Barclays Capital U.S. Aggregate Bond Index is an unmanaged index generally representative of investment-grade fixed-rate debt issues, including government, corporate, asset-backed, and mortgage-backed securities, with maturities of at least one year.
Barclays Capital U.S. Corporate High-Yield Bond Index is an unmanaged index that covers the USD-denominated, non-investment grade, fixed-rate, taxable corporate bond market. Securities are classified as high-yield if the middle rating of Moody’s, Fitch, and S&P is Ba1/BB+/BB+ or below. The index excludes Emerging Markets debt.
Gross Domestic Product (GDP) is the measure of the market value of the goods and services produced by labor and property in the United States.
The Group of 20 (G-20) Finance Ministers and Central Bank Governors was established in 1999 to bring together systemically important industrialized and developing economies to discuss key issues in the global economy.
Lipper International Large-Cap Value Funds Average is an equally weighted average of mutual Funds that, by portfolio practice, invest at least 75% of their equity assets in companies strictly outside of the U.S. with market capitalizations (on a three-year weighted basis) above Lipper’s international large-cap floor. International large-cap value funds typically have a below-average price-to-cash flow ratio, price-to-book ratio, and three-year sales-per-share growth value compared to their large-cap-specific subset of the S&P/Citigroup World ex-U.S. BMI.
Lipper Large-Cap Growth Funds Average is an equally weighted average of mutual Funds that, by portfolio practice, invest at least 75% of their equity assets in companies with market capitalizations (on a three-year weighted basis) above Lipper’s U.S. Diversified Equity large-cap floor. Large-cap growth funds typically have an above-average price-to-earnings ratio, price-to-book ratio, and three-year sales-per-share growth value, compared to the S&P 500 Index.
Lipper Large-Cap Core Funds is an equally weighted average of mutual Funds that, by portfolio practice, invest at least 75% of their equity assets in companies with market capitalizations (on a three-year weighted basis) above Lipper’s U.S. Diversified Equity large-cap floor. Large-cap core funds have more latitude in the companies in which they invest. These funds typically have an average price-to-earnings ratio, price-to-book ratio, and three-year sales-per-share growth value, compared to the S&P 500 Index.
Lipper Large-Cap Value Funds Average is an equally weighted average of mutual Funds that, by portfolio practice, invest at least 75% of their equity assets in companies with market capitalizations (on a three-year weighted basis) above Lipper’s U.S. Diversified Equity large-cap floor. Large-cap value funds typically have a below average price-to-earnings ratio, price-to-book ratio, and three-year sales-per-share growth value, compared to the S&P 500 Index.
Lipper Mid-Cap Growth Funds Average is an equally weighted average of mutual Funds that, by portfolio practice, invest at least 75% of their equity assets in companies with market capitalizations (on a three-year weighted basis) below Lipper’s U.S. Diversified Equity large-cap floor. Mid-cap growth funds typically have an above-average price-to-earnings ratio, price-to-book ratio, and three-year sales-per-share growth value, compared to the S&P MidCap 400 Index.
The MSCI EAFE Index (Europe, Australasia, Far East) which is a free float-adjusted market capitalization index that is designed to measure developed market equity performance, excluding the U.S. & Canada. The MSCI EAFE Index currently consists of the following 21 developed market country indices: Australia, Austria, Belgium, Denmark, Finland, France, Germany, Greece, Hong Kong, Ireland, Italy, Japan, the Netherlands, New Zealand, Norway, Portugal, Singapore, Spain, Sweden, Switzerland and the United Kingdom.
MSCI Emerging Markets Index is a market capitalization weighted index composed of companies representative of the market structure of 26 emerging market countries in Europe, Latin America, and the Pacific Basin.
Russell 1000® Growth Index is an unmanaged index which measures the performance of the large-cap growth segment of the U.S. equity universe. It includes those Russell 1000 companies with higher price-to-book ratios and higher forecasted growth values.
Russell 1000® Value Index is an unmanaged index which measures the performance of the large-cap value segment of the U.S. equity universe. It includes those Russell 1000 companies with lower price-to-book ratios and lower expected growth values.
Russell 2000® Index is an unmanaged index which measures the performance of the small-cap segment of the U.S. equity universe. The Russell 2000® Index is a subset of the Russell 3000® Index representing approximately 10% of the total market capitalization of that index. It includes approximately 2000 of the smallest securities based on a combination of their market cap and current index membership.
Russell 2500™ Growth Index is an unmanaged index which measures the performance of the small- to mid-cap growth segment of the U.S. equity universe. It includes those Russell 2500 companies with higher price-to-book ratios and higher forecasted growth values.
Standard & Poor’s MidCap 400 Index (“S&P MidCap 400”) is an unmanaged index that is the most widely used index for mid-sized companies. The S&P MidCap 400 covers 7% of the U.S. equities market, and is part of a series of S&P U.S. indices that can be used as building blocks for portfolio composition.
Standard & Poor’s 500 Index (“S&P 500”) is an unmanaged index that is widely regarded as a gauge of the U.S. equities market, this index includes 500 leading companies in leading industries of the U.S. economy. The S&P 500 focuses on the large cap segment of the market, with approximately 75% coverage of U.S. equities.
Lipper is an independent mutual fund performance monitor whose results are based on total return and do not reflect a sales charge.
Securities indexes assume reinvestment of all distributions and interest payments and do not take in account brokerage fees or expenses. Securities in the Funds do not match those in the indexes and performance of the Funds will differ. Investors cannot invest directly in an index.
| |
HSBC INVESTOR FAMILY OF FUNDS | 3 |
December 18, 2009
To Our Shareholders:
It is a pleasure to report on a challenging, but fruitful year.
Since money market funds comprise the vast majority of the HSBC Investor Funds family assets, we have focused especially closely on events in the credit markets over the past year, hallmarked by the freezing of the commercial paper market in the wake of the Lehman bankruptcy and the September 15, 2008 “breaking of the buck” by The Reserve Fund, and the ultra-low short-term interest yields which prevail as a result of unprecedented fiscal and monetary stimulus.
Throughout the year, the Board of Trustees and the Funds’ Adviser have sought to ensure that all of the HSBC Investor money market funds appropriately managed their liquidity and risk. Each of the money market funds, with the exception of the US Treasury Money Market Fund, participated in the US Treasury Temporary Guarantee Program for Money Market Funds, which provided insurance against loss on investments in covered money market funds. This program expired on September 18, 2009, with no claims made by any money market funds.
The Adviser also instituted minimum yields on each of the money market funds which required the Adviser and shareholder servicing agents to waive significant portions of their fees to sustain a competitive yield.
HSBC’s Investor Funds include long-term funds, which we expect to grow in number, expanding your choices within the fund group. The Board, with input from HSBC’s competitively-distinguishing Multimanager analytical team, regularly reviews these funds’ investment performance in great detail. From time to time, we change sub-advisors and believe that the Board’s consistent and careful scrutiny has contributed to the funds’ generally excellent long-term performance. Information about this performance is included in the commentaries from the portfolio managers within this annual report.
To better fulfill our responsibilities, the Board has redesigned our committee structure; it now consists of: Audit, Contracts and Expense, Valuation and Investment Oversight, and Nominating and Corporate Governance committees. All independent trustees are members of these “committees of the whole”, which are chaired by a different member of the Board. I might add that our board had perfect attendance at all meetings last year—including telephone meetings.
There is much talk in the mutual fund industry of regulatory change. We monitor these trends, and our funds’ compliance, very carefully. In connection with this responsibility, the board invited a senior staff member of the U.S. Securities and Exchange Commission to discuss the regulatory environment and possible future developments.
Regulatory change may come from the judiciary as well. The U.S. Supreme Court recently heard arguments about how mutual fund fees are set—a case known as Jones v. Harris Associates. The plaintiff seeks to supplant the rule under which mutual funds have operated since 1982—the so-called Gartenberg standard which gives boards considerable discretion in establishing advisory fees. As you know, there are over 7,000 funds in the US, a number that assures vigorous competition—one reason US fund fees are the lowest in the world. A Wall Street Journal editorial (November 3, 2009) noted: “The Jones suit is a culmination of the plaintiffs bar assault on mutual funds that began earlier this decade and seeks to achieve via judicial fiat what it hasn’t been able to accomplish in legislation. Let’s hope the high Court shuts them down.” It would be a great disservice to fund investors if the tort bar were to prevail in this case.
Our fund family has shown rapid growth in recent years, and we thank you for the confidence you’ve placed in us. On behalf of the Board of Trustees and Advisory staff, we pledge our very best effort to making the future a good one for our shareholders.
Cordially,

Michael Seely
Chairperson, HSBC Investor Funds
| |
4 | HSBC INVESTOR FAMILY OF FUNDS |
Dear Shareholder,
Welcome to the HSBC Investor Funds annual report, covering the period between November 1, 2008 and October 31, 2009. This report offers detailed information about your funds’ results, from investment operations and composition. We encourage you to review it carefully.
Inside these pages you will find a letter from the Funds’ Chairman, as well as commentary from the portfolio managers discussing the investment markets and explaining the primary reasons each fund performed as it did. The report also includes each fund’s return during the 12-month period, as well as the performance of its benchmark index and peer group average. We believe the HSBC Investor Funds have provided their shareholders with competitive returns.
In closing, we want to thank you for investing through the HSBC Investor Funds. We recognize that the past year has presented challenges for many investors, and we appreciate and honor the trust you place in us. Please contact us at any time with questions or concerns.
Sincerely,

Richard A. Fabietti
President
| |
HSBC INVESTOR FAMILY OF FUNDS | 5 |
(This Page Intentionally Left Blank)
|
Commentary From the Investment Manager |
|
HSBC Global Asset Management (USA) Inc.
U.S. Economic Review
The 12-month period between November 1, 2008 and October 31, 2009 began with the U.S. economy in severe recession and the financial system suffering from a major credit crunch.
The federal government took unprecedented steps to try to restore the economy and financial system to health. The Federal Reserve Board in December reduced the federal funds rate, its target short-term interest rate, from 1.00% to a range between 0.00% and 0.25%, and also took a wide range of other actions to inject liquidity and improve confidence in the system. The government also enacted a massive fiscal stimulus package. All told, the U.S. government and Federal Reserve committed a total of $12.8 trillion, an amount nearly equal to 2008 gross domestic product1. Governments around the world took similar steps: For example, the G-20 group1 of nations agreed to a $1.1 trillion program through which the International Monetary Fund would help countries afflicted by the global crisis to boost economic activity.
Leading economic indicators began showing signs of improvement during the second quarter of 2009. Credit spreads declined, the housing market’s descent slowed and survey data turned up. The economy continued to regain its footing throughout the period. Unemployment continued to rise, however, as is typical in the end stages of recession.
The U.S. economy contracted at an annualized rate of 5.4% during the fourth calendar quarter of 2008. It fell 6.4% and 0.7% in the first and second quarters of 2009, respectively, before recovering to grow 2.8% during the third quarter of 2009.
Market Review
Investors during the first four months of the period responded to the financial crisis by fleeing assets perceived as risky. Higher-risk assets generally fared worst during this time, with emerging markets stocks, small caps and high-yield bonds posting some of the largest losses. Assets considered safe and stable, particularly bonds backed by the U.S. government, produced the best returns.
The market environment changed dramatically beginning in early 2009. As the financial system and economy began showing signs of stabilizing, investors moved quickly back into risk assets. Between March 9 and the end of the reporting period the stock market posted a powerful rebound, with the S&P 5001 gaining roughly 55.31%. For the period as a whole the S&P 500 returned 9.80%, while the small-cap Russell 2000®, 1 gained 6.46%.
Foreign stocks on the whole declined considerably through early March, then surged to produce strong returns for the 12-month period. Foreign currencies’ strength against the dollar further boosted the gains of U.S. investors’ international holdings. Japan’s market did not keep pace with other major markets; It generated a 10.62% gain in U.S. dollar terms—and just a 2.05% return in local currency—as its economic recovery proved anemic.
During the rally, investors especially favored shares in emerging markets, which in many cases offered more-attractive macroeconomic backdrops than developed countries. The MSCI EAFE Index1 of developed foreign stock markets gained 28.41% in U.S. dollar terms during the period under review, while the MSCI Emerging Markets Index1 gained 64.63%.
Investors in the fixed-income markets began the period fleeing to the most conservative and secure types of securities, particularly Treasury bills. The rally in government debt was so extreme that Treasury bills briefly offered negative yields. Meanwhile, investors sold bonds not backed by the federal government. That environment caused spreads between yields on Treasuries and other types of debt to widen to historic levels.
Conditions in the fixed-income markets changed dramatically during 2009. As the financial crisis began to recede, investors sought the greater yield available on higher-risk debt securities. Corporate bonds, in particular high-yield bonds, staged a strong rally. The Barclays Capital U.S. Aggregate Bond Index1, which tracks the broad fixed-income market, returned 13.79% for the 12 months through October, while the Barclays Capital U.S. Corporate High-Yield Bond Index1 returned 48.10%.
| |
1 | For additional information, please refer to the Glossary of Terms. |
| |
HSBC INVESTOR FAMILY OF FUNDS | 7 |
|
Portfolio Reviews |
|
HSBC Investor Growth Fund |
(Class A Shares, B Shares, C Shares and I Shares) |
by Clark J. Winslow, Chief Executive Officer/Portfolio Manager
Justin H. Kelly, CFA, Managing Director/Portfolio Manager
R. Bart Wear CFA, Managing Director/Portfolio Manager
Winslow Capital Management, Inc. |
The HSBC Investor Growth Fund (the “Fund”) seeks long-term growth of capital. Under normal market conditions, the Fund invests primarily in U.S. and foreign equity securities of high quality companies with market capitalization generally in excess of $2 billion which the subadviser believes have the potential to generate superior levels of long-term profitability and growth. The Fund utilizes a two-tier structure, commonly known as a “master-feeder” structure, in which the Fund invests all of its investable assets in the HSBC Investor Growth Portfolio (the “Portfolio”). The Portfolio employs Winslow Capital Management, Inc. as subadviser.
Investment Concerns
Equity securities (stocks) are more volatile and carry more risk than other forms of investments, including investments in high-grade fixed income securities.
The growth investment style may fall out of favor in the marketplace and result in significant declines in the value of the Portfolio’s securities. Securities of companies considered to be growth investments may have rapid price swings in the event of earnings disappointments or during periods of market, political, regulatory and economics uncertainty.
The net asset value per share of this Fund will fluctuate as the value of the securities in the portfolio changes.
Market Commentary
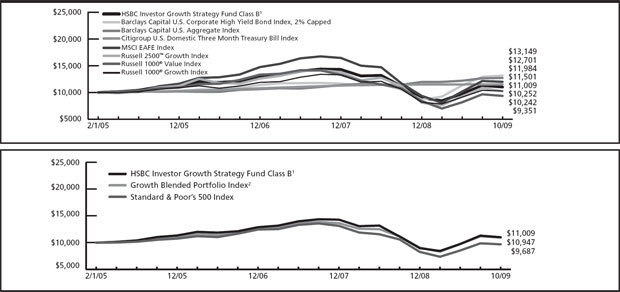
The Fund returned 18.86% (without sales charge) for the Class A Shares and 19.11% for the Class I Shares for the 12-month period ended October 31, 2009. That compared to a 17.51% return for the Russell 1000® Growth Index1 and a 14.74% return for the Lipper Large-Cap Growth Funds Average1.
Past performance does not guarantee future results.
Portfolio Performance
The stock market in the beginning of the period declined steeply as a result of the global financial crisis. Intervention by the federal government in the form of fiscal and monetary stimulus programs helped stanch the market downturn, and by early March the stock market began a sustained rally that continued through the end of the period.
The Fund benefited from its shift to an overweight position in the information technology and energy sectors, as stocks in those sectors performed well. Stock selection in those sectors and in the financial services sector further boosted the Fund’s relative performance. We positioned the Fund with a smaller-than-benchmark stake in consumer staples stocks. Because of that strategy the Fund’s Class I Shares outperformed its benchmark index, the Russell 1000® Growth Index, as the sector lagged the benchmark during the period.*
The Fund maintained a neutral weighting in the small materials sector, but its materials allocation significantly underperformed the benchmark’s allocation. The underperformance was the result of our decision to avoid shares of non-energy, resource-related materials companies. Such shares rebounded sharply in the latter half of the period, fueling much of the sector’s gains.*
| |
* | Portfolio composition is subject to change. |
| |
1 | For additional information, please refer to the Glossary of Terms. |
| |
8 | HSBC INVESTOR FAMILY OF FUNDS |
| |
| Portfolio Reviews |
|
HSBC Investor Growth Fund - As of October 31, 2009 |
| |
Value of a $10,000 Investment | |
|
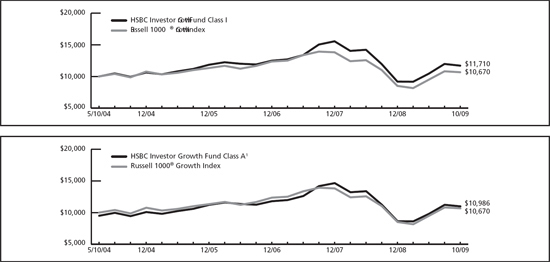
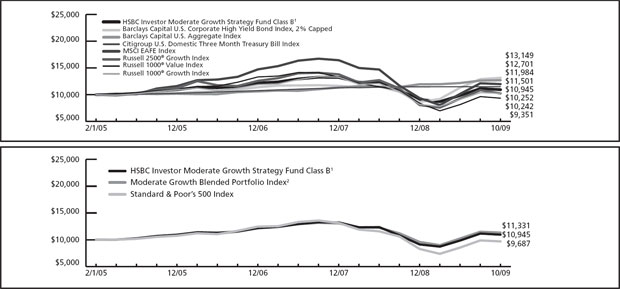
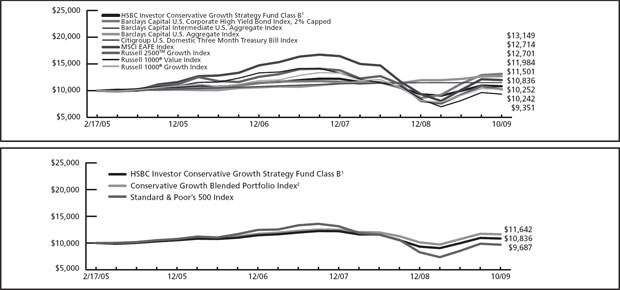
The charts above represent a comparison of a hypothetical $10,000 investment in the indicated share class versus a similar investment in the Fund’s benchmark and represents the reinvestment of dividends and capital gains in the Fund.
| | | | | | | | | | | | | | |
Fund Performance | | | | Average Annual
Total Return (%) | | Expense
Ratio (%)6 | |
|
|
|
|
|
|
As of October 31, 2009 | | Inception
Date | | 1
Year | | 5
Year | | Since
Inception | | Gross | | Net | |
|
|
|
|
|
|
|
|
|
|
|
|
|
|
HSBC Investor Growth Fund Class A1 | | 5/7/045 | | 12.87 | | 1.90 | | 1.73 | | | 1.32 | | 1.20 | |
|
|
|
|
|
|
|
|
|
|
|
|
|
|
|
HSBC Investor Growth Fund Class B2 | | 5/7/045 | | 13.87 | | 2.18 | | 1.91 | | | 2.07 | | 1.95 | |
|
|
|
|
|
|
|
|
|
|
|
|
|
|
|
HSBC Investor Growth Fund Class C3 | | 5/7/045 | | 16.86 | | 2.18 | | 1.92 | | | 2.07 | | 1.95 | |
|
|
|
|
|
|
|
|
|
|
|
|
|
|
|
HSBC Investor Growth Fund Class I | | 5/7/045 | | 19.11 | | 3.19 | | 2.92 | | | 1.07 | | 0.95 | |
|
|
|
|
|
|
|
|
|
|
|
|
|
|
|
Russell 1000® Growth Index4 | | — | | 17.51 | | 1.27 | | 1.19 | 7 | | N/A | | N/A | |
|
|
|
|
|
|
|
|
|
|
|
|
|
|
|
Lipper Large-Cap Growth Funds Average4 | | — | | 14.74 | | 0.70 | | 0.79 | 7 | | N/A | | N/A | |
|
|
|
|
|
|
|
|
|
|
|
|
|
|
|
Past performance does not guarantee future results. The performance data quoted represents past performance and current returns may be lower or higher. Total return figures include change in share price, reinvestment of dividends and capital gains and do not reflect the taxes that a shareholder would pay on fund distributions or on the redemption of fund shares. The investment return and principal value will fluctuate so that an investor’s shares, when redeemed may be worth more or less than the original cost. To obtain performance information current to the most recent month end, please call 1-800-782-8183.
The performance above reflects any fee waivers that have been in effect during the applicable periods, as well as any expense reimbursements that have periodically been made. Absent such waivers and reimbursements, returns would have been lower. Currently, contractual fee waivers are in effect from March 1, 2009 through March 1, 2010.
During the fiscal periods ended October 31, 2008 and 2009, the Portfolio in which the Fund invests in received monies related to certain nonrecurring litigation settlements which enhanced performance. Without the receipt of these payments, the returns for applicable periods would be lower.
| |
1 | Reflects the maximum sales charge of 5.00%. |
| |
2 | Reflects the applicable contingent deferred sales charge maximum of 4.00%. |
| |
3 | Reflects the applicable contingent deferred sales charge maximum of 1.00%. |
| |
4 | For additional information, please refer to the Glossary of Terms. |
| |
5 | The HSBC Investor Growth Fund was initially offered for purchase effective May 7, 2004, however, no shareholder activity occurred until May 10, 2004. |
| |
6 | Reflects the expense ratio as reported in the prospectus dated February 27, 2009. |
| |
7 | Return for the period 5/10/04 to 10/31/09. |
The Fund’s performance is measured against the Russell 1000® Growth Index, an unmanaged index which measures the performance of the large-cap growth segment of the U.S. equity universe. It includes those Russell 1000 companies with higher price-to-book ratios and higher forecasted growth values. The index does not reflect the deduction of expenses associated with a mutual fund, such as investment management and fund accounting fees. The Fund’s performance reflects the deduction of fees for these value-added services. Investors cannot invest directly in an index.
| |
HSBC INVESTOR FAMILY OF FUNDS | 9 |
|
Portfolio Reviews |
|
HSBC Investor International Equity Fund |
HSBC Investor Overseas Equity Fund |
(Class A Shares, B Shares, and C Shares) |
by Kevin F. Simms |
Co-CIO International Value Equities and Director of Research – Global and International Value Equities |
AllianceBernstein L.P. |
The HSBC Investor International Equity Fund and the HSBC Investor Overseas Equity Fund (the “Funds”) seek to provide their shareholders with long-term growth of capital and future income. Under normal market conditions, each Fund invests at least 80% of its net assets in equity securities of companies organized and domiciled in developed nations outside the United States or for which the principal trading market is outside the United States, including Europe, Canada, Australia and the Far East. Each Fund may invest up to 20% of its assets in equity securities of companies in emerging markets. The Funds employ a two-tier fund structure, known as a “master-feeder” structure, in which the Funds invest all of their investable assets in the HSBC Investor International Equity Portfolio (the “Portfolio”). AllianceBernstein L.P., acting through the Bernstein Value Equities Unit (“AllianceBernstein”), serves as the subadviser to the Portfolio and manages its investments.
Investment Concerns
There are risks associated with investing in foreign companies, such as erratic market conditions, economic and political instability and fluctuations in currency and exchange rates.
Equity securities (stocks) are more volatile and carry more risk than other forms of investments, including investments in high-grade fixed income securities.
The net asset value per share of this Fund will fluctuate as the value of the securities in the portfolio changes.
Market Commentary
For the 12-month period ended October 31, 2009, the Class I Shares of the HSBC Investor International Equity Fund produced a 27.90% return and the Class A Shares of the HSBC Investor Overseas Equity Fund returned 23.99% (without sales charge). That compared to a total return of 28.41% and 24.28% for the Funds’ benchmark, the MSCI EAFE Index1, and the Lipper International Large-Cap Value Funds Average1, respectively.
Past performance does not guarantee future results.
Portfolio Performance
The period was marked by two significantly different environments in the equity markets. The beginning of the period was dominated by stress in the global financial system, including a credit crunch and a contraction of economies around the world. As the period wore on, economies generally stabilized and economic growth resumed.
Stocks fell initially, then rebounded strongly. International stocks performed particularly well as many foreign markets were less affected by the issues that plagued the U.S. market, including overextended consumers and declines in the housing market. Those trends benefited the Fund’s absolute return.
We positioned the Fund to take advantage of an improving economic environment. That strategy included holding an overweight position relative to the benchmark in sectors such as financials, autos, energy and technology. Those overweight positions boosted relative performance, as did individual stock selection in each of those sectors.*
The Fund also maintained a modest allocation to emerging markets stocks, which are absent from the benchmark. Emerging markets were among the period’s best performers, so holding such stocks significantly helped the Fund’s relative performance.*
The Fund was hurt in relative terms by its underweight position in the consumer cyclical sector. Such stocks benefited as economic fundamentals improved and consumer spending increased. We positioned the Fund with an overweight stake in the telecommunications sector, believing that such stocks would benefit from a market rebound. That sector underperformed the benchmark, and dragged on the Fund’s relative performance.*
| |
* | Portfolio composition is subject to change. |
| |
1 | For additional information, please refer to the Glossary of Terms. |
Past performance does not guarantee future results. The performance data quoted represents past performance and current returns may be lower or higher. Total return figures include change in share price, reinvestment of dividends and capital gains and do not reflect taxes that a shareholder would pay on fund distributions or on the redemption of fund shares. The investment return and principal value will fluctuate so that an investor’s shares, when redeemed may be worth more or less than the original cost. To obtain performance information current to the most recent month end, please call 1-800-782-8183.
| |
10 | HSBC INVESTOR FAMILY OF FUNDS |
| |
| Portfolio Reviews |
|
HSBC Investor International Equity Fund |
HSBC Investor Overseas Equity Fund - As of October 31, 2009 |
|
Value of a $10,000 Investment |
|
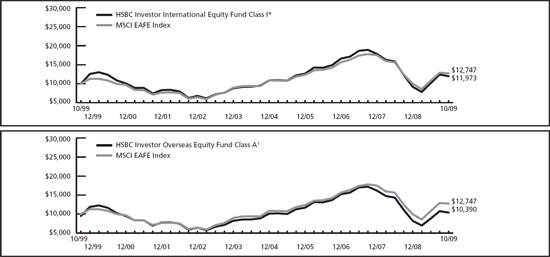
The charts above represent a comparison of a hypothetical $10,000 investment in the indicated share class versus a similar investment in the Fund’s benchmark and represents the reinvestment of dividends and capital gains in the Fund.
| | | | | | | | | | | | | |
Fund Performance | | | | Average Annual
Total Return (%) | | Expense
Ratio (%)5 | |
|
|
|
|
|
|
As of October 31, 2009 | | Inception
Date | | 1
Year | | 5
Year | | 10
Year | | Gross | | Net | |
|
|
|
|
|
|
|
|
|
|
|
|
|
|
HSBC Investor International Equity Fund Class I* | | 1/9/95 | | 27.90 | | 4.14 | | 1.82 | | 0.84 | | 0.84 | |
|
|
|
|
|
|
|
|
|
|
|
|
|
|
HSBC Investor Overseas Equity Fund Class A1 | | 8/26/96 | | 17.83 | | 1.63 | | 0.38 | | 1.81 | | 1.81 | |
|
|
|
|
|
|
|
|
|
|
|
|
|
|
HSBC Investor Overseas Equity Fund Class B2 | | 1/6/98 | | 21.08 | | 1.90 | | 0.43 | | 2.56 | | 2.56 | |
|
|
|
|
|
|
|
|
|
|
|
|
|
|
HSBC Investor Overseas Equity Fund Class C3 | | 11/4/98 | | 22.50 | | 1.93 | | 0.14 | | 2.56 | | 2.56 | |
|
|
|
|
|
|
|
|
|
|
|
|
|
|
MSCI EAFE Index4 | | — | | 28.41 | | 5.59 | | 2.46 | | N/A | | N/A | |
|
|
|
|
|
|
|
|
|
|
|
|
|
|
Lipper International Large-Cap Value Funds Average4 | | — | | 24.28 | | 3.86 | | 3.92 | | N/A | | N/A | |
|
|
|
|
|
|
|
|
|
|
|
|
|
|
Past performance does not guarantee future results. The performance data quoted represents past performance and current returns may be lower or higher. Total return figures include change in share price, reinvestment of dividends and capital gains and do not reflect the taxes that a shareholder would pay on fund distributions or on the redemption of fund shares. The investment return and principal value will fluctuate so that an investor’s shares, when redeemed may be worth more or less than the original cost. To obtain performance information current to the most recent month end, please call 1-800-782-8183.
The performance above reflects any fee waivers that have been in effect during the applicable periods, as well as any expense reimbursements that have periodically been made. Absent such waivers and reimbursements, returns would have been lower.
During the fiscal period ended October 31, 2007, the Portfolio in which the Fund invests in received monies related to certain nonrecurring litigation settlements which enhanced performance. Without the receipt of this payment, the returns for applicable periods would be lower.
| |
* | The Class I Shares are issued by HSBC Investor International Equity Fund and are part of the HSBC Advisor Funds Trust. |
| |
1 | Reflects the maximum sales charge of 5.00%. |
| |
2 | Reflects the applicable contingent deferred sales charge maximum of 4.00%. |
| |
3 | Reflects the applicable contingent deferred sales charge maximum of 1.00%. |
| |
4 | For additional information, please refer to the Glossary of Terms. |
| |
5 | Reflects the expense ratio as reported in the prospectus dated February 27, 2009. |
The Funds’ performance is measured against the MSCI EAFE Index (Europe, Australasia, Far East), which is a free float-adjusted market capitalization index that is designed to measure developed market equity performance, excluding the U.S. & Canada. The MSCI EAFE Index currently consists of the following 21 developed market country indices: Australia, Austria, Belgium, Denmark, Finland, France, Germany, Greece, Hong Kong, Ireland, Italy, Japan, the Netherlands, New Zealand, Norway, Portugal, Singapore, Spain, Sweden, Switzerland and the United Kingdom. The performance of the index does not reflect the deduction of expenses associated with a mutual fund, such as investment management and fund accounting fees. The Funds’ performance reflects the deduction of fees for these value-added services. Investors cannot invest directly in an index.
| |
HSBC INVESTOR FAMILY OF FUNDS | 11 |
|
Portfolio Reviews |
|
HSBC Investor Mid-Cap Fund |
(Class A Shares, B Shares, C Shares and Class I Shares) |
by Tony Y. Dong, CFA, Director, Mid-Cap Equity and Senior Portfolio Manager and |
Brian S. Matuszak, CFA, Senior Equity Analyst and |
Andy Y. Mui, CPA, Senior Equity Analyst |
Munder Capital Management |
The HSBC Investor Mid-Cap Fund (the “Fund”) seeks to achieve long-term growth of capital by investing at least 80% of its net assets in equity securities, i.e., common stocks, preferred stocks, convertible securities and rights and warrants, of mid-capitalization companies. Mid-capitalization companies are those companies with market capitalization within the range of companies included in the S&P MidCap 400® Index1, or within the range of companies included in the Russell Midcap® Index. The Fund employs Munder Capital Management (“Munder”) as subadviser.
Investment Concerns
Equity securities (stocks) are more volatile and carry more risk than other forms of investments, including investments in high-grade fixed income securities.
The net asset value per share of this Fund will fluctuate as the value of the securities in the portfolio changes.
Mid capitalization funds typically carry additional risks since smaller companies generally have a higher risk of failure, and historically, their stocks have experienced a greater degree of market volatility than stocks on average.
Market Commentary
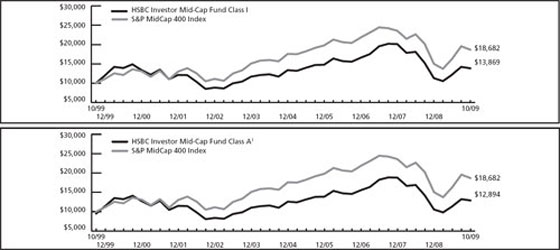
The Fund’s Class A Shares posted a return of 16.07% (without sales charge) and 16.42% for the Class I Shares for the 12-month period ended October 31, 2009. That compared to 18.18% and 16.74% for the Fund’s benchmarks, the S&P MidCap 400 Index1, and the Lipper Mid-Cap Growth Funds Average1, respectively.
Past performance does not guarantee future results.
Portfolio Performance
The recent recession was the longest and deepest in the post-World War II period. The financial markets were in turmoil early in the period, but federal intervention in the form of fiscal and monetary stimulus provided a much-needed spark to the U.S. economy and helped the stock market recover beginning in early March. Stocks rebounded strongly during the rest of the period, and small- and mid-cap stocks—which typically outperform large-cap stocks coming out of recessions—were among the best performers.
The Fund’s performance relative to its benchmark benefited from stock selection in sectors including energy, information technology, financials, utilities, materials and industrials. We held a larger position than the benchmark in the industrials sector and underweight positions in financials and health care, and these sector allocations also benefited relative performance.*
Although stocks across the equity spectrum performed well during the period, higher-risk stocks provided the period’s strongest returns. We focused the Fund’s portfolio on high-quality stocks with strong fundamentals and good management, rather than more-speculative shares. As a result, the Fund did not benefit from the outsized gains among lower-quality stocks. The Fund underperformed its benchmark in part because of its underweight stake in such stocks.*
| |
* | Portfolio composition is subject to change. |
| |
1 | For additional information, please refer to the Glossary of Terms. |
| |
12 | HSBC INVESTOR FAMILY OF FUNDS |
|
Portfolio Reviews |
|
HSBC Investor Mid-Cap Fund - As of October 31, 2009 |
|
Value of a $10,000 Investment |
|
The charts above represent a comparison of a hypothetical $10,000 investment in the indicated share class versus a similar investment in the Fund’s benchmark and represents the reinvestment of dividends and capital gains in the Fund.
| | | | | | | | | | | |
Fund Performance | | | Average Annual Total Return† (%) | | Expense
Ratio (%)5 |
|
|
|
|
|
|
As of October 31, 2009 | Inception
Date† | | 1
Year | | 5
Year | | 10
Year | | Gross | | Net |
|
|
|
|
|
|
|
|
|
|
|
|
HSBC Investor Mid-Cap Fund Class A1 | 7/1/93 | | 10.33 | | 1.58 | | 2.57 | | 1.79 | | 1.35 |
|
|
|
|
|
|
|
|
|
|
|
|
HSBC Investor Mid-Cap Fund Class B2 | 7/1/93 | | 11.26 | | 1.86 | | 2.34 | | 2.54 | | 2.10 |
|
|
|
|
|
|
|
|
|
|
|
|
HSBC Investor Mid-Cap Fund Class C3 | 7/1/93 | | 14.30 | | 1.85 | | 2.40 | | 2.54 | | 2.10 |
|
|
|
|
|
|
|
|
|
|
|
|
HSBC Investor Mid-Cap Fund Class I | 7/1/93 | | 16.42 | | 2.83 | | 3.33 | | 1.54 | | 1.10 |
|
|
|
|
|
|
|
|
|
|
|
|
S&P MidCap 400 Index4 | — | | 18.18 | | 3.24 | | 6.45 | | N/A | | N/A |
|
|
|
|
|
|
|
|
|
|
|
|
Lipper Mid-Cap Growth Funds Average4 | — | | 16.74 | | 1.56 | | 1.60 | | N/A | | N/A |
|
|
|
|
|
|
|
|
|
|
|
|
Past performance does not guarantee future results. The performance data quoted represents past performance and current returns may be lower or higher. Total return figures include change in share price, reinvestment of dividends and capital gains and do not reflect the taxes that a shareholder would pay on fund distributions or on the redemption of fund shares. The investment return and principal value will fluctuate so that an investor’s shares, when redeemed may be worth more or less than the original cost. To obtain performance information current to the most recent month end, please call 1-800-782-8183.
The performance above reflects any fee waivers that have been in effect during the applicable periods, as well as any expense reimbursements that have periodically been made. Absent such waivers and reimbursements, returns would have been lower. Currently, contractual fee waivers are in effect from March 1, 2009 through March 1, 2010.
During the fiscal period ended October 31, 2009, the Fund received monies related to certain nonrecurring litigation settlements which enhanced performance. Without the receipt of this payment, the returns for applicable periods would be lower.
| |
1 | Reflects the maximum sales charge of 5.00%. |
| |
2 | Reflects the applicable contingent deferred sales charge, maximum of 4.00%. |
| |
3 | Reflects the applicable contingent deferred sales charge, maximum of 1.00%. |
| |
4 | For additional information, please refer to the Glossary of Terms. |
| |
5 | Reflects the expense ratio as reported in the prospectus dated February 27, 2009. |
| |
† | For periods prior to July 1, 2000, the performance shown above includes the total return (adjusted for Fund expenses) generated by HSBC Global Asset Management (USA) Inc.’s management of a pooled investment vehicle called a collective investment trust (“CIT”) with the same investment objective as the Fund. The assets from that CIT were converted into the HSBC Investor Mid-Cap Fund on July 1, 2000. The CIT was not registered with the Securities & Exchange Commission (SEC) and thus was not subject to certain investment restrictions that are imposed on the Fund. If the CIT had been registered with the SEC, its performance might have been adversely affected. Performance assumes reinvestment of dividends and distributions. |
The Fund’s performance is measured against the Standard & Poor’s Mid Cap 400 Index, an unmanaged index that is the most widely used index for mid-sized companies. The S&P MidCap 400 covers 7% of the U.S. equities market, and is part of a series of S&P U.S. indices that can be used as building blocks for portfolio composition. The performance of the index does not reflect the deduction of expenses associated with a mutual fund, such as investment management and fund accounting fees. The Fund’s performance reflects the deduction of fees for these value-added services. Investors cannot invest directly in an index.
| |
HSBC INVESTOR FAMILY OF FUNDS | 13 |
|
Portfolio Reviews |
|
HSBC Investor Opportunity Fund |
(Class A Shares, B Shares, C Shares and I Shares)
by William A. Muggia
President–Chief Investment Officer
Westfield Capital Management Company, L.P. |
The HSBC Investor Opportunity Fund (the “Fund”) seeks to provide its shareholders with long-term growth of capital by investing in equity securities of small cap companies. The Fund may also invest in bonds, notes, commercial paper, U.S. Government securities, and foreign securities. Small cap companies generally are defined as those that have market capitalizations within the range of market capitalizations represented in the Russell 2500™ Growth Index.1 The Fund may also invest in equity securities of larger, more established companies if they are expected to show increased earnings. The Fund employs a two-tier structure, commonly referred to as “master-feeder” structure, in which the Fund invests all of its investable assets in the HSBC Investor Opportunity Portfolio (the “Portfolio”). The Portfolio employs Westfield Capital Management Company, L.P. as subadviser.
Investment Concerns
Equity securities (stocks) are more volatile and carry more risk than other forms of investments, including investments in high-grade fixed income securities.
The net asset value per share of this Fund will fluctuate as the value of the securities in the portfolio changes.
Small-capitalization funds typically carry additional risks since smaller companies generally have a higher risk of failure, and historically, their stocks have experienced a greater degree of market volatility than stocks on average.
Market Commentary
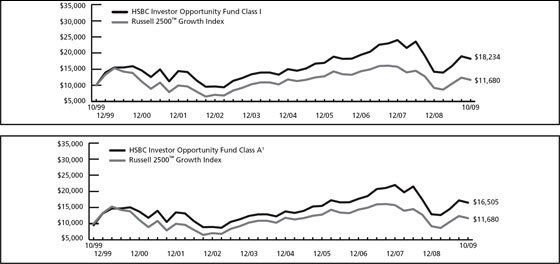
For the 12-month period ended October 31, 2009, the Class I Shares of the HSBC Investor Opportunity Fund produced a 15.47% return, and the Class A Shares of the Fund produced a 14.85% return (without sales charge). The Fund’s benchmarks, the Russell 2500™ Growth Index1, and the Lipper Mid-Cap Growth Funds Average1, returned 18.21% and 16.74%, respectively.
Past performance does not guarantee future results.
Portfolio Performance
The 12-month period consisted of two distinct market and economic environments. In the first half of the period, continued fallout from the financial crisis caused equities to fall sharply. Stocks recovered dramatically in the second half of the period, as investors began to act on their belief that a depression had been averted.
The Fund’s performance relative to its benchmark index benefited from certain stock selection decisions. Within the energy sector, the focus on companies with solid fundamentals and strong competitive positions led to investments in coal and oil & gas exploration firms. This emphasis boosted the Fund’s performance relative to the benchmark. Stock selection in industrials and technology also boosted relative returns.*
The Fund held a smaller position than its benchmark in consumer discretionary stocks. This underweight position dragged on performance relative to the benchmark. The Fund did not have a bullish view on the sector as a whole, believing that there was insufficient evidence of improving fundamentals to merit increasing the Fund’s consumer discretionary holdings. But investors proved to have a significant appetite for stocks in cyclically sensitive industries. The Fund generally did not hold these stocks, so did not benefit from their rally. Stock selection in the financial services sector also weighed on returns relative to the benchmark.*
| |
* | Portfolio composition is subject to change. |
| |
1 | For additional information, please refer to the Glossary of Terms. |
| |
14 | HSBC INVESTOR FAMILY OF FUNDS |
|
Portfolio Reviews |
|
HSBC Investor Opportunity Fund - As of October 31, 2009 |
|
Value of a $10,000 Investment |
|
The charts above represent a comparison of a hypothetical $10,000 investment in the indicated share class versus a similar investment in the Fund’s benchmark and represents the reinvestment of dividends and capital gains in the Fund.
| | | | | | | | | | | |
Fund Performance | | | Average Annual Total Return (%) | | Expense
Ratio (%)5 |
|
|
|
|
|
|
As of October 31, 2009 | Inception
Date | | 1
Year | | 5
Year | | 10
Year | | Gross | | Net |
|
|
|
|
|
|
|
|
|
|
|
|
HSBC Investor Opportunity Fund Class A1 | 9/23/96 | | 9.16 | | 4.24 | | 5.14 | | 1.82 | | 1.65 |
|
|
|
|
|
|
|
|
|
|
|
|
HSBC Investor Opportunity Fund Class B2 | 1/6/98 | | 9.92 | | 4.52 | | 5.19 | | 2.57 | | 2.40 |
|
|
|
|
|
|
|
|
|
|
|
|
HSBC Investor Opportunity Fund Class C3 | 11/4/98 | | 12.83 | | 4.51 | | 4.88 | | 2.57 | | 2.40 |
|
|
|
|
|
|
|
|
|
|
|
|
HSBC Investor Opportunity Fund Class I* | 9/3/96 | | 15.47 | | 5.67 | | 6.19 | | 0.97 | | 0.97 |
|
|
|
|
|
|
|
|
|
|
|
|
Russell 2500™ Growth Index4 | — | | 18.21 | | 2.00 | | 1.56 | | N/A | | N/A |
|
|
|
|
|
|
|
|
|
|
|
|
Lipper Mid-Cap Growth Funds Average4 | — | | 16.74 | | 1.56 | | 1.60 | | N/A | | N/A |
|
|
|
|
|
|
|
|
|
|
|
|
Past performance does not guarantee future results. The performance data quoted represents past performance and current returns may be lower or higher. Total return figures include change in share price, reinvestment of dividends and capital gains and do not reflect the taxes that a shareholder would pay on fund distributions or on the redemption of fund shares. The investment return and principal value will fluctuate so that an investor’s shares, when redeemed may be worth more or less than the original cost. To obtain performance information current to the most recent month end, please call 1-800-782-8183.
The performance above reflects any fee waivers that have been in effect during the applicable periods, as well as any expense reimbursements that have periodically been made. Absent such waivers and reimbursements, returns would have been lower. Currently, contractual fee waivers are in effect from March 1, 2009 through March 1, 2010.
| |
* | The Class I Shares of the HSBC Investor Opportunity Fund are part of the HSBC Advisor Funds Trust. |
| |
1 | Reflects the maximum sales charge of 5.00%. |
| |
2 | Reflects the applicable contingent deferred sales charge, maximum of 4.00%. |
| |
3 | Reflects the applicable contingent deferred sales charge, maximum of 1.00%. |
| |
4 | For additional information, please refer to the Glossary of Terms. |
| |
5 | Reflects the expense ratio as reported in the prospectus dated February 27, 2009. |
The Fund’s performance is measured against the Russell 2500™ Growth Index, an unmanaged index which measures the performance of the small- to mid-cap growth segment of the U.S. equity universe. It includes those 2500 companies with higher price-to-book ratios and higher forecasted growth values. The performance for the index does not reflect the deduction of expenses associated with a mutual fund, such as investment management and fund accounting fees. The Fund’s performance reflects the deduction of fees for these value-added services. Investors cannot invest directly in an index.
| |
HSBC INVESTOR FAMILY OF FUNDS | 15 |
|
Portfolio Reviews |
|
HSBC Investor Value Fund |
(Class A Shares, B Shares, C Shares and I Shares)
by Jon D. Bosse, CFA
Chief Investment Officer
NWQ Investment Management Company, LLC |
The HSBC Investor Value Fund (the “Fund”) seeks long-term growth of capital and income. Under normal market conditions, the Fund invests primarily in U.S. and foreign companies with large and medium capitalizations that the subadviser believes possess opportunities underappreciated or misperceived by the market. The Fund utilizes a two-tier structure, commonly known as a “master-feeder” structure, in which the Fund invests all of its investable assets in the HSBC Investor Value Portfolio (the “Portfolio”). The Portfolio employs NWQ Investment Management Company, LLC (“NWQ”) as subadviser.
Investment Concerns
Value-based investments are subject to the risk that the broad market may not recognize their intrinsic value.
Equity securities (stocks) are more volatile and carry more risk than other forms of investments, including investments in high-grade fixed income securities.
The net asset value per share of this Fund will fluctuate as the value of the securities in the Portfolio changes.
Market Commentary
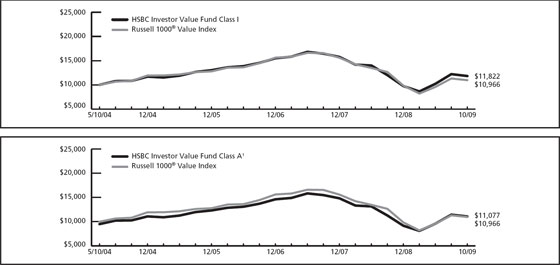
The Fund returned 19.59% (without sales charge) for the Class A Shares and 19.82% for the Class I Shares for the 12-month period ended October 31, 2009. That compared to a 4.78% return for the Russell 1000® Value Index1 and a 10.85% return for the Lipper Large-Cap Core Funds Average1.
Past performance does not guarantee future results.
Portfolio Performance
During the period, global equity markets experienced considerable volatility. During the first half of the period, the U.S. equity markets declined materially due to economic weakness, as well as fears that a number of major money center banks would fail and that the financial system would collapse. The second half saw stabilization within the U.S. and global financial system. Credit spreads tightened dramatically, reflecting lower risk premiums and better-functioning capital markets. These factors, combined with an improvement in the U.S. economy, contributed to appreciation and a reversal of the U.S. equity market’s first half decline.
The Fund’s absolute return was enhanced by positive contributions from all sectors except industrials and utilities. The largest contributor to performance came from the Fund’s investments in materials, specifically gold and fertilizer stocks. The Fund’s overweight position as well as specific holdings contributed to this performance. The second largest contribution came from the Fund’s overweight position, relative to the Russell 1000® Value Index1, and stock selection in information technology. Other notable contributors to performance in the Fund came from its investments in the energy, financials and consumer staples sectors. Underweight positions, again relative to the Russell 1000® Value Index1, in consumer discretionary and health care shares dragged on relative performance.*
| |
* | Portfolio composition is subject to change. |
| |
1 | For additional information, please refer to the Glossary of Terms. |
| |
16 | HSBC INVESTOR FAMILY OF FUNDS |
|
Portfolio Reviews |
|
HSBC Investor Value Fund - As of October 31, 2009 |
|
Value of a $10,000 Investment |
|
The charts above represent a comparison of a hypothetical $10,000 investment in the indicated share class versus a similar investment in the Fund’s benchmark and represents the reinvestment of dividends and capital gains in the Fund.
| | | | | | | | | | | | | |
Fund Performance | | | | Average Annual Total Return (%) | | Expense
Ratio (%)6 |
|
|
|
|
|
|
|
|
|
|
|
|
|
As of October 31, 2009 | | Inception
Date | | 1
Year | | 5
Year | | Since
Inception | | Gross | | Net |
|
|
|
|
|
|
|
|
|
|
|
|
|
HSBC Investor Value Fund Class A1 | | 5/7/04 | 5 | 13.61 | | 0.72 | | 1.89 | | | 1.23 | | 1.20 |
|
|
|
|
|
|
|
|
|
|
|
|
|
|
HSBC Investor Value Fund Class B2 | | 5/7/04 | 5 | 14.63 | | 0.97 | | 2.07 | | | 1.98 | | 1.95 |
|
|
|
|
|
|
|
|
|
|
|
|
|
|
HSBC Investor Value Fund Class C3 | | 5/7/04 | 5 | 17.60 | | 0.98 | | 2.06 | | | 1.98 | | 1.95 |
|
|
|
|
|
|
|
|
|
|
|
|
|
|
HSBC Investor Value Fund Class I | | 5/7/04 | 5 | 19.82 | | 1.99 | | 3.10 | | | 0.98 | | 0.95 |
|
|
|
|
|
|
|
|
|
|
|
|
|
|
Russell 1000® Value Index4 | | — | | 4.78 | | -0.05 | | 1.70 | 7 | | N/A | | N/A |
|
|
|
|
|
|
|
|
|
|
|
|
|
|
Lipper Large-Cap Core Funds Average4 | | — | | 10.85 | | 0.51 | | 1.11 | 7 | | N/A | | N/A |
|
|
|
|
|
|
|
|
|
|
|
|
|
|
Past performance does not guarantee future results. The performance data quoted represents past performance and current returns may be lower or higher. Total return figures include change in share price, reinvestment of dividends and capital gains and do not reflect the taxes that a shareholder would pay on fund distributions or on the redemption of fund shares. The investment return and principal value will fluctuate so that an investor’s shares, when redeemed may be worth more or less than the original cost. To obtain performance information current to the most recent month end, please call 1-800-782-8183.
The performance above reflects any fee waivers that have been in effect during the applicable periods, as well as any expense reimbursements that have periodically been made. Absent such waivers and reimbursements, returns would have been lower. Currently, contractual fee waivers are in effect from March 1, 2009 through March 1, 2010.
During the fiscal periods ended October 31, 2008 and 2009, the Portfolio in which the Fund invests received monies related to certain nonrecurring litigation settlements. Without the receipt of these payments, the returns for applicable periods would have been lower.
| |
1 | Reflects the maximum sales charge of 5.00%. |
| |
2 | Reflects the applicable contingent deferred sales charge, maximum of 4.00%. |
| |
3 | Reflects the applicable contingent deferred sales charge, maximum of 1.00%. |
| |
4 | For additional information, please refer to the Glossary of Terms. |
| |
5 | The HSBC Investor Value Fund was initially offered for purchase effective May 7, 2004, however, no shareholder activity occurred until May 10, 2004. |
| |
6 | Reflects the expense ratio as reported in the prospectus dated February 27, 2009. |
| |
7 | Return for the period 5/10/04 to 10/31/09. |
The Fund’s performance is measured against the Russell 1000® Value Index, an unmanaged index which measures the performance of the large-cap value segment of the U.S. equity universe. It includes those Russell 1000 companies with lower price-to-book ratios and lower expected growth values. The performance of the index does not reflect the deduction of expenses associated with a mutual fund, such as investment management and fund accounting fees. The Fund’s performance reflects the deduction of fees for these value-added services. Investors cannot invest directly in an index.
| |
HSBC INVESTOR FAMILY OF FUNDS | 17 |
(This Page Intentionally Left Blank)
|
Portfolio Reviews |
|
Portfolio Composition* |
October 31, 2009 |
(Unaudited) |
| | | | |
HSBC Investor Growth Portfolio | | | | |
|
|
|
|
|
| | | | |
Investment Allocation | | Percentage of Investments at Value | |
|
|
|
|
Financial Services | | 13.1 | % | |
|
|
|
|
|
Internet Related | | 8.8 | % | |
|
|
|
|
|
Telecommunications | | 8.6 | % | |
|
|
|
|
|
Computers | | 8.4 | % | |
|
|
|
|
|
Pharmaceuticals | | 8.4 | % | |
|
|
|
|
|
Oil & Gas | | 8.0 | % | |
|
|
|
|
|
Retail | | 6.5 | % | |
|
|
|
|
|
Computer Services | | 4.7 | % | |
|
|
|
|
|
Computer Software | | 4.6 | % | |
|
|
|
|
|
Health Care | | 3.7 | % | |
|
|
|
|
|
Cash and Equivalents | | 3.6 | % | |
|
|
|
|
|
Diversified Manufacturing Operations | | 3.4 | % | |
|
|
|
|
|
Transportation | | 3.4 | % | |
|
|
|
|
|
Electronic Components & Semiconductors | | 3.2 | % | |
|
|
|
|
|
Business Services | | 3.0 | % | |
|
|
|
|
|
Aerospace & Defense | | 2.3 | % | |
|
|
|
|
|
Metals & Mining | | 1.7 | % | |
|
|
|
|
|
Biotechnology | | 1.5 | % | |
|
|
|
|
|
Chemicals | | 1.2 | % | |
|
|
|
|
|
Consumer Products | | 1.0 | % | |
|
|
|
|
|
Leisure | | 0.9 | % | |
|
|
|
|
|
Total | | 100.0 | % | |
|
|
|
|
|
| | | | |
HSBC International Equity Portfolio | | | | |
|
|
|
|
|
| | | |
Investment Allocation | | Percentage of Investments at Value | |
|
|
|
|
Europe | | 71.0 | % | |
|
|
|
|
|
Japan | | 12.0 | % | |
|
|
|
|
|
Australia & Far East | | 11.5 | % | |
|
|
|
|
|
Canada | | 4.0 | % | |
|
|
|
|
|
Cash | | 0.9 | % | |
|
|
|
|
|
Other | | 0.6 | % | |
|
|
|
|
|
Total | | 100.0 | % | |
|
|
|
|
|
| | | | |
HSBC Investor Mid-Cap Fund | | | | |
|
|
|
|
|
| | | |
Investment Allocation | | Percentage of Investments at Value | |
|
|
|
|
Health Care | | 8.3 | % | |
|
|
|
|
|
Oil & Gas | | 7.5 | % | |
|
|
|
|
|
Computer Services | | 6.1 | % | |
|
|
|
|
|
Financial Services | | 5.9 | % | |
|
|
|
|
|
Computer Software | | 5.7 | % | |
|
|
|
|
|
Consumer Products | | 5.1 | % | |
|
|
|
|
|
Utilities | | 4.9 | % | |
|
|
|
|
|
Electronic Components & Semiconductors | | 4.6 | % | |
|
|
|
|
|
Commercial Services | | 4.5 | % | |
|
|
|
|
|
Insurance | | 4.3 | % | |
|
|
|
|
|
Cash and Equivalents | | 4.0 | % | |
|
|
|
|
|
Food & Beverage | | 3.9 | % | |
|
|
|
|
|
Real Estate | | 3.4 | % | |
|
|
|
|
|
Distribution & Wholesale | | 3.3 | % | |
|
|
|
|
|
Retail | | 2.6 | % | |
|
|
|
|
|
Industrial Manufacturing | | 2.5 | % | |
|
|
|
|
|
Chemicals | | 2.3 | % | |
|
|
|
|
|
Telecommunications | | 2.2 | % | |
|
|
|
|
|
Business Services | | 1.9 | % | |
|
|
|
|
|
Machinery | | 1.9 | % | |
|
|
|
|
|
Education | | 1.7 | % | |
|
|
|
|
|
Energy | | 1.7 | % | |
|
|
|
|
|
Correctional Institutions | | 1.5 | % | |
|
|
|
|
|
Aerospace & Defense | | 1.4 | % | |
|
|
|
|
|
Environmental Services | | 1.3 | % | |
|
|
|
|
|
Biotechnology | | 1.2 | % | |
|
|
|
|
|
Communications | | 1.1 | % | |
|
|
|
|
|
Agricultural Chemicals | | 1.0 | % | |
|
|
|
|
|
Automotive & Transport | | 1.0 | % | |
|
|
|
|
|
Banking | | 0.8 | % | |
|
|
|
|
|
Specialty Retail | | 0.7 | % | |
|
|
|
|
|
Leisure | | 0.6 | % | |
|
|
|
|
|
Metal Processors & Fabrication | | 0.6 | % | |
|
|
|
|
|
Transportation | | 0.5 | % | |
|
|
|
|
|
Total | | 100.0 | % | |
|
|
|
|
|
| |
* | Portfolio composition is subject to change. |
| |
HSBC INVESTOR FAMILY OF FUNDS | 19 |
|
Portfolio Reviews |
|
Portfolio Composition* |
October 31, 2009 |
(Unaudited) |
| | | | |
HSBC Investor Opportunity Portfolio | | | | |
|
|
|
|
|
| | | | | | | |
Investment Allocation | | Percentage of Investments at Value | |
|
|
|
|
Oil & Gas | | 12.3 | % | |
|
|
|
|
|
Computer Software | | 10.7 | % | |
|
|
|
|
|
Pharmaceuticals | | 10.5 | % | |
|
|
|
|
|
Industrial Manufacturing | | 6.7 | % | |
|
|
|
|
|
Health Care | | 6.5 | % | |
|
|
|
|
|
Telecommunications | | 5.8 | % | |
|
|
|
|
|
Biotechnology | | 5.6 | % | |
|
|
|
|
|
Consumer Products | | 5.3 | % | |
|
|
|
|
|
Retail | | 5.0 | % | |
|
|
|
|
|
Diversified Manufacturing Operations | | 4.3 | % | |
|
|
|
|
|
Financial Services | | 3.9 | % | |
|
|
|
|
|
Electronic Components & Semiconductors | | 3.4 | % | |
|
|
|
|
|
Internet Related | | 3.4 | % | |
|
|
|
|
|
Business Services | | 2.6 | % | |
|
|
|
|
|
Cash and Equivalents | | 2.5 | % | |
|
|
|
|
|
Aerospace & Defense | | 2.3 | % | |
|
|
|
|
|
Environmental Services | | 2.1 | % | |
|
|
|
|
|
Chemicals | | 1.7 | % | |
|
|
|
|
|
Education | | 1.5 | % | |
|
|
|
|
|
Transportation | | 1.5 | % | |
|
|
|
|
|
Communications | | 1.2 | % | |
|
|
|
|
|
Gaming | | 1.2 | % | |
|
|
|
|
|
Total | | 100.0 | % | |
|
|
|
|
|
| | | | |
HSBC Investor Value Portfolio | | | | |
|
|
|
|
|
| | | | |
Investment Allocation | | Percentage of Investments at Value | |
|
|
|
|
Oil & Gas | | 14.8 | % | |
|
|
|
|
|
Pharmaceuticals | | 11.2 | % | |
|
|
|
|
|
Insurance | | 10.4 | % | |
|
|
|
|
|
Telecommunications | | 8.3 | % | |
|
|
|
|
|
Computer Software | | 7.4 | % | |
|
|
|
|
|
Media | | 6.9 | % | |
|
|
|
|
|
Metals & Mining | | 6.8 | % | |
|
|
|
|
|
Aerospace & Defense | | 5.4 | % | |
|
|
|
|
|
Conglomerates | | 3.4 | % | |
|
|
|
|
|
Business Services | | 3.2 | % | |
|
|
|
|
|
Energy | | 3.2 | % | |
|
|
|
|
|
Consumer Products | | 2.9 | % | |
|
|
|
|
|
Cash and Equivalents | | 2.8 | % | |
|
|
|
|
|
Banking | | 2.6 | % | |
|
|
|
|
|
Financial Services | | 2.5 | % | |
|
|
|
|
|
Tobacco | | 2.5 | % | |
|
|
|
|
|
Transportation | | 1.9 | % | |
|
|
|
|
|
Diversified Manufacturing Operations | | 1.6 | % | |
|
|
|
|
|
Agricultural Chemicals | | 1.1 | % | |
|
|
|
|
|
Retail | | 1.1 | % | |
|
|
|
|
|
Total | | 100.0 | % | |
|
|
|
|
|
| |
* | Portfolio composition is subject to change. |
| |
20 | HSBC INVESTOR FAMILY OF FUNDS |
|
HSBC INVESTOR MID-CAP FUND |
|
Schedule of Portfolio Investments—As of October 31, 2009 |
| | | | | | | |
Common Stocks—97.1% | | | | | | | |
|
|
|
|
|
|
|
|
| | | | | | | |
| | Shares | | Value($) | |
| |
| |
| |
Aerospace & Defense – 1.4% | | | | | | | |
Elbit Systems Ltd. | | | 500 | | | 30,255 | |
L-3 Communications Holdings, Inc. | | | 2,100 | | | 151,809 | |
| | | | |
|
| |
| | | | | | 182,064 | |
| | | | |
|
| |
Agricultural Chemicals – 1.0% | | | | | | | |
Compass Minerals International, Inc. | | | 2,200 | | | 137,104 | |
| | | | |
|
| |
Automotive & Transport – 1.0% | | | | | | | |
BorgWarner, Inc. | | | 4,450 | | | 134,924 | |
| | | | |
|
| |
Banking – 0.8% | | | | | | | |
Signature Bank (a) | | | 3,350 | | | 105,726 | |
| | | | |
|
| |
Biotechnology – 1.2% | | | | | | | |
BioMarin Pharmaceuticals, Inc. (a) | | | 10,400 | | | 161,824 | |
| | | | |
|
| |
Business Services – 1.9% | | | | | | | |
Fiserv, Inc. (a) | | | 3,400 | | | 155,958 | |
Morningstar, Inc. (a) | | | 1,900 | | | 96,938 | |
| | | | |
|
| |
| | | | | | 252,896 | |
| | | | |
|
| |
Chemicals – 2.3% | | | | | | | |
Airgas, Inc. | | | 3,550 | | | 157,478 | |
Valspar Corp. (The) | | | 5,700 | | | 144,609 | |
| | | | |
|
| |
| | | | | | 302,087 | |
| | | | |
|
| |
Commercial Services – 4.6% | | | | | | | |
Aaron’s, Inc. | | | 4,200 | | | 105,210 | |
IHS, Inc., Class A (a) | | | 4,200 | | | 217,392 | |
Ritchie Brothers Auctioneers, Inc. ADR | | | 7,275 | | | 159,468 | |
URS Corp. (a) | | | 3,050 | | | 118,523 | |
| | | | |
|
| |
| | | | | | 600,593 | |
| | | | |
|
| |
Communications – 1.1% | | | | | | | |
Discovery Communications, Inc., Class A (a) | | | 2,250 | | | 61,875 | |
Discovery Communications, Inc., Class C (a) | | | 3,600 | | | 86,472 | |
| | | | |
|
| |
| | | | | | 148,347 | |
| | | | |
|
| |
Computer Services – 6.1% | | | | | | | |
Cognizant Technology Solutions Corp. (a) | | | 7,425 | | | 286,976 | |
FactSet Research Systems, Inc. | | | 2,950 | | | 188,948 | |
McAfee, Inc. (a) | | | 6,250 | | | 261,750 | |
Teradata Corp. (a) | | | 2,600 | | | 72,488 | |
| | | | |
|
| |
| | | | | | 810,162 | |
| | | | |
|
| |
Computer Software – 5.7% | | | | | | | |
Akamai Technologies, Inc. (a) | | | 3,550 | | | 78,100 | |
Check Point Software Technologies Ltd. (a) | | | 5,800 | | | 180,206 | |
MICROS Systems, Inc. (a) | | | 5,200 | | | 139,984 | |
Solera Holdings, Inc. | | | 5,300 | | | 170,766 | |
Sybase, Inc. (a) | | | 4,700 | | | 185,932 | |
| | | | |
|
| |
| | | | | | 754,988 | |
| | | | |
|
| |
| | | | | | | |
Common Stocks, continued | | | | | | | |
|
|
|
|
|
|
|
|
| | | | | | | |
| | Shares | | Value($) | |
| |
| |
| |
Consumer Products – 5.1% | | | | | | | |
Church & Dwight Co., Inc. | | | 3,050 | | | 173,484 | |
Crown Holdings, Inc. (a) | | | 9,100 | | | 242,515 | |
Gildan Activewear, Inc. (a) | | | 1,100 | | | 19,503 | |
Tupperware Brands Corp. | | | 3,800 | | | 171,076 | |
VF Corp. | | | 1,000 | | | 71,040 | |
| | | | |
|
| |
| �� | | | | | 677,618 | |
| | | | |
|
| |
Correctional Institutions – 1.5% | | | | | | | |
Corrections Corp. of America (a) | | | 8,275 | | | 198,104 | |
| | | | |
|
| |
Distribution & Wholesale – 3.3% | | | | | | | |
Genuine Parts Co. | | | 5,100 | | | 178,449 | |
LKQ Corp. (a) | | | 14,825 | | | 256,028 | |
| | | | |
|
| |
| | | | | | 434,477 | |
| | | | |
|
| |
Education – 1.8% | | | | | | | |
DeVry, Inc. | | | 2,600 | | | 143,754 | |
New Oriental Education & Technology Group, Inc. ADR (a) | | | 1,250 | | | 87,300 | |
| | | | |
|
| |
| | | | | | 231,054 | |
| | | | |
|
| |
Electronic Components & Semiconductors – 4.7% | | | | | | | |
American Superconductor Corp. (a) | | | 3,300 | | | 110,616 | |
Cree, Inc. (a) | | | 5,100 | | | 214,710 | |
Itron, Inc. (a) | | | 2,300 | | | 138,092 | |
Microchip Technology, Inc. | | | 6,400 | | | 153,344 | |
| | | | |
|
| |
| | | | | | 616,762 | |
| | | | |
|
| |
Energy – 1.8% | | | | | | | |
Core Laboratories N.V. | | | 2,225 | | | 232,068 | |
| | | | |
|
| |
Environmental Services – 1.3% | | | | | | | |
Stericycle, Inc. (a) | | | 3,375 | | | 176,749 | |
| | | | |
|
| |
Financial Services – 6.0% | | | | | | | |
Affiliated Managers Group, Inc. (a) | | | 2,750 | | | 174,598 | |
Annaly Capital Management, Inc. | | | 16,350 | | | 276,478 | |
Eaton Vance Corp. | | | 4,975 | | | 141,240 | |
Lazard Ltd., Class A | | | 3,600 | | | 135,900 | |
People’s United Financial, Inc. | | | 4,000 | | | 64,120 | |
| | | | |
|
| |
| | | | | | 792,336 | |
| | | | |
|
| |
Food & Beverage – 3.9% | | | | | | | |
Central European Distribution Corp. (a) | | | 5,625 | | | 174,994 | |
Flowers Foods, Inc. | | | 6,025 | | | 140,744 | |
J.M. Smucker Co. (The) | | | 2,650 | | | 139,734 | |
Yum! Brands, Inc. | | | 1,900 | | | 62,605 | |
| | | | |
|
| |
| | | | | | 518,077 | |
| | | | |
|
| |
Health Care – 8.4% | | | | | | | |
DaVita, Inc. (a) | | | 3,000 | | | 159,090 | |
Haemonetics Corp. (a) | | | 2,900 | | | 149,350 | |
Hologic, Inc. (a) | | | 4,276 | | | 63,199 | |
Intuitive Surgical, Inc. (a) | | | 300 | | | 73,905 | |
| | |
See notes to financial statements. | HSBC INVESTOR FAMILY OF FUNDS | 21 |
|
HSBC INVESTOR MID-CAP FUND |
|
Schedule of Portfolio Investments—As of October 31, 2009 (continued) |
| | | | | | | |
Common Stocks, continued | | | | | | | |
|
|
|
|
|
|
|
|
| | | | | |
| | Shares | | Value($) | |
| |
| |
| |
Health Care, continued | | | | | | | |
Laboratory Corp. of America Holdings (a) | | | 2,175 | | | 149,836 | |
Masimo Corp. (a) | | | 2,800 | | | 74,396 | |
ResMed, Inc. (a) | | | 4,150 | | | 204,221 | |
Techne Corp. | | | 725 | | | 45,320 | |
West Pharmaceutical Services, Inc. | | | 4,750 | | | 187,483 | |
| | | | |
|
| |
| | | | | | 1,106,800 | |
| | | | |
|
| |
Industrial Manufacturing – 2.6% | | | | | | | |
Eaton Corp. | | | 1,350 | | | 81,607 | |
Lincoln Electric Holdings, Inc. | | | 2,850 | | | 135,204 | |
Valmont Industries, Inc. | | | 1,700 | | | 122,859 | |
| | | | |
|
| |
| | | | | | 339,670 | |
| | | | |
|
| |
Insurance – 4.4% | | | | | | | |
Axis Capital Holdings Ltd. | | | 7,100 | | | 205,119 | |
Lincoln National Corp. | | | 7,300 | | | 173,959 | |
Proassurance Corp. (a) | | | 3,950 | | | 198,606 | |
| | | | |
|
| |
| | | | | | 577,684 | |
| | | | |
|
| |
Leisure – 0.6% | | | | | | | |
Penn National Gaming, Inc. (a) | | | 3,300 | | | 82,929 | |
| | | | |
|
| |
| | | | | | | |
Machinery – 2.0% | | | | | | | |
AGCO Corp. (a) | | | 1,700 | | | 47,787 | |
Flowserve Corp. | | | 2,150 | | | 211,151 | |
| | | | |
|
| |
| | | | | | 258,938 | |
| | | | |
|
| |
Metal Processors & Fabrication – 0.6% | | | | | | | |
Precision Castparts Corp. | | | 800 | | | 76,304 | |
| | | | |
|
| |
Oil & Gas – 7.6% | | | | | | | |
Arena Resources, Inc. (a) | | | 3,650 | | | 135,999 | |
Atlas Energy, Inc. | | | 8,512 | | | 222,844 | |
Denbury Resources, Inc. (a) | | | 10,200 | | | 148,920 | |
EQT Corp. | | | 5,125 | | | 214,533 | |
Oil States International, Inc. (a) | | | 3,175 | | | 109,347 | |
Southwestern Energy Co. (a) | | | 3,950 | | | 172,141 | |
| | | | |
|
| |
| | | | | | 1,003,784 | |
| | | | |
|
| |
Real Estate – 3.4% | | | | | | | |
Corporate Office Properties Trust | | | 3,500 | | | 116,165 | |
Digital Realty Trust, Inc. | | | 4,600 | | | 207,598 | |
Essex Property Trust, Inc. | | | 1,700 | | | 127,806 | |
| | | | |
|
| |
| | | | | | 451,569 | |
| | | | |
|
| |
Retail – 2.6% | | | | | | | |
Chipotle Mexican Grill, Inc., Class A (a) | | | 1,200 | | | 97,788 | |
Guess?, Inc. | | | 2,650 | | | 96,857 | |
O’Reilly Automotive, Inc. (a) | | | 4,000 | | | 149,120 | |
| | | | |
|
| |
| | | | | | 343,765 | |
| | | | |
|
| |
Specialty Retail – 0.7% | | | | | | | |
GameStop Corp., Class A (a) | | | 3,975 | | | 96,553 | |
| | | | |
|
| |
Telecommunications – 2.2% | | | | | | | |
American Tower Corp., Class A (a) | | | 5,100 | | | 187,782 | |
NII Holdings, Inc. (a) | | | 3,850 | | | 103,680 | |
| | | | |
|
| |
| | | | | | 291,462 | |
| | | | |
|
| |
| | | | | | | |
Common Stocks, continued | | | | | | | |
|
|
|
|
|
|
|
|
| | | | | | | |
| | Shares | | Value($) | |
| |
| |
| |
Transportation – 0.5% | | | | | | | |
Kansas City Southern (a) | | | 2,550 | | | 61,787 | |
| | | | |
|
| |
Utilities – 5.0% | | | | | | | |
ITC Holdings Corp. | | | 3,275 | | | 145,475 | |
Northeast Utilities | | | 8,575 | | | 197,654 | |
NorthWestern Corp. | | | 7,600 | | | 183,540 | |
Portland General Electric Co. | | | 6,900 | | | 128,271 | |
| | | | |
|
| |
| | | | | | 654,940 | |
| | | | |
|
| |
TOTAL COMMON STOCKS
(COST $11,684,946) | | | | | | 12,814,145 | |
| | | | |
|
| |
Investment Companies – 4.0% | | | | | | | |
|
|
|
|
|
|
|
|
MidCap S&P Depositary Receipt Trust
Series 1 | | | 2,510 | | | 300,045 | |
Northern Institutional Diversified Assets
Portfolio, Shares Class, 0.09% (b) | | | 229,848 | | | 229,848 | |
| | | | |
|
| |
TOTAL INVESTMENT COMPANIES
(COST $486,185) | | | | | | 529,893 | |
| | | | |
|
| |
TOTAL INVESTMENTS
(COST $12,171,131) – 101.1% | | | | | | 13,344,038 | |
| | | | |
|
| |
| |
| Percentages indicated are based on net assets of $13,204,305. |
| |
(a) | Represents non-income producing security. |
| |
(b) | The rate represents the annualized one-day yield that was in effect on October 31, 2009. |
| |
ADR — American Depositary Receipt |
| | |
22 | HSBC INVESTOR FAMILY OF FUNDS | See notes to financial statements. |
(This Page Intentionally Left Blank)
HSBC INVESTOR FAMILY OF FUNDS
Statements of Assets and Liabilities—As of October 31, 2009
| | | | | | | | | | | | | | | | |
| | Growth
Fund | | International
Equity Fund | | Mid-Cap
Fund | | Opportunity
Fund | | Opportunity
Fund (Advisor) | |
|
Assets: | | | | | | | | | | | | | | | | |
Investments in Affiliated Portfolios | | $ | 57,520,119 | | $ | 179,737,109 | | $ | — | | $ | 11,027,004 | | $ | 100,214,407 | |
Investments in non-affiliates, at value | | | — | | | — | | | 13,344,038 | | | — | | | — | |
Dividends receivable | | | — | | | — | | | 3,068 | | | — | | | — | |
Receivable for capital shares issued | | | 24,021 | | | 33,222 | | | 273 | | | 9,772 | | | 128,566 | |
Receivable for investments sold | | | — | | | — | | | 31,238 | | | — | | | — | |
Reclaims receivable | | | — | | | 807,988 | | | — | | | — | | | — | |
Receivable from Investment Adviser | | | — | | | — | | | — | | | 5,675 | | | — | |
Prepaid expenses and other assets | | | 15,048 | | | 2,202 | | | 4,545 | | | 12,043 | | | 451 | |
| |
|
| |
|
| |
|
| |
|
| |
|
| |
Total Assets | | | 57,559,188 | | | 180,580,521 | | | 13,383,162 | | | 11,054,494 | | | 100,343,424 | |
| |
|
| |
|
| |
|
| |
|
| |
|
| |
Liabilities: | | | | | | | | | | | | | | | | |
Payable for investments purchased | | | — | | | — | | | 50,973 | | | — | | | — | |
Payable for capital shares redeemed | | | 45,982 | | | 235,403 | | | 103,205 | | | 1,022 | | | 13,936 | |
Payable to Investment Adviser | | | 1,288 | | | — | | | — | | | — | | | — | |
Accrued expenses and other liabilities: | | | | | | | | | | | | | | | | |
Investment Management | | | — | | | — | | | 3,363 | | | — | | | — | |
Administration | | | 970 | | | 3,019 | | | 450 | | | 187 | | | 1,685 | |
Distribution | | | 1,455 | | | — | | | 1,085 | | | 901 | | | — | |
Shareholder Servicing | | | 4,071 | | | — | | | 1,292 | | | 2,474 | | | — | |
Compliance Services | | | 25 | | | 71 | | | 1 | | | 4 | | | 40 | |
Transfer Agent | | | 14,021 | | | 6,097 | | | 11,250 | | | 10,257 | | | 6,090 | |
Trustee | | | 107 | | | 376 | | | 47 | | | 23 | | | 203 | |
Other | | | 16,101 | | | 93,413 | | | 7,191 | | | 3,196 | | | 36,171 | |
| |
|
| |
|
| |
|
| |
|
| |
|
| |
Total Liabilities | | | 84,020 | | | 338,379 | | | 178,857 | | | 18,064 | | | 58,125 | |
| |
|
| |
|
| |
|
| |
|
| |
|
| |
Net Assets | | $ | 57,475,168 | | $ | 180,242,142 | | $ | 13,204,305 | | $ | 11,036,430 | | $ | 100,285,299 | |
| |
|
| |
|
| |
|
| |
|
| |
|
| |
| | | | | | | | | | | | | | | | |
Composition of Net Assets: | | | | | | | | | | | | | | | | |
Capital | | $ | 62,912,976 | | $ | 247,813,362 | | $ | 15,673,685 | | $ | 12,494,689 | | $ | 112,608,620 | |
Accumulated net investment income (loss) | | | — | | | 2,365,154 | | | 37,965 | | | — | | | — | |
Accumulated net realized gains (losses) from investment and foreign currency transactions | | | (9,563,975 | ) | | (60,031,894 | ) | | (3,680,252 | ) | | (1,571,331 | ) | | (13,150,084 | ) |
Unrealized appreciation/depreciation from investments and foreign currencies | | | 4,126,167 | | | (9,904,480 | ) | | 1,172,907 | | | 113,072 | | | 826,763 | |
| |
|
| |
|
| |
|
| |
|
| |
|
| |
Net Assets | | $ | 57,475,168 | | $ | 180,242,142 | | $ | 13,204,305 | | $ | 11,036,430 | | $ | 100,285,299 | |
| |
|
| |
|
| |
|
| |
|
| |
|
| |
| | | | | | | | | | | | | | | | |
Net Assets: | | | | | | | | | | | | | | | | |
Class A Shares | | $ | 15,895,536 | | $ | — | | $ | 4,186,288 | | $ | 9,687,040 | | $ | — | |
Class B Shares | | | 2,059,465 | | | — | | | 1,573,521 | | | 1,082,277 | | | — | |
Class C Shares | | | 120,253 | | | — | | | 12,810 | | | 267,113 | | | — | |
Class I Shares | | | 39,399,914 | | | 180,242,142 | | | 7,431,686 | | | — | | | 100,285,299 | |
| |
|
| |
|
| |
|
| |
|
| |
|
| |
| | $ | 57,475,168 | | $ | 180,242,142 | | $ | 13,204,305 | | $ | 11,036,430 | | $ | 100,285,299 | |
| |
|
| |
|
| |
|
| |
|
| |
|
| |
| | | | | | | | | | | | | | | | |
Shares Outstanding ($0.001 par value, unlimited number of shares authorized): | | | | | | | | | | | | | | | | |
| | | | | | | | | | | | | | | | |
| | | | | | | | | | | | | | | | |
Class A Shares | | | 1,267,988 | | | — | | | 736,994 | | | 1,282,081 | | | — | |
Class B Shares | | | 177,472 | | | — | | | 307,780 | | | 169,946 | | | — | |
Class C Shares | | | 10,298 | | | — | | | 2,477 | | | 41,131 | | | — | |
Class I Shares | | | 3,114,630 | | | 14,826,622 | | | 1,269,485 | | | — | | | 10,102,215 | |
| | | | | | | | | | | | | | | | |
Net Asset Value, Offering Price and Redemption Price per share: | | | | | | | | | | | | | | | | |
Class A Shares | | $ | 12.54 | | $ | — | | $ | 5.68 | | $ | 7.56 | | $ | — | |
Class B Shares* | | $ | 11.60 | | $ | — | | $ | 5.11 | | $ | 6.37 | | $ | — | |
Class C Shares* | | $ | 11.68 | | $ | — | | $ | 5.17 | | $ | 6.49 | | $ | — | |
Class I Shares | | $ | 12.65 | | $ | 12.16 | | $ | 5.85 | | $ | — | | $ | 9.93 | |
Maximum Sales Charge – Class A Shares | | | 5.00 | % | | — | % | | 5.00 | % | | 5.00 | % | | — | % |
| |
|
| |
|
| |
|
| |
|
| |
|
| |
| | | | | | | | | | | | | | | | |
Maximum Offering Price per share (Net Asset Value/(100% – maximum sales charge)) – Class A Shares | | $ | 13.20 | | $ | — | | $ | 5.98 | | $ | 7.96 | | $ | — | |
| |
|
| |
|
| |
|
| |
|
| |
|
| |
Total Investments, at cost | | | | | | | | $ | 12,171,131 | | | | | | | |
| | | | | | | |
|
| | | | | | | |
| |
|
* | Redemption Price per share varies by length of time shares are held. |
| | |
24 | HSBC INVESTOR FAMILY OF FUNDS | See notes to financial statements. |
HSBC INVESTOR FAMILY OF FUNDS
Statements of Assets and Liabilities—As of October 31, 2009 (continued)
| | | | | | | |
| | Overseas
Equity Fund | | Value Fund | |
|
Assets: | | | | | | | |
Investments in Affiliated Portfolios | | $ | 6,910,706 | | $ | 30,047,170 | |
Receivable for capital shares issued | | | 33 | | | 23,826 | |
Reclaims receivable | | | 52,495 | | | — | |
Receivable from Investment Adviser | | | 3,143 | | | 1,753 | |
Prepaid expenses and other assets | | | 11,479 | | | 6,962 | |
| |
|
| |
|
| |
Total Assets | | | 6,977,856 | | | 30,079,711 | |
| |
|
| |
|
| |
Liabilities: | | | | | | | |
Payable for capital shares redeemed | | | 5,596 | | | 38,323 | |
Accrued expenses and other liabilities: | | | | | | | |
Administration | | | 120 | | | 511 | |
Distribution | | | 683 | | | 364 | |
Shareholder Servicing | | | 1,586 | | | 3,035 | |
Compliance Services | | | 3 | | | 67 | |
Transfer Agent | | | 9,357 | | | 12,073 | |
Trustee | | | 13 | | | 54 | |
Other | | | 1,970 | | | 8,753 | |
| |
|
| |
|
| |
Total Liabilities | | | 19,328 | | | 63,180 | |
| |
|
| |
|
| |
Net Assets | | $ | 6,958,528 | | $ | 30,016,531 | |
| |
|
| |
|
| |
| | | | | | | |
Composition of Net Assets: | | | | | | | |
Capital | | $ | 9,576,058 | | $ | 38,385,888 | |
Accumulated net investment income | | | 108,816 | | | 14,848 | |
Accumulated net realized gains (losses) from investment and foreign currency transactions | | | (2,395,705 | ) | | (5,824,403 | ) |
Unrealized appreciation/depreciation from investments and foreign currencies | | | (330,641 | ) | | (2,559,802 | ) |
| |
|
| |
|
| |
Net Assets | | $ | 6,958,528 | | $ | 30,016,531 | |
| |
|
| |
|
| |
| | | | | | | |
Net Assets: | | | | | | | |
Class A Shares | | $ | 5,939,113 | | $ | 12,742,187 | |
Class B Shares | | | 961,597 | | | 466,051 | |
Class C Shares | | | 57,818 | | | 71,244 | |
Class I Shares | | | — | | | 16,737,049 | |
| |
|
| |
|
| |
| | $ | 6,958,528 | | $ | 30,016,531 | |
| |
|
| |
|
| |
| | | | | | | |
Shares Outstanding ($0.001 par value, unlimited number of shares authorized): | | | | | | | |
Class A Shares | | | 1,449,988 | | | 1,206,972 | |
Class B Shares | | | 267,861 | | | 46,234 | |
Class C Shares | | | 14,877 | | | 7,020 | |
Class I Shares | | | — | | | 1,588,086 | |
| | | | | | | |
Net Asset Value, Offering Price and Redemption Price per share: | | | | | | | |
Class A Shares | | $ | 4.10 | | $ | 10.56 | |
Class B Shares* | | $ | 3.59 | | $ | 10.08 | |
Class C Shares* | | $ | 3.89 | | $ | 10.15 | |
Class I Shares | | $ | — | | $ | 10.54 | |
Maximum Sales Charge – Class A Shares | | | 5.00 | % | | 5.00 | % |
| |
|
| |
|
| |
Maximum Offering Price per share (Net Asset Value/(100%–maximum sales charge)) – Class A Shares | | $ | 4.32 | | $ | 11.12 | |
| |
|
| |
|
| |
| |
|
* | Redemption Price per share varies by length of time shares are held. |
| | |
See notes to financial statements. | HSBC INVESTOR FAMILY OF FUNDS | 25 |
HSBC INVESTOR FAMILY OF FUNDS
Statements of Operations—For the year ended October 31, 2009
| | | | | | | | | | | | | | | | |
| | Growth
Fund | | International
Equity Fund | | Mid-Cap
Fund | | Opportunity
Fund | | Opportunity
Fund (Advisor) | |
|
Investment Income: | | | | | | | | | | | | | | | | |
Dividends | | $ | — | | $ | — | | $ | 204,943 | | $ | — | | $ | — | |
Investment income from Affiliated Portfolios (a) | | | 462,303 | | | 5,304,378 | | | — | | | 52,830 | | | 459,753 | |
Tax reclaims from Affiliated Portfolios (a) | | | — | | | 227,813 | | | — | | | — | | | — | |
Foreign tax withholding from Affiliated Portfolios (a) | | | (190 | ) | | (736,335 | ) | | — | | | — | | | — | |
Expenses from Affiliated Portfolios (a) | | | (368,086 | ) | | (1,294,526 | ) | | — | | | (89,861 | ) | | (784,048 | ) |
| |
|
| |
|
| |
|
| |
|
| |
|
| |
Total Investment Income (Loss) | | | 94,027 | | | 3,501,330 | | | 204,943 | | | (37,031 | ) | | (324,295 | ) |
| |
|
| |
|
| |
|
| |
|
| |
|
| |
| | | | | | | | | | | | | | | | |
Expenses: | | | | | | | | | | | | | | | | |
Investment Management | | | — | | | — | | | 96,355 | | | — | | | — | |
Administration: | | | | | | | | | | | | | | | | |
Class A Shares | | | 2,971 | | | — | | | 1,378 | | | 1,672 | | | — | |
Class B Shares | | | 444 | | | — | | | 643 | | | 235 | | | — | |
Class C Shares | | | 16 | | | — | | | 7 | | | 40 | | | — | |
Class I Shares | | | 6,847 | | | 28,826 | | | 2,939 | | | — | | | 17,007 | |
Distribution: | | | | | | | | | | | | | | | | |
Class B Shares | | | 17,154 | | | — | | | 12,310 | | | 8,972 | | | — | |
Class C Shares | | | 652 | | | — | | | 81 | | | 1,555 | | | — | |
Shareholder Servicing: | | | | | | | | | | | | | | | | |
Class A Shares | | | 38,197 | | | — | | | 8,886 | | | 18,247 | | | — | |
Class B Shares | | | 5,750 | | | — | | | 4,145 | | | 2,994 | | | — | |
Class C Shares | | | 218 | | | — | | | 28 | | | 520 | | | — | |
Accounting | | | 14,452 | | | 9,001 | | | 57,150 | | | 18,998 | | | 9,001 | |
Compliance Services | | | 206 | | | 672 | | | 104 | | | 45 | | | 398 | |
Custodian | | | — | | | — | | | 10,348 | | | — | | | — | |
Printing | | | 27,840 | | | 16,451 | | | 9,226 | | | 9,506 | | | 18,281 | |
Professional | | | 6,663 | | | 2,791 | | | 475 | | | 192 | | | 1,644 | |
Transfer Agent | | | 67,396 | | | 30,867 | | | 58,091 | | | 68,642 | | | 31,862 | |
Trustee | | | 713 | | | 2,236 | | | 388 | | | 151 | | | 1,314 | |
Registration | | | 52,118 | | | 13,000 | | | 5,917 | | | 16,792 | | | 6,544 | |
Other | | | 14,540 | | | 42,551 | | | 6,681 | | | 2,866 | | | 23,669 | |
| |
|
| |
|
| |
|
| |
|
| |
|
| |
Total expenses before fee reductions | | | 256,177 | | | 146,395 | | | 275,152 | | | 151,427 | | | 109,720 | |
Fees reimbursed by Investment Adviser | | | (56,048 | ) | | — | | | (108,174 | ) | | (75,810 | ) | | — | |
| |
|
| |
|
| |
|
| |
|
| |
|
| |
Net Expenses | | | 200,129 | | | 146,395 | | | 166,978 | | | 75,617 | | | 109,720 | |
| |
|
| |
|
| |
|
| |
|
| |
|
| |
| | | | | | | | | | | | | | | | |
Net Investment Income (Loss) | | | (106,102 | ) | | 3,354,935 | | | 37,965 | | | (112,648 | ) | | (434,015 | ) |
| |
|
| |
|
| |
|
| |
|
| |
|
| |
Net Realized/Unrealized Gains (Losses) from Investments: (a) | | | | | | | | | | | | | | | | |
Net realized gains (losses) from investment and foreign currency transactions | | | (9,717,237 | ) | | (59,981,220 | ) | | (3,510,422 | ) | | (1,474,598 | ) | | (12,341,854 | ) |
Net realized gain from payment by affiliate for the disposal of investment in violation of restrictions | | | — | | | — | | | 463 | | | — | | | — | |
Change in unrealized appreciation/depreciation from investments and foreign currencies | | | 18,612,853 | | | 90,089,864 | | | 5,026,011 | | | 2,899,270 | | | 24,564,409 | |
| |
|
| |
|
| |
|
| |
|
| |
|
| |
| | | | | | | | | | | | | | | | |
Net realized/unrealized gains from investments and foreign currency transactions | | | 8,895,616 | | | 30,108,644 | | | 1,516,052 | | | 1,424,672 | | | 12,222,555 | |
| |
|
| |
|
| |
|
| |
|
| |
|
| |
Change In Net Assets Resulting From Operations | | $ | 8,789,514 | | $ | 33,463,579 | | $ | 1,554,017 | | $ | 1,312,024 | | $ | 11,788,540 | |
| |
|
| |
|
| |
|
| |
|
| |
|
| |
| | |
|
(a) | Represents amounts allocated from the respective Affiliated Portfolios, where applicable. |
| | |
26 | HSBC INVESTOR FAMILY OF FUNDS | See notes to financial statements. |
HSBC INVESTOR FAMILY OF FUNDS
Statements of Operations—For the year ended October 31, 2009 (continued)
| | | | | | | |
| | Overseas
Equity Fund | | Value Fund | |
| |
Investment Income: | | | | | | | |
Investment income from Affiliated Portfolios (a) | | $ | 243,297 | | $ | 603,307 | |
Tax reclaims from Affiliated Portfolios (a) | | | 8,463 | | | — | |
Foreign tax withholding from Affiliated Portfolios (a) | | | (34,005 | ) | | — | |
Expenses from Affiliated Portfolios (a) | | | (58,671 | ) | | (194,530 | ) |
| |
|
| |
|
| |
Total Investment Income (Loss) | | | 159,084 | | | 408,777 | |
| |
|
| |
|
| |
| | | | | | | |
Expenses: | | | | | | | |
Administration: | | | | | | | |
Class A Shares | | | 1,106 | | | 2,462 | |
Class B Shares | | | 192 | | | 106 | |
Class C Shares | | | 10 | | | 11 | |
Class I Shares | | | — | | | 3,000 | |
Distribution: | | | | | | | |
Class B Shares | | | 7,351 | | | 4,029 | |
Class C Shares | | | 406 | | | 466 | |
Shareholder Servicing: | | | | | | | |
Class A Shares | | | 14,093 | | | 31,283 | |
Class B Shares | | | 2,469 | | | 1,354 | |
Class C Shares | | | 136 | | | 156 | |
Accounting | | | 18,998 | | | 24,000 | |
Compliance Services | | | 31 | | | 136 | |
Printing | | | 5,350 | | | 13,045 | |
Professional | | | 162 | | | 565 | |
Transfer Agent | | | 50,291 | | | 68,423 | |
Trustee | | | 99 | | | 415 | |
Registration | | | 15,574 | | | 13,349 | |
Other | | | 1,927 | | | 7,539 | |
| |
|
| |
|
| |
Total expenses before fee reductions | | | 118,195 | | | 170,339 | |
Fees reimbursed by Investment Adviser | | | (55,265 | ) | | (55,991 | ) |
| |
|
| |
|
| |
Net Expenses | | | 62,930 | | | 114,348 | |
| |
|
| |
|
| |
| | | | | | | |
Net Investment Income (Loss) | | | 96,154 | | | 294,429 | |
| |
|
| |
|
| |
| | | | | | | |
Net Realized/Unrealized Gains (Losses) from Investments: (a) | | | | | | | |
Net realized gains (losses) from investments and foreign currency transactions | | | (2,354,316 | ) | | (1,353,212 | ) |
Change in unrealized appreciation/depreciation from investments and foreign currencies | | | 3,553,124 | | | 5,610,790 | |
| |
|
| |
|
| |
| | | | | | | |
Net realized/unrealized gains from investments and foreign currency transactions | | | 1,198,808 | | | 4,257,578 | |
| |
|
| |
|
| |
Change In Net Assets Resulting From Operations | | $ | 1,294,962 | | $ | 4,552,007 | |
| |
|
| |
|
| |
| | | |
|
(a) | Represents amounts allocated from the respective Affiliated Portfolios. | |
| | |
See notes to financial statements. | HSBC INVESTOR FAMILY OF FUNDS | 27 |
HSBC INVESTOR FAMILY OF FUNDS
Statements of Changes in Net Assets
| | | | | | | |
| | Growth Fund | |
|
| | For the year
ended
October 31,
2009 | | For the year
ended
October 31,
2008 | |
|
Investment Activities: | | | | | | | |
|
Operations: | | | | | | | |
Net investment income (loss) | | $ | (106,102 | ) | $ | (153,221 | ) |
Net realized gains (losses) from investment transactions | | | (9,717,237 | ) | | 182,222 | |
Change in unrealized appreciation/depreciation from investments and foreign currencies | | | 18,612,853 | | | (30,016,810 | ) |
| |
|
| |
|
| |
Change in net assets resulting from operations | | | 8,789,514 | | | (29,987,809 | ) |
| |
|
| |
|
| |
| | | | | | | |
Dividends: | | | | | | | |
| | | | | | | |
Net realized gains: | | | | | | | |
Class A Shares | | | — | | | (1,383,410 | ) |
Class B Shares | | | — | | | (79,802 | ) |
Class C Shares | | | — | | | (4,866 | ) |
Class I Shares | | | — | | | (1,424,277 | ) |
| |
|
| |
|
| |
Change in net assets resulting from shareholder dividends | | | — | | | (2,892,355 | ) |
| |
|
| |
|
| |
Change in net assets resulting from capital transactions | | | (10,272,668 | ) | | 28,956,532 | |
| |
|
| |
|
| |
Change in net assets | | | (1,483,154 | ) | | (3,923,632 | ) |
| | | | | | | |
Net Assets: | | | | | | | |
Beginning of period | | | 58,958,322 | | | 62,881,954 | |
| |
|
| |
|
| |
End of period | | $ | 57,475,168 | | $ | 58,958,322 | |
| |
|
| |
|
| |
Accumulated net investment income (loss) | | $ | — | | $ | — | |
| |
|
| |
|
| |
| | |
28 | HSBC INVESTOR FAMILY OF FUNDS | See notes to financial statements. |
HSBC INVESTOR FAMILY OF FUNDS
Statements of Changes in Net Assets (continued)
| | | | | | | |
| | Growth Fund | |
|
| | For the year
ended
October 31,
2009 | | For the year
ended
October 31,
2008 | |
|
CAPITAL TRANSACTIONS: | | | | | | | |
Class A Shares: | | | | | | | |
Proceeds from shares issued | | $ | 1,225,814 | | $ | 2,184,134 | |
Proceeds from shares issued in conversion | | | — | | | 2,181,685 | |
Dividends reinvested | | | — | | | 1,365,451 | |
Value of shares redeemed | | | (5,063,199 | ) | | (7,496,370 | ) |
| |
|
| |
|
| |
Class A Shares capital transactions | | | (3,837,385 | ) | | (1,765,100 | ) |
| |
|
| |
|
| |
| | | | | | | |
Class B Shares: | | | | | | | |
Proceeds from shares issued | | | 66,339 | | | 94,123 | |
Proceeds from shares issued in conversion | | | — | | | 3,033,945 | |
Dividends reinvested | | | — | | | 79,295 | |
Value of shares redeemed | | | (1,164,836 | ) | | (621,351 | ) |
| |
|
| |
|
| |
Class B Shares capital transactions | | | (1,098,497 | ) | | 2,586,012 | |
| |
|
| |
|
| |
| | | | | | | |
Class C Shares: | | | | | | | |
Proceeds from shares issued | | | 36,704 | | | 316 | |
Proceeds from shares issued in conversion | | | — | | | 27,158 | |
Dividends reinvested | | | — | | | 4,866 | |
Value of shares redeemed | | | (5,976 | ) | | (12,332 | ) |
| |
|
| |
|
| |
Class C Shares capital transactions | | | 30,728 | | | 20,008 | |
| |
|
| |
|
| |
| | | | | | | |
Class I Shares: | | | | | | | |
Proceeds from shares issued | | | 4,547,877 | | | 5,289,940 | |
Proceeds from shares issued in conversion | | | — | | | 29,095,081 | |
Dividends reinvested | | | — | | | 1,334,114 | |
Value of shares redeemed | | | (9,915,391 | ) | | (7,603,523 | ) |
| |
|
| |
|
| |
Class I Shares capital transactions | | | (5,367,514 | ) | | 28,115,612 | |
| |
|
| |
|
| |
Change in net assets resulting from capital transactions | | $ | (10,272,668 | ) | $ | 28,956,532 | |
| |
|
| |
|
| |
| | | | | | | |
SHARE TRANSACTIONS: | | | | | | | |
Class A Shares: | | | | | | | |
Issued | | | 112,735 | | | 171,527 | |
Issued in conversion | | | — | | | 154,250 | |
Reinvested | | | — | | | 82,517 | |
Redeemed | | | (472,708 | ) | | (499,620 | ) |
| |
|
| |
|
| |
Change in Class A Shares | | | (359,973 | ) | | (91,326 | ) |
| |
|
| |
|
| |
| | | | | | | |
Class B Shares: | | | | | | | |
Issued | | | 6,818 | | | 6,697 | |
Issued in conversion | | | — | | | 229,821 | |
Reinvested | | | — | | | 5,109 | |
Redeemed | | | (117,668 | ) | | (49,634 | ) |
| |
|
| |
|
| |
Change in Class B Shares | | | (110,850 | ) | | 191,993 | |
| |
|
| |
|
| |
| | | | | | | |
Class C Shares: | | | | | | | |
Issued | | | 3,677 | | | 21 | |
Issued in conversion | | | — | | | 2,045 | |
Reinvested | | | — | | | 312 | |
Redeemed | | | (631 | ) | | (900 | ) |
| |
|
| |
|
| |
Change in Class C Shares | | | 3,046 | | | 1,478 | |
| |
|
| |
|
| |
| | | | | | | |
Class I Shares: | | | | | | | |
Issued | | | 418,087 | | | 372,328 | |
Issued in conversion | | | — | | | 2,043,578 | |
Reinvested | | | — | | | 80,320 | |
Redeemed | | | (961,622 | ) | | (519,054 | ) |
| |
|
| |
|
| |
Change in Class I Shares | | | (543,535 | ) | | 1,977,172 | |
| |
|
| |
|
| |
| | |
See notes to financial statements. | HSBC INVESTOR FAMILY OF FUNDS | 29 |
HSBC INVESTOR FAMILY OF FUNDS
Statements of Changes in Net Assets (continued)
| | | | | | | | | | | | | |
| | International Equity Fund | | Mid-Cap Fund | |
|
| | For the
year ended
October 31, 2009 | | For the
year ended
October 31, 2008 | | For the
year ended
October 31, 2009 | | For the
year ended
October 31, 2008 | |
|
Investment Activities: | | | | | | | | | | | | | |
Operations: | | | | | | | | | | | | | |
Net investment income (loss) | | $ | 3,354,935 | | $ | 7,877,663 | | $ | 37,965 | | $ | (87,610 | ) |
Net realized gains (losses) from investment and foreign currency transactions | | | (59,981,220 | ) | | 7,880,059 | | | (3,509,959 | ) | | 1,072,890 | |
Change in unrealized appreciation/depreciation from investments and foreign currencies | | | 90,089,864 | | | (201,336,999 | ) | | 5,026,011 | | | (14,339,743 | ) |
| |
|
| |
|
| |
|
| |
|
| |
Change in net assets resulting from operations | | | 33,463,579 | | | (185,579,277 | ) | | 1,554,017 | | | (13,354,463 | ) |
| |
|
| |
|
| |
|
| |
|
| |
| | | | | | | | | | | | | |
Dividends: | | | | | | | | | | | | | |
Net investment income: | | | | | | | | | | | | | |
Class A Shares | | | — | | | — | | | — | | | — | |
Class B Shares | | | — | | | — | | | — | | | — | |
Class C Shares | | | — | | | — | | | — | | | — | |
Class I Shares | | | (7,354,738 | ) | | (5,964,290 | ) | | — | | | — | |
Net realized gains: | | | | | | | | | | | | | |
Class A Shares | | | — | | | — | | | (294,264 | ) | | (598,216 | ) |
Class B Shares | | | — | | | — | | | (174,161 | ) | | (737,486 | ) |
Class C Shares | | | — | | | — | | | (1,041 | ) | | (9,380 | ) |
Class I Shares | | | (8,461,420 | ) | | (28,980,345 | ) | | (681,038 | ) | | (2,185,201 | ) |
| |
|
| |
|
| |
|
| |
|
| |
Change in net assets resulting from shareholder dividends | | | (15,816,158 | ) | | (34,944,635 | ) | | (1,150,504 | ) | | (3,530,283 | ) |
| |
|
| |
|
| |
|
| |
|
| |
Change in net assets resulting from capital transactions | | | 1,541,373 | | | (4,139,847 | ) | | (3,850,002 | ) | | 603,841 | |
| |
|
| |
|
| |
|
| |
|
| |
Change in net assets | | | 19,188,794 | | | (224,663,759 | ) | | (3,446,489 | ) | | (16,280,905 | ) |
| | | | | | | | | | | | | |
Net Assets: | | | | | | | | | | | | | |
Beginning of period | | | 161,053,348 | | | 385,717,107 | | | 16,650,794 | | | 32,931,699 | |
| |
|
| |
|
| |
|
| |
|
| |
End of period | | $ | 180,242,142 | | $ | 161,053,348 | | $ | 13,204,305 | | $ | 16,650,794 | |
| |
|
| |
|
| |
|
| |
|
| |
Accumulated net investment income (loss) | | $ | 2,365,154 | | $ | 6,999,097 | | $ | 37,965 | | $ | — | |
| |
|
| |
|
| |
|
| |
|
| |
| | |
30 | HSBC INVESTOR FAMILY OF FUNDS | See notes to financial statements. |
HSBC INVESTOR FAMILY OF FUNDS
Statements of Changes in Net Assets (continued)
| | | | | | | | | | | | | |
| | International
Equity Fund | | Mid-Cap Fund | |
|
| | For the
year ended
October 31, 2009 | | For the
year ended
October 31, 2008 | | For the
year ended
October 31, 2009 | | For the
year ended
October 31, 2008 | |
|
CAPITAL TRANSACTIONS: | | | | | | | | | | | | | |
Class A Shares: | | | | | | | | | | | | | |
Proceeds from shares issued | | $ | — | | $ | — | | $ | 566,784 | | $ | 2,247,640 | |
Dividends reinvested | | | — | | | — | | | 290,977 | | | 592,760 | |
Value of shares redeemed | | | — | | | — | | | (541,791 | ) | | (1,823,839 | ) |
| |
|
| |
|
| |
|
| |
|
| |
Class A Shares capital transactions | | | — | | | — | | | 315,970 | | | 1,016,561 | |
| |
|
| |
|
| |
|
| |
|
| |
| | | | | | | | | | | | | |
Class B Shares: | | | | | | | | | | | | | |
Proceeds from shares issued | | | — | | | — | | | 82,819 | | | 132,611 | |
Dividends reinvested | | | — | | | — | | | 169,310 | | | 721,029 | |
Value of shares redeemed | | | — | | | — | | | (686,734 | ) | | (2,456,625 | ) |
| |
|
| |
|
| |
|
| |
|
| |
Class B Shares capital transactions | | | — | | | — | | | (434,605 | ) | | (1,602,985 | ) |
| |
|
| |
|
| |
|
| |
|
| |
| | | | | | | | | | | | | |
Class C Shares: | | | | | | | | | | | | | |
Proceeds from shares issued | | | — | | | — | | | 11 | | | 9 | |
Dividends reinvested | | | — | | | — | | | 1,041 | | | 9,380 | |
Value of shares redeemed | | | — | | | — | | | (508 | ) | | (52,339 | ) |
| |
|
| |
|
| |
|
| |
|
| |
Class C Shares capital transactions | | | — | | | — | | | 544 | | | (42,950 | ) |
| |
|
| |
|
| |
|
| |
|
| |
| | | | | | | | | | | | | |
Class I Shares: | | | | | | | | | | | | | |
Proceeds from shares issued | | | 26,914,666 | | | 40,597,462 | | | 341,422 | | | 2,731,685 | |
Dividends reinvested | | | 11,845,280 | | | 26,918,243 | | | 462,791 | | | 1,405,125 | |
Value of shares redeemed | | | (37,218,573 | ) | | (71,655,552 | ) | | (4,536,124 | ) | | (2,903,595 | ) |
| |
|
| |
|
| |
|
| |
|
| |
Class I Shares capital transactions | | | 1,541,373 | | | (4,139,847 | ) | | (3,731,911 | ) | | 1,233,215 | |
| |
|
| |
|
| |
|
| |
|
| |
Change in net assets resulting from capital transactions | | $ | 1,541,373 | | $ | (4,139,847 | ) | $ | (3,850,002 | ) | $ | 603,841 | |
| |
|
| |
|
| |
|
| |
|
| |
| | | | | | | | | | | | | |
| | | | | | | | | | | | | |
SHARE TRANSACTIONS: | | | | | | | | | | | | | |
Class A Shares: | | | | | | | | | | | | | |
Issued | | | — | | | — | | | 116,639 | | | 266,103 | |
Reinvested | | | — | | | — | | | 65,535 | | | 65,426 | |
Redeemed | | | — | | | — | | | (111,962 | ) | | (210,220 | ) |
| |
|
| |
|
| |
|
| |
|
| |
Change in Class A Shares | | | — | | | — | | | 70,212 | | | 121,309 | |
| |
|
| |
|
| |
|
| |
|
| |
| | | | | | | | | | | | | |
Class B Shares: | | | | | | | | | | | | | |
Issued | | | — | | | — | | | 18,945 | | | 17,380 | |
Reinvested | | | — | | | — | | | 42,117 | | | 86,351 | |
Redeemed | | | — | | | — | | | (154,800 | ) | | (326,374 | ) |
| |
|
| |
|
| |
|
| |
|
| |
Change in Class B Shares | | | — | | | — | | | (93,738 | ) | | (222,643 | ) |
| |
|
| |
|
| |
|
| |
|
| |
| | | | | | | | | | | | | |
Class C Shares: | | | | | | | | | | | | | |
Issued | | | — | | | — | | | — | | | — | |
Reinvested | | | — | | | — | | | 256 | | | 1,113 | |
Redeemed | | | — | | | — | | | (138 | ) | | (6,502 | ) |
| |
|
| |
|
| |
|
| |
|
| |
Change in Class C Shares | | | — | | | — | | | 118 | | | (5,389 | ) |
| |
|
| |
|
| |
|
| |
|
| |
| | | | | | | | | | | | | |
Class I Shares: | | | | | | | | | | | | | |
Issued | | | 2,374,315 | | | 2,263,402 | | | 70,062 | | | 318,390 | |
Reinvested | | | 1,323,495 | | | 1,358,821 | | | 101,267 | | | 151,578 | |
Redeemed | | | (3,874,180 | ) | | (4,112,422 | ) | | (911,670 | ) | | (334,242 | ) |
| |
|
| |
|
| |
|
| |
|
| |
Change in Class I Shares | | | (176,370 | ) | | (490,199 | ) | | (740,341 | ) | | 135,726 | |
| |
|
| |
|
| |
|
| |
|
| |
| | |
See notes to financial statements. | HSBC INVESTOR FAMILY OF FUNDS | 31 |
HSBC INVESTOR FAMILY OF FUNDS
Statements of Changes in Net Assets (continued)
| | | | | | | | | | | | | |
| | Opportunity
Fund | | Opportunity
Fund (Advisor) | |
|
| | For the
year ended
October 31, 2009 | | For the
year ended
October 31, 2008 | | For the
year ended
October 31, 2009 | | For the
year ended
October 31, 2008 | |
|
Investment Activities: | | | | | | | | | | | | | |
Operations: | | | | | | | | | | | | | |
Net investment income (loss) | | $ | (112,648 | ) | $ | (217,394 | ) | $ | (434,015 | ) | $ | (799,142 | ) |
Net realized gains (losses) from investment transactions | | | (1,474,598 | ) | | 619,272 | | | (12,341,854 | ) | | 2,335,993 | |
Change in unrealized appreciation/depreciation from investments and foreign currencies | | | 2,899,270 | | | (7,169,941 | ) | | 24,564,409 | | | (57,458,069 | ) |
| |
|
| |
|
| |
|
| |
|
| |
Change in net assets resulting from operations | | | 1,312,024 | | | (6,768,063 | ) | | 11,788,540 | | | (55,921,218 | ) |
| |
|
| |
|
| |
|
| |
|
| |
| | | | | | | | | | | | | |
Net realized gains: | | | | | | | | | | | | | |
Class A Shares | | | (539,992 | ) | | (4,275,970 | ) | | — | | | — | |
Class B Shares | | | (107,053 | ) | | (1,656,407 | ) | | — | | | — | |
Class C Shares | | | (13,420 | ) | | (112,933 | ) | | — | | | — | |
Class I Shares | | | — | | | — | | | (2,746,629 | ) | | (45,200,235 | ) |
| |
|
| |
|
| |
|
| |
|
| |
Change in net assets resulting from shareholder dividends | | | (660,465 | ) | | (6,045,310 | ) | | (2,746,629 | ) | | (45,200,235 | ) |
| |
|
| |
|
| |
|
| |
|
| |
Change in net assets resulting from capital transactions | | | (981,801 | ) | | 3,861,286 | | | (6,597,185 | ) | | 22,369,148 | |
| |
|
| |
|
| |
|
| |
|
| |
Change in net assets | | | (330,242 | ) | | (8,952,087 | ) | | 2,444,726 | | | (78,752,305 | ) |
| | | | | | | | | | | | | |
Net Assets: | | | | | | | | | | | | | |
Beginning of period | | | 11,366,672 | | | 20,318,759 | | | 97,840,573 | | | 176,592,878 | |
| |
|
| |
|
| |
|
| |
|
| |
End of period | | $ | 11,036,430 | | $ | 11,366,672 | | $ | 100,285,299 | | $ | 97,840,573 | |
| |
|
| |
|
| |
|
| |
|
| |
Accumulated net investment income (loss) | | $ | — | | $ | — | | $ | — | | $ | — | |
| |
|
| |
|
| |
|
| |
|
| |
| | |
32 | HSBC INVESTOR FAMILY OF FUNDS | See notes to financial statements. |
HSBC INVESTOR FAMILY OF FUNDS
Statements of Changes in Net Assets (continued)
| | | | | | | | | | | | | |
| | Opportunity
Fund | | Opportunity
Fund (Advisor) | |
|
| | For the
year ended
October 31, 2009 | | For the
year ended
October 31, 2008 | | For the
year ended
October 31, 2009 | | For the
year ended
October 31, 2008 | |
|
CAPITAL TRANSACTIONS: | | | | | | | | | | | | | |
Class A Shares: | | | | | | | | | | | | | |
Proceeds from shares issued | | $ | 1,180,248 | | $ | 4,352,351 | | $ | — | | $ | — | |
Dividends reinvested | | | 537,467 | | | 4,182,326 | | | — | | | — | |
Value of shares redeemed | | | (2,263,523 | ) | | (4,197,723 | ) | | — | | | — | |
| |
|
| |
|
| |
|
| |
|
| |
Class A Shares capital transactions | | | (545,808 | ) | | 4,336,954 | | | — | | | — | |
| |
|
| |
|
| |
|
| |
|
| |
| | | | | | | | | | | | | |
Class B Shares: | | | | | | | | | | | | | |
Proceeds from shares issued | | | 66,965 | | | 123,807 | | | — | | | — | |
Dividends reinvested | | | 106,455 | | | 1,634,480 | | | — | | | — | |
Value of shares redeemed | | | (667,369 | ) | | (2,318,068 | ) | | — | | | — | |
| |
|
| |
|
| |
|
| |
|
| |
Class B Shares capital transactions | | | (493,949 | ) | | (559,781 | ) | | — | | | — | |
| |
|
| |
|
| |
|
| |
|
| |
| | | | | | | | | | | | | |
Class C Shares: | | | | | | | | | | | | | |
Proceeds from shares issued | | | 54,586 | | | 54,646 | | | — | | | — | |
Dividends reinvested | | | 13,420 | | | 111,644 | | | — | | | — | |
Value of shares redeemed | | | (10,050 | ) | | (82,177 | ) | | — | | | — | |
| |
|
| |
|
| |
|
| |
|
| |
Class C Shares capital transactions | | | 57,956 | | | 84,113 | | | — | | | — | |
| |
|
| |
|
| |
|
| |
|
| |
| | | | | | | | | | | | | |
Class I Shares: | | | | | | | | | | | | | |
Proceeds from shares issued | | | — | | | — | | | 9,048,783 | | | 18,539,696 | |
Dividends reinvested | | | — | | | — | | | 2,020,969 | | | 33,936,218 | |
Value of shares redeemed | | | — | | | — | | | (17,666,937 | ) | | (30,106,766 | ) |
| |
|
| |
|
| |
|
| |
|
| |
Class I Shares capital transactions | | | — | | | — | | | (6,597,185 | ) | | 22,369,148 | |
| |
|
| |
|
| |
|
| |
|
| |
Change in net assets resulting from capital transactions | | $ | (981,801 | ) | $ | 3,861,286 | | $ | (6,597,185 | ) | $ | 22,369,148 | |
| |
|
| |
|
| |
|
| |
|
| |
| | | | | | | | | | | | | |
SHARE TRANSACTIONS: | | | | | | | | | | | | | |
Class A Shares: | | | | | | | | | | | | | |
Issued | | | 173,171 | | | 413,739 | | | — | | | — | |
Reinvested | | | 95,805 | | | 393,076 | | | — | | | — | |
Redeemed | | | (340,092 | ) | | (371,280 | ) | | — | | | — | |
| |
|
| |
|
| |
|
| |
|
| |
Change in Class A Shares | | | (71,116 | ) | | 435,535 | | | — | | | — | |
| |
|
| |
|
| |
|
| |
|
| |
| | | | | | | | | | | | | |
Class B Shares: | | | | | | | | | | | | | |
Issued | | | 12,358 | | | 12,688 | | | — | | | — | |
Reinvested | | | 22,363 | | | 177,468 | | | — | | | — | |
Redeemed | | | (123,288 | ) | | (261,383 | ) | | — | | | — | |
| |
|
| |
|
| |
|
| |
|
| |
Change in Class B Shares | | | (88,567 | ) | | (71,227 | ) | | — | | | — | |
| |
|
| |
|
| |
|
| |
|
| |
| | | | | | | | | | | | | |
Class C Shares: | | | | | | | | | | | | | |
Issued | | | 9,847 | | | 5,891 | | | — | | | — | |
Reinvested | | | 2,768 | | | 11,915 | | | — | | | — | |
Redeemed | | | (1,959 | ) | | (9,434 | ) | | — | | | — | |
| |
|
| |
|
| |
|
| |
|
| |
Change in Class C Shares | | | 10,656 | | | 8,372 | | | — | | | — | |
| |
|
| |
|
| |
|
| |
|
| |
| | | | | | | | | | | | | |
Class I Shares: | | | | | | | | | | | | | |
Issued | | | — | | | — | | | 1,063,736 | | | 1,473,803 | |
Reinvested | | | — | | | — | | | 275,712 | | | 2,551,595 | |
Redeemed | | | — | | | — | | | (2,220,201 | ) | | (2,365,826 | ) |
| |
|
| |
|
| |
|
| |
|
| |
Change in Class I Shares | | | — | | | — | | | (880,753 | ) | | 1,659,572 | |
| |
|
| |
|
| |
|
| |
|
| |
| | |
See notes to financial statements. | HSBC INVESTOR FAMILY OF FUNDS | 33 |
HSBC INVESTOR FAMILY OF FUNDS
Statements of Changes in Net Assets (continued)
| | | | | | | | | | | | | |
| | Overseas Equity Fund | | Value Fund | |
|
| | For the
year ended
October 31, 2009 | | For the
year ended
October 31, 2008 | | For the
year ended
October 31, 2009 | | For the
year ended
October 31, 2008 | |
|
Investment Activities: | | | | | | | | | | | | | |
Operations: | | | | | | | | | | | | | |
Net investment income (loss) | | $ | 96,154 | | $ | 216,267 | | $ | 294,429 | | $ | 508,204 | |
Net realized gains (losses) from investment transactions | | | (2,354,316 | ) | | 3,797,400 | | | (1,353,212 | ) | | (4,675,106 | ) |
Change in unrealized appreciation/depreciation from investments and foreign currencies | | | 3,553,124 | | | (12,419,361 | ) | | 5,610,790 | | | (17,328,757 | ) |
| |
|
| |
|
| |
|
| |
|
| |
Change in net assets resulting from operations | | | 1,294,962 | | | (8,405,694 | ) | | 4,552,007 | | | (21,495,659 | ) |
| |
|
| |
|
| |
|
| |
|
| |
| | | | | | | | | | | | | |
Dividends: | | | | | | | | | | | | | |
Net investment income: | | | | | | | | | | | | | |
Class A Shares | | | (374,072 | ) | | (105,065 | ) | | (155,138 | ) | | (197,548 | ) |
Class B Shares | | | (62,669 | ) | | (4,715 | ) | | (2,255 | ) | | (1,645 | ) |
Class C Shares | | | (2,972 | ) | | (123 | ) | | (298 | ) | | (118 | ) |
Class I Shares | | | — | | | — | | | (232,742 | ) | | (297,653 | ) |
Net realized gains: | | | | | | | | | | | | | |
Class A Shares | | | (2,912,698 | ) | | (2,297,440 | ) | | — | | | (2,036,989 | ) |
Class B Shares | | | (617,230 | ) | | (617,609 | ) | | — | | | (144,385 | ) |
Class C Shares | | | (28,817 | ) | | (24,923 | ) | | — | | | (10,272 | ) |
Class I Shares | | | — | | | — | | | — | | | (2,265,906 | ) |
| |
|
| |
|
| |
|
| |
|
| |
Change in net assets resulting from shareholder dividends | | | (3,998,458 | ) | | (3,049,875 | ) | | (390,433 | ) | | (4,954,516 | ) |
| |
|
| |
|
| |
|
| |
|
| |
Change in net assets resulting from capital transactions | | | 1,710,202 | | | (515,372 | ) | | (7,588,940 | ) | | 2,078,757 | |
| |
|
| |
|
| |
|
| |
|
| |
Change in net assets | | | (993,294 | ) | | (11,970,941 | ) | | (3,427,366 | ) | | (24,371,418 | ) |
| | | | | | | | | | | | | |
Net Assets: | | | | | | | | | | | | | |
Beginning of period | | | 7,951,822 | | | 19,922,763 | | | 33,443,897 | | | 57,815,315 | |
| |
|
| |
|
| |
|
| |
|
| |
End of period | | $ | 6,958,528 | | $ | 7,951,822 | | $ | 30,016,531 | | $ | 33,443,897 | |
| |
|
| |
|
| |
|
| |
|
| |
Accumulated net investment income (loss) | | $ | 108,816 | | $ | 439,713 | | $ | 14,848 | | $ | 126,892 | |
| |
|
| |
|
| |
|
| |
|
| |
| | |
34 | HSBC INVESTOR FAMILY OF FUNDS | See notes to financial statements. |
HSBC INVESTOR FAMILY OF FUNDS
Statements of Changes in Net Assets (continued)
| | | | | | | | | | | | | |
| | Overseas Equity Fund | | Value Fund | |
|
|
|
|
|
|
| | For the
year ended
October 31, 2009 | | For the
year ended
October 31, 2008 | | For the
year ended
October 31, 2009 | | For the
year ended
October 31, 2008 | |
|
|
|
|
|
|
|
|
|
|
CAPITAL TRANSACTIONS: | | | | | | | | | | | | | |
Class A Shares: | | | | | | | | | | | | | |
Proceeds from shares issued | | $ | 405,226 | | $ | 2,168,458 | | $ | 493,761 | | $ | 3,123,186 | |
Dividends reinvested | | | 3,262,709 | | | 2,383,150 | | | 154,141 | | | 2,222,634 | |
Value of shares redeemed | | | (2,210,404 | ) | | (4,837,345 | ) | | (4,681,860 | ) | | (5,905,400 | ) |
| |
|
| |
|
| |
|
| |
|
| |
Class A Shares capital transactions | | | 1,457,531 | | | (285,737 | ) | | (4,033,958 | ) | | (559,580 | ) |
| |
|
| |
|
| |
|
| |
|
| |
| | | | | | | | | | | | | |
Class B Shares: | | | | | | | | | | | | | |
Proceeds from shares issued | | | 33,259 | | | 151,714 | | | 13,994 | | | 107,540 | |
Dividends reinvested | | | 667,369 | | | 599,255 | | | 2,250 | | | 145,230 | |
Value of shares redeemed | | | (468,176 | ) | | (986,692 | ) | | (336,758 | ) | | (583,192 | ) |
| |
|
| |
|
| |
|
| |
|
| |
Class B Shares capital transactions | | | 232,452 | | | (235,723 | ) | | (320,514 | ) | | (330,422 | ) |
| |
|
| |
|
| |
|
| |
|
| |
| | | | | | | | | | | | | |
Class C Shares: | | | | | | | | | | | | | |
Proceeds from shares issued | | | — | | | 3,000 | | | — | | | 50 | |
Dividends reinvested | | | 31,789 | | | 25,043 | | | 298 | | | 10,390 | |
Value of shares redeemed | | | (11,570 | ) | | (21,955 | ) | | (5,546 | ) | | (11,882 | ) |
| |
|
| |
|
| |
|
| |
|
| |
Class C Shares capital transactions | | | 20,219 | | | 6,088 | | | (5,248 | ) | | (1,442 | ) |
| |
|
| |
|
| |
|
| |
|
| |
| | | | | | | | | | | | | |
Class I Shares: | | | | | | | | | | | | | |
Proceeds from shares issued | | | — | | | — | | | 2,374,352 | | | 6,102,681 | |
Dividends reinvested | | | — | | | — | | | 209,767 | | | 2,444,669 | |
Value of shares redeemed | | | — | | | — | | | (5,813,339 | ) | | (5,577,149 | ) |
| |
|
| |
|
| |
|
| |
|
| |
Class I Shares capital transactions | | | — | | | — | | | (3,229,220 | ) | | 2,970,201 | |
| |
|
| |
|
| |
|
| |
|
| |
Change in net assets resulting from capital transactions | | $ | 1,710,202 | | $ | (515,372 | ) | $ | (7,588,940 | ) | $ | 2,078,757 | |
| |
|
| |
|
| |
|
| |
|
| |
| | | | | | | | | | | | | |
SHARE TRANSACTIONS: | | | | | | | | | | | | | |
Class A Shares: | | | | | | | | | | | | | |
Issued | | | 108,012 | | | 229,442 | | | 53,511 | | | 313,160 | |
Reinvested | | | 1,049,103 | | | 162,229 | | | 17,816 | | | 157,396 | |
Redeemed | | | (553,300 | ) | | (330,382 | ) | | (529,179 | ) | | (452,094 | ) |
| |
|
| |
|
| |
|
| |
|
| |
Change in Class A Shares | | | 603,815 | | | 61,289 | | | (457,852 | ) | | 18,462 | |
| |
|
| |
|
| |
|
| |
|
| |
| | | | | | | | | | | | | |
Class B Shares: | | | | | | | | | | | | | |
Issued | | | 8,391 | | | 11,070 | | | 1,659 | | | 9,342 | |
Reinvested | | | 243,565 | | | 43,236 | | | 274 | | | 10,720 | |
Redeemed | | | (153,763 | ) | | (75,053 | ) | | (39,815 | ) | | (47,908 | ) |
| |
|
| |
|
| |
|
| |
|
| |
Change in Class B Shares | | | 98,193 | | | (20,747 | ) | | (37,882 | ) | | (27,846 | ) |
| |
|
| |
|
| |
|
| |
|
| |
| | | | | | | | | | | | | |
Class C Shares: | | | | | | | | | | | | | |
Issued | | | — | | | 165 | | | — | | | 3 | |
Reinvested | | | 10,703 | | | 1,749 | | | 36 | | | 761 | |
Redeemed | | | (3,505 | ) | | (1,593 | ) | | (751 | ) | | (939 | ) |
| |
|
| |
|
| |
|
| |
|
| |
Change in Class C Shares | | | 7,198 | | | 321 | | | (715 | ) | | (175 | ) |
| |
|
| |
|
| |
|
| |
|
| |
| | | | | | | | | | | | | |
Class I Shares: | | | | | | | | | | | | | |
Issued | | | — | | | — | | | 249,723 | | | 527,200 | |
Reinvested | | | — | | | — | | | 24,319 | | | 173,797 | |
Redeemed | | | — | | | — | | | (677,423 | ) | | (446,281 | ) |
| |
|
| |
|
| |
|
| |
|
| |
Change in Class I Shares | | | — | | | — | | | (403,381 | ) | | 254,716 | |
| |
|
| |
|
| |
|
| |
|
| |
| | |
See notes to financial statements. | HSBC INVESTOR FAMILY OF FUNDS | 35 |
|
HSBC INVESTOR FUNDS—GROWTH FUND |
|
Financial Highlights |
|
Selected data for a share outstanding throughout the periods indicated. (a) |
| | | | | | | | | | | | | | | | | | | | | | | | | | | | | |
| | | | | | | Investment Activities | | Dividends | | | | | | |
| | | | | | |
| |
| | | | | | |
| | Net Asset
Value,
Beginning
of Period | | Net
Investment
Income (Loss) | | Net Realized
and Unrealized
Gains (Losses)
from
Investment
Transactions | | Total from
Investment
Activities | | Net
Investment
Income | | Net Realized
Gains from
Investment
Transactions | | Total
Dividends | | Net Asset
Value, End
of Period | |
|
|
|
|
|
|
|
|
|
|
|
|
|
|
|
|
|
|
CLASS A SHARES | | | | | | | | | | | | | | | | | | | | | | | | | |
Year Ended October 31, 2005 | | | $ | 12.55 | | | 0.03 | | | 1.59 | | | 1.62 | | | (0.05 | ) | | — | | | (0.05 | ) | | | $ | 14.12 | | |
Year Ended October 31, 2006 | | | | 14.12 | | | (0.02 | )* | | 0.99 | | | 0.97 | | | — | | | (0.23 | ) | | (0.23 | ) | | | | 14.86 | | |
Year Ended October 31, 2007 | | | | 14.86 | | | — | *(e) | | 4.23 | | | 4.23 | | | (0.01 | ) | | (1.13 | ) | | (1.14 | ) | | | | 17.95 | | |
Year Ended October 31, 2008 | | | | 17.95 | | | (0.05 | )* | | (6.51 | ) | | (6.56 | ) | | — | | | (0.84 | ) | | (0.84 | ) | | | | 10.55 | | |
Year Ended October 31, 2009 | | | | 10.55 | | | (0.04 | )* | | 2.03 | | | 1.99 | | | — | | | — | | | — | | | | | 12.54 | | |
|
|
|
|
|
|
|
|
|
|
|
|
|
|
|
|
|
|
|
|
|
|
|
|
|
|
|
|
|
|
CLASS B SHARES | | | | | | | | | | | | | | | | | | | | | | | | | | | | | |
Year Ended October 31, 2005 | | | $ | 12.11 | | | (0.07 | ) | | 1.53 | | | 1.46 | | | — | | | — | | | — | | | | $ | 13.57 | | |
Year Ended October 31, 2006 | | | | 13.57 | | | (0.12 | )* | | 0.95 | | | 0.83 | | | — | | | (0.23 | ) | | (0.23 | ) | | | | 14.17 | | |
Year Ended October 31, 2007 | | | | 14.17 | | | (0.11 | )* | | 3.99 | | | 3.88 | | | — | | | (1.13 | ) | | (1.13 | ) | | | | 16.92 | | |
Year Ended October 31, 2008 | | | | 16.92 | | | (0.16 | )* | | (6.07 | ) | | (6.23 | ) | | — | | | (0.84 | ) | | (0.84 | ) | | | | 9.85 | | |
Year Ended October 31, 2009 | | | | 9.85 | | | (0.10 | )* | | 1.85 | | | 1.75 | | | — | | | — | | | — | | | | | 11.60 | | |
|
|
|
|
|
|
|
|
|
|
|
|
|
|
|
|
|
|
|
|
|
|
|
|
|
|
|
|
|
|
CLASS C SHARES | | | | | | | | | | | | | | | | | | | | | | | | | | | | | |
Year Ended October 31, 2005 | | | $ | 12.17 | | | (0.07 | ) | | 1.54 | | | 1.47 | | | — | | | — | | | — | | | | $ | 13.64 | | |
Year Ended October 31, 2006 | | | | 13.64 | | | (0.16 | )* | | 0.99 | | | 0.83 | | | — | | | (0.23 | ) | | (0.23 | ) | | | | 14.24 | | |
Year Ended October 31, 2007 | | | | 14.24 | | | (0.11 | )* | | 4.02 | | | 3.91 | | | — | | | (1.13 | ) | | (1.13 | ) | | | | 17.02 | | |
Year Ended October 31, 2008 | | | | 17.02 | | | (0.16 | )* | | (6.11 | ) | | (6.27 | ) | | — | | | (0.84 | ) | | (0.84 | ) | | | | 9.91 | | |
Year Ended October 31, 2009 | | | | 9.91 | | | (0.12 | )* | | 1.89 | | | 1.77 | | | — | | | — | | | — | | | | | 11.68 | | |
|
|
|
|
|
|
|
|
|
|
|
|
|
|
|
|
|
|
|
|
|
|
|
|
|
|
|
|
|
|
CLASS I SHARES | | | | | | | | | | | | | | | | | | | | | | | | | | | | | |
Year Ended October 31, 2005 | | | $ | 12.55 | | | 0.06 | | | 1.59 | | | 1.65 | | | (0.08 | ) | | — | | | (0.08 | ) | | | $ | 14.12 | | |
Year Ended October 31, 2006 | | | | 14.12 | | | 0.02 | * | | 0.99 | | | 1.01 | | | — | | | (0.23 | ) | | (0.23 | ) | | | | 14.90 | | |
Year Ended October 31, 2007 | | | | 14.90 | | | 0.03 | * | | 4.24 | | | 4.27 | | | (0.02 | ) | | (1.13 | ) | | (1.15 | ) | | | | 18.02 | | |
Year Ended October 31, 2008 | | | | 18.02 | | | (0.02 | )* | | (6.54 | ) | | (6.56 | ) | | — | | | (0.84 | ) | | (0.84 | ) | | | | 10.62 | | |
Year Ended October 31, 2009 | | | | 10.62 | | | (0.01 | )* | | 2.04 | | | 2.03 | | | — | | | — | | | — | | | | | 12.65 | | |
|
|
|
|
|
|
|
|
|
|
|
|
|
|
|
|
|
|
|
|
|
|
|
|
|
|
|
|
|
|
| | | | | | | | | | | | | | | | | | | | | |
| | | | Ratios/Supplementary Data | |
| | | |
| |
| | Total
Return(b) | | Net Assets
at End of
Period
(000’s) | | Ratio of Net
Expenses to
Average
Net Assets | | Ratio of Net
Investment
Income
(Loss)
to Average
Net Assets | | Ratio of
Expenses to
Average
Net Assets(c) | | Portfolio
Turnover
Rate(d) | |
|
|
|
|
|
|
|
|
|
|
|
|
|
|
CLASS A SHARES | | | | | | | | | | | | | | | | | | | |
Year Ended October 31, 2005 | | 12.91 | %(f) | | | $ | 21,866 | | | 1.15 | %(f) | | 0.19 | %(f) | | 1.35 | % | | 79.54 | % | |
Year Ended October 31, 2006 | | 6.92 | % | | | | 21,985 | | | 1.20 | % | | (0.14 | )% | | 1.44 | % | | 75.06 | % | |
Year Ended October 31, 2007 | | 30.45 | %(g) | | | | 30,858 | | | 1.11 | %(g) | | (0.03 | )%(g) | | 1.22 | % | | 57.04 | % | |
Year Ended October 31, 2008 | | (38.23 | )%(h) | | | | 17,180 | | | 1.20 | % | | (0.36 | )% | | 1.22 | % | | 157.87 | % | |
Year Ended October 31, 2009 | | 18.86 | %(i) | | | | 15,896 | | | 1.20 | % | | (0.33 | )% | | 1.31 | % | | 65.67 | % | |
|
|
|
|
|
|
|
|
|
|
|
|
|
|
|
|
|
|
|
|
|
|
CLASS B SHARES | | | | | | | | | | | | | | | | | | | | | |
Year Ended October 31, 2005 | | 12.06 | %(f) | | | $ | 1,317 | | | 1.90 | %(f) | | (0.48 | )%(f) | | 2.09 | % | | 79.54 | % | |
Year Ended October 31, 2006 | | 6.16 | % | | | | 1,446 | | | 1.95 | % | | (0.88 | )% | | 2.19 | % | | 75.06 | % | |
Year Ended October 31, 2007 | | 29.43 | %(g) | | | | 1,630 | | | 1.86 | %(g) | | (0.78 | )%(g) | | 1.98 | % | | 57.04 | % | |
Year Ended October 31, 2008 | | (38.62 | )%(h) | | | | 2,839 | | | 1.95 | % | | (1.20 | )% | | 1.96 | % | | 157.87 | % | |
Year Ended October 31, 2009 | | 17.87 | %(i) | | | | 2,059 | | | 1.95 | % | | (1.06 | )% | | 2.06 | % | | 65.67 | % | |
|
|
|
|
|
|
|
|
|
|
|
|
|
|
|
|
|
|
|
|
|
|
CLASS C SHARES | | | | | | | | | | | | | | | | | | | | | |
Year Ended October 31, 2005 | | 12.08 | %(f) | | | $ | 344 | | | 1.90 | %(f) | | (0.51 | )%(f) | | 2.10 | % | | 79.54 | % | |
Year Ended October 31, 2006 | | 6.13 | % | | | | 270 | | | 1.95 | % | | (0.89 | )% | | 2.18 | % | | 75.06 | % | |
Year Ended October 31, 2007 | | 29.49 | %(g) | | | | 98 | | | 1.86 | %(g) | | (0.79 | )%(g) | | 1.96 | % | | 57.04 | % | |
Year Ended October 31, 2008 | | (38.63 | )%(h) | | | | 72 | | | 1.95 | % | | (1.13 | )% | | 1.97 | % | | 157.87 | % | |
Year Ended October 31, 2009 | | 17.86 | %(i) | | | | 120 | | | 1.95 | % | | (1.12 | )% | | 2.05 | % | | 65.67 | % | |
|
|
|
|
|
|
|
|
|
|
|
|
|
|
|
|
|
|
|
|
|
|
CLASS I SHARES | | | | | | | | | | | | | | | | | | | | | |
Year Ended October 31, 2005 | | 13.17 | %(f) | | | $ | 13,107 | | | 0.90 | %(f) | | 0.56 | %(f) | | 1.07 | % | | 79.54 | % | |
Year Ended October 31, 2006 | | 7.21 | % | | | | 15,042 | | | 0.95 | % | | 0.12 | % | | 1.19 | % | | 75.06 | % | |
Year Ended October 31, 2007 | | 30.73 | %(g) | | | | 30,295 | | | 0.87 | %(g) | | 0.20 | %(g) | | 0.96 | % | | 57.04 | % | |
Year Ended October 31, 2008 | | (38.07 | )%(h) | | | | 38,868 | | | 0.95 | % | | (0.16 | )% | | 0.97 | % | | 157.87 | % | |
Year Ended October 31, 2009 | | 19.11 | %(i) | | | | 39,400 | | | 0.95 | % | | (0.08 | )% | | 1.06 | % | | 65.67 | % | |
|
|
|
|
|
|
|
|
|
|
|
|
|
|
|
|
|
|
|
|
|
|
| |
* | Calculated based on average shares outstanding. |
| |
(a) | The per share amounts and percentages reflect income and expenses assuming inclusion of the Fund’s proportionate share of the income and expenses of the HSBC Investor Growth Portfolio. |
| |
(b) | Total return calculations do not include any sales or redemption charges. |
| |
(c) | During the period certain fees were reduced. If such fee reductions had not occurred, the ratio would have been as indicated. |
| |
(d) | Portfolio turnover rate is calculated on the basis of the respective Portfolio in which the Fund invests all its investable assets. Portfolio turnover rate is calculated on the basis of the Fund as a whole without distinguishing between the classes of shares issued. |
| |
(e) | Represents less than $0.005 or $(0.005). |
| |
(f) | During the year ended October 31, 2005, HSBC reimbursed certain amounts to the respective Portfolio in which the Fund invests related to a violation of certain investment policies and limitations. The corresponding impact to the net expense ratio, net income ratio, gross expense ratio and total return were 0.05%, 0.05%, 0.05% and 0.05% for Class A Shares, Class B Shares, Class C Shares and Class I Shares, respectively. |
| |
(g) | During the year ended October 31, 2007, HSBC reimbursed amounts to certain Funds related to past marketing arrangements. The corresponding impact to the net expense ratio, net income ratio, and the total returns were 0.09%, 0.09%, 0.09%, and 0.08% for Class A Shares, Class B Shares, Class C Shares and Class I Shares, respectively. |
| |
(h) | During the year ended October 31, 2008, the respective Portfolio in which the Fund invests in received monies related to certain nonrecurring litigation settlements. The corresponding impact to the total return was 0.19%, 0.19%, 0.19% and 0.19% for Class A Shares, Class B Shares, Class C Shares and Class I Shares, respectively. |
| |
(i) | During the year ended October 31, 2009, the respective Portfolio in which the Fund invests in received monies related to certain nonrecurring litigation settlements. The corresponding impact to the total return was 0.50%, 0.54%, 0.53% and 0.49% for Class A Shares, Class B Shares, Class C Shares and Class I Shares, respectively. |
| | |
36 | HSBC INVESTOR FAMILY OF FUNDS | See notes to financial statements. |
|
HSBC ADVISOR FUNDS TRUST—INTERNATIONAL EQUITY FUND |
|
Financial Highlights |
Selected data for a share outstanding throughout the periods indicated. (a)
| | | | | | | | | | | | | | | | | | | | | | | | |
| | | | Investment Activities | | Dividends | | | |
| | | |
| |
| | | |
| | Net Asset
Value,
Beginning
of Period | | Net
Investment
Income
(Loss) | | Net Realized
and Unrealized
Gains (Losses)
from
Investment
Transactions | | Total from
Investment
Activities | | Net
Investment
Income | | Net
Realized
Gains from
Investment
Transactions | | Total
Dividends | | Net Asset
Value, End
of Period | |
|
|
|
|
|
|
|
|
|
|
|
|
|
|
|
|
|
|
|
|
|
|
CLASS I SHARES | | | | | | | | | | | | | | | | | | | | | |
Year Ended October 31, 2005 | | $ | 14.87 | | 0.31 | | 2.59 | | | 2.90 | | | (0.23) | | — | | | (0.23) | | | $ | 17.54 | | |
Year Ended October 31, 2006 | | | 17.54 | | 0.38 | | 5.14 | | | 5.52 | | | (0.36) | | (0.60 | ) | | (0.96) | | | | 22.10 | | |
Year Ended October 31, 2007 | | | 22.10 | | 0.50 | | 4.69 | | | 5.19 | | | (0.55) | | (1.84 | ) | | (2.39) | | | | 24.90 | | |
Year Ended October 31, 2008 | | | 24.90 | | 0.53 | | (12.41 | ) | | (11.88 | ) | | (0.39) | | (1.90 | ) | | (2.29) | | | | 10.73 | | |
Year Ended October 31, 2009 | | | 10.73 | | 0.28 | | 2.31 | | | 2.59 | | | (0.54) | | (0.62 | ) | | (1.16) | | | | 12.16 | | |
|
|
|
|
|
|
|
|
|
|
|
|
|
|
|
|
|
|
|
|
|
|
|
|
|
| | | | | | | | | | | | | | | | | |
| | | | Ratios/Supplementary Data | |
| | | |
|
|
| | Total
Return(b) | | Net Assets
at End of
Period
(000’s) | | Ratio of Net
Expenses to
Average Net
Assets | | Ratio of Net
Investment
Income to
Average
Net Assets | | Ratio of
Expenses to
Average Net
Assets(c) | | Portfolio
Turnover
Rate(d) | |
|
|
|
|
|
|
|
|
|
|
|
|
|
|
|
|
|
|
CLASS I SHARES | | | | | | | | | | | | | | | | | |
Year Ended October 31, 2005 | | 19.69 | % | | $ | 193,144 | | 0.92 | % | | 2.01 | % | | 0.92% | | 31.32% | |
Year Ended October 31, 2006 | | 32.70 | % | | | 283,749 | | 0.97 | % | | 2.02 | % | | 0.97% | | 33.39% | |
Year Ended October 31, 2007 | | 25.41 | %(e)(f) | | | 385,717 | | 0.87 | %(e) | | 2.15 | %(e) | | 0.89% | | 26.08% | |
Year Ended October 31, 2008 | | (51.92 | )% | | | 161,053 | | 0.84 | % | | 2.69 | % | | 0.84% | | 28.98% | |
Year Ended October 31, 2009 | | 27.90 | % | | | 180,242 | | 0.97 | % | | 2.27 | % | | 0.97% | | 58.31% | |
|
|
|
|
|
|
|
|
|
|
|
|
|
|
|
|
|
|
| |
(a) | The per share amounts and percentages reflect income and expense assuming inclusion of the Fund’s proportionate share of the income and expenses of the HSBC Investor International Equity Portfolio. |
| |
(b) | Total return calculations do not include any sales or redemption charges. |
| |
(c) | During the period certain fees were reduced. If such fee reductions had not occurred, the ratio would have been as indicated. |
| |
(d) | Portfolio turnover rate is calculated on the basis of the respective Portfolio in which the Fund invests all of its investable assets. |
| |
(e) | During the year ended October 31, 2007, HSBC reimbursed amounts to certain Funds related to past marketing arrangements. The corresponding impact to the net expense ratio, net income ratio, and the total return were 0.02% for the Class I Shares. |
| |
(f) | During the year ended October 31, 2007, the Portfolio in which the Fund invests in received monies related to certain nonrecurring litigation settlements. The corresponding impact to the total return was 0.18%. |
| | |
See notes to financial statements. | HSBC INVESTOR FAMILY OF FUNDS | 37 |
|
HSBC INVESTOR FUNDS—MID-CAP FUND |
|
Financial Highlights |
Selected data for a share outstanding throughout the periods indicated.
| | | | | | | | | | | | | | | | | | | | | | |
| | | | | Investment Activities | | Dividends | | | | |
| | | | |
| |
| | | | |
| | Net Asset
Value,
Beginning
of Period | | Net
Investment
Income
(Loss) | | Net
Realized and
Unrealized
Gains (Losses)
from
Investment
Transactions | | Total from
Investment
Activities | | Net
Realized
Gains from
Investment
Transactions | | Total
Dividends | | Net Asset
Value, End
of Period | |
|
|
|
|
|
|
|
|
|
|
|
|
|
|
|
|
CLASS A SHARES | | | | | | | | | | | | | | | | | | | | | | |
Year Ended October 31, 2005 | | $ | 8.44 | | | (0.06 | )* | | 1.49 | | | 1.43 | | | — | | | — | | $ | 9.87 | |
Year Ended October 31, 2006 | | | 9.87 | | | (0.00 | )(d) | | 1.19 | | | 1.19 | | | (2.18 | ) | | (2.18 | ) | | 8.88 | |
Year Ended October 31, 2007 | | | 8.88 | | | (0.04 | )* | | 2.59 | | | 2.55 | | | (0.62 | ) | | (0.62 | ) | | 10.81 | |
Year Ended October 31, 2008 | | | 10.81 | | | (0.03 | )* | | (4.17 | ) | | (4.20 | ) | | (1.23 | ) | | (1.23 | ) | | 5.38 | |
Year Ended October 31, 2009 | | | 5.38 | | | 0.01 | * | | 0.73 | | | 0.74 | | | (0.44 | ) | | (0.44 | ) | | 5.68 | |
|
|
|
|
|
|
|
|
|
|
|
|
|
|
|
|
|
|
|
|
|
|
|
CLASS B SHARES | | | | | | | | | | | | | | | | | | | | | | |
Year Ended October 31, 2005 | | $ | 8.16 | | | (0.13 | )* | | 1.45 | | | 1.32 | | | — | | | — | | $ | 9.48 | |
Year Ended October 31, 2006 | | | 9.48 | | | (0.06 | )* | | 1.13 | | | 1.07 | | | (2.18 | ) | | (2.18 | ) | | 8.37 | |
Year Ended October 31, 2007 | | | 8.37 | | | (0.10 | )* | | 2.42 | | | 2.32 | | | (0.62 | ) | | (0.62 | ) | | 10.07 | |
Year Ended October 31, 2008 | | | 10.07 | | | (0.09 | )* | | (3.83 | ) | | (3.92 | ) | | (1.23 | ) | | (1.23 | ) | | 4.92 | |
Year Ended October 31, 2009 | | | 4.92 | | | (0.02 | )* | | 0.65 | | | 0.63 | | | (0.44 | ) | | (0.44 | ) | | 5.11 | |
|
|
|
|
|
|
|
|
|
|
|
|
|
|
|
|
|
|
|
|
|
|
|
CLASS C SHARES | | | | | | | | | | | | | | | | | | | | | | |
Year Ended October 31, 2005 | | $ | 8.22 | | | (0.13 | )* | | 1.45 | | | 1.32 | | | — | | | — | | $ | 9.54 | |
Year Ended October 31, 2006 | | | 9.54 | | | (0.06 | )* | | 1.15 | | | 1.09 | | | (2.18 | ) | | (2.18 | ) | | 8.45 | |
Year Ended October 31, 2007 | | | 8.45 | | | (0.10 | )* | | 2.43 | | | 2.33 | | | (0.62 | ) | | (0.62 | ) | | 10.16 | |
Year Ended October 31, 2008 | | | 10.16 | | | (0.10 | )* | | (3.86 | ) | | (3.96 | ) | | (1.23 | ) | | (1.23 | ) | | 4.97 | |
Year Ended October 31, 2009 | | | 4.97 | | | (0.02 | )* | | 0.66 | | | 0.64 | | | (0.44 | ) | | (0.44 | ) | | 5.17 | |
|
|
|
|
|
|
|
|
|
|
|
|
|
|
|
|
|
|
|
|
|
|
|
CLASS I SHARES | | | | | | | | | | | | | | | | | | | | | | |
Year Ended October 31, 2005 | | $ | 8.52 | | | (0.02 | )* | | 1.48 | | | 1.46 | | | — | | | — | | $ | 9.98 | |
Year Ended October 31, 2006 | | | 9.98 | | | 0.03 | * | | 1.20 | | | 1.23 | | | (2.18 | ) | | (2.18 | ) | | 9.03 | |
Year Ended October 31, 2007 | | | 9.03 | | | (0.02 | )* | | 2.64 | | | 2.62 | | | (0.62 | ) | | (0.62 | ) | | 11.03 | |
Year Ended October 31, 2008 | | | 11.03 | | | (0.01 | )* | | (4.28 | ) | | (4.29 | ) | | (1.23 | ) | | (1.23 | ) | | 5.51 | |
Year Ended October 31, 2009 | | | 5.51 | | | 0.03 | * | | 0.75 | | | 0.78 | | | (0.44 | ) | | (0.44 | ) | | 5.85 | |
|
|
|
|
|
|
|
|
|
|
|
|
|
|
|
|
|
|
|
|
|
|
|
| | | | | | | | | | | | | | | | | | | |
| | | | | Ratios/Supplementary Data |
| | | | |
|
| | Total
Return(a) | | Net Assets
at End of
Period
(000’s) | | Ratio of Net
Expenses to
Average Net
Assets | | Ratio of Net
Investment
Income (Loss)
to Average
Net Assets | | Ratio of
Expenses to
Average Net
Assets(b) | | Portfolio
Turnover
Rate(c) | |
|
|
|
|
|
|
|
|
|
|
|
|
|
|
CLASS A SHARES | | | | | | | | | | | | | | | | | | | |
Year Ended October 31, 2005 | | | 16.94 | %(e) | $ | 2,151 | | | 1.38 | %(e) | | (0.65 | )%(e) | | 1.53 | % | | 169.62 | % |
Year Ended October 31, 2006 | | | 13.66 | % | | 3,185 | | | 1.48 | % | | (0.01 | )% | | 1.85 | % | | 53.16 | % |
Year Ended October 31, 2007 | | | 30.51 | %(f) | | 5,897 | | | 1.19 | %(f) | | (0.45 | )%(f) | | 1.70 | % | | 66.16 | % |
Year Ended October 31, 2008 | | | (43.49 | )% | | 3,584 | | | 1.35 | % | | (0.36 | )% | | 1.80 | % | | 64.65 | % |
Year Ended October 31, 2009 | | | 16.07 | %(g) | | 4,186 | | | 1.35 | % | | 0.22 | % | | 2.17 | % | | 46.49 | % |
|
|
|
|
|
|
|
|
|
|
|
|
|
|
|
|
|
|
|
|
CLASS B SHARES | | | | | | | | | | | | | | | | | | | |
Year Ended October 31, 2005 | | | 16.18 | %(e) | $ | 7,415 | | | 2.11 | %(e) | | (1.38 | )%(e) | | 2.27 | % | | 169.62 | % |
Year Ended October 31, 2006 | | | 12.78 | % | | 7,425 | | | 2.25 | % | | (0.72 | )% | | 2.60 | % | | 53.16 | % |
Year Ended October 31, 2007 | | | 29.56 | %(f) | | 6,285 | | | 1.92 | %(f) | | (1.15 | )%(f) | | 2.48 | % | | 66.16 | % |
Year Ended October 31, 2008 | | | (43.97 | )% | | 1,975 | | | 2.09 | % | | (1.16 | )% | | 2.51 | % | | 64.65 | % |
Year Ended October 31, 2009 | | | 15.26 | %(g) | | 1,574 | | | 2.10 | % | | (0.48 | )% | | 2.94 | % | | 46.49 | % |
|
|
|
|
|
|
|
|
|
|
|
|
|
|
|
|
|
|
|
|
CLASS C SHARES | | | | | | | | | | | | | | | | | | | |
Year Ended October 31, 2005 | | | 16.06 | %(e) | $ | 111 | | | 2.13 | %(e) | | (1.40 | )%(e) | | 2.28 | % | | 169.62 | % |
Year Ended October 31, 2006 | | | 12.93 | % | | 95 | | | 2.25 | % | | (0.72 | )% | | 2.60 | % | | 53.16 | % |
Year Ended October 31, 2007 | | | 29.40 | %(f) | | 79 | | | 1.93 | %(f) | | (1.16 | )%(f) | | 2.46 | % | | 66.16 | % |
Year Ended October 31, 2008 | | | (43.97 | )% | | 12 | | | 2.09 | % | | (1.20 | )% | | 2.49 | % | | 64.65 | % |
Year Ended October 31, 2009 | | | 15.30 | %(g) | | 13 | | | 2.10 | % | | (0.53 | )% | | 2.91 | % | | 46.49 | % |
|
|
|
|
|
|
|
|
|
|
|
|
|
|
|
|
|
|
|
|
CLASS I SHARES | | | | | | | | | | | | | | | | | | | |
Year Ended October 31, 2005 | | | 17.14 | %(e) | $ | 19,618 | | | 0.89 | %(e) | | (0.19 | )%(e) | | 1.02 | % | | 169.62 | % |
Year Ended October 31, 2006 | | | 13.97 | % | | 17,029 | | | 1.26 | % | | 0.29 | % | | 1.60 | % | | 53.16 | % |
Year Ended October 31, 2007 | | | 30.80 | %(f) | | 20,671 | | | 0.93 | %(f) | | (0.19 | )%(f) | | 1.47 | % | | 66.16 | % |
Year Ended October 31, 2008 | | | (43.44 | )% | | 11,080 | | | 1.10 | % | | (0.12 | )% | | 1.54 | % | | 64.65 | % |
Year Ended October 31, 2009 | | | 16.42 | %(g) | | 7,432 | | | 1.10 | % | | 0.51 | % | | 1.95 | % | | 46.49 | % |
|
|
|
|
|
|
|
|
|
|
|
|
|
|
|
|
|
|
|
|
| |
* | Calculated based on average shares outstanding.
|
(a) | Total return calculations do not include any sales or redemption charges.
|
(b) | During the period certain fees were reduced. If such fee reductions had not occurred, the ratio would have been indicated.
|
(c) | Portfolio turnover rate is calculated on the basis of the Fund as a whole, without the distinguishing between the classes of shares issued.
|
(d) | Less than $0.005 per share.
|
(e) | During the year ended October 31, 2005, HSBC reimbursed certain amounts to the Fund related to a violation of certain investment policies and limitations. The corresponding impact to the net expense ratio and net income ratio were 0.10%, 0.10%, 0.10% and 0.09% for Class A Shares, Class B Shares, Class C Shares and Class I Shares, respectively. The corresponding impact to the total return was 0.57%, 0.57%, 0.57% and 0.56% for Class A Shares, Class B Shares, Class C Shares and Class I Shares, respectively.
|
(f) | During the year ended October 31, 2007, HSBC reimbursed amounts to certain Funds related to past marketing arrangements. The corresponding impact to the net expense ratio, net income ratio, and the total returns were 0.16%, 0.18%, 0.17%, and 0.17% for Class A Shares, Class B Shares, Class C Shares and Class I Shares, respectively.
|
(g) | During the year ended October 31, 2009, the Fund received monies related to certain nonrecurring litigation settlements. The corresponding impact to the total return was 0.04%, 0.04%, 0.04% and 0.04% for Class A Shares, Class B Shares, Class C Shares and Class I Shares, respectively. |
| | |
38 | HSBC INVESTOR FAMILY OF FUNDS | See notes to financial statements. |
|
HSBC INVESTOR FUNDS—OPPORTUNITY FUND |
|
Financial Highlights
Selected data for a share outstanding throughout the periods indicated. (a)
| | | | | | | | | | | | | | | | | | | | | | | | | | |
| | | | Investment Activities | | Dividends | | | | | | |
| | | |
| |
| | | |
| | Net Asset
Value,
Beginning
of Period | | Net
Investment
Income
(Loss) | | Net
Realized and
Unrealized
Gains (Losses)
from
Investment
Transactions | | Total from
Investment
Activities | | Net
Realized
Gains from
Investment
Transactions | | Total
Dividends | | Net Asset
Value, End
of Period | |
|
|
|
|
|
|
|
|
|
|
|
|
|
|
|
|
CLASS A SHARES | | | | | | | | | | | | | | | | | | | | | | | | | | |
Year Ended October 31, 2005 | | | $ | 10.91 | | | (0.14 | ) | | 1.62 | | | 1.48 | | | — | | | — | | | | $ | 12.39 | | |
Year Ended October 31, 2006 | | | | 12.39 | | | (0.14 | )* | | 2.43 | | | 2.29 | | | (0.39 | ) | | (0.39 | ) | | | | 14.29 | | |
Year Ended October 31, 2007 | | | | 14.29 | | | (0.16 | )* | | 4.01 | | | 3.85 | | | (1.73 | ) | | (1.73 | ) | | | | 16.41 | | |
Year Ended October 31, 2008 | | | | 16.41 | | | (0.12 | )* | | (4.04 | ) | | (4.16 | ) | | (5.16 | ) | | (5.16 | ) | | | | 7.09 | | |
Year Ended October 31, 2009 | | | | 7.09 | | | (0.07 | )* | | 0.97 | | | 0.90 | | | (0.43 | ) | | (0.43 | ) | | | | 7.56 | | |
|
|
|
|
|
|
|
|
|
|
|
|
|
|
|
|
|
|
|
|
|
|
|
|
|
|
|
CLASS B SHARES | | | | | | | | | | | | | | | | | | | | | | | | | | |
Year Ended October 31, 2005 | | | $ | 10.29 | | | (0.22 | ) | | 1.53 | | | 1.31 | | | — | | | — | | | | $ | 11.60 | | |
Year Ended October 31, 2006 | | | | 11.60 | | | (0.23 | )* | | 2.27 | | | 2.04 | | | (0.39 | ) | | (0.39 | ) | | | | 13.25 | | |
Year Ended October 31, 2007 | | | | 13.25 | | | (0.25 | )* | | 3.67 | | | 3.42 | | | (1.73 | ) | | (1.73 | ) | | | | 14.94 | | |
Year Ended October 31, 2008 | | | | 14.94 | | | (0.18 | )* | | (3.50 | ) | | (3.68 | ) | | (5.16 | ) | | (5.16 | ) | | | | 6.10 | | |
Year Ended October 31, 2009 | | | | 6.10 | | | (0.10 | )* | | 0.80 | | | 0.70 | | | (0.43 | ) | | (0.43 | ) | | | | 6.37 | | |
|
|
|
|
|
|
|
|
|
|
|
|
|
|
|
|
|
|
|
|
|
|
|
|
|
|
|
CLASS C SHARES | | | | | | | | | | | | | | | | | | | | | | | | | | |
Year Ended October 31, 2005 | | | $ | 10.39 | | | (0.21 | ) | | 1.53 | | | 1.32 | | | — | | | — | | | | $ | 11.71 | | |
Year Ended October 31, 2006 | | | | 11.71 | | | (0.23 | )* | | 2.29 | | | 2.06 | | | (0.39 | ) | | (0.39 | ) | | | | 13.38 | | |
Year Ended October 31, 2007 | | | | 13.38 | | | (0.26 | )* | | 3.72 | | | 3.46 | | | (1.73 | ) | | (1.73 | ) | | | | 15.11 | | |
Year Ended October 31, 2008 | | | | 15.11 | | | (0.17 | )* | | (3.57 | ) | | (3.74 | ) | | (5.16 | ) | | (5.16 | ) | | | | 6.21 | | |
Year Ended October 31, 2009 | | | | 6.21 | | | (0.10 | )* | | 0.81 | | | 0.71 | | | (0.43 | ) | | (0.43 | ) | | | | 6.49 | | |
|
|
|
|
|
|
|
|
|
|
|
|
|
|
|
|
|
|
|
|
|
|
|
|
|
|
|
| | | | | | | | | | | | | | | | | | | | | |
| | | | Ratios/Supplementary Data | |
| | | |
|
| | Total
Return(b) | | Net Assets
at End of
Period
(000’s) | | Ratio of Net
Expenses to
Average Net
Assets | | Ratio of Net
Investment
Income (Loss)
to Average
Net Assets | | Ratio of
Expenses to
Average Net
Assets(c) | | Portfolio
Turnover
Rate(d) | |
|
|
|
|
|
|
|
|
|
|
|
|
|
|
CLASS A SHARES | | | | | | | | | | | | | | | | | | | |
Year Ended October 31, 2005 | | 13.57 | %(e) | | | $ | 22,875 | | | 1.51 | %(e) | | (1.11 | )% | | 1.69 | %(e) | | 63.95 | % | |
Year Ended October 31, 2006 | | 18.81 | % | | | | 24,463 | | | 1.55 | % | | (1.04 | )% | | 1.70 | % | | 60.83 | % | |
Year Ended October 31, 2007 | | 30.28 | %(f) | | | | 15,057 | | | 1.52 | %(f) | | (1.13 | )% | | 1.77 | %(f) | | 69.41 | % | |
Year Ended October 31, 2008 | | (35.84 | )% | | | | 9,600 | | | 1.55 | % | | (1.13 | )% | | 1.82 | % | | 80.42 | % | |
Year Ended October 31, 2009 | | 14.85 | % | | | | 9,687 | | | 1.55 | % | | (1.02 | )% | | 2.30 | % | | 64.91 | % | |
|
|
|
|
|
|
|
|
|
|
|
|
|
|
|
|
|
|
|
|
|
|
CLASS B SHARES | | | | | | | | | | | | | | | | | | | | | |
Year Ended October 31, 2005 | | 12.73 | %(e) | | | $ | 4,539 | | | 2.26 | %(e) | | (1.86 | )% | | 2.44 | %(e) | | 63.95 | % | |
Year Ended October 31, 2006 | | 17.91 | % | | | | 4,768 | | | 2.30 | % | | (1.79 | )% | | 2.45 | % | | 60.83 | % | |
Year Ended October 31, 2007 | | 29.30 | %(f) | | | | 4,928 | | | 2.26 | %(f) | | (1.91 | )% | | 2.52 | %(f) | | 69.41 | % | |
Year Ended October 31, 2008 | | (36.30 | )% | | | | 1,578 | | | 2.29 | % | | (1.88 | )% | | 2.58 | % | | 80.42 | % | |
Year Ended October 31, 2009 | | 13.92 | % | | | | 1,082 | | | 2.30 | % | | (1.77 | )% | | 3.10 | % | | 64.91 | % | |
|
|
|
|
|
|
|
|
|
|
|
|
|
|
|
|
|
|
|
|
|
|
CLASS C SHARES | | | | | | | | | | | | | | | | | | | | | |
Year Ended October 31, 2005 | | 12.70 | %(e) | | | $ | 306 | | | 2.26 | %(e) | | (1.86 | )% | | 2.44 | %(e) | | 63.95 | % | |
Year Ended October 31, 2006 | | 17.92 | % | | | | 299 | | | 2.30 | % | | (1.78 | )% | | 2.45 | % | | 60.83 | % | |
Year Ended October 31, 2007 | | 29.32 | %(f) | | | | 334 | | | 2.27 | %(f) | | (1.91 | )% | | 2.50 | %(f) | | 69.41 | % | |
Year Ended October 31, 2008 | | (36.27 | )% | | | | 189 | | | 2.30 | % | | (1.88 | )% | | 2.58 | % | | 80.42 | % | |
Year Ended October 31, 2009 | | 13.83 | % | | | | 267 | | | 2.30 | % | | (1.78 | )% | | 3.08 | % | | 64.91 | % | |
|
|
|
|
|
|
|
|
|
|
|
|
|
|
|
|
|
|
|
|
|
|
| |
* | Calculated based on average shares outstanding. |
| |
(a) | The per share amounts and percentages reflect income and expense assuming inclusion of the Fund’s proportionate share of the income and expenses of the HSBC Investor Opportunity Portfolio. |
| |
(b) | Total return calculations do not include any sales or redemption charges. |
| |
(c) | During the period certain fees were reduced. If such fee reductions had not occurred, the ratio would have been as indicated. |
| |
(d) | Portfolio turnover rate is calculated on the basis of the respective Portfolio in which the Fund invests all of its investable assets. Portfolio turnover rate is calculated on the basis of the Fund as a whole without distinguishing between the classes of shares issued. |
| |
(e) | During the year ended October 31, 2005, HSBC reimbursed certain amounts to the respective Portfolio in which the Fund invests related to a violation of certain investment policies and limitations. The corresponding impact to the net expense ratio, net income ratio, gross expense ratio and total return were 0.04%, 0.04% and 0.04% for Class A Shares, Class B Shares and Class C Shares, respectively. |
| |
(f) | During the year ended October 31, 2007, HSBC reimbursed amounts to certain Funds related to past marketing arrangements. The corresponding impact to the net expense ratio, net income ratio, and the total returns were 0.03%, 0.04%, and 0.03% for Class A Shares, Class B Shares, and Class C Shares, respectively. |
| | |
See notes to financial statements. | HSBC INVESTOR FAMILY OF FUNDS | 39 |
|
HSBC ADVISOR FUNDS TRUST—OPPORTUNITY FUND (ADVISOR) |
|
Financial Highlights |
Selected data for a share outstanding throughout the periods indicated. (a)
| | | | | | | | | | | | | | | | | | | | | | | | | | |
| | | | | Investment Activities | | Dividends | | | | |
| | | | |
| |
| | | | |
| | Net Asset
Value,
Beginning
of Period | | Net
Investment
Income
(Loss) | | Net Realized
and Unrealized
Gains (Losses)
from
Investment
Transactions | | Total from
Investment
Activities | | Net
Realized
Gains from
Investment
Transactions | | Total
Dividends | | Net Asset
Value, End
of Period | |
|
|
|
|
|
|
|
|
|
|
|
|
|
|
|
|
CLASS I SHARES | | | | | | | | | | | | | | | | | |
Year Ended October 31, 2005 | | | $ | 13.07 | | | (0.10 | ) | | 1.97 | | | 1.87 | | | — | | | — | | | | $ | 14.94 | | |
Year Ended October 31, 2006 | | | | 14.94 | | | (0.09 | ) | | 2.93 | | | 2.84 | | | (0.50 | ) | | (0.50 | ) | | | | 17.28 | | |
Year Ended October 31, 2007 | | | | 17.28 | | | (0.11 | ) | | 4.48 | | | 4.37 | | | (2.71 | ) | | (2.71 | ) | | | | 18.94 | | |
Year Ended October 31, 2008 | | | | 18.94 | | | (0.07 | ) | | (4.99 | ) | | (5.06 | ) | | (4.97 | ) | | (4.97 | ) | | | | 8.91 | | |
Year Ended October 31, 2009 | | | | 8.91 | | | (0.04 | ) | | 1.32 | | | 1.28 | | | (0.26 | ) | | (0.26 | ) | | | | 9.93 | | |
| | | | | | | | | | | | | | | | | | | | | |
| | | | Ratios/Supplementary Data | |
| | | |
| |
| | Total
Return(b) | | Net Assets
at End of
Period
(000’s) | | Ratio of Net
Expenses to
Average Net
Assets | | Ratio of Net
Investment
Income (Loss)
to Average
Net Assets | | Ratio of
Expenses to
Average Net
Assets(c) | | Portfolio
Turnover
Rate(d) | |
|
|
|
|
|
|
|
|
|
|
|
|
|
|
CLASS I SHARES | | | | | | | | | | | | | | | |
Year Ended October 31, 2005 | | 14.31 | %(e) | | | $ | 177,519 | | | 0.94 | %(e) | | (0.54 | )%(e) | | 0.94 | % | | 63.95 | % | |
Year Ended October 31, 2006 | | 19.40 | % | | | | 192,124 | | | 1.03 | % | | (0.51 | )% | | 1.03 | % | | 60.83 | % | |
Year Ended October 31, 2007 | | 29.42 | %(f) | | | | 176,593 | | | 0.96 | %(f) | | (0.60 | )%(f) | | 1.03 | % | | 69.41 | % | |
Year Ended October 31, 2008 | | (35.39 | )% | | | | 97,841 | | | 0.97 | % | | (0.55 | )% | | 0.97 | % | | 80.42 | % | |
Year Ended October 31, 2009 | | 15.47 | % | | | | 100,285 | | | 1.02 | % | | (0.50 | )% | | 1.02 | % | | 64.91 | % | |
| |
(a) | The per share amounts and percentages reflect income and expense assuming inclusion of the Fund’s proportionate share of the income and expenses of the HSBC Investor Opportunity Portfolio. |
| |
(b) | Total return calculations do not include any sales or redemption charges. |
| |
(c) | During the period certain fees were reduced. If such fee reductions had not occurred, the ratio would have been as indicated. |
| |
(d) | Portfolio turnover rate is calculated on the basis of the respective Portfolio in which the Fund invests all of its investable assets. |
| |
(e) | During the year ended October 31, 2005, HSBC reimbursed certain amounts to the respective Portfolio in which the Fund invests related to a violation of certain investment policies and limitations. The corresponding impact to the net expense ratio, net income ratio, gross expense ratio and total return was 0.04% for the Class I Shares. |
| |
(f) | During the year ended October 31, 2007, HSBC reimbursed amounts to certain Funds related to past marketing arrangements. The corresponding impact to the net expense ratio, net income ratio, and the total return were 0.07% for the Class I Shares. |
| | |
40 | HSBC INVESTOR FAMILY OF FUNDS | See notes to financial statements. |
|
HSBC INVESTOR FUNDS—OVERSEAS EQUITY FUND |
|
Financial Highlights |
Selected data for a share outstanding throughout the periods indicated. (a)
| | | | | | | | | | | | | | | | | | | | | | | | | |
| | | | | Investment Activities | | Dividends | | | | |
| | | | |
| |
| | | | |
| | Net Asset
Value,
Beginning
of Period | | Net
Investment
Income
(Loss) | | Net Realized
and Unrealized
Gains (Losses)
from
Investment
Transactions | | Total from
Investment
Activities | | Net
Investment
Income | | Net
Realized
Gains from
Investment
Transactions | | Total
Dividends | | Net Asset
Value, End
of Period | |
|
|
|
|
|
|
|
|
|
|
|
|
|
|
|
|
|
|
CLASS A SHARES | | | | | | | | | | | | | | | | | | | | | | | | | |
Year Ended October 31, 2005 | | $ 13.93 | | | 0.18 | | | 2.33 | | | 2.51 | | | (0.06 | ) | | (0.79 | ) | | (0.85 | ) | | $ 15.59 | | |
Year Ended October 31, 2006 | | 15.59 | | | 0.22 | | | 4.45 | | | 4.67 | | | (0.25 | ) | | (1.16 | ) | | (1.41 | ) | | 18.85 | | |
Year Ended October 31, 2007 | | 18.85 | | | 0.22 | * | | 3.92 | | | 4.14 | | | (0.40 | ) | | (2.11 | ) | | (2.51 | ) | | 20.48 | | |
Year Ended October 31, 2008 | | 20.48 | | | 0.24 | * | | (9.41 | ) | | (9.17 | ) | | (0.15 | ) | | (3.31 | ) | | (3.46 | ) | | 7.85 | | |
Year Ended October 31, 2009 | | 7.85 | | | 0.06 | * | | 0.47 | | | 0.53 | | | (0.49 | ) | | (3.79 | ) | | (4.28 | ) | | 4.10 | | |
|
|
|
|
|
|
|
|
|
|
|
|
|
|
|
|
|
|
|
|
|
|
|
|
|
|
CLASS B SHARES | | | | | | | | | | | | | | | | | | | | | | | | | |
Year Ended October 31, 2005 | | $ 13.43 | | | 0.07 | | | 2.24 | | | 2.31 | | | — | | | (0.79 | ) | | (0.79 | ) | | $ 14.95 | | |
Year Ended October 31, 2006 | | 14.95 | | | 0.09 | | | 4.26 | | | 4.35 | | | (0.14 | ) | | (1.16 | ) | | (1.30 | ) | | 18.00 | | |
Year Ended October 31, 2007 | | 18.00 | | | 0.10 | * | | 3.70 | | | 3.80 | | | (0.27 | ) | | (2.11 | ) | | (2.38 | ) | | 19.42 | | |
Year Ended October 31, 2008 | | 19.42 | | | 0.14 | * | | (8.86 | ) | | (8.72 | ) | | (0.03 | ) | | (3.31 | ) | | (3.34 | ) | | 7.36 | | |
Year Ended October 31, 2009 | | 7.36 | | | 0.03 | * | | 0.37 | | | 0.40 | | | (0.38 | ) | | (3.79 | ) | | (4.17 | ) | | 3.59 | | |
|
|
|
|
|
|
|
|
|
|
|
|
|
|
|
|
|
|
|
|
|
|
|
|
|
|
CLASS C SHARES | | | | | | | | | | | | | | | | | | | | | | | | | |
Year Ended October 31, 2005 | | $ 13.67 | | | 0.06 | | | 2.29 | | | 2.35 | | | — | | | (0.79 | ) | | (0.79 | ) | | $ 15.23 | | |
Year Ended October 31, 2006 | | 15.23 | | | 0.11 | | | 4.33 | | | 4.44 | | | (0.14 | ) | | (1.16 | ) | | (1.30 | ) | | 18.37 | | |
Year Ended October 31, 2007 | | 18.37 | | | 0.11 | * | | 3.80 | | | 3.91 | | | (0.23 | ) | | (2.11 | ) | | (2.34 | ) | | 19.94 | | |
Year Ended October 31, 2008 | | 19.94 | | | 0.15 | * | | (9.15 | ) | | (9.00 | ) | | (0.02 | ) | | (3.31 | ) | | (3.33 | ) | | 7.61 | | |
Year Ended October 31, 2009 | | 7.61 | | | 0.03 | * | | 0.43 | | | 0.46 | | | (0.39 | ) | | (3.79 | ) | | (4.18 | ) | | 3.89 | | |
|
|
|
|
|
|
|
|
|
|
|
|
|
|
|
|
|
|
|
|
|
|
|
|
|
|
| | | | | | | | | | | | | | | | | | | |
| | | | | Ratios/Supplementary Data |
| | | | |
|
| | Total
Return(b) | | Net Assets
at End of
Period
(000’s) | | Ratio of Net
Expenses to
Average Net
Assets | | Ratio of Net
Investment
Income to
Average
Net Assets | | Ratio of
Expenses to
Average Net
Assets(c) | | Portfolio
Turnover
Rate(d) | |
|
|
|
|
|
|
|
|
|
|
|
|
|
|
CLASS A SHARES | | | | | | | | | | | | | | | | | | | |
Year Ended October 31, 2005 | | 18.64 | % | | $ 20,680 | | | 1.66 | % | | 1.21 | % | | 1.66 | % | | 31.32 | % | |
Year Ended October 31, 2006 | | 31.85 | % | | 22,761 | | | 1.67 | % | | 1.24 | % | | 1.67 | % | | 33.39 | % | |
Year Ended October 31, 2007 | | 24.19 | %(e) | | 16,078 | | | 1.62 | %(e) | | 1.15 | %(e) | | 1.64 | % | | 26.08 | % | |
Year Ended October 31, 2008 | | (52.63 | )% | | 6,645 | | | 1.70 | % | | 1.75 | % | | 1.81 | % | | 28.98 | % | |
Year Ended October 31, 2009 | | 23.99 | % | | 5,939 | | | 1.70 | % | | 1.56 | % | | 2.52 | % | | 58.31 | % | |
|
|
|
|
|
|
|
|
|
|
|
|
|
|
|
|
|
|
|
|
CLASS B SHARES | | | | | | | | | | | | | | | | | | | |
Year Ended October 31, 2005 | | 17.72 | % | | $ 2,403 | | | 2.41 | % | | 0.47 | % | | 2.41 | % | | 31.32 | % | |
Year Ended October 31, 2006 | | 30.87 | % | | 3,234 | | | 2.42 | % | | 0.58 | % | | 2.42 | % | | 33.39 | % | |
Year Ended October 31, 2007 | | 23.26 | %(e) | | 3,698 | | | 2.37 | %(e) | | 0.59 | %(e) | | 2.40 | % | | 26.08 | % | |
Year Ended October 31, 2008 | | (52.97 | )% | | 1,249 | | | 2.45 | % | | 1.05 | % | | 2.56 | % | | 28.98 | % | |
Year Ended October 31, 2009 | | 23.03 | % | | 962 | | | 2.45 | % | | 0.80 | % | | 3.28 | % | | 58.31 | % | |
|
|
|
|
|
|
|
|
|
|
|
|
|
|
|
|
|
|
|
|
CLASS C SHARES | | | | | | | | | | | | | | | | | | | |
Year Ended October 31, 2005 | | 17.70 | % | | $ 164 | | | 2.41 | % | | 0.48 | % | | 2.41 | % | | 31.32 | % | |
Year Ended October 31, 2006 | | 30.92 | % | | 163 | | | 2.41 | % | | 0.58 | % | | 2.41 | % | | 33.39 | % | |
Year Ended October 31, 2007 | | 23.39 | %(e) | | 147 | | | 2.30 | %(e) | | 0.59 | %(e) | | 2.32 | % | | 26.08 | % | |
Year Ended October 31, 2008 | | (52.96 | )% | | 58 | | | 2.45 | % | | 1.12 | % | | 2.57 | % | | 28.98 | % | |
Year Ended October 31, 2009 | | 23.01 | % | | 58 | | | 2.45 | % | | 0.92 | % | | 3.28 | % | | 58.31 | % | |
|
|
|
|
|
|
|
|
|
|
|
|
|
|
|
|
|
|
|
|
| |
* | Calculated based on average shares outstanding.
|
(a) | The per share amounts and percentages reflect income and expense assuming inclusion of the Fund’s proportionate share of the income and expenses of the HSBC Investor International Equity Portfolio.
|
(b) | Total return calculations do not include any sales or redemption charges.
|
(c) | During the period certain fees were reduced. If such fee reductions had not occurred, the ratio would have been as indicated.
|
(d) | Portfolio turnover rate is calculated on the basis of the respective Portfolio in which the Fund invests all of its investable assets. Portfolio turnover rate is calculated on the basis of the Fund as a whole without distinguishing between the classes of shares issued.
|
(e) | During the year ended October 31, 2007, HSBC reimbursed amounts to certain Funds related to past marketing arrangements. The corresponding impact to the net expense ratio, net income ratio, and the total returns were 0.02%, 0.03%, and 0.02% for Class A Shares, Class B Shares, and Class C Shares, respectively. |
| | |
See notes to financial statements. | HSBC INVESTOR FAMILY OF FUNDS | 41 |
|
HSBC INVESTOR FUNDS—VALUE FUND |
|
Financial Highlights |
Selected data for a share outstanding throughout the periods indicated. (a)
| | | | | | | | | | | | | | | | | | | | | | | | | | | | | |
| | | | Investment Activities | | Dividends | | | |
| | | |
| |
| | | | | | |
| | Net Asset
Value,
Beginning
of Period | | Net
Investment
Income (Loss) | | Net Realized
and Unrealized
Gains (Losses)
from
Investment
Transactions | | Total from
Investment
Activities | | Net
Investment
Income | | Net Realized
Gains from
Investment
Transactions | | Total
Dividends | | Net Asset
Value, End
of Period | |
|
|
|
|
|
|
|
|
|
|
|
|
|
|
|
|
|
|
CLASS A SHARES | | | | | | | | | | | | | | | | | | | | | | | | | | | | | |
Year Ended October 31, 2005 | | | $ | 13.38 | | | 0.10 | | | 1.86 | | | 1.96 | | | (0.08 | ) | | (0.13 | ) | | (0.21 | ) | | | $ | 15.13 | | |
Year Ended October 31, 2006 | | | | 15.13 | | | 0.12 | * | | 2.95 | | | 3.07 | | | (0.19 | ) | | (1.29 | ) | | (1.48 | ) | | | | 16.72 | | |
Year Ended October 31, 2007 | | | | 16.72 | | | 0.14 | * | | 1.38 | | | 1.52 | | | (0.13 | ) | | (1.57 | ) | | (1.70 | ) | | | | 16.54 | | |
Year Ended October 31, 2008 | | | | 16.54 | | | 0.13 | * | | (6.30 | ) | | (6.17 | ) | | (0.13 | ) | | (1.30 | ) | | (1.43 | ) | | | | 8.94 | | |
Year Ended October 31, 2009 | | | | 8.94 | | | 0.09 | * | | 1.64 | | | 1.73 | | | (0.11 | ) | | — | | | (0.11 | ) | | | | 10.56 | | |
|
|
|
|
|
|
|
|
|
|
|
|
|
|
|
|
|
|
|
|
|
|
|
|
|
|
|
|
|
|
CLASS B SHARES | | | | | | | | | | | | | | | | | | | | | | | | | | | | | |
Year Ended October 31, 2005 | | | $ | 12.95 | | | (0.02 | ) | | 1.80 | | | 1.78 | | | — | | | (0.13 | ) | | (0.13 | ) | | | $ | 14.60 | | |
Year Ended October 31, 2006 | | | | 14.60 | | | — | * | | 2.84 | | | 2.84 | | | (0.07 | ) | | (1.29 | ) | | (1.36 | ) | | | | 16.08 | | |
Year Ended October 31, 2007 | | | | 16.08 | | | 0.02 | * | | 1.32 | | | 1.34 | | | (0.02 | ) | | (1.57 | ) | | (1.59 | ) | | | | 15.83 | | |
Year Ended October 31, 2008 | | | | 15.83 | | | 0.03 | * | | (6.01 | ) | | (5.98 | ) | | (0.02 | ) | | (1.30 | ) | | (1.32 | ) | | | | 8.53 | | |
Year Ended October 31, 2009 | | | | 8.53 | | | 0.04 | * | | 1.54 | | | 1.58 | | | (0.03 | ) | | — | | | (0.03 | ) | | | | 10.08 | | |
|
|
|
|
|
|
|
|
|
|
|
|
|
|
|
|
|
|
|
|
|
|
|
|
|
|
|
|
|
|
CLASS C SHARES | | | | | | | | | | | | | | | | | | | | | | | | | | | | | |
Year Ended October 31, 2005 | | | $ | 13.01 | | | (0.02 | ) | | 1.82 | | | 1.80 | | | (0.01 | ) | | (0.13 | ) | | (0.14 | ) | | | $ | 14.67 | | |
Year Ended October 31, 2006 | | | | 14.67 | | | — | * | | 2.85 | | | 2.85 | | | (0.05 | ) | | (1.29 | ) | | (1.34 | ) | | | | 16.18 | | |
Year Ended October 31, 2007 | | | | 16.18 | | | 0.02 | * | | 1.32 | | | 1.34 | | | (0.01 | ) | | (1.57 | ) | | (1.58 | ) | | | | 15.94 | | |
Year Ended October 31, 2008 | | | | 15.94 | | | 0.03 | * | | (6.05 | ) | | (6.02 | ) | | (0.02 | ) | | (1.30 | ) | | (1.32 | ) | | | | 8.60 | | |
Year Ended October 31, 2009 | | | | 8.60 | | | 0.02 | * | | 1.57 | | | 1.59 | | | (0.04 | ) | | — | | | (0.04 | ) | | | | 10.15 | | |
|
|
|
|
|
|
|
|
|
|
|
|
|
|
|
|
|
|
|
|
|
|
|
|
|
|
|
|
|
|
CLASS I SHARES | | | | | | | | | | | | | | | | | | | | | | | | | | | | | |
Year Ended October 31, 2005 | | | $ | 13.38 | | | 0.13 | | | 1.86 | | | 1.99 | | | (0.11 | ) | | (0.13 | ) | | (0.24 | ) | | | $ | 15.13 | | |
Year Ended October 31, 2006 | | | | 15.13 | | | 0.15 | * | | 2.94 | | | 3.09 | | | (0.23 | ) | | (1.29 | ) | | (1.52 | ) | | | | 16.70 | | |
Year Ended October 31, 2007 | | | | 16.70 | | | 0.18 | * | | 1.38 | | | 1.56 | | | (0.17 | ) | | (1.57 | ) | | (1.74 | ) | | | | 16.52 | | |
Year Ended October 31, 2008 | | | | 16.52 | | | 0.16 | * | | (6.28 | ) | | (6.12 | ) | | (0.17 | ) | | (1.30 | ) | | (1.47 | ) | | | | 8.93 | | |
Year Ended October 31, 2009 | | | | 8.93 | | | 0.11 | * | | 1.63 | | | 1.74 | | | (0.13 | ) | | — | | | (0.13 | ) | | | | 10.54 | | |
|
|
|
|
|
|
|
|
|
|
|
|
|
|
|
|
|
|
|
|
|
|
|
|
|
|
|
|
|
|
| | | | | | | | | | | | | | | | | | | | | |
| | | | Ratios/Supplementary Data | |
| | | |
|
|
| | Total
Return(b) | | Net Assets
at End of
Period
(000’s) | | Ratio of Net
Expenses to
Average
Net Assets | | Ratio of Net
Investment
Income
(Loss)
to Average
Net Assets | | Ratio of
Expenses to
Average
Net Assets(c) | | Portfolio
Turnover
Rate(d) | |
|
|
|
|
|
|
|
|
|
|
|
|
|
|
CLASS A SHARES | | | | | | | | | | | | | | | | | | | | | |
Year Ended October 31, 2005 | | 14.69 | %(e) | | | $ | 23,315 | | | 1.15 | %(e) | | 0.64 | %(e) | | 1.30 | %(e) | | 16.45 | % | |
Year Ended October 31, 2006 | | 21.70 | % | | | | 24,688 | | | 1.20 | % | | 0.74 | % | | 1.43 | % | | 20.63 | % | |
Year Ended October 31, 2007 | | 9.77 | %(f) | | | | 27,225 | | | 1.11 | %(f) | | 0.84 | %(f) | | 1.25 | % | | 18.67 | % | |
Year Ended October 31, 2008 | | (40.46 | )%(g) | | | | 14,881 | | | 1.20 | % | | 0.99 | % | | 1.23 | % | | 24.61 | % | |
Year Ended October 31, 2009 | | 19.59 | %(h) | | | | 12,742 | | | 1.20 | % | | 0.91 | % | | 1.40 | % | | 19.77 | % | |
|
|
|
|
|
|
|
|
|
|
|
|
|
|
|
|
|
|
|
|
|
|
CLASS B SHARES | | | | | | | | | | | | | | | | | | | | | |
Year Ended October 31, 2005 | | 13.78 | %(e) | | | $ | 1,767 | | | 1.90 | %(e) | | (0.10 | )%(e) | | 2.04 | %(e) | | 16.45 | % | |
Year Ended October 31, 2006 | | 20.78 | % | | | | 1,939 | | | 1.95 | % | | (0.01 | )% | | 2.18 | % | | 20.63 | % | |
Year Ended October 31, 2007 | | 8.92 | %(f) | | | | 1,772 | | | 1.87 | %(f) | | 0.10 | %(f) | | 2.00 | % | | 18.67 | % | |
Year Ended October 31, 2008 | | (40.89 | )%(g) | | | | 717 | | | 1.95 | % | | 0.24 | % | | 1.98 | % | | 24.61 | % | |
Year Ended October 31, 2009 | | 18.63 | %(h) | | | | 466 | | | 1.95 | % | | 0.23 | % | | 2.14 | % | | 19.77 | % | |
|
|
|
|
|
|
|
|
|
|
|
|
|
|
|
|
|
|
|
|
|
|
CLASS C SHARES | | | | | | | | | | | | | | | | | | | | | |
Year Ended October 31, 2005 | | 13.86 | %(e) | | | $ | 388 | | | 1.90 | %(e) | | (0.12 | )%(e) | | 2.05 | %(e) | | 16.45 | % | |
Year Ended October 31, 2006 | | 20.72 | % | | | | 157 | | | 1.95 | % | | 0.01 | % | | 2.17 | % | | 20.63 | % | |
Year Ended October 31, 2007 | | 8.95 | %(f) | | | | 126 | | | 1.87 | %(f) | | 0.11 | %(f) | | 1.99 | % | | 18.67 | % | |
Year Ended October 31, 2008 | | (40.89 | )%(g) | | | | 66 | | | 1.95 | % | | 0.24 | % | | 1.98 | % | | 24.61 | % | |
Year Ended October 31, 2009 | | 18.60 | %(h) | | | | 71 | | | 1.95 | % | | 0.12 | % | | 2.14 | % | | 19.77 | % | |
|
|
|
|
|
|
|
|
|
|
|
|
|
|
|
|
|
|
|
|
|
|
CLASS I SHARES | | | | | | | | | | | | | | | | | | | | | |
Year Ended October 31, 2005 | | 14.96 | %(e) | | | $ | 15,044 | | | 0.90 | %(e) | | 0.91 | %(e) | | 1.02 | %(e) | | 16.45 | % | |
Year Ended October 31, 2006 | | 21.90 | % | | | | 18,036 | | | 0.95 | % | | 0.99 | % | | 1.18 | % | | 20.63 | % | |
Year Ended October 31, 2007 | | 10.04 | %(f) | | | | 28,692 | | | 0.87 | %(f) | | 1.07 | %(f) | | 0.99 | % | | 18.67 | % | |
Year Ended October 31, 2008 | | (40.29 | )%(g) | | | | 17,779 | | | 0.95 | % | | 1.24 | % | | 0.98 | % | | 24.61 | % | |
Year Ended October 31, 2009 | | 19.82 | %(h) | | | | 16,737 | | | 0.95 | % | | 1.16 | % | | 1.15 | % | | 19.77 | % | |
|
|
|
|
|
|
|
|
|
|
|
|
|
|
|
|
|
|
|
|
|
|
| |
* | Calculated based on average shares outstanding. |
| |
(a) | The per share amounts and percentages reflect income and expenses assuming inclusion of the Fund’s proportionate share of the income and expenses of the HSBC Investor Value Portfolio. |
| |
(b) | Total return calculations do not include any sales or redemption charges. |
| |
(c) | During the period certain fees were reduced. If such fee reductions had not occurred, the ratio would have been as indicated. |
| |
(d) | Portfolio turnover rate is calculated on the basis of the respective Portfolio in which the Fund invests all its investable assets. Portfolio turnover rate is calculated on the basis of the Fund as a whole without distinguishing between the classes of shares issued. |
| |
(e) | During the year ended October 31, 2005, HSBC reimbursed certain amounts to the respective Portfolio in which the Fund invests related to a violation of certain investment policies and limitations. The corresponding impact to the net expense ratio, net income ratio, gross expense ratio and total return were 0.05%, 0.05%, 0.05% and 0.05% for Class A Shares, Class B Shares, Class C Shares and Class I Shares, respectively. |
| |
(f) | During the year ended October 31, 2007, HSBC reimbursed amounts to certain Funds related to past marketing arrangements. The corresponding impact to the net expense ratio, net income ratio, and the total returns were 0.09%, 0.08%, 0.08%, and 0.08% for Class A Shares, Class B Shares, Class C Shares and Class I Shares, respectively. |
| |
(g) | During the year ended October 31, 2008, the respective Portfolio in which the Fund invests in received monies related to certain nonrecurring litigations settlements. The corresponding impact to the total return was 0.22%, 0.22%, 0.22% and 0.22% for Class A Shares, Class B Shares, Class C Shares and Class I Shares, respectively. |
| |
(h) | During the year ended October 31, 2009, the respective Portfolio in which the Fund invests in received monies related to certain nonrecurring litigation settlements. The corresponding impact to the total return was 0.03%, 0.03%, 0.03% and 0.03% for Class A Shares, Class B Shares, Class C Shares and Class I Shares, respectively. |
| | |
42 | HSBC INVESTOR FAMILY OF FUNDS | See notes to financial statements. |
|
HSBC INVESTOR FAMILY OF FUNDS |
|
Notes to Financial Statements—As of October 31, 2009 |
| |
1. | Organization: |
| |
| The HSBC Investor Funds (the “Trust”), a Massachusetts business trust organized on April 22, 1987, and the HSBC Advisor Funds Trust (the “Advisor Trust”), a Massachusetts business trust organized on April 5, 1996, are registered under the Investment Company Act of 1940, as amended (the “Act”), as open-end management investment companies. As of October 31, 2009, the Trust is comprised of 15 separate operational funds and the Advisor Trust is comprised of 2 separate operational funds. The accompanying financial statements are presented for the following 7 funds (individually a “Fund”, collectively the “Funds”) of the Trust and Advisor Trust (collectively the “Trusts”): |
| | | | |
Fund | | Short Name | | Trust |
| |
| |
|
HSBC Investor Growth Fund | | Growth Fund | | Trust |
HSBC Investor International Equity Fund | | International Equity Fund | | Advisor Trust |
HSBC Investor Mid-Cap Fund | | Mid-Cap Fund | | Trust |
HSBC Investor Opportunity Fund | | Opportunity Fund | | Trust |
HSBC Investor Opportunity Fund (Advisor) | | Opportunity Fund (Advisor) | | Advisor Trust |
HSBC Investor Overseas Equity Fund | | Overseas Equity Fund | | Trust |
HSBC Investor Value Fund | | Value Fund | | Trust |
| |
| All the funds are diversified funds. Each Fund is a part of the HSBC Family of Funds. |
| |
| Financial statements for all other funds of the HSBC Investor Family of Funds are published separately. The Growth Fund, International Equity Fund, Opportunity Fund, Opportunity Fund (Advisor), Overseas Equity Fund, and the Value Fund (individually a “Feeder Fund”, collectively the “Feeder Funds”) utilize the master-feeder fund structure and seek to achieve their investment objectives by investing all of their investable assets in their respective Portfolios (as defined below). |
| | | | | |
Fund | | Respective Portfolio | | Proportionate
Interest on
October 31, 2009 |
| |
| |
|
Growth Fund | | HSBC Investor Growth Portfolio | | 65.2 | % |
International Equity Fund | | HSBC Investor International Equity Portfolio | | 82.8 | % |
Opportunity Fund | | HSBC Investor Opportunity Portfolio | | 8.5 | % |
Opportunity Fund (Advisor) | | HSBC Investor Opportunity Portfolio | | 77.2 | % |
Overseas Equity Fund | | HSBC Investor International Equity Portfolio | | 3.2 | % |
Value Fund | | HSBC Investor Value Portfolio | | 60.5 | % |
| |
| The HSBC Investor Growth Portfolio, HSBC Investor International Equity Portfolio, HSBC Investor Opportunity Portfolio and the HSBC Investor Value Portfolio (individually a “Portfolio”, collectively the “Portfolios”) are diversified series of the HSBC Investor Portfolios (the “Portfolio Trust”). The Portfolios operate as master funds in master-feeder arrangements and also receive investments from certain funds of funds. |
| |
| The financial statements of the Portfolios, including the Schedules of Portfolio Investments, are included elsewhere in this report. The financial statements of the Portfolios should be read in conjunction with the financial statements of the Feeder Funds. |
| |
| The Funds are authorized to issue an unlimited number of shares of beneficial interest with a par value of $0.001 per share. The Growth Fund, Mid-Cap Fund, and the Value Fund each offer four classes of shares: Class A Shares, Class B Shares, Class C Shares, and Class I Shares. The International Equity Fund and the Opportunity Fund (Advisor) each offer one class of shares: Class I Shares. The Opportunity Fund and the Overseas Equity Fund each offer three classes of shares: Class A Shares, Class B Shares, and Class C Shares. Class A Shares of the Funds have a maximum sales charge of 5.00% as a percentage of the original purchase price. Class B Shares of the Funds are offered without any front-end sales charge but will be subject to a contingent deferred sales charge (“CDSC”) ranging from a maximum of 4.00% if redeemed less than one year after purchase to 0.00% if redeemed more than four years after purchase. Class C Shares of the Funds are offered without any front-end sales charge but will be subject to a maximum CDSC of 1.00% if redeemed less than one year after purchase. No sales charges are assessed with respect to Class I Shares of the Funds. Each class of shares in the Funds has identical rights and privileges except with respect to arrangements pertaining to shareholder servicing or distribution, class-related expenses, voting rights on matters affecting a single class of shares, and the exchange privilege of each class of shares. |
| |
HSBC INVESTOR FAMILY OF FUNDS | 43 |
| |
HSBC INVESTOR FAMILY OF FUND |
|
Notes to Financial Statements—As of October 31, 2009 (continued) |
| |
| Under the Trusts’ organizational documents, the Trusts’ officers and trustees are indemnified against certain liabilities arising out of the performance of their duties to the Funds. In addition, in the normal course of business, the Trusts enter into contracts with service providers, which also provide for indemnifications by the Funds. The Funds’ maximum exposure under these arrangements is unknown, as this would involve any future claims that may be made against the Funds. However, based on experience, the Trusts expect that risk of loss to be remote. |
| |
2. | Significant Accounting Policies: |
| |
| The following is a summary of the significant accounting policies followed by the Funds in the preparation of their financial statements. The policies are in conformity with U.S. generally accepted accounting principles (“GAAP”). The preparation of financial statements requires management to make certain estimates and assumptions that affect the reported amounts of assets and liabilities and disclosure of contingent assets and liabilities at the date of the financial statements and the reported amounts of increases and decreases in net assets from operations during the reporting period. Actual results could differ from those estimates. Management has evaluated events and transactions through December 21, 2009, the date the financial statements were issued, for purposes of recognition or disclosure in these financial statements and there are no subsequent events to report. |
| |
| Securities Valuation: |
| |
| The Funds record their investments at fair value. Fair value is defined as the price that would be received to sell an asset or paid to transfer a liability in an orderly transaction between market participants at the measurement date. The valuation techniques used to determine fair value are further described below. |
| |
| A. Mid-Cap Fund |
| |
| The value of each equity security is based either on the last sale price on a national securities exchange, or in the absence of recorded sales, at the closing bid prices on such exchanges, or at the quoted bid price in the over-the-counter market. Securities or other assets for which market quotations are not readily available, or are deemed unreliable due to a significant event or otherwise, are valued pursuant to procedures adopted by the Funds’ Board of Trustees (“Trustees”). In addition, specific securities may need to be valued pursuant to procedures adopted by the Trustees due to potentially significant events. Examples of potentially significant events that could affect the value of an individual security include corporate actions by the issuer, announcements by the issuer relating to its earnings or profits, regulatory news, natural disasters and litigation. Examples of potentially significant events that could affect multiple securities held by a Fund include governmental actions, natural disasters and armed conflicts. |
| |
| B. Feeder Funds |
| |
| The Feeder Funds record their investments in their respective Portfolios at fair value. Securities of the Portfolios are recorded at fair value as more fully discussed in the notes to those financial statements. |
| |
| Investment Transactions and Related Income: |
| |
| A. Mid-Cap Fund |
| |
| Investment transactions are accounted for no later than one business day after trade date. For financial reporting purposes, changes in holdings are accounted for on trade date on the last business day of the reporting period. Investment gains and losses are calculated on the identified cost basis. Interest income is recognized on the accrual basis and includes, where applicable, the amortization or accretion of premium or discount. Dividend income is recorded on the ex-dividend date. |
| |
| B. Feeder Funds |
| |
| The Feeder Funds record daily their pro-rata share of income, expenses, changes in unrealized appreciation and depreciation and realized gains and losses derived from their respective Portfolios. In addition, the Feeder Funds accrue their own expenses daily as incurred. |
| |
| Futures Contracts: |
| |
| The Mid-Cap Fund may invest in futures contracts for the purpose of hedging existing portfolio securities or securities it intends to purchase against fluctuations in fair value caused by changes in prevailing market conditions. Upon entering into a futures contract, a Fund is required to pledge to the broker an amount of cash and/or other assets equal to a certain percentage of the contract amount (initial margin deposit). Subsequent payments, known as “variation margin,” |
| |
44 | HSBC INVESTOR FAMILY OF FUNDS |
| |
HSBC INVESTOR FAMILY OF FUND |
|
Notes to Financial Statements—As of October 31, 2009 (continued) |
| |
| are made each day, depending on the daily fluctuations in the fair value of the underlying security. A gain or loss equal to the daily variation margin is recognized on a daily basis. |
| |
| Should market conditions move unexpectedly, the Mid-Cap Fund may not achieve the anticipated benefits of the futures contracts and may realize a loss. Futures contracts involve, to varying degrees, elements of market risk (generally equity price risk related to stock futures, interest rate risk related to bond futures, and foreign currency risk related to currency futures) and exposure to loss in excess of the variation margin. The primary risks associated with the use of futures contracts are the imperfect correlation between the change in market value of the securities held by the Funds and the prices of futures contracts, the possibility of an illiquid market, and the inability of the counterparty to meet the terms of the contract. For the year ended October 31, 2009, the Mid-Cap Fund did not hold any futures contracts. |
| |
| Options: |
| |
| The Mid-Cap Fund may write covered call options against some of the securities in their portfolios provided the securities are listed on a national securities exchange. A call option is “covered” if the Fund owns the underlying securities covered by the call. The premium received is recorded as a liability and is subsequently adjusted to the current fair value of the option written. Premiums received from writing options that expire unexercised are treated on the expiration date as realized gains from investments. The difference between the premium and the amount paid on effecting a closing purchase transaction, including brokerage commissions, is also treated as a realized gain or loss. If the call option is exercised, the premium is added to the proceeds from the sale of the underlying security in determining a realized gain or loss. For the year ended October 31, 2009, the Mid-Cap Fund did not write any covered call options. |
| |
| Allocations: |
| |
| Expenses directly attributable to a Fund are charged to that Fund. Expenses not directly attributable to a Fund are allocated proportionately among various or all funds within the HSBC Investor Family of Funds in relation to the net assets of each fund or on another reasonable basis. Class specific expenses are charged directly to the class incurring the expense. In addition, income, expenses (other than class specific expenses), and unrealized/realized gains and losses are allocated to each class based on relative net assets on a daily basis. |
| |
| Dividends to Shareholders: |
| |
| Dividends to shareholders from net investment income, if any, are declared and distributed semi-annually in the case of the Growth Fund, Opportunity Fund, Opportunity (Advisor) and the Value Fund, and annually in the case of the International Equity Fund, Mid-Cap Fund, and Overseas Equity Fund. |
| |
| The Funds’ net realized gains, if any, are distributed to shareholders at least annually. Additional distributions are also made to the Funds’ shareholders to the extent necessary to avoid the federal excise tax on certain undistributed income and net capital gains of regulated investment companies. |
| |
| The amount and character of net investment income and net realized gains distributions are determined in accordance with federal income tax regulations which may differ from GAAP. These “book/tax” differences are either considered temporary or permanent in nature. To the extent these differences are permanent in nature (e.g., reclassification of market discounts, certain gain/loss, paydowns, and certain distributions), such amounts are reclassified within the composition of net assets; temporary differences (e.g., wash losses and post-October loss deferrals) do not require reclassification. The Funds may utilize equalization accounting for tax purposes and designate earnings and profits, including net realized gains distributed to shareholders on redemption of shares, as a part of the dividends paid deduction for income tax purposes. To the extent distributions to shareholders from net investment income and net realized gains exceed net investment income and net realized gains for tax purposes, they are reported as distributions of capital. |
| |
| Redemption Fee: |
| |
| A redemption fee of 2.00% is charged and recorded as paid-in-capital for any shares redeemed or exchanged after holding them for less than 30 days. This fee does not apply to shares purchased through reinvested dividends or capital gains or shares held in certain omnibus accounts or retirement plans that cannot implement the fee. The Trustees have approved the removal of such redemption fee effective February 28, 2010. For the fiscal years ended October 31, 2008 and October 31, 2009, the following Funds collected redemption fees as follows: |
| |
HSBC INVESTOR FAMILY OF FUNDS | 45 |
|
HSBC INVESTOR FAMILY OF FUND |
|
Notes to Financial Statements—As of October 31, 2009 (continued) |
| | | | | | | |
Fund | | Fees Collected
October 31, 2008 | | Fees Collected
October 31, 2009 | |
| |
| |
| |
Growth Fund | | $ | 1,549 | | $ | 2,635 | |
International Equity Fund | | | 868 | | | 8,926 | |
Mid-Cap Fund | | | 20 | | | 25 | |
Opportunity Fund (Advisor) | | | 5 | | | 2,378 | |
Opportunity Fund | | | 749 | | | 638 | |
Overseas Equity Fund | | | 1,711 | | | 73 | |
Value Fund | | | 761 | | | 2,519 | |
| | | |
| Federal Income Taxes: |
| |
| Each Fund is a separate taxable entity for federal income tax purposes. Each Fund has qualified and intends to continue to qualify each year as a “regulated investment company” under Subchapter M of the Internal Revenue Code, as amended and to distribute substantially all of their taxable net investment income and net realized gains, if any, to their shareholders. Accordingly, no provision for federal income or excise tax is required. |
| | | |
| Management of the Funds has reviewed tax positions taken in tax years that remain subject to examination by all major tax jurisdictions, including federal (i.e., the last four tax year ends and the interim tax period since then, as applicable). Management believes that there is no tax liability resulting from unrecognized tax benefits related to uncertain tax positions taken. |
| | | |
| New Accounting Pronouncements: |
| | | |
| In June 2009, the Financial Accounting Standards Board (“FASB”) issued Accounting Standard Codification 105-10, “The FASB Accounting Standards Codification and the Hierarchy of Generally Accepted Accounting Principles — a replacement of FASB Statement No. 162” (“ASC 105-10, formerly “SFAS 168”). ASC 105-10 replaces SFAS No. 162, “The Hierarchy of Generally Accepted Accounting Principles” and establishes the “FASB Accounting Standards Codification” (“Codification”) as the source of authoritative accounting principles recognized by the FASB to be applied by nongovernmental entities in the preparation of financial statements in conformity with U.S. GAAP. All guidance contained in the Codification carries an equal level of authority. The Codification supersedes all existing non-SEC accounting and reporting standards. All other non-grandfathered non-SEC accounting literature not included in the Codification will become nonauthoritative. ASC 105-10 is effective for financial statements issued for interim and annual periods ending after September 15, 2009. The Funds adopted ASC 105-10 in the current reporting period. Management has evaluated this new statement and has determined that it did not have a significant impact on the determination or reporting of the Funds’ financial statements. |
| | | |
3. | Investment Valuation Summary: |
| |
| The valuation techniques employed by the Funds, as described in Note 2 above, maximize the use of observable inputs and minimize the use of unobservable inputs in determining fair value. The inputs used for valuing the Funds’ investments are summarized in the three broad levels listed below: |
| |
| • | Level 1— | quoted prices in active markets for identical assets |
| | | |
| • | Level 2— | other significant observable inputs (including quoted prices for similar securities, interest rates, prepayments speeds, credit risk, etc.) |
| | | |
| • | Level 3— | significant unobservable inputs (including the Fund’s own assumptions in determining the fair value of investments) |
| | | |
| The inputs or methodology used for valuing investments are not necessarily an indication of the risk associated with investing in those investments. For example, short-term debt securities maturing in sixty days or less are generally valued at amortized cost. Generally, amortized cost approximates the current fair value of a security, but since the valuation is not obtained from a quoted price in an active market, such securities are reflected as Level 2. |
| |
46 | HSBC INVESTOR FAMILY OF FUNDS |
|
HSBC INVESTOR FAMILY OF FUNDS |
|
Notes to Financial Statements—As of October 31, 2009 (continued) |
| |
| The Schedules of Portfolio Investments of the Mid-Cap Fund and the Portfolios include additional information regarding the investments for the Funds. The following is a summary of the valuation inputs used as of October 31, 2009 in valuing the Funds’ investments based upon the three levels defined above: |
| | | | | | | | | | |
| | | | | | | | | | |
| | LEVEL 1 | | LEVEL 2 | | TOTAL
INVESTMENTS | |
| |
| |
| |
| |
Growth Fund | | | | | | | | | | |
Investments: | | | | | | | | | | |
Affiliated Investment Portfolio | | $ | — | | $ | 57,520,119 | | $ | 57,520,119 | |
| |
|
| |
|
| |
|
| |
Total Investments | | $ | — | | $ | 57,520,119 | | $ | 57,520,119 | |
| |
|
| |
|
| |
|
| |
| | | | | | | | | | |
International Equity Fund | | | | | | | | | | |
Investments: | | | | | | | | | | |
Affiliated Investment Portfolio | | $ | — | | $ | 179,737,109 | | $ | 179,737,109 | |
| |
|
| |
|
| |
|
| |
Total Investments | | $ | — | | $ | 179,737,109 | | $ | 179,737,109 | |
| |
|
| |
|
| |
|
| |
| | | | | | | | | | |
Mid-Cap Fund | | | | | | | | | | |
Investments: | | | | | | | | | | |
Common Stocks - Domestic | | $ | 12,814,145 | | $ | — | | $ | 12,814,145 | |
Investment Companies | | | 529,893 | | | — | | | 529,893 | |
| |
|
| |
|
| |
|
| |
Total Investments | | $ | 13,344,038 | | $ | — | | $ | 13,344,038 | |
| |
|
| |
|
| |
|
| |
| | | | | | | | | | |
Opportunity Fund | | | | | | | | | | |
Investments: | | | | | | | | | | |
Affiliated Investment Portfolio | | $ | — | | $ | 11,027,004 | | $ | 11,027,004 | |
| |
|
| |
|
| |
|
| |
Total Investments | | $ | — | | $ | 11,027,004 | | $ | 11,027,004 | |
| |
|
| |
|
| |
|
| |
| | | | | | | | | | |
Opportunity Fund (Advisor) | | | | | | | | | | |
Investments: | | | | | | | | | | |
Affiliated Investment Portfolio | | $ | — | | $ | 100,214,407 | | $ | 100,214,407 | |
| |
|
| |
|
| |
|
| |
Total Investments | | $ | — | | $ | 100,214,407 | | $ | 100,214,407 | |
| |
|
| |
|
| |
|
| |
| | | | | | | | | | |
Overseas Equity Fund | | | | | | | | | | |
Investments: | | | | | | | | | | |
Affiliated Investment Portfolio | | $ | — | | $ | 6,910,706 | | $ | 6,910,706 | |
| |
|
| |
|
| |
|
| |
Total Investments | | $ | — | | $ | 6,910,706 | | $ | 6,910,706 | |
| |
|
| |
|
| |
|
| |
| | | | | | | | | | |
Value Fund | | | | | | | | | | |
Investments: | | | | | | | | | | |
Affiliated Investment Portfolio | | $ | — | | $ | 30,047,170 | | $ | 30,047,170 | |
| |
|
| |
|
| |
|
| |
Total Investments | | $ | — | | $ | 30,047,170 | | $ | 30,047,170 | |
| |
|
| |
|
| |
|
| |
| |
HSBC INVESTOR FAMILY OF FUNDS | 47 |
|
HSBC INVESTOR FAMILY OF FUNDS |
|
Notes to Financial Statements—As of October 31, 2009 (continued) |
| |
4. | Related Party Transactions and Other Agreements and Plans: |
| |
| Investment Management: |
| |
| HSBC Global Asset Management (USA) Inc. (“HSBC” or the “Investment Adviser”), a wholly owned subsidiary of HSBC Bank USA, N.A., a national bank organized under the laws of the United States, acts as Investment Adviser to the Mid-Cap Fund. As Investment Adviser, HSBC manages the investments of the Funds and continuously reviews, supervises, and administers the Funds’ investments. Investment sub-advisory services are provided by Munder Capital Management (“Munder”) for the Mid-Cap Fund. |
| |
| For their services as Investment Adviser and Investment Sub-Adviser, respectively, HSBC and Munder receive, in the aggregate, a fee, accrued daily and paid monthly at an annual rate of 0.75% of the Mid-Cap Fund’s average daily net assets. |
| |
| Feeder Funds are not directly charged any investment management fees. |
| |
| Administration: |
| |
| HSBC serves the Funds as Administrator. Under the terms of the Administration Agreement, HSBC received from the Funds (as well as other funds in the HSBC Investor Family of Funds) a fee, accrued daily and paid monthly, during the period November 1, 2008 to December 31, 2008, at an annual rate of: |
| | | | |
| Based on Average Daily Net Assets of | | Fee Rate | |
|
| |
| |
| Up to $12 billion | | 0.0525% | |
| In excess of $12 billion | | 0.0350% | |
| |
| Effective January 1, 2009, the terms of the Administration Agreement were amended. Pursuant to the amended Administration Agreement, HSBC receives from the Funds (as well as the other funds in the HSBC Investor Family of Funds) a fee, accrued daily and paid monthly, at an annual rate of: |
| | | | |
| Based on Average Daily Net Assets of | | Fee Rate | |
|
| |
| |
| Up to $10 billion | | 0.0550% | |
| In excess of $10 billion but not exceeding $20 billion | | 0.0350% | |
| In excess of $20 billion but not exceeding $50 billion | | 0.0275% | |
| In excess of $50 billion | | 0.0250% | |
| |
| The fee breakpoints are determined on the basis of the aggregate average daily net assets of the HSBC Investor Family of Funds. The fee is allocated to each series of the HSBC Investor Family of Funds based upon its pro-rata share of net assets for each class. For assets invested in the underlying Portfolios by the Feeder Funds, the Portfolios pay half of the administration fee and the Feeder Funds pay half, for a combination of the total fee rate above. Certain administration fees of the Portfolios also may be reduced by treating them as apportioned in part to other funds making investments in the Portfolios. An amount equal to 50% of the administration fees is deemed to be class specific. |
| |
| Pursuant to a Sub-Administration Agreement with HSBC, Citi Fund Services Ohio, Inc. (“Citi Ohio”), a wholly-owned subsidiary of Citigroup, Inc., serves as the Trusts’ Sub-Administrator, subject to the general supervision of the Trusts’ Board of Trustees and HSBC. For these services, Citi Ohio is entitled to a fee, payable by HSBC, at an annual rate equivalent to the fee rates set forth above, minus 0.02% (2 basis points) which is retained by HSBC. |
| |
| Under a Compliance Services Agreement between the Trust and Citi Ohio (the “CCO Agreement”), Citi Ohio makes an employee available to serve as the Trusts’ Chief Compliance Officer (the “CCO”). Under the CCO Agreement, Citi Ohio also provides infrastructure and support in implementing the written policies and procedures comprising the Trusts’ compliance program, including support services to the CCO. For the services provided under the CCO Agreement, the HSBC Investor Family of Funds paid Citi Ohio $266,099 for the year ended October 31, 2009, plus reimbursement of certain out of pocket expenses. Expenses incurred by each fund are reflected on the Statements of Operations as “Compliance Service.” Citi Ohio pays the salary and other compensation earned by individuals performing these services, as employees of Citi Ohio. |
| |
| Distribution Arrangements: |
| |
| Foreside Distribution Services, L.P. (“Foreside”), a wholly-owned subsidiary of Foreside Financial Group LLC, serves the Trusts as Distributor (the “Distributor”). The Trusts have adopted a non-compensatory Distribution Plan and Agreement (the “Distribution Plan”) pursuant to Rule 12b-1 of the Act. The Distribution Plan provides for reimbursement of expenses incurred by the Distributor related to distribution and marketing, at a rate not to exceed 0.25%, 1.00%, and 1.00% of the average daily net assets of Class A Shares (currently not being charged), Class B Shares (currently charging |
| |
48 | HSBC INVESTOR FAMILY OF FUNDS |
|
HSBC INVESTOR FAMILY OF FUNDS |
|
Notes to Financial Statements—As of October 31, 2009 (continued) |
| |
| 0.75%), and Class C Shares (currently charging 0.75%) of the Funds, respectively. Foreside, as Distributor, also received $222,439, $151,254 and $10,302 in commissions from sales of HSBC Investor Family of Funds, for Class A Shares, Class B Shares, and Class C Shares, respectively of which $75, $12 and $0 were reallocated to HSBC-affiliated brokers and dealers, for Class A Shares, Class B Shares, and Class C Shares, respectively. |
| |
| Shareholder Servicing: |
| |
| The Trusts have adopted a Shareholder Services Plan, which provides for payments to shareholder servicing agents (which primarily consist of HSBC and its affiliates) for providing various shareholder services. For performing these services, the shareholder servicing agents receive a fee that is computed daily and paid monthly up to 0.25%, 0.25%, and 0.25% of the average daily net assets of Class A Shares, Class B Shares, and Class C Shares of the Funds, respectively. The aggregate fees paid to the Distributor pursuant to the Distribution Plan and to shareholder servicing agents pursuant to the Shareholder Services Plan currently are not intended to exceed 0.25% of the average daily net assets of Class A Shares and 1.00% of the average daily net assets of Class B Shares and Class C Shares. |
| |
| Fund Accounting, Transfer Agency and Trustees: |
| |
| Citi Ohio provides fund accounting and transfer agency services for each Fund. As transfer agent, Citi Ohio receives a fee based on the number of funds and shareholder accounts, subject to certain minimums and reimbursement of certain expenses. As fund accountant, Citi Ohio receives an annual fee per Fund and share class, subject to certain minimums and reimbursement of certain expenses. |
| |
| Each non-interested Trustee is compensated with a $60,000 annual Board retainer for service as a Trustee of the Trusts and Portfolio Trust, as well as a $3,000 annual retainer for each Committee of the Board of the Trusts and Portfolio Trust. Each non-interested Trustee also receives a $5,000 and $3,000 meeting fee for each regular in-person Board meeting and Committee meeting, respectively. Furthermore, each non-interested Trustee receives compensation for attending special meetings and/or functioning as a Committee or Board Chairperson. In addition, the non-interested Trustees are reimbursed for certain expenses incurred in connection with their Board membership. |
| |
| Fee Reductions: |
| |
| The Investment Adviser has agreed to contractually waive 0.05% of its management fee, computed daily and paid monthly, and based on the average daily net assets of the Mid-Cap Fund. |
| |
| The Investment Adviser has also agreed to contractually limit, through March 1, 2010, the total expenses, exclusive of interest, taxes, brokerage commissions and extraordinary expenses, of certain Funds. Each affected Fund Class has its own expense limitations based on the average daily net assets for any full fiscal year as follows: |
| | | | | |
| Fund | | Class | | Current Contractual
Expense
Limitation |
|
| |
| |
|
| Growth Fund | | A | | 1.20% |
| Growth Fund | | B | | 1.95% |
| Growth Fund | | C | | 1.95% |
| Growth Fund | | I | | 0.95% |
| Mid-Cap Fund | | A | | 1.35% |
| Mid-Cap Fund | | B | | 2.10% |
| Mid-Cap Fund | | C | | 2.10% |
| Mid-Cap Fund | | I | | 1.10% |
| Opportunity Fund | | A | | 1.65% |
| Opportunity Fund | | B | | 2.40% |
| Opportunity Fund | | C | | 2.40% |
| Overseas Equity Fund | | A | | 1.85% |
| Overseas Equity Fund | | B | | 2.60% |
| Overseas Equity Fund | | C | | 2.60% |
| Value Fund | | A | | 1.20% |
| Value Fund | | B | | 1.95% |
| Value Fund | | C | | 1.95% |
| Value Fund | | I | | 0.95% |
| |
HSBC INVESTOR FAMILY OF FUNDS | 49 |
|
HSBC INVESTOR FAMILY OF FUNDS |
|
Notes to Financial Statements—As of October 31, 2009 (continued) |
| |
| Any amounts contractually waived or reimbursed by the Investment Adviser will be subject to repayment by the Fund to the Investment Adviser within three years to the extent that the repayment will not cause the Fund’s operating expenses to exceed the contractual expense limit that was in effect at the time of such waiver or reimbursement. During the year ended October 31, 2009, the Investment Adviser did not recapture any of its prior contractual waivers or reimbursements. As of October 31, 2009, the repayments that may potentially be made by the Funds are as follows: |
| | | | | | | | |
| Fund | | 2012($) | | 2011($) | | 2010($) | |
|
| |
| |
| |
| |
| Growth Fund | | 56,048 | | 7,580 | | 8,757 | |
| Mid-Cap Fund | | 69,632 | | 35,881 | | 19,994 | |
| Opportunity Fund | | 65,792 | | — | | 18,813 | |
| Overseas Equity Fund | | 45,169 | | — | | — | |
| Value Fund | | 55,991 | | 13,116 | | 25,113 | |
| |
| The Administrator and Citi Ohio may voluntarily waive/reimburse fees to help support the expense limits of the Funds. In addition, the Investment Adviser may waive/reimburse additional fees at its discretion. Any voluntary fee waivers/reimbursements are not subject to recoupment in subsequent fiscal periods. Voluntary waivers/reimbursements may be stopped at any time. Amounts waived/reimbursed by the Investment Adviser, Administrator and Citi Ohio are reported separately on the Statements of Operations, as applicable. |
| |
5. | Investment Transactions: |
| |
| Purchases and sales of securities (excluding securities maturing less than one year from acquisition) for the year ended October 31, 2009 were as follows: |
| | | | | | | | |
| Fund | | Purchases | | Sales | |
|
| |
| |
| |
| Mid-Cap Fund | | $ | 5,996,184 | | $ | 10,712,437 | |
| |
| There were no long-term U.S. Government securities held during the year ended October 31, 2009. |
| |
| Contributions and withdrawals of the respective Portfolios for the year ended October 31, 2009 totaled: |
| | | | | | | | |
| Fund | | Contributions | | Withdrawals | |
|
| |
| |
| |
| Growth Fund | | $ | 2,570,019 | | $ | (12,753,241 | ) |
| International Equity Fund | | | 21,585,609 | | | (36,373,148 | ) |
| Opportunity Fund | | | 661,096 | | | (2,413,179 | ) |
| Opportunity Fund (Advisor) | | | 5,659,820 | | | (15,711,901 | ) |
| Overseas Equity Fund | | | 403,012 | | | (2,532,748 | ) |
| Value Fund | | | 2,145,552 | | | (9,561,191 | ) |
| |
6. | Federal Income Tax Information: |
| |
| At October 31, 2009, the cost basis for federal income tax purposes, gross unrealized appreciation, gross unrealized depreciation and net unrealized appreciation/depreciation were as follows: |
| | | | | | | | | | | | | | |
| Fund | | Tax Cost($) | | Tax Unrealized
Appreciation($) | | Tax Unrealized
Depreciation($) | | Net Unrealized
Appreciation
(Depreciation)($) | |
|
| |
| |
| |
| |
| |
| Mid-Cap Fund | | | 12,489,593 | | | 1,830,743 | | | (976,298 | ) | | 854,445 | |
| |
| The tax character of dividends paid by the Funds for the year ended of October 31, 2009 was as follows: |
| | | | | | | | | | | |
| | | Dividends paid from | | | | |
| | |
| | | | |
| | | Ordinary Income | | Net Long Term
Capital Gains | | Total
Dividends Paid* | |
| | |
| |
| |
| |
| Growth Fund | | $ | — | | $ | — | | $ | — | |
| International Equity Fund (Advisor) | | | 7,354,738 | | | 8,461,420 | | | 15,816,158 | |
| Mid-Cap Fund | | | — | | | 1,150,504 | | | 1,150,504 | |
| Opportunity Fund | | | — | | | 660,465 | | | 660,465 | |
| Opportunity Fund (Advisor) | | | — | | | 2,746,629 | | | 2,746,629 | |
| Overseas Equity Fund | | | 651,140 | | | 3,347,318 | | | 3,998,458 | |
| Value Fund | | | 390,433 | | | — | | | 390,433 | |
| |
50 | HSBC INVESTOR FAMILY OF FUNDS |
|
HSBC INVEST OR FAMILY OF FUNDS |
|
Notes to Financial Statements—As of October 31, 2009 (continued) |
| |
| The tax character of dividends paid by the Funds for the year ended of October 31, 2008 was as follows: |
| | | | | | | | | | |
| | Dividends paid from | | | |
| |
| | | |
| | Ordinary Income | | Net Long Term
Capital Gains | | Total
Dividends Paid* | |
| |
| |
| |
| |
Growth Fund | | $ | — | | $ | 2,892,355 | | $ | 2,892,355 | |
International Equity Fund (Advisor) | | | 10,817,657 | | | 24,126,978 | | | 34,944,635 | |
Mid-Cap Fund | | | — | | | 3,530,283 | | | 3,530,283 | |
Opportunity Fund | | | 1,084,594 | | | 4,960,716 | | | 6,045,310 | |
Opportunity Fund (Advisor) | | | 9,223,734 | | | 35,976,501 | | | 45,200,235 | |
Overseas Equity Fund | | | 562,242 | | | 2,487,633 | | | 3,049,875 | |
Value Fund | | | 868,977 | | | 4,085,539 | | | 4,954,516 | |
| |
|
* | Total dividends paid may differ from the amount reported in the Statements of Changes in Net Assets because dividends are recognized when actually paid for tax purposes. |
As of October 31, 2009, the components of accumulated earnings/(deficit) on a tax basis for the Funds were as follows:
| | | | | | | | | | | | | | | | | | | | | | |
| | Undistributed
Ordinary
Income | | Undistributed
Tax Exempt
Income | | Undistributed
Long Term
Capital Gains | | Accumulated
Earnings | | Accumulated
Capital and
Other Losses | | Total
Unrealized
Appreciation/
(Depreciation)(1) | | Accumulated
Earnings/
(Deficit) | |
| |
| |
| |
| |
| |
| |
| |
| |
Growth Fund | | $ | — | | $ | — | | $ | — | | $ | — | | $ | (11,630,969 | ) | $ | 6,193,161 | | $ | (5,437,808 | ) |
International Equity Fund (Advisor) | | | 2,365,154 | | | — | | | — | | | 2,365,154 | | | (59,383,976 | ) | | (10,552,398 | ) | | (67,571,220 | ) |
Mid-Cap Fund | | | 37,965 | | | — | | | — | | | 37,965 | | | (3,361,790 | ) | | 854,445 | | | (2,469,380 | ) |
Opportunity Fund | | | — | | | — | | | — | | | — | | | (1,305,884 | ) | | (152,375 | ) | | (1,458,259 | ) |
Opportunity Fund (Advisor) | | | — | | | — | | | — | | | — | | | (10,911,778 | ) | | (1,411,543 | ) | | (12,323,321 | ) |
Overseas Equity Fund | | | 108,816 | | | — | | | — | | | 108,816 | | | (2,368,405 | ) | | (357,941 | ) | | (2,617,530 | ) |
Value Fund | | | 14,848 | | | — | | | — | | | 14,848 | | | (6,016,194 | ) | | (2,368,011 | ) | | (8,369,357 | ) |
| |
|
(1) | The differences between book-basis and tax-basis unrealized appreciation/depreciation are attributable primarily to: tax deferral of losses on wash sales, the realization for tax purposes of unrealized gains/losses on certain derivative instruments, the realization for tax purposes of unrealized gains/losses on investments in passive foreign investment companies, and the return of capital adjustments from real estate investment trusts |
| |
| As of October 31, 2009, the following Funds have net capital loss carryforwards, which are available to offset future realized gains, if any, to the extent provided by the Treasury regulations. To the extent that these carryforwards are used to offset future capital gains, it is probable that the gains that are offset will not be distributed to shareholders. |
| | | | | | | |
Fund | | Amount | | Expires | |
| |
| |
| |
Growth Fund | | $ | 211,343 | | | 2016 | |
Growth Fund | | | 11,419,626 | | | 2017 | |
International Equity Fund | | | 59,383,976 | | | 2017 | |
Mid-Cap Fund | | | 3,361,790 | | | 2017 | |
Opportunity Fund | | | 1,305,884 | | | 2017 | |
Opportunity Fund (Advisor) | | | 10,911,778 | | | 2017 | |
Overseas Equity Fund | | | 2,368,405 | | | 2017 | |
Value Fund | | | 4,701,437 | | | 2016 | |
Value Fund | | | 1,314,757 | | | 2017 | |
| |
7. | Legal and Regulatory Matters: |
| |
| On September 26, 2006, BISYS Fund Services, Inc. (“BISYS”), an affiliate of BISYS Fund Services Ohio, Inc. which provided various services to the Funds, reached a settlement with the Securities and Exchange Commission (“the SEC”) regarding the SEC’s investigation related to BISYS’ past payment of certain marketing and other expenses with respect to certain of its mutual fund clients. Although BISYS has reached a settlement with the SEC, the Funds’ management is not aware that any determination has been made as to how the BISYS settlement monies will be distributed. While the Funds’ management is currently unable to determine the impact, if any, of such matters on the Funds or the Funds’ financial statements, management does not anticipate a material, adverse impact to the Funds or the Funds’ financial statements. |
| | |
| HSBC INVESTOR FAMILY OF FUNDS | 51 |
REPORT OF INDEPENDENT REGISTERED PUBLIC ACCOUNTING FIRM
To the Shareholders and Board of Trustees of
HSBC Investor Funds
HSBC Advisor Funds Trust:
We have audited the accompanying statements of assets and liabilities of HSBC Investor Growth Fund, HSBC Investor International Equity Fund, HSBC Investor Mid-Cap Fund, HSBC Investor Opportunity Fund, HSBC Investor Opportunity Fund (Advisor), HSBC Investor Overseas Equity Fund and HSBC Investor Value Fund (the Funds), including the schedule of portfolio investments of HSBC Investor Mid-Cap Fund as of October 31, 2009, and the related statements of operations for the year then ended, the statements of changes in net assets for each year in the two-year period then ended, and the financial highlights for each year in the five-year period then ended. These financial statements and financial highlights are the responsibility of the Funds’ management. Our responsibility is to express an opinion on these financial statements and financial highlights based on our audits.
We conducted our audits in accordance with the standards of the Public Company Accounting Oversight Board (United States). Those standards require that we plan and perform the audits to obtain reasonable assurance about whether the financial statements and financial highlights are free of material misstatement. An audit includes examining, on a test basis, evidence supporting the amounts and disclosures in the financial statements. Our procedures included confirmation of securities owned as of October 31, 2009, by correspondence with custodians and brokers or by other appropriate auditing procedures. An audit also includes assessing the accounting principles used and significant estimates made by management, as well as evaluating the overall financial statement presentation. We believe that our audits provide a reasonable basis for our opinion.
In our opinion, the financial statements and financial highlights referred to above present fairly, in all material respects, the financial position of the Funds as of October 31, 2009, the results of their operations for the year then ended, the changes in their net assets for each year in the two-year period then ended, and the financial highlights for each year in the five-year period then ended, in conformity with U.S. generally accepted accounting principles.

Columbus, Ohio
December 21, 2009
| | |
52 | HSBC INVESTOR FAMILY OF FUNDS | |
|
HSBC INVESTOR FAMILY OF FUNDS |
|
Other Federal Income Tax Information (Unaudited)—As of October 31, 2009 |
| |
| For the year ended October 31, 2009, the following percentages of the total ordinary income dividends paid by the Funds qualify for the corporate dividends received deduction available to corporate shareholders: |
| | | | |
Fund | | | Dividends
Received
Deduction | |
| | |
| |
Value Fund | | | 100.00 | % |
| |
| The International Equity Fund and the Overseas Equity Fund intend to elect to pass through to shareholders the income tax credit for taxes paid to foreign countries. Foreign source income and foreign tax expense per outstanding share on October 31, 2009 are as follows: |
| | | | | | | |
Fund | | Foreign
Source Income | | Foreign Tax
Expense | |
| |
| |
| |
International Equity Fund | | $ | 0.31 | | $ | 0.03 | |
Overseas Equity Fund | | $ | 0.12 | | $ | 0.01 | |
| |
| For the year ended October 31, 2009, dividends paid by the Funds may be subject to a maximum tax rate of 15%, as provided for by the Jobs and Growth Tax Relief Reconciliation Act of 2003. The Funds intend to designate the maximum amount allowable as taxed at a maximum rate of 15%. Complete information will be reported in conjunction with your 2009 Form 1099-DIV: |
| | | | |
Fund | | Qualified
Dividend
Income | |
| |
| |
International Equity Fund | | | 100.00 | % |
Overseas Equity Fund | | | 71.38 | % |
Value Fund | | | 100.00 | % |
| |
| During the year ended October 31, 2009, the following Funds declared net long-term capital gain distributions: |
| | | | |
Fund | | Amount | |
| |
| |
International Equity Fund | | $ | 8,461,420 | |
Mid-Cap Fund | | | 1,150,504 | |
Opportunity Fund | | | 660,465 | |
Opportunity Fund (Advisor) | | | 2,746,629 | |
Overseas Equity Fund | | | 3,347,318 | |
| |
| During the year ended October 31, 2009, the following Funds declared net short-term capital gain distributions: |
| | | | |
Fund | | Amount | |
| |
| |
Overseas Equity Fund | | $ | 211,428 | |
| | |
| HSBC INVESTOR FAMILY OF FUNDS | 53 |
|
HSBC INVESTOR FAMILY OF FUNDS |
|
Table of Shareholder Expenses—As of October 31, 2009 (Unaudited)
| |
| As a shareholder of the HSBC Investor Family of Funds (“Funds”), you incur two types of costs: (1) transaction costs, including sales charges (loads) on purchases, redemption fees and exchange fees, (2) ongoing costs, including management fees; distribution and /or shareholder servicing fees; and other Fund expenses. These examples are intended to help you understand your ongoing costs (in dollars) of investing in the Funds and to compare these cost with the ongoing costs of investing in other mutual funds. |
| |
| These examples are based on an investment of $1,000 invested at the beginning of the period and held for the entire period from May 1, 2009 through October 31, 2009. |
| |
| Actual Example |
| |
| The table below provides information about actual account values and actual expenses. You may use the information below, together with the amount you invested, to estimate the expenses that you paid over the period. Simply divide your account value by $1,000 (for example, an $8,600 account value divided by $1,000 = 8.6), then multiply the result by the number in the table under the heading entitled “Expenses Paid During Period” to estimate the expenses you paid on your account during this period. |
| | | | | | | | | | | | | | | | | | | | | |
| | | | Beginning
Account Value
5/1/09 | | Ending
Account
Value
10/31/09 | | Expenses Paid
During Period*
5/1/09 - 10/31/09 | | Annualized
Expense Ratio
During Period
5/1/09 - 10/31/09 | |
| | | |
| |
| |
| |
| |
Growth Fund | | Class A Shares | | | $ | 1,000.00 | | | | $ | 1,166.50 | | | | $ | 6.55 | | | 1.20 | % | |
| | Class B Shares | | | | 1,000.00 | | | | | 1,162.20 | | | | | 10.63 | | | 1.95 | % | |
| | Class C Shares | | | | 1,000.00 | | | | | 1,162.20 | | | | | 10.63 | | | 1.95 | % | |
| | Class I Shares | | | | 1,000.00 | | | | | 1,168.10 | | | | | 5.19 | | | 0.95 | % | |
International Equity Fund | | Class I Shares | | | | 1,000.00 | | | | | 1,337.70 | | | | | 5.42 | | | 0.92 | % | |
Mid-Cap Fund | | Class A Shares | | | | 1,000.00 | | | | | 1,183.30 | | | | | 7.43 | | | 1.35 | % | |
| | Class B Shares | | | | 1,000.00 | | | | | 1,177.40 | | | | | 11.53 | | | 2.10 | % | |
| | Class C Shares | | | | 1,000.00 | | | | | 1,177.70 | | | | | 11.53 | | | 2.10 | % | |
| | Class I Shares | | | | 1,000.00 | | | | | 1,184.20 | | | | | 6.06 | | | 1.10 | % | |
Opportunity Fund | | Class A Shares | | | | 1,000.00 | | | | | 1,196.20 | | | | | 8.58 | | | 1.55 | % | |
| | Class B Shares | | | | 1,000.00 | | | | | 1,190.70 | | | | | 12.70 | | | 2.30 | % | |
| | Class C Shares | | | | 1,000.00 | | | | | 1,190.80 | | | | | 12.70 | | | 2.30 | % | |
Opportunity Fund (Advisor) | | Class I Shares | | | | 1,000.00 | | | | | 1,199.30 | | | | | 5.49 | | | 0.99 | % | |
Overseas Equity Fund | | Class A Shares | | | | 1,000.00 | | | | | 1,301.60 | | | | | 9.86 | | | 1.70 | % | |
| | Class B Shares | | | | 1,000.00 | | | | | 1,296.00 | | | | | 14.18 | | | 2.45 | % | |
| | Class C Shares | | | | 1,000.00 | | | | | 1,296.70 | | | | | 14.18 | | | 2.45 | % | |
Value Fund | | Class A Shares | | | | 1,000.00 | | | | | 1,256.30 | | | | | 6.82 | | | 1.20 | % | |
| | Class B Shares | | | | 1,000.00 | | | | | 1,252.40 | | | | | 11.07 | | | 1.95 | % | |
| | Class C Shares | | | | 1,000.00 | | | | | 1,252.50 | | | | | 11.07 | | | 1.95 | % | |
| | Class I Shares | | | | 1,000.00 | | | | | 1,258.40 | | | | | 5.41 | | | 0.95 | % | |
| | |
| |
* | Expenses are equal to the average account value over the period multiplied by the Fund’s annualized expense ratio, multiplied by the number of days in the most recent fiscal half-year divided by the number of days in the fiscal year (to reflect the one half year period). |
| |
54 | HSBC INVESTOR FAMILY OF FUNDS |
|
HSBC INVESTOR FAMILY OF FUNDS |
|
Table of Shareholder Expenses—As of October 31, 2009 (Unaudited) (continued)
| |
| Hypothetical Example for Comparison Purposes |
| |
| The table below provides information about hypothetical account values and hypothetical expenses based on each Fund’s actual expense ratio and an assumed rate of return of 5% per year before expenses, which is not the Fund’s actual return. The hypothetical account values and expenses may not be used to estimate the actual ending account balance or expenses you paid for the period. You may use this information to compare this 5% hypothetical example with the 5% hypothetical examples that appear in the shareholder reports of other funds. |
| |
| Please note that the expenses shown in the table are meant to highlight your ongoing costs only and do not reflect any transactional costs, such as sales charges (loads), redemption fees, or exchange fees. Therefore, the table is useful in comparing ongoing costs only, and will not help you determine the relative total costs of owning different funds. In addition, if these transactional costs were included, your costs would have been higher. |
| | | | | | | | | | | | | | | | | | | | | |
| | | | Beginning
Account Value
5/1/09 | | Ending
Account
Value
10/31/09 | | Expenses Paid
During Period*
5/1/09 - 10/31/09 | | Annualized
Expense Ratio
During Period
5/1/09 - 10/31/09 | |
| | | |
| |
| |
| |
| |
Growth Fund | | Class A Shares | | | $ | 1,000.00 | | | | $ | 1,019.16 | | | | $ | 6.11 | | | 1.20 | % | |
| | Class B Shares | | | | 1,000.00 | | | | | 1,015.38 | | | | | 9.91 | | | 1.95 | % | |
| | Class C Shares | | | | 1,000.00 | | | | | 1,015.38 | | | | | 9.91 | | | 1.95 | % | |
| | Class I Shares | | | | 1,000.00 | | | | | 1,020.42 | | | | | 4.84 | | | 0.95 | % | |
International Equity Fund | | Class I Shares | | | | 1,000.00 | | | | | 1,020.57 | | | | | 4.69 | | | 0.92 | % | |
Mid-Cap Fund | | Class A Shares | | | | 1,000.00 | | | | | 1,018.40 | | | | | 6.87 | | | 1.35 | % | |
| | Class B Shares | | | | 1,000.00 | | | | | 1,014.62 | | | | | 10.66 | | | 2.10 | % | |
| | Class C Shares | | | | 1,000.00 | | | | | 1,014.62 | | | | | 10.66 | | | 2.10 | % | |
| | Class I Shares | | | | 1,000.00 | | | | | 1,019.66 | | | | | 5.60 | | | 1.10 | % | |
Opportunity Fund | | Class A Shares | | | | 1,000.00 | | | | | 1,017.39 | | | | | 7.88 | | | 1.55 | % | |
| | Class B Shares | | | | 1,000.00 | | | | | 1,013.61 | | | | | 11.67 | | | 2.30 | % | |
| | Class C Shares | | | | 1,000.00 | | | | | 1,013.61 | | | | | 11.67 | | | 2.30 | % | |
Opportunity Fund (Advisor) | | Class I Shares | | | | 1,000.00 | | | | | 1,020.21 | | | | | 5.04 | | | 0.99 | % | |
Overseas Equity Fund | | Class A Shares | | | | 1,000.00 | | | | | 1,016.64 | | | | | 8.64 | | | 1.70 | % | |
| | Class B Shares | | | | 1,000.00 | | | | | 1,012.85 | | | | | 12.43 | | | 2.45 | % | |
| | Class C Shares | | | | 1,000.00 | | | | | 1,012.85 | | | | | 12.43 | | | 2.45 | % | |
Value Fund | | Class A Shares | | | | 1,000.00 | | | | | 1,019.16 | | | | | 6.11 | | | 1.20 | % | |
| | Class B Shares | | | | 1,000.00 | | | | | 1,015.38 | | | | | 9.91 | | | 1.95 | % | |
| | Class C Shares | | | | 1,000.00 | | | | | 1,015.38 | | | | | 9.91 | | | 1.95 | % | |
| | Class I Shares | | | | 1,000.00 | | | | | 1,020.42 | | | | | 4.84 | | | 0.95 | % | |
| | |
| |
* | Expenses are equal to the average account value over the period multiplied by the Fund’s annualized expense ratio, multiplied by the number of days in the most recent fiscal half-year divided by the number of days in the fiscal year (to reflect the one half year period). |
| |
HSBC INVESTOR FAMILY OF FUNDS | 55 |
(This Page Intentionally Left Blank)
|
HSBC INVESTOR GROWTH PORTFOLIO |
|
Schedule of Portfolio Investments—As of October 31, 2009 |
| | | | | | | |
Common Stocks—96.6% | | | | | | | |
|
|
|
|
|
|
|
|
| | | | | |
| | Shares | | Value($) | |
| |
| |
| |
Aerospace & Defense – 2.3% | | | | | | | |
United Technologies Corp. | | | 33,100 | | | 2,033,995 | |
| | | | |
|
| |
Biotechnology – 1.5% | | | | | | | |
Gilead Sciences, Inc. (a) | | | 31,600 | | | 1,344,580 | |
| | | | |
|
| |
Business Services – 3.0% | | | | | | | |
Aecom Technology Corp. (a) | | | 26,100 | | | 658,764 | |
MasterCard, Inc., Class A | | | 9,000 | | | 1,971,180 | |
| | | | |
|
| |
| | | | | | 2,629,944 | |
| | | | |
|
| |
Chemicals – 1.2% | | | | | | | |
Monsanto Co. | | | 15,300 | | | 1,027,854 | |
| | | | |
|
| |
Computer Services – 4.7% | | | | | | | |
Accenture plc, Class A | | | 28,700 | | | 1,064,196 | |
Cognizant Technology Solutions Corp. (a) | | | 79,000 | | | 3,053,350 | |
| | | | |
|
| |
| | | | | | 4,117,546 | |
| | | | |
|
| |
Computer Software – 4.6% | | | | | | | |
Adobe Systems, Inc. (a) | | | 28,700 | | | 945,378 | |
Microsoft Corp. | | | 54,800 | | | 1,519,604 | |
Oracle Corp. | | | 77,100 | | | 1,626,810 | |
| | | | |
|
| |
| | | | | | 4,091,792 | |
| | | | |
|
| |
Computers – 8.4% | | | | | | | |
Apple, Inc. (a) | | | 18,900 | | | 3,562,650 | |
Hewlett-Packard Co. | | | 64,301 | | | 3,051,725 | |
International Business Machines Corp. | | | 6,800 | | | 820,148 | |
| | | | |
|
| |
| | | | | | 7,434,523 | |
| | | | |
|
| |
Consumer Products – 1.0% | | | | | | | |
Ecolab, Inc. | | | 19,100 | | | 839,636 | |
| | | | |
|
| |
Diversified Manufacturing Operations – 3.4% | | | | | | | |
Danaher Corp. | | | 31,200 | | | 2,128,776 | |
Fastenal Co. | | | 24,800 | | | 855,600 | |
| | | | |
|
| |
| | | | | | 2,984,376 | |
| | | | |
|
| |
Electronic Components & Semiconductors – 3.3% | | | | | | | |
First Solar, Inc. (a) | | | 5,800 | | | 707,194 | |
Lam Research Corp. (a) | | | 18,100 | | | 610,332 | |
Linear Technology Corp. | | | 27,400 | | | 709,112 | |
Marvell Technology Group Ltd. (a) | | | 61,100 | | | 838,292 | |
| | | | |
|
| |
| | | | | | 2,864,930 | |
| | | | |
|
| |
Financial Services – 13.1% | | | | | | | |
BlackRock, Inc. | | | 7,350 | | | 1,591,202 | |
Goldman Sachs Group, Inc. | | | 10,800 | | | 1,837,836 | |
IntercontinentalExchange, Inc. (a) | | | 8,300 | | | 831,577 | |
Invesco Ltd. | | | 20,900 | | | 442,035 | |
JP Morgan Chase & Co. | | | 58,600 | | | 2,447,722 | |
The Charles Schwab Corp. | | | 82,200 | | | 1,425,348 | |
Visa, Inc., Class A | | | 39,500 | | | 2,992,520 | |
| | | | |
|
| |
| | | | | | 11,568,240 | |
| | | | |
|
| |
| | | | | | | |
Common Stocks, continued | | | | | | | |
|
|
|
|
|
|
|
|
| | | | | | | |
| | Shares | | Value($) | |
| |
| |
| |
Health Care – 3.7% | | | | | | | |
Baxter International, Inc. | | | 28,700 | | | 1,551,522 | |
Celgene Corp. (a) | | | 16,600 | | | 847,430 | |
Mindray Medical International Ltd. ADR | | | 28,700 | | | 881,951 | |
| | | | |
|
| |
| | | | | | 3,280,903 | |
| | | | |
|
| |
Internet Related – 8.8% | | | | | | | |
eBay, Inc. (a) | | | 27,100 | | | 603,517 | |
Equinix, Inc. (a) | | | 16,200 | | | 1,382,184 | |
Google, Inc., Class A (a) | | | 6,600 | | | 3,538,392 | |
Priceline.com, Inc. (a) | | | 14,000 | | | 2,209,060 | |
| | | | |
|
| |
| | | | | | 7,733,153 | |
| | | | |
|
| |
Leisure – 0.9% | | | | | | | |
Carnival Corp. | | | 28,211 | | | 821,504 | |
| | | | |
|
| |
Metals & Mining – 1.7% | | | | | | | |
Freeport-McMoRan Copper & Gold, Inc. (a) | | | 12,000 | | | 880,320 | |
Peabody Energy Corp. | | | 15,900 | | | 629,481 | |
| | | | |
|
| |
| | | | | | 1,509,801 | |
| | | | |
|
| |
Oil & Gas – 8.0% | | | | | | | |
FMC Technologies, Inc. (a) | | | 14,800 | | | 778,480 | |
Petrohawk Energy Corp. (a) | | | 24,800 | | | 583,296 | |
Petroleo Brasileiro SA ADR | | | 22,200 | | | 1,026,084 | |
Southwestern Energy Co. (a) | | | 54,200 | | | 2,362,036 | |
Suncor Energy, Inc. | | | 50,836 | | | 1,678,605 | |
Weatherford International Ltd. (a) | | | 37,600 | | | 659,128 | |
| | | | |
|
| |
| | | | | | 7,087,629 | |
| | | | |
|
| |
Pharmaceuticals – 8.4% | | | | | | | |
CVS Caremark Corp. | | | 52,900 | | | 1,867,370 | |
Medco Health Solutions, Inc. (a) | | | 61,000 | | | 3,423,320 | |
Teva Pharmaceutical Industries Ltd. ADR | | | 42,000 | | | 2,120,160 | |
| | | | |
|
| |
| | | | | | 7,410,850 | |
| | | | |
|
| |
Retail – 6.6% | | | | | | | |
Amazon.com, Inc. (a) | | | 10,700 | | | 1,271,267 | |
Best Buy Co., Inc. | | | 21,000 | | | 801,780 | |
Costco Wholesale Corp. | | | 12,400 | | | 704,940 | |
Kohl’s Corp. (a) | | | 21,500 | | | 1,230,230 | |
O’Reilly Automotive, Inc. (a) | | | 22,900 | | | 853,712 | |
Target Corp. | | | 19,100 | | | 925,013 | |
| | | | |
|
| |
| | | | | | 5,786,942 | |
| | | | |
|
| |
Telecommunications – 8.6% | | | | | | | |
American Tower Corp., Class A (a) | | | 24,200 | | | 891,044 | |
Cisco Systems, Inc. (a) | | | 108,000 | | | 2,467,800 | |
Juniper Networks, Inc. (a) | | | 53,200 | | | 1,357,132 | |
QUALCOMM, Inc. | | | 70,100 | | | 2,902,841 | |
| | | | |
|
| |
| | | | | | 7,618,817 | |
| | | | |
|
| |
Transportation – 3.4% | | | | | | | |
C.H. Robinson Worldwide, Inc. | | | 14,000 | | | 771,540 | |
Union Pacific Corp. | | | 40,300 | | | 2,222,142 | |
| | | | |
|
| |
| | | | | | 2,993,682 | |
| | | | |
|
| |
TOTAL COMMON STOCKS
(COST $78,479,982) | | | | | | 85,180,697 | |
| | | | |
|
| |
| | |
See notes to financial statements. | HSBC INVESTOR PORTFOLIOS | 57 |
|
HSBC INVESTOR GROWTH PORTFOLIO |
|
Schedule of Portfolio Investments—As of October 31, 2009 (continued) |
| | | | | | | |
Investment Companies—3.6% | | | | | | | |
|
|
|
|
|
|
|
|
| | | | | | | |
| | Shares | | Value($) | |
| |
| |
| |
| | | | | | | |
Northern Institutional Diversified Assets
Portfolio, Shares Class, 0.09% (b) | | | 3,185,710 | | | 3,185,710 | |
| | | | |
|
| |
TOTAL INVESTMENT COMPANIES
(COST $3,185,710) | | | | | | 3,185,710 | |
| | | | |
|
| |
TOTAL INVESTMENTS
(COST $81,665,692) — 100.2% | | | | | | 88,366,407 | |
| | | | |
|
| |
| |
|
| Percentages indicated are based on net assets of $88,162,884. |
| |
(a) | Represents non-income producing security. |
| |
(b) | The rate represents the annualized one-day yield that was in effect on October 31, 2009. |
| |
ADR — | American Depositary Receipt |
plc — | Public Limited Company |
| | |
58 | HSBC INVESTOR PORTFOLIOS | See notes to financial statements. |
|
HSBC INVESTOR INTERNATIONAL EQUITY PORTFOLIO |
|
Schedule of Portfolio Investments—As of October 31, 2009 |
| | | | | | | |
Common Stocks—98.3% | | | | | | | |
|
|
|
|
|
|
|
|
| | | | | | | |
| | Shares | | Value($) | |
| |
| |
| |
Australia – 5.9% | | | | | | | |
Australia & New Zealand Banking
Group Ltd. | | | 165,400 | | | 3,372,607 | |
BHP Billiton Ltd. | | | 36,500 | | | 1,196,754 | |
Lend Lease Corp., Ltd. | | | 80,600 | | | 667,922 | |
Macquarie Group Ltd. | | | 18,300 | | | 801,246 | |
National Australia Bank Ltd. | | | 113,565 | | | 2,999,764 | |
Qantas Airways Ltd. | | | 412,833 | | | 1,026,229 | |
Tabcorp Holdings Ltd. | | | 206,100 | | | 1,314,370 | |
Telstra Corp. Ltd. | | | 513,500 | | | 1,525,516 | |
| | | | |
|
| |
| | | | | | 12,904,408 | |
| | | | |
|
| |
Belgium – 0.2% | | | | | | | |
Delhaize Group SA | | | 7,232 | | | 491,232 | |
| | | | |
|
| |
Brazil – 0.4% | | | | | | | |
Banco Do Brasil SA | | | 60,000 | | | 961,213 | |
| | | | |
|
| |
Canada – 3.9% | | | | | | | |
Fairfax Financial Holdings Ltd. | | | 2,200 | | | 787,164 | |
Industrial Alliance Insurance and Financial
Services, Inc. | | | 26,100 | | | 670,233 | |
National Bank of Canada | | | 26,600 | | | 1,386,554 | |
Nexen, Inc. | | | 40,662 | | | 875,034 | |
Royal Bank of Canada | | | 30,300 | | | 1,534,886 | |
Suncor Energy, Inc. | | | 62,428 | | | 2,072,854 | |
TELUS Corp. | | | 19,700 | | | 587,285 | |
WestJet Airlines Ltd. | | | 59,300 | | | 601,880 | |
| | | | |
|
| |
| | | | | | 8,515,890 | |
| | | | |
|
| |
Denmark – 0.9% | | | | | | | |
Danske Bank A/S (a) | | | 84,800 | | | 1,947,818 | |
| | | | |
|
| |
Finland – 1.4% | | | | | | | |
Nokia Oyj | | | 245,900 | | | 3,105,698 | |
| | | | |
|
| |
France – 14.5% | | | | | | | |
BNP Paribas SA | | | 60,698 | | | 4,572,160 | |
Casino Guichard-Perrachon SA | | | 17,000 | | | 1,350,705 | |
Compagnie de Saint-Gobain | | | 34,600 | | | 1,685,875 | |
Credit Agricole SA | | | 192,279 | | | 3,682,755 | |
Electricite de France | | | 42,900 | | | 2,390,810 | |
France Telecom SA | | | 113,600 | | | 2,814,576 | |
Lagardere S.C.A. | | | 46,400 | | | 2,096,106 | |
Renault SA (a) | | | 38,800 | | | 1,736,150 | |
Sanofi-Aventis | | | 52,700 | | | 3,862,624 | |
Societe Generale | | | 57,481 | | | 3,817,483 | |
Vallourec SA | | | 4,772 | | | 751,267 | |
Vivendi | | | 100,220 | | | 2,780,050 | |
| | | | |
|
| |
| | | | | | 31,540,561 | |
| | | | |
|
| |
Germany – 13.6% | | | | | | | |
Allianz SE | | | 27,200 | | | 3,115,448 | |
BASF AG | | | 64,800 | | | 3,487,389 | |
Bayer AG | | | 45,800 | | | 3,165,184 | |
Bayerische Motoren Werke AG | | | 32,200 | | | 1,571,934 | |
Deutsche Bank AG | | | 44,700 | | | 3,204,262 | |
Deutsche Post AG | | | 132,950 | | | 2,230,349 | |
Deutsche Telekom AG | | | 191,900 | | | 2,612,238 | |
E.ON AG | | | 91,100 | | | 3,480,332 | |
| | | | | | | |
Common Stocks, continued | | | | | | | |
|
|
|
|
|
|
|
|
| | | | | | | |
| | Shares | | Value($) | |
| |
| |
| |
Germany, continued | | | | | | | |
Fresenius Medical Care AG & Co. KGaA | | | 18,100 | | | 875,395 | |
Metro AG | | | 33,100 | | | 1,824,340 | |
Muenchener Rueckversicherungs-
Gesellschaft AG | | | 17,600 | | | 2,794,864 | |
RWE AG | | | 12,550 | | | 1,096,995 | |
| | | | |
|
| |
| | | | | | 29,458,730 | |
| | | | |
|
| |
Hong Kong – 0.7% | | | | | | | |
New World Development Co. Ltd. | | | 711,000 | | | 1,530,427 | |
| | | | |
|
| |
India – 0.7% | | | | | | | |
State Bank of India GDR | | | 17,600 | | | 1,607,489 | |
| | | | |
|
| |
Israel – 0.4% | | | | | | | |
Israel Chemicals Ltd. | | | 64,100 | | | 749,465 | |
| | | | |
|
| |
Italy – 5.7% | | | | | | | |
Enel SpA | | | 377,100 | | | 2,243,628 | |
ENI SpA | | | 139,700 | | | 3,459,561 | |
Intesa Sanpaolo SpA (a) | | | 228,900 | | | 963,222 | |
Telecom Italia RSP | | | 920,000 | | | 1,012,344 | |
Telecom Italia SpA | | | 1,289,400 | | | 2,048,172 | |
UniCredit SpA (a) | | | 797,400 | | | 2,671,179 | |
| | | | |
|
| |
| | | | | | 12,398,106 | |
| | | | |
|
| |
Japan – 11.9% | | | | | | | |
AEON Co. Ltd. | | | 81,200 | | | 724,378 | |
FUJITSU Ltd. | | | 9,000 | | | 53,008 | |
KDDI Corp. | | | 279 | | | 1,481,035 | |
Kyocera Corp. | | | 24,500 | | | 2,055,507 | |
Mitsubishi Chemical Holdings Corp. | | | 51,000 | | | 189,415 | |
Mitsubishi Corp. | | | 50,900 | | | 1,079,278 | |
Mitsui & Co., Ltd. | | | 149,000 | | | 1,957,136 | |
Mitsui Fudosan Co. Ltd. | | | 87,000 | | | 1,407,896 | |
NAMCO BANDAI Holdings, Inc. | | | 123,800 | | | 1,266,047 | |
Nippon Mining Holdings, Inc. | | | 187,000 | | | 834,386 | |
Nippon Telegraph & Telephone Corp. | | | 63,000 | | | 2,599,963 | |
Nissan Motor Co., Ltd. (a) | | | 371,400 | | | 2,687,952 | |
Sharp Corp. | | | 134,000 | | | 1,429,936 | |
Sony Corp. | | | 37,910 | | | 1,119,624 | |
Sumitomo Mitsui Financial Group, Inc. | | | 67,000 | | | 2,277,718 | |
Sumitomo Realty & Development Co. Ltd. | | | 27,000 | | | 512,043 | |
The Furukawa Electric Co. Ltd. | | | 123,000 | | | 466,554 | |
The Tokyo Electric Power Co., Inc. | | | 28,000 | | | 688,383 | |
Toshiba Corp. | | | 543,000 | | | 3,103,950 | |
| | | | |
|
| |
| | | | | | 25,934,209 | |
| | | | |
|
| |
Jersey – 1.0% | | | | | | | |
WPP plc | | | 242,600 | | | 2,173,839 | |
| | | | |
|
| |
Kazakhstan – 0.4% | | | | | | | |
KazMunaiGas Exploration Production GDR | | | 31,650 | | | 746,546 | |
| | | | |
|
| |
Netherlands – 2.4% | | | | | | | |
Koninklijke Ahold NV | | | 223,020 | | | 2,808,910 | |
Randstad Holding NV (a) | | | 60,700 | | | 2,302,866 | |
| | | | |
|
| |
| | | | | | 5,111,776 | |
| | | | |
|
| |
New Zealand – 0.4% | | | | | | | |
Telecom Corp. of New Zealand Ltd. | | | 456,800 | | | 830,588 | |
| | | | |
|
| |
| | |
See notes to financial statements. | HSBC INVESTOR PORTFOLIOS | 59 |
|
HSBC INVESTOR INTERNATIONAL EQUITY PORTFOLIO |
|
Schedule of Portfolio Investments—As of October 31, 2009 (continued) |
| | | | | | | |
Common Stocks, continued | | | | | | | |
|
|
|
|
|
|
|
|
| | | | | | | |
| | Shares | | Value($) | |
| |
| |
| |
Norway – 1.2% | | | | | | | |
StatoilHydro ASA | | | 110,400 | | | 2,602,669 | |
| | | | |
|
| |
Russian Federation – 0.9% | | | | | | | |
JSC MMC Norilsk Nickel ADR (a) | | | 67,789 | | | 890,512 | |
LUKOIL ADR | | | 16,550 | | | 960,093 | |
| | | | |
|
| |
| | | | | | 1,850,605 | |
| | | | |
|
| |
Singapore – 0.2% | | | | | | | |
Neptune Orient Lines Ltd. | | | 427,000 | | | 475,353 | |
| | | | |
|
| |
South Africa – 0.2% | | | | | | | |
Standard Bank Group Ltd. | | | 31,023 | | | 387,694 | |
| | | | |
|
| |
South Korea – 1.6% | | | | | | | |
Hynix Semiconductor, Inc. (a) | | | 40,400 | | | 599,978 | |
KB Financial Group, Inc. ADR (a) | | | 35,779 | | | 1,697,356 | |
Samsung Electronics Co., Ltd., Preferred | | | 2,900 | | | 1,162,058 | |
| | | | |
|
| |
| | | | | | 3,459,392 | |
| | | | |
|
| |
Spain – 4.1% | | | | | | | |
Banco Santander SA | | | 266,200 | | | 4,283,317 | |
Telefonica SA | | | 161,400 | | | 4,506,871 | |
| | | | |
|
| |
| | | | | | 8,790,188 | |
| | | | |
|
| |
Sweden – 2.3% | | | | | | | |
Electrolux AB, B Shares (a) | | | 35,300 | | | 846,372 | |
Ericsson LM, B Shares | | | 153,000 | | | 1,599,027 | |
Svenska Cellusoa AB (SCA), B Shares | | | 189,700 | | | 2,607,504 | |
| | | | |
|
| |
| | | | | | 5,052,903 | |
| | | | |
|
| |
Switzerland – 2.1% | | | | | | | |
Adecco SA, Registered | | | 28,300 | | | 1,264,938 | |
Novartis AG | | | 63,940 | | | 3,330,596 | |
| | | | |
|
| |
| | | | | | 4,595,534 | |
| | | | |
|
| |
Taiwan – 0.8% | | | | | | | |
AU Optronics Corp. | | | 1,134,030 | | | 1,005,822 | |
Compal Electronics, Inc. | | | 584,804 | | | 731,282 | |
| | | | |
|
| |
| | | | | | 1,737,104 | |
| | | | |
|
| |
Thailand – 0.4% | | | | | | | |
PTT Public Co., Ltd. | | | 121,400 | | | 859,954 | |
| | | | |
|
| |
Turkey – 0.5% | | | | | | | |
Turkiye Garanti Bankasi AS | | | 308,700 | | | 1,121,542 | |
| | | | |
|
| |
United Kingdom – 19.6% | | | | | | | |
Associated British Foods plc | | | 155,400 | | | 2,103,983 | |
AstraZeneca plc | | | 77,900 | | | 3,496,538 | |
Aviva plc | | | 343,791 | | | 2,149,466 | |
Barclays plc (a) | | | 366,500 | | | 1,920,573 | |
BP plc | | | 658,800 | | | 6,172,225 | |
BT Group plc | | | 500,700 | | | 1,072,820 | |
Centrica plc | | | 280,200 | | | 1,138,140 | |
Drax Group plc | | | 51,100 | | | 388,723 | |
GlaxoSmithKline plc | | | 213,800 | | | 4,384,974 | |
Old Mutual plc | | | 440,300 | | | 764,081 | |
Rolls-Royce Group plc | | | 289,600 | | | 2,135,435 | |
Royal Dutch Shell plc, A Shares | | | 200,987 | | | 5,958,380 | |
| | | | | | | |
Common Stocks, continued | | | | | | | |
|
|
|
|
|
|
|
|
| | | | | | | |
| | Shares | | Value($) | |
| |
| |
| |
United Kingdom, continued | | | | | | | |
RSA Insurance Group plc | | | 477,027 | | | 945,151 | |
Thomas Cook Group plc | | | 175,500 | | | 587,609 | |
Travis Perkins plc (a) | | | 65,900 | | | 812,840 | |
Tui Travel plc | | | 208,700 | | | 795,087 | |
Vodafone Group plc | | | 2,629,958 | | | 5,795,135 | |
Wolseley plc (a) | | | 96,200 | | | 1,945,650 | |
| | | | |
|
| |
| | | | | | 42,566,810 | |
| | | | |
|
| |
TOTAL COMMON STOCKS
(COST $225,303,826) | | | | | | 213,507,743 | |
| | | | |
|
| |
Rights—0.0% | | | | | | | |
|
|
|
|
|
|
|
|
Belgium – 0.0% | | | | | | | |
Fortis (a) | | | 121,532 | | | 0 | |
| | | | |
|
| |
Spain – 0.0% | | | | | | | |
Banco Santander SA (a) | | | 161,000 | | | 28,429 | |
| | | | |
|
| |
TOTAL RIGHTS
(COST $—) | | | | | | 28,429 | |
| | | | |
|
| |
Investment Companies—0.9% | | | | | | | |
|
|
|
|
|
|
|
|
Northern Institutional Diversified Assets
Portfolio, Shares Class, 0.09% (b) | | | 1,904,284 | | | 1,904,284 | |
| | | | |
|
| |
TOTAL INVESTMENT COMPANIES
(COST $1,904,284) | | | | | | 1,904,284 | |
| | | | |
|
| |
TOTAL INVESTMENTS
(COST $227,208,110) — 99.2% | | | | | | 215,440,456 | |
| | | | |
|
| |
| |
|
| Percentages indicated are based on net assets of $217,148,205. |
| |
(a) | Represents non-income producing security. |
| |
(b) | The rate represents the annualized one-day yield that was in effect on October 31, 2009. |
| |
ADR — American Depositary Receipt |
GDR — Global Depositary Receipt |
plc — Public Limited Company |
At October 31, 2009 the portfolio’s open foreign currency exchange contracts were as follows:
| | | | | | | | | | | | | |
Currency | | Delivery
Date | | Contract
Amount
(Local
Currency) | | Contract
Value
(U.S. Dollars)
($) | | Value
($) | | Unrealized
Appreciation/
(Depreciation)
($) | |
| |
| |
| |
| |
| |
| |
SHORT CONTRACTS | | | | | | | | | | | | |
Canadian Dollar | | 11/2/2009 | | 338,000 | | 315,122 | | 312,442 | | | 2,680 | | |
British Sterling Pound | | 11/3/2009 | | 189,000 | | 312,209 | | 310,145 | | | 2,064 | | |
| | | | | | | | | | |
| | |
| | | | | | | | | | | 4,744 | | |
| | | | | | | | | | |
| | |
LONG CONTRACTS | | | | | | | | | | | | |
European Euro | | 11/2/2009 | | 879,000 | | 1,303,469 | | 1,293,446 | | | (10,023 | ) | |
| | | | | | | | | | |
| | |
| | | | | | | | | | | (10,023 | ) | |
| | | | | | | | | | |
| | |
| | |
60 | HSBC INVESTOR PORTFOLIOS | See notes to financial statements. |
|
HSBC INVESTOR INTERNATIONAL EQUITY PORTFOLIO |
|
Schedule of Portfolio Investments—As of October 31, 2009 (continued) |
|
Schedule of Portfolio Investments—October 31, 2009 |
|
The Portfolio invested, as a percentage of net assets, in the following industries, as of October 31, 2009: |
| | | | |
Industry | | Percent of Net Assets | |
| |
| |
Aerospace/Defense | | 1.0 | % | |
Appliances | | 0.4 | % | |
Automotive | | 2.8 | % | |
Banking & Financial Services | | 23.6 | % | |
Building & Construction | | 2.0 | % | |
Cash & Cash Equivalents | | 0.9 | % | |
Chemicals | | 1.7 | % | |
Distribution | | 0.9 | % | |
Drugs - Medical | | 7.3 | % | |
Electrical | | 5.4 | % | |
Electronic Components & Semiconductors | | 3.1 | % | |
Food & Beverage | | 1.2 | % | |
Gambling and Entertainment | | 0.6 | % | |
Human Resources | | 1.6 | % | |
Import/Export | | 0.9 | % | |
Insurance | | 3.5 | % | |
Manufacturing | | 4.2 | % | |
Metals & Mining | | 1.3 | % | |
Multimedia | | 2.3 | % | |
Oil & Gas | | 11.8 | % | |
Publishing | | 1.0 | % | |
Real Estate | | 1.9 | % | |
Retail | | 3.5 | % | |
Telecommunications | | 14.6 | % | |
Transportation Services | | 1.7 | % | |
| |
|
| |
Total Investments | | 99.2 | % | |
| |
|
| |
| | | | | |
| | |
See notes to financial statements. | HSBC INVESTOR PORTFOLIOS | 61 |
|
HSBC INVESTOR OPPORTUNITY PORTFOLIO |
|
Schedule of Portfolio Investments—As of October 31, 2009 |
| | | | | | | |
Common Stocks—97.3% | |
|
|
| | | | | |
| | Shares | | Value($) | |
| |
| |
| |
Aerospace & Defense – 2.3% | | | | | | | |
BE Aerospace, Inc. (a) | | | 165,400 | | | 2,932,542 | |
| | | | |
|
| |
Biotechnology – 5.5% | | | | | | | |
Charles River Laboratories International,
Inc. (a) | | | 53,900 | | | 1,968,428 | |
Illumina, Inc. (a) | | | 83,350 | | | 2,675,535 | |
Life Technologies Corp. (a) | | | 54,100 | | | 2,551,897 | |
| | | | |
|
| |
| | | | | | 7,195,860 | |
| | | | |
|
| |
Business Services – 2.6% | | | | | | | |
MSCI, Inc., Class A (a) | | | 42,500 | | | 1,292,000 | |
Navigant Consulting, Inc. (a) | | | 143,750 | | | 2,047,000 | |
| | | | |
|
| |
| | | | | | 3,339,000 | |
| | | | |
|
| |
Chemicals – 1.7% | | | | | | | |
Celanese Corp., Series A | | | 79,100 | | | 2,171,295 | |
| | | | |
|
| |
Communications – 1.2% | | | | | | | |
Discovery Communications, Inc., Class A (a) | | | 57,000 | | | 1,567,500 | |
| | | | |
|
| |
Computer Software – 10.7% | | | | | | | |
ACI Worldwide, Inc. (a) | | | 3,050 | | | 49,075 | |
BMC Software, Inc. (a) | | | 40,650 | | | 1,510,554 | |
Check Point Software Technologies Ltd. (a) | | | 135,250 | | | 4,202,217 | |
Citrix Systems, Inc. (a) | | | 52,800 | | | 1,940,928 | |
Nuance Communications, Inc. (a) | | | 229,550 | | | 3,009,400 | |
Salesforce.com, Inc. (a) | | | 26,850 | | | 1,523,738 | |
VeriFone Holdings, Inc. (a) | | | 122,750 | | | 1,632,575 | |
| | | | |
|
| |
| | | | | | 13,868,487 | |
| | | | |
|
| |
Consumer Products – 5.3% | | | | | | | |
Church & Dwight Co., Inc. | | | 38,700 | | | 2,201,256 | |
Crown Holdings, Inc. (a) | | | 95,200 | | | 2,537,080 | |
Ralcorp Holdings, Inc. (a) | | | 40,400 | | | 2,169,480 | |
| | | | |
|
| |
| | | | | | 6,907,816 | |
| | | | |
|
| |
Diversified Manufacturing Operations – 4.3% | | | | | | | |
AMETEK, Inc. | | | 65,100 | | | 2,271,339 | |
Crane Co. | | | 50,800 | | | 1,414,780 | |
Joy Global, Inc. | | | 38,150 | | | 1,923,142 | |
| | | | |
|
| |
| | | | | | 5,609,261 | |
| | | | |
|
| |
Education – 1.5% | | | | | | | |
DeVry, Inc. | | | 35,950 | | | 1,987,676 | |
| | | | |
|
| |
Electronic Components & Semiconductors – 3.4% | | | | | | | |
Maxim Integrated Products, Inc. | | | 144,150 | | | 2,402,981 | |
Novellus Systems, Inc. (a) | | | 96,350 | | | 1,982,883 | |
| | | | |
|
| |
| | | | | | 4,385,864 | |
| | | | |
|
| |
Environmental Services – 2.1% | | | | | | | |
Stericycle, Inc. (a) | | | 38,700 | | | 2,026,719 | |
Waste Connections, Inc. (a) | | | 22,500 | | | 707,175 | |
| | | | |
|
| |
| | | | | | 2,733,894 | |
| | | | |
|
| |
Financial Services – 3.8% | | | | | | | |
First Horizon Natlional Corp. (a) | | | 191,193 | | | 2,261,808 | |
Knight Capital Group, Inc., Class A (a) | | | 31,400 | | | 529,090 | |
Waddell & Reed Financial, Inc., Class A | | | 78,700 | | | 2,208,322 | |
| | | | |
|
| |
| | | | | | 4,999,220 | |
| | | | |
|
| |
Gaming – 1.2% | | | | | | | |
Scientific Games Corp., Class A (a) | | | 109,400 | | | 1,539,258 | |
| | | | |
|
| |
Health Care – 6.5% | | | | | | | |
DaVita, Inc. (a) | | | 55,900 | | | 2,964,377 | |
IDEXX Laboratories, Inc. (a) | | | 60,400 | | | 3,087,648 | |
MEDNAX, Inc. (a) | | | 27,837 | | | 1,445,297 | |
Skilled Healthcare Group, Inc., Class A (a) | | | 118,900 | | | 955,956 | |
| | | | |
|
| |
| | | | | | 8,453,278 | |
| | | | |
|
| |
| | | | | | | |
Common Stocks, continued | |
|
|
| | Shares | | Value($) | |
| |
| |
| |
Industrial Manufacturing – 6.7% | | | | | | | |
IDEX Corp. | | | 86,700 | | | 2,464,881 | |
Mettler-Toledo International, Inc. (a) | | | 43,350 | | | 4,226,625 | |
WESCO International, Inc. (a) | | | 76,100 | | | 1,945,116 | |
| | | | |
|
| |
| | | | | | 8,636,622 | |
| | | | |
|
| |
Internet Related – 3.4% | | | | | | | |
Ctrip.com International Ltd. ADR (a) | | | 37,800 | | | 2,023,812 | |
Shanda Games Ltd. ADR (a) | | | 74,800 | | | 745,008 | |
VeriSign, Inc. (a) | | | 74,000 | | | 1,687,940 | |
| | | | |
|
| |
| | | | | | 4,456,760 | |
| | | | |
|
| |
Oil & Gas – 12.3% | | | | | | | |
Consol Energy, Inc. | | | 67,700 | | | 2,898,237 | |
Denbury Resources, Inc. (a) | | | 166,700 | | | 2,433,820 | |
ENSCO International, Inc. | | | 56,000 | | | 2,564,240 | |
EQT Corp. | | | 32,100 | | | 1,343,706 | |
Exterran Holdings, Inc. (a) | | | 116,200 | | | 2,373,966 | |
Massey Energy Co. | | | 147,650 | | | 4,295,138 | |
| | | | |
|
| |
| | | | | | 15,909,107 | |
| | | | |
|
| |
Pharmaceuticals – 10.5% | | | | | | | |
Alexion Pharmaceuticals, Inc. (a) | | | 105,750 | | | 4,696,357 | |
Elan Corp. plc ADR (a) | | | 314,200 | | | 1,712,390 | |
OSI Pharmaceuticals, Inc. (a) | | | 86,700 | | | 2,793,474 | |
Santarus, Inc. (a) | | | 210,100 | | | 649,209 | |
Shire plc ADR | | | 70,550 | | | 3,760,315 | |
| | | | |
|
| |
| | | | | | 13,611,745 | |
| | | | |
|
| |
Retail – 5.0% | | | | | | | |
American Eagle Outfitters, Inc. | | | 156,650 | | | 2,739,808 | |
Hibbett Sports, Inc. (a) | | | 95,350 | | | 1,786,859 | |
O’Reilly Automotive, Inc. (a) | | | 51,000 | | | 1,901,280 | |
| | | | |
|
| |
| | | | | | 6,427,947 | |
| | | | |
|
| |
Telecommunications – 5.8% | | | | | | | |
Alcatel-Lucent ADR (a) | | | 79,600 | | | 293,724 | |
Comverse Technology, Inc. (a) | | | 234,800 | | | 1,972,320 | |
NII Holdings, Inc. (a) | | | 106,500 | | | 2,868,045 | |
Polycom, Inc. (a) | | | 111,800 | | | 2,400,346 | |
| | | | |
|
| |
| | | | | | 7,534,435 | |
| | | | |
|
| |
Transportation – 1.5% | | | | | | | |
Landstar System, Inc. | | | 54,700 | | | 1,927,628 | |
| | | | |
|
| |
TOTAL COMMON STOCKS
(COST $125,012,335) | | | | | | 126,195,195 | |
| | | | |
|
| |
| | | | | | | |
Investment Companies—2.5% | |
|
|
Northern Institutional Government Select
Portfolio, 0.08%, Shares Class (b) | | | 3,270,825 | | | 3,270,825 | |
| | | | |
|
| |
TOTAL INVESTMENT COMPANIES
(COST $3,270,825) | | | | | | 3,270,825 | |
| | | | |
|
| |
TOTAL INVESTMENTS
(COST $128,283,160) — 99.8% | | | | | | 129,466,020 | |
| | | | |
|
| |
| | |
| |
| Percentages indicated are based on net assets of $129,748,321. |
| |
(a) | Represents non-income producing security. |
| |
(b) | The rate represents the annualized one-day yield that was in effect on October 31, 2009. |
| |
ADR | — American Depositary Receipt |
plc | — Public Limited Company |
| | |
62 | HSBC INVESTOR PORTFOLIOS | See notes to financial statements. |
|
HSBC INVESTOR VALUE PORTFOLIO |
|
Schedule of Portfolio Investments—As of October 31, 2009 |
| | | | | | | |
Common Stocks—97.7% | |
|
|
|
| | Shares | | Value($) | |
| |
| |
| |
Aerospace & Defense – 5.4% | | | | | | | |
Lockheed Martin Corp. | | | 20,300 | | | 1,396,437 | |
Raytheon Co. | | | 28,700 | | | 1,299,536 | |
| | | | |
|
| |
| | | | | | 2,695,973 | |
| | | | |
|
| |
Agricultural Chemicals – 1.1% | | | | | | | |
The Mosaic Co. | | | 11,500 | | | 537,395 | |
| | | | |
|
| |
Banking – 2.6% | | | | | | | |
Wells Fargo & Co. | | | 47,500 | | | 1,307,200 | |
| | | | |
|
| |
Business Services – 3.2% | | | | | | | |
Pitney Bowes, Inc. | | | 65,700 | | | 1,609,650 | |
| | | | |
|
| |
Computer Software – 7.5% | | | | | | | |
CA, Inc. | | | 115,600 | | | 2,418,352 | |
Microsoft Corp. | | | 46,900 | | | 1,300,537 | |
| | | | |
|
| |
| | | | | | 3,718,889 | |
| | | | |
|
| |
Conglomerates – 3.4% | | | | | | | |
Loews Corp. | | | 51,240 | | | 1,696,044 | |
| | | | |
|
| |
Consumer Products – 2.9% | | | | | | | |
Kimberly-Clark Corp. | | | 23,400 | | | 1,431,144 | |
| | | | |
|
| |
Diversified Manufacturing Operations – 1.7% | | | | | | | |
Ingersoll-Rand plc | | | 26,100 | | | 824,499 | |
| | | | |
|
| |
Energy – 3.2% | | | | | | | |
Halliburton Co. | | | 28,000 | | | 817,880 | |
NRG Energy, Inc. (a) | | | 33,800 | | | 777,062 | |
| | | | |
|
| |
| | | | | | 1,594,942 | |
| | | | |
|
| |
Financial Services – 2.5% | | | | | | | |
JP Morgan Chase & Co. | | | 29,650 | | | 1,238,481 | |
| | | | |
|
| |
Insurance – 10.4% | | | | | | | |
Aetna, Inc. | | | 20,800 | | | 541,424 | |
Aon Corp. | | | 29,100 | | | 1,120,641 | |
Genworth Financial, Inc., Class A (a) | | | 78,200 | | | 830,484 | |
MetLife, Inc. | | | 35,200 | | | 1,197,856 | |
The Hartford Financial Services Group, Inc. | | | 60,700 | | | 1,488,364 | |
| | | | |
|
| |
| | | | | | 5,178,769 | |
| | | | |
|
| |
Media – 6.9% | | | | | | | |
CBS Corp., Class B | | | 34,350 | | | 404,299 | |
Comcast Corp., Class A | | | 50,750 | | | 711,515 | |
Viacom, Inc., Class B (a) | | | 84,800 | | | 2,339,632 | |
| | | | |
|
| |
| | | | | | 3,455,446 | |
| | | | |
|
| |
Metals & Mining – 6.9% | | | | | | | |
AngloGold Ashanti Ltd. ADR | | | 40,727 | | | 1,528,892 | |
Barrick Gold Corp. | | | 52,600 | | | 1,889,918 | |
| | | | |
|
| |
| | | | | | 3,418,810 | |
| | | | |
|
| |
| | | | | | | |
Common Stocks, continued | |
|
|
|
| | Shares | | Value($) | |
| |
| |
| |
Oil & Gas – 14.9% | | | | | | | |
Apache Corp. | | | 23,800 | | | 2,240,056 | |
ConocoPhillips | | | 9,571 | | | 480,273 | |
EOG Resources, Inc. | | | 9,075 | | | 741,064 | |
Hess Corp. | | | 12,100 | | | 662,354 | |
Noble Energy, Inc. | | | 35,900 | | | 2,356,117 | |
Talisman Energy, Inc. | | | 55,200 | | | 936,744 | |
| | | | |
|
| |
| | | | | | 7,416,608 | |
| | | | |
|
| |
Pharmaceuticals – 11.2% | | | | | | | |
Amgen, Inc. (a) | | | 35,500 | | | 1,907,415 | |
CVS Caremark Corp. | | | 30,700 | | | 1,083,710 | |
Merck & Co., Inc. | | | 40,800 | | | 1,261,944 | |
Sanofi-Aventis ADR | | | 36,200 | | | 1,336,504 | |
| | | | |
|
| |
| | | | | | 5,589,573 | |
| | | | |
|
| |
Retail – 1.1% | | | | | | | |
Kroger Co. (The) | | | 23,000 | | | 531,990 | |
| | | | |
|
| |
Telecommunications – 8.4% | | | | | | | |
AT&T, Inc. | | | 31,500 | | | 808,605 | |
Motorola, Inc. | | | 303,000 | | | 2,596,710 | |
Verizon Communications, Inc. | | | 25,800 | | | 763,422 | |
| | | | |
|
| |
| | | | | | 4,168,737 | |
| | | | |
|
| |
Tobacco – 2.5% | | | | | | | |
Philip Morris International, Inc. | | | 25,900 | | | 1,226,624 | |
| | | | |
|
| |
Transportation – 1.9% | | | | | | | |
Union Pacific Corp. | | | 16,800 | | | 926,352 | |
| | | | |
|
| |
TOTAL COMMON STOCKS
(COST $52,166,129) | | | | | | 48,567,126 | |
| | | | |
|
| |
| | | | | | | |
Investment Companies—2.9% | |
|
|
Northern Institutional Government Select
Portfolio, 0.08%, Shares Class (b) | | | 1,417,909 | | | 1,417,909 | |
| | | | |
|
| |
TOTAL INVESTMENT COMPANIES
(COST $1,417,909) | | | | | | 1,417,909 | |
| | | | |
|
| |
TOTAL INVESTMENTS
(COST $53,584,038) — 100.6% | | | | | | 49,985,035 | |
| | | | |
|
| |
| | |
| |
| Percentages indicated are based on net assets of $49,686,156. |
| |
(a) | Represents non-income producing security. |
| |
(b) | The rate represents the annualized one-day yield that was in effect on October 31, 2009. |
| |
ADR | — American Depositary Receipt |
plc | — Public Limited Company |
| | |
See notes to financial statements. | HSBC INVESTOR PORTFOLIOS | 63 |
HSBC INVESTOR PORTFOLIOS
Statements of Assets and Liabilities—As of October 31, 2009
| | | | | | | | | | | | | |
| | Growth
Portfolio | | International
Equity
Portfolio | | Opportunity
Portfolio | | Value
Portfolio | |
|
Assets: | | | | | | | | | | | | | |
Investments in non-affiliates, at value | | $ | 88,366,407 | | $ | 215,440,456 | | $ | 129,466,020 | | $ | 49,985,035 | |
Cash | | | 2,960 | | | — | | | — | | | 1,483 | |
Foreign currency, at value | | | — | | | 1,665,361 | | | — | | | — | |
Unrealized appreciation on foreign currency exchange contracts | | | — | | | 4,744 | | | — | | | — | |
Dividends receivable | | | 42,742 | | | 381,813 | | | 20,769 | | | 49,207 | |
Receivable for investments sold | | | 1,670,744 | | | 1,453,006 | | | 369,343 | | | — | |
Prepaid expenses and other assets | | | 419 | | | 15,196 | | | 1,614 | | | 274 | |
| |
|
| |
|
| |
|
| |
|
| |
Total Assets | | | 90,083,272 | | | 218,960,576 | | | 129,857,746 | | | 50,035,999 | |
| |
|
| |
|
| |
|
| |
|
| |
| | | | | | | | | | | | | |
Liabilities: | | | | | | | | | | | | | |
Unrealized depreciation on foreign currency exchange contracts | | | — | | | 10,023 | | | — | | | — | |
Payable for investments purchased | | | 1,863,842 | | | 1,640,608 | | | — | | | 320,029 | |
Accrued expenses and other liabilities: | | | | | | | | | | | | | |
Investment Management | | | 44,820 | | | 132,653 | | | 92,353 | | | 23,381 | |
Administration | | | 1,513 | | | 3,727 | | | 2,231 | | | 863 | |
Compliance Services | | | 34 | | | 420 | | | 52 | | | 20 | |
Trustee | | | 172 | | | 447 | | | 259 | | | 95 | |
Other | | | 10,007 | | | 24,493 | | | 14,530 | | | 5,455 | |
| |
|
| |
|
| |
|
| |
|
| |
Total Liabilities | | | 1,920,388 | | | 1,812,371 | | | 109,425 | | | 349,843 | |
| |
|
| |
|
| |
|
| |
|
| |
Applicable to investors’ beneficial interest | | $ | 88,162,884 | | $ | 217,148,205 | | $ | 129,748,321 | | $ | 49,686,156 | |
| |
|
| |
|
| |
|
| |
|
| |
Total Investments, at cost | | $ | 81,665,692 | | $ | 227,208,110 | | $ | 128,283,160 | | $ | 53,584,038 | |
| |
|
| |
|
| |
|
| |
|
| |
Foreign currency, at cost | | $ | — | | $ | 1,659,697 | | $ | — | | $ | — | |
| |
|
| |
|
| |
|
| |
|
| |
| | |
64 | HSBC INVESTOR PORTFOLIOS | See notes to financial statements. |
HSBC INVESTOR PORTFOLIOS
Statements of Operations—For the year ended October 31, 2009
| | | | | | | | | | | | | |
| | Growth
Portfolio | | International
Equity
Portfolio | | Opportunity
Portfolio | | Value
Portfolio | |
|
Investment Income: | | | | | | | | | | | | | |
Dividends | | $ | 685,582 | | $ | 6,577,804 | | $ | 604,370 | | $ | 955,557 | |
Foreign tax withholding | | | (284 | ) | | (914,469 | ) | | — | | | — | |
| |
|
| |
|
| |
|
| |
|
| |
Total Investment Income (Loss) | | | 685,298 | | | 5,663,335 | | | 604,370 | | | 955,557 | |
| |
|
| |
|
| |
|
| |
|
| |
| | | | | | | | | | | | | |
Expenses: | | | | | | | | | | | | | |
Investment Management | | | 456,575 | | | 1,287,301 | | | 916,022 | | | 240,377 | |
Administration | | | 15,595 | | | 35,816 | | | 22,518 | | | 9,009 | |
Accounting | | | 45,227 | | | 85,202 | | | 44,830 | | | 44,405 | |
Compliance Services | | | 377 | | | 867 | | | 524 | | | 210 | |
Custodian | | | 7,191 | | | 136,502 | | | 12,818 | | | 2,636 | |
Printing | | | 3,121 | | | 2,175 | | | 19 | | | 2,216 | |
Professional | | | 2,406 | | | 3,808 | | | 2,406 | | | 1,067 | |
Trustee | | | 1,195 | | | 2,739 | | | 1,722 | | | 667 | |
Other | | | 17,325 | | | 45,881 | | | 27,589 | | | 10,426 | |
| |
|
| |
|
| |
|
| |
|
| |
Total Expenses | | | 549,012 | | | 1,600,291 | | | 1,028,448 | | | 311,013 | |
| |
|
| |
|
| |
|
| |
|
| |
| | | | | | | | | | | | | |
Net Investment Income (Loss) | | | 136,286 | | | 4,063,044 | | | (424,078 | ) | | 644,544 | |
| |
|
| |
|
| |
|
| |
|
| |
| | | | | | | | | | | | | |
Net Realized/Unrealized Gains (Losses) from Investments: | | | | | | | | | | | | | |
Net realized gains (losses) from investment and foreign currency transactions | | | (12,681,042 | ) | | (72,712,532 | ) | | (15,580,861 | ) | | (1,577,886 | ) |
Change in unrealized appreciation/depreciation from investments and foreign currencies | | | 26,751,782 | | | 109,291,830 | | | 31,798,950 | | | 9,018,297 | |
| |
|
| |
|
| |
|
| |
|
| |
| | | | | | | | | | | | | |
Net realized/unrealized gains/(losses) from investments and foreign currency transactions | | | 14,070,740 | | | 36,579,298 | | | 16,218,089 | | | 7,440,411 | |
| |
|
| |
|
| |
|
| |
|
| |
Change In Net Assets Resulting From Operations | | $ | 14,207,026 | | $ | 40,642,342 | | $ | 15,794,011 | | $ | 8,084,955 | |
| |
|
| |
|
| |
|
| |
|
| |
| | |
See notes to financial statements. | HSBC INVESTOR PORTFOLIOS | 65 |
HSBC INVESTOR PORTFOLIOS
Statements of Changes in Net Assets
| | | | | | | | | | | | | |
| | Growth
Portfolio | | International Equity
Portfolio | |
|
| | For the
year ended
October 31,
2009 | | For the
year ended
October 31,
2008 | | For the
year ended
October 31,
2009 | | For the
year ended
October 31,
2008 | |
|
Investment Activities: | | | | | | | | | | | | | |
Operations: | | | | | | | | | | | | | |
Net investment income (loss) | | $ | 136,286 | | $ | 158,253 | | $ | 4,063,044 | | $ | 9,312,232 | |
Net realized gains (losses) from investment transactions | | | (12,681,042 | ) | | (80,608 | ) | | (72,712,532 | ) | | 10,348,234 | |
Change in unrealized appreciation/depreciation from investment and foreign currencies | | | 26,751,782 | | | (42,269,939 | ) | | 109,291,830 | | | (242,760,619 | ) |
| |
|
| |
|
| |
|
| |
|
| |
Change in net assets resulting from operations | | | 14,207,026 | | | (42,192,294 | ) | | 40,642,342 | | | (223,100,153 | ) |
| |
|
| |
|
| |
|
| |
|
| |
Proceeds from contributions | | | 8,763,453 | | | 50,198,227 | | | 23,984,676 | | | 43,694,202 | |
Value of withdrawals | | | (16,749,107 | ) | | (15,750,298 | ) | | (46,787,723 | ) | | (76,346,748 | ) |
| |
|
| |
|
| |
|
| |
|
| |
Change in net assets resulting from transactions in investors’ beneficial interest | | | (7,985,654 | ) | | 34,447,929 | | | (22,803,047 | ) | | (32,652,546 | ) |
| |
|
| |
|
| |
|
| |
|
| |
Change in net assets | | | 6,221,372 | | | (7,744,365 | ) | | 17,839,295 | | | (255,752,699 | ) |
| | | | | | | | | | | | | |
Net Assets: | | | | | | | | | | | | | |
Beginning of period | | | 81,941,512 | | | 89,685,877 | | | 199,308,910 | | | 455,061,609 | |
| |
|
| |
|
| |
|
| |
|
| |
End of period | | $ | 88,162,884 | | $ | 81,941,512 | | $ | 217,148,205 | | $ | 199,308,910 | |
| |
|
| |
|
| |
|
| |
|
| |
| | |
66 | HSBC INVESTOR PORTFOLIOS | See notes to financial statements. |
HSBC INVESTOR PORTFOLIOS
Statements of Changes in Net Assets (continued)
| | | | | | | | | | | | | |
| | Opportunity
Portfolio | | Value
Portfolio | |
|
| | For the
year ended
October 31,
2009 | | For the
year ended
October 31,
2008 | | For the
year ended
October 31,
2009 | | For the
year ended
October 31,
2008 | |
|
Investment Activities: | | | | | | | | | | | | | |
Operations: | | | | | | | | | | | | | |
Net investment income (loss) | | $ | (424,078 | ) | $ | (854,296 | ) | $ | 644,544 | | $ | 1,062,396 | |
Net realized gains (losses) from investment transactions | | | (15,580,861 | ) | | 2,354,698 | | | (1,577,886 | ) | | (7,776,127 | ) |
Change in unrealized appreciation/depreciation from investment and foreign currencies | | | 31,798,950 | | | (73,360,727 | ) | | 9,018,297 | | | (25,258,253 | ) |
| |
|
| |
|
| |
|
| |
|
| |
| | | | | | | | | | | | | |
Change in net assets resulting from operations | | | 15,794,011 | | | (71,860,325 | ) | | 8,084,955 | | | (31,971,984 | ) |
| |
|
| |
|
| |
|
| |
|
| |
Proceeds from contributions | | | 8,367,302 | | | 20,402,348 | | | 4,852,585 | | | 12,224,588 | |
Value of withdrawals | | | (22,382,631 | ) | | (44,840,850 | ) | | (12,914,556 | ) | | (13,247,672 | ) |
| |
|
| |
|
| |
|
| |
|
| |
Change in net assets resulting from transactions in investors’ beneficial interest | | | (14,015,329 | ) | | (24,438,502 | ) | | (8,061,971 | ) | | (1,023,084 | ) |
| |
|
| |
|
| |
|
| |
|
| |
Change in net assets | | | 1,778,682 | | | (96,298,827 | ) | | 22,984 | | | (32,995,068 | ) |
| | | | | | | | | | | | | |
Net Assets: | | | | | | | | | | | | | |
Beginning of period | | | 127,969,639 | | | 224,268,466 | | | 49,663,172 | | | 82,658,240 | |
| |
|
| |
|
| |
|
| |
|
| |
End of period | | $ | 129,748,321 | | $ | 127,969,639 | | $ | 49,686,156 | | $ | 49,663,172 | |
| |
|
| |
|
| |
|
| |
|
| |
| | |
See notes to financial statements. | HSBC INVESTOR PORTFOLIOS | 67 |
|
HSBC INVESTOR PORTFOLIOS |
|
Financial Highlights |
| | | | | | | | | | | | | | | | | | | | | |
| | | | Ratio/Supplementary Data | |
| | | |
| |
| | Total
Return | | Net Assets
at End of
Period
(000’s) | | Ratio of Net
Expenses
to Average
Net Assets | | Ratio of Net
Investment
Income (Loss)
to Average
Net Assets | | Ratio of
Expenses
to Average
Net Assets(a) | | Portfolio
Turnover
Rate | |
|
|
|
|
|
|
|
|
|
|
|
|
|
|
GROWTH PORTFOLIO | | | | | | | | | | | | | | | | | | | |
Year Ended October 31, 2005 | | 13.59 | %(b) | | | $ | 49,415 | | | 0.63 | %(b) | | 0.77 | %(b) | | 0.68 | % | | 79.54 | % | |
Year Ended October 31, 2006 | | 7.53 | % | | | $ | 59,828 | | | 0.69 | % | | 0.38 | % | | 0.69 | % | | 75.06 | % | |
Year Ended October 31, 2007 | | 31.11 | % | | | $ | 89,686 | | | 0.62 | % | | 0.45 | % | | 0.62 | % | | 57.04 | % | |
Year Ended October 31, 2008 | | (37.75 | )%(c) | | | $ | 81,942 | | | 0.62 | % | | 0.19 | % | | 0.62 | % | | 157.87 | % | |
Year Ended October 31, 2009 | | 19.31 | % | | | $ | 88,163 | | | 0.69 | % | | 0.17 | % | | 0.69 | % | | 65.67 | % | |
|
|
|
|
|
|
|
|
|
|
|
|
|
|
|
|
|
|
|
|
|
|
INTERNATIONAL PORTFOLIO | | | | | | | | | | | | | | | | | | | | |
Year Ended October 31, 2005 | | 19.54 | % | | | $ | 230,230 | | | 0.84 | % | | 1.92 | % | | 0.84 | % | | 31.32 | % | |
Year Ended October 31, 2006 | | 32.79 | % | | | $ | 333,755 | | | 0.86 | % | | 2.03 | % | | 0.86 | % | | 33.39 | % | |
Year Ended October 31, 2007 | | 25.17 | % | | | $ | 455,062 | | | 0.79 | % | | 2.16 | % | | 0.79 | % | | 26.08 | % | |
Year Ended October 31, 2008 | | (51.79 | )% | | | $ | 199,309 | | | 0.76 | % | | 2.65 | % | | 0.76 | % | | 28.98 | % | |
Year Ended October 31, 2009 | | 24.16 | % | | | $ | 217,148 | | | 0.88 | % | | 2.23 | % | | 0.88 | % | | 58.31 | % | |
|
|
|
|
|
|
|
|
|
|
|
|
|
|
|
|
|
|
|
|
|
|
OPPORTUNITY PORTFOLIO | | | | | | | | | | | | | | | | | | | | | |
Year Ended October 31, 2005 | | 14.35 | %(b) | | | $ | 218,778 | | | 0.85 | %(b) | | (0.45 | )%(b) | | 0.90 | % | | 63.95 | % | |
Year Ended October 31, 2006 | | 19.54 | % | | | $ | 241,495 | | | 0.91 | % | | (0.40 | )% | | 0.91 | % | | 60.83 | % | |
Year Ended October 31, 2007 | | 30.54 | % | | | $ | 224,268 | | | 0.91 | % | | (0.55 | )% | | 0.91 | % | | 69.41 | % | |
Year Ended October 31, 2008 | | (35.30 | )% | | | $ | 127,970 | | | 0.87 | % | | (0.46 | )% | | 0.87 | % | | 80.42 | % | |
Year Ended October 31, 2009 | | 15.41 | % | | | $ | 129,748 | | | 0.90 | % | | (0.37 | )% | | 0.90 | % | | 64.91 | % | |
|
|
|
|
|
|
|
|
|
|
|
|
|
|
|
|
|
|
|
|
|
|
VALUE PORTFOLIO | | | | | | | | | | | | | | | | | | | | | |
Year Ended October 31, 2005 | | 15.23 | %(b) | | | $ | 54,150 | | | 0.64 | %(b) | | 1.15 | %(b) | | 0.69 | % | | 16.45 | % | |
Year Ended October 31, 2006 | | 22.21 | % | | | $ | 67,432 | | | 0.71 | % | | 1.23 | % | | 0.71 | % | | 20.63 | % | |
Year Ended October 31, 2007 | | 10.28 | % | | | $ | 82,658 | | | 0.66 | % | | 1.29 | % | | 0.66 | % | | 18.67 | % | |
Year Ended October 31, 2008 | | (39.91 | )% | | | $ | 49,663 | | | 0.64 | % | | 1.54 | % | | 0.64 | % | | 24.61 | % | |
Year Ended October 31, 2009 | | 20.05 | % | | | $ | 49,686 | | | 0.68 | % | | 1.41 | % | | 0.68 | % | | 19.77 | % | |
|
|
|
|
|
|
|
|
|
|
|
|
|
|
|
|
|
|
|
|
|
|
| |
(a) | During the period, certain fees were reduced. If such fee reductions had not occurred, the ratio would have been as indicated. |
| |
(b) | During the year ended October 31, 2005, HSBC reimbursed certain amounts to the Portfolios related to violations of certain investment policies and limitations. The corresponding impact to the net expense ratio, net income ratio and total return were 0.05%, 0.04% and 0.05% for the Growth Portfolio, Opportunity Portfolio and Value Portfolio, respectively. |
| |
(c) | During the year ended October 31, 2008, Winslow Capital Management, Inc. reimbursed $64,658 to the Growth Portfolio related to violations of certain investment policies and limitations. The corresponding impact to the total return was 0.08%. |
| | |
68 | HSBC INVESTOR PORTFOLIOS | See notes to financial statements. |
|
HSBC INVESTOR PORTFOLIOS |
|
Notes to Financial Statements—As of October 31, 2009 |
| |
1. | Organization: |
| |
| The HSBC Investor Portfolios (the “Portfolio Trust”), is an open-end management investment company organized as a New York trust under the laws of the State of New York on November 1, 1994. The Portfolio Trust contains the following master funds (individually a “Portfolio,” collectively the “Portfolios”): |
| | | |
| Portfolio | | Short Name |
|
| |
|
| HSBC Investor Growth Portfolio | | Growth Portfolio |
| HSBC Investor International Equity Portfolio | | International Equity Portfolio |
| HSBC Investor Opportunity Portfolio | | Opportunity Portfolio |
| HSBC Investor Value Portfolio | | Value Portfolio |
| |
| The Portfolios operate as master funds in master-feeder arrangements, in which other funds invest all or part of their investable assets in the Portfolios. The Portfolios also receive investments from funds of funds. The Declaration of Trust permits the Board of Trustees to issue an unlimited number of beneficial interests in the Portfolios. |
| |
| The Portfolios are diversified series of the Portfolio Trust and are part of the HSBC Investor Family of Funds. Financial statements for all other funds of the HSBC Investor Family of Funds are published separately. |
| |
| Under the Portfolio Trust’s organizational documents, the Portfolio Trust’s Officers and Trustees are indemnified against certain liabilities arising out of the performance of their duties to the Portfolios. In addition, in the normal course of business, the Portfolio Trust may enter into contracts with its service providers, which also provide for indemnifications by the Portfolios. The Portfolios’ maximum exposure under these arrangements is unknown as this would involve any future claims that may be made against the Portfolios. However, based on experience, the Portfolio Trust expects that risk of loss to be remote. |
| |
2. | Significant Accounting Policies: |
| |
| The following is a summary of the significant accounting policies followed by the Portfolios in the preparation of their financial statements. The policies are in conformity with U.S. generally accepted accounting principles (“GAAP”). The preparation of financial statements requires management to make certain estimates and assumptions that affect the reported amounts of assets and liabilities and disclosure of contingent assets and liabilities at the date of the financial statements and the reported amounts of increases and decreases in net assets from operations during the reporting period. Actual results could differ from those estimates. Management has evaluated events and transactions through December 21, 2009, the date the financial statements were issued, for purposes of recognition or disclosure in these financial statements and there are no subsequent events to report. |
| |
| Securities Valuation: |
|
| The Portfolios record their investments at fair value. Fair value is defined as the price that would be received to sell an asset or paid to transfer a liability in an orderly transaction between market participants at the measurement date. The valuation techniques used to determine fair value are further described below. |
| |
| Bonds and other fixed income securities (other than short-term obligations but including listed issues) are valued on the basis of valuations furnished by a pricing service, the use of which has been approved by the Portfolio Trust’s Board of Trustees. In making such valuations, the pricing service utilizes both dealer-supplied valuations and the use of matrix techniques which take into account appropriate factors such as institutional-size trading in similar groups of securities, yield, quality, coupon rate, maturity, type of issue, trading characteristics other than market data and without exclusive reliance upon quoted prices or exchanges or over-the-counter prices, since such valuations are believed to reflect more accurately the fair value of such securities. |
| |
| The value of each equity security is based either on the last sale price on a national securities exchange, or in the absence of recorded sales, at the closing bid prices on such exchanges, or at the quoted bid price in the over-the-counter market. Securities or other assets for which market quotations are not readily available, or are deemed unreliable due to a significant event or otherwise, are valued pursuant to procedures adopted by the Portfolio Trust’s Board of Trustees. Examples of potentially significant events that could affect the value of an individual security include corporate actions by the issuer, announcements by the issuer relating to its earnings or products, regulatory news, natural disasters, and litigation. Examples of potentially significant events that could affect multiple securities held by a Portfolio include governmen- |
| |
HSBC INVESTOR PORTFOLIOS | 69 |
|
HSBC INVESTOR PORTFOLIOS |
|
Notes to Financial Statements—As of October 31, 2009 (continued) |
| |
| tal actions, natural disasters, and armed conflicts. In addition, if events materially affecting the value of foreign securities occur between the time when the exchange on which they are traded closes and the time when the Portfolios’ net assets are calculated, such securities may be valued using fair value pricing in accordance with procedures adopted by the Board of Trustees. Management identifies possible fluctuations in foreign securities by monitoring the rise or fall in the value of a designated benchmark index. In the event of a rise or fall greater than predetermined levels, the International Equity Portfolio may use a systematic valuation model provided by an independent third party to value its foreign securities, rather than local market closing prices. When the International Equity Portfolio uses such a valuation model, the value assigned to the International Equity Portfolio’s foreign securities may not be the quoted or published prices of the investment on their primary markets or exchanges. |
| |
| Exchange traded futures contracts are valued at the last sales price as of the close of the primary exchange. Forward foreign currency contracts are generally valued at the foreign currency exchange rate as of the close of the New York Stock Exchange. |
| |
| Investment Transactions and Related Income: |
| |
| Investment transactions are accounted for no later than one business day after trade date. For financial reporting purposes, changes in holdings are accounted for on trade date on the last business day of the reporting period. Investment gains and losses are calculated on the identified cost basis. Interest income is recognized on the accrual basis and includes, where applicable, the amortization or accretion of premium or discount. Dividend income is recorded on the ex-dividend date. |
| |
| Foreign Currency Translation: |
| |
| The accounting records of the Portfolios are maintained in U.S. dollars. Foreign currency amounts are translated into U.S. dollars at the current rate of exchange to determine the value of investments, assets and liabilities. Purchases and sales of securities, and income and expenses are translated at the prevailing rate of exchange on the respective dates of such transactions. The Portfolios do not isolate the portion of the results of operations resulting from changes in foreign exchange rates on investments from fluctuations arising from changes in market prices of securities held. Such fluctuations are included with the net realized and unrealized gain or loss from investments and foreign currencies. |
| |
| Expense Allocations: |
| |
| Expenses directly attributable to a Portfolio are charged to that Portfolio. Expenses not directly attributable to a Portfolio are allocated proportionally among various or all funds within the HSBC Investor Family of Funds in relation to net assets or on another reasonable basis. |
| |
| Federal Income Taxes: |
| |
| Each Portfolio will be treated as a partnership for U.S. Federal income tax purposes. Accordingly, each Portfolio passes through all of its net investment income and gains and losses to its feeder funds, and is therefore not subject to U.S. Federal income tax. As such, investors in the Portfolios will be taxed on their respective share of the Portfolios’ ordinary income and realized gains. It is intended that the Portfolios will be managed in such a way that an investor will be able to satisfy the requirements of the Internal Revenue Code applicable to regulated investment companies. |
| |
| Management of the Portfolios has reviewed tax positions taken in tax years that remain subject to examination by all major tax jurisdictions, including federal (i.e., the last four tax year ends and the interim tax period since then, as applicable). Management believes that there is no tax liability resulting from unrecognized tax benefits related to uncertain tax positions taken. |
| |
| New Accounting Pronouncements: |
| |
| In June 2009, the Financial Accounting Standards Board (“FASB”) issued Accounting Standard Codification 105-10, “The FASB Accounting Standards Codification and the Hierarchy of Generally Accepted Accounting Principles - a replacement of FASB Statement No. 162” (“ASC 105-10, formerly “SFAS 168”). ASC 105-10 replaces SFAS No. 162, “The Hierarchy of Generally Accepted Accounting Principles” and establishes the “FASB Accounting Standards Codification” (“Codification”) as the source of authoritative accounting principles recognized by the FASB to be applied by nongovernmental entities in the preparation of financial statements in conformity with U.S. GAAP. All guidance contained in the Codification carries an equal level of authority. The Codification supersedes all existing non-SEC accounting and reporting standards. All other non-grandfathered non-SEC accounting literature not included in the Codification |
| |
70 | HSBC INVESTOR PORTFOLIOS |
|
HSBC INVESTOR PORTFOLIOS |
|
Notes to Financial Statements—As of October 31, 2009 (continued) |
| |
| will become nonauthoritative. ASC 105-10 is effective for financial statements issued for interim and annual periods ending after September 15, 2009. The Portfolios adopted ASC 105-10 in the current reporting period. Management has evaluated this new statement and has determined that it did not have a significant impact on the determination or reporting of the Portfolios’ financial statements. |
| |
| Derivative Instruments |
| |
| All open derivative positions at period end are reflected on the Portfolio’s Schedule of Portfolio Investments. The following is a description of the derivative instruments utilized by the Fund, including the primary underlying risk exposures related to each instrument type. |
| |
| Foreign Currency Exchange Contracts: |
| |
| During the year, the International Equity Portfolio, entered into foreign currency exchange contracts in connection with planned purchases or sales of securities or to hedge the U.S. dollar value of securities denominated in a particular currency. In addition to the foreign currency risk related to the use of these contracts, the Portfolio could be exposed to risks if the counterparties to the contracts are unable to meet the terms of their contracts and from unanticipated movements in the value of a foreign currency relative to the U.S. dollar. The foreign currency exchange contracts are adjusted by the daily exchange rate of the underlying currency and any gains or losses are recorded for financial statement purposes as unrealized gains or losses until the contract settlement date. The volume of foreign currency exchange contracts will generally be representative of the volume of security trades throughout the reporting period that were denominated in foreign currencies. |
| |
| Futures Contracts: |
| |
| Each Portfolio may invest in futures contracts for the purpose of hedging its existing portfolio securities or securities it intends to purchase against fluctuations in fair value caused by changes in prevailing market interest rates. Upon entering into a futures contract, the Portfolio is required to pledge to the broker an amount of cash and/or other assets equal to a certain percentage of the contract amount (initial margin deposit). Subsequent payments, known as “variation margin,” are made or received by the Portfolio each day, depending on the daily fluctuations in the fair value of the underlying security. The Portfolio recognizes a gain or loss equal to the daily variation margin. Should market conditions move unexpectedly, the Portfolio may not achieve the anticipated benefits of the futures contracts and may realize a loss. Futures contracts involve, to varying degrees, elements of market risk (generally equity price risk related to stock futures, interest rate risk related to bond futures, and foreign currency risk related to currency futures) and exposure to loss in excess of the variation margin. The primary risks associated with the use of futures contracts are the imperfect correlation between the change in market value of the securities held by the Portfolios and the prices of futures contracts, the possibility of an illiquid market, and the inability of the counterparty to meet the terms of the contract. For the year ended October 31, 2009, the Portfolios did not hold any futures contracts. |
| |
| Summary of Derivative Instruments: |
| |
| The following is a summary of the fair value of derivative instruments for the International Equity Portfolio as of October 31, 2009: |
| | | | | | | | |
| | Asset Derivatives | | Liability Derivatives |
| |
| |
|
Primary Risk Exposure | | Statements of
Assets and
Liabilities Location | | Total Fair Value* | | Statements of
Assets and
Liabilities Location | | Total Fair Value* |
| |
| |
| |
| |
|
Foreign Currency Exchange Contracts | | Unrealized appreciation on foreign currency contracts | | $4,744 | | Unrealized depreciation on foreign currency contracts | | $(10,023) |
| | |
|
|
| * | Total Fair Value is presented by Primary Risk Exposure. For foreign currency contracts, such amounts represent the unrealized gain/appreciation (for asset derivatives) or loss/depreciation (for liability derivatives). |
| |
HSBC INVESTOR PORTFOLIOS | 71 |
|
HSBC INVESTOR PORTFOLIOS |
|
Notes to Financial Statements—As of October 31, 2009 (continued) |
| |
| The derivative instruments had the following impact on the Statements of Operations for the International Equity Portfolio for the year ended October 31, 2009: |
| | | | | | |
Primary Risk Exposure | | Location of Gain (Loss)
on Derivatives
Recognized in Income | | Realized Gain
(Loss) on
Derivatives
Recognized
in Income | | Change in Unrealized
Appreciation/
Depreciation on
Derivatives Recognized
in Income |
| |
| |
| |
|
Foreign Currency Exchange Contracts | | Net realized gains (losses) from investment and foreign currency transactions/change in unrealized appreciation/depreciation on investments and foreign currencies | | $(614,669) | | $(56,257) |
| | | |
3. | Investment Valuation Summary |
| |
| The valuation techniques employed by the Portfolios, as described in Note 2 above, maximize the use of observable inputs and minimize the use of unobservable inputs in determining fair value. The inputs used for valuing the Portfolios’ investments are summarized in the three broad levels listed below: |
| | | |
| | • | Level 1: quoted prices in active markets for identical assets |
| | | |
| | • | Level 2: other significant observable inputs (including quoted prices for similar securities, interest rates, prepayments speeds, credit risk, etc.) |
| | | |
| | • | Level 3: significant unobservable inputs (including the Portfolio’s own assumptions in determining the fair value of investments) |
| |
| The inputs or methodology used for valuing investments are not necessarily an indication of the risk associated with investing in those investments. For example, short-term debt securities of sufficient credit quality maturing in sixty days or less are generally valued at amortized cost, which approximates fair value. Generally, amortized cost approximates the current fair value of a security, but since the valuation is not obtained from a quoted price in an active market, such securities are reflected as Level 2. |
| |
| The Schedules of Portfolio Investments includes additional information regarding the investments for the Portfolios. The following is a summary of the valuation inputs used as of October 31, 2009 in valuing the Portfolios’ investments based upon the three levels defined above: |
| | | | | | | | | | |
| | LEVEL 1 | | LEVEL 2 | | TOTAL
INVESTMENTS | |
| |
| |
| |
| |
Growth Portfolio | | | | | | | | | | |
Investments: | | | | | | | | | | |
Common Stocks - Domestic | | $ | 85,180,697 | | $ | — | | $ | 85,180,697 | |
Investment Companies | | | 3,185,710 | | | — | | | 3,185,710 | |
| |
|
| |
|
| |
|
| |
Total Investments | | $ | 88,366,407 | | $ | — | | $ | 88,366,407 | |
| |
|
| |
|
| |
|
| |
| | | | | | | | | | |
International Equity Portfolio | | | | | | | | | | |
Investments: | | | | | | | | | | |
Common Stocks - Foreign (a): | | | | | | | | | | |
Brazil | | $ | 961,213 | | $ | — | | $ | 961,213 | |
Canada | | | 8,515,890 | | | — | | | 8,515,890 | |
South Korea | | | 1,697,356 | | | 1,762,036 | | | 3,459,392 | |
Spain | | | 4,506,871 | | | 4,283,317 | | | 8,790,188 | |
All Other Common Stocks - Foreign† | | | — | | | 191,781,060 | | | 191,781,060 | |
Rights | | | — | | | 28,429 | | | 28,429 | |
Investment Companies | | | 1,904,284 | | | — | | | 1,904,284 | |
| |
|
| |
|
| |
|
| |
Total Investments | | | 17,585,614 | | | 197,854,842 | | | 215,440,456 | |
| |
|
| |
|
| |
|
| |
Other Financial Instruments* | | | — | | | (5,279 | ) | | (5,279 | ) |
| |
|
| |
|
| |
|
| |
Total Investments | | $ | 17,585,614 | | $ | 197,849,563 | | $ | 215,435,177 | |
| |
|
| |
|
| |
|
| |
| |
72 | HSBC INVESTOR PORTFOLIOS |
|
HSBC INVESTOR PORTFOLIOS |
|
Notes to Financial Statements—As of October 31, 2009 (continued) |
| | | | | | | | | | |
| | LEVEL 1 | | LEVEL 2 | | Total
Investments | |
| |
| |
| |
| |
Opportunity Portfolio | | | | | | | | | | |
Investments: | | | | | | | | | | |
Common Stocks - Domestic | | $ | 126,195,195 | | $ | — | | $ | 126,195,195 | |
Investment Companies | | | 3,270,825 | | | — | | | 3,270,825 | |
| |
|
| |
|
| |
|
| |
Total Investments | | $ | 129,466,020 | | $ | — | | $ | 129,466,020 | |
| |
|
| |
|
| |
|
| |
| | | | | | | | | | |
Value Portfolio | | | | | | | | | | |
Investments: | | | | | | | | | | |
Common Stocks - Domestic | | $ | 48,567,126 | | $ | — | | $ | 48,567,126 | |
Investment Companies | | | 1,417,909 | | | — | | | 1,417,909 | |
| |
|
| |
|
| |
|
| |
Total Investments | | $ | 49,985,035 | | $ | — | | $ | 49,985,035 | |
| |
|
| |
|
| |
|
| |
| | | |
| | * | Other financial instruments would include any derivative instruments, such as foreign currency exchange contracts. These investments are generally recorded in the financial statements at the unrealized gain or loss on the investment. |
| | | |
| | (a) | Based on the domicile of the security issuer. |
| | | |
| | † | For detailed country descriptions, see the accompanying Schedules of Portfolio Investments. |
| | | |
4. | Related Party Transactions and Other Agreements: |
| |
| Investment Management: |
| |
| HSBC Global Asset Management (USA) Inc. (“HSBC” or the “Investment Adviser”), a wholly owned subsidiary of HSBC Bank USA, N.A., a national bank organized under the laws of the United States, acts as the Investment Adviser to the Portfolios pursuant to an investment management contract with the Portfolio Trust. As Investment Adviser, HSBC manages the investments of the Portfolios and continuously reviews, supervises, and administers the Portfolios’ investments, except that Winslow Capital Management, Inc., AllianceBernstein L.P., Westfield Capital Management Company, L.P. and NWQ Investment Management Company, LLC serve as Sub-Investment Advisers for the Growth Portfolio, International Equity Portfolio, Opportunity Portfolio, and the Value Portfolio, respectively, and are paid for their services directly by the respective Portfolios. |
| |
| For their services, the Investment Adviser and Winslow Capital Management, Inc. (“Winslow”) receive in aggregate, from the Growth Portfolio, a fee, accrued daily and paid monthly, at an annual rate of: |
| | | | |
Based on Average Daily Net Assets of all Sub-Adviser serviced funds and separate accounts affiliated with HSBC: | | | Fee Rate* | |
| | |
| |
Up to $250 million | | 0.575% | |
In excess of $250 million but not exceeding $500 million | | 0.525% | |
In excess of $500 million but not exceeding $750 million | | 0.475% | |
In excess of $750 million but not exceeding $1 billion | | 0.425% | |
In excess of $1 billion | | 0.375% | |
| | | |
| | * | The investment advisory contract provides that the Growth Portfolio may pay the Investment Adviser an aggregate maximum fee of 0.68%. Currently, the Investment Adviser’s share of the aggregate maximum fee rate is capped at 0.175%. Accordingly, the aggregate maximum fee rate is 0.575%. |
| | | |
| For their services, the Investment Adviser and AllianceBernstein L.P. receive in aggregate, from the International Equity Portfolio, a fee, accrued daily and paid monthly, at an annual rate of: |
| | | | |
Based on Average Daily Net Assets of: | | | Fee Rate | |
| | |
| |
Up to $10 million | | 1.015% | |
In excess of $10 million but not exceeding $25 million | | 0.92% | |
In excess of $25 million but not exceeding $50 million | | 0.79% | |
In excess of $50 million but not exceeding $100 million | | 0.70% | |
In excess of $100 million | | 0.61% | |
| | | |
| For their services, the Investment Adviser and Westfield Capital Management Company, L.P. receive in aggregate, a fee, accrued daily and paid monthly, at an annual rate of 0.80% of the Opportunity Portfolio’s average daily net assets. |
| |
HSBC INVESTOR PORTFOLIOS | 73 |
|
HSBC INVESTOR PORTFOLIOS |
|
Notes to Financial Statements—As of October 31, 2009 (continued) |
| |
| For their services, the Investment Adviser and NWQ Investment Management Company, LLC receive in aggregate, from the Value Portfolio, a fee, accrued daily and paid monthly, at an annual rate of: |
| | | | |
Based on Average Daily Net Assets of | | | Fee Rate | |
| | |
| |
Up to $500 million | | 0.525% | |
In excess of $500 million but not exceeding $1 billion | | 0.475% | |
In excess of $1 billion | | 0.425% | |
| |
| Any voluntary fee waivers/reimbursements are not subject to recoupment in subsequent fiscal periods. Voluntary waiver/reimbursements may be stopped at any time. |
| |
| Administration: |
| |
| HSBC serves the Portfolios as Administrator. Under the terms of the Administration Agreement, HSBC receives from the Portfolios (as well as the other funds in the HSBC Investor Family of Funds) a fee, accrued daily and paid monthly, during the period November 1, 2008 to December 31, 2008, at annual rate of: |
| | | | |
Based on Average Daily Net Assets of | | | Fee Rate | |
| | |
| |
Up to $12 billion | | 0.0525% | |
In excess of $12 billion | | 0.0350% | |
| |
| Effective January 1, 2009, under the terms of the Administration Agreement, HSBC receives from the Portfolios (as well as the other funds in the HSBC Investor Family of Funds) a fee, accrued daily and paid monthly, at annual rate of: |
| | | | |
Based on Average Daily Net Assets of | | | Fee Rate | |
| | |
| |
Up to $10 billion | | 0.0550% | |
In excess of $10 billion but not exceeding $20 billion | | 0.0350% | |
In excess of $20 billion but not exceeding $50 billion | | 0.0275% | |
In excess of $50 billion | | 0.0250% | |
| |
| The fee rates and breakpoints are determined on the basis of the aggregate average daily net assets of the HSBC Investor Family of Funds, however, the assets of the Portfolios and HSBC Investor Funds that invest in the Portfolios are not double-counted. The total administration fee paid to HSBC is allocated to each series in the HSBC Investor Family of Funds based upon its proportionate share of the aggregate net assets of the Family of Funds. For assets invested in the Portfolios by the HSBC Investor Funds, the Portfolios pay half of the administration fee and the other funds pay half of the administration fee, for a combination of the total fee rate set forth above. Certain administrative fees of the Portfolios also may be received by treating them as apportioned in part to other funds makes investments in the Portfolios a master-feeder structure. |
| |
| Pursuant to a Sub-Administration Agreement with HSBC, Citi Fund Services Ohio, Inc. (“Citi Ohio”), a wholly-owned subsidiary of Citigroup, Inc., serves as the Portfolio Trust’s Sub-Administrator subject to the general supervision of the Portfolio Trust’s Board of Trustees and HSBC. For these services, Citi Ohio is entitled to a fee, payable by HSBC, at an annual rate equivalent to the fee rates set forth above, minus 0.02% (2 basis points) which is retained by HSBC. |
| |
| Under a Compliance Services Agreement between the Portfolio Trust and the other HSBC Investor Funds (the “Trusts”) and Citi Ohio (the “CCO Agreement”), Citi Ohio makes an employee available to serve as the Trusts’ Chief Compliance Officer (the “CCO”). Under the CCO Agreement, Citi Ohio also provides infrastructure and support in implementing the written policies and procedures comprising the Portfolios’ compliance program, including support services to the CCO. For the services provided under the CCO Agreement, the HSBC Investor Family of Funds paid Citi Ohio $266,099 for the year ended October 31, 2009, plus reimbursement of certain expenses. Expenses incurred by each Portfolio are reflected on the Statements of Operations as “Compliance Services.” Citi Ohio pays the salary and other compensation earned by individuals performing these services, as employees of Citi Ohio. |
| |
| Fund Accounting and Trustees: |
| |
| Citi Ohio provides fund accounting services for the Portfolio Trust. For its services to the Portfolios, Citi Ohio receives an annual fee per portfolio, including reimbursement of certain expenses, that is accrued daily and paid monthly. |
| |
| Each non-interested Trustee is compensated with a $60,000 annual Board retainer for services as a Trustee of the HSBC Investor Family of Funds (or the “Trusts”), as well as a $3,000 annual retainer for each Committee of the Board of the Trusts. Each non-interested Trustee also receives a $5,000 and $3,000 meeting fee for each regular in-person Board |
| |
74 | HSBC INVESTOR PORTFOLIOS |
|
HSBC INVESTOR PORTFOLIOS |
|
Notes to Financial Statements—As of October 31, 2009 (continued) |
| |
| meeting and Committee meeting, respectively. Furthermore, each non-interested Trustee receives compensation for attending special meetings and/or functioning as a Committee or Board Chairperson. In addition, the non-interested Trustees are reimbursed for certain expenses incurred in connection with their Board membership. |
| |
5. | Investment Transactions: |
| |
| Purchases and sales of securities (excluding securities maturing less than one year from acquisition) for the year ended October 31, 2009 were as follows: |
| | | | | | | |
Portfolio Name | | | Purchases
(excluding U.S.
Government) | | Sales
(excluding U.S.
Government) |
| | |
| |
|
Growth Portfolio | | $ | 51,655,635 | | $ | 58,934,962 |
International Equity Portfolio | | | 104,824,970 | | | 124,088,899 |
Opportunity Portfolio | | | 72,783,514 | | | 84,100,255 |
Value Portfolio | | | 8,891,736 | | | 13,184,851 |
| |
| There were no long-term U.S. Government securities held during the year ended October 31, 2009. |
| |
6. | Federal Income Tax Information: |
| |
| At October 31, 2009, the cost, gross unrealized appreciation and gross unrealized depreciation on securities for federal income tax purposes, were as follows: |
| | | | | | | | | | |
Fund | | | Tax Cost ($) | | Tax Unrealized
Appreciation ($) | | Tax Unrealized
Depreciation ($) | | Net Unrealized
Appreciation/
(Depreciation) ($)* | |
| | |
| |
| |
| |
| |
Growth Portfolio | | 79,874,530 | | 10,686,442 | | (2,194,565 | ) | 8,491,877 | |
International Equity Portfolio | | 228,068,719 | | 18,620,686 | | (31,248,949 | ) | (12,628,263 | ) |
Opportunity Portfolio | | 131,149,543 | | 16,508,193 | | (18,191,716 | ) | (1,683,523 | ) |
Value Portfolio | | 53,335,078 | | 5,357,517 | | (8,707,560 | ) | (3,350,043 | ) |
| | | |
| |
|
| | * | The difference between book-basis unrealized appreciation (depreciation) is attributable primarily to: tax deferral of losses on wash sales. |
| | | |
7. | Legal and Regulatory Matters: |
| | | |
| On September 26, 2006, BISYS Fund Services, Inc. (“BISYS”), an affiliate of BISYS Fund Services Ohio, Inc. which provided various services to the Portfolios, reached a settlement with the Securities and Exchange Commission (“the SEC”) regarding the SEC’s investigation related to BISYS’ past payment of certain marketing and other expenses with respect to certain of its mutual fund clients. Although BISYS has reached a settlement with the SEC, the Portfolios’ management is not aware that any determination has been made as to how the BISYS settlement monies will be distributed. While the Portfolios’ management is currently unable to determine the impact, if any, of such matters on the Funds or the Portfolios’ financial statements, management does not anticipate a material, adverse impact to the Portfolios or the Portfolios’ financial statements. |
| |
HSBC INVESTOR PORTFOLIOS | 75 |
REPORT OF INDEPENDENT REGISTERED PUBLIC ACCOUNTING FIRM
To the Shareholders and Board of
Trustees of HSBC Investor Portfolios:
We have audited the accompanying statements of assets and liabilities of HSBC Investor Portfolios -HSBC Investor Growth Portfolio, HSBC Investor International Equity Portfolio, HSBC Investor Opportunity Portfolio and HSBC Investor Value Portfolio (the Funds), including the schedules of portfolio investments, as of October 31, 2009, and the related statements of operations for the year then ended, the changes in net assets for each year in the two-year period then ended, and the financial highlights for each year in the five-year period then ended. These financial statements and financial highlights are the responsibility of the Funds’ management. Our responsibility is to express an opinion on these financial statements and financial highlights based on our audits.
We conducted our audits in accordance with the standards of the Public Company Accounting Oversight Board (United States). Those standards require that we plan and perform the audits to obtain reasonable assurance about whether the financial statements and financial highlights are free of material misstatement. An audit includes examining, on a test basis, evidence supporting the amounts and disclosures in the financial statements. Our procedures included confirmation of securities owned as of October 31, 2009, by correspondence with custodians and brokers or by other appropriate auditing procedures. An audit also includes assessing the accounting principles used and significant estimates made by management, as well as evaluating the overall financial statement presentation. We believe that our audits provide a reasonable basis for our opinion.
In our opinion, the financial statements and financial highlights referred to above present fairly, in all material respects, the financial position of the Funds as of October 31, 2009, the results of their operations for the year then ended, the changes in their net assets for each year in the two-year period then ended, and the financial highlights for each year in the five-year period then ended, in conformity with U.S. generally accepted accounting principles.

Columbus, Ohio
December 21, 2009
| |
76 | HSBC INVESTOR PORTFOLIOS |
|
HSBC INVESTOR FAMILY OF FUNDS |
|
Table of Shareholder Expenses (Unaudited)—As of October 31, 2009 |
| |
| As a shareholder of the HSBC Investor Portfolios (“Portfolios”), you incur ongoing costs, including management fees and other Fund expenses. |
| |
| These examples are intended to help you understand your ongoing costs (in dollars) of investing in the Portfolios and to compare these costs with the ongoing costs of investing in other mutual funds. |
| |
| These examples are based on an investment of $1,000 invested at the beginning of the period and held for the entire period from May 1, 2009 through October 31, 2009. |
| |
| Actual Example |
| |
| The table below provides information about actual account values and actual expenses. You may use the information below, together with the amount you invested, to estimate the expenses that you paid over the period. Simply divide your account value by $1,000 (for example, an $8,600 account value divided by $1,000 = 8.6), then multiply the result by the number in the table under the heading entitled “Expenses Paid During Period” to estimate the expenses you paid on your account during this period. |
| | | | | | | | | | | | |
| | Beginning
Account Value
5/1/09 | | Ending
Account Value
10/31/09 | | Expenses Paid
During Period*
5/1/09 – 10/31/09 | | Annualized
Expense Ratio
During Period
5/1/09 – 10/31/09 |
| |
| |
| |
| |
|
Growth Portfolio | | $ | 1,000.00 | | $ | 1,169.10 | | $ | 3.72 | | 0.68 | % |
International Equity Portfolio | | | 1,000.00 | | | 1,299.70 | | | 4.87 | | 0.84 | % |
Opportunity Portfolio | | | 1,000.00 | | | 1,198.30 | | | 4.93 | | 0.89 | % |
Value Portfolio | | | 1,000.00 | | | 1,258.40 | | | 3.81 | | 0.67 | % |
| | |
|
|
| * | Expenses are equal to the average account value over the period multiplied by the Portfolio’s annualized expense ratio, multiplied by the number of days in the most recent fiscal half-year divided by the number of days in the fiscal year (to reflect the one half year period). |
| | |
| Hypothetical Example for Comparison Purposes |
| | |
| The table below provides information about hypothetical account values and hypothetical expenses based on each Portfolio’s actual expense ratio and an assumed rate of return of 5% per year before expenses, which is not the Portfolio’s actual return. The hypothetical account values and expenses may not be used to estimate the actual ending account balance or expenses you paid for the period. You may use this information to compare this 5% hypothetical example with the 5% hypothetical examples that appear in the shareholder reports of other funds. |
| | |
| Please note that the expenses shown in the table are meant to highlight your ongoing costs only and do not reflect any transactional costs, such as sales charges (loads), redemption fees, or exchange fees. Therefore, the table is useful in comparing ongoing costs only, and will not help you determine the relative total costs of owning different funds. In addition, if these transactional costs were included, your costs would have been higher. |
| | | | | | | | | | | | |
| | Beginning
Account Value
5/1/09 | | Ending
Account Value
10/31/09 | | Expenses Paid
During Period*
5/1/09 - 10/31/09 | | Annualized
Expense Ratio
During Period
5/1/09 - 10/31/09 |
| |
| |
| |
| |
|
Growth Portfolio | | $ | 1,000.00 | | $ | 1,021.78 | | $ | 3.47 | | 0.68 | % |
International Equity Portfolio | | | 1,000.00 | | | 1,020.97 | | | 4.28 | | 0.84 | % |
Opportunity Portfolio | | | 1,000.00 | | | 1,020.72 | | | 4.53 | | 0.89 | % |
Value Portfolio | | | 1,000.00 | | | 1,021.83 | | | 3.41 | | 0.67 | % |
| | |
|
|
| * | Expenses are equal to the average account value over the period multiplied by the Portfolio’s annualized expense ratio, multiplied by the number of days in the most recent fiscal half-year divided by the number of days in the fiscal year (to reflect the one half year period). |
| |
HSBC INVESTOR PORTFOLIOS | 77 |
|
HSBC INVESTOR FAMILY OF FUNDS |
|
Board of Trustees and Officers (unaudited) |
MANAGEMENT OF THE TRUST
The following table contains information regarding HSBC Investor Family of Funds Board of Trustees (“Trustees”). Asterisks indicate those Trustees who are “interested persons,” as defined in the Investment company act of 1940, as amended, of the HSBC Investor Family of Funds. The HSBC Investor Family of Funds’ Statement of Additional Information includes additional information about the Trustees and is available by calling (888) 525-5757.
| | | | | | | | | | |
Name, Address,
and Age | | Position(s)
Held with
HSBC Investor
Family of Funds | | Term of Office and
Length of Time Served
With the HSBC Investor
Family of Funds | | Principal Occupation(s)
During Past 5 Years | | Number of
Portfolios in Fund
Complex Overseen
By Trustee* | | Other
Directorships
Held by Trustee |
|
|
NON-INTERESTED | | | | | | | | |
TRUSTEES | | | | | | | | |
| | | | | | | | | | |
Alan S. Parsow
P.O. Box 182845
Columbus, OH 43218
Age: 59 | | Trustee | | Indefinite: 1987
to present | | General Partner of Elkhorn Partners, L.P. (A private investment partnership) (since 1989) | | 36 | | Penn Treaty American Corporation (insurance) |
|
Larry M. Robbins
P.O. Box 182845
Columbus, OH 43218
Age: 70 | | Trustee | | Indefinite: 1987
to present | | Private Investor (2007-present); Director, Center for Teaching and Learning, University of Pennsylvania (1999-2007) | | 36 | | None |
|
Michael Seely
P.O. Box 182845
Columbus, OH 43218
Age: 64 | | Trustee | | Indefinite: 1987
to present | | Private Investor (2003-present); Global Multi Manager Partners (1999-2003); President of Investor Access Corporation (1981-2003) | | 36 | | None |
|
Thomas F. Robards
P.O. Box 182845
Columbus, OH 43218
Age: 63 | | Trustee | | Indefinite: March 2005
to present | | Partner, Robards & Co. LLC (2005-present); Chief Financial Officer, American Museum of Natural History (2003-2004) | | 36 | | Overseas Shipholding Group (energy transportation); Ellington Financial LLC (financial services); Big Apple Circus (entertainment) |
|
Susan S. Huang
P.O. Box 182845
Columbus, OH 43218
Age: 55 | | Trustee | | Indefinite: June 2008
to present | | Investment Consultant, self employed (2001 to present); Senior Vice President, Schroeder Investment Management (2001-2004) | | 36 | | United Church Federation; Huntington’s Disease Society; Second Congregational Church (Greenwich) Endowment, Inc. |
|
Marcia L. Beck
P.O. Box 182845
Columbus, OH 43218
Age: 54 | | Trustee | | Indefinite: June 2008
to present | | Private Investor (June 1999 to present) | | 36 | | None |
|
| | | | | | | | | | |
INTERESTED TRUSTEES | | | | | | | | |
| | | | | | | | | | |
Stephen J. Baker**
P.O. Box 182845
Columbus, OH 43218
Age: 53 | | Trustee | | Indefinite: 2004
to present | | Chief Executive Officer, HSBC Global Asset Management (USA) Inc., and Executive Vice President, HSBC (USA), N.A. (2003 to present); Chief Executive Officer, HSBC Asset Management (Canada) Limited (1998 to 2003) | | 36 | | None |
|
| |
* | Includes the Funds and the underlying Portfolios for the HSBC Investor Family of Funds with a master/feeder structure. |
| |
** | Mr. Baker is an “interested person” of the the HSBC Investor Family of Funds, as defined by the 1940 Act, due to his employment with the Investment Adviser. |
| |
78 | HSBC INVESTOR PORTFOLIOS |
|
HSBC INVESTOR FAMILY OF FUNDS |
|
Board of Trustees and Officers (unaudited) (continued) |
The names of the officers, their addresses, ages, position(s) held with the Trust, and principal occupation(s) during the past five years are described in the table below.
| | | | | | |
Name, Address,
and Age/ | | Position(s)
Held with the
HSBC Investor
Family of Funds | | Term of Office and
Length of Time Served
With the HSBC Investor
Family of Funds | | Principal Occupation(s)
During Past 5 Years |
|
Richard A. Fabietti
452 Fifth Avenue
New York, NY 10018
Age: 51 | | President | | Indefinite: March 2004
to present | | Senior Vice President, Head of Product Management, HSBC Global Asset Management (USA) Inc. (1998 to present) |
|
Elba L. Vasquez
452 Fifth Avenue
New York, NY 10018
Age: 47 | | Vice President | | Indefinite: March 2006
to present | | Vice President of Product Administration, HSBC Global Asset Management (USA) Inc. (2005 to present); Vice President of Client Services, Citi Fund Services Ohio, Inc. (1996 to 2005) |
|
|
|
|
|
|
|
Martin R. Dean*
3435 Stelzer Road
Columbus, OH 43219-3035
Age: 46 | | Treasurer | | Indefinite: October 2009
to present | | Senior Vice President of Citi Fund Services |
|
|
|
|
|
|
|
Jennifer A. English*
100 Summer Street
Suite 1500
Boston, MA 02110
Age: 37 | | Secretary | | Indefinite: 2008
to present | | Senior Vice President, Regulatory Administration, Citi Fund Services (2005 – present); Assistant Vice President and Assistant Counsel, PFPC, Inc. (2002-2005) |
|
|
|
|
|
|
|
F. Martin Fox*
100 Summer Street
Suite 1500
Boston, MA 02110
Age: 46 | | Assistant Secretary | | Indefinite: 2008
to present | | Assistant Vice President, Regulatory Administration, Citi Fund Services (May 2008 – present); Contract Attorney, Update Legal LLC (2002 – 2008) |
|
|
|
|
|
|
|
Frederick J. Schmidt*
1 RexCorp Plaza
Uniondale, NY 11556
Age: 50 | | Chief
Compliance Officer | | Term expires 2009;
2004 to present | | Senior Vice President and Chief Compliance Officer, CCO Services Group, Global Transaction Services of Citi Fund Services (2004 to present) |
|
|
|
|
|
|
|
| |
* | Messrs. Dean, Fox and Schmidt and Ms. English also are officers of certain other investment companies of which Citi (or an affiliate) is the administrator or sub-administrator. |
| |
HSBC INVESTOR PORTFOLIOS | 79 |
Other Information:
A description of the policies and procedures that the Funds and Portfolios use to determine how to vote proxies relating to the portfolio securities is available without charge, upon request, by calling 1-800-525-5757 for HSBC Bank USA and HSBC Brokerage (USA) Inc. clients and 1-800-782-8183 for all other shareholders or on the Funds’ website at www.investor-funds.us.hsbc.com and the Securities and Exchange Commission’s (“Commission“) website at http://www.sec.gov. A copy of the Funds’ and Portfolios’ voting records for the most recent 12 month period ending June 30 are available at the Commission’s web-site at http://www.sec.gov.
Schedules of Portfolio Investments for fiscal quarters ending January 31 and July 31 will be available no later than 60 days after each period end, without charge, on the Funds’ website at www.investorfunds.us.hsbc.com and on the Commission’s web-site at http://www.sec.gov.
An investment in a Fund is not a deposit of HSBC Bank USA, National Association, and is not insured or guaranteed by the Federal Deposit Insurance Corporation or any other government agency.
| |
80 | HSBC INVESTOR PORTFOLIOS |
| | |
HSBC INVESTOR FAMILY OF FUNDS: | | SHAREHOLDER SERVICING AGENTS |
| | For HSBC Bank USA, N.A. and |
INVESTMENT ADVISER AND ADMINISTRATOR | | HSBC Securities (USA) Inc. Clients |
HSBC Global Asset Management (USA) Inc. | | HSBC Bank USA, N.A. |
452 Fifth Avenue | | 452 Fifth Avenue |
New York, NY 10018 | | New York, NY 10018 |
| | 1-888-525-5757 |
SUB-ADVISERS | | |
HSBC Investor Growth Portfolio | | For All Other Shareholders |
Winslow Capital Management, Inc. | | HSBC Investor Funds |
4720 IDS Tower | | P.O. Box 182845 |
80th South Eighth Street | | Columbus, OH 43218-2845 |
Minneapolis, MN 55402 | | 1-800-782-8183 |
| | |
HSBC Investor International Equity Portfolio | | TRANSFER AGENT |
AllianceBernstein L.P. | | Citi Fund Services |
1345 Avenue of the Americas, 39th Floor | | 3435 Stelzer Road |
New York, NY 10105 | | Columbus, OH 43219 |
| | |
HSBC Investor Mid-Cap Fund | | DISTRIBUTOR |
Munder Capital Management | | Foreside Distribution Services, L.P. |
Munder Capital Center | | 690 Taylor Road, Suite 150 |
480 Pierce Street | | Gahanna, OH 43230-3202 |
Birmingham, MI 48009-6063 | | |
| | CUSTODIAN |
HSBC Investor Opportunity Portfolio | | The Northern Trust Company |
Westfield Capital Management Company, L.P. | | 50 South LaSalle Street |
One Financial Center | | Chicago, IL 60603 |
Boston, MA 02111 | | |
| | INDEPENDENT REGISTERED PUBLIC |
HSBC Investor Value Portfolio | | ACCOUNTING FIRM |
NWQ Investment Management Company, LLC | | KPMG LLP |
2049 Century Park East, 16th Floor | | 191 West Nationwide Blvd., Suite 500 |
Los Angeles, CA 90067 | | Columbus, OH 43215 |
| | |
| | LEGAL COUNSEL |
| | Dechert LLP |
| | 1775 I Street, N.W. |
| | Washington, D.C. 20006 |


The HSBC Investor Family of Funds are distributed by Foreside Distribution Services, L.P. This document must be preceded or accompanied by a current prospectus for the HSBC Investor Funds, which you should read carefully before you invest or send money.
| | | |
| — NOT FDIC INSURED | — NO BANK GUARANTEE | — MAY LOSE VALUE |
|
HSB-0008 | | 12/09 |

HSBC Global Asset Management (USA) Inc.
October 31, 2009
HSBC Investor Funds
Annual Report
MONEY MARKET FUNDS
HSBC Investor California Tax-Free Money Market Fund
HSBC Investor New York Tax-Free Money Market Fund
HSBC Investor Prime Money Market Fund
HSBC Investor Tax-Free Money Market Fund
HSBC Investor U.S. Government Money Market Fund
HSBC Investor U.S. Treasury Money Market Fund
HSBC Investor Family of Funds
Annual Report - October 31, 2009
(This Page Intentionally Left Blank)
Barclays Capital U.S. Aggregate Bond Index is an unmanaged index generally representative of investment-grade fixed-rate debt issues, including government, corporate, asset-backed, and mortgage-backed securities, with maturities of at least one year.
Barclays Capital U.S. Corporate High-Yield Bond Index is an unmanaged index that covers the USD-denominated, non-investment grade, fixed-rate, taxable corporate bond market. Securities are classified as high-yield if the middle rating of Moody’s, Fitch, and S&P is Ba1/BB+/BB+ or below. The index excludes Emerging Markets debt.
Gross Domestic Product (GDP) is the measure of the market value of the goods and services produced by labor and property in the United States.
The Group of 20 (G-20) Finance Ministers and Central Bank Governors was established in 1999 to bring together systemically important industrialized and developing economies to discuss Key issues in the global economy.
Lipper California Tax-Exempt Money Market Funds Average is an equally weighted average of mutual funds that invest in California municipal obligations with dollar weighted average maturities of less than 90 days. These funds intend to keep a constant net asset value.
Lipper Money Market Instrument Funds Average is an equally weighted average of mutual funds that invest in high-quality financial instruments rated in the top two grades with dollar-weighted average maturities of less than 90 days. These funds intend to keep constant net asset value.
Lipper New York Tax-Exempt Money Market Funds Average is an equally weighted average of mutual funds that invest in New York municipal obligations with dollar weighted average maturities of less than 90 days. These funds intend to keep a constant net asset value.
Lipper Tax- Exempt Money Market Funds is an equally weighted average of mutual funds that invest in high-quality municipal obligations with dollar-weighted average maturities of less than 90 days. These funds intend to keep constant net asset value.
Lipper U.S. Government Money Market Funds is an equally weighted average of mutual funds that invest principally in financial instruments issued or guaranteed by the U.S. government, its agencies, or its instrumentalities, with dollar-weighted average maturities of less than 90 days. These funds intend to keep constant net asset value.
Lipper U.S. Treasury Money Market Funds is an equally weighted average of mutual funds that invest principally in U.S. Treasury obligations with dollar weighted average maturities of less than 90 days. These funds intend to keep a constant net asset value.
The MSCI EAFE Index (Europe, Australasia, Far East) which is a free float-adjusted market capitalization index that is designed to measure developed market equity performance, excluding the U.S. & Canada. The MSCI EAFE Index currently consists of the following 21 developed market country indices: Australia, Austria, Belgium, Denmark, Finland, France, Germany, Greece, Hong Kong, Ireland, Italy, Japan, the Netherlands, New Zealand, Norway, Portugal, Singapore, Spain, Sweden, Switzerland and the United Kingdom.
MSCI Emerging Markets Index is a market capitalization weighted index composed of companies representative of the market structure of 26 emerging market countries in Europe, Latin America, and the Pacific Basin.
Russell 2000® Index is an unmanaged index which measures the performance of the small-cap segment of the U.S. equity universe. The Russell 2000® Index is a subset of the Russell 3000® Index representing approximately 10% of the total market capitalization of that index. It includes approximately 2000 of the smallest securities based on a combination of their market cap and current index membership.
Standard & Poor’s 500 Index (“S&P 500”) is an unmanaged index that is widely regarded as a gauge of the U.S. equities market, this index includes 500 leading companies in leading industries of the U.S. economy. The S&P 500 focuses on the large cap segment of the market, with approximately 75% coverage of U.S. equities.
Lipper is an independent mutual fund performance monitor whose results are based on total return and do not reflect a sales charge.
Securities indexes assume reinvestment of all distributions and interest payments and do not take in account brokerage fees or expenses. Securities in the Funds do not match those in the indexes and performance of the Funds will differ. Investors cannot invest directly in an index.
December 18, 2009
To Our Shareholders:
It is a pleasure to report on a challenging, but fruitful year.
Since money market funds comprise the vast majority of the HSBC Investor Funds family assets, we have focused especially closely on events in the credit markets over the past year, hallmarked by the freezing of the commercial paper market in the wake of the Lehman bankruptcy and the September 15, 2008 “breaking of the buck” by The Reserve Fund, and the ultra-low short-term interest yields which prevail as a result of unprecedented fiscal and monetary stimulus.
Throughout the year, the Board of Trustees and the Funds’ Adviser have sought to ensure that all of the HSBC Investor money market funds appropriately managed their liquidity and risk. Each of the money market funds, with the exception of the US Treasury Money Market Fund, participated in the US Treasury Temporary Guarantee Program for Money Market Funds, which provided insurance against loss on investments in covered money market funds. This program expired on September 18, 2009, with no claims made by any money market funds.
The Adviser also instituted minimum yields on each of the money market funds which required the Adviser and shareholder servicing agents to waive significant portions of their fees to sustain a competitive yield.
HSBC’s Investor Funds include long-term funds, which we expect to grow in number, expanding your choices within the fund group. The Board, with input from HSBC’s competitively-distinguishing Multimanager analytical team, regularly reviews these funds’ investment performance in great detail. From time to time, we change sub-advisors and believe that the Board’s consistent and careful scrutiny has contributed to the funds’ generally excellent long-term performance. Information about this performance is included in the commentaries from the portfolio managers within this annual report.
To better fulfill our responsibilities, the Board has redesigned our committee structure; it now consists of: Audit, Contracts and Expense, Valuation and Investment Oversight, and Nominating and Corporate Governance committees. All independent trustees are members of these “committees of the whole”, which are chaired by a different member of the Board. I might add that our board had perfect attendance at all meetings last year—including telephone meetings.
There is much talk in the mutual fund industry of regulatory change. We monitor these trends, and our funds’ compliance, very carefully. In connection with this responsibility, the board invited a senior staff member of the U.S. Securities and Exchange Commission to discuss the regulatory environment and possible future developments.
Regulatory change may come from the judiciary as well. The U.S. Supreme Court recently heard arguments about how mutual fund fees are set—a case known as Jones v. Harris Associates. The plaintiff seeks to supplant the rule under which mutual funds have operated since 1982—the so-called Gartenberg standard which gives boards considerable discretion in establishing advisory fees. As you know, there are over 7,000 funds in the US, a number that assures vigorous competition—one reason US fund fees are the lowest in the world. A Wall Street Journal editorial (November 3, 2009) noted: “The Jones suit is a culmination of the plaintiffs bar assault on mutual funds that began earlier this decade and seeks to achieve via judicial fiat what it hasn’t been able to accomplish in legislation. Let’s hope the high Court shuts them down.” It would be a great disservice to fund investors if the tort bar were to prevail in this case.
Our fund family has shown rapid growth in recent years, and we thank you for the confidence you’ve placed in us. On behalf of the Board of Trustees and Advisory staff, we pledge our very best effort to making the future a good one for our shareholders.
Cordially,
Michael Seely
Chairperson, HSBC Investor Funds
| |
1 | HSBC INVESTOR FAMILY OF FUNDS |
Dear Shareholder,
Welcome to the HSBC Investor Funds annual report, covering the period between November 1, 2008 and October 31, 2009. This report offers detailed information about your funds’ results, from investment operations and composition. We encourage you to review it carefully.
Inside these pages you will find a letter from the Funds’ Chairman, as well as commentary from the portfolio managers discussing the investment markets and explaining the primary reasons each fund performed as it did. The report also includes each fund’s return during the 12-month period, as well as the performance of its benchmark index and peer group average. We believe the HSBC Investor Funds have provided their shareholders with competitive returns.
In closing, we want to thank you for investing through the HSBC Investor Funds. We recognize that the past year has presented challenges for many investors, and we appreciate and honor the trust you place in us. Please contact us at any time with questions or concerns.
Sincerely,
Richard A. Fabietti
President
| |
HSBC INVESTOR FAMILY OF FUNDS | 2 |
|
Commentary From the Investment Manager |
|
HSBC Global Asset Management (USA) Inc. |
U.S. Economic Review
The 12-month period between November 1, 2008 and October 31, 2009 began with the U.S. economy in severe recession and the financial system suffering from a major credit crunch.
The federal government took unprecedented steps to try to restore the economy and financial system to health. The Federal Reserve Board in December reduced the federal funds rate, its target short-term interest rate, from 1.00% to a range between 0.00% and 0.25%, and also took a wide range of other actions to inject liquidity and improve confidence in the system. The government also enacted a massive fiscal stimulus package. All told, the U.S. government and Federal Reserve committed a total of $12.8 trillion, an amount nearly equal to 2008 gross domestic product1.Governments around the world took similar steps: For example, the G-20 group1 of nations agreed to a $1.1 trillion program through which the International Monetary Fund would help countries afflicted by the global crisis to boost economic activity.
Leading economic indicators began showing signs of improvement during the second quarter of 2009. Credit spreads declined, the housing market’s descent slowed and survey data turned up. The economy continued to regain its footing throughout the period. Unemployment continued to rise, however, as is typical in the end stages of recession.
The U.S. economy contracted at an annualized rate of 5.4% during the fourth calendar quarter of 2008. It fell 6.4% and 0.7% in the first and second quarters of 2009, respectively, before recovering to grow 2.8% during the third quarter of 2009.
Market Review
Investors during the first four months of the period responded to the financial crisis by fleeing assets perceived as risky. Higher-risk assets generally fared worst during this time, with emerging markets stocks, small caps and high-yield bonds posting some of the largest losses. Assets considered safe and stable, particularly bonds backed by the U.S. government, produced the best returns.
The market environment changed dramatically beginning in early 2009. As the financial system and economy began showing signs of stabilizing, investors moved quickly back into risk assets. Between March 9 and the end of the reporting period the stock market posted a powerful rebound, with the S&P 5001 gaining roughly 55.31%. For the period as a whole the S&P 500 returned 9.80%, while the small-cap Russell 2000®, 1 gained 6.46%.
Foreign stocks on the whole declined considerably through early March, then surged to produce strong returns for the 12-month period. Foreign currencies’ strength against the dollar further boosted the gains of U.S. investors’ international holdings. Japan’s market did not keep pace with other major markets: It generated a 10.62% gain in U.S. dollar terms—and just a 2.05% return in local currency—as its economic recovery proved anemic.
During the rally investors especially favored shares in emerging markets, which in many cases offered more-attractive macroeconomic backdrops than developed countries. The MSCI EAFE Index1 of developed foreign stock markets gained 28.41% in U.S. dollar terms during the period under review, while the MSCI Emerging Markets Index1 gained 64.63%.
Investors in the fixed-income markets began the period fleeing to the most conservative and secure types of securities, particularly Treasury bills. The rally in government debt was so extreme that Treasury bills briefly offered negative yields. Meanwhile, investors sold bonds not backed by the federal government. That environment caused spreads between yields on Treasuries and other types of debt to widen to historic levels.
Conditions in the fixed-income markets changed dramatically during 2009. As the financial crisis began to recede, investors sought the greater yield available on higher-risk debt securities. Corporate bonds, in particular high-yield bonds, staged a strong rally. The Barclays Capital U.S. Aggregate Bond Index1, which tracks the broad fixed-income market, returned 13.79% for the 12 months through October, while the Barclays Capital U.S. Corporate High-Yield Bond Index1 returned 48.10%.
| |
1 | For additional information, please refer to the Glossary of Terms. |
| |
3 | HSBC INVESTOR FAMILY OF FUNDS |
|
Portfolio Reviews |
|
HSBC Investor California Tax-Free Money Market Fund |
(Class A Shares, C Shares, D Shares and Y Shares)
by Jason Moshos
Portfolio Manager |
Investment Concerns
An investment in the Fund is not insured or guaranteed by the FDIC or any other government agency. Although the Fund seeks to preserve the value of your investment at $1.00 per share, it is possible to lose money by investing in this Fund. The Fund’s income may be subject to the federal alternative minimum tax and to certain state and local taxes. Regional funds may be subject to additional risk, since issues they invest in are located in one geographical area.
The money markets were significantly affected by the actions of the Federal Reserve Board (the “Fed”) during the 12 months through October 31, 2009. The Fed lowered key short-term interest rates to historically low levels in an effort to jumpstart the U.S. economy. The federal funds rate began the period at a target of 1.00%, and in December was cut to a range between 0.00% and 0.25%. The rate cuts caused yields on money market securities to decline considerably.
Credit quality diminished across the municipal sector driven by rising unemployment and widening budget deficits. The challenging environment prompted us to position the Fund defensively. The Fund actively diversified away from credits most heavily affected by the credit crisis to pursue the Fund’s primary goal of capital preservation. We maintained a weighted average maturity that was shorter than that of the Fund’s peers during the period to maximize liquidity.*
The supply of money market eligible tax-free securities was low throughout the period due to the success of the federal government’s Build America bond program, which partially subsidizes interest paid by state and local governments.*
* Portfolio composition is subject to change.
| | | | | | | | | | | | | | | | |
Fund Performance | | | | Average Annual
Total Return (%) | | Yield (%)2 | | Expense
Ratio (%)3 |
|
|
|
|
|
|
|
|
|
As of October 31, 2009 | | Inception
Date | | 1
Year | | 5
Year | | Since
Inception | | 7-Day
Average | | Gross | | Net |
|
|
|
|
|
|
|
|
|
|
|
|
|
|
|
Class A† | | 3/2/07 | | 0.08 | | — | | 0.81 | | | 0.02 | | | 0.75 | | 0.75 |
|
|
|
|
|
|
|
|
|
|
|
|
|
|
|
|
|
Class C**, † | | 5/7/07 | | — | | — | | 1.75 | | | — | | | 1.35 | | 1.35 |
|
|
|
|
|
|
|
|
|
|
|
|
|
|
|
|
|
Class D | | 6/17/02 | | 0.10 | | 1.89 | | 1.49 | | | 0.02 | | | 0.60 | | 0.60 |
|
|
|
|
|
|
|
|
|
|
|
|
|
|
|
|
|
Class Y | | 7/18/02 | | 0.22 | | 2.12 | | 1.73 | | | 0.09 | | | 0.35 | | 0.35 |
|
|
|
|
|
|
|
|
|
|
|
|
|
|
|
|
|
Lipper California Tax-Exempt Money Market Funds Average1 | | — | | 0.24 | | 1.92 | | 1.50 | 4 | | N/A | | | N/A | | N/A |
|
|
|
|
|
|
|
|
|
|
|
|
|
|
|
|
|
Past performance does not guarantee future results. The performance data quoted represents past performance and current returns may be lower or higher. Total return figures include change in share price, reinvestment of dividends and capital gains and do not reflect taxes that a shareholder would pay on fund distributions or on the redemption of fund shares. The investment return and principal value will fluctuate so that an investor’s shares, when redeemed may be worth more or less than the original cost. To obtain performance information current to the most recent month end, please call 1-800-782-8183.
The performance above reflects any fee waivers that have been in effect during the applicable periods, as well as any expense reimbursements that have periodically been made. Absent such waivers and reimbursements, returns would have been lower. Currently, contractual fee waivers are in effect from March 1, 2009 through March 1, 2010.
| |
** | Reflects the applicable contingent deferred sales charge, maximum of 1.00%. |
| |
† | Class A Shares were operational during a portion of the periods presented. Amounts reflect performance for the period of the time the class had operations, which was 3 days during the year ended October 31, 2007 and 332 days during the year ended October 31, 2008. Class C shares were operational during a portion of the periods presented. Amounts reflect performance for the period of the time the class had operations, which was 165 days during the year ended October 31, 2007, 152 days during the year ended October 31, 2008 and 28 days during the year ended October 31, 2009. |
| |
1 | For additional information, please refer to the Glossary of Terms. |
| |
2 | The 7-day yield quotation more closely reflects the current earnings of the Fund than the total return quotation. |
| |
3 | Reflects the expense ratio as reported in the prospectus dated February 27, 2009. |
| |
4 | Return for the period 5/31/02 to 10/31/09. |
| |
HSBC INVESTOR FAMILY OF FUNDS | 4 |
|
Portfolio Reviews |
|
HSBC Investor New York Tax-Free Money Market Fund |
(Class A Shares, B Shares, C Shares, D Shares and Y Shares)
by Jason Moshos
Portfolio Manager |
Investment Concerns
An investment in the Fund is not insured or guaranteed by the FDIC or any other government agency. Although the Fund seeks to preserve the value of your investment at $1.00 per share, it is possible to lose money by investing in the Fund. The Fund’s income may be subject to the federal alternative minimum tax and to certain state and local taxes. Regional funds may be subject to additional risk, since issues they invest in are located in one geographical area.
The money markets were significantly affected by the actions of the Federal Reserve Board (the “Fed”) during the 12 months through October 31, 2009. The Fed lowered key short-term interest rates to historically low levels in an effort to jumpstart the U.S. economy. The federal funds rate began the period at a target of 1.00%, and in December was cut to a range between 0.00% and 0.25%. The rate cuts caused yields on money market securities to decline considerably.
Credit quality diminished across the municipal sector driven by rising unemployment and widening budget deficits. The challenging environment prompted us to position the Fund defensively. The Fund actively diversified away from credits most heavily affected by the credit crisis to pursue the Fund’s primary goal of capital preservation. We maintained a weighted average maturity that was shorter than that of the Fund’s peers during the period to maximize liquidity.*
The supply of money market eligible tax-free securities was low throughout the period due to the success of the federal government’s Build America bond program, which partially subsidizes interest paid by state and local governments.*
* Portfolio composition is subject to change.
| | | | | | | | | | | | | | | | | | | | |
Fund Performance | | | | Average Annual
Total Return (%) | | Yield (%)2 | | Expense
Ratio (%)3 | |
|
|
|
|
|
|
|
|
|
|
As of October 31, 2009 | | Inception
Date | | 1
Year | | 5
Year | | 10
Year | | Since
Inception | | 7-Day
Average | | Gross | | Net | |
|
|
|
|
|
|
|
|
|
|
|
|
|
|
|
|
|
|
Class A | | 11/17/94 | | | 0.18 | | 1.84 | | 1.65 | | 2.08 | | | 0.02 | | | 0.63 | | 0.63 | |
|
|
|
|
|
|
|
|
|
|
|
|
|
|
|
|
|
|
|
|
|
Class B** | | 4/29/98 | | | -3.92 | | 1.33 | | 0.92 | | 0.93 | | | 0.02 | | | 1.23 | | 1.23 | |
|
|
|
|
|
|
|
|
|
|
|
|
|
|
|
|
|
|
|
|
|
Class C*** | | 3/19/01 | | | — | | — | | — | | 0.77 | | | — | | | 1.23 | | 1.23 | |
|
|
|
|
|
|
|
|
|
|
|
|
|
|
|
|
|
|
|
|
|
Class D | | 4/1/99 | | | 0.25 | | 1.97 | | 1.80 | | 1.84 | | | 0.02 | | | 0.48 | | 0.48 | |
|
|
|
|
|
|
|
|
|
|
|
|
|
|
|
|
|
|
|
|
|
Class Y | | 7/1/96 | | | 0.40 | | 2.21 | | 2.04 | | 2.30 | | | 0.02 | | | 0.23 | | 0.23 | |
|
|
|
|
|
|
|
|
|
|
|
|
|
|
|
|
|
|
|
|
|
Lipper New York Tax-Exempt Money Market Funds Average1 | | — | | | 0.31 | | 1.97 | | 1.78 | | 2.21 | 4 | | N/A | | | N/A | | N/A | |
|
|
|
|
|
|
|
|
|
|
|
|
|
|
|
|
|
|
|
|
|
Past performance does not guarantee future results. The performance data quoted represents past performance and current returns may be lower or higher. Total return figures include change in share price, reinvestment of dividends and capital gains and do not reflect taxes that a shareholder would pay on fund distributions or on the redemption of fund shares. The investment return and principal value will fluctuate so that an investor’s shares, when redeemed may be worth more or less than the original cost. To obtain performance information current to the most recent month end, please call 1-800-782-8183.
The performance above reflects any fee waivers that have been in effect during the applicable periods, as well as any expense reimbursements that have periodically been made. Absent such waivers and reimbursements, returns would have been lower.
| |
** | Reflects the applicable contingent deferred sales charge, maximum of 4.00%. |
| |
*** | Reflects the applicable contingent deferred sales charge, maximum of 1.00%. Class C Shares were operational during a portion of the periods presented. Amounts reflect performance for the period of the time the class had operations, which was 81 days, 81 days, 145 days and 227 days during the years ended October 31, 2004, 2003, 2002, and 2001, respectively. |
| |
1 | For additional information, please refer to the Glossary of Terms. |
| |
2 | The 7-day yield quotation more closely reflects the current earnings of the Fund than the total return quotation. |
| |
3 | Reflects the expense ratio as reported in the prospectus dated February 27, 2009. |
| |
4 | Return for the period 10/31/94 to 10/31/09. |
| |
5 | HSBC INVESTOR FAMILY OF FUNDS |
| |
Portfolio Reviews |
|
HSBC Investor Prime Money Market Fund |
|
(Class A Shares, B Shares, C Shares, D Shares, I Shares and Y Shares) | Moody’s and Standard & Poor’s have assigned an
“Aaa” and “AAAm” rating to the HSBC Investor
Prime Money Market Fund.1 |
|
by John Chiodi |
Senior Portfolio Manager |
|
Investment Concerns
An investment in the Fund is not insured or guaranteed by the FDIC or any other government agency. Although the Fund seeks to preserve the value of your investment at $1.00 per share, it is possible to lose money by investing in the Fund.
The turmoil in the U.S. economy at the beginning of the period led the Federal Reserve Board (the “Fed”) to reduce key short-term interest rates to historically low levels. The Fed lowered the federal funds rate from 1.00% to a range between 0.00% and 0.25%, in hopes of stemming the economic downturn and financial crisis. The money markets were deeply affected by those rate cuts, which caused yields on money market securities to decline significantly early in the period.
We positioned the Fund conservatively during the period to protect shareholders’ principal. We increased the Fund’s concentrations in government issues to boost credit quality and liquidity. We also favored high quality short-term corporate obligations to further increase the Fund’s liquidity. These conservative strategies caused the Fund to miss out on some opportunities to generate higher yield.*
As the period wore on and the economy began to stabilize—thanks in part to the Fed’s interest-rate actions—we became more comfortable slightly increasing the duration of the Fund’s high-quality short-term corporate obligations. We also extended the Fund’s average weighted maturity as it became apparent that interest rates were not likely to increase as the period continued.*
* Portfolio composition is subject to change.
| | | | | | | | | | | | | | | | | | | |
Fund Performance | | Average Annual
Total Return (%) | | Yield (%)3 | | Expense
Ratio (%)4 | |
|
|
|
|
|
|
|
|
|
As of October 31, 2009 | | Inception
Date | | 1
Year | | 5
Year | | 10
Year | | Since
Inception | | 7-Day
Average | | Gross | | Net | |
|
|
|
|
|
|
|
|
|
|
|
|
|
|
|
|
|
|
|
Class A | | 11/13/98 | | 0.32 | | 2.83 | | 2.68 | | 2.84 | | | 0.02 | | | 0.67 | | 0.67 | |
|
|
|
|
|
|
|
|
|
|
|
|
|
|
|
|
|
|
|
|
Class B** | | 4/4/01 | | -3.83 | | 2.31 | | — | | 1.80 | | | 0.02 | | | 1.27 | | 1.27 | |
|
|
|
|
|
|
|
|
|
|
|
|
|
|
|
|
|
|
|
|
Class C*** | | 3/23/01 | | -0.83 | | 2.31 | | — | | 1.69 | | | 0.02 | | | 1.27 | | 1.27 | |
|
|
|
|
|
|
|
|
|
|
|
|
|
|
|
|
|
|
|
|
Class D | | 4/1/99 | | 0.40 | | 2.97 | | 2.82 | | 2.92 | | | 0.02 | | | 0.52 | | 0.52 | |
|
|
|
|
|
|
|
|
|
|
|
|
|
|
|
|
|
|
|
|
Class I | | 1/9/02 | | 0.69 | | 3.34 | | | | 2.62 | | | 0.12 | | | 0.17 | | 0.17 | |
|
|
|
|
|
|
|
|
|
|
|
|
|
|
|
|
|
|
|
|
Class Y | | 11/12/98 | | 0.58 | | 3.21 | | 3.07 | | 3.24 | | | 0.02 | | | 0.27 | | 0.27 | |
|
|
|
|
|
|
|
|
|
|
|
|
|
|
|
|
|
|
|
|
Lipper Money Market | | | | | | | | | | | | | | | | | | | |
Funds Average2 | | — | | 0.36 | | 2.70 | | 2.55 | | 2.73 | 5 | | N/A | | | N/A | | N/A | |
|
|
|
|
|
|
|
|
|
|
|
|
|
|
|
|
|
|
|
|
Past performance does not guarantee future results. The performance data quoted represents past performance and current returns may be lower or higher. Total return figures include change in share price, reinvestment of dividends and capital gains and do not reflect taxes that a shareholder would pay on fund distributions or on the redemption of fund shares. The investment return and principal value will fluctuate so that an investor’s shares, when redeemed may be worth more or less than the original cost. To obtain performance information current to the most recent month end, please call 1-800-782-8183.
The performance above reflects any fee waivers that have been in effect during the applicable periods, as well as any expense reimbursements that have periodically been made. Absent such waivers and reimbursements, returns would have been lower. Currently, for Class I contractual fee waivers are in effect from March 1, 2009 through March 1, 2010.
| |
** | Reflects the applicable contingent deferred sales charge, maximum of 4.00%. |
| |
*** | Reflects the applicable contingent deferred sales charge, maximum of 1.00%. |
| |
1 | The “Aaa” and “AAAm” money market fund rating is historical and reflects the superior quality of the Fund’s investments, sound liquidity management, and strong operations and trading support. Periodic reviews are conducted to ensure a secure operations environment. Moody’s and Standard & Poor’s ratings represent an opinion only, not a recommendation to buy or sell. |
| |
2 | For additional information, please refer to the Glossary of Terms. |
| |
3 | The 7-day yield quotation more closely reflects the current earnings of the Fund than the total return quotation. |
| |
4 | Reflects the expense ratio as reported in the prospectus dated February 27, 2009. |
| |
5 | Return for the period 10/31/98 to 10/31/09. |
| |
HSBC INVESTOR FAMILY OF FUNDS | 6 |
|
Portfolio Reviews |
|
HSBC Investor Tax-Free Money Market Fund |
(Class A Shares, D Shares, I Shares and Y Shares) |
|
by Jason Moshos
Portfolio Manager |
Investment Concerns
An investment in the Fund is not insured or guaranteed by the FDIC or any other government agency. Although the Fund seeks to preserve the value of your investment at $1.00 per share, it is possible to lose money by investing in the Fund. The Fund’s income may be subject to the federal alternative minimum tax and to certain state and local taxes.
The money markets were significantly affected by the actions of the Federal Reserve Board (the “Fed”) during the 12 months through October 31, 2009. The Fed lowered key short-term interest rates to historically low levels in an effort to jumpstart the U.S. economy. The federal funds rate began the period at a target of 1.00%, and in December was cut to a range between 0.00% and 0.25%. The rate cuts caused yields on money market securities to decline considerably.
Credit quality diminished across the municipal sector driven by rising unemployment and widening budget deficits. The challenging environment prompted us to position the Fund defensively. The Fund actively diversified away from credits most heavily affected by the credit crisis to ensure the Fund’s primary goal of capital preservation. We maintained a weighted average maturity that was shorter than that of the Fund’s peers during the period to maximize liquidity.
The supply of money market eligible tax-free securities was low throughout the period due to the success of the federal government’s Build America bond program, which partially subsidizes interest paid by state and local governments.*
* Portfolio composition is subject to change.
| | | | | | | | | | | | | | | | | |
Fund Performance | | | | Average Annual
Total Return (%) | | | Yield (%)2 | | Expense
Ratio (%)3 | |
|
|
|
|
|
|
|
|
|
|
|
As of October 31, 2009 | | Inception
Date | | 1
Year | | 5
Year | | Since
Inception | | 7-Day
Average | | Gross | | Net | |
|
|
|
|
|
|
|
|
|
|
|
|
|
|
|
|
Class A** | | 8/27/04 | | — | | — | | 0.69 | | | — | | | 0.80 | | 0.80 | |
|
|
|
|
|
|
|
|
|
|
|
|
|
|
|
|
|
|
Class D | | 8/24/04 | | 0.31 | | 1.97 | | 1.94 | | | 0.02 | | | 0.65 | | 0.65 | |
|
|
|
|
|
|
|
|
|
|
|
|
|
|
|
|
|
|
Class I*** | | 6/25/04 | | — | | — | | 0.26 | | | — | | | 0.30 | | 0.30 | |
|
|
|
|
|
|
|
|
|
|
|
|
|
|
|
|
|
|
Class Y | | 6/8/04 | | 0.55 | | 2.22 | | 2.15 | | | 0.17 | | | 0.40 | | 0.40 | |
|
|
|
|
|
|
|
|
|
|
|
|
|
|
|
|
|
|
Lipper Tax-Exempt Money | | | | | | | | | | | | | | | | | |
Market Funds Average1 | | — | | 0.29 | | 1.93 | | 1.83 | 4 | | N/A | | | N/A | | N/A | |
|
|
|
|
|
|
|
|
|
|
|
|
|
|
|
|
|
|
Past performance does not guarantee future results. The performance data quoted represents past performance and current returns may be lower or higher. Total return figures include change in share price, reinvestment of dividends and capital gains and do not reflect taxes that a shareholder would pay on fund distributions or on the redemption of fund shares. The investment return and principal value will fluctuate so that an investor’s shares, when redeemed may be worth more or less than the original cost. To obtain performance information current to the most recent month end, please call 1-800-782-8183.
The performance above reflects any fee waivers that have been in effect during the applicable periods, as well as any expense reimbursements that have periodically been made. Absent such waivers and reimbursements, returns would have been lower.
| |
** | Class A Shares were operational during a portion of the periods presented. Amounts reflect performance for the period of the time the class had operations, which was 262 days, 24 days, 78 days and 5 days during the years ended October 31, 2009, 2007, 2006 and 2004, respectively. |
| |
*** | Class I Shares were operational during a portion of the periods presented. Amounts reflect performance for the period of the time the class had operations, which was 27 and 40 days during the years ended October 31, 2005 and 2004, respectively. |
| |
1 | For additional information, please refer to the Glossary of Terms. |
| |
2 | The 7-day yield quotation more closely reflects the current earnings of the Fund than the total return quotation. |
| |
3 | Reflects the expense ratio as reported in the prospectus dated February 27, 2009. |
| |
4 | Return for the period 5/31/04 to 10/31/09. |
| |
7 | HSBC INVESTOR FAMILY OF FUNDS |
| |
Portfolio Reviews |
|
|
HSBC Investor U.S. Government Money Market Fund
(Class A Shares, B Shares, C Shares, D Shares, I Shares and Y Shares) |
|
Moody’s and Standard & Poor’s
have assigned an “Aaa” and
“AAAm” rating to the HSBC
Investor U.S. Government
Money Market Fund.1 |
|
by John Chiodi
Senior Portfolio Manager |
|
|
Investment Concerns
An investment in the Fund is not insured or guaranteed by the FDIC or any other government agency. Although the Fund seeks to preserve the value of your investment at $1.00 per share, it is possible to lose money by investing in the Fund.
The turmoil in the U.S. economy at the beginning of the period led the Federal Reserve Board (the “Fed”) to reduce key short-term interest rates to historically low levels. The Fed lowered the federal funds rate from 1.00% to a range between 0.00% and 0.25%, in hopes of stemming the economic downturn and financial crisis. The money markets were deeply affected by those rate cuts, which caused yields on money market securities to decline significantly early in the period.
The economic downturn caused a great deal of uncertainty in the financial markets. As a result, investors early in the period favored relatively safe areas of the market such as government-issued money market securities, leading to significant inflows for the Fund. We sought to maintain liquidity in that environment in case that flight to quality reversed course.
As the period wore on we employed a barbell structure, in which we invested in a combination of short-term and longer-term securities. That approach enabled us to capture additional yield at the long end of the yield curve, while maintaining liquidity in case of higher outflows.*
* Portfolio composition is subject to change.
| | | | | | | | | | | | | | | | | | | |
Fund Performance | | | | Average Annual
Total Return (%) | | Yield (%)3 | | | Expense
Ratio (%)4 | |
|
|
|
|
|
|
|
|
|
|
|
As of October 31, 2009 | | Inception
Date | | 1
Year | | 5
Year | | 10
Year | | Since
Inception | | 7-Day
Average | | | Gross | | Net | |
|
|
|
|
|
|
|
|
|
|
|
|
|
|
|
|
|
|
|
|
Class A | | 5/3/90 | | 0.14 | | 2.63 | | 2.49 | | 3.55 | | | 0.02 | | | 0.67 | | 0.67 | |
|
|
|
|
|
|
|
|
|
|
|
|
|
|
|
|
|
|
|
|
Class B** | | 9/11/98 | | -3.92 | | 2.49 | | 2.22 | | 2.40 | | | 0.02 | | | 1.27 | | 1.27 | |
|
|
|
|
|
|
|
|
|
|
|
|
|
|
|
|
|
|
|
|
Class C*** | | 11/20/06 | | -0.92 | | — | | — | | 1.84 | | | 0.05 | | | 1.27 | | 1.27 | |
|
|
|
|
|
|
|
|
|
|
|
|
|
|
|
|
|
|
|
|
Class D | | 4/1/99 | | 0.18 | | 2.76 | | 2.63 | | 2.73 | | | 0.02 | | | 0.52 | | 0.52 | |
|
|
|
|
|
|
|
|
|
|
|
|
|
|
|
|
|
|
|
|
Class I**** | | 12/24/03 | | 0.43 | | — | | — | | 2.88 | | | 0.10 | | | 0.17 | | 0.17 | |
|
|
|
|
|
|
|
|
|
|
|
|
|
|
|
|
|
|
|
|
Class Y | | 7/1/96 | | 0.32 | | 3.00 | | 2.88 | | 3.40 | | | 0.02 | | | 0.27 | | 0.27 | |
|
|
|
|
|
|
|
|
|
|
|
|
|
|
|
|
|
|
|
|
Lipper U.S. Government
Money Market Funds Average2 | | — | | 0.20 | | 2.61 | | 2.51 | | 3.585 | | | N/A | | | N/A | | N/A | |
|
|
|
|
|
|
|
|
|
|
|
|
|
|
|
|
|
|
|
|
Past performance does not guarantee future results. The performance data quoted represents past performance and current returns may be lower or higher. Total return figures include change in share price, reinvestment of dividends and capital gains and do not reflect taxes that a shareholder would pay on fund distributions or on the redemption of fund shares. The investment return and principal value will fluctuate so that an investor’s shares, when redeemed may be worth more or less than the original cost. To obtain performance information current to the most recent month end, please call 1-800-782-8183.
The performance above reflects any fee waivers that have been in effect during the applicable periods, as well as any expense reimbursements that have periodically been made. Absent such waivers and reimbursements, returns would have been lower. Currently, for Class I Shares contractual fee waivers are in effect from March 1, 2009 through March 1, 2010.
| |
** | Reflects the applicable contingent deferred sales charge, maximum of 4.00%. |
| |
*** | Reflects the applicable contingent deferred sales charge, maximum of 1.00%. |
| |
**** | Class I Shares were operational during a portion of the periods presented. Amounts reflect performance for the period of the time the class had operations, which was 357 days, 136 days, 89 days and 10 days during the years ended October 31, 2007, 2006, 2005 and 2004, respectively. |
| |
1 | The “Aaa” and “AAAm” money market fund rating is historical and reflects the superior quality of the Fund’s investments, sound liquidity management, and strong operations and trading support. Periodic reviews are conducted to ensure a secure operations environment. Moody’s and Standard & Poor’s ratings represent an opinion only, not a recommendation to buy or sell. |
| |
2 | For additional information, please refer to the Glossary of Terms. |
| |
3 | The 7-day yield quotation more closely reflects the current earnings of the Fund than the total return quotation. |
| |
4 | Reflects the expense ratio as reported in the prospectus dated February 27, 2009. |
| |
5 | Return for the period 4/30/09 to 10/31/09. |
| |
HSBC INVESTOR FAMILY OF FUNDS | 8 |
| |
Portfolio Reviews | �� |
|
|
HSBC Investor U.S. Treasury Money Market Fund |
|
(Class A Shares, B Shares, C Shares, D Shares, I Shares and Y Shares) | Standard & Poor’s has assigned an
“AAA” rating to the HSBC Investor
U.S. Treasury Money Market Fund.1 |
|
by John Chiodi
Senior Portfolio Manager |
|
|
Investment Concerns
An investment in the Fund is not insured or guaranteed by the FDIC or any other government agency. Although the Fund seeks to preserve the value of your investment at $1.00 per share, it is possible to lose money by investing in the fund. The Fund’s income may be subject to the federal alternative minimum tax and to certain state and local taxes.
The turmoil in the U.S. economy at the beginning of the period led the Federal Reserve Board (the “Fed”) to reduce key short-term interest rates to historically low levels. The Fed lowered the federal funds rate from 1.00% to a range between 0.00% and 0.25%, in hopes of stemming the economic downturn and financial crisis. The money markets were deeply affected by those rate cuts, which caused yields on money market securities to decline significantly early in the period.
The economic downturn caused a great deal of uncertainty in the financial markets. As a result, investors early in the period favored relatively safe areas of the market such as government-issued money market securities, leading to significant inflows for the Fund. We sought to maintain liquidity in that environment in case that flight to quality reversed course.
To preserve liquidity, we focused a significant portion of the Fund’s portfolio on short-term issues. The high demand for such securities pushed down their yields—in fact, yields on certain short-term instruments briefly dipped into negative territory. As the period wore on we employed a barbell structure, in which we invested in a combination of short-term and longer-term securities. That approach enabled us to capture additional yield at the long end of the yield curve, while maintaining liquidity in case of higher outflows.*
* Portfolio composition is subject to change.
| | | | | | | | | | | | | | | | | |
Fund Performance | | | | Average Annual
Total Return (%) | | | Yield (%)3 | | Expense
Ratio (%)4 | | | |
|
|
|
|
|
|
|
|
|
|
|
|
|
As of October 31, 2009 | | Inception
Date | | 1
Year | | 5
Year | | Since
Inception | | 7-Day
Average | | Gross | | Net | |
|
|
|
|
|
|
|
|
|
|
|
|
|
|
|
|
|
Class A | | 5/24/01 | | 0.07 | | 2.24 | | 1.66 | | | 0.02 | | | 0.66 | | 0.66 | |
|
|
|
|
|
|
|
|
|
|
|
|
|
|
|
|
|
|
Class B** | | 8/13/04 | | -3.93 | | 1.77 | | 1.70 | | | 0.02 | | | 1.26 | | 1.26 | |
|
|
|
|
|
|
|
|
|
|
|
|
|
|
|
|
|
|
Class C*** | | 12/24/03 | | -0.93 | | 0.02 | | 0.07 | | | 0.02 | | | 1.26 | | 1.26 | |
|
|
|
|
|
|
|
|
|
|
|
|
|
|
|
|
|
|
Class D | | 5/14/01 | | 0.07 | | 2.36 | | 1.80 | | | 0.02 | | | 0.51 | | 0.51 | |
|
|
|
|
|
|
|
|
|
|
|
|
|
|
|
|
|
|
Class I**** | | 12/30/03 | | 0.14 | | 2.62 | | 2.24 | | | 0.02 | | | 0.16 | | 0.16 | |
|
|
|
|
|
|
|
|
|
|
|
|
|
|
|
|
|
|
Class Y | | 5/11/01 | | 0.08 | | 2.57 | | 2.03 | | | 0.02 | | | 0.26 | | 0.26 | |
|
|
|
|
|
|
|
|
|
|
|
|
|
|
|
|
|
|
Lipper U.S. Treasury
Money Market Funds Average2 | | — | | 0.05 | | 2.29 | | 1.815 | | | N/A | | | N/A | | N/A | |
|
|
|
|
|
|
|
|
|
|
|
|
|
|
|
|
|
|
Past performance does not guarantee future results. The performance data quoted represents past performance and current returns may be lower or higher. Total return figures include change in share price, reinvestment of dividends and capital gains and do not reflect taxes that a shareholder would pay on fund distributions or on the redemption of fund shares. The investment return and principal value will fluctuate so that an investor’s shares, when redeemed may be worth more or less than the original cost. To obtain performance information current to the most recent month end, please call 1-800-782-8183.
The performance above reflects any fee waivers that have been in effect during the applicable periods, as well as any expense reimbursements that have periodically been made. Absent such waivers and reimbursements, returns would have been lower. Currently, for Class I contractual fee waivers are in effect from March 1, 2009 through March 1, 2010.
| |
** | Reflects the applicable contingent deferred sales charge, maximum of 4.00%. |
| |
*** | Reflects the applicable contingent deferred sales charge, maximum of 1.00%. |
| |
**** | Class I Shares were operational during a portion of the periods presented. Amounts reflect performance for the period of the time the class had operations, which was 280 and 13 days during the years ended October 31, 2005 and 2004, respectively. |
| |
1 | The “AAA” money market fund rating is historical and reflects the superior quality of the Fund’s investments, sound liquidity management, and strong operations and trading support. Periodic reviews are conducted to ensure a secure operations environment. Standard & Poor’s rating represent an opinion only, not a recommendation to buy or sell. |
| |
2 | For additional information, please refer to the Glossary of Terms. |
| |
3 | The 7-day yield quotation more closely reflects the current earnings of the Fund than the total return quotation. |
| |
4 | Reflects the expense ratio as reported in the prospectus dated February 27, 2009. |
| |
5 | Return for the period 4/30/01 to 10/31/09. |
| |
9 | HSBC INVESTOR FAMILY OF FUNDS |
|
Portfolio Reviews |
|
Portfolio Composition* |
October 31, 2009
(Unaudited) |
| | | | |
HSBC Investor California Tax-Free Money Market Fund | | | | |
|
|
|
|
|
| | | | |
Investment Allocation | | Percentage of Investments at Value | |
|
|
|
|
Variable Rate Demand Notes | | 85.3 | % | |
|
|
|
|
|
Commercial Paper and Notes | | 11.6 | % | |
|
|
|
|
|
Cash and Equivalents | | 2.3 | % | |
|
|
|
|
|
Municipal Bonds | | 0.8 | % | |
|
|
|
|
|
Total | | 100.0 | % | |
|
|
|
|
|
| | | | |
HSBC Investor N.Y. Tax-Free Money Market Fund | | | | |
|
|
|
|
|
| | | | |
Investment Allocation | | Percentage of Investments at Value | |
|
|
|
|
Variable Rate Demand Notes | | 79.3 | % | |
|
|
|
|
|
Tax-Free Notes and Commercial Paper | | 17.9 | % | |
|
|
|
|
|
Cash and Equivalents | | 2.8 | % | |
|
|
|
|
|
Total | | 100.0 | % | |
|
|
|
|
|
| | | | |
HSBC Investor Prime Money Market Fund | | | | |
|
|
|
|
|
| | | | |
Investment Allocation | | Percentage of Investments at Value | |
|
|
|
|
Certificates of Deposit | | 29.6 | % | |
|
|
|
|
|
Commercial Paper and Notes | | 26.9 | % | |
|
|
|
|
|
Time Deposits | | 17.4 | % | |
|
|
|
|
|
U.S. Government and Government Agency Obligations | | 16.8 | % | |
|
|
|
|
|
Variable Rate Demand Notes | | 4.5 | % | |
|
|
|
|
|
U.S. Treasury Obligations | | 2.7 | % | |
|
|
|
|
|
Corporate Obligations | | 2.1 | % | |
|
|
|
|
|
Total | | 100.0 | % | |
|
|
|
|
|
| | | | |
HSBC Investor Tax-Free Money Market Fund | | | | |
|
|
|
|
|
| | | | |
Investment Allocation | | Percentage of Investments at Value | |
|
|
|
|
Municipal Bonds | | 42.4 | % | |
|
|
|
|
|
Variable Rate Demand Notes | | 32.5 | % | |
|
|
|
|
|
Commercial Paper and Notes | | 22.9 | % | |
|
|
|
|
|
Cash and Equivalents | | 2.2 | % | |
|
|
|
|
|
Total | | 100.0 | % | |
|
|
|
|
|
| | | | |
HSBC Investor U.S. Government Money Market Fund | | | | |
|
|
|
|
|
| | | | |
Investment Allocation | | Percentage of Investments at Value | |
|
|
|
|
Repurchase Agreements | | 58.2 | % | |
|
|
|
|
|
U.S. Government and Government Agency Obligations | | 40.6 | % | |
|
|
|
|
|
U.S. Treasury Obligations | | 1.2 | % | |
|
|
|
|
|
Total | | 100.0 | % | |
|
|
|
|
|
| | | | |
HSBC Investor U.S. Treasury Money Market Fund | | | | |
|
|
|
|
|
| | | | |
Investment Allocation | | Percentage of Investments at Value | |
|
|
|
|
U.S. Treasury Bills | | 97.5 | % | |
|
|
|
|
|
U.S. Treasury Notes | | 2.5 | % | |
|
|
|
|
|
Total | | 100.0 | % | |
|
|
|
|
|
| |
* | Portfolio composition is subject to change. |
| |
HSBC INVESTOR FAMILY OF FUNDS | 10 |
(This Page Intentionally Left Blank)
|
HSBC INVESTOR CALIFORNIA TAX-FREE MONEY MARKET FUND |
|
Schedule of Portfolio Investments—As of October 31, 2009 |
| | | | | | | |
Variable Rate Demand Notes—85.3% | | | | | | | |
|
|
|
|
|
|
|
|
| | | | | | | |
| | Principal
Amount ($) | | Amortized
Cost ($) | |
| |
| |
| |
California – 85.3% | | | | | | | |
ABAG Finance Authority for
Nonprofit Corporations Certificates of
Participation, Series C-98B, 0.15%,
10/1/27, (LOC U.S. Bank N.A.) (a) | | | 600,000 | | | 600,000 | |
ABAG Finance Authority for
Nonprofit Corporations Multi-family
Revenue, Series A, 0.22%, 12/15/32,
(Credit Support FNMA) (a) | | | 1,000,000 | | | 1,000,000 | |
ABAG Finance Authority for
Nonprofit Corporations Multi-family
Revenue, Series A, 0.39%, 12/15/32,
AMT, (Credit Support FNMA, Liquidity
Facility FNMA) (a) | | | 1,100,000 | | | 1,100,000 | |
ABAG Finance Authority for
Nonprofit Corporations Revenue,
0.30%, 7/1/35, (LOC Wells Fargo
Bank N.A., U.S. Bank N.A.) (a) | | | 1,500,000 | | | 1,500,000 | |
ABAG Finance Authority for
Nonprofit Corporations Revenue, 0.22%,
9/1/35, (LOC Bank of New York) (a) | | | 775,000 | | | 775,000 | |
Anaheim California Union High School
District Certificates of Participation,
0.40%, 9/1/21, (Credit Support FSA,
SPA Wachovia Bank N.A.) (a) | | | 1,000,000 | | | 1,000,000 | |
Anaheim California Union High School
District Certificates of Participation,
0.40%, 9/1/29, (Credit Support FSA,
SPA First Union National Bank) (a) | | | 1,485,000 | | | 1,485,000 | |
Antelope Valley-East Kern California
Water Agency Certificates of
Participation, Series A-2, 0.16%,
6/1/37, (LOC Wells Fargo Bank
N.A.) (a) | | | 1,000,000 | | | 1,000,000 | |
Burbank California Redevelopment
Agency Multi-family Housing
Revenue, Series A, 0.20%, 11/1/10,
(LOC FHLB, Washington Mutual
Bank) (a) | | | 1,500,000 | | | 1,500,000 | |
California Economic Development
Financing Authority IDR, 0.39%,
5/1/23, AMT, (LOC Wells Fargo
Bank N.A.) (a) | | | 1,490,000 | | | 1,490,000 | |
California Health Facilities Financing
Authority Revenue, Series A, 0.16%,
8/1/21, (LOC U.S. Bank N.A.) (a) | | | 500,000 | | | 500,000 | |
California Health Facilities Financing
Authority Revenue, Series B, 0.17%,
9/1/28, (LOC Bank of America
N.A.) (a) | | | 500,000 | | | 500,000 | |
California Health Facilities Financing
Authority Revenue, Series F, 0.17%,
10/1/31, (LOC Northern Trust
Co.) (a) | | | 975,000 | | | 975,000 | |
California Health Facilities Financing
Authority Revenue, Series B, 0.25%,
11/15/36, (Credit Support FSA, SPA
Dexia Credit Local) (a) | | | 2,000,000 | | | 2,000,000 | |
California Health Facilities Financing
Authority Revenue, Series A-2,
0.20%, 11/15/40, (LOC Bank of
America N.A.) (a) | | | 1,800,000 | | | 1,800,000 | |
| | | | | | | |
Variable Rate Demand Notes, continued | | | | | | | |
|
|
|
|
|
|
|
|
| | | | | | | |
| | Principal
Amount ($) | | Amortized
Cost ($) | |
| |
| |
| |
California, continued | | | | | | | |
California Housing Finance Agency
Revenue, Series F, 0.85%, 2/1/22,
AMT, (Credit Support FSA, SPA
Dexia Credit Local) (a) | | | 500,000 | | | 500,000 | |
California Infrastructure & Economic
Development Bank Revenue, Series A,
0.18%, 12/1/31, (LOC Bank of
America N.A.) (a) | | | 500,000 | | | 500,000 | |
California Infrastructure & Economic
Development Bank Revenue,
0.21%, 11/15/37, (LOC Bank of New
York, California State Teacher’s
Retirement) (a) | | | 1,500,000 | | | 1,500,000 | |
California Infrastructure & Economic
Development Bank Revenue, Series E,
0.17%, 9/1/38, (LOC Northern Trust
Co.) (a) | | | 500,000 | | | 500,000 | |
California Infrastructure & Economic
Development Bank Revenue, Series F,
0.17%, 9/1/38, (LOC Wells Fargo
Bank N.A.) (a) | | | 900,000 | | | 900,000 | |
California Infrastructure & Economic
Development Bank Revenue, Series A,
0.17%, 9/1/38, (LOC U.S. Bank
N.A.) (a) | | | 500,000 | | | 500,000 | |
California Municipal Finance Authority
Revenue, 0.20%, 7/1/38, (LOC U.S.
Bank N.A.) (a) | | | 1,500,000 | | | 1,500,000 | |
California Municipal Finance Authority
Solid Waste Disposal Revenue,
Series A, 0.22%, 2/1/19, (LOC JP
Morgan Chase Bank) (a) | | | 1,500,000 | | | 1,500,000 | |
California Pollution Control Financing
Authority Revenue, Series C,
0.25%, 11/1/17, AMT, (LOC BNP
Paribas) (a) | | | 1,000,000 | | | 1,000,000 | |
California Pollution Control Financing
Authority Revenue, 0.19%, 11/1/26,
(LOC Bank One N.A.) (a) | | | 500,000 | | | 500,000 | |
California Pollution Control Financing
Authority Revenue, Series C, 0.19%,
11/1/26, (LOC JP Morgan Chase
Bank) (a) | | | 500,000 | | | 500,000 | |
California State Department of Water
Resources Power Supply Revenue,
0.15%, 5/1/11, (LOC Lloyds TSB
Bank PLC) (a) | | | 2,000,000 | | | 2,000,000 | |
California State Department of Water
Resources Power Supply Revenue,
0.18%, 5/1/20, (LOC JPMorgan Chase
Bank, Societe Generale) (a) | | | 1,000,000 | | | 1,000,000 | |
California State Department of Water
Resources Power Supply Revenue,
0.21%, 5/1/22, (LOC Bayerische
Landesbank) (a) | | | 2,000,000 | | | 2,000,000 | |
California State Department of Water
Resources Power Supply Revenue,
Series B-5, 0.18%, 5/1/22, (LOC
Bayerische Landesbank, Westdeutsche
Landesbank) (a) | | | 1,000,000 | | | 1,000,000 | |
| | |
See notes to financial statements. | HSBC INVESTOR FAMILY OF FUNDS | 12 |
|
HSBC INVESTOR CALIFORNIA TAX-FREE MONEY MARKET FUND |
|
Schedule of Portfolio Investments—As of October 31, 2009 (continued) |
| | | | | | | |
Variable Rate Demand Notes, continued | | | | | | | |
|
|
|
|
|
|
|
|
| | | | | | | |
| | Principal
Amount ($) | | Amortized
Cost ($) | |
| |
| |
| |
California, continued | | | | | | | |
California State Economic Development
Financing Authority IDR, 0.39%,
4/1/16, AMT, (LOC Wells Fargo
Bank N.A.) (a) | | | 500,000 | | | 500,000 | |
California State Economic Recovery
GO, Series C-15, 0.60%, 7/1/23,
(Credit Support FSA State
Guaranteed, SPA Dexia Credit
Local) (a) | | | 1,320,000 | | | 1,320,000 | |
California State GO, Series A-3, 0.18%,
5/1/33, (LOC Westdeutsche
Landesbank AG, JP Morgan Chase
Bank) (a) | | | 1,000,000 | | | 1,000,000 | |
California State GO, Series B-3, 0.18%,
5/1/33, (LOC BNP Paribas, Bank of
New York, California State Teacher’s
Retirement) (a) | | | 510,000 | | | 510,000 | |
California State GO, Series B-1, 0.20%,
5/1/33, (LOC BNP Paribas, Bank of
New York, California State Teacher’s
Retirement) (a) | | | 1,000,000 | | | 1,000,000 | |
California State GO, Series A-2, 0.22%,
5/1/33, (LOC Westdeutsche
Landesbank, JP Morgan Chase
Bank) (a) | | | 2,000,000 | | | 2,000,000 | |
California State GO, 0.22%, 5/1/33,
(LOC Westlandesbank AG, JP Morgan
Chase Bank) (a) | | | 2,500,000 | | | 2,500,000 | |
California Statewide Communities
Development Authority Multi-family
Revenue, Series J, 0.19%, 9/1/29,
(LOC Wells Fargo Bank N.A.) (a) | | | 500,000 | | | 500,000 | |
California Statewide Communities
Development Authority Multi-family
Revenue, Series S, 0.22%, 8/1/32,
AMT, (LOC U.S. Bank N.A.) (a) | | | 1,500,000 | | | 1,500,000 | |
California Statewide Communities
Development Authority Multi-family
Revenue, Series BB, 0.32%, 12/1/34,
AMT, (LOC Citibank N.A.) (a) | | | 860,000 | | | 860,000 | |
California Statewide Communities
Development Authority Revenue,
0.25%, 5/1/25, (LOC Bank of New
York) (a) | | | 1,065,000 | | | 1,065,000 | |
California Statewide Communities
Development Authority Revenue,
Series C, 0.21%, 8/15/27, (LOC Wells
Fargo Bank N.A.) (a) | | | 500,000 | | | 500,000 | |
California Statewide Communities
Development Authority Revenue,
Series A, 0.19%, 3/1/31, (LOC BNP
Paribas) (a) | | | 1,000,000 | | | 1,000,000 | |
California Statewide Communities
Development Authority Revenue,
Series B, 0.17%, 8/15/36,
(LOC UBS AG) (a) | | | 1,500,000 | | | 1,500,000 | |
California Statewide Communities
Development Authority Revenue,
0.17%, 11/15/38, (LOC Bank of
America N.A.) (a) | | | 500,000 | | | 500,000 | |
| | | | | | | |
Variable Rate Demand Notes, continued | | | | | | | |
|
|
|
|
|
|
|
|
| | | | | | | |
| | Principal
Amount ($) | | Amortized
Cost ($) | |
| |
| |
| |
California, continued | | | | | | | |
California Statewide Communities
Development Authority Revenue,
Series D, 0.20%, 8/15/41, (LOC
Wachovia Bank N.A.) (a) | | | 500,000 | | | 500,000 | |
Concord California Multi-family
Mortgage Revenue, Series A, 0.32%,
12/1/16, AMT, (Credit Support
FHLMC, Liquidity Facility
FHLMC) (a) | | | 1,425,000 | | | 1,425,000 | |
Contra Costa County California Housing
Authority Multi-family Revenue,
0.18%, 11/15/17, (Credit Support
FHLMC) (a) | | | 1,075,000 | | | 1,075,000 | |
Contra Costa County California
Multi-family Mortgage Revenue,
Series B, 0.20%, 11/15/22, (Credit
Support FNMA, Liquidity Facility
FNMA) (a) | | | 900,000 | | | 900,000 | |
Hayward California Housing Authority
Multi-family Housing Revenue,
Series A, 0.20%, 6/15/25, (Credit
Support FNMA, Liquidity Facility
FNMA) (a) | | | 950,000 | | | 950,000 | |
Hemet California Unified School
District Certificates of Participation,
0.20%, 10/1/36, (LOC State Street
B&T Co.) (a) | | | 1,445,000 | | | 1,445,000 | |
Hesperia California Unified School
District Certificates of Participation,
1.75%, 2/1/18, (Credit Support FSA,
SPA Dexia Bank) (a) | | | 1,100,000 | | | 1,100,000 | |
Irvine California Improvement Bond Act
1915 Revenue, 0.16%, 9/2/20, (LOC
State Street B&T Co.) (a) | | | 500,000 | | | 500,000 | |
Irvine California Improvement Bond Act
1915 Revenue, Series A, 0.16%,
9/2/29, (LOC Bank of New York,
California State Teacher’s
Retirement) (a) | | | 1,000,000 | | | 1,000,000 | |
Irvine California Improvement Bond Act
1915 Revenue, Series A, 0.17%,
9/2/31, (LOC Bank of New York,
California State Teacher’s
Retirement) (a) | | | 1,085,000 | | | 1,085,000 | |
Irvine Public Facilities & Infrastructure
Authority Lease Revenue, 0.70%,
11/1/10, (LOC State Street B&T
Co.) (a) | | | 790,000 | | | 790,000 | |
Irvine Ranch California Water District
GO, Series A, 0.15%, 11/15/13, (LOC
Landesbank Hessen-Thuringen) (a) | | | 700,000 | | | 700,000 | |
Irvine Ranch California Water District
GO, Series A, 0.15%, 11/15/13, (LOC
Landesbank Hessen-Thuringen) (a) | | | 900,000 | | | 900,000 | |
Kern California Water Bank Authority
Revenue, Series A, 0.26%, 7/1/28,
(LOC Wells Fargo Bank N.A.) (a) | | | 615,000 | | | 615,000 | |
Los Angeles California Wastewater
System Revenue, Series A, 0.20%,
6/1/28, (LOC Bank of Nova
Scotia) (a) | | | 500,000 | | | 500,000 | |
| | |
13 | HSBC INVESTOR FAMILY OF FUNDS | See notes to financial statements. |
|
HSBC INVESTOR CALIFORNIA TAX-FREE MONEY MARKET FUND |
|
Schedule of Portfolio Investments—As of October 31, 2009 (continued) |
| | | | | | | |
Variable Rate Demand Notes, continued | | | | | | | |
|
|
| | Principal
Amount ($) | | Amortized
Cost ($) | |
| |
| |
| |
California, continued | | | | | | | |
Los Angeles County California
Metropolitan Transportation Authority
Sales Tax Revenue, Series C-4, 0.20%,
7/1/25, (LOC U.S. Bank N.A.) (a) | | | 1,600,000 | | | 1,600,000 | |
Los Angeles County California
Metropolitan Transportation Authority
Sales Tax Revenue, Series C-3, 0.25%,
7/1/25, (LOC Sumitomo Mitsui Banking Corp.) (a) | | | 1,500,000 | | | 1,500,000 | |
Los Angeles County California
Multi-family Mortgage Revenue,
Series C, 0.18%, 4/1/31, (Credit
Support FHLMC, Liquidity Facility
FHLMC) (a) | | | 2,015,000 | | | 2,015,000 | |
Los Angeles County Housing Authority
Multi-family Housing Revenue,
0.20%, 12/1/32, (Credit Support
FHLMC) (a) | | | 3,000,000 | | | 3,000,000 | |
Los Angeles County Housing Authority
Multi-family Housing Revenue,
0.20%, 5/1/33, (Credit Support
FHLMC) (a) | | | 1,150,000 | | | 1,150,000 | |
Los Angeles Unified School District
Certificates of Participation, Series A,
0.17%, 12/1/17, (LOC Bank of
New York) (a) | | | 900,000 | | | 900,000 | |
Modesto California Multi-family
Housing Revenue, Series A, 0.20%,
8/1/38, (Credit Support FHLMC,
Liquidity Facility FHLMC) (a) | | | 1,500,000 | | | 1,500,000 | |
Morgan Hill Redevelopment Agency Tax
Allocation, 0.18%, 9/1/33, (LOC
Scotiabank) (a) | | | 1,000,000 | | | 1,000,000 | |
Northern California Transmission
Agency Revenue, 0.30%, 5/1/24,
(LOC FSA, SPA Dexia Credit
Local) (a) | | | 1,150,000 | | | 1,150,000 | |
Oakland-Alameda County California
Coliseum Authority Lease Revenue,
Series C-1, 0.23%, 2/1/25, (LOC Bank
of New York, California State
Teacher’s Retirement) (a) | | | 1,600,000 | | | 1,600,000 | |
Orange County California Apartment
Development Revenue, Series F,
0.20%, 8/15/28, (Credit Support
FNMA, Liquidity Facility FNMA) (a) | | | 1,000,000 | | | 1,000,000 | |
Orange County California Apartment
Development Revenue, Series 2,
0.18%, 11/15/28, (Credit Support
FNMA) (a) | | | 500,000 | | | 500,000 | |
Orange County California Apartment
Development Revenue, Series J,
0.23%, 11/15/28, (Credit Support
FNMA, Liquidity Facility FNMA) (a) | | | 2,500,000 | | | 2,500,000 | |
Otay California Water District
Certificates of Participation, 0.25%,
9/1/26, (LOC Landesbank
Hessen-Thuringen) (a) | | | 2,900,000 | | | 2,900,000 | |
Oxnard California Housing Finance
Authority Multi-family Housing
Revenue, Series A, 0.30%, 12/1/20,
AMT, (Credit Support FNMA, Liquidity
Facility FNMA) (a) | | | 2,000,000 | | | 2,000,000 | |
| | | | | | | |
Variable Rate Demand Notes, continued | | | | | | | |
|
| | | | | |
| | Principal
Amount ($) | | Amortized
Cost ($) | |
| |
| |
| |
California, continued | | | | | | | |
Perris California Union High School
District Certificates of Participation,
1.75%, 9/1/33, (Credit Support FSA,
SPA Dexia Credit Local) (a) | | | 1,500,000 | | | 1,500,000 | |
Pittsburg California Redevelopment
Agency Tax Allocation, Series A,
0.18%, 9/1/35, (LOC State Street
B&T Co., California State Teacher’s
Retirement) (a) | | | 4,000,000 | | | 4,000,000 | |
Pleasanton California Certificates of
Participation, 0.20%, 11/1/40, (LOC
Citibank N.A.) (a) | | | 1,000,000 | | | 1,000,000 | |
Riverside County California Certificates
of Participation, 0.21%, 12/1/15,
(LOC State Street B&T Co.) (a) | | | 3,000,000 | | | 3,000,000 | |
Sacramento County California Sanitation
District Financing Authority Revenue,
Series A, 0.18%, 12/1/36, (LOC Bank
of America N.A.) (a) | | | 1,000,000 | | | 1,000,000 | |
Sacramento County California Sanitation
District Financing Authority Revenue,
Series B, 0.18%, 12/1/37, (LOC Bank
of America N.A.) (a) | | | 1,500,000 | | | 1,500,000 | |
San Bernardino County California
Certificates of Participation, 0.17%,
7/1/15, (LOC BNP Paribas) (a) | | | 800,000 | | | 800,000 | |
San Bernardino County California
Multi-family Revenue, Series A,
0.23%, 5/15/29, (Credit Support
FNMA, Liquidity Facility FNMA) (a) | | | 525,000 | | | 525,000 | |
San Bernardino County California
Multi-family Revenue, Series A,
0.23%, 5/15/29, (Credit Support
FNMA, Liquidity Facility FNMA) (a) | | | 1,000,000 | | | 1,000,000 | |
San Diego California Housing Authority
Multi-family Housing Revenue,
Series F, 0.25%, 9/1/39, AMT,
(Credit Support FHLMC, Liquidity
Facility FHLMC) (a) | | | 2,200,000 | | | 2,200,000 | |
San Jacinto California Unified School
District Certificates of Participation,
0.40%, 10/1/28, (LOC FSA, SPA
Wachovia Bank N.A.) (a) | | | 1,100,000 | | | 1,100,000 | |
San Jose California Redevelopment
Agency Revenue, Series B, 0.18%,
8/1/32, (LOC JP Morgan Chase
Bank) (a) | | | 800,000 | | | 800,000 | |
San Rafael California Redevelopment
Agency Multi-family Revenue,
Series A, 0.29%, 9/1/31, (LOC
Citibank N.V.) (a) | | | 500,000 | | | 500,000 | |
Stockton California Health Facilities
Revenue, Series A, 0.18%, 12/1/32,
(LOC Citibank N.V.) (a) | | | 1,465,000 | | | 1,465,000 | |
Stockton California Public Financing
Authority Lease Revenue, Series A,
1.75%, 9/1/48, (LOC Assured
Guaranty, SPA Dexia Credit
Local) (a) | | | 1,400,000 | | | 1,400,000 | |
Tahoe Forest California Hospital District
Revenue, 0.18%, 7/1/33, (LOC U.S.
Bank N.A.) (a) | | | 1,685,000 | | | 1,685,000 | |
| | |
See notes to financial statements. | HSBC INVESTOR FAMILY OF FUNDS | 14 |
|
HSBC INVESTOR CALIFORNIA TAX-FREE MONEY MARKET FUND |
|
Schedule of Portfolio Investments—As of October 31, 2009 (continued) |
| | | | | | | |
Variable Rate Demand Notes, continued |
|
| | | | | | | |
| | Principal
Amount ($) | | Amortized
Cost ($) | |
| |
| |
| |
California, continued | | | | | | | |
Three Valleys California Municipal
Water District Certificates of
Participation, 0.25%, 11/1/14, (LOC
Wells Fargo Bank N.A.) (a) | | | 1,000,000 | | | 1,000,000 | |
Tracy California Multi-family Housing
Revenue, Series A, 0.20%, 5/1/15,
(LOC FHLMC) (a) | | | 1,700,000 | | | 1,700,000 | |
Tustin California Improvement Bond Act
1915, Series A, 0.18%, 9/2/13, (LOC
Bank of New York) (a) | | | 500,000 | | | 500,000 | |
Walnut Creek California Multi-family
Housing Revenue, 0.20%, 4/1/27,
(Credit Support FHLMC, Liquidity
Facility FHLMC) (a) | | | 2,000,000 | | | 2,000,000 | |
Whittier California Health Facility
Revenue, Series B, 0.17%, 6/1/36,
(LOC U.S. Bank N.A.) (a) | | | 1,000,000 | | | 1,000,000 | |
| | | | |
|
| |
| | | | | | 116,355,000 | |
| | | | |
|
| |
TOTAL VARIABLE RATE DEMAND
NOTES (COST $116,355,000) | | | | | | 116,355,000 | |
| | | | |
|
| |
Municipal Bonds—0.8% | | | | | | | |
|
|
California – 0.8% | | | | | | | |
California State GO, 5.25%, 9/1/18,
prerefunded 9/1/10 @ 100 | | | 1,000,000 | | | 1,040,066 | |
| | | | |
|
| |
TOTAL MUNICIPAL BONDS
(COST $1,040,066) | | | | | | 1,040,066 | |
| | | | |
|
| |
Commercial Paper And Notes—11.6% | | | | | | | |
|
|
California – 11.6% | | | | | | | |
Los Angeles Municipal Improvement,
0.30%, 11/18/09 | | | 1,000,000 | | | 1,000,000 | |
Los Angeles Municipal Improvement,
0.30%, 12/1/09 | | | 1,000,000 | | | 1,000,000 | |
Orange County Local Transit,
0.50%, 11/18/09 | | | 2,000,000 | | | 2,000,000 | |
Orange County Local Transit,
0.55%, 11/23/09 | | | 3,000,000 | | | 3,000,000 | |
Port of Oakland California,
0.25%, 12/10/09 | | | 2,000,000 | | | 2,000,000 | |
Riverside County Teeter Finance,
0.33%, 12/9/09 | | | 2,000,000 | | | 2,000,000 | |
San Diego County Regional Airport,
0.43%, 12/3/09 | | | 1,500,000 | | | 1,500,000 | |
San Diego County Regional Airport,
0.37%, 3/2/10 | | | 750,000 | | | 750,000 | |
San Francisco Airport,
0.23%, 11/18/09 | | | 1,600,000 | | | 1,600,000 | |
San Gabriel Valley Government,
0.30%, 1/5/10 | | | 1,000,000 | | | 1,000,000 | |
| | | | |
|
| |
| | | | | | 15,850,000 | |
| | | | |
|
| |
TOTAL COMMERCIAL PAPER AND
NOTES (COST $15,850,000) | | | | | | 15,850,000 | |
| | | | |
|
| |
| | | | | | | |
Investment Companies—2.3% | | | | | | | |
|
| | | | | | | |
| | Shares | | Amortized
Cost ($) | |
| |
| |
| |
BlackRock Provident California
Institutional Shares, 0.15% (b) | | | 3,110,022 | | | 3,110,022 | |
Northern Institutional Tax Exempt
Portfolio, Shares Class, 0.06% (b) | | | 70,007 | | | 70,007 | |
| | | | |
|
| |
TOTAL INVESTMENT COMPANIES
(COST $3,180,029) | | | | | | 3,180,029 | |
| | | | |
|
| |
TOTAL INVESTMENTS
(COST $136,425,095)—100.0% | | | | | | 136,425,095 | |
| | | | |
|
| |
| |
| Percentages indicated are based on net assets of $136,467,604. |
| |
(a) | Variable rate security. The interest rates on these securities are adjusted periodically to reflect then-current short-term interest rates. The rates presented represent the rates in effect on October 31, 2009. The maturity dates presented reflect the final maturity dates. However, some of these securities may contain put or demand features that allow the fund to require the issuer to repurchase the security from the fund within various time periods, including daily, weekly, monthly, or semi-annually. |
| |
(b) | The rate represents the annualized one-day yield that was in effect on October 31, 2009. |
| |
AMT | — Interest on security is subject to federal alternative minimum tax. |
| |
FHLB | — Federal Home Loan Bank |
FHLMC | — Federal Home Loan Mortgage Corporation |
FNMA | — Federal National Mortgage Association |
FSA | — Financial Security Assurance |
GO | — General Obligation |
IDR | — Industrial Development Revenue |
LOC | — Letter of Credit |
PLC | — Public Limited Company |
SPA | — Standby Purchase Agreement |
| | |
15 | HSBC INVESTOR FAMILY OF FUNDS | See notes to financial statements. |
|
HSBC INVESTOR NEW YORK TAX-FREE MONEY MARKET FUND |
|
Schedule of Portfolio Investments—As of October 31, 2009 |
|
Variable Rate Demand Notes—75.4% |
|
| | | | | | | |
| | Principal
Amount ($) | | Amortized
Cost ($) | |
| |
| |
| |
New York – 75.4% | | | | | | | |
Chautauqua County IDA Exempt
Facility Revenue, 0.18%, 4/1/42,
(LOC Bank of America N.A.) (a) | | | 5,000,000 | | | 5,000,000 | |
Dutchess County IDA Civic Facility
Revenue, Series A, 0.23%, 7/1/38,
(LOC KeyBank N.A.) (a) | | | 5,000,000 | | | 5,000,000 | |
Franklin County IDA Civic Facility
Revenue, 0.19%, 5/1/19, (LOC Fleet
National Bank) (a) | | | 2,325,000 | | | 2,325,000 | |
Long Island Power Authority Electrical
Systems Revenue, 0.44%, 12/1/29,
(Credit Support FSA, SPA Dexia
Credit Local) (a) | | | 8,930,000 | | | 8,930,000 | |
Long Island Power Authority Electrical
Systems Revenue, Series D, 0.25%,
12/1/29, (Credit Support FSA, SPA
Dexia Credit Local) (a) | | | 5,000,000 | | | 5,000,000 | |
Long Island Power Authority Electrical
Systems Revenue, Series J, 0.25%,
12/1/29, (Credit Support FSA, SPA
Dexia Credit Local) (a) | | | 6,000,000 | | | 6,000,000 | |
Metropolitan Transportation Authority
Revenue, Series D-1, 0.30%, 11/1/29,
(Credit Support FSA, SPA
Westdeutsche Landesbank) (a) | | | 11,000,000 | | | 11,000,000 | |
Metropolitan Transportation Authority
Revenue, Sub-series B-1, 0.18%,
11/1/34, (LOC Scotiabank) (a) | | | 3,000,000 | | | 3,000,000 | |
Metropolitan Transportation Authority
Revenue, Sub-series B-2, 0.18%,
11/1/34, (LOC BNP Paribas) (a) | | | 3,000,000 | | | 3,000,000 | |
Metropolitan Transportation Authority
Revenue, Sub-series B-3, 0.18%,
11/1/34, (LOC Lloyds TSB Bank
PLC) (a) | | | 3,000,000 | | | 3,000,000 | |
Metropolitan Transportation Authority
Revenue, Sub-series G-2, 0.26%,
11/1/26, (LOC BNP Paribas) (a) | | | 2,100,000 | | | 2,100,000 | |
Metropolitan Transportation Authority
Revenue, Dedicated Tax Fund,
Series A, 0.24%, 11/1/31, (Credit
Support FSA, SPA Dexia Credit
Local) (a) | | | 5,000,000 | | | 5,000,000 | |
Monroe County IDA Civic Facility
Revenue, 0.21%, 1/15/32, (LOC JP
Morgan Chase Bank) (a) | | | 4,950,000 | | | 4,950,000 | |
Monroe County IDA Civic Facility
Revenue, 0.30%, 4/1/35, (LOC JP
Morgan Chase Bank) (a) | | | 4,050,000 | | | 4,050,000 | |
Monroe County IDA Civic Facility
Revenue, 0.21%, 6/1/36, (LOC JP
Morgan Chase Bank) (a) | | | 3,800,000 | | | 3,800,000 | |
Monroe County IDA Civic Facility
Revenue, 0.35%, 2/1/38, (LOC JP
Morgan Chase Bank) (a) | | | 1,900,000 | | | 1,900,000 | |
Monroe County IDA Civic Facility
Revenue, 0.21%, 4/1/38, (LOC JP
Morgan Chase Bank) (a) | | | 2,200,000 | | | 2,200,000 | |
Nassau County IDA Civic Facility
Revenue, 0.35%, 6/1/19, (LOC Fleet
Bank N.A.) (a)(b) | | | 1,530,000 | | | 1,530,000 | |
|
Variable Rate Demand Notes, continued |
|
| | | | | | | |
| | Principal
Amount ($) | | Amortized
Cost ($) | |
| |
| |
| |
New York, continued | | | | | | | |
Nassau Health Care Corp. Revenue,
0.19%, 8/1/29, (LOC TD Bank
N.A.) (a) | | | 2,000,000 | | | 2,000,000 | |
Nassau Health Care Corp. Revenue,
Sub-series B-2, 0.17%, 8/1/29, (Credit
Support County Guaranteed, LOC TD
Bank N.A.) (a) | | | 5,000,000 | | | 5,000,000 | |
Nassau Health Care Corp. Revenue,
Sub-series D-2, 0.30%, 8/1/29, (Credit
Support County Guaranteed, LOC JP
Morgan Chase Bank) (a) | | | 5,000,000 | | | 5,000,000 | |
New York City Capital Resources Corp.
Revenue, Series B1, 0.19%, 7/1/37,
(LOC Bank of America N.A.) (a) | | | 2,000,000 | | | 2,000,000 | |
New York City GO, 0.20%, 2/15/16,
(LOC Bayerische Landesbank) (a) | | | 3,000,000 | | | 3,000,000 | |
New York City GO, 0.20%, 8/1/23,
(LOC Westdeutsche Landesbank) (a) | | | 1,000,000 | | | 1,000,000 | |
New York City GO, Series H, Sub-series
H-3, 0.25%, 8/1/23, (Credit Support
FSA, SPA State Street B&T Co.) (a) | | | 1,000,000 | | | 1,000,000 | |
New York City GO, Series J, Sub-series
J2, 0.20%, 2/15/16, (LOC
Westdeutsche Landesbank) (a) | | | 1,000,000 | | | 1,000,000 | |
New York City GO, Sub-series E4,
0.20%, 8/1/22, (LOC Fortis Bank
S.A.) (a) | | | 1,000,000 | | | 1,000,000 | |
New York City Health & Hospital Corp.
Revenue, Series B, 0.20%, 2/15/31,
(LOC TD Bank N.A.) (a) | | | 10,000,000 | | | 10,000,000 | |
New York City Housing Development
Corp. Multi-family Housing Revenue,
Series A, 0.22%, 11/15/19, (Credit
Support FNMA, Liquidity Facility
FNMA) (a) | | | 1,500,000 | | | 1,500,000 | |
New York City Housing Development
Corp. Multi-family Housing Revenue,
Series A, 0.17%, 4/1/31, (Credit
Support FHLMC) (a) | | | 1,135,000 | | | 1,135,000 | |
New York City Housing Development
Corp. Multi-family Mortgage
Revenue, 0.20%, 6/15/32, (Credit
Support FNMA) (a) | | | 5,000,000 | | | 5,000,000 | |
New York City Housing Development
Corp. Multi-family Mortgage
Revenue, 0.22%, 12/1/36, (LOC
Landesbank Hessen) (a) | | | 13,935,000 | | | 13,935,000 | |
New York City Housing Development
Corp. Multi-family Mortgage
Revenue, 0.29%, 1/1/37, AMT, (LOC
Citibank N.A.) (a) | | | 5,000,000 | | | 5,000,000 | |
New York City Housing Development
Corp. Multi-family Mortgage
Revenue, 0.27%, 6/1/42, AMT, (LOC
Citibank N.A.) (a) | | | 10,000,000 | | | 10,000,000 | |
New York City Housing Development
Corp. Multi-family Mortgage
Revenue, 0.17%, 11/1/46, (Credit
Support FHLMC, Liquidity Facility
FHLMC) (a) | | | 4,000,000 | | | 4,000,000 | |
| | |
See notes to financial statements. | HSBC INVESTOR FAMILY OF FUNDS | 16 |
|
HSBC INVESTOR NEW YORK TAX-FREE MONEY MARKET FUND |
|
Schedule of Portfolio Investments—As of October 31, 2009 (continued) |
|
Variable Rate Demand Notes, continued |
|
| | | | | | | |
| | Principal
Amount ($) | | Amortized
Cost ($) | |
| |
| |
| |
New York, continued | | | | | | | |
New York City Housing Development
Corp. Multi-family Mortgage
Revenue, Series A, 0.29%, 1/1/36,
AMT, (LOC Citibank N.A.) (a) | | | 5,000,000 | | | 5,000,000 | |
New York City Housing Development
Corp. Multi-family Mortgage
Revenue, Series A, 0.29%, 1/1/38,
AMT, (LOC Citibank N.A.) (a) | | | 5,000,000 | | | 5,000,000 | |
New York City Housing Development
Corp. Multi-family Mortgage
Revenue, Series A, 0.26%, 10/1/40,
AMT, (LOC Bank of America
N.A.) (a) | | | 10,000,000 | | | 10,000,000 | |
New York City Housing Development
Corp. Residential Revenue, Series A,
0.20%, 6/1/43, (LOC RBS, Citizens
N.A., FHLB) (a) | | | 7,000,000 | | | 7,000,000 | |
New York City Housing Development
Corp. Revenue, Series A, 0.23%,
3/1/38, (LOC Freddie Mac) (a) | | | 4,900,000 | | | 4,900,000 | |
New York City IDA Civic Facility
Revenue, 0.20%, 11/1/32, (LOC
Wachovia Bank N.A.) (a) | | | 1,500,000 | | | 1,500,000 | |
New York City IDA Civic Facility
Revenue, 0.31%, 12/1/36, (LOC JP
Morgan Chase Bank) (a) | | | 4,440,000 | | | 4,440,000 | |
New York City IDA Civic Facility
Revenue, 0.20%, 11/1/39, (LOC Bank
of America, Citibank N.A.) (a) | | | 8,000,000 | | | 8,000,000 | |
New York City IDA Civic Facility
Revenue, 0.21%, 11/1/39, (LOC Bank
of America, Citibank N.A.) (a) | | | 1,000,000 | | | 1,000,000 | |
New York City IDA Civic Facility
Revenue, Series B, 0.24%, 6/1/36,
(Credit Support Radian, LOC TD
Bank N.A.) (a) | | | 4,700,000 | | | 4,700,000 | |
New York City IDA Special Facility
Revenue, Series B, 0.19%, 5/1/33,
(LOC Bank of America N.A.) (a) | | | 2,960,000 | | | 2,960,000 | |
New York City Municipal Water Finance
Authority Water & Sewer System
Revenue, Series BB-1, 0.15%,
6/15/36, (LOC Fortis Bank S.A.) (a) | | | 1,250,000 | | | 1,250,000 | |
New York City Municipal Water Finance
Authority Water & Sewer System
Revenue, Sub-series B4, 0.18%,
6/15/23, (SPA BNP Paribas) (a) | | | 2,000,000 | | | 2,000,000 | |
New York City Transitional Finance
Authority Revenue, 0.20%, 11/1/22,
(SPA Citigroup) (a) | | | 1,900,000 | | | 1,900,000 | |
New York City Transitional Finance
Authority Revenue, 0.24%, 11/1/22,
(SPA Royal Bank of Canada) (a) | | | 1,150,000 | | | 1,150,000 | |
New York City Transitional Finance
Authority Revenue, Series 3,
Sub-series 3-F, 0.20%, 11/1/22,
(SPA Royal Bank of Canada) (a) | | | 1,000,000 | | | 1,000,000 | |
New York City Transitional Finance
Authority Revenue, Series 3,
Sub-series 3G, 0.20%, 11/1/22,
(SPA Bank of New York) (a) | | | 2,085,000 | | | 2,085,000 | |
|
Variable Rate Demand Notes, continued |
|
| | | | | | | |
| | Principal
Amount ($) | | Amortized
Cost ($) | |
| |
| |
| |
New York, continued | | | | | | | |
New York City Transitional Finance
Authority Revenue, Series A2,
0.20%, 11/15/27, (SPA Bank of
Nova Scotia) (a) | | | 6,100,000 | | | 6,100,000 | |
New York City Trust for Cultural
Resources Revenue, 0.25%, 4/1/30,
(LOC The Chase Manhattan
Bank) (a) | | | 6,850,000 | | | 6,850,000 | |
New York City Trust for Cultural
Resources Revenue, Series B-1,
0.20%, 11/1/38, (LOC U.S.
Bank N.A.) (a) | | | 3,750,000 | | | 3,750,000 | |
New York Local Government Assistance
Corp., 0.16%, 4/1/25, (LOC Societe
Generale) (a) | | | 5,000,000 | | | 5,000,000 | |
New York Mortgage Agency Revenue,
Series 132, 0.27%, 4/1/37, AMT,
(SPA Dexia Credit Local) (a) | | | 5,000,000 | | | 5,000,000 | |
New York State Dormitory Authority
Revenue, 0.19%, 7/1/28, (LOC TD
Bank N.A.) (a) | | | 1,400,000 | | | 1,400,000 | |
New York State Dormitory Authority
Revenue, Series D, 0.20%, 7/1/34,
(LOC TD Banknorth N.A.) (a) | | | 4,775,000 | | | 4,775,000 | |
New York State Dormitory Authority
Revenue, Non State Supported Debt,
0.20%, 7/1/36, (Credit Support XLCA,
LOC TD Banknorth N.A.) (a) | | | 1,925,000 | | | 1,925,000 | |
New York State Dormitory Authority
Revenue, Non State Supported Debt,
0.20%, 12/1/36, (LOC TD
Bank N.A.) (a) | | | 4,500,000 | | | 4,500,000 | |
New York State Dormitory Authority
Revenue, Non State Supported Debt,
0.20%, 1/1/39, (LOC TD
Banknorth N.A.) (a) | | | 4,000,000 | | | 4,000,000 | |
New York State Dormitory Authority
Revenue, Non State Supported Debt,
Series A, 0.20%, 11/15/36, (Credit
Support FNMA, Liquidity Facility
FNMA) (a) | | | 5,000,000 | | | 5,000,000 | |
New York State Dormitory Authority
Revenue, Non State Supported Debt,
Series A-2, 0.20%, 9/1/36, (LOC
Citizens Bank, FHLB) (a) | | | 5,000,000 | | | 5,000,000 | |
New York State Dormitory Authority
Revenue, Non State Supported Debt,
Series B, 0.18%, 7/1/39, (LOC TD
Bank N.A.) (a) | | | 1,500,000 | | | 1,500,000 | |
New York State Dormitory Authority
Revenue, State Supported Debt,
Series A, 0.20%, 7/1/31, (LOC JP
Morgan Chase Bank) (a) | | | 2,200,000 | | | 2,200,000 | |
New York State Dormitory Authority
Revenue, State Supported Debt,
Series C, 0.18%, 7/1/31, (LOC Bank
of America N.A.) (a) | | | 5,000,000 | | | 5,000,000 | |
New York State Energy Research &
Development Authority Facilities
Revenue, 0.27%, 11/1/39, AMT,
(LOC Citibank N.A.) (a) | | | 1,000,000 | | | 1,000,000 | |
| | |
17 | HSBC INVESTOR FAMILY OF FUNDS | See notes to financial statements. |
|
HSBC INVESTOR NEW YORK TAX-FREE MONEY MARKET FUND |
|
Schedule of Portfolio Investments—As of October 31, 2009 (continued) |
|
Variable Rate Demand Notes, continued |
|
| | | | | | | |
| | Principal
Amount ($) | | Amortized
Cost ($) | |
| |
| |
| |
New York, continued | | | | | | | |
New York State Energy Research &
Development Authority Facilities
Revenue, 0.29%, 11/1/39, AMT,
(LOC Citibank N.A.) (a) | | | 4,300,000 | | | 4,300,000 | |
New York State Energy Research &
Development Authority Facilities
Revenue, Series C2, 0.29%, 11/1/39,
AMT, (LOC Citibank N.A.) (a) | | | 5,000,000 | | | 5,000,000 | |
New York State Energy Research &
Development Authority Facilities
Revenue, Sub-series A-3, 0.22%,
5/1/39, (LOC Wachovia
Bank N.A.) (a) | | | 15,000,000 | | | 15,000,000 | |
New York State Energy Research &
Development Authority Pollution
Control Revenue, Series C, 0.16%,
6/1/29, (LOC Wells Fargo N.A.) (a) | | | 8,000,000 | | | 8,000,000 | |
New York State GO, 0.43%, 3/13/20,
(LOC Dexia Credit Local) (a) | | | 25,000,000 | | | 25,000,000 | |
New York State Housing Finance
Agency Revenue, 0.24%, 5/15/33,
AMT, (Credit Support FNMA) (a) | | | 2,000,000 | | | 2,000,000 | |
New York State Housing Finance
Agency Revenue, 0.20%, 5/15/34,
(Credit Support FNMA) (a) | | | 5,000,000 | | | 5,000,000 | |
New York State Housing Finance Agency
Revenue, 0.20%, 11/15/37, (Credit
Support FNMA) (a) | | | 5,000,000 | | | 5,000,000 | |
New York State Housing Finance Agency
Revenue, 0.20%, 5/15/15, (LOC
Landesbank Hessen-Thuringen) (a) | | | 800,000 | | | 800,000 | |
New York State Housing Finance Agency
Revenue, 0.26%, 5/15/28, AMT,
(Credit Support FNMA, LOC
FNMA) (a) | | | 5,000,000 | | | 5,000,000 | |
New York State Housing Finance Agency
Revenue, 0.20%, 11/1/41, AMT,
(LOC Bank of New York) (a) | | | 10,000,000 | | | 10,000,000 | |
New York State Housing Finance Agency
Revenue, Series A, 0.26%, 5/15/32,
AMT, (Credit Support FNMA) (a) | | | 1,600,000 | | | 1,600,000 | |
New York State Housing Finance Agency
Revenue, Series A, 0.23%, 11/1/32,
AMT, (Credit Support FHLMC,
Liquidity Facility FHLMC) (a) | | | 2,050,000 | | | 2,050,000 | |
New York State Housing Finance Agency
Revenue, Series A, 0.20%, 5/15/34,
(Credit Support FNMA) (a) | | | 1,400,000 | | | 1,400,000 | |
New York State Housing Finance Agency
Revenue, Series A, 0.20%, 5/1/35,
(Credit Support FHLMC) (a) | | | 9,365,000 | | | 9,365,000 | |
New York State Housing Finance Agency
Revenue, Series A, 0.28%, 11/1/39,
AMT, (LOC Citibank N.A.) (a) | | | 5,000,000 | | | 5,000,000 | |
New York State Housing Finance Agency
Revenue, Series A, 0.22%, 11/1/41,
(LOC Bank of New York) (a) | | | 13,000,000 | | | 13,000,000 | |
New York State Housing Finance Agency
Revenue, Series A, 0.19%, 5/1/42,
(LOC Wachovia Bank N.A.) (a) | | | 5,000,000 | | | 5,000,000 | |
| | | | | | | |
Variable Rate Demand Notes, continued | | | | | | | |
|
|
|
|
|
|
|
|
|
| | Principal
Amount ($) | | Amortized
Cost ($) | |
| |
| |
| |
New York, continued | | | | | | | |
New York State Housing Finance Agency
Revenue, Series A, 0.20%, 5/1/42,
(LOC Wachovia Bank N.A.) (a) | | | 4,200,000 | | | 4,200,000 | |
New York State Housing Finance Agency
Revenue, Series A, 0.20%, 5/1/45,
(Credit Support FHLMC, Liquidity
Facility FHLMC) (a) | | | 5,000,000 | | | 5,000,000 | |
New York State Local Government
Assistance Corp. Revenue, Series 4V,
0.30%, 4/1/22, (Credit Support FSA,
SPA Westlandesbank AG) (a) | | | 15,000,000 | | | 15,000,000 | |
New York State Power Authority,
Finance & Administration GO, 0.40%,
3/1/20, (Liquidity Facility Bank of
Novia Scotia) (a) | | | 23,500,000 | | | 23,500,000 | |
New York State Urban Development
Corp. Revenue, Series A5, 0.20%,
1/1/30, (LOC TD Banknorth
N.A.) (a) | | | 1,000,000 | | | 1,000,000 | |
Ramapo Housing Authority Revenue,
Series A, 0.27%, 12/15/38, AMT,
(Credit Support FNMA, Liquidity
Facility FNMA) (a) | | | 500,000 | | | 500,000 | |
Suffolk County IDA, 0.35%, 8/1/18,
AMT, (LOC The Chase Manhattan
Bank) (a) | | | 2,430,000 | | | 2,430,000 | |
Suffolk County IDA Civic Facility,
0.25%, 11/1/14, (LOC Bank of
America N.A.) (a) | | | 1,805,000 | | | 1,805,000 | |
Suffolk County Water Authority, 0.18%,
12/1/09, (SPA Bank of Nova
Scotia) (a) | | | 1,200,000 | | | 1,200,000 | |
Syracuse IDA Civic Facility Revenue,
Series A-1, 0.21%, 7/1/37, (LOC JP
Morgan Chase Bank) (a) | | | 2,100,000 | | | 2,100,000 | |
Syracuse IDA Civic Facility Revenue,
Series A2, 0.21%, 12/1/37, (LOC JP
Morgan Chase Bank) (a) | | | 1,250,000 | | | 1,250,000 | |
Triborough Bridge & Tunnel Authority
Revenue, Series B, 0.18%, 1/1/32,
(LOC State Street B&T Co.) (a) | | | 15,000,000 | | | 15,000,000 | |
Triborough Bridge & Tunnel Authority
Revenue, Sub-series CD, 0.22%,
1/1/19, (Credit Support FSA, SPA
Lloyds TSB Bank PLC) (a) | | | 10,700,000 | | | 10,700,000 | |
Troy IDA Civic Facility Revenue,
Series B, 0.19%, 9/1/37, (LOC Bank
of America N.A.) (a) | | | 10,000,000 | | | 10,000,000 | |
Troy IDA Civic Facility Revenue,
Series D, 0.22%, 9/1/42, (LOC
Northern Trust Co.) (a) | | | 13,225,000 | | | 13,225,000 | |
Ulster County IDA Civic Facility
Revenue, Series A, 0.55%, 7/1/21,
AMT, (LOC TD Banknorth N.A.,
ABN Amro Bank N.V.) (a) | | | 1,000,000 | | | 1,000,000 | |
Westchester County IDA Civic Facility
Revenue, 0.21%, 11/1/24, (LOC
Commerce Bank N.A.) (a) | | | 2,315,000 | | | 2,315,000 | |
| | | | |
|
| |
| | | | | | 508,980,000 | |
| | | | |
|
| |
TOTAL VARIABLE RATE DEMAND
NOTES (COST $508,980,000) | | | | | | 508,980,000 | |
| | | | |
|
| |
| | |
See notes to financial statements. | HSBC INVESTOR FAMILY OF FUNDS | 18 |
|
HSBC INVESTOR NEW YORK TAX-FREE MONEY MARKET FUND |
|
Schedule of Portfolio Investments—As of October 31, 2009 (continued) |
|
Tax-Free Notes And Commercial Paper—17.1% |
|
| | | | | | | |
| | Shares or
Principal
Amount ($) | | Amortized
Cost ($) | |
| |
| |
| |
New York – 17.1% | | | | | | | |
Long Island Power Authority, 0.42%,
1/5/10 | | | 10,200,000 | | | 10,200,000 | |
Metropolitan Transportation Authority
Revenue, 0.30%, 12/3/09 | | | 10,000,000 | | | 10,000,000 | |
New York City Municipal Water
Finance Authority, 0.35%, 11/2/09 | | | 20,000,000 | | | 20,000,000 | |
New York City Municipal Water
Finance Authority, 0.45%, 1/4/10 | | | 15,000,000 | | | 15,000,000 | |
New York City Municipal Water
Industry Regional Authority,
0.30%, 12/9/09 | | | 10,000,000 | | | 10,000,000 | |
New York State, 0.35%, 11/2/09 | | | 10,000,000 | | | 10,000,000 | |
New York State, 0.30%, 11/10/09 | | | 10,000,000 | | | 10,000,000 | |
New York State, 0.25%, 11/16/09 | | | 10,000,000 | | | 10,000,000 | |
New York State, 0.35%, 12/1/09 | | | 10,000,000 | | | 10,000,000 | |
New York State, 0.45%, 1/11/10 | | | 10,000,000 | | | 10,000,000 | |
| | | | |
|
| |
| | | | | | 115,200,000 | |
| | | | |
|
| |
TOTAL TAX-FREE NOTES AND COMMERCIAL PAPER
(COST $115,200,000) | | | | | | 115,200,000 | |
| | | | |
|
| |
| | | | | | | |
Investment Companies—2.7% | | | | | | | |
|
|
|
|
|
|
|
|
BlackRock Liquidity New York Money
Fund, Portfolio Institutional Shares,
0.11% (c) | | | 18,137,777 | | | 18,137,777 | |
JPMorgan New York Municipal Money
Market Fund, 0.00% (c) | | | 100,000 | | | 100,000 | |
Northern Institutional Tax Exempt
Portfolio, Shares Class, 0.06% (c) | | | 9,550 | | | 9,550 | |
| | | | |
|
| |
TOTAL INVESTMENT COMPANIES
(COST $18,247,327) | | | | | | 18,247,327 | |
| | | | |
|
| |
TOTAL INVESTMENTS
(COST $642,427,327)—95.2% | | | | | | 642,427,327 | |
| | | | |
|
| |
| |
| Percentages indicated are based on net assets of $674,487,226. |
| |
(a) | Variable rate security. The interest rates on these securities are adjusted periodically to reflect then-current short-term interest rates. The rates presented represent the rates in effect on October 31, 2009. The maturity dates presented reflect the final maturity dates. However, some of these securities may contain put or demand features that allow the fund to require the issuer to repurchase the security from the fund within various time periods, including daily, weekly, monthly, or semi-annually. |
| |
(b) | Rule 144A security or other security which is restricted as to resale to institutional investors. This security has been deemed liquid by the Investment Adviser based on procedures approved by the Board of Trustees. |
| |
(c) | The rate represents the annualized one-day yield that was in effect on October 31, 2009. |
| |
AMT | — Interest on security is subject to federal alternative minimum tax. |
FHLB | — Federal Home Loan Bank |
FHLMC | — Federal Home Loan Mortgage Corporation |
FNMA | — Federal National Mortgage Association |
FSA | — Financial Security Assurance |
GO | — General Obligation |
IDA | — Industrial Development Agency |
LOC | — Letter of Credit |
PLC | — Public Limited Company |
SPA | — Standby Purchase Agreement |
XLCA | — XL Capital Assurance |
| | |
19 | HSBC INVESTOR FAMILY OF FUNDS | See notes to financial statements. |
|
HSBC INVESTOR PRIME MONEY MARKET FUND |
|
Schedule of Portfolio Investments—As of October 31, 2009 |
|
Corporate Obligations—2.1% |
|
| | | | | | | |
| | Principal
Amount ($) | | Amortized
Cost ($) | |
| |
| |
| |
Banking – 1.2% | | | | | | | |
Commonwealth Bank of Australia,
0.24%, 11/4/10 (a)(b) | | | 80,000,000 | | | 80,000,000 | |
Wachovia Corp., Series G, 0.41%,
12/1/09, MTN (a) | | | 58,000,000 | | | 58,005,336 | |
| | | | |
|
| |
| | | | | | 138,005,336 | |
| | | | |
|
| |
Finance – 0.9% | | | | | | | |
General Electric Capital Corp., Series A,
0.31%, 1/4/10, MTN (a) | | | 75,000,000 | | | 75,015,240 | |
Merrill Lynch & Co., Series C, 0.41%,
12/4/09, MTN (a) | | | 19,458,000 | | | 19,460,880 | |
| | | | |
|
| |
| | | | | | 94,476,120 | |
| | | | |
|
| |
TOTAL CORPORATE OBLIGATIONS
(COST $232,481,456) | | | | | | 232,481,456 | |
| | | | |
|
| |
| | | | | | | |
Variable Rate Demand Notes—4.6% | | | | | | | |
|
|
|
|
|
|
|
|
California – 0.4% | | | | | | | |
Los Angeles Community Redevelopment
Agency Multi-family Housing
Revenue, 0.24%, 10/15/38, AMT,
(LOC Fleet National Bank) (a) | | | 40,700,000 | | | 40,700,000 | |
| | | | |
|
| |
Colorado – 0.8% | | | | | | | |
Colorado Housing & Finance Authority
Multi-family Revenue, 0.29%, 5/1/25,
AMT, (LOC U.S. Bank N.A.) (a) | | | 13,250,000 | | | 13,250,000 | |
Denver Colorado City & County
Airport Revenue, Series B, 0.32%,
11/15/25, AMT, (LOC Wachovia
Bank N.A.) (a) | | | 78,800,000 | | | 78,800,000 | |
| | | | |
|
| |
| | | | | | 92,050,000 | |
| | | | |
|
| |
Connecticut – 0.2% | | | | | | | |
Connecticut State Health & Educational
Facilities Authority Revenue,
Series L2, 0.22%, 7/1/36, (LOC Bank
of America N.A.) (a) | | | 17,030,000 | | | 17,030,000 | |
| | | | |
|
| |
Georgia – 0.0% | | | | | | | |
Savannah Georgia Economic
Development Authority Revenue,
0.26%, 9/1/24, (LOC Bank of
America N.A.) (a) | | | 2,000,000 | | | 2,000,000 | |
| | | | |
|
| |
Idaho – 0.2% | | | | | | | |
Power County Industrial Development
Corp. Exempt Facilities Revenue,
0.37%, 4/1/14, AMT, (LOC Wachovia
Bank N.A.) (a) | | | 20,000,000 | | | 20,000,000 | |
| | | | |
|
| |
Illinois – 0.3% | | | | | | | |
Illinois Educational Facilities Authority
Revenue, 0.26%, 3/1/28, (Credit
Support GO of Institution, LOC Bank
of America N.A.) (a) | | | 2,000,000 | | | 2,000,000 | |
Illinois Development Finance Authority
Revenue, 0.20%, 12/1/28, (LOC
Northern Trust Co.) (a) | | | 3,300,000 | | | 3,300,000 | |
| | | | | | | |
Variable Rate Demand Notes, continued | | | | | | | |
|
|
|
|
|
|
|
|
| | | | | | | |
| | Principal
Amount ($) | | Amortized
Cost ($) | |
| |
| |
| |
Illinois, continued | | | | | | | |
Illinois Development Finance Authority
Solid Waste Disposal Revenue,
0.37%, 9/1/27, AMT, (LOC Wachovia
Bank N.A.) (a) | | | 24,900,000 | | | 24,900,000 | |
| | | | |
|
| |
| | | | | | 30,200,000 | |
| | | | |
|
| |
Indiana – 0.3% | | | | | | | |
Indiana State Finance Authority
Revenue, Series A, 0.23%, 7/1/36,
(LOC Northern Trust Co.) (a) | | | 2,000,000 | | | 2,000,000 | |
Indianapolis Local Public Improvement
Bond Bank Revenue, Series C-3,
0.60%, 1/1/33, AMT, (Credit Support
FSA, SPA Dexia Credit Local) (a) | | | 35,000,000 | | | 35,000,000 | |
| | | | |
|
| |
| | | | | | 37,000,000 | |
| | | | |
|
| |
Maine – 0.2% | | | | | | | |
Old Town Solid Waste Disposal
Revenue, 0.40%, 12/1/24, AMT,
(LOC Bank of America N.A.) (a) | | | 22,260,000 | | | 22,260,000 | |
| | | | |
|
| |
Maryland – 0.4% | | | | | | | |
Maryland State Economic Development
Corp. Lease Environmental
Improvement Revenue, 0.27%,
12/1/37, AMT, (LOC Wachovia
Bank N.A.) (a) | | | 47,000,000 | | | 47,000,000 | |
| | | | |
|
| |
Massachusetts – 0.1% | | | | | | | |
Massachusetts State Development
Finance Agency Solid Waste Disposal
Revenue, Series A, 0.40%, 7/1/28,
AMT, (LOC Wachovia
Bank N.A.) (a) | | | 12,000,000 | | | 12,000,000 | |
| | | | |
|
| |
Minnesota – 0.1% | | | | | | | |
Bloomington Minnesota Housing
Revenue, 0.24%, 7/1/38, (LOC
Freddie Mac) (a) | | | 2,000,000 | | | 2,000,000 | |
Oakdale Minnesota Multi-family
Revenue, 0.34%, 6/1/45, AMT,
(LOC Freddie Mac) (a) | | | 2,000,000 | | | 2,000,000 | |
Robbinsdale Minnesota Revenue,
Series A-1, 0.23%, 5/1/33, (LOC
Wells Fargo Bank N.A.) (a) | | | 2,000,000 | | | 2,000,000 | |
| | | | |
|
| |
| | | | | | 6,000,000 | |
| | | | |
|
| |
Nebraska – 0.0% | | | | | | | |
Lancaster County Nebraska Hospital
Authority No. 1 Hospital Revenue,
Series B-2, 0.23%, 6/1/31, (LOC U.S.
Bank N.A.) (a) | | | 2,000,000 | | | 2,000,000 | |
| | | | |
|
| |
New York – 0.2% | | | | | | | |
Syracuse IDA Civic Facility Revenue,
Series A, 0.24%, 1/1/23, (LOC Fleet
National Bank) (a) | | | 10,440,000 | | | 10,440,000 | |
New York City Housing Development
Corp. Multi-family Mortgage Revenue,
Series A, 0.26%, 10/1/40, AMT,
(LOC Bank of America N.A.) (a) | | | 11,200,000 | | | 11,200,000 | |
| | | | |
|
| |
| | | | | | 21,640,000 | |
| | | | |
|
| |
| | |
See notes to financial statements. | HSBC INVESTOR FAMILY OF FUNDS | 20 |
|
HSBC INVESTOR PRIME MONEY MARKET FUND |
|
Schedule of Portfolio Investments—As of October 31, 2009 (continued) |
|
Variable Rate Demand Notes, continued |
|
| | | | | | | |
| | Principal
Amount ($) | | Amortized
Cost ($) | |
| |
| |
| |
Ohio – 0.0% | | | | | | | |
Lorain County Ohio Hospital Revenue,
0.25%, 5/1/26, (LOC JP Morgan
Chase Bank) (a) | | | 2,000,000 | | | 2,000,000 | |
| | | | |
|
| |
Pennsylvania – 0.4% | | | | | | | |
Bethlehem Area School District, GO,
Series 2005, 0.50%, 1/1/30, (Credit
Support FSA State Aid Withholding,
SPA Dexia Credit Local) (a) | | | 34,680,000 | | | 34,680,000 | |
Cumberland County Municipal Authority
Revenue, Series D, 0.22%, 1/1/33,
(LOC Wachovia Bank N.A.) (a) | | | 9,295,000 | | | 9,295,000 | |
| | | | |
|
| |
| | | | | | 43,975,000 | |
| | | | |
|
| |
South Carolina – 0.2% | | | | | | | |
North Charleston South Carolina
Certificates of Participation, 0.26%,
9/1/19, (LOC Bank of America
N.A.) (a) | | | 3,000,000 | | | 3,000,000 | |
South Carolina State Housing Finance &
Development Authority Multi-family
Rental Housing Improvement
Revenue, 0.37%, 7/15/39, AMT,
(LOC Wachovia Bank N.A.) (a) | | | 17,250,000 | | | 17,250,000 | |
| | | | |
|
| |
| | | | | | 20,250,000 | |
| | | | |
|
| |
Texas – 0.8% | | | | | | | |
Austin Hotel Occupancy Tax Revenue,
Sub-series B, 0.28%, 11/15/29,
(LOC Dexia Credit Local) (a) | | | 10,740,000 | | | 10,740,000 | |
Houston Utility System Revenue,
Series B4, 0.23%, 5/15/34, (LOC
Bank of America N.A., Bank of New
York, Dexia Credit Local, State Street
B&T Co.) (a) | | | 27,855,000 | | | 27,855,000 | |
Houston Utility System Revenue,
Series B5, 0.23%, 5/15/34, (LOC
Bank of America N.A., Bank of New
York, Dexia Credit Local, State Street
B&T Co.) (a) | | | 24,000,000 | | | 24,000,000 | |
Montgomery County Housing Finance
Corp. Multi-family Housing Revenue,
0.30%, 2/1/38, AMT, (LOC
Citibank N.A.) (a) | | | 14,785,000 | | | 14,785,000 | |
Texas State Department of Housing &
Community Affairs Multi-family
Housing Revenue, 0.30%, 12/1/39,
AMT, (LOC Citibank N.A.) (a) | | | 7,200,000 | | | 7,200,000 | |
| | | | |
|
| |
| | | | | | 84,580,000 | |
| | | | |
|
| |
TOTAL VARIABLE RATE DEMAND
NOTES (COST $500,685,000) | | | | | | 500,685,000 | |
| | | | |
|
| |
| | | | | | | |
U.S. Government and Government Agency Obligations—16.9% | | | | | | | |
|
|
|
|
|
|
|
|
Federal Home Loan Bank – 11.0% | | | | | | | |
0.55%, 11/18/09 (a) | | | 100,000,000 | | | 100,000,000 | |
0.58%, 12/9/09 | | | 21,425,000 | | | 21,425,000 | |
1.15%, 12/11/09 | | | 100,000,000 | | | 100,054,026 | |
4.75%, 12/11/09, Series Y509 | | | 98,000,000 | | | 98,474,657 | |
0.58%, 12/14/09 | | | 50,000,000 | | | 50,000,000 | |
| | | | | | | |
U.S. Government and Government Agency Obligations, continued | | | | | | | |
|
|
|
|
|
|
|
|
| | | | | | | |
| | Principal
Amount ($) | | Amortized
Cost ($) | |
| |
| |
| |
Federal Home Loan Bank, continued | | | | | | | |
0.16%, 12/28/09, Series 1 (a) | | | 75,000,000 | | | 74,994,567 | |
3.75%, 1/8/10 | | | 50,000,000 | | | 50,316,139 | |
0.32%, 1/20/10, Series 1 | | | 100,000,000 | | | 99,995,127 | |
0.08%, 1/22/10 (a) | | | 150,000,000 | | | 150,000,000 | |
0.71%, 1/27/10 (a) | | | 150,000,000 | | | 150,000,000 | |
0.73%, 2/26/10 (a) | | | 150,000,000 | | | 150,000,000 | |
0.65%, 5/11/10, Series 1 | | | 110,000,000 | | | 110,088,447 | |
0.55%, 8/5/10 | | | 50,000,000 | | | 49,978,299 | |
| | | | |
|
| |
| | | | | | 1,205,326,262 | |
| | | | |
|
| |
Federal Home Loan Mortgage Corp. – 2.7% | | | | | | | |
4.13%, 11/30/09 | | | 100,000,000 | | | 100,303,101 | |
4.00%, 12/15/09 | | | 185,000,000 | | | 185,819,343 | |
2.38%, 5/28/10, Series 1 | | | 14,809,000 | | | 14,958,807 | |
| | | | |
|
| |
| | | | | | 301,081,251 | |
| | | | |
|
| |
Federal National Mortgage Association – 3.2% | | | | | | | |
3.88%, 12/10/09 | | | 100,000,000 | | | 100,379,181 | |
3.25%, 2/10/10 | | | 150,000,000 | | | 151,183,163 | |
0.40%, 2/12/10 (a) | | | 50,000,000 | | | 49,970,984 | |
3.00%, 7/12/10 | | | 50,000,000 | | | 50,840,966 | |
| | | | |
|
| |
| | | | | | 352,374,294 | |
| | | | |
|
| |
TOTAL U.S. GOVERNMENT AND
GOVERNMENT AGENCY OBLIGATIONS
(COST $1,858,781,807) | | | | | | 1,858,781,807 | |
| | | | |
|
| |
U.S. Treasury Obligations—2.7% | | | | | | | |
|
|
|
|
|
|
|
|
U.S. Treasury Bills – 2.7% | | | | | | | |
0.36%, 6/10/10 (c) | | | 50,000,000 | | | 49,891,188 | |
0.35%, 6/17/10 (c) | | | 150,000,000 | | | 149,666,867 | |
0.40%, 7/15/10 (c) | | | 100,000,000 | | | 99,718,578 | |
| | | | |
|
| |
| | | | | | 299,276,633 | |
| | | | |
|
| |
TOTAL U.S. TREASURY OBLIGATIONS
(COST $299,276,633) | | | | | | 299,276,633 | |
| | | | |
|
| |
| | | | | | | |
Commercial Paper And Notes—27.1% | | | | | | | |
|
|
|
|
|
|
|
|
Banking – 8.6% | | | | | | | |
ANZ National International Ltd., 0.24%,
12/17/09 (b)(c) | | | 50,000,000 | | | 49,984,667 | |
ANZ National International Ltd., 0.71%,
9/22/10 (b)(c) | | | 50,000,000 | | | 49,684,028 | |
Banque Et Caisse Epargne, 0.24%,
12/29/09 (c) | | | 87,000,000 | | | 86,966,360 | |
Banque Et Caisse Epargne, 0.24%,
1/5/10 (c) | | | 50,000,000 | | | 49,978,333 | |
BNZ International Funding Ltd., 0.23%,
1/14/10 (b)(c) | | | 100,000,000 | | | 99,952,722 | |
DnB NOR Bank ASA, 0.21%,
1/4/10 (b)(c) | | | 80,000,000 | | | 79,970,133 | |
DnB NOR Bank ASA, 0.35%,
3/22/10 (b)(c) | | | 100,000,000 | | | 99,862,917 | |
Groupe BPCE, 0.26%, 1/6/10 (b)(c) | | | 40,000,000 | | | 39,980,933 | |
Groupe BPCE, 0.26%, 1/20/10 (b)(c) | | | 50,000,000 | | | 49,971,111 | |
Groupe BPCE, 0.48%, 3/4/10 (b)(c) | | | 75,000,000 | | | 74,877,000 | |
Groupe BPCE, 0.40%, 4/14/10 (b)(c) | | | 40,000,000 | | | 39,927,111 | |
| | |
21 | HSBC INVESTOR FAMILY OF FUNDS | See notes to financial statements. |
|
HSBC INVESTOR PRIME MONEY MARKET FUND |
|
Schedule of Portfolio Investments—As of October 31, 2009 (continued) |
|
Commercial Paper And Notes, continued |
|
| | | | | | | |
| | Principal
Amount ($) | | Amortized
Cost ($) | |
| |
| |
| |
Banking, continued | | | | | | | |
Intesa Funding LLC, 0.23%,
12/21/09 (c) | | | 65,000,000 | | | 64,979,236 | |
Lloyds TSB Bank PLC, N.Y.,
0.40%, 11/3/09 (c) | | | 100,000,000 | | | 99,997,778 | |
National Bank of Canada, N.Y.,
0.32%, 11/2/09 (c) | | | 15,000,000 | | | 14,999,867 | |
Svenska Handelsbank, Inc.,
0.23%, 1/27/10 (c) | | | 50,000,000 | | | 49,972,813 | |
| | | | |
|
| |
| | | | | | 951,105,009 | |
| | | | |
|
| |
Diversified – 0.5% | | | | | | | |
E.ON AG, 0.27%, 1/19/10 (b)(c) | | | 50,000,000 | | | 49,970,375 | |
| | | | |
|
| |
| | | | | | 49,970,375 | |
| | | | |
|
| |
Finance – 18.0% | | | | | | | |
ASB Finance Ltd. London,
0.25%, 11/19/09 (b)(c) | | | 50,000,000 | | | 49,993,750 | |
CBA Delaware Finance,
0.23%, 12/11/09 (c) | | | 50,000,000 | | | 49,987,223 | |
Danske Corp., 0.25%,
11/30/09 (b)(c) | | | 150,000,000 | | | 149,969,791 | |
Falcon Asset Securitization Co. LLC,
0.19%, 11/2/09 (b)(c) | | | 100,000,000 | | | 99,999,472 | |
Falcon Asset Securitization Co. LLC,
0.19%, 11/19/09 (b)(c) | | | 100,000,000 | | | 99,990,500 | |
Gemini Securitization Corp. LLC,
0.19%, 11/6/09 (b)(c) | | | 75,000,000 | | | 74,998,021 | |
Gemini Securitization Corp. LLC,
0.18%, 11/20/09 (b)(c) | | | 40,000,000 | | | 39,996,200 | |
General Electric Capital Corp.,
0.29%, 11/9/09 (c) | | | 75,000,000 | | | 74,995,167 | |
General Electric Capital Corp.,
0.27%, 12/1/09 (c) | | | 75,000,000 | | | 74,983,125 | |
ING Funding LLC, 0.29%,
11/9/09 (c) | | | 75,000,000 | | | 74,995,167 | |
ING Funding LLC, 0.22%,
12/4/09 (c) | | | 24,670,000 | | | 24,665,025 | |
JP Morgan Chase & Co.,
0.18%, 11/6/09 (b)(c) | | | 225,000,000 | | | 224,994,375 | |
Matchpoint Master Trust,
0.22%, 1/5/10 (b)(c) | | | 65,000,000 | | | 64,974,181 | |
Matchpoint Master Trust,
0.22%, 1/13/10 (b)(c) | | | 50,000,000 | | | 49,977,694 | |
Nationwide Building Society,
0.27%, 1/8/10 (b)(c) | | | 75,000,000 | | | 74,961,750 | |
Rabobank USA Financial Corp.,
0.33%, 3/16/10 (c) | | | 60,000,000 | | | 59,925,750 | |
Ranger Funding Co. LLC,
0.19%, 11/10/09 (b)(c) | | | 64,250,000 | | | 64,246,948 | |
Santander Central Hispano Finance,
0.69%, 6/3/10 (c) | | | 75,000,000 | | | 74,692,375 | |
Sheffield Receivables Corp.,
0.19%, 11/4/09 (b)(c) | | | 100,000,000 | | | 99,998,417 | |
Sheffield Receivables Corp.,
0.19%, 11/10/09 (b)(c) | | | 48,000,000 | | | 47,997,720 | |
Sheffield Receivables Corp.,
0.18%, 11/13/09 (b)(c) | | | 48,000,000 | | | 47,997,120 | |
Thames Asset Global Securitization
No. 1, Inc., 0.20%, 11/9/09 (b)(c) | | | 43,351,000 | | | 43,349,073 | |
|
Commercial Paper And Notes, continued |
|
| | | | | | | |
| | Principal
Amount ($) | | Amortized
Cost ($) | |
| |
| |
| |
Finance, continued | | | | | | | |
Thames Asset Global Securitization
No. 1, Inc., 0.20%, 11/18/09 (b)(c) | | | 80,499,000 | | | 80,491,397 | |
Toyota Motor Credit Corp.,
0.28%, 11/20/09 (c) | | | 75,000,000 | | | 74,988,917 | |
Toyota Motor Credit Corp.,
0.26%, 11/30/09 (c) | | | 75,000,000 | | | 74,984,292 | |
Westpac Securities NZ Ltd.,
0.25%, 12/4/09 (b)(c) | | | 75,000,000 | | | 74,982,812 | |
| | | | |
|
| |
| | | | | | 1,973,136,262 | |
| | | | |
|
| |
TOTAL COMMERCIAL PAPER AND
NOTES (COST $2,974,211,646) | | | | | | 2,974,211,646 | |
| | | | |
|
| |
| | | | | | | |
Certificates of Deposit—29.9% | | | | | | | |
|
|
|
|
|
|
|
|
| | | | | | | |
Banking – 29.9% | | | | | | | |
Abbey National N.A. LLC,
0.21%, 1/19/10 | | | 20,000,000 | | | 20,000,000 | |
Banco Bilbao Vizcaya Argentaria SA,
0.26%, 12/24/09 | | | 125,000,000 | | | 125,006,435 | |
Banco Bilbao Vizcaya Argentaria SA,
0.43%, 6/30/10 | | | 81,000,000 | | | 81,000,000 | |
Bank of Montreal, 0.19%,
11/2/09 | | | 125,000,000 | | | 125,000,000 | |
Bank of Montreal, 0.18%,
11/20/09 | | | 100,000,000 | | | 100,000,000 | |
Bank of Nova Scotia Houston,
0.25%, 11/23/10 (a) | | | 80,000,000 | | | 80,000,000 | |
Bank of Tokyo-Mitsubishi UFJ, N.Y.,
0.27%, 12/8/09 | | | 75,000,000 | | | 75,000,000 | |
Bank of Tokyo-Mitsubishi UFJ, N.Y.,
0.24%, 1/28/10 | | | 20,000,000 | | | 20,000,000 | |
Bank of Tokyo-Mitsubishi UFJ, N.Y.,
0.40%, 3/3/10 | | | 50,000,000 | | | 50,000,000 | |
Bank of Tokyo-Mitsubishi UFJ, N.Y.,
0.31%, 4/6/10 | | | 72,000,000 | | | 72,000,000 | |
Calyon N.A., Inc., 0.40%,
11/17/09 (a) | | | 100,000,000 | | | 100,004,876 | |
Calyon N.A., Inc., 0.92%,
8/26/10 | | | 86,000,000 | | | 86,000,000 | |
Canadian Imperial Bank of Commerce,
N.Y., 0.21%, 2/1/10 | | | 100,000,000 | | | 100,000,000 | |
Commerzbank AG, N.Y.,
0.37%, 11/20/09 | | | 75,000,000 | | | 75,000,000 | |
Credit Industriel Et Commercial, N.Y.,
0.31%, 11/19/09 | | | 100,000,000 | | | 100,000,000 | |
Credit Industriel Et Commercial, N.Y.,
0.30%, 12/11/09 | | | 36,000,000 | | | 36,000,000 | |
Deutsche Bank, N.Y., 0.78%, 1/25/10 (a) | | | 50,000,000 | | | 50,065,411 | |
Fortis Bank, N.Y., 0.24%, 11/20/09 | | | 100,000,000 | | | 100,000,000 | |
Intesa Sanpaolo SpA, 0.21%, 1/29/10 | | | 75,000,000 | | | 75,000,000 | |
Intesa Sanpaolo SpA, 0.80%, 8/24/10 | | | 86,000,000 | | | 86,000,000 | |
Lloyds TSB Bank PLC, N.Y.,
0.25%, 12/16/09 | | | 50,000,000 | | | 50,000,000 | |
National Bank of Canada, N.Y.,
0.33%, 11/12/09 | | | 85,000,000 | | | 85,000,000 | |
National Bank of Canada, N.Y.,
0.25%, 12/23/09 | | | 100,000,000 | | | 100,000,000 | |
Nordea Bank Finland, N.Y.,
0.18%, 11/20/09 | | | 120,000,000 | | | 120,000,000 | |
| | |
See notes to financial statements. | HSBC INVESTOR FAMILY OF FUNDS | 22 |
|
HSBC INVESTOR PRIME MONEY MARKET FUND |
|
Schedule of Portfolio Investments—As of October 31, 2009 (continued) |
|
Certificates of Deposit, continued |
|
| | | | | | | |
| | Principal
Amount ($) | | Amortized
Cost ($) | |
| |
| |
| |
Banking, continued | | | | | | | |
Nordea Bank Finland, N.Y.,
0.76%, 8/25/10 | | | 86,000,000 | | | 86,000,000 | |
Norinchukin Bank, N.Y.,
0.23%, 11/4/09 | | | 100,000,000 | | | 100,000,000 | |
Norinchukin Bank, N.Y.,
0.23%, 11/30/09 | | | 100,000,000 | | | 100,000,000 | |
Rabobank Nederland NV, N.Y.,
0.32%, 12/7/09 | | | 50,000,000 | | | 50,000,000 | |
Rabobank Nederland NV, N.Y.,
0.24%, 12/15/09 | | | 100,000,000 | | | 100,000,000 | |
Royal Bank of Canada, N.Y.,
0.40%, 1/11/10 | | | 25,000,000 | | | 25,000,000 | |
Royal Bank of Canada, N.Y.,
0.41%, 1/11/10 | | | 100,000,000 | | | 100,000,000 | |
Royal Bank of Scotland PLC, N.Y.,
0.35%, 12/8/09 | | | 60,000,000 | | | 60,000,000 | |
Royal Bank of Scotland PLC, N.Y.,
0.25%, 12/30/09 | | | 50,000,000 | | | 50,000,000 | |
Societe Generale, N.Y., 0.40%, 3/1/10 | | | 100,000,000 | | | 100,000,000 | |
State Street Bank & Trust Co.,
0.21%, 1/19/10 | | | 100,000,000 | | | 100,000,000 | |
Sumitomo Mitsui Banking Corp.,
0.30%, 11/23/09 | | | 100,000,000 | | | 100,000,000 | |
Sumitomo Mitsui Banking Corp.,
0.27%, 12/15/09 | | | 40,000,000 | | | 40,000,000 | |
Sumitomo Mitsui Banking Corp.,
0.29%, 1/6/10 | | | 100,000,000 | | | 100,000,000 | |
Svenska Handelsbanken,
0.29%, 11/10/09 | | | 75,000,000 | | | 75,000,187 | |
Toronto Dominion Bank,
0.23%, 12/14/09 | | | 100,000,000 | | | 100,000,000 | |
Westpac Banking Corp.,
0.29%, 9/17/10 (a)(b) | | | 85,000,000 | | | 85,000,000 | |
| | | | |
|
| |
| | | | | | 3,282,076,909 | |
| | | | |
|
| |
TOTAL CERTIFICATES OF DEPOSIT
(COST $3,282,076,909) | | | | | | 3,282,076,909 | |
| | | | |
|
| |
| | | | | | | |
Time Deposits—17.5% | | | | | | | |
|
|
|
|
|
|
|
|
| | | | | | | |
ABN AMRO Bank N.V. Time Deposit,
0.14%, 11/6/09 | | | 300,000,000 | | | 300,000,000 | |
Calyon N.A., Inc. Time Deposit,
0.11%, 11/2/09 | | | 300,000,000 | | | 300,000,000 | |
Citibank N.A. Nassau Euro Time
Deposit, 0.11%, 11/2/09 | | | 100,000,000 | | | 100,000,000 | |
Danske Bank A/S Cayman Time
Deposit, 0.15%, 11/2/09 | | | 150,000,000 | | | 150,000,000 | |
DnB NOR Bank ASA Time Deposit,
0.11%, 11/2/09 | | | 175,000,000 | | | 175,000,000 | |
Lloyds TSB Bank PLC, N.Y. Time
Deposit, 0.11%, 11/2/09 | | | 300,000,000 | | | 300,000,000 | |
Natixis Time Deposit, 0.15%, 11/2/09 | | | 150,000,000 | | | 150,000,000 | |
Northern Trust Premium Offshore Time
Deposit, 0.00%, 11/2/09 (a) | | | 1,335 | | | 1,335 | |
Societe Generale Cayman Time Deposit,
0.13%, 11/2/09 | | | 447,600,000 | | | 447,600,000 | |
| | | | |
|
| |
TOTAL TIME DEPOSITS
(COST $1,922,601,335) | | | | | | 1,922,601,335 | |
| | | | |
|
| |
TOTAL INVESTMENTS
(COST $11,070,114,786)—100.8% | | | | | | 11,070,114,786 | |
| | | | |
|
| |
| |
| Percentages indicated are based on net assets of $10,981,682,445. |
| |
(a) | Variable rate security. The interest rates on these securities are adjusted periodically to reflect then-current short-term interest rates. The rates presented represent the rates in effect on October 31, 2009. The maturity dates presented reflect the final maturity dates. However, some of these securities may contain put or demand features that allow the fund to require the issuer to repurchase the security from the fund within various time periods, including daily, weekly, monthly, or semi-annually. |
| |
(b) | Rule 144A security or other security which is restricted as to resale to institutional investors. This security has been deemed liquid by the Investment Adviser based on procedures approved by the Board of Trustees. |
| |
(c) | Discount note. Rate presented represents the effective yield at time of purchase. |
| |
AMT | — Interest on security is subject to federal alternative minimum tax. |
FSA | — Financial Security Assurance |
GO | — General Obligation |
IDA | — Industrial Development Agency |
LLC | — Limited Liability Company |
LOC | — Letter of Credit |
MTN | — Medium Term Note |
PLC | — Public Limited Company |
SPA | — Standby Purchase Agreement |
| | |
23 | HSBC INVESTOR FAMILY OF FUNDS | See notes to financial statements. |
|
HSBC INVESTOR TAX-FREE MONEY MARKET FUND |
|
Schedule of Portfolio Investments—As of October 31, 2009 |
|
Variable Rate Demand Notes—32.5% |
|
| | | | | | | |
| | Principal
Amount ($) | | Amortized
Cost ($) | |
| |
| |
| |
Arizona – 1.2% | | | | | | | |
Apache County Arizona Industrial
Development Authority Revenue,
Series 83C, 0.25%, 12/15/18,
(LOC Bank of New York) (a) | | | 700,000 | | | 700,000 | |
Apache County Arizona Industrial
Development Authority Revenue,
Series 83A, 0.25%, 12/15/18,
(LOC ABN AMRO Bank N.V.) (a) | | | 600,000 | | | 600,000 | |
Yuma Arizona Industrial Development
Authority Multi-family Revenue,
0.27%, 4/15/33, (Credit Support
FNMA) (a) | | | 1,050,000 | | | 1,050,000 | |
| | | | |
|
| |
| | | | | | 2,350,000 | |
| | | | |
|
| |
California – 5.1% | | | | | | | |
California State Department of Water
Resources Power Supply Revenue,
Sub-series G-7, 0.25%, 5/1/17,
(Credit Support FSA, SPA Societe
Generale) (a) | | | 1,600,000 | | | 1,600,000 | |
California State Department of Water
Resources Power Supply Revenue,
0.21%, 5/1/22, (LOC Bayerische
Landesbank) (a) | | | 3,480,000 | | | 3,480,000 | |
Perris California Unified High School
District Certificates of Participation,
1.75%, 9/1/18, (Credit Support FSA,
SPA Dexia Credit Local) (a) | | | 1,735,000 | | | 1,735,000 | |
Perris California Union High School
District Certificates of Participation,
1.75%, 9/1/33, (Credit Support FSA,
SPA Dexia Credit Local) (a) | | | 600,000 | | | 600,000 | |
Tustin California Improvement Bond
Act 1915, Series A, 0.18%, 9/2/13,
(LOC Bank of New York) (a) | | | 2,500,000 | | | 2,500,000 | |
| | | | |
|
| |
| | | | | | 9,915,000 | |
| | | | |
|
| |
Colorado – 1.0% | | | | | | | |
Denver Colorado City & County Airport
Revenue, Series F, 0.30%, 11/15/25,
AMT, (LOC Lloyds TSB
Bank PLC) (a) | | | 2,000,000 | | | 2,000,000 | |
| | | | |
|
| |
Florida – 1.5% | | | | | | | |
Broward County Florida Housing
Finance Authority Multi-family
Housing Revenue, 0.24%, 12/1/29,
(Credit Support Freddie Mac) (a) | | | 2,000,000 | | | 1,999,983 | |
Orange County Florida Housing Finance
Authority Multi-family Revenue,
0.24%, 7/1/32, (Credit Support
Freddie Mac) (a) | | | 1,000,000 | | | 999,982 | |
| | | | |
|
| |
| | | | | | 2,999,965 | |
| | | | |
|
| |
Georgia – 2.9% | | | | | | | |
De Kalb County Georgia Housing
Authority Multi-family Housing
Revenue, 0.42%, 12/1/25, (Credit
Support Freddie Mac) (a) | | | 2,000,000 | | | 2,000,000 | |
Roswell Georgia Housing Authority
Multi-family Revenue, 0.25%,
6/15/25, (Credit Support FNMA) (a) | | | 1,400,000 | | | 1,400,000 | |
| | | | | | | |
Variable Rate Demand Notes, continued | | | | | | | |
|
|
|
|
|
|
|
|
| | | | | | | |
| | Principal
Amount ($) | | Amortized
Cost ($) | |
| |
| |
| |
Georgia, continued | | | | | | | |
Roswell Georgia Housing Authority
Multi-family Revenue, 0.21%,
11/15/32, (Credit Support
FNMA) (a) | | | 1,300,000 | | | 1,300,000 | |
Savannah Georgia Economic
Development Authority Revenue,
0.26%, 9/1/24, (LOC Bank of
America N.A.) (a) | | | 900,000 | | | 900,000 | |
| | | | |
|
| |
| | | | | | 5,600,000 | |
| | | | |
|
| |
Illinois – 3.9% | | | | | | | |
Chicago Illinois O’Hare International
Airport Revenue, Series C, 0.27%,
1/1/18, (LOC Societe Generale) (a) | | | 1,800,000 | | | 1,800,000 | |
Chicago Illinois O’Hare International
Airport Revenue, Series B, 0.32%,
1/1/18, (LOC Societe Generale) (a) | | | 1,800,000 | | | 1,800,000 | |
Illinois Development Finance Authority
Revenue, 0.20%, 12/1/28, (LOC
Northern Trust Co.) (a) | | | 1,000,000 | | | 1,000,000 | |
Illinois Development Finance Authority
Revenue, 0.30%, 6/1/37, (LOC Bank
One N.A.) (a) | | | 2,000,000 | | | 2,000,000 | |
Illinois Educational Facilities Authority
Revenue, 0.26%, 3/1/28, (Credit
Support GO of Institution, LOC Bank
of America N.A.) (a) | | | 865,000 | | | 865,000 | |
| | | | |
|
| |
| | | | | | 7,465,000 | |
| | | | |
|
| |
Indiana – 1.1% | | | | | | | |
Indiana State Finance Authority
Revenue, Series A, 0.23%, 7/1/36,
(LOC Northern Trust Co.) (a) | | | 2,085,000 | | | 2,085,000 | |
| | | | |
|
| |
Maryland – 1.9% | | | | | | | |
Baltimore Maryland Industrial
Development Authority Revenue,
0.37%, 8/1/16, (LOC Bayerische
Landesbank) (a) | | | 1,725,000 | | | 1,725,000 | |
Maryland State Health & Higher
Educational Facilities Authority
Revenue, 0.33%, 7/1/38,
(LOC UBS AG) (a) | | | 2,000,000 | | | 2,000,000 | |
| | | | |
|
| |
| | | | | | 3,725,000 | |
| | | | |
|
| |
Minnesota – 0.2% | | | | | | | |
Robbinsdale Minnesota Revenue,
Series A-1, 0.23%, 5/1/33, (LOC Wells
Fargo Bank N.A.) (a) | | | 400,000 | | | 400,000 | |
| | | | |
|
| |
Nebraska – 0.7% | | | | | | | |
Lancaster County Nebraska Hospital
Authority No. 1 Hospital Revenue,
Series B-2, 0.23%, 6/1/31, (LOC U.S.
Bank N.A.) (a) | | | 400,000 | | | 400,000 | |
Saline County Nebraska Hospital
Authority No. 1 Hospital Revenue,
Series C, 0.23%, 6/1/31, (LOC U.S.
Bank N.A.) (a) | | | 990,000 | | | 990,000 | |
| | | | |
|
| |
| | | | | | 1,390,000 | |
| | | | |
|
| |
| | |
See notes to financial statements. | HSBC INVESTOR FAMILY OF FUNDS | 24 |
|
HSBC INVESTOR TAX-FREE MONEY MARKET FUND |
|
Schedule of Portfolio Investments—As of October 31, 2009 (continued) |
|
Variable Rate Demand Notes, continued |
|
| | | | | | | |
| | Principal
Amount ($) | | Amortized
Cost ($) | |
| |
| |
| |
New Mexico – 0.3% | | | | | | | |
Farmington New Mexico Hospital
Revenue, 0.23%, 6/1/28, (LOC Bank
of Nova Scotia) (a) | | | 500,000 | | | 500,000 | |
| | | | |
|
| |
New York – 2.8% | | | | | | | |
New York City GO, Series H, Sub-series
H-3, 0.25%, 8/1/23, (Credit Support
FSA, SPA State Street B&T Co.) (a) | | | 2,100,000 | | | 2,100,000 | |
New York State Housing Finance Agency
Revenue, Series A, 0.22%, 11/1/41,
(LOC Bank of New York) (a) | | | 3,300,000 | | | 3,300,000 | |
| | | | |
|
| |
| | | | | | 5,400,000 | |
| | | | |
|
| |
Ohio – 0.6% | | | | | | | |
Lorain County Ohio Hospital Revenue,
0.25%, 11/1/21, (LOC JP Morgan
Chase Bank) (a) | | | 1,000,000 | | | 1,000,000 | |
Lorain County Ohio Hospital Revenue,
0.25%, 5/1/26, (LOC JP Morgan
Chase Bank) (a) | | | 100,000 | | | 100,000 | |
| | | | |
|
| |
| | | | | | 1,100,000 | |
| | | | |
|
| |
Pennsylvania – 0.8% | | | | | | | |
Beaver County Pennsylvania Industrial
Development Authority Pollution
Control Revenue, Series A, 0.25%,
1/1/35, (LOC Barclays Bank PLC) (a) | | | 1,500,000 | | | 1,500,000 | |
| | | | |
|
| |
Rhode Island – 1.2% | | | | | | | |
Providence Housing Authority
Multi-Family Revenue, Series A,
0.25%, 9/1/30, (LOC Bank of
America N.A.) (a)(b) | | | 2,420,000 | | | 2,420,000 | |
| | | | |
|
| |
South Carolina – 0.5% | | | | | | | |
North Charleston South Carolina
Certificates of Participation, 0.26%,
9/1/19, (LOC Bank of America
N.A.) (a) | | | 1,000,000 | | | 1,000,000 | |
| | | | |
|
| |
Tennessee – 2.1% | | | | | | | |
Chattanooga Tennessee Health Education
& Housing Facility Board Revenue,
0.20%, 6/1/28, (LOC Bank of
America N.A.) (a) | | | 1,570,000 | | | 1,570,000 | |
Hamilton County Tennessee Industrial
Development Board IDR, 0.26%,
3/1/15, (LOC Bank of America
N.A.) (a)(b) | | | 1,050,000 | | | 1,050,000 | |
Jackson Tennessee Health Educational
& Housing Facility Board
Multi-family Revenue, 0.24%, 5/15/31,
(Credit Support FNMA) (a) | | | 1,375,000 | | | 1,375,000 | |
| | | | |
|
| |
| | | | | | 3,995,000 | |
| | | | |
|
| |
Texas – 0.7% | | | | | | | |
Tarrant County Texas Housing Finance
Corp. Revenue, 0.26%, 2/15/36,
(Credit Support FNMA) (a) | | | 1,400,000 | | | 1,400,000 | |
| | | | |
|
| |
| | | | | | | |
Variable Rate Demand Notes, continued | | | | | | | |
|
|
|
|
|
|
|
|
| | | | | | | |
| | Principal
Amount ($) | | Amortized
Cost ($) | |
| |
| |
| |
Vermont – 0.5% | | | | | | | |
Vermont Housing Finance Agency
Single Family Revenue, Series 21A,
0.82%, 11/1/34, AMT, (Credit Support
FSA, SPA Dexia Credit Local) (a) | | | 895,000 | | | 895,000 | |
| | | | |
|
| |
Washington – 2.5% | | | | | | | |
Washington State Health Care Facilities
Authority Lease Revenue, 0.25%,
1/1/32, (LOC BNP Paribas) (a) | | | 1,000,000 | | | 1,000,000 | |
Washington State Health Care Facilities
Authority Revenue, 0.28%, 11/15/26,
(LOC Citibank N.A.) (a)(b) | | | 2,800,000 | | | 2,800,000 | |
Washington State Housing Finance
Commission Nonprofit Revenue,
0.20%, 6/1/32, (LOC Northern
Trust Co.) (a) | | | 1,000,000 | | | 1,000,000 | |
| | | | |
|
| |
| | | | | | 4,800,000 | |
| | | | |
|
| |
Wisconsin – 1.0% | | | | | | | |
Wisconsin State Health & Educational
Facilities Authority Revenue, Series B,
0.20%, 12/1/26, (LOC U.S. Bank
N.A.) (a) | | | 1,900,000 | | | 1,900,000 | |
| | | | |
|
| |
TOTAL VARIABLE RATE DEMAND
NOTES (COST $62,839,965) | | | | | | 62,839,965 | |
| | | | |
|
| |
| | | | | | | |
Commercial Paper And Notes—22.9% | | | | | | | |
|
|
|
|
|
|
|
|
California – 6.2% | | | | | | | |
Orange County Local Transit,
0.50%, 11/18/09 | | | 4,000,000 | | | 4,000,000 | |
Orange County Local Transit,
0.55%, 11/23/09 | | | 5,000,000 | | | 5,000,000 | |
Orange County Local Transit,
0.40%, 12/9/09 | | | 3,000,000 | | | 3,000,000 | |
| | | | |
|
| |
| | | | | | 12,000,000 | |
| | | | |
|
| |
Connecticut – 2.1% | | | | | | | |
City of New Haven Connecticut,
0.35%, 1/4/10 | | | 4,000,000 | | | 4,000,000 | |
| | | | |
|
| |
Florida – 0.5% | | | | | | | |
Florida Local Government Finance
Commission, 0.35%, 11/16/09 | | | 1,075,000 | | | 1,075,000 | |
| | | | |
|
| |
Georgia – 2.3% | | | | | | | |
Municipal Electric Authority Georgia,
0.50%, 11/5/09 | | | 4,400,000 | | | 4,400,000 | |
| | | | |
|
| |
Massachusetts – 2.1% | | | | | | | |
Massachusetts Water Resources
Authority, 0.30%, 1/12/10 | | | 4,000,000 | | | 4,000,000 | |
| | | | |
|
| |
New York – 2.1% | | | | | | | |
Metropolitan Transportation Authority
Revenue, 0.30%, 12/7/09 | | | 1,000,000 | | | 1,000,000 | |
New York City Municipal Water Industry
Regional Authority, 0.45%, 12/2/09 | | | 3,000,000 | | | 3,000,000 | |
| | | | |
|
| |
| | | | | | 4,000,000 | |
| | | | |
|
| |
| | |
25 | HSBC INVESTOR FAMILY OF FUNDS | See notes to financial statements. |
|
HSBC INVESTOR TAX-FREE MONEY MARKET FUND |
|
Schedule of Portfolio Investments—As of October 31, 2009 (continued) |
| | | | | | | |
Commercial Paper And Notes, continued | | | | | |
|
|
|
|
|
|
|
| | Principal
Amount ($) | | Amortized
Cost ($) | |
| |
| |
| |
Pennsylvania – 3.1% | | | | | |
Montgomery County Pennsylvania
Industrial Pollution Control Revenue,
0.35%, 3/9/10 | | | 4,000,000 | | | 4,000,000 | |
Montgomery County Pennsylvania
Industrial Pollution Control Revenue,
0.37%, 3/10/10 | | | 2,000,000 | | | 2,000,000 | |
| | | | |
|
| |
| | | | | | 6,000,000 | |
| | | | |
|
| |
Texas – 3.7% | | | | | | | |
Harris County Texas, 0.30%, 12/9/09 | | | 3,190,000 | | | 3,190,000 | |
Houston Texas, 0.35%, 12/3/09 | | | 4,000,000 | | | 4,000,000 | |
| | | | |
|
| |
| | | | | | 7,190,000 | |
| | | | |
|
| |
Wyoming – 0.8% | | | | | | | |
Sweetwater County Wyoming Pollution
Control Revenue, 0.35%, 12/8/09 | | | 1,500,000 | | | 1,500,000 | |
| | | | |
|
| |
TOTAL COMMERCIAL PAPER AND
NOTES (COST $44,165,000) | | | | | | 44,165,000 | |
| | | | |
|
| |
| | | | | | | |
Municipal Bonds—42.4% | | | | | | | |
|
|
|
|
|
|
|
|
Alabama – 1.0% | | | | | | | |
Mobile Alabama Industrial Development
Board Dock & Wharf Revenue,
Series A, 0.22%, 6/1/32, (LOC
Bayerische Landesbank) (a) | | | 2,000,000 | | | 2,000,000 | |
| | | | |
|
| |
Arizona – 1.0% | | | | | | | |
Salt River Pima - Maricopa Indian
Community Revenue, 0.26%, 10/1/26,
(LOC Bank of America N.A.) (a) | | | 1,900,000 | | | 1,900,000 | |
| | | | |
|
| |
California – 0.3% | | | | | | | |
Hesperia California Unified School
District Certificates of Participation,
1.75%, 2/1/38, (Credit Support FSA,
SPA Dexia Credit Bank) (a) | | | 500,000 | | | 500,000 | |
| | | | |
|
| |
Colorado – 1.6% | | | | | | | |
Broomfield Colorado Urban Renewal
Authority Tax Increment Revenue,
0.23%, 12/1/30, (LOC BNP
Paribas) (a) | | | 650,000 | | | 650,000 | |
Thornton Colorado Multi-family
Housing Revenue, Series A, 0.28%,
4/1/10, (Credit Support FHLMC,
Liquidity Facility FHLMC) (a) | | | 2,500,000 | | | 2,500,000 | |
| | | | |
|
| |
| | | | | | 3,150,000 | |
| | | | |
|
| |
District of Columbia – 0.6% | | | | | | | |
District of Columbia University
Revenue, Series C, 0.17%, 4/1/42,
(LOC TD Bank N.A.) (a) | | | 1,150,000 | | | 1,150,000 | |
| | | | |
|
| |
Florida – 2.1% | | | | | | | |
Florida Housing Finance Corp.
Multi-family Mortgage Revenue,
Series P, 0.30%, 8/1/35, AMT,
(LOC Citibank N.A.) (a) | | | 1,100,000 | | | 1,100,000 | |
Lee Memorial Health System Hospital
Revenue, Series A, 0.20%, 4/1/33,
(LOC Bank of America N.A.) (a) | | | 1,700,000 | | | 1,700,000 | |
| | | | | | | |
Municipal Bonds, continued | | | | | | | |
|
|
|
|
|
|
|
|
|
| | Principal
Amount ($) | | Amortized
Cost ($) | |
| |
| |
| |
Florida, continued | | | | | | | |
Orange County School Board
Certificates of Participation, Series E,
0.21%, 8/1/22, (LOC Wachovia
Bank N.A.) (a) | | | 1,270,000 | | | 1,270,000 | |
| | | | |
|
| |
| | | | | | 4,070,000 | |
| | | | |
|
| |
Illinois – 0.8% | | | | | | | |
Lake County Illinois Solid Waste
Disposal Facility Revenue, 0.30%,
4/1/21, AMT, (LOC JP Morgan
Chase Bank) (a) | | | 1,500,000 | | | 1,500,000 | |
| | | | |
|
| |
Indiana – 0.5% | | | | | | | |
Valparaiso Indiana Economic
Development Revenue, 0.42%, 5/1/19,
AMT, (LOC U.S. Bank N.A.) (a) | | | 1,005,000 | | | 1,005,000 | |
| | | | |
|
| |
Iowa – 0.5% | | | | | | | |
Iowa Finance Authority Private College
Revenue, 0.20%, 10/1/31, (LOC U.S.
Bank N.A.) (a) | | | 900,000 | | | 900,000 | |
| | | | |
|
| |
Louisiana – 1.0% | | | | | | | |
Louisiana Public Facilities Authority
Revenue, Series B-1, 0.20%, 7/1/47,
(LOC Bank of New York) (a) | | | 2,000,000 | | | 2,000,000 | |
| | | | |
|
| |
Maine – 0.6% | | | | | | | |
Gorham Maine Revenue Obligation
Securities, Series A, 0.50%, 7/1/21,
AMT, (LOC TD Banknorth N.A.) (a) | | | 1,140,000 | | | 1,140,000 | |
| | | | |
|
| |
Maryland – 1.0% | | | | | | | |
Maryland State Economic Development
Corp. Revenue, Series A, 0.25%,
4/1/24, (LOC Wachovia Bank
N.A.) (a) | | | 2,000,000 | | | 2,000,000 | |
| | | | |
|
| |
Massachusetts – 1.5% | | | | | | | |
Massachusetts State Development
Financial Agency Solid Waste
Disposal Revenue, 0.15%, 5/1/27,
AMT, (LOC JP Morgan Chase
Bank) (a) | | | 100,000 | | | 100,000 | |
Massachusetts State Industrial Finance
Agency Mortgage Revenue, 0.27%,
8/1/26, (Credit Support FHA
LOC Sumitomo Bank Ltd.) (a) | | | 2,825,000 | | | 2,825,000 | |
| | | | |
|
| |
| | | | | | 2,925,000 | |
| | | | |
|
| |
Minnesota – 1.9% | | | | | | | |
Arden Hills Housing & Health Care
Facilities Revenue, Series B, 0.20%,
9/1/29, (LOC U.S. Bank N.A.) (a) | | | 1,957,000 | | | 1,957,000 | |
St. Paul Minnesota Port Authority Tax
Increment Revenue, 0.40%, 2/1/15,
(LOC U.S. Bank N.A.) (a) | | | 1,690,000 | | | 1,690,000 | |
| | | | |
|
| |
| | | | | | 3,647,000 | |
| | | | |
|
| |
| | |
See notes to financial statements. | HSBC INVESTOR FAMILY OF FUNDS | 26 |
|
HSBC INVESTOR TAX-FREE MONEY MARKET FUND |
|
Schedule of Portfolio Investments—As of October 31, 2009 (continued) |
| | | | | | | |
Municipal Bonds, continued | | | | | | | |
|
|
|
|
|
|
|
|
|
| | Principal
Amount ($) | | Amortized
Cost ($) | |
| |
| |
| |
Missouri – 0.9% | | | | | | | |
Kansas City Missouri Industrial
Development Authority Multi-family
Housing Revenue, Series II-B, 0.40%,
9/1/39, AMT, (LOC Valley View State
Bank, FHLB) (a) | | | 735,000 | | | 735,000 | |
Missouri State Health & Educational
Facilities Authority Revenue, 0.20%,
11/15/31, (Credit Support Radian,
LOC Northern Trust Co.) (a) | | | 1,000,000 | | | 1,000,000 | |
| | | | |
|
| |
| | | | | | 1,735,000 | |
| | | | |
|
| |
New Jersey – 4.3% | | | | | | | |
New Jersey Health Care Facilities
Financing Authority Revenue,
Series B, 0.13%, 7/1/43, (LOC JP
Morgan Chase Bank) (a) | | | 4,000,000 | | | 4,000,000 | |
New Jersey State Turnpike Authority
Revenue, Series D, 0.17%, 1/1/24,
(LOC Bank of Nova Scotia) (a) | | | 4,200,000 | | | 4,200,000 | |
| | | | |
|
| |
| | | | | | 8,200,000 | |
| | | | |
|
| |
New Mexico – 1.8% | | | | | | | |
New Mexico Educational Assistance
Foundation Revenue, Series A-1,
0.30%, 4/1/34, AMT, (Credit Support
Guaranteed Student Loans, LOC
Royal Bank of Canada) (a) | | | 3,450,000 | | | 3,450,000 | |
| | | | |
|
| |
New York – 0.6% | | | | | | | |
New York City Municipal Water
Finance Authority Water & Sewer
Systems Revenue, Series BB-1,
0.18%, 6/15/39, (SPA Landesbank
Hessen-Thuringen) (a) | | | 1,100,000 | | | 1,100,000 | |
| | | | |
|
| |
North Carolina – 3.1% | | | | | | | |
Charlotte-Mecklenburg Hospital
Authority North Carolina Health Care
System Revenue, Series G, 0.45%,
1/15/41, (Credit Support FSA,
SPA Dexia Credit Local) (a) | | | 5,000,000 | | | 5,000,000 | |
New Hanover County North Carolina
Hospital Revenue, Series B, 0.20%,
10/1/38, (LOC RBC Bank
U.S.A.) (a) | | | 1,000,000 | | | 1,000,000 | |
| | | | |
|
| |
| | | | | | 6,000,000 | |
| | | | |
|
| |
Ohio – 3.0% | | | | | | | |
Hamilton County Ohio Health Care
Revenue, Series B, 0.23%, 1/1/37,
(LOC PNB Bank N.A.) (a) | | | 500,000 | | | 500,000 | |
Ohio State Air Quality Development
Authority Revenue, Series A, 0.20%,
2/1/26, (LOC Bank of Nova
Scotia) (a) | | | 1,250,000 | | | 1,250,000 | |
Ohio State Air Quality Development
Authority Revenue, Series C, 0.25%,
2/1/26, (LOC Bank of
Tokyo-Mitsubishi UFJ Ltd.) (a) | | | 4,000,000 | | | 4,000,000 | |
| | | | |
|
| |
| | | | | | 5,750,000 | |
| | | | |
|
| |
Municipal Bonds, continued | | | | | | | |
|
|
|
|
|
|
|
|
|
| | Principal
Amount ($) | | Amortized
Cost ($) | |
| |
| |
| |
Pennsylvania – 3.6% | | | | | | | |
Haverford Township Pennsylvania
School District GO, 0.23%, 3/1/30,
(Credit Support State Aid Withholding,
LOC TD Bank N.A.) (a) | | | 2,000,000 | | | 2,000,000 | |
Jackson Township Pennsylvania
Industrial Development Authority
Revenue, 0.34%, 12/1/34, AMT,
(LOC PNC Bank N.A.) (a) | | | 4,000,000 | | | 4,000,000 | |
Philadelphia Pennsylvania School
District GO, Series B-5, 0.42%,
9/1/30, (Credit Support State Aid
Withholding, LOC Wachovia
Bank N.A.) (a) | | | 1,030,000 | | | 1,030,000 | |
| | | | |
|
| |
| | | | | | 7,030,000 | |
| | | | |
|
| |
Puerto Rico – 2.9% | | | | | | | |
Puerto Rico Commonwealth GO,
Series C4, 0.32%, 7/1/18, (Credit
Support FSA, SPA Dexia Credit
Local) (a) | | | 2,000,000 | | | 2,000,000 | |
Puerto Rico Commonwealth GO,
Series B-2, 0.32%, 7/1/24, (Credit
Support FSA, SPA Dexia Bank) (a) | | | 2,000,000 | | | 2,000,000 | |
Puerto Rico Commonwealth GO,
Series B, 0.15%, 7/1/32, (LOC
Wachovia Bank N.A.) (a) | | | 1,635,000 | | | 1,635,000 | |
| | | | |
|
| |
| | | | | | 5,635,000 | |
| | | | |
|
| |
South Carolina – 0.8% | | | | | | | |
South Carolina Jobs-Economic
Development Authority Revenue,
0.52%, 6/1/12, AMT, (LOC Wachovia
Bank N.A.) (a)(b) | | | 1,505,000 | | | 1,505,000 | |
| | | | |
|
| |
Texas – 2.1% | | | | | | | |
Bexar County Housing Finance Corp.
Multi-family Housing Revenue,
0.24%, 9/1/39, (Credit Support
Freddie Mac, Liquidity Facility Freddie
Mac) (a) | | | 1,000,000 | | | 1,000,000 | |
Gulf Coast Industrial Development
Authority Environmental Facilities
Revenue, 0.23%, 3/1/31, AMT,
(LOC Sumitomo Mitsui Banking
Corp.) (a) | | | 1,100,000 | | | 1,100,000 | |
Tarrant County Texas Housing Finance
Corp. Revenue, 0.26%, 2/15/28,
(Credit Support FNMA) (a) | | | 2,000,000 | | | 2,000,000 | |
| | | | |
|
| |
| | | | | | 4,100,000 | |
| | | | |
|
| |
Vermont – 1.9% | | | | | | | |
Vermont Educational & Health
Buildings Financing Agency Revenue,
Series A, 0.21%, 4/1/15, (LOC TD
Banknorth N.A., SPA TD Banknorth
N.A.) (a) | | | 600,000 | | | 600,000 | |
Vermont Educational & Health
Buildings Financing Agency Revenue,
Series A, 0.21%, 10/1/28, (LOC
Banknorth N.A.) (a) | | | 2,000,000 | | | 2,000,000 | |
| | |
27 | HSBC INVESTOR FAMILY OF FUNDS | See notes to financial statements. |
|
HSBC INVESTOR TAX-FREE MONEY MARKET FUND |
|
Schedule of Portfolio Investments—As of October 31, 2009 (continued) |
| | | | | | | |
Municipal Bonds, continued | | | | | | | |
|
|
|
|
|
|
|
|
|
| | Shares or
Principal
Amount ($) | | Amortized
Cost ($) | |
| |
| |
| |
Vermont, continued | | | | | | | |
Vermont Educational & Health
Buildings Financing Agency Revenue,
Series A, 0.21%, 10/1/32, (LOC TD
Banknorth N.A.) (a) | | | 1,000,000 | | | 1,000,000 | |
| | | | |
|
| |
| | | | | | 3,600,000 | |
| | | | |
|
| |
Wisconsin – 1.1% | | | | | | | |
Whitewater Wisconsin IDR, 0.30%,
12/1/12, AMT, (LOC JP Morgan
Chase Bank) (a) | | | 1,200,000 | | | 1,200,000 | |
Wisconsin Housing & Economic
Development Authority Revenue,
Series B, 0.60%, 5/1/34, AMT,
(Credit Support FSA GO of Authority,
SPA FHLB) (a) | | | 1,000,000 | | | 1,000,000 | |
| | | | |
|
| |
| | | | | | 2,200,000 | |
| | | | |
|
| |
Wyoming – 1.9% | | | | | | | |
Sweetwater County Wyoming Pollution
Control Revenue, Series A, 0.19%,
7/1/15, (LOC Barclays Bank plc) (a) | | | 2,100,000 | | | 2,100,000 | |
Sweetwater County Wyoming Pollution
Control Revenue, 0.27%, 11/1/24,
(LOC Wells Fargo Bank N.A.) (a) | | | 1,500,000 | | | 1,500,000 | |
| | | | |
|
| |
| | | | | | 3,600,000 | |
| | | | |
|
| |
TOTAL MUNICIPAL BONDS
(COST $81,792,000) | | | | | | 81,792,000 | |
| | | | |
|
| |
| | | | | | | |
Investment Companies—2.2% | | | | | | | |
|
|
|
|
|
|
|
|
BlackRock Liquidity Funds MuniFund
Portfolio, Institutional Shares,
0.17% (c) | | | 4,250,439 | | | 4,250,439 | |
Northern Institutional Tax Exempt
Portfolio, Shares Class, 0.06% (c) | | | 19,868 | | | 19,868 | |
| | | | |
|
| |
TOTAL INVESTMENT COMPANIES
(COST $4,270,307) | | | | | | 4,270,307 | |
| | | | |
|
| |
TOTAL INVESTMENTS
(COST $193,067,272)—100.0% | | | | | | 193,067,272 | |
| | | | |
|
| |
| |
| Percentages indicated are based on net assets of $193,139,288. |
| |
(a) | Variable rate security. The interest rates on these securities are adjusted periodically to reflect then-current short-term interest rates. The rates presented represent the rates in effect on October 31, 2009. The maturity dates presented reflect the final maturity dates. However, some of these securities may contain put or demand features that allow the fund to require the issuer to repurchase the security from the fund within various time periods, including daily, weekly, monthly, or semi-annually. |
| |
(b) | Rule 144A security or other security which is restricted as to resale to institutional investors. This security has been deemed liquid by the Investment Adviser based on procedures approved by the Board of Trustees. |
| |
(c) | The rate represents the annualized one-day yield that was in effect on October 31, 2009. |
| |
AMT | — Interest on security is subject to federal alternative minimum tax. |
FHA | — Federal Housing Administration |
FHLB | — Federal Home Loan Bank |
FHLMC | — Federal Home Loan Mortgage Corporation |
FNMA | — Federal National Mortgage Association |
FSA | — Financial Security Assurance |
GO | — General Obligation |
IDR | — Industrial Development Revenue |
LOC | — Letter of Credit |
PLC | — Public Limited Company |
SPA | — Standby Purchase Agreement |
| | |
See notes to financial statements. | HSBC INVESTOR FAMILY OF FUNDS | 28 |
|
HSBC INVESTOR U.S. GOVERNMENT MONEY MARKET FUND |
|
Schedule of Portfolio Investments—As of October 31, 2009 |
| | | | | | | |
U.S. Government and Government Agency Obligations—40.8% |
|
| | | | | |
| | Principal
Amount ($) | | Amortized
Cost ($) | |
| |
| |
| |
Federal Farm Credit Bank – 8.3% | | | | | | | |
0.31%, 11/16/09 (a) | | | 200,000,000 | | | 200,000,000 | |
0.72%, 11/17/09 (b) | | | 25,000,000 | | | 24,992,111 | |
0.66%, 11/20/09 (b) | | | 125,000,000 | | | 124,957,118 | |
1.11%, 12/9/09 (b) | | | 250,000,000 | | | 249,715,000 | |
0.81%, 12/15/09 (b) | | | 25,000,000 | | | 24,975,861 | |
0.32%, 12/16/09 (b) | | | 90,000,000 | | | 89,964,000 | |
0.43%, 3/24/10 (b) | | | 43,000,000 | | | 42,928,262 | |
0.50%, 4/5/10 (b) | | | 50,000,000 | | | 49,894,514 | |
5.25%, 6/24/10 | | | 36,725,000 | | | 37,844,285 | |
0.49%, 7/23/10 (a) | | | 50,000,000 | | | 50,102,467 | |
0.48%, 8/19/10 (b) | | | 65,000,000 | | | 64,747,800 | |
0.22%, 9/3/10, Series 1 (a) | | | 100,000,000 | | | 100,000,000 | |
5.25%, 9/13/10 | | | 16,340,000 | | | 17,029,799 | |
| | | | |
|
| |
| | | | | | 1,077,151,217 | |
| | | | |
|
| |
Federal Home Loan Bank – 20.0% | | | | | | | |
4.25%, 11/20/09 | | | 100,000,000 | | | 100,206,164 | |
0.08%, 12/4/09 (b) | | | 114,642,000 | | | 114,633,593 | |
0.09%, 12/11/09 (b) | | | 150,000,000 | | | 149,985,833 | |
0.09%, 12/16/09 (b) | | | 100,000,000 | | | 99,989,375 | |
0.08%, 1/27/10 (b) | | | 250,000,000 | | | 249,951,667 | |
0.51%, 2/1/10 (b) | | | 100,000,000 | | | 99,872,222 | |
1.00%, 2/5/10, Series 2 | | | 150,000,000 | | | 149,980,274 | |
2.75%, 3/12/10 | | | 100,000,000 | | | 100,872,691 | |
2.35%, 3/19/10 | | | 141,500,000 | | | 141,756,685 | |
0.20%, 4/16/10 (a) | | | 300,000,000 | | | 300,000,000 | |
0.55%, 6/4/10 | | | 86,205,000 | | | 86,194,844 | |
0.68%, 7/2/10 | | | 72,000,000 | | | 72,000,000 | |
0.52%, 7/7/10 (b) | | | 35,000,000 | | | 34,877,033 | |
0.55%, 8/5/10 | | | 100,000,000 | | | 99,956,743 | |
0.68%, 8/25/10 | | | 100,000,000 | | | 100,000,000 | |
0.42%, 9/21/10 | | | 85,000,000 | | | 84,976,852 | |
0.77%, 9/29/10 | | | 48,000,000 | | | 48,141,316 | |
0.50%, 10/25/10 | | | 100,000,000 | | | 100,063,561 | |
0.50%, 10/28/10, Series 2,
Callable 4/28/10 @ 100 | | | 100,000,000 | | | 100,000,000 | |
0.50%, 10/29/10, Series 1 | | | 40,000,000 | | | 40,017,469 | |
0.50%, 10/29/10 | | | 100,000,000 | | | 100,062,957 | |
0.50%, 11/3/10,
Callable 5/31/10 @ 100 | | | 100,000,000 | | | 100,000,000 | |
0.50%, 11/24/10 | | | 100,000,000 | | | 100,000,000 | |
| | | | |
|
| |
| | | | | | 2,573,539,279 | |
| | | | |
|
| |
Federal Home Loan Mortgage Corp. – 6.9% | | | | | | | |
0.24%, 11/23/09 (b) | | | 100,000,000 | | | 99,985,333 | |
4.13%, 11/30/09 | | | 99,611,000 | | | 99,883,129 | |
4.00%, 12/15/09 | | | 10,579,000 | | | 10,621,975 | |
0.64%, 1/4/10 (b) | | | 100,000,000 | | | 99,888,000 | |
0.56%, 1/8/10 (a) | | | 10,000,000 | | | 10,000,000 | |
0.36%, 2/22/10 (b) | | | 200,000,000 | | | 199,780,278 | |
7.00%, 3/15/10 | | | 19,445,000 | | | 19,901,016 | |
0.16%, 3/30/10 (b) | | | 50,000,000 | | | 49,966,889 | |
2.88%, 4/30/10 | | | 10,000,000 | | | 10,107,258 | |
0.52%, 7/6/10 (b) | | | 50,000,000 | | | 49,825,042 | |
1.33%, 8/18/10 | | | 12,600,000 | | | 12,699,434 | |
1.45%, 9/10/10 | | | 77,425,000 | | | 78,149,136 | |
| | | | | | | |
U.S. Government and Government Agency Obligations, continued | | | | | | | |
|
| | | | | | | |
| | Principal
Amount ($) | | Amortized
Cost ($) | |
| |
| |
| |
Federal Home Loan Mortgage Corp., continued | | | | | | | |
6.88%, 9/15/10 | | | 98,957,000 | | | 104,551,915 | |
3.13%, 10/25/10 | | | 33,305,000 | | | 34,190,595 | |
| | | | |
|
| |
| | | | | | 879,550,000 | |
| | | | |
|
| |
Federal National Mortgage Association – 5.6% | | | | | | | |
0.29%, 11/12/09 (b) | | | 50,000,000 | | | 49,995,569 | |
0.29%, 11/16/09 (b) | | | 50,000,000 | | | 49,993,958 | |
0.44%, 12/29/09 (a) | | | 150,000,000 | | | 149,935,246 | |
0.49%, 12/30/09 (b) | | | 96,400,000 | | | 96,324,165 | |
0.50%, 2/22/10 (b) | | | 175,566,000 | | | 175,295,970 | |
4.13%, 5/15/10 | | | 39,500,000 | | | 40,231,945 | |
0.53%, 7/19/10 (b) | | | 100,000,000 | | | 99,624,444 | |
0.36%, 10/1/10 (b) | | | 50,000,000 | | | 49,833,000 | |
2.88%, 10/12/10 | | | 25,000,000 | | | 25,581,380 | |
| | | | |
|
| |
| | | | | | 736,815,677 | |
| | | | |
|
| |
TOTAL U.S. GOVERNMENT AND
GOVERNMENT AGENCY OBLIGATIONS
(COST $5,267,056,173) | | | | | | 5,267,056,173 | |
| | | | |
|
| |
U.S. Treasury Obligations—1.2% | | | | | | | |
|
|
|
|
|
|
|
|
|
U.S. Treasury Bills – 1.2% | | | | | | | |
0.28%, 11/19/09 (b) | | | 100,000,000 | | | 99,985,875 | |
0.40%, 7/15/10 (b) | | | 50,000,000 | | | 49,859,734 | |
| | | | |
|
| |
| | | | | | 149,845,609 | |
| | | | |
|
| |
TOTAL U.S. TREASURY OBLIGATIONS
(COST $149,845,609) | | | | | | 149,845,609 | |
| | | | |
|
| |
Repurchase Agreements—58.6% | | | | | | | |
|
|
|
|
|
|
|
|
|
Bank of America Corp., purchased on
10/6/09, 0.12%, due 11/5/09 with a
maturity value of $250,025,000,
Collateralized by various
U.S. Government and Government
Agency Obligations, 0.00%-7.87%,
12/1/10-11/1/39, fair value $255,000,001 | | | 250,000,000 | | | 250,000,000 | |
Bank of America Corp., purchased on
9/22/09, 0.15%, due 11/16/09 with a
maturity value of $250,057,292,
Collateralized by various
U.S. Government and Government
Agency Obligations, 2.10%-7.00%,
3/1/18-10/1/39, fair value $255,000,000 | | | 250,000,000 | | | 250,000,000 | |
Bank of America Corp., purchased on
10/29/09, 0.10%, due 11/30/09 with a
maturity value of $250,021,528,
Collateralized by various
U.S. Government and Government
Agency Obligations, 4.00%-6.029%,
12/1/18-1/1/39, fair value $255,000,001 | | | 250,000,000 | | | 250,000,000 | |
BNP Paribas, purchased on 10/30/09,
0.08% due 11/2/09 with a maturity
value of $1,200,008,000, Collateralized
by various U.S. Government and
Government Agency Obligations,
5.50%, 6/1/33-6/1/38, fair value
$1,224,000,000 | | | 1,200,000,000 | | | 1,200,000,000 | |
| | |
29 | HSBC INVESTOR FAMILY OF FUNDS | See notes to financial statements. |
|
HSBC INVESTOR U.S. GOVERNMENT MONEY MARKET FUND |
|
Schedule of Portfolio Investments—As of October 31, 2009 (continued) |
| | | | | | | |
Repurchase Agreements, continued | | | | | |
|
| | | | | |
| | Principal
Amount ($) | | Amortized
Cost ($) | |
| |
| |
| |
BNP Paribas, purchased on 10/8/09,
0.12% due 11/9/09 with a maturity
value of $250,026,667, Collateralized
by various U.S. Government and
Government Agency Obligations,
2.10%-6.93%, 12/1/16-8/1/46,
fair value $255,000,000 | | | 250,000,000 | | | 250,000,000 | |
BNP Paribas, purchased on 10/15/09,
0.14% due 11/16/09 with a maturity
value of $250,031,111, Collateralized
by various U.S. Government and
Government Agency Obligations,
1.41%-7.72%, 12/1/16-9/1/46,
fair value $255,000,000 | | | 250,000,000 | | | 250,000,000 | |
BNP Paribas, purchased on 10/26/09,
0.08% due 11/25/09 with a maturity
value of $250,016,667, Collateralized
by various U.S. Government and
Government Agency Obligations,
0.00%-6.50%, 8/1/19-8/1/45,
fair value $255,000,001 | | | 250,000,000 | | | 250,000,000 | |
Deutsche Bank, purchased on 10/30/09,
0.08%, due 11/2/09 with a maturity
value of $1,600,010,667,
Collateralized by various
U.S. Government and Government
Agency Obligations, 4.53%-7.00%,
6/1/35-10/1/39, fair value
$1,632,000,000 | | | 1,600,000,000 | | | 1,600,000,000 | |
Goldman Sachs, purchased on 10/30/09,
0.08%, due 11/2/09 with a maturity
value of $1,400,009,333,
Collateralized by various
U.S. Government and Government
Agency Obligations, 0.00%-2.75%,
12/1/10-12/28/12, fair value
$1,428,000,000 | | | 1,400,000,000 | | | 1,400,000,000 | |
Greenwich Capital Markets, Inc.,
purchased on 10/13/09, 0.12%, due
11/5/09 with a maturity value of
$250,019,167, Collateralized by
various U.S. Government and
Government Agency Obligations,
5.50%, 4/1/37, fair value
$255,004,177 | | | 250,000,000 | | | 250,000,000 | |
Greenwich Capital Markets, Inc.,
purchased on 10/27/09, 0.10%, due
11/19/09 with a maturity value of
$250,015,972, Collateralized by
various U.S. Government and
Government Agency Obligations,
5.50%, 4/1/37, fair value
$255,004,177 | | | 250,000,000 | | | 250,000,000 | |
Greenwich Capital Markets, Inc.,
purchased on 10/20/09, 0.10%, due
11/12/09 with a maturity value of
$250,015,972, Collateralized by
various U.S. Government and
Government Agency Obligations,
5.00%-5.50%, 4/1/37-10/1/39,
fair value $255,002,922 | | | 250,000,000 | | | 250,000,000 | |
| | | | | | | |
Repurchase Agreements, continued | | | | | | | |
|
|
|
|
|
|
| | | | | |
| | Principal
Amount ($) | | Amortized
Cost ($) | |
| |
| |
| |
Greenwich Capital Markets, Inc.,
purchased on 10/30/09, 0.07%, due
11/2/09 with a maturity value of
$500,002,917, Collateralized by
various U.S. Government and
Government Agency Obligations,
0.00%-5.00%, 2/1/33-10/1/39,
fair value $510,002,088 | | | 500,000,000 | | | 500,000,000 | |
Morgan Stanley, purchased on 10/30/09,
0.07%, due 11/2/09 with a maturity
value of $600,003,500, Collateralized
by various U.S. Government and
Government Agency Obligations,
2.81%-8.00%, 3/1/18-11/1/39,
fair value $612,007,749 | | | 600,000,000 | | | 600,000,000 | |
| | | | |
|
| |
TOTAL REPURCHASE AGREEMENTS
(COST $7,550,000,000) | | | | | | 7,550,000,000 | |
| | | | |
|
| |
TOTAL INVESTMENTS
(COST $12,966,901,782)—100.6% | | | | | | 12,966,901,782 | |
| | | | |
|
| |
| |
| Percentages indicated are based on net assets of $12,889,720,942. |
| |
(a) | Variable rate security. The interest rates on these securities are adjusted periodically to reflect then-current short-term interest rates. The rates presented represent the rates in effect on October 31, 2009. The maturity dates presented reflect the final maturity dates. However, some of these securities may contain put or demand features that allow the fund to require the issuer to repurchase the security from the fund within various time periods, including daily, weekly, monthly, or semi-annually. |
| |
(b) | Discount note. Rate presented represents the effective yield at time of purchase. |
| | |
See notes to financial statements. | HSBC INVESTOR FAMILY OF FUNDS | 30 |
|
HSBC INVESTOR U.S. TREASURY MONEY MARKET FUND |
|
Schedule of Portfolio Investments—As of October 31, 2009 |
| | | | | | | |
U.S. Treasury Obligations—97.3% |
|
| | | | | | | |
| | Principal
Amount ($) | | Amortized
Cost ($) | |
| |
| |
| |
U.S. Treasury Bills – 94.9% | | | | | | | |
0.13%, 11/5/09 (a) | | | 875,000,000 | | | 874,991,209 | |
0.12%, 11/12/09 (a) | | | 528,800,000 | | | 528,788,717 | |
0.18%, 11/19/09 (a) | | | 999,700,000 | | | 999,646,929 | |
0.22%, 11/27/09 (a) | | | 1,175,000,000 | | | 1,174,922,219 | |
0.30%, 12/3/09 (a) | | | 50,000,000 | | | 49,986,667 | |
0.35%, 12/10/09 (a) | | | 50,000,000 | | | 49,981,001 | |
0.30%, 12/17/09 (a) | | | 75,000,000 | | | 74,972,576 | |
0.29%, 12/24/09 (a) | | | 50,000,000 | | | 49,978,690 | |
0.35%, 12/31/09 (a) | | | 50,000,000 | | | 49,970,875 | |
0.27%, 1/7/10 (a) | | | 50,000,000 | | | 49,974,875 | |
0.28%, 1/14/10 (a) | | | 250,000,000 | | | 249,858,219 | |
0.28%, 1/21/10 (a) | | | 125,000,000 | | | 124,922,178 | |
0.27%, 2/4/10 (a) | | | 100,000,000 | | | 99,928,288 | |
0.27%, 2/11/10 (a) | | | 125,000,000 | | | 124,902,746 | |
0.27%, 2/18/10 (a) | | | 100,000,000 | | | 99,918,213 | |
0.25%, 2/25/10 (a) | | | 75,000,000 | | | 74,938,496 | |
0.22%, 3/4/10 (a) | | | 75,000,000 | | | 74,943,625 | |
0.23%, 3/11/10 (a) | | | 150,000,000 | | | 149,875,868 | |
0.30%, 4/1/10 (a) | | | 25,000,000 | | | 24,968,542 | |
0.36%, 6/10/10 (a) | | | 75,000,000 | | | 74,843,382 | |
0.36%, 6/17/10 (a) | | | 225,000,000 | | | 224,512,414 | |
0.24%, 7/15/10 (a) | | | 25,000,000 | | | 24,957,867 | |
0.28%, 8/26/10 (a) | | | 10,000,000 | | | 9,976,657 | |
0.37%, 10/21/10 (a) | | | 115,000,000 | | | 114,578,592 | |
| | | | |
|
| |
| | | | | | 5,376,338,845 | |
| | | | |
|
| |
U.S. Treasury Notes – 2.4% | | | | | | | |
3.50%, 2/15/10 | | | 30,000,000 | | | 30,275,509 | |
2.00%, 2/28/10 | | | 30,000,000 | | | 30,165,460 | |
2.38%, 8/31/10 | | | 50,000,000 | | | 50,847,445 | |
1.50%, 10/31/10 | | | 25,000,000 | | | 25,266,188 | |
| | | | |
|
| |
| | | | | | 136,554,602 | |
| | | | |
|
| |
Total U.S. Treasury Obligations (COST $5,512,893,447) | | | | | | 5,512,893,447 | |
| | | | |
|
| |
TOTAL INVESTMENTS
(COST $5,512,893,447)—97.3% | | | | | | 5,512,893,447 | |
| | | | |
|
| |
| |
| Percentages indicated are based on net assets of $5,668,114,055. |
| |
(a) | Discount note. Rate presented represents the effective yield at time of purchase. |
| | |
31 | HSBC INVESTOR FAMILY OF FUNDS | See notes to financial statements. |
(This Page Intentionally Left Blank)
HSBC INVESTOR FAMILY OF FUNDS
Statements of Assets and Liabilities—As of October 31, 2009
| | | | | | | | | | |
| | California
Tax-Free
Money Market
Fund | | New York
Tax-Free
Money Market
Fund | | Prime
Money Market
Fund | |
|
|
|
|
|
|
|
|
Assets: | | | | | | | | | | |
Investments, at amortized cost | | $ | 136,425,095 | | $ | 642,427,327 | | $ | 11,070,114,786 | |
Interest and dividends receivable | | | 55,071 | | | 182,798 | | | 13,518,811 | |
Receivable for capital shares issued | | | 705 | | | 10,074 | | | 464,457 | |
Receivable for investments sold | | | — | | | 32,000,000 | | | — | |
Prepaid expenses and other assets | | | 21,173 | | | 34,572 | | | 159,341 | |
| |
|
| |
|
| |
|
| |
Total Assets | | | 136,502,044 | | | 674,654,771 | | | 11,084,257,395 | |
| |
|
| |
|
| |
|
| |
| | | | | | | | | | |
Liabilities: | | | | | | | | | | |
Dividends payable | | | 3,736 | | | 13,403 | | | 898,732 | |
Payable for investments purchased | | | — | | | — | | | 99,473,954 | |
Accrued expenses and other liabilities: | | | | | | | | | | |
Investment Management | | | 6,296 | | | 82,662 | | | 1,318,935 | |
Administration | | | 4,761 | | | 24,026 | | | 380,212 | |
Distribution | | | — | | | — | | | 26,268 | |
Shareholder Servicing | | | 8,275 | | | — | | | — | |
Compliance Services | | | 1 | | | — | | | — | |
Transfer Agent | | | 5,902 | | | 6,514 | | | 28,485 | |
Trustee | | | 429 | | | 1,619 | | | 45,400 | |
Other | | | 5,040 | | | 39,321 | | | 402,964 | |
| |
|
| |
|
| |
|
| |
Total Liabilities | | | 34,440 | | | 167,545 | | | 102,574,950 | |
| |
|
| |
|
| |
|
| |
Net Assets | | $ | 136,467,604 | | $ | 674,487,226 | | $ | 10,981,682,445 | |
| |
|
| |
|
| |
|
| |
| | | | | | | | | | |
Composition of Net Assets: | | | | | | | | | | |
Capital | | $ | 136,470,493 | | $ | 674,500,629 | | $ | 10,982,091,731 | |
Accumulated net investment income (loss) | | | 36 | | | (13,403 | ) | | (35,094 | ) |
Accumulated net realized gains (losses) from investment transactions | | | (2,925 | ) | | — | | | (374,192 | ) |
| |
|
| |
|
| |
|
| |
Net Assets | | $ | 136,467,604 | | $ | 674,487,226 | | $ | 10,981,682,445 | |
| |
|
| |
|
| |
|
| |
| | | | | | | | | | |
Net Assets: | | | | | | | | | | |
Class A Shares | | $ | 221,214 | | $ | 40,697,887 | | $ | 343,265,397 | |
Class B Shares | | | — | | | 21,447 | | | 312,332 | |
Class C Shares | | | — | | | — | | | 259,363,883 | |
Class D Shares | | | 115,159,575 | | | 423,061,456 | | | 1,994,447,915 | |
Class I Shares | | | — | | | — | | | 7,189,613,112 | |
Class Y Shares | | | 21,086,815 | | | 210,706,436 | | | 1,194,679,806 | |
| |
|
| |
|
| |
|
| |
| | $ | 136,467,604 | | $ | 674,487,226 | | $ | 10,981,682,445 | |
| |
|
| |
|
| |
|
| |
| | | | | | | | | | |
Shares Outstanding
($0.001 par value, unlimited number of shares authorized): | | | | | | | | | | |
Class A Shares | | | 221,243 | | | 40,697,368 | | | 343,377,650 | |
Class B Shares | | | — | | | 21,408 | | | 312,347 | |
Class C Shares | | | — | | | — | | | 259,386,521 | |
Class D Shares | | | 115,155,514 | | | 423,077,755 | | | 1,995,478,524 | |
Class I Shares | | | — | | | — | | | 7,188,996,044 | |
Class Y Shares | | | 21,095,356 | | | 210,710,652 | | | 1,194,555,298 | |
| | | | | | | | | | |
Net Asset Value, Offering Price and Redemption Price per share: | | | | | | | | | | |
Class A Shares | | $ | 1.00 | | $ | 1.00 | | $ | 1.00 | |
Class B Shares* | | $ | — | | $ | 1.00 | | $ | 1.00 | |
Class C Shares* | | $ | — | | $ | — | | $ | 1.00 | |
Class D Shares | | $ | 1.00 | | $ | 1.00 | | $ | 1.00 | |
Class I Shares | | $ | — | | $ | — | | $ | 1.00 | |
Class Y Shares | | $ | 1.00 | | $ | 1.00 | | $ | 1.00 | |
| |
|
| |
|
| |
|
| |
Total Investments, at amortized cost | | $ | 136,425,095 | | $ | 642,427,327 | | $ | 11,070,114,786 | |
| |
|
| |
|
| |
|
| |
| | |
|
* | Redemption price per share varies by the length of time shares are held. | |
| | |
33 | HSBC INVESTOR FAMILY OF FUNDS | See notes to financial statements. |
HSBC INVESTOR FAMILY OF FUNDS
Statements of Assets and Liabilities—As of October 31, 2009 (continued)
| | | | | | | | | | |
| | Tax-Free
Money Market
Fund | | U.S.
Government
Money Market
Fund | | U.S. Treasury
Money Market
Fund | |
|
|
|
|
|
|
|
|
Assets: | | | | | | | | | | |
Investments, at amortized cost | | $ | 193,067,272 | | $ | 5,416,901,782 | | $ | 5,512,893,447 | |
Repurchase agreements, at cost | | | — | | | 7,550,000,000 | | | — | |
| |
|
| |
|
| |
|
| |
Total Investments | | | 193,067,272 | | | 12,966,901,782 | | | 5,512,893,447 | |
| |
|
| |
|
| |
|
| |
Cash | | | — | | | 15,063,153 | | | 53,490,349 | |
Interest and dividends receivable | | | 78,965 | | | 10,132,559 | | | 2,529,737 | |
Receivable for capital shares issued | | | 12,517 | | | 627,661 | | | 68,751 | |
Receivable for investments sold | | | — | | | — | | | 100,000,000 | |
Prepaid expenses and other assets | | | 32,534 | | | 509,239 | | | 132,161 | |
| |
|
| |
|
| |
|
| |
Total Assets | | | 193,191,288 | | | 12,993,234,394 | | | 5,669,114,445 | |
| |
|
| |
|
| |
|
| |
| | | | | | | | | | |
Liabilities: | | | | | | | | | | |
Dividends payable | | | 18,451 | | | 962,661 | | | 103,495 | |
Payable for investments purchased | | | — | | | 100,000,000 | | | — | |
Accrued expenses and other liabilities: | | | | | | | | | | |
Investment Management | | | — | | | 1,484,129 | | | 493,043 | |
Administration | | | 6,528 | | | 431,252 | | | 161,296 | |
Distribution | | | 9 | | | 302 | | | — | |
Shareholder Servicing | | | 9,097 | | | 2,659 | | | — | |
Compliance Services | | | — | | | 237 | | | — | |
Transfer Agent | | | 6,375 | | | 24,581 | | | 14,284 | |
Trustee | | | 409 | | | 36,723 | | | 13,699 | |
Other | | | 11,131 | | | 570,908 | | | 214,573 | |
| |
|
| |
|
| |
|
| |
Total Liabilities | | | 52,000 | | | 103,513,452 | | | 1,000,390 | |
| |
|
| |
|
| |
|
| |
Net Assets | | $ | 193,139,288 | | $ | 12,889,720,942 | | $ | 5,668,114,055 | |
| |
|
| |
|
| |
|
| |
| | | | | | | | | | |
Composition of Net Assets: | | | | | | | | | | |
Capital | | $ | 193,139,238 | | $ | 12,888,358,386 | | $ | 5,668,185,302 | |
Accumulated net investment income | | | 50 | | | 4,056 | | | 4,245 | |
Accumulated net realized gains (losses) from investment transactions | | | — | | | 1,358,500 | | | (75,492 | ) |
| |
|
| |
|
| |
|
| |
Net Assets | | $ | 193,139,288 | | $ | 12,889,720,942 | | $ | 5,668,114,055 | |
| |
|
| |
|
| |
|
| |
| | | | | | | | | | |
Net Assets: | | | | | | | | | | |
Class A Shares | | $ | 255 | | $ | 574,577,433 | | $ | 385,993,604 | |
Class B Shares | | | — | | | 83,892 | | | 59,686 | |
Class C Shares | | | — | | | 229,333 | | | 7,138,312 | |
Class D Shares | | | 95,349,929 | | | 767,551,470 | | | 955,651,873 | |
Class I Shares | | | — | | | 8,176,980,221 | | | 3,322,961,862 | |
Class Y Shares | | | 97,789,104 | | | 3,370,298,593 | | | 996,308,718 | |
| |
|
| |
|
| |
|
| |
| | $ | 193,139,288 | | $ | 12,889,720,942 | | $ | 5,668,114,055 | |
| |
|
| |
|
| |
|
| |
| | | | | | | | | | |
Shares Outstanding
($0.001 par value, unlimited number of shares authorized): | | | | | | | | | | |
Class A Shares | | | 255 | | | 574,111,122 | | | 386,031,326 | |
Class B Shares | | | — | | | 83,878 | | | 59,690 | |
Class C Shares | | | — | | | 229,344 | | | 7,138,368 | |
Class D Shares | | | 95,348,744 | | | 767,135,439 | | | 955,655,501 | |
Class I Shares | | | — | | | 8,176,843,885 | | | 3,323,001,907 | |
Class Y Shares | | | 97,789,871 | | | 3,369,955,075 | | | 996,310,378 | |
| | | | | | | | | | |
Net Asset Value, Offering Price and Redemption Price per share: | | | | | | | | | | |
Class A Shares | | $ | 1.00 | | $ | 1.00 | | $ | 1.00 | |
Class B Shares* | | $ | — | | $ | 1.00 | | $ | 1.00 | |
Class C Shares* | | $ | — | | $ | 1.00 | | $ | 1.00 | |
Class D Shares | | $ | 1.00 | | $ | 1.00 | | $ | 1.00 | |
Class I Shares | | $ | — | | $ | 1.00 | | $ | 1.00 | |
Class Y Shares | | $ | 1.00 | | $ | 1.00 | | $ | 1.00 | |
| |
|
| |
|
| |
|
| |
Total Investments, at amortized cost | | $ | 193,067,272 | | $ | 12,966,901,782 | | $ | 5,512,893,447 | |
| |
|
| |
|
| |
|
| |
| |
|
* | Redemption price per share varies by length of times shares are held. |
| | |
See notes to financial statements. | HSBC INVESTOR FAMILY OF FUNDS | 34 |
HSBC INVESTOR FAMILY OF FUNDS
Statements of Operations—For the year ended October 31, 2009
| | | | | | | | | | |
| | California
Tax-Free
Money Market
Fund | | New York
Tax-Free
Money Market
Fund | | Prime
Money Market
Fund | |
|
|
|
|
|
|
|
|
Investment Income: | | | | | | | | | | |
Interest | | $ | 494,333 | | $ | 6,195,402 | | $ | 89,374,329 | |
Dividends | | | 18,490 | | | 148,995 | | | 855 | |
| |
|
| |
|
| |
|
| |
Total Investment Income | | | 512,823 | | | 6,344,397 | | | 89,375,184 | |
| |
|
| |
|
| |
|
| |
| | | | | | | | | | |
Expenses: | | | | | | | | | | |
Investment Management | | | 97,282 | | | 929,345 | | | 11,052,450 | |
Advisory Services: | | | | | | | | | | |
Operational Support—Class A Shares | | | 275 | | | 19,516 | | | 330,906 | |
Operational Support—Class B Shares | | | — | | | 14 | | | 361 | |
Operational Support—Class C Shares | | | 3 | | | — | | | 273,423 | |
Operational Support—Class D Shares | | | 81,982 | | | 259,642 | | | 2,505,134 | |
Operational Support—Class Y Shares | | | 15,022 | | | 185,500 | | | 1,360,039 | |
Administration: | | | | | | | | | | |
Class A Shares | | | 105 | | | 15,294 | | | 128,950 | |
Class B Shares | | | — | | | 10 | | | 140 | |
Class C Shares | | | 1 | | | — | | | 106,862 | |
Class D Shares | | | 31,721 | | | 203,620 | | | 978,278 | |
Class I Shares | | | — | | | — | | | 2,547,312 | |
Class Y Shares | | | 5,842 | | | 144,708 | | | 532,416 | |
Distribution: | | | | | | | | | | |
Class B Shares | | | — | | | 203 | | | 2,738 | |
Class C Shares | | | 19 | | | — | | | 2,054,144 | |
Shareholder Servicing: | | | | | | | | | | |
Class A Shares | | | 1,118 | | | 156,682 | | | 1,326,013 | |
Class B Shares | | | — | | | 69 | | | 904 | |
Class C Shares | | | 5 | | | — | | | 683,563 | |
Class D Shares | | | 202,828 | | | 1,297,300 | | | 6,278,595 | |
Accounting | | | 70,650 | | | 80,313 | | | 84,398 | |
Compliance Services | | | 691 | | | 7,841 | | | 91,575 | |
Custodian | | | 6,472 | | | 49,393 | | | 331,783 | |
Printing | | | 12,572 | | | 27,363 | | | 327,310 | |
Professional | | | 4,782 | | | 40,098 | | | 521,277 | |
Transfer Agent | | | 34,607 | | | 41,954 | | | 144,207 | |
Treasury Guarantee Program (See Note 8) | | | 45,669 | | | 395,493 | | | 3,028,653 | |
Trustee | | | 3,155 | | | 28,071 | | | 328,148 | |
Registration | | | 30,788 | | | 46,339 | | | 278,508 | |
Other | | | 3,556 | | | 25,228 | | | 296,960 | |
| |
|
| |
|
| |
|
| |
Total expenses before fee reductions | | | 649,145 | | | 3,953,996 | | | 35,595,047 | |
Fees reduced by Investment Adviser | | | (145,922 | ) | | — | | | — | |
Fees reduced by Advisory Services | | | (301 | ) | | (27,729 | ) | | — | |
Fees reduced by Administrator | | | — | | | — | | | (182,331 | ) |
Fees reduced by Custody Credits | | | — | | | — | | | (12,542 | ) |
Fees reduced by Distributor | | | (11 | ) | | (129 | ) | | (991,957 | ) |
Fees reduced by Shareholder Servicing Agent | | | (112,303 | ) | | (535,301 | ) | | (2,360,133 | ) |
| |
|
| |
|
| |
|
| |
Net Expenses | | | 390,608 | | | 3,390,837 | | | 32,048,084 | |
| |
|
| |
|
| |
|
| |
Net Investment Income (Loss) | | | 122,215 | | | 2,953,560 | | | 57,327,100 | |
| |
|
| |
|
| |
|
| |
Net realized gains/(losses) from investment transactions | | | (1 | ) | | — | | | 3,584,834 | |
| |
|
| |
|
| |
|
| |
Change In Net Assets Resulting From Operations | | $ | 122,214 | | $ | 2,953,560 | | $ | 60,911,934 | |
| |
|
| |
|
| |
|
| |
| | |
35 | HSBC INVESTOR FAMILY OF FUNDS | See notes to financial statements. |
HSBC INVESTOR FAMILY OF FUNDS
Statements of Operations—For the year ended October 31, 2009 (continued)
| | | | | | | | | | |
| | Tax-Free
Money Market
Fund | | U.S.
Government
Money Market
Fund | | U.S. Treasury
Money Market
Fund | |
|
|
|
|
|
|
|
|
Investment Income: | | | | | | | | | | |
Interest | | $ | 1,621,330 | | $ | 80,725,134 | | $ | 19,202,822 | |
Dividends | | | 54,109 | | | — | | | — | |
| |
|
| |
|
| |
|
| |
Total Investment Income | | | 1,675,439 | | | 80,725,134 | | | 19,202,822 | |
| |
|
| |
|
| |
|
| |
| | | | | | | | | | |
Expenses: | | | | | | | | | | |
Investment Management | | | 228,879 | | | 12,588,953 | | | 6,397,981 | |
Advisory Services: | | | | | | | | | | |
Operational Support—Class A Shares | | | — | | | 622,667 | | | 459,514 | |
Operational Support—Class B Shares | | | — | | | 86 | | | 118 | |
Operational Support—Class C Shares | | | — | | | 245 | | | 4,964 | |
Operational Support—Class D Shares | | | 94,695 | | | 1,015,086 | | | 1,072,422 | |
Operational Support—Class Y Shares | | | 134,184 | | | 3,788,246 | | | 1,031,323 | |
Administration: | | | | | | | | | | |
Class A Shares | | | — | | | 242,894 | | | 179,747 | |
Class B Shares | | | — | | | 32 | | | 46 | |
Class C Shares | | | — | | | 95 | | | 1,924 | |
Class D Shares | | | 36,907 | | | 397,401 | | | 420,162 | |
Class I Shares | | | — | | | 2,777,778 | | | 1,499,213 | |
Class Y Shares | | | 52,331 | | | 1,484,133 | | | 403,476 | |
Distribution: | | | | | | | | | | |
Class B Shares | | | — | | | 638 | | | 888 | |
Class C Shares | | | — | | | 1,837 | | | 37,229 | |
Shareholder Servicing: | | | | | | | | | | |
Class A Shares | | | — | | | 2,492,173 | | | 1,838,076 | |
Class B Shares | | | — | | | 218 | | | 296 | |
Class C Shares | | | — | | | 611 | | | 12,410 | |
Class D Shares | | | 237,748 | | | 2,536,925 | | | 2,681,079 | |
Accounting | | | 83,808 | | | 74,776 | | | 67,760 | |
Compliance Services | | | 1,899 | | | 105,323 | | | 49,441 | |
Custodian | | | 16,573 | | | 351,263 | | | 272,908 | |
Printing | | | 3,325 | | | 187,964 | | | 80,924 | |
Professional | | | 9,836 | | | 483,465 | | | 321,024 | |
Transfer Agent | | | 38,189 | | | 144,674 | | | 84,440 | |
Treasury Guarantee Program (See Note 8) | | | 78,254 | | | 7,872,373 | | | — | |
Trustee | | | 6,395 | | | 400,929 | | | 180,783 | |
Registration | | | 83,450 | | | 719,679 | | | 291,632 | |
Other | | | 4,879 | | | 374,540 | | | 148,185 | |
| |
|
| |
|
| |
|
| |
Total expenses before fee reductions | | | 1,111,352 | | | 38,665,004 | | | 17,537,965 | |
Fees reduced by Investment Adviser | | | (457,766 | ) | | — | | | — | |
Fees reduced by Advisory Services | | | — | | | (31,088 | ) | | (1,015,685 | ) |
Fees reduced by Administrator | | | — | | | (260,352 | ) | | (202,015 | ) |
Fees reduced by Custody Credits | | | — | | | (27,335 | ) | | (24,377 | ) |
Fees reduced by Distributor | | | — | | | (1,920 | ) | | (37,225 | ) |
Fees reduced by Shareholder Servicing Agent | | | (13,873 | ) | | (2,258,930 | ) | | (4,338,266 | ) |
| |
|
| |
|
| |
|
| |
Net Expenses | | | 639,713 | | | 36,085,379 | | | 11,920,397 | |
| |
|
| |
|
| |
|
| |
Net Investment Income (Loss) | | | 1,035,726 | | | 44,639,755 | | | 7,282,425 | |
| |
|
| |
|
| |
|
| |
Net realized gains/(losses) from investment transactions | | | 2 | | | 1,358,500 | | | 240,063 | |
| |
|
| |
|
| |
|
| |
Change In Net Assets Resulting From Operations | | $ | 1,035,728 | | $ | 45,998,255 | | $ | 7,522,488 | |
| |
|
| |
|
| |
|
| |
| | |
See notes to financial statements. | HSBC INVESTOR FAMILY OF FUNDS | 36 |
|
HSBC INVESTOR FAMILY OF FUNDS |
|
Statements of Changes in Net Assets |
All capital share transactions have been processed at a net asset value of $1.00 per share. |
| | | | | | | | | | | | | |
| | California Tax-Free
Money Market Fund | | New York Tax-Free
Money Market Fund | |
|
|
|
|
|
|
| | For the
year ended
October 31, 2009 | | For the
year ended
October 31, 2008 | | For the
year ended
October 31, 2009 | | For the
year ended
October 31, 2008 | |
|
|
|
|
|
|
|
|
|
|
Investment Activities: | | | | | | | | | | | | | |
Operations: | | | | | | | | | | | | | |
Net investment income (loss) | | $ | 122,215 | | $ | 3,525,705 | | $ | 2,953,560 | | $ | 22,986,049 | |
Net realized gains (losses) from investments transactions | | | (1 | ) | | (2,900 | ) | | — | | | 19,955 | |
| |
|
| |
|
| |
|
| |
|
| |
Change in net assets resulting from operations | | | 122,214 | | | 3,522,805 | | | 2,953,560 | | | 23,006,004 | |
| |
|
| |
|
| |
|
| |
|
| |
| | | | | | | | | | | | | |
Dividends: | | | | | | | | | | | | | |
Net investment income: | | | | | | | | | | | | | |
Class A Shares | | | (259 | ) | | (518 | ) | | (81,076 | ) | | (1,479,339 | ) |
Class B Shares | | | — | | | — | | | (24 | ) | | (455 | ) |
Class C Shares | | | (4 | ) | | (6,483 | ) | | — | | | — | |
Class D Shares | | | (84,480 | ) | | (1,842,641 | ) | | (1,436,276 | ) | | (13,705,945 | ) |
Class Y Shares | | | (37,436 | ) | | (1,697,267 | ) | | (1,456,061 | ) | | (7,966,517 | ) |
Net realized gains: | | | | | | | | | | | | | |
Class A Shares | | | — | | | — | | | (383 | ) | | — | |
Class D Shares | | | — | | | — | | | (4,864 | ) | | — | |
Class Y Shares | | | — | | | — | | | (2,970 | ) | | — | |
| |
|
| |
|
| |
|
| |
|
| |
Change in net assets resulting from shareholder dividends | | | (122,179 | ) | | (3,546,909 | ) | | (2,981,654 | ) | | (23,152,256 | ) |
| |
|
| |
|
| |
|
| |
|
| |
Change in net assets resulting from capital transactions | | | 26,601,526 | | | (14,176,303 | ) | | (277,897,541 | ) | | (39,845,047 | ) |
| |
|
| |
|
| |
|
| |
|
| |
Change in net assets | | | 26,601,561 | | | (14,200,407 | ) | | (277,925,635 | ) | | (39,991,299 | ) |
| |
|
| |
|
| |
|
| |
|
| |
| | | | | | | | | | | | | |
Net Assets: | | | | | | | | | | | | | |
Beginning of period | | | 109,866,043 | | | 124,066,450 | | | 952,412,861 | | | 992,404,160 | |
| |
|
| |
|
| |
|
| |
|
| |
End of period | | $ | 136,467,604 | | $ | 109,866,043 | | $ | 674,487,226 | | $ | 952,412,861 | |
| |
|
| |
|
| |
|
| |
|
| |
Accumulated net investment income (loss) | | $ | 36 | | $ | — | | $ | (13,403 | ) | $ | — | |
| |
|
| |
|
| |
|
| |
|
| |
| | |
37 | HSBC INVESTOR FAMILY OF FUNDS | See notes to financial statements. |
|
HSBC INVESTOR FAMILY OF FUNDS |
|
Statements of Changes in Net Assets (continued) |
All capital share transactions have been processed at a net asset value of $1.00 per share. |
| | | | | | | | | | | | | |
| | California Tax-Free
Money Market Fund | | New York Tax-Free
Money Market Fund | |
|
|
|
|
|
|
| | For the
year ended
October 31, 2009 | | For the
year ended
October 31, 2008 | | For the
year ended
October 31, 2009 | | For the
year ended
October 31, 2008 | |
|
|
|
|
|
|
|
|
|
|
CAPITAL TRANSACTIONS: | | | | | | | | | | | | | |
Class A Shares: | | | | | | | | | | | | | |
Proceeds from shares issued | | $ | 335,984 | | $ | 681,499 | | $ | 114,978,329 | | $ | 210,390,939 | |
Dividends reinvested | | | 259 | | | 518 | | | 80,082 | | | 1,443,966 | |
Value of shares redeemed | | | (557,023 | ) | | (239,994 | ) | | (120,149,734 | ) | | (286,871,286 | ) |
| |
|
| |
|
| |
|
| |
|
| |
Class A Shares capital transactions | | | (220,780 | ) | | 442,023 | | | (5,091,323 | ) | | (75,036,381 | ) |
| |
|
| |
|
| |
|
| |
|
| |
| | | | | | | | | | | | | |
Class B Shares: | | | | | | | | | | | | | |
Dividends reinvested | | | — | | | — | | | 24 | | | 455 | |
Value of shares redeemed | | | — | | | — | | | (13,219 | ) | | (54 | ) |
| |
|
| |
|
| |
|
| |
|
| |
Class B Shares capital transactions | | | — | | | — | | | (13,195 | ) | | 401 | |
| |
|
| |
|
| |
|
| |
|
| |
| | | | | | | | | | | | | |
Class C Shares: | | | | | | | | | | | | | |
Proceeds from shares issued | | | 27,562 | | | 784 | | | — | | | — | |
Dividends reinvested | | | 4 | | | 6,483 | | | — | | | — | |
Value of shares redeemed | | | (27,566 | ) | | (1,025,743 | ) | | (1 | ) | | — | |
| |
|
| |
|
| |
|
| |
|
| |
Class C Shares capital transactions | | | — | | | (1,018,476 | ) | | (1 | ) | | — | |
| |
|
| |
|
| |
|
| |
|
| |
| | | | | | | | | | | | | |
Class D Shares: | | | | | | | | | | | | | |
Proceeds from shares issued | | | 301,424,257 | | | 415,175,969 | | | 1,091,358,577 | | | 2,052,625,049 | |
Dividends reinvested | | | 37,909 | | | 1,228,442 | | | 1,144,944 | | | 11,715,496 | |
Value of shares redeemed | | | (269,564,034 | ) | | (423,974,744 | ) | | (1,256,216,848 | ) | | (2,009,326,659 | ) |
| |
|
| |
|
| |
|
| |
|
| |
Class D Shares capital transactions | | | 31,898,132 | | | (7,570,333 | ) | | (163,713,327 | ) | | 55,013,886 | |
| |
|
| |
|
| |
|
| |
|
| |
| | | | | | | | | | | | | |
Class Y Shares: | | | | | | | | | | | | | |
Proceeds from shares issued | | | 169,462,249 | | | 542,672,399 | | | 1,093,831,944 | | | 1,210,332,698 | |
Dividends reinvested | | | 5,257 | | | 1,121,256 | | | 1,158,964 | | | 5,947,200 | |
Value of shares redeemed | | | (174,543,332 | ) | | (549,823,172 | ) | | (1,204,070,603 | ) | | (1,236,102,851 | ) |
| |
|
| |
|
| |
|
| |
|
| |
Class Y Shares capital transactions | | | (5,075,826 | ) | | (6,029,517 | ) | | (109,079,695 | ) | | (19,822,953 | ) |
| |
|
| |
|
| |
|
| |
|
| |
Change in net assets resulting from capital transactions | | $ | 26,601,526 | | $ | (14,176,303 | ) | $ | (277,897,541 | ) | $ | (39,845,047 | ) |
| |
|
| |
|
| |
|
| |
|
| |
| | |
See notes to financial statements. | HSBC INVESTOR FAMILY OF FUNDS | 38 |
|
HSBC INVESTOR FAMILY OF FUNDS |
|
Statements of Changes in Net Assets (continued) |
All capital share transactions have been processed at a net asset value of $1.00 per share. |
| | | | | | | | | | | | | |
| | Prime
Money Market Fund | | Tax-Free
Money Market Fund | |
|
|
|
|
|
|
| | For the
year ended
October 31, 2009 | | For the
year ended
October 31, 2008 | | For the
year ended
October 31, 2009 | | For the
year ended
October 31, 2008 | |
|
|
|
|
|
|
|
|
|
|
Investment Activities: | | | | | | | | | | | | | |
Operations: | | | | | | | | | | | | | |
Net investment income (loss) | | $ | 57,327,100 | | $ | 234,083,656 | | $ | 1,035,726 | | $ | 3,181,467 | |
Net realized gains (losses) from investment transactions | | | 3,584,834 | | | (3,685,003 | ) | | 2 | | | 716 | |
| |
|
| |
|
| |
|
| |
|
| |
Change in net assets resulting from operations | | | 60,911,934 | | | 230,398,653 | | | 1,035,728 | | | 3,182,183 | |
| |
|
| |
|
| |
|
| |
|
| |
| | | | | | | | | | | | | |
Dividends: | | | | | | | | | | | | | |
Net investment income: | | | | | | | | | | | | | |
Class A Shares | | | (1,016,162 | ) | | (10,717,376 | ) | | — | | | — | |
Class B Shares | | | (503 | ) | | (4,255 | ) | | — | | | — | |
Class C Shares | | | (518,642 | ) | | (7,530,526 | ) | | — | | | — | |
Class D Shares | | | (10,530,148 | ) | | (98,458,039 | ) | | (276,495 | ) | | (1,494,796 | ) |
Class I Shares | | | (36,107,949 | ) | | (79,246,127 | ) | | — | | | — | |
Class Y Shares | | | (9,188,251 | ) | | (38,841,857 | ) | | (759,183 | ) | | (1,686,697 | ) |
Net realized gains: | | | | | | | | | | | | | |
Class D Shares | | | — | | | — | | | (278 | ) | | — | |
Class Y Shares | | | — | | | — | | | (438 | ) | | — | |
| |
|
| |
|
| |
|
| |
|
| |
Change in net assets resulting from shareholder dividends | | | (57,361,655 | ) | | (234,798,180 | ) | | (1,036,394 | ) | | (3,181,493 | ) |
| |
|
| |
|
| |
|
| |
|
| |
Change in net assets resulting from capital transactions | | | 2,440,883,353 | | | 1,134,798,302 | | | (20,377,067 | ) | | 154,396,548 | |
| |
|
| |
|
| |
|
| |
|
| |
Change in net assets | | | 2,444,433,632 | | | 1,130,398,775 | | | (20,377,733 | ) | | 154,397,238 | |
| | | | | | | | | | | | | |
Net Assets: | | | | | | | | | | | | | |
Beginning of period | | | 8,537,248,813 | | | 7,406,850,038 | | | 213,517,021 | | | 59,119,783 | |
| |
|
| |
|
| |
|
| |
|
| |
End of period | | $ | 10,981,682,445 | | $ | 8,537,248,813 | | $ | 193,139,288 | | $ | 213,517,021 | |
| |
|
| |
|
| |
|
| |
|
| |
Accumulated net investment income (loss) | | $ | (35,094 | ) | $ | (539 | ) | $ | 50 | | $ | — | |
| |
|
| |
|
| |
|
| |
|
| |
| | |
39 | HSBC INVESTOR FAMILY OF FUNDS | See notes to financial statements. |
|
HSBC INVESTOR FAMILY OF FUNDS |
|
Statements of Changes in Net Assets (continued) |
All capital share transactions have been processed at a net asset value of $1.00 per share. |
| | | | | | | | | | | | | |
| | Prime
Money Market Fund | | Tax-Free
Money Market Fund | |
|
|
|
|
|
|
| | For the
year ended
October 31, 2009 | | For the
year ended
October 31, 2008 | | For the
year ended
October 31, 2009 | | For the
year ended
October 31, 2008 | |
|
|
|
|
|
|
|
|
|
|
CAPITAL TRANSACTIONS: | | | | | | | | | | | | | |
Class A Shares: | | | | | | | | | | | | | |
Proceeds from shares issued | | $ | 809,840,157 | | $ | 812,447,094 | | $ | 255 | | $ | 828 | |
Dividends reinvested | | | 883,282 | | | 8,967,364 | | | — | | | — | |
Value of shares redeemed | | | (776,080,491 | ) | | (983,783,863 | ) | | — | | | (828 | ) |
| |
|
| |
|
| |
|
| |
|
| |
Class A Shares capital transactions | | | 34,642,948 | | | (162,369,405 | ) | | 255 | | | — | |
| |
|
| |
|
| |
|
| |
|
| |
| | | | | | | | | | | | | |
Class B Shares: | | | | | | | | | | | | | |
Proceeds from shares issued | | | 278,962 | | | 200,130 | | | — | | | — | |
Dividends reinvested | | | 418 | | | 1,251 | | | — | | | — | |
Value of shares redeemed | | | (165,781 | ) | | (206,424 | ) | | — | | | — | |
| |
|
| |
|
| |
|
| |
|
| |
Class B Shares capital transactions | | | 113,599 | | | (5,043 | ) | | — | | | — | |
| |
|
| |
|
| |
|
| |
|
| |
| | | | | | | | | | | | | |
Class C Shares: | | | | | | | | | | | | | |
Proceeds from shares issued | | | 770,195,894 | | | 1,414,798,792 | | | — | | | — | |
Dividends reinvested | | | 518,642 | | | 7,530,526 | | | — | | | — | |
Value of shares redeemed | | | (828,248,859 | ) | | (1,422,597,259 | ) | | — | | | — | |
| |
|
| |
|
| |
|
| |
|
| |
Class C Shares capital transactions | | | (57,534,323 | ) | | (267,941 | ) | | — | | | — | |
| |
|
| |
|
| |
|
| |
|
| |
| | | | | | | | | | | | | |
Class D Shares: | | | | | | | | | | | | | |
Proceeds from shares issued | | | 7,709,199,164 | | | 14,056,339,720 | | | 275,263,759 | | | 197,036,869 | |
Dividends reinvested | | | 7,863,842 | | | 73,917,807 | | | 76,274 | | | 298,710 | |
Value of shares redeemed | | | (8,444,300,576 | ) | | (15,118,065,887 | ) | | (249,776,390 | ) | | (167,733,619 | ) |
| |
|
| |
|
| |
|
| |
|
| |
Class D Shares capital transactions | | | (727,237,570 | ) | | (987,808,360 | ) | | 25,563,643 | | | 29,601,960 | |
| |
|
| |
|
| |
|
| |
|
| |
| | | | | | | | | | | | | |
Class I Shares: | | | | | | | | | | | | | |
Proceeds from shares issued | | | 58,493,552,982 | | | 20,082,620,039 | | | — | | | — | |
Dividends reinvested | | | 20,360,616 | | | 35,720,314 | | | — | | | — | |
Value of shares redeemed | | | (54,280,103,881 | ) | | (19,033,614,412 | ) | | — | | | — | |
| |
|
| |
|
| |
|
| |
|
| |
Class I Shares capital transactions | | | 4,233,809,717 | | | 1,084,725,941 | | | — | | | — | |
| |
|
| |
|
| |
|
| |
|
| |
| | | | | | | | | | | | | |
Class Y Shares: | | | | | | | | | | | | | |
Proceeds from shares issued | | | 5,861,067,626 | | | 7,458,133,919 | | | 306,605,386 | | | 300,761,859 | |
Dividends reinvested | | | 6,952,852 | | | 35,421,479 | | | 395,490 | | | 807,043 | |
Value of shares redeemed | | | (6,910,931,496 | ) | | (6,293,032,288 | ) | | (352,941,841 | ) | | (176,774,314 | ) |
| |
|
| |
|
| |
|
| |
|
| |
Class Y Shares capital transactions | | | (1,042,911,018 | ) | | 1,200,523,110 | | | (45,940,965 | ) | | 124,794,588 | |
| |
|
| |
|
| |
|
| |
|
| |
Change in net assets resulting from capital transactions | | $ | 2,440,883,353 | | $ | 1,134,798,302 | | $ | (20,377,067 | ) | $ | 154,396,548 | |
| |
|
| |
|
| |
|
| |
|
| |
| | |
See notes to financial statements. | HSBC INVESTOR FAMILY OF FUNDS | 40 |
|
HSBC INVESTOR FAMILY OF FUNDS |
|
Statements of Changes in Net Assets (continued) |
All capital share transactions have been processed at a net asset value of $1.00 per share. |
| | | | | | | | | | | | | |
| | U.S. Government
Money Market Fund | | U.S. Treasury
Money Market Fund | |
|
|
|
|
|
|
| | For the
year ended
October 31, 2009 | | For the
year ended
October 31, 2008 | | For the
year ended
October 31, 2009 | | For the
year ended
October 31, 2008 | |
|
|
|
|
|
|
|
|
|
|
Investment Activities: | | | | | | | | | | | | | |
Operations: | | | | | | | | | | | | | |
Net investment income (loss) | | $ | 44,639,755 | | $ | 384,597,544 | | $ | 7,282,425 | | $ | 30,525,495 | |
Net realized gains (losses) from investment transactions | | | 1,358,500 | | | 852,522 | | | 240,063 | | | 56,374 | |
| |
|
| |
|
| |
|
| |
|
| |
Change in net assets resulting from operations | | | 45,998,255 | | | 385,450,066 | | | 7,522,488 | | | 30,581,869 | |
| |
|
| |
|
| |
|
| |
|
| |
| | | | | | | | | | | | | |
Dividends: | | | | | | | | | | | | | |
Net investment income: | | | | | | | | | | | | | |
Class A Shares | | | (875,403 | ) | | (20,761,810 | ) | | (304,735 | ) | | (2,345,769 | ) |
Class B Shares | | | (55 | ) | | (208 | ) | | (84 | ) | | (368 | ) |
Class C Shares | | | (131 | ) | | (4,999 | ) | | (2,223 | ) | | (113 | ) |
Class D Shares | | | (2,261,113 | ) | | (110,537,831 | ) | | (689,245 | ) | | (8,589,362 | ) |
Class I Shares | | | (27,006,162 | ) | | (36,476,266 | ) | | (5,451,587 | ) | | (11,454,843 | ) |
Class Y Shares | | | (14,492,834 | ) | | (217,291,492 | ) | | (829,704 | ) | | (8,162,220 | ) |
Net realized gains: | | | | | | | | | | | | | |
Class A Shares | | | (43,041 | ) | | — | | | (20,098 | ) | | — | |
Class B Shares | | | (6 | ) | | — | | | (7 | ) | | — | |
Class C Shares | | | (13 | ) | | — | | | (173 | ) | | — | |
Class D Shares | | | (70,176 | ) | | — | | | (53,316 | ) | | — | |
Class I Shares | | | (429,417 | ) | | — | | | (166,785 | ) | | — | |
Class Y Shares | | | (307,699 | ) | | — | | | (41,513 | ) | | — | |
| |
|
| |
|
| |
|
| |
|
| |
Change in net assets resulting from shareholder dividends | | | (45,486,050 | ) | | (385,072,606 | ) | | (7,559,470 | ) | | (30,552,675 | ) |
| |
|
| |
|
| |
|
| |
|
| |
|
Change in net assets resulting from capital transactions | | | (909,500,912 | ) | | 4,729,251,775 | | | (987,019,574 | ) | | 6,158,909,368 | |
| |
|
| |
|
| |
|
| |
|
| |
Change in net assets | | | (908,988,707 | ) | | 4,729,629,235 | | | (987,056,556 | ) | | 6,158,938,562 | |
| | | | | | | | | | | | | |
Net Assets: | | | | | | | | | | | | | |
Beginning of period | | | 13,798,709,649 | | | 9,069,080,414 | | | 6,655,170,611 | | | 496,232,049 | |
| |
|
| |
|
| |
|
| |
|
| |
End of period | | $ | 12,889,720,942 | | $ | 13,798,709,649 | | $ | 5,668,114,055 | | $ | 6,655,170,611 | |
| |
|
| |
|
| |
|
| |
|
| |
Accumulated net investment income (loss) | | $ | 4,056 | | $ | (1 | ) | $ | 4,245 | | $ | (602 | ) |
| |
|
| |
|
| |
|
| |
|
| |
| | |
41 | HSBC INVESTOR FAMILY OF FUNDS | See notes to financial statements. |
|
HSBC INVESTOR FAMILY OF FUNDS |
|
Statements of Changes in Net Assets (continued) |
All capital share transactions have been processed at a net asset value of $1.00 per share. |
| | | | | | | | | | | | | |
| | U.S. Government
Money Market Fund | | U.S. Treasury
Money Market Fund | |
|
|
|
|
|
|
| | For the
year ended
October 31, 2009 | | For the
year ended
October 31, 2008 | | For the
year ended
October 31, 2009 | | For the
year ended
October 31, 2008 | |
|
|
|
|
|
|
|
|
|
|
CAPITAL TRANSACTIONS: | | | | | | | | | | | | | |
Class A Shares: | | | | | | | | | | | | | |
Proceeds from shares issued | | $ | 2,080,944,837 | | $ | 2,218,184,757 | | $ | 1,023,071,534 | | $ | 1,146,228,416 | |
Dividends reinvested | | | 913,749 | | | 20,748,773 | | | 322,146 | | | 2,345,451 | |
Value of shares redeemed | | | (2,211,025,475 | ) | | (2,626,012,754 | ) | | (1,217,854,944 | ) | | (652,469,814 | ) |
| |
|
| |
|
| |
|
| |
|
| |
Class A Shares capital transactions | | | (129,166,889 | ) | | (387,079,224 | ) | | (194,461,264 | ) | | 496,104,053 | |
| |
|
| |
|
| |
|
| |
|
| |
Class B Shares: | | | | | | | | | | | | | |
Proceeds from shares issued | | | 38,074 | | | 53,672 | | | 53,702 | | | 156,651 | |
Dividends reinvested | | | 61 | | | 208 | | | 90 | | | 368 | |
Value of shares redeemed | | | (8,130 | ) | | (635 | ) | | (125,494 | ) | | (66,940 | ) |
| |
|
| |
|
| |
|
| |
|
| |
Class B Shares capital transactions | | | 30,005 | | | 53,245 | | | (71,702 | ) | | 90,079 | |
| |
|
| |
|
| |
|
| |
|
| |
Class C Shares: | | | | | | | | | | | | | |
Proceeds from shares issued | | | 5,857,186 | | | 10,271,297 | | | 17,236,521 | | | 1,308,712 | |
Dividends reinvested | | | 144 | | | 4,310 | | | 2,396 | | | 113 | |
Value of shares redeemed | | | (5,728,598 | ) | | (10,602,789 | ) | | (11,203,400 | ) | | (205,984 | ) |
| |
|
| |
|
| |
|
| |
|
| |
Class C Shares capital transactions | | | 128,732 | | | (327,182 | ) | | 6,035,517 | | | 1,102,841 | |
| |
|
| |
|
| |
|
| |
|
| |
Class D Shares: | | | | | | | | | | | | | |
Proceeds from shares issued | | | 4,052,413,546 | | | 21,742,131,804 | | | 2,696,084,524 | | | 3,861,433,949 | |
Dividends reinvested | | | 837,509 | | | 12,459,719 | | | 450,754 | | | 5,493,923 | |
Value of shares redeemed | | | (4,724,014,727 | ) | | (21,077,754,961 | ) | | (2,678,774,334 | ) | | (3,226,179,507 | ) |
| |
|
| |
|
| |
|
| |
|
| |
Class D Shares capital transactions | | | (670,763,672 | ) | | 676,836,562 | | | 17,760,944 | | | 640,748,365 | |
| |
|
| |
|
| |
|
| |
|
| |
Class I Shares: | | | | | | | | | | | | | |
Proceeds from shares issued | | | 41,618,275,191 | | | 15,079,578,869 | | | 14,180,222,732 | | | 6,937,308,780 | |
Dividends reinvested | | | 20,612,947 | | | 31,259,496 | | | 3,671,466 | | | 10,722,081 | |
Value of shares redeemed | | | (38,370,813,811 | ) | | (11,151,199,818 | ) | | (14,632,179,986 | ) | | (3,250,211,911 | ) |
| |
|
| |
|
| |
|
| |
|
| |
Class I Shares capital transactions | | | 3,268,074,327 | | | 3,959,638,547 | | | (448,285,788 | ) | | 3,697,818,950 | |
| |
|
| |
|
| |
|
| |
|
| |
Class Y Shares: | | | | | | | | | | | | | |
Proceeds from shares issued | | | 29,490,401,988 | | | 37,523,017,690 | | | 4,032,151,030 | | | 4,734,361,422 | |
Dividends reinvested | | | 14,679,200 | | | 216,736,458 | | | 813,514 | | | 7,992,936 | |
Value of shares redeemed | | | (32,882,884,603 | ) | | (37,259,624,321 | ) | | (4,400,961,825 | ) | | (3,419,309,278 | ) |
| |
|
| |
|
| |
|
| |
|
| |
Class Y Shares capital transactions | | | (3,377,803,415 | ) | | 480,129,827 | | | (367,997,281 | ) | | 1,323,045,080 | |
| |
|
| |
|
| |
|
| |
|
| |
Change in net assets resulting from capital transactions | | $ | (909,500,912 | ) | $ | 4,729,251,775 | | $ | (987,019,574 | ) | $ | 6,158,909,368 | |
| |
|
| |
|
| |
|
| |
|
| |
| | |
See notes to financial statements. | HSBC INVESTOR FAMILY OF FUNDS | 42 |
|
HSBC INVESTOR CALIFORNIA TAX-FREE MONEY MARKET FUND |
|
Selected data for a share outstanding throughout the periods indicated.
| | | | | | | | | | | | | | | | | | | | | | | | | | |
| | | | | Investment Activities | | Dividends | | | | |
| | | | |
| |
| | | | |
| | Net Asset
Value,
Beginning
of Period | | Net
Investment
Income | | Net Realized
Gains
(Losses) from
Investment
Transactions | | Total from
Investment
Activities | | Net
Investment
Income | | Total
Dividends | | Net Asset
Value, End
of Period | |
|
|
|
|
|
|
|
|
|
|
|
|
|
|
|
|
CLASS A SHARES | | | | | | | | | | | | | | | | | | | | | | | | | | |
Period Ended October 31, 2007(d) | | | $ | 1.00 | | | — | * | | — | | | — | * | | — | * | | — | * | | | $ | 1.00 | | |
Year Ended October 31, 2008(i) | | | | 1.00 | | | 0.01 | | | — | | | 0.01 | | | (0.01 | ) | | (0.01 | ) | | | | 1.00 | | |
Year Ended October 31, 2009 | | | | 1.00 | | | — | * | | — | * | | — | * | | — | * | | — | * | | | | 1.00 | | |
|
|
|
|
|
|
|
|
|
|
|
|
|
|
|
|
|
|
|
|
|
|
|
|
|
|
|
CLASS C SHARES | | | | | | | | | | | | | | | | | | | | | | | | | | |
Period Ended October 31, 2007(e) | | | $ | 1.00 | | | 0.01 | | | — | | | 0.01 | | | (0.01 | ) | | (0.01 | ) | | | $ | 1.00 | | |
Year Ended October 31, 2008(f) | | | | 1.00 | | | 0.01 | | | — | | | 0.01 | | | (0.01 | ) | | (0.01 | ) | | | | 1.00 | | |
Year Ended October 31, 2009(j) | | | | 1.00 | | | — | * | | — | * | | — | * | | — | * | | — | * | | | | 1.00 | | |
|
|
|
|
|
|
|
|
|
|
|
|
|
|
|
|
|
|
|
|
|
|
|
|
|
|
|
CLASS D SHARES | | | | | | | | | | | | | | | | | | | | | | | | | | |
Year Ended October 31, 2005 | | | $ | 1.00 | | | 0.02 | | | — | | | 0.02 | | | (0.02 | ) | | (0.02 | ) | | | $ | 1.00 | | |
Year Ended October 31, 2006 | | | | 1.00 | | | 0.03 | | | — | | | 0.03 | | | (0.03 | ) | | (0.03 | ) | | | | 1.00 | | |
Year Ended October 31, 2007 | | | | 1.00 | | | 0.03 | | | — | | | 0.03 | | | (0.03 | ) | | (0.03 | ) | | | | 1.00 | | |
Year Ended October 31, 2008 | | | | 1.00 | | | 0.02 | | | — | | | 0.02 | | | (0.02 | ) | | (0.02 | ) | | | | 1.00 | | |
Year Ended October 31, 2009 | | | | 1.00 | | | — | * | | — | * | | — | * | | — | * | | — | * | | | | 1.00 | | |
|
|
|
|
|
|
|
|
|
|
|
|
|
|
|
|
|
|
|
|
|
|
|
|
|
|
|
CLASS Y SHARES | | | | | | | | | | | | | | | | | | | | | | | | | | |
Year Ended October 31, 2005 | | | $ | 1.00 | | | 0.02 | | | — | | | 0.02 | | | (0.02 | ) | | (0.02 | ) | | | $ | 1.00 | | |
Year Ended October 31, 2006 | | | | 1.00 | | | 0.03 | | | — | | | 0.03 | | | (0.03 | ) | | (0.03 | ) | | | | 1.00 | | |
Year Ended October 31, 2007 | | | | 1.00 | | | 0.03 | | | — | | | 0.03 | | | (0.03 | ) | | (0.03 | ) | | | | 1.00 | | |
Year Ended October 31, 2008 | | | | 1.00 | | | 0.02 | | | — | | | 0.02 | | | (0.02 | ) | | (0.02 | ) | | | | 1.00 | | |
Year Ended October 31, 2009 | | | | 1.00 | | | — | * | | — | * | | — | * | | — | * | | — | * | | | | 1.00 | | |
|
|
|
|
|
|
|
|
|
|
|
|
|
|
|
|
|
|
|
|
|
|
|
|
|
|
|
| | | | | | | | | | | | | | | | | | |
| | | | | Ratios/Supplementary Data | |
| | | | |
| |
| | Total
Return(a) | | Net Assets
at End of
Period
(000’s) | | Ratio of Net
Expenses to
Average Net
Assets(b) | | Ratio of Net
Investment
Income to
Average
Net Assets(b) | | Ratio of
Expenses to
Average Net
Assets(b)(c) | |
|
|
|
|
|
|
|
|
|
|
|
|
|
|
|
|
|
CLASS A SHARES | | | | | | | | | | | | | | | | | | |
Period Ended October 31, 2007(d) | | 0.00 | % | | | $ | — | | | 0.72 | % | | 2.71 | % | | 0.87 | % | |
Year Ended October 31, 2008(i) | | 1.48 | % | | | | 442 | | | 0.67 | % | | 1.49 | % | | 0.82 | % | |
Year Ended October 31, 2009 | | 0.08 | %(k) | | | | 221 | | | 0.47 | %(k) | | 0.08 | %(k) | | 0.88 | %(k) | |
|
|
|
|
|
|
|
|
|
|
|
|
|
|
|
|
|
|
|
CLASS C SHARES | | | | | | | | | | | | | | | | | | |
Period Ended October 31, 2007(e) | | 1.08 | % | | | $ | 1,018 | | | 1.22 | % | | 2.41 | % | | 1.37 | % | |
Year Ended October 31, 2008(f) | | 0.65 | % | | | | — | | | 1.21 | % | | 1.62 | % | | 1.36 | % | |
Year Ended October 31, 2009(j) | | 0.02 | %(k) | | | | — | | | 0.90 | %(k) | | 0.08 | %(k) | | 1.05 | %(k) | |
|
|
|
|
|
|
|
|
|
|
|
|
|
|
|
|
|
|
|
CLASS D SHARES | | | | | | | | | | | | | | | | | | |
Year Ended October 31, 2005 | | 1.64 | %(g) | | | $ | 132,649 | | | 0.50 | %(g) | | 1.64 | %(g) | | 0.65 | % | |
Year Ended October 31, 2006 | | 2.73 | % | | | | 86,686 | | | 0.57 | % | | 2.66 | % | | 0.72 | % | |
Year Ended October 31, 2007 | | 3.09 | %(h) | | | | 90,843 | | | 0.50 | %(h) | | 3.08 | %(h) | | 0.66 | % | |
Year Ended October 31, 2008 | | 1.90 | % | | | | 83,261 | | | 0.47 | % | | 1.76 | % | | 0.62 | % | |
Year Ended October 31, 2009 | | 0.10 | %(k) | | | | 115,160 | | | 0.42 | %(k) | | 0.10 | %(k) | | 0.70 | %(k) | |
|
|
|
|
|
|
|
|
|
|
|
|
|
|
|
|
|
|
|
CLASS Y SHARES | | | | | | | | | | | | | | | | | | |
Year Ended October 31, 2005 | | 1.89 | %(g) | | | $ | 43,722 | | | 0.25 | %(g) | | 2.04 | %(g) | | 0.40 | % | |
Year Ended October 31, 2006 | | 2.98 | % | | | | 43,114 | | | 0.31 | % | | 2.95 | % | | 0.46 | % | |
Year Ended October 31, 2007 | | 3.35 | %(h) | | | | 32,205 | | | 0.24 | %(h) | | 3.32 | %(h) | | 0.40 | % | |
Year Ended October 31, 2008 | | 2.16 | % | | | | 26,163 | | | 0.20 | % | | 2.03 | % | | 0.35 | % | |
Year Ended October 31, 2009 | | 0.22 | %(k) | | | | 21,087 | | | 0.31 | %(k) | | 0.25 | %(k) | | 0.46 | %(k) | |
|
|
|
|
|
|
|
|
|
|
|
|
|
|
|
|
|
|
|
| |
* | Less than $0.005 per share. |
| |
(a) | Not annualized for periods less than one year. Total returns do not include redemption charges. |
| |
(b) | Annualized for periods less than one year. |
| |
(c) | During the period, certain fees were reduced. If such fee reductions had not occurred, the ratio would have been as indicated. |
| |
(d) | Class A Shares commenced operations on March 2, 2007 and were operational during a portion of the period only. Amounts reflect performance for the period of time the class had operations, which was 3 days during the period. The net asset value, end of period, presented is as of the last day the class had shareholders during the period. |
| |
(e) | Class C Shares commenced operations on May 7, 2007. |
| |
(f) | Class C Shares were operational during a portion of the year only. Amounts reflect performance for the period of time the class had operations, which was 152 days during the period. The net asset value, end of period, presented is as of the last day during the period the class had shareholders. |
| |
(g) | During the year ended October 31, 2005, HSBC reimbursed certain amounts to the Fund related to violation of certain investment policies and limitations. There was no rounded impact to the net expense ratio, net income ratio or total return for Class D Shares and Class Y Shares. |
| |
(h) | During the year ended October 31, 2007, HSBC reimbursed amounts to certain Funds related to past marketing arrangements. The corresponding impact to the net expense ratio, net income ratio and the total return were 0.02% and 0.01% for Class D Shares and Class Y Shares, respectively. |
| |
(i) | Class A Shares were operational during a portion of the year only. Amounts reflect performance for the period of time the class had operations, which was 332 days during the period. The net asset value, end of period, presented is as of the last day during the period the class had shareholders. |
| |
(j) | Class C Shares were operational during a portion of the year only. Amounts reflect performance for the period of time the class had operations, which was 28 days during the period. The net asset value, end of period, presented is as of the last day during the period the class had shareholders. |
| |
(k) | Included in the expense ratios is the Treasury Guarantee Program fees incurred by the Fund during the period. Without these fees, the gross and net expense ratios would have decreased by 0.05% and the total return and net investment income ratio would have increased by 0.05%. |
| | |
43 | HSBC INVESTOR FAMILY OF FUNDS | See notes to financial statements. |
|
HSBC INVESTOR NEW YORK TAX-FREE MONEY MARKET FUND |
|
Financial Highlights
Selected data for a share outstanding throughout the periods indicated.
| | | | | | | | | | | | | | | | | | | | | | | | | | | | |
| | | | | Investment Activities | | Dividends | | | | |
| | | | |
| |
| | | | |
| | Net Asset
Value,
Beginning
of Period | | Net
Investment
Income | | Net Realized
Gains
(Losses) from
Investment
Transactions | | Total from
Investment
Activities | | Net
Investment
Income | | Net Realized
Gains(Losses)
from
Investments | | Total
Dividends | | Net Asset
Value, End
of Period | |
|
|
|
|
|
|
|
|
|
|
|
|
|
|
|
|
|
|
CLASS A SHARES | | | | | | | | | | | | | | | | | | | | | | | | | | | | |
Year Ended October 31, 2005 | | | $ | 1.00 | | | 0.01 | | | — | | 0.01 | | | (0.01 | ) | | — | | | (0.01 | ) | | | $ | 1.00 | | |
Year Ended October 31, 2006 | | | | 1.00 | | | 0.03 | | | — | | 0.03 | | | (0.03 | ) | | — | | | (0.03 | ) | | | | 1.00 | | |
Year Ended October 31, 2007 | | | | 1.00 | | | 0.03 | | | — | | 0.03 | | | (0.03 | ) | | — | | | (0.03 | ) | | | | 1.00 | | |
Year Ended October 31, 2008 | | | | 1.00 | | | 0.02 | | | — | | 0.02 | | | (0.02 | ) | | — | | | (0.02 | ) | | | | 1.00 | | |
Year Ended October 31, 2009 | | | | 1.00 | | | — | * | | — | | — | * | | — | * | | — | * | | — | * | | | | 1.00 | | |
|
|
|
|
|
|
|
|
|
|
|
|
|
|
|
|
|
|
|
|
|
|
|
|
|
|
|
|
|
CLASS B SHARES | | | | | | | | | | | | | | | | | | | | | | | | | | | | |
Year Ended October 31, 2005 | | | $ | 1.00 | | | 0.01 | | | — | | 0.01 | | | (0.01 | ) | | — | | | (0.01 | ) | | | $ | 1.00 | | |
Year Ended October 31, 2006 | | | | 1.00 | | | 0.02 | | | — | | 0.02 | | | (0.02 | ) | | — | | | (0.02 | ) | | | | 1.00 | | |
Year Ended October 31, 2007 | | | | 1.00 | | | 0.02 | | | — | | 0.02 | | | (0.02 | ) | | — | | | (0.02 | ) | | | | 1.00 | | |
Year Ended October 31, 2008 | | | | 1.00 | | | 0.01 | | | — | | 0.01 | | | (0.01 | ) | | — | | | (0.01 | ) | | | | 1.00 | | |
Year Ended October 31, 2009 | | | | 1.00 | | | — | * | | — | | — | * | | — | * | | — | * | | — | * | | | | 1.00 | | |
|
|
|
|
|
|
|
|
|
|
|
|
|
|
|
|
|
|
|
|
|
|
|
|
|
|
|
|
|
CLASS C SHARES | | | | | | | | | | | | | | | | | | | | | | | | | | | | |
Year Ended October 31, 2005(e) | | | $ | 1.00 | | | — | | | — | | — | | | — | | | — | | | — | | | | $ | 1.00 | | |
Year Ended October 31, 2006(e) | | | | 1.00 | | | — | | | — | | — | | | — | | | — | | | — | | | | | 1.00 | | |
Year Ended October 31, 2007(e) | | | | 1.00 | | | — | | | — | | — | | | — | | | — | | | — | | | | | 1.00 | | |
Year Ended October 31, 2008(e) | | | | 1.00 | | | — | | | — | | — | | | — | | | — | | | — | | | | | 1.00 | | |
Year Ended October 31, 2009(e) | | | | 1.00 | | | — | | | — | | — | | | — | | | — | | | — | | | | | 1.00 | | |
|
|
|
|
|
|
|
|
|
|
|
|
|
|
|
|
|
|
|
|
|
|
|
|
|
|
|
|
|
CLASS D SHARES | | | | | | | | | | | | | | | | | | | | | | | | | | | | |
Year Ended October 31, 2005 | | | $ | 1.00 | | | 0.02 | | | — | | 0.02 | | | (0.02 | ) | | — | | | (0.02 | ) | | | $ | 1.00 | | |
Year Ended October 31, 2006 | | | | 1.00 | | | 0.03 | | | — | | 0.03 | | | (0.03 | ) | | — | | | (0.03 | ) | | | | 1.00 | | |
Year Ended October 31, 2007 | | | | 1.00 | | | 0.03 | | | — | | 0.03 | | | (0.03 | ) | | — | | | (0.03 | ) | | | | 1.00 | | |
Year Ended October 31, 2008 | | | | 1.00 | | | 0.02 | | | — | | 0.02 | | | (0.02 | ) | | — | | | (0.02 | ) | | | | 1.00 | | |
Year Ended October 31, 2009 | | | | 1.00 | | | — | * | | — | | — | * | | — | * | | — | * | | — | * | | | | 1.00 | | |
|
|
|
|
|
|
|
|
|
|
|
|
|
|
|
|
|
|
|
|
|
|
|
|
|
|
|
|
|
CLASS Y SHARES | | | | | | | | | | | | | | | | | | | | | | | | | | | | |
Year Ended October 31, 2005 | | | $ | 1.00 | | | 0.02 | | | — | | 0.02 | | | (0.02 | ) | | — | | | (0.02 | ) | | | $ | 1.00 | | |
Year Ended October 31, 2006 | | | | 1.00 | | | 0.03 | | | — | | 0.03 | | | (0.03 | ) | | — | | | (0.03 | ) | | | | 1.00 | | |
Year Ended October 31, 2007 | | | | 1.00 | | | 0.03 | | | — | | 0.03 | | | (0.03 | ) | | — | | | (0.03 | ) | | | | 1.00 | | |
Year Ended October 31, 2008 | | | | 1.00 | | | 0.02 | | | — | | 0.02 | | | (0.02 | ) | | — | | | (0.02 | ) | | | | 1.00 | | |
Year Ended October 31, 2009 | | | | 1.00 | | | — | * | | — | | — | * | | — | * | | — | * | | — | * | | | | 1.00 | | |
|
|
|
|
|
|
|
|
|
|
|
|
|
|
|
|
|
|
|
|
|
|
|
|
|
|
|
|
|
| | | | | | | | | | | | | | | | | | |
| | | | | Ratios/Supplementary Data | |
| | | | |
| |
| | Total
Return(a) | | Net Assets
at End of
Period
(000’s) | | Ratio of Net
Expenses to
Average Net
Assets | | Ratio of Net
Investment
Income to
Average
Net Assets | | Ratio of
Expenses to
Average Net
Assets(b) | |
|
|
|
|
|
|
|
|
|
|
|
|
|
|
|
|
|
CLASS A SHARES | | | | | | | | | | | | | | | | | | |
Year Ended October 31, 2005 | | 1.46 | %(c) | | | $ | 128,218 | | | 0.70 | %(c) | | 1.38 | %(c) | | 0.71 | % | |
Year Ended October 31, 2006 | | 2.63 | % | | | | 153,523 | | | 0.70 | % | | 2.61 | % | | 0.70 | % | |
Year Ended October 31, 2007 | | 3.00 | %(d) | | | | 120,841 | | | 0.65 | %(d) | | 2.98 | %(d) | | 0.67 | % | |
Year Ended October 31, 2008 | | 1.94 | % | | | | 45,791 | | | 0.63 | % | | 2.09 | % | | 0.63 | % | |
Year Ended October 31, 2009 | | 0.18 | %(f) | | | | 40,698 | | | 0.49 | %(f) | | 0.21 | %(f) | | 0.67 | %(f) | |
|
|
|
|
|
|
|
|
|
|
|
|
|
|
|
|
|
|
|
CLASS B SHARES | | | | | | | | | | | | | | | | | | |
Year Ended October 31, 2005 | | 0.85 | %(c) | | | $ | 228 | | | 1.29 | %(c) | | 0.77 | %(c) | | 1.31 | % | |
Year Ended October 31, 2006 | | 2.01 | % | | | | 55 | | | 1.30 | % | | 1.88 | % | | 1.30 | % | |
Year Ended October 31, 2007 | | 2.39 | %(d) | | | | 34 | | | 1.25 | %(d) | | 2.38 | %(d) | | 1.27 | % | |
Year Ended October 31, 2008 | | 1.33 | % | | | | 35 | | | 1.23 | % | | 1.30 | % | | 1.23 | % | |
Year Ended October 31, 2009 | | 0.08 | %(f) | | | | 21 | | | 0.65 | %(f) | | 0.08 | %(f) | | 1.27 | %(f) | |
|
|
|
|
|
|
|
|
|
|
|
|
|
|
|
|
|
|
|
CLASS C SHARES | | | | | | | | | | | | | | | | | | |
Year Ended October 31, 2005(e) | | — | % | | | | | ** | | — | % | | — | % | | — | % | |
Year Ended October 31, 2006(e) | | — | % | | | | | ** | | — | % | | — | % | | — | % | |
Year Ended October 31, 2007(e) | | — | % | | | | | ** | | — | % | | — | % | | — | % | |
Year Ended October 31, 2008(e) | | — | % | | | | | ** | | — | % | | — | % | | — | % | |
Year Ended October 31, 2009(e) | | — | % | | | | — | | | — | % | | — | % | | — | % | |
|
|
|
|
|
|
|
|
|
|
|
|
|
|
|
|
|
|
|
CLASS D SHARES | | | | | | | | | | | | | | | | | | |
Year Ended October 31, 2005 | | 1.61 | %(c) | | | $ | 189,538 | | | 0.55 | %(c) | | 1.61 | %(c) | | 0.56 | % | |
Year Ended October 31, 2006 | | 2.78 | % | | | | 352,630 | | | 0.55 | % | | 2.78 | % | | 0.55 | % | |
Year Ended October 31, 2007 | | 3.16 | %(d) | | | | 531,864 | | | 0.50 | %(d) | | 3.14 | %(d) | | 0.52 | % | |
Year Ended October 31, 2008 | | 2.09 | % | | | | 586,791 | | | 0.48 | % | | 1.99 | % | | 0.48 | % | |
Year Ended October 31, 2009 | | 0.25 | %(f) | | | | 423,061 | | | 0.43 | %(f) | | 0.26 | %(f) | | 0.52 | %(f) | |
|
|
|
|
|
|
|
|
|
|
|
|
|
|
|
|
|
|
|
CLASS Y SHARES | | | | | | | | | | | | | | | | | | |
Year Ended October 31, 2005 | | 1.86 | %(c) | | | $ | 280,683 | | | 0.30 | %(c) | | 1.89 | %(c) | | 0.31 | % | |
Year Ended October 31, 2006 | | 3.04 | % | | | | 263,187 | | | 0.30 | % | | 2.99 | % | | 0.30 | % | |
Year Ended October 31, 2007 | | 3.42 | %(d) | | | | 339,665 | | | 0.25 | %(d) | | 3.39 | %(d) | | 0.27 | % | |
Year Ended October 31, 2008 | | 2.35 | % | | | | 319,797 | | | 0.23 | % | | 2.27 | % | | 0.23 | % | |
Year Ended October 31, 2009 | | 0.40 | %(f) | | | | 210,706 | | | 0.26 | %(f) | | 0.39 | %(f) | | 0.27 | %(f) | |
|
|
|
|
|
|
|
|
|
|
|
|
|
|
|
|
|
|
|
| |
* | Less than $0.005 per share. |
| |
** | Less than $500. |
| |
(a) | Total returns do not include redemption charges. |
| |
(b) | During the period, certain fees were reduced. If such fee reductions had not occurred, the ratio would have been as indicated. |
| |
(c) | During the year ended October 31, 2005, HSBC reimbursed certain amounts to the Fund related to violation of certain investment policies and limitations. The corresponding impact to the net expense ratio, net income ratio and total return were 0.01%, 0.01%, 0.01% and 0.01% for Class A Shares, Class B Shares, Class D Shares and Class Y Shares, respectively. |
| |
(d) | During the year ended October 31, 2007, HSBC reimbursed amounts to certain Funds related to past marketing arrangements. The corresponding impact to the net expense ratio, net income ratio and the total return were 0.02%, 0.02%, 0.02%, and 0.02% for Class A Shares, Class B Shares, Class D Shares, and Class Y Shares, respectively. |
| |
(e) | During the year ended, Class C Shares had no operations. Net assets at the end of the period represent seed money. The net asset values reflected represent the last day the class had shareholders. |
| |
(f) | Included in the expense ratios is the Treasury Guarantee Program fees incurred by the Fund during the period. Without these fees, the gross and net expense ratios would have decreased by 0.04% and the total return and net investment income ratio would have increased by 0.04%. |
| | |
See notes to financial statements. | HSBC INVESTOR FAMILY OF FUNDS | 44 |
|
HSBC INVESTOR PRIME MONEY MARKET FUND |
|
Financial Highlights
Selected data for a share outstanding throughout the periods indicated.
| | | | | | | | | | | | | | | | | | | | | | | | | | |
| | | | | Investment Activities | | Dividends | | | | |
| | | | |
| |
| | | | |
| | Net Asset
Value,
Beginning
of Period | | Net
Investment
Income | | Net Realized
Gains
(Losses) from
Investment
Transactions | | Total from
Investment
Activities | | Net
Investment
Income | | Total
Dividends | | Net Asset
Value, End
of Period | |
|
|
|
|
|
|
|
|
|
|
|
|
|
|
|
|
CLASS A SHARES | | | | | | | | | | | | | | | | | | | | | | | | | | |
Year Ended October 31, 2005 | | | $ | 1.00 | | | 0.02 | | | — | * | | 0.02 | | | (0.02 | ) | | (0.02 | ) | | | $ | 1.00 | | |
Year Ended October 31, 2006 | | | | 1.00 | | | 0.04 | | | — | * | | 0.04 | | | (0.04 | ) | | (0.04 | ) | | | | 1.00 | | |
Year Ended October 31, 2007 | | | | 1.00 | | | 0.05 | | | — | * | | 0.05 | | | (0.05 | ) | | (0.05 | ) | | | | 1.00 | | |
Year Ended October 31, 2008 | | | | 1.00 | | | 0.03 | | | — | * | | 0.03 | | | (0.03 | ) | | (0.03 | ) | | | | 1.00 | | |
Year Ended October 31, 2009 | | | | 1.00 | | | — | * | | — | * | | — | * | | — | * | | — | * | | | | 1.00 | | |
|
|
|
|
|
|
|
|
|
|
|
|
|
|
|
|
|
|
|
|
|
|
|
|
|
|
|
CLASS B SHARES | | | | | | | | | | | | | | | | | | | | | | | | | | |
Year Ended October 31, 2005 | | | $ | 1.00 | | | 0.02 | | | — | * | | 0.02 | | | (0.02 | ) | | (0.02 | ) | | | $ | 1.00 | | |
Year Ended October 31, 2006 | | | | 1.00 | | | 0.04 | | | — | * | | 0.04 | | | (0.04 | ) | | (0.04 | ) | | | | 1.00 | | |
Year Ended October 31, 2007 | | | | 1.00 | | | 0.04 | | | — | * | | 0.04 | | | (0.04 | ) | | (0.04 | ) | | | | 1.00 | | |
Year Ended October 31, 2008 | | | | 1.00 | | | 0.02 | | | — | * | | 0.02 | | | (0.02 | ) | | (0.02 | ) | | | | 1.00 | | |
Year Ended October 31, 2009 | | | | 1.00 | | | — | * | | — | * | | — | * | | — | * | | — | * | | | | 1.00 | | |
|
|
|
|
|
|
|
|
|
|
|
|
|
|
|
|
|
|
|
|
|
|
|
|
|
|
|
CLASS C SHARES | | | | | | | | | | | | | | | | | | | | | | | | | | |
Year Ended October 31, 2005 | | | $ | 1.00 | | | 0.02 | | | — | * | | 0.02 | | | (0.02 | ) | | (0.02 | ) | | | $ | 1.00 | | |
Year Ended October 31, 2006 | | | | 1.00 | | | 0.04 | | | — | * | | 0.04 | | | (0.04 | ) | | (0.04 | ) | | | | 1.00 | | |
Year Ended October 31, 2007 | | | | 1.00 | | | 0.04 | | | — | * | | 0.04 | | | (0.04 | ) | | (0.04 | ) | | | | 1.00 | | |
Year Ended October 31, 2008 | | | | 1.00 | | | 0.02 | | | — | * | | 0.02 | | | (0.02 | ) | | (0.02 | ) | | | | 1.00 | | |
Year Ended October 31, 2009 | | | | 1.00 | | | — | * | | — | * | | — | * | | — | * | | — | * | | | | 1.00 | | |
|
|
|
|
|
|
|
|
|
|
|
|
|
|
|
|
|
|
|
|
|
|
|
|
|
|
|
CLASS D SHARES | | | | | | | | | | | | | | | | | | | | | | | | | | |
Year Ended October 31, 2005 | | | $ | 1.00 | | | 0.02 | | | — | * | | 0.02 | | | (0.02 | ) | | (0.02 | ) | | | $ | 1.00 | | |
Year Ended October 31, 2006 | | | | 1.00 | | | 0.04 | | | — | * | | 0.04 | | | (0.04 | ) | | (0.04 | ) | | | | 1.00 | | |
Year Ended October 31, 2007 | | | | 1.00 | | | 0.05 | | | — | * | | 0.05 | | | (0.05 | ) | | (0.05 | ) | | | | 1.00 | | |
Year Ended October 31, 2008 | | | | 1.00 | | | 0.03 | | | — | * | | 0.03 | | | (0.03 | ) | | (0.03 | ) | | | | 1.00 | | |
Year Ended October 31, 2009 | | | | 1.00 | | | — | * | | — | * | | — | * | | — | * | | — | * | | | | 1.00 | | |
|
|
|
|
|
|
|
|
|
|
|
|
|
|
|
|
|
|
|
|
|
|
|
|
|
|
|
CLASS I SHARES | | | | | | | | | | | | | | | | | | | | | | | | | | |
Year Ended October 31, 2005 | | | $ | 1.00 | | | 0.03 | | | — | * | | 0.03 | | | (0.03 | ) | | (0.03 | ) | | | $ | 1.00 | | |
Year Ended October 31, 2006 | | | | 1.00 | | | 0.05 | | | — | * | | 0.05 | | | (0.05 | ) | | (0.05 | ) | | | | 1.00 | | |
Year Ended October 31, 2007 | | | | 1.00 | | | 0.05 | | | — | * | | 0.05 | | | (0.05 | ) | | (0.05 | ) | | | | 1.00 | | |
Year Ended October 31, 2008 | | | | 1.00 | | | 0.03 | | | — | * | | 0.03 | | | (0.03 | ) | | (0.03 | ) | | | | 1.00 | | |
Year Ended October 31, 2009 | | | | 1.00 | | | 0.01 | | | — | * | | 0.01 | | | (0.01 | ) | | (0.01 | ) | | | | 1.00 | | |
|
|
|
|
|
|
|
|
|
|
|
|
|
|
|
|
|
|
|
|
|
|
|
|
|
|
|
CLASS Y SHARES | | | | | | | | | | | | | | | | | | | | | | | | | | |
Year Ended October 31, 2005 | | | $ | 1.00 | | | 0.03 | | | — | * | | 0.03 | | | (0.03 | ) | | (0.03 | ) | | | $ | 1.00 | | |
Year Ended October 31, 2006 | | | | 1.00 | | | 0.05 | | | — | * | | 0.05 | | | (0.05 | ) | | (0.05 | ) | | | | 1.00 | | |
Year Ended October 31, 2007 | | | | 1.00 | | | 0.05 | | | — | * | | 0.05 | | | (0.05 | ) | | (0.05 | ) | | | | 1.00 | | |
Year Ended October 31, 2008 | | | | 1.00 | | | 0.03 | | | — | * | | 0.03 | | | (0.03 | ) | | (0.03 | ) | | | | 1.00 | | |
Year Ended October 31, 2009 | | | | 1.00 | | | 0.01 | | | — | * | | 0.01 | | | (0.01 | ) | | (0.01 | ) | | | | 1.00 | | |
|
|
|
|
|
|
|
|
|
|
|
|
|
|
|
|
|
|
|
|
|
|
|
|
|
|
|
| | | | | | | | | | | | | | | | | | |
| | | | | Ratios/Supplementary Data | |
| | | | |
|
|
| | Total
Return(a) | | Net Assets
at End of
Period
(000’s) | | Ratio of Net
Expenses to
Average Net
Assets | | Ratio of Net
Investment
Income to
Average
Net Assets | | Ratio of
Expenses to
Average Net
Assets(b) | |
|
|
|
|
|
|
|
|
|
|
|
|
CLASS A SHARES | | | | | | | | | | | | | | | | | | |
Year Ended October 31, 2005 | | 2.17 | % | | | $ | 243,772 | | | 0.73 | % | | 2.10 | % | | 0.73 | % | |
Year Ended October 31, 2006 | | 4.24 | % | | | | 415,514 | | | 0.72 | % | | 4.20 | % | | 0.73 | % | |
Year Ended October 31, 2007 | | 4.77 | %(c) | | | | 471,148 | | | 0.67 | %(c) | | 4.68 | %(c) | | 0.70 | % | |
Year Ended October 31, 2008 | | 2.71 | %(d) | | | | 308,499 | | | 0.67 | % | | 2.73 | % | | 0.67 | % | |
Year Ended October 31, 2009 | | 0.32 | %(e) | | | | 343,265 | | | 0.55 | %(e) | | 0.31 | %(e) | | 0.69 | %(e) | |
|
|
|
|
|
|
|
|
|
|
|
|
|
|
|
|
|
|
|
CLASS B SHARES | | | | | | | | | | | | | | | | | | |
Year Ended October 31, 2005 | | 1.56 | % | | | $ | 88 | | | 1.33 | % | | 1.40 | % | | 1.33 | % | |
Year Ended October 31, 2006 | | 3.61 | % | | | | 109 | | | 1.32 | % | | 3.60 | % | | 1.33 | % | |
Year Ended October 31, 2007 | | 4.14 | %(c) | | | | 204 | | | 1.27 | %(c) | | 4.07 | %(c) | | 1.30 | % | |
Year Ended October 31, 2008 | | 2.10 | %(d) | | | | 199 | | | 1.27 | % | | 2.08 | % | | 1.27 | % | |
Year Ended October 31, 2009 | | 0.17 | %(e) | | | | 312 | | | 0.68 | %(e) | | 0.13 | %(e) | | 1.30 | %(e) | |
|
|
|
|
|
|
|
|
|
|
|
|
|
|
|
|
|
|
|
CLASS C SHARES | | | | | | | | | | | | | | | | | | |
Year Ended October 31, 2005 | | 1.56 | % | | | $ | 195,246 | | | 1.33 | % | | 1.54 | % | | 1.33 | % | |
Year Ended October 31, 2006 | | 3.61 | % | | | | 268,071 | | | 1.32 | % | | 3.59 | % | | 1.33 | % | |
Year Ended October 31, 2007 | | 4.14 | %(c) | | | | 317,217 | | | 1.27 | %(c) | | 4.08 | %(c) | | 1.30 | % | |
Year Ended October 31, 2008 | | 2.10 | %(d) | | | | 316,779 | | | 1.27 | % | | 2.04 | % | | 1.27 | % | |
Year Ended October 31, 2009 | | 0.17 | %(e) | | | | 259,364 | | | 0.74 | %(e) | | 0.19 | %(e) | | 1.29 | %(e) | |
|
|
|
|
|
|
|
|
|
|
|
|
|
|
|
|
|
|
|
CLASS D SHARES | | | | | | | | | | | | | | | | | | |
Year Ended October 31, 2005 | | 2.32 | % | | | $ | 1,351,695 | | | 0.58 | % | | 2.36 | % | | 0.58 | % | |
Year Ended October 31, 2006 | | 4.39 | % | | | | 2,098,413 | | | 0.57 | % | | 4.38 | % | | 0.58 | % | |
Year Ended October 31, 2007 | | 4.92 | %(c) | | | | 3,710,803 | | | 0.52 | %(c) | | 4.83 | %(c) | | 0.55 | % | |
Year Ended October 31, 2008 | | 2.86 | %(d) | | | | 2,720,592 | | | 0.52 | % | | 2.89 | % | | 0.52 | % | |
Year Ended October 31, 2009 | | 0.40 | %(e) | | | | 1,994,448 | | | 0.49 | %(e) | | 0.42 | %(e) | | 0.54 | %(e) | |
|
|
|
|
|
|
|
|
|
|
|
|
|
|
|
|
|
|
|
CLASS I SHARES | | | | | | | | | | | | | | | | | | |
Year Ended October 31, 2005 | | 2.71 | % | | | $ | 1,476,725 | | | 0.20 | % | | 2.55 | % | | 0.23 | % | |
Year Ended October 31, 2006 | | 4.79 | % | | | | 2,111,147 | | | 0.19 | % | | 4.70 | % | | 0.22 | % | |
Year Ended October 31, 2007 | | 5.33 | %(c) | | | | 1,870,485 | | | 0.14 | %(c) | | 5.21 | %(c) | | 0.21 | % | |
Year Ended October 31, 2008 | | 3.23 | %(d) | | | | 2,954,253 | | | 0.16 | % | | 3.14 | % | | 0.17 | % | |
Year Ended October 31, 2009 | | 0.69 | %(e) | | | | 7,189,613 | | | 0.18 | %(e) | | 0.55 | %(e) | | 0.19 | %(e) | |
|
|
|
|
|
|
|
|
|
|
|
|
|
|
|
|
|
|
|
CLASS Y SHARES | | | | | | | | | | | | | | | | | | |
Year Ended October 31, 2005 | | 2.58 | % | | | $ | 420,576 | | | 0.33 | % | | 2.49 | % | | 0.33 | % | |
Year Ended October 31, 2006 | | 4.65 | % | | | | 530,780 | | | 0.32 | % | | 4.59 | % | | 0.33 | % | |
Year Ended October 31, 2007 | | 5.19 | %(c) | | | | 1,036,994 | | | 0.27 | %(c) | | 5.08 | %(c) | | 0.30 | % | |
Year Ended October 31, 2008 | | 3.12 | %(d) | | | | 2,236,927 | | | 0.27 | % | | 2.96 | % | | 0.27 | % | |
Year Ended October 31, 2009 | | 0.58 | %(e) | | | | 1,194,680 | | | 0.29 | %(e) | | 0.68 | %(e) | | 0.29 | %(e) | |
|
|
|
|
|
|
|
|
|
|
|
|
|
|
|
|
|
|
|
| |
* | Less than $0.005 per share. |
| |
(a) | Total returns do not include redemption charges. |
| |
(b) | During the period, certain fees were reduced. If such fee reductions had not occurred, the ratio would have been as indicated. |
| |
(c) | During the year ended October 31, 2007, HSBC reimbursed amounts to certain Funds related to past marketing arrangements. The corresponding impact to the net expense ratio, net income ratio and the total return were 0.02%, 0.02%, 0.02%, 0.02%, 0.02% and 0.02% for Class A Shares, Class B Shares, Class C Shares, Class D Shares, Class I Shares and Class Y Shares, respectively. |
| |
(d) | During the year ended October 31, 2008, an affiliate of the Fund’s investment adviser purchased certain defaulted securities at $16,746,382, in excess of their fair value on the purchase date. The corresponding impact of this excess amount to the total returns were 0.20%, 0.20%, 0.20%, 0.20%, 0.20% and 0.20% for Class A Shares, Class B Shares, Class C Shares, Class D Shares, Class I Shares and Class Y Shares, respectively. |
| |
(e) | Included in the expense ratios is the Treasury Guarantee Program fees incurred by the Fund during the period. Without these fees, the gross and net expense ratios would have been decreased by 0.03% and the total return and net investment income ratio would have increased by 0.03%. |
| | |
45 | HSBC INVESTOR FAMILY OF FUNDS | See notes to financial statements. |
|
HSBC INVESTOR TAX-FREE MONEY MARKET FUND |
|
Financial Highlights |
Selected data for a share outstanding throughout the periods indicated.
| | | | | | | | | | | | | | | | | | | | | | | | | | | | | |
| | | | | | | Investment Activities | | Dividends | | | | | | |
| | | | | | |
| |
| | | | | | |
| | Net Asset
Value,
Beginning
of Period | | Net
Investment
Income | | Net Realized
Gains
(Losses) from
Investment
Transactions | | Total from
Investment
Activities | | Net
Investment
Income | | Net Realized
Gains from
Investments | | Total
Dividends | | Net Asset
Value, End
of Period | |
|
|
|
|
|
|
|
|
|
|
|
|
|
|
|
|
|
|
CLASS A SHARES | | | | | | | | | | | | | | | | | | | | | | | | | | | | | |
Year Ended October 31, 2005(d) | | | $ | 1.00 | | | — | | | — | | | — | | | — | | | — | | | — | | | | $ | 1.00 | | |
Year Ended October 31, 2006(e) | | | | 1.00 | | | 0.01 | | | — | | | 0.01 | | | (0.01 | ) | | — | | | (0.01 | ) | | | | 1.00 | | |
Year Ended October 31, 2007(f) | | | | 1.00 | | | — | * | | — | | | — | * | | — | * | | — | | | — | * | | | | 1.00 | | |
Year Ended October 31, 2008(j) | | | | 1.00 | | | — | | | — | | | — | | | — | | | — | | | — | | | | | 1.00 | | |
Year Ended October 31, 2009(g) | | | | 1.00 | | | — | * | | — | * | | — | * | | — | * | | — | * | | — | * | | | | 1.00 | | |
|
|
|
|
|
|
|
|
|
|
|
|
|
|
|
|
|
|
|
|
|
|
|
|
|
|
|
|
|
|
CLASS C SHARES | | | | | | | | | | | | | | | | | | | | | | | | | | | | | |
Period Ended October 31, 2007(h) | | | $ | 1.00 | | | — | * | | — | | | — | * | | — | * | | — | | | — | * | | | $ | 1.00 | | |
Year Ended October 31, 2008(j) | | | | 1.00 | | | — | | | — | | | — | | | — | | | — | | | — | | | | | 1.00 | | |
Year Ended October 31, 2009(j) | | | | 1.00 | | | — | | | — | | | — | | | — | | | — | | | — | | | | | 1.00 | | |
|
|
|
|
|
|
|
|
|
|
|
|
|
|
|
|
|
|
|
|
|
|
|
|
|
|
|
|
|
|
CLASS D SHARES | | | | | | | | | | | | | | | | | | | | | | | | | | | | | |
Year Ended October 31, 2005 | | | $ | 1.00 | | | 0.02 | | | — | | | 0.02 | | | (0.02 | ) | | — | | | (0.02 | ) | | | $ | 1.00 | | |
Year Ended October 31, 2006 | | | | 1.00 | | | 0.03 | | | — | | | 0.03 | | | (0.03 | ) | | — | | | (0.03 | ) | | | | 1.00 | | |
Year Ended October 31, 2007 | | | | 1.00 | | | 0.03 | | | — | | | 0.03 | | | (0.03 | ) | | — | | | (0.03 | ) | | | | 1.00 | | |
Year Ended October 31, 2008 | | | | 1.00 | | | 0.02 | | | — | | | 0.02 | | | (0.02 | ) | | — | | | (0.02 | ) | | | | 1.00 | | |
Year Ended October 31, 2009 | | | | 1.00 | | | — | * | | — | * | | — | * | | — | * | | — | * | | — | * | | | | 1.00 | | |
|
|
|
|
|
|
|
|
|
|
|
|
|
|
|
|
|
|
|
|
|
|
|
|
|
|
|
|
|
|
CLASS I SHARES | | | | | | | | | | | | | | | | | | | | | | | | | | | | | |
Year Ended October 31, 2005(i) | | | $ | 1.00 | | | — | * | | — | | | — | * | | — | * | | — | | | — | * | | | $ | 1.00 | | |
Year Ended October 31, 2006(j) | | | | 1.00 | | | — | | | — | | | — | | | — | | | — | | | — | | | | | 1.00 | | |
Year Ended October 31, 2007(j) | | | | 1.00 | | | — | | | — | | | — | | | — | | | — | | | — | | | | | 1.00 | | |
Year Ended October 31, 2008(j) | | | | 1.00 | | | — | | | — | | | — | | | — | | | — | | | — | | | | | 1.00 | | |
Year Ended October 31, 2009(j) | | | | 1.00 | | | — | | | — | | | — | | | — | | | — | | | — | | | | | 1.00 | | |
|
|
|
|
|
|
|
|
|
|
|
|
|
|
|
|
|
|
|
|
|
|
|
|
|
|
|
|
|
|
CLASS Y SHARES | | | | | | | | | | | | | | | | | | | | | | | | | | | | | |
Year Ended October 31, 2005 | | | $ | 1.00 | | | 0.02 | | | — | | | 0.02 | | | (0.02 | ) | | — | | | (0.02 | ) | | | $ | 1.00 | | |
Year Ended October 31, 2006 | | | | 1.00 | | | 0.03 | | | — | | | 0.03 | | | (0.03 | ) | | — | | | (0.03 | ) | | | | 1.00 | | |
Year Ended October 31, 2007 | | | | 1.00 | | | 0.03 | | | — | | | 0.03 | | | (0.03 | ) | | — | | | (0.03 | ) | | | | 1.00 | | |
Year Ended October 31, 2008 | | | | 1.00 | | | 0.02 | | | — | | | 0.02 | | | (0.02 | ) | | — | | | (0.02 | ) | | | | 1.00 | | |
Year Ended October 31, 2009 | | | | 1.00 | | | 0.01 | | | — | * | | 0.01 | | | (0.01 | ) | | — | * | | (0.01 | ) | | | | 1.00 | | |
|
|
|
|
|
|
|
|
|
|
|
|
|
|
|
|
|
|
|
|
|
|
|
|
|
|
|
|
|
|
| | | | | | | | | | | | | | | | | | |
| | | | | Ratios/Supplementary Data | |
| | | | |
| |
| | Total
Return(a) | | Net Assets
at End of
Period
(000’s) | | Ratio of Net
Expenses to
Average
Net Assets(b) | | Ratio of Net
Investment
Income to
Average
Net Assets(b) | | Ratio of
Expenses to
Average Net
Assets(b)(c) | |
|
|
|
|
|
|
|
|
|
|
|
|
CLASS A SHARES | | | | | | | | | | | | | | | | | | |
Year Ended October 31, 2005(d) | | — | | | | $ | | ** | | — | | | — | | | — | | |
Year Ended October 31, 2006(e) | | 0.56 | % | | | | 1 | | | 1.06 | % | | 3.35 | % | | 1.49 | % | |
Year Ended October 31, 2007(f) | | 0.18 | % | | | | — | | | 0.72 | % | | 2.96 | % | | 0.92 | % | |
Year Ended October 31, 2008(j) | | — | | | | | — | | | — | | | — | | | — | | |
Year Ended October 31, 2009(g) | | 0.01 | %(k) | | | | | ** | | 0.78 | %(k) | | 0.01 | %(k) | | 0.98 | %(k) | |
|
|
|
|
|
|
|
|
|
|
|
|
|
|
|
|
|
|
|
CLASS C SHARES | | | | | | | | | | | | | | | | | | |
Period Ended October 31, 2007(h) | | 0.09 | % | | | $ | — | | | 1.34 | % | | 2.24 | % | | 1.54 | % | |
Year Ended October 31, 2008(j) | | — | | | | | — | | | — | | | — | | | — | | |
Year Ended October 31, 2009(j) | | — | | | | | — | | | — | | | — | | | — | | |
|
|
|
|
|
|
|
|
|
|
|
|
|
|
|
|
|
|
|
CLASS D SHARES | | | | | | | | | | | | | | | | | | |
Year Ended October 31, 2005 | | 1.60 | % | | | $ | 11,892 | | | 0.57 | % | | 1.71 | % | | 1.11 | % | |
Year Ended October 31, 2006 | | 2.77 | % | | | | 48,502 | | | 0.66 | % | | 2.76 | % | | 0.99 | % | |
Year Ended October 31, 2007 | | 3.04 | % | | | | 40,184 | | | 0.63 | % | | 3.04 | % | | 0.83 | % | |
Year Ended October 31, 2008 | | 2.13 | % | | | | 69,787 | | | 0.46 | % | | 2.05 | % | | 0.66 | % | |
Year Ended October 31, 2009 | | 0.31 | %(k) | | | | 95,350 | | | 0.43 | %(k) | | 0.29 | %(k) | | 0.63 | %(k) | |
|
|
|
|
|
|
|
|
|
|
|
|
|
|
|
|
|
|
|
CLASS I SHARES | | | | | | | | | | | | | | | | | | |
Year Ended October 31, 2005(i) | | 0.15 | % | | | $ | | ** | | 0.33 | % | | 2.11 | % | | 0.74 | % | |
Year Ended October 31, 2006(j) | | — | | | | | — | | | — | | | — | | | — | | |
Year Ended October 31, 2007(j) | | — | | | | | — | | | — | | | — | | | — | | |
Year Ended October 31, 2008(j) | | — | | | | | — | | | — | | | — | | | — | | |
Year Ended October 31, 2009(j) | | — | | | | | — | | | — | | | — | | | — | | |
|
|
|
|
|
|
|
|
|
|
|
|
|
|
|
|
|
|
|
CLASS Y SHARES | | | | | | | | | | | | | | | | | | |
Year Ended October 31, 2005 | | 1.86 | % | | | $ | 26,569 | | | 0.31 | % | | 1.86 | % | | 0.87 | % | |
Year Ended October 31, 2006 | | 3.02 | % | | | | 12,424 | | | 0.39 | % | | 2.92 | % | | 0.77 | % | |
Year Ended October 31, 2007 | | 3.30 | % | | | | 18,936 | | | 0.34 | % | | 3.31 | % | | 0.54 | % | |
Year Ended October 31, 2008 | | 2.38 | % | | | | 143,730 | | | 0.20 | % | | 2.31 | % | | 0.40 | % | |
Year Ended October 31, 2009 | | 0.55 | %(k) | | | | 97,789 | | | 0.18 | %(k) | | 0.57 | %(k) | | 0.38 | %(k) | |
|
|
|
|
|
|
|
|
|
|
|
|
|
|
|
|
|
|
|
| |
* | Less than $0.005 per share. |
| |
** | Less than $500. |
| |
(a) | Not annualized for periods less than one year. Total returns do not include redemption charges. |
| |
(b) | Annualized for periods less than one year. |
| |
(c) | During the period, certain fees were reduced. If such fee reductions had not occurred, the ratio would have been as indicated. |
| |
(d) | During the period, Class A shares had no operations. Net Assets at the end of the year represent seed money. |
| |
(e) | Class A Shares were operational during a portion of the year only. Amounts reflect performance for the period of the time the class had operations, which was 78 days during the period. The net asset value, end of period, presented is as of the last day during the period the class had shareholders. |
| |
(f) | Class A Shares were operational during a portion of the year only. Amounts reflect performance for the period of the time the class had operations, which was 24 days during the period. The net asset value, end of period, presented is as of the last day during the period the class had shareholders. |
| |
(g) | Class A Shares were operational during a portion of the year only. Amounts reflect performance for the period of time the class had operations, which was 262 days during the period. The net asset value, end of period, presented is as of the last day during the period the class had shareholders. |
| |
(h) | Class C Shares commenced operations on July 30, 2007 and were operational during a portion of the year only. Amounts reflect performance for the period of time the class had operations, which was 15 days during the period. The net asset value, end of period, presented is as of the last day during the period the class had shareholders. |
| |
(i) | Class I Shares were operational during a portion of the year only. Amounts reflect performance for the period of the time the class had operations, which was 27 days during the period. The net asset value, end of period, presented is as of the last day during the period the class had shareholders. |
| |
(j) | During the period, class had no operations. The net asset values reflected represent the last day the class had shareholders. |
| |
(k) | Included in the expense ratios is the Treasury Guarantee Program fees incurred by the Fund during the period. Without these fees, the gross and net expense ratios would have been decreased by 0.03% and the total return and net investment income ratio would have increased by 0.03%. |
| | |
See notes to financial statements. | HSBC INVESTOR FAMILY OF FUNDS | 46 |
|
HSBC INVESTOR U.S. GOVERNMENT MONEY MARKET FUND |
|
Financial Highlights |
|
Selected data for a share outstanding throughout the periods indicated. |
| | | | | | | | | | | | | | | | | | | | | | | | | | | | | |
| | | | Investment Activities | | Dividends | | | |
| | | |
| |
| | | |
Total Dividends | | Net Asset
Value,
Beginning
of Period | | Net
Investment
Income | | Net Realized
Gains
(Losses) from
Investment
Transactions | | Total from
Investment
Activities | | Net
Investment
Income | | Net Realized
Gains from
Investments | | Total
Dividends | | Net Asset
Value, End
of Period | |
|
|
|
|
|
|
|
|
|
|
|
|
|
|
|
|
|
|
CLASS A SHARES | | | | | | | | | | | | | | | | | | | | | | | | | |
Year Ended October 31, 2005 | | | $ | 1.00 | | | 0.02 | | | — | | | 0.02 | | | (0.02 | ) | | — | | | (0.02 | ) | | | $ | 1.00 | | |
Year Ended October 31, 2006 | | | | 1.00 | | | 0.04 | | | — | | | 0.04 | | | (0.04 | ) | | — | | | (0.04 | ) | | | | 1.00 | | |
Year Ended October 31, 2007 | | | | 1.00 | | | 0.05 | | | — | | | 0.05 | | | (0.05 | ) | | — | | | (0.05 | ) | | | | 1.00 | | |
Year Ended October 31, 2008 | | | | 1.00 | | | 0.02 | | | — | | | 0.02 | | | (0.02 | ) | | — | | | (0.02 | ) | | | | 1.00 | | |
Year Ended October 31, 2009 | | | | 1.00 | | | — | * | | — | * | | — | * | | — | * | | — | * | | — | * | | | | 1.00 | | |
|
|
|
|
|
|
|
|
|
|
|
|
|
|
|
|
|
|
|
|
|
|
|
|
|
|
|
|
|
|
CLASS B SHARES | | | | | | | | | | | | | | | | | | | | | | | | | | | | | |
Year Ended October 31, 2005 | | | $ | 1.00 | | | 0.02 | | | — | | | 0.02 | | | (0.02 | ) | | — | | | (0.02 | ) | | | $ | 1.00 | | |
Year Ended October 31, 2006 | | | | 1.00 | | | 0.04 | | | — | | | 0.04 | | | (0.04 | ) | | — | | | (0.04 | ) | | | | 1.00 | | |
Year Ended October 31, 2007 | | | | 1.00 | | | 0.05 | | | — | | | 0.05 | | | (0.05 | ) | | — | | | (0.05 | ) | | | | 1.00 | | |
Year Ended October 31, 2008 | | | | 1.00 | | | 0.02 | | | — | | | 0.02 | | | (0.02 | ) | | — | | | (0.02 | ) | | | | 1.00 | | |
Year Ended October 31, 2009 | | | | 1.00 | | | — | * | | — | * | | — | * | | — | * | | — | * | | — | * | | | | 1.00 | | |
|
|
|
|
|
|
|
|
|
|
|
|
|
|
|
|
|
|
|
|
|
|
|
|
|
|
|
|
|
|
CLASS C SHARES | | | | | | | | | | | | | | | | | | | | | | | | | | | | | |
Period Ended October 31, 2007(e) | | | $ | 1.00 | | | 0.04 | | | — | | | 0.04 | | | (0.04 | ) | | — | | | (0.04 | ) | | | $ | 1.00 | | |
Year Ended October 31, 2008 | | | | 1.00 | | | 0.02 | | | — | | | 0.02 | | | (0.02 | ) | | — | | | (0.02 | ) | | | | 1.00 | | |
Year Ended October 31, 2009 | | | | 1.00 | | | — | * | | — | * | | — | * | | — | * | | — | * | | — | * | | | | 1.00 | | |
|
|
|
|
|
|
|
|
|
|
|
|
|
|
|
|
|
|
|
|
|
|
|
|
|
|
|
|
|
|
CLASS D SHARES | | | | | | | | | | | | | | | | | | | | | | | | | | | | | |
Year Ended October 31, 2005 | | | $ | 1.00 | | | 0.02 | | | — | | | 0.02 | | | (0.02 | ) | | — | | | (0.02 | ) | | | $ | 1.00 | | |
Year Ended October 31, 2006 | | | | 1.00 | | | 0.04 | | | — | | | 0.04 | | | (0.04 | ) | | — | | | (0.04 | ) | | | | 1.00 | | |
Year Ended October 31, 2007 | | | | 1.00 | | | 0.05 | | | — | | | 0.05 | | | (0.05 | ) | | — | | | (0.05 | ) | | | | 1.00 | | |
Year Ended October 31, 2008 | | | | 1.00 | | | 0.02 | | | — | | | 0.02 | | | (0.02 | ) | | — | | | (0.02 | ) | | | | 1.00 | | |
Year Ended October 31, 2009 | | | | 1.00 | | | — | * | | — | * | | — | * | | — | * | | — | * | | — | * | | | | 1.00 | | |
|
|
|
|
|
|
|
|
|
|
|
|
|
|
|
|
|
|
|
|
|
|
|
|
|
|
|
|
|
|
CLASS I SHARES | | | | | | | | | | | | | | | | | | | | | | | | | | | | | |
Year Ended October 31, 2005(f) | | | $ | 1.00 | | | 0.01 | | | — | | | 0.01 | | | (0.01 | ) | | — | | | (0.01 | ) | | | $ | 1.00 | | |
Year Ended October 31, 2006(g) | | | | 1.00 | | | 0.02 | | | — | | | 0.02 | | | (0.02 | ) | | — | | | (0.02 | ) | | | | 1.00 | | |
Year Ended October 31, 2007(h) | | | | 1.00 | | | 0.05 | | | — | | | 0.05 | | | (0.05 | ) | | — | | | (0.05 | ) | | | | 1.00 | | |
Year Ended October 31, 2008 | | | | 1.00 | | | 0.03 | | | — | | | 0.03 | | | (0.03 | ) | | — | | | (0.03 | ) | | | | 1.00 | | |
Year Ended October 31, 2009 | | | | 1.00 | | | — | * | | — | * | | — | * | | — | * | | — | * | | — | * | | | | 1.00 | | |
|
|
|
|
|
|
|
|
|
|
|
|
|
|
|
|
|
|
|
|
|
|
|
|
|
|
|
|
|
|
CLASS Y SHARES | | | | | | | | | | | | | | | | | | | | | | | | | | | | | |
Year Ended October 31, 2005 | | | $ | 1.00 | | | 0.02 | | | — | | | 0.02 | | | (0.02 | ) | | — | | | (0.02 | ) | | | $ | 1.00 | | |
Year Ended October 31, 2006 | | | | 1.00 | | | 0.04 | | | — | | | 0.04 | | | (0.04 | ) | | — | | | (0.04 | ) | | | | 1.00 | | |
Year Ended October 31, 2007 | | | | 1.00 | | | 0.05 | | | — | | | 0.05 | | | (0.05 | ) | | — | | | (0.05 | ) | | | | 1.00 | | |
Year Ended October 31, 2008 | | | | 1.00 | | | 0.03 | | | — | | | 0.03 | | | (0.03 | ) | | — | | | (0.03 | ) | | | | 1.00 | | |
Year Ended October 31, 2009 | | | | 1.00 | | | — | * | | — | * | | — | * | | — | * | | — | * | | — | * | | | | 1.00 | | |
|
|
|
|
|
|
|
|
|
|
|
|
|
|
|
|
|
|
|
|
|
|
|
|
|
|
|
|
|
|
| | | | | | | | | | | | | | | | |
| | | | Ratio/Supplementary Data | |
| | | |
| |
Total Dividends | | Total
Return(a) | | Net Assets
at End of
Period
(000’s) | | Ratio of Net
Expenses to
Average
Net Assets(b) | | Ratio of Net
Investment
Income to
Average
Net Assets(b) | | Ratio of
Expenses to
Average Net
Assets(b)(c) | |
|
|
|
|
|
|
|
|
|
|
|
|
CLASS A SHARES | | | | | | | | | | | | | | | | |
Year Ended October 31, 2005 | | 2.09 | % | | $ | 725,469 | | 0.73 | % | | 2.08 | % | | 0.74 | % | |
Year Ended October 31, 2006 | | 4.16 | % | | | 1,287,045 | | 0.72 | % | | 4.13 | % | | 0.73 | % | |
Year Ended October 31, 2007 | | 4.63 | %(d) | | | 1,090,807 | | 0.65 | %(d) | | 4.56 | %(d) | | 0.70 | % | |
Year Ended October 31, 2008 | | 2.20 | % | | | 703,712 | | 0.67 | % | | 2.29 | % | | 0.67 | % | |
Year Ended October 31, 2009 | | 0.14 | %(i) | | | 574,577 | | 0.52 | %(i) | | 0.14 | %(i) | | 0.72 | %(i) | |
|
|
|
|
|
|
|
|
|
|
|
|
|
|
|
|
|
CLASS B SHARES | | | | | | | | | | | | | | | | |
Year Ended October 31, 2005 | | 1.72 | % | | $ | 1 | | 1.32 | % | | 1.10 | % | | 1.32 | % | |
Year Ended October 31, 2006 | | 4.29 | % | | | 1 | | 1.31 | % | | 3.95 | % | | 1.32 | % | |
Year Ended October 31, 2007 | | 4.76 | %(d) | | | 1 | | 1.25 | %(d) | | 4.01 | %(d) | | 1.28 | % | |
Year Ended October 31, 2008 | | 1.67 | % | | | 54 | | 1.29 | % | | 1.24 | % | | 1.29 | % | |
Year Ended October 31, 2009 | | 0.08 | %(i) | | | 84 | | 0.54 | %(i) | | 0.08 | %(i) | | 1.30 | %(i) | |
|
|
|
|
|
|
|
|
|
|
|
|
|
|
|
|
|
CLASS C SHARES | | | | | | | | | | | | | | | | |
Period Ended October 31, 2007(e) | | 3.79 | %(d) | | $ | 428 | | 1.20 | %(d) | | 3.78 | %(d) | | 1.25 | % | |
Year Ended October 31, 2008 | | 1.59 | % | | | 101 | | 1.27 | % | | 1.28 | % | | 1.27 | % | |
Year Ended October 31, 2009 | | 0.08 | %(i) | | | 229 | | 0.50 | %(i) | | 0.04 | %(i) | | 1.32 | %(i) | |
|
|
|
|
|
|
|
|
|
|
|
|
|
|
|
|
|
CLASS D SHARES | | | | | | | | | | | | | | | | |
Year Ended October 31, 2005 | | 2.24 | % | | $ | 525,937 | | 0.58 | % | | 2.21 | % | | 0.59 | % | |
Year Ended October 31, 2006 | | 4.32 | % | | | 967,456 | | 0.57 | % | | 4.27 | % | | 0.58 | % | |
Year Ended October 31, 2007 | | 4.79 | %(d) | | | 761,155 | | 0.50 | %(d) | | 4.66 | %(d) | | 0.54 | % | |
Year Ended October 31, 2008 | | 2.36 | % | | | 1,438,199 | | 0.52 | % | | 1.92 | % | | 0.52 | % | |
Year Ended October 31, 2009 | | 0.18 | %(i) | | | 767,551 | | 0.48 | %(i) | | 0.21 | %(i) | | 0.58 | %(i) | |
|
|
|
|
|
|
|
|
|
|
|
|
|
|
|
|
|
CLASS I SHARES | | | | | | | | | | | | | | | | |
Year Ended October 31, 2005(f) | | 0.73 | % | | | | ** | 0.20 | % | | 3.08 | % | | 0.24 | % | |
Year Ended October 31, 2006(g) | | 1.80 | % | | $ | 23,002 | | 0.17 | % | | 5.08 | % | | 0.23 | % | |
Year Ended October 31, 2007(h) | | 4.99 | %(d) | | | 949,095 | | 0.15 | %(d) | | 4.73 | %(d) | | 0.17 | % | |
Year Ended October 31, 2008 | | 2.72 | % | | | 4,908,887 | | 0.17 | % | | 2.23 | % | | 0.18 | % | |
Year Ended October 31, 2009 | | 0.43 | %(i) | | | 8,176,980 | | 0.22 | %(i) | | 0.38 | %(i) | | 0.22 | %(i) | |
|
|
|
|
|
|
|
|
|
|
|
|
|
|
|
|
|
CLASS Y SHARES | | | | | | | | | | | | | | | | |
Year Ended October 31, 2005 | | 2.50 | % | | $ | 465,996 | | 0.34 | % | | 2.49 | % | | 0.34 | % | |
Year Ended October 31, 2006 | | 4.58 | % | | | 517,089 | | 0.32 | % | | 4.49 | % | | 0.33 | % | |
Year Ended October 31, 2007 | | 5.05 | %(d) | | | 6,267,594 | | 0.26 | %(d) | | 4.78 | %(d) | | 0.28 | % | |
Year Ended October 31, 2008 | | 2.61 | % | | | 6,747,758 | | 0.27 | % | | 2.53 | % | | 0.27 | % | |
Year Ended October 31, 2009 | | 0.32 | %(i) | | | 3,370,299 | | 0.33 | %(i) | | 0.38 | %(i) | | 0.33 | %(i) | |
|
|
|
|
|
|
|
|
|
|
|
|
|
|
|
|
|
| |
* | Less than $0.005 per share. |
| |
** | Less than $500. |
| |
(a) | Not annualized for periods less than one year. Total returns do not include redemption charges. |
| |
(b) | Annualized for periods less than one year. |
| |
(c) | During the period, certain fees were reduced. If such fee reductions had not occurred, the ratio would have been as indicated. |
| |
(d) | During the year ended October 31, 2007, HSBC reimbursed amounts to certain Funds related to past marketing arrangements. The corresponding impact to the net expense ratio, net income ratio and the total return were 0.03%, 0.03%, 0.02%, 0.02%, 0.00% and 0.01% for Class A Shares, Class B Shares, Class C Shares, Class D Shares, Class I Shares and Class Y Shares, respectively. |
| |
(e) | Class C Shares commenced operations on November 20, 2006 and were operational during a portion of the year only. Amounts reflect performance for the period of time the class had operations, which was 346 days during the period. |
| |
(f) | Class I Shares were operational during a portion of the year only. Amounts reflect performance for the period of time the class had operations, which was 89 days during the period. |
| |
(g) | Class I Shares were operational during a portion of the year only. Amounts reflect performance for the period of time the class had operations, which was 136 days during the period. |
| |
(h) | Class I Shares were operational during a portion of the year only. Amounts reflect performance for the period of time the class had operations, which was 357 days during the period. |
| |
(i) | Included in the expense ratios is the Treasury Guarantee Program fees incurred by the Fund during the period. Without these fees, the gross and net expense ratios would have been decreased by 0.06% and the total return and net investment income ratio would have increased by 0.06%. |
| | |
47 | HSBC INVESTOR FAMILY OF FUNDS | See notes to financial statements. |
|
HSBC INVESTOR U.S. TREASURY MONEY MARKET FUND |
|
Financial Highlights |
|
Selected data for a share outstanding throughout the periods indicated. |
| | | | | | | | | | | | | | | | | | | | | | | | | | | | | |
| | | | | | | Investment Activities | | Dividends | | | | | | |
| | | | | | |
| |
| | | | | | |
| | Net Asset
Value,
Beginning
of Period | | Net
Investment
Income | | Net Realized
Gains
(Losses) from
Investment
Transactions | | Total from
Investment
Activities | | Net
Investment
Income | | Net Realized
Gains from
Investments | | Total
Dividends | | Net Asset
Value, End
of Period | |
|
|
|
|
|
|
|
|
|
|
|
|
|
|
|
|
|
|
CLASS A SHARES | | | | | | | | | | | | | | | | | | | | | | | | | | | | | |
Year Ended October 31, 2005 | | | $ | 1.00 | | | 0.02 | | | — | | | 0.02 | | | (0.02 | ) | | — | | | (0.02 | ) | | | $ | 1.00 | | |
Year Ended October 31, 2006 | | | | 1.00 | | | 0.04 | | | — | | | 0.04 | | | (0.04 | ) | | — | | | (0.04 | ) | | | | 1.00 | | |
Year Ended October 31, 2007 | | | | 1.00 | | | 0.04 | | | — | | | 0.04 | | | (0.04 | ) | | — | | | (0.04 | ) | | | | 1.00 | | |
Year Ended October 31, 2008 | | | | 1.00 | | | 0.01 | | | — | | | 0.01 | | | (0.01 | ) | | — | | | (0.01 | ) | | | | 1.00 | | |
Year Ended October 31, 2009 | | | | 1.00 | | | — | * | | — | * | | — | * | | — | * | | — | * | | — | * | | | | 1.00 | | |
|
|
|
|
|
|
|
|
|
|
|
|
|
|
|
|
|
|
|
|
|
|
|
|
|
|
|
|
|
|
CLASS B SHARES | | | | | | | | | | | | | | | | | | | | | | | | | | | | | |
Year Ended October 31, 2005 | | | $ | 1.00 | | | 0.01 | | | — | | | 0.01 | | | (0.01 | ) | | — | | | (0.01 | ) | | | $ | 1.00 | | |
Year Ended October 31, 2006 | | | | 1.00 | | | 0.03 | | | — | | | 0.03 | | | (0.03 | ) | | — | | | (0.03 | ) | | | | 1.00 | | |
Year Ended October 31, 2007 | | | | 1.00 | | | 0.04 | | | — | | | 0.04 | | | (0.04 | ) | | — | | | (0.04 | ) | | | | 1.00 | | |
Year Ended October 31, 2008 | | | | 1.00 | | | 0.01 | | | — | | | 0.01 | | | (0.01 | ) | | — | | | (0.01 | ) | | | | 1.00 | | |
Year Ended October 31, 2009 | | | | 1.00 | | | — | * | | — | * | | — | * | | — | * | | — | * | | — | * | | | | 1.00 | | |
|
|
|
|
|
|
|
|
|
|
|
|
|
|
|
|
|
|
|
|
|
|
|
|
|
|
|
|
|
|
CLASS C SHARES | | | | | | | | | | | | | | | | | | | | | | | | | | | | | |
Year Ended October 31, 2008(e) | | | $ | 1.00 | | | — | * | | — | | | — | * | | — | * | | — | | | — | * | | | $ | 1.00 | | |
Year Ended October 31, 2009 | | | | 1.00 | | | — | * | | — | * | | — | * | | — | * | | — | * | | — | * | | | | 1.00 | | |
|
|
|
|
|
|
|
|
|
|
|
|
|
|
|
|
|
|
|
|
|
|
|
|
|
|
|
|
|
|
CLASS D SHARES | | | | | | | | | | | | | | | | | | | | | | | | | | | | | |
Year Ended October 31, 2005 | | | $ | 1.00 | | | 0.02 | | | — | | | 0.02 | | | (0.02 | ) | | — | | | (0.02 | ) | | | $ | 1.00 | | |
Year Ended October 31, 2006 | | | | 1.00 | | | 0.04 | | | — | | | 0.04 | | | (0.04 | ) | | — | | | (0.04 | ) | | | | 1.00 | | |
Year Ended October 31, 2007 | | | | 1.00 | | | 0.04 | | | — | | | 0.04 | | | (0.04 | ) | | — | | | (0.04 | ) | | | | 1.00 | | |
Year Ended October 31, 2008 | | | | 1.00 | | | 0.02 | | | — | | | 0.02 | | | (0.02 | ) | | — | | | (0.02 | ) | | | | 1.00 | | |
Year Ended October 31, 2009 | | | | 1.00 | | | — | * | | — | * | | — | * | | — | * | | — | * | | — | * | | | | 1.00 | | |
|
|
|
|
|
|
|
|
|
|
|
|
|
|
|
|
|
|
|
|
|
|
|
|
|
|
|
|
|
|
CLASS I SHARES | | | | | | | | | | | | | | | | | | | | | | | | | | | | | |
Year Ended October 31, 2005(f) | | | $ | 1.00 | | | 0.02 | | | — | | | 0.02 | | | (0.02 | ) | | — | | | (0.02 | ) | | | $ | 1.00 | | |
Year Ended October 31, 2006 | | | | 1.00 | | | 0.04 | | | — | | | 0.04 | | | (0.04 | ) | | — | | | (0.04 | ) | | | | 1.00 | | |
Year Ended October 31, 2007 | | | | 1.00 | | | 0.05 | | | — | | | 0.05 | | | (0.05 | ) | | — | | | (0.05 | ) | | | | 1.00 | | |
Year Ended October 31, 2008 | | | | 1.00 | | | 0.02 | | | — | | | 0.02 | | | (0.02 | ) | | — | | | (0.02 | ) | | | | 1.00 | | |
Year Ended October 31, 2009 | | | | 1.00 | | | — | * | | — | * | | — | * | | — | * | | — | * | | — | * | | | | 1.00 | | |
|
|
|
|
|
|
|
|
|
|
|
|
|
|
|
|
|
|
|
|
|
|
|
|
|
|
|
|
|
|
CLASS Y SHARES | | | | | | | | | | | | | | | | | | | | | | | | | | | | | |
Year Ended October 31, 2005 | | | $ | 1.00 | | | 0.02 | | | — | | | 0.02 | | | (0.02 | ) | | — | | | (0.02 | ) | | | $ | 1.00 | | |
Year Ended October 31, 2006 | | | | 1.00 | | | 0.04 | | | — | | | 0.04 | | | (0.04 | ) | | — | | | (0.04 | ) | | | | 1.00 | | |
Year Ended October 31, 2007 | | | | 1.00 | | | 0.05 | | | — | | | 0.05 | | | (0.05 | ) | | — | | | (0.05 | ) | | | | 1.00 | | |
Year Ended October 31, 2008 | | | | 1.00 | | | 0.02 | | | — | | | 0.02 | | | (0.02 | ) | | — | | | (0.02 | ) | | | | 1.00 | | |
Year Ended October 31, 2009 | | | | 1.00 | | | — | * | | — | * | | — | * | | — | * | | — | * | | — | * | | | | 1.00 | | |
|
|
|
|
|
|
|
|
|
|
|
|
|
|
|
|
|
|
|
|
|
|
|
|
|
|
|
|
|
|
| | | | | | | | | | | | | | | | | | |
| | | | | Ratios/Supplementary Data | |
| | | | |
|
|
| | Total
Return(a) | | Net Assets
at End of
Period
(000’s) | | Ratio of Net
Expenses to
Average
Net Assets(b) | | Ratio of Net
Investment
Income to
Average
Net Assets(b) | | Ratio of
Expenses to
Average Net
Assets(b)(c) | |
|
|
|
|
|
|
|
|
|
|
|
|
CLASS A SHARES | | | | | | | | | | | | | | | | |
Year Ended October 31, 2005 | | 1.89 | % | | | $ | 56,307 | | | 0.76 | % | | 1.84 | % | | 0.76 | % | |
Year Ended October 31, 2006 | | 3.74 | % | | | | 67,861 | | | 0.74 | % | | 3.75 | % | | 0.77 | % | |
Year Ended October 31, 2007 | | 4.19 | %(d) | | | | 84,355 | | | 0.68 | %(d) | | 4.09 | %(d) | | 0.74 | % | |
Year Ended October 31, 2008 | | 1.38 | % | | | | 580,458 | | | 0.67 | % | | 1.06 | % | | 0.67 | % | |
Year Ended October 31, 2009 | | 0.07 | % | | | | 385,994 | | | 0.24 | % | | 0.07 | % | | 0.66 | % | |
|
|
|
|
|
|
|
|
|
|
|
|
|
|
|
|
|
|
|
CLASS B SHARES | | | | | | | | | | | | | | | | | | |
Year Ended October 31, 2005 | | 1.29 | % | | | $ | 39 | | | 1.36 | % | | 1.28 | % | | 1.36 | % | |
Year Ended October 31, 2006 | | 3.12 | % | | | | 40 | | | 1.35 | % | | 3.09 | % | | 1.38 | % | |
Year Ended October 31, 2007 | | 3.57 | %(d) | | | | 41 | | | 1.28 | %(d) | | 3.51 | %(d) | | 1.35 | % | |
Year Ended October 31, 2008 | | 0.86 | % | | | | 131 | | | 1.11 | % | | 1.01 | % | | 1.28 | % | |
Year Ended October 31, 2009 | | 0.07 | % | | | | 60 | | | 0.24 | % | | 0.07 | % | | 1.26 | % | |
|
|
|
|
|
|
|
|
|
|
|
|
|
|
|
|
|
|
|
CLASS C SHARES | | | | | | | | | | | | | | | | | | |
Year Ended October 31, 2008(e) | | 0.01 | % | | | $ | 1,103 | | | 0.64 | % | | 0.20 | % | | 1.26 | % | |
Year Ended October 31, 2009 | | 0.07 | % | | | | 7,138 | | | 0.22 | % | | 0.04 | % | | 1.26 | % | |
|
|
|
|
|
|
|
|
|
|
|
|
|
|
|
|
|
|
|
CLASS D SHARES | | | | | | | | | | | | | | | | | | |
Year Ended October 31, 2005 | | 2.04 | % | | | $ | 293,480 | | | 0.62 | % | | 2.08 | % | | 0.62 | % | |
Year Ended October 31, 2006 | | 3.90 | % | | | | 302,637 | | | 0.60 | % | | 3.85 | % | | 0.62 | % | |
Year Ended October 31, 2007 | | 4.34 | %(d) | | | | 297,120 | | | 0.53 | %(d) | | 4.28 | %(d) | | 0.59 | % | |
Year Ended October 31, 2008 | | 1.53 | % | | | | 937,905 | | | 0.52 | % | | 1.33 | % | | 0.52 | % | |
Year Ended October 31, 2009 | | 0.07 | % | | | | 955,652 | | | 0.23 | % | | 0.06 | % | | 0.51 | % | |
|
|
|
|
|
|
|
|
|
|
|
|
|
|
|
|
|
|
|
CLASS I SHARES | | | | | | | | | | | | | | | | | | |
Year Ended October 31, 2005(f) | | 2.02 | % | | | $ | 30,518 | | | 0.20 | % | | 2.62 | % | | 0.26 | % | |
Year Ended October 31, 2006 | | 4.37 | % | | | | 6,521 | | | 0.19 | % | | 4.12 | % | | 0.27 | % | |
Year Ended October 31, 2007 | | 4.74 | %(d) | | | | 73,460 | | | 0.15 | %(d) | | 4.38 | %(d) | | 0.22 | % | |
Year Ended October 31, 2008 | | 1.90 | % | | | | 3,771,262 | | | 0.16 | % | | 1.26 | % | | 0.16 | % | |
Year Ended October 31, 2009 | | 0.14 | % | | | | 3,322,962 | | | 0.16 | % | | 0.14 | % | | 0.16 | % | |
|
|
|
|
|
|
|
|
|
|
|
|
|
|
|
|
|
|
|
CLASS Y SHARES | | | | | | | | | | | | | | | | | | |
Year Ended October 31, 2005 | | 2.30 | % | | | $ | 47,804 | | | 0.36 | % | | 2.13 | % | | 0.36 | % | |
Year Ended October 31, 2006 | | 4.16 | % | | | | 42,934 | | | 0.35 | % | | 4.07 | % | | 0.37 | % | |
Year Ended October 31, 2007 | | 4.60 | %(d) | | | | 41,256 | | | 0.27 | %(d) | | 4.34 | %(d) | | 0.32 | % | |
Year Ended October 31, 2008 | | 1.78 | % | | | | 1,364,310 | | | 0.27 | % | | 1.34 | % | | 0.27 | % | |
Year Ended October 31, 2009 | | 0.08 | % | | | | 996,309 | | | 0.22 | % | | 0.08 | % | | 0.26 | % | |
|
|
|
|
|
|
|
|
|
|
|
|
|
|
|
|
|
|
|
| |
* | Less than $0.005 per share. |
| |
(a) | Not annualized for periods less than one year. Total returns do not include redemption charges. |
| |
(b) | Annualized for periods less than one year. |
| |
(c) | During the period, certain fees were reduced. If such fee reductions had not occurred, the ratio would have been as indicated. |
| |
(d) | During the year ended October 31, 2007, HSBC reimbursed amounts to certain Funds related to past marketing arrangements. The corresponding impact to the net expense ratio, net income ratio and the total return were 0.01%, 0.01%, 0.01%, 0.01% and 0.01% for Class A Shares, Class B Shares, Class D Shares, Class I Shares and Class Y Shares, respectively. |
| |
(e) | Class C Shares were operational during a portion of the year only. Amounts reflect performance for the period of time the class had operations, which was 26 days during the period. |
| |
(f) | Class I Shares were operational during a portion of the year only. Amounts reflect performance for the period of time the class had operations, which was 280 days during the period. |
| | |
See notes to financial statements. | HSBC INVESTOR FAMILY OF FUNDS | 48 |
|
HSBC INVESTOR FAMILY OF FUNDS |
|
Notes to Financial Statements—As of October 31, 2009 |
| |
1. | Organization: |
| |
| HSBC Investor Funds (the “Trust”), a Massachusetts business trust organized on April 22, 1987, is registered under the Investment Company Act of 1940, as amended (the “Act”), as an open-end management investment company. As of October 31, 2009, the Trust is comprised of 15 separate operational funds, each a series of the HSBC Investor Family of Funds. The accompanying financial statements are presented for the following 6 funds (individually a “Fund,” collectively the “Funds”): |
| | | |
| Fund | | Short Name |
|
| |
|
| HSBC Investor California Tax-Free Money Market Fund | | California Tax-Free Money Market Fund |
| HSBC Investor New York Tax-Free Money Market Fund | | N.Y. Tax-Free Money Market Fund |
| HSBC Investor Prime Money Market Fund | | Prime Money Market Fund |
| HSBC Investor Tax-Free Money Market Fund | | Tax-Free Money Market Fund |
| HSBC Investor U.S. Government Money Market Fund | | U.S. Government Money Market Fund |
| HSBC Investor U.S. Treasury Money Market Fund | | U.S. Treasury Money Market Fund |
| |
| Each Fund except the N.Y. Tax-Free Money Market Fund is a diversified fund under the Act. The N.Y. Tax-Free Money Market Fund is a non-diversified fund, which means it may concentrate its investments in the investments of a limited number of issuers. |
| |
| Financial statements for all other funds of HSBC Investor Family of Funds are published separately. |
| |
| The Funds are authorized to issue an unlimited number of shares of beneficial interest with a par value of $0.001 per share. The Funds are authorized to issue six classes of shares: Class A Shares, Class B Shares, Class C Shares, Class D Shares, Class E Shares and Class Y Shares. In addition, the Prime Money Market Fund, Tax-Free Money Market Fund, U.S. Government Money Market Fund and U.S. Treasury Money Market Fund are authorized to issue Class I Shares. Class B Shares of the Funds are offered without any front-end sales charge but will be subject to a contingent deferred sales charge (“CDSC”) ranging from a maximum of 4.00% if redeemed less than one year after purchase to 0.00% if redeemed more than four years after purchase. Class C Shares of the Funds are offered without any front-end sales charge but will be subject to a maximum CDSC of 1.00% if redeemed less than one year after purchase. No sales charges are assessed with respect to Class A, Class D, Class E, Class I or Class Y Shares of the Funds. Each class of shares in each Fund has identical rights and privileges, except with respect to arrangements pertaining to shareholder servicing and/or distribution, class-related expenses, voting rights on matters affecting a single class of shares, and exchange privileges. Class E Shares will not be available for issue until December 1, 2009. |
| |
| Under the Trust’s organizational documents, the Funds’ officers and trustees are indemnified against certain liabilities arising out of the performance of their duties to the Funds. In addition, in the normal course of business, the Trust may enter into contracts with its service providers, which also provide for indemnifications by the Funds. The Funds’ maximum exposure under these arrangements is unknown as this would involve future claims that may be made against the Funds. However, based on experience, the Trust expects that risk of loss to be remote. |
| |
2. | Significant Accounting Policies: |
| |
| The following is a summary of the significant accounting policies followed by the Funds in the preparation of their financial statements. The policies are in conformity with U.S. generally accepted accounting principles (“GAAP”). The preparation of financial statements requires management to make certain estimates and assumptions that affect the reported amounts of assets and liabilities and disclosure of contingent assets and liabilities at the date of the financial statements and the reported amounts of increases and decreases in net assets from operations during the reporting period. Actual results could differ from those estimates. Management has evaluated events and transactions through December 21, 2009, the date the financial statements were issued, for purposes of recognition or disclosure in these financial statements and there are no subsequent events to report. |
| |
| Securities Valuation: |
| |
| Investments of the Funds are valued at amortized cost, which approximates fair value. Investments in other money market funds are priced at net asset value as reported by such companies. Under the amortized cost method, premium or discount, if any, is amortized or accreted, respectively, on a constant (straight-line) basis to the maturity of the security. |
| |
49 | HSBC INVESTOR FAMILY OF FUNDS |
|
HSBC INVESTOR FAMILY OF FUNDS |
|
Notes to Financial Statements—As of October 31, 2009 (continued) |
| |
| Investment Transactions and Related Income: |
| |
| Investment transactions are accounted for no later than one business day after trade date. For financial reporting purposes, changes in holdings are accounted for on trade date on the last business day of the reporting period. Investment gains and losses are calculated on the identified cost basis. Interest income is recognized on the accrual basis and includes, where applicable, the amortization or accretion of premium or discount. Dividend income is recorded on the ex-dividend date. |
| |
| Restricted and Illiquid Securities: |
| |
| A restricted security is a security which has been purchased through a private offering and cannot be resold to the general public without prior registration under the Securities Act of 1933 (the “1933 Act”) or pursuant to the resale limitations provided by Rule 144A under the 1933 Act, or another exemption from the registration requirements of the 1933 Act. Certain restricted securities may be resold in transactions exempt from registration, normally to qualified institutional buyers, and may be deemed liquid by the Investment Adviser (as defined in Note 4) based on procedures established by the Board of Trustees. Therefore, not all restricted securities are considered illiquid. At October 31, 2009, the Funds did not hold any restricted securities that were deemed illiquid. |
| |
| Repurchase Agreements: |
| |
| The Funds (except U.S. Treasury Money Market Fund) may enter into repurchase agreements with an entity which is a member of the Federal Reserve System or which is a “primary dealer” (as designated by the Federal Reserve Bank of New York) in U.S. Government obligations. The U.S. Treasury Money Market Fund may temporarily invest in repurchase agreements collaterized by U.S. Treasury Obligations. The repurchase price generally equals the price paid by a Fund plus interest negotiated on the basis of current short-term rates, which may be more or less than the rate on the underlying portfolio securities. The seller, under a repurchase agreement, is required to maintain the collateral held pursuant to the agreement, with a fair value equal to or greater than the repurchase price (including accrued interest). Collateral subject to repurchase agreements is held by the Funds’ custodian or another qualified custodian or in the Federal Reserve/Treasury book-entry system. In the event of counterparty default, the Fund has the right to use the collateral to offset losses incurred. There is potential for loss to the Fund in the event the Fund is delayed or prevented from exercising its rights to dispose of the collateral securities, including the risk of a possible decline in the fair value of the underlying securities during the period while the Fund seeks to assert its rights. |
| |
| Allocations: |
| |
| Expenses directly attributable to a Fund are charged to that Fund. Expenses not directly attributable to a Fund are allocated proportionately among various or all funds within the HSBC Investor Family of Funds in relation to the net assets of each fund or on another reasonable basis. Class specific expenses are charged directly to the class incurring the expense. In addition, income, expenses (other than class specific expenses), and unrealized/realized gains and losses are allocated to each class based on relative net assets on a daily basis. |
| |
| Dividends to Shareholders: |
| |
| Dividends to shareholders from net investment income are declared daily and paid monthly from each Fund. Dividends from net realized gains, if any, are declared and paid at least annually by the Funds. Additional distributions are also made to the Funds’ shareholders to the extent necessary to avoid the federal excise tax on certain undistributed income and net realized gains of regulated investment companies. |
| |
| The character of net investment income and net realized gains distributed are determined in accordance with federal income tax regulations, which may differ from GAAP. These “book/tax” differences are either considered temporary or permanent in nature. To the extent these differences are permanent in nature (e.g., reclassification of market discounts, certain gain/loss, paydowns, and distributions), such amounts are reclassified within the composition of net assets based on their federal tax-basis treatment; temporary differences (e.g., wash losses and post-October loss deferrals) do not require reclassification. To the extent distributions to shareholders from net investment income and net realized gains exceed net investment income and net realized gains for tax purposes, they are reported as distributions of capital. |
| |
| Federal Income Taxes: |
| |
| Each Fund is a separate taxable entity for federal income tax purposes. Each Fund has qualified and intends to continue to qualify each year as a “regulated investment company” under Subchapter M of the Internal Revenue Code, as amended and to distribute substantially all of their taxable net investment income and net realized gains, if any, to their shareholders. Accordingly, no provision for federal income or excise tax is required. |
| |
HSBC INVESTOR FAMILY OF FUNDS | 50 |
|
HSBC INVESTOR FAMILY OF FUNDS |
|
Notes to Financial Statements—As of October 31, 2009 (continued) |
| |
| Management of the Funds has reviewed tax positions taken in tax years that remain subject to examination by all major tax jurisdictions, including federal (i.e., the last four tax year ends and the interim tax period since then, as applicable). Management believes that there is no tax liability resulting from unrecognized tax benefits related to uncertain tax positions taken. |
| |
| New Accounting Pronouncement: |
| |
| In June 2009, the Financial Accounting Standards Board (“FASB”) issued Accounting Standard Codification 105-10, “The FASB Accounting Standards Codification and the Hierarchy of Generally Accepted Accounting Principles - a replacement of FASB Statement No. 162” (“ASC 105-10,” formerly “SFAS 168”). ASC 105-10 replaces SFAS No. 162, “The Hierarchy of Generally Accepted Accounting Principles” and establishes the “FASB Accounting Standards Codification” (“Codification”) as the source of authoritative accounting principles recognized by the FASB to be applied by nongovernmental entities in the preparation of financial statements in conformity with U.S. GAAP. All guidance contained in the Codification carries an equal level of authority. The Codification supersedes all existing non-SEC accounting and reporting standards. All other non-grandfathered non-SEC accounting literature not included in the Codification will become nonauthoritative. ASC 105-10 is effective for financial statements issued for interim and annual periods ending after September 15, 2009. The Funds adopted ASC 105-10 in the current reporting period. Management has evaluated this new statement and has determined that it did not have a significant impact on the determination or reporting of the Funds’ financial statements. |
| |
3. | Investment Valuation Summary: |
| |
| The valuation techniques employed by the Funds, as described in Note 2 above, maximize the use of observable inputs and minimize the use of unobservable inputs in determining fair value. The inputs used for valuing the Funds’ investments are summarized in the three broad levels listed below: |
| |
| Level 1: quoted prices in active markets for identical assets |
| |
| Level 2: other significant observable inputs (including quoted prices for similar securities, interest rates, prepayments speeds, credit risk, etc.) |
| |
| Level 3: significant unobservable inputs (including the Fund’s own assumptions in determining the fair value of investments) |
| |
| The inputs or methodology used for valuing investments are not necessarily an indication of the risk associated with investing in those investments. For example, debt securities held in the Funds are valued at amortized cost in accordance with Rule 2a-7 of the Act, which approximates fair value. Generally, amortized cost approximates the current fair value of a security, but since the valuation is not obtained from a quoted price in an active market, such securities are reflected as Level 2. |
| |
| The Schedules of Portfolio Investments include additional information regarding the investments for the Funds. The following is a summary of the valuation inputs used as of October 31, 2009 in valuing the Funds’ investments based upon the three levels defined above: |
| | | | | | | | | | |
| | LEVEL 1 | | LEVEL 2 | | TOTAL
INVESTMENTS | |
| |
| |
| |
| |
California Tax-Free Money Market Fund | | | | | | | | | | |
Investments: | | | | | | | | | | |
Commercial Paper and Notes | | $ | — | | $ | 15,850,000 | | $ | 15,850,000 | |
Municipal Bonds | | | — | | | 1,040,066 | | | 1,040,066 | |
Variable Rate Demand Notes | | | — | | | 116,355,000 | | | 116,355,000 | |
Investment Companies | | | 3,180,029 | | | — | | | 3,180,029 | |
| |
|
| |
|
| |
|
| |
Total Investments | | $ | 3,180,029 | | $ | 133,245,066 | | $ | 136,425,095 | |
| |
|
| |
|
| |
|
| |
| |
51 | HSBC INVESTOR FAMILY OF FUNDS |
|
HSBC INVESTOR FAMILY OF FUNDS |
|
Notes to Financial Statements—As of October 31, 2009 (continued) |
| | | | | | | | | | |
| | LEVEL 1 | | LEVEL 2 | | TOTAL
INVESTMENTS | |
| |
| |
| |
| |
New York Tax-Free Money Market Fund | | | | | | | | | | |
Investments: | | | | | | | | | | |
Tax-Free Notes and Commercial Paper | | $ | — | | $ | 115,200,000 | | $ | 115,200,000 | |
Variable Rate Demand Notes | | | — | | | 508,980,000 | | | 508,980,000 | |
Investment Companies | | | 18,247,327 | | | — | | | 18,247,327 | |
| |
|
| |
|
| |
|
| |
Total Investments | | $ | 18,247,327 | | $ | 624,180,000 | | $ | 642,427,327 | |
| |
|
| |
|
| |
|
| |
Prime Money Market Fund Fund | | | | | | | | | | |
Investments: | | | | | | | | | | |
Certificates of Deposit | | $ | — | | $ | 3,282,076,909 | | $ | 3,282,076,909 | |
Corporate Obligations | | | — | | | 232,481,456 | | | 232,481,456 | |
Commercial Paper and Notes | | | — | | | 2,974,211,646 | | | 2,974,211,646 | |
Variable Rate Demand Notes | | | — | | | 500,685,000 | | | 500,685,000 | |
Time Deposits | | | — | | | 1,922,601,335 | | | 1,922,601,335 | |
U.S. Government and Government | | | | | | | | | | |
Agency Obligations | | | — | | | 1,858,781,807 | | | 1,858,781,807 | |
U.S. Treasury Obligations | | | — | | | 299,276,633 | | | 299,276,633 | |
| |
|
| |
|
| |
|
| |
Total Investments | | $ | — | | $ | 11,070,114,786 | | $ | 11,070,114,786 | |
| |
|
| |
|
| |
|
| |
Tax-Free Money Market Fund | | | | | | | | | | |
Investments: | | | | | | | | | | |
Commercial Paper and Notes | | $ | — | | $ | 44,165,000 | | $ | 44,165,000 | |
Municipal Bonds | | | — | | | 81,792,000 | | | 81,792,000 | |
Variable Rate Demand Notes | | | — | | | 62,839,965 | | | 62,839,965 | |
Investment Companies | | | 4,270,307 | | | — | | | 4,270,307 | |
| |
|
| |
|
| |
|
| |
Total Investments | | $ | 4,270,307 | | $ | 188,796,965 | | $ | 193,067,272 | |
| |
|
| |
|
| |
|
| |
U.S. Government Money Market Fund | | | | | | | | | | |
Investments: | | | | | | | | | | |
U.S. Government and Government | | | | | | | | | | |
Agency Obligations | | $ | — | | $ | 5,267,056,173 | | $ | 5,267,056,173 | |
U.S. Treasury Obligations | | | — | | | 149,845,609 | | | 149,845,609 | |
Repurchase Agreements | | | — | | | 7,550,000,000 | | | 7,550,000,000 | |
| |
|
| |
|
| |
|
| |
Total Investments | | $ | — | | $ | 12,966,901,782 | | $ | 12,966,901,782 | |
| |
|
| |
|
| |
|
| |
U.S. Treasury Money Market Fund | | | | | | | | | | |
Investments: | | | | | | | | | | |
U.S. Treasury Obligations | | $ | — | | $ | 5,512,893,447 | | $ | 5,512,893,447 | |
| |
|
| |
|
| |
|
| |
Total Investments | | $ | — | | $ | 5,512,893,447 | | $ | 5,512,893,447 | |
| |
|
| |
|
| |
|
| |
| |
4. | Related Party Transactions and Other Agreements and Plans: |
| |
| Investment Management: |
| |
| HSBC Global Asset Management (USA) Inc. (“HSBC” or the “Investment Adviser”), a wholly owned subsidiary of HSBC Bank USA, N.A., a national bank organized under the laws of the United States, acts as Investment Adviser to the Funds. As Investment Adviser, HSBC manages the investments of the Funds and continuously reviews, supervises and administers the Funds’ investments pursuant to an Investment Advisory Agreement. For its services as investment adviser, HSBC receives a fee from each Fund, accrued daily and paid monthly, based on the average daily net assets of each respective Fund, at an annual rate of 0.10%. |
| |
| HSBC also provides operational support services to the Funds pursuant to an Operational Support Services Agreement. For its services in this capacity, HSBC receives a fee, accrued daily and paid monthly, based on the average daily net assets of Class A Shares, Class B Shares, Class C Shares, Class D Shares and Class Y Shares, at an annual rate of: |
| |
HSBC INVESTOR FAMILY OF FUNDS | 52 |
|
HSBC INVESTOR FAMILY OF FUNDS |
|
Notes to Financial Statements—As of October 31, 2009 (continued) |
| | | | | |
| Fund | | Fee Rate | |
|
| |
| |
| California Tax-Free Money Market Fund | | 0.10 | % | |
| N.Y. Tax-Free Money Market Fund | | 0.05 | % | |
| Prime Money Market Fund | | 0.10 | % | |
| Tax-Free Money Market Fund | | 0.10 | % | |
| U.S. Government Money Market Fund | | 0.10 | % | |
| U.S. Treasury Money Market Fund | | 0.10 | % | |
| |
| The Bank of New York Mellon (the “Servicer”) provides recordkeeping, reporting and processing services to the Prime Money Market Fund, U.S. Government Money Market Fund and U.S. Treasury Money Market Fund, Class I Shares. The Servicer is paid by the Investment Adviser from its profits and not by the Funds, for these services. |
| |
| Administration: |
| |
| HSBC serves the Funds as Administrator. Under the terms of the Administration Agreement, HSBC received from the Funds (as well as other funds in the HSBC Investor Family of Funds) a fee, accrued daily and paid monthly, during the period November 1, 2008 through December 31, 2008, at an annual rate of: |
| | | | | |
| Based on Average Daily Net Assets of | | Fee Rate | |
|
| |
| |
| Up to $12 billion | | 0.0525 | % | |
| In excess of $12 billion | | 0.0350 | % | |
| |
| Effective January 1, 2009, the terms of the Administration Agreement were amended. Pursuant to the amended Administration Agreement, HSBC receives from the Funds (as well as the other funds in the HSBC Investor Family of Funds) a fee, accrued daily and paid monthly, at annual rate of: |
| | | | | |
| Based on Average Daily Net Assets of | | Fee Rate | |
|
| |
| |
| Up to $10 billion | | 0.0550 | % | |
| In excess of $10 billion but not exceeding $20 billion | | 0.0350 | % | |
| In excess of $20 billion but not exceeding $50 billion | | 0.0275 | % | |
| In excess of $50 billion | | 0.0250 | % | |
| |
| The fee breakpoints are determined on the basis of the aggregate average daily net assets of the HSBC Investor Family of Funds. The fee is allocated to each of the HSBC Investor Family of Funds based upon its pro-rata share of net assets for each class, subject to certain allocations in cases where one fund invests some or all of its assets in another fund. An amount equal to 50% of the administration fees is deemed to be class specific. |
| |
| Pursuant to a Sub-Administration Agreement with HSBC, Citi Fund Services Ohio, Inc. (“Citi Ohio”), a wholly-owned subsidiary of Citigroup, Inc., serves as Sub-Administrator for the Trusts, and the HSBC Investor Family of Funds, subject to the general supervision of the Trusts’ Board of Trustees and HSBC. For these services, Citi Ohio is entitled to a fee, payable by HSBC, at an annual rate equivalent to the fee rates set forth above, minus 0.02% (2 basis points) which is retained by HSBC. During the year ended October 31, 2009, HSBC voluntarily reduced its administrative fees by $644,698. |
| |
53 | HSBC INVESTOR FAMILY OF FUNDS |
|
HSBC INVESTOR FAMILY OF FUNDS |
|
Notes to Financial Statements—As of October 31, 2009 (continued) |
| |
| Under a Compliance Services Agreement between the Trusts and Citi Ohio (the “CCO Agreement”), Citi Ohio makes an employee available to serve as the Funds’ Chief Compliance Officer (the “CCO”). Under the CCO Agreement, Citi Ohio also provides infrastructure and support in implementing the written policies and procedures comprising the Funds’ compliance program, including support services to the CCO. For the services provided under the CCO Agreement, the HSBC Investor Family of Funds paid Citi Ohio $266,099 for the year ended October 31, 2009, plus reimbursement of certain out of pocket expenses. Expenses incurred by each Fund are reflected on the Statements of Operations as “Compliance Services.” Citi Ohio pays the salary and other compensation earned by individuals performing these services, as employees of Citi Ohio. |
| |
| Distribution Arrangements: |
| |
| Foreside Distribution Services, L.P. (“Foreside”), a wholly-owned subsidiary of Foreside Financial Group LLC, serves the Trust as Distributor (the “Distributor”). The Trust has adopted a non-compensatory Distribution Plan and Agreement (the “Distribution Plan”) pursuant to Rule 12b-1 of the Act. The Distribution Plan provides for reimbursement of expenses incurred by the Distributor related to distribution and marketing, at a rate not to exceed 0.25%, 1.00%, 1.00% and 0.25% of the average daily net assets of Class A Shares (currently not being charged), Class B Shares (currently charging 0.75%), Class C Shares (currently charging 0.75%) and Class D Shares (currently not being charged) of the Funds, respectively. Foreside, as Distributor, also received $222,439, $151,254 and $10,302 in commissions from sales of HSBC Investor Family of Funds, for Class A Shares, Class B Shares and Class C Shares, respectively, of which $75, $12 and $0 were reallocated to HSBC-affiliated brokers and dealers for Class A Shares, Class B Shares and Class C Shares, respectively. Expenses reduced during the year ended October 31, 2009 are reflected on the Statements of Operations as “Fees reduced by Distributor.” |
| |
| Shareholder Servicing: |
| |
| The Trust has adopted a Shareholder Services Plan, which provides for payments to shareholder servicing agents (which primarily consist of HSBC and its affiliates) for providing various shareholder services. For performing these services, the shareholder servicing agents receive a fee that is computed daily and paid monthly up to 0.60%, 0.25%, 0.25% and 0.25% of the average daily net assets of Class A Shares (currently charging 0.40%), Class B Shares, Class C Shares and Class D Shares of the Funds, respectively. The fees paid to the Distributor pursuant to the Distribution Plan and to shareholder servicing agents pursuant to the Shareholder Services Plan may not exceed, in the aggregate, 0.85%, 1.00%, 1.00% and 0.50% annually of each Fund’s average daily net assets of Class A Shares, Class B Shares, Class C Shares and Class D Shares, respectively. Expenses reduced during the year ended October 31, 2009 are reflected on the Statements of Operations as “Fees reduced by Shareholder Servicing Agent.” |
| |
| Fund Accounting, Transfer Agent and Trustees: |
| |
| Citi Ohio provides fund accounting and transfer agency services for each fund of the HSBC Investor Family of Funds. As transfer agent, Citi Ohio receives a fee based on the number of funds and shareholder accounts, subject to certain minimums and reimbursement of certain expenses. As fund accountant, Citi Ohio receives an annual fee per fund and share class, subject to certain minimums and reimbursement of certain expenses. |
| |
| Each non-interested Trustee is compensated with a $60,000 annual Board retainer for service as a Trustee of the Trust and the other HSBC Investor Funds, as well as a $3,000 annual retainer for each Committee of the Board of the Trust and other HSBC Investor Funds. Each non-interested Trustee also receives a $5,000 and $3,000 meeting fee for each regular in-person Board meeting and Committee meeting, respectively. Furthermore, each non-interested Trustee receives compensation for attending special meetings and/or functioning as a Committee or Board Chairperson. In addition, the non-interested Trustees are reimbursed for certain expenses incurred in connection with their Board membership. |
| |
HSBC INVESTOR FAMILY OF FUNDS | 54 |
|
HSBC INVESTOR FAMILY OF FUNDS |
|
Notes to Financial Statements—As of October 31, 2009 (continued) |
| |
| Fee Reductions: |
| |
| The Investment Adviser has agreed to contractually limit through March 1, 2010 the annual total expenses, exclusive of interest, taxes, brokerage commissions, and extraordinary expenses, of the California Tax-Free Money Market Fund, Prime Money Market Fund, U.S. Government Money Market Fund and U.S. Treasury Money Market Fund. Each Fund Class has its own expense limitations based on the average daily net assets for any full fiscal year as follows: |
| | | | | |
Fund | | Class | | Contractual
Expense
Limitations |
| |
| |
|
California Tax-Free Money Market Fund | | A | | 0.80 | % |
California Tax-Free Money Market Fund | | B | | 1.40 | %* |
California Tax-Free Money Market Fund | | C | | 1.40 | % |
California Tax-Free Money Market Fund | | D | | 0.65 | % |
California Tax-Free Money Market Fund | | Y | | 0.40 | % |
Prime Money Market Fund | | I | | 0.20 | % |
U.S. Government Money Market Fund | | I | | 0.20 | % |
U.S. Treasury Money Market Fund | | I | | 0.20 | % |
|
|
* The California Tax-Free Money Market Fund Class B Shares have not commenced operations as of October 31, 2009. |
| |
| Any amounts contractually waived or reimbursed by the Investment Adviser will be subject to repayment by the Fund to the Investment Adviser within three years to the extent that the repayment will not cause the Fund’s operating expenses to exceed the contractual expense limit that was in effect at the time of such waiver or reimbursement. During the year ended October 31, 2009, the Investment Adviser did not recapture any of its prior contractual waivers or reimbursements. As of October 31, 2009, the repayments that may potentially be made by the Funds are as follows: |
| | | | | | |
Fund | | 2012($) | | 2011($) | | 2010($) |
| |
| |
| |
|
U.S. Government Money Market Fund | | — | | — | | 6,689 |
| |
| The Administrator and Citi Ohio may voluntarily waive/reimburse fees to help support the expense limits of the Funds. In addition, the Administrator and Investment Adviser may waive/reimburse additional fees at their discretion. Any voluntary fee waivers/reimbursements are not subject to recoupment in subsequent fiscal periods. Voluntary waivers/reimbursements may be stopped at any time. Amounts waived/reimbursed by the Investment Adviser, Administrator and Citi Ohio are reported separately on the Statements of Operations, as applicable. |
| |
| The Funds have entered into an arrangement with their custodian whereby credits realized as a result of uninvested cash balances are used to reduce a portion of the Funds’ custodian expenses. Expenses reduced during the year ended October 31, 2009 are reflected on the Statements of Operations as “Fees Reduced by Custody Credits.” |
| |
5. | Concentration of Credit Risk: |
| |
| The California Tax-Free Money Market Fund and N.Y. Tax-Free Money Market Fund invest primarily in debt obligations issued by the State of California and the State of New York, respectively, and their respective political subdivisions, agencies and public authorities. The Funds are more susceptible to economic and political factors adversely affecting issuers of California and New York municipal securities than are municipal money market funds that are not concentrated in these issuers to the same extent. |
| |
6. | Federal Income Tax Information: |
| |
| At October 31, 2009, the cost basis for federal income tax purposes, gross unrealized appreciation, gross unrealized depreciation and net unrealized appreciation/depreciation were as follows: |
| | | | | | | | | | | | | |
Fund | | Tax Cost | | Tax Unrealized
Appreciation | | Tax Unrealized
Depreciation | | Net Unrealized
Appreciation
(Depreciation) | |
| |
| |
| |
| |
| |
California Tax-Free Money Market Fund | | $ | 136,425,095 | | $ | — | | $ | — | | $ | — | |
New York Tax-Free Money Market Fund | | | 642,427,327 | | | — | | | — | | | — | |
Prime Money Market Fund | | | 11,070,114,786 | | | — | | | — | | | — | |
Tax-Free Money Market Fund | | | 193,067,272 | | | — | | | — | | | — | |
U.S. Government Money Market Fund | | | 12,966,901,782 | | | — | | | — | | | — | |
U.S Treasury Money Market Fund | | | 5,512,893,447 | | | — | | | — | | | — | |
| |
55 | HSBC INVESTOR FAMILY OF FUNDS |
|
HSBC INVESTOR FAMILY OF FUNDS |
|
Notes to Financial Statements—As of October 31, 2009 (continued) |
| |
| The tax character of dividends paid by the Funds for the year ended October 31, 2009 was as follows: |
| | | | | | | | | | | | | | | | |
| | Dividends paid from | |
| |
| |
| | Ordinary
Income | | Net Long
Term
Capital Gains | | Total Taxable
Dividends | | Tax Exempt
Distributions | | Total
Dividends
Paid(1) | |
| |
| |
| |
| |
| |
| |
California Tax-Free Money Market Fund | | $ | — | | $ | — | | $ | — | | $ | 314,207 | | $ | 314,207 | |
New York Tax-Free Money Market Fund | | | 14,699 | | | — | | | 14,699 | | | 5,594,422 | | | 5,609,121 | |
Prime Money Market Fund | | | 69,404,711 | | | — | | | 69,404,711 | | | — | | | 69,404,711 | |
Tax-Free Money Market Fund | | | 717 | | | 2 | | | 719 | | | 1,543,185 | | | 1,543,904 | |
U.S. Government Money Market Fund | | | 65,922,133 | | | — | | | 65,922,133 | | | — | | | 65,922,133 | |
U.S Treasury Money Market Fund | | | 10,236,049 | | | — | | | 10,236,049 | | | — | | | 10,236,049 | |
| | | | | | | | | | | | | | | | |
The tax character of dividends paid by the Funds for the year ended October 31, 2008 was as follows: |
| | | | | | | | | | | | | | | | |
| | Dividends paid from | |
| |
| |
| | Ordinary
Income | | Net Long
Term
Capital Gains | | Total Taxable
Dividends | | Tax Exempt
Distributions | | Total
Dividends
Paid(1) | |
| |
| |
| |
| |
| |
| |
California Tax-Free Money Market Fund | | $ | 40,728 | | $ | — | | $ | 40,728 | | $ | 3,640,204 | | $ | 3,680,932 | |
New York Tax-Free Money Market Fund | | | 153,488 | | | — | | | 153,488 | | | 22,999,078 | | | 23,152,566 | |
Prime Money Market Fund | | | 250,554,750 | | | — | | | 250,554,750 | | | — | | | 250,554,750 | |
Tax-Free Money Market Fund | | | 8,629 | | | — | | | 8,629 | | | 2,832,608 | | | 2,841,237 | |
U.S. Government Money Market Fund | | | 398,399,999 | | | — | | | 398,399,999 | | | — | | | 398,399,999 | |
U.S Treasury Money Market Fund | | | 29,192,297 | | | — | | | 29,192,297 | | | — | | | 29,192,297 | |
| |
(1) Total dividends paid may differ from the amount reported in the Statements of Changes in Net Assets because dividends are recognized when actually paid for tax purposes. |
| |
| As of October 31, 2009, the components of accumulated earnings/(deficit) on a tax basis for the Funds were as follows: |
| | | | | | | | | | | | | | | | | | | | | | | | | |
| | Undistributed
Ordinary
Income | | Undistributed
Tax Exempt
Income | | Undistributed
Long Term
Capital Gains | | Accumulated
Earnings | | Dividends
Payable | | Accumulated
Capital and
Other Losses | | Unrealized
Appreciation/
(Depreciation) | | Total
Accumulated
Earnings/
(Deficit) | |
| |
| |
| |
| |
| |
| |
| |
| |
| |
California Tax-Free Money Market Fund | | $ | — | | $ | 3,772 | | $ | — | | $ | 3,772 | | $ | (3,736 | ) | $ | (2,925 | ) | $ | — | | $ | (2,889 | ) |
New York Tax-Free Money Market Fund | | | — | | | — | | | — | | | — | | | (13,403 | ) | | — | | | — | | | (13,403 | ) |
Prime Money Market Fund | | | 863,638 | | | — | | | — | | | 863,638 | | | (898,732 | ) | | (374,192 | ) | | — | | | (409,286 | ) |
Tax-Free Money Market Fund | | | — | | | 18,501 | | | — | | | 18,501 | | | (18,451 | ) | | — | | | — | | | 50 | |
U.S. Government Money Market Fund | | | 2,325,217 | | | — | | | — | | | 2,325,217 | | | (962,661 | ) | | — | | | — | | | 1,362,556 | |
U.S Treasury Money Market Fund | | | 107,741 | | | — | | | — | | | 107,741 | | | (103,495 | ) | | (75,493 | ) | | — | | | (71,247 | ) |
| |
HSBC INVESTOR FAMILY OF FUNDS | 56 |
|
HSBC INVESTOR FAMILY OF FUNDS |
|
Notes to Financial Statements—As of October 31, 2009 (continued) |
| |
| As of October 31, 2009, the following Funds have net capital loss carryforwards, which are available to offset future realized gains, if any, to the extent provided by the Treasury regulations. To the extent that these carryforwards are used to offset future capital gains, it is probable that the gains that are offset will not be distributed to shareholders. |
| | | | | | | | | |
| Fund | | | Amount | | Expires | |
|
| | |
| |
| |
| California Tax-Free Money Market Fund | | $ | 24 | | | 2014 | |
| | | | 2,900 | | | 2016 | |
| | | | 1 | | | 2017 | |
| Prime Money Market Fund | | | 374,192 | | | 2016 | |
| U.S. Treasury Money Market Fund | | | 75,493 | | | 2017 | |
| |
| During the year ended October 31, 2009, the following Funds utilized capital loss carryforwards to offset capital gains realized: |
| | | | | | | | | |
| Fund | | | Amount | | | | |
|
| | |
| | | | |
| Prime Money Market Fund | | $ | 3,584,834 | | | | |
| |
7. | Legal and Regulatory Matters: |
| |
| On September 26, 2006, BISYS Fund Services, Inc. (“BISYS”), an affiliate of BISYS Fund Services Ohio, Inc. which provided various services to the Funds, reached a settlement with the Securities and Exchange Commission (“the SEC”) regarding the SEC’s investigation related to BISYS’ past payment of certain marketing and other expenses with respect to certain of its mutual fund clients. Although BISYS has reached a settlement with the SEC, the Funds’ management is not aware that any determination has been made as to how the BISYS settlement monies will be distributed. While the Funds’ management is currently unable to determine the impact, if any, of such matters on the Funds or the Funds’ financial statements, management does not anticipate a material, adverse impact to the Funds or the Funds’ financial statements. |
| |
8. | Participation in the U.S. Department of Treasury’s Temporary Guarantee Program for Money Market Funds: |
| |
| The Funds, excluding the U.S. Treasury Money Market Fund, participated in the U.S. Department of the Treasury’s Temporary Guarantee Program for Money Market Funds (the “Program”) which expired on September 18, 2009. The fee for the Program was expensed by each Fund over the period without regard to any expense limitation in effect for the Funds. Amounts expensed during the year ended October 31, 2009 are reflected in the Statements of Operations as “Treasury Guarantee Program.” |
| |
57 | HSBC INVESTOR FAMILY OF FUNDS |
REPORT OF INDEPENDENT REGISTERED PUBLIC ACCOUNTING FIRM
To the Shareholders and Board of Trustees of
HSBC Investor Funds:
We have audited the accompanying statements of assets and liabilities of HSBC Investor California Tax-Free Money Market Fund, HSBC Investor New York Tax-Free Money Market Fund, HSBC Investor Prime Money Market Fund, HSBC Investor Tax-Free Money Market Fund, HSBC Investor U.S. Government Money Market Fund and HSBC Investor U.S. Treasury Money Market Fund (the Funds), including the schedules of portfolio investments, as of October 31, 2009, and the related statements of operations for the year then ended, the statements of changes in net assets for each year in the two-year period then ended, and the financial highlights for each year in the five-year period then ended. These financial statements and financial highlights are the responsibility of the Funds’ management. Our responsibility is to express an opinion on these financial statements and financial highlights based on our audits.
We conducted our audits in accordance with the standards of the Public Company Accounting Oversight Board (United States). Those standards require that we plan and perform the audits to obtain reasonable assurance about whether the financial statements and financial highlights are free of material misstatement. An audit includes examining, on a test basis, evidence supporting the amounts and disclosures in the financial statements. Our procedures included confirmation of securities owned as of October 31, 2009, by correspondence with custodians and brokers or by other appropriate auditing procedures. An audit also includes assessing the accounting principles used and significant estimates made by management, as well as evaluating the overall financial statement presentation. We believe that our audits provide a reasonable basis for our opinion.
In our opinion, the financial statements and financial highlights referred to above present fairly, in all material respects, the financial position of the Funds as of October 31, 2009, the results of their operations for the year then ended, the changes in their net assets for each year in the two-year period then ended, and the financial highlights for each year in the five-year period then ended, in conformity with U.S. generally accepted accounting principles.
|
 |
Columbus, Ohio
December 21, 2009 |
| |
HSBC INVESTOR FAMILY OF FUNDS | 58 |
|
HSBC INVESTOR FAMILY OF FUNDS |
|
Other Federal Income Tax Information (Unaudited)—As of October 31, 2009 |
| | | | | | |
| During the year ended October 31, 2009, the following Funds designated income dividends as tax-exempt dividends: | |
| | | | | |
| Fund | | | Amount ($) | |
|
| | |
| |
| California Tax-Free Money Market Fund | | $ | 314,207 | |
| New York Tax-Free Money Market Fund | | | 5,594,422 | |
| Tax-Free Money Market Fund | | | 1,543,185 | |
| | | | | |
| During the year ended October 31, 2009, the following Funds declared net long term capital gain distributions: |
| |
| Fund | | | Amount ($) | |
|
| | |
| |
| Tax-Free Money Market Fund | | $ | 2 | |
| | | | | |
| During the year ended October 31, 2009, the following Funds declared net short term capital gain distributions: |
| |
| Fund | | | Amount ($) | |
|
| | |
| |
| New York Tax-Free Money Market Fund | | $ | 8,217 | |
| Tax-Free Money Market Fund | | | 716 | |
| U.S. Government Money Market Fund | | | 850,352 | |
| U.S. Treasury Money Market Fund | | | 281,892 | |
| | | | | |
During the year ended October 31, 2009, the following Funds designated the maximum amount allowable as interest-related dividends for certain non U.S. resident investors: |
| | | | | | |
| Fund | | | Qualified
Interest
Income | |
|
| | |
| |
| Prime Money Market Fund | | | 100.00 | % |
| U.S. Government Money Market Fund | | | 100.00 | % |
| U.S. Treasury Money Market Fund | | | 100.00 | % |
| |
59 | HSBC INVESTOR FAMILY OF FUNDS |
(This Page Intentionally Left Blank)
|
HSBC INVESTOR FAMILY OF FUNDS |
|
Table of Shareholder Expenses—As of October 31, 2009 (Unaudited) |
| |
| As a shareholder of the HSBC Investor Funds (“Funds”), you incur two types of costs: (1) transaction costs, shareholder servicing fees; and exchange fees: (2) ongoing costs, including management fees; distribution; and other Fund expenses. These examples are intended to help you understand your ongoing costs (in dollars) of investing in the Funds (“Funds”) and to compare the cost with the ongoing costs of investing in other mutual funds. |
| |
| These examples are based on an investment of $1,000 invested at the beginning of the period and held for the entire period from May 1, 2009 through October 31, 2009. |
| |
Actual Example |
| |
| The table below provides information about actual account values and actual expenses. You may use the information below, together with the amount you invested, to estimate the expenses that you paid over the period. Simply divide your account value by $1,000 (for example, an $8,600 account value divided by $1,000 = 8.6), then multiply the result by the number in the table under the heading entitled “Expenses Paid During Period” to estimate the expenses you paid on your account during this period. |
| | | | | | | | | | | | | | | | | | | | | |
| | | | Beginning
Account Value
5/1/09 | | Ending
Account Value
10/31/09 | | Expenses Paid
During Period*
5/1/09 – 10/31/09 | | Annualized
Expense Ratio
During Period
5/1/09 – 10/31/09 | |
| | | |
| |
| |
| |
| |
California Tax-Free Money
Market Fund | | Class A Shares | | | $ | 1,000.00 | | | | $ | 1,000.10 | | | | $ | 1.76 | | | 0.35 | % | |
| | Class D Shares | | | | 1,000.00 | | | | | 1,000.10 | | | | | 1.61 | | | 0.32 | % | |
| | Class Y Shares | | | | 1,000.00 | | | | | 1,000.40 | | | | | 1.41 | | | 0.28 | % | |
New York Tax-Free Money
Market Fund | | Class A Shares | | | | 1,000.00 | | | | | 1,000.10 | | | | | 1.56 | | | 0.31 | % | |
| | Class B Shares | | | | 1,000.00 | | | | | 1,000.10 | | | | | 1.51 | | | 0.30 | % | |
| | Class D Shares | | | | 1,000.00 | | | | | 1,000.10 | | | | | 1.56 | | | 0.31 | % | |
| | Class Y Shares | | | | 1,000.00 | | | | | 1,000.40 | | | | | 1.31 | | | 0.26 | % | |
Prime Money Market Fund | | Class A Shares | | | | 1,000.00 | | | | | 1,000.10 | | | | | 2.12 | | | 0.42 | % | |
| | Class B Shares | | | | 1,000.00 | | | | | 1,000.10 | | | | | 2.22 | | | 0.44 | % | |
| | Class C Shares | | | | 1,000.00 | | | | | 1,000.10 | | | | | 2.12 | | | 0.42 | % | |
| | Class D Shares | | | | 1,000.00 | | | | | 1,000.20 | | | | | 2.12 | | | 0.42 | % | |
| | Class I Shares | | | | 1,000.00 | | | | | 1,001.40 | | | | | 0.91 | | | 0.18 | % | |
| | Class Y Shares | | | | 1,000.00 | | | | | 1,000.80 | | | | | 1.41 | | | 0.28 | % | |
Tax-Free Money Market Fund | | Class A Shares | | | | 1,000.00 | | | | | 1,000.00 | | | | | 0.81 | | | 0.16 | % | |
| | Class D Shares | | | | 1,000.00 | | | | | 1,000.20 | | | | | 2.02 | | | 0.40 | % | |
| | Class Y Shares | | | | 1,000.00 | | | | | 1,001.40 | | | | | 0.91 | | | 0.18 | % | |
U.S. Government Money
Market Fund | | Class A Shares | | | | 1,000.00 | | | | | 1,000.10 | | | | | 1.81 | | | 0.36 | % | |
| | Class B Shares | | | | 1,000.00 | | | | | 1,000.10 | | | | | 1.66 | | | 0.33 | % | |
| | Class C Shares | | | | 1,000.00 | | | | | 1,000.10 | | | | | 1.76 | | | 0.35 | % | |
| �� | Class D Shares | | | | 1,000.00 | | | | | 1,000.10 | | | | | 1.81 | | | 0.36 | % | |
| | Class I Shares | | | | 1,000.00 | | | | | 1,000.90 | | | | | 1.06 | | | 0.21 | % | |
| | Class Y Shares | | | | 1,000.00 | | | | | 1,000.40 | | | | | 1.56 | | | 0.31 | % | |
U.S. Treasury Money Market Fund | | Class A Shares | | | | 1,000.00 | | | | | 1,000.10 | | | | | 1.01 | | | 0.20 | % | |
| | Class B Shares | | | | 1,000.00 | | | | | 1,000.10 | | | | | 1.01 | | | 0.20 | % | |
| | Class C Shares | | | | 1,000.00 | | | | | 1,000.10 | | | | | 1.01 | | | 0.20 | % | |
| | Class D Shares | | | | 1,000.00 | | | | | 1,000.10 | | | | | 1.01 | | | 0.20 | % | |
| | Class I Shares | | | | 1,000.00 | | | | | 1,000.30 | | | | | 0.81 | | | 0.16 | % | |
| | Class Y Shares | | | | 1,000.00 | | | | | 1,000.10 | | | | | 1.01 | | | 0.20 | % | |
| |
|
* | Expenses are equal to the average account value over the period multiplied by the Fund’s annualized expense ratio, multiplied by the number of days in the most recent fiscal half-year divided by the number of days in the fiscal year (to reflect the one half year period). |
| |
61 | HSBC INVESTOR FAMILY OF FUNDS |
|
HSBC INVESTOR FAMILY OF FUNDS |
|
Table of Shareholder Expenses—As of October 31, 2009 (Unaudited) (continued) |
Hypothetical Example for Comparison Purposes
The table below provides information about hypothetical account values and hypothetical expenses based on each Fund’s actual expense ratio and an assumed rate of return of 5% per year before expenses, which is not the Fund’s actual return. The hypothetical account values and expenses may not be used to estimate the actual ending account balance or expenses you paid for the period. You may use this information to compare this 5% hypothetical example with the 5% hypothetical examples that appear in the shareholder reports of other funds.
Please note that the expenses shown in the table are meant to highlight your ongoing costs only and do not reflect any transactional costs, such as sales charges (loads), redemption fees, or exchange fees. Therefore, the table is useful in comparing ongoing costs only, and will not help you determine the relative total costs of owning different funds. In addition, if these transactional costs were included, your costs would have been higher.
| | | | | | | | | | | | | | | | | | | | | |
| | | | Beginning
Account Value
5/1/09 | | Ending
Account Value
10/31/09 | | Expenses Paid
During Period*
5/1/09 – 10/31/09 | | Annualized
Expense Ratio
During Period
5/1/09 – 10/31/09 | |
| | | |
| |
| |
| |
| |
California Tax-Free Money
Market Fund | | Class A Shares | | | $ | 1,000.00 | | | | $ | 1,023.44 | | | | $ | 1.79 | | | 0.35 | % | |
| | Class D Shares | | | | 1,000.00 | | | | | 1,023.59 | | | | | 1.63 | | | 0.32 | % | |
| | Class Y Shares | | | | 1,000.00 | | | | | 1,023.79 | | | | | 1.43 | | | 0.28 | % | |
New York Tax-Free Money
Market Fund | | Class A Shares | | | | 1,000.00 | | | | | 1,023.64 | | | | | 1.58 | | | 0.31 | % | |
| | Class B Shares | | | | 1,000.00 | | | | | 1,023.69 | | | | | 1.53 | | | 0.30 | % | |
| | Class D Shares | | | | 1,000.00 | | | | | 1,023.64 | | | | | 1.58 | | | 0.31 | % | |
| | Class Y Shares | | | | 1,000.00 | | | | | 1,023.89 | | | | | 1.33 | | | 0.26 | % | |
Prime Money Market Fund | | Class A Shares | | | | 1,000.00 | | | | | 1,023.09 | | | | | 2.14 | | | 0.42 | % | |
| | Class B Shares | | | | 1,000.00 | | | | | 1,022.99 | | | | | 2.24 | | | 0.44 | % | |
| | Class C Shares | | | | 1,000.00 | | | | | 1,023.09 | | | | | 2.14 | | | 0.42 | % | |
| | Class D Shares | | | | 1,000.00 | | | | | 1,023.09 | | | | | 2.14 | | | 0.42 | % | |
| | Class I Shares | | | | 1,000.00 | | | | | 1,024.30 | | | | | 0.92 | | | 0.18 | % | |
| | Class Y Shares | | | | 1,000.00 | | | | | 1,023.79 | | | | | 1.43 | | | 0.28 | % | |
Tax-Free Money Market Fund | | Class A Shares | | | | 1,000.00 | | | | | 1,024.40 | | | | | 0.81 | | | 0.16 | % | |
| | Class D Shares | | | | 1,000.00 | | | | | 1,023.19 | | | | | 2.04 | | | 0.40 | % | |
| | Class Y Shares | | | | 1,000.00 | | | | | 1,024.30 | | | | | 0.92 | | | 0.18 | % | |
U.S. Government Money
Market Fund | | Class A Shares | | | | 1,000.00 | | | | | 1,023.39 | | | | | 1.84 | | | 0.36 | % | |
| | Class B Shares | | | | 1,000.00 | | | | | 1,023.54 | | | | | 1.68 | | | 0.33 | % | |
| | Class C Shares | | | | 1,000.00 | | | | | 1,023.44 | | | | | 1.79 | | | 0.35 | % | |
| | Class D Shares | | | | 1,000.00 | | | | | 1,023.39 | | | | | 1.84 | | | 0.36 | % | |
| | Class I Shares | | | | 1,000.00 | | | | | 1,024.15 | | | | | 1.07 | | | 0.21 | % | |
| | Class Y Shares | | | | 1,000.00 | | | | | 1,023.64 | | | | | 1.58 | | | 0.31 | % | |
U.S. Treasury Money Market Fund | | Class A Shares | | | | 1,000.00 | | | | | 1,024.20 | | | | | 1.02 | | | 0.20 | % | |
| | Class B Shares | | | | 1,000.00 | | | | | 1,024.20 | | | | | 1.02 | | | 0.20 | % | |
| | Class C Shares | | | | 1,000.00 | | | | | 1,024.20 | | | | | 1.02 | | | 0.20 | % | |
| | Class D Shares | | | | 1,000.00 | | | | | 1,024.20 | | | | | 1.02 | | | 0.20 | % | |
| | Class I Shares | | | | 1,000.00 | | | | | 1,024.40 | | | | | 0.82 | | | 0.16 | % | |
| | Class Y Shares | | | | 1,000.00 | | | | | 1,024.20 | | | | | 1.02 | | | 0.20 | % | |
| |
|
* | Expenses are equal to the average account value over the period multiplied by the Fund’s annualized expense ratio, multiplied by the number of days in the most recent fiscal half-year divided by the number of days in the fiscal year (to reflect the one half year period). |
| |
HSBC INVESTOR FAMILY OF FUNDS | 62 |
|
HSBC INVESTOR FAMILY OF FUNDS |
|
Board of Trustees and Officers (Unaudited) |
MANAGEMENT OF THE TRUST
The following table contains information regarding HSBC Investor Family of Funds Board of Trustees (“Trustees”). Asterisks indicate those Trustees who are “interested persons,” as defined in the Investment company act of 1940, as amended, of the HSBC Investor Family of Funds. The HSBC Investor Family of Funds’ Statement of Additional Information includes additional information about the Trustees and is available by calling (888) 525-5757.
| | | | | | | | | | |
Name, Address,
and Age | | Position(s) Held with
the HSBC Investor
Family of Funds | | Term of Office and
Length of Time Served
With the HSBC
Investor Family of Funds | | Principal Occupation(s)
During Past 5 Years | | Number of
Portfolios in Fund
Complex Overseen
By Trustee* | | Other
Directorships
Held by Trustee |
|
|
NON-INTERESTED
TRUSTEES | | | | | | | | |
| | | | | | | | | | |
Alan S. Parsow
P.O. Box 182845
Columbus, OH 43218
Age: 59 | | Trustee | | Indefinite: 1987
to present | | General Partner of Elkhorn Partners, L.P. (A private investment partnership) (since 1989) | | 36 | | Penn Treaty American Corporation (insurance) |
|
Larry M. Robbins
P.O. Box 182845
Columbus, OH 43218
Age: 70 | | Trustee | | Indefinite: 1987
to present | | Private Investor (2007-present); Director, Center for Teaching and Learning, University of Pennsylvania (1999-2007) | | 36 | | None |
|
Michael Seely
P.O. Box 182845
Columbus, OH 43218
Age: 64 | | Trustee | | Indefinite: 1987
to present | | Private Investor (2003-present); Global Multi Manager Partners (1999-2003); President of Investor Access Corporation (1981-2003) | | 36 | | None |
|
Thomas F. Robards
P.O. Box 182845
Columbus, OH 43218
Age: 63 | | Trustee | | Indefinite: March 2005
to present | | Partner, Robards & Co. LLC (2005-present); Chief Financial Officer, American Museum of Natural History (2003-2004) | | 36 | | Overseas Shipholding Group (energy transportation); Ellington Financial LLC (financial services); Big Apple Circus (entertainment) |
|
Susan S. Huang
P.O. Box 182845
Columbus, OH 43218
Age: 55 | | Trustee | | Indefinite: June 2008
to present | | Investment Consultant, self employed (2001 to present); Senior Vice President, Schroeder Investment Management (2001-2004) | | 36 | | United Church Federation; Huntington’s Disease Society; Second Congregational Church (Greenwich) Endowment, Inc. |
|
Marcia L. Beck
P.O. Box 182845
Columbus, OH 43218
Age: 54 | | Trustee | | Indefinite: June 2008
to present | | Private Investor (June 1999 to present) | | 36 | | None |
|
| | | | | | | | | | |
INTERESTED TRUSTEES | | | | | | | | |
| | | | | | | | | | |
Stephen J. Baker**
P.O. Box 182845
Columbus, OH 43218
Age: 53 | | Trustee | | Indefinite: 2004
to present | | Chief Executive Officer, HSBC Global Asset Management (USA) Inc., and Executive Vice President, HSBC (USA), N.A. (2003 to present); Chief Executive Officer, HSBC Asset Management (Canada) Limited (1998 to 2003) | | 36 | | None |
|
| |
* | Includes the Funds and the underlying Portfolios for the HSBC Investor Family of Funds with a master/feeder structure. |
| |
** | Mr. Baker is an “interested person” of the HSBC Investor Family of Funds, as defined by the 1940 Act, due to his employment with the Investment Adviser. |
| |
63 | HSBC INVESTOR FAMILY OF FUNDS |
|
HSBC INVESTOR FAMILY OF FUNDS |
|
Board of Trustees and Officers (Unaudited) (continued) |
The names of the officers, their addresses, ages, position(s) held with the Trust, and principal occupation(s) during the past five years are described in the table below.
| | | | | | |
Name, Address,
and Age | | Position(s) Held with
the HSBC Investor
Family of Funds | | Term of Office and
Length of Time Served
With the HSBC Investor
Family of Funds | | Principal Occupation(s)
During Past 5 Years |
|
Richard A. Fabietti
452 Fifth Avenue
New York, NY 10018
Age: 51 | | President | | Indefinite: March 2004
to present | | Senior Vice President, Head of Product Management, HSBC Global Asset Management (USA) Inc. (1998 to present) |
|
Elba L. Vasquez
452 Fifth Avenue
New York, NY 10018
Age: 47 | | Vice President | | Indefinite: March 2006
to present | | Vice President of Product Administration, HSBC Global Asset Management (USA) Inc. (2005 to present); Vice President of Client Services, Citi Fund Services Ohio, Inc. (1996 to 2005) |
|
|
|
|
|
|
|
Martin R. Dean*
3435 Stelzer Road
Columbus, OH 43219-3035
Age: 46 | | Treasurer | | Indefinite: October 2009
to present | | Senior Vice President of Citi Fund Services |
|
|
|
|
|
|
|
Jennifer A. English*
100 Summer Street
Suite 1500
Boston, MA 02110
Age: 37 | | Secretary | | Indefinite: 2008
to present | | Senior Vice President, Regulatory Administration, Citi Fund Services (2005 – present); Assistant Vice President and Assistant Counsel, PFPC, Inc. (2002-2005) |
|
|
|
|
|
|
|
F. Martin Fox*
100 Summer Street
Suite 1500
Boston, MA 02110
Age: 46 | | Assistant Secretary | | Indefinite: 2008
to present | | Assistant Vice President, Regulatory Administration, Citi Fund Services (May 2008 – present); Contract Attorney, Update Legal LLC (2002 – 2008) |
|
|
|
|
|
|
|
Frederick J. Schmidt*
1 RexCorp Plaza
Uniondale, NY 11556
Age: 50 | | Chief
Compliance Officer | | Term expires 2009;
2004 to present | | Senior Vice President and Chief Compliance Officer, CCO Services Group, Global Transaction Services of Citi Fund Services (2004 to present) |
|
|
|
|
|
|
|
| |
* | Messrs. Dean, Fox and Schmidt and Ms. English also are officers of certain other investment companies of which Citi (or an affiliate) is the administrator or sub-administrator. |
| |
HSBC INVESTOR FAMILY OF FUNDS | 64 |
Other Information:
A description of the policies and procedures that the Funds use to determine how to vote proxies relating to the portfolio securities is available without charge, upon request, by calling 1-800-525-5757 for HSBC Bank USA and HSBC Brokerage (USA) Inc. clients and 1-800-782-8183 for all other shareholders or on the Fund’s website at www.investorfunds.us.hsbc.com and the Securities and Exchange Commission’s (“Commission”) website at http://www.sec.gov. A copy of the Fund’s voting record for the most recent 12 month period ending June 30 is available at the Commission’s website at http://www.sec.gov.
Schedules of Portfolio Investments for fiscal quarters ending January 31 and July 31 will be available no later than 60 days after each period end, without charge, on the Fund’s website at www.investorfunds.us.hsbc.com and on the Commission’s website at http://www.sec.gov.
An investment in a Fund is not a deposit of HSBC Bank USA, National Association, and is not insured or guaranteed by the Federal Deposit Insurance Corporation or any other government agency.
| |
65 | HSBC INVESTOR FAMILY OF FUNDS |
| | |
HSBC INVESTOR FAMILY OF FUNDS: | | CUSTODIAN |
| | The Northern Trust Company |
INVESTMENT ADVISER AND ADMINISTRATOR | | 50 South LaSalle Street |
HSBC Global Asset Management (USA) Inc. | | Chicago, IL 60603 |
452 Fifth Avenue | | |
New York, NY 10018 | | INDEPENDENT REGISTERED |
| | PUBLIC ACCOUNTING FIRM |
SHAREHOLDER SERVICING AGENTS | | KPMG LLP |
For HSBC Bank USA, N.A. and | | 191 West Nationwide Blvd. |
HSBC Securities (USA) Inc. Clients: | | Suite 500 |
HSBC Bank USA, N.A. | | Columbus, OH 43215 |
452 Fifth Avenue | | |
New York, NY 10018 | | LEGAL COUNSEL |
1-888-525-5757 | | Dechert LLP |
| | 1775 I Street, N.W. |
For All Other Shareholders: | | Washington, D.C. 20006 |
HSBC Investor Funds | | |
P.O. Box 182845 | | |
Columbus, OH 43218-2845 | | |
1-800-782-8183 | | |
| | |
TRANSFER AGENT | | |
Citi Fund Services | | |
3435 Stelzer Road | | |
Columbus, OH 43219 | | |
| | |
DISTRIBUTOR | | |
Foreside Distribution Services, L.P. | | |
690 Taylor Road, Suite 150 | | |
Gahanna, Ohio 43230-3202 | | |


The HSBC Investor Family of Funds are distributed by Foreside Distribution Services, L.P. This document must be preceded or accompanied by a current prospectus for the HSBC Investor Funds, which you should read carefully before you invest or send money.
— NOT FDIC INSURED — NO BANK GUARANTEE — MAY LOSE VALUE

HSBC Global Asset Management (USA) Inc.
October 31, 2009
HSBC Investor LifeLine Funds
Annual Report
HSBC Investor Aggressive Growth Strategy Fund
HSBC Investor Growth Strategy Fund
HSBC Investor Moderate Growth Strategy Fund
HSBC Investor Conservative Growth Strategy Fund
|
Table of Contents |
|
|
HSBC Investor Lifeline Funds
Annual Report - October 31, 2009 |
(This Page Intentionally Left Blank)
Barclays Capital Intermediate U.S. Aggregate Index is an unmanaged index generally representative of investment-grade issues with maturities between three- and ten-years.
Barclays Capital U.S. Aggregate Bond Index is an unmanaged index generally representative of investment-grade fixed-rate debt issues, including government, corporate, asset-backed, and mortgage-backed securities, with maturities of at least one year.
Barclays Capital U.S. Corporate High-Yield Bond Index is an unmanaged index that covers the USD-denominated, non-investment grade, fixed-rate, taxable corporate bond market. Securities are classified as high-yield if the middle rating of Moody’s, Fitch, and S&P is Ba1/BB+/BB+ or below. The index excludes Emerging Markets debt.
Barclays Capital U.S. Corporate High-Yield Bond Index, 2% Capped is an unmanaged market value-weighted index which covers the universe of fixed rate, non-investment grade debt.
Citigroup U.S. Domestic Three Month Treasury Bill Index is an unmanaged index of three-month Treasury bills.
Citigroup U.S. High Yield Market Capped Index, the “U.S. High Yield Market Capped Index” uses the U.S. High-Yield Market Index as its foundation, imposing a cap on the par amount of each issuer in order to limit the impact of large issuers while retaining the characteristics of the issuer’s distribution across different maturities. The U.S. High-Yield Market Index is an index that captures the performance of below-investments-grade debt issued by corporations domiciled in the United States or Canada.
Gross Domestic Product (GDP) is the measure of the market value of the goods and services produced by labor and property in the United States.
The Group of 20 (G-20) Finance Ministers and Central Bank Governors was established in 1999 to bring together systemically important industrialized and developing economies to discuss key issues in the global economy.
The MSCI EAFE Index (Europe, Australasia, Far East) which is a free float-adjusted market capitalization index that is designed to measure developed market equity performance, excluding the U.S. & Canada. The MSCI EAFE Index currently consists of the following 21 developed market country indices: Australia, Austria, Belgium, Denmark, Finland, France, Germany, Greece, Hong Kong, Ireland, Italy, Japan, the Netherlands, New Zealand, Norway, Portugal, Singapore, Spain, Sweden, Switzerland and the United Kingdom.
MSCI Emerging Markets Index is a market capitalization weighted index composed of companies representative of the market structure of 26 emerging market countries in Europe, Latin America, and the Pacific Basin.
Russell 1000® Growth Index is an unmanaged index which measures the performance of the large-cap growth segment of the U.S. equity universe. It includes those Russell 1000 companies with higher price-to-book ratios and higher forecasted growth values.
Russell 1000® Value Index is an unmanaged index which measures the performance of the large-cap value segment of the U.S. equity universe. It includes those Russell 1000 companies with lower price-to-book ratios and lower expected growth values.
Russell 2000® Index is an unmanaged index which measures the performance of the small-cap segment of the U.S. equity universe. The Russell 2000® Index is a subset of the Russell 3000® Index representing approximately 10% of the total market capitalization of that index. It includes approximately 2000 of the smallest securities based on a combination of their market cap and current index membership.
Russell 2500™ Growth Index is an unmanaged index which measures the performance of the small- to mid-cap growth segment of the U.S. equity universe. It includes those Russell 2500 companies with higher price-to-book ratios and higher forecasted growth values.
Standard & Poor’s 500 Index (“S&P 500”) is an unmanaged index that is widely regarded as a gauge of the U.S. equities market, this index includes 500 leading companies in leading industries of the U.S. economy. The S&P 500 focuses on the large cap segment of the market, with approximately 75% coverage of U.S. equities.
Securities indexes assume reinvestment of all distributions and interest payments and do not take in account brokerage fees or expenses. Securities in the Funds do not match those in the indexes and performance of the Funds will differ. Investors cannot invest directly in an index.
| | |
| HSBC INVESTOR FAMILY OF FUNDS | 3 |
December 18, 2009
To Our Shareholders:
It is a pleasure to report on a challenging, but fruitful year.
Since money market funds comprise the vast majority of the HSBC Investor Funds family assets, we have focused especially closely on events in the credit markets over the past year, hallmarked by the freezing of the commercial paper market in the wake of the Lehman bankruptcy and the September 15, 2008 “breaking of the buck” by The Reserve Fund, and the ultra-low short-term interest yields which prevail as a result of unprecedented fiscal and monetary stimulus.
Throughout the year, the Board of Trustees and the Funds’ Adviser have sought to ensure that all of the HSBC Investor money market funds appropriately managed their liquidity and risk. Each of the money market funds, with the exception of the US Treasury Money Market Fund, participated in the US Treasury Temporary Guarantee Program for Money Market Funds, which provided insurance against loss on investments in covered money market funds. This program expired on September 18, 2009, with no claims made by any money market funds.
The Adviser also instituted minimum yields on each of the money market funds which required the Adviser and shareholder servicing agents to waive significant portions of their fees to sustain a competitive yield.
HSBC’s Investor Funds include long-term funds, which we expect to grow in number, expanding your choices within the fund group. The Board, with input from HSBC’s competitively-distinguishing Multimanager analytical team, regularly reviews these funds’ investment performance in great detail. From time to time, we change sub-advisors and believe that the Board’s consistent and careful scrutiny has contributed to the funds’ generally excellent long-term performance. Information about this performance is included in the commentaries from the portfolio managers within this annual report.
To better fulfill our responsibilities, the Board has redesigned our committee structure; it now consists of: Audit, Contracts and Expense, Valuation and Investment Oversight, and Nominating and Corporate Governance committees. All independent trustees are members of these “committees of the whole”, which are chaired by a different member of the Board. I might add that our board had perfect attendance at all meetings last year—including telephone meetings.
There is much talk in the mutual fund industry of regulatory change. We monitor these trends, and our funds’ compliance, very carefully. In connection with this responsibility, the board invited a senior staff member of the U.S. Securities and Exchange Commission to discuss the regulatory environment and possible future developments.
Regulatory change may come from the judiciary as well. The U.S. Supreme Court recently heard arguments about how mutual fund fees are set—a case known as Jones v. Harris Associates. The plaintiff seeks to supplant the rule under which mutual funds have operated since 1982—the so-called Gartenberg standard which gives boards considerable discretion in establishing advisory fees. As you know, there are over 7,000 funds in the US, a number that assures vigorous competition—one reason US fund fees are the lowest in the world. A Wall Street Journal editorial (November 3, 2009) noted: “The Jones suit is a culmination of the plaintiffs bar assault on mutual funds that began earlier this decade and seeks to achieve via judicial fiat what it hasn’t been able to accomplish in legislation. Let’s hope the high Court shuts them down.” It would be a great disservice to fund investors if the tort bar were to prevail in this case.
Our fund family has shown rapid growth in recent years, and we thank you for the confidence you’ve placed in us. On behalf of the Board of Trustees and Advisory staff, we pledge our very best effort to making the future a good one for our shareholders.
Cordially,

Michael Seely
Chairperson, HSBC Investor Funds
| | |
4 | HSBC INVESTOR FAMILY OF FUNDS | |
Dear Shareholder,
Welcome to the HSBC Investor Funds annual report, covering the period between November 1, 2008 and October 31, 2009. This report offers detailed information about your funds’ results, from investment operations and composition. We encourage you to review it carefully.
Inside these pages you will find a letter from the Funds’ Chairman, as well as commentary from the portfolio managers discussing the investment markets and explaining the primary reasons each fund performed as it did. The report also includes each fund’s return during the 12-month period, as well as the performance of its benchmark index and peer group average. We believe the HSBC Investor Funds have provided their shareholders with competitive returns.
In closing, we want to thank you for investing through the HSBC Investor Funds. We recognize that the past year has presented challenges for many investors, and we appreciate and honor the trust you place in us. Please contact us at any time with questions or concerns.
Sincerely,

Richard A. Fabietti
President
| | |
| HSBC INVESTOR FAMILY OF FUNDS | 5 |
|
Commentary From the Investment Manager |
|
HSBC Global Asset Management (USA) Inc. |
U.S. Economic Review
The 12-month period between November 1, 2008 and October 31, 2009 began with the U.S. economy in severe recession and the financial system suffering from a major credit crunch.
The federal government took unprecedented steps to try to restore the economy and financial system to health. The Federal Reserve Board in December reduced the federal funds rate, its target short-term interest rate, from 1.00% to a range between 0.00% and 0.25%, and also took a wide range of other actions to inject liquidity and improve confidence in the system. The government also enacted a massive fiscal stimulus package. All told, the U.S. government and Federal Reserve committed a total of $12.8 trillion, an amount nearly equal to 2008 gross domestic product1. Governments around the world took similar steps: For example, the G-20 group1 of nations agreed to a $1.1 trillion program through which the International Monetary Fund would help countries afflicted by the global crisis to boost economic activity.
Leading economic indicators began showing signs of improvement during the second quarter of 2009. Credit spreads declined, the housing market’s descent slowed and survey data turned up. The economy continued to regain its footing throughout the period. Unemployment continued to rise, however, as is typical in the end stages of recession.
The U.S. economy contracted at an annualized rate of 5.4% during the fourth calendar quarter of 2008. It fell 6.4% and 0.7% in the first and second quarters of 2009, respectively, before recovering to grow 2.8% during the third quarter of 2009.
Market Review
Investors during the first four months of the period responded to the financial crisis by fleeing assets perceived as risky. Higher-risk assets generally fared worst during this time, with emerging markets stocks, small caps and high-yield bonds posting some of the largest losses. Assets considered safe and stable, particularly bonds backed by the U.S. government, produced the best returns.
The market environment changed dramatically beginning in early 2009. As the financial system and economy began showing signs of stabilizing, investors moved quickly back into risk assets. Between March 9 and the end of the reporting period the stock market posted a powerful rebound, with the S&P 5001 gaining roughly 55.31%. For the period as a whole the S&P 500 returned 9.80%, while the small-cap Russell 2000®, 1 gained 6.46%.
Foreign stocks on the whole declined considerably through early March, then surged to produce strong returns for the 12-month period. Foreign currencies’ strength against the dollar further boosted the gains of U.S. investors’ international holdings. Japan’s market did not keep pace with other major markets: It generated a 10.62% gain in U.S. dollar terms—and just a 2.05% return in local currency—as its economic recovery proved anemic.
During the rally investors especially favored shares in emerging markets, which in many cases offered more-attractive macroeconomic backdrops than developed countries. The MSCI EAFE Index1 of developed foreign stock markets gained 28.41% in U.S. dollar terms during the period under review, while the MSCI Emerging Markets Index1 gained 64.63%.
Investors in the fixed-income markets began the period fleeing to the most conservative and secure types of securities, particularly Treasury bills. The rally in government debt was so extreme that Treasury bills briefly offered negative yields. Meanwhile, investors sold bonds not backed by the federal government. That environment caused spreads between yields on Treasuries and other types of debt to widen to historic levels.
Conditions in the fixed-income markets changed dramatically during 2009. As the financial crisis began to recede, investors sought the greater yield available on higher-risk debt securities. Corporate bonds, in particular high-yield bonds, staged a strong rally. The Barclays Capital U.S. Aggregate Bond Index1, which tracks the broad fixed-income market, returned 13.79% for the 12 months through October, while the Barclays Capital U.S. Corporate High-Yield Bond Index1 returned 48.10%.
| |
1 | For additional information, please refer to the Glossary of Terms. |
| | |
6 | HSBC INVESTOR FAMILY OF FUNDS | |
|
Portfolio Reviews |
|
HSBC Investor Aggressive Growth Strategy Fund |
HSBC Investor Growth Strategy Fund |
HSBC Investor Moderate Growth Strategy Fund |
HSBC Investor Conservative Growth Strategy Fund |
Investment Concerns
Common stocks, and funds investing in common stocks, generally provide greater return potential when compared with other types of investments.
Equity securities (stocks) are more volatile and carry more risk than other forms of investments, including investments in high-grade fixed income securities.
The net asset value per share of this Fund will fluctuate as the value of the securities in the portfolio changes.
There are risks associated with investing in foreign companies, such as erratic market conditions, economic and political instability and fluctuations in currency and exchange rates.
Value-based investments are subject to the risk that the broad market may not recognize their intrinsic value.
Smaller companies generally have a higher risk of failure and historically have experienced a greater degree of market volatility than average.
Bonds can offer a relatively stable level of income, although bond prices will fluctuate providing the potential for principal gain or loss. Intermediate-term, higher-quality bonds generally offer less risk and a lower rate of return than longer-term bonds.
The mortgage market in the U.S. recently experienced difficulties that may adversely affect the performance and market value of certain mortgage-related investments.
The risks associated with higher-yielding, lower-rated securities (commonly called junk bonds) include higher risk of default and loss of principal.
Investing in derivatives, such as financial futures and option contracts, and the use of foreign currency techniques involve special risks and as such may not achieve the anticipated benefits and/or may result in losses to the fund.
Investments in commodities may be affected by changes in overall market movements, commodity index volatility, changes in interest rates or factors affecting a particular industry or commodity.
Alternative investments such as hedge funds are subject to less regulation than other types of pooled investment vehicles such as mutual funds, may make speculative investments, may be illiquid and can involve a significant use of leverage, making them substantially riskier than the other investments. An alternative investment fund may incur high fees and expenses which would offset trading profits.
Interest rate movements and mortgage prepayments will affect the fund’s share price and yield.
An investment in money market funds is not insured or guaranteed by the FDIC or any other government agency, although the money market funds seek to preserve the value of your investment at $1.00.
The HSBC Investor Funds feature a number of funds that are structured as “funds of funds”. Under this two-tier structure, one fund (the “funds of funds”) invests in multiple underlying funds (the “Underlying Funds”). The LifeLine Funds, through this funds of funds structure, provide an asset allocation option to investors who seek to diversify their investment across a variety of asset classes. Each LifeLine Fund provides an asset allocation option corresponding to different investment objectives and risk tolerances. Each LifeLine Fund is a fund of funds. HSBC Global Asset Management (USA) Inc. (the “Investment Adviser”), according to specific target allocations, invested each LifeLine Fund’s assets in some or all of the following underlying funds: HSBC Investor Growth Portfolio (“Growth Portfolio”); HSBC Investor Value Portfolio (“Value Portfolio”); HSBC Investor Opportunity Portfolio (“Small Cap Equity Portfolio”); HSBC Investor International Equity Portfolio (“International Equity Portfolio”); Franklin Total Return Fund; Goldman Sachs High Yield Fund; and the HSBC Investor Money Market Fund (“Money Market Fund”).
| | |
| HSBC INVESTOR FAMILY OF FUNDS | 7 |
During the last period, each LifeLine Fund invested in a different combination of the Underlying Funds according to the various target percentage weightings selected by the Investment Adviser, approximately as set forth in the table below.
| | | | | | | | | | | | | |
Asset Class | | HSBC Investor
Aggressive Growth
Strategy
Fund | | HSBC Investor
Growth
Strategy
Fund | | HSBC Investor
Moderate Growth
Strategy
Fund | | HSBC Investor
Conservative Growth
Strategy
Fund | |
|
|
|
|
|
|
|
|
|
|
Large Cap Growth | | 21 | % | | 21 | % | | 19 | % | | 15 | % | |
|
|
|
|
|
|
|
|
|
|
|
|
|
|
Large Cap Value | | 21 | % | | 21 | % | | 18 | % | | 14 | % | |
|
|
|
|
|
|
|
|
|
|
|
|
|
|
Small-Cap | | 34 | % | | 20 | % | | 11 | % | | 4 | % | |
|
|
|
|
|
|
|
|
|
|
|
|
|
|
International Equity | | 23 | % | | 20 | % | | 15 | % | | 10 | % | |
|
|
|
|
|
|
|
|
|
|
|
|
|
|
Fixed Income | | None | | | 15 | % | | 26 | % | | 28 | % | |
|
|
|
|
|
|
|
|
|
|
|
|
|
|
High Yield Fixed Income | | None | | | 2 | % | | 5 | % | | 8 | % | |
|
|
|
|
|
|
|
|
|
|
|
|
|
|
Money Market | | 1 | % | | 1 | % | | 6 | % | | 21 | % | |
|
|
|
|
|
|
|
|
|
|
|
|
|
|
Total: | | 100 | % | | 100 | % | | 100 | % | | 100 | % | |
|
|
|
|
|
|
|
|
|
|
|
|
|
|
| |
8 | HSBC INVESTOR FAMILY OF FUNDS |
(This Page Intentionally Left Blank)
|
Portfolio Reviews |
|
|
HSBC Investor Aggressive Growth Strategy Fund |
| | | | | | | | | | | | | | | | |
Fund Performance | | | | Average Annual
Total Return (%) | | Expense
Ratio (%)4 | |
|
|
|
|
|
|
|
|
As of October 31, 2009 | | Inception
Date | | 1
Year | | 3
Year | | Since
Inception | | Gross | | Net | |
|
|
|
|
|
|
|
|
|
|
|
|
|
|
HSBC Investor Aggressive Growth Strategy Fund Class A1 | | 2/14/05 | | 12.46 | | -6.33 | | 0.78 | | | | 1.98 | | | 1.50 | |
|
|
|
|
|
|
|
|
|
|
|
|
|
|
|
|
|
HSBC Investor Aggressive Growth Strategy Fund Class B2 | | 2/9/05 | | 13.52 | | -6.02 | | 1.19 | | | | 2.73 | | | 2.25 | |
|
|
|
|
|
|
|
|
|
|
|
|
|
|
|
|
|
HSBC Investor Aggressive Growth Strategy Fund Class C3 | | 6/10/05 | | 16.40 | | -5.38 | | 1.25 | | | | 2.73 | | | 2.25 | |
|
|
|
|
|
|
|
|
|
|
|
|
|
|
|
|
|
Standard & Poor’s 500 Index7 | | — | | 9.80 | | -7.02 | | -0.67 | 5 | | | N/A | | | N/A | |
|
|
|
|
|
|
|
|
|
|
|
|
|
|
|
|
|
Aggressive Growth Blended Portfolio Index7, 8 | | — | | 17.44 | | -5.75 | | 1.07 | 6 | | | N/A | | | N/A | |
|
|
|
|
|
|
|
|
|
|
|
|
|
|
|
|
|
Past performance does not guarantee future results. The performance data quoted represents past performance and current returns may be lower or higher. Total return figures include change in share price, reinvestment of dividends and capital gains and do not reflect the taxes that a shareholder would pay on fund distributions or on the redemption of fund shares. The investment return and principal value will fluctuate so that an investor’s shares, when redeemed may be worth more or less than the original cost. To obtain performance information current to the most recent month end, please call 1-800-782-8183.
The performance above reflects any fee waivers that have been in effect during the applicable periods, as well as any expense reimbursements that have periodically been made. Absent such waivers and reimbursements, returns would have been lower. Currently, contractual fee waivers are in effect from March 1, 2009 through March 1, 2010.
During the periods ended October 31, 2008 and October 31, 2009, one or more Underlying Funds in which the Fund invests received monies related to certain nonrecurring litigation settlements. Without the receipt of these payments, the returns for the applicable periods would be lower.
| |
1 | Reflects the maximum sales charge of 5.00%. |
| |
2 | Reflects the applicable contingent deferred sales charge, maximum of 4.00%. |
| |
3 | Reflects the applicable contingent deferred sales charge, maximum of 1.00%. |
| |
4 | Reflects the expense ratio as reported in the prospectus dated February 27, 2009. |
| |
5 | Return for the period 2/9/05 to 10/31/09. |
| |
6 | Return for the period 2/1/05 to 10/31/09. |
| |
7 | For additional information, please refer to the description of the components of the Aggressive Growth Blended Portfolio index on the next page and to the Glossary of Terms. |
| |
8 | The performance of the HSBC Investor Aggressive Growth Strategy Fund is compared to an Aggressive Growth Blended Portfolio Index, which is a hypothetical combination of broad-based indexes. These indexes are unmanaged and do not reflect the fees and expenses associated with a mutual fund, and investors cannot directly invest in an index. |
| |
10 | HSBC INVESTOR FAMILY OF FUNDS |
|
Portfolio Reviews |
|
HSBC Investor Aggressive Growth Strategy Fund (continued) |
Value of a $10,000 Investment |
|
The charts above represent a comparison of a hypothetical $10,000 investment in the indicated share class versus a similar investment in the Fund’s benchmark and represents the reinvestment of dividends and capital gains in the Fund. The hypothetical performance for the above benchmarks are for the period beginning 1/31/05.
Past performance does not guarantee future results. The performance data quoted represents past performance and current returns may be lower or higher. Total return figures include change in share price, reinvestment of dividends and capital gains and do not reflect the taxes that a shareholder would pay on fund distributions or on the redemption of fund shares. The investment return and principal value will fluctuate so that an investor’s shares, when redeemed may be worth more or less than the original cost. To obtain performance information current to the most recent month end, please call 1-800-782-8183.
The performance above reflects any fee waivers that have been in effect during the applicable periods, as well as any expense reimbursements that have periodically been made. Absent such waivers and reimbursements, returns would have been lower. Currently, contractual fee waivers are in effect from March 1, 2009 through March 1, 2010.
During the periods ended October 31, 2008 and October 31, 2009, one or more Underlying Funds in which the Fund invests received monies related to certain nonrecurring litigation settlements. Without the receipt of these payments, the returns for the applicable periods would be lower.
| |
1 | Reflects the applicable contingent deferred sales charge, maximum of 4.00%. |
| |
2 | The performance of the HSBC Investor Aggressive Growth Strategy Fund is compared to an Aggressive Growth Blended Portfolio index, which is a hypothetical combination of broad-based indexes. The components of the Aggressive Growth Blended Portfolio index and their weighting as of October 31, 2009 are as follows: |
| | | | |
Asset Allocation | | Benchmark3 | | |
|
|
|
|
|
Large Cap Growth | | Russell 2500™ Growth Index | 34.0 | % |
International Equity | | MSCI EAFE Index | 23.0 | % |
Small-Cap | | Russell 1000® Growth Index | 21.0 | % |
Large Cap Value | | Russell 1000® Value Index | 21.0 | % |
Money Market | | Citigroup U.S. Domestic 3-Month U.S. Treasury Bill Index | 1.0 | % |
|
|
|
|
|
| |
3 | For additional information, please refer to the Glossary of Terms. |
| |
HSBC INVESTOR FAMILY OF FUNDS | 11 |
|
Portfolio Reviews |
|
HSBC Investor Growth Strategy Fund |
| | | | | | | | | | | | | | |
Fund Performance | | | | Average Annual
Total Return (%) | | Expense
Ratio (%)4 | |
|
|
|
|
|
|
|
|
As of October 31, 2009 | | Inception
Date | | 1
Year | | 3
Year | | Since
Inception | | Gross | | Net | |
|
|
|
|
|
|
|
|
|
|
|
|
|
|
|
HSBC Investor Growth Strategy Fund Class A1 | | 2/8/05 | | 12.77 | | -4.94 | | 1.48 | | | 1.53 | | 1.50 | |
|
|
|
|
|
|
|
|
|
|
|
|
|
|
|
HSBC Investor Growth Strategy Fund Class B2 | | 2/1/05 | | 13.80 | | -4.64 | | 2.05 | | | 2.28 | | 2.25 | |
|
|
|
|
|
|
|
|
|
|
|
|
|
|
|
HSBC Investor Growth Strategy Fund Class C3 | | 4/27/05 | | 16.81 | | -4.01 | | 2.26 | | | 2.28 | | 2.25 | |
|
|
|
|
|
|
|
|
|
|
|
|
|
|
|
Standard & Poor’s 500 Index7 | | — | | 9.80 | | -7.02 | | -0.67 | 5 | | N/A | | N/A | |
|
|
|
|
|
|
|
|
|
|
|
|
|
|
|
Growth Blended Portfolio Index7, 8 | | — | | 17.34 | | -3.59 | | 1.92 | 6 | | N/A | | N/A | |
|
|
|
|
|
|
|
|
|
|
|
|
|
|
|
Past performance does not guarantee future results. The performance data quoted represents past performance and current returns may be lower or higher. Total return figures include change in share price, reinvestment of dividends and capital gains and do not reflect the taxes that a shareholder would pay on fund distributions or on the redemption of fund shares. The investment return and principal value will fluctuate so that an investor’s shares, when redeemed may be worth more or less than the original cost. To obtain performance information current to the most recent month end, please call 1-800-782-8183.
The performance above reflects any fee waivers that have been in effect during the applicable periods, as well as any expense reimbursements that have periodically been made. Absent such waivers and reimbursements, returns would have been lower. Currently, contractual fee waivers are in effect from March 1, 2009 through March 1, 2010.
During the periods ended October 31, 2007, October 31, 2008 and October 31, 2009, one or more Underlying Funds in which the Fund invests received monies related to certain nonrecurring litigation settlements. Without the receipt of these payments, the returns for the applicable periods would be lower.
| |
1 | Reflects the maximum sales charge of 5.00%. |
| |
2 | Reflects the applicable contingent deferred sales charge, maximum of 4.00%. |
| |
3 | Reflects the applicable contingent deferred sales charge, maximum of 1.00%. |
| |
4 | Reflects the expense ratio as reported in the prospectus dated February 27, 2009. |
| |
5 | Return for the period 1/31/05 to 10/31/09. |
| |
6 | Return for the period 2/1/05 to 10/31/09. |
| |
7 | For additional information, please refer to the description of the components of the Growth Blended Portfolio index on the next page and to the Glossary of Terms. |
| |
8 | The performance of the HSBC Investor Growth Strategy Fund is compared to a Growth Blended Portfolio Index, which is a hypothetical combination of broad-based indexes. These indexes are unmanaged and do not reflect the fees and expenses associated with a mutual fund, and investors cannot directly invest in an index. The stated performance for the Growth Blended Portfolio Index from April 30, 2006 to February 28, 2008 reflects a 2% allocation for the Merrill Lynch U.S. High Yield Master II Index. On February 29, 2008, the Merrill Lynch U.S. High Yield Master II Index was replaced with the Citigroup U.S. High Yield Market Capped Index. Due to the liquidation of the HSBC Investor High Yield Fixed Income Portfolio, the underlying high yield index was changed from the Citigroup U.S. High Yield Market Capped Index to the Barclays Capital U.S. Corp HY Bond Index, 2% Capped, on March 31, 2009. |
| |
12 | HSBC INVESTOR FAMILY OF FUNDS |
|
Portfolio Reviews |
|
HSBC Investor Growth Strategy Fund (continued) |
Value of a $10,000 Investment |
|
The charts above represent a comparison of a hypothetical $10,000 investment in the indicated share class versus a similar investment in the Fund’s benchmark and represents the reinvestment of dividends and capital gains in the Fund. The hypothetical performance for the above benchmarks are for the period beginning 1/31/05.
Past performance does not guarantee future results. The performance data quoted represents past performance and current returns may be lower or higher. Total return figures include change in share price, reinvestment of dividends and capital gains and do not reflect the taxes that a shareholder would pay on fund distributions or on the redemption of fund shares. The investment return and principal value will fluctuate so that an investor’s shares, when redeemed may be worth more or less than the original cost. To obtain performance information current to the most recent month end, please call 1-800-782-8183.
The performance above reflects any fee waivers that have been in effect during the applicable periods, as well as any expense reimbursements that have periodically been made. Absent such waivers and reimbursements, returns would have been lower. Currently, contractual fee waivers are in effect from March 1, 2009 through March 1, 2010.
During the periods ended October 31, 2007, October 31, 2008 and October 31, 2009 one or more Underlying Funds in which the Fund invests received monies related to certain nonrecurring litigation settlements. Without the receipt of these payments, the returns for the applicable periods would be lower.
| |
1 | Reflects the applicable contingent deferred sales charge, maximum of 4.00%. |
| |
2 | The performance of the HSBC Investor Growth Strategy Fund is compared to a Blended Portfolio Index, which is a hypothetical combination of broad-based indexes. The components of the Growth Blended Portfolio Index and their weighting as of October 31, 2009 are as follows: |
| | | | |
Asset Allocation | | Benchmark3 | | |
|
|
|
|
|
Large Cap Growth | | Russell 1000® Growth Index | 21.0 | % |
Large Cap Value | | Russell 1000® Value Index | 21.0 | % |
International Equity | | MSCI EAFE Index | 20.0 | % |
Small-Cap | | Russell 2500TM Growth Index | 20.0 | % |
Fixed Income | | Barclays Capital U.S. Aggregate Bond Index | 15.0 | % |
High Yield Fixed Income | | Barclays Capital U.S. Corporate High Yield Bond Index, 2% Capped | 2.0 | % |
Money Market | | Citigroup U.S. Domestic 3-Month U.S. Treasury Bill Index | 1.0 | % |
|
|
|
|
|
| |
3 | For additional information, please refer to the Glossary of Terms. |
The stated performance for the Growth Blended Portfolio Index from April 30, 2006 to February 28, 2008 reflects a 2% allocation for the Merrill Lynch U.S. High Yield Master II Index. On February 29, 2008, the Merrill Lynch U.S. High Yield Master II Index was replaced with the Citigroup U.S. High Yield Market Capped Index. Due to the liquidation of the HSBC Investor High Yield Fixed Income Portfolio, the underlying high yield index was changed from the Citigroup U.S. High Yield Market Capped Index to Barclays Capital U.S. Corp HY Bond Index, 2% Capped, on March 31, 2009.
| |
HSBC INVESTOR FAMILY OF FUNDS | 13 |
|
Portfolio Reviews |
|
HSBC Investor Moderate Growth Strategy Fund |
| | | | | | | | | | | | | | |
Fund Performance | | | | Average Annual
Total Return (%) | | Expense
Ratio (%)4 | |
|
|
|
|
|
|
|
|
As of October 31, 2009 | | Inception
Date | | 1
Year | | 3
Year | | Since
Inception | | Gross | | Net | |
|
|
|
|
|
|
|
|
|
|
|
|
|
|
HSBC Investor Moderate Growth Strategy Fund Class A1 | | 2/3/05 | | 11.72 | | -3.46 | | 1.45 | | | 1.48 | | 1.48 | |
|
|
|
|
|
|
|
|
|
|
|
|
|
|
|
HSBC Investor Moderate Growth Strategy Fund Class B2 | | 2/1/05 | | 12.85 | | -3.11 | | 1.92 | | | 2.23 | | 2.23 | |
|
|
|
|
|
|
|
|
|
|
|
|
|
|
|
HSBC Investor Moderate Growth Strategy Fund Class C3 | | 6/10/05 | | 15.75 | | -2.50 | | 1.60 | | | 2.23 | | 2.23 | |
|
|
|
|
|
|
|
|
|
|
|
|
|
|
|
Standard & Poor’s 500 Index7 | | — | | 9.80 | | -7.02 | | -0.67 | 5 | | N/A | | N/A | |
|
|
|
|
|
|
|
|
|
|
|
|
|
|
|
Moderate Growth Blended Portfolio Index7, 8 | | — | | 16.78 | | -1.39 | | 2.67 | 6 | | N/A | | N/A | |
|
|
|
|
|
|
|
|
|
|
|
|
|
|
|
Past performance does not guarantee future results. The performance data quoted represents past performance and current returns may be lower or higher. Total return figures include change in share price, reinvestment of dividends and capital gains and do not reflect the taxes that a shareholder would pay on fund distributions or on the redemption of fund shares. The investment return and principal value will fluctuate so that an investor’s shares, when redeemed may be worth more or less than the original cost. To obtain performance information current to the most recent month end, please call 1-800-782-8183.
The performance above reflects any fee waivers that have been in effect during the applicable periods, as well as any expense reimbursements that have periodically been made. Absent such waivers and reimbursements, returns would have been lower. Currently, contractual fee waivers are in effect from March 1, 2009 through March 1, 2010.
During the periods ended October 31, 2007, October 31, 2008 and October 31, 2009, one or more Underlying Funds in which the Fund invests received monies related to certain nonrecurring litigation settlements. Without the receipt of these payments, the returns for the applicable periods would be lower.
| |
1 | Reflects the maximum sales charge of 5.00%. |
| |
2 | Reflects the applicable contingent deferred sales charge, maximum of 4.00%. |
| |
3 | Reflects the applicable contingent deferred sales charge, maximum of 1.00%. |
| |
4 | Reflects the expense ratio as reported in the prospectus dated February 27, 2009. |
| |
5 | Return for the period 1/31/05 to 10/31/09. |
| |
6 | Return for the period 2/1/05 to 10/31/09. |
| |
7 | For additional information, please refer to the description of the components of the Moderate Growth Blended Portfolio index on the next page and to the Glossary of Terms. |
| |
8 | The performance of the HSBC Investor Moderate Growth Strategy Fund is compared to a Moderate Growth Blended Portfolio Index, which is a hypothetical combination of broad-based indexes. These indexes are unmanaged and do not reflect the fees and expenses associated with a mutual fund, and investors cannot directly invest in an index. The stated performance for the Moderate Growth Blended Index from April 30, 2006 to February 28, 2008 reflects a 5% allocation for the Merrill Lynch U.S. High Yield Master II Index. On February 29, 2008, the Merrill Lynch U.S. High Yield Master II Index was replaced with the Citigroup U.S. High Yield Market Capped Index. Due to the liquidation of the HSBC Investor High Yield Fixed Income Portfolio, the underlying high yield index was changed from the Citigroup U.S. High Yield Market Capped Index to the Barclays Capital U.S. Corp HY Bond Index, 2% Capped, on March 31, 2009. |
| |
14 | HSBC INVESTOR FAMILY OF FUNDS |
|
Portfolio Reviews |
|
HSBC Investor Moderate Growth Strategy Fund (continued) |
Value of a $10,000 Investment |
|
The charts above represent a comparison of a hypothetical $10,000 investment in the indicated share class versus a similar investment in the Fund’s benchmark and represents the reinvestment of dividends and capital gains in the Fund. The hypothetical performance for the above benchmarks are for the period beginning 1/31/05.
Past performance does not guarantee future results. The performance data quoted represents past performance and current returns may be lower or higher. Total return figures include change in share price, reinvestment of dividends and capital gains and do not reflect the taxes that a shareholder would pay on fund distributions or on the redemption of fund shares. The investment return and principal value will fluctuate so that an investor’s shares, when redeemed may be worth more or less than the original cost. To obtain performance information current to the most recent month end, please call 1-800-782-8183.
The performance above reflects any fee waivers that have been in effect during the applicable periods, as well as any expense reimbursements that have periodically been made. Absent such waivers and reimbursements, returns would have been lower. Currently, contractual fee waivers are in effect from March 1, 2009 through March 1, 2010.
During the periods ended October 31, 2007, October 31, 2008 and October 31, 2009, one or more Underlying Funds in which the Fund invests received monies related to certain nonrecurring litigation settlements. Without the receipt of these payments, the returns for the applicable periods would be lower.
| |
1 | Reflects the applicable contingent deferred sales charge, maximum of 4.00%. |
| |
2 | The performance of the HSBC Investor Moderate Growth Strategy Fund is compared to a Moderate Growth Blended Portfolio Index, which is a hypothetical combination of broad-based indexes. The components of the Moderate Growth Blended Portfolio Index and their weighting as of October 31, 2009 are as follows: |
| | | | | |
Asset Allocation | | Benchmark3 | | | |
|
|
|
|
|
|
Fixed Income | | Barclays Capital U.S. Aggregate Bond Index | | 26.0% | |
Large Cap Growth | | Russell 1000® Growth Index | | 19.0% | |
Large Cap Value | | Russell 1000® Value Index | | 18.0% | |
International Equity | | MSCI EAFE Index | | 15.0% | |
Small-Cap | | Russell 2500TM Index | | 11.0% | |
Money Market | | Citigroup U.S. Domestic 3-Month U.S. Treasury Bill Index | | 6.0% | |
High Yield Fixed Income | | Barclays Capital U.S. Corporate High Yield Bond Index, 2% Capped | | 5.0% | |
|
|
|
|
|
|
| |
3 | For additional information, please refer to the Glossary of Terms. |
The stated performance for the Moderate Growth Blended Index from April 30, 2006 to February 28, 2008 reflects a 5% allocation for the Merrill Lynch U.S. High Yield Master II Index. On February 29, 2008, the Merrill Lynch U.S. High Yield Master II Index was replaced with the Citigroup U.S. High Yield Market Capped Index. Due to the liquidation of the HSBC Investor High Yield Fixed Income Portfolio, the underlying high yield index was changed from the Citigroup U.S. High Yield Market Capped Index to Barclays Capital U.S. Corp HY Bond Index, 2% Capped, on March 31, 2009.
| |
HSBC INVESTOR FAMILY OF FUNDS | 15 |
|
Portfolio Reviews |
|
HSBC Investor Conservative Growth Strategy Fund |
| | | | | | | | | | | | | | |
Fund Performance | | | | Average Annual
Total Return (%) | | Expense
Ratio (%)4 | |
|
|
|
|
|
|
|
|
As of October 31, 2009 | | Inception
Date | | 1
Year | | 3
Year | | Since
Inception | | Gross | | Net | |
|
|
|
|
|
|
|
|
|
|
|
|
|
|
HSBC Investor Conservative Growth Strategy Fund Class A1 | | 2/23/05 | | 9.15 | | -2.00 | | 1.45 | | | 1.72 | | 1.50 | |
|
|
|
|
|
|
|
|
|
|
|
|
|
|
|
HSBC Investor Conservative Growth Strategy Fund Class B2 | | 2/17/05 | | 10.05 | | -1.64 | | 1.72 | | | 2.47 | | 2.25 | |
|
|
|
|
|
|
|
|
|
|
|
|
|
|
|
HSBC Investor Conservative Growth Strategy Fund Class C3 | | 4/19/05 | | 12.97 | | -0.90 | | 2.35 | | | 2.47 | | 2.25 | |
|
|
|
|
|
|
|
|
|
|
|
|
|
|
|
Standard & Poor’s 500 Index7 | | — | | 9.80 | | -7.02 | | -1.05 | 5 | | N/A | | N/A | |
|
|
|
|
|
|
|
|
|
|
|
|
|
|
|
Conservative Growth Blended Portfolio Index7, 8 | | — | | 14.64 | | 0.50 | | 3.25 | 6 | | N/A | | N/A | |
|
|
|
|
|
|
|
|
|
|
|
|
|
|
|
Past performance does not guarantee future results. The performance data quoted represents past performance and current returns may be lower or higher. Total return figures include change in share price, reinvestment of dividends and capital gains and do not reflect the taxes that a shareholder would pay on fund distributions or on the redemption of fund shares. The investment return and principal value will fluctuate so that an investor’s shares, when redeemed may be worth more or less than the original cost. To obtain performance information current to the most recent month end, please call 1-800-782-8183.
The performance above reflects any fee waivers that have been in effect during the applicable periods, as well as any expense reimbursements that have periodically been made. Absent such waivers and reimbursements, returns would have been lower. Currently, contractual fee waivers are in effect from March 1, 2009 through March 1, 2010.
During the periods October 31, 2007, October 31, 2008 and October 31, 2009, one or more Underlying Funds in which the Fund invests received monies related to certain nonrecurring litigation settlements. Without the receipt of these payments, the returns for the applicable periods would be lower.
| |
1 | Reflects the maximum sales charge of 5.00%. |
| |
2 | Reflects the applicable contingent deferred sales charge, maximum of 4.00%. |
| |
3 | Reflects the applicable contingent deferred sales charge, maximum of 1.00%. |
| |
4 | Reflects the expense ratio as reported in the prospectus dated February 27, 2009. |
| |
5 | Return for the period 2/17/05 to 10/31/09. |
| |
6 | Return for the period 2/1/05 to 10/31/09. |
| |
7 | For additional information, please refer to the description of the components of the Conservative Growth Blended Portfolio index on the next page and to the Glossary of Terms. |
| |
8 | The performance of the HSBC Investor Conservative Growth Strategy Fund is compared to a Conservative Growth Blended Portfolio index, which is a hypothetical combination of broad-based indexes. These indexes are unmanaged and do not reflect the fees and expenses associated with a mutual fund, and investors cannot directly invest in an index. The stated performance for the Conservative Growth Blended Portfolio index from April 30, 2006 to February 28, 2008 reflects an 8% allocation for the Merrill Lynch U.S. High Yield Master II Index. On February 29, 2008, the Merrill Lynch U.S. High Yield Master II Index was replaced with the Citigroup U.S. High Yield Market Capped Index. Due to the liquidation of the HSBC Investor High Yield Fixed Income Portfolio, the underlying high yield index was changed from the Citigroup U.S. High Yield Market Capped Index to the Barclays Capital U.S. Corp HY Bond Index, 2% Capped, on March 31, 2009. |
| |
16 | HSBC INVESTOR FAMILY OF FUNDS |
|
Portfolio Reviews |
|
HSBC Investor Conservative Growth Strategy Fund (continued) |
Value of a $10,000 Investment |
|
The charts above represent a comparison of a hypothetical $10,000 investment in the indicated share class versus a similar investment in the Fund’s benchmark and represents the reinvestment of dividends and capital gains in the Fund. The hypothetical performance for the above benchmarks are for the period beginning 1/31/05.
Past performance does not guarantee future results. The performance data quoted represents past performance and current returns may be lower or higher. Total return figures include change in share price, reinvestment of dividends and capital gains and do not reflect the taxes that a shareholder would pay on fund distributions or on the redemption of fund shares. The investment return and principal value will fluctuate so that an investor’s shares, when redeemed may be worth more or less than the original cost. To obtain performance information current to the most recent month end, please call 1-800-782-8183.
The performance above reflects any fee waivers that have been in effect during the applicable periods, as well as any expense reimbursements that have periodically been made. Absent such waivers and reimbursements, returns would have been lower. Currently, contractual fee waivers are in effect from March 1, 2009 through March 1, 2010.
During the periods October 31, 2007, October 31, 2008 and October 31, 2009, one or more Underlying Funds in which the Fund invests received monies related to certain nonrecurring litigation settlements. Without the receipt of these payments, the returns for the applicable periods would be lower.
| |
1 | Reflects the applicable contingent deferred sales charge, maximum of 4.00%. |
| |
2 | The performance of the HSBC Investor Conservative Growth Strategy Fund is compared to a Conservative Growth Blended Portfolio index, which is a hypothetical combination of broad-based indexes. The components of the Conservative Growth Blended Portfolio index and their weighting as of October 31, 2009 are as follows: |
| | | | | |
Asset Allocation | | Benchmark3 | | | |
|
|
|
|
|
|
Fixed Income | | Barclays Capital U.S. Aggregate Bond Index | | 25.0% | |
|
|
|
|
|
|
Money Market | | Citigroup U.S. Domestic 3-Month U.S. Treasury Bill Index | | 21.0% | |
|
|
|
|
|
|
Large Cap Growth | | Russell 1000® Growth Index | | 15.0% | |
|
|
|
|
|
|
Large Cap Value | | Russell 1000® Value Index | | 14.0% | |
|
|
|
|
|
|
International Equity | | MSCI EAFE Index | | 10.0% | |
|
|
|
|
|
|
High Yield Fixed Income | | Barclays Capital U.S. Corporate High Yield Bond Index, 2% Capped | | 8.0% | |
|
|
|
|
|
|
Small-Cap | | Russell 2500TM Growth Index | | 4.0% | |
|
|
|
|
|
|
Fixed Income | | Barclays Capital U.S. Intermediate Aggregate Bond Index | | 3.0% | |
|
|
|
|
|
|
| |
3 | For additional information, please refer to the Glossary of Terms. |
The stated performance for the Conservative Growth Blended Portfolio Index from April 30, 2006 to February 28, 2008 reflects an 8% allocation for the Merrill Lynch U.S. High Yield Master II Index. On February 29, 2008, the Merrill Lynch U.S. High Yield Master II Index was replaced with the Citigroup U.S. High Yield Market Capped Index. Due to the liquidation of the HSBC Investor High Yield Fixed Income Portfolio, the underlying high yield index was changed from the Citigroup U.S. High Yield Market Capped Index to Barclays Capital U.S. Corp HY Bond Index, 2% Capped, on March 31, 2009.
| |
HSBC INVESTOR FAMILY OF FUNDS | 17 |
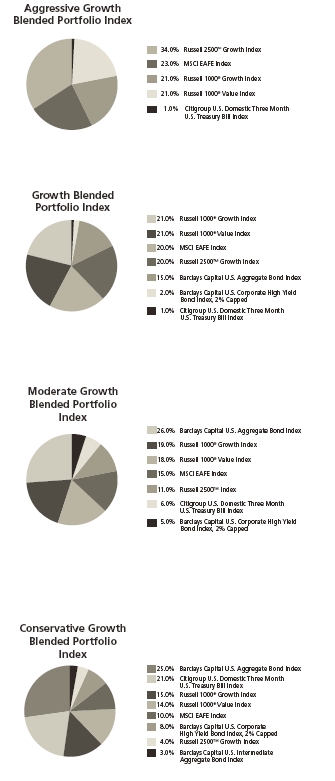
| | | | |
|
|
|
|
|
Standardized Performance Benchmark Indices for the
period ended October 31, 2009 | | 1
Year (%) | |
|
|
|
|
|
Barclays Capital Intermediate U.S. Aggregate Index | | | 12.39 | |
Barclays Capital U.S. Corporate High Yield Bond Index, 2% Capped | | | 48.66 | |
Barclays Capital U.S. Aggregate Bond Index | | | 13.79 | |
Citigroup U.S. Domestic Three Month U.S. Treasury Bill Index | | | 0.28 | |
MSCI EAFE Index | | | 28.41 | |
Russell 1000® Growth Index | | | 17.51 | |
Russell 1000® Value Index | | | 4.78 | |
Russell 2500™ Growth Index | | | 18.21 | |
Barclays Capital Intermediate U.S. Aggregate Index (formerly Lehman Brothers U.S. Intermediate Aggregate Index) is an unmanaged index generally representative of investment-grade issues with maturities between three- and ten-years.
Barclays Capital U.S. Aggregate Bond Index (formerly Lehman Brothers U.S. Aggregate Index) is an unmanaged index generally representative of investment-grade fixed-rate debt issues, including government, corporate, asset-backed, and mortgage-backed securities, with maturities of at least one year.
Barclays Capital U.S. Corporate High Yield Bond Index, 2% Capped covers the universe of U.S. dollar denominated, non-convertible, fixed rate, non-investment grade debt. Index holdings must have at least one year to final maturity, at least $150 million par amount outstanding, and be publicly issued with a rating of Ba1 or lower. The Index is a total return performance benchmark for fixed income securities having a maximum quality rating of Ba1 (as determined by Moody’s Investors Service). The Index is unmanaged and the figures for the Index do not include any deduction for fees, expenses or taxes. It is not possible to invest directly in an unmanaged index.
Citigroup U.S. Domestic Three Month Treasury Bill Index is an unmanaged index of three-month Treasury bills.
The MSCI EAFE Index (Europe, Australasia, Far East) which is a free float-adjusted market capitalization index that is designed to measure developed market equity performance, excluding the U.S. & Canada. The MSCI EAFE Index currently consists of the following 21 developed market country indices: Australia, Austria, Belgium, Denmark, Finland, France, Germany, Greece, Hong Kong, Ireland, Italy, Japan, the Netherlands, New Zealand, Norway, Portugal, Singapore, Spain, Sweden, Switzerland and the United Kingdom.
Russell 1000® Growth Index is an unmanaged index which measures the performance of the large-cap growth segment of the U.S. equity universe. It includes those Russell 1000 companies with higher price-to-book ratios and higher forecasted growth values.
Russell 1000® Value Index is an unmanaged index which measures the performance of the large-cap value segment of the U.S. equity universe. It includes those Russell 1000 companies with lower price-to-book ratios and lower expected growth values.
Russell 2500™ Growth Index is an unmanaged index which measures the performance of the small- to mid-cap growth segment of the U.S. equity universe. It includes those Russell 2500 companies with higher price-to-book ratios and higher forecasted growth values.
Investors cannot invest directly in an index.
| |
18 | HSBC INVESTOR FAMILY OF FUNDS |
|
HSBC INVESTOR LIFELINE FUNDS |
|
Schedules of Portfolio Investments—As of October 31, 2009 |
| | | | | | | |
HSBC INVESTOR AGGRESSIVE GROWTH STRATEGY FUND | | | | | | | |
|
|
|
|
|
|
|
|
| | | | | | | |
| | Shares | | Value ($) | |
| |
| |
| |
Investment Companies – 100.9% | | | | | | | |
| | | | | | | |
Affiliated Investment Companies – 100.9% | | | | | | | |
HSBC Investor Growth Portfolio | | | | | | 1,995,639 | |
HSBC Investor International Equity Portfolio | | | | | | 2,192,711 | |
HSBC Investor Opportunity Portfolio | | | | | | 3,269,782 | |
HSBC Investor Value Portfolio | | | | | | 2,018,514 | |
HSBC Investor Prime Money Market Fund – Class I Shares, 0.12% (a) | | | 94,361 | | | 94,361 | |
| | | | |
|
| |
TOTAL INVESTMENTS – 100.9%* | | | | | | 9,571,007 | |
| | | | |
|
| |
| | | | | | | |
|
* Percentages indicated are based on net assets of $9,482,289. | | | | | | | |
| | | | | | | |
HSBC INVESTOR GROWTH STRATEGY FUND | | | | | | | |
|
|
|
|
|
|
|
|
| | | | | | | |
| | Shares | | Value ($) | |
| |
| |
| |
Investment Companies – 100.5% | | | | | | | |
| | | | | | | |
Affiliated Investment Companies – 83.4% | | | | | | | |
HSBC Investor Growth Portfolio | | | | | | 5,866,416 | |
HSBC Investor International Equity Portfolio | | | | | | 5,604,940 | |
HSBC Investor Opportunity Portfolio | | | | | | 5,654,037 | |
HSBC Investor Value Portfolio | | | | | | 5,933,586 | |
HSBC Investor Prime Money Market Fund – Class I Shares, 0.12% (a) | | | 280,464 | | | 280,464 | |
| | | | |
|
| |
| | | | | | 23,339,443 | |
| | | | |
|
| |
Unaffiliated Investment Companies – 17.1% | | | | | | | |
Goldman Sachs High Yield Fund – Class I Shares | | | 81,938 | | | 562,785 | |
Franklin Total Return Fund, Advisor Class | | | 437,059 | | | 4,236,095 | |
| | | | |
|
| |
| | | | | | 4,798,880 | |
| | | | |
|
| |
TOTAL INVESTMENTS – 100.5%* | | | | | | 28,138,323 | |
| | | | |
|
| |
| |
|
* | Percentages indicated are based on net assets of $28,007,326. |
| | | | | | | |
HSBC INVESTOR MODERATE GROWTH STRATEGY FUND | | | | | | | |
|
|
| | Shares | | Value ($) | |
| |
| |
| |
Investment Companies – 100.0% | | | | | | | |
| | | | | | | |
Affiliated Investment Companies – 68.9% | | | | | | | |
HSBC Investor Growth Portfolio | | | | | | 5,966,860 | |
HSBC Investor International Equity Portfolio | | | | | | 4,725,863 | |
HSBC Investor Opportunity Portfolio | | | | | | 3,495,961 | |
HSBC Investor Value Portfolio | | | | | | 5,717,753 | |
HSBC Investor Prime Money Market Fund – Class I Shares, 0.12% (a) | | | 1,900,737 | | | 1,900,737 | |
| | | | |
|
| |
| | | | | | 21,807,174 | |
| | | | |
|
| |
| | | | | | | |
Unaffiliated Investment Companies – 31.1% | | | | | | | |
Goldman Sachs High Yield Fund – Class I Shares | | | 230,247 | | | 1,581,542 | |
Franklin Total Return Fund, Advisor Class | | | 851,556 | | | 8,253,809 | |
| | | | |
|
| |
| | | | | | 9,835,351 | |
| | | | |
|
| |
TOTAL INVESTMENTS – 100.0%* | | | | | | 31,642,525 | |
| | | | |
|
| |
| |
|
* | Percentages indicated are based on net assets of $31,627,460. |
| | | | | | | |
| | | | | | | |
HSBC INVESTOR CONSERVATIVE GROWTH STRATEGY FUND | | | | | | | |
|
|
|
|
|
|
|
|
| | | | | | | |
| | Shares | | Value ($) | |
| |
| |
| |
Investment Companies – 99.9% | | | | | | | |
| | | | | | | |
Affiliated Investment Companies – 63.9% | | | | | | | |
HSBC Investor Growth Portfolio | | | | | | 1,552,990 | |
HSBC Investor International Equity Portfolio | | | | | | 1,038,645 | |
HSBC Investor Opportunity Portfolio | | | | | | 419,096 | |
HSBC Investor Value Portfolio | | | | | | 1,466,064 | |
HSBC Investor Prime Money Market Fund – Class I Shares, 0.12% (a) | | | 2,193,545 | | | 2,193,545 | |
| | | | |
|
| |
| | | | | | 6,670,340 | |
| | | | |
|
| |
| | | | | | | |
Unaffiliated Investment Companies – 36.0% | | | | | | | |
Goldman Sachs High Yield Fund – Class I Shares | | | 121,428 | | | 834,248 | |
Franklin Total Return Fund, Advisor Class | | | 302,309 | | | 2,930,460 | |
| | | | |
|
| |
| | | | | | 3,764,708 | |
| | | | |
|
| |
TOTAL INVESTMENTS – 99.9%* | | | | | | 10,435,048 | |
| | | | |
|
| |
| |
|
* | Percentages indicated are based on net assets of $10,450,322. |
(a) | The rate represents the annualized one-day yield that was in effect on October 31, 2009. |
| | |
See notes to financial statements. | HSBC INVESTOR LIFELINE FUNDS | 19 |
HSBC INVESTOR LIFELINE FUNDS
Statements of Assets and Liabilities—As of October 31, 2009
| | | | | | | | | | | | | |
| | Aggressive
Growth
Strategy Fund | | Growth
Strategy
Fund | | Moderate
Growth
Strategy Fund | | Conservative
Growth
Strategy Fund | |
|
Assets: | | | | | | | | | | | | | |
Investments in Affiliated Portfolios | | $ | 9,476,646 | | $ | 23,058,979 | | $ | 19,906,437 | | $ | 4,476,795 | |
Investments in Affiliated Fund, at value (a) | | | 94,361 | | | 280,464 | | | 1,900,737 | | | 2,193,545 | |
Investments in non-affiliates, at value | | | — | | | 4,798,880 | | | 9,835,351 | | | 3,764,708 | |
| |
|
| |
|
| |
|
| |
|
| |
Total Investments | | | 9,571,007 | | | 28,138,323 | | | 31,642,525 | | | 10,435,048 | |
| |
|
| |
|
| |
|
| |
|
| |
Receivable for capital shares issued | | | 12,598 | | | 52,624 | | | 81,109 | | | 42,031 | |
Reclaims receivable | | | 5,262 | | | 18,471 | | | 14,844 | | | 857 | |
Receivable from Investment Adviser | | | 3,112 | | | 1,188 | | | 1,375 | | | 456 | |
Prepaid expenses and other assets | | | 6,060 | | | 4,461 | | | 6,799 | | | 2,780 | |
| |
|
| |
|
| |
|
| |
|
| |
Total Assets | | | 9,598,039 | | | 28,215,067 | | | 31,746,652 | | | 10,481,172 | |
| |
|
| |
|
| |
|
| |
|
| |
| | | | | | | | | | | | | �� |
Liabilities: | | | | | | | | | | | | | |
Payable for capital shares redeemed | | | 97,506 | | | 148,743 | | | 59,005 | | | 6,172 | |
Payable to Investment Adviser | | | — | | | 12,552 | | | 574 | | | 5,416 | |
Accrued expenses and other liabilities: | | | | | | | | | | | | | |
Investment Management | | | 423 | | | 1,229 | | | 1,375 | | | 456 | |
Administration | | | 160 | | | 467 | | | 522 | | | 173 | |
Distribution | | | 2,695 | | | 8,404 | | | 10,249 | | | 3,499 | |
Shareholder Servicing | | | 2,117 | | | 6,147 | | | 6,873 | | | 2,279 | |
Compliance Services | | | 4 | | | 10 | | | 13 | | | 5 | |
Transfer Agent | | | 8,608 | | | 12,529 | | | 17,494 | | | 7,023 | |
Trustee | | | 21 | | | 56 | | | 61 | | | 20 | |
Other | | | 4,216 | | | 17,604 | | | 23,026 | | | 5,807 | |
| |
|
| |
|
| |
|
| |
|
| |
Total Liabilities | | | 115,750 | | | 207,741 | | | 119,192 | | | 30,850 | |
| |
|
| |
|
| |
|
| |
|
| |
Net Assets | | $ | 9,482,289 | | $ | 28,007,326 | | $ | 31,627,460 | | $ | 10,450,322 | |
| |
|
| |
|
| |
|
| |
|
| |
| | | | | | | | | | | | | |
Composition of Net Assets: | | | | | | | | | | | | | |
Capital | | $ | 11,634,898 | | $ | 33,183,413 | | $ | 36,405,296 | | $ | 11,687,690 | |
Accumulated net investment income (loss) | | | — | | | 122,678 | | | 46,429 | | | 11,295 | |
Accumulated net realized gains (losses) from investment and foreign currency transactions | | | (2,117,413 | ) | | (5,490,016 | ) | | (5,444,840 | ) | | (1,542,679 | ) |
Unrealized appreciation/depreciation from investments and foreign currencies | | | (35,196 | ) | | 191,251 | | | 620,575 | | | 294,016 | |
| |
|
| |
|
| |
|
| |
|
| |
Net Assets | | $ | 9,482,289 | | $ | 28,007,326 | | $ | 31,627,460 | | $ | 10,450,322 | |
| |
|
| |
|
| |
|
| |
|
| |
| | | | | | | | | | | | | |
Net Assets: | | | | | | | | | | | | | |
Class A Shares | | $ | 5,426,304 | | $ | 15,304,013 | | $ | 15,909,337 | | $ | 5,058,675 | |
Class B Shares | | | 3,767,179 | | | 11,196,342 | | | 14,229,931 | | | 4,906,623 | |
Class C Shares | | | 288,806 | | | 1,506,971 | | | 1,488,192 | | | 485,024 | |
| |
|
| |
|
| |
|
| |
|
| |
| | $ | 9,482,289 | | $ | 28,007,326 | | $ | 31,627,460 | | $ | 10,450,322 | |
| |
|
| |
|
| |
|
| |
|
| |
| | | | | | | | | | | | | |
Shares Outstanding | | | | | | | | | | | | | |
($0.001 par value, unlimited number of shares authorized): | | | | | | | | | | | | | |
Class A Shares | | | 531,871 | | | 1,480,708 | | | 1,577,412 | | | 505,597 | |
Class B Shares | | | 382,169 | | | 1,085,931 | | | 1,411,366 | | | 495,278 | |
Class C Shares | | | 29,311 | | | 145,613 | | | 151,236 | | | 47,637 | |
| | | | | | | | | | | | | |
Net Asset Value, Offering Price and Redemption Price per share: | | | | | | | | | | | | | |
Class A Shares | | $ | 10.20 | | $ | 10.34 | | $ | 10.09 | | $ | 10.01 | |
Class B Shares* | | $ | 9.86 | | $ | 10.31 | | $ | 10.08 | | $ | 9.91 | |
Class C Shares* | | $ | 9.85 | | $ | 10.35 | | $ | 9.84 | | $ | 10.18 | |
Maximum Sales Charge — Class A Shares | | | 5.00 | % | | 5.00 | % | | 5.00 | % | | 5.00 | % |
| |
|
| |
|
| |
|
| |
|
| |
Maximum Offering Price per share (Net Asset Value/ (100% — maximum sales charge)) — Class A Shares | | $ | 10.74 | | $ | 10.88 | | $ | 10.62 | | $ | 10.54 | |
| |
|
| |
|
| |
|
| |
|
| |
Investments in Affiliated Fund, at cost (a) | | $ | 94,361 | | $ | 280,464 | | $ | 1,900,737 | | $ | 2,193,545 | |
| |
|
| |
|
| |
|
| |
|
| |
Investments in non-affiliates, at cost | | $ | — | | $ | 4,519,390 | | $ | 9,176,781 | | $ | 3,470,446 | |
| |
|
| |
|
| |
|
| |
|
| |
| |
|
* | Redemption Price per share varies by length of time shares are held. |
| |
(a) | The investment in the affiliated fund is the HSBC Investor Prime Money Market Fund Class I Shares (See Note 1). |
| | |
20 | HSBC INVESTOR LIFELINE FUNDS | See notes to financial statements. |
HSBC INVESTOR LIFELINE FUNDS
Statements of Operations—For the year ended October 31, 2009
| | | | | | | | | | | | | |
| | Aggressive
Growth
Strategy Fund | | Growth
Strategy
Fund | | Moderate
Growth
Strategy Fund | | Conservative
Growth
Strategy Fund | |
|
Investment Income: | | | | | | | | | | | | | |
Investment income from non-affiliates | | $ | — | | $ | 66,516 | | $ | 153,930 | | $ | 70,899 | |
Investment income from Affiliated Portfolios (a) | | | 134,185 | | | 518,819 | | | 658,866 | | | 212,191 | |
Investment income from Affiliated Fund | | | 2,174 | | | 1,470 | | | 10,536 | | | 12,514 | |
Tax reclaims from Affiliated Portfolios (a) | | | 2,312 | | | 8,309 | | | 6,883 | | | 619 | |
Foreign tax withholding from Affiliated Portfolios (a) | | | (9,832 | ) | | (25,623 | ) | | (22,135 | ) | | (5,191 | ) |
Expenses from Affiliated Portfolios (a) | | | (64,641 | ) | | (178,518 | ) | | (180,290 | ) | | (50,165 | ) |
| |
|
| |
|
| |
|
| |
|
| |
Total Investment Income (Loss) | | | 64,198 | | | 390,973 | | | 627,790 | | | 240,867 | |
| |
|
| |
|
| |
|
| |
|
| |
| | | | | | | | | | | | | |
Expenses: | | | | | �� | | | | | | | | |
Investment Management | | | 4,054 | | | 12,186 | | | 13,903 | | | 4,804 | |
Administration: | | | | | | | | | | | | | |
Class A Shares | | | 900 | | | 2,629 | | | 2,741 | | | 932 | |
Class B Shares | | | 622 | | | 1,869 | | | 2,413 | | | 854 | |
Class C Shares | | | 56 | | | 249 | | | 263 | | | 86 | |
Distribution: | | | | | | | | | | | | | |
Class B Shares | | | 23,946 | | | 71,910 | | | 92,768 | | | 32,852 | |
Class C Shares | | | 2,152 | | | 9,615 | | | 10,089 | | | 3,308 | |
Shareholder Servicing: | | | | | | | | | | | | | |
Class A Shares | | | 11,548 | | | 33,696 | | | 35,155 | | | 11,938 | |
Class B Shares | | | 7,992 | | | 23,998 | | | 30,963 | | | 10,957 | |
Class C Shares | | | 720 | | | 3,207 | | | 3,368 | | | 1,103 | |
Accounting | | | 18,998 | | | 18,999 | | | 18,998 | | | 18,999 | |
Compliance Services | | | 38 | | | 111 | | | 129 | | | 45 | |
Printing | | | 8,514 | | | 23,369 | | | 31,626 | | | 11,419 | |
Professional | | | 179 | | | 540 | | | 637 | | | 226 | |
Transfer Agent | | | 45,360 | | | 67,279 | | | 73,136 | | | 36,606 | |
Trustee | | | 122 | | | 362 | | | 415 | | | 142 | |
Registration fees | | | 10,130 | | | 8,021 | | | 12,926 | | | 4,767 | |
Other | | | 1,228 | | | 6,433 | | | 7,258 | | | 2,636 | |
| |
|
| |
|
| |
|
| |
|
| |
Total expenses before fee reductions | | | 136,559 | | | 284,473 | | | 336,788 | | | 141,674 | |
Fees reduced by Investment Adviser | | | (53,311 | ) | | (15,434 | ) | | (13,903 | ) | | (11,396 | ) |
| |
|
| |
|
| |
|
| |
|
| |
Net Expenses | | | 83,248 | | | 269,039 | | | 322,885 | | | 130,278 | |
| |
|
| |
|
| |
|
| |
|
| |
Net Investment Income (Loss) | | | (19,050 | ) | | 121,934 | | | 304,905 | | | 110,589 | |
| |
|
| |
|
| |
|
| |
|
| |
Net Realized/Unrealized Gains (Losses) from Investments: | | | | | | | | | | | | | |
Net realized losses from investments and foreign currency transactions (a) | | | (1,143,628 | ) | | (3,229,403 | ) | | (3,394,340 | ) | | (1,012,633 | ) |
Net realized gains (losses) from non-affiliates investment transactions | | | — | | | 10,119 | | | 36,466 | | | 38,780 | |
Change in unrealized appreciation/depreciation from Affiliated Portfolios investments and foreign currencies (a) | | | 2,619,167 | | | 7,079,125 | | | 6,981,433 | | | 1,942,126 | |
Change in unrealized appreciation/depreciation from non-affiliates investments | | | — | | | 261,420 | | | 619,542 | | | 277,995 | |
| |
|
| |
|
| |
|
| |
|
| |
Net realized/unrealized gains from investments and foreign currency transactions | | | 1,475,539 | | | 4,121,261 | | | 4,243,101 | | | 1,246,268 | |
| |
|
| |
|
| |
|
| |
|
| |
Change In Net Assets Resulting From Operations | | $ | 1,456,489 | | $ | 4,243,195 | | $ | 4,548,006 | | $ | 1,356,857 | |
| |
|
| |
|
| |
|
| |
|
| |
| |
|
(a) | Represents amounts allocated from the respective Affiliated Portfolios. |
| | |
See notes to financial statements. | HSBC INVESTOR LIFELINE FUNDS | 21 |
HSBC INVESTOR LIFELINE FUNDS
Statements of Changes in Net Assets
| | | | | | | | | | | | | |
| | Aggressive Growth Strategy Fund | | Growth Strategy Fund | |
|
| | For the year
ended
October 31, 2009 | | For the year
ended
October 31, 2008 | | For the year
ended
October 31, 2009 | | For the year
ended
October 31, 2008 | |
|
Investment Activities: | | | | | | | | | | | | | |
Operations: | | | | | | | | | | | | | |
Net investment income (loss) | | $ | (19,050 | ) | $ | (23,552 | ) | $ | 121,934 | | $ | 225,539 | |
Net realized gains (losses) from investment and foreign currency transactions | | | (1,143,628 | ) | | (1,008,442 | ) | | (3,219,284 | ) | | (2,323,453 | ) |
Change in unrealized appreciation/depreciation from investments and foreign currencies | | | 2,619,167 | | | (4,611,582 | ) | | 7,340,545 | | | (12,045,449 | ) |
| |
|
| |
|
| |
|
| |
|
| |
Change in net assets resulting from operations | | | 1,456,489 | | | (5,643,576 | ) | | 4,243,195 | | | (14,143,363 | ) |
| |
|
| |
|
| |
|
| |
|
| |
| | | | | | | | | | | | | |
Dividends: | | | | | | | | | | | | | |
Net investment income: | | | | | | | | | | | | | |
Class A Shares | | | — | | | — | | | (139,550 | ) | | (137,880 | ) |
Class B Shares | | | — | | | — | | | (7,901 | ) | | (1,259 | ) |
Class C Shares | | | — | | | — | | | (1,544 | ) | | (816 | ) |
| | | | | | | | | | | | | |
Net realized gains: | | | | | | | | | | | | | |
Class A Shares | | | — | | | (420,292 | ) | | — | | | (1,103,525 | ) |
Class B Shares | | | — | | | (302,904 | ) | | — | | | (702,526 | ) |
Class C Shares | | | — | | | (31,294 | ) | | — | | | (63,975 | ) |
Return of Capital: | | | | | | | | | | | | | |
Class A Shares | | | — | | | (1,758 | ) | | — | | | — | |
Class B Shares | | | — | | | (1,250 | ) | | — | | | — | |
Class C Shares | | | — | | | (126 | ) | | — | | | — | |
| |
|
| |
|
| |
|
| |
|
| |
Change in net assets resulting from shareholder dividends | | | — | | | (757,624 | ) | | (148,995 | ) | | (2,009,981 | ) |
| |
|
| |
|
| |
|
| |
|
| |
Change in net assets resulting from capital transactions | | | (31,438 | ) | | 1,942,878 | | | (447,939 | ) | | 3,984,572 | |
| |
|
| |
|
| |
|
| |
|
| |
Change in net assets | | | 1,425,051 | | | (4,458,322 | ) | | 3,646,261 | | | (12,168,772 | ) |
| | | | | | | | | | | | | |
Net Assets: | | | | | | | | | | | | | |
Beginning of period | | | 8,057,238 | | | 12,515,560 | | | 24,361,065 | | | 36,529,837 | |
| |
|
| |
|
| |
|
| |
|
| |
End of period | | $ | 9,482,289 | | $ | 8,057,238 | | $ | 28,007,326 | | $ | 24,361,065 | |
| |
|
| |
|
| |
|
| |
|
| |
Accumulated net investment income (loss) | | $ | — | | $ | — | | $ | 122,678 | | $ | 117,076 | |
| |
|
| |
|
| |
|
| |
|
| |
| | |
22 | HSBC INVESTOR LIFELINE FUNDS | See notes to financial statements. |
HSBC INVESTOR LIFELINE FUNDS
Statements of Changes in Net Assets (continued)
| | | | | | | | | | | | | |
| | Aggressive Growth Strategy Fund | | Growth Strategy Fund | |
|
| | For the year
ended
October 31, 2009 | | For the year
ended
October 31, 2008 | | For the year
ended
October 31, 2009 | | For the year
ended
October 31, 2008 | |
|
CAPITAL TRANSACTIONS: | | | | | | | | | | | | | |
Class A Shares: | | | | | | | | | | | | | |
Proceeds from shares issued | | $ | 919,824 | | $ | 1,808,587 | | $ | 1,604,683 | | $ | 4,094,924 | |
Dividends reinvested | | | — | | | 421,632 | | | 138,893 | | | 1,235,211 | |
Value of shares redeemed | | | (913,945 | ) | | (1,135,189 | ) | | (2,526,023 | ) | | (3,486,779 | ) |
| |
|
| |
|
| |
|
| |
|
| |
Class A Shares capital transactions | | | 5,879 | | | 1,095,030 | | | (782,447 | ) | | 1,843,356 | |
| |
|
| |
|
| |
|
| |
|
| |
| | | | | | | | | | | | | |
Class B Shares: | | | | | | | | | | | | | |
Proceeds from shares issued | | | 424,668 | | | 1,075,628 | | | 935,667 | | | 2,700,023 | |
Dividends reinvested | | | — | | | 303,827 | | | 7,888 | | | 701,613 | |
Value of shares redeemed | | | (383,617 | ) | | (597,445 | ) | | (915,409 | ) | | (1,552,870 | ) |
| |
|
| |
|
| |
|
| |
|
| |
Class B Shares capital transactions | | | 41,051 | | | 782,010 | | | 28,146 | | | 1,848,766 | |
| |
|
| |
|
| |
|
| |
|
| |
| | | | | | | | | | | | | |
Class C Shares: | | | | | | | | | | | | | |
Proceeds from shares issued | | | 16,971 | | | 160,943 | | | 496,755 | | | 471,136 | |
Dividends reinvested | | | — | | | 31,420 | | | 1,544 | | | 64,791 | |
Value of shares redeemed | | | (95,339 | ) | | (126,525 | ) | | (191,937 | ) | | (243,477 | ) |
| |
|
| |
|
| |
|
| |
|
| |
Class C Shares capital transactions | | | (78,368 | ) | | 65,838 | | | 306,362 | | | 292,450 | |
| |
|
| |
|
| |
|
| |
|
| |
| | | | | | | | | | | | | |
Change in net assets resulting from capital transactions | | $ | (31,438 | ) | $ | 1,942,878 | | $ | (447,939 | ) | $ | 3,984,572 | |
| |
|
| |
|
| |
|
| |
|
| |
| | | | | | | | | | | | | |
SHARE TRANSACTIONS: | | | | | | | | | | | | | |
Class A Shares: | | | | | | | | | | | | | |
Issued | | | 108,502 | | | 140,000 | | | 177,228 | | | 323,501 | |
Reinvested | | | — | | | 30,686 | | | 17,211 | | | 93,719 | |
Redeemed | | | (107,013 | ) | | (93,561 | ) | | (293,206 | ) | | (287,477 | ) |
| |
|
| |
|
| |
|
| |
|
| |
Change in Class A Shares | | | 1,489 | | | 77,125 | | | (98,767 | ) | | 129,743 | |
| |
|
| |
|
| |
|
| |
|
| |
| | | | | | | | | | | | | |
Class B Shares: | | | | | | | | | | | | | |
Issued | | | 50,718 | | | 84,358 | | | 104,902 | | | 218,579 | |
Reinvested | | | — | | | 22,556 | | | 973 | | | 53,152 | |
Redeemed | | | (45,783 | ) | | (53,351 | ) | | (105,971 | ) | | (133,643 | ) |
| |
|
| |
|
| |
|
| |
|
| |
Change in Class B Shares | | | 4,935 | | | 53,563 | | | (96 | ) | | 138,088 | |
| |
|
| |
|
| |
|
| |
|
| |
| | | | | | | | | | | | | |
Class C Shares: | | | | | | | | | | | | | |
Issued | | | 2,243 | | | 12,747 | | | 58,266 | | | 37,995 | |
Reinvested | | | — | | | 2,334 | | | 190 | | | 4,890 | |
Redeemed | | | (11,023 | ) | | (11,560 | ) | | (19,296 | ) | | (22,815 | ) |
| |
|
| |
|
| |
|
| |
|
| |
Change in Class C Shares | | | (8,780 | ) | | 3,521 | | | 39,160 | | | 20,070 | |
| |
|
| |
|
| |
|
| |
|
| |
| | |
See notes to financial statements. | HSBC INVESTOR LIFELINE FUNDS | 23 |
HSBC INVESTOR LIFELINE FUNDS
Statements of Changes in Net Assets (continued)
| | | | | | | | | | | | | |
| | Moderate Growth Strategy Fund | | Conservative Growth Strategy Fund | |
|
|
|
|
|
|
| | For the year
ended
October 31, 2009 | | For the year
ended
October 31, 2008 | | For the year
ended
October 31, 2009 | | For the year
ended
October 31, 2008 | |
|
|
|
|
|
|
|
|
|
|
Investment Activities: | | | | | | | | | | | | | |
Operations: | | | | | | | | | | | | | |
Net investment income (loss) | | $ | 304,905 | | $ | 510,248 | | $ | 110,589 | | $ | 224,175 | |
Net realized gains (losses) from investment and foreign currency transactions | | | (3,357,874 | ) | | (2,119,789 | ) | | (973,853 | ) | | (572,415 | ) |
Change in unrealized appreciation/depreciation from investments and foreign currencies | | | 7,600,975 | | | (11,008,540 | ) | | 2,220,121 | | | (2,729,503 | ) |
| |
|
| |
|
| |
|
| |
|
| |
Change in net assets resulting from operations | | | 4,548,006 | | | (12,618,081 | ) | | 1,356,857 | | | (3,077,743 | ) |
| |
|
| |
|
| |
|
| |
|
| |
| | | | | | | | | | | | | |
Dividends: | | | | | | | | | | | | | |
Net investment income: | | | | | | | | | | | | | |
Class A Shares | | | (193,616 | ) | | (306,761 | ) | | (71,561 | ) | | (141,579 | ) |
Class B Shares | | | (84,484 | ) | | (139,765 | ) | | (34,422 | ) | | (79,044 | ) |
Class C Shares | | | (9,513 | ) | | (16,616 | ) | | (3,180 | ) | | (7,481 | ) |
| | | | | | | | | | | | | |
Net realized gains: | | | | | | | | | | | | | |
Class A Shares | | | — | | | (772,146 | ) | | — | | | (146,067 | ) |
Class B Shares | | | — | | | (634,501 | ) | | — | | | (110,864 | ) |
Class C Shares | | | — | | | (74,952 | ) | | — | | | (9,305 | ) |
Return of Capital: | | | | | | | | | | | | | |
Class A Shares | | | — | | | (20,619 | ) | | — | | | (262 | ) |
Class B Shares | | | — | | | (17,902 | ) | | — | | | (242 | ) |
Class C Shares | | | — | | | (2,090 | ) | | — | | | (23 | ) |
| |
|
| |
|
| |
|
| |
|
| |
Change in net assets resulting from shareholder dividends | | | (287,613 | ) | | (1,985,352 | ) | | (109,163 | ) | | (494,867 | ) |
| |
|
| |
|
| |
|
| |
|
| |
Change in net assets resulting from capital transactions | | | (620,407 | ) | | 4,171,062 | | | (322,434 | ) | | 1,063,369 | |
| |
|
| |
|
| |
|
| |
|
| |
Change in net assets | | | 3,639,986 | | | (10,432,371 | ) | | 925,260 | | | (2,509,241 | ) |
|
Net Assets: | | | | | | | | | | | | | |
Beginning of period | | | 27,987,474 | | | 38,419,845 | | | 9,525,062 | | | 12,034,303 | |
| |
|
| |
|
| |
|
| |
|
| |
End of period | | $ | 31,627,460 | | $ | 27,987,474 | | $ | 10,450,322 | | $ | 9,525,062 | |
| |
|
| |
|
| |
|
| |
|
| |
Accumulated net investment income (loss) | | $ | 46,429 | | $ | — | | $ | 11,295 | | $ | — | |
| |
|
| |
|
| |
|
| |
|
| |
| | |
24 | HSBC INVESTOR LIFELINE FUNDS | See notes to financial statements. |
HSBC INVESTOR LIFELINE FUNDS
Statements of Changes in Net Assets (continued)
| | | | | | | | | | | | | |
| | Moderate Growth Strategy Fund | | Conservative Growth Strategy Fund | |
|
|
|
|
|
|
| | For the year
ended
October 31, 2009 | | For the year
ended
October 31, 2008 | | For the year
ended
October 31, 2009 | | For the year
ended
October 31, 2008 | |
|
|
|
|
|
|
|
|
|
|
CAPITAL TRANSACTIONS: | | | | | | | | | | | | | |
Class A Shares: | | | | | | | | | | | | | |
Proceeds from shares issued | | $ | 1,737,577 | | $ | 4,477,845 | | $ | 845,986 | | $ | 1,702,567 | |
Dividends reinvested | | | 193,104 | | | 1,096,649 | | | 69,473 | | | 277,201 | |
Value of shares redeemed | | | (2,409,781 | ) | | (3,953,091 | ) | | (1,218,686 | ) | | (2,025,309 | ) |
| |
|
| |
|
| |
|
| |
|
| |
Class A Shares capital transactions | | | (479,100 | ) | | 1,621,403 | | | (303,227 | ) | | (45,541 | ) |
| |
|
| |
|
| |
|
| |
|
| |
| | | | | | | | | | | | | |
Class B Shares: | | | | | | | | | | | | | |
Proceeds from shares issued | | | 1,513,370 | | | 3,948,083 | | | 770,085 | | | 1,595,118 | |
Dividends reinvested | | | 84,267 | | | 790,250 | | | 33,341 | | | 183,107 | |
Value of shares redeemed | | | (1,629,024 | ) | | (2,551,316 | ) | | (820,164 | ) | | (813,124 | ) |
| |
|
| |
|
| |
|
| |
|
| |
Class B Shares capital transactions | | | (31,387 | ) | | 2,187,017 | | | (16,738 | ) | | 965,101 | |
| |
|
| |
|
| |
|
| |
|
| |
| | | | | | | | | | | | | |
Class C Shares: | | | | | | | | | | | | | |
Proceeds from shares issued | | | 297,893 | | | 778,453 | | | 79,844 | | | 203,099 | |
Dividends reinvested | | | 9,424 | | | 93,634 | | | 3,101 | | | 16,809 | |
Value of shares redeemed | | | (417,237 | ) | | (509,445 | ) | | (85,414 | ) | | (76,099 | ) |
| |
|
| |
|
| |
|
| |
|
| |
Class C Shares capital transactions | | | (109,920 | ) | | 362,642 | | | (2,469 | ) | | 143,809 | |
| |
|
| |
|
| |
|
| |
|
| |
|
Change in net assets resulting from capital transactions | | $ | (620,407 | ) | $ | 4,171,062 | | $ | (322,434 | ) | $ | 1,063,369 | |
| |
|
| |
|
| |
|
| |
|
| |
| | | | | | | | | | | | | |
SHARE TRANSACTIONS: | | | | | | | | | | | | | |
Class A Shares: | | | | | | | | | | | | | |
Issued | | | 194,386 | | | 382,474 | | | 94,440 | | | 157,831 | |
Reinvested | | | 22,198 | | | 91,761 | | | 7,802 | | | 25,060 | |
Redeemed | | | (275,784 | ) | | (355,687 | ) | | (133,563 | ) | | (199,713 | ) |
| |
|
| |
|
| |
|
| |
|
| |
Change in Class A Shares | | | (59,200 | ) | | 118,548 | | | (31,321 | ) | | (16,822 | ) |
| |
|
| |
|
| |
|
| |
|
| |
| | | | | | | | | | | | | |
Class B Shares: | | | | | | | | | | | | | |
Issued | | | 172,132 | | | 340,238 | | | 87,053 | | | 148,878 | |
Reinvested | | | 9,836 | | | 65,629 | | | 3,828 | | | 16,609 | |
Redeemed | | | (191,599 | ) | | (229,160 | ) | | (91,989 | ) | | (81,932 | ) |
| |
|
| |
|
| |
|
| |
|
| |
Change in Class B Shares | | | (9,631 | ) | | 176,707 | | | (1,108 | ) | | 83,555 | |
| |
|
| |
|
| |
|
| |
|
| |
| | | | | | | | | | | | | |
Class C Shares: | | | | | | | | | | | | | |
Issued | | | 33,657 | | | 68,169 | | | 8,443 | | | 18,026 | |
Reinvested | | | 1,125 | | | 7,964 | | | 348 | | | 1,489 | |
Redeemed | | | (49,433 | ) | | (46,372 | ) | | (8,952 | ) | | (7,369 | ) |
| |
|
| |
|
| |
|
| |
|
| |
Change in Class C Shares | | | (14,651 | ) | | 29,761 | | | (161 | ) | | 12,146 | |
| |
|
| |
|
| |
|
| |
|
| |
| | |
See notes to financial statements. | HSBC INVESTOR LIFELINE FUNDS | 25 |
|
HSBC INVESTOR AGGRESSIVE GROWTH STRATEGY FUND |
|
Financial Highlights
Selected data for a share outstanding throughout the periods indicated. (a)
| | | | | | | | | | | | | | | | | | | | | | | | | | | | | | | | | | | | |
| | | | | Investment Activities | | Dividends | | | | |
| | | | |
| |
| | | | |
| | Net Asset
Value,
Beginning
of Period | | Net
Investment
Income
(Loss) | | Net Realized
and Unrealized
Gains (Losses)
from
Investment
Transactions | | Total from
Investment
Activities | | Net
Realized
Gains from
Investment
Transactions | | Total
Dividends | | Net Asset
Value, End
of Period | |
|
|
|
|
|
|
|
|
|
|
|
|
|
|
|
|
CLASS A SHARES | | | | | | | | | | | | | | | | | | | | | | |
Period Ended October 31, 2005 (i) | | | $ | 10.00 | | | | | (0.01 | ) | | | | 0.61 | | | | | 0.60 | | | | | — | | | | | — | | | | $ | 10.60 | | |
Year Ended October 31, 2006 | | | | 10.60 | | | | | 0.01 | | | | | 2.01 | | | | | 2.02 | | | | | (0.05 | ) | | | | (0.05 | ) | | | | 12.57 | | |
Year Ended October 31, 2007 | | | | 12.57 | | | | | — | *(g) | | | | 2.98 | | | | | 2.98 | | | | | — | | | | | — | | | | | 15.55 | | |
Year Ended October 31, 2008 | | | | 15.55 | | | | | 0.02 | * | | | | (6.05 | ) | | | | (6.03 | ) | | | | (0.90 | ) | | | | (0.90 | ) | | | | 8.62 | | |
Year Ended October 31, 2009 | | | | 8.62 | | | | | 0.01 | * | | | | 1.57 | | | | | 1.58 | | | | | — | | | | | — | | | | | 10.20 | | |
|
|
|
|
|
|
|
|
|
|
|
|
|
|
|
|
|
|
|
|
|
|
|
|
|
|
|
|
|
|
|
|
|
|
|
|
|
CLASS B SHARES | | | | | | | | | | | | | | | | | | | | | | | | | | | | | | | | | | | | |
Period Ended October 31, 2005 (j) | | | $ | 10.00 | | | | | (0.04 | ) | | | | 0.61 | | | | | 0.57 | | | | | — | | | | | — | | | | $ | 10.57 | | |
Year Ended October 31, 2006 | | | | 10.57 | | | | | (0.05 | ) | | | | 1.97 | | | | | 1.92 | | | | | (0.05 | ) | | | | (0.05 | ) | | | | 12.44 | | |
Year Ended October 31, 2007 | | | | 12.44 | | | | | (0.11 | )* | | | | 2.94 | | | | | 2.83 | | | | | — | | | | | — | | | | | 15.27 | | |
Year Ended October 31, 2008 | | | | 15.27 | | | | | (0.08 | )* | | | | (5.90 | ) | | | | (5.98 | ) | | | | (0.90 | ) | | | | (0.90 | ) | | | | 8.39 | | |
Year Ended October 31, 2009 | | | | 8.39 | | | | | (0.06 | )* | | | | 1.53 | | | | | 1.47 | | | | | — | | | | | — | | | | | 9.86 | | |
|
|
|
|
|
|
|
|
|
|
|
|
|
|
|
|
|
|
|
|
|
|
|
|
|
|
|
|
|
|
|
|
|
|
|
|
|
CLASS C SHARES | | | | | | | | | | | | | | | | | | | | | | | | | | | | | | | | | | | | |
Period Ended October 31, 2005 (k) | | | $ | 10.00 | | | | | (0.05 | ) | | | | 0.60 | | | | | 0.55 | | | | | — | | | | | — | | | | $ | 10.55 | | |
Year Ended October 31, 2006 | | | | 10.55 | | | | | (0.04 | ) | | | | 1.95 | | | | | 1.91 | | | | | (0.05 | ) | | | | (0.05 | ) | | | | 12.41 | | |
Year Ended October 31, 2007 | | | | 12.41 | | | | | (0.11 | )* | | | | 2.96 | | | | | 2.85 | | | | | — | | | | | — | | | | | 15.26 | | |
Year Ended October 31, 2008 | | | | 15.26 | | | | | (0.08 | )* | | | | (5.89 | ) | | | | (5.97 | ) | | | | (0.90 | ) | | | | (0.90 | ) | | | | 8.39 | | |
Year Ended October 31, 2009 | | | | 8.39 | | | | | (0.05 | )* | | | | 1.51 | | | | | 1.46 | | | | | — | | | | | — | | | | | 9.85 | | |
|
|
|
|
|
|
|
|
|
|
|
|
|
|
|
|
|
|
|
|
|
|
|
|
|
|
|
|
|
|
|
|
|
|
|
|
|
| | | | | | | | | | | | | | | | | | | | | | | | | | | | | | | |
| | | | | Ratios/Supplementary Data | |
| | | | |
| |
|
| | Total
Return(b) | | Net Assets
at End of
Period
(000’s) | | Ratio of Net
Expenses to
Average
Net Assets(c) | | Ratio of Net
Investment
Income (Loss)
to Average
Net Assets(c) | | Ratio of
Expenses to
Average Net
Assets(c)(d) | | Portfolio
Turnover
Rate(e) | |
|
|
|
|
|
|
|
|
|
|
|
|
|
|
CLASS A SHARES | | | | | | | | | | | | | | | | | | | |
Period Ended October 31, 2005 (i) | | | | 6.00 | % | | | $ | 726 | | | | | 1.50 | % | | | | (0.20 | )% | | | | 11.72 | % | | | | 49.10 | % | |
Year Ended October 31, 2006 | | | | 19.15 | % | | | | 4,116 | | | | | 1.50 | % | | | | 0.05 | % | | | | 3.52 | % | | | | 48.46 | % | |
Year Ended October 31, 2007 | | | | 23.71 | % | | | | 7,046 | | | | | 1.50 | % | | | | (0.03 | )% | | | | 2.27 | % | | | | 45.50 | % | |
Year Ended October 31, 2008 | | | | (40.92 | )%(f) | | | | 4,572 | | | | | 1.50 | % | | | | 0.13 | % | | | | 1.98 | % | | | | 72.33 | % | |
Year Ended October 31, 2009 | | | | 18.33 | %(h) | | | | 5,426 | | | | | 1.50 | % | | | | 0.09 | % | | | | 2.16 | % | | | | 53.42 | % | |
|
|
|
|
|
|
|
|
|
|
|
|
|
|
|
|
|
|
|
|
|
|
|
|
|
|
|
|
|
|
|
|
CLASS B SHARES | | | | | | | | | | | | | | | | | | | | | | | | | | | | | | | |
Period Ended October 31, 2005 (j) | | | | 5.70 | % | | | $ | 700 | | | | | 2.25 | % | | | | (1.01 | )% | | | | 11.63 | % | | | | 49.10 | % | |
Year Ended October 31, 2006 | | | | 18.25 | % | | | | 2,998 | | | | | 2.25 | % | | | | (0.70 | )% | | | | 4.33 | % | | | | 48.46 | % | |
Year Ended October 31, 2007 | | | | 22.75 | % | | | | 4,942 | | | | | 2.25 | % | | | | (0.77 | )% | | | | 3.02 | % | | | | 45.50 | % | |
Year Ended October 31, 2008 | | | | (41.36 | )%(f) | | | | 3,166 | | | | | 2.25 | % | | | | (0.62 | )% | | | | 2.73 | % | | | | 72.33 | % | |
Year Ended October 31, 2009 | | | | 17.52 | %(h) | | | | 3,767 | | | | | 2.25 | % | | | | (0.66 | )% | | | | 2.91 | % | | | | 53.42 | % | |
|
|
|
|
|
|
|
|
|
|
|
|
|
|
|
|
|
|
|
|
|
|
|
|
|
|
|
|
|
|
|
|
CLASS C SHARES | | | | | | | | | | | | | | | | | | | | | | | | | | | | | | | |
Period Ended October 31, 2005 (k) | | | | 5.50 | % | | | $ | 21 | | | | | 2.25 | % | | | | (1.15 | )% | | | | 9.79 | % | | | | 49.10 | % | |
Year Ended October 31, 2006 | | | | 18.19 | % | | | | 229 | | | | | 2.25 | % | | | | (0.69 | )% | | | | 4.20 | % | | | | 48.46 | % | |
Year Ended October 31, 2007 | | | | 22.97 | % | | | | 528 | | | | | 2.25 | % | | | | (0.79 | )% | | | | 2.99 | % | | | | 45.50 | % | |
Year Ended October 31, 2008 | | | | (41.32 | )%(f) | | | | 319 | | | | | 2.25 | % | | | | (0.64 | )% | | | | 2.73 | % | | | | 72.33 | % | |
Year Ended October 31, 2009 | | | | 17.40 | %(h) | | | | 289 | | | | | 2.25 | % | | | | (0.59 | )% | | | | 2.93 | % | | | | 53.42 | % | |
|
|
|
|
|
|
|
|
|
|
|
|
|
|
|
|
|
|
|
|
|
|
|
|
|
|
|
|
|
|
|
|
| |
* | Calculated based on average shares outstanding. |
| |
(a) | The per share amounts and percentages reflect income and expenses assuming inclusion of the Fund’s proportionate share of the income and expenses of the applicable HSBC Investor Portfolios. |
| |
(b) | Not annualized for periods less than one year. Total return calculations do not include any sales or redemption charges. |
| |
(c) | Annualized for periods less than one year. |
| |
(d) | During the period certain fees were reduced. If such fee reductions had not occurred, the ratio would have been as indicated. |
| |
(e) | Portfolio turnover rate is calculated by aggregating the results of multiplying the Fund’s investment percentage in the respective Portfolios by the corresponding Portfolio’s portfolio turnover rates. Portfolio turnover rate is calculated on the basis of the Fund as a whole without distinguishing between classes of shares issued. |
| |
(f) | During the year ended October 31, 2008, certain HSBC Investor Portfolios in which the Fund invests in received monies related to certain nonrecurring litigation settlements. The corresponding impact to the total return was 0.11%, 0.11% and 0.11% for Class A Shares, Class B Shares and Class C Shares, respectively. |
| |
(g) | Rounds to less than $0.01 or $(0.01). |
| |
(h) | During the year ended October 31, 2009, certain HSBC Investor Portfolios in which the Fund invests in received monies related to certain nonrecurring litigation settlements. The corresponding impact to the total return was 0.11%, 0.11% and 0.11% for Class A Shares, Class B Shares and Class C Shares, respectively. |
| |
(i) | Class A Shares commenced operations on February 14, 2005. |
| |
(j) | Class B Shares commenced operations on February 9, 2005. |
| |
(k) | Class C Shares commenced operations on June 9, 2005. |
| | |
26 | HSBC INVESTOR LIFELINE FUNDS | See notes to financial statements. |
|
HSBC INVESTOR GROWTH STRATEGY FUND |
|
Financial Highlights |
Selected data for a share outstanding throughout the periods indicated. (a)
| | | | | | | | | | | | | | | | | | | | | | | | | | | | | |
| | | | Investment Activities | | Dividends | | | |
| | | |
| |
| | | |
| | Net Asset
Value,
Beginning
of Period | | Net
Investment
Income
(Loss) | | Net Realized
and Unrealized
Gains
(Losses) from
Investment
Transactions | | Total from
Investment
Activities | | Net
Investment
Income | | Net
Realized
Gains from
Investment
Transactions | | Total
Dividends | | Net Asset
Value, End
of Period | |
|
|
|
|
|
|
|
|
|
|
|
|
|
|
|
|
|
|
CLASS A SHARES | | | | | | | | | | | | | | | | | | | | | | | | | |
Period Ended October 31, 2005(f) | | | $ | 10.00 | | | 0.02 | | | 0.70 | | | 0.72 | | | — | | | — | | | — | | | | $ | 10.72 | | |
Year Ended October 31, 2006 | | | | 10.72 | | | 0.07 | | | 1.69 | | | 1.76 | | | — | | | (0.03 | ) | | (0.03 | ) | | | | 12.45 | | |
Year Ended October 31, 2007 | | | | 12.45 | | | 0.11 | * | | 2.34 | | | 2.45 | | | (0.08 | ) | | (0.09 | ) | | (0.17 | ) | | | | 14.73 | | |
Year Ended October 31, 2008 | | | | 14.73 | | | 0.12 | * | | (5.21 | ) | | (5.09 | ) | | (0.09 | ) | | (0.74 | ) | | (0.83 | ) | | | | 8.81 | | |
Year Ended October 31, 2009 | | | | 8.81 | | | 0.07 | * | | 1.55 | | | 1.62 | | | (0.09 | ) | | — | | | (0.09 | ) | | | | 10.34 | | |
|
|
|
|
|
|
|
|
|
|
|
|
|
|
|
|
|
|
|
|
|
|
|
|
|
|
|
|
|
|
CLASS B SHARES | | | | | | | | | | | | | | | | | | | | | | | | | | | | | |
Period Ended October 31, 2005(j) | | | $ | 10.00 | | | (0.01 | ) | | 0.79 | | | 0.78 | | | — | | | — | | | — | | | | $ | 10.78 | | |
Year Ended October 31, 2006 | | | | 10.78 | | | 0.02 | | | 1.66 | | | 1.68 | | | — | | | (0.03 | ) | | (0.03 | ) | | | | 12.43 | | |
Year Ended October 31, 2007 | | | | 12.43 | | | 0.01 | * | | 2.34 | | | 2.35 | | | (0.02 | ) | | (0.09 | ) | | (0.11 | ) | | | | 14.67 | | |
Year Ended October 31, 2008 | | | | 14.67 | | | 0.03 | * | | (5.20 | ) | | (5.17 | ) | | — | (l) | | (0.74 | ) | | (0.74 | ) | | | | 8.76 | | |
Year Ended October 31, 2009 | | | | 8.76 | | | 0.01 | * | | 1.55 | | | 1.56 | | | (0.01 | ) | | — | | | (0.01 | ) | | | | 10.31 | | |
|
|
|
|
|
|
|
|
|
|
|
|
|
|
|
|
|
|
|
|
|
|
|
|
|
|
|
|
|
|
CLASS C SHARES | | | | | | | | | | | | | | | | | | | | | | | | | | | | | |
Period Ended October 31, 2005(k) | | | $ | 10.00 | | | (0.02 | ) | | 0.84 | | | 0.82 | | | — | | | — | | | — | | | | $ | 10.82 | | |
Year Ended October 31, 2006 | | | | 10.82 | | | 0.02 | | | 1.67 | | | 1.69 | | | — | | | (0.03 | ) | | (0.03 | ) | | | | 12.48 | | |
Year Ended October 31, 2007 | | | | 12.48 | | | 0.01 | * | | 2.35 | | | 2.36 | | | (0.01 | ) | | (0.09 | ) | | (0.10 | ) | | | | 14.74 | | |
Year Ended October 31, 2008 | | | | 14.74 | | | 0.03 | * | | (5.22 | ) | | (5.19 | ) | | (0.01 | ) | | (0.74 | ) | | (0.75 | ) | | | | 8.80 | | |
Year Ended October 31, 2009 | | | | 8.80 | | | 0.01 | * | | 1.55 | | | 1.56 | | | (0.01 | ) | | — | | | (0.01 | ) | | | | 10.35 | | |
|
|
|
|
|
|
|
|
|
|
|
|
|
|
|
|
|
|
|
|
|
|
|
|
|
|
|
|
|
|
| | | | | | | | | | | | | | | | | | | | | |
| | | | Ratios/Supplementary Data |
| | | |
|
| | Total
Return(b) | | Net Assets
at End of
Period
(000’s) | | Ratio of Net
Expenses to
Average
Net Assets(c) | | Ratio of Net
Investment
Income (Loss)
to Average
Net Assets(c) | | Ratio of
Expenses to
Average Net
Assets(c)(d) | | Portfolio
Turnover
Rate(e) | |
|
|
|
|
|
|
|
|
|
|
|
|
|
|
CLASS A SHARES | | | | | | | | | | | | | | | | | | | |
Period Ended October 31, 2005(f) | | 7.20 | % | | | $ | 2,814 | | | 1.50 | % | | 0.42 | % | | 5.19 | % | | 69.23 | % | |
Year Ended October 31, 2006 | | 16.41 | % | | | | 12,562 | | | 1.50 | % | | 0.87 | % | | 2.19 | % | | 80.30 | % | |
Year Ended October 31, 2007 | | 19.92 | %(g) | | | | 21,352 | | | 1.50 | % | | 0.84 | % | | 1.65 | % | | 73.45 | % | |
Year Ended October 31, 2008 | | (36.43 | )%(h) | | | | 13,908 | | | 1.50 | % | | 0.98 | % | | 1.53 | % | | 78.59 | % | |
Year Ended October 31, 2009 | | 18.66 | %(i) | | | | 15,304 | | | 1.50 | % | | 0.84 | % | | 1.57 | % | | 47.74 | % | |
|
|
|
|
|
|
|
|
|
|
|
|
|
|
|
|
|
|
|
|
|
|
CLASS B SHARES | | | | | | | | | | | | | | | | | | | | | |
Period Ended October 31, 2005(j) | | 7.80 | % | | | $ | 2,670 | | | 2.25 | % | | (0.38 | )% | | 5.74 | % | | 69.23 | % | |
Year Ended October 31, 2006 | | 15.57 | % | | | | 8,702 | | | 2.25 | % | | 0.11 | % | | 2.94 | % | | 80.30 | % | |
Year Ended October 31, 2007 | | 18.98 | %(g) | | | | 13,905 | | | 2.25 | % | | 0.09 | % | | 2.40 | % | | 73.45 | % | |
Year Ended October 31, 2008 | | (36.95 | )%(h) | | | | 9,516 | | | 2.25 | % | | 0.24 | % | | 2.28 | % | | 78.59 | % | |
Year Ended October 31, 2009 | | 17.80 | %(i) | | | | 11,196 | | | 2.25 | % | | 0.08 | % | | 2.31 | % | | 47.74 | % | |
|
|
|
|
|
|
|
|
|
|
|
|
|
|
|
|
|
|
|
|
|
|
CLASS C SHARES | | | | | | | | | | | | | | | | | | | | | |
Period Ended October 31, 2005(k) | | 8.20 | % | | | $ | 106 | | | 2.25 | % | | (0.55 | )% | | 5.24 | % | | 69.23 | % | |
Year Ended October 31, 2006 | | 15.61 | % | | | | 585 | | | 2.25 | % | | 0.14 | % | | 2.90 | % | | 80.30 | % | |
Year Ended October 31, 2007 | | 19.04 | %(g) | | | | 1,273 | | | 2.25 | % | | 0.07 | % | | 2.39 | % | | 73.45 | % | |
Year Ended October 31, 2008 | | (36.94 | )%(h) | | | | 937 | | | 2.25 | % | | 0.25 | % | | 2.29 | % | | 78.59 | % | |
Year Ended October 31, 2009 | | 17.81 | %(i) | | | | 1,507 | | | 2.25 | % | | 0.06 | % | | 2.30 | % | | 47.74 | % | |
|
|
|
|
|
|
|
|
|
|
|
|
|
|
|
|
|
|
|
|
|
|
| |
* | Calculated based on average shares outstanding. |
| |
(a) | The per share amounts and percentages reflect income and expenses assuming inclusion of the Fund’s proportionate share of the income and expenses of the applicable HSBC Investor Portfolios, the Fund does not include expenses of the unaffiliated investment companies in which the Fund invests in. |
| |
(b) | Not annualized for periods less than one year. Total return calculations do not include any sales or redemption charges. |
| |
(c) | Annualized for periods less than one year. |
| |
(d) | During the period certain fees were reduced. If such fee reductions had not occurred, the ratio would have been as indicated. |
| |
(e) | Portfolio turnover rate is calculated by aggregating the results of multiplying the Fund’s investment percentage in the respective Portfolios and unaffiliated investment companies by their corresponding portfolio turnover rates. Portfolio turnover rate is calculated on the basis of the Fund as a whole without distinguishing between classes of shares issued. |
| |
(f) | Class A Shares commenced operations on February 8, 2005. |
| |
(g) | During the year ended October 31, 2007, certain HSBC Investor Portfolios in which the Fund invests in received monies related to certain nonrecurring litigation settlements. The corresponding impact to the total return was 0.23%, 0.24% and 0.23% for Class A Shares, Class B Shares and Class C Shares, respectively. |
| |
(h) | During the year ended October 31, 2008, certain HSBC Investor Portfolios in which the Fund invests in received monies related to certain nonrecurring litigation settlements. The corresponding impact to the total return was 0.15%, 0.15% and 0.15% for Class A Shares, Class B Shares and Class C Shares, respectively. |
| |
(i) | During the year ended October 31, 2009, certain HSBC Investor Portfolios in which the Fund invests in received monies related to certain nonrecurring litigation settlements. The corresponding impact to the total return was 0.11%, 0.11% and 0.11% for Class A Shares, Class B Shares and Class C Shares, respectively. |
| |
(j) | Class B Shares commenced operations on February 1, 2005. |
| |
(k) | Class C Shares commenced operations on April 27, 2005. |
| |
(l) | Rounds to less than $0.01. |
| | |
See notes to financial statements. | HSBC INVESTOR LIFELINE FUNDS | 27 |
|
HSBC INVESTOR MODERATE GROWTH STRATEGY FUND |
|
Financial Highlights |
|
Selected data for a share outstanding throughout the periods indicated. (a) |
| | | | | | | | | | | | | | | | | | | | | | | | | | | | | | | | |
| | | | Investment Activities | | Dividends | | | |
| | | |
| |
| | | |
| | Net Asset
Value,
Beginning
of Period | | Net
Investment
Income
(Loss) | | Net Realized
and Unrealized
Gains
(Losses) from
Investment
Transactions | | Total from
Investment
Activities | | Net
Investment
Income | | Net
Realized
Gains from
Investment
Transactions | | Return
of
Capital | | Total
Dividends | | Net Asset
Value, End
of Period | |
|
|
|
|
|
|
|
|
|
|
|
|
|
|
|
|
|
|
|
|
CLASS A SHARES | | | | | | | | | | | | | | | | | | | | | | | | | | | | | | | | |
Period Ended October 31, 2005(f) | | | $ | 10.00 | | | 0.04 | | | 0.45 | | | 0.49 | | | — | (g) | | — | | | — | | | — | (g) | | | $ | 10.49 | | |
Year Ended October 31, 2006 | | | | 10.49 | | | 0.17 | | | 1.23 | | | 1.40 | | | (0.17 | ) | | (0.01 | ) | | — | | | (0.18 | ) | | | | 11.71 | | |
Year Ended October 31, 2007 | | | | 11.71 | | | 0.21 | * | | 1.65 | | | 1.86 | | | (0.20 | ) | | (0.10 | ) | | — | | | (0.30 | ) | | | | 13.27 | | |
Year Ended October 31, 2008 | | | | 13.27 | | | 0.20 | * | | (4.08 | ) | | (3.88 | ) | | (0.19 | ) | | (0.50 | ) | | (0.01 | ) | | (0.70 | ) | | | | 8.69 | | |
Year Ended October 31, 2009 | | | | 8.69 | | | 0.13 | * | | 1.39 | | | 1.52 | | | (0.12 | ) | | — | | | — | | | (0.12 | ) | | | | 10.09 | | |
|
|
|
|
|
|
|
|
|
|
|
|
|
|
|
|
|
|
|
|
|
|
|
|
|
|
|
|
|
|
|
|
|
CLASS B SHARES | | | | | | | | | | | | | | | | | | | | | | | | | | | | | | | | |
Period Ended October 31, 2005(k) | | | $ | 10.00 | | | 0.01 | | | 0.49 | | | 0.50 | | | — | (g) | | — | | | — | | | — | (g) | | | $ | 10.50 | | |
Year Ended October 31, 2006 | | | | 10.50 | | | 0.09 | | | 1.22 | | | 1.31 | | | (0.08 | ) | | (0.01 | ) | | — | | | (0.09 | ) | | | | 11.72 | | |
Year Ended October 31, 2007 | | | | 11.72 | | | 0.12 | * | | 1.65 | | | 1.77 | | | (0.12 | ) | | (0.10 | ) | | — | | | (0.22 | ) | | | | 13.27 | | |
Year Ended October 31, 2008 | | | | 13.27 | | | 0.11 | * | | (4.08 | ) | | (3.97 | ) | | (0.10 | ) | | (0.50 | ) | | (0.01 | ) | | (0.61 | ) | | | | 8.69 | | |
Year Ended October 31, 2009 | | | | 8.69 | | | 0.06 | * | | 1.39 | | | 1.45 | | | (0.06 | ) | | — | | | — | | | (0.06 | ) | | | | 10.08 | | |
|
|
|
|
|
|
|
|
|
|
|
|
|
|
|
|
|
|
|
|
|
|
|
|
|
|
|
|
|
|
|
|
|
CLASS C SHARES | | | | | | | | | | | | | | | | | | | | | | | | | | | | | | | | |
Period Ended October 31, 2005(l) | | | $ | 10.00 | | | — | (g) | | 0.28 | | | 0.28 | | | — | | | — | | | — | | | — | | | | $ | 10.28 | | |
Year Ended October 31, 2006 | | | | 10.28 | | | 0.09 | | | 1.19 | | | 1.28 | | | (0.08 | ) | | (0.01 | ) | | — | | | (0.09 | ) | | | | 11.47 | | |
Year Ended October 31, 2007 | | | | 11.47 | | | 0.12 | * | | 1.60 | | | 1.72 | | | (0.12 | ) | | (0.10 | ) | | — | | | (0.22 | ) | | | | 12.97 | | |
Year Ended October 31, 2008 | | | | 12.97 | | | 0.11 | * | | (3.97 | ) | | (3.86 | ) | | (0.11 | ) | | (0.50 | ) | | (0.01 | ) | | (0.62 | ) | | | | 8.49 | | |
Year Ended October 31, 2009 | | | | 8.49 | | | 0.06 | * | | 1.35 | | | 1.41 | | | (0.06 | ) | | — | | | — | | | (0.06 | ) | | | | 9.84 | | |
|
|
|
|
|
|
|
|
|
|
|
|
|
|
|
|
|
|
|
|
|
|
|
|
|
|
|
|
|
|
|
|
|
| | | | | | | | | | | | | | | | | | | | | |
| | | | Ratios/Supplementary Data | |
| | | |
| |
| | Total
Return(b) | | Net Assets
at End of
Period
(000’s) | | Ratio of Net
Expenses to
Average
Net Assets(c) | | Ratio of Net
Investment
Income to
Average Net
Assets(c) | | Ratio of
Expenses to
Average Net
Assets(c)(d) | | Portfolio
Turnover
Rate(e) | |
|
|
|
|
|
|
|
|
|
|
|
|
|
|
CLASS A SHARES | | | | | | | | | | | | | | | | | | | | | |
Period Ended October 31, 2005(f) | | 4.94 | % | | | $ | 3,241 | | | 1.50 | % | | 0.95 | % | | 4.30 | % | | 84.55 | % | |
Year Ended October 31, 2006 | | 13.40 | % | | | | 11,973 | | | 1.50 | % | | 1.65 | % | | 2.12 | % | | 101.57 | % | |
Year Ended October 31, 2007 | | 16.12 | %(h) | | | | 20,140 | | | 1.50 | % | | 1.70 | % | | 1.60 | % | | 92.87 | % | |
Year Ended October 31, 2008 | | (30.65 | )%(i) | | | | 14,226 | | | 1.48 | % | | 1.75 | % | | 1.48 | % | | 79.86 | % | |
Year Ended October 31, 2009 | | 17.75 | %(j) | | | | 15,909 | | | 1.44 | % | | 1.47 | % | | 1.49 | % | | 41.29 | % | |
|
|
|
|
|
|
|
|
|
|
|
|
|
|
|
|
|
|
|
|
|
|
CLASS B SHARES | | | | | | | | | | | | | | | | | | | | | |
Period Ended October 31, 2005(k) | | 5.03 | % | | | $ | 3,604 | | | 2.25 | % | | 0.18 | % | | 5.01 | % | | 84.55 | % | |
Year Ended October 31, 2006 | | 12.45 | % | | | | 10,731 | | | 2.25 | % | | 0.91 | % | | 2.87 | % | | 101.57 | % | |
Year Ended October 31, 2007 | | 15.25 | %(h) | | | | 16,513 | | | 2.25 | % | | 0.95 | % | | 2.35 | % | | 92.87 | % | |
Year Ended October 31, 2008 | | (31.17 | )%(i) | | | | 12,354 | | | 2.23 | % | | 1.00 | % | | 2.23 | % | | 79.86 | % | |
Year Ended October 31, 2009 | | 16.82 | %(j) | | | | 14,230 | | | 2.19 | % | | 0.71 | % | | 2.24 | % | | 41.29 | % | |
|
|
|
|
|
|
|
|
|
|
|
|
|
|
|
|
|
|
|
|
|
|
CLASS C SHARES | | | | | | | | | | | | | | | | | | | | | |
Period Ended October 31, 2005(l) | | 2.80 | % | | | $ | 278 | | | 2.25 | % | | 0.05 | % | | 4.69 | % | | 84.55 | % | |
Year Ended October 31, 2006 | | 12.53 | % | | | | 763 | | | 2.25 | % | | 0.87 | % | | 2.83 | % | | 101.57 | % | |
Year Ended October 31, 2007 | | 15.20 | %(h) | | | | 1,766 | | | 2.25 | % | | 0.95 | % | | 2.33 | % | | 92.87 | % | |
Year Ended October 31, 2008 | | (31.09 | )%(i) | | | | 1,408 | | | 2.23 | % | | 1.00 | % | | 2.23 | % | | 79.86 | % | |
Year Ended October 31, 2009 | | 16.75 | %(j) | | | | 1,488 | | | 2.19 | % | | 0.72 | % | | 2.24 | % | | 41.29 | % | |
|
|
|
|
|
|
|
|
|
|
|
|
|
|
|
|
|
|
|
|
|
|
| |
* | Calculated based on average shares outstanding. |
| |
(a) | The per share amounts and percentages reflect income and expenses assuming inclusion of the Fund’s proportionate share of the income and expenses of the applicable HSBC Investor Portfolios, the Fund does not include expenses of the unaffiliated investment companies in which the Fund invests in. |
| |
(b) | Not annualized for periods less than one year. Total return calculations do not include any sales or redemption charges. |
| |
(c) | Annualized for periods less than one year. |
| |
(d) | During the period certain fees were reduced. If such fee reductions had not occurred, the ratio would have been as indicated. |
| |
(e) | Portfolio turnover rate is calculated by aggregating the results of multiplying the Fund’s investment percentage in the respective Portfolios and unaffiliated investment companies by their corresponding portfolio turnover rates. Portfolio turnover rate is calculated on the basis of the Fund as a whole without distinguishing between classes of shares issued. |
| |
(f) | Class A Shares commenced operations on February 3, 2005. |
| |
(g) | Rounds to less than $0.01 or $(0.01). |
| |
(h) | During the year ended October 31, 2007, certain HSBC Investor Portfolios in which the Fund invests in received monies related to certain nonrecurring litigation settlements. The corresponding impact to the total return was 0.41%, 0.41% and 0.33% for Class A Shares, Class B Shares and Class C Shares, respectively. |
| |
(i) | During the year ended October 31, 2008, certain HSBC Investor Portfolios in which the Fund invests in received monies related to certain nonrecurring litigation settlements. The corresponding impact to the total return was 0.19%, 0.19% and 0.19% for Class A Shares, Class B Shares and Class C Shares, respectively. |
| |
(j) | During the year ended October 31, 2009, certain HSBC Investor Portfolios in which the Fund invests in received monies related to certain nonrecurring litigation settlements. The corresponding impact to the total return was 0.09%, 0.09% and 0.09% for Class A Shares, Class B Shares and Class C Shares, respectively. |
| |
(k) | Class B Shares commenced operations on February 1, 2005. |
| |
(l) | Class C Shares commenced operations on June 9, 2005. |
| | |
28 | HSBC INVESTOR LIFELINE FUNDS | See notes to financial statements. |
|
HSBC INVESTOR CONSERVATIVE GROWTH STRATEGY FUND |
|
Financial Highlights |
Selected data for a share outstanding throughout the periods indicated. (a)
| | | | | | | | | | | | | | | | | | | | | | | | | |
| | | | Investment Activities | | Dividends | | | |
| | | |
| |
| | | |
| | Net Asset
Value,
Beginning
of Period | | Net
Investment
Income
(Loss) | | Net Realized
and Unrealized
Gains
(Losses) from
Investment
Transactions | | Total from
Investment
Activities | | Net
Investment
Income | | Net
Realized
Gains from
Investment
Transactions | | Total
Dividends | | Net Asset
Value, End
of Period | |
|
|
|
|
|
|
|
|
|
|
|
|
|
|
|
|
|
|
CLASS A SHARES | | | | | | | | | | | | | | | | | | | | | | | | | |
Period Ended October 31, 2005(j) | | $ | 10.00 | | 0.04 | | | 0.26 | | | 0.30 | | | (0.01 | ) | | — | | | (0.01 | ) | | $ | 10.29 | |
Year Ended October 31, 2006 | | | 10.29 | | 0.22 | | | 0.85 | | | 1.07 | | | (0.25 | ) | | — | | | (0.25 | ) | | | 11.11 | |
Year Ended October 31, 2007 | | | 11.11 | | 0.29 | * | | 1.03 | | | 1.32 | | | (0.27 | ) | | (0.12 | ) | | (0.39 | ) | | | 12.04 | |
Year Ended October 31, 2008 | | | 12.04 | | 0.24 | * | | (2.93 | ) | | (2.69 | ) | | (0.25 | ) | | (0.26 | ) | | (0.51 | ) | | | 8.84 | |
Year Ended October 31, 2009 | | | 8.84 | | 0.14 | * | | 1.16 | | | 1.30 | | | (0.13 | ) | | — | | | (0.13 | ) | | | 10.01 | |
|
|
|
|
|
|
|
|
|
|
|
|
|
|
|
|
|
|
|
|
|
|
|
|
|
|
CLASS B SHARES | | | | | | | | | | | | | | | | | | | | | | | | | |
Period Ended October 31, 2005(k) | | $ | 10.00 | | 0.03 | | | 0.16 | | | 0.19 | | | — | (f) | | — | | | — | (f) | | $ | 10.19 | |
Year Ended October 31, 2006 | | | 10.19 | | 0.15 | | | 0.83 | | | 0.98 | | | (0.16 | ) | | — | | | (0.16 | ) | | | 11.01 | |
Year Ended October 31, 2007 | | | 11.01 | | 0.20 | * | | 1.05 | | | 1.25 | | | (0.20 | ) | | (0.12 | ) | | (0.32 | ) | | | 11.94 | |
Year Ended October 31, 2008 | | | 11.94 | | 0.16 | * | | (2.91 | ) | | (2.75 | ) | | (0.17 | ) | | (0.26 | ) | | (0.43 | ) | | | 8.76 | |
Year Ended October 31, 2009 | | | 8.76 | | 0.07 | * | | 1.15 | | | 1.22 | | | (0.07 | ) | | — | | | (0.07 | ) | | | 9.91 | |
|
|
|
|
|
|
|
|
|
|
|
|
|
|
|
|
|
|
|
|
|
|
|
|
|
|
CLASS C SHARES | | | | | | | | | | | | | | | | | | | | | | | | | |
Period Ended October 31, 2005(l) | | $ | 10.00 | | 0.03 | | | 0.38 | | | 0.41 | | | — | | | — | | | — | | | $ | 10.41 | |
Year Ended October 31, 2006 | | | 10.41 | | 0.15 | | | 0.85 | | | 1.00 | | | (0.17 | ) | | — | | | (0.17 | ) | | | 11.24 | |
Year Ended October 31, 2007 | | | 11.24 | | 0.21 | * | | 1.11 | | | 1.32 | | | (0.19 | ) | | (0.12 | ) | | (0.31 | ) | | | 12.25 | |
Year Ended October 31, 2008 | | | 12.25 | | 0.16 | * | | (2.98 | ) | | (2.82 | ) | | (0.17 | ) | | (0.26 | ) | | (0.43 | ) | | | 9.00 | |
Year Ended October 31, 2009 | | | 9.00 | | 0.07 | * | | 1.18 | | | 1.25 | | | (0.07 | ) | | — | | | (0.07 | ) | | | 10.18 | |
|
|
|
|
|
|
|
|
|
|
|
|
|
|
|
|
|
|
|
|
|
|
|
|
|
|
| | | | | | | | | | | | | | | | | | | |
| | | | Ratios/Supplementary Data | |
| | | |
| |
| | Total
Return(b) | | Net Assets
at End of
Period
(000’s) | | Ratio of Net
Expenses to
Average
Net Assets(c) | | Ratio of Net
Investment
Income
to Average
Net Assets(c) | | Ratio of
Expenses to
Average Net
Assets(c)(d) | | Portfolio
Turnover
Rate(e) | |
|
|
|
|
|
|
|
|
|
|
|
|
|
|
CLASS A SHARES | | | | | | | | | | | | | | | | | | | |
Period Ended October 31, 2005(j) | | 2.96 | % | | $ | 1,054 | | 1.50 | % | | 1.28 | % | | 8.01 | % | | 72.14 | % | |
Year Ended October 31, 2006 | | 10.48 | % | | | 3,069 | | 1.50 | % | | 2.33 | % | | 3.22 | % | | 96.58 | % | |
Year Ended October 31, 2007 | | 12.13 | %(g) | | | 6,669 | | 1.50 | % | | 2.52 | % | | 2.06 | % | | 88.67 | % | |
Year Ended October 31, 2008 | | (23.17 | )%(h) | | | 4,747 | | 1.50 | % | | 2.24 | % | | 1.72 | % | | 68.74 | % | |
Year Ended October 31, 2009 | | 14.95 | %(i) | | | 5,059 | | 1.50 | % | | 1.53 | % | | 1.62 | % | | 34.40 | % | |
|
|
|
|
|
|
|
|
|
|
|
|
|
|
|
|
|
|
|
|
CLASS B SHARES | | | | | | | | | | | | | | | | | | | |
Period Ended October 31, 2005(k) | | 1.92 | % | | $ | 1,306 | | 2.25 | % | | 0.53 | % | | 9.21 | % | | 72.14 | % | |
Year Ended October 31, 2006 | | 9.65 | % | | | 2,567 | | 2.25 | % | | 1.54 | % | | 3.98 | % | | 96.58 | % | |
Year Ended October 31, 2007 | | 11.51 | %(g) | | | 4,928 | | 2.25 | % | | 1.77 | % | | 2.82 | % | | 88.67 | % | |
Year Ended October 31, 2008 | | (23.76 | )%(h) | | | 4,348 | | 2.25 | % | | 1.48 | % | | 2.48 | % | | 68.74 | % | |
Year Ended October 31, 2009 | | 14.05 | %(i) | | | 4,907 | | 2.25 | % | | 0.77 | % | | 2.38 | % | | 34.40 | % | |
|
|
|
|
|
|
|
|
|
|
|
|
|
|
|
|
|
|
|
|
CLASS C SHARES | | | | | | | | | | | | | | | | | | | |
Period Ended October 31, 2005(l) | | 4.10 | % | | $ | 82 | | 2.25 | % | | 0.66 | % | | 7.94 | % | | 72.14 | % | |
Year Ended October 31, 2006 | | 9.66 | % | | | 320 | | 2.25 | % | | 1.56 | % | | 3.92 | % | | 96.58 | % | |
Year Ended October 31, 2007 | | 11.97 | %(g) | | | 437 | | 2.25 | % | | 1.78 | % | | 2.85 | % | | 88.67 | % | |
Year Ended October 31, 2008 | | (23.73 | )%(h) | | | 430 | | 2.25 | % | | 1.46 | % | | 2.48 | % | | 68.74 | % | |
Year Ended October 31, 2009 | | 13.97 | %(i) | | | 485 | | 2.25 | % | | 0.78 | % | | 2.37 | % | | 34.40 | % | |
|
|
|
|
|
|
|
|
|
|
|
|
|
|
|
|
|
|
|
|
| |
* | Calculated based on average shares outstanding. |
| |
(a) | The per share amounts and percentages reflect income and expenses assuming inclusion of the Fund’s proportionate share of the income and expenses of the applicable HSBC Investor Portfolios, the Fund does not include expenses of the unaffiliated investment companies in which the Fund invests in. |
| |
(b) | Not annualized for periods less than one year. Total return calculations do not include any sales or redemption charges. |
| |
(c) | Annualized for periods less than one year. |
| |
(d) | During the period certain fees were reduced. If such fee reductions had not occurred, the ratio would have been as indicated. |
| |
(e) | Portfolio turnover rate is calculated by aggregating the results of multiplying the Fund’s investment percentage in the respective Portfolios and unaffilated investment companies by their corresponding portfolio turnover rates. Portfolio turnover rate is calculated on the basis of the Fund as a whole without distinguishing between classes of shares issued. |
| |
(f) | Rounds to less than $0.01. |
| |
(g) | During the year ended October 31, 2007, certain HSBC Investor Portfolios in which the Fund invests in received monies related to certain nonrecurring litigation settlements. The corresponding impact to the total return was 0.44%, 0.47% and 0.48% for Class A Shares, Class B Shares and Class C Shares, respectively. |
| |
(h) | During the year ended October 31, 2008, certain HSBC Investor Portfolios in which the Fund invests in received monies related to certain nonrecurring litigation settlements. The corresponding impact to the total return was 0.19%, 0.19% and 0.19% for Class A Shares, Class B Shares and Class C Shares, respectively. |
| |
(i) | During the year ended October 31, 2009, certain HSBC Investor Portfolios in which the Fund invests in received monies related to certain nonrecurring litigation settlements. The corresponding impact to the total return was 0.08%, 0.08% and 0.08% for Class A Shares, Class B Shares and Class C Shares, respectively. |
| |
(j) | Class A Shares commenced operations on February 23, 2005. |
| |
(k) | Class B Shares commenced operations on February 17, 2005. |
| |
(l) | Class C Shares commenced operations on April 19, 2005. |
| | |
See notes to financial statements. | HSBC INVESTOR LIFELINE FUNDS | 29 |
|
HSBC INVESTOR LIFELINE FUNDS |
|
Notes to Financial Statements—As of October 31, 2009 |
| |
1. | Organization: |
| |
| The HSBC Investor Funds (the “Trust”), a Massachusetts business trust organized on April 22, 1987, is registered under the Investment Company Act of 1940, as amended (the “Act”), as an open-end management investment company. As of October 31, 2009, the Trust is comprised of 15 separate operational funds, each a series of the HSBC Investor Family of Funds. The accompanying financial statements are presented for the following 4 funds (individually a “Fund”, collectively the “LifeLine Funds”): |
| | |
| Fund | Short Name |
|
|
|
| HSBC Investor Aggressive Growth Strategy Fund | Aggressive Growth Fund |
| HSBC Investor Growth Strategy Fund | Growth Strategy Fund |
| HSBC Investor Moderate Growth Strategy Fund | Moderate Growth Fund |
| HSBC Investor Conservative Growth Strategy Fund | Conservative Growth Fund |
| |
| The LifeLine Funds are diversified series of the Trust and part of the HSBC Investor Family of Funds. Financial statements for all other funds of the HSBC Investor Family of Funds are published separately. |
| |
| The LifeLine Funds are funds of funds that invest in other funds in the HSBC Investor Family of Funds, as well as mutual funds that are not affiliated with the HSBC Investor Family of Funds (collectively the ��Underlying Funds”). The LifeLine Funds currently invest in the HSBC Investor Growth Portfolio, HSBC Investor International Equity Portfolio, HSBC Investor Opportunity Portfolio and the HSBC Investor Value Portfolio (individually a “Portfolio,” collectively the “Portfolios”), which are each diversified series of the HSBC Investor Portfolios (the “Portfolio Trust”). The Portfolios operate as master funds in master-feeder arrangements in addition to receiving investments from the LifeLine Funds. |
| |
| The LifeLine Funds also invest in the HSBC Investor Prime Money Market Fund (the “Prime Money Market Fund”), an open-end management investment company that is a diversified series of the Trust. In addition, effective February 9, 2009, the applicable LifeLine Funds began investing in the Goldman Sachs High Yield Fund, Class I (“GS High Yield Fund”), as a replacement to the HSBC Investor High Yield Fixed Income Portfolio. The Goldman Sachs High Yield Fund is an open-end management investment company that is a diversified series of the Goldman Sachs Trust. Effective August 4, 2009, the applicable LifeLine Funds began investing in the Franklin Total Return Fund, Advisor Class (“Franklin Total Return Fund”), an open end management investment company that is a diversified series of the Franklin Investors Securities Trust. |
| |
| The financial statements of the Portfolios, including the Schedules of Portfolio Investments, are included elsewhere in this report. The financial statements of the Portfolios should be read in conjunction with the financial statements of the LifeLine Funds. |
| |
| The LifeLine Funds target portfolio weightings and summary of Underlying Funds are as follows: |
| |
| LifeLine Funds Portfolio Weightings |
| | | | | | | | | | |
| Asset Class of Underlying Funds | | Aggressive
Growth
Fund | | Growth
Strategy
Fund | | Moderate
Growth
Fund | | Conservative
Growth
Fund | |
|
| |
| |
| |
| |
| |
| Large Cap Growth | | 21 | % | 21 | % | 19 | % | 15 | % |
| Large Cap Value | | 21 | % | 21 | % | 18 | % | 14 | % |
| Small-Cap | | 34 | % | 20 | % | 11 | % | 4 | % |
| International Equity | | 23 | % | 20 | % | 15 | % | 10 | % |
| Fixed Income | | None | | 15 | % | 26 | % | 28 | % |
| High Yield Fixed Income | | None | | 2 | % | 5 | % | 8 | % |
| Money Market | | 1 | % | 1 | % | 6 | % | 21 | % |
| | |
| |
| |
| |
| |
| Total | | 100 | % | 100 | % | 100 | % | 100 | % |
| | |
| |
| |
| |
| |
| |
30 | HSBC INVESTOR LIFELINE FUNDS |
|
HSBC INVESTOR LIFELINE FUNDS |
|
Notes to Financial Statements—As of October 31, 2009 (continued) |
LifeLine Funds Portfolio Investments
| | | | | | | | | | | | | | |
| Underlying Funds | | Aggressive
Growth
Fund | | Growth
Strategy
Fund | | Moderate
Growth
Fund | | Conservative
Growth
Fund | |
|
| |
| |
| |
| |
| |
| Growth Portfolio | | $ | 1,995,639 | | $ | 5,866,416 | | $ | 5,966,860 | | $ | 1,552,990 | |
| International Equity Portfolio | | | 2,192,711 | | | 5,604,940 | | | 4,725,863 | | | 1,038,645 | |
| Opportunity Portfolio | | | 3,269,782 | | | 5,654,037 | | | 3,495,961 | | | 419,096 | |
| Value Portfolio | | | 2,018,514 | | | 5,933,586 | | | 5,717,753 | | | 1,466,064 | |
| Prime Money Market Fund | | | 94,361 | | | 280,464 | | | 1,900,737 | | | 2,193,545 | |
| GS High Yield Fund, Class I | | | — | | | 562,785 | | | 1,581,542 | | | 834,248 | |
| Franklin Total Return Fund | | | — | | | 4,236,095 | | | 8,253,809 | | | 2,930,460 | |
| | |
|
| |
|
| |
|
| |
|
| |
| Total | | $ | 9,571,007 | | $ | 28,138,323 | | $ | 31,642,525 | | $ | 10,435,048 | |
| | |
|
| |
|
| |
|
| |
|
| |
| |
| The LifeLine Funds are authorized to issue an unlimited number of shares of beneficial interest with a par value of $0.001 per share. Each Fund offers three classes of shares: Class A Shares, Class B Shares and Class C Shares. Class A Shares of the LifeLine Funds have a maximum sales charge of 5.00% as a percentage of the original purchase price. The Class B Shares of the LifeLine Funds are offered without any front-end sales charge, but will be subject to a contingent deferred sales charge (“CDSC”) ranging from a maximum of 4.00% if redeemed less than one year after purchase to 0.00% if redeemed more than four years after purchase. Class C Shares of the LifeLine Funds are offered without any front-end sales charge, but will be subject to a maximum CDSC of 1.00% if redeemed less than one year after purchase. Each class of shares in the LifeLine Funds has identical rights and privileges except with respect to arrangements pertaining to shareholder servicing or distribution, class-related expenses, voting rights on matters affecting a single class of shares, and the exchange privileges of each class of shares. |
| |
| Under the Trust’s organizational documents, the LifeLine Funds’ Officers and Trustees are indemnified against certain liabilities arising out of the performance of their duties to the LifeLine Funds. In addition, in the normal course of business, the Trust enters into contracts with its service providers, which also provide for indemnifications by the LifeLine Funds. The LifeLine Funds’ maximum exposure under these arrangements is unknown as this would involve any future claims that may be made against the LifeLine Funds. However, based on experience, the Trust expects that risk of loss to be remote. |
| |
2. | Significant Accounting Policies: |
| |
| The following is a summary of the significant accounting policies followed by the LifeLine Funds in the preparation of their financial statements. The policies are in conformity with U.S. generally accepted accounting principles (“GAAP”). The preparation of financial statements requires management to make certain estimates and assumptions that affect the reported amounts of assets and liabilities and disclosure of contingent assets and liabilities at the date of the financial statements and the reported amounts of increases and decreases in net assets from operations during the reporting period. Actual results could differ from those estimates. Management has evaluated events and transactions through December 21, 2009, the date the financial statements were issued, for purposes of recognition or disclosure in these financial statements. |
| |
| Securities Valuation: |
| |
| The LifeLine Funds record their investments in the Prime Money Market Fund, GS High Yield Fund and Franklin Total Return Fund at the net asset value reported by those funds. The LifeLine Funds record their investments in the Portfolios at fair value. The underlying securities of the Portfolios are recorded at fair value, respectively, as more fully discussed in the notes to those financial statements. Fair value is defined as the price that would be received to sell an asset or paid to transfer a liability in an orderly transaction between market participants at the measurement date. The valuation techniques used to determine fair value in funds or portfolios in which the LifeLine Funds are invested are described in their respective notes to financial statements. |
| |
| Investment Transactions and Related Income: |
| |
| The LifeLine Funds record daily their pro-rata income, expenses and unrealized/realized gains and losses derived from their respective Portfolios. Dividend income is recorded on the ex-dividend date for the Prime Money Market Fund, GS High Yield Fund and Franklin Total Return Fund. Changes in holdings of the Prime Money Market Fund, GS High Yield |
| |
HSBC INVESTOR LIFELINE FUNDS | 31 |
|
HSBC INVESTOR LIFELINE FUNDS |
|
Notes to Financial Statements—As of October 31, 2009 (continued) |
| |
| Fund and the Franklin Total Return Fund for each LifeLine Fund are reflected no later than the first business day following trade date. However, for financial reporting purposes, changes in holdings of the Prime Money Market Fund, GS High Yield Fund and Franklin Total Return Fund are reflected as of trade date. In addition, the LifeLine Funds accrue their own expenses daily as incurred. |
| |
| Allocations: |
| |
| Expenses directly attributable to a Fund are charged to that Fund. Expenses not directly attributable to a Fund are allocated proportionately among various or all funds within the HSBC Investor Family of Funds in relation to the net assets of each fund or on another reasonable basis. Class specific expenses are charged directly to the class incurring the expense. In addition, income, expenses (other than class specific expenses), and unrealized/realized gains and losses are allocated to each class based on relative net assets on a daily basis. |
| |
| Dividends to Shareholders: |
| |
| Dividends to shareholders from net investment income, if any, are declared and distributed quarterly in the case of the Moderate Growth Fund and Conservative Growth Fund, and annually in the case of the Aggressive Growth Fund and Growth Strategy Fund. |
| |
| The LifeLine Funds’ net realized gains, if any, are distributed to shareholders at least annually. Additional distributions are also made to the LifeLine Funds’ shareholders to the extent necessary to avoid the federal excise tax on certain undistributed income and net capital gains of regulated investment companies. |
| |
| The amount and character of net investment income and net realized gains distributions are determined in accordance with federal income tax regulations which may differ from GAAP. These “book/tax” differences are either considered temporary or permanent in nature. To the extent these differences are permanent in nature (e.g., reclassification of market discounts, certain gain/loss, paydowns, and certain distributions), such amounts are reclassified within the composition of net assets; temporary differences (e.g., wash losses and post-October loss deferrals) do not require reclassification. The LifeLine Funds may utilize equalization accounting for tax purposes and designate earnings and profits, including net realized gains distributed to shareholders on redemption of shares, as a part of the dividends paid deduction for income tax purposes. To the extent distributions to shareholders from net investment income and net realized gains exceed net investment income and net realized gains for tax purposes, they are reported as distributions of capital. |
| |
| Redemption Fee: |
| |
| A redemption fee of 2.00% will be charged and recorded as paid-in-capital for any shares redeemed or exchanged after holding them for less than 30 days. This fee does not apply to shares purchased through reinvested dividends or capital gains or shares held in certain omnibus accounts or retirement plans that cannot implement the fee. The Trustees have approved the removal of such redemption fee effective February 28, 2010. For the fiscal years ended October 31, 2008 and October 31, 2009, respectively, the following LifeLine Funds collected redemption fees as follows: |
| | | | | | | | | | |
| Fund | | Fees Collected
October 31, 2008 | | Fees Collected
October 31, 2009 | |
|
| |
| |
| |
| Aggressive Growth Fund | | $ | 119 | | | $ | 47 | | |
| Growth Strategy Fund | | | 1,152 | | | | 431 | | |
| Moderate Growth Fund | | | 187 | | | | 259 | | |
| Conservative Growth Fund | | | 2,849 | | | | 63 | | |
| |
| Federal Income Taxes: |
| |
| Each Fund is a separate taxable entity for federal income tax purposes. Each Fund has qualified and intends to continue to qualify each year as a “regulated investment company” under Subchapter M of the Internal Revenue Code, as amended, and to distribute substantially all of their taxable net investment income and net realized gains, if any, to their shareholders. Accordingly, no provision for federal income or excise tax is required. |
| |
| Management of the Funds has reviewed tax positions taken in tax years that remain subject to examination by all major tax jurisdictions, including federal (i.e., the last four tax year ends and the interim tax period since then, as applicable). Management believes that there is no tax liability resulting from unrecognized tax benefits related to uncertain tax positions taken. |
| |
32 | HSBC INVESTOR LIFELINE FUNDS |
|
HSBC INVESTOR LIFELINE FUNDS |
|
Notes to Financial Statements—As of October 31, 2009 (continued) |
| | | |
| New Accounting Pronouncements: |
| | |
| In June 2009, the Financial Accounting Standards Board (“FASB”) issued Accounting Standard Codification 105-10, “The FASB Accounting Standards Codification and the Hierarchy of Generally Accepted Accounting Principles – a replacement of FASB Statement No. 162” (“ASC 105-10, formerly “SFAS 168”). ASC 105-10 replaces SFAS No. 162, “The Hierarchy of Generally Accepted Accounting Principles” and establishes the “FASB Accounting Standards Codification” (“Codification”) as the source of authoritative accounting principles recognized by the FASB to be applied by nongovernmental entities in the preparation of financial statements in conformity with U.S. GAAP. All guidance contained in the Codification carries an equal level of authority. The Codification supersedes all existing non-SEC accounting and reporting standards. All other non-grandfathered non-SEC accounting literature not included in the Codification will become nonauthoritative. ASC 105-10 is effective for financial statements issued for interim and annual periods ending after September 15, 2009. The LifeLine Funds adopted ASC 105-10 in the current reporting period. Management has evaluated this new statement and has determined that it did not have a significant impact on the determination or reporting of the LifeLine Funds’ financial statements. |
| | |
3. | Investment Valuation Summary |
| | |
| The valuation techniques employed by the LifeLine Funds, as described in Note 2 above, maximize the use of observable inputs and minimize the use of unobservable inputs in determining fair value. The inputs used for valuing the LifeLine Funds’ investments are summarized in the three broad levels listed below: |
| | | |
| | • | Level 1: quoted prices in active markets for identical assets |
| | | |
| | • | Level 2: other significant observable inputs (including quoted prices for similar securities, interest rates, prepayments speeds, credit risk, etc.) |
| | | |
| | • | Level 3: significant unobservable inputs (including the Fund’s own assumptions in determining the fair value of investments) |
| | |
| The inputs or methodology used for valuing investments are not necessarily an indication of the risk associated with investing in those investments. For example, short-term debt securities of sufficient credit quality maturing in sixty days or less are generally valued at amortized cost, which approximates fair value. Generally, amortized cost approximates the current fair value of a security, but since the valuation is not obtained from a quoted price in an active market, such securities are reflected as Level 2. |
| | |
| The Schedules of Portfolio Investments for the Portfolios include additional information regarding the investments for the LifeLine Funds. The following is a summary of the valuation inputs used as of October 31, 2009 in valuing the LifeLine Funds’ investments based upon the three levels defined above: |
| | | | | | | | | | |
| | LEVEL 1 | | LEVEL 2 | | TOTAL
INVESTMENTS | |
| |
| |
| |
| |
Aggressive Growth Strategy Fund | | | | | | | | | | |
Investments: | | | | | | | | | | |
Affiliated Investment Companies | | $ | 94,361 | | $ | 9,476,646 | | $ | 9,571,007 | |
| |
|
| |
|
| |
|
| |
Total Investments | | $ | 94,361 | | $ | 9,476,646 | | $ | 9,571,007 | |
| |
|
| |
|
| |
|
| |
| | | | | | | | | | |
Growth Strategy Fund | | | | | | | | | | |
Investments: | | | | | | | | | | |
Affiliated Investment Companies | | $ | 280,464 | | $ | 23,058,979 | | $ | 23,339,443 | |
Unaffiliated Investment Companies | | | 4,798,880 | | | — | | | 4,798,880 | |
| |
|
| |
|
| |
|
| |
Total Investments | | $ | 5,079,344 | | $ | 23,058,979 | | $ | 28,138,323 | |
| |
|
| |
|
| |
|
| |
| |
HSBC INVESTOR LIFELINE FUNDS | 33 |
|
HSBC INVESTOR LIFELINE FUNDS |
|
Notes to Financial Statements—As of October 31, 2009 (continued) |
| | | | | | | | | | |
| | LEVEL 1 | | LEVEL 2 | | TOTAL
INVESTMENTS | |
| |
| |
| |
| |
Moderate Growth Strategy Fund | | | | | | | | | | |
Investments: | | | | | | | | | | |
Affiliated Investment Companies | | $ | 1,900,737 | | $ | 19,906,437 | | $ | 21,807,174 | |
Unaffiliated Investment Companies | | | 9,835,351 | | | — | | | 9,835,351 | |
| |
|
| |
|
| |
|
| |
Total Investments | | $ | 11,736,088 | | $ | 19,906,437 | | $ | 31,642,525 | |
| |
|
| |
|
| |
|
| |
| | | | | | | | | | |
Conservative Growth Strategy Fund | | | | | | | | | | |
Investments: | | | | | | | | | | |
Affiliated Investment Companies | | $ | 2,193,545 | | $ | 4,476,794 | | $ | 6,670,339 | |
Unaffiliated Investment Companies | | | 3,764,709 | | | — | | | 3,764,709 | |
| |
|
| |
|
| |
|
| |
Total Investments | | $ | 5,958,254 | | $ | 4,476,794 | | $ | 10,435,048 | |
| |
|
| |
|
| |
|
| |
| |
4. | Related Party Transactions and Other Agreements and Plans: |
| |
| Investment Management: |
| |
| HSBC Global Asset Management (USA) Inc. (“HSBC” or the “Investment Adviser”), a wholly owned subsidiary of HSBC Bank USA, N.A., a national bank organized under the laws of the United States, acts as Investment Adviser to the LifeLine Funds. As Investment Adviser, HSBC manages the investments of the LifeLine Funds and continuously reviews, supervises and administers the LifeLine Funds’ investments. For its services as Investment Adviser, HSBC is entitled to receive a fee, computed daily and paid monthly, based on average daily net assets, at an annual rate of 0.05% for each Fund. The Investment Adviser is currently waiving all of the fee for each of the LifeLine Funds. Any voluntary fee waivers/reimbursements are not subject to recoupment in subsequent fiscal periods. Voluntary waivers/reimbursements may be stopped at any time. |
| |
| Administration: |
| |
| HSBC serves the LifeLine Funds as Administrator. Under the terms of the Administration Agreement, HSBC received from the LifeLine Funds (as well as the other funds in the HSBC Investor Family of Funds) a fee, accrued daily and paid monthly, during the period November 1, 2008 to December 31, 2008, at an annual rate of: |
| | | | |
Based on Average Daily Net Assets of | | Fee Rate | |
| |
| |
Up to $12 billion | | 0.0525 | % | |
In excess of $12 billion | | 0.0350 | % | |
| |
| Effective January 1, 2009, the terms of the Administration Agreement were amended. Pursuant to the amended Administration Agreement, HSBC receives from the LifeLine Funds (as well as the other funds in the HSBC Investor Family of Funds) a fee, accrued daily and paid monthly, at an annual rate of: |
| | | | |
Based on Average Daily Net Assets of | | Fee Rate | |
| |
| |
Up to $10 billion | | 0.0550 | % | |
In excess of $10 billion but not exceeding $20 billion | | 0.0350 | % | |
In excess of $20 billion but not exceeding $50 billion | | 0.0275 | % | |
In excess of $50 billion | | 0.0250 | % | |
| |
| The fee breakpoints are determined on the basis of the aggregate average daily net assets of the HSBC Investor Family of Funds. The fee is allocated to each series of the HSBC Investor Family of Funds based upon its pro-rata share of net assets. For assets invested in underlying Portfolios by LifeLine Funds, the Portfolios pay half of the administration fee and the LifeLine Funds pay half, for a combination of the total fee rate above. Certain administration fees of the Portfolios also may be reduced by treating them as apportioned in part to other funds making investments in the Portfolios in master-feeder structures. An amount equal to 50% of the administration fees is deemed to be class-specific. |
| |
| Pursuant to a Sub-Administration Agreement with HSBC, Citi Fund Services Ohio, Inc. (“Citi Ohio”), a wholly-owned subsidiary of Citigroup, Inc., serves as the Sub-Administrator for the Trust and the HSBC Investor Family of Funds |
| |
34 | HSBC INVESTOR LIFELINE FUNDS |
|
HSBC INVESTOR LIFELINE FUNDS |
|
Notes to Financial Statements—As of October 31, 2009 (continued) |
| |
| (collectively, the “Trusts”) subject to the general supervision of the Trusts’ Board of Trustees and HSBC. For these services, Citi Ohio is entitled to a fee, payable by HSBC, at an annual rate equivalent to the fee rates set forth above, minus 0.02% (2 basis points) which is retained by HSBC. |
| |
| Under a Compliance Services Agreement between the Trusts and Citi Ohio (the “CCO Agreement”), Citi Ohio makes an employee available to serve as the Trusts’ Chief Compliance Officer (the “CCO”). Under the CCO Agreement, Citi Ohio also provides infrastructure and support in implementing the written policies and procedures comprising the Trusts’ compliance program, including support services to the CCO. For the services provided under the CCO Agreement, the HSBC Investor Family of Funds paid Citi Ohio $266,099 for the year ended October 31, 2009, plus reimbursement of certain out of pocket expenses. Expenses incurred by each Fund are reflected on the Statements of Operations as “Compliance Services.” Citi Ohio pays the salary and other compensation earned by individuals performing these services, as employees of Citi Ohio. |
| |
| Distribution Arrangements: |
| |
| Foreside Distribution Services, L.P. (“Foreside”), a wholly-owned subsidiary of Foreside Financial Group LLC, serves the Trust as Distributor (the “Distributor”). The Trust has adopted a non-compensatory Distribution Plan and Agreement (the “Distribution Plan”) pursuant to Rule 12b-1 of the Act. The Distribution Plan provides for reimbursement of expenses incurred by the Distributor related to distribution and marketing, at a rate not to exceed 0.25%, 1.00%, and 1.00% of the average daily net assets of Class A Shares (currently not being charged), Class B Shares (currently charging 0.75%), and Class C Shares (currently charging 0.75%) of the LifeLine Funds, respectively. Foreside, as Distributor, also received $222,439, $151,254, and $10,302 in commissions from sales of HSBC Investor Family of Funds, for Class A Shares, Class B Shares, and Class C Shares, respectively of which $75, $12, and $0 were reallocated to HSBC-affiliated brokers and dealers, for Class A Shares, Class B Shares, and Class C Shares, respectively. |
| |
| Shareholder Servicing: |
| |
| The Trust has adopted a Shareholder Services Plan which provides for payments to shareholder servicing agents (which primarily consist of HSBC and its affiliates) for providing various shareholder services. For performing these services, the shareholder servicing agents receive a fee up to 0.25%, 0.25% and 0.25% that is computed daily and paid monthly of the average daily net assets of Class A Shares, Class B Shares and Class C Shares of the LifeLine Funds, respectively. The fees paid to the Distributor pursuant to the Distribution Plan and to shareholder servicing agents pursuant to the Shareholder Services Plan currently are not intended to exceed, in the aggregate, 0.25% of the average daily net assets of Class A Shares and 1.00% of the average daily net assets of Class B Shares and Class C Shares. |
| |
| Fund Accounting, Transfer Agency and Trustees: |
| |
| Citi Ohio provides fund accounting and transfer agency services for the Trusts. As transfer agent, Citi Ohio receives a fee based on the number of funds and shareholder accounts, subject to certain minimums and reimbursement of certain expenses. As fund accountant, Citi Ohio receives an annual fee per fund and share class, subject to minimums and reimbursement of certain expenses. |
| |
| Each non-interested Trustee is compensated with a $60,000 annual Board retainer for service as a Trustee of the Trusts and Portfolio Trust, as well as a $3,000 annual retainer for each Committee of the Board of the Trusts and Portfolio Trust. Each non-interested Trustee also receives a $5,000 and $3,000 meeting fee for each regular in-person Board meeting and Committee meeting, respectively. Furthermore, each non-interested Trustee receives compensation for attending special meetings and/or functioning as a Committee or Board Chairperson. In addition, the non-interested Trustees are reimbursed for certain expenses incurred in connection with their Board membership. |
| |
| Fee Reductions: |
| |
| The Investment Adviser has agreed to contractually limit through March 1, 2010 the total expenses, exclusive of interest, taxes, brokerage commissions, and extraordinary expenses of the LifeLine Funds. Each Fund Class has its own expense limitations based on the average daily net assets for any full fiscal year as follows: Class A Shares 1.50%, Class B Shares 2.25%, Class C Shares 2.25%. |
| |
| Any amounts contractually waived or reimbursed by the Investment Adviser will be subject to repayment by the Fund to the Investment Adviser within three years to the extent that the repayment will not cause the Fund’s operating expenses to exceed the contractual expense limit that was in effect at the time of such waiver or reimbursement. During |
| |
HSBC INVESTOR LIFELINE FUNDS | 35 |
|
HSBC INVESTOR LIFELINE FUNDS |
|
Notes to Financial Statements—As of October 31, 2009 (continued) |
| |
| the year ended October 31, 2009, the Investment Adviser did not recapture any of its prior contractual waivers or reimbursements. As of October 31, 2009, the repayments that may potentially be made by the Funds are as follows: |
| | | | | | | | | | | |
Fund | | | 2012($) | | 2011($) | | 2010($) | |
| | |
| |
| |
| |
Aggressive Growth Fund | | | 49,257 | | | 51,467 | | | 71,425 | |
Growth Strategy Fund | | | 3,289 | | | — | | | 29,729 | |
Moderate Growth Fund | | | — | | | — | | | 14,225 | |
Conservative Growth Fund | | | 6,592 | | | 20,961 | | | 40,321 | |
| |
| The Administrator and Citi Ohio may voluntarily waive/reimburse fees to help support the expense limits of each Fund. In addition, the Investment Adviser may waive/reimburse additional fees at their discretion. Any voluntary fee waivers/reimbursements are not subject to recoupment in subsequent fiscal periods. Voluntary waivers/reimbursements may be stopped at any time. Amounts waived/reimbursed by the Investment Adviser, Administrator, and Citi Ohio are reported separately on the Statements of Operations, as applicable. |
| |
5. | Investment Transactions: |
| |
| Aggregate contributions and withdrawals of the Underlying Portfolios for the year ended October 31, 2009 totaled: |
| | | | | | | |
| | Contributions | | Withdrawals | |
| |
| |
| |
Aggressive Growth Fund | | $ | 1,447,942 | | $ | (1,488,474 | ) |
Growth Strategy Fund | | | 7,761,778 | | | (8,532,057 | ) |
Moderate Growth Fund | | | 14,521,430 | | | (15,831,571 | ) |
Conservative Growth Fund | | | 7,532,723 | | | (8,118,122 | ) |
| |
| Purchases and sales of securities (excluding securities maturing less than one year from acquisition) for the year ended October 31, 2009 were as follows: |
| | | | | | |
Fund | Purchases | | Sales | |
|
| |
| |
Growth Strategy Fund | $ | 4,616,544 | | $ | 107,272 | |
Moderate Growth Fund | $ | 9,435,634 | | $ | 295,318 | |
Conservative Growth Fund | $ | 3,766,261 | | $ | 334,595 | |
| |
6. | Federal Tax Information: |
| |
| At October 31, 2009, the cost basis of securities (which excludes investments in the Affiliated Portfolios) for federal income tax purposes, gross unrealized appreciation, gross unrealized depreciation and net unrealized appreciation/depreciation were as follows: |
| | | | | | | | | | | | | | |
Fund | | | Tax Cost
of Securities ($) | | Tax Unrealized
Appreciation ($) | | Tax Unrealized
Depreciation ($) | | Net Unrealized
Appreciation/
(Depreciation) ($) | |
| | |
| |
| |
| |
| |
Aggressive Growth Fund | | | 94,361 | | | — | | | — | | | — | |
Growth Strategy Fund | | | 4,799,854 | | | 279,490 | | | — | | | 279,490 | |
Moderate Growth Strategy Fund | | | 11,077,518 | | | 658,570 | | | — | | | 658,570 | |
Conservative Growth Strategy Fund | | | 5,663,991 | | | 294,262 | | | — | | | 294,262 | |
| |
| The tax character of dividends paid by the LifeLine Funds for the year ended October 31, 2009 was as follows: |
| | | | | | | | | | | | | | | | |
| | Distributions paid from | | | |
| |
| | | |
| | Ordinary
Income | | Net
Long-Term
Gains | | Total Taxable
Dividends | | Return of
Capital | | Total
Dividends Paid* | |
| |
| |
| |
| |
| |
| |
Aggressive Growth Fund | | $ | — | | $ | — | | $ | — | | $ | — | | $ | — | |
Growth Strategy Fund | | | 148,995 | | | — | | | 148,995 | | | — | | | 148,995 | |
Moderate Growth Fund | | | 287,613 | | | — | | | 287,613 | | | — | | | 287,613 | |
Conservative Growth Fund | | | 109,163 | | | — | | | 109,163 | | | — | | | 109,163 | |
| |
36 | HSBC INVESTOR LIFELINE FUNDS |
|
HSBC INVESTOR LIFELINE FUNDS |
|
Notes to Financial Statements—As of October 31, 2009 (continued) |
| |
| The tax character of dividends paid by the LifeLine Funds for the year ended October 31, 2008 was as follows: |
| | | | | | | | | | | | | | | | |
| | Distributions paid from | | | |
| |
| | | |
| | Ordinary
Income | | Net
Long-Term
Gains | | Total Taxable
Dividends | | Return of
Capital | | Total
Dividends Paid* | |
| |
| |
| |
| |
| |
| |
Aggressive Growth Fund | | $ | 87,226 | | $ | 667,264 | | $ | 754,490 | | $ | 3,134 | | $ | 757,624 | |
Growth Strategy Fund | | | 434,489 | | | 1,575,492 | | | 2,009,981 | | | — | | | 2,009,981 | |
Moderate Growth Fund | | | 686,794 | | | 1,257,947 | | | 1,944,741 | | | 40,611 | | | 1,985,352 | |
Conservative Growth Fund | | | 265,882 | | | 228,458 | | | 494,340 | | | 527 | | | 494,867 | |
| |
|
* | Total dividends paid may differ from the amount reported in the Statement of Changes in Net Assets because dividends are recognized when actually paid for tax purposes. |
| |
| As of October 31, 2009, the components of accumulated earnings/(deficit) on a tax basis for the LifeLine Funds were as follows: |
| | | | | | | | | | | | | | | | | | | | | | |
| | Undistributed
Ordinary
Income | | Undistributed
Long Term
Capital
Gains (Losses) | | Accumulated
Earnings | | Dividends
Payable | | Accumulated
Capital and
Other Losses | | Unrealized
Appreciation
(Depreciation) (1) | | Total
Accumulated
Earnings/
(Deficit) | |
| |
| |
| |
| |
| |
| |
| |
| |
Aggressive Growth Fund | | $ | — | | $ | — | | $ | — | | $ | — | | $ | (2,039,823 | ) | $ | (112,786 | ) | $ | (2,152,609 | ) |
Growth Strategy Fund | | | 122,678 | | | — | | | 122,678 | | | — | | | (5,334,226 | ) | | 35,461 | | | (5,176,087 | ) |
Moderate Growth Fund | | | 46,429 | | | — | | | 46,429 | | | — | | | (5,325,093 | ) | | 500,828 | | | (4,777,836 | ) |
Conservative Growth Fund | | | 11,295 | | | — | | | 11,295 | | | — | | | (1,518,116 | ) | | 269,453 | | | (1,237,368 | ) |
| |
|
(1) | The differences between book-basis and tax-basis unrealized appreciation/depreciation are attributable primarily to: tax deferral of losses on wash sales, the realization for tax purposes of unrealized gains/losses on certain derivative instruments, the difference between book and tax amortization methods for premium and market discount, the realization for tax purposes of unrealized gains/losses on investments in passive foreign investment companies, and the return of capital adjustments from real estate investment trusts. |
| |
| As of October 31, 2009, the following LifeLine Funds have net capital loss carryforwards, which are available to offset future realized gains, if any, to the extent provided by the Treasury regulations. To the extent that these carryforwards are used to offset future capital gains, it is probable that the gains that are offset will not be distributed to shareholders. |
| | | | | | | |
Fund | | Amount | | Expires | |
Aggressive Growth Fund | | $ | 911,837 | | | 2016 | |
| | | 1,127,986 | | | 2017 | |
Growth Strategy Fund | | | 2,102,771 | | | 2016 | |
| | | 3,231,455 | | | 2017 | |
Moderate Growth Fund | | | 1,920,789 | | | 2016 | |
| | | 3,404,304 | | | 2017 | |
Conservative Growth Fund | | | 522,074 | | | 2016 | |
| | | 996,042 | | | 2017 | |
| |
7. | Legal and Regulatory Matters: |
| |
| On September 26, 2006, BISYS Fund Services, Inc. (“BISYS”), an affiliate of BISYS Fund Services Ohio, Inc. which provided various services to the Funds, reached a settlement with the Securities and Exchange Commission (“the SEC”) regarding the SEC’s investigation related to BISYS’ past payment of certain marketing and other expenses with respect to certain of its mutual fund clients. Although BISYS has reached a settlement with the SEC, the Funds’ management is not aware that any determination has been made as to how the BISYS settlement monies will be distributed. While the Funds’ management is currently unable to determine the impact, if any, of such matters on the |
| |
HSBC INVESTOR LIFELINE FUNDS | 37 |
|
HSBC INVESTOR LIFELINE FUNDS |
|
Notes to Financial Statements—As of October 31, 2009 (continued) |
| |
| Funds or the Funds’ financial statements, management does not anticipate a material, adverse impact to the Funds or the Funds’ financial statements. |
| |
8. | Subsequent Events (Unaudited) |
| |
| On September 14, 2009, the Board of Trustees (the “Board”) of the HSBC Investor LifeLine Funds (collectively, the “Funds”) approved a proposal to restructure and rebrand the Funds as the HSBC Investor World Selection Funds. In addition, the Board approved changes to each Fund’s investment strategies and certain other aspects of the Fund’s operations that will become effective as of December 30, 2009. |
| |
38 | HSBC INVESTOR LIFELINE FUNDS |
REPORT OF INDEPENDENT REGISTERED PUBLIC ACCOUNTING FIRM
To the Shareholders and Board of Trustees
of HSBC Investor LifeLine Funds:
We have audited the accompanying statements of assets and liabilities of HSBC Investor LifeLine Funds – HSBC Investor Aggressive Growth Strategy Fund, HSBC Investor Growth Strategy Fund, HSBC Investor Moderate Growth Strategy Fund and HSBC Investor Conservative Growth Strategy Fund (the Funds), as of October 31, 2009, and the related statements of operations for the year then ended, the statements of changes in net assets for each year in the two-year period then ended and the financial highlights for each period in the five-year period then ended. These financial statements and financial highlights are the responsibility of the Funds’ management. Our responsibility is to express an opinion on these financial statements and financial highlights based on our audits.
We conducted our audits in accordance with the standards of the Public Company Accounting Oversight Board (United States). Those standards require that we plan and perform the audits to obtain reasonable assurance about whether the financial statements and financial highlights are free of material misstatement. An audit includes examining, on a test basis, evidence supporting the amounts and disclosures in the financial statements. Our procedures included confirmation of securities owned as of October 31, 2009, by correspondence with the respective transfer agents. An audit also includes assessing the accounting principles used and significant estimates made by management, as well as evaluating the overall financial statement presentation. We believe that our audits provide a reasonable basis for our opinion.
In our opinion, the financial statements and financial highlights referred to above present fairly, in all material respects, the financial position of the Funds as of October 31, 2009, the results of their operations for the year then ended, the changes in their net assets for each year in the two-year period then ended, and the financial highlights for each period in the five-year period then ended, in conformity with U.S. generally accepted accounting principles.

Columbus, Ohio
December 21, 2009
| |
HSBC INVESTOR LIFELINE FUNDS | 39 |
|
HSBC INVESTOR LIFELINE FUNDS |
|
Other Federal Income Tax Information (Unaudited): |
| |
| For the year ended October 31, 2009, the following percentages of the total ordinary income dividends paid by the LifeLine Funds qualify for the corporate dividends received deduction available to corporate shareholders: |
| | | | |
Fund | | | Dividends
Received Deduction |
| | |
|
Growth Strategy Fund | | 100.00 | % |
Moderate Growth Strategy Fund | | 44.03 | % |
Conservative Growth Strategy Fund | | 31.54 | % |
| |
| For the year ended October 31, 2009, dividends paid by the LifeLine Funds may be subject to a maximum tax rate of 15%, as provided for by the Jobs and Growth Tax Relief Reconciliation Act of 2003. The LifeLine Funds intend to designate the maximum amount allowable as taxed at a maximum rate of 15%. Complete information will be reported in conjunction with your 2009 Form 1099-DIV: |
| | | | |
Fund | | | Qualified
Dividend Income |
| | |
|
Growth Strategy Fund | | 100.00 | % |
Moderate Growth Strategy Fund | | 92.38 | % |
Conservative Growth Strategy Fund | | 63.22 | % |
| |
40 | HSBC INVESTOR LIFELINE FUNDS |
(This Page Intentionally Left Blank)
|
HSBC INVESTOR LIFELINE FUNDS |
|
Table of Shareholder Expenses—As of October 31, 2009 (Unaudited) |
| |
| As a shareholder of the HSBC Investor LifeLine Funds (“Funds”), you incur two types of costs: (1) transaction costs, including sales charges (loads) on purchases, redemption fees; and exchange fees; (2) ongoing costs, including management fees; distribution and/or shareholder servicing fees; and other Fund expenses. These examples are intended to help you understand your ongoing costs (in dollars) of investing in the Funds and to compare these costs with the ongoing costs of investing in other mutual funds. |
| |
| These examples are based on an investment of $1,000 invested at the beginning of the period and held for the entire period from May 1, 2009 through October 31, 2009. |
| |
| Actual Example |
| |
| The table below provides information about actual account values and actual expenses. You may use the information below, together with the amount you invested, to estimate the expenses that you paid over the period. Simply divide your account value by $1,000 (for example, an $8,600 account value divided by $1,000 = 8.6), then multiply the result by the number in the table under the heading entitled “Expenses Paid During Period” to estimate the expenses you paid on your account during this period. |
| | | | | | | | | | | | | | | | |
| | | | Beginning
Account Value
5/1/09 | | Ending
Account Value
10/31/09 | | Expenses Paid
During Period*
5/1/09 - 10/31/09 | | Annualized
Expense Ratio
During Period
5/1/09 - 10/31/09 |
| | | |
| |
| |
| |
|
Aggressive Growth Strategy Fund | | Class A Shares | | $ | 1,000.00 | | $ | 1,221.60 | | | $ | 8.40 | | | 1.50 | % |
| | Class B Shares | | | 1,000.00 | | | 1,217.30 | | | | 12.57 | | | 2.25 | % |
| | Class C Shares | | | 1,000.00 | | | 1,217.60 | | | | 12.58 | | | 2.25 | % |
Growth Strategy Fund | | Class A Shares | | | 1,000.00 | | | 1,205.10 | | | | 8.34 | | | 1.50 | % |
| | Class B Shares | | | 1,000.00 | | | 1,200.20 | | | | 12.48 | | | 2.25 | % |
| | Class C Shares | | | 1,000.00 | | | 1,200.70 | | | | 12.48 | | | 2.25 | % |
Moderate Growth Strategy Fund | | Class A Shares | | | 1,000.00 | | | 1,177.30 | | | | 7.63 | | | 1.39 | % |
| | Class B Shares | | | 1,000.00 | | | 1,173.30 | | | | 11.67 | | | 2.13 | % |
| | Class C Shares | | | 1,000.00 | | | 1,174.20 | | | | 11.73 | | | 2.14 | % |
Conservative Growth Strategy Fund | | Class A Shares | | | 1,000.00 | | | 1,141.40 | | | | 8.10 | | | 1.50 | % |
| | Class B Shares | | | 1,000.00 | | | 1,136.30 | | | | 12.12 | | | 2.25 | % |
| | Class C Shares | | | 1,000.00 | | | 1,135.80 | | | | 12.11 | | | 2.25 | % |
| | |
|
|
| * | Expenses are equal to the average account value over the period multiplied by the Funds’ annualized expense ratio, multiplied by the number of days in the most recent fiscal half-year divided by the number of days in the fiscal year (to reflect the one half year period). |
| |
42 | HSBC INVESTOR LIFELINE FUNDS |
|
HSBC INVESTOR LIFELINE FUNDS |
|
Table of Shareholder Expenses—As of October 31, 2009 (Unaudited) (continued) |
| |
| Hypothetical Example for Comparison Purposes |
| |
| The table below provides information about hypothetical account values and hypothetical expenses based on the Fund’s actual expense ratio and an assumed rate of return of 5% per year before expenses, which is not the Fund’s actual return. The hypothetical account values and expenses may not be used to estimate the actual ending account balance or expenses you paid for the period. You may use this information to compare this 5% hypothetical example with the 5% hypothetical examples that appear in the shareholder reports of other funds. |
| |
| Please note that the expenses shown in the table are meant to highlight your ongoing costs only and do not reflect any transactional costs, such as sales charges (loads), redemption fees, or exchange fees. Therefore, the table is useful in comparing ongoing costs only, and will not help you determine the relative total costs of owning different funds. In addition, if these transactional costs were included, your costs would have been higher. |
| | | | | | | | | | | | | | | | |
| | | | Beginning
Account Value
5/1/09 | | Ending
Account Value
10/31/09 | | Expenses Paid
During Period*
5/1/09 - 10/31/09 | | Annualized
Expense Ratio
During Period
5/1/09 - 10/31/09 |
| | | |
| |
| |
| |
|
Aggressive Growth Strategy Fund | | Class A Shares | | $ | 1,000.00 | | $ | 1,017.64 | | | $ | 7.63 | | | 1.50 | % |
| | Class B Shares | | | 1,000.00 | | | 1,013.86 | | | | 11.42 | | | 2.25 | % |
| | Class C Shares | | | 1,000.00 | | | 1,013.86 | | | | 11.42 | | | 2.25 | % |
Growth Strategy Fund | | Class A Shares | | | 1,000.00 | | | 1,017.64 | | | | 7.63 | | | 1.50 | % |
| | Class B Shares | | | 1,000.00 | | | 1,013.86 | | | | 11.42 | | | 2.25 | % |
| | Class C Shares | | | 1,000.00 | | | 1,013.86 | | | | 11.42 | | | 2.25 | % |
Moderate Growth Strategy Fund | | Class A Shares | | | 1,000.00 | | | 1,018.20 | | | | 7.07 | | | 1.39 | % |
| | Class B Shares | | | 1,000.00 | | | 1,014.47 | | | | 10.82 | | | 2.13 | % |
| | Class C Shares | | | 1,000.00 | | | 1,014.42 | | | | 10.87 | | | 2.14 | % |
Conservative Growth Strategy Fund | | Class A Shares | | | 1,000.00 | | | 1,017.64 | | | | 7.63 | | | 1.50 | % |
| | Class B Shares | | | 1,000.00 | | | 1,013.86 | | | | 11.42 | | | 2.25 | % |
| | Class C Shares | | | 1,000.00 | | | 1,013.86 | | | | 11.42 | | | 2.25 | % |
| | |
|
|
| * | Expenses are equal to the average account value over the period multiplied by the Funds’ annualized expense ratio, multiplied by the number of days in the most recent fiscal half-year divided by the number of days in the fiscal year (to reflect the one half year period). |
| |
HSBC INVESTOR LIFELINE FUNDS | 43 |
|
Portfolio Reviews |
|
HSBC Investor Growth Portfolio |
by Clark J. Winslow, Chief Executive Officer/Portfolio Manager |
Justin H. Kelly, CFA, Managing Director/Portfolio Manager |
R. Bart Wear CFA, Managing Director/Portfolio Manager |
Winslow Capital Management, Inc. |
The HSBC Investor Growth Portfolio (the “Portfolio”) seeks long-term growth of capital. Under normal market conditions, the Portfolio invests primarily in U.S. and foreign equity securities of high quality companies with market capitalization generally in excess of $2 billion which the subadviser believes have the potential to generate superior levels of long-term profitability and growth.
Investment Concerns
Equity securities (stocks) are more volatile and carry more risk than other forms of investments, including investments in high-grade fixed income securities.
The growth investment style may fall out of favor in the marketplace and result in significant declines in the value of the Portfolio’s securities. Securities of companies considered to be growth investments may have rapid price swings in the event of earnings disappointments or during periods of market, political, regulatory and economics uncertainty.
The net asset value per share of this Portfolio will fluctuate as the value of the securities in the portfolio changes.
Past performance does not guarantee future results.
Market Commentary
The stock market in the beginning of the period declined steeply as a result of the global financial crisis. Intervention by the federal government in the form of fiscal and monetary stimulus programs helped stanch the market downturn, and by early March the stock market began a sustained rally that continued through the end of the period.
The Portfolio benefited from its shift to an overweight position in the information technology and energy sectors, as stocks in those sectors performed well. Stock selection in those sectors and in the financial services sector further boosted the Portfolio’s relative performance. We positioned the Portfolio with a smaller-than-benchmark stake in consumer staples stocks. That strategy also helped the Portfolio outperform its benchmark index, the Russell 1000® Growth Index, as the sector lagged the benchmark during the period.*
The Portfolio maintained a neutral weighting in the small materials sector, but its materials allocation significantly underperformed the benchmark’s allocation. The underperformance was the result of our decision to avoid shares of non-energy, resource-related materials companies. Such shares rebounded sharply in the latter half of the period, fueling much of the sector’s gains.*
| |
* | Portfolio composition is subject to change. |
Past performance does not guarantee future results. The performance data quoted represents past performance and current returns may be lower or higher. Total return figures include change in share price, reinvestment of dividends and capital gains and do not reflect taxes that a shareholder would pay on fund distributions or on the redemption of fund shares. The investment return and principal value will fluctuate so that an investor’s shares, when redeemed may be worth more or less than the original cost. To obtain performance information current to the most recent month end, please call 1-800-782-8183.
| |
44 | HSBC INVESTOR PORTFOLIOS |
| |
| Portfolio Reviews |
|
HSBC Investor International Equity Portfolio |
by Kevin F. Simms | |
Co-CIO International Value Equities and Director of Research – Global and International Value Equities |
AllianceBernstein L.P. | |
The HSBC Investor International Equity Portfolio (the “Portfolio”) seeks to provide its shareholders with long-term growth of capital and future income. Under normal market conditions, the Portfolio invests at least 80% of its net assets in equity securities of companies organized and domiciled in developed nations outside the United States or for which the principal trading market is outside the United States, including Europe, Canada, Australia and the Far East. The Portfolio may invest up to 20% of its assets in equity securities of companies in emerging markets. AllianceBernstein L.P., acting through the Bernstein Value Equities Unit (“AllianceBernstein”), serves as the subadviser to the Portfolio and manages its investments.
Investment Concerns
There are risks associated with investing in foreign companies, such as erratic market conditions, economic and political instability and fluctuations in currency and exchange rates.
Equity securities (stocks) are more volatile and carry more risk than other forms of investments, including investments in high-grade fixed income securities.
The net asset value per share of this Portfolio will fluctuate as the value of the securities in the portfolio changes.
Past performance does not guarantee future results.
Market Commentary
The period was marked by two significantly different environments in the equity markets. The beginning of the period was dominated by stress in the global financial system, including a credit crunch and a contraction of economies around the world. As the period wore on, economies generally stabilized and economic growth resumed.
Stocks fell initially, then rebounded strongly. International stocks performed particularly well as many foreign markets were less affected by the issues that plagued the U.S. market, including overextended consumers and declines in the housing market. Those trends benefited the Portfolio’s absolute return.
We positioned the Portfolio to take advantage of an improving economic environment. That strategy included holding an overweight position relative to the benchmark in sectors such as financials, autos, energy and technology. Those overweight positions boosted relative performance, as did individual stock selection in each of those sectors.*
The Portfolio also maintained a modest allocation to emerging markets stocks, which are absent from the benchmark. Emerging markets were among the period’s best performers, so holding such stocks significantly helped the Portfolio’s relative performance.*
The Portfolio was hurt in relative terms by its underweight position in the consumer cyclical sector. Such stocks benefited as economic fundamentals improved and consumer spending increased. We positioned the Portfolio with an overweight stake in the telecommunications sector, believing that such stocks would benefit from a market rebound. That sector underperformed the benchmark, and dragged on the Portfolio’s relative performance.*
| |
* | Portfolio composition is subject to change. |
Past performance does not guarantee future results. The performance data quoted represents past performance and current returns may be lower or higher. Total return figures include change in share price, reinvestment of dividends and capital gains and do not reflect taxes that a shareholder would pay on fund distributions or on the redemption of fund shares. The investment return and principal value will fluctuate so that an investor’s shares, when redeemed may be worth more or less than the original cost. To obtain performance information current to the most recent month end, please call 1-800-782-8183.
| |
HSBC INVESTOR PORTFOLIOS | 45 |
|
Portfolio Reviews |
|
HSBC Investor Opportunity Portfolio |
by William A. Muggia |
President–Chief Investment Officer |
Westfield Capital Management Company, L.P. |
The HSBC Investor Opportunity Portfolio (the “Portfolio”) seeks to provide its shareholders with long-term growth of capital by investing in equity securities of small cap companies. The Portfolio may also invest in bonds, notes, commercial paper, U.S. Government securities, and foreign securities. Small cap companies generally are defined as those that have market capitalizations within the range of market capitalizations represented in the Russell 2500™ Growth Index.1 The Portfolio may also invest in equity securities of larger, more established companies if they are expected to show increased earnings. The Portfolio employs Westfield Capital Management Company, L.P. as subadviser.
Investment Concerns
Equity securities (stocks) are more volatile and carry more risk than other forms of investments, including investments in high-grade fixed income securities.
The net asset value per share of this Portfolio will fluctuate as the value of the securities in the portfolio changes.
Small-capitalization funds typically carry additional risks since smaller companies generally have a higher risk of failure, and historically, their stocks have experienced a greater degree of market volatility than stocks on average.
Past performance does not guarantee future results.
Market Commentary
The 12-month period consisted of two distinct market and economic environments. In the first half of the period, continued fallout from the financial crisis caused equities to fall sharply. Stocks recovered dramatically in the second half of the period, as investors began to act on their belief that a depression had been averted.
The Portfolio’s performance relative to its benchmark index benefited from certain stock selection decisions. Within the energy sector, the focus on companies with solid fundamentals and strong competitive positions led to investments in coal and oil & gas exploration firms. This emphasis boosted the Portfolio’s performance relative to the benchmark. Stock selection in industrials and technology also boosted relative returns.*
The Portfolio held a smaller position than its benchmark in consumer discretionary stocks. This underweight position dragged on performance relative to the benchmark. The Portfolio did not have a bullish view on the sector as a whole, believing that there was insufficient evidence of improving fundamentals to merit increasing the Portfolio’s consumer discretionary holdings. But investors proved to have a significant appetite for stocks in cyclically sensitive industries. The Portfolio generally did not hold these stocks, so did not benefit from their rally. Stock selection in the financial services sector also weighed on returns relative to the benchmark.*
| |
* | Portfolio composition is subject to change. |
| |
Past performance does not guarantee future results. The performance data quoted represents past performance and current returns may be lower or higher. Total return figures include change in share price, reinvestment of dividends and capital gains and do not reflect taxes that a shareholder would pay on fund distributions or on the redemption of fund shares. The investment return and principal value will fluctuate so that an investor’s shares, when redeemed may be worth more or less than the original cost. To obtain performance information current to the most recent month end, please call 1-800-782-8183. |
| |
46 | HSBC INVESTOR PORTFOLIOS |
|
Portfolio Reviews |
|
HSBC Investor Value Portfolio |
by Jon D. Bosse, CFA |
Chief Investment Officer |
NWQ Investment Management Company, LLC |
The HSBC Investor Value Portfolio (the “Portfolio”) seeks long-term growth of capital and income. Under normal market conditions, the Portfolio invests primarily in U.S. and foreign companies with large and medium capitalizations that the subadviser believes possess opportunities underappreciated or misperceived by the market. The Portfolio employs NWQ Investment Management Company, LLC (“NWQ”) as subadviser.
Investment Concerns
Value-based investments are subject to the risk that the broad market may not recognize their intrinsic value.
Equity securities (stocks) are more volatile and carry more risk than other forms of investments, including investments in high-grade fixed income securities.
The net asset value per share of this Portfolio will fluctuate as the value of the securities in the Portfolio changes.
Past performance does not guarantee future results.
Market Commentary
During the period, global equity markets experienced considerable volatility. During the first half of the period, the U.S. equity markets declined materially due to economic weakness, as well as fears that a number of major money center banks would fail and that the financial system would collapse. The second half saw stabilization within the U.S. and global financial system. Credit spreads tightened dramatically, reflecting lower risk premiums and better-functioning capital markets. These factors, combined with an improvement in the U.S. economy, contributed to a reversal of the U.S. equity market’s first half decline and appreciation.
The Portfolio’s absolute return was enhanced by positive contributions from all sectors except industrials and utilities. The largest contributor to performance came from the Portfolio’s investments in materials, specifically gold and fertilizer stocks. The Portfolio’s overweight position as well as specific holdings contributed to this performance. The second largest contribution came from the Portfolio’s overweight position, relative to the Russell 1000® Value Index1, and stock selection in information technology. Other notable contributors to performance in the Portfolio came from its investments in the energy, financials and consumer staples sectors. Underweight positions, again relative to the Russell 1000® Value Index1, in consumer discretionary and health care shares dragged on relative performance.*
| |
* | Portfolio composition is subject to change. |
| |
1 | For additional information, please refer to the Glossary of Terms. |
Past performance does not guarantee future results. The performance data quoted represents past performance and current returns may be lower or higher. Total return figures include change in share price, reinvestment of dividends and capital gains and do not reflect taxes that a shareholder would pay on fund distributions or on the redemption of fund shares. The investment return and principal value will fluctuate so that an investor’s shares, when redeemed may be worth more or less than the original cost. To obtain performance information current to the most recent month end, please call 1-800-782-8183.
| |
HSBC INVESTOR PORTFOLIOS | 47 |
|
Portfolio Reviews |
|
Franklin Total Return Fund |
The Franklin Total Return Fund (the “Fund”) seeks to provide high, current income consistent with preservation of capital. Capital appreciation over the long term is a secondary goal. It is a multi-sector fixed income fund focused on government and corporate debt securities and mortgage- and asset-backed securities. Some of the Fund’s investments may include securities issued by U.S. government-sponsored entities, such as Fannie Mae and Freddie Mac.
Investment Concerns
Interest rate movements and mortgage prepayments will affect the fund’s share price and yield.
Bond prices generally move in the opposite direction of interest rates. Thus, as the prices of bonds in the fund adjust to a rise in interest rates, the fund’s share price may decline.
The risks associated with higher-yielding, lower-rated securities (commonly called junk bonds) include higher risk of default and loss of principal.
Investing in derivatives, such as financial futures and option contracts, and the use of foreign currency techniques involve special risks and as such may not achieve the anticipated benefits and/or may result in losses to the fund.
Portfolio Performance
The financial markets faced two distinct environments during the 12-month period. Early in the period, the U.S. economy was mired in a recession caused by a credit crunch and a sharp decline in consumer spending. During that time investors sought out relatively safe areas of the financial markets, and particularly favored U.S. Treasury securities. Investors’ flight to safety caused yields on Treasuries to fall to historic lows.
A combination of fiscal and monetary stimulus helped stabilize the economy and the financial markets early in 2009, and investors began seeking out investments with higher return potential. Most fixed-income sectors outperformed Treasuries during the latter half of the period.
During much of the period the Fund benefited from its positions in high-quality corporate bonds and mortgage-backed securities. Such securities performed well as investors sought to capture more yield than Treasuries offered.*
| |
* | Portfolio composition is subject to change. |
| |
1 | For additional information, please refer to the Glossary of Terms. |
| |
48 | HSBC INVESTOR PORTFOLIOS |
|
Portfolio Reviews |
|
Goldman Sachs High Yield Fund |
The Goldman Sachs High Yield Fund (the “Fund”) seeks strong, consistent performance through a total return investment philosophy across the fixed income markets. We utilize total return and risk measurement to concentrate on investor’s capital accumulation and income objectives.
Investment Concerns
Investing in high yield bonds requires extensive research capabilities and disciplined risk management practices resulting in a comprehensive investment process which seeks to improve risk-adjusted returns by reducing default losses.
Equity securities are more volatile than bonds and subject to greater risks. Small- and mid-sized company stocks involve greater risks than those customarily associated with larger companies.
Bonds are subject to interest rate, price and credit risks. Prices tend to be inversely affected by changes in interest rates.
High yield fixed income securities are considered speculative, involve greater risk of default, and tend to be more volatile than investment grade fixed income securities.
Investments in foreign securities entail special risks such as currency, political, economic, and market risks. These risks are heightened in emerging markets.
An investment in real estate securities is subject to greater price volatility and the special risks associated with direct ownership of real estate.
Investments in commodities may be affected by changes in overall market movements, commodity index volatility, changes in interest rates or factors affecting a particular industry or commodity.
Alternative investments such as hedge funds are subject to less regulation than other types of pooled investment vehicles such as mutual funds, may make speculative investments, may be illiquid and can involve a significant use of leverage, making them substantially riskier than the other investments. An alternative investment fund may incur high fees and expenses which would offset trading profits.
Portfolio Performance
The period was marked by two very different environments for high-yield bonds. It began during a severe economic and financial crisis, which led investors to sell risk assets such as high-yield bonds in favor of Treasury bills and other government-backed securities. This trend caused yields to rise and prices to fall on the type of bonds in which this Fund invests, hurting absolute returns. By early 2009, the spread between yields on high-yield and Treasury bonds reached record levels.
Investors’ appetite for risk returned mid-way through the period, following indications that the economy and financial system had begun to stabilize. High-yield bonds surged as investors sought to capture historically high yields, and Fund returns benefited from the rally.
The Fund’s positions in bonds rated CCC and below boosted performance as the markets rebounded. A stake in European bonds also contributed positively to the Fund’s returns during this time.*
| |
* | Portfolio composition is subject to change. |
| |
1 | For additional information, please refer to the Glossary of Terms. |
| |
HSBC INVESTOR PORTFOLIOS | 49 |
|
Portfolio Reviews |
|
Portfolio Composition* |
October 31, 2009
(Unaudited) |
| | | | |
HSBC Investor Growth Portfolio | | | | |
|
|
|
|
|
| | | | |
Investment Allocation | | Percentage of Investments at Value | |
|
|
|
|
Financial Services | | 13.1 | % | |
|
|
|
|
|
Internet Related | | 8.8 | % | |
|
|
|
|
|
Telecommunications | | 8.6 | % | |
|
|
|
|
|
Computers | | 8.4 | % | |
|
|
|
|
|
Pharmaceuticals | | 8.4 | % | |
|
|
|
|
|
Oil & Gas | | 8.0 | % | |
|
|
|
|
|
Retail | | 6.5 | % | |
|
|
|
|
|
Computer Services | | 4.7 | % | |
|
|
|
|
|
Computer Software | | 4.6 | % | |
|
|
|
|
|
Health Care | | 3.7 | % | |
|
|
|
|
|
Cash and Equivalents | | 3.6 | % | |
|
|
|
|
|
Diversified Manufacturing Operations | | 3.4 | % | |
|
|
|
|
|
Transportation | | 3.4 | % | |
|
|
|
|
|
Electronic Components & Semiconductors | | 3.2 | % | |
|
|
|
|
|
Business Services | | 3.0 | % | |
|
|
|
|
|
Aerospace & Defense | | 2.3 | % | |
|
|
|
|
|
Metals & Mining | | 1.7 | % | |
|
|
|
|
|
Biotechnology | | 1.5 | % | |
|
|
|
|
|
Chemicals | | 1.2 | % | |
|
|
|
|
|
Consumer Products | | 1.0 | % | |
|
|
|
|
|
Leisure | | 0.9 | % | |
|
|
|
|
|
Total | | 100.0 | % | |
|
|
|
|
|
| | | | |
HSBC International Equity Portfolio | | | | |
|
|
|
|
|
| | | | |
Investment Allocation | | Percentage of Investments at Value | |
|
|
|
|
Europe | | 71.0 | % | |
|
|
|
|
|
Japan | | 12.0 | % | |
|
|
|
|
|
Australia & Far East | | 11.5 | % | |
|
|
|
|
|
Canada | | 4.0 | % | |
|
|
|
|
|
Cash | | 0.9 | % | |
|
|
|
|
|
Other | | 0.6 | % | |
|
|
|
|
|
Total | | 100.0 | % | |
|
|
|
|
|
| | | | |
HSBC Investor Opportunity Portfolio | | | | |
|
|
|
|
|
| | | | |
Investment Allocation | | Percentage of Investments at Value | |
|
|
|
|
Oil & Gas | | 12.3 | % | |
|
|
|
|
|
Computer Software | | 10.7 | % | |
|
|
|
|
|
Pharmaceuticals | | 10.5 | % | |
|
|
|
|
|
Industrial Manufacturing | | 6.7 | % | |
|
|
|
|
|
Health Care | | 6.5 | % | |
|
|
|
|
|
Telecommunications | | 5.8 | % | |
|
|
|
|
|
Biotechnology | | 5.6 | % | |
|
|
|
|
|
Consumer Products | | 5.3 | % | |
|
|
|
|
|
Retail | | 5.0 | % | |
|
|
|
|
|
Diversified Manufacturing Operations | | 4.3 | % | |
|
|
|
|
|
Financial Services | | 3.9 | % | |
|
|
|
|
|
Electronic Components & Semiconductors | | 3.4 | % | |
|
|
|
|
|
Internet Related | | 3.4 | % | |
|
|
|
|
|
Business Services | | 2.6 | % | |
|
|
|
|
|
Cash and Equivalents | | 2.5 | % | |
|
|
|
|
|
Aerospace & Defense | | 2.3 | % | |
|
|
|
|
|
Environmental Services | | 2.1 | % | |
|
|
|
|
|
Chemicals | | 1.7 | % | |
|
|
|
|
|
Education | | 1.5 | % | |
|
|
|
|
|
Transportation | | 1.5 | % | |
|
|
|
|
|
Communications | | 1.2 | % | |
|
|
|
|
|
Gaming | | 1.2 | % | |
|
|
|
|
|
Total | | 100.0 | % | |
|
|
|
|
|
| | | | |
HSBC Investor Value Portfolio | | | | |
|
|
|
|
|
| | | | |
Investment Allocation | | Percentage of Investments at Value | |
|
|
|
|
Oil & Gas | | 14.8 | % | |
|
|
|
|
|
Pharmaceuticals | | 11.2 | % | |
|
|
|
|
|
Insurance | | 10.4 | % | |
|
|
|
|
|
Telecommunications | | 8.3 | % | |
|
|
|
|
|
Computer Software | | 7.4 | % | |
|
|
|
|
|
Media | | 6.9 | % | |
|
|
|
|
|
Metals & Mining | | 6.8 | % | |
|
|
|
|
|
Aerospace & Defense | | 5.4 | % | |
|
|
|
|
|
Conglomerates | | 3.4 | % | |
|
|
|
|
|
Business Services | | 3.2 | % | |
|
|
|
|
|
Energy | | 3.2 | % | |
|
|
|
|
|
Consumer Products | | 2.9 | % | |
|
|
|
|
|
Cash and Equivalents | | 2.8 | % | |
|
|
|
|
|
Banking | | 2.6 | % | |
|
|
|
|
|
Financial Services | | 2.5 | % | |
|
|
|
|
|
Tobacco | | 2.5 | % | |
|
|
|
|
|
Transportation | | 1.9 | % | |
|
|
|
|
|
Diversified Manufacturing Operations | | 1.6 | % | |
|
|
|
|
|
Agricultural Chemicals | | 1.1 | % | |
|
|
|
|
|
Retail | | 1.1 | % | |
|
|
|
|
|
Total | | 100.0 | % | |
|
|
|
|
|
| |
* | Portfolio composition is subject to change. |
| |
50 | HSBC INVESTOR PORTFOLIOS |
(This Page Intentionally Left Blank)
|
HSBC INVESTOR GROWTH PORTFOLIO |
|
|
Schedule of Portfolio Investments—As of October 31, 2009 |
| | | | | | | |
Common Stocks—96.6% | | | | | | | |
|
| | | | | | | |
| | Shares | | Value($) | |
| |
| |
| |
Aerospace & Defense – 2.3% | | | | | | | |
United Technologies Corp. | | | 33,100 | | | 2,033,995 | |
| | | | |
|
| |
Biotechnology – 1.5% | | | | | | | |
Gilead Sciences, Inc. (a) | | | 31,600 | | | 1,344,580 | |
| | | | |
|
| |
Business Services – 3.0% | | | | | | | |
Aecom Technology Corp. (a) | | | 26,100 | | | 658,764 | |
MasterCard, Inc., Class A | | | 9,000 | | | 1,971,180 | |
| | | | |
|
| |
| | | | | | 2,629,944 | |
| | | | |
|
| |
Chemicals – 1.2% | | | | | | | |
Monsanto Co. | | | 15,300 | | | 1,027,854 | |
| | | | |
|
| |
Computer Services – 4.7% | | | | | | | |
Accenture plc, Class A | | | 28,700 | | | 1,064,196 | |
Cognizant Technology Solutions Corp. (a) | | | 79,000 | | | 3,053,350 | |
| | | | |
|
| |
| | | | | | 4,117,546 | |
| | | | |
|
| |
Computer Software – 4.6% | | | | | | | |
Adobe Systems, Inc. (a) | | | 28,700 | | | 945,378 | |
Microsoft Corp. | | | 54,800 | | | 1,519,604 | |
Oracle Corp. | | | 77,100 | | | 1,626,810 | |
| | | | |
|
| |
| | | | | | 4,091,792 | |
| | | | |
|
| |
Computers – 8.4% | | | | | | | |
Apple, Inc. (a) | | | 18,900 | | | 3,562,650 | |
Hewlett-Packard Co. | | | 64,301 | | | 3,051,725 | |
International Business Machines Corp. | | | 6,800 | | | 820,148 | |
| | | | |
|
| |
| | | | | | 7,434,523 | |
| | | | |
|
| |
Consumer Products – 1.0% | | | | | | | |
Ecolab, Inc. | | | 19,100 | | | 839,636 | |
| | | | |
|
| |
Diversified Manufacturing Operations – 3.4% | | | | | | | |
Danaher Corp. | | | 31,200 | | | 2,128,776 | |
Fastenal Co. | | | 24,800 | | | 855,600 | |
| | | | |
|
| |
| | | | | | 2,984,376 | |
| | | | |
|
| |
Electronic Components & Semiconductors – 3.3% | | | | | | | |
First Solar, Inc. (a) | | | 5,800 | | | 707,194 | |
Lam Research Corp. (a) | | | 18,100 | | | 610,332 | |
Linear Technology Corp. | | | 27,400 | | | 709,112 | |
Marvell Technology Group Ltd. (a) | | | 61,100 | | | 838,292 | |
| | | | |
|
| |
| | | | | | 2,864,930 | |
| | | | |
|
| |
Financial Services – 13.1% | | | | | | | |
BlackRock, Inc. | | | 7,350 | | | 1,591,202 | |
Goldman Sachs Group, Inc. | | | 10,800 | | | 1,837,836 | |
IntercontinentalExchange, Inc. (a) | | | 8,300 | | | 831,577 | |
Invesco Ltd. | | | 20,900 | | | 442,035 | |
JP Morgan Chase & Co. | | | 58,600 | | | 2,447,722 | |
The Charles Schwab Corp. | | | 82,200 | | | 1,425,348 | |
Visa, Inc., Class A | | | 39,500 | | | 2,992,520 | |
| | | | |
|
| |
| | | | | | 11,568,240 | |
| | | | |
|
| |
Common Stocks, continued | | | | | | | |
|
| | | | | |
| | Shares | | Value($) | |
| |
| |
| |
Health Care – 3.7% | | | | | | | |
Baxter International, Inc. | | | 28,700 | | | 1,551,522 | |
Celgene Corp. (a) | | | 16,600 | | | 847,430 | |
Mindray Medical International Ltd. ADR | | | 28,700 | | | 881,951 | |
| | | | |
|
| |
| | | | | | 3,280,903 | |
| | | | |
|
| |
Internet Related – 8.8% | | | | | | | |
eBay, Inc. (a) | | | 27,100 | | | 603,517 | |
Equinix, Inc. (a) | | | 16,200 | | | 1,382,184 | |
Google, Inc., Class A (a) | | | 6,600 | | | 3,538,392 | |
Priceline.com, Inc. (a) | | | 14,000 | | | 2,209,060 | |
| | | | |
|
| |
| | | | | | 7,733,153 | |
| | | | |
|
| |
Leisure – 0.9% | | | | | | | |
Carnival Corp. | | | 28,211 | | | 821,504 | |
| | | | |
|
| |
Metals & Mining – 1.7% | | | | | | | |
Freeport-McMoRan Copper & Gold, Inc. (a) | | | 12,000 | | | 880,320 | |
Peabody Energy Corp. | | | 15,900 | | | 629,481 | |
| | | | |
|
| |
| | | | | | 1,509,801 | |
| | | | |
|
| |
Oil & Gas – 8.0% | | | | | | | |
FMC Technologies, Inc. (a) | | | 14,800 | | | 778,480 | |
Petrohawk Energy Corp. (a) | | | 24,800 | | | 583,296 | |
Petroleo Brasileiro SA ADR | | | 22,200 | | | 1,026,084 | |
Southwestern Energy Co. (a) | | | 54,200 | | | 2,362,036 | |
Suncor Energy, Inc. | | | 50,836 | | | 1,678,605 | |
Weatherford International Ltd. (a) | | | 37,600 | | | 659,128 | |
| | | | |
|
| |
| | | | | | 7,087,629 | |
| | | | |
|
| |
Pharmaceuticals – 8.4% | | | | | | | |
CVS Caremark Corp. | | | 52,900 | | | 1,867,370 | |
Medco Health Solutions, Inc. (a) | | | 61,000 | | | 3,423,320 | |
Teva Pharmaceutical Industries Ltd. ADR | | | 42,000 | | | 2,120,160 | |
| | | | |
|
| |
| | | | | | 7,410,850 | |
| | | | |
|
| |
Retail – 6.6% | | | | | | | |
Amazon.com, Inc. (a) | | | 10,700 | | | 1,271,267 | |
Best Buy Co., Inc. | | | 21,000 | | | 801,780 | |
Costco Wholesale Corp. | | | 12,400 | | | 704,940 | |
Kohl’s Corp. (a) | | | 21,500 | | | 1,230,230 | |
O’Reilly Automotive, Inc. (a) | | | 22,900 | | | 853,712 | |
Target Corp. | | | 19,100 | | | 925,013 | |
| | | | |
|
| |
| | | | | | 5,786,942 | |
| | | | |
|
| |
Telecommunications – 8.6% | | | | | | | |
American Tower Corp., Class A (a) | | | 24,200 | | | 891,044 | |
Cisco Systems, Inc. (a) | | | 108,000 | | | 2,467,800 | |
Juniper Networks, Inc. (a) | | | 53,200 | | | 1,357,132 | |
QUALCOMM, Inc. | | | 70,100 | | | 2,902,841 | |
| | | | |
|
| |
| | | | | | 7,618,817 | |
| | | | |
|
| |
Transportation – 3.4% | | | | | | | |
C.H. Robinson Worldwide, Inc. | | | 14,000 | | | 771,540 | |
Union Pacific Corp. | | | 40,300 | | | 2,222,142 | |
| | | | |
|
| |
| | | | | | 2,993,682 | |
| | | | |
|
| |
TOTAL COMMON STOCKS
(COST $78,479,982) | | | | | | 85,180,697 | |
| | | | |
|
| |
| | |
52 | HSBC INVESTOR PORTFOLIOS | See notes to financial statements. |
|
HSBC INVESTOR GROWTH PORTFOLIO |
|
|
Schedule of Portfolio Investments—As of October 31, 2009 (continued) |
| | | | | | | |
Investment Companies—3.6% | | | | | | | |
|
| | | | | |
| | Shares | | Value($) | |
| |
| |
| |
Northern Institutional Diversified Assets
Portfolio, Shares Class, 0.09% (b) | | | 3,185,710 | | | 3,185,710 | |
| | | | |
|
| |
TOTAL INVESTMENT COMPANIES
(COST $3,185,710) | | | | | | 3,185,710 | |
| | | | |
|
| |
TOTAL INVESTMENTS
(COST $81,665,692) — 100.2% | | | | | | 88,366,407 | |
| | | | |
|
| |
| |
|
| Percentages indicated are based on net assets of $88,162,884. |
| |
(a) | Represents non-income producing security. |
| |
(b) | The rate represents the annualized one-day yield that was in effect on October 31, 2009. |
| |
ADR — American Depositary Receipt |
|
plc — Public Limited Company |
| | |
See notes to financial statements. | HSBC INVESTOR PORTFOLIOS | 53 |
|
HSBC INVESTOR INTERNATIONAL EQUITY PORTFOLIO |
|
|
Schedule of Portfolio Investments—As of October 31, 2009 |
| | | | | | | |
Common Stocks—98.3% | | | | | | | |
|
| |
Shares
| |
Value($)
| |
| |
| |
| |
Australia – 5.9% | | | | | | | |
Australia & New Zealand Banking
Group Ltd. | | | 165,400 | | | 3,372,607 | |
BHP Billiton Ltd. | | | 36,500 | | | 1,196,754 | |
Lend Lease Corp., Ltd. | | | 80,600 | | | 667,922 | |
Macquarie Group Ltd. | | | 18,300 | | | 801,246 | |
National Australia Bank Ltd. | | | 113,565 | | | 2,999,764 | |
Qantas Airways Ltd. | | | 412,833 | | | 1,026,229 | |
Tabcorp Holdings Ltd. | | | 206,100 | | | 1,314,370 | |
Telstra Corp. Ltd. | | | 513,500 | | | 1,525,516 | |
| | | | |
|
| |
| | | | | | 12,904,408 | |
| | | | |
|
| |
Belgium – 0.2% | | | | | | | |
Delhaize Group SA | | | 7,232 | | | 491,232 | |
| | | | |
|
| |
Brazil – 0.4% | | | | | | | |
Banco Do Brasil SA | | | 60,000 | | | 961,213 | |
| | | | |
|
| |
Canada – 3.9% | | | | | | | |
Fairfax Financial Holdings Ltd. | | | 2,200 | | | 787,164 | |
Industrial Alliance Insurance and Financial
Services, Inc. | | | 26,100 | | | 670,233 | |
National Bank of Canada | | | 26,600 | | | 1,386,554 | |
Nexen, Inc. | | | 40,662 | | | 875,034 | |
Royal Bank of Canada | | | 30,300 | | | 1,534,886 | |
Suncor Energy, Inc. | | | 62,428 | | | 2,072,854 | |
TELUS Corp. | | | 19,700 | | | 587,285 | |
WestJet Airlines Ltd. | | | 59,300 | | | 601,880 | |
| | | | |
|
| |
| | | | | | 8,515,890 | |
| | | | |
|
| |
Denmark – 0.9% | | | | | | | |
Danske Bank A/S (a) | | | 84,800 | | | 1,947,818 | |
| | | | |
|
| |
Finland – 1.4% | | | | | | | |
Nokia Oyj | | | 245,900 | | | 3,105,698 | |
| | | | |
|
| |
France – 14.5% | | | | | | | |
BNP Paribas SA | | | 60,698 | | | 4,572,160 | |
Casino Guichard-Perrachon SA | | | 17,000 | | | 1,350,705 | |
Compagnie de Saint-Gobain | | | 34,600 | | | 1,685,875 | |
Credit Agricole SA | | | 192,279 | | | 3,682,755 | |
Electricite de France | | | 42,900 | | | 2,390,810 | |
France Telecom SA | | | 113,600 | | | 2,814,576 | |
Lagardere S.C.A. | | | 46,400 | | | 2,096,106 | |
Renault SA (a) | | | 38,800 | | | 1,736,150 | |
Sanofi-Aventis | | | 52,700 | | | 3,862,624 | |
Societe Generale | | | 57,481 | | | 3,817,483 | |
Vallourec SA | | | 4,772 | | | 751,267 | |
Vivendi | | | 100,220 | | | 2,780,050 | |
| | | | |
|
| |
| | | | | | 31,540,561 | |
| | | | |
|
| |
Germany – 13.6% | | | | | | | |
Allianz SE | | | 27,200 | | | 3,115,448 | |
BASF AG | | | 64,800 | | | 3,487,389 | |
Bayer AG | | | 45,800 | | | 3,165,184 | |
Bayerische Motoren Werke AG | | | 32,200 | | | 1,571,934 | |
Deutsche Bank AG | | | 44,700 | | | 3,204,262 | |
Deutsche Post AG | | | 132,950 | | | 2,230,349 | |
Deutsche Telekom AG | | | 191,900 | | | 2,612,238 | |
E.ON AG | | | 91,100 | | | 3,480,332 | |
| | | | | | | |
Common Stocks, continued | | | | | | | |
|
| | | | | | | |
| | Shares | | Value($) | |
| |
| |
| |
Germany, continued | | | | | | | |
Fresenius Medical Care AG & Co. KGaA | | | 18,100 | | | 875,395 | |
Metro AG | | | 33,100 | | | 1,824,340 | |
Muenchener Rueckversicherungs-
Gesellschaft AG | | | 17,600 | | | 2,794,864 | |
RWE AG | | | 12,550 | | | 1,096,995 | |
| | | | |
|
| |
| | | | | | 29,458,730 | |
| | | | |
|
| |
Hong Kong – 0.7% | | | | | | | |
New World Development Co. Ltd. | | | 711,000 | | | 1,530,427 | |
| | | | |
|
| |
India – 0.7% | | | | | | | |
State Bank of India GDR | | | 17,600 | | | 1,607,489 | |
| | | | |
|
| |
Israel – 0.4% | | | | | | | |
Israel Chemicals Ltd. | | | 64,100 | | | 749,465 | |
| | | | |
|
| |
Italy – 5.7% | | | | | | | |
Enel SpA | | | 377,100 | | | 2,243,628 | |
ENI SpA | | | 139,700 | | | 3,459,561 | |
Intesa Sanpaolo SpA (a) | | | 228,900 | | | 963,222 | |
Telecom Italia RSP | | | 920,000 | | | 1,012,344 | |
Telecom Italia SpA | | | 1,289,400 | | | 2,048,172 | |
UniCredit SpA (a) | | | 797,400 | | | 2,671,179 | |
| | | | |
|
| |
| | | | | | 12,398,106 | |
| | | | |
|
| |
Japan – 11.9% | | | | | | | |
AEON Co. Ltd. | | | 81,200 | | | 724,378 | |
FUJITSU Ltd. | | | 9,000 | | | 53,008 | |
KDDI Corp. | | | 279 | | | 1,481,035 | |
Kyocera Corp. | | | 24,500 | | | 2,055,507 | |
Mitsubishi Chemical Holdings Corp. | | | 51,000 | | | 189,415 | |
Mitsubishi Corp. | | | 50,900 | | | 1,079,278 | |
Mitsui & Co., Ltd. | | | 149,000 | | | 1,957,136 | |
Mitsui Fudosan Co. Ltd. | | | 87,000 | | | 1,407,896 | |
NAMCO BANDAI Holdings, Inc. | | | 123,800 | | | 1,266,047 | |
Nippon Mining Holdings, Inc. | | | 187,000 | | | 834,386 | |
Nippon Telegraph & Telephone Corp. | | | 63,000 | | | 2,599,963 | |
Nissan Motor Co., Ltd. (a) | | | 371,400 | | | 2,687,952 | |
Sharp Corp. | | | 134,000 | | | 1,429,936 | |
Sony Corp. | | | 37,910 | | | 1,119,624 | |
Sumitomo Mitsui Financial Group, Inc. | | | 67,000 | | | 2,277,718 | |
Sumitomo Realty & Development Co. Ltd. | | | 27,000 | | | 512,043 | |
The Furukawa Electric Co. Ltd. | | | 123,000 | | | 466,554 | |
The Tokyo Electric Power Co., Inc. | | | 28,000 | | | 688,383 | |
Toshiba Corp. | | | 543,000 | | | 3,103,950 | |
| | | | |
|
| |
| | | | | | 25,934,209 | |
| | | | |
|
| |
Jersey – 1.0% | | | | | | | |
WPP plc | | | 242,600 | | | 2,173,839 | |
| | | | |
|
| |
Kazakhstan – 0.4% | | | | | | | |
KazMunaiGas Exploration Production GDR | | | 31,650 | | | 746,546 | |
| | | | |
|
| |
Netherlands – 2.4% | | | | | | | |
Koninklijke Ahold NV | | | 223,020 | | | 2,808,910 | |
Randstad Holding NV (a) | | | 60,700 | | | 2,302,866 | |
| | | | |
|
| |
| | | | | | 5,111,776 | |
| | | | |
|
| |
New Zealand – 0.4% | | | | | | | |
Telecom Corp. of New Zealand Ltd. | | | 456,800 | | | 830,588 | |
| | | | |
|
| |
| | |
54 | HSBC INVESTOR PORTFOLIOS | See notes to financial statements. |
| |
HSBC INVESTOR INTERNATIONAL EQUITY PORTFOLIO |
|
Schedule of Portfolio Investments—As of October 31, 2009 (continued) |
| | | | | | | |
Common Stocks, continued | | | | | | | |
|
|
| | Shares | | Value($) | |
| |
| |
| |
Norway – 1.2% | | | | | | | |
StatoilHydro ASA | | | 110,400 | | | 2,602,669 | |
| | | | |
|
| |
Russian Federation – 0.9% | | | | | | | |
JSC MMC Norilsk Nickel ADR (a) | | | 67,789 | | | 890,512 | |
LUKOIL ADR | | | 16,550 | | | 960,093 | |
| | | | |
|
| |
| | | | | | 1,850,605 | |
| | | | |
|
| |
Singapore – 0.2% | | | | | | | |
Neptune Orient Lines Ltd. | | | 427,000 | | | 475,353 | |
| | | | |
|
| |
South Africa – 0.2% | | | | | | | |
Standard Bank Group Ltd. | | | 31,023 | | | 387,694 | |
| | | | |
|
| |
South Korea – 1.6% | | | | | | | |
Hynix Semiconductor, Inc. (a) | | | 40,400 | | | 599,978 | |
KB Financial Group, Inc. ADR (a) | | | 35,779 | | | 1,697,356 | |
Samsung Electronics Co., Ltd., Preferred | | | 2,900 | | | 1,162,058 | |
| | | | |
|
| |
| | | | | | 3,459,392 | |
| | | | |
|
| |
Spain – 4.1% | | | | | | | |
Banco Santander SA | | | 266,200 | | | 4,283,317 | |
Telefonica SA | | | 161,400 | | | 4,506,871 | |
| | | | |
|
| |
| | | | | | 8,790,188 | |
| | | | |
|
| |
Sweden – 2.3% | | | | | | | |
Electrolux AB, B Shares (a) | | | 35,300 | | | 846,372 | |
Ericsson LM, B Shares | | | 153,000 | | | 1,599,027 | |
Svenska Cellusoa AB (SCA), B Shares | | | 189,700 | | | 2,607,504 | |
| | | | |
|
| |
| | | | | | 5,052,903 | |
| | | | |
|
| |
Switzerland – 2.1% | | | | | | | |
Adecco SA, Registered | | | 28,300 | | | 1,264,938 | |
Novartis AG | | | 63,940 | | | 3,330,596 | |
| | | | |
|
| |
| | | | | | 4,595,534 | |
| | | | |
|
| |
Taiwan – 0.8% | | | | | | | |
AU Optronics Corp. | | | 1,134,030 | | | 1,005,822 | |
Compal Electronics, Inc. | | | 584,804 | | | 731,282 | |
| | | | |
|
| |
| | | | | | 1,737,104 | |
| | | | |
|
| |
Thailand – 0.4% | | | | | | | |
PTT Public Co., Ltd. | | | 121,400 | | | 859,954 | |
| | | | |
|
| |
Turkey – 0.5% | | | | | | | |
Turkiye Garanti Bankasi AS | | | 308,700 | | | 1,121,542 | |
| | | | |
|
| |
United Kingdom – 19.6% | | | | | | | |
Associated British Foods plc | | | 155,400 | | | 2,103,983 | |
AstraZeneca plc | | | 77,900 | | | 3,496,538 | |
Aviva plc | | | 343,791 | | | 2,149,466 | |
Barclays plc (a) | | | 366,500 | | | 1,920,573 | |
BP plc | | | 658,800 | | | 6,172,225 | |
BT Group plc | | | 500,700 | | | 1,072,820 | |
Centrica plc | | | 280,200 | | | 1,138,140 | |
Drax Group plc | | | 51,100 | | | 388,723 | |
GlaxoSmithKline plc | | | 213,800 | | | 4,384,974 | |
Old Mutual plc | | | 440,300 | | | 764,081 | |
Rolls-Royce Group plc | | | 289,600 | | | 2,135,435 | |
Royal Dutch Shell plc, A Shares | | | 200,987 | | | 5,958,380 | |
| | | | | | | |
| | | | | | | |
Common Stocks, continued | | | | | | | |
|
| | | | | | | |
| | Shares | | Value($) | |
| |
| |
| |
United Kingdom, continued | | | | | | | |
RSA Insurance Group plc | | | 477,027 | | | 945,151 | |
Thomas Cook Group plc | | | 175,500 | | | 587,609 | |
Travis Perkins plc (a) | | | 65,900 | | | 812,840 | |
Tui Travel plc | | | 208,700 | | | 795,087 | |
Vodafone Group plc | | | 2,629,958 | | | 5,795,135 | |
Wolseley plc (a) | | | 96,200 | | | 1,945,650 | |
| | | | |
|
| |
| | | | | | 42,566,810 | |
| | | | |
|
| |
TOTAL COMMON STOCKS
(COST $225,303,826) | | | | | | 213,507,743 | |
| | | | |
|
| |
| | | | | | | |
Rights—0.0% | | | | | | | |
|
| | | | | | | |
Belgium – 0.0% | | | | | | | |
Fortis (a) | | | 121,532 | | | 0 | |
| | | | |
|
| |
Spain – 0.0% | | | | | | | |
Banco Santander SA (a) | | | 161,000 | | | 28,429 | |
| | | | |
|
| |
TOTAL RIGHTS
(COST $—) | | | | | | 28,429 | |
| | | | |
|
| |
Investment Companies—0.9% | | | | | | | |
|
Northern Institutional Diversified Assets
Portfolio, Shares Class, 0.09% (b) | | | 1,904,284 | | | 1,904,284 | |
| | | | |
|
| |
TOTAL INVESTMENT COMPANIES
(COST $1,904,284) | | | | | | 1,904,284 | |
| | | | |
|
| |
TOTAL INVESTMENTS
(COST $227,208,110) — 99.2% | | | | | | 215,440,456 | |
| | | | |
|
| |
| |
|
| Percentages indicated are based on net assets of $217,148,205. |
| |
(a) | Represents non-income producing security. |
| |
(b) | The rate represents the annualized one-day yield that was in effect on October 31, 2009. |
| |
ADR — American Depositary Receipt |
GDR — Global Depositary |
Receipt plc — Public Limited Company |
| |
At October 31, 2009 the portfolio’s open foreign currency exchange contracts were as follows: |
| | | | | | | | | | | | | | |
Currency | | Delivery
Date | | Contract
Amount
(Local
Currency) | | Contract
Value
(U.S. Dollars)
($) | | Value
($) | | Unrealized
Appreciation/
(Depreciation)
($) | |
| |
| |
| |
| |
| |
| |
SHORT CONTRACTS | | | | | | | | | | | | | | |
Canadian Dollar | | 11/2/2009 | | 338,000 | | 315,122 | | | 312,442 | | | 2,680 | | |
British Sterling Pound | | 11/3/2009 | | 189,000 | | 312,209 | | | 310,145 | | | 2,064 | | |
| | | | | | | | | | | |
| | |
| | | | | | | | | | | | 4,744 | | |
| | | | | | | | | | | |
| | |
LONG CONTRACTS | | | | | | | | | | | | | | |
European Euro | | 11/2/2009 | | 879,000 | | 1,303,469 | | | 1,293,446 | | | (10,023 | ) | |
| | | | | | | | | | | |
| | |
| | | | | | | | | | | | (10,023 | ) | |
| | | | | | | | | | | |
| | |
| | | | | | | | | | | | | | |
| | |
See notes to financial statements. | HSBC INVESTOR PORTFOLIOS | 55 |
|
HSBC INVESTOR INTERNATIONAL EQUITY PORTFOLIO |
|
|
Schedule of Portfolio Investments—As of October 31, 2009 (continued) |
|
Schedule of Portfolio Investments—October 31, 2009 |
|
The Portfolio invested, as a percentage of net assets, in the following industries, as of October 31, 2009:
| | | | |
Industry | | Percent of Net Assets | |
| |
| |
Aerospace/Defense | | 1.0% | | |
Appliances | | 0.4% | | |
Automotive | | 2.8% | | |
Banking & Financial Services | | 23.6% | | |
Building & Construction | | 2.0% | | |
Cash & Cash Equivalents | | 0.9% | | |
Chemicals | | 1.7% | | |
Distribution | | 0.9% | | |
Drugs - Medical | | 7.3% | | |
Electrical | | 5.4% | | |
Electronic Components & Semiconductors | | 3.1% | | |
Food & Beverage | | 1.2% | | |
Gambling and Entertainment | | 0.6% | | |
Human Resources | | 1.6% | | |
Import/Export | | 0.9% | | |
Insurance | | 3.5% | | |
Manufacturing | | 4.2% | | |
Metals & Mining | | 1.3% | | |
Multimedia | | 2.3% | | |
Oil & Gas | | 11.8% | | |
Publishing | | 1.0% | | |
Real Estate | | 1.9% | | |
Retail | | 3.5% | | |
Telecommunications | | 14.6% | | |
Transportation Services | | 1.7% | | |
| |
|
| |
Total Investments | | 99.2% | | |
| |
|
| |
| | |
56 | HSBC INVESTOR PORTFOLIOS | See notes to financial statements. |
|
HSBC INVESTOR OPPORTUNITY PORTFOLIO |
|
Schedule of Portfolio Investments—As of October 31, 2009 |
| | | | | | | |
Common Stocks—97.3% | | | | | | | |
|
|
|
|
|
|
|
|
| | | | | | | |
| | Shares | | Value($) | |
| |
| |
| |
Aerospace & Defense – 2.3% | | | | | | | |
BE Aerospace, Inc. (a) | | | 165,400 | | | 2,932,542 | |
| | | | |
|
| |
Biotechnology – 5.5% | | | | | | | |
Charles River Laboratories International,
Inc. (a) | | | 53,900 | | | 1,968,428 | |
Illumina, Inc. (a) | | | 83,350 | | | 2,675,535 | |
Life Technologies Corp. (a) | | | 54,100 | | | 2,551,897 | |
| | | | |
|
| |
| | | | | | 7,195,860 | |
| | | | |
|
| |
Business Services – 2.6% | | | | | | | |
MSCI, Inc., Class A (a) | | | 42,500 | | | 1,292,000 | |
Navigant Consulting, Inc. (a) | | | 143,750 | | | 2,047,000 | |
| | | | |
|
| |
| | | | | | 3,339,000 | |
| | | | |
|
| |
Chemicals – 1.7% | | | | | | | |
Celanese Corp., Series A | | | 79,100 | | | 2,171,295 | |
| | | | |
|
| |
Communications – 1.2% | | | | | | | |
Discovery Communications, Inc., Class A (a) | | | 57,000 | | | 1,567,500 | |
| | | | |
|
| |
Computer Software – 10.7% | | | | | | | |
ACI Worldwide, Inc. (a) | | | 3,050 | | | 49,075 | |
BMC Software, Inc. (a) | | | 40,650 | | | 1,510,554 | |
Check Point Software Technologies Ltd. (a) | | | 135,250 | | | 4,202,217 | |
Citrix Systems, Inc. (a) | | | 52,800 | | | 1,940,928 | |
Nuance Communications, Inc. (a) | | | 229,550 | | | 3,009,400 | |
Salesforce.com, Inc. (a) | | | 26,850 | | | 1,523,738 | |
VeriFone Holdings, Inc. (a) | | | 122,750 | | | 1,632,575 | |
| | | | |
|
| |
| | | | | | 13,868,487 | |
| | | | |
|
| |
Consumer Products – 5.3% | | | | | | | |
Church & Dwight Co., Inc. | | | 38,700 | | | 2,201,256 | |
Crown Holdings, Inc. (a) | | | 95,200 | | | 2,537,080 | |
Ralcorp Holdings, Inc. (a) | | | 40,400 | | | 2,169,480 | |
| | | | |
|
| |
| | | | | | 6,907,816 | |
| | | | |
|
| |
Diversified Manufacturing Operations – 4.3% | | | | | | | |
AMETEK, Inc. | | | 65,100 | | | 2,271,339 | |
Crane Co. | | | 50,800 | | | 1,414,780 | |
Joy Global, Inc. | | | 38,150 | | | 1,923,142 | |
| | | | |
|
| |
| | | | | | 5,609,261 | |
| | | | |
|
| |
Education – 1.5% | | | | | | | |
DeVry, Inc. | | | 35,950 | | | 1,987,676 | |
| | | | |
|
| |
Electronic Components & Semiconductors – 3.4% | | | | | | | |
Maxim Integrated Products, Inc. | | | 144,150 | | | 2,402,981 | |
Novellus Systems, Inc. (a) | | | 96,350 | | | 1,982,883 | |
| | | | |
|
| |
| | | | | | 4,385,864 | |
| | | | |
|
| |
Environmental Services – 2.1% | | | | | | | |
Stericycle, Inc. (a) | | | 38,700 | | | 2,026,719 | |
Waste Connections, Inc. (a) | | | 22,500 | | | 707,175 | |
| | | | |
|
| |
| | | | | | 2,733,894 | |
| | | | |
|
| |
Financial Services – 3.8% | | | | | | | |
First Horizon Natlional Corp. (a) | | | 191,193 | | | 2,261,808 | |
Knight Capital Group, Inc., Class A (a) | | | 31,400 | | | 529,090 | |
Waddell & Reed Financial, Inc., Class A | | | 78,700 | | | 2,208,322 | |
| | | | |
|
| |
| | | | | | 4,999,220 | |
| | | | |
|
| |
Gaming – 1.2% | | | | | | | |
Scientific Games Corp., Class A (a) | | | 109,400 | | | 1,539,258 | |
| | | | |
|
| |
Health Care – 6.5% | | | | | | | |
DaVita, Inc. (a) | | | 55,900 | | | 2,964,377 | |
IDEXX Laboratories, Inc. (a) | | | 60,400 | | | 3,087,648 | |
MEDNAX, Inc. (a) | | | 27,837 | | | 1,445,297 | |
Skilled Healthcare Group, Inc., Class A (a) | | | 118,900 | | | 955,956 | |
| | | | |
|
| |
| | | | | | 8,453,278 | |
| | | | |
|
| |
| | | | | | | |
Common Stocks, continued | | | | | | | |
|
|
|
|
|
|
|
|
| | | | | | | |
| | Shares | | Value($) | |
| |
| |
| |
Industrial Manufacturing – 6.7% | | | | | | | |
IDEX Corp. | | | 86,700 | | | 2,464,881 | |
Mettler-Toledo International, Inc. (a) | | | 43,350 | | | 4,226,625 | |
WESCO International, Inc. (a) | | | 76,100 | | | 1,945,116 | |
| | | | |
|
| |
| | | | | | 8,636,622 | |
| | | | |
|
| |
Internet Related – 3.4% | | | | | | | |
Ctrip.com International Ltd. ADR (a) | | | 37,800 | | | 2,023,812 | |
Shanda Games Ltd. ADR (a) | | | 74,800 | | | 745,008 | |
VeriSign, Inc. (a) | | | 74,000 | | | 1,687,940 | |
| | | | |
|
| |
| | | | | | 4,456,760 | |
| | | | |
|
| |
Oil & Gas – 12.3% | | | | | | | |
Consol Energy, Inc. | | | 67,700 | | | 2,898,237 | |
Denbury Resources, Inc. (a) | | | 166,700 | | | 2,433,820 | |
ENSCO International, Inc. | | | 56,000 | | | 2,564,240 | |
EQT Corp. | | | 32,100 | | | 1,343,706 | |
Exterran Holdings, Inc. (a) | | | 116,200 | | | 2,373,966 | |
Massey Energy Co. | | | 147,650 | | | 4,295,138 | |
| | | | |
|
| |
| | | | | | 15,909,107 | |
| | | | |
|
| |
Pharmaceuticals – 10.5% | | | | | | | |
Alexion Pharmaceuticals, Inc. (a) | | | 105,750 | | | 4,696,357 | |
Elan Corp. plc ADR (a) | | | 314,200 | | | 1,712,390 | |
OSI Pharmaceuticals, Inc. (a) | | | 86,700 | | | 2,793,474 | |
Santarus, Inc. (a) | | | 210,100 | | | 649,209 | |
Shire plc ADR | | | 70,550 | | | 3,760,315 | |
| | | | |
|
| |
| | | | | | 13,611,745 | |
| | | | |
|
| |
Retail – 5.0% | | | | | | | |
American Eagle Outfitters, Inc. | | | 156,650 | | | 2,739,808 | |
Hibbett Sports, Inc. (a) | | | 95,350 | | | 1,786,859 | |
O’Reilly Automotive, Inc. (a) | | | 51,000 | | | 1,901,280 | |
| | | | |
|
| |
| | | | | | 6,427,947 | |
| | | | |
|
| |
Telecommunications – 5.8% | | | | | | | |
Alcatel-Lucent ADR (a) | | | 79,600 | | | 293,724 | |
Comverse Technology, Inc. (a) | | | 234,800 | | | 1,972,320 | |
NII Holdings, Inc. (a) | | | 106,500 | | | 2,868,045 | |
Polycom, Inc. (a) | | | 111,800 | | | 2,400,346 | |
| | | | |
|
| |
| | | | | | 7,534,435 | |
| | | | |
|
| |
Transportation – 1.5% | | | | | | | |
Landstar System, Inc. | | | 54,700 | | | 1,927,628 | |
| | | | |
|
| |
TOTAL COMMON STOCKS
(COST $125,012,335) | | | | | | 126,195,195 | |
| | | | |
|
| |
Investment Companies—2.5% | | | | | | | |
|
|
|
|
|
|
|
|
Northern Institutional Government Select
Portfolio, 0.08%, Shares Class (b) | | | 3,270,825 | | | 3,270,825 | |
| | | | |
|
| |
TOTAL INVESTMENT COMPANIES
(COST $3,270,825) | | | | | | 3,270,825 | |
| | | | |
|
| |
TOTAL INVESTMENTS
(COST $128,283,160) — 99.8% | | | | | | 129,466,020 | |
| | | | |
|
| |
| |
|
| Percentages indicated are based on net assets of $129,748,321. |
| |
(a) | Represents non-income producing security. |
| |
(b) | The rate represents the annualized one-day yield that was in effect on October 31, 2009. |
| |
ADR | — American Depositary Receipt |
plc | — Public Limited Company |
| | |
See notes to financial statements. | HSBC INVESTOR PORTFOLIOS | 57 |
|
HSBC INVESTOR VALUE PORTFOLIO |
|
Schedule of Portfolio Investments—As of October 31, 2009 |
| | | | | | | |
Common Stocks—97.7% |
|
|
|
|
|
|
|
|
|
| | Shares | | Value($) | |
| |
| |
| |
Aerospace & Defense – 5.4% | | | | | | | |
Lockheed Martin Corp. | | | 20,300 | | | 1,396,437 | |
Raytheon Co. | | | 28,700 | | | 1,299,536 | |
| | | | |
|
| |
| | | | | | 2,695,973 | |
| | | | |
|
| |
Agricultural Chemicals – 1.1% | | | | | | | |
The Mosaic Co. | | | 11,500 | | | 537,395 | |
| | | | |
|
| |
Banking – 2.6% | | | | | | | |
Wells Fargo & Co. | | | 47,500 | | | 1,307,200 | |
| | | | |
|
| |
Business Services – 3.2% | | | | | | | |
Pitney Bowes, Inc. | | | 65,700 | | | 1,609,650 | |
| | | | |
|
| |
Computer Software – 7.5% | | | | | | | |
CA, Inc. | | | 115,600 | | | 2,418,352 | |
Microsoft Corp. | | | 46,900 | | | 1,300,537 | |
| | | | |
|
| |
| | | | | | 3,718,889 | |
| | | | |
|
| |
Conglomerates – 3.4% | | | | | | | |
Loews Corp. | | | 51,240 | | | 1,696,044 | |
| | | | |
|
| |
Consumer Products – 2.9% | | | | | | | |
Kimberly-Clark Corp. | | | 23,400 | | | 1,431,144 | |
| | | | |
|
| |
Diversified Manufacturing Operations – 1.7% | | | | | | | |
Ingersoll-Rand plc | | | 26,100 | | | 824,499 | |
| | | | |
|
| |
Energy – 3.2% | | | | | | | |
Halliburton Co. | | | 28,000 | | | 817,880 | |
NRG Energy, Inc. (a) | | | 33,800 | | | 777,062 | |
| | | | |
|
| |
| | | | | | 1,594,942 | |
| | | | |
|
| |
Financial Services – 2.5% | | | | | | | |
JP Morgan Chase & Co. | | | 29,650 | | | 1,238,481 | |
| | | | |
|
| |
Insurance – 10.4% | | | | | | | |
Aetna, Inc. | | | 20,800 | | | 541,424 | |
Aon Corp. | | | 29,100 | | | 1,120,641 | |
Genworth Financial, Inc., Class A (a) | | | 78,200 | | | 830,484 | |
MetLife, Inc. | | | 35,200 | | | 1,197,856 | |
The Hartford Financial Services Group, Inc. | | | 60,700 | | | 1,488,364 | |
| | | | |
|
| |
| | | | | | 5,178,769 | |
| | | | |
|
| |
Media – 6.9% | | | | | | | |
CBS Corp., Class B | | | 34,350 | | | 404,299 | |
Comcast Corp., Class A | | | 50,750 | | | 711,515 | |
Viacom, Inc., Class B (a) | | | 84,800 | | | 2,339,632 | |
| | | | |
|
| |
| | | | | | 3,455,446 | |
| | | | |
|
| |
Metals & Mining – 6.9% | | | | | | | |
AngloGold Ashanti Ltd. ADR | | | 40,727 | | | 1,528,892 | |
Barrick Gold Corp. | | | 52,600 | | | 1,889,918 | |
| | | | |
|
| |
| | | | | | 3,418,810 | |
| | | | |
|
| |
| | | | | | | |
Common Stocks, continued | | | | | | | |
|
|
|
|
|
|
|
|
| | | | | | | |
| | Shares | | Value($) | |
| |
| |
| |
Oil & Gas – 14.9% | | | | | | | |
Apache Corp. | | | 23,800 | | | 2,240,056 | |
ConocoPhillips | | | 9,571 | | | 480,273 | |
EOG Resources, Inc. | | | 9,075 | | | 741,064 | |
Hess Corp. | | | 12,100 | | | 662,354 | |
Noble Energy, Inc. | | | 35,900 | | | 2,356,117 | |
Talisman Energy, Inc. | | | 55,200 | | | 936,744 | |
| | | | |
|
| |
| | | | | | 7,416,608 | |
| | | | |
|
| |
Pharmaceuticals – 11.2% | | | | | | | |
Amgen, Inc. (a) | | | 35,500 | | | 1,907,415 | |
CVS Caremark Corp. | | | 30,700 | | | 1,083,710 | |
Merck & Co., Inc. | | | 40,800 | | | 1,261,944 | |
Sanofi-Aventis ADR | | | 36,200 | | | 1,336,504 | |
| | | | |
|
| |
| | | | | | 5,589,573 | |
| | | | |
|
| |
Retail – 1.1% | | | | | | | |
Kroger Co. (The) | | | 23,000 | | | 531,990 | |
| | | | |
|
| |
Telecommunications – 8.4% | | | | | | | |
AT&T, Inc. | | | 31,500 | | | 808,605 | |
Motorola, Inc. | | | 303,000 | | | 2,596,710 | |
Verizon Communications, Inc. | | | 25,800 | | | 763,422 | |
| | | | |
|
| |
| | | | | | 4,168,737 | |
| | | | |
|
| |
Tobacco – 2.5% | | | | | | | |
Philip Morris International, Inc. | | | 25,900 | | | 1,226,624 | |
| | | | |
|
| |
Transportation – 1.9% | | | | | | | |
Union Pacific Corp. | | | 16,800 | | | 926,352 | |
| | | | |
|
| |
TOTAL COMMON STOCKS
(COST $52,166,129) | | | | | | 48,567,126 | |
| | | | |
|
| |
| | | | | | | |
Investment Companies—2.9% | | | | | | | |
|
|
|
|
|
|
|
|
Northern Institutional Government Select
Portfolio, 0.08%, Shares Class (b) | | | 1,417,909 | | | 1,417,909 | |
| | | | |
|
| |
TOTAL INVESTMENT COMPANIES
(COST $1,417,909) | | | | | | 1,417,909 | |
| | | | |
|
| |
TOTAL INVESTMENTS
(COST $53,584,038) — 100.6% | | | | | | 49,985,035 | |
| | | | |
|
| |
| |
|
| Percentages indicated are based on net assets of $49,686,156. |
| |
(a) | Represents non-income producing security. |
| |
(b) | The rate represents the annualized one-day yield that was in effect on October 31, 2009. |
| |
ADR | — American Depositary Receipt |
plc | — Public Limited Company |
| | |
58 | HSBC INVESTOR PORTFOLIOS | See notes to financial statements. |
|
HSBC INVESTOR PORTFOLIOS |
|
Statements of Assets and Liabilities—As of October 31, 2009 |
| | | | | | | | | | | | | |
| | Growth
Portfolio | | International
Equity
Portfolio | | Opportunity
Portfolio | | Value
Portfolio | |
|
|
|
|
|
|
|
|
|
|
Assets: | | | | | | | | | | | | | |
Investments in non-affiliates, at value | | $ | 88,366,407 | | $ | 215,440,456 | | $ | 129,466,020 | | $ | 49,985,035 | |
Cash | | | 2,960 | | | — | | | — | | | 1,483 | |
Foreign currency, at value | | | — | | | 1,665,361 | | | — | | | — | |
Unrealized appreciation on foreign currency exchange contracts | | | — | | | 4,744 | | | — | | | — | |
Dividends receivable | | | 42,742 | | | 381,813 | | | 20,769 | | | 49,207 | |
Receivable for investments sold | | | 1,670,744 | | | 1,453,006 | | | 369,343 | | | — | |
Prepaid expenses and other assets | | | 419 | | | 15,196 | | | 1,614 | | | 274 | |
| |
|
| |
|
| |
|
| |
|
| |
Total Assets | | | 90,083,272 | | | 218,960,576 | | | 129,857,746 | | | 50,035,999 | |
| |
|
| |
|
| |
|
| |
|
| |
Liabilities: | | | | | | | | | | | | | |
Unrealized depreciation on foreign currency exchange contracts | | | — | | | 10,023 | | | — | | | — | |
Payable for investments purchased | | | 1,863,842 | | | 1,640,608 | | | — | | | 320,029 | |
Accrued expenses and other liabilities: | | | | | | | | | | | | | |
Investment Management | | | 44,820 | | | 132,653 | | | 92,353 | | | 23,381 | |
Administration | | | 1,513 | | | 3,727 | | | 2,231 | | | 863 | |
Compliance Services | | | 34 | | | 420 | | | 52 | | | 20 | |
Trustee | | | 172 | | | 447 | | | 259 | | | 95 | |
Other | | | 10,007 | | | 24,493 | | | 14,530 | | | 5,455 | |
| |
|
| |
|
| |
|
| |
|
| |
Total Liabilities | | | 1,920,388 | | | 1,812,371 | | | 109,425 | | | 349,843 | |
| |
|
| |
|
| |
|
| |
|
| |
Applicable to investors’ beneficial interest | | $ | 88,162,884 | | $ | 217,148,205 | | $ | 129,748,321 | | $ | 49,686,156 | |
| |
|
| |
|
| |
|
| |
|
| |
Total Investments, at cost | | $ | 81,665,692 | | $ | 227,208,110 | | $ | 128,283,160 | | $ | 53,584,038 | |
| |
|
| |
|
| |
|
| |
|
| |
Foreign currency, at cost | | $ | — | | $ | 1,659,697 | | $ | — | | $ | — | |
| |
|
| |
|
| |
|
| |
|
| |
| | |
See notes to financial statements. | HSBC INVESTOR PORTFOLIOS | 59 |
HSBC INVESTOR PORTFOLIOS
Statements of Operations—For the year ended October 31, 2009
| | | | | | | | | | | | | |
| | Growth
Portfolio | | International
Equity
Portfolio | | Opportunity
Portfolio | | Value
Portfolio | |
|
|
|
|
|
|
|
|
|
|
Investment Income: | | | | | | | | | | | | | |
Dividends | | $ | 685,582 | | $ | 6,577,804 | | $ | 604,370 | | $ | 955,557 | |
Foreign tax withholding | | | (284 | ) | | (914,469 | ) | | — | | | — | |
| |
|
| |
|
| |
|
| |
|
| |
Total Investment Income (Loss) | | | 685,298 | | | 5,663,335 | | | 604,370 | | | 955,557 | |
| |
|
| |
|
| |
|
| |
|
| |
Expenses: | | | | | | | | | | | | | |
Investment Management | | | 456,575 | | | 1,287,301 | | | 916,022 | | | 240,377 | |
Administration | | | 15,595 | | | 35,816 | | | 22,518 | | | 9,009 | |
Accounting | | | 45,227 | | | 85,202 | | | 44,830 | | | 44,405 | |
Compliance Services | | | 377 | | | 867 | | | 524 | | | 210 | |
Custodian | | | 7,191 | | | 136,502 | | | 12,818 | | | 2,636 | |
Printing | | | 3,121 | | | 2,175 | | | 19 | | | 2,216 | |
Professional | | | 2,406 | | | 3,808 | | | 2,406 | | | 1,067 | |
Trustee | | | 1,195 | | | 2,739 | | | 1,722 | | | 667 | |
Other | | | 17,325 | | | 45,881 | | | 27,589 | | | 10,426 | |
| |
|
| |
|
| |
|
| |
|
| |
Total Expenses | | | 549,012 | | | 1,600,291 | | | 1,028,448 | | | 311,013 | |
| |
|
| |
|
| |
|
| |
|
| |
Net Investment Income (Loss) | | | 136,286 | | | 4,063,044 | | | (424,078 | ) | | 644,544 | |
| |
|
| |
|
| |
|
| |
|
| |
Net Realized/Unrealized Gains (Losses) from Investments: | | | | | | | | | | | | | |
Net realized gains (losses) from investment and foreign currency transactions | | | (12,681,042 | ) | | (72,712,532 | ) | | (15,580,861 | ) | | (1,577,886 | ) |
Change in unrealized appreciation/depreciation from investments and foreign currencies | | | 26,751,782 | | | 109,291,830 | | | 31,798,950 | | | 9,018,297 | |
| |
|
| |
|
| |
|
| |
|
| |
Net realized/unrealized gains/(losses) from investments and foreign currency transactions | | | 14,070,740 | | | 36,579,298 | | | 16,218,089 | | | 7,440,411 | |
| |
|
| |
|
| |
|
| |
|
| |
Change In Net Assets Resulting From Operations | | $ | 14,207,026 | | $ | 40,642,342 | | $ | 15,794,011 | | $ | 8,084,955 | |
| |
|
| |
|
| |
|
| |
|
| |
| | |
60 | HSBC INVESTOR PORTFOLIOS | See notes to financial statements. |
(This Page Intentionally Left Blank)
HSBC INVESTOR PORTFOLIOS
Statements of Changes in Net Assets
| | | | | | | | | | | | | |
| | Growth
Portfolio | | International Equity
Portfolio | |
|
|
|
|
|
|
| | For the
year ended
October 31,
2009 | | For the
year ended
October 31,
2008 | | For the
year ended
October 31,
2009 | | For the
year ended
October 31,
2008 | |
|
|
|
|
|
|
|
|
|
|
Investment Activities: | | | | | | | | | | | | | |
Operations: | | | | | | | | | | | | | |
Net investment income (loss) | | $ | 136,286 | | $ | 158,253 | | $ | 4,063,044 | | $ | 9,312,232 | |
Net realized gains (losses) from investment transactions | | | (12,681,042 | ) | | (80,608 | ) | | (72,712,532 | ) | | 10,348,234 | |
Change in unrealized appreciation/depreciation from investment and foreign currencies | | | 26,751,782 | | | (42,269,939 | ) | | 109,291,830 | | | (242,760,619 | ) |
| |
|
| |
|
| |
|
| |
|
| |
Change in net assets resulting from operations | | | 14,207,026 | | | (42,192,294 | ) | | 40,642,342 | | | (223,100,153 | ) |
| |
|
| |
|
| |
|
| |
|
| |
Proceeds from contributions | | | 8,763,453 | | | 50,198,227 | | | 23,984,676 | | | 43,694,202 | |
Value of withdrawals | | | (16,749,107 | ) | | (15,750,298 | ) | | (46,787,723 | ) | | (76,346,748 | ) |
| |
|
| |
|
| |
|
| |
|
| |
Change in net assets resulting from transactions in investors’ beneficial interest | | | (7,985,654 | ) | | 34,447,929 | | | (22,803,047 | ) | | (32,652,546 | ) |
| |
|
| |
|
| |
|
| |
|
| |
Change in net assets | | | 6,221,372 | | | (7,744,365 | ) | | 17,839,295 | | | (255,752,699 | ) |
| | | | | | | | | | | | | |
Net Assets: | | | | | | | | | | | | | |
Beginning of period | | | 81,941,512 | | | 89,685,877 | | | 199,308,910 | | | 455,061,609 | |
| |
|
| |
|
| |
|
| |
|
| |
End of period | | $ | 88,162,884 | | $ | 81,941,512 | | $ | 217,148,205 | | $ | 199,308,910 | |
| |
|
| |
|
| |
|
| |
|
| |
| | |
62 | HSBC INVESTOR PORTFOLIOS | See notes to financial statements. |
|
HSBC INVESTOR PORTFOLIOS |
|
Statements of Changes in Net Assets (continued) |
| | | | | | | | | | | | | |
| | Opportunity
Portfolio | | Value
Portfolio | |
|
|
|
|
|
|
| | For the
year ended
October 31,
2009 | | For the
year ended
October 31,
2008 | | For the
year ended
October 31,
2009 | | For the
year ended
October 31,
2008 | |
|
|
|
|
|
|
|
|
|
|
Investment Activities: | | | | | | | | | | | | | |
Operations: | | | | | | | | | | | | | |
Net investment income (loss) | | $ | (424,078 | ) | $ | (854,296 | ) | $ | 644,544 | | $ | 1,062,396 | |
Net realized gains (losses) from investment transactions | | | (15,580,861 | ) | | 2,354,698 | | | (1,577,886 | ) | | (7,776,127 | ) |
Change in unrealized appreciation/depreciation from investment and foreign currencies | | | 31,798,950 | | | (73,360,727 | ) | | 9,018,297 | | | (25,258,253 | ) |
| |
|
| |
|
| |
|
| |
|
| |
Change in net assets resulting from operations | | | 15,794,011 | | | (71,860,325 | ) | | 8,084,955 | | | (31,971,984 | ) |
| |
|
| |
|
| |
|
| |
|
| |
Proceeds from contributions | | | 8,367,302 | | | 20,402,348 | | | 4,852,585 | | | 12,224,588 | |
Value of withdrawals | | | (22,382,631 | ) | | (44,840,850 | ) | | (12,914,556 | ) | | (13,247,672 | ) |
| |
|
| |
|
| |
|
| |
|
| |
Change in net assets resulting from transactions in investors’ beneficial interest | | | (14,015,329 | ) | | (24,438,502 | ) | | (8,061,971 | ) | | (1,023,084 | ) |
| |
|
| |
|
| |
|
| |
|
| |
Change in net assets | | | 1,778,682 | | | (96,298,827 | ) | | 22,984 | | | (32,995,068 | ) |
| | | | | | | | | | | | | |
Net Assets: | | | | | | | | | | | | | |
Beginning of period | | | 127,969,639 | | | 224,268,466 | | | 49,663,172 | | | 82,658,240 | |
| |
|
| |
|
| |
|
| |
|
| |
End of period | | $ | 129,748,321 | | $ | 127,969,639 | | $ | 49,686,156 | | $ | 49,663,172 | |
| |
|
| |
|
| |
|
| |
|
| |
| | |
See notes to financial statements. | HSBC INVESTOR PORTFOLIOS | 63 |
Financial Highlights
| | | | | | | | | | | | | | | | | | | | | |
| | | | | Ratio/Supplementary Data |
| | | | |
|
| | Total
Return | | Net Assets
at End of
Period
(000’s) | | Ratio of Net
Expenses
to Average
Net Assets | | Ratio of Net
Investment
Income (Loss)
to Average
Net Assets | | Ratio of
Expenses
to Average
Net Assets(a) | | Portfolio
Turnover
Rate | |
|
|
|
|
|
|
|
|
|
|
|
|
|
|
GROWTH PORTFOLIO | | | | | | | | | | | | | | | | | | | |
Year Ended October 31, 2005 | | 13.59 | %(b) | | | $ | 49,415 | | | 0.63 | %(b) | | 0.77 | %(b) | | 0.68 | % | | 79.54 | % | |
Year Ended October 31, 2006 | | 7.53 | % | | | $ | 59,828 | | | 0.69 | % | | 0.38 | % | | 0.69 | % | | 75.06 | % | |
Year Ended October 31, 2007 | | 31.11 | % | | | $ | 89,686 | | | 0.62 | % | | 0.45 | % | | 0.62 | % | | 57.04 | % | |
Year Ended October 31, 2008 | | (37.75 | )%(c) | | | $ | 81,942 | | | 0.62 | % | | 0.19 | % | | 0.62 | % | | 157.87 | % | |
Year Ended October 31, 2009 | | 19.31 | % | | | $ | 88,163 | | | 0.69 | % | | 0.17 | % | | 0.69 | % | | 65.67 | % | |
|
|
|
|
|
|
|
|
|
|
|
|
|
|
|
|
|
|
|
|
|
|
INTERNATIONAL PORTFOLIO | | | | | | | | | | | | | | | | | | | | | |
Year Ended October 31, 2005 | | 19.54 | % | | | $ | 230,230 | | | 0.84 | % | | 1.92 | % | | 0.84 | % | | 31.32 | % | |
Year Ended October 31, 2006 | | 32.79 | % | | | $ | 333,755 | | | 0.86 | % | | 2.03 | % | | 0.86 | % | | 33.39 | % | |
Year Ended October 31, 2007 | | 25.17 | % | | | $ | 455,062 | | | 0.79 | % | | 2.16 | % | | 0.79 | % | | 26.08 | % | |
Year Ended October 31, 2008 | | (51.79 | )% | | | $ | 199,309 | | | 0.76 | % | | 2.65 | % | | 0.76 | % | | 28.98 | % | |
Year Ended October 31, 2009 | | 24.16 | % | | | $ | 217,148 | | | 0.88 | % | | 2.23 | % | | 0.88 | % | | 58.31 | % | |
|
|
|
|
|
|
|
|
|
|
|
|
|
|
|
|
|
|
|
|
|
|
OPPORTUNITY PORTFOLIO | | | | | | | | | | | | | | | | | | | | | |
Year Ended October 31, 2005 | | 14.35 | %(b) | | | $ | 218,778 | | | 0.85 | %(b) | | (0.45 | )%(b) | | 0.90 | % | | 63.95 | % | |
Year Ended October 31, 2006 | | 19.54 | % | | | $ | 241,495 | | | 0.91 | % | | (0.40 | )% | | 0.91 | % | | 60.83 | % | |
Year Ended October 31, 2007 | | 30.54 | % | | | $ | 224,268 | | | 0.91 | % | | (0.55 | )% | | 0.91 | % | | 69.41 | % | |
Year Ended October 31, 2008 | | (35.30 | )% | | | $ | 127,970 | | | 0.87 | % | | (0.46 | )% | | 0.87 | % | | 80.42 | % | |
Year Ended October 31, 2009 | | 15.41 | % | | | $ | 129,748 | | | 0.90 | % | | (0.37 | )% | | 0.90 | % | | 64.91 | % | |
|
|
|
|
|
|
|
|
|
|
|
|
|
|
|
|
|
|
|
|
|
|
VALUE PORTFOLIO | | | | | | | | | | | | | | | | | | | | | |
Year Ended October 31, 2005 | | 15.23 | %(b) | | | $ | 54,150 | | | 0.64 | %(b) | | 1.15 | %(b) | | 0.69 | % | | 16.45 | % | |
Year Ended October 31, 2006 | | 22.21 | % | | | $ | 67,432 | | | 0.71 | % | | 1.23 | % | | 0.71 | % | | 20.63 | % | |
Year Ended October 31, 2007 | | 10.28 | % | | | $ | 82,658 | | | 0.66 | % | | 1.29 | % | | 0.66 | % | | 18.67 | % | |
Year Ended October 31, 2008 | | (39.91 | )% | | | $ | 49,663 | | | 0.64 | % | | 1.54 | % | | 0.64 | % | | 24.61 | % | |
Year Ended October 31, 2009 | | 20.05 | % | | | $ | 49,686 | | | 0.68 | % | | 1.41 | % | | 0.68 | % | | 19.77 | % | |
|
|
|
|
|
|
|
|
|
|
|
|
|
|
|
|
|
|
|
|
|
|
| |
(a) | During the period, certain fees were reduced. If such fee reductions had not occurred, the ratio would have been as indicated. |
| |
(b) | During the year ended October 31, 2005, HSBC reimbursed certain amounts to the Portfolios related to violations of certain investment policies and limitations. The corresponding impact to the net expense ratio, net income ratio and total return were 0.05%, 0.04% and 0.05% for the Growth Portfolio, Opportunity Portfolio and Value Portfolio, respectively. |
| |
(c) | During the year ended October 31, 2008, Winslow Capital Management, Inc. reimbursed $64,658 to the Growth Portfolio related to violations of certain investment policies and limitations. The corresponding impact to the total return was 0.08%. |
| | |
64 | HSBC INVESTOR PORTFOLIOS | See notes to financial statements. |
|
HSBC INVESTOR PORTFOLIOS |
|
Notes to Financial Statements—As of October 31, 2009 |
| |
1. | Organization: |
| |
| The HSBC Investor Portfolios (the “Portfolio Trust”), is an open-end management investment company organized as a New York trust under the laws of the State of New York on November 1, 1994. The Portfolio Trust contains the following master funds (individually a “Portfolio,” collectively the “Portfolios”): |
| | | | |
| Portfolio | | Short Name | |
|
| |
| |
| HSBC Investor Growth Portfolio | Growth Portfolio |
| HSBC Investor International Equity Portfolio | International Equity Portfolio |
| HSBC Investor Opportunity Portfolio | Opportunity Portfolio |
| HSBC Investor Value Portfolio | Value Portfolio |
| |
| The Portfolios operate as master funds in master-feeder arrangements, in which other funds invest all or part of their investable assets in the Portfolios. The Portfolios also receive investments from funds of funds. The Declaration of Trust permits the Board of Trustees to issue an unlimited number of beneficial interests in the Portfolios. |
| |
| The Portfolios are diversified series of the Portfolio Trust and are part of the HSBC Investor Family of Funds. Financial statements for all other funds of the HSBC Investor Family of Funds are published separately. |
| |
| Under the Portfolio Trust’s organizational documents, the Portfolio Trust’s Officers and Trustees are indemnified against certain liabilities arising out of the performance of their duties to the Portfolios. In addition, in the normal course of business, the Portfolio Trust may enter into contracts with its service providers, which also provide for indemnifications by the Portfolios. The Portfolios’ maximum exposure under these arrangements is unknown as this would involve any future claims that may be made against the Portfolios. However, based on experience, the Portfolio Trust expects that risk of loss to be remote. |
| |
2. | Significant Accounting Policies: |
| |
| The following is a summary of the significant accounting policies followed by the Portfolios in the preparation of their financial statements. The policies are in conformity with U.S. generally accepted accounting principles (“GAAP”). The preparation of financial statements requires management to make certain estimates and assumptions that affect the reported amounts of assets and liabilities and disclosure of contingent assets and liabilities at the date of the financial statements and the reported amounts of increases and decreases in net assets from operations during the reporting period. Actual results could differ from those estimates. Management has evaluated events and transactions through December 21, 2009, the date the financial statements were issued, for purposes of recognition or disclosure in these financial statements and there are no subsequent events to report. |
| |
| Securities Valuation: |
| |
| The Portfolios record their investments at fair value. Fair value is defined as the price that would be received to sell an asset or paid to transfer a liability in an orderly transaction between market participants at the measurement date. The valuation techniques used to determine fair value are further described below. |
| |
| Bonds and other fixed income securities (other than short-term obligations but including listed issues) are valued on the basis of valuations furnished by a pricing service, the use of which has been approved by the Portfolio Trust’s Board of Trustees. In making such valuations, the pricing service utilizes both dealer-supplied valuations and the use of matrix techniques which take into account appropriate factors such as institutional-size trading in similar groups of securities, yield, quality, coupon rate, maturity, type of issue, trading characteristics other than market data and without exclusive reliance upon quoted prices or exchanges or over-the-counter prices, since such valuations are believed to reflect more accurately the fair value of such securities. |
| |
| The value of each equity security is based either on the last sale price on a national securities exchange, or in the absence of recorded sales, at the closing bid prices on such exchanges, or at the quoted bid price in the over-the-counter market. Securities or other assets for which market quotations are not readily available, or are deemed unreliable due to a significant event or otherwise, are valued pursuant to procedures adopted by the Portfolio Trust’s Board of Trustees. Examples of potentially significant events that could affect the value of an individual security include corporate actions by the issuer, announcements by the issuer relating to its earnings or products, regulatory news, natural disasters, and litigation. Examples of potentially significant events that could affect multiple securities held by a Portfolio include govern- |
| |
HSBC INVESTOR PORTFOLIOS | 65 |
| |
HSBC INVESTOR PORTFOLIOS |
|
Notes to Financial Statements—As of October 31, 2009 (continued) |
| |
| mental actions, natural disasters, and armed conflicts. In addition, if events materially affecting the value of foreign securities occur between the time when the exchange on which they are traded closes and the time when the Portfolios’ net assets are calculated, such securities may be valued using fair value pricing in accordance with procedures adopted by the Board of Trustees. Management identifies possible fluctuations in foreign securities by monitoring the rise or fall in the value of a designated benchmark index. In the event of a rise or fall greater than predetermined levels, the International Equity Portfolio may use a systematic valuation model provided by an independent third party to value its foreign securities, rather than local market closing prices. When the International Equity Portfolio uses such a valuation model, the value assigned to the International Equity Portfolio’s foreign securities may not be the quoted or published prices of the investment on their primary markets or exchanges. |
| |
| Exchange traded futures contracts are valued at the last sales price as of the close of the primary exchange. Forward foreign currency contracts are generally valued at the foreign currency exchange rate as of the close of the New York Stock Exchange. |
| |
| Investment Transactions and Related Income: |
| |
| Investment transactions are accounted for no later than one business day after trade date. For financial reporting purposes, changes in holdings are accounted for on trade date on the last business day of the reporting period. Investment gains and losses are calculated on the identified cost basis. Interest income is recognized on the accrual basis and includes, where applicable, the amortization or accretion of premium or discount. Dividend income is recorded on the ex-dividend date. |
| |
| Foreign Currency Translation: |
| |
| The accounting records of the Portfolios are maintained in U.S. dollars. Foreign currency amounts are translated into U.S. dollars at the current rate of exchange to determine the value of investments, assets and liabilities. Purchases and sales of securities, and income and expenses are translated at the prevailing rate of exchange on the respective dates of such transactions. The Portfolios do not isolate the portion of the results of operations resulting from changes in foreign exchange rates on investments from fluctuations arising from changes in market prices of securities held. Such fluctuations are included with the net realized and unrealized gain or loss from investments and foreign currencies. |
| |
| Expense Allocations: |
| |
| Expenses directly attributable to a Portfolio are charged to that Portfolio. Expenses not directly attributable to a Portfolio are allocated proportionally among various or all funds within the HSBC Investor Family of Funds in relation to net assets or on another reasonable basis. |
| |
| Federal Income Taxes: |
| |
| Each Portfolio will be treated as a partnership for U.S. Federal income tax purposes. Accordingly, each Portfolio passes through all of its net investment income and gains and losses to its feeder funds, and is therefore not subject to U.S. Federal income tax. As such, investors in the Portfolios will be taxed on their respective share of the Portfolios’ ordinary income and realized gains. It is intended that the Portfolios will be managed in such a way that an investor will be able to satisfy the requirements of the Internal Revenue Code applicable to regulated investment companies. |
| |
| Management of the Portfolios has reviewed tax positions taken in tax years that remain subject to examination by all major tax jurisdictions, including federal (i.e., the last four tax year ends and the interim tax period since then, as applicable). Management believes that there is no tax liability resulting from unrecognized tax benefits related to uncertain tax positions taken. |
| |
| New Accounting Pronouncements: |
| |
| In June 2009, the Financial Accounting Standards Board (“FASB”) issued Accounting Standard Codification 105-10, “The FASB Accounting Standards Codification and the Hierarchy of Generally Accepted Accounting Principles - a replacement of FASB Statement No. 162” (“ASC 105-10, formerly “SFAS 168”). ASC 105-10 replaces SFAS No. 162, “The Hierarchy of Generally Accepted Accounting Principles” and establishes the “FASB Accounting Standards Codification” (“Codification”) as the source of authoritative accounting principles recognized by the FASB to be applied by nongovernmental entities in the preparation of financial statements in conformity with U.S. GAAP. All guidance contained in the Codification carries an equal level of authority. The Codification supersedes all existing non-SEC accounting and reporting standards. All other non-grandfathered non-SEC accounting literature not included in the Codification |
| |
66 | HSBC INVESTOR PORTFOLIOS |
| |
HSBC INVESTOR PORTFOLIOS |
|
Notes to Financial Statements—As of October 31, 2009 (continued) |
| |
| will become nonauthoritative. ASC 105-10 is effective for financial statements issued for interim and annual periods ending after September 15, 2009. The Portfolios adopted ASC 105-10 in the current reporting period. Management has evaluated this new statement and has determined that it did not have a significant impact on the determination or reporting of the Portfolios’ financial statements. |
| |
| Derivative Instruments |
| |
| All open derivative positions at period end are reflected on the Portfolio’s Schedule of Portfolio Investments. The following is a description of the derivative instruments utilized by the Fund, including the primary underlying risk exposures related to each instrument type. |
| |
| Foreign Currency Exchange Contracts: |
| |
| During the year, the International Equity Portfolio, entered into foreign currency exchange contracts in connection with planned purchases or sales of securities or to hedge the U.S. dollar value of securities denominated in a particular currency. In addition to the foreign currency risk related to the use of these contracts, the Portfolio could be exposed to risks if the counterparties to the contracts are unable to meet the terms of their contracts and from unanticipated movements in the value of a foreign currency relative to the U.S. dollar. The foreign currency exchange contracts are adjusted by the daily exchange rate of the underlying currency and any gains or losses are recorded for financial statement purposes as unrealized gains or losses until the contract settlement date. The volume of foreign currency exchange contracts will generally be representative of the volume of security trades throughout the reporting period that were denominated in foreign currencies. |
| |
| Futures Contracts: |
| |
| Each Portfolio may invest in futures contracts for the purpose of hedging its existing portfolio securities or securities it intends to purchase against fluctuations in fair value caused by changes in prevailing market interest rates. Upon entering into a futures contract, the Portfolio is required to pledge to the broker an amount of cash and/or other assets equal to a certain percentage of the contract amount (initial margin deposit). Subsequent payments, known as “variation margin,” are made or received by the Portfolio each day, depending on the daily fluctuations in the fair value of the underlying security. The Portfolio recognizes a gain or loss equal to the daily variation margin. Should market conditions move unexpectedly, the Portfolio may not achieve the anticipated benefits of the futures contracts and may realize a loss. Futures contracts involve, to varying degrees, elements of market risk (generally equity price risk related to stock futures, interest rate risk related to bond futures, and foreign currency risk related to currency futures) and exposure to loss in excess of the variation margin. The primary risks associated with the use of futures contracts are the imperfect correlation between the change in market value of the securities held by the Portfolios and the prices of futures contracts, the possibility of an illiquid market, and the inability of the counterparty to meet the terms of the contract. For the year ended October 31, 2009, the Portfolios did not hold any futures contracts. |
| |
| Summary of Derivative Instruments: |
| |
| The following is a summary of the fair value of derivative instruments for the International Equity Portfolio as of October 31, 2009: |
| | | | | | | | | |
| | Asset Derivatives | | Liability Derivatives | |
| |
| |
| |
Primary Risk Exposure | | Statements of
Assets and
Liabilities Location | | Total Fair Value* | | Statements of
Assets and
Liabilities Location | | Total Fair Value* | |
| |
| |
| |
| |
| |
Foreign Currency Exchange Contracts | | Unrealized appreciation on foreign currency contracts | | $4,744 | | Unrealized depreciation on foreign currency contracts | | $(10,023) | |
| |
|
* | Total Fair Value is presented by Primary Risk Exposure. For foreign currency contracts, such amounts represent the unrealized gain/appreciation (for asset derivatives) or loss/depreciation (for liability derivatives). |
| |
HSBC INVESTOR PORTFOLIOS | 67 |
|
HSBC INVESTOR PORTFOLIOS |
|
Notes to Financial Statements—As of October 31, 2009 (continued) |
| |
| The derivative instruments had the following impact on the Statements of Operations for the International Equity Portfolio for the year ended October 31, 2009: |
| | | | | | | |
| Primary Risk Exposure | | Location of Gain (Loss)
on Derivatives
Recognized in Income | | Realized Gain
(Loss) on
Derivatives
Recognized
in Income | | Change in Unrealized
Appreciation/
Depreciation on
Derivatives Recognized
in Income |
|
| |
| |
| |
|
| | | | | | | |
| Foreign Currency Exchange Contracts | | Net realized gains (losses) from investment and foreign currency transactions/change in unrealized appreciation/depreciation on investments and foreign currencies | | $(614,669) | | $(56,257) |
| | | |
3. | Investment Valuation Summary |
| | | |
| The valuation techniques employed by the Portfolios, as described in Note 2 above, maximize the use of observable inputs and minimize the use of unobservable inputs in determining fair value. The inputs used for valuing the Portfolios’ investments are summarized in the three broad levels listed below: |
| | | |
| | • | Level 1: quoted prices in active markets for identical assets |
| | | |
| | • | Level 2: other significant observable inputs (including quoted prices for similar securities, interest rates, prepayments speeds, credit risk, etc.) |
| | | |
| | • | Level 3: significant unobservable inputs (including the Portfolio’s own assumptions in determining the fair value of investments) |
| | | |
| The inputs or methodology used for valuing investments are not necessarily an indication of the risk associated with investing in those investments. For example, short-term debt securities of sufficient credit quality maturing in sixty days or less are generally valued at amortized cost, which approximates fair value. Generally, amortized cost approximates the current fair value of a security, but since the valuation is not obtained from a quoted price in an active market, such securities are reflected as Level 2. |
| | | |
| The Schedules of Portfolio Investments includes additional information regarding the investments for the Portfolios. The following is a summary of the valuation inputs used as of October 31, 2009 in valuing the Portfolios’ investments based upon the three levels defined above: |
| | | | | | | | | | | |
| | | LEVEL 1 | | LEVEL 2 | | TOTAL
INVESTMENTS | |
| | |
| |
| |
| |
| | | | | | | | |
| Growth Portfolio | | | | | | | | | | |
| Investments: | | | | | | | | | | |
| Common Stocks - Domestic | | $ | 85,180,697 | | $ | — | | $ | 85,180,697 | |
| Investment Companies | | | 3,185,710 | | | — | | | 3,185,710 | |
| | |
|
| |
|
| |
|
| |
| Total Investments | | $ | 88,366,407 | | $ | — | | $ | 88,366,407 | |
| | |
|
| |
|
| |
|
| |
| | | | | | | | | | | |
| International Equity Portfolio | | | | | | | | | | |
| Investments: | | | | | | | | | | |
| Common Stocks - Foreign (a): | | | | | | | | | | |
| Brazil | | $ | 961,213 | | $ | — | | $ | 961,213 | |
| Canada | | | 8,515,890 | | | — | | | 8,515,890 | |
| South Korea | | | 1,697,356 | | | 1,762,036 | | | 3,459,392 | |
| Spain | | | 4,506,871 | | | 4,283,317 | | | 8,790,188 | |
| All Other Common Stocks - Foreign† | | | — | | | 191,781,060 | | | 191,781,060 | |
| Rights | | | — | | | 28,429 | | | 28,429 | |
| Investment Companies | | | 1,904,284 | | | — | | | 1,904,284 | |
| | |
|
| |
|
| |
|
| |
| Total Investments | | | 17,585,614 | | | 197,854,842 | | | 215,440,456 | |
| | |
|
| |
|
| |
|
| |
| Other Financial Instruments* | | | — | | | (5,279 | ) | | (5,279 | ) |
| | |
|
| |
|
| |
|
| |
| Total Investments | | $ | 17,585,614 | | $ | 197,849,563 | | $ | 215,435,177 | |
| | |
|
| |
|
| |
|
| |
| |
68 | HSBC INVESTOR PORTFOLIOS |
|
HSBC INVESTOR PORTFOLIOS |
|
Notes to Financial Statements—As of October 31, 2009 (continued) |
| | | | | | | | | | | |
| | | LEVEL 1 | | LEVEL 2 | | Total Investments | |
| | |
| |
| |
| |
| | | | | | | | |
| Opportunity Portfolio | | | | | | | | | | |
| Investments: | | | | | | | | | | |
| Common Stocks - Domestic | | $ | 126,195,195 | | $ | — | | $ | 126,195,195 | |
| Investment Companies | | | 3,270,825 | | | — | | | 3,270,825 | |
| | |
|
| |
|
| |
|
| |
| Total Investments | | $ | 129,466,020 | | $ | — | | $ | 129,466,020 | |
| | |
|
| |
|
| |
|
| |
| | | | | | | | | | | |
| Value Portfolio | | | | | | | | | | |
| Investments: | | | | | | | | | | |
| Common Stocks - Domestic | | $ | 48,567,126 | | $ | — | | $ | 48,567,126 | |
| Investment Companies | | | 1,417,909 | | | — | | | 1,417,909 | |
| | |
|
| |
|
| |
|
| |
| Total Investments | | $ | 49,985,035 | | $ | — | | $ | 49,985,035 | |
| | |
|
| |
|
| |
|
| |
| | | |
|
| |
| * | Other financial instruments would include any derivative instruments, such as foreign currency exchange contracts. These investments are generally recorded in the financial statements at the unrealized gain or loss on the investment. |
| | | |
| (a) | Based on the domicile of the security issuer. |
| | | |
| † | For detailed country descriptions, see the accompanying Schedules of Portfolio Investments. |
| |
4. | Related Party Transactions and Other Agreements: |
| |
| Investment Management: |
| |
| HSBC Global Asset Management (USA) Inc. (“HSBC” or the “Investment Adviser”), a wholly owned subsidiary of HSBC Bank USA, N.A., a national bank organized under the laws of the United States, acts as the Investment Adviser to the Portfolios pursuant to an investment management contract with the Portfolio Trust. As Investment Adviser, HSBC manages the investments of the Portfolios and continuously reviews, supervises, and administers the Portfolios’ investments, except that Winslow Capital Management, Inc., AllianceBernstein L.P., Westfield Capital Management Company, L.P. and NWQ Investment Management Company, LLC serve as Sub-Investment Advisers for the Growth Portfolio, International Equity Portfolio, Opportunity Portfolio, and the Value Portfolio, respectively, and are paid for their services directly by the respective Portfolios. |
| |
| For their services, the Investment Adviser and Winslow Capital Management, Inc. (“Winslow”) receive in aggregate, from the Growth Portfolio, a fee, accrued daily and paid monthly, at an annual rate of: |
| | | |
| Based on Average Daily Net Assets of all Sub-Adviser serviced funds and separate accounts affiliated with HSBC: | | Fee Rate* |
|
| |
|
| Up to $250 million | | 0.575% |
| In excess of $250 million but not exceeding $500 million | | 0.525% |
| In excess of $500 million but not exceeding $750 million | | 0.475% |
| In excess of $750 million but not exceeding $1 billion | | 0.425% |
| In excess of $1 billion | | 0.375% |
| | | |
|
| |
| * | The investment advisory contract provides that the Growth Portfolio may pay the Investment Adviser an aggregate maximum fee of 0.68%. Currently, the Investment Adviser’s share of the aggregate maximum fee rate is capped at 0.175%. Accordingly, the aggregate maximum fee rate is 0.575%. |
| |
| For their services, the Investment Adviser and AllianceBernstein L.P. receive in aggregate, from the International Equity Portfolio, a fee, accrued daily and paid monthly, at an annual rate of: |
| | | |
| Based on Average Daily Net Assets of: | | Fee Rate |
|
| |
|
| Up to $10 million | | 1.015% |
| In excess of $10 million but not exceeding $25 million | | 0.92% |
| In excess of $25 million but not exceeding $50 million | | 0.79% |
| In excess of $50 million but not exceeding $100 million | | 0.70% |
| In excess of $100 million | | 0.61% |
| |
| For their services, the Investment Adviser and Westfield Capital Management Company, L.P. receive in aggregate, a fee, accrued daily and paid monthly, at an annual rate of 0.80% of the Opportunity Portfolio’s average daily net assets. |
| |
HSBC INVESTOR PORTFOLIOS | 69 |
|
HSBC INVESTOR PORTFOLIOS |
|
Notes to Financial Statements—As of October 31, 2009 (continued) |
| |
| For their services, the Investment Adviser and NWQ Investment Management Company, LLC receive in aggregate, from the Value Portfolio, a fee, accrued daily and paid monthly, at an annual rate of: |
| | | |
| Based on Average Daily Net Assets of | | Fee Rate |
|
| |
|
| Up to $500 million | | 0.525% |
| In excess of $500 million but not exceeding $1 billion | | 0.475% |
| In excess of $1 billion | | 0.425% |
| |
| Any voluntary fee waivers/reimbursements are not subject to recoupment in subsequent fiscal periods. Voluntary waiver/reimbursements may be stopped at any time. |
| |
Administration: |
| |
| HSBC serves the Portfolios as Administrator. Under the terms of the Administration Agreement, HSBC receives from the Portfolios (as well as the other funds in the HSBC Investor Family of Funds) a fee, accrued daily and paid monthly, during the period November 1, 2008 to December 31, 2008, at annual rate of: |
| | | |
| Based on Average Daily Net Assets of | | Fee Rate |
|
| |
|
| Up to $12 billion | | 0.0525% |
| In excess of $12 billion | | 0.0350% |
| |
| Effective January 1, 2009, under the terms of the Administration Agreement, HSBC receives from the Portfolios (as well as the other funds in the HSBC Investor Family of Funds) a fee, accrued daily and paid monthly, at annual rate of: |
| | | |
| Based on Average Daily Net Assets of | | Fee Rate |
|
| |
|
| Up to $10 billion | | 0.0550% |
| In excess of $10 billion but not exceeding $20 billion | | 0.0350% |
| In excess of $20 billion but not exceeding $50 billion | | 0.0275% |
| In excess of $50 billion | | 0.0250% |
| |
| The fee rates and breakpoints are determined on the basis of the aggregate average daily net assets of the HSBC Investor Family of Funds, however, the assets of the Portfolios and HSBC Investor Funds that invest in the Portfolios are not double-counted. The total administration fee paid to HSBC is allocated to each series in the HSBC Investor Family of Funds based upon its proportionate share of the aggregate net assets of the Family of Funds. For assets invested in the Portfolios by the HSBC Investor Funds, the Portfolios pay half of the administration fee and the other funds pay half of the administration fee, for a combination of the total fee rate set forth above. Certain administrative fees of the Portfolios also may be received by treating them as apportioned in part to other funds makes investments in the Portfolios a master-feeder structure. |
| |
| Pursuant to a Sub-Administration Agreement with HSBC, Citi Fund Services Ohio, Inc. (“Citi Ohio”), a wholly-owned subsidiary of Citigroup, Inc., serves as the Portfolio Trust’s Sub-Administrator subject to the general supervision of the Portfolio Trust’s Board of Trustees and HSBC. For these services, Citi Ohio is entitled to a fee, payable by HSBC, at an annual rate equivalent to the fee rates set forth above, minus 0.02% (2 basis points) which is retained by HSBC. |
| |
| Under a Compliance Services Agreement between the Portfolio Trust and the other HSBC Investor Funds (the “Trusts”) and Citi Ohio (the “CCO Agreement”), Citi Ohio makes an employee available to serve as the Trusts’ Chief Compliance Officer (the “CCO”). Under the CCO Agreement, Citi Ohio also provides infrastructure and support in implementing the written policies and procedures comprising the Portfolios’ compliance program, including support services to the CCO. For the services provided under the CCO Agreement, the HSBC Investor Family of Funds paid Citi Ohio $266,099 for the year ended October 31, 2009, plus reimbursement of certain expenses. Expenses incurred by each Portfolio are reflected on the Statements of Operations as “Compliance Services.” Citi Ohio pays the salary and other compensation earned by individuals performing these services, as employees of Citi Ohio. |
| |
Fund Accounting and Trustees: |
| |
| Citi Ohio provides fund accounting services for the Portfolio Trust. For its services to the Portfolios, Citi Ohio receives an annual fee per portfolio, including reimbursement of certain expenses, that is accrued daily and paid monthly. |
| |
| Each non-interested Trustee is compensated with a $60,000 annual Board retainer for services as a Trustee of the HSBC Investor Family of Funds (or the “Trusts”), as well as a $3,000 annual retainer for each Committee of the Board of the Trusts. Each non-interested Trustee also receives a $5,000 and $3,000 meeting fee for each regular in-person Board |
| |
70 | HSBC INVESTOR PORTFOLIOS |
|
HSBC INVESTOR PORTFOLIOS |
|
Notes to Financial Statements—As of October 31, 2009 (continued) |
| |
| meeting and Committee meeting, respectively. Furthermore, each non-interested Trustee receives compensation for attending special meetings and/or functioning as a Committee or Board Chairperson. In addition, the non-interested Trustees are reimbursed for certain expenses incurred in connection with their Board membership. |
| |
5. | Investment Transactions: |
| |
| Purchases and sales of securities (excluding securities maturing less than one year from acquisition) for the year ended October 31, 2009 were as follows: |
| | | | | | | |
Portfolio Name | | Purchases
(excluding U.S.
Government) | | Sales
(excluding U.S.
Government) | |
| |
| |
| |
Growth Portfolio | | $ | 51,655,635 | | $ | 58,934,962 | |
International Equity Portfolio | | | 104,824,970 | | | 124,088,899 | |
Opportunity Portfolio | | | 72,783,514 | | | 84,100,255 | |
Value Portfolio | | | 8,891,736 | | | 13,184,851 | |
| |
| There were no long-term U.S. Government securities held during the year ended October 31, 2009. |
| |
6. | Federal Income Tax Information: |
| |
| At October 31, 2009, the cost, gross unrealized appreciation and gross unrealized depreciation on securities for federal income tax purposes, were as follows: |
| | | | | | | | | | | | | |
Fund | | Tax Cost ($) | | Tax Unrealized
Appreciation ($) | | Tax Unrealized
Depreciation ($) | | Net Unrealized
Appreciation/
(Depreciation) ($)* | |
| |
| |
| |
| |
| |
Growth Portfolio | | | 79,874,530 | | | 10,686,442 | | | (2,194,565 | ) | | 8,491,877 | |
International Equity Portfolio | | | 228,068,719 | | | 18,620,686 | | | (31,248,949 | ) | | (12,628,263 | ) |
Opportunity Portfolio | | | 131,149,543 | | | 16,508,193 | | | (18,191,716 | ) | | (1,683,523 | ) |
Value Portfolio | | | 53,335,078 | | | 5,357,517 | | | (8,707,560 | ) | | (3,350,043 | ) |
| | |
|
|
| * | The difference between book-basis unrealized appreciation (depreciation) is attributable primarily to: tax deferral of losses on wash sales. |
| |
7. | Legal and Regulatory Matters: |
| |
| On September 26, 2006, BISYS Fund Services, Inc. (“BISYS”), an affiliate of BISYS Fund Services Ohio, Inc. which provided various services to the Portfolios, reached a settlement with the Securities and Exchange Commission (“the SEC”) regarding the SEC’s investigation related to BISYS’ past payment of certain marketing and other expenses with respect to certain of its mutual fund clients. Although BISYS has reached a settlement with the SEC, the Portfolios’ management is not aware that any determination has been made as to how the BISYS settlement monies will be distributed. While the Portfolios’ management is currently unable to determine the impact, if any, of such matters on the Funds or the Portfolios’ financial statements, management does not anticipate a material, adverse impact to the Portfolios or the Portfolios’ financial statements. |
| |
HSBC INVESTOR PORTFOLIOS | 71 |
REPORT OF INDEPENDENT REGISTERED PUBLIC ACCOUNTING FIRM
To the Shareholders and Board of Trustees of
HSBC Investor Portfolios:
We have audited the accompanying statements of assets and liabilities of HSBC Investor Portfolios -HSBC Investor Growth Portfolio, HSBC Investor International Equity Portfolio, HSBC Investor Opportunity Portfolio and HSBC Investor Value Portfolio (the Funds), including the schedules of portfolio investments, as of October 31, 2009, and the related statements of operations for the year then ended, the changes in net assets for each year in the two-year period then ended, and the financial highlights for each year in the five-year period then ended. These financial statements and financial highlights are the responsibility of the Funds’ management. Our responsibility is to express an opinion on these financial statements and financial highlights based on our audits.
We conducted our audits in accordance with the standards of the Public Company Accounting Oversight Board (United States). Those standards require that we plan and perform the audits to obtain reasonable assurance about whether the financial statements and financial highlights are free of material misstatement. An audit includes examining, on a test basis, evidence supporting the amounts and disclosures in the financial statements. Our procedures included confirmation of securities owned as of October 31, 2009, by correspondence with custodians and brokers or by other appropriate auditing procedures. An audit also includes assessing the accounting principles used and significant estimates made by management, as well as evaluating the overall financial statement presentation. We believe that our audits provide a reasonable basis for our opinion.
In our opinion, the financial statements and financial highlights referred to above present fairly, in all material respects, the financial position of the Funds as of October 31, 2009, the results of their operations for the year then ended, the changes in their net assets for each year in the two-year period then ended, and the financial highlights for each year in the five-year period then ended, in conformity with U.S. generally accepted accounting principles.
Columbus, Ohio
December 21, 2009
| |
72 | HSBC INVESTOR PORTFOLIOS |
|
HSBC INVESTOR FAMILY OF FUNDS |
|
Table of Shareholder Expenses (Unaudited)—As of October 31, 2009 |
| |
| As a shareholder of the HSBC Investor Portfolios (“Portfolios”), you incur ongoing costs, including management fees and other Fund expenses. |
| |
| These examples are intended to help you understand your ongoing costs (in dollars) of investing in the Portfolios and to compare these costs with the ongoing costs of investing in other mutual funds. |
| |
| These examples are based on an investment of $1,000 invested at the beginning of the period and held for the entire period from May 1, 2009 through October 31, 2009. |
| |
| Actual Example |
| |
| The table below provides information about actual account values and actual expenses. You may use the information below, together with the amount you invested, to estimate the expenses that you paid over the period. Simply divide your account value by $1,000 (for example, an $8,600 account value divided by $1,000 = 8.6), then multiply the result by the number in the table under the heading entitled “Expenses Paid During Period” to estimate the expenses you paid on your account during this period. |
| | | | | | | | | | | | | | | | | | | | | |
| | Beginning
Account Value
5/1/09 | | Ending
Account Value
10/31/09 | | Expenses Paid
During Period*
5/1/09 – 10/31/09 | | Annualized
Expense Ratio
During Period
5/1/09 – 10/31/09 | |
| |
| |
| |
| |
| |
Growth Portfolio | | | $ | 1,000.00 | | | | $ | 1,169.10 | | | | $ | 3.72 | | | | | 0.68 | % | |
International Equity Portfolio | | | | 1,000.00 | | | | | 1,299.70 | | | | | 4.87 | | | | | 0.84 | % | |
Opportunity Portfolio | | | | 1,000.00 | | | | | 1,198.30 | | | | | 4.93 | | | | | 0.89 | % | |
Value Portfolio | | | | 1,000.00 | | | | | 1,258.40 | | | | | 3.81 | | | | | 0.67 | % | |
| |
|
* | Expenses are equal to the average account value over the period multiplied by the Portfolio’s annualized expense ratio, multiplied by the number of days in the most recent fiscal half-year divided by the number of days in the fiscal year (to reflect the one half year period). |
Hypothetical Example for Comparison Purposes
The table below provides information about hypothetical account values and hypothetical expenses based on each Portfolio’s actual expense ratio and an assumed rate of return of 5% per year before expenses, which is not the Portfolio’s actual return. The hypothetical account values and expenses may not be used to estimate the actual ending account balance or expenses you paid for the period. You may use this information to compare this 5% hypothetical example with the 5% hypothetical examples that appear in the shareholder reports of other funds.
Please note that the expenses shown in the table are meant to highlight your ongoing costs only and do not reflect any transactional costs, such as sales charges (loads), redemption fees, or exchange fees. Therefore, the table is useful in comparing ongoing costs only, and will not help you determine the relative total costs of owning different funds. In addition, if these transactional costs were included, your costs would have been higher.
| | | | | | | | | | | | | | | | | | | | | |
| | Beginning
Account Value
5/1/09 | | Ending
Account Value
10/31/09 | | Expenses Paid
During Period*
5/1/09 - 10/31/09 | | Annualized
Expense Ratio
During Period
5/1/09 - 10/31/09 | |
| |
| |
| |
| |
| |
Growth Portfolio | | | $ | 1,000.00 | | | | $ | 1,021.78 | | | | $ | 3.47 | | | | | 0.68 | % | |
International Equity Portfolio | | | | 1,000.00 | | | | | 1,020.97 | | | | | 4.28 | | | | | 0.84 | % | |
Opportunity Portfolio | | | | 1,000.00 | | | | | 1,020.72 | | | | | 4.53 | | | | | 0.89 | % | |
Value Portfolio | | | | 1,000.00 | | | | | 1,021.83 | | | | | 3.41 | | | | | 0.67 | % | |
| |
|
* | Expenses are equal to the average account value over the period multiplied by the Portfolio’s annualized expense ratio, multiplied by the number of days in the most recent fiscal half-year divided by the number of days in the fiscal year (to reflect the one half year period). |
| |
HSBC INVESTOR PORTFOLIOS | 73 |
|
HSBC INVESTOR FAMILY OF FUNDS |
|
Board of Trustees and Officers (unaudited) |
MANAGEMENT OF THE TRUST
The following table contains information regarding HSBC Investor Family of Funds Board of Trustees (“Trustees”). Asterisks indicate those Trustees who are “interested persons,” as defined in the Investment company act of 1940, as amended, of the HSBC Investor Family of Funds. The HSBC Investor Family of Funds’ Statement of Additional Information includes additional information about the Trustees and is available by calling (888) 525-5757.
| | | | | | | | | | |
Name, Address,
and Age | | Position(s)
Held with
HSBC Investor
Family of Funds | | Term of Office and
Length of Time Served
With the HSBC Investor
Family of Funds | | Principal Occupation(s)
During Past 5 Years | | Number of
Portfolios in Fund
Complex Overseen
By Trustee* | | Other
Directorships
Held by Trustee |
|
|
|
|
|
|
|
|
|
|
|
| | | | | | | | | | |
NON-INTERESTED
TRUSTEES | | | | | | | | | | |
| | | | | | | | | | |
Alan S. Parsow
P.O. Box 182845
Columbus, OH 43218
Age: 59 | | Trustee | | Indefinite: 1987
to present | | General Partner of Elkhorn Partners,
L.P. (A private investment partnership)
(since 1989) | | 36 | | Penn Treaty
American
Corporation
(insurance) |
|
|
|
|
|
|
|
|
|
|
|
Larry M. Robbins
P.O. Box 182845
Columbus, OH 43218
Age: 70 | | Trustee | | Indefinite: 1987
to present | | Private Investor (2007-present); Director,
Center for Teaching and Learning, University
of Pennsylvania (1999-2007) | | 36 | | None |
|
|
|
|
|
|
|
|
|
|
|
Michael Seely
P.O. Box 182845
Columbus, OH 43218
Age: 64 | | Trustee | | Indefinite: 1987
to present | | Private Investor (2003-present);
Global Multi Manager Partners (1999-2003);
President of Investor Access Corporation
(1981-2003) | | 36 | | None |
|
|
|
|
|
|
|
|
|
|
|
Thomas F. Robards
P.O. Box 182845
Columbus, OH 43218
Age: 63 | | Trustee | | Indefinite: March 2005
to present | | Partner, Robards & Co. LLC (2005-
present); Chief Financial Officer,
American Museum of Natural History
(2003-2004) | | 36 | | Overseas Shipholding
Group (energy
transportation);
Ellington Financial
LLC (financial
services); Big Apple
Circus (entertainment) |
|
|
|
|
|
|
|
|
|
|
|
Susan S. Huang
P.O. Box 182845
Columbus, OH 43218
Age: 55 | | Trustee | | Indefinite: June 2008
to present | | Investment Consultant, self employed
(2001 to present); Senior Vice President, Schroeder Investment Management
(2001-2004) | | 36 | | United Church
Federation;
Huntington’s Disease
Society; Second
Congregational
Church (Greenwich)
Endowment, Inc. |
|
|
|
|
|
|
|
|
|
|
|
Marcia L. Beck
P.O. Box 182845
Columbus, OH 43218
Age: 54 | | Trustee | | Indefinite: June 2008
to present | | Private Investor (June 1999
to present) | | 36 | | None |
|
|
|
|
|
|
|
|
|
|
|
| | | | | | | | | | |
INTERESTED TRUSTEES | | | | | | | | |
| | | | | | | | | | |
Stephen J. Baker**
P.O. Box 182845
Columbus, OH 43218
Age: 53 | | Trustee | | Indefinite: 2004
to present | | Chief Executive Officer, HSBC Global
Asset Management (USA) Inc., and
Executive Vice President, HSBC (USA),
N.A. (2003 to present); Chief Executive
Officer, HSBC Asset Management
(Canada) Limited (1998 to 2003) | | 36 | | None |
|
|
|
|
|
|
|
|
|
|
|
| |
* | Includes the Funds and the underlying Portfolios for the HSBC Investor Family of Funds with a master/feeder structure. |
| |
** | Mr. Baker is an “interested person” of the the HSBC Investor Family of Funds, as defined by the 1940 Act, due to his employment with the Investment Adviser. |
| |
74 | HSBC INVESTOR PORTFOLIOS |
|
HSBC INVESTOR FAMILY OF FUNDS |
|
Board of Trustees and Officers (unaudited) (continued) |
The names of the officers, their addresses, ages, position(s) held with the Trust, and principal occupation(s) during the past five years are described in the table below.
| | | | | | |
Name, Address,
and Age/ | | Position(s)
Held with the
HSBC Investor
Family of Funds | | Term of Office and
Length of Time Served
With the HSBC Investor
Family of Funds | | Principal Occupation(s)
During Past 5 Years |
|
|
|
|
|
|
|
| | | | | | |
Richard A. Fabietti
452 Fifth Avenue
New York, NY 10018
Age: 51 | | President | | Indefinite: March 2004
to present | | Senior Vice President, Head of Product Management, HSBC Global Asset Management (USA) Inc. (1998 to present) |
|
|
|
|
|
|
|
Elba L. Vasquez
452 Fifth Avenue
New York, NY 10018
Age: 47 | | Vice President | | Indefinite: March 2006
to present | | Vice President of Product Administration, HSBC Global Asset Management (USA) Inc. (2005 to present); Vice President of Client Services, Citi Fund Services Ohio, Inc. (1996 to 2005) |
|
|
|
|
|
|
|
Martin R. Dean*
3435 Stelzer Road
Columbus, OH 43219-3035
Age: 46 | | Treasurer | | Indefinite: October 2009
to present | | Senior Vice President of Citi Fund Services |
|
|
|
|
|
|
|
Jennifer A. English*
100 Summer Street
Suite 1500
Boston, MA 02110
Age: 37 | | Secretary | | Indefinite: 2008
to present | | Senior Vice President, Regulatory Administration, Citi Fund Services (2005 – present); Assistant Vice President and Assistant Counsel, PFPC, Inc. (2002-2005) |
|
|
|
|
|
|
|
F. Martin Fox*
100 Summer Street
Suite 1500
Boston, MA 02110
Age: 46 | | Assistant Secretary | | Indefinite: 2008
to present | | Assistant Vice President, Regulatory Administration, Citi Fund Services (May 2008 – present); Contract Attorney, Update Legal LLC (2002 – 2008) |
|
|
|
|
|
|
|
Frederick J. Schmidt*
1 RexCorp Plaza
Uniondale, NY 11556
Age: 50 | | Chief
Compliance Officer | | Term expires 2009;
2004 to present | | Senior Vice President and Chief Compliance Officer, CCO Services Group, Global Transaction Services of Citi Fund Services (2004 to present) |
|
|
|
|
|
|
|
| |
* | Messrs. Dean, Fox and Schmidt and Ms. English also are officers of certain other investment companies of which Citi (or an affiliate) is the administrator or sub-administrator. |
| |
HSBC INVESTOR PORTFOLIOS | 75 |
Other Information:
A description of the policies and procedures that the Funds and Portfolios use to determine how to vote proxies relating to the portfolio securities is available without charge, upon request, by calling 1-800-525-5757 for HSBC Bank USA and HSBC Brokerage (USA) Inc. clients and 1-800-782-8183 for all other shareholders or on the Funds’ website at www.investor-funds.us.hsbc.com and the Securities and Exchange Commission’s (“Commission”) website at http://www.sec.gov. A copy of the Funds’ and Portfolios’ voting records for the most recent 12 month period ending June 30 are available at the Commission’s website at http://www.sec.gov.
Schedules of Portfolio Investments for fiscal quarters ending January 31 and July 31 will be available no later than 60 days after each period end, without charge, on the Funds’ website at www.investorfunds.us.hsbc.com and on the Commission’s web-site at http://www.sec.gov.
An investment in a Fund is not a deposit of HSBC Bank USA, National Association, and is not insured or guaranteed by the Federal Deposit Insurance Corporation or any other government agency.
| |
76 | HSBC INVESTOR PORTFOLIOS |
| |
HSBC INVESTOR FAMILY OF FUNDS: | For All Other Shareholders |
| HSBC Investor Funds |
INVESTMENT ADVISER AND ADMINISTRATOR | P.O. Box 182845 |
HSBC Global Asset Management (USA) Inc. | Columbus, OH 43218-2845 |
452 Fifth Avenue | 1-800-782-8183 |
New York, NY 10018 | |
| TRANSFER AGENT |
SUB-ADVISERS | Citi Fund Services |
HSBC Investor Growth Portfolio | 3435 Stelzer Road |
Winslow Capital Management, Inc. | Columbus, OH 43219 |
4720 IDS Tower | |
80th South Eighth Street | DISTRIBUTOR |
Minneapolis, MN 55402 | Foreside Distribution Services, L.P. |
| 690 Taylor Road, Suite 150 |
HSBC Investor International Equity Portfolio | Gahanna, Ohio 43230-3202 |
AllianceBernstein L.P. | |
1345 Avenue of the Americas, 39th Floor | CUSTODIAN |
New York, NY 10105 | The Northern Trust Company |
| 50 South LaSalle Street |
HSBC Investor Opportunity Portfolio | Chicago, IL 60603 |
Westfield Capital Management Company, L.P. | |
One Financial Center | INDEPENDENT REGISTERED PUBLIC |
Boston, MA 02111 | ACCOUNTING FIRM |
| KPMG LLP |
HSBC Investor Value Portfolio | 191 West Nationwide Blvd., Suite 500 |
NWQ Investment Management Company, LLC | Columbus, OH 43215 |
2049 Century Park East, 16th Floor | |
Los Angeles, CA 90067 | LEGAL COUNSEL |
| Dechert LLP |
SHAREHOLDER SERVICING AGENTS | 1775 I Street, N.W. |
For HSBC Bank USA, N.A. and | Washington, D.C. 20006 |
HSBC Securities (USA) Inc. Clients | |
HSBC Bank USA, N.A. | |
452 Fifth Avenue | |
New York, NY 10018 | |
1-888-525-5757 | |


The HSBC Investor Family of Funds are distributed by Foreside Distribution Services, L.P. This document must be preceded or accompanied by a current prospectus for the HSBC Investor Funds, which you should read carefully before you invest or send money.
| | | |
| — NOT FDIC INSURED | — NO BANK GUARANTEE | — MAY LOSE VALUE |
Item 2. Code of Ethics.
(a) The registrant has adopted a code of ethics that applies to the registrant’s principal executive officer, principal financial officer, principal accounting officer or controller, or persons performing similar functions. This code of ethics is included as Exhibit 12(a)(i).
(b) During the period covered by the report, with respect to the registrant’s code of ethics that applies to its principal executive officer, principal financial officer, principal accounting officer or controller, or persons performing similar functions; there have been no amendments to, nor any waivers granted from, a provision that relates to any element of the code of ethics definition enumerated in paragraph (b) of this Item 2.
Item 3. Audit Committee Financial Expert.
3(a)(1) The registrant’s board of directors has determined that the registrant has at least one audit committee financial expert serving on its audit committee.
3(a)(2) The audit committee financial expert is Thomas Robards, who is “independent” for purposes of this Item 3 of Form N-CSR.
Item 4. Principal Accountant Fees and Services.
| | |
| (a) Audit Fees, |
| 2008 | $303,300 |
| 2009 | $228,000 |
| | |
| (b) Audit-Related Fees, |
| 2008 | $10,200 |
| 2009 | $10,700 |
| | |
| 2008 – Fees of $10,200 relate to the consent of N-1A filing and the consent of the N-14 filing for the HSBC Investor Growth and Income Fund and the HSBC Investor Growth Fund. |
| | |
| 2009 – Fees of $10,700 relate to the consent of N-1A filing and the consent of the N-14 filing for the HSBC Investor Core Plus Fixed Income Fund (Advisor), HSBC Investor Core Plus Fixed Income Fund and HSBC Investor Intermediate Duration Fixed Income Fund. |
| | |
| (c) Tax Fees, |
| 2008 | $161,500 |
| 2009 | $160,805 |
| | |
| Fees for both 2008 and 2009 relate to the preparation of federal income and excise tax returns and the review of excise tax distributions. |
| | |
| (d) All Other Fees, |
| 2008 | $0 |
| 2009 | $0 |
(e)(1) Disclose the audit committee’s pre-approval policies and procedures described in paragraph (c)(7) of Rule 2-01 of Regulation S-X.
(2) Disclose the percentage of services described in each of paragraphs (b) through (d) of this Item that were approved by the audit committee pursuant to paragraph (c)(7)(i)(C) of Rule 2-01 of Regulation S-X.
None of the services summarized in (b) – (d), above, were approved by the audit Committee pursuant to Rule 2-01(c)(7)(i)(C) of Regulation S-X.
| | |
| (f) Not applicable. |
| | |
| (g) Non-Audit Fees. |
| 2008 | $171,700 |
| 2009 | $171,505 |
(h) The audit committee considered the nonaudit services rendered to the registrant’s investment adviser and any entity controlling, controlled by, or under common control with the investment adviser, and believes the services are compatible with the principal accountant’s independence.
Item 5. Audit Committee of Listed Registrants.
Not applicable.
Item 6. Investments.
(a) Included as a part of the report to shareholders filed under Item 1.
(b) Not applicable.
Item 7. Disclosure of Proxy Voting Policies and Procedures for Closed-End Management Investment Companies.
Not applicable.
Item 8. Portfolio Managers of Closed-End Management Investment Companies.
Not applicable.
Item 9. Purchases of Equity Securities by Closed-End Management Investment Company and Affiliated Purchasers.
Not applicable.
Item 10. Submission of Matters to a Vote of Security Holders.
Not applicable.
Item 11. Controls and Procedures.
(a) The registrant’s principal executive officer and principal financial officer have concluded, based on their evaluation of the registrant’s disclosure controls and procedures as conducted within 90 days of the filing date of this report, that these disclosure controls and procedures are adequately designed and are operating effectively to ensure that information required to be disclosed by the registrant on Form N-CSR is recorded, processed, summarized and reported within the time periods specified in the Securities and Exchange Commission’s rules and forms.
(b) There were no changes in the registrant’s internal control over financial reporting (as defined in Rule 30a-3(d) under the Act (17 CFR 270.30a-3(d)) that occurred during the second fiscal quarter of the period covered by this report that have materially affected or are reasonably likely to materially affect, the registrant’s internal control over financial reporting.
Item 12. Exhibits.
(a)(1) The code of ethics that is the subject of the disclosure required by Item 2 is attached hereto.
(a)(2) Certifications pursuant to Rule 30a-2(a) are attached hereto.
(a)(3) Not applicable.
(b) Certifications pursuant to Rule 30a-2(b) are furnished herewith.
SIGNATURES
Pursuant to the requirements of the Securities Exchange Act of 1934 and the Investment Company Act of 1940, the registrant has duly caused this report to be signed on its behalf by the undersigned, thereunto duly authorized.
| | |
(Registrant) | HSBC INVESTOR FUNDS | |
| | |
By (Signature and Title)* | /s/ Richard A. Fabietti | |
| Richard A. Fabietti | |
| President | |
Pursuant to the requirements of the Securities Exchange Act of 1934 and the Investment Company Act of 1940, this report has been signed below by the following persons on behalf of the registrant and in the capacities and on the dates indicated.
| | |
By (Signature and Title)* | /s/ Richard A. Fabietti | |
| Richard A. Fabietti | |
| President | |
| | |
By (Signature and Title)* | /s/ Martin R. Dean | |
| Martin R. Dean | |
| Treasurer | |
* Print the name and title of each signing officer under his or her signature.