Barclays Capital Intermediate U.S. Aggregate Index (formerly Lehman Brothers Intermediate U.S. Aggregate Index) is an unmanaged index generally representative of investment-grade issues with maturities between three- and ten-years.
Barclays Capital New York Tax Exempt Index (formerly Lehman Brothers New York Tax Exempt Index) is an unmanaged index composed of investment grade New York tax-exempt securities, all having a $50 million minimum maturity value.
Barclays Capital U.S. Aggregate Index (formerly Lehman Brothers U.S. Aggregate Index) is an unmanaged index generally representative of investment-grade fixed-rate debt issues, including government, corporate, asset-backed, and mortgage-backed securities, with maturities of at least one year.
Citigroup U.S. High Yield Market Capped Index, the “U.S. High Yield Market Capped Index” uses the U.S. High-Yield Market Index as its foundation imposing a cap on the par amount of each issuer in order to limit the impact of large issuers while retaining the characteristics of the issuer’s distribution across different maturities. The U.S. High-Yield Market Index captures the performance of below-investments-grade debt issued by corporations domiciled in the United States or Canada.
Gross Domestic Product (“GDP”) is the measure of the market value of the goods and services produced by labor and property in the United States.
Lipper High Current Yield Funds Average is an average of managed mutual funds that aim at high (relative) current yield from fixed income securities, which have no quality or maturity restrictions, and tend to invest in lower grade debt issues.
Lipper Intermediate Investment-Grade Debt Funds Average is an average of managed mutual funds that invest at least 65% of their assets in investment-grade debt issues (rated in the top four grades) with dollar-weighted average maturities of five- to ten-years.
Lipper International Large-Cap Core Funds Average is an average of managed mutual funds that, by portfolio practice, invest at least 75% of their equity assets in companies strictly outside of the U.S. with market capitalizations (on a three-year weighted basis) above Lipper’s international large-cap floor. International large-cap core funds typically have an average price-to-cash flow ratio, price-to-book ratio, and three-year sales-per-share growth value compared to their large-cap specific subset of the S&P/Citigroup World ex-U.S. BMI.
Lipper Large-Cap Growth Funds Average is an average of managed mutual funds that, by portfolio practice, invest at least 75% of their equity assets in companies with market capitalizations (on a three-year weighted basis) greater than 300% of the dollar-weighted median market capitalization of the middle 1,000 securities of the S&P SuperComposite 1500 Index. Large-cap growth funds typically have an above-average price-to-earnings ratio, price-to-book ratio, and three-year sales-per-share growth value, compared to the S&P 500 Index.
Lipper Mid-Cap Growth Funds Average is an average of managed mutual of managed funds that, by portfolio practice, invest at least 75% of their equity assets in companies with market capitalizations (on a three-year weighted basis) of less than 300% of the dollar-weighted median market capitalization of the Standard & Poor’s MidCap 400 Index.
Lipper Multi-Cap Value Funds Average is an average of managed mutual of managed funds that, by portfolio practice, invest in a variety of market capitalization ranges, without concentrating 75% of their equity assets in any one market capitalization range over an extended period of time. Multi-Cap funds will generally have between 25% to 75% of their assets invested in companies with market capitalizations (on a three-year weighted basis) above 300% of the dollar-weighted median market capitalization of the S&P MidCap 400 Index. Multi-Cap value funds seek long-term growth of capital by investing in companies that are considered to be undervalued relative to a major unmanaged stock index based on price-to-current earnings, book value, asset value, or other factors. These funds will normally have a below-average price-to-earnings ratio, price-to-book ratio, and three-year earnings growth figure, compared to the U.S. diversified multi-cap funds universe average.
Lipper New York Municipal Debt Funds Average is an average of managed mutual funds that invest at least 65% of their assets in municipal debt issues that are exempt from taxation in New York or a city in New York.
Morgan Stanley Capital International Europe, Australasia and Far East (“MSCI EAFE”) Index is an unmanaged free float-adjusted market capitalization index that is designed to measure the equity market performance of developed markets, excluding the U.S. & Canada. As of June 2007 the MSCI EAFE Index consisted of the following 21 developed market country indices: Australia, Austria, Belgium, Denmark, Finland, France, Germany, Greece, Hong Kong, Ireland, Italy, Japan, the Netherlands, New Zealand, Norway, Portugal, Singapore, Spain, Sweden, Switzerland, and the United Kingdom.
The Russell Universe - Russell is a recognized leader in consulting, multi-manager investing and institutional investment management. Our consultants advise clients on more than $2 trillion in assets. We deliver investment programs to over 2,000 clients in 44 countries. With more than $230 billion in assets in our funds, Russell researchers meet with over 4,000 investment managers around the world to evaluate their investment process.
Russell 1000® Growth Index is an unmanaged index which measures the performance of the large-cap growth segment of the U.S. equity universe. It includes those Russell 1000 companies with higher price-to-book ratios and higher forecasted growth values.
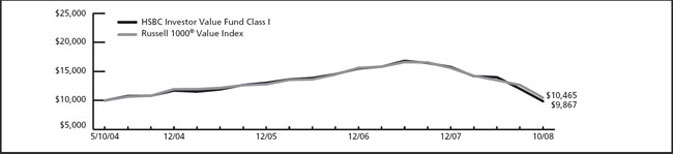
Russell 1000® Value Index is an unmanaged index which measures the performance of the large-cap value segment of the U.S. equity universe. It includes those Russell 1000 companies with lower price-to-book ratios and lower expected growth values.
Russell 2000® Index is an unmanaged index which easures the performance of the 2,000 smallest companies in the Russell 3000 Index, which represents approximately 8% of the total market capitalization of the Russell 3000 Index. The companies which comprise this index have high price-to-book ratios and higher forecasted growth values.
Russell 2500™ Growth Index is an unmanaged index which measures the performance of the small to mid-cap growth segment of the U.S. equity universe. It includes those Russell 2500 companies with higher price-to-book ratios and higher forecasted growth values.
Standard & Poor’s MidCap 400 Index (“S&P MidCap 400”) is an unmanaged index comprised of 400 domestic stocks chosen for market size (median market capitalization of $676 million), liquidity and industry group representation.
Standard & Poor’s 500 Index (“S&P 500”) is an unmanaged index that is widely regarded as a gauge of the U.S. equities market, this index includes 500 leading companies in leading industries of the U.S. economy. The S&P 500 focuses on the large cap segment of the market, with approximately 75% coverage of U.S. equities.
Lipper is an independent mutual fund performance monitor whose results are based on total return and do not reflect a sales charge.
Securities indexes assume reinvestment of all distributions and interest payments and do not take in account brokerage fees or expenses. Securities in the Fund do not match those in the indexes and performance of the Fund will differ. Investors cannot invest directly in an index.
Dear Shareholder,
Over the past eighteen months, the financial markets have experienced arguably the most difficult conditions in recent history. The underlying causes of the market’s significant and persistent downturn have had devastating effects on corporations around the world. The value of equity, fixed income and even money market securities has all been affected by the slowing economy, decreasing corporate earnings and the lack of available credit to support business operations. Many organizations with renowned histories of success and profitability are now seeking government relief in order to remain solvent. The result has been significant double-digit losses for U.S. and international market indices over the past year.
During this period of extreme volatility, the HSBC Investor Funds (the “Funds”) were committed to offering sound, long-term investment solutions to investors. Now, more than ever, the Funds are diligently seeking and working with investment sub-advisers who can assist in navigating through this market environment. Moreover, the Board of Trustees is also aware that the Funds’ ability to execute shareholder instructions in an accurate and timely manner is also an important part of a fund’s overall performance. In performing its oversight role, the Board continuously attempts to maintain the highest level of responsiveness to shareholders.
Recognizing its responsibility to shareholders, the Board considers a wide range of factors including relative expertise and the financial viability in selecting the Funds’ service providers. We believe that aligning the Funds’ interests with strong partners provides a tangible benefit to shareholders, now and in the future.
We understand that these are extremely challenging times in the financial markets. We remain committed to managing the HSBC Investor Funds in a prudent and consistent manner for long-term performance.
For further market insight and investment results for the Funds, please see our portfolio manager commentary in this Annual Report.
Thank you for your investment in the HSBC Investor Funds.
Sincerely,

Larry M. Robbins, Chairman, HSBC Investor Funds
| |
1 | HSBC INVESTOR FAMILY OF FUNDS |
|
Commentary From the Investment Manager |
|
HSBC Global Asset Management (USA) Inc. |
U.S. Economic Review
The 12-month period from November 1, 2007 through October 31, 2008 was extraordinarily challenging for the U.S. economy and the global financial system. Over the course of this period, a growing number of signs indicated that the health of the economy was deteriorating and the risk of a recession was rising. In addition, a number of financial institutions faced serious problems and incurred heavy financial losses that threatened their ability to operate.
These issues largely stemmed from the housing market’s prolonged downturn. Rising default rates on subprime mortgages during the period generated huge losses for a wide variety of global financial institutions, which had invested heavily in securities that were backed by those risky mortgages. The losses were so severe that they eventually resulted in the collapse of Bear Sterns, Lehman Brothers and others, the nationalization of Fannie Mae and Freddie Mac, the failure of some banks and the forced mergers of several financial institutions. In that environment, lenders became suspicious of borrowers’ financial health and significantly reduced their willingness to lend money. The result was a crisis that effectively froze the credit markets and depressed economic growth.
The economic slowdown and declining home prices were particularly hard on consumers, who account for approximately two-thirds of U.S. economic activity. Retail sales fell sharply, real personal incomes declined, unemployment rose to its highest levels in years and consumer confidence plummeted. Corporate profits declined and U.S. Gross Domestic Product1 growth fell during two of the past four quarters (through the third quarter of 2008).
Problems in the U.S. economy spread overseas, creating fears of a global economic downturn. Consensus 2009 forecasts for economic growth in Europe and Asia declined during the third quarter, driven lower by factors such as falling business activities and confidence.
Aggressive steps were taken during the period to stabilize the credit markets and respark the economy. For example, the Federal Reserve Board (the “Fed”) cut its target short-term interest rate, the federal funds rate, from 4.50% in November to 1.00% by the end of October in an effort to inject liquidity into the markets. The Fed also established and increased auction lending facilities. Additionally, the U.S. government began implementing a $700 billion financial bailout package, and helped engineer the rescue of several large financial institutions and guaranteed senior debt issued by banks. Governments in Europe and Asia adopted similar strategies to improve sentiment and ease the strains in their financial systems.
The weak economy did have some relatively positive consequences. Energy prices, which had risen sharply during the first half of the period as the price of oil soared to record highs, fell significantly during later months. Falling commodity prices also reduced inflationary pressures, giving central banks around the world a greater ability to target their monetary policy to support growth, liquidity and financial market stability.
Market Review
The U.S. stock market was extremely volatile during the period as investors reacted strongly to new developments in the economy, the housing sector and the financial markets. Investors during most of the period fled from stocks into assets that were perceived to be safer, such as high-quality government bonds and cash. The S&P 500 Index1 returned -36.08% for the 12-month period ended October 31, 2008. Small-company stocks, represented by the Russell 2000® Index1, returned
-34.16%.
Shares of financial services firms suffered particularly large declines during the period due to the turmoil in the credit and banking system and concerns that more problems could occur if the subprime mortgage crisis spread. Consumer discretionary stocks also posted significant losses as increasingly nervous consumers cut their spending on non-essential items. Investors also shunned shares of auto-related companies, which faced critical credit shortages and an uncertain future.
The energy sector posted strong returns during the first half of the period as the price of oil and other commodities rose, but lagged later in the period as oil prices fell sharply. Conversely, health care stocks outperformed the overall market, especially as economic conditions worsened during the final months of the period.
Foreign stocks also delivered negative returns, as banks worldwide suffered from their exposure to problem assets related to the mortgage industry and the outlook for global economic growth worsened. The MSCI EAFE Index1 of developed foreign stock markets returned -46.34% during the period. Emerging markets stocks also suffered as investors avoided the perceived riskiness of developing markets in favor of assets they believed to be more stable. Falling commodity prices during the second half of the period also hurt some emerging economies, which are heavily dependent on commodity exports.
The Barclays Capital U.S. Aggregate Index1, which tracks the broad fixed-income markets, returned 0.3% for the period. High-quality government bonds, such as those issued by the U.S. Treasury, performed well as investors seeking to avoid risk fled into these securities. The rally pushed yields for government bonds lower, particularly among short-term fixed-income securities. Investors favored shorter maturities as they focused on liquidity and safety during the period of heightened market volatility. Other types of fixed-income securities—including corporate bonds and high-yield bonds—performed poorly, as investors favored the stability of government-backed bonds and worried about companies’ ability to fulfill their debt obligations in a weak economic environment. As a result, the spread between yields on government securities and corporate bonds widened substantially.
| |
1 | For additional information, please refer to the Glossary of Terms. |
| |
HSBC INVESTOR FAMILY OF FUNDS | 2 |
|
Portfolio Reviews |
|
HSBC Investor Core Plus Fixed Income Fund |
(Class A Shares, B Shares, C Shares and I Shares) |
by Halbis Capital Management (USA) Inc., Broad Markets Fixed Income Team |
The HSBC Investor Core Plus Fixed Income Fund (the “Fund”) seeks to maximize total return, consistent with reasonable risk. The “total return” sought by the Fund consists of income earned on investments, plus capital appreciation, if any, which generally arises from decreases in interest rates or improving credit fundamentals for a particular sector or security. The Fund utilizes a two-tier structure, commonly known as a “master-feeder,” in which the Fund invest all of its investable assets in the HSBC Investor Core Plus Fixed Income Portfolio (the “Portfolio”). The Fund employs Halbis Capital Management (USA) Inc. as subadviser to the Portfolio.
Investment Concerns
Bonds offer a relatively stable level of income, although bond prices will fluctuate providing the potential for principal gain or loss. Intermediate-term, higher-quality bonds generally offer less risk than longer-term bonds and a lower rate of return.
The mortgage market in the U.S. recently experienced difficulties that may adversely affect the performance and market value of certain mortgage-related investments.
Market Commentary
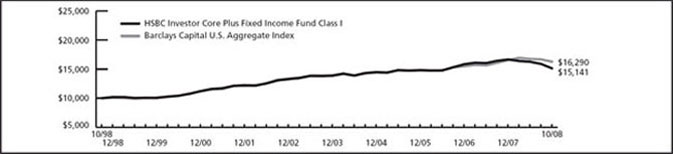
For the 12-month period ended October 31, 2008, the Class I Shares of the Fund produced a -8.60% total return, and the Class A Shares returned -8.99% (without sales charge). That compared to a total return of 0.30% and -7.01% for the Barclays Capital U.S. Aggregate Index1 (formerly Lehman Brothers U.S. Aggregate Index) and the Lipper Intermediate Investment-Grade Debt Funds Average1, respectively.
Past performance is no guarantee of future results.
Portfolio Performance
The period was marked by a worsening of the credit crisis, which led to the failure of several financial institutions as well as federal bailouts for select banks and insurers. Liquidity in the credit markets and money markets evaporated in that environment, which led to a standstill in investment activity. Investors during the period favored the relative safety of Treasury securities and shunned all other fixed-income securities. Sector exposure in anything other than Treasury securities resulted in negative returns.
The main driver of the Fund’s underperformance relative to its benchmarks was its overweight positions in mortgage-backed and corporate securities. Our strategy of emphasizing various types of “spread” bonds—bonds that offer higher yields than Treasuries—is designed to provide shareholders with greater income over time. Although these securities offered attractive yields relative to Treasury bonds, they performed poorly as investors flocked to Treasuries and avoided other sectors of the bond market.*
For much of the period, the Fund focused on intermediate-term securities and maintained a duration slightly longer than that of its benchmarks. That strategy benefited the fund as such securities offered more attractive yields shorter-term issues.
| |
* | Portfolio composition is subject to change. |
| |
1 | For additional information, please refer to the Glossary of Terms. |
| |
3 | HSBC INVESTOR FAMILY OF FUNDS |
|
Portfolio Reviews |
|
HSBC Investor Core Plus Fixed Income Fund - As of October 31, 2008 |
|
Value of a $10,000 Investment |
|
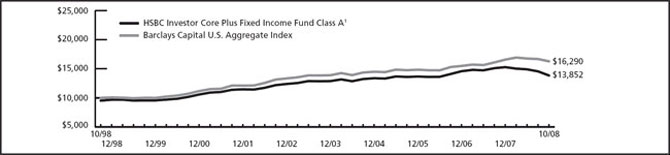
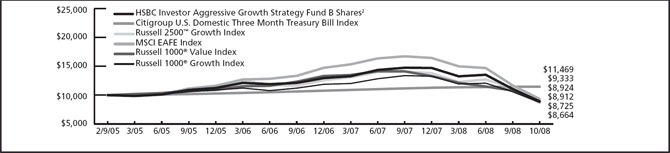
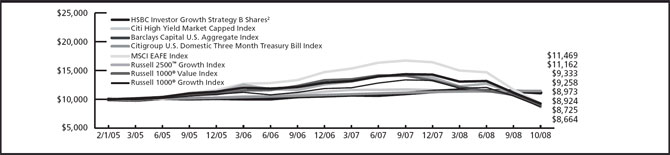
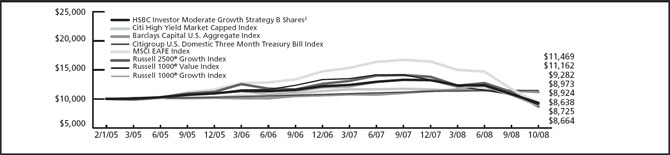
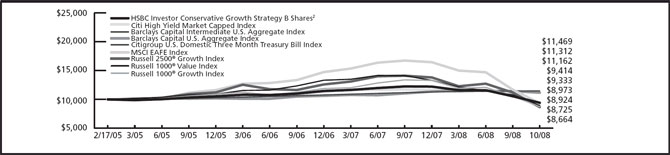
The charts above represent a comparison of a hypothetical $10,000 investment in the indicated share class versus a similar investment in the Funds’ benchmark and represents the reinvestment of dividends and capital gains in the Funds.
| | | | | | | | | | | | | | | |
Fund Performance | | | | Average Annual Total Return (%) | | Expense
Ratio (%)5 | |
|
|
|
|
|
|
|
|
As of October 31, 2008 | | Inception
Date | | 1
Year | | 5
Year | | 10
Year | | Since
Inception | | Gross | | Net | |
|
|
|
|
|
|
|
|
|
|
|
|
|
|
|
|
HSBC Investor Core Plus Fixed Income Fund Class A1 | | 8/26/96 | | -13.29 | | 0.77 | | 3.31 | | 4.19 | | 1.41 | | 0.70 | |
|
|
|
|
|
|
|
|
|
|
|
|
|
|
|
|
HSBC Investor Core Plus Fixed Income Fund Class B2 | | 1/6/98 | | -13.13 | | 0.99 | | 3.35 | | 3.42 | | 2.16 | | 1.45 | |
|
|
|
|
|
|
|
|
|
|
|
|
|
|
|
|
HSBC Investor Core Plus Fixed Income Fund Class C3 | | 11/4/98 | | -10.56 | | 0.96 | | — | | 3.06 | | 2.16 | | 1.45 | |
|
|
|
|
|
|
|
|
|
|
|
|
|
|
|
|
HSBC Investor Core Plus Fixed Income Fund Class I** | | 1/9/95 | | -8.60 | | 2.07 | | 4.24 | | 5.66 | | 0.72 | | 0.45 | |
|
|
|
|
|
|
|
|
|
|
|
|
|
|
|
|
Barclays Capital U.S. Aggregate Index4 | | — | | 0.30 | | 3.48 | | 5.00 | | N/A | | N/A | | N/A | |
|
|
|
|
|
|
|
|
|
|
|
|
|
|
|
|
Lipper Intermediate Investment-Grade Debt Funds Average4 | | — | | -7.01 | | 1.28 | | 3.73 | | N/A | | N/A | | N/A | |
|
|
|
|
|
|
|
|
|
|
|
|
|
|
|
|
Past performance does not guarantee future results. The performance data quoted represents past performance and current returns may be lower or higher. Total return figures include change in share price, reinvestment of dividends and capital gains and do not reflect the taxes that a shareholder would pay on fund distributions or on the redemption of fund shares. The investment return and principal value will fluctuate so that an investor’s shares, when redeemed may be worth more or less than the original cost. To obtain performance information current to the most recent month end, please call 1-800-782-8183.
The performance above reflects any fee waivers that have been in effect during the applicable periods, as well as any expense reimbursements that have periodically been made. Absent such waivers and reimbursements, returns would have been lower. Currently, contractual fee waivers are in effect from March 1, 2008 through March 1, 2009.
During the years ended October 31, 2007 and 2008, the Portfolio the Fund invests in received monies related to certain nonrecurring litigation settlements. Without the receipt of this payment, the returns for applicable periods would have been lower.
| |
** | The Class I Shares of the HSBC Core Plus Fixed Income Fund are part of the Advisor Funds Trust. |
| |
1 | Reflects the maximum sales charge of 4.75%. |
| |
2 | Reflects the contingent deferred sales charge, maximum of 4.00%. |
| |
3 | Reflects the contingent deferred sales charge, maximum of 1.00%. |
| |
4 | For additional information, please refer to the Glossary of Terms. |
| |
5 | Reflects the expense ratio as reported in the prospectus dated February 28, 2008. |
The Fund’s performance is measured against the Barclays Capital U.S. Aggregate Index (formerly Lehman Brothers U.S. Aggregate Index), an unmanaged market value-weighted performance benchmark for investment-grade fixed-rate debt issues, including government, corporate, asset-backed, and mortgage-backed securities, with maturities of at least one year. The performance of the index does not reflect the deduction of expenses associated with a mutual fund, such as investment management and fund accounting fees. The Fund’s performance reflects the deduction of fees for these value-added services. Investors cannot invest directly in an index.
| |
HSBC INVESTOR FAMILY OF FUNDS | 4 |
|
Portfolio Reviews |
|
HSBC Investor High Yield Fixed Income Fund |
(Class A Shares, B Shares, C Shares and I Shares) |
by Halbis Capital Management (USA) Inc., High Yield Team |
The HSBC Investor High Yield Fixed Income Fund (the “Fund”) seeks to provide a high level of current income and capital appreciation. HSBC Global Asset Management (USA) Inc. serves as investment adviser to the Fund. The Halbis High Yield Team provides the day to day management of the portfolio. The Team’s philosophy is focused on delivering sustainable value added performance in the high yield fixed income market. The investment approach is a combination of top-down sector/ industry selection and bottom-up security/quality selection. The team rotates sectors and themes within the high yield universe during different market environments seeking to add value, endeavoring to take advantage of market inefficiencies in order to outperform in both up and down markets. The Fund employs Halbis Capital Management (USA) Inc. as subadviser to the Portfolio.
Investment Concerns
Bond funds will tend to experience smaller fluctuations in value than stock funds. However, investors in any bond fund should anticipate fluctuations in price, especially for longer-term issues and in environments of rising interest rates. High yield bonds are subject to greater risks than investment grade bonds, such as the increased risk of default because of the lower credit quality of the issues.
The mortgage market in the U.S. recently experienced difficulties that may adversely affect the performance and market value of certain mortgage-related investments.
Market Commentary
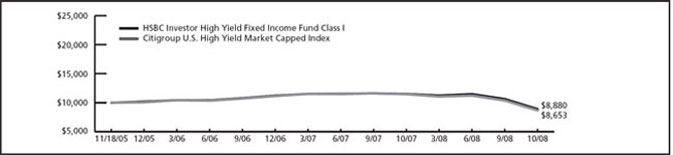
The Fund delivered a total return of -26.01% (without sales charge) for Class A Shares and -25.83% for Class I Shares for the period ended October 31, 2008. That compared to -24.05% and -25.13% total return for the Fund’s benchmarks, the Citigroup U.S. High Yield Market Capped Index1 and the Lipper High Current Yield Funds Average1, respectively.
Past performance does not guarantee future results.
Portfolio Performance
High-yield bonds performed poorly during the period under review, which was characterized by a severe economic slowdown and a deepening credit crisis that led to unprecedented moves by the U.S. government to attempt to shore up the economy and the financial system. Investors in that environment flocked to Treasury securities with extremely high levels of liquidity and safety, and shunned high-yield bonds due to fears that the companies issuing such bonds would default on their obligations. In addition, liquidity in the high-yield market was often extremely tight, making it difficult to buy and sell securities.
The Fund’s performance remained relatively in line or slightly under its benchmark indices during the period which was the result of several key strategies. Our decision to underweight the homebuilding, building products and financial sectors contributed to strong relative performance, as these industries suffered due to the weak economy, the credit crisis and the prolonged downturn in the housing market. We also overweighted the energy and utilities sectors. Energy prices soared during the first half of the period, and energy companies remained healthy despite a downturn in energy prices during the second half of the period. Additionally, we increased the Fund’s overall credit quality whenever possible. That benefited performance as investors favored higher-quality bonds.*
The Fund’s relatively large position in bonds of gaming companies dampened performance somewhat. As the economic environment deteriorated throughout the period, consumers cut back on their discretionary spending—hurting revenues among companies in the gaming sector.*
| |
* | Portfolio composition is subject to change. |
| |
1 | For additional information, please refer to the Glossary of Terms. |
| |
5 | HSBC INVESTOR FAMILY OF FUNDS |
|
Portfolio Reviews |
|
HSBC Investor High Yield Fixed Income Fund - As of October 31, 2008 |
|
Value of a $10,000 Investment |
|
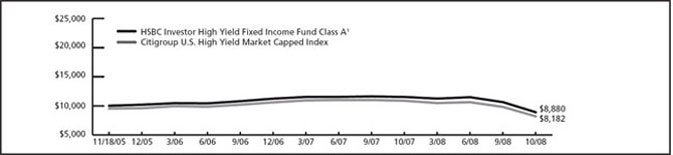
The charts above represent a comparison of a hypothetical $10,000 investment in the indicated share class versus a similar investment in the Funds’ benchmark and represents the reinvestment of dividends and capital gains in the Funds.
| | | | | | | | | | | |
Fund Performance | | | | Average Annual
Total Return (%) | | Expense
Ratio (%)5 | |
|
|
|
|
|
|
|
|
As of October 31, 2008 | | Inception
Date | | 1
Year | | Since
Inception | | Gross | | Net | |
|
|
|
|
|
|
|
|
|
|
|
|
HSBC Investor High Yield Fixed Income Fund Class A1 | | 11/18/05 | | -29.53 | | -6.58 | | 2.93 | | 0.80 | |
|
|
|
|
|
|
|
|
|
|
|
|
HSBC Investor High Yield Fixed Income Fund Class B2 | | 11/21/05 | | -29.25 | | -6.27 | | 3.68 | | 1.55 | |
|
|
|
|
|
|
|
|
|
|
|
|
HSBC Investor High Yield Fixed Income Fund Class C3 | | 12/14/05 | | -27.30 | | -5.99 | | 3.68 | | 1.55 | |
|
|
|
|
|
|
|
|
|
|
|
|
HSBC Investor High Yield Fixed Income Fund Class I | | 11/18/05 | | -25.83 | | -4.78 | | 2.68 | | 0.55 | |
|
|
|
|
|
|
|
|
|
|
|
|
Citigroup U.S. High Yield Market Capped Index4 | | — | | -24.05 | | N/A | | N/A | | N/A | |
|
|
|
|
|
|
|
|
|
|
|
|
Lipper High Current Yield Funds Average4 | | — | | -25.13 | | N/A | | N/A | | N/A | |
|
|
|
|
|
|
|
|
|
|
|
|
Past performance does not guarantee future results. The performance data quoted represents past performance and current returns may be lower or higher. Total return figures include change in share price, reinvestment of dividends and capital gains and do not reflect the taxes that a shareholder would pay on fund distributions or on the redemption of fund shares. The investment return and principal value will fluctuate so that an investor’s shares, when redeemed may be worth more or less than the original cost. To obtain performance information current to the most recent month end, please call 1-800-782-8183.
The performance above reflects any fee waivers that have been in effect during the applicable periods, as well as any expense reimbursements that have periodically been made. Absent such waivers and reimbursements, returns would have been lower. Currently, contractual fee waivers are in effect from March 1, 2008 through March 1, 2009.
| |
1 | Reflects the maximum sales charge of 4.75%. |
| |
2 | Reflects the contingent deferred sales charge, maximum of 4.00%. |
| |
3 | Reflects the contingent deferred sales charge, maximum of 1.00%. |
| |
4 | For additional information, please refer to the Glossary of Terms. |
| |
5 | Reflects the expense ratio as reported in the prospectus dated February 28, 2008. |
The Citigroup U.S. High Yield Market Capped Index, the “U.S. High Yield Market Capped Index” uses the U.S. High-Yield Market Index as its foundation imposing a cap on the par amount of each issuer in order to limit the impact of large issuers while retaining the characteristics of the issuer’s distribution across different maturities. The U.S. High-Yield Market Index captures the performance of below-investments-grade debt issued by corporations domiciled in the United States or Canada. The Merrill Lynch U.S. High Yield Master II Index measures the performance of the broad high yield market. The Indexes are unmanaged and do not reflect the deduction of expenses associated with a mutual fund, such as investment management and fund accounting fees. The Fund’s performance reflects the deduction of fees for these value-added services. Investors cannot invest directly in an index.
| |
HSBC INVESTOR FAMILY OF FUNDS | 6 |
|
Portfolio Reviews |
|
HSBC Investor Intermediate Duration Fixed Income Fund |
(Class A Shares, B Shares, C Shares and I Shares) |
by Halbis Capital Management (USA) Inc., Broad Markets Fixed Income Team |
The HSBC Investor Intermediate Duration Fixed Income Fund (the “Fund”) seeks to maximize total return, consistent with reasonable risk. The “total return’’ sought by the Fund consists of income earned on investments, plus capital appreciation, if any, which generally arises from decreases in interest rates or improving credit fundamentals for a particular sector or security. The Fund utilizes a two tier structure, commonly known as “master-feeder,” in which the Fund invests all of its investable assets in the HSBC Investor Intermediate Duration Fixed Income Portfolio (the “Portfolio”). Under normal market conditions, the Portfolio invest at least 80% of its net assets in fixed income securities. The Portfolio expects to maintain an average portfolio duration with respect to fixed income securities of 3 to 6 years. The Fund employs Halbis Capital Management (USA) Inc. as subadviser to the Portfolio.
Investment Concerns
Bonds offer a relatively stable level of income, although bond prices will fluctuate providing the potential for principal gain or loss. Intermediate-term, higher-quality bonds generally offer less risk than longer-term bonds and a lower rate of return.
The mortgage market in the U.S. recently experienced difficulties that may adversely affect the performance and market value of certain mortgage-related investments.
Market Commentary
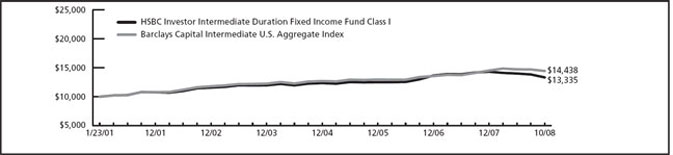
The Fund returned -6.90% (without sales charge) for the Class A Shares and -6.56% for the Class I Shares during the 12-month period ended October 31, 2008. That compared to a total return of 1.48% and -7.01% for the Barclays Capital Intermediate U.S. Aggregate Index (formerly Lehman Brothers Intermediate U.S. Aggregate Index)1 and the Lipper Intermediate Investment-Grade Debt Funds Average1.
Past performance is no guarantee of future results.
Portfolio Performance
The collapse of the subprime mortgage market led to the failure of several financial institutions during the period as the credit market dried up and lending activity froze. Other financial institutions, including banks and insurers, were rescued by federal bailouts. In that environment, investors fled to high-quality issues, favoring Treasury bonds over other securities in the fixed-income market.
The Fund underperformed its benchmarks in large part due to its focus on sectors other than Treasuries. Our strategy of emphasizing various types of “spread” bonds—bonds that offer higher yields than Treasuries—is designed to provide shareholders with greater income over time. However, such issues significantly underperformed during the period as investors shunned any fixed-income securities outside of the Treasury market.*
As investors sought liquidity and relative safety in short-term Treasury issues, the yield curve steepened and longer-term securities offered higher yields. The Fund maintained a duration slightly longer than that of its benchmarks. That strategy benefited the fund as such securities offered higher yields than shorter-term issues.*
| |
* | Portfolio composition is subject to change. |
| |
1 | For additional information, please refer to the Glossary of Terms. |
| |
7 | HSBC INVESTOR FAMILY OF FUNDS |
|
Portfolio Reviews |
|
HSBC Investor Intermediate Duration Fixed Income Fund - As of October 31, 2008 |
|
Value of a $10,000 Investment |
|
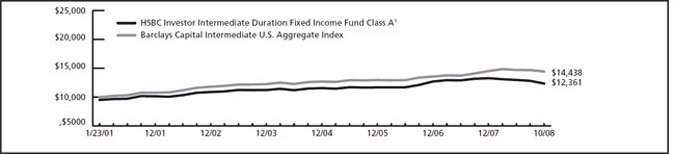
The charts above represent a comparison of a hypothetical $10,000 investment in the indicated share class versus a similar investment in the Funds’ benchmark and represents the reinvestment of dividends and capital gains in the Funds.
| | | | | | | | | | | | | | | |
Fund Performance | | | | | Average Annual
Total Return (%) | | Expense
Ratio (%)5 | |
|
|
|
|
|
|
|
|
|
As of October 31, 2008 | | Inception
Date | | 1
Year | | 5
Year | | Since
Inception | | Gross | | Net | |
|
|
|
|
|
|
|
|
|
|
|
|
|
|
HSBC Investor Intermediate Duration Fixed Income Fund Class A1 | | | 2/7/01 | | | -11.31 | | 1.13 | | 2.78 | | 1.67 | | 0.65 | |
|
|
|
|
|
|
|
|
|
|
|
|
|
|
|
|
HSBC Investor Intermediate Duration Fixed Income Fund Class B2 | | | 2/15/01 | | | -11.13 | | 1.35 | | 2.82 | | 2.42 | | 1.40 | |
|
|
|
|
|
|
|
|
|
|
|
|
|
|
|
|
HSBC Investor Intermediate Duration Fixed Income Fund Class C3 | | | 2/13/01 | | | -8.38 | | 1.36 | | 2.64 | | 2.42 | | 1.40 | |
|
|
|
|
|
|
|
|
|
|
|
|
|
|
|
|
HSBC Investor Intermediate Duration Fixed Income Fund Class I | | | 1/23/01 | | | -6.56 | | 2.39 | | 3.77 | | 1.42 | | 0.40 | |
|
|
|
|
|
|
|
|
|
|
|
|
|
|
|
|
Barclays Capital Intermediate U.S. Aggregate Index4 | | | — | | | 1.48 | | 3.56 | | N/A | | N/A | | N/A | |
|
|
|
|
|
|
|
|
|
|
|
|
|
|
|
|
Lipper Intermediate Investment-Grade Debt Funds Average4 | | | — | | | -7.01 | | 1.28 | | N/A | | N/A | | N/A | |
|
|
|
|
|
|
|
|
|
|
|
|
|
|
|
|
Past performance does not guarantee future results. The performance data quoted represents past performance and current returns may be lower or higher. Total return figures include change in share price, reinvestment of dividends and capital gains and do not reflect the taxes that a shareholder would pay on fund distributions or on the redemption of fund shares. The investment return and principal value will fluctuate so that an investor’s shares, when redeemed may be worth more or less than the original cost. To obtain performance information current to the most recent month end, please call 1-800-782-8183.
The performance above reflects any fee waivers that have been in effect during the applicable periods, as well as any expense reimbursements that have periodically been made. Absent such waivers and reimbursements, returns would have been lower. Currently, contractual fee waivers are in effect from March 1, 2008 through March 1, 2009.
During the years ended October 31, 2007 and 2008, the Portfolio the Fund invests in received monies related to certain nonrecurring litigation settlements. Without the receipt of this payment, the returns for applicable periods would have been lower.
| |
1 | Reflects the maximum sales charge of 4.75%. |
| |
2 | Reflects the applicable contingent deferred sales charge, maximum of 4.00%. |
| |
3 | Reflects the applicable contingent deferred sales charge, maximum of 1.00%. |
| |
4 | For additional information, please refer to the Glossary of Terms. |
| |
5 | Reflects the expense ratio as reported in the prospectus dated February 28, 2008. |
| |
The Fund’s performance is measured against the Barclays Capital Intermediate U.S. Aggregate Index (formerly Lehman Brothers Intermediate U.S. Aggregate Index), an unmanaged index generally representative of investment-grade issues with maturities between three- and ten-years. The performance of the index does not reflect the deduction of expenses associated with a mutual fund, such as investment management and fund accounting fees. The Fund’s performance reflects the deduction of fees for these value-added services. Investors cannot invest directly in an index. |
| |
HSBC INVESTOR FAMILY OF FUNDS | 8 |
|
Portfolio Reviews |
|
HSBC Investor New York Tax-Free Bond Fund |
(Class A Shares, B Shares, C Shares and I Shares) |
by Halbis Capital Management (USA) Inc., Broad Markets Fixed Income Team |
The HSBC Investor New York Tax-Free Bond Fund (the “Fund”) seeks to provide shareholders with income exempt from regular federal, New York State and New York City personal income taxes. The Fund employs Halbis Capital Management (USA) Inc. as subadviser to the Portfolio.
Investment Concerns
Bonds offer a relatively stable level of income, although bond prices will fluctuate providing the potential for principal gain or loss. Intermediate-term, higher-quality bonds generally offer less risk than longer-term bonds and a lower rate of return.
The Fund’s income may be subject to certain state and local taxes and, depending on your tax status, the federal alternative minimum tax. Regional funds may be subject to additional risks, since the issues they invest in are located in one geographical location.
Market Commentary
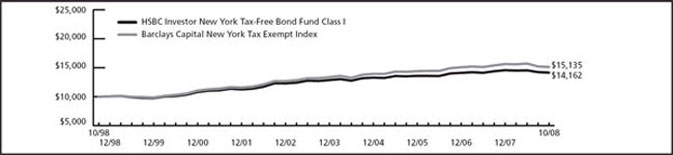
The Fund delivered a total return of -2.20% (without sales charge) for Class A Shares and -1.96% for Class I Shares for the 12-month period ended October 31, 2008. That compared to - -2.25% and -7.30% for the Fund’s benchmarks, the Barclays Capital New York Tax Exempt Index (formerly Lehman Brothers New York Tax Exempt Index)1 and the Lipper New York Municipal Debt Funds Average1, respectively.
Past performance does not guarantee future results.
Portfolio Performance
The fixed-income markets were negatively impacted by the deepening of the credit and liquidity crisis during the period, and most debt securities (including municipal bonds) performed poorly. The exception was U.S. Treasury securities, which benefited from investors’ flight to quality as concerns mounted over the weakness of the economy and the rising threat of recession. In the municipal bond market, the collapse of several municipal bond insurers caused bond prices to fall. The Fund posted negative returns in that environment, as prices of the Fund’s underlying securities declined.
The Fund outperformed its benchmark and its peer group during the period in part by maintaining a relatively short average maturity, which helped reduce the Fund’s interest rate exposure. Longer-term securities underperformed significantly as the yield curve steepened during the period. By focusing on intermediate-term municipal securities, the Fund’s relative performance benefited.*
We also maintained very high credit quality in the Fund’s portfolios. That strategy helped the Fund’s performance relative to its benchmark and peer group as investors concerned about the weakening economy and the credit crisis favored such high-quality investments.
| |
* | Portfolio composition is subject to change. |
| |
1 | For additional information, please refer to the Glossary of Terms. |
| |
9 | HSBC INVESTOR FAMILY OF FUNDS |
|
Portfolio Reviews |
|
HSBC Investor New York Tax-Free Bond Fund - As of October 31, 2008 |
|
Value of a $10,000 Investment |
|
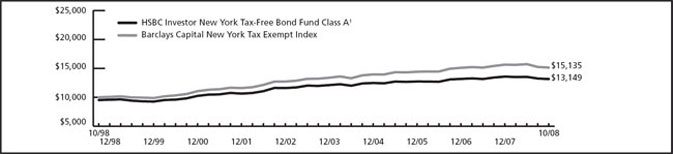
The charts above represent a comparison of a hypothetical $10,000 investment in the indicated share class versus a similar investment in the Funds’ benchmark and represents the reinvestment of dividends and capital gains in the Funds.
| | | | | | | | | | | | | | | | | |
Fund Performance | | | | Average Annual Total Return (%) | | Expense
Ratio (%)5 | |
|
|
|
|
|
|
|
|
As of October 31, 2008 | | Inception
Date | | 1
Year | | 5
Year | | 10
Year | | Since
Inception | | Gross | | Net | |
|
|
|
|
|
|
|
|
|
|
|
|
|
|
|
|
|
|
HSBC Investor New York Tax-Free Bond Fund Class A1 | | 5/1/95 | | | -6.84 | | 1.02 | | 2.78 | | 4.04 | | | 0.88 | | 0.88 | |
|
|
|
|
|
|
|
|
|
|
|
|
|
|
|
|
|
|
HSBC Investor New York Tax-Free Bond Fund Class B2 | | 1/6/98 | | | -6.71 | | 1.25 | | 2.83 | | 3.07 | | | 1.63 | | 1.63 | |
|
|
|
|
|
|
|
|
|
|
|
|
|
|
|
|
|
|
HSBC Investor New York Tax-Free Bond Fund Class C3 | | 11/4/98 | | | -3.78 | | 1.24 | | — | | 2.54 | | | 1.63 | | 1.63 | |
|
|
|
|
|
|
|
|
|
|
|
|
|
|
|
|
|
|
HSBC Investor New York Tax-Free Bond Fund Class I | | 7/1/96 | | | -1.96 | | 2.26 | | 3.54 | | 4.42 | | | 0.63 | | 0.63 | |
|
|
|
|
|
|
|
|
|
|
|
|
|
|
|
|
|
|
Barclays Capital New York Tax Exempt Index4 | | — | | | -2.25 | | 2.86 | | 4.22 | | N/A | | | N/A | | N/A | |
|
|
|
|
|
|
|
|
|
|
|
|
|
|
|
|
|
|
Lipper New York Municipal Debt Funds Average4 | | — | | | -7.30 | | 1.30 | | 2.83 | | N/A | | | N/A | | N/A | |
|
|
|
|
|
|
|
|
|
|
|
|
|
|
|
|
|
|
Past performance does not guarantee future results. The performance data quoted represents past performance and current returns may be lower or higher. Total return figures include change in share price, reinvestment of dividends and capital gains and do not reflect the taxes that a shareholder would pay on fund distributions or on the redemption of fund shares. The investment return and principal value will fluctuate so that an investor’s shares, when redeemed may be worth more or less than the original cost. To obtain performance information current to the most recent month end, please call 1-800-782-8183.
The performance above reflects any fee waivers that have been in effect during the applicable periods, as well as any expense reimbursements that have periodically been made. Absent such waivers and reimbursements, returns would have been lower.
| |
1 | Reflects the maximum sales charge of 4.75%. |
| |
2 | Reflects the contingent deferred sales charge, maximum of 4.00%. |
| |
3 | Reflects the contingent deferred sales charge, maximum of 1.00%. |
| |
4 | For additional information, please refer to the Glossary of Terms. |
| |
5 | Reflects the expense ratio as reported in the prospectus dated February 28, 2008. |
The Fund’s performance is measured against the Barclays Capital New York Tax Exempt Index (formerly Lehman Brothers New York Tax Exempt Index), an unmanaged index composed of investment-grade New York tax-exempt securities, all having a $50 million minimum maturity value. The performance of the index does not reflect the deduction of expenses associated with a mutual fund, such as investment management and fund accounting fees. The Fund’s performance reflects the deduction of fees for these value-added services. Investors cannot invest directly in an index.
| |
HSBC INVESTOR FAMILY OF FUNDS | 10 |
|
Portfolio Reviews |
|
HSBC Investor Growth Fund |
(Class A Shares, B Shares, C Shares and I Shares)
by Clark J. Winslow, Chief Executive Officer/Portfolio Manager
Justin H. Kelly, CFA, Managing Director/Portfolio Manager
R. Bart Wear CFA, Managing Director/Portfolio Manager |
The HSBC Investor Growth Fund (the “Fund”) seeks long-term growth of capital by investing primarily in U.S. and foreign equity securities of high quality companies with market capitalization generally in excess of $2 billion, which the subadviser believes have the potential to generate superior levels of long-term profitability and growth. The Fund utilizes a two tier structure, commonly known as a “master-feeder”, and invests all of its investable assets in the HSBC Investor Growth Portfolio (the “Portfolio”), which acts as the master fund. Effective May 12, 2008, Winslow Capital Management Inc, replaced Waddell & Reed Investment Management Company (Waddell & Reed) as subadviser.
Investment Concerns
Equity securities (stocks) are more volatile and carry more risk than other forms of investments, including investments in high-grade fixed income securities. The net asset value per share of this Fund will fluctuate as the value of the securities in the portfolio changes.
Market Commentary
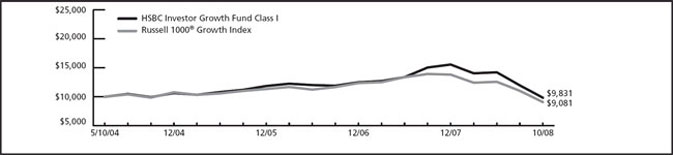
The Fund returned -38.23% (without sales charge) for the Class A Shares and -38.07% for the Class I Shares for the 12-month period ended October 31, 2008. That compared to a - -36.95% for the Russell 1000® Growth Index1 and a -38.55% return for the Lipper Large-Cap Growth Funds Average1.
Past performance does not guarantee future results.
Portfolio Performance
The subprime mortgage crisis continued to worsen during the period, forcing the federal government to bail out several failing financial institutions. That environment had a significantly negative impact on both the domestic and international equity markets.
The Fund’s returns relative to the benchmark benefited from its overweight position in the health care sector. Health care stocks outperformed the market as a whole—especially during the three months through September, which were among the most difficult of the 12-month period under review. Stock selection among financial services shares also benefited performance relative to the benchmark, despite the poor performance of the overall sector throughout the period.*
Stock selection in the consumer staples and technology sectors hurt performance relative to the benchmark. The Fund’s holdings in the energy sector hurt relative returns as well. Oil prices declined steeply off of July highs, and investors sold energy shares as a result.*
It is clear that the global economic outlook is negative. However, we see valuations for many companies at levels similar to those we encountered in late 2002 and early 2003. We remain focused on implementing our investment discipline: we will continue to focus on companies with strong potential future earnings growth, attractive absolute valuations, favorable risk/reward and downside protection, and catalysts/ inflection points to improve /sustain profitability or recognize value.
| |
* | Portfolio composition is subject to change. |
| |
1 | For additional information, please refer to the Glossary of Terms. |
| |
11 | HSBC INVESTOR FAMILY OF FUNDS |
|
Portfolio Reviews |
|
HSBC Investor Growth Fund - As of October 31, 2008 |
|
Value of a $10,000 Investment |
|
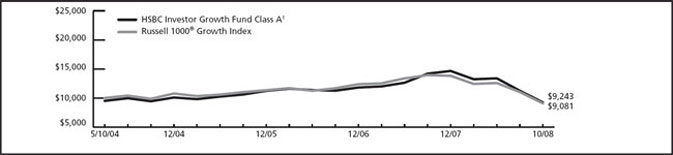
The charts above represent a comparison of a hypothetical $10,000 investment in the indicated share class versus a similar investment in the Funds’ benchmark and represents the reinvestment of dividends and capital gains in the Funds.
| | | | | | | | | | | | | | | |
Fund Performance | | | | | Average Annual
Total Return (%) | | Expense
Ratio (%)6 | |
|
|
|
|
|
|
|
|
|
As of October 31, 2008 | | Inception
Date | | 1
Year | | 3
Year | | Since
Inception | | Gross | | Net | |
|
|
|
|
|
|
|
|
|
|
|
|
|
|
HSBC Investor Growth Fund Class A1 | | 5/7/04 | 5 | | -41.30 | | -6.45 | | -1.74 | | | 1.21 | | 1.20 | |
|
|
|
|
|
|
|
|
|
|
|
|
|
|
|
|
HSBC Investor Growth Fund Class B2 | | 5/7/04 | 5 | | -40.95 | | -6.07 | | -1.35 | | | 1.96 | | 1.95 | |
|
|
|
|
|
|
|
|
|
|
|
|
|
|
|
|
HSBC Investor Growth Fund Class C3 | | 5/7/04 | 5 | | -39.21 | | -5.52 | | -1.34 | | | 1.96 | | 1.95 | |
|
|
|
|
|
|
|
|
|
|
|
|
|
|
|
|
HSBC Investor Growth Fund Class I | | 5/7/04 | 5 | | -38.07 | | -4.61 | | -0.38 | | | 0.96 | | 0.95 | |
|
|
|
|
|
|
|
|
|
|
|
|
|
|
|
|
Russell 1000® Growth Index4 | | — | | | -36.95 | | -5.90 | | N/A | | | N/A | | N/A | |
|
|
|
|
|
|
|
|
|
|
|
|
|
|
|
|
Lipper Large-Cap Growth Funds Average4 | | — | | | -38.55 | | -6.97 | | N/A | | | N/A | | N/A | |
|
|
|
|
|
|
|
|
|
|
|
|
|
|
|
|
Past performance does not guarantee future results. The performance data quoted represents past performance and current returns may be lower or higher. Total return figures include change in share price, reinvestment of dividends and capital gains and do not reflect the taxes that a shareholder would pay on fund distributions or on the redemption of fund shares. The investment return and principal value will fluctuate so that an investor’s shares, when redeemed may be worth more or less than the original cost. To obtain performance information current to the most recent month end, please call
1-800-782-8183.
The performance above reflects any fee waivers that have been in effect during the applicable periods, as well as any expense reimbursements that have periodically been made. Absent such waivers and reimbursements, returns would have been lower. Currently, contractual fee waivers are in effect from March 1, 2008 through March 1, 2009.
During the year ended October 31 2008, the Portfolio the Fund invests in received monies related to certain nonrecurring litigation settlements. Without the receipt of this payment, the returns for applicable periods would have been lower.
| |
1 | Reflects the maximum sales charge of 5.00%. |
| |
2 | Reflects the contingent deferred sales charge maximum of 4.00%. |
| |
3 | Reflects the contingent deferred sales charge maximum of 1.00%. |
| |
4 | For additional information, please refer to the Glossary of Terms. |
| |
5 | The HSBC Investor Growth Fund was initially offered for purchase effective May 7, 2004, however, no shareholder activity occurred until May 10, 2004. |
| |
6 | Reflects the expense ratio as reported in the prospectus dated February 28, 2008. |
The Fund’s performance is measured against the Russell 1000® Growth Index, an unmanaged index which measures the performance of the large-cap growth segment of the U.S. equity universe. It includes those Russell 1000 companies with higher price-to-book ratios and higher forecasted growth values. The index does not reflect the deduction of expenses associated with a mutual fund, such as investment management and fund accounting fees. The Fund’s performance reflects the deduction of fees for these value-added services. Investors cannot invest directly in an index.
| |
HSBC INVESTOR FAMILY OF FUNDS | 12 |
|
Portfolio Reviews |
|
HSBC Investor International Equity Fund |
|
HSBC Investor Overseas Equity Fund (Class A Shares, B Shares, C Shares, and I Shares)
by Kevin F. Simms
Co-CIO International Value Equities and Director of Research – Global and International Value Equities
AllianceBernstein Investment Research and Management |
The HSBC Investor International Equity Fund and the HSBC Investor Overseas Equity Fund (the “Funds”) seek to provide their shareholders with long-term growth of capital and future income by investing at least 80% of its net assets in equity securities of companies organized and domiciled in developed nations outside the United States or for which the principal trading market is outside the United States, including Europe, Canada, Australia and the Far East. The Portfolio may invest up to 20% of its assets in equity securities of companies in emerging markets. The Funds employ a two-tier fund structure, known as “master-feeder,” in which the Funds invest all of their investable assets in the HSBC Investor International Equity Portfolio (the “Portfolio”). The Portfolio employs AllianceBernstein L.P. (“AllianceBernstein”), a unit of AllianceBernstein Investment Research and Management as subadviser.
Investment Concerns
There are risks associated with investing in foreign companies, such as erratic market conditions, economic and political instability and fluctuations in currency and exchange rates.
Equity securities (stocks) are more volatile and carry more risk than other forms of investments, including investments in high-grade fixed income securities. The net asset value per share of this Fund will fluctuate as the value of the securities in the portfolio changes.
Market Commentary
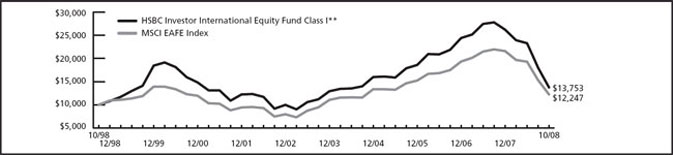
For the 12-month period ended October 31, 2008, the Class I Shares of the HSBC Investor International Equity Fund produced a -51.92% return and the Class A Shares of the HSBC Investor Overseas Equity Fund returned -52.63% (without sales charge). That compared to a total return of -46.34% and -47.80% for the Funds’ benchmarks, the MSCI EAFE Index1 and the Lipper International Large-Cap Core Funds Average1.
Past performance does not guarantee future results.
Portfolio Performance
Investor worries about slowing global economic growth and further repercussions from the subprime mortgage crisis dominated financial markets during the period under review, contributing to the Fund’s negative performance. The U.S. and U.K. housing markets continued to decline, and banks worldwide suffered from exposure to problem assets related to the mortgage industry. Global stocks declined during the period as prospects for economic growth fell sharply.
The Fund’s sector selection hurt relative returns, due primarily to underweight positions in shares of consumer staples, medical and utilities firms. The Fund’s overweight position in financials also dragged on returns, as these companies suffered some of the period’s largest losses.*
Security selection weighed on the Fund’s performance relative to its benchmark. Key detractors included shares of U.K. banks with significant exposure to that country’s housing market. Meanwhile, softening consumer spending hurt performance among shares of certain automakers in the Fund’s portfolio. Those events cascaded through the supply chain, eventually weakening shares of some materials firms in the Fund’s portfolio.
The Fund’s investment in shares of certain securities enhanced its relative performance. Such securities included a major Japanese utility, a French financial services firm and a global energy company.*
| |
* | Portfolio composition is subject to change. |
| |
1 | For additional information, please refer to the Glossary of Terms. |
| |
13 | HSBC INVESTOR FAMILY OF FUNDS |
|
Portfolio Reviews |
|
HSBC Investor International Equity Fund |
HSBC Investor Overseas Equity Fund - As of October 31, 2008 |
|
Value of a $10,000 Investment |
|
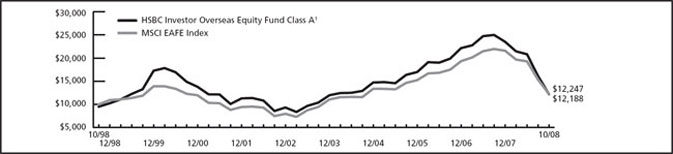
The charts above represent a comparison of a hypothetical $10,000 investment in the indicated share class versus a similar investment in the Funds’ benchmark and represents the reinvestment of dividends and capital gains in the Funds.
| | | | | | | | | | | | | | | |
Fund Performance | | | | Average Annual Total Return (%) | | Expense
Ratio (%)5 | |
|
|
|
|
|
|
|
|
|
|
|
|
|
|
|
|
As of October 31, 2008 | | Inception
Date | | 1
Year | | 5
Year | | 10
Year | | Since
Inception | | Gross | | Net | |
|
|
|
|
|
|
|
|
|
|
|
|
|
|
|
|
HSBC Investor International Equity Fund Class I** | | 1/9/95 | | -51.92 | | 2.83 | | 3.24 | | 5.29 | | 0.89 | | 0.89 | |
|
|
|
|
|
|
|
|
|
|
|
|
|
|
|
|
HSBC Investor Overseas Equity Fund Class A1 | | 8/26/96 | | -55.00 | | 0.86 | | 2.00 | | 3.03 | | 1.64 | | 1.64 | |
|
|
|
|
|
|
|
|
|
|
|
|
|
|
|
|
HSBC Investor Overseas Equity Fund Class B2 | | 1/6/98 | | -54.49 | | 1.13 | | 2.04 | | 2.05 | | 2.39 | | 2.39 | |
|
|
|
|
|
|
|
|
|
|
|
|
|
|
|
|
HSBC Investor Overseas Equity Fund Class C3 | | 11/4/98 | | -53.34 | | 1.16 | | — | | 1.58 | | 2.39 | | 2.39 | |
|
|
|
|
|
|
|
|
|
|
|
|
|
|
|
|
MSCI EAFE Index4 | | — | | -46.34 | | 4.04 | | 2.05 | | N/A | | N/A | | N/A | |
|
|
|
|
|
|
|
|
|
|
|
|
|
|
|
|
Lipper International Large-Cap Core Funds Average4 | | — | | -47.80 | | 2.48 | | 1.18 | | N/A | | N/A | | N/A | |
|
|
|
|
|
|
|
|
|
|
|
|
|
|
|
|
Past performance does not guarantee future results. The performance data quoted represents past performance and current returns may be lower or higher. Total return figures include change in share price, reinvestment of dividends and capital gains and do not reflect the taxes that a shareholder would pay on fund distributions or on the redemption of fund shares. The investment return and principal value will fluctuate so that an investor’s shares, when redeemed may be worth more or less than the original cost. To obtain performance information current to the most recent month end, please call 1-800-782-8183.
The performance above reflects any fee waivers that have been in effect during the applicable periods, as well as any expense reimbursements that have periodically been made. Absent such waivers and reimbursements, returns would have been lower.
| |
** | The Class I Shares represent HSBC Investor International Equity Fund and are part of the Advisor Funds Trust. |
| |
1 | Reflects the maximum sales charge of 5.00%. |
| |
2 | Reflects the contingent deferred sales charge, maximum of 4.00%. |
| |
3 | Reflects the contingent deferred sales charge, maximum of 1.00%. |
| |
4 | For additional information, please refer to the Glossary of Terms. |
| |
5 | Reflects the expense ratio as reported in the prospectus dated February 28, 2008. |
The Fund’s performance is measured against the Morgan Stanley Capital International (“MSCI”) Europe, Australasia and Far East (“EAFE”) Index, an unmanaged free float-adjusted market capitalization index that is designed to measure the equity market performance of developed markets, excluding the U.S. & Canada. As of June 2007 the MSCI EAFE Index consisted of the following 21 developed market country indices: Australia, Austria, Belgium, Denmark, Finland, France, Germany, Greece, Hong Kong, Ireland, Italy, Japan, the Netherlands, New Zealand, Norway, Portugal, Singapore, Spain, Sweden, Switzerland, and the United Kingdom. The performance of the index does not reflect the deduction of expenses associated with a mutual fund, such as investment management and fund accounting fees. The Funds’ performance reflects the deduction of fees for these value-added services. Investors cannot invest directly in an index.
| |
HSBC INVESTOR FAMILY OF FUNDS | 14 |
|
Portfolio Reviews |
|
HSBC Investor Mid-Cap Fund |
(Class A Shares, B Shares, C Shares and Class I Shares)
by Tony Y. Dong, CFA, Director, Mid-Cap Equity and Senior Portfolio Manager and
Brian S. Matuszak, CFA, Senior Equity Analyst and
Andy Y. Mui, CPA, Senior Equity Analyst
Munder Capital Management
The HSBC Investor Mid-Cap Fund (the “Fund”) seeks to achieve long-term growth of capital by investing at least 80% of its net assets in equity securities, i.e., common stocks, preferred stocks, convertible securities and rights and warrants of mid-capitalization companies. Mid-capitalization companies are those companies with market capitalization within the range of companies included in the S&P MidCap 400® Index1, or within the range of companies included in the Russell Midcap® Index. The Fund employs Munder Capital Management (“Munder”) as subadviser.
Investment Concerns
Equity securities (stocks) are more volatile and carry more risk than other forms of investments, including investments in high-grade fixed income securities. The net asset value per share of this Fund will fluctuate as the value of the securities in the portfolio changes.
Mid capitalization funds typically carry additional risks since smaller companies generally have a higher risk of failure, and historically, their stocks have experienced a greater degree of market volatility than stocks on average.
Market Commentary
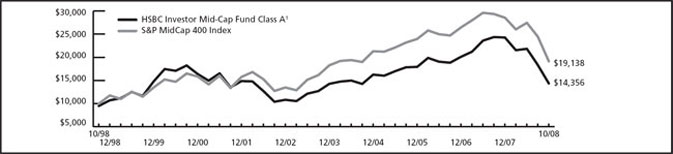
The Fund’s Class A Shares posted a return of -43.49% (without sales charge) and -43.44% for the Class I Shares for the 12-month period ended October 31, 2008. That compares to -36.46% and -42.43% for the Fund’s benchmarks, the S&P MidCap 400 Index1 and the Lipper Mid-Cap Growth Funds Average1.
Past performance does not guarantee future results.
Portfolio Performance
The stock market fell dramatically during the 12 months under review as the subprime mortgage crisis continued to spread through the credit markets. Investors concerned with the direction of the U.S. and global economies sought refuge outside of stocks, resulting in double-digit losses in each of the 10 economic sectors of the index.
The Fund benefited from strong stock selection in the consumer staples sector, as its holdings within that sector declined just 5% during the period versus a 25% loss in the consumer staples that make up that sector of the index. The Fund’s performance relative to the mid-cap index also benefited from the Fund’s overweighting in the consumer staples sector, which out-gained the index as a whole. Stock selection also helped the Fund outperform its index in the energy, telecommunications services and health care sectors, and an overweight position in the materials sector boosted relative performance.*
The financial services sector performed poorly during the period. The Fund underweighted that sector, but its holdings within the financial services sector—including its underexposure to commercial banks and exposure to stocks within the capital markets sub-sector—dragged on its performance relative to the broader benchmark. Stock selection in the consumer discretionary, industrials and information technology sectors also hampered the Fund’s relative performance during the period.*
In absolute terms, the Fund’s bias toward growth dragged on performance as value stocks in the mid-cap sector outperformed growth stocks in the sector. The market’s bias toward value also hampered the Fund’s performance relative to its benchmark during the period.*
It is clear that the global economic outlook is negative. However, we remain focused on implementing our investment discipline. Our process involves a continual and rigorous evaluation of the fundamentals for each stock, relative to alternative holdings, with the goal of capturing the best ideas of our mid-cap team and we believe the current strength of the portfolio fundamentals positions the portfolio well for future strong performance.
| |
* | Portfolio composition is subject to change. |
| |
1 | For additional information, please refer to the Glossary of Terms. |
| |
15 | HSBC INVESTOR FAMILY OF FUNDS |
HSBC Investor Mid-Cap Fund - As of October 31, 2008
|
Value of a $10,000 Investment |
|
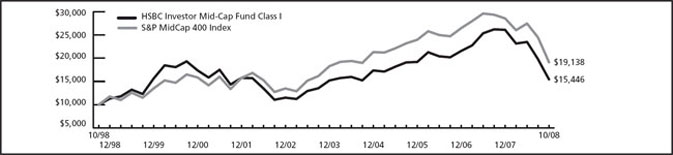
The charts above represent a comparison of a hypothetical $10,000 investment in the indicated share class versus a similar investment in the Funds’ benchmark and represents the reinvestment of dividends and capital gains in the Funds.
| | | | | | | | | | | | | | | |
Fund Performance | | | | Average Annual Total Return† (%) | | Expense
Ratio (%)5 | |
|
|
|
|
|
|
|
|
As of October 31, 2008 | | Inception
Date | | 1
Year | | 5
Year | | 10
Year | | Since
Inception | | Gross | | Net | |
|
|
|
|
|
|
|
|
|
|
|
|
|
|
|
|
HSBC Investor Mid-Cap Fund Class A1 | | 7/1/93 | | -46.32 | | -0.23 | | 3.68 | | 7.13 | | 1.72 | | 1.35 | |
|
|
|
|
|
|
|
|
|
|
|
|
|
|
|
|
HSBC Investor Mid-Cap Fund Class B2 | | 7/1/93 | | -45.92 | | 0.03 | | 3.44 | | 6.81 | | 2.47 | | 2.10 | |
|
|
|
|
|
|
|
|
|
|
|
|
|
|
|
|
HSBC Investor Mid-Cap Fund Class C3 | | 7/1/93 | | -44.46 | | 0.03 | | 3.50 | | 6.73 | | 2.47 | | 2.10 | |
|
|
|
|
|
|
|
|
|
|
|
|
|
|
|
|
HSBC Investor Mid-Cap Fund Class I | | 7/1/93 | | -43.44 | | 0.99 | | 4.44 | | 7.75 | | 1.47 | | 1.10 | |
|
|
|
|
|
|
|
|
|
|
|
|
|
|
|
|
S&P MidCap 400 Index4 | | — | | -36.46 | | 1.96 | | 6.71 | | N/A | | N/A | | N/A | |
|
|
|
|
|
|
|
|
|
|
|
|
|
|
|
|
Lipper Mid-Cap Growth Funds Average4 | | — | | -42.43 | | -0.42 | | 2.57 | | N/A | | N/A | | N/A | |
|
|
|
|
|
|
|
|
|
|
|
|
|
|
|
|
Past performance does not guarantee future results. The performance data quoted represents past performance and current returns may be lower or higher. Total return figures include change in share price, reinvestment of dividends and capital gains and do not reflect the taxes that a shareholder would pay on fund distributions or on the redemption of fund shares. The investment return and principal value will fluctuate so that an investor’s shares, when redeemed may be worth more or less than the original cost. To obtain performance information current to the most recent month end, please call 1-800-782-8183.
The performance above reflects any fee waivers that have been in effect during the applicable periods, as well as any expense reimbursements that have periodically been made. Absent such waivers and reimbursements, returns would have been lower. Currently, contractual fee waivers are in effect from March 1, 2008 through March 1, 2009.
| |
1 | Reflects the maximum sales charge of 5.00%. |
| |
2 | Reflects the contingent deferred sales charge, maximum of 4.00%. |
| |
3 | Reflects the contingent deferred sales charge, maximum of 1.00%. |
| |
4 | For additional information, please refer to the Glossary of Terms. |
| |
5 | Reflects the expense ratio as reported in the prospectus dated February 28, 2008. |
| |
† | For periods prior to July 1, 2000, the performance shown above includes the total return (adjusted for Fund expenses) generated by HSBC Global Asset Management (USA) Inc’s management of a pooled investment vehicle called a collective investment trust (“CIT”) with the same investment objective as the Fund. The assets from that CIT were converted into the HSBC Investor Mid-Cap Fund on July 1, 2000. The CIT was not registered with the Securities & Exchange Commission (SEC) and thus was not subject to certain investment restrictions that are imposed on the Fund. If the CIT had been registered with the SEC, its performance might have been adversely affected. Performance assumes reinvestment of dividends and distributions. |
The Fund’s performance is measured against the S&P MidCap 400 Index, an unmanaged index comprised of 400 domestic stocks chosen for market size (median market capitalization of $676 million), liquidity and industry group representation. The performance of the index does not reflect the deduction of expenses associated with a mutual fund, such as investment management and fund accounting fees. The Fund’s performance reflects the deduction of fees for these value-added services. Investors cannot invest directly in an index.
| |
HSBC INVESTOR FAMILY OF FUNDS | 16 |
|
Portfolio Reviews |
|
HSBC Investor Opportunity Fund |
(Class A Shares, B Shares, C Shares and I Shares)
by William A. Muggia
President–Chief Investment Officer
Westfield Capital Management
The HSBC Investor Opportunity Fund (“the Fund”) seeks to provide its shareholders with long-term growth of capital by investing in equity securities of small cap companies. The Portfolio may also invest in bonds, notes, commercial paper, U.S. Government securities, and foreign securities. Small cap companies generally are defined as those that have market capitalizations within the range of market capitalizations represented in the Russell 2500™ Growth Index.1 The Portfolio may also invest in equity securities of larger, more established companies if they are expected to show increased earnings. The Funds employ a two-tier structure, commonly referred to as “master-feeder.” The Fund invest all of its investable assets in the HSBC Investor Opportunity Portfolio (the “Portfolio”). The Portfolio employs Westfield Capital Management Company, LLC as subadviser.
Investment Concerns
Equity securities (stocks) are more volatile and carry more risk than other forms of investments, including investments in high-grade fixed income securities. The net asset value per share of this Fund will fluctuate as the value of the securities in the portfolio changes. Small-capitalization funds typically carry additional risks since smaller companies generally have a higher risk of failure, and historically, their stocks have experienced a greater degree of market volatility than stocks on average.
Market Commentary
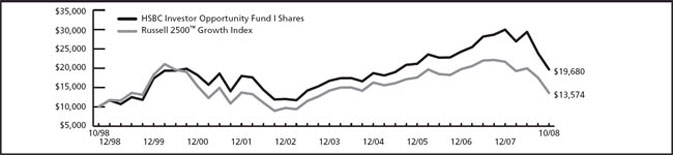
For the 12-month period ended October 31, 2008, the Class I Shares of the HSBC Investor Opportunity Fund produced a -35.39% return and the Class A Shares of the Fund produced a - -35.84% return (without sales charge). The Funds’ benchmarks, the Russell 2500™ Growth Index1 and the Lipper Mid-Cap Growth Funds Average1, returned -41.00% and -42.43%, respectively.
Past performance does not guarantee future results.
Portfolio Performance
The fallout from the subprime mortgage crisis intensified during the 12 months under review, leading to larger credit and liquidity crises in the financial markets. Fears of U.S. and global recessions grew as a result, particularly toward the end of the period. Stocks of almost all kinds posted heavy losses.
The Fund benefited from holding a larger position than its benchmark in the health care sector. The Fund did not have a bullish view on the sector as a whole, but managed to identify a number of attractive investments in sub-sectors such as biotechnology and health care equipment, and those holdings helped relative performance. The Fund also held an underweight position in consumer discretionary stocks. Consumer discretionary proved to be the second-worst performing sector during the period, following only the financial services sector, so the Fund’s underweight position benefited relative performance.*
Stock selection within the industrial sector was the greatest drag on the Fund’s relative performance during the period. We believe that the pace of development in foreign countries would continue to increase, making shares of building and construction firms attractive. But stocks of such companies suffered as the economic woes in the United States spread globally. Stock selection in the financial services sector also weighed on returns relative to the benchmark.
The economic realities are grim, but we believe that this is largely reflected in stocks. Valuation levels of US stocks are well below their ten-year averages. Stocks have traded down as an asset class, with little regard for company specific prospects or fundamentals. We believe that once the financial markets have stabilized, we will look back on this period as an opportunity to invest in high quality growth companies trading at very attractive historical valuations. We remain focused on company fundamentals and are committed to upgrading quality in the portfolio wherever possible.
| |
* | Portfolio composition is subject to change. |
| |
1 | For additional information, please refer to the Glossary of Terms. |
| |
17 | HSBC INVESTOR FAMILY OF FUNDS |
|
Portfolio Reviews |
|
HSBC Investor Opportunity Fund - As of October 31, 2008 |
|
Value of a $10,000 Investment |
|
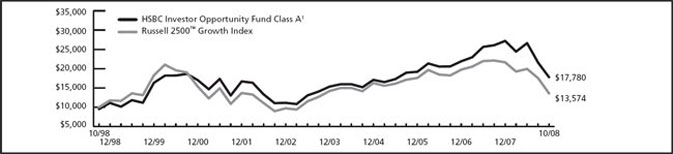
The charts above represent a comparison of a hypothetical $10,000 investment in the indicated share class versus a similar investment in the Funds’ benchmark and represents the reinvestment of dividends and capital gains in the Funds.
| | | | | | | | | | | | | | | |
Fund Performance | | | | Average Annual Total Return (%) | | Expense
Ratio (%)5 | |
|
|
|
|
|
|
|
|
|
|
|
|
|
|
|
|
As of October 31, 2008 | | Inception
Date | | 1
Year | | 5
Year | | 10
Year | | Since
Inception | | Gross | | Net | |
|
|
|
|
|
|
|
|
|
|
|
|
|
|
|
|
HSBC Investor Opportunity Fund Class A1 | | 9/23/96 | | -39.04 | | 2.43 | | 5.92 | | 6.31 | | 1.77 | | 1.65 | |
|
|
|
|
|
|
|
|
|
|
|
|
|
|
|
|
HSBC Investor Opportunity Fund Class B2 | | 1/6/98 | | -37.93 | | 2.72 | | 6.00 | | 5.31 | | 2.52 | | 2.40 | |
|
|
|
|
|
|
|
|
|
|
|
|
|
|
|
|
HSBC Investor Opportunity Fund Class C3 | | 11/4/98 | | -36.68 | | 2.74 | | — | | 5.53 | | 2.52 | | 2.40 | |
|
|
|
|
|
|
|
|
|
|
|
|
|
|
|
|
HSBC Investor Opportunity Fund Class I** | | 9/3/96 | | -35.39 | | 3.83 | | 7.00 | | 7.99 | | 1.03 | | 1.03 | |
|
|
|
|
|
|
|
|
|
|
|
|
|
|
|
|
Russell 2500TM Growth Index4 | | — | | -41.00 | | -0.17 | | 3.10 | | N/A | | N/A | | N/A | |
|
|
|
|
|
|
|
|
|
|
|
|
|
|
|
|
Lipper Mid-Cap Growth Funds Average4 | | — | | -42.43 | | -0.42 | | 2.57 | | N/A | | N/A | | N/A | |
|
|
|
|
|
|
|
|
|
|
|
|
|
|
|
|
Past performance does not guarantee future results. The performance data quoted represents past performance and current returns may be lower or higher. Total return figures include change in share price, reinvestment of dividends and capital gains and do not reflect the taxes that a shareholder would pay on fund distributions or on the redemption of fund shares. The investment return and principal value will fluctuate so that an investor’s shares, when redeemed may be worth more or less than the original cost. To obtain performance information current to the most recent month end, please call 1-800-782-8183.
The performance above reflects any fee waivers that have been in effect during the applicable periods, as well as any expense reimbursements that have periodically been made. Absent such waivers and reimbursements, returns would have been lower. Currently, contractual fee waivers are in effect from March 1, 2008 through March 1, 2009.
| |
** | The Class I Shares of the HSBC Investor Opportunity Fund are part of the Advisor Funds Trust. |
| |
1 | Reflects the maximum sales charge of 5.00%. |
| |
2 | Reflects the contingent deferred sales charge, maximum of 4.00%. |
| |
3 | Reflects the contingent deferred sales charge, maximum of 1.00%. |
| |
4 | For additional information, please refer to the Glossary of Terms. |
| |
5 | Reflects the expense ratio as reported in the prospectus dated February 28, 2008. |
The Fund’s performance is measured against the Russell 2500™ Growth Index, an unmanaged index which measures the performance of those 2500 securities in The Russell Universe with higher price-to-book ratios and higher forecasted growth values. The performance for the index does not reflect the deduction of expenses associated with a mutual fund, such as investment management and fund accounting fees. The Fund’s performance reflects the deduction of fees for these value-added services. Investors cannot invest directly in an index.
| |
HSBC INVESTOR FAMILY OF FUNDS | 18 |
|
Portfolio Reviews |
|
HSBC Investor Value Fund
(Class A Shares, B Shares, C Shares and I Shares)
by Jon D. Bosse, CFA
Chief Investment Officer
NWQ Investment Management Co., LLC |
The HSBC Investor Value Fund (the “Fund”) seeks long-term growth of capital and income by investing primarily in U.S. and foreign companies with large and medium capitalizations that the subadviser believes possess opportunities under appreciated or misperceived by the market. The Fund utilizes a two tier structure, commonly known as a “master-feeder” and invests all of its investable assets in the HSBC Investor Value Portfolio (the “Portfolio”), which acts as the master fund. The Portfolio employs NWQ Investment Management Company, LLC (“NWQ”) as subadviser.
Investment Concerns
Value-based investments are subject to the risk that the broad market may not recognize their intrinsic value.
Equity securities (stocks) are more volatile and carry more risk than other forms of investments, including investments in high-grade fixed income securities. The net asset value per share of this Fund will fluctuate as the value of the securities in the Portfolio changes.
Market Commentary
The Fund returned -40.46% (without sales charge) for the Class A Shares and -40.29% for the Class I Shares for the 12-month period ended October 31, 2008. That compared to a -36.80% return for the Russell 1000® Value Index1 and a -38.75% return for the Lipper Multi-Cap Value Funds Average1.
Past performance does not guarantee future results.
Portfolio Performance
U.S and Global Equity markets experienced significant declines during the period under review, with most of the decline occurring during the last weeks. This has been an unprecedented period and one of the most challenging investment environments in our country’s history. Given the crisis of confidence, the U.S. Government took decisive action regarding the fate of many companies. The U.S. Government has either: assumed control of companies; sponsored/engineered “takeovers;” or allowed companies to fail. In many cases, such events might signal a bottom and thereby provide a floor in equity valuations. However, the magnitude of recent events and continued economic deterioration combined with the realization that a company’s financial well-being could quickly evaporate, have heightened investor fears and market volatility. The U. S. Treasury/the Federal Reserve Board (as well as Central Banks broadly) have begun implementing broad and meaningful financial rescue measures in order to stabilize global markets.
There were few places to “hide” during the period under review; and most of the Fund’s holdings declined. The credit markets dysfunction has led to fear and panic, particularly within the financial sector. While the Fund was underweighted in the financial sector (relative to the Russell 1000® Value Index1), the sector adversely impacted absolute and relative performance. The Fund’s positions within the materials/processing sector adversely impacted the portfolio. These stocks came under pressure as commodity prices declined amid a deteriorating outlook for global growth. Oil and gas prices declined during the latter part of the period adversely affecting the Fund’s energy holdings. We would like to note that we reduced the energy position in Fund during the first half of the period — at higher share prices. Finally, the Fund’s consumer discretionary sector, primarily media, adversely impacted the portfolio. There were positive contributors during the period. One of the Fund’s health care companies, as well as the Fund’s railroad holding, appreciated during the period. Consumer staples contributed positively to the portfolio. *
It is clear that the global economic outlook is negative. However, we see valuations for many companies at levels similar to those we encountered in late 2002 and early 2003. We remain focused on implementing our investment discipline: we will continue to focus on companies with attractive absolute valuations, favorable risk/reward and downside protection, and catalysts/ inflection points to improve /sustain profitability or recognize value.
| |
* | Portfolio composition is subject to change. |
| |
1 | For additional information, please refer to the Glossary of Terms. |
| |
19 | HSBC INVESTOR FAMILY OF FUNDS |
|
Portfolio Reviews |
|
HSBC Investor Value Fund - As of October 31, 2008 |
|
Value of a $10,000 Investment |
|
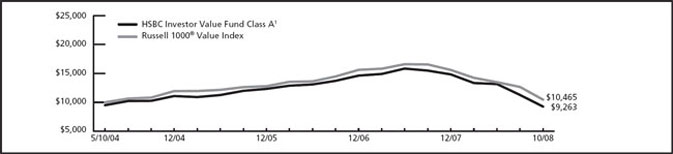
The charts above represent a comparison of a hypothetical $10,000 investment in the indicated share class versus a similar investment in the Funds’ benchmark and represents the reinvestment of dividends and capital gains in the Funds.
| | | | | | | | | | | | | |
Fund Performance | | | | Average Annual
Total Return (%) | | Expense
Ratio (%)6 | |
|
|
|
|
|
|
|
|
|
|
|
|
|
|
As of October 31, 2008 | | Inception
Date | | 1
Year | | 3
Year | | Since
Inception | | Gross | | Net | |
|
|
|
|
|
|
|
|
|
|
|
|
|
|
HSBC Investor Value Fund Class A1 | | 5/7/04 | 5 | -43.44 | | -8.93 | | -1.70 | | 1.24 | | 1.20 | |
|
|
|
|
|
|
|
|
|
|
|
|
|
|
HSBC Investor Value Fund Class B2 | | 5/7/04 | 5 | -43.04 | | -8.51 | | -1.30 | | 1.99 | | 1.95 | |
|
|
|
|
|
|
|
|
|
|
|
|
|
|
HSBC Investor Value Fund Class C3 | | 5/7/04 | 5 | -41.43 | | -8.05 | | -1.31 | | 1.99 | | 1.95 | |
|
|
|
|
|
|
|
|
|
|
|
|
|
|
HSBC Investor Value Fund Class I | | 5/7/04 | 5 | -40.29 | | -7.13 | | -0.30 | | 0.99 | | 0.95 | |
|
|
|
|
|
|
|
|
|
|
|
|
|
|
Russell 1000® Value Index4 | | — | | -36.80 | | -5.24 | | N/A | | N/A | | N/A | |
|
|
|
|
|
|
|
|
|
|
|
|
|
|
Lipper Multi-Cap Value Funds Average4 | | — | | -38.75 | | -7.30 | | N/A | | N/A | | N/A | |
|
|
|
|
|
|
|
|
|
|
|
|
|
|
Past performance does not guarantee future results. The performance data quoted represents past performance and current returns may be lower or higher. Total return figures include change in share price, reinvestment of dividends and capital gains and do not reflect the taxes that a shareholder would pay on fund distributions or on the redemption of fund shares. The investment return and principal value will fluctuate so that an investor’s shares, when redeemed may be worth more or less than the original cost. To obtain performance information current to the most recent month end, please call 1-800-782-8183.
The performance above reflects any fee waivers that have been in effect during the applicable periods, as well as any expense reimbursements that have periodically been made. Absent such waivers and reimbursements, returns would have been lower. Currently, contractual fee waivers are in effect from March 1, 2008 through March 1, 2009.
During the year ended October 31 2008, the Portfolio the Fund invests in received monies related to certain nonrecurring litigation settlements. Without the receipt of this payment, the returns for applicable periods would have been lower.
| |
1 | Reflects the maximum sales charge of 5.00%. |
| |
2 | Reflects the contingent deferred sales charge, maximum of 4.00%. |
| |
3 | Reflects the contingent deferred sales charge, maximum of 1.00%. |
| |
4 | For additional information, please refer to the Glossary of Terms. |
| |
5 | The HSBC Investor Value Fund was initially offered for purchase effective May 7, 2004, however, no shareholder activity occurred until May 10, 2004. |
| |
6 | Reflects the expense ratio as reported in the prospectus dated February 28, 2008. |
The Fund’s performance is measured against the Russell 1000® Value Index, an unmanaged index which measures the performance of the large-cap value segment of the U.S. equity universe. It includes those Russell 1000 companies with lower price-to-book ratios and lower expected growth values. The performance of the index does not reflect the deduction of expenses associated with a mutual fund, such as investment management and fund accounting fees. The Fund’s performance reflects the deduction of fees for these value-added services. Investors cannot invest directly in an index.
| |
HSBC INVESTOR FAMILY OF FUNDS | 20 |
|
Portfolio Reviews |
|
Portfolio Composition*
October 31, 2008
(Unaudited) |
| | | | |
HSBC Investor Core Plus Fixed Income Portfolio | | | | |
|
|
|
|
|
| | | | |
Investment Allocation | | Percentage of Investments at Value | |
|
|
|
|
U.S. Government and Government Agency Obligations | | 33.4 | % | |
|
|
|
|
|
Corporate Obligations | | 29.5 | % | |
|
|
|
|
|
Asset Backed Securities | | 19.4 | % | |
|
|
|
|
|
Commercial Mortgage Backed Securities | | 8.8 | % | |
|
|
|
|
|
Collateralized Mortgage Obligations | | 4.5 | % | |
|
|
|
|
|
Cash and Equivalents | | 2.1 | % | |
|
|
|
|
|
Municipal Bonds | | 1.8 | % | |
|
|
|
|
|
Foreign Bonds | | 0.4 | % | |
|
|
|
|
|
Certificates of Deposit | | 0.1 | % | |
|
|
|
|
|
Total | | 100.0 | % | |
|
|
|
|
|
| | | | |
HSBC Investor High Yield Fixed Income Portfolio | | | |
|
|
|
|
| | | |
Investment Allocation | | Percentage of Investments at Value | |
|
|
|
|
Corporate Obligations | | 100.0 | % | |
|
|
|
|
|
Common Stock | | 0.0 | % | |
|
|
|
|
|
Total | | 100.0 | % | |
|
|
|
|
|
| | | | |
HSBC Investor Intermediate Duration Fixed Income Portfolio | | | | |
|
|
|
|
|
| | | | |
Investment Allocation | | Percentage of Investments at Value | |
|
|
|
|
U.S. Government and Government Agency Obligations | | 42.6 | % | |
|
|
|
|
|
Corporate Obligations | | 21.2 | % | |
|
|
|
|
|
Asset Backed Securities | | 15.4 | % | |
|
|
|
|
|
Cash and Equivalents | | 9.8 | % | |
|
|
|
|
|
Commercial Mortgage Backed Securities | | 5.7 | % | |
|
|
|
|
|
Collateralized Mortgage Obligations | | 4.0 | % | |
|
|
|
|
|
Municipal Bonds | | 0.4 | % | |
|
|
|
|
|
Foreign Bonds | | 0.4 | % | |
|
|
|
|
|
Certificates of Deposit | | 0.5 | % | |
|
|
|
|
|
Total | | 100.0 | % | |
|
|
|
|
|
| | | | |
HSBC Investor New York Tax-Free Bond Fund | | | | |
|
|
|
|
|
| | | | |
Investment Allocation | | Percentage of Investments at Value | |
|
|
|
|
Municipal Bonds | | 100.0 | % | |
|
|
|
|
|
Cash and Equivalents | | 0.0 | % | |
|
|
|
|
|
Total | | 100.0 | % | |
|
|
|
|
|
| | | | |
HSBC Investor Growth Portfolio | | | | |
|
|
|
|
|
| | | | |
Investment Allocation | | Percentage of Investments at Value | |
|
|
|
|
Biotechnology | | 7.8 | % | |
|
|
|
|
|
Retail | | 7.2 | % | |
|
|
|
|
|
Software Services | | 7.2 | % | |
|
|
|
|
|
Industrial Conglomerates | | 6.8 | % | |
|
|
|
|
|
Medical Services & Distributors | | 6.7 | % | |
|
|
|
|
|
Medical Products | | 6.6 | % | |
|
|
|
|
|
Cash and Equivalents | | 5.6 | % | |
|
|
|
|
|
Telecommunication | | 5.3 | % | |
|
|
|
|
|
Hardware & Peripherals | | 4.4 | % | |
|
|
|
|
|
Credit Card | | 4.2 | % | |
|
|
|
|
|
Communication Equipment | | 3.4 | % | |
|
|
|
|
|
Railroad | | 3.3 | % | |
|
|
|
|
|
Agriculture | | 3.0 | % | |
|
|
|
|
|
Investment Management | | 2.5 | % | |
|
|
|
|
|
Internet | | 2.3 | % | |
|
|
|
|
|
Retail Pharmacy | | 2.3 | % | |
|
|
|
|
|
Aerospace & Defense | | 2.3 | % | |
|
|
|
|
|
Oil & Gas Drill & Equipment | | 2.1 | % | |
|
|
|
|
|
Pharmaceuticals | | 2.1 | % | |
|
|
|
|
|
Engineering & Construction | | 2.0 | % | |
|
|
|
|
|
Distribution & Wholesale | | 1.8 | % | |
|
|
|
|
|
Household Products | | 1.5 | % | |
|
|
|
|
|
Exchanges | | 1.5 | % | |
|
|
|
|
|
Oil & Gas Exploration & Production | | 1.4 | % | |
|
|
|
|
|
Transportation | | 1.3 | % | |
|
|
|
|
|
Computer Storage | | 1.1 | % | |
|
|
|
|
|
Solar | | 1.0 | % | |
|
|
|
|
|
Travel & Leisure | | 1.0 | % | |
|
|
|
|
|
Electric, Gas & Water | | 0.8 | % | |
|
|
|
|
|
Coal | | 0.8 | % | |
|
|
|
|
|
Business Services | | 0.7 | % | |
|
|
|
|
|
Total | | 100.0 | % | |
|
|
|
|
|
| | | | |
HSBC International Equity Portfolio | | | | |
|
|
|
|
|
| | | | |
Investment Allocation | | Percentage of Investments at Value | |
|
|
|
|
Europe | | 66.9 | % | |
|
|
|
|
|
Japan | | 18.6 | % | |
|
|
|
|
|
Australia & Far East | | 6.2 | % | |
|
|
|
|
|
Canada | | 5.1 | % | |
|
|
|
|
|
Cash and Equivalents | | 2.4 | % | |
|
|
|
|
|
Other | | 0.8 | % | |
|
|
|
|
|
Total | | 100.0 | % | |
|
|
|
|
|
* | Portfolio composition is subject to change. |
| |
21 | HSBC INVESTOR FAMILY OF FUNDS |
|
Portfolio Reviews |
|
Portfolio Composition* |
October 31, 2008 |
(Unaudited) |
| | | | |
HSBC Investor Mid-Cap Fund | | | | |
|
|
|
|
|
| | | |
Investment Allocation | | Percentage of Investments at Value | |
|
|
|
|
Health Care | | 11.6 | % | |
|
|
|
|
|
Utilities | | 8.9 | % | |
|
|
|
|
|
Financial Services | | 6.7 | % | |
|
|
|
|
|
Chemicals | | 5.2 | % | |
|
|
|
|
|
Consumer Products | | 4.7 | % | |
|
|
|
|
|
Oil & Gas | | 4.5 | % | |
|
|
|
|
|
Insurance | | 4.3 | % | |
|
|
|
|
|
Retail | | 3.9 | % | |
|
|
|
|
|
Real Estate | | 3.8 | % | |
|
|
|
|
|
Computer Software | | 3.7 | % | |
|
|
|
|
|
Electronic Components & Semiconductors | | 3.4 | % | |
|
|
|
|
|
Commercial Services | | 3.2 | % | |
|
|
|
|
|
Food & Beverage | | 2.9 | % | |
|
|
|
|
|
Industrial Manufacturing | | 2.6 | % | |
|
|
|
|
|
Banking | | 2.5 | % | |
|
|
|
|
|
Telecommunications | | 2.3 | % | |
|
|
|
|
|
Cash and Equivalents | | 2.1 | % | |
|
|
|
|
|
Agricultural Chemicals | | 2.0 | % | |
|
|
|
|
|
Environmental Services | | 1.8 | % | |
|
|
|
|
|
Communications | | 1.7 | % | |
|
|
|
|
|
Business Services | | 1.7 | % | |
|
|
|
|
|
Correctional Institutions | | 1.7 | % | |
|
|
|
|
|
Computer Services | | 1.6 | % | |
|
|
|
|
|
Energy | | 1.6 | % | |
|
|
|
|
|
Aerospace & Defense | | 1.6 | % | |
|
|
|
|
|
Machinery | | 1.5 | % | |
|
|
|
|
|
Biotechnology | | 1.5 | % | |
|
|
|
|
|
Distribution & Wholesale | | 1.4 | % | |
|
|
|
|
|
Transportation | | 1.1 | % | |
|
|
|
|
|
Education | | 1.0 | % | |
|
|
|
|
|
Specialty Retail | | 1.0 | % | |
|
|
|
|
|
Metal Processors & Fabrication | | 1.0 | % | |
|
|
|
|
|
Wire & Cable Products | | 0.9 | % | |
|
|
|
|
|
Computers | | 0.6 | % | |
|
|
|
|
|
Total | | 100.0 | % | |
|
|
|
|
|
| | | | |
HSBC Investor Opportunity Portfolio | | | | |
|
|
|
|
|
| | | |
Investment Allocation | | Percentage of Investments at Value | |
|
|
|
|
Computer Software | | 14.9 | % | |
|
|
|
|
|
Pharmaceuticals | | 12.6 | % | |
|
|
|
|
|
Oil & Gas | | 9.4 | % | |
|
|
|
|
|
Health Care | | 8.1 | % | |
|
|
|
|
|
Consumer Products | | 8.0 | % | |
|
|
|
|
|
Industrial Manufacturing | | 5.7 | % | |
|
|
|
|
|
Financial Services | | 5.4 | % | |
|
|
|
|
|
Biotechnology | | 5.2 | % | |
|
|
|
|
|
Education | | 4.7 | % | |
|
|
|
|
|
Retail | | 4.7 | % | |
|
|
|
|
|
Cash and Equivalents | | 3.7 | % | |
|
|
|
|
|
Telecommunications | | 3.1 | % | |
|
|
|
|
|
Diversified Manufacturing Operations | | 2.6 | % | |
|
|
|
|
|
Transportation | | 2.3 | % | |
|
|
|
|
|
Business Services | | 2.3 | % | |
|
|
|
|
|
Utilities | | 1.4 | % | |
|
|
|
|
|
Aerospace & Defense | | 1.4 | % | |
|
|
|
|
|
Internet Related | | 1.4 | % | |
|
|
|
|
|
Media | | 1.3 | % | |
|
|
|
|
|
Homebuilders | | 1.3 | % | |
|
|
|
|
|
Electronic Components & Semiconductors | | 0.5 | % | |
|
|
|
|
|
Total | | 100.0 | % | |
|
|
|
|
|
| | | | |
HSBC Investor Value Portfolio | | | | |
|
|
|
|
|
| | | |
Investment Allocation | | Percentage of Investments at Value | |
|
|
|
|
Oil & Gas | | 11.8 | % | |
|
|
|
|
|
Cash and Equivalents | | 9.7 | % | |
|
|
|
|
|
Computer Software | | 9.2 | % | |
|
|
|
|
|
Insurance | | 7.3 | % | |
|
|
|
|
|
Telecommunications | | 6.6 | % | |
|
|
|
|
|
Media | | 6.4 | % | |
|
|
|
|
|
Metals & Mining | | 6.4 | % | |
|
|
|
|
|
Consumer Products | | 6.0 | % | |
|
|
|
|
|
Pharmaceuticals | | 5.9 | % | |
|
|
|
|
|
Aerospace & Defense | | 5.4 | % | |
|
|
|
|
|
Tobacco | | 4.5 | % | |
|
|
|
|
|
Financial Services | | 4.2 | % | |
|
|
|
|
|
Business Services | | 3.5 | % | |
|
|
|
|
|
Banking | | 3.4 | % | |
|
|
|
|
|
Conglomerates | | 2.5 | % | |
|
|
|
|
|
Diversified Manufacturing Operations | | 2.4 | % | |
|
|
|
|
|
Transportation | | 2.4 | % | |
|
|
|
|
|
Energy | | 1.6 | % | |
|
|
|
|
|
Paper & Related Products | | 0.8 | % | |
|
|
|
|
|
Total | | 100.0 | % | |
|
|
|
|
|
| | |
* | Portfolio composition is subject to change. | |
| | |
HSBC INVESTOR FAMILY OF FUNDS | 22 |
(This Page Intentionally Left Blank)
|
HSBC INVESTOR NEW YORK TAX-FREE BOND FUND |
|
Schedule of Portfolio Investments—as of October 31, 2008 |
| | | | | | | |
Municipal Bonds – 99.6% | | | | | | | |
|
| | | | | | | |
| | Shares or
Principal
Amount ($) | | Value ($) | |
| |
| |
| |
New York – 89.7% | | | | | | | |
Buffalo, New York Fiscal Stability Authority
Sales Tax & State Aid Revenue, 5.25%,
8/15/13, (MBIA Insured) | | | 500,000 | | | 535,465 | |
Long Island Power Authority Electrical
Systems Revenue, 5.00%, 12/1/22,
Callable 12/1/16 @ 100 | | | 500,000 | | | 483,300 | |
Metropolitan Transportation Authority Revenue,
5.75%, 7/1/13, Escrowed to Maturity | | | 285,000 | | | 301,901 | |
Metropolitan Transportation Authority Revenue,
5.50%, 1/1/19, (MBIA Insured), Callable
7/1/12 @ 100 | | | 480,000 | | | 496,205 | |
Metropolitan Transportation Authority Revenue,
5.50%, 11/15/19, (FGIC Insured) | | | 1,000,000 | | | 1,035,560 | |
Metropolitan Transportation Authority Revenue,
5.00%, 11/15/32, (FSA Insured), Callable
11/15/12 @ 100 | | | 1,625,000 | | | 1,509,154 | |
Monroe County Airport Authority Revenue,
5.63%, 1/1/10, AMT, (MBIA Insured) | | | 1,240,000 | | | 1,256,579 | |
Monroe County Airport Authority Revenue,
5.75%, 1/1/14, AMT, (MBIA Insured) | | | 750,000 | | | 747,945 | |
New York City GO, 5.00%, 8/1/14 | | | 200,000 | | | 207,104 | |
New York City GO, 5.00%, 8/1/15 | | | 325,000 | | | 334,406 | |
New York City GO, Series C, 5.00%, 8/1/16,
(MBIA Insured), Callable 8/1/15 @ 100 | | | 500,000 | | | 508,585 | |
New York City GO, 5.00%, 8/1/17 | | | 500,000 | | | 504,870 | |
New York City Housing Development Corp.
Revenue, 5.60%, 11/1/19, AMT, Callable
11/1/09 @ 101 | | | 100,000 | | | 96,563 | |
New York City IDA Civic Facility Revenue,
USTA National Tennis Center, 5.00%,
11/15/19, (FSA Insured), Callable
5/1/13 @ 100 | | | 1,000,000 | | | 1,011,300 | |
New York City IDA Revenue, Queens Baseball
Stadium, 5.00%, 1/1/18, (AMBAC Insured),
Callable 1/1/17 @ 100 | | | 550,000 | | | 542,806 | |
New York City IDA Special Facility Revenue,
Terminal One Group Association, 5.00%,
1/1/09, AMT | | | 1,000,000 | | | 1,001,330 | |
New York City Municipal Water Finance
Authority, 5.00%, 6/15/34, Callable
6/15/13 @ 100 | | | 1,250,000 | | | 1,139,825 | |
New York City Municipal Water Finance
Authority, 5.00%, 6/15/36, Callable
12/15/14 @ 100 | | | 1,000,000 | | | 905,700 | |
New York City Transitional Finance Authority
Building Aid Revenue, 5.00%, 7/15/18,
(FGIC Insured), Callable 1/15/17 @ 100 | | | 550,000 | | | 556,902 | |
New York City Transitional Finance Authority
Building Aid Revenue, 5.00%, 7/15/36,
(FGIC Insured), Callable 1/15/17 @ 100 | | | 1,000,000 | | | 879,060 | |
New York City Transitional Finance Authority
Revenue, 5.25%, 5/1/17, Callable
5/1/11 @ 100 | | | 400,000 | | | 413,544 | |
New York City Transitional Finance Authority
Revenue, 5.25%, 2/1/29, Callable
2/1/11 @ 100 | | | 1,540,000 | | | 1,585,954 | |
New York State Dormitory Authority Revenue,
Department of Health, 5.25%, 7/1/16,
Callable 7/1/14 @ 100 | | | 500,000 | | | 520,825 | |
| | | | | | | |
Municipal Bonds, continued | | | | | | | |
|
| | | | | | | |
| | Shares or
Principal
Amount ($) | | Value ($) | |
| |
| |
| |
New York, continued | | | | | | | |
New York State Dormitory Authority Revenue,
Fashion Institute, 5.25%, 7/1/22,
(FGIC Insured) | | | 1,250,000 | | | 1,179,987 | |
New York State Dormitory Authority Revenue,
Master Boces PG, 5.25%, 8/15/19, (FSA
Insured), Callable 8/15/12 @ 100 | | | 1,000,000 | | | 1,018,120 | |
New York State Dormitory Authority Revenue,
Mental Health, 6.50%, 8/15/11 | | | 225,000 | | | 243,414 | |
New York State Dormitory Authority Revenue,
Mental Health, 5.00%, 2/15/15,
(FGIC Insured) | | | 1,245,000 | | | 1,291,102 | |
New York State Dormitory Authority Revenue,
New York Presbyterian Hospital, 5.50%,
8/1/10, (AMBAC Insured) | | | 750,000 | | | 771,240 | |
New York State Dormitory Authority Revenue,
New York University, 5.50%, 7/1/18,
(AMBAC Insured) | | | 500,000 | | | 535,165 | |
New York State Dormitory Authority Revenue,
NYSARC, Inc., 5.25%, 7/1/18, (FSA
Insured), Callable 7/1/12 @ 101 | | | 1,460,000 | | | 1,504,939 | |
New York State Dormitory Authority Revenue,
Rockefeller University, 5.25%, 7/1/13,
Callable 7/1/09 @ 100.50 | | | 500,000 | | | 506,030 | |
New York State Dormitory Authority Revenue,
Sloan Kettering Institute, 5.50%, 7/1/23,
(MBIA Insured) | | | 1,300,000 | | | 1,292,135 | |
New York State Dormitory Authority Revenue,
St. Johns University, 5.00%, 7/1/24, (MBIA
Insured), Callable 7/1/17 @ 100 | | | 1,000,000 | | | 921,210 | |
New York State Dormitory Authority Revenue,
State Personal Income Tax Revenue, 5.00%,
3/15/23, Callable 3/15/15 @ 100 | | | 1,000,000 | | | 995,890 | |
New York State Dormitory Authority Revenue,
University of Rochester, 5.00%, 7/1/22,
Callable 1/1/17 @100 | | | 500,000 | | | 487,405 | |
New York State Environmental Facilities Corp.,
5.70%, 1/15/14, Callable 7/15/09 @ 101 | | | 415,000 | | | 427,317 | |
New York State Environmental Facilities
Corp., 5.70%, 1/15/14, Pre-refunded
7/15/09 @ 101 | | | 15,000 | | | 15,590 | |
New York State Mortgage Agency Revenue,
5.60%, 10/1/14, AMT, Callable
11/24/08 @ 100.75 | | | 1,000,000 | | | 1,000,020 | |
New York State Municipal Bond Bank
Revenue, 5.50%, 12/1/12 | | | 850,000 | | | 902,989 | |
New York State Thruway Authority Revenue,
Personal Income Tax Revenue, 5.00%,
3/15/21, (MBIA Insured), Callable
3/15/13 @ 100 | | | 500,000 | | | 498,600 | |
New York State Thruway Authority Revenue,
Second General Highway & Bridge, 5.00%,
4/1/22, (MBIA Insured), Callable
4/1/14 @ 100 | | | 1,000,000 | | | 992,240 | |
New York State Urban Development Corp.
Revenue, 5.75%, 4/1/12 | | | 500,000 | | | 533,590 | |
New York State Urban Development Corp.
Revenue, 5.00%, 3/15/21, (FSA Insured),
Callable 3/15/15 @100 | | | 1,000,000 | | | 1,001,020 | |
| | |
See notes to financial statements. | HSBC INVESTOR FAMILY OF FUNDS | 24 |
|
HSBC INVESTOR NEW YORK TAX-FREE BOND FUND |
|
Schedule of Portfolio Investments—as of October 31, 2008 (continued) |
| | | | | | | |
Municipal Bonds, continued | | | | | | | |
|
| | | | | | | |
| | Shares or
Principal
Amount ($) | | Value ($) | |
| |
| |
| |
New York, continued | | | | | | | |
New York State Urban Development Corp.
Revenue, 5.13%, 1/1/22, Callable
7/1/14 @ 100 | | | 885,000 | | | 870,389 | |
New York State Urban Development Corp.
Revenue, 5.13%, 1/1/25, Pre-refunded
1/1/11 @ 100 | | | 175,000 | | | 183,565 | |
Onondaga County, Water Authority Revenue,
5.00%, 9/15/14, (FSA Insured), Callable
9/15/10 @ 101 | | | 300,000 | | | 312,495 | |
Onondaga County, Water Authority Revenue,
5.00%, 9/15/15, (FSA Insured), Callable
9/15/10 @ 101 | | | 665,000 | | | 690,516 | |
Port Authority of New York & New Jersey
Revenue, 5.00%, 9/1/27, Callable
9/1/13 @ 100 | | | 795,000 | | | 764,909 | |
Port Authority of New York & New Jersey
Revenue, 5.38%, 3/1/28 | | | 1,100,000 | | | 1,078,583 | |
Port Authority of New York & New Jersey
Special Obligation Revenue, 5.75%,
12/1/22, AMT, (MBIA Insured), Callable
12/1/08 @ 101 | | | 500,000 | | | 442,110 | |
Suffolk County, New York GO, 5.25%, 5/1/12,
(FSA Insured) | | | 515,000 | | | 549,520 | |
Suffolk County, New York GO, 5.25%, 5/1/15,
(FSA Insured) | | | 100,000 | | | 107,822 | |
Syracuse Industrial Development Agency
Revenue, 5.00%, 1/1/36, AMT, (XLCA
Insured), Callable 1/1/17 @ 100 | | | 1,000,000 | | | 723,340 | |
Tobacco Settlement Financing Corp., 5.50%,
6/1/21, Callable 6/1/13 @ 100 | | | 1,000,000 | | | 982,160 | |
Webster, Central School District GO, 5.00%,
6/15/14, (FSA Insured) | | | 500,000 | | | 532,285 | |
Yonkers, New York, 5.00%, 12/1/14, (MBIA
Insured) | | | 750,000 | | | 789,210 | |
| | | | |
|
| |
| | | | | | 40,719,790 | |
| | | | |
|
| |
Puerto Rico – 9.9% | | | | | | | |
Puerto Rico Commonwealth, Highway &
Transportation Authority Grant Antic
Revenue, 5.00%, 9/15/17, (MBIA Insured),
Callable 3/15/14 @ 100 | | | 1,000,000 | | | 1,013,900 | |
Puerto Rico Electric Power Authority Power
Revenue, 5.25%, 7/1/22, (MBIA Insured) | | | 1,000,000 | | | 921,870 | |
Puerto Rico Municipal Finance Agency
Revenue, 5.00%, 8/1/12 (Commonwealth
Guranteed) | | | 995,000 | | | 1,001,915 | |
Puerto Rico Public Buildings Authority
Revenue, 5.25%, 7/1/33, (Commonwealth
Guaranteed), Pre-refunded 7/1/14 @ 100 | | | 10,000 | | | 10,643 | |
Puerto Rico Public Buildings Authority
Revenue, 5.25%, 7/1/33, (Commonwealth
Guaranteed), Callable 7/1/14 @ 100 | | | 690,000 | | | 577,979 | |
Puerto Rico Public Finance Corp. Revenue,
5.25%, 8/1/29, (MBIA Insured), Callable
7/1/10 @ 101 | | | 1,000,000 | | | 983,680 | |
| | | | |
|
| |
| | | | | | 4,509,987 | |
| | | | |
|
| |
TOTAL MUNICIPAL BONDS
(COST $46,957,909) | | | | | | 45,229,777 | |
| | | | |
|
| |
| | | | | | | |
Investment Company – 0.0% | | | | | | | |
|
| | | | | | | |
| | Shares or
Principal
Amount ($) | | Value ($) | |
| |
| |
| |
BlackRock Liquidity New York Money Fund,
Portfolio Institutional Shares, 1.51% (a) | | | 1 | | | 1 | |
| | | | |
|
| |
TOTAL INVESTMENT COMPANY
(COST $1) | | | | | | 1 | |
| | | | |
|
| |
TOTAL INVESTMENTS
(COST $46,957,910) — 99.6% | | | | | | 45,229,778 | |
| | | | |
|
| |
Percentages indicated are based on net assets of $45,412,769.
| |
(a) | The rates presented represent the annualized one day yield that was in effect on October 31, 2008. |
| |
AMBAC | — American Municipal Bond Assurance Corp. |
AMT | — Interest on security is subject to federal alternative minimum tax |
FGIC | — Financial Guaranty Insurance Co. |
FSA | — Financial Security Assurance |
GO | — General Obligation |
IDA | — Industrial Development Agency |
MBIA | — Municipal Bond Insurance Association |
XLCA | — XL Capital Assurance |
| | |
25 | HSBC INVESTOR FAMILY OF FUNDS | See notes to financial statements. |
|
HSBC INVESTOR MID-CAP FUND |
|
Schedule of Portfolio Investments—as of October 31, 2008 |
| | | | | | | |
Common Stocks – 97.2% | | | | | | | |
|
|
|
|
|
|
|
|
| | | | | | | |
| | Shares | | Value($) | |
| |
| |
| |
Aerospace & Defense – 1.5% | | | | | | | |
L-3 Communications Holdings, Inc. | | | 3,150 | | | 255,686 | |
| | | | |
|
| |
Agricultural Chemicals – 2.0% | | | | | | | |
Compass Minerals International, Inc. | | | 5,950 | | | 326,834 | |
| | | | |
|
| |
Banking – 2.5% | | | | | | | |
HDFC Bank Ltd. ADR | | | 1,225 | | | 80,360 | |
M&T Bank Corp. | | | 1,700 | | | 137,870 | |
New York Community Bancorp, Inc. | | | 6,400 | | | 100,224 | |
Signature Bank (a) | | | 2,800 | | | 91,224 | |
| | | | |
|
| |
| | | | | | 409,678 | |
| | | | |
|
| |
Biotechnology – 1.5% | | | | | | | |
BioMarin Pharmaceuticals, Inc. (a) | | | 13,550 | | | 248,236 | |
| | | | |
|
| |
Business Services – 1.7% | | | | | | | |
Fiserv, Inc. (a) | | | 5,150 | | | 171,804 | |
Morningstar, Inc. (a) | | | 2,950 | | | 110,448 | |
| | | | |
|
| |
| | | | | | 282,252 | |
| | | | |
|
| |
Chemicals – 5.2% | | | | | | | |
Airgas, Inc. | | | 9,100 | | | 349,076 | |
FMC Corp. | | | 6,650 | | | 289,541 | |
Praxair, Inc. | | | 3,425 | | | 223,139 | |
| | | | |
|
| |
| | | | | | 861,756 | |
| | | | |
|
| |
Commercial Services – 3.2% | | | | | | | |
Aaron Rents, Inc. | | | 4,200 | | | 104,118 | |
IHS, Inc., Class A (a) | | | 5,600 | | | 198,184 | |
Ritchie Brothers Auctioneers, Inc. ADR | | | 12,225 | | | 227,018 | |
| | | | |
|
| |
| | | | | | 529,320 | |
| | | | |
|
| |
Communications – 1.7% | | | | | | | |
CommScope, Inc. (a) | | | 9,350 | | | 137,539 | |
Discovery Communications, Inc., Class A (a) | | | 5,200 | | | 70,928 | |
Discovery Communications, Inc., Class C (a) | | | 5,600 | | | 74,592 | |
| | | | |
|
| |
| | | | | | 283,059 | |
| | | | |
|
| |
Computer Services – 1.6% | | | | | | | |
Cognizant Technology Solutions Corp. (a) | | | 8,875 | | | 170,400 | |
FactSet Research Systems, Inc. | | | 2,500 | | | 96,975 | |
| | | | |
|
| |
| | | | | | 267,375 | |
| | | | |
|
| |
Computer Software – 3.7% | | | | | | | |
Akamai Technologies, Inc. (a) | | | 5,100 | | | 73,338 | |
MICROS Systems, Inc. (a) | | | 7,500 | | | 127,725 | |
Solera Holdings, Inc. (a) | | | 9,250 | | | 230,232 | |
Sybase, Inc. (a) | | | 6,600 | | | 175,758 | |
| | | | |
|
| |
| | | | | | 607,053 | |
| | | | |
|
| |
Computers – 0.6% | | | | | | | |
Logitech International S.A. (a) | | | 7,150 | | | 105,749 | |
| | | | |
|
| |
Consumer Products – 4.6% | | | | | | | |
Church & Dwight Co., Inc. | | | 6,150 | | | 363,403 | |
Gildan Activewear, Inc. (a) | | | 10,325 | | | 241,192 | |
Tupperware Brands Corp. | | | 6,600 | | | 166,980 | |
| | | | |
|
| |
| | | | | | 771,575 | |
| | | | |
|
| |
| | | | | | | |
Common Stocks, continued | | | | | | | |
|
|
|
|
|
|
|
|
| | | | | | | |
| | Shares | | Value($) | |
| |
| |
| |
Correctional Institutions – 1.6% | | | | | | | |
Corrections Corp. of America (a) | | | 14,325 | | | 273,751 | |
| | | | |
|
| |
Distribution & Wholesale – 1.4% | | | | | | | |
LKQ Corp. (a) | | | 20,775 | | | 237,666 | |
| | | | |
|
| |
Education – 1.0% | | | | | | | |
New Oriental Education & Technology Group,
Inc. ADR (a) | | | 2,700 | | | 172,665 | |
| | | | |
|
| |
Electronic Components & Semiconductors – 3.3% | | | | | | | |
American Superconductor Corp. (a) | | | 4,850 | | | 60,673 | |
Diodes, Inc. (a) | | | 7,450 | | | 73,606 | |
Itron, Inc. (a) | | | 4,100 | | | 198,768 | |
Microchip Technology, Inc. | | | 9,000 | | | 221,670 | |
| | | | |
|
| |
| | | | | | 554,717 | |
| | | | |
|
| |
Energy – 1.6% | | | | | | | |
Core Laboratories N.V. | | | 2,925 | | | 215,573 | |
Foundation Coal Holdings, Inc. | | | 2,250 | | | 46,710 | |
| | | | |
|
| |
| | | | | | 262,283 | |
| | | | |
|
| |
Environmental Services – 1.8% | | | | | | | |
Stericycle, Inc. (a) | | | 5,125 | | | 299,454 | |
| | | | |
|
| |
Financial Services – 6.6% | | | | | | | |
Affiliated Managers Group, Inc. (a) | | | 3,950 | | | 183,201 | |
Alliance Data Systems Corp. (a) | | | 3,650 | | | 183,084 | |
Annaly Capital Management, Inc. | | | 24,100 | | | 334,990 | |
BlackRock, Inc. | | | 850 | | | 111,639 | |
CME Group, Inc. | | | 450 | | | 126,967 | |
Eaton Vance Corp. | | | 7,275 | | | 160,050 | |
| | | | |
|
| |
| | | | | | 1,099,931 | |
| | | | |
|
| |
Food & Beverage – 2.9% | | | | | | | |
Central European Distribution Corp. (a) | | | 8,075 | | | 232,479 | |
Flowers Foods, Inc. | | | 8,325 | | | 246,836 | |
| | | | |
|
| |
| | | | | | 479,315 | |
| | | | |
|
| |
Health Care – 11.6% | | | | | | | |
Cepheid, Inc. (a) | | | 10,100 | | | 119,887 | |
DaVita, Inc. (a) | | | 3,700 | | | 209,975 | |
Express Scripts, Inc. (a) | | | 2,925 | | | 177,284 | |
Haemonetics Corp. (a) | | | 4,200 | | | 248,052 | |
Hologic, Inc. (a) | | | 5,976 | | | 73,146 | |
Laboratory Corp. of America Holdings (a) | | | 3,675 | | | 225,976 | |
Psychiatric Solutions, Inc. (a) | | | 8,875 | | | 295,449 | |
ResMed, Inc. (a) | | | 6,000 | | | 205,560 | |
Techne Corp. | | | 925 | | | 63,843 | |
VCA Antech, Inc. (a) | | | 1,925 | | | 34,843 | |
West Pharmaceutical Services, Inc. | | | 6,800 | | | 271,456 | |
| | | | |
|
| |
| | | | | | 1,925,471 | |
| | | | |
|
| |
Industrial Manufacturing – 2.5% | | | | | | | |
Interface, Inc., Class A | | | 4,200 | | | 29,610 | |
Lincoln Electric Holdings, Inc. | | | 1,700 | | | 73,355 | |
Snap-on, Inc. | | | 2,450 | | | 90,528 | |
Valmont Industries, Inc. | | | 4,200 | | | 230,076 | |
| | | | |
|
| |
| | | | | | 423,569 | |
| | | | |
|
| |
| | |
See notes to financial statements. | HSBC INVESTOR FAMILY OF FUNDS | 26 |
|
HSBC INVESTOR MID-CAP FUND |
|
Schedule of Portfolio Investments—as of October 31, 2008 (continued) |
| | | | | | | |
Common Stocks, continued | | | | | | | |
|
|
|
|
|
|
|
|
| | | | | | | |
| | Shares | | Value($) | |
| |
| |
| |
Insurance – 4.3% | | | | | | | |
Assurant, Inc. | | | 4,900 | | | 124,852 | |
Axis Capital Holdings Ltd. | | | 10,150 | | | 289,072 | |
Proassurance Corp. (a) | | | 5,550 | | | 304,972 | |
| | | | |
|
| |
| | | | | | 718,896 | |
| | | | |
|
| |
Machinery – 1.5% | | | | | | | |
AGCO Corp. (a) | | | 2,100 | | | 66,192 | |
Flowserve Corp. | | | 3,250 | | | 184,990 | |
| | | | |
|
| |
| | | | | | 251,182 | |
| | | | |
|
| |
Metal Processors & Fabrication – 1.0% | | | | | | | |
Carpenter Technology Corp. | | | 4,900 | | | 88,690 | |
Kaydon Corp. | | | 2,200 | | | 73,502 | |
| | | | |
|
| |
| | | | | | 162,192 | |
| | | | |
|
| |
Oil & Gas – 4.5% | | | | | | | |
Arena Resources, Inc. (a) | | | 3,300 | | | 100,584 | |
Atlas America, Inc. | | | 7,562 | | | 173,245 | |
Denbury Resources, Inc. (a) | | | 5,300 | | | 67,363 | |
Enbridge, Inc. | | | 3,100 | | | 107,260 | |
Oceaneering International, Inc. (a) | | | 4,550 | | | 128,174 | |
Oil States International, Inc. (a) | | | 4,425 | | | 102,350 | |
Southwestern Energy Co. (a) | | | 1,900 | | | 67,678 | |
| | | | |
|
| |
| | | | | | 746,654 | |
| | | | |
|
| |
Real Estate – 3.8% | | | | | | | |
Alexandria Real Estate Equities, Inc. | | | 2,700 | | | 187,704 | |
Digital Realty Trust, Inc. | | | 6,550 | | | 219,294 | |
Essex Property Trust, Inc. | | | 2,350 | | | 228,655 | |
| | | | |
|
| |
| | | | | | 635,653 | |
| | | | |
|
| |
Retail – 3.9% | | | | | | | |
Burger King Holdings, Inc. | | | 7,650 | | | 152,082 | |
Guess?, Inc. | | | 4,700 | | | 102,319 | |
Hanesbrands, Inc. (a) | | | 7,950 | | | 138,886 | |
O’Reilly Automotive, Inc. (a) | | | 9,300 | | | 252,123 | |
| | | | |
|
| |
| | | | | | 645,410 | |
| | | | |
|
| |
Specialty Retail – 1.0% | | | | | | | |
GameStop Corp., Class A (a) | | | 6,075 | | | 166,394 | |
| | | | |
|
| |
Telecommunications – 2.3% | | | | | | | |
American Tower Corp., Class A (a) | | | 7,500 | | | 242,325 | |
NII Holdings, Inc. (a) | | | 5,550 | | | 142,968 | |
| | | | |
|
| |
| | | | | | 385,293 | |
| | | | |
|
| |
Transportation – 1.1% | | | | | | | |
Kansas City Southern (a) | | | 6,000 | | | 185,220 | |
| | | | |
|
| |
Utilities – 8.8% | | | | | | | |
Equitable Resources, Inc. | | | 9,475 | | | 328,877 | |
ITC Holdings Corp. | | | 5,675 | | | 230,292 | |
Northeast Utilities | | | 17,125 | | | 386,340 | |
NorthWestern Corp. | | | 11,500 | | | 224,710 | |
Wisconsin Energy Corp. | | | 6,800 | | | 295,800 | |
| | | | |
|
| |
| | | | | | 1,466,019 | |
| | | | |
|
| |
| | | | | | | |
Common Stocks, continued | | | | | | | |
|
|
|
|
|
|
|
|
| | | | | | | |
| | Shares | | Value($) | |
| |
| |
| |
Wire & Cable Products – 0.9% | | | | | | | |
General Cable Corp. (a) | | | 8,950 | | | 152,866 | |
| | | | |
|
| |
TOTAL COMMON STOCKS
(COST $20,018,973) | | | | | | 16,193,174 | |
| | | | |
|
| |
Investment Companies – 2.1% | | | | | | | |
|
|
|
|
|
|
|
|
MidCap S&P Depositary Receipt Trust
Series 1 | | | 1,260 | | | 129,969 | |
Northern Institutional Diversified Assets
Portfolio, Shares Class, 0.82% (b) | | | 213,973 | | | 213,973 | |
| | | | |
|
| |
TOTAL INVESTMENT COMPANIES
(COST $371,247) | | | | | | 343,942 | |
| | | | |
|
| |
TOTAL INVESTMENTS
(COST $20,390,220) — 99.3% | | | | | | 16,537,116 | |
| | | | |
|
| |
| |
|
Percentages indicated are based on net assets of $16,650,794. |
| |
(a) | Represents non-income producing security. |
| |
(b) | The rates presented represent the annualized one day yield that was in effect on October 31, 2008. |
| |
ADR—American Depositary Receipt |
| | |
27 | HSBC INVESTOR FAMILY OF FUNDS | See notes to financial statements. |
[This Page Intentionally Left Blank]
HSBC INVESTOR FAMILY OF FUNDS
Statements of Assets and Liabilities—as of October 31, 2008
| | | | | | | | | | | | | | | | |
| | Core Plus
Fixed Income
Fund
(Advisor) | | Core Plus
Fixed Income
Fund | | High Yield
Fixed Income
Fund | | Intermediate
Duration
Fixed Income
Fund | | New York
Tax-Free
Bond Fund | |
|
Assets: | | | | | | | | | | | | | | | | |
Investments in Affiliated Portfolios | | $ | 56,002,871 | | $ | 10,647,948 | | $ | 6,209,199 | | $ | 12,876,912 | | $ | — | |
Investments in non-affiliates, at value | | | — | | | — | | | — | | | — | | | 45,229,778 | |
Interest and dividends receivable | | | — | | | — | | | — | | | — | | | 753,658 | |
Receivable for capital shares issued | | | 230,084 | | | 57,502 | | | 47,679 | | | 54,804 | | | 113,748 | |
Receivable for investments sold | | | — | | | — | | | — | | | — | | | 3,096,310 | |
Receivable from Investment Adviser | | | 16,049 | | | 10,220 | | | 16,034 | | | 13,213 | | | — | |
Prepaid expenses and other assets | | | 5,595 | | | 4,654 | | | 6,417 | | | 653 | | | 3,484 | |
| |
|
| |
|
| |
|
| |
|
| |
|
| |
Total Assets | | | 56,254,599 | | | 10,720,324 | | | 6,279,329 | | | 12,945,582 | | | 49,196,978 | |
| |
|
| |
|
| |
|
| |
|
| |
|
| |
Liabilities: | | | | | | | | | | | | | | | | |
Cash overdraft | | | — | | | — | | | — | | | — | | | 2,588,513 | |
Dividends payable | | | 277,012 | | | 52,252 | | | 61,523 | | | 49,016 | | | 164,213 | |
Payable for capital shares redeemed | | | 1,027,059 | | | 459,260 | | | 77,365 | | | 4,828 | | | 977,645 | |
Accrued expenses and other liabilities: | | | | | | | | | | | | | | | | |
Investment Management | | | — | | | — | | | — | | | — | | | 10,685 | |
Administration | | | 1,035 | | | 207 | | | 114 | | | 222 | | | 1,699 | |
Distribution | | | — | | | 2,452 | | | 1,296 | | | 2,535 | | | 3,601 | |
Shareholder Servicing | | | — | | | 2,616 | | | 970 | | | 712 | | | 7,035 | |
Compliance Service | | | 42 | | | 9 | | | 18 | | | 9 | | | 69 | |
Transfer Agent | | | 9,838 | | | 13,785 | | | 26,815 | | | 11,952 | | | 18,282 | |
Trustee | | | 52 | | | 10 | | | 94 | | | 11 | | | 91 | |
Other | | | 22,045 | | | 2,203 | | | 2,368 | | | 2,553 | | | 12,376 | |
| |
|
| |
|
| |
|
| |
|
| |
|
| |
Total Liabilities | | | 1,337,083 | | | 532,794 | | | 170,563 | | | 71,838 | | | 3,784,209 | |
| |
|
| |
|
| |
|
| |
|
| |
|
| |
Net Assets | | $ | 54,917,516 | | $ | 10,187,530 | | $ | 6,108,766 | | $ | 12,873,744 | | $ | 45,412,769 | |
| |
|
| |
|
| |
|
| |
|
| |
|
| |
| | | | | | | | | | | | | | | | |
Composition of Net Assets: | | | | | | | | | | | | | | | | |
Capital | | $ | 64,317,502 | | $ | 12,753,125 | | $ | 9,257,009 | | $ | 14,505,465 | | $ | 46,988,660 | |
Accumulated net investment income (loss) | | | 52,351 | | | (1,731 | ) | | (8,348 | ) | | 8,733 | | | 359 | |
Accumulated net realized gains (losses) from investment and foreign currency transactions | | | (1,267,891 | ) | | (842,974 | ) | | (326,305 | ) | | (128,676 | ) | | 151,882 | |
Unrealized appreciation/depreciation from investments and foreign currencies | | | (8,184,446 | ) | | (1,720,890 | ) | | (2,813,590 | ) | | (1,511,778 | ) | | (1,728,132 | ) |
| |
|
| |
|
| |
|
| |
|
| |
|
| |
Net Assets | | $ | 54,917,516 | | $ | 10,187,530 | | $ | 6,108,766 | | $ | 12,873,744 | | $ | 45,412,769 | |
| |
|
| |
|
| |
|
| |
|
| |
|
| |
| | | | | | | | | | | | | | | | |
Net Assets: | | | | | | | | | | | | | | | | |
Class A Shares | | $ | — | | $ | 8,370,962 | | $ | 2,208,539 | | $ | 1,645,561 | | $ | 24,362,788 | |
Class B Shares | | | — | | | 1,721,673 | | | 1,484,055 | | | 1,365,279 | | | 4,855,990 | |
Class C Shares | | | — | | | 94,895 | | | 382,259 | | | 221,571 | | | 471,103 | |
Class I Shares | | | 54,917,516 | | | — | | | 2,033,913 | | | 9,641,333 | | | 15,722,888 | |
| |
|
| |
|
| |
|
| |
|
| |
|
| |
| | $ | 54,917,516 | | $ | 10,187,530 | | $ | 6,108,766 | | $ | 12,873,744 | | $ | 45,412,769 | |
| |
|
| |
|
| |
|
| |
|
| |
|
| |
| | | | | | | | | | | | | | | | |
Shares Outstanding ($0.001 par value, unlimited number of shares authorized): | | | | | | | | | | | | | | | | |
Class A Shares | | | — | | | 921,234 | | | 329,308 | | | 184,626 | | | 2,339,609 | |
Class B Shares | | | — | | | 189,256 | | | 221,223 | | | 152,864 | | | 466,793 | |
Class C Shares | | | — | | | 10,463 | | | 56,864 | | | 24,819 | | | 45,101 | |
Class I Shares | | | 6,180,099 | | | — | | | 303,172 | | | 1,080,077 | | | 1,509,786 | |
| | | | | | | | | | | | | | | | |
Net Asset Value, Offering Price and Redemption Price per share: | | | | | | | | | | | | | | | | |
Class A Shares | | $ | — | | $ | 9.09 | | $ | 6.71 | | $ | 8.91 | | $ | 10.41 | |
Class B Shares* | | $ | — | | $ | 9.10 | | $ | 6.71 | | $ | 8.93 | | $ | 10.40 | |
Class C Shares* | | $ | — | | $ | 9.07 | | $ | 6.72 | | $ | 8.93 | | $ | 10.45 | |
Class I Shares | | $ | 8.89 | | $ | — | | $ | 6.71 | | $ | 8.93 | | $ | 10.41 | |
Maximum Sales Charge—Class A Shares | | | — | % | | 4.75 | % | | 4.75 | % | | 4.75 | % | | 4.75 | % |
| |
|
| |
|
| |
|
| |
|
| |
|
| |
Maximum Offering Price per share (Net Asset Value/(100%-maximum sales charge))—Class A Shares | | $ | — | | $ | 9.54 | | $ | 7.04 | | $ | 9.35 | | $ | 10.93 | |
| |
|
| |
|
| |
|
| |
|
| |
|
| |
Total Investments, at cost | | | | | | | | | | | | | | $ | 46,957,910 | |
| | | | | | | | | | | | | |
|
| |
| |
|
* | Redemption Price per share varies by length of time shares are held. |
| | |
29 | HSBC INVESTOR FAMILY OF FUNDS | See notes to financial statements. |
HSBC INVESTOR FAMILY OF FUNDS
Statements of Assets and Liabilities—as of October 31, 2008 (continued)
| | | | | | | | | | | | | | | | |
| | Growth
Fund | | International
Equity Fund | | Mid-Cap
Fund | | Opportunity
Fund | | Opportunity
Fund
(Advisor) | |
|
Assets: | | | | | | | | | | | | | | | | |
Investments in Affiliated Portfolios | | $ | 58,713,698 | | $ | 161,142,487 | | $ | — | | $ | 11,391,447 | | $ | 98,368,674 | |
Investments in non-affiliates, at value | | | — | | | — | | | 16,537,116 | | | — | | | — | |
Interest and dividends receivable | | | — | | | — | | | 3,796 | | | — | | | — | |
Receivable for capital shares issued | | | 350,319 | | | 406,387 | | | 416 | | | 26,664 | | | 332,622 | |
Receivable for investments sold | | | — | | | — | | | 145,553 | | | — | | | — | |
Reclaims receivable | | | — | | | 687,470 | | | — | | | — | | | — | |
Receivable from Investment Adviser | | | — | | | — | | | 4,338 | | | 1,453 | | | — | |
Receivable from fund accounting | | | — | | | 9,195 | | | — | | | — | | | — | |
Prepaid expenses and other assets | | | 31,856 | | | 9,213 | | | 4,585 | | | 3,343 | | | 5,497 | |
| |
|
| |
|
| |
|
| |
|
| |
|
| |
Total Assets | | | 59,095,873 | | | 162,254,752 | | | 16,695,804 | | | 11,422,907 | | | 98,706,793 | |
| |
|
| |
|
| |
|
| |
|
| |
|
| |
Liabilities: | | | | | | | | | | | | | | | | |
Payable for investments purchased | | | — | | | — | | | 6,779 | | | — | | | — | |
Payable for capital shares redeemed | | | 69,547 | | | 1,071,291 | | | 2,381 | | | 36,159 | | | 812,358 | |
Payable to Investment Adviser | | | 15 | | | — | | | — | | | — | | | — | |
Accrued expenses and other liabilities: | | | | | | | | | | | | | | | | |
Administration | | | 1,091 | | | 2,834 | | | 637 | | | 188 | | | 1,626 | |
Distribution | | | 1,964 | | | — | | | 1,459 | | | 1,183 | | | — | |
Shareholder Servicing | | | 4,211 | | | — | | | 1,238 | | | 2,737 | | | — | |
Compliance Service | | | 90 | | | 162 | | | 30 | | | 10 | | | 91 | |
Transfer Agent | | | 44,848 | | | 14,054 | | | 28,142 | | | 15,111 | | | 13,391 | |
Trustee | | | 140 | | | 165 | | | 41 | | | 12 | | | 106 | |
Other | | | 15,645 | | | 112,898 | | | 4,303 | | | 835 | | | 38,648 | |
| |
|
| |
|
| |
|
| |
|
| |
|
| |
Total Liabilities | | | 137,551 | | | 1,201,404 | | | 45,010 | | | 56,235 | | | 866,220 | |
| |
|
| |
|
| |
|
| |
|
| |
|
| |
Net Assets | | $ | 58,958,322 | | $ | 161,053,348 | | $ | 16,650,794 | | $ | 11,366,672 | | $ | 97,840,573 | |
| |
|
| |
|
| |
|
| |
|
| |
|
| |
| | | | | | | | | | | | | | | | |
Composition of Net Assets: | | | | | | | | | | | | | | | | |
Capital | | $ | 73,291,746 | | $ | 246,271,989 | | $ | 19,523,687 | | $ | 13,589,138 | | $ | 119,639,825 | |
Accumulated net investment income (loss) | | | — | | | 6,999,097 | | | — | | | — | | | — | |
Accumulated net realized gains (losses) from investment and foreign currency transactions | | | 153,262 | | | 7,776,606 | | | 980,211 | | | 563,732 | | | 1,938,394 | |
Unrealized appreciation/depreciation from investments and foreign currencies | | | (14,486,686 | ) | | (99,994,344 | ) | | (3,853,104 | ) | | (2,786,198 | ) | | (23,737,646 | ) |
| |
|
| |
|
| |
|
| |
|
| |
|
| |
Net Assets | | $ | 58,958,322 | | $ | 161,053,348 | | $ | 16,650,794 | | $ | 11,366,672 | | $ | 97,840,573 | |
| |
|
| |
|
| |
|
| |
|
| |
|
| |
| | | | | | | | | | | | | | | | |
Net Assets: | | | | | | | | | | | | | | | | |
Class A Shares | | $ | 17,180,191 | | $ | — | | $ | 3,584,190 | | $ | 9,599,877 | | $ | — | |
Class B Shares | | | 2,838,597 | | | — | | | 1,975,212 | | | 1,577,621 | | | — | |
Class C Shares | | | 71,844 | | | — | | | 11,728 | | | 189,174 | | | — | |
Class I Shares | | | 38,867,690 | | | 161,053,348 | | | 11,079,664 | | | — | | | 97,840,573 | |
| |
|
| |
|
| |
|
| |
|
| |
|
| |
| | $ | 58,958,322 | | $ | 161,053,348 | | $ | 16,650,794 | | $ | 11,366,672 | | $ | 97,840,573 | |
| |
|
| |
|
| |
|
| |
|
| |
|
| |
| | | | | | | | | | | | | | | | |
Shares Outstanding ($0.001 par value, unlimited number of shares authorized): | | | | | | | | | | | | | | | | |
Class A Shares | | | 1,627,961 | | | — | | | 666,782 | | | 1,353,197 | | | — | |
Class B Shares | | | 288,322 | | | — | | | 401,518 | | | 258,513 | | | — | |
Class C Shares | | | 7,252 | | | — | | | 2,359 | | | 30,475 | | | — | |
Class I Shares | | | 3,658,165 | | | 15,002,992 | | | 2,009,826 | | | — | | | 10,982,968 | |
| | | | | | | | | | | | | | | | |
Net Asset Value, Offering Price and Redemption Price per share: | | | | | | | | | | | | | | | | |
Class A Shares | | $ | 10.55 | | $ | — | | $ | 5.38 | | $ | 7.09 | | $ | — | |
Class B Shares* | | $ | 9.85 | | $ | — | | $ | 4.92 | | $ | 6.10 | | $ | — | |
Class C Shares* | | $ | 9.91 | | $ | — | | $ | 4.97 | | $ | 6.21 | | $ | — | |
Class I Shares | | $ | 10.62 | | $ | 10.73 | | $ | 5.51 | | $ | — | | $ | 8.91 | |
Maximum Sales Charge—Class A Shares | | | 5.00 | % | | — | % | | 5.00 | % | | 5.00 | % | | — | % |
| |
|
| |
|
| |
|
| |
|
| |
|
| |
Maximum Offering Price per share (Net Asset Value/(100%-maximum sales charge))—Class A Shares | | $ | 11.11 | | $ | — | | $ | 5.66 | | $ | 7.46 | | $ | — | |
| |
|
| |
|
| |
|
| |
|
| |
|
| |
Total Investments, at cost | | | | | | | | $ | 20,390,220 | | | | | | | |
| | | | | | | |
|
| | | | | | | |
| |
|
* | Redemption Price per share varies by length of time shares are held. |
| | |
See notes to financial statements. | HSBC INVESTOR FAMILY OF FUNDS | 30 |
HSBC INVESTOR FAMILY OF FUNDS
Statements of Assets and Liabilities—as of October 31, 2008 (continued)
| | | | | | | |
| | Overseas
Equity Fund | | Value
Fund | |
|
Assets: | | | | | | | |
Investments in Affiliated Portfolios | | $ | 7,691,012 | | $ | 32,797,856 | |
Receivable for capital shares issued | | | 213,474 | | | 703,224 | |
Reclaims receivable | | | 79,297 | | | — | |
Receivable from Investment Adviser | | | 5,008 | | | 6,213 | |
Prepaid expenses and other assets | | | 4,003 | | | 4,970 | |
| |
|
| |
|
| |
Total Assets | | | 7,992,794 | | | 33,512,263 | |
| |
|
| |
|
| |
Liabilities: | | | | | | | |
Payable for capital shares redeemed | | | 19,923 | | | 37,897 | |
Accrued expenses and other liabilities: | | | | | | | |
Administration | | | 120 | | | 508 | |
Distribution | | | 953 | | | 541 | |
Shareholder Servicing | | | 1,566 | | | 3,009 | |
Compliance Service | | | 7 | | | 77 | |
Transfer Agent | | | 17,049 | | | 19,164 | |
Trustee | | | 7 | | | 34 | |
Other | | | 1,347 | | | 7,136 | |
| |
|
| |
|
| |
Total Liabilities | | | 40,972 | | | 68,366 | |
| |
|
| |
|
| |
Net Assets | | $ | 7,951,822 | | $ | 33,443,897 | |
| |
|
| |
|
| |
| | | | | | | |
Composition of Net Assets: | | | | | | | |
Capital | | $ | 7,865,856 | | $ | 45,974,828 | |
Accumulated net investment income | | | 439,713 | | | 126,892 | |
Accumulated net realized gains (losses) from investment and foreign currency transactions | | | 3,530,018 | | | (4,487,231 | ) |
Unrealized appreciation/depreciation from investments and foreign currencies | | | (3,883,765 | ) | | (8,170,592 | ) |
| |
|
| |
|
| |
Net Assets | | $ | 7,951,822 | | $ | 33,443,897 | |
| |
|
| |
|
| |
| | | | | | | |
Net Assets: | | | | | | | |
Class A Shares | | $ | 6,644,634 | | $ | 14,881,281 | |
Class B Shares | | | 1,248,777 | | | 717,293 | |
Class C Shares | | | 58,411 | | | 66,490 | |
Class I Shares | | | — | | | 17,778,833 | |
| |
|
| |
|
| |
| | $ | 7,951,822 | | $ | 33,443,897 | |
| |
|
| |
|
| |
| | | | | | | |
Shares Outstanding ($0.001 par value, unlimited number of shares authorized): | | | | | | | |
Class A Shares | | | 846,173 | | | 1,664,824 | |
Class B Shares | | | 169,668 | | | 84,116 | |
Class C Shares | | | 7,679 | | | 7,735 | |
Class I Shares | | | — | | | 1,991,467 | |
| | | | | | | |
Net Asset Value, Offering Price and Redemption Price per share: | | | | | | | |
Class A Shares | | $ | 7.85 | | $ | 8.94 | |
Class B Shares | | $ | 7.36 | | $ | 8.53 | |
Class C Shares | | $ | 7.61 | | $ | 8.60 | |
Class I Shares | | $ | — | | $ | 8.93 | |
Maximum Sales Charge—Class A Shares | | | 5.00 | % | | 5.00 | % |
| |
|
| |
|
| |
Maximum Offering Price per share (Net Asset Value/(100%-maximum sales charge))—Class A Shares | | $ | 8.26 | | $ | 9.41 | |
| |
|
| |
|
| |
| |
|
* | Redemption Price per share varies by length of time shares are held. |
| | |
31 | HSBC INVESTOR FAMILY OF FUNDS | See notes to financial statements. |
HSBC INVESTOR FAMILY OF FUNDS
Statements of Operations—For the year ended October 31, 2008
| | | | | | | | | | | | | | | | |
| | Core Plus
Fixed Income
Fund
(Advisor) | | Core Plus
Fixed Income
Fund | | High Yield
Fixed Income
Fund | | Intermediate
Duration
Fixed Income
Fund | | New York
Tax-Free
Bond Fund | |
|
Investment Income: | | | | | | | | | | | | | | | | |
Interest | | $ | — | | $ | — | | $ | — | | $ | — | | $ | 2,517,550 | |
Dividends | | | — | | | — | | | — | | | — | | | 31,355 | |
Investment Income from Affiliated Portfolios (a) | | | 3,784,559 | | | 830,896 | | | 800,064 | | | 690,989 | | | — | |
Expenses from Affiliated Portfolios (a) | | | (413,847 | ) | | (90,730 | ) | | (107,914 | ) | | (123,953 | ) | | — | |
| |
|
| |
|
| |
|
| |
|
| |
|
| |
Total Investment Income (Loss) | | | 3,370,712 | | | 740,166 | | | 692,150 | | | 567,036 | | | 2,548,905 | |
| |
|
| |
|
| |
|
| |
|
| |
|
| |
| | | | | | | | | | | | | | | | |
Expenses: | | | | | | | | | | | | | | | | |
Investment Management | | | — | | | — | | | — | | | — | | | 145,190 | |
Administration | | | 15,018 | | | 3,293 | | | 1,830 | | | 2,920 | | | 24,182 | |
Distribution: | | | | | | | | | | | | | | | | |
Class B Shares | | | — | | | 20,976 | | | 16,265 | | | 16,261 | | | 49,872 | |
Class C Shares | | | — | | | 726 | | | 2,774 | | | 2,030 | | | 4,191 | |
Shareholder Servicing: | | | | | | | | | | | | | | | | |
Class A Shares | | | — | | | 31,102 | | | 8,360 | | | 3,126 | | | 77,322 | |
Class B Shares | | | — | | | 6,992 | | | 5,422 | | | 5,421 | | | 16,624 | |
Class C Shares | | | — | | | 242 | | | 925 | | | 677 | | | 1,397 | |
Accounting | | | 9,001 | | | 18,999 | | | 24,001 | | | 24,000 | | | 73,345 | |
Compliance Service | | | 284 | | | 62 | | | 48 | | | 52 | | | 454 | |
Custodian | | | — | | | — | | | — | | | — | | | 3,487 | |
Printing | | | 15,662 | | | 8,223 | | | 4,636 | | | 6,379 | | | 18,661 | |
Professional fees | | | 1,862 | | | 388 | | | 808 | | | 328 | | | 2,124 | |
Transfer Agent | | | 29,351 | | | 52,856 | | | 66,205 | | | 43,463 | | | 58,258 | |
Trustee | | | 1,022 | | | 222 | | | 182 | | | 191 | | | 1,677 | |
Registration fees | | | — | | | 153 | | | 405 | | | 1 | | | 545 | |
Other | | | 14,531 | | | 9,573 | | | 14,989 | | | 5,314 | | | 12,348 | |
| |
|
| |
|
| |
|
| |
|
| |
|
| |
Total expenses before fee reductions | | | 86,731 | | | 153,807 | | | 146,850 | | | 110,163 | | | 489,677 | |
Fees reduced by Investment Adviser | | | (185,877 | ) | | (115,741 | ) | | (174,018 | ) | | (152,071 | ) | | — | |
| |
|
| |
|
| |
|
| |
|
| |
|
| |
Net Expenses (Recoveries) | | | (99,146 | ) | | 38,066 | | | (27,168 | ) | | (41,908 | ) | | 489,677 | |
| |
|
| |
|
| |
|
| |
|
| |
|
| |
|
Net Investment Income (Loss) | | | 3,469,858 | | | 702,100 | | | 719,318 | | | 608,944 | | | 2,059,228 | |
| |
|
| |
|
| |
|
| |
|
| |
|
| |
| | | | | | | | | | | | | | | | |
Net Realized/Unrealized Gains (Losses) from Investments: (a) | | | | | | | | | | | | | | | | |
Net realized gains (losses) from investments and foreign currency transactions | | | (1,184,807 | ) | | (265,253 | ) | | (326,305 | ) | | (127,295 | ) | | 151,884 | |
Change in unrealized appreciation/depreciation from investments and foreign currencies | | | (8,103,005 | ) | | (1,704,210 | ) | | (2,715,493 | ) | | (1,432,619 | ) | | (3,382,762 | ) |
| |
|
| |
|
| |
|
| |
|
| |
|
| |
Net realized/unrealized gains (losses) from investments and foreign currency transactions | | | (9,287,812 | ) | | (1,969,463 | ) | | (3,041,798 | ) | | (1,559,914 | ) | | (3,230,878 | ) |
| |
|
| |
|
| |
|
| |
|
| |
|
| |
Change In Net Assets Resulting From Operations | | $ | (5,817,954 | ) | $ | (1,267,363 | ) | $ | (2,322,480 | ) | $ | (950,970 | ) | $ | (1,171,650 | ) |
| |
|
| |
|
| |
|
| |
|
| |
|
| |
| |
|
(a) | With the exception of the New York Tax-Free Bond Fund, represents amounts allocated from the respective Affiliated Portfolios. |
| | |
See notes to financial statements. | HSBC INVESTOR FAMILY OF FUNDS | 32 |
HSBC INVESTOR FAMILY OF FUNDS
Statements of Operations—For the year ended October 31, 2008 (continued)
| | | | | | | | | | | | | | | | |
| | Growth
Fund | | International
Equity Fund | | Mid-Cap
Fund | | Opportunity
Fund | | Opportunity
Fund
(Advisor) | |
|
Investment Income: | | | | | | | | | | | | | | | | |
Dividends | | $ | — | | $ | — | | $ | 250,305 | | $ | — | | $ | — | |
Investment Income from Affiliated Portfolios (a) | | | 437,346 | | | 11,567,506 | | | — | | | 69,378 | | | 601,337 | |
Tax reclaims (a) | | | — | | | 353,549 | | | — | | | — | | | — | |
Foreign tax withholding from Affiliated Portfolios (a) | | | — | | | (1,579,349 | ) | | — | | | — | | | — | |
Expenses from Affiliated Portfolios (a) | | | (334,301 | ) | | (2,233,554 | ) | | — | | | (146,284 | ) | | (1,265,289 | ) |
| |
|
| |
|
| |
|
| |
|
| |
|
| |
Total Investment Income (Loss) | | | 103,045 | | | 8,108,152 | | | 250,305 | | | (76,906 | ) | | (663,952 | ) |
| |
|
| |
|
| |
|
| |
|
| |
|
| |
| | | | | | | | | | | | | | | | |
Expenses: | | | | | | | | | | | | | | | | |
Investment Management | | | — | | | — | | | 193,406 | | | — | | | — | |
Administration | | | 11,585 | | | 62,887 | | | 10,801 | | | 3,571 | | | 30,962 | |
Distribution: | | | | | | | | | | | | | | | | |
Class B Shares | | | 11,556 | | | — | | | 31,509 | | | 25,856 | | | — | |
Class C Shares | | | 618 | | | — | | | 350 | | | 2,241 | | | — | |
Shareholder Servicing: | | | | | | | | | | | | | | | | |
Class A Shares | | | 60,327 | | | — | | | 12,595 | | | 32,456 | | | — | |
Class B Shares | | | 3,852 | | | — | | | 10,503 | | | 8,619 | | | — | |
Class C Shares | | | 206 | | | — | | | 117 | | | 747 | | | — | |
Accounting | | | 33,000 | | | 9,001 | | | 64,806 | | | 18,999 | | | 9,001 | |
Compliance Service | | | 267 | | | 1,218 | | | 202 | | | 67 | | | 507 | |
Custodian | | | — | | | — | | | 12,768 | | | — | | | — | |
Printing | | | 28,949 | | | 79,312 | | | 14,147 | | | 8,741 | | | 33,099 | |
Professional fees | | | 1,663 | | | 6,627 | | | 836 | | | 490 | | | 3,543 | |
Transfer Agent | | | 94,520 | | | 35,183 | | | 86,764 | | | 73,880 | | | 39,571 | |
Trustee | | | 766 | | | 4,398 | | | 766 | | | 245 | | | 1,911 | |
Registration fees | | | 598 | | | — | | | — | | | 51 | | | — | |
Other | | | 15,939 | | | 31,863 | | | 11,588 | | | 10,855 | | | 16,596 | |
| |
|
| |
|
| |
|
| |
|
| |
|
| |
Total expenses before fee reductions | | | 263,846 | | | 230,489 | | | 451,158 | | | 186,818 | | | 135,190 | |
Fees reduced by Investment Adviser | | | (7,580 | ) | | — | | | (113,243 | ) | | (46,330 | ) | | — | |
| |
|
| |
|
| |
|
| |
|
| |
|
| |
Net Expenses | | | 256,266 | | | 230,489 | | | 337,915 | | | 140,488 | | | 135,190 | |
| |
|
| |
|
| |
|
| |
|
| |
|
| |
|
Net Investment Income (Loss) | | | (153,221 | ) | | 7,877,663 | | | (87,610 | ) | | (217,394 | ) | | (799,142 | ) |
| |
|
| |
|
| |
|
| |
|
| |
|
| |
Net Realized/Unrealized Gains (Losses) from Investments: (a) | | | | | | | | | | | | | | | | |
Net realized gains from investments and foreign currency transactions | | | 182,222 | | | 7,880,059 | | | 1,072,890 | | | 619,272 | | | 2,335,993 | |
Change in unrealized appreciation/depreciation from investments and foreign currencies | | | (30,016,810 | ) | | (201,336,999 | ) | | (14,339,743 | ) | | (7,169,941 | ) | | (57,458,069 | ) |
| |
|
| |
|
| |
|
| |
|
| |
|
| |
|
Net realized/unrealized gains from investments and foreign currency transactions | | | (29,834,588 | ) | | (193,456,940 | ) | | (13,266,853 | ) | | (6,550,669 | ) | | (55,122,076 | ) |
| |
|
| |
|
| |
|
| |
|
| |
|
| |
Change In Net Assets Resulting From Operations | | $ | (29,987,809 | ) | $ | (185,579,277 | ) | $ | (13,354,463 | ) | $ | (6,768,063 | ) | $ | (55,921,218 | ) |
| |
|
| |
|
| |
|
| |
|
| |
|
| |
| |
|
(a) | With the exception of the Mid-Cap Fund, represents amounts allocated from the respective Affiliated Portfolios. |
| | |
33 | HSBC INVESTOR FAMILY OF FUNDS | See notes to financial statements. |
HSBC INVESTOR FAMILY OF FUNDS
Statements of Operations—For the year ended October 31, 2008 (continued)
| | | | | | | |
| | Overseas
Equity Fund | | Value
Fund | |
|
Investment Income: | | | | | | | |
Investment Income from Affiliated Portfolios (a) | | $ | 519,883 | | $ | 1,012,973 | |
Tax reclaims (a) | | | 15,101 | | | — | |
Foreign tax withholding from Affiliated Portfolios (a) | | | (70,422 | ) | | — | |
Expenses from Affiliated Portfolios (a) | | | (102,517 | ) | | (298,059 | ) |
| |
|
| |
|
| |
Total Investment Income (Loss) | | | 362,045 | | | 714,914 | |
| |
|
| |
|
| |
| | | | | | | |
Expenses: | | | | | | | |
Administration | | | 2,898 | | | 9,927 | |
Distribution: | | | | | | | |
Class B Shares | | | 19,288 | | | 9,791 | |
Class C Shares | | | 839 | | | 749 | |
Shareholder Servicing: | | | | | | | |
Class A Shares | | | 26,957 | | | 51,791 | |
Class B Shares | | | 6,429 | | | 3,264 | |
Class C Shares | | | 280 | | | 250 | |
Accounting | | | 18,999 | | | 24,000 | |
Compliance Service | | | 54 | | | 233 | |
Printing | | | 7,115 | | | 18,582 | |
Professional fees | | | 325 | | | 1,081 | |
Transfer Agent | | | 66,222 | | | 83,523 | |
Trustee | | | 202 | | | 677 | |
Registration fees | | | — | | | 467 | |
Other | | | 11,155 | | | 15,491 | |
| |
|
| |
|
| |
Total expenses before fee reductions | | | 160,763 | | | 219,826 | |
Fees reduced by Investment Adviser | | | (14,985 | ) | | (13,116 | ) |
| |
|
| |
|
| |
Net Expenses | | | 145,778 | | | 206,710 | |
| |
|
| |
|
| |
Net Investment Income (Loss) | | | 216,267 | | | 508,204 | |
| |
|
| |
|
| |
| | | | | | | |
Net Realized/Unrealized Gains (Losses) from Investments: | | | | | | | |
Net realized gains (losses) from investments and foreign currency transactions | | | 3,797,400 | | | (4,675,106 | ) |
Change in unrealized appreciation/depreciation from investments and foreign currencies | | | (12,419,361 | ) | | (17,328,757 | ) |
| |
|
| |
|
| |
Net realized/unrealized gains from investments and foreign currency transactions | | | (8,621,961 | ) | | (22,003,863 | ) |
| |
|
| |
|
| |
Change In Net Assets Resulting From Operations | | $ | (8,405,694 | ) | $ | (21,495,659 | ) |
| |
|
| |
|
| |
| |
|
(a) | Represents amounts allocated from the respective Affiliated Portfolios. |
| | |
See notes to financial statements. | HSBC INVESTOR FAMILY OF FUNDS | 34 |
HSBC INVESTOR FAMILY OF FUNDS
Statements of Changes in Net Assets
| | | | | | | | | | | | | |
| | Core Plus
Fixed Income Fund (Advisor) | | Core Plus Fixed
Income Fund | |
|
| | For the year
ended
October 31,
2008 | | For the year
ended
October 31,
2007 | | For the year
ended
October 31,
2008 | | For the year
ended
October 31,
2007 | |
|
Investment Activities: | | | | | | | | | | | | | |
Operations: | | | | | | | | | | | | | |
Net investment income (loss) | | $ | 3,469,858 | | $ | 4,349,066 | | $ | 702,100 | | $ | 875,944 | |
Net realized gains (losses) from investments transactions | | | (1,184,807 | ) | | 2,097,739 | | | (265,253 | ) | | 433,571 | |
Change in unrealized appreciation/depreciation from investments and foreign currencies | | | (8,103,005 | ) | | (740,498 | ) | | (1,704,210 | ) | | (152,977 | ) |
| |
|
| |
|
| |
|
| |
|
| |
| | | | | | | | | | | | | |
Change in net assets resulting from operations | | | (5,817,954 | ) | | 5,706,307 | | | (1,267,363 | ) | | 1,156,538 | |
| |
|
| |
|
| |
|
| |
|
| |
| | | | | | | | | | | | | |
Dividends: | | | | | | | | | | | | | |
Net investment income: | | | | | | | | | | | | | |
Class A Shares | | | — | | | — | | | (598,607 | ) | | (704,651 | ) |
Class B Shares | | | — | | | — | | | (113,867 | ) | | (172,434 | ) |
Class C Shares | | | — | | | — | | | (3,888 | ) | | (5,092 | ) |
Class I Shares | | | (3,535,491 | ) | | (4,321,491 | ) | | — | | | — | |
Net realized gains: | | | | | | | | | | | | | |
Class I Shares | | | (562,425 | ) | | — | | | — | | | — | |
| |
|
| |
|
| |
|
| |
|
| |
Change in net assets resulting from shareholder dividends | | | (4,097,916 | ) | | (4,321,491 | ) | | (716,362 | ) | | (882,177 | ) |
| |
|
| |
|
| |
|
| |
|
| |
Change in net assets resulting from capital transactions | | | (16,559,085 | ) | | (968,500 | ) | | (5,243,046 | ) | | 388,105 | |
| |
|
| |
|
| |
|
| |
|
| |
Change in net assets | | | (26,474,955 | ) | | 416,316 | | | (7,226,771 | ) | | 662,466 | |
| | | | | | | | | | | | | |
Net Assets: | | | | | | | | | | | | | |
Beginning of period | | | 81,392,471 | | | 80,976,155 | | | 17,414,301 | | | 16,751,835 | |
| |
|
| |
|
| |
|
| |
|
| |
End of period | | $ | 54,917,516 | | $ | 81,392,471 | | $ | 10,187,530 | | $ | 17,414,301 | |
| |
|
| |
|
| |
|
| |
|
| |
Accumulated net investment income (loss) | | $ | 52,351 | | $ | 120,218 | | $ | (1,731 | ) | $ | 13,008 | |
| |
|
| |
|
| |
|
| |
|
| |
| | |
35 | HSBC INVESTOR FAMILY OF FUNDS | See notes to financial statements. |
HSBC INVESTOR FAMILY OF FUNDS
Statements of Changes in Net Assets (continued)
| | | | | | | | | | | | | |
| | Core Plus
Fixed Income Fund (Advisor) | | Core Plus Fixed
Income Fund | |
|
| | For the year
ended
October 31,
2008 | | For the year
ended
October 31,
2007 | | For the year
ended
October 31,
2008 | | For the year
ended
October 31,
2007 | |
|
CAPITAL TRANSACTIONS: | | | | | | | | | | | | | |
Class A Shares: | | | | | | | | | | | | | |
Proceeds from shares issued | | $ | — | | $ | — | | $ | 1,848,069 | | $ | 4,557,268 | |
Dividends reinvested | | | — | | | — | | | 567,781 | | | 673,120 | |
Value of shares redeemed | | | — | | | — | | | (5,999,967 | ) | | (4,086,990 | ) |
| |
|
| |
|
| |
|
| |
|
| |
Class A Shares capital transactions | | | — | | | — | | | (3,584,117 | ) | | 1,143,398 | |
| |
|
| |
|
| |
|
| |
|
| |
|
Class B Shares: | | | | | | | | | | | | | |
Proceeds from shares issued | | | — | | | — | | | 152,662 | | | 133,221 | |
Dividends reinvested | | | — | | | — | | | 104,382 | | | 152,515 | |
Value of shares redeemed | | | — | | | — | | | (1,994,529 | ) | | (832,273 | ) |
| |
|
| |
|
| |
|
| |
|
| |
Class B Shares capital transactions | | | — | | | — | | | (1,737,485 | ) | | (546,537 | ) |
| |
|
| |
|
| |
|
| |
|
| |
|
Class C Shares: | | | | | | | | | | | | | |
Proceeds from shares issued | | | — | | | — | | | 79,000 | | | 16,800 | |
Dividends reinvested | | | — | | | — | | | 3,768 | | | 4,727 | |
Value of shares redeemed | | | — | | | — | | | (4,212 | ) | | (230,283 | ) |
| |
|
| |
|
| |
|
| |
|
| |
Class C Shares capital transactions | | | — | | | — | | | 78,556 | | | (208,756 | ) |
| |
|
| |
|
| |
|
| |
|
| |
|
Class I Shares: | | | | | | | | | | | | | |
Proceeds from shares issued | | | 11,045,505 | | | 16,414,081 | | | — | | | — | |
Dividends reinvested | | | 3,221,531 | | | 2,820,496 | | | — | | | — | |
Value of shares redeemed | | | (30,826,121 | ) | | (20,203,077 | ) | | — | | | — | |
| |
|
| |
|
| |
|
| |
|
| |
Class I Shares capital transactions | | | (16,559,085 | ) | | (968,500 | ) | | — | | | — | |
| |
|
| |
|
| |
|
| |
|
| |
Change in net assets resulting from capital transactions | | $ | (16,559,085 | ) | $ | (968,500 | ) | $ | (5,243,046 | ) | $ | 388,105 | |
| |
|
| |
|
| |
|
| |
|
| |
| | | | | | | | | | | | | |
SHARE TRANSACTIONS: | | | | | | | | | | | | | |
Class A Shares: | | | | | | | | | | | | | |
Issued | | | — | | | — | | | 183,156 | | | 435,107 | |
Reinvested | | | — | | | — | | | 56,566 | | | 64,455 | |
Redeemed | | | — | | | — | | | (615,873 | ) | | (391,171 | ) |
| |
|
| |
|
| |
|
| |
|
| |
Change in Class A Shares | | | — | | | — | | | (376,151 | ) | | 108,391 | |
| |
|
| |
|
| |
|
| |
|
| |
|
Class B Shares: | | | | | | | | | | | | | |
Issued | | | — | | | — | | | 15,333 | | | 12,712 | |
Reinvested | | | — | | | — | | | 10,322 | | | 14,586 | |
Redeemed | | | — | | | — | | | (197,907 | ) | | (79,589 | ) |
| |
|
| |
|
| |
|
| |
|
| |
Change in Class B Shares | | | — | | | — | | | (172,252 | ) | | (52,291 | ) |
| |
|
| |
|
| |
|
| |
|
| |
|
Class C Shares: | | | | | | | | | | | | | |
Issued | | | — | | | — | | | 7,588 | | | 1,628 | |
Reinvested | | | — | | | — | | | 378 | | | 453 | |
Redeemed | | | — | | | — | | | (403 | ) | | (22,120 | ) |
| |
|
| |
|
| |
|
| |
|
| |
Change in Class C Shares | | | — | | | — | | | 7,563 | | | (20,039 | ) |
| |
|
| |
|
| |
|
| |
|
| |
|
Class I Shares: | | | | | | | | | | | | | |
Issued | | | 1,115,935 | | | 1,596,631 | | | — | | | — | |
Reinvested | | | 326,863 | | | 274,454 | | | — | | | — | |
Redeemed | | | (3,155,373 | ) | | (1,968,988 | ) | | — | | | — | |
| |
|
| |
|
| |
|
| |
|
| |
Change in Class I Shares | | | (1,712,575 | ) | | (97,903 | ) | | — | | | — | |
| |
|
| |
|
| |
|
| |
|
| |
| | |
See notes to financial statements. | HSBC INVESTOR FAMILY OF FUNDS | 36 |
HSBC INVESTOR FAMILY OF FUNDS
Statements of Changes in Net Assets (continued)
| | | | | | | | | | | | | |
| | High Yield
Fixed Income Fund | | Intermediate Duration
Fixed Income Fund | |
|
| | For the
year ended
October 31, 2008 | | For the
year ended
October 31, 2007 | | For the
year ended
October 31, 2008 | | For the
year ended
October 31, 2007 | |
|
Investment Activities: | | | | | | | | | | | | | |
Operations: | | | | | | | | | | �� | | | |
Net investment income (loss) | | $ | 719,318 | | $ | 664,670 | | $ | 608,944 | | $ | 875,888 | |
Net realized gains (losses) from investments transactions | | | (326,305 | ) | | 94,442 | | | (127,295 | ) | | 792,234 | |
Change in unrealized appreciation/depreciation from investments and foreign currencies | | | (2,715,493 | ) | | (167,829 | ) | | (1,432,619 | ) | | (170,042 | ) |
| |
|
| |
|
| |
|
| |
|
| |
Change in net assets resulting from operations | | | (2,322,480 | ) | | 591,283 | | | (950,970 | ) | | 1,498,080 | |
| |
|
| |
|
| |
|
| |
|
| |
| | | | | | | | | | | | | |
Dividends: | | | | | | | | | | | | | |
Net investment income: | | | | | | | | | | | | | |
Class A Shares | | | (288,938 | ) | | (307,911 | ) | | (55,096 | ) | | (41,612 | ) |
Class B Shares | | | (170,963 | ) | | (163,518 | ) | | (82,985 | ) | | (145,985 | ) |
Class C Shares | | | (29,245 | ) | | (18,030 | ) | | (10,215 | ) | | (19,081 | ) |
Class I Shares | | | (238,848 | ) | | (181,367 | ) | | (472,469 | ) | | (666,493 | ) |
Net realized gains: | | | | | | | | | | | | | |
Class A Shares | | | (38,586 | ) | | (15,636 | ) | | (3,193 | ) | | — | |
Class B Shares | | | (24,882 | ) | | (6,846 | ) | | (10,717 | ) | | — | |
Class C Shares | | | (2,297 | ) | | (757 | ) | | (1,145 | ) | | — | |
Class I Shares | | | (28,677 | ) | | (8,215 | ) | | (38,243 | ) | | — | |
| |
|
| |
|
| |
|
| |
|
| |
Change in net assets resulting from shareholder dividends | | | (822,436 | ) | | (702,280 | ) | | (674,063 | ) | | (873,171 | ) |
| |
|
| |
|
| |
|
| |
|
| |
Change in net assets resulting from capital transactions | | | 241,192 | | | (533,751 | ) | | 453,241 | | | (4,796,641 | ) |
| |
|
| |
|
| |
|
| |
|
| |
Change in net assets | | | (2,903,724 | ) | | (644,748 | ) | | (1,171,792 | ) | | (4,171,732 | ) |
| | | | | | | | | | | | | |
Net Assets: | | | | | | | | | | | | | |
Beginning of period | | | 9,012,490 | | | 9,657,238 | | | 14,045,536 | | | 18,217,268 | |
| |
|
| |
|
| |
|
| |
|
| |
End of period | | $ | 6,108,766 | | $ | 9,012,490 | | $ | 12,873,744 | | $ | 14,045,536 | |
| |
|
| |
|
| |
|
| |
|
| |
Accumulated net investment income (loss) | | $ | (8,348 | ) | $ | 328 | | $ | 8,733 | | $ | 23,112 | |
| |
|
| |
|
| |
|
| |
|
| |
| | |
37 | HSBC INVESTOR FAMILY OF FUNDS | See notes to financial statements. |
HSBC INVESTOR FAMILY OF FUNDS
Statements of Changes in Net Assets (continued)
| | | | | | | | | | | | | |
| | High Yield
Fixed Income Fund | | Intermediate Duration
Fixed Income Fund | |
|
| | For the
year ended
October 31, 2008 | | For the
year ended
October 31, 2007 | | For the
year ended
October 31, 2008 | | For the
year ended
October 31, 2007 | |
|
CAPITAL TRANSACTIONS: | | | | | | | | | | | | | |
Class A Shares: | | | | | | | | | | | | | |
Proceeds from shares issued | | $ | 513,208 | | $ | 1,101,456 | | $ | 1,234,199 | | $ | 91,672 | |
Dividends reinvested | | | 233,298 | | | 261,982 | | | 47,821 | | | 37,106 | |
Value of shares redeemed | | | (1,036,177 | ) | | (2,360,652 | ) | | (270,271 | ) | | (335,287 | ) |
| |
|
| |
|
| |
|
| |
|
| |
Class A Shares capital transactions | | | (289,671 | ) | | (997,214 | ) | | 1,011,749 | | | (206,509 | ) |
| |
|
| |
|
| |
|
| |
|
| |
| | | | | | | | | | | | | |
Class B Shares: | | | | | | | | | | | | | |
Proceeds from shares issued | | | 151,468 | | | 542,167 | | | 28,472 | | | 53,039 | |
Dividends reinvested | | | 139,567 | | | 113,890 | | | 83,053 | | | 129,255 | |
Value of shares redeemed | | | (488,920 | ) | | (279,180 | ) | | (1,496,720 | ) | | (1,060,828 | ) |
| |
|
| |
|
| |
|
| |
|
| |
Class B Shares capital transactions | | | (197,885 | ) | | 376,877 | | | (1,385,195 | ) | | (878,534 | ) |
| |
|
| |
|
| |
|
| |
|
| |
| | | | | | | | | | | | | |
Class C Shares: | | | | | | | | | | | | | |
Proceeds from shares issued | | | 384,266 | | | 83,515 | | | 2,250 | | | 16,250 | |
Dividends reinvested | | | 9,773 | | | 15,343 | | | 11,183 | | | 18,729 | |
Value of shares redeemed | | | (69,023 | ) | | (112,155 | ) | | (66,567 | ) | | (248,148 | ) |
| |
|
| |
|
| |
|
| |
|
| |
Class C Shares capital transactions | | | 325,016 | | | (13,297 | ) | | (53,134 | ) | | (213,169 | ) |
| |
|
| |
|
| |
|
| |
|
| |
| | | | | | | | | | | | | |
Class I Shares: | | | | | | | | | | | | | |
Proceeds from shares issued | | | 858,365 | | | 1,158,432 | | | 3,331,706 | | | 2,137,921 | |
Dividends reinvested | | | 265,507 | | | 188,601 | | | 437,644 | | | 500,994 | |
Value of shares redeemed | | | (720,140 | ) | | (1,247,150 | ) | | (2,889,529 | ) | | (6,137,344 | ) |
| |
|
| |
|
| |
|
| |
|
| |
Class I Shares capital transactions | | | 403,732 | | | 99,883 | | | 879,821 | | | (3,498,429 | ) |
| |
|
| |
|
| |
|
| |
|
| |
Change in net assets resulting from capital transactions | | $ | 241,192 | | $ | (533,751 | ) | $ | 453,241 | | $ | (4,796,641 | ) |
| |
|
| |
|
| |
|
| |
|
| |
| | | | | | | | | | | | | |
SHARE TRANSACTIONS: | | | | | | | | | | | | | |
Class A Shares: | | | | | | | | | | | | | |
Issued | | | 56,231 | | | 107,567 | | | 128,765 | | | 9,160 | |
Reinvested | | | 26,066 | | | 25,689 | | | 4,994 | | | 3,707 | |
Redeemed | | | (123,310 | ) | | (230,848 | ) | | (29,064 | ) | | (33,428 | ) |
| |
|
| |
|
| |
|
| |
|
| |
Change in Class A Shares | | | (41,013 | ) | | (97,592 | ) | | 104,695 | | | (20,561 | ) |
| |
|
| |
|
| |
|
| |
|
| |
| | | | | | | | | | | | | |
Class B Shares: | | | | | | | | | | | | | |
Issued | | | 16,457 | | | 52,978 | | | 2,919 | | | 5,264 | |
Reinvested | | | 15,661 | | | 11,185 | | | 8,530 | | | 12,882 | |
Redeemed | | | (55,294 | ) | | (27,507 | ) | | (154,813 | ) | | (105,990 | ) |
| |
|
| |
|
| |
|
| |
|
| |
Change in Class B Shares | | | (23,176 | ) | | 36,656 | | | (143,364 | ) | | (87,844 | ) |
| |
|
| |
|
| |
|
| |
|
| |
| | | | | | | | | | | | | |
Class C Shares: | | | | | | | | | | | | | |
Issued | | | 42,443 | | | 7,961 | | | 230 | | | 1,608 | |
Reinvested | | | 1,092 | | | 1,498 | | | 1,154 | | | 1,868 | |
Redeemed | | | (8,336 | ) | | (11,490 | ) | | (6,896 | ) | | (24,816 | ) |
| |
|
| |
|
| |
|
| |
|
| |
Change in Class C Shares | | | 35,199 | | | (2,031 | ) | | (5,512 | ) | | (21,340 | ) |
| |
|
| |
|
| |
|
| |
|
| |
| | | | | | | | | | | | | |
Class I Shares: | | | | | | | | | | | | | |
Issued | | | 94,078 | | | 113,787 | | | 345,371 | | | 215,480 | |
Reinvested | | | 29,870 | | | 18,529 | | | 45,299 | | | 49,957 | |
Redeemed | | | (84,666 | ) | | (121,825 | ) | | (299,875 | ) | | (612,503 | ) |
| |
|
| |
|
| |
|
| |
|
| |
Change in Class I Shares | | | 39,282 | | | 10,491 | | | 90,795 | | | (347,066 | ) |
| |
|
| |
|
| |
|
| |
|
| |
| | |
See notes to financial statements. | HSBC INVESTOR FAMILY OF FUNDS | 38 |
HSBC INVESTOR FAMILY OF FUNDS
Statements of Changes in Net Assets (continued)
| | | | | | | | | | | | | |
| | New York Tax-Free
Bond Fund | | Growth Fund | |
|
| | For the
year ended
October 31, 2008 | | For the
year ended
October 31, 2007 | | For the
year ended
October 31, 2008 | | For the
year ended
October 31, 2007 | |
|
Investment Activities: | | | | | | | | | | | | | |
Operations: | | | | | | | | | | | | | |
Net investment income (loss) | | $ | 2,059,228 | | $ | 2,140,227 | | $ | (153,221 | ) | $ | 25,419 | |
Net realized gains (losses) from investment transactions | | | 151,884 | | | 79,494 | | | 182,222 | | | 2,943,213 | |
Change in unrealized appreciation/depreciation from investments and foreign currencies | | | (3,382,762 | ) | | (832,199 | ) | | (30,016,810 | ) | | 11,547,046 | |
| |
|
| |
|
| |
|
| |
|
| |
Change in net assets resulting from operations | | | (1,171,650 | ) | | 1,387,522 | | | (29,987,809 | ) | | 14,515,678 | |
| |
|
| |
|
| |
|
| |
|
| |
| | | | | | | | | | | | | |
Dividends: | | | | | | | | | | | | | |
Net investment income: | | | | | | | | | | | | | |
Class A Shares | | | (1,111,330 | ) | | (1,173,859 | ) | | — | | | (9,938 | ) |
Class B Shares | | | (188,686 | ) | | (304,650 | ) | | — | | | — | |
Class C Shares | | | (15,852 | ) | | (26,272 | ) | | — | | | — | |
Class I Shares | | | (764,542 | ) | | (608,516 | ) | | — | | | (37,788 | ) |
Net realized gains: | | | | | | | | | | | | | |
Class A Shares | | | (41,981 | ) | | (11,494 | ) | | (1,383,410 | ) | | (1,670,738 | ) |
Class B Shares | | | (10,694 | ) | | (4,734 | ) | | (79,802 | ) | | (114,608 | ) |
Class C Shares | | | (809 | ) | | (438 | ) | | (4,866 | ) | | (8,469 | ) |
Class I Shares | | | (26,013 | ) | | (5,055 | ) | | (1,424,277 | ) | | (1,202,878 | ) |
| |
|
| |
|
| |
|
| |
|
| |
Change in net assets resulting from shareholder dividends | | | (2,159,907 | ) | | (2,135,018 | ) | | (2,892,355 | ) | | (3,044,419 | ) |
| |
|
| |
|
| |
|
| |
|
| |
Change in net assets resulting from capital transactions | | | (12,285,228 | ) | | 323,731 | | | 28,956,532 | | | 12,667,797 | |
| |
|
| |
|
| |
|
| |
|
| |
Change in net assets | | | (15,616,785 | ) | | (423,765 | ) | | (3,923,632 | ) | | 24,139,056 | |
| | | | | | | | | | | | | |
Net Assets: | | | | | | | | | | | | | |
Beginning of period | | | 61,029,554 | | | 61,453,319 | | | 62,881,954 | | | 38,742,898 | |
| |
|
| |
|
| |
|
| |
|
| |
End of period | | $ | 45,412,769 | | $ | 61,029,554 | | $ | 58,958,322 | | $ | 62,881,954 | |
| |
|
| |
|
| |
|
| |
|
| |
Accumulated net investment income (loss) | | $ | 359 | | $ | 21,541 | | $ | — | | $ | — | |
| |
|
| |
|
| |
|
| |
|
| |
| | |
39 | HSBC INVESTOR FAMILY OF FUNDS | See notes to financial statements. |
HSBC INVESTOR FAMILY OF FUNDS
Statements of Changes in Net Assets (continued)
| | | | | | | | | | | | | |
| | New York Tax-Free
Bond Fund | | Growth Fund | |
|
| | For the
year ended
October 31, 2008 | | For the
year ended
October 31, 2007 | | For the
year ended
October 31, 2008 | | For the
year ended
October 31, 2007 | |
|
CAPITAL TRANSACTIONS: | | | | | | | | | | | | | |
Class A Shares: | | | | | | | | | | | | | |
Proceeds from shares issued | | $ | 4,006,530 | | $ | 7,409,045 | | $ | 2,184,134 | | $ | 8,418,213 | |
Proceeds from shares issued in conversion | | | — | | | — | | | 2,181,685 | | | — | |
Dividends reinvested | | | 1,035,303 | | | 1,075,105 | | | 1,365,451 | | | 1,668,294 | |
Value of shares redeemed | | | (11,207,042 | ) | | (8,495,178 | ) | | (7,496,370 | ) | | (7,016,198 | ) |
| |
|
| |
|
| |
|
| |
|
| |
Class A Shares capital transactions | | | (6,165,209 | ) | | (11,028 | ) | | (1,765,100 | ) | | 3,070,309 | |
| |
|
| |
|
| |
|
| |
|
| |
| | | | | | | | | | | | | |
Class B Shares: | | | | | | | | | | | | | |
Proceeds from shares issued | | | 120,432 | | | 141,720 | | | 94,123 | | | 61,125 | |
Proceeds from shares issued in conversion | | | — | | | — | | | 3,033,945 | | | — | |
Dividends reinvested | | | 147,784 | | | 227,620 | | | 79,295 | | | 112,067 | |
Value of shares redeemed | | | (3,728,591 | ) | | (5,321,458 | ) | | (621,351 | ) | | (260,768 | ) |
| |
|
| |
|
| |
|
| |
|
| |
Class B Shares capital transactions | | | (3,460,375 | ) | | (4,952,118 | ) | | 2,586,012 | | | (87,576 | ) |
| |
|
| |
|
| |
|
| |
|
| |
| | | | | | | | | | | | | |
Class C Shares: | | | | | | | | | | | | | |
Proceeds from shares issued | | | 33,615 | | | 17,375 | | | 316 | | | 54 | |
Proceeds from shares issued in conversion | | | — | | | — | | | 27,158 | | | — | |
Dividends reinvested | | | 12,094 | | | 14,700 | | | 4,866 | | | 8,413 | |
Value of shares redeemed | | | (352,550 | ) | | (456,298 | ) | | (12,332 | ) | | (197,005 | ) |
| |
|
| |
|
| |
|
| |
|
| |
Class C Shares capital transactions | | | (306,841 | ) | | (424,223 | ) | | 20,008 | | | (188,538 | ) |
| |
|
| |
|
| |
|
| |
|
| |
| | | | | | | | | | | | | |
Class I Shares: | | | | | | | | | | | | | |
Proceeds from shares issued | | | 5,250,741 | | | 7,546,678 | | | 5,289,940 | | | 13,457,915 | |
Proceeds from shares issued in conversion | | | — | | | — | | | 29,095,081 | | | — | |
Dividends reinvested | | | 286,948 | | | 144,401 | | | 1,334,114 | | | 1,190,246 | |
Value of shares redeemed | | | (7,890,492 | ) | | (1,979,979 | ) | | (7,603,523 | ) | | (4,774,559 | ) |
| |
|
| |
|
| |
|
| |
|
| |
Class I Shares capital transactions | | | (2,352,803 | ) | | 5,711,100 | | | 28,115,612 | | | 9,873,602 | |
| |
|
| |
|
| |
|
| |
|
| |
Change in net assets resulting from capital transactions | | $ | (12,285,228 | ) | $ | 323,731 | | $ | 28,956,532 | | $ | 12,667,797 | |
| |
|
| |
|
| |
|
| |
|
| |
| | | | | | | | | | | | | |
SHARE TRANSACTIONS: | | | | | | | | | | | | | |
Class A Shares: | | | | | | | | | | | | | |
Issued | | | 365,610 | | | 667,129 | | | 171,527 | | | 581,862 | |
Issued in conversion | | | — | | | — | | | 154,250 | | | — | |
Reinvested | | | 95,116 | | | 97,101 | | | 82,517 | | | 117,196 | |
Redeemed | | | (1,044,410 | ) | | (768,451 | ) | | (499,620 | ) | | (458,934 | ) |
| |
|
| |
|
| |
|
| |
|
| |
Change in Class A Shares | | | (583,684 | ) | | (4,221 | ) | | (91,326 | ) | | 240,124 | |
| |
|
| |
|
| |
|
| |
|
| |
| | | | | | | | | | | | | |
Class B Shares: | | | | | | | | | | | | | |
Issued | | | 10,955 | | | 12,842 | | | 6,697 | | | 4,219 | |
Issued in conversion | | | — | | | — | | | 229,821 | | | — | |
Reinvested | | | 13,566 | | | 20,557 | | | 5,109 | | | 8,307 | |
Redeemed | | | (339,919 | ) | | (481,133 | ) | | (49,634 | ) | | (18,265 | ) |
| |
|
| |
|
| |
|
| |
|
| |
Change in Class B Shares | | | (315,398 | ) | | (447,734 | ) | | 191,993 | | | (5,739 | ) |
| |
|
| |
|
| |
|
| |
|
| |
| | | | | | | | | | | | | |
Class C Shares: | | | | | | | | | | | | | |
Issued | | | 3,026 | | | 1,555 | | | 21 | | | 4 | |
Issued in conversion | | | — | | | — | | | 2,045 | | | — | |
Reinvested | | | 1,091 | | | 1,336 | | | 312 | | | 620 | |
Redeemed | | | (31,836 | ) | | (41,171 | ) | | (900 | ) | | (13,792 | ) |
| |
|
| |
|
| |
|
| |
|
| |
Change in Class C Shares | | | (27,719 | ) | | (38,280 | ) | | 1,478 | | | (13,168 | ) |
| |
|
| |
|
| |
|
| |
|
| |
| | | | | | | | | | | | | |
Class I Shares: | | | | | | | | | | | | | |
Issued | | | 476,765 | | | 681,820 | | | 372,328 | | | 901,736 | |
Issued in conversion | | | — | | | — | | | 2,043,578 | | | — | |
Reinvested | | | 26,350 | | | 13,084 | | | 80,320 | | | 83,266 | |
Redeemed | | | (738,030 | ) | | (179,624 | ) | | (519,054 | ) | | (313,430 | ) |
| |
|
| |
|
| |
|
| |
|
| |
Change in Class I Shares | | | (234,915 | ) | | 515,280 | | | 1,977,172 | | | 671,572 | |
| |
|
| |
|
| |
|
| |
|
| |
| | |
See notes to financial statements. | HSBC INVESTOR FAMILY OF FUNDS | 40 |
HSBC INVESTOR FAMILY OF FUNDS
Statements of Changes in Net Assets (continued)
| | | | | | | | | | | | | |
| | International Equity Fund | | Mid-Cap Fund | |
|
| | For the
year ended
October 31, 2008 | | For the
year ended
October 31, 2007 | | For the
year ended
October 31, 2008 | | For the
year ended
October 31, 2007 | |
|
Investment Activities: | | | | | | | | | | | | | |
Operations: | | | | | | | | | | | | | |
Net investment income (loss) | | $ | 7,877,663 | | $ | 7,281,046 | | $ | (87,610 | ) | $ | (136,947 | ) |
Net realized gains (losses) from investment transactions | | | 7,880,059 | | | 29,592,826 | | | 1,072,890 | | | 3,529,981 | |
Change in unrealized appreciation/depreciation from investments and foreign currencies | | | (201,336,999 | ) | | 37,623,613 | | | (14,339,743 | ) | | 4,694,868 | |
| |
|
| |
|
| |
|
| |
|
| |
Change in net assets resulting from operations | | | (185,579,277 | ) | | 74,497,485 | | | (13,354,463 | ) | | 8,087,902 | |
| |
|
| |
|
| |
|
| |
|
| |
| | | | | | | | | | | | | |
Dividends: | | | | | | | | | | | | | |
Net investment income: | | | | | | | | | | | | | |
Class I Shares | | | (5,964,290 | ) | | (7,179,951 | ) | | — | | | — | |
Net realized gains: | | | | | | | | | | | | | |
Class A Shares | | | — | | | — | | | (598,216 | ) | | (258,695 | ) |
Class B Shares | | | — | | | — | | | (737,486 | ) | | (522,684 | ) |
Class C Shares | | | — | | | — | | | (9,380 | ) | | (6,914 | ) |
Class I Shares | | | (28,980,345 | ) | | (24,089,605 | ) | | (2,185,201 | ) | | (1,159,580 | ) |
| |
|
| |
|
| |
|
| |
|
| |
Change in net assets resulting from shareholder dividends | | | (34,944,635 | ) | | (31,269,556 | ) | | (3,530,283 | ) | | (1,947,873 | ) |
| |
|
| |
|
| |
|
| |
|
| |
Change in net assets resulting from capital transactions | | | (4,139,847 | ) | | 58,740,573 | | | 603,841 | | | (942,082 | ) |
| |
|
| |
|
| |
|
| |
|
| |
Change in net assets | | | (224,663,759 | ) | | 101,968,502 | | | (16,280,905 | ) | | 5,197,947 | |
| | | | | | | | | | | | | |
Net Assets: | | | | | | | | | | | | | |
Beginning of period | | | 385,717,107 | | | 283,748,605 | | | 32,931,699 | | | 27,733,752 | |
| |
|
| |
|
| |
|
| |
|
| |
End of period | | $ | 161,053,348 | | $ | 385,717,107 | | $ | 16,650,794 | | $ | 32,931,699 | |
| |
|
| |
|
| |
|
| |
|
| |
Accumulated net investment income (loss) | | $ | 6,999,097 | | $ | 5,187,203 | | $ | — | | $ | — | |
| |
|
| |
|
| |
|
| |
|
| |
| | |
41 | HSBC INVESTOR FAMILY OF FUNDS | See notes to financial statements. |
HSBC INVESTOR FAMILY OF FUNDS
Statements of Changes in Net Assets (continued)
| | | | | | | | | | | | | |
| | International Equity Fund | | Mid-Cap Fund | |
|
| | For the
year ended
October 31, 2008 | | For the
year ended
October 31, 2007 | | For the
year ended
October 31, 2008 | | For the
year ended
October 31, 2007 | |
|
CAPITAL TRANSACTIONS: | | | | | | | | | | | | | |
Class A Shares: | | | | | | | | | | | | | |
Proceeds from shares issued | | $ | — | | $ | — | | $ | 2,247,640 | | $ | 3,918,143 | |
Dividends reinvested | | | — | | | — | | | 592,760 | | | 256,489 | |
Value of shares redeemed | | | — | | | — | | | (1,823,839 | ) | | (2,634,591 | ) |
| |
|
| |
|
| |
|
| |
|
| |
Class A Shares capital transactions | | | — | | | — | | | 1,016,561 | | | 1,540,041 | |
| |
|
| |
|
| |
|
| |
|
| |
| | | | | | | | | | | | | |
Class B Shares: | | | | | | | | | | | | | |
Proceeds from shares issued | | | — | | | — | | | 132,611 | | | 235,774 | |
Dividends reinvested | | | — | | | — | | | 721,029 | | | 514,297 | |
Value of shares redeemed | | | — | | | — | | | (2,456,625 | ) | | (3,072,777 | ) |
| |
|
| |
|
| |
|
| |
|
| |
Class B Shares capital transactions | | | — | | | — | | | (1,602,985 | ) | | (2,322,706 | ) |
| |
|
| |
|
| |
|
| |
|
| |
| | | | | | | | | | | | | |
Class C Shares: | | | | | | | | | | | | | |
Proceeds from shares issued | | | — | | | — | | | 9 | | | 11,496 | |
Dividends reinvested | | | — | | | — | | | 9,380 | | | 6,914 | |
Value of shares redeemed | | | — | | | — | | | (52,339 | ) | | (49,388 | ) |
| |
|
| |
|
| |
|
| |
|
| |
Class C Shares capital transactions | | | — | | | — | | | (42,950 | ) | | (30,978 | ) |
| |
|
| |
|
| |
|
| |
|
| |
| | | | | | | | | | | | | |
Class I Shares: | | | | | | | | | | | | | |
Proceeds from shares issued | | | 40,597,462 | | | 84,946,485 | | | 2,731,685 | | | 5,100,905 | |
Dividends reinvested | | | 26,918,243 | | | 22,576,471 | | | 1,405,125 | | | 581,066 | |
Value of shares redeemed | | | (71,655,552 | ) | | (48,782,383 | ) | | (2,903,595 | ) | | (5,810,410 | ) |
| |
|
| |
|
| |
|
| |
|
| |
Class I Shares capital transactions | | | (4,139,847 | ) | | 58,740,573 | | | 1,233,215 | | | (128,439 | ) |
| |
|
| |
|
| |
|
| |
|
| |
Change in net assets resulting from capital transactions | | $ | (4,139,847 | ) | $ | 58,740,573 | | $ | 603,841 | | $ | (942,082 | ) |
| |
|
| |
|
| |
|
| |
|
| |
| | | | | | | | | | | | | |
SHARE TRANSACTIONS: | | | | | | | | | | | | | |
Class A Shares: | | | | | | | | | | | | | |
Issued | | | — | | | — | | | 266,103 | | | 421,403 | |
Reinvested | | | — | | | — | | | 65,426 | | | 29,999 | |
Redeemed | | | — | | | — | | | (210,220 | ) | | (264,389 | ) |
| |
|
| |
|
| |
|
| |
|
| |
Change in Class A Shares | | | — | | | — | | | 121,309 | | | 187,013 | |
| |
|
| |
|
| |
|
| |
|
| |
| | | | | | | | | | | | | |
Class B Shares: | | | | | | | | | | | | | |
Issued | | | — | | | — | | | 17,380 | | | 27,574 | |
Reinvested | | | — | | | — | | | 86,351 | | | 64,127 | |
Redeemed | | | — | | | — | | | (326,374 | ) | | (354,120 | ) |
| |
|
| |
|
| |
|
| |
|
| |
Change in Class B Shares | | | — | | | — | | | (222,643 | ) | | (262,419 | ) |
| |
|
| |
|
| |
|
| |
|
| |
| | | | | | | | | | | | | |
Class C Shares: | | | | | | | | | | | | | |
Issued | | | — | | | — | | | — | | | 1,231 | |
Reinvested | | | — | | | — | | | 1,113 | | | 855 | |
Redeemed | | | — | | | — | | | (6,502 | ) | | (5,550 | ) |
| |
|
| |
|
| |
|
| |
|
| |
Change in Class C Shares | | | — | | | — | | | (5,389 | ) | | (3,464 | ) |
| |
|
| |
|
| |
|
| |
|
| |
| | | | | | | | | | | | | |
Class I Shares: | | | | | | | | | | | | | |
Issued | | | 2,263,402 | | | 3,750,486 | | | 318,390 | | | 522,495 | |
Reinvested | | | 1,358,821 | | | 1,070,482 | | | 151,578 | | | 66,712 | |
Redeemed | | | (4,112,422 | ) | | (2,166,669 | ) | | (334,242 | ) | | (600,816 | ) |
| |
|
| |
|
| |
|
| |
|
| |
Change in Class I Shares | | | (490,199 | ) | | 2,654,299 | | | 135,726 | | | (11,609 | ) |
| |
|
| |
|
| |
|
| |
|
| |
| | |
See notes to financial statements. | HSBC INVESTOR FAMILY OF FUNDS | 42 |
HSBC INVESTOR FAMILY OF FUNDS
Statements of Changes in Net Assets (continued)
| | | | | | | | | | | | | |
| | Opportunity Fund | | Opportunity Fund (Advisor) | |
|
| | For the
year ended
October 31, 2008 | | For the
year ended
October 31, 2007 | | For the
year ended
October 31, 2008 | | For the
year ended
October 31, 2007 | |
|
Investment Activities: | | | | | | | | | | | | | |
Operations: | | | | | | | | | | | | | |
Net investment income (loss) | | $ | (217,394 | ) | $ | (302,009 | ) | $ | (799,142 | ) | $ | (1,033,815 | ) |
Net realized gains (losses) from investment transactions | | | 619,272 | | | 6,380,550 | | | 2,335,993 | | | 46,538,426 | |
Change in unrealized appreciation/depreciation from investments and foreign currencies | | | (7,169,941 | ) | | (180,853 | ) | | (57,458,069 | ) | | 1,172,860 | |
| |
|
| |
|
| |
|
| |
|
| |
Change in net assets resulting from operations | | | (6,768,063 | ) | | 5,897,688 | | | (55,921,218 | ) | | 46,677,471 | |
| |
|
| |
|
| |
|
| |
|
| |
| | | | | | | | | | | | | |
Dividends: | | | | | | | | | | | | | |
Net realized gains: | | | | | | | | | | | | | |
Class A Shares | | | (4,275,970 | ) | | (2,977,887 | ) | | — | | | — | |
Class B Shares | | | (1,656,407 | ) | | (619,431 | ) | | — | | | — | |
Class C Shares | | | (112,933 | ) | | (38,717 | ) | | — | | | — | |
Class I Shares | | | — | | | — | | | (45,200,235 | ) | | (29,938,816 | ) |
| |
|
| |
|
| |
|
| |
|
| |
Change in net assets resulting from shareholder dividends | | | (6,045,310 | ) | | (3,636,035 | ) | | (45,200,235 | ) | | (29,938,816 | ) |
| |
|
| |
|
| |
|
| |
|
| |
Change in net assets resulting from capital transactions | | | 3,861,286 | | | (11,472,973 | ) | | 22,369,148 | | | (32,269,549 | ) |
| |
|
| |
|
| |
|
| |
|
| |
Change in net assets | | | (8,952,087 | ) | | (9,211,320 | ) | | (78,752,305 | ) | | (15,530,894 | ) |
| | | | | | | | | | | | | |
Net Assets: | | | | | | | | | | | | | |
Beginning of period | | | 20,318,759 | | | 29,530,079 | | | 176,592,878 | | | 192,123,772 | |
| |
|
| |
|
| |
|
| |
|
| |
End of period | | $ | 11,366,672 | | $ | 20,318,759 | | $ | 97,840,573 | | $ | 176,592,878 | |
| |
|
| |
|
| |
|
| |
|
| |
Accumulated net investment income (loss) | | $ | — | | $ | — | | $ | — | | $ | — | |
| |
|
| |
|
| |
|
| |
|
| |
| | |
43 | HSBC INVESTOR FAMILY OF FUNDS | See notes to financial statements. |
HSBC INVESTOR FAMILY OF FUNDS
Statements of Changes in Net Assets (continued)
| | | | | | | | | | | | | |
| | Opportunity Fund | | Opportunity Fund (Advisor) | |
|
| | | For the
year ended
October 31, 2008 | | | For the
year ended
October 31, 2007 | | | For the
year ended
October 31, 2008 | | | For the
year ended
October 31, 2007 | |
|
CAPITAL TRANSACTIONS: | | | | | | | | | | | | | |
Class A Shares: | | | | | | | | | | | | | |
Proceeds from shares issued | | $ | 4,352,351 | | $ | 1,869,751 | | $ | — | | $ | — | |
Dividends reinvested | | | 4,182,326 | | | 2,944,516 | | | — | | | — | |
Value of shares redeemed | | | (4,197,723 | ) | | (15,806,644 | ) | | — | | | — | |
| |
|
| |
|
| |
|
| |
|
| |
Class A Shares capital transactions | | | 4,336,954 | | | (10,992,377 | ) | | — | | | — | |
| |
|
| |
|
| |
|
| |
|
| |
|
Class B Shares: | | | | | | | | | | | | | |
Proceeds from shares issued | | | 123,807 | | | 187,082 | | | — | | | — | |
Dividends reinvested | | | 1,634,480 | | | 612,160 | | | — | | | — | |
Value of shares redeemed | | | (2,318,068 | ) | | (1,272,389 | ) | | — | | | — | |
| |
|
| |
|
| |
|
| |
|
| |
Class B Shares capital transactions | | | (559,781 | ) | | (473,147 | ) | | — | | | — | |
| |
|
| |
|
| |
|
| |
|
| |
|
Class C Shares: | | | | | | | | | | | | | |
Proceeds from shares issued | | | 54,646 | | | — | | | — | | | — | |
Dividends reinvested | | | 111,644 | | | 38,284 | | | — | | | — | |
Value of shares redeemed | | | (82,177 | ) | | (45,733 | ) | | — | | | — | |
| |
|
| |
|
| |
|
| |
|
| |
Class C Shares capital transactions | | | 84,113 | | | (7,449 | ) | | — | | | — | |
| |
|
| |
|
| |
|
| |
|
| |
|
Class I Shares: | | | | | | | | | | | | | |
Proceeds from shares issued | | | — | | | — | | | 18,539,696 | | | 43,767,538 | |
Dividends reinvested | | | — | | | — | | | 33,936,218 | | | 12,322,958 | |
Value of shares redeemed | | | — | | | — | | | (30,106,766 | ) | | (88,360,045 | ) |
| |
|
| |
|
| |
|
| |
|
| |
Class I Shares capital transactions | | | — | | | — | | | 22,369,148 | | | (32,269,549 | ) |
| |
|
| |
|
| |
|
| |
|
| |
Change in net assets resulting from capital transactions | | $ | 3,861,286 | | $ | (11,472,973 | ) | $ | 22,369,148 | | $ | (32,269,549 | ) |
| |
|
| |
|
| |
|
| |
|
| |
|
SHARE TRANSACTIONS: | | | | | | | | | | | | | |
Class A Shares: | | | | | | | | | | | | | |
Issued | | | 413,739 | | | 131,660 | | | — | | | — | |
Reinvested | | | 393,076 | | | 228,434 | | | — | | | — | |
Redeemed | | | (371,280 | ) | | (1,154,412 | ) | | — | | | — | |
| |
|
| |
|
| |
|
| |
|
| |
Change in Class A Shares | | | 435,535 | | | (794,318 | ) | | — | | | — | |
| |
|
| |
|
| |
|
| |
|
| |
| | | | | | | | | | | | | |
Class B Shares: | | | | | | | | | | | | | |
Issued | | | 12,688 | | | 14,236 | | | — | | | — | |
Reinvested | | | 177,468 | | | 51,790 | | | — | | | — | |
Redeemed | | | (261,383 | ) | | (96,076 | ) | | — | | | — | |
| |
|
| |
|
| |
|
| |
|
| |
Change in Class B Shares | | | (71,227 | ) | | (30,050 | ) | | — | | | — | |
| |
|
| |
|
| |
|
| |
|
| |
|
Class C Shares: | | | | | | | | | | | | | |
Issued | | | 5,891 | | | — | | | — | | | — | |
Reinvested | | | 11,915 | | | 3,204 | | | — | | | — | |
Redeemed | | | (9,434 | ) | | (3,443 | ) | | — | | | — | |
| |
|
| |
|
| |
|
| |
|
| |
Change in Class C Shares | | | 8,372 | | | (239 | ) | | — | | | — | |
| |
|
| |
|
| |
|
| |
|
| |
|
Class I Shares: | | | | | | | | | | | | | |
Issued | | | — | | | — | | | 1,473,803 | | | 2,507,207 | |
Reinvested | | | — | | | — | | | 2,551,595 | | | 822,079 | |
Redeemed | | | — | | | — | | | (2,365,826 | ) | | (5,122,696 | ) |
| |
|
| |
|
| |
|
| |
|
| |
Change in Class I Shares | | | — | | | — | | | 1,659,572 | | | (1,793,410 | ) |
| |
|
| |
|
| |
|
| |
|
| |
| | |
See notes to financial statements. | HSBC INVESTOR FAMILY OF FUNDS | 44 |
HSBC INVESTOR FAMILY OF FUNDS
Statements of Changes in Net Assets (continued)
| | | | | | | | | | | | | |
| | Overseas Equity Fund | | Value Fund | |
|
| | | For the
year ended
October 31, 2008 | | | For the
year ended
October 31, 2007 | | | For the
year ended
October 31, 2008 | | | For the
year ended
October 31, 2007 | |
|
Investment Activities: | | | | | | | | | | | | | |
Operations: | | | | | | | | | | | | | |
Net investment income (loss) | | $ | 216,267 | | $ | 218,504 | | $ | 508,204 | | $ | 507,210 | |
Net realized gains (losses) from investments transactions | | | 3,797,400 | | | 3,031,889 | | | (4,675,106 | ) | | 4,408,682 | |
Change in unrealized appreciation/depreciation from investments and foreign currencies | | | (12,419,361 | ) | | 1,272,896 | | | (17,328,757 | ) | | 12,266 | |
| |
|
| |
|
| |
|
| |
|
| |
Change in net assets resulting from operations | | | (8,405,694 | ) | | 4,523,289 | | | (21,495,659 | ) | | 4,928,158 | |
| |
|
| |
|
| |
|
| |
|
| |
| | | | | | | | | | | | | |
Dividends: | | | | | | | | | | | | | |
Net investment income: | | | | | | | | | | | | | |
Class A Shares | | | (105,065 | ) | | (474,482 | ) | | (197,548 | ) | | (213,752 | ) |
Class B Shares | | | (4,715 | ) | | (48,615 | ) | | (1,645 | ) | | (1,937 | ) |
Class C Shares | | | (123 | ) | | (2,106 | ) | | (118 | ) | | (113 | ) |
Class I Shares | | | — | | | — | | | (297,653 | ) | | (240,365 | ) |
Net realized gains: | | | | | | | | | | | | | |
Class A Shares | | | (2,297,440 | ) | | (2,532,363 | ) | | (2,036,989 | ) | | (2,315,837 | ) |
Class B Shares | | | (617,609 | ) | | (377,205 | ) | | (144,385 | ) | | (187,844 | ) |
Class C Shares | | | (24,923 | ) | | (18,983 | ) | | (10,272 | ) | | (14,732 | ) |
Class I Shares | | | — | | | — | | | (2,265,906 | ) | | (1,767,244 | ) |
| |
|
| |
|
| |
|
| |
|
| |
Change in net assets resulting from shareholder dividends | | | (3,049,875 | ) | | (3,453,754 | ) | | (4,954,516 | ) | | (4,741,824 | ) |
| |
|
| |
|
| |
|
| |
|
| |
Change in net assets resulting from capital transactions | | | (515,372 | ) | | (7,305,261 | ) | | 2,078,757 | | | 12,809,994 | |
| |
|
| |
|
| |
|
| |
|
| |
Change in net assets | | | (11,970,941 | ) | | (6,235,726 | ) | | (24,371,418 | ) | | 12,996,328 | |
| | | | | | | | | | | | | |
Net Assets: | | | | | | | | | | | | | |
Beginning of period | | | 19,922,763 | | | 26,158,489 | | | 57,815,315 | | | 44,818,987 | |
| |
|
| |
|
| |
|
| |
|
| |
End of period | | $ | 7,951,822 | | $ | 19,922,763 | | $ | 33,443,897 | | $ | 57,815,315 | |
| |
|
| |
|
| |
|
| |
|
| |
Accumulated net investment income (loss) | | $ | 439,713 | | $ | 79,109 | | $ | 126,892 | | $ | 131,577 | |
| |
|
| |
|
| |
|
| |
|
| |
| | |
45 | HSBC INVESTOR FAMILY OF FUNDS | See notes to financial statements. |
HSBC INVESTOR FAMILY OF FUNDS
Statements of Changes in Net Assets (continued)
| | | | | | | | | | | | | |
| | Overseas Equity Fund | | Value Fund | |
|
| | | For the
year ended
October 31, 2008 | | | For the
year ended
October 31, 2007 | | | For the
year ended
October 31, 2008 | | | For the
year ended
October 31, 2007 | |
|
CAPITAL TRANSACTIONS: | | | | | | | | | | | | | |
Class A Shares: | | | | | | | | | | | | | |
Proceeds from shares issued | | $ | 2,168,458 | | $ | 1,927,533 | | $ | 3,123,186 | | $ | 6,834,608 | |
Dividends reinvested | | | 2,383,150 | | | 2,979,338 | | | 2,222,634 | | | 2,504,967 | |
Value of shares redeemed | | | (4,837,345 | ) | | (12,347,048 | ) | | (5,905,400 | ) | | (6,945,162 | ) |
| |
|
| |
|
| |
|
| |
|
| |
Class A Shares capital transactions | | | (285,737 | ) | | (7,440,177 | ) | | (559,580 | ) | | 2,394,413 | |
| |
|
| |
|
| |
|
| |
|
| |
|
Class B Shares: | | | | | | | | | | | | | |
Proceeds from shares issued | | | 151,714 | | | 299,816 | | | 107,540 | | | 81,743 | |
Dividends reinvested | | | 599,255 | | | 417,884 | | | 145,230 | | | 185,697 | |
Value of shares redeemed | | | (986,692 | ) | | (551,790 | ) | | (583,192 | ) | | (410,699 | ) |
| |
|
| |
|
| |
|
| |
|
| |
Class B Shares capital transactions | | | (235,723 | ) | | 165,910 | | | (330,422 | ) | | (143,259 | ) |
| |
|
| |
|
| |
|
| |
|
| |
|
Class C Shares: | | | | | | | | | | | | | |
Proceeds from shares issued | | | 3,000 | | | 28,000 | | | 50 | | | — | |
Dividends reinvested | | | 25,043 | | | 20,910 | | | 10,390 | | | 14,746 | |
Value of shares redeemed | | | (21,955 | ) | | (79,904 | ) | | (11,882 | ) | | (42,494 | ) |
| |
|
| |
|
| |
|
| |
|
| |
Class C Shares capital transactions | | | 6,088 | | | (30,994 | ) | | (1,442 | ) | | (27,748 | ) |
| |
|
| |
|
| |
|
| |
|
| |
|
Class I Shares: | | | | | | | | | | | | | |
Proceeds from shares issued | | | — | | | — | | | 6,102,681 | | | 13,481,595 | |
Dividends reinvested | | | — | | | — | | | 2,444,669 | | | 1,920,064 | |
Value of shares redeemed | | | — | | | — | | | (5,577,149 | ) | | (4,815,071 | ) |
| |
|
| |
|
| |
|
| |
|
| |
Class I Shares capital transactions | | | — | | | — | | | 2,970,201 | | | 10,586,588 | |
| |
|
| |
|
| |
|
| |
|
| |
Change in net assets resulting from capital transactions | | $ | (515,372 | ) | $ | (7,305,261 | ) | $ | 2,078,757 | | $ | 12,809,994 | |
| |
|
| |
|
| |
|
| |
|
| |
| | | | | | | | | | | | | |
SHARE TRANSACTIONS: | | | | | | | | | | | | | |
Class A Shares: | | | | | | | | | | | | | |
Issued | | | 229,442 | | | 102,880 | | | 313,160 | | | 433,376 | |
Reinvested | | | 162,229 | | | 170,248 | | | 157,396 | | | 160,308 | |
Redeemed | | | (330,382 | ) | | (695,566 | ) | | (452,094 | ) | | (424,086 | ) |
| |
|
| |
|
| |
|
| |
|
| |
Change in Class A Shares | | | 61,289 | | | (422,438 | ) | | 18,462 | | | 169,598 | |
| |
|
| |
|
| |
|
| |
|
| |
|
Class B Shares: | | | | | | | | | | | | | |
Issued | | | 11,070 | | | 16,784 | | | 9,342 | | | 5,175 | |
Reinvested | | | 43,236 | | | 25,023 | | | 10,720 | | | 12,417 | |
Redeemed | | | (75,053 | ) | | (31,048 | ) | | (47,908 | ) | | (26,217 | ) |
| |
|
| |
|
| |
|
| |
|
| |
Change in Class B Shares | | | (20,747 | ) | | 10,759 | | | (27,846 | ) | | (8,625 | ) |
| |
|
| |
|
| |
|
| |
|
| |
|
Class C Shares: | | | | | | | | | | | | | |
Issued | | | 165 | | | 1,618 | | | 3 | | | — | |
Reinvested | | | 1,749 | | | 1,221 | | | 761 | | | 979 | |
Redeemed | | | (1,593 | ) | | (4,376 | ) | | (939 | ) | | (2,761 | ) |
| |
|
| |
|
| |
|
| |
|
| |
Change in Class C Shares | | | 321 | | | (1,537 | ) | | (175 | ) | | (1,782 | ) |
| |
|
| |
|
| |
|
| |
|
| |
|
Class I Shares: | | | | | | | | | | | | | |
Issued | | | — | | | — | | | 527,200 | | | 831,134 | |
Reinvested | | | — | | | — | | | 173,797 | | | 122,918 | |
Redeemed | | | — | | | — | | | (446,281 | ) | | (297,127 | ) |
| |
|
| |
|
| |
|
| |
|
| |
Change in Class I Shares | | | — | | | — | | | 254,716 | | | 656,925 | |
| |
|
| |
|
| |
|
| |
|
| |
| | |
See notes to financial statements. | HSBC INVESTOR FAMILY OF FUNDS | 46 |
|
HSBC INVESTOR ADVISOR FUNDS TRUST—CORE PLUS FIXED INCOME FUND (ADVISOR) |
|
Financial Highlights |
Selected data for a share outstanding throughout the periods indicated. (a)
| | | | | | | | | | | | | | | | | | | | | | | | | | | | | |
| | | | | Investment Activities | | Dividends | | | | |
| | | | |
| |
| | | | |
| | Net Asset
Value,
Beginning
of Period | | Net
Investment
Income | | Net Realized
and Unrealized
Gains (Losses)
from
Investments | | Total from
Investment
Activities | | Net
Investment
Income | | Net
Realized
Gains from
Investment
Transactions | | Total
Dividends | | Net Asset
Value, End
of Period | |
|
|
|
|
|
|
|
|
|
|
|
|
|
|
|
|
|
|
CLASS I SHARES | | | | | | | | | | | | | | | | | | | | | | | | | | | | | |
Year Ended October 31, 2004 | | | $ | 10.73 | | | 0.45 | | | 0.12 | | | 0.57 | | | (0.45 | ) | | — | | | (0.45 | ) | | | $ | 10.85 | | |
Year Ended October 31, 2005 | | | | 10.85 | | | 0.44 | | | (0.27 | ) | | 0.17 | | | (0.47 | ) | | — | | | (0.47 | ) | | | | 10.55 | | |
Year Ended October 31, 2006 | | | | 10.55 | | | 0.53 | | | 0.02 | | | 0.55 | | | (0.51 | ) | | (0.46 | ) | | (0.97 | ) | | | | 10.13 | | |
Year Ended October 31, 2007 | | | | 10.13 | | | 0.54 | | | 0.17 | | | 0.71 | | | (0.53 | ) | | — | | | (0.53 | ) | | | | 10.31 | | |
Year Ended October 31, 2008 | | | | 10.31 | | | 0.49 | | | (1.33 | ) | | (0.84 | ) | | (0.50 | ) | | (0.08 | ) | | (0.58 | ) | | | | 8.89 | | |
|
|
|
|
|
|
|
|
|
|
|
|
|
|
|
|
|
|
|
|
|
|
|
|
|
|
|
|
|
|
| | | | | | | | | | | | | | | | | | | | | |
| | | | | Ratios/Supplementary Data | |
| | | | |
| |
| | Total
Return(b) | | Net Assets
at End of
Period
(000’s) | | Ratio of Net
Expenses to
Average Net
Assets | | Ratio of Net
Investment
Income to
Average
Net Assets | | Ratio of
Expenses to
Average Net
Assets(c) | | Portfolio
Turnover
Rate(d) | |
|
|
|
|
|
|
|
|
|
|
|
|
|
|
CLASS I SHARES | | | | | | | | | | | | | | | | | | | | | |
Year Ended October 31, 2004 | | 5.46 | % | | | $ | 109,518 | | | 0.64 | % | | 4.20 | % | | 0.64 | % | | 34.88 | % | |
Year Ended October 31, 2005 | | 1.55 | %(e) | | | | 89,743 | | | 0.52 | %(e) | | 4.15 | %(e) | | 0.52 | %(e) | | 176.60 | % | |
Year Ended October 31, 2006 | | 5.56 | % | | | | 80,976 | | | 0.56 | % | | 5.05 | % | | 0.80 | % | | 273.91 | % | |
Year Ended October 31, 2007 | | 7.20 | %(f)(g) | | | | 81,392 | | | 0.35 | %(f) | | 5.24 | %(f) | | 0.72 | % | | 252.26 | % | |
Year Ended October 31, 2008 | | (8.60 | )%(h) | | | | 54,918 | | | 0.45 | % | | 4.96 | % | | 0.72 | % | | 119.38 | % | |
|
|
|
|
|
|
|
|
|
|
|
|
|
|
|
|
|
|
|
|
|
|
| |
(a) | The per share amounts and percentages reflect income and expenses assuming inclusion of the Fund’s proportionate share of the income and expenses of the HSBC Investor Core Plus Fixed Income Portfolio. |
| |
(b) | Total return calculations do not include any sales or redemption charges. |
| |
(c) | During the period certain fees were reduced. If such fee reductions had not occurred, the ratio would have been as indicated. |
| |
(d) | Portfolio turnover rate is calculated on the basis of the respective Portfolio in which the Fund invests all of its investable assets. |
| |
(e) | During the year ended October 31, 2005, HSBC reimbursed certain amounts to the respective Portfolio in which the Fund invests related to violation of certain investment policies and limitations. The corresponding impact to the net expense ratio, net income ratio, gross expense ratio and total return were 0.11% for the Advisor Shares. |
| |
(f) | During the year ended October 31, 2007, HSBC reimbursed amounts to certain Funds related to past marketing arrangements. The corresponding impact to the net expense ratio, net income ratio, and the total return were 0.10% for the Advisor Shares. |
| |
(g) | During the year ended October 31, 2007, the respective Portfolio in which the Fund invests received monies related to certain nonrecurring litigation settlements. The corresponding impact to total return was 1.80%. |
| |
(h) | During the year ended October 31, 2008, the respective Portfolio in which the Fund invests received monies related to certain nonrecurring litigation settlements. The corresponding impact to total return was 0.38%. |
| | |
47 | HSBC INVESTOR FAMILY OF FUNDS | See notes to financial statements. |
|
HSBC INVESTOR FUNDS—CORE PLUS FIXED INCOME FUND |
|
Financial Highlights |
Selected data for a share outstanding throughout the periods indicated. (a)
| | | | | | | | | | | | | | | | | | | | | | | | | | | | | |
| | | | | Investment Activities | | Dividends | | | | |
| | | | |
| |
| | | | |
| | Net Asset
Value,
Beginning
of Period | | Net
Investment
Income | | Net Realized
and Unrealized
Gains (Losses)
from
Investments | | Total from
Investment
Activities | | Net
Investment
Income | | Net
Realized
Gains from
Investment
Transactions | | Total
Dividends | | Net Asset
Value, End
of Period | |
|
|
|
|
|
|
|
|
|
|
|
|
|
|
|
|
|
|
CLASS A SHARES | | | | | | | | | | | | | | | | | | | | | | | | | | | | | |
Year Ended October 31, 2004 | | | $ | 10.48 | | | 0.40 | | | 0.12 | | | 0.52 | | | (0.40 | ) | | — | | | (0.40 | ) | | | $ | 10.60 | | |
Year Ended October 31, 2005 | | | | 10.60 | | | 0.39 | | | (0.27 | ) | | 0.12 | | | (0.42 | ) | | — | | | (0.42 | ) | | | | 10.30 | | |
Year Ended October 31, 2006 | | | | 10.30 | | | 0.49 | * | | 0.05 | | | 0.54 | | | (0.49 | ) | | (0.05 | ) | | (0.54 | ) | | | | 10.30 | | |
Year Ended October 31, 2007 | | | | 10.30 | | | 0.51 | * | | 0.19 | | | 0.70 | | | (0.52 | ) | | — | | | (0.52 | ) | | | | 10.48 | | |
Year Ended October 31, 2008 | | | | 10.48 | | | 0.48 | * | | (1.39 | ) | | (0.91 | ) | | (0.48 | ) | | — | | | (0.48 | ) | | | | 9.09 | | |
|
|
|
|
|
|
|
|
|
|
|
|
|
|
|
|
|
|
|
|
|
|
|
|
|
|
|
|
|
|
CLASS B SHARES | | | | | | | | | | | | | | | | | | | | | | | | | | | | | |
Year Ended October 31, 2004 | | | $ | 10.49 | | | 0.32 | | | 0.11 | | | 0.43 | | | (0.32 | ) | | — | | | (0.32 | ) | | | $ | 10.60 | | |
Year Ended October 31, 2005 | | | | 10.60 | | | 0.32 | | | (0.27 | ) | | 0.05 | | | (0.34 | ) | | — | | | (0.34 | ) | | | | 10.31 | | |
Year Ended October 31, 2006 | | | | 10.31 | | | 0.41 | | | 0.06 | | | 0.47 | | | (0.42 | ) | | (0.05 | ) | | (0.47 | ) | | | | 10.31 | | |
Year Ended October 31, 2007 | | | | 10.31 | | | 0.44 | * | | 0.18 | | | 0.62 | | | (0.44 | ) | | — | | | (0.44 | ) | | | | 10.49 | | |
Year Ended October 31, 2008 | | | | 10.49 | | | 0.40 | * | | (1.38 | ) | | (0.98 | ) | | (0.41 | ) | | — | | | (0.41 | ) | | | | 9.10 | | |
|
|
|
|
|
|
|
|
|
|
|
|
|
|
|
|
|
|
|
|
|
|
|
|
|
|
|
|
|
|
CLASS C SHARES | | | | | | | | | | | | | | | | | | | | | | | | | | | | | |
Year Ended October 31, 2004 | | | $ | 10.48 | | | 0.32 | | | 0.11 | | | 0.43 | | | (0.32 | ) | | — | | | (0.32 | ) | | | $ | 10.59 | | |
Year Ended October 31, 2005 | | | | 10.59 | | | 0.32 | | | (0.27 | ) | | 0.05 | | | (0.34 | ) | | — | | | (0.34 | ) | | | | 10.30 | | |
Year Ended October 31, 2006 | | | | 10.30 | | | 0.41 | * | | 0.06 | | | 0.47 | | | (0.42 | ) | | (0.05 | ) | | (0.47 | ) | | | | 10.30 | | |
Year Ended October 31, 2007 | | | | 10.30 | | | 0.44 | * | | 0.16 | | | 0.60 | | | (0.44 | ) | | — | | | (0.44 | ) | | | | 10.46 | | |
Year Ended October 31, 2008 | | | | 10.46 | | | 0.39 | * | | (1.37 | ) | | (0.98 | ) | | (0.41 | ) | | — | | | (0.41 | ) | | | | 9.07 | | |
|
|
|
|
|
|
|
|
|
|
|
|
|
|
|
|
|
|
|
|
|
|
|
|
|
|
|
|
|
|
| | | | | | | | | | | | | | | | | | | | | |
| | | | | Ratios/Supplementary Data | |
| | | | |
| |
| | Total
Return(b) | | Net Assets
at End of
Period
(000’s) | | Ratio of Net
Expenses to
Average Net
Assets | | Ratio of Net
Investment
Income to
Average
Net Assets | | Ratio of
Expenses to
Average Net
Assets(c) | | Portfolio
Turnover
Rate(d) | |
|
|
|
|
|
|
|
|
|
|
|
|
|
|
|
|
|
|
|
|
CLASS A SHARES | | | | | | | | | | | | | | | | | | | | | |
Year Ended October 31, 2004 | | 5.07 | % | | | $ | 17,248 | | | 1.04 | % | | 3.78 | % | | 1.26 | % | | 34.88 | % | |
Year Ended October 31, 2005 | | 1.16 | %(e) | | | | 17,646 | | | 0.84 | %(e) | | 3.82 | %(e) | | 1.15 | %(e) | | 176.60 | % | |
Year Ended October 31, 2006 | | 5.45 | % | | | | 12,248 | | | 0.79 | % | | 4.82 | % | | 1.43 | % | | 273.91 | % | |
Year Ended October 31, 2007 | | 6.90 | %(f)(g) | | | | 13,592 | | | 0.67 | %(f) | | 4.93 | %(f) | | 1.41 | % | | 252.26 | % | |
Year Ended October 31, 2008 | | (8.99 | )%(h) | | | | 8,371 | | | 0.70 | % | | 4.72 | % | | 1.46 | % | | 119.38 | % | |
|
|
|
|
|
|
|
|
|
|
|
|
|
|
|
|
|
|
|
|
|
|
CLASS B SHARES | | | | | | | | | | | | | | | | | | | | | |
Year Ended October 31, 2004 | | 4.19 | % | | | $ | 7,017 | | | 1.79 | % | | 3.05 | % | | 2.01 | % | | 34.88 | % | |
Year Ended October 31, 2005 | | 0.50 | %(e) | | | | 6,168 | | | 1.59 | %(e) | | 3.08 | %(e) | | 1.90 | %(e) | | 176.90 | % | |
Year Ended October 31, 2006 | | 4.67 | % | | | | 4,267 | | | 1.54 | % | | 4.06 | % | | 2.19 | % | | 273.91 | % | |
Year Ended October 31, 2007 | | 6.10 | %(f)(g) | | | | 3,792 | | | 1.42 | %(f) | | 4.18 | %(f) | | 2.12 | % | | 252.26 | % | |
Year Ended October 31, 2008 | | (9.66 | )%(h) | | | | 1,722 | | | 1.45 | % | | 3.98 | % | | 2.19 | % | | 119.38 | % | |
|
|
|
|
|
|
|
|
|
|
|
|
|
|
|
|
|
|
|
|
|
|
CLASS C SHARES | | | | | | | | | | | | | | | | | | | | | |
Year Ended October 31, 2004 | | 4.20 | % | | | $ | 377 | | | 1.80 | % | | 3.07 | % | | 2.02 | % | | 34.88 | % | |
Year Ended October 31, 2005 | | 0.51 | %(e) | | | | 285 | | | 1.58 | %(e) | | 3.14 | %(e) | | 1.89 | %(e) | | 176.90 | % | |
Year Ended October 31, 2006 | | 4.67 | % | | | | 236 | | | 1.54 | % | | 4.07 | % | | 2.19 | % | | 273.91 | % | |
Year Ended October 31, 2007 | | 5.92 | %(f)(g) | | | | 30 | | | 1.43 | %(f) | | 4.24 | %(f) | | 2.19 | % | | 252.26 | % | |
Year Ended October 31, 2008 | | (9.69 | )%(h) | | | | 95 | | | 1.45 | % | | 3.92 | % | | 2.22 | % | | 119.38 | % | |
|
|
|
|
|
|
|
|
|
|
|
|
|
|
|
|
|
|
|
|
|
|
| |
* | Calculated based on average shares outstanding. |
| |
(a) | The per share amounts and percentages reflect income and expenses assuming inclusion of the Fund’s proportionate share of the income and expenses of the HSBC Investor Core Plus Fixed Income Portfolio. |
| |
(b) | Total return calculations do not include any sales or redemption charges. |
| |
(c) | During the period certain fees were reduced. If such fee reductions had not occurred, the ratio would have been as indicated. |
| |
(d) | Portfolio turnover rate is calculated on the basis of the respective Portfolio in which the Fund invests all of its investable assets. |
| |
(e) | During the year ended October 31, 2005, HSBC reimbursed certain amounts to the respective Portfolio in which the Fund invests related to violation of certain investment policies and limitations. The corresponding impact to the net expense ratio, net income ratio, gross expense ratio and total return were 0.11%, 0.11% and 0.12% for Class A Shares, Class B Shares and Class C Shares, respectively. |
| |
(f) | During the year ended October 31, 2007, HSBC reimbursed amounts to certain Funds related to past marketing arrangements. The corresponding impact to the net expense ratio, net income ratio, and the total returns were 0.03%, 0.03%, and 0.02% for Class A Shares, Class B Shares, and Class C Shares, respectively. |
| |
(g) | During the year ended October 31, 2007, the respective Portfolio in which the Fund invests received monies related to certain nonrecurring litigation settlements. The corresponding impact to the total return was 1.77%, 1.76% and 1.77% for Class A Shares, Class B Shares and Class C Shares, respectively. |
| |
(h) | During the year ended October 31, 2008, the respective Portfolio in which the Fund invests received monies related to certain nonrecurring litigation settlements. The corresponding impact to the total return was 0.38%, 0.38% and 0.38% for Class A Shares, Class B Shares and Class C Shares respectively. |
| | |
See notes to financial statements. | HSBC INVESTOR FAMILY OF FUNDS | 48 |
|
HSBC INVESTOR FUNDS—HIGH YIELD FIXED INCOME FUND |
|
Financial Highlights |
Selected data for a share outstanding throughout the periods indicated. (a)
| | | | | | | | | | | | | | | | | | | | | | | | | | | | | |
| | | | | Investment Activities | | Dividends | | | | |
| | | | |
| |
| | | | |
| | Net Asset
Value,
Beginning
of Period | | Net
Investment
Income | | Net Realized
and Unrealized
Gains (Losses)
from
Investments | | Total from
Investment
Activities | | Net
Investment
Income | | Net
Realized
Gains from
Investment
Transactions | | Total
Dividends | | Net Asset
Value, End
of Period | |
|
|
|
|
|
|
|
|
|
|
|
|
|
|
|
|
|
|
|
|
|
|
|
|
|
|
CLASS A SHARES | | | | | | | | | | | | | | | | | | | | | | | | | | | | | |
Period Ended October 31, 2006(f) | | | $ | 10.00 | | | 0.69 | | | 0.12 | | | 0.81 | | | (0.68 | ) | | — | | | (0.68 | ) | | | $ | 10.13 | | |
Year Ended October 31, 2007 | | | | 10.13 | | | 0.79 | * | | (0.09 | ) | | 0.70 | | | (0.79 | ) | | (0.03 | ) | | (0.82 | ) | | | | 10.01 | | |
Year Ended October 31, 2008 | | | | 10.01 | | | 0.77 | * | | (3.19 | ) | | (2.42 | ) | | (0.78 | ) | | (0.10 | ) | | (0.88 | ) | | | | 6.71 | | |
|
|
|
|
|
|
|
|
|
|
|
|
|
|
|
|
|
|
|
|
|
|
|
|
|
|
|
|
|
|
CLASS B SHARES | | | | | | | | | | | | | | | | | | | | | | | | | | | | | |
Period Ended October 31, 2006(g) | | | $ | 10.00 | | | 0.62 | | | 0.13 | | | 0.75 | | | (0.61 | ) | | — | | | (0.61 | ) | | | $ | 10.14 | | |
Year Ended October 31, 2007 | | | | 10.14 | | | 0.71 | * | | (0.09 | ) | | 0.62 | | | (0.72 | ) | | (0.03 | ) | | (0.75 | ) | | | | 10.01 | | |
Year Ended October 31, 2008 | | | | 10.01 | | | 0.70 | * | | (3.19 | ) | | (2.49 | ) | | (0.71 | ) | | (0.10 | ) | | (0.81 | ) | | | | 6.71 | | |
|
|
|
|
|
|
|
|
|
|
|
|
|
|
|
|
|
|
|
|
|
|
|
|
|
|
|
|
|
|
CLASS C SHARES | | | | | | | | | | | | | | | | | | | | | | | | | | | | | |
Period Ended October 31, 2006(h) | | | $ | 10.01 | | | 0.58 | | | 0.15 | | | 0.73 | | | (0.58 | ) | | — | | | (0.58 | ) | | | $ | 10.16 | | |
Year Ended October 31, 2007 | | | | 10.16 | | | 0.71 | * | | (0.09 | ) | | 0.62 | | | (0.72 | ) | | (0.03 | ) | | (0.75 | ) | | | | 10.03 | | |
Year Ended October 31, 2008 | | | | 10.03 | | | 0.69 | * | | (3.19 | ) | | (2.50 | ) | | (0.71 | ) | | (0.10 | ) | | (0.81 | ) | | | | 6.72 | | |
|
|
|
|
|
|
|
|
|
|
|
|
|
|
|
|
|
|
|
|
|
|
|
|
|
|
|
|
|
|
CLASS I SHARES | | | | | | | | | | | | | | | | | | | | | | | | | | | | | |
Period Ended October 31, 2006(i) | | | $ | 10.00 | | | 0.71 | | | 0.14 | | | 0.85 | | | (0.71 | ) | | — | | | (0.71 | ) | | | $ | 10.14 | | |
Year Ended October 31, 2007 | | | | 10.14 | | | 0.81 | * | | (0.09 | ) | | 0.72 | | | (0.82 | ) | | (0.03 | ) | | (0.85 | ) | | | | 10.01 | | |
Year Ended October 31, 2008 | | | | 10.01 | | | 0.79 | * | | (3.19 | ) | | (2.40 | ) | | (0.80 | ) | | (0.10 | ) | | (0.90 | ) | | | | 6.71 | | |
|
|
|
|
|
|
|
|
|
|
|
|
|
|
|
|
|
|
|
|
|
|
|
|
|
|
|
|
|
|
| | | | | | | | | | | | | | | | | | | | | |
| | | | | Ratios/Supplementary Data | |
| | | | |
| |
| | Total
Return(b) | | Net Assets
at End of
Period
(000’s) | | Ratio of Net
Expenses to
Average Net
Assets(c) | | Ratio of Net
Investment
Income to
Average
Net Assets(c) | | Ratio of
Expenses to
Average Net
Assets(c)(d) | | Portfolio
Turnover
Rate(e) | |
|
|
|
|
|
|
|
|
|
|
|
|
|
|
CLASS A SHARES | | | | | | | | | | | | | | | | | | | | | |
Period Ended October 31, 2006(f) | | 8.38 | % | | | $ | 4,742 | | | 0.80 | % | | 7.27 | % | | 3.53 | % | | 13.61 | % | |
Year Ended October 31, 2007 | | 7.13 | % | | | | 3,706 | | | 0.80 | % | | 7.71 | % | | 2.97 | % | | 30.77 | % | |
Year Ended October 31, 2008 | | (26.01 | )% | | | | 2,209 | | | 0.80 | % | | 8.54 | % | | 2.83 | % | | 24.10 | % | |
|
|
|
|
|
|
|
|
|
|
|
|
|
|
|
|
|
|
|
|
|
|
CLASS B SHARES | | | | | | | | | | | | | | | | | | | | | |
Period Ended October 31, 2006(g) | | 7.68 | % | | | $ | 2,106 | | | 1.55 | % | | 6.65 | % | | 4.26 | % | | 13.61 | % | |
Year Ended October 31, 2007 | | 6.22 | % | | | | 2,447 | | | 1.55 | % | | 6.95 | % | | 3.69 | % | | 30.77 | % | |
Year Ended October 31, 2008 | | (26.57 | )% | | | | 1,484 | | | 1.55 | % | | 7.79 | % | | 3.57 | % | | 24.10 | % | |
|
|
|
|
|
|
|
|
|
|
|
|
|
|
|
|
|
|
|
|
|
|
CLASS C SHARES | | | | | | | | | | | | | | | | | | | | | |
Period Ended October 31, 2006(h) | | 7.42 | % | | | $ | 241 | | | 1.55 | % | | 6.65 | % | | 4.29 | % | | 13.61 | % | |
Year Ended October 31, 2007 | | 6.20 | % | | | | 217 | | | 1.55 | % | | 6.90 | % | | 3.69 | % | | 30.77 | % | |
Year Ended October 31, 2008 | | (26.63 | )% | | | | 382 | | | 1.55 | % | | 7.81 | % | | 3.63 | % | | 24.10 | % | |
|
|
|
|
|
|
|
|
|
|
|
|
|
|
|
|
|
|
|
|
|
|
CLASS I SHARES | | | | | | | | | | | | | | | | | | | | | |
Period Ended October 31, 2006(i) | | 8.73 | % | | | $ | 2,568 | | | 0.55 | % | | 7.53 | % | | 3.29 | % | | 13.61 | % | |
Year Ended October 31, 2007 | | 7.29 | % | | | | 2,642 | | | 0.55 | % | | 7.95 | % | | 2.68 | % | | 30.77 | % | |
Year Ended October 31, 2008 | | (25.83 | )% | | | | 2,034 | | | 0.55 | % | | 8.80 | % | | 2.59 | % | | 24.10 | % | |
|
|
|
|
|
|
|
|
|
|
|
|
|
|
|
|
|
|
|
|
|
|
| |
* | Calculated based on average shares outstanding. |
| |
(a) | The per share amounts and percentages reflect income and expenses assuming inclusion of the Fund’s proportionate share of the income and expenses of the HSBC Investor High Yield Fixed Income Portfolio. |
| |
(b) | Not annualized for periods less than one year. Total return calculations do not include any sales or redemption charges. |
| |
(c) | Annualized for periods less than one year. |
| |
(d) | During the period certain fees were reduced. If such fee reductions had not occurred, the ratio would have been as indicated. |
| |
(e) | Portfolio turnover rate is calculated on the basis of the respective Portfolio in which the Fund invests all its investable assets. |
| |
(f) | Class A Shares commenced operations on November 18, 2005. |
| |
(g) | Class B Shares commenced operations on November 21, 2005. |
| |
(h) | Class C Shares commenced operations on December 14, 2005. |
| |
(i) | Class I Shares commenced operations on November 18, 2005. |
| | |
49 | HSBC INVESTOR FAMILY OF FUNDS | See notes to financial statements. |
|
HSBC INVESTOR FUNDS—INTERMEDIATE DURATION FIXED INCOME FUND |
|
Financial Highlights |
Selected data for a share outstanding throughout the periods indicated. (a)
| | | | | | | | | | | | | | | | | | | | | | | | | | | | | |
| | | | Investment Activities | | Dividends | | | |
| | | |
| |
| | | |
| | Net Asset
Value,
Beginning
of Period | | Net
Investment
Income | | Net Realized
and Unrealized
Gains (Losses)
from
Investments | | Total from
Investment
Activities | | Net
Investment
Income | | Net
Realized
Gains from
Investment
Transactions | | Total
Dividends | | Net Asset
Value, End
of Period | |
|
|
|
|
|
|
|
|
|
|
|
|
|
|
|
|
|
|
CLASS A SHARES | | | | | | | | | | | | | | | | | | | | | | | | | |
Year Ended October 31, 2004 | | | $ | 10.47 | | | 0.32 | * | | 0.06 | | | 0.38 | | | (0.33 | ) | | (0.46 | ) | | (0.79 | ) | | | $ | 10.06 | | |
Year Ended October 31, 2005 | | | | 10.06 | | | 0.33 | | | (0.29 | ) | | 0.04 | | | (0.37 | ) | | (0.06 | ) | | (0.43 | ) | | | | 9.67 | | |
Year Ended October 31, 2006 | | | | 9.67 | | | 0.45 | | | 0.05 | | | 0.50 | | | (0.45 | ) | | — | | | (0.45 | ) | | | | 9.72 | | |
Year Ended October 31, 2007 | | | | 9.72 | | | 0.50 | * | | 0.33 | | | 0.83 | | | (0.50 | ) | | — | | | (0.50 | ) | | | | 10.05 | | |
Year Ended October 31, 2008 | | | | 10.05 | | | 0.41 | * | | (1.08 | ) | | (0.67 | ) | | (0.43 | ) | | (0.04 | ) | | (0.47 | ) | | | | 8.91 | | |
|
|
|
|
|
|
|
|
|
|
|
|
|
|
|
|
|
|
|
|
|
|
|
|
|
|
|
|
|
|
CLASS B SHARES | | | | | | | | | | | | | | | | | | | | | | | | | | | | | |
Year Ended October 31, 2004 | | | $ | 10.49 | | | 0.23 | | | 0.08 | | | 0.31 | | | (0.26 | ) | | (0.46 | ) | | (0.72 | ) | | | $ | 10.08 | | |
Year Ended October 31, 2005 | | | | 10.08 | | | 0.25 | | | (0.29 | ) | | (0.04 | ) | | (0.29 | ) | | (0.06 | ) | | (0.35 | ) | | | | 9.69 | | |
Year Ended October 31, 2006 | | | | 9.69 | | | 0.38 | | | 0.04 | | | 0.42 | | | (0.38 | ) | | — | | | (0.38 | ) | | | | 9.73 | | |
Year Ended October 31, 2007 | | | | 9.73 | | | 0.43 | * | | 0.33 | | | 0.76 | | | (0.42 | ) | | — | | | (0.42 | ) | | | | 10.07 | | |
Year Ended October 31, 2008 | | | | 10.07 | | | 0.36 | * | | (1.10 | ) | | (0.74 | ) | | (0.36 | ) | | (0.04 | ) | | (0.40 | ) | | | | 8.93 | | |
|
|
|
|
|
|
|
|
|
|
|
|
|
|
|
|
|
|
|
|
|
|
|
|
|
|
|
|
|
|
CLASS C SHARES | | | | | | | | | | | | | | | | | | | | | | | | | | | | | |
Year Ended October 31, 2004 | | | $ | 10.49 | | | 0.22 | | | 0.08 | | | 0.30 | | | (0.26 | ) | | (0.46 | ) | | (0.72 | ) | | | $ | 10.07 | | |
Year Ended October 31, 2005 | | | | 10.07 | | | 0.25 | | | (0.29 | ) | | (0.04 | ) | | (0.29 | ) | | (0.06 | ) | | (0.35 | ) | | | | 9.68 | | |
Year Ended October 31, 2006 | | | | 9.68 | | | 0.38 | | | 0.05 | | | 0.43 | | | (0.38 | ) | | — | | | (0.38 | ) | | | | 9.73 | | |
Year Ended October 31, 2007 | | | | 9.73 | | | 0.43 | * | | 0.33 | | | 0.76 | | | (0.43 | ) | | — | | | (0.43 | ) | | | | 10.06 | | |
Year Ended October 31, 2008 | | | | 10.06 | | | 0.36 | * | | (1.09 | ) | | (0.73 | ) | | (0.36 | ) | | (0.04 | ) | | (0.40 | ) | | | | 8.93 | | |
|
|
|
|
|
|
|
|
|
|
|
|
|
|
|
|
|
|
|
|
|
|
|
|
|
|
|
|
|
|
CLASS I SHARES | | | | | | | | | | | | | | | | | | | | | | | | | | | | | |
Year Ended October 31, 2004 | | | $ | 10.48 | | | 0.33 | | | 0.09 | | | 0.42 | | | (0.36 | ) | | (0.46 | ) | | (0.82 | ) | | | $ | 10.08 | | |
Year Ended October 31, 2005 | | | | 10.08 | | | 0.35 | | | (0.30 | ) | | 0.05 | | | (0.39 | ) | | (0.06 | ) | | (0.45 | ) | | | | 9.68 | | |
Year Ended October 31, 2006 | | | | 9.68 | | | 0.47 | | | 0.05 | | | 0.52 | | | (0.47 | ) | | — | | | (0.47 | ) | | | | 9.73 | | |
Year Ended October 31, 2007 | | | | 9.73 | | | 0.53 | * | | 0.32 | | | 0.85 | | | (0.52 | ) | | — | | | (0.52 | ) | | | | 10.06 | | |
Year Ended October 31, 2008 | | | | 10.06 | | | 0.45 | * | | (1.08 | ) | | (0.63 | ) | | (0.46 | ) | | (0.04 | ) | | (0.50 | ) | | | | 8.93 | | |
|
|
|
|
|
|
|
|
|
|
|
|
|
|
|
|
|
|
|
|
|
|
|
|
|
|
|
|
|
|
| | | | | | | | | | | | | | | | | | | | | |
| | | | Ratios/Supplementary Data | |
| | | |
|
|
| | Total
Return(b) | | Net Assets
at End of
Period
(000’s) | | Ratio of Net
Expenses to
Average Net
Assets | | Ratio of Net
Investment
Income to
Average
Net Assets | | Ratio of
Expenses to
Average Net
Assets(c) | | Portfolio
Turnover
Rate(d) | |
|
|
|
|
|
|
|
|
|
|
|
|
|
|
CLASS A SHARES | | | | | | | | | | | | | | | | | | | |
Year Ended October 31, 2004 | | 3.90 | % | | | $ | 1,558 | | | 1.10 | % | | 3.01 | % | | 1.21 | % | | 50.06 | % | |
Year Ended October 31, 2005 | | 0.31 | %(e) | | | | 1,055 | | | 1.01 | %(e) | | 3.37 | %(e) | | 1.10 | %(e) | | 107.26 | % | |
Year Ended October 31, 2006 | | 5.30 | % | | | | 976 | | | 0.80 | % | | 4.61 | % | | 1.65 | % | | 236.51 | % | |
Year Ended October 31, 2007 | | 8.67 | %(f)(g) | | | | 803 | | | 0.53 | %(f) | | 5.02 | %(f) | | 1.67 | % | | 219.76 | % | |
Year Ended October 31, 2008 | | (6.90 | )%(h) | | | | 1,646 | | | 0.65 | % | | 4.33 | % | | 1.78 | % | | 124.23 | % | |
|
|
|
|
|
|
|
|
|
|
|
|
|
|
|
|
|
|
|
|
|
|
CLASS B SHARES | | | | | | | | | | | | | | | | | | | | | |
Year Ended October 31, 2004 | | 3.11 | % | | | $ | 6,321 | | | 1.85 | % | | 2.28 | % | | 1.96 | % | | 50.06 | % | |
Year Ended October 31, 2005 | | (0.44 | )%(e) | | | | 4,852 | | | 1.76 | %(e) | | 2.60 | %(e) | | 1.85 | %(e) | | 107.26 | % | |
Year Ended October 31, 2006 | | 4.40 | % | | | | 3,738 | | | 1.56 | % | | 3.84 | % | | 2.40 | % | | 236.51 | % | |
Year Ended October 31, 2007 | | 7.96 | %(f)(g) | | | | 2,982 | | | 1.28 | %(f) | | 4.26 | %(f) | | 2.41 | % | | 219.76 | % | |
Year Ended October 31, 2008 | | (7.58 | )%(h) | | | | 1,365 | | | 1.40 | % | | 3.74 | % | | 2.51 | % | | 124.23 | % | |
|
|
|
|
|
|
|
|
|
|
|
|
|
|
|
|
|
|
|
|
|
|
CLASS C SHARES | | | | | | | | | | | | | | | | | | | | | |
Year Ended October 31, 2004 | | 3.03 | % | | | $ | 679 | | | 1.85 | % | | 2.25 | % | | 1.96 | % | | 50.06 | % | |
Year Ended October 31, 2005 | | (0.44 | )%(e) | | | | 527 | | | 1.77 | %(e) | | 2.60 | %(e) | | 1.86 | %(e) | | 107.26 | % | |
Year Ended October 31, 2006 | | 4.51 | % | | | | 503 | | | 1.55 | % | | 3.86 | % | | 2.40 | % | | 236.51 | % | |
Year Ended October 31, 2007 | | 7.86 | %(f)(g) | | | | 305 | | | 1.27 | %(f) | | 4.27 | %(f) | | 2.43 | % | | 219.76 | % | |
Year Ended October 31, 2008 | | (7.49 | )%(h) | | | | 222 | | | 1.40 | % | | 3.69 | % | | 2.51 | % | | 124.23 | % | |
|
|
|
|
|
|
|
|
|
|
|
|
|
|
|
|
|
|
|
|
|
|
CLASS I SHARES | | | | | | | | | | | | | | | | | | | | | |
Year Ended October 31, 2004 | | 4.25 | % | | | $ | 31,217 | | | 0.85 | % | | 3.28 | % | | 0.96 | % | | 50.06 | % | |
Year Ended October 31, 2005 | | 0.45 | %(e) | | | | 24,744 | | | 0.76 | %(e) | | 3.60 | %(e) | | 0.85 | %(e) | | 107.26 | % | |
Year Ended October 31, 2006 | | 5.56 | % | | | | 13,000 | | | 0.58 | % | | 4.77 | % | | 1.38 | % | | 236.51 | % | |
Year Ended October 31, 2007 | | 8.93 | %(f)(g) | | | | 9,955 | | | 0.28 | %(f) | | 5.25 | %(f) | | 1.42 | % | | 219.76 | % | |
Year Ended October 31, 2008 | | (6.56 | )%(h) | | | | 9,641 | | | 0.40 | % | | 4.66 | % | | 1.51 | % | | 124.23 | % | |
|
|
|
|
|
|
|
|
|
|
|
|
|
|
|
|
|
|
|
|
|
|
| |
* | Calculated based on average shares outstanding. |
| |
(a) | The per share amounts and percentages reflect income and expenses assuming inclusion of the Fund’s proportionate share of the income and expenses of the HSBC Investor Intermediate Duration Fixed Income Portfolio. |
| |
(b) | Total return calculations do not include any sales or redemption charges. |
| |
(c) | During the period certain fees were reduced. If such fee reductions had not occurred, the ratio would have been as indicated. |
| |
(d) | Portfolio turnover rate is calculated on the basis of the respective Portfolio in which the Fund invests all of its investable assets. |
| |
(e) | During the year ended October 31, 2005, HSBC reimbursed certain amounts to the respective Portfolio in which the Fund invests related to violation of certain investment policies and limitations. The corresponding impact to the net expense ratio, net income ratio, gross expense ratio and total return were 0.09%, 0.09%, 0.09% and 0.08% for Class A Shares, Class B Shares, Class C Shares and Class I Shares, respectively. |
| |
(f) | During the year ended October 31, 2007, HSBC reimbursed amounts to certain Funds related to past marketing arrangements. The corresponding impact to the net expense ratio, net income ratio, and the total returns were 0.12%, 0.12%, 0.13%, and 0.12% for Class A Shares, Class B Shares, Class C Shares and Class I Shares, respectively. |
| |
(g) | During the year ended October 31, 2007, the respective Portfolio in which the Fund invests received monies related to certain nonrecurring litigation settlements. The corresponding impact to the total return was 3.75%, 3.74%, 3.74% and 3.75% for Class A Shares, Class B Shares, Class C Shares and Class I Shares, respectively. |
| |
(h) | During the year ended October 31, 2008, the respective Portfolio in which the Fund invests in received monies related to certain nonrecurring litigation settlements. The corresponding impact to the total return was 1.39%, 1.39%, 1.39% and 1.39% for Class A Shares, Class B Shares, Class C Shares and Class I Shares, respectively. |
| | |
See notes to financial statements. | HSBC INVESTOR FAMILY OF FUNDS | 50 |
|
HSBC INVESTOR FUNDS—NEW YORK TAX-FREE BOND FUND |
|
Financial Highlights |
|
Selected data for a share outstanding throughout the periods indicated. |
| | | | | | | | | | | | | | | | | | | | | | | | | | | |
| | | | Investment Activities | | Dividends | | | |
| | | |
| |
| | | |
| | Net Asset
Value,
Beginning
of Period | | Net
Investment
Income | | Net Realized
and Unrealized
Gains (Losses)
from
Investments | | Total from
Investment
Activities | | Net
Investment
Income | | Net
Realized
Gains from
Investment
Transactions | | Total
Dividends | | Net Asset
Value, End
of Period | |
|
|
|
|
|
|
|
|
|
|
|
|
|
|
|
|
|
|
CLASS A SHARES | | | | | | | | | | | | | | | | | |
Year Ended October 31, 2004 | | $ | 11.21 | | | 0.34 | | | 0.17 | | | 0.51 | | | (0.34 | ) | | (0.06 | ) | | (0.40 | ) | | $ | 11.32 | | |
Year Ended October 31, 2005 | | | 11.32 | | | 0.34 | | | (0.22 | ) | | 0.12 | | | (0.34 | ) | | (0.02 | ) | | (0.36 | ) | | | 11.08 | | |
Year Ended October 31, 2006 | | | 11.08 | | | 0.37 | | | 0.12 | | | 0.49 | | | (0.37 | ) | | (0.02 | ) | | (0.39 | ) | | | 11.18 | | |
Year Ended October 31, 2007 | | | 11.18 | | | 0.39 | * | | (0.14 | ) | | 0.25 | | | (0.38 | ) | | — | | | (0.38 | ) | | | 11.05 | | |
Year Ended October 31, 2008 | | | 11.05 | | | 0.39 | * | | (0.63 | ) | | (0.24 | ) | | (0.39 | ) | | (0.01 | ) | | (0.40 | ) | | | 10.41 | | |
|
|
|
|
|
|
|
|
|
|
|
|
|
|
|
|
|
|
|
|
|
|
|
|
|
|
|
|
CLASS B SHARES | | | | | | | | | | | | | | | | | | | | | | | | | | | |
Year Ended October 31, 2004 | | $ | 11.20 | | | 0.25 | | | 0.17 | | | 0.42 | | | (0.25 | ) | | (0.06 | ) | | (0.31 | ) | | $ | 11.31 | | |
Year Ended October 31, 2005 | | | 11.31 | | | 0.25 | | | (0.22 | ) | | 0.03 | | | (0.25 | ) | | (0.02 | ) | | (0.27 | ) | | | 11.07 | | |
Year Ended October 31, 2006 | | | 11.07 | | | 0.28 | | | 0.12 | | | 0.40 | | | (0.28 | ) | | (0.02 | ) | | (0.30 | ) | | | 11.17 | | |
Year Ended October 31, 2007 | | | 11.17 | | | 0.30 | * | | (0.13 | ) | | 0.17 | | | (0.30 | ) | | — | | | (0.30 | ) | | | 11.04 | | |
Year Ended October 31, 2008 | | | 11.04 | | | 0.31 | * | | (0.63 | ) | | (0.32 | ) | | (0.31 | ) | | (0.01 | ) | | (0.32 | ) | | | 10.40 | | |
|
|
|
|
|
|
|
|
|
|
|
|
|
|
|
|
|
|
|
|
|
|
|
|
|
|
|
|
CLASS C SHARES | | | | | | | | | | | | | | | | | | | | | | | | | | | |
Year Ended October 31, 2004 | | $ | 11.25 | | | 0.25 | | | 0.16 | | | 0.41 | | | (0.25 | ) | | (0.06 | ) | | (0.31 | ) | | $ | 11.35 | | |
Year Ended October 31, 2005 | | | 11.35 | | | 0.25 | | | (0.22 | ) | | 0.03 | | | (0.25 | ) | | (0.02 | ) | | (0.27 | ) | | | 11.11 | | |
Year Ended October 31, 2006 | | | 11.11 | | | 0.28 | | | 0.12 | | | 0.40 | | | (0.28 | ) | | (0.02 | ) | | (0.30 | ) | | | 11.21 | | |
Year Ended October 31, 2007 | | | 11.21 | | | 0.31 | * | | (0.14 | ) | | 0.17 | | | (0.30 | ) | | — | | | (0.30 | ) | | | 11.08 | | |
Year Ended October 31, 2008 | | | 11.08 | | | 0.31 | * | | (0.62 | ) | | (0.31 | ) | | (0.31 | ) | | (0.01 | ) | | (0.32 | ) | | | 10.45 | | |
|
|
|
|
|
|
|
|
|
|
|
|
|
|
|
|
|
|
|
|
|
|
|
|
|
|
|
|
CLASS I SHARES | | | | | | | | | | | | | | | | | | | | | | | | | | | |
Year Ended October 31, 2004 | | $ | 11.21 | | | 0.37 | | | 0.17 | | | 0.54 | | | (0.37 | ) | | (0.06 | ) | | (0.43 | ) | | $ | 11.32 | | |
Year Ended October 31, 2005 | | | 11.32 | | | 0.37 | | | (0.22 | ) | | 0.15 | | | (0.37 | ) | | (0.02 | ) | | (0.39 | ) | | | 11.08 | | |
Year Ended October 31, 2006 | | | 11.08 | | | 0.39 | | | 0.12 | | | 0.51 | | | (0.39 | ) | | (0.02 | ) | | (0.41 | ) | | | 11.18 | | |
Year Ended October 31, 2007 | | | 11.18 | | | 0.41 | * | | (0.13 | ) | | 0.28 | | | (0.41 | ) | | — | | | (0.41 | ) | | | 11.05 | | |
Year Ended October 31, 2008 | | | 11.05 | | | 0.42 | * | | (0.63 | ) | | (0.21 | ) | | (0.42 | ) | | (0.01 | ) | | (0.43 | ) | | | 10.41 | | |
|
|
|
|
|
|
|
|
|
|
|
|
|
|
|
|
|
|
|
|
|
|
|
|
|
|
|
|
| | | | | | | | | | | | | | | | | | | | |
| | | | Ratios/Supplementary Data | |
| | | |
|
|
| | Total
Return(a) | | Net Assets
at End of
Period
(000’s) | | Ratio of Net
Expenses to
Average Net
Assets | | Ratio of Net
Investment
Income to
Average
Net Assets | | Ratio of
Expenses to
Average Net
Assets(b) | | Portfolio
Turnover
Rate(c) | |
|
|
|
|
|
|
|
|
|
|
|
|
|
|
CLASS A SHARES | | | | | | | | | | | | | | |
Year Ended October 31, 2004 | | 4.57 | % | | $ | 32,889 | | | 0.87 | % | | 3.01 | % | | 0.87 | % | | 26.96 | % | |
Year Ended October 31, 2005 | | 1.03 | %(d) | | | 34,441 | | | 0.88 | %(d) | | 3.02 | %(d) | | 0.89 | % | | 13.87 | % | |
Year Ended October 31, 2006 | | 4.45 | % | | | 32,727 | | | 0.93 | % | | 3.30 | % | | 0.93 | % | | 12.69 | % | |
Year Ended October 31, 2007 | | 2.34 | %(e) | | | 32,305 | | | 0.86 | %(e) | | 3.50 | %(e) | | 0.89 | % | | 17.03 | % | |
Year Ended October 31, 2008 | | (2.20 | )% | | | 24,363 | | | 0.84 | % | | 3.56 | % | | 0.84 | % | | 0.00 | % | |
|
|
|
|
|
|
|
|
|
|
|
|
|
|
|
|
|
|
|
|
|
CLASS B SHARES | | | | | | | | | | | | | | | | | | | | |
Year Ended October 31, 2004 | | 3.80 | % | | $ | 17,457 | | | 1.62 | % | | 2.27 | % | | 1.62 | % | | 26.96 | % | |
Year Ended October 31, 2005 | | 0.28 | %(d) | | | 16,258 | | | 1.63 | %(d) | | 2.27 | %(d) | | 1.64 | % | | 13.87 | % | |
Year Ended October 31, 2006 | | 3.67 | % | | | 13,735 | | | 1.68 | % | | 2.56 | % | | 1.68 | % | | 12.69 | % | |
Year Ended October 31, 2007 | | 1.58 | %(e) | | | 8,635 | | | 1.61 | %(e) | | 2.75 | %(e) | | 1.64 | % | | 17.03 | % | |
Year Ended October 31, 2008 | | (2.94 | )% | | | 4,856 | | | 1.59 | % | | 2.80 | % | | 1.59 | % | | 0.00 | % | |
|
|
|
|
|
|
|
|
|
|
|
|
|
|
|
|
|
|
|
|
|
CLASS C SHARES | | | | | | | | | | | | | | | | | | | | |
Year Ended October 31, 2004 | | 3.69 | % | | $ | 2,340 | | | 1.62 | % | | 2.26 | % | | 1.62 | % | | 26.96 | % | |
Year Ended October 31, 2005 | | 0.28 | %(d) | | | 1,782 | | | 1.63 | %(d) | | 2.26 | %(d) | | 1.64 | % | | 13.87 | % | |
Year Ended October 31, 2006 | | 3.66 | % | | | 1,246 | | | 1.68 | % | | 2.55 | % | | 1.68 | % | | 12.69 | % | |
Year Ended October 31, 2007 | | 1.57 | %(e) | | | 807 | | | 1.60 | %(e) | | 2.75 | %(e) | | 1.63 | % | | 17.03 | % | |
Year Ended October 31, 2008 | | (2.84 | )% | | | 471 | | | 1.59 | % | | 2.80 | % | | 1.59 | % | | 0.00 | % | |
|
|
|
|
|
|
|
|
|
|
|
|
|
|
|
|
|
|
|
|
|
CLASS I SHARES | | | | | | | | | | | | | | | | | | | | |
Year Ended October 31, 2004 | | 4.83 | % | | $ | 19,908 | | | 0.62 | % | | 3.27 | % | | 0.62 | % | | 26.96 | % | |
Year Ended October 31, 2005 | | 1.28 | %(d) | | | 16,981 | | | 0.63 | %(d) | | 3.27 | %(d) | | 0.64 | % | | 13.87 | % | |
Year Ended October 31, 2006 | | 4.71 | % | | | 13,746 | | | 0.68 | % | | 3.55 | % | | 0.68 | % | | 12.69 | % | |
Year Ended October 31, 2007 | | 2.59 | %(e) | | | 19,282 | | | 0.60 | %(e) | | 3.74 | %(e) | | 0.63 | % | | 17.03 | % | |
Year Ended October 31, 2008 | | (1.96 | )% | | | 15,723 | | | 0.59 | % | | 3.80 | % | | 0.59 | % | | 0.00 | % | |
|
|
|
|
|
|
|
|
|
|
|
|
|
|
|
|
|
|
|
|
|
| |
* | Calculated based on average shares outstanding. |
| |
(a) | Total return calculations do not include any sales or redemption charges. |
| |
(b) | During the period certain fees were reduced. If such fee reductions had not occurred, the ratio would have been as indicated. |
| |
(c) | Portfolio turnover rate is calculated on the basis of the Fund as a whole, without the distinguishing between the classes of shares issued. |
| |
(d) | During the year ended October 31, 2005, HSBC reimbursed certain amounts to the Fund related to violation of certain investment policies and limitations. The corresponding impact to the net expense ratio, net income ratio and total return were 0.01%, 0.01%, 0.01% and 0.01% for Class A Shares, Class B Shares, Class C Shares and Class I Shares, respectively. |
| |
(e) | During the year ended October 31, 2007, HSBC reimbursed amounts to certain Funds related to past marketing arrangements. The corresponding impact to the net expense ratio, net income ratio, and the total returns were 0.03%, 0.04%, 0.03%, and 0.03% for Class A Shares, Class B Shares, Class C Shares and Class I Shares, respectively. |
| | |
51 | HSBC INVESTOR FAMILY OF FUNDS | See notes to financial statements. |
|
HSBC INVESTOR FUNDS—GROWTH FUND |
|
Financial Highlights |
Selected data for a share outstanding throughout the periods indicated. (a)
| | | | | | | | | | | | | | | | | | | | | | | | | | | |
| | | | Investment Activities | | Dividends | | | |
| | | |
| |
| | | |
| | Net Asset
Value,
Beginning
of Period | | Net
Investment
Income (Loss) | | Net Realized
and Unrealized
Gains (Losses)
from
Investments | | Total from
Investment
Activities | | Net
Investment
Income | | Net
Realized
Gains from
Investment
Transactions | | Total
Dividends | | Net Asset
Value, End
of Period | |
|
|
|
|
|
|
|
|
|
|
|
|
|
|
|
|
|
|
CLASS A SHARES | | | | | | | | | | | | | | | | | | | |
Period Ended October 31, 2004(f) | | $ | 12.68 | | | (0.02 | ) | | (0.11 | ) | | (0.13 | ) | | — | | | — | | | — | | | $ | 12.55 | | |
Year Ended October 31, 2005 | | | 12.55 | | | 0.03 | | | 1.59 | | | 1.62 | | | (0.05 | ) | | — | | | (0.05 | ) | | | 14.12 | | |
Year Ended October 31, 2006 | | | 14.12 | | | (0.02 | )* | | 0.99 | | | 0.97 | | | — | | | (0.23 | ) | | (0.23 | ) | | | 14.86 | | |
Year Ended October 31, 2007 | | | 14.86 | | | — | *(i) | | 4.23 | | | 4.23 | | | (0.01 | ) | | (1.13 | ) | | (1.14 | ) | | | 17.95 | | |
Year Ended October 31, 2008 | | | 17.95 | | | (0.05 | )* | | (6.51 | ) | | (6.56 | ) | | — | | | (0.84 | ) | | (0.84 | ) | | | 10.55 | | |
|
|
|
|
|
|
|
|
|
|
|
|
|
|
|
|
|
|
|
|
|
|
|
|
|
|
|
|
CLASS B SHARES | | | | | | | | | | | | | | | | | | | | | | | | | | | |
Period Ended October 31, 2004(f) | | $ | 12.28 | | | (0.07 | ) | | (0.10 | ) | | (0.17 | ) | | — | | | — | | | — | | | $ | 12.11 | | |
Year Ended October 31, 2005 | | | 12.11 | | | (0.07 | ) | | 1.53 | | | 1.46 | | | — | | | — | | | — | | | | 13.57 | | |
Year Ended October 31, 2006 | | | 13.57 | | | (0.12 | )* | | 0.95 | | | 0.83 | | | — | | | (0.23 | ) | | (0.23 | ) | | | 14.17 | | |
Year Ended October 31, 2007 | | | 14.17 | | | (0.11 | )* | | 3.99 | | | 3.88 | | | — | | | (1.13 | ) | | (1.13 | ) | | | 16.92 | | |
Year Ended October 31, 2008 | | | 16.92 | | | (0.16 | )* | | (6.07 | ) | | (6.23 | ) | | — | | | (0.84 | ) | | (0.84 | ) | | | 9.85 | | |
|
|
|
|
|
|
|
|
|
|
|
|
|
|
|
|
|
|
|
|
|
|
|
|
|
|
|
|
CLASS C SHARES | | | | | | | | | | | | | | | | | | | | | | | | | | | |
Year Ended October 31, 2004(f) | | $ | 12.35 | | | (0.06 | ) | | (0.12 | ) | | (0.18 | ) | | — | | | — | | | — | | | $ | 12.17 | | |
Year Ended October 31, 2005 | | | 12.17 | | | (0.07 | ) | | 1.54 | | | 1.47 | | | — | | | — | | | — | | | | 13.64 | | |
Year Ended October 31, 2006 | | | 13.64 | | | (0.16 | )* | | 0.99 | | | 0.83 | | | — | | | (0.23 | ) | | (0.23 | ) | | | 14.24 | | |
Year Ended October 31, 2007 | | | 14.24 | | | (0.11 | )* | | 4.02 | | | 3.91 | | | — | | | (1.13 | ) | | (1.13 | ) | | | 17.02 | | |
Year Ended October 31, 2008 | | | 17.02 | | | (0.16 | )* | | (6.11 | ) | | (6.27 | ) | | — | | | (0.84 | ) | | (0.84 | ) | | | 9.91 | | |
|
|
|
|
|
|
|
|
|
|
|
|
|
|
|
|
|
|
|
|
|
|
|
|
|
|
|
|
CLASS I SHARES | | | | | | | | | | | | | | | | | | | | | | | | | | | |
Period Ended October 31, 2004(f) | | $ | 12.67 | | | (0.01 | ) | | (0.11 | ) | | (0.12 | ) | | — | | | — | | | — | | | $ | 12.55 | | |
Year Ended October 31, 2005 | | | 12.55 | | | 0.06 | | | 1.59 | | | 1.65 | | | (0.08 | ) | | — | | | (0.08 | ) | | | 14.12 | | |
Year Ended October 31, 2006 | | | 14.12 | | | 0.02 | * | | 0.99 | | | 1.01 | | | — | | | (0.23 | ) | | (0.23 | ) | | | 14.90 | | |
Year Ended October 31, 2007 | | | 14.90 | | | 0.03 | * | | 4.24 | | | 4.27 | | | (0.02 | ) | | (1.13 | ) | | (1.15 | ) | | | 18.02 | | |
Year Ended October 31, 2008 | | | 18.02 | | | (0.02 | )* | | (6.54 | ) | | (6.56 | ) | | — | | | (0.84 | ) | | (0.84 | ) | | | 10.62 | | |
|
|
|
|
|
|
|
|
|
|
|
|
|
|
|
|
|
|
|
|
|
|
|
|
|
|
|
|
| | | | | | | | | | | | | | | | | | | | |
| | | | Ratios/Supplementary Data | |
| | | |
|
|
| | Total
Return(b) | | Net Assets
at End of
Period
(000’s) | | Ratio of Net
Expenses to
Average Net
Assets(c) | | Ratio of Net
Investment
Income to
Average
Net Assets(c) | | Ratio of
Expenses to
Average Net
Assets(c)(d) | | Portfolio
Turnover
Rate(e) | |
|
|
|
|
|
|
|
|
|
|
|
|
|
|
CLASS A SHARES | | | | | | | | | | | | | | |
Period Ended October 31, 2004(f) | | (1.03 | )% | | $ | 17,372 | | | 1.20 | % | | (0.42 | )% | | 1.31 | % | | 53.08 | % | |
Year Ended October 31, 2005 | | 12.91 | %(g) | | | 21,866 | | | 1.15 | %(g) | | 0.19 | %(g) | | 1.35 | % | | 79.54 | % | |
Year Ended October 31, 2006 | | 6.92 | % | | | 21,985 | | | 1.20 | % | | (0.14 | )% | | 1.44 | % | | 75.06 | % | |
Year Ended October 31, 2007 | | 30.45 | %(h) | | | 30,858 | | | 1.11 | %(h) | | (0.03 | )%(h) | | 1.22 | % | | 57.04 | % | |
Year Ended October 31, 2008 | | (38.23 | )%(j) | | | 17,180 | | | 1.20 | % | | (0.36 | )% | | 1.22 | % | | 157.87 | % | |
|
|
|
|
|
|
|
|
|
|
|
|
|
|
|
|
|
|
|
|
|
CLASS B SHARES | | | | | | | | | | | | | | | | | | | | |
Period Ended October 31, 2004(f) | | (1.38 | )% | | $ | 1,402 | | | 1.95 | % | | (1.17 | )% | | 2.06 | % | | 53.08 | % | |
Year Ended October 31, 2005 | | 12.06 | %(g) | | | 1,317 | | | 1.90 | %(g) | | (0.48 | )%(g) | | 2.09 | % | | 79.54 | % | |
Year Ended October 31, 2006 | | 6.16 | % | | | 1,446 | | | 1.95 | % | | (0.88 | )% | | 2.19 | % | | 75.06 | % | |
Year Ended October 31, 2007 | | 29.43 | %(h) | | | 1,630 | | | 1.86 | %(h) | | (0.78 | )%(h) | | 1.98 | % | | 57.04 | % | |
Year Ended October 31, 2008 | | (38.62 | %(j) | | | 2,839 | | | 1.95 | % | | (1.20 | )% | | 1.96 | % | | 157.87 | % | |
|
|
|
|
|
|
|
|
|
|
|
|
|
|
|
|
|
|
|
|
|
CLASS C SHARES | | | | | | | | | | | | | | | | | | | | |
Year Ended October 31, 2004(f) | | (1.46 | )% | | $ | 309 | | | 1.95 | % | | (1.18 | )% | | 2.06 | % | | 53.08 | % | |
Year Ended October 31, 2005 | | 12.08 | %(g) | | | 344 | | | 1.90 | %(g) | | (0.51 | )%(g) | | 2.10 | % | | 79.54 | % | |
Year Ended October 31, 2006 | | 6.13 | % | | | 270 | | | 1.95 | % | | (0.89 | )% | | 2.18 | % | | 75.06 | % | |
Year Ended October 31, 2007 | | 29.49 | %(h) | | | 98 | | | 1.86 | %(h) | | (0.79 | )%(h) | | 1.96 | % | | 57.04 | % | |
Year Ended October 31, 2008 | | (38.63 | )%(j) | | | 72 | | | 1.95 | % | | (1.13 | )% | | 1.97 | % | | 157.87 | % | |
|
|
|
|
|
|
|
|
|
|
|
|
|
|
|
|
|
|
|
|
|
CLASS I SHARES | | | | | | | | | | | | | | | | | | | | |
Period Ended October 31, 2004(f) | | 0.95 | % | | $ | 19,115 | | | 0.95 | % | | (0.17 | ) % | | 1.06 | % | | 53.08 | % | |
Year Ended October 31, 2005 | | 13.17 | %(g) | | | 13,107 | | | 0.90 | %(g) | | 0.56 | %(g) | | 1.07 | % | | 79.54 | % | |
Year Ended October 31, 2006 | | 7.21 | % | | | 15,042 | | | 0.95 | % | | 0.12 | % | | 1.19 | % | | 75.06 | % | |
Year Ended October 31, 2007 | | 30.73 | %(h) | | | 30,295 | | | 0.87 | %(h) | | 0.20 | %(h) | | 0.96 | % | | 57.04 | % | |
Year Ended October 31, 2008 | | (38.07 | )%(j) | | | 38,868 | | | 0.95 | % | | (0.16 | )% | | 0.97 | % | | 157.87 | % | |
|
|
|
|
|
|
|
|
|
|
|
|
|
|
|
|
|
|
|
|
|
| |
* | Calculated based on average shares outstanding. |
| |
(a) | The per share amounts and percentages reflect income and expenses assuming inclusion of the Fund’s proportionate share of the income and expenses of the HSBC Investor Growth Portfolio. |
| |
(b) | Not annualized for periods less than one year. Total return calculations do not include any sales or redemption charges. |
| |
(c) | Annualized for periods less than one year. |
| |
(d) | During the period certain fees were reduced. If such fee reductions had not occurred, the ratio would have been as indicated. |
| |
(e) | Portfolio turnover rate is calculated on the basis of the respective Portfolio in which the Fund invests all its investable assets. |
| |
(f) | Class A Shares, Class B Shares, Class C Shares and Class I Shares commenced operations on May 10, 2004. |
| |
(g) | During the year ended October 31, 2005, HSBC reimbursed certain amounts to the respective Portfolio in which the Fund invests related to violation of certain investment policies and limitations. The corresponding impact to the net expense ratio, net income ratio, gross expense ratio and total return were 0.05%, 0.05%, 0.05% and 0.05% for Class A Shares, Class B Shares, Class C Shares and Class I Shares, respectively. |
| |
(h) | During the year ended October 31, 2007, HSBC reimbursed amounts to certain Funds related to past marketing arrangements. The corresponding impact to the net expense ratio, net income ratio, and the total returns were 0.09%, 0.09%, 0.09%, and 0.08% for Class A Shares, Class B Shares, Class C Shares and Class I Shares, respectively. |
| |
(i) | Represents less than $0.005. |
| |
(j) | During the year ended October 31, 2008, the respective Portfolio in which the Fund invests in received monies related to certain nonrecurring litigation settlements. The corresponding impact to the total return was 0.19%, 0.19%, 0.19% and 0.19% for Class A Shares, Class B Shares, Class C Shares and Class I Shares, respectively. |
| | |
See notes to financial statements. | HSBC INVESTOR FAMILY OF FUNDS | 52 |
|
HSBC INVESTOR ADVISOR FUNDS TRUST—INTERNATIONAL EQUITY FUND |
|
Financial Highlights |
Selected data for a share outstanding throughout the periods indicated. (a)
| | | | | | | | | | | | | | | | | | | | | | | | | | | | | |
| | | | | Investment Activities | | Dividends | | | | |
| | | | |
| |
| | | | |
| | Net Asset
Value,
Beginning
of Period | | Net
Investment
Income | | Net Realized
and Unrealized
Gains (Losses)
from
Investments | | Total from
Investment
Activities | | Net
Investment
Income | | Net
Realized
Gains from
Investment
Transactions | | Total
Dividends | | Net Asset
Value, End
of Period | |
|
|
|
|
|
|
|
|
|
|
|
|
|
|
|
|
|
|
|
|
|
|
|
|
|
|
CLASS I SHARES | | | | | | | | | | | | | | | | | | | | | | | | | | | | | |
Year Ended October 31, 2004 | | | $ | 12.76 | | | 0.18 | | | 2.32 | | | 2.50 | | | (0.39 | ) | | — | | | (0.39 | ) | | | $ | 14.87 | | |
Year Ended October 31, 2005 | | | | 14.87 | | | 0.31 | | | 2.59 | | | 2.90 | | | (0.23 | ) | | — | | | (0.23 | ) | | | | 17.54 | | |
Year Ended October 31, 2006 | | | | 17.54 | | | 0.38 | | | 5.14 | | | 5.52 | | | (0.36 | ) | | (0.60 | ) | | (0.96 | ) | | | | 22.10 | | |
Year Ended October 31, 2007 | | | | 22.10 | | | 0.50 | | | 4.69 | | | 5.19 | | | (0.55 | ) | | (1.84 | ) | | (2.39 | ) | | | | 24.90 | | |
Year Ended October 31, 2008 | | | | 24.90 | | | 0.53 | | | (12.41 | ) | | (11.88 | ) | | (0.39 | ) | | (1.90 | ) | | (2.29 | ) | | | | 10.73 | | |
|
|
|
|
|
|
|
|
|
|
|
|
|
|
|
|
|
|
|
|
|
|
|
|
|
|
|
|
|
|
| | | | | | | | | | | | | | | | | | | | | |
| | | | | Ratios/Supplementary Data | |
| | | | |
| |
| | Total
Return(b) | | Net Assets
at End of
Period
(000’s) | | Ratio of Net
Expenses to
Average Net
Assets | | Ratio of Net
Investment
Income to
Average
Net Assets | | Ratio of
Expenses to
Average Net
Assets(c) | | Portfolio
Turnover
Rate(d) | |
|
|
|
|
|
|
|
|
|
|
|
|
|
|
CLASS I SHARES | | | | | | | | | | | | | | | | | | | | | |
Year Ended October 31, 2004 | | 20.06 | % | | | $ | 148,317 | | | 1.05 | % | | 1.39 | % | | 1.05 | % | | 106.11 | % | |
Year Ended October 31, 2005 | | 19.69 | % | | | | 193,144 | | | 0.92 | % | | 2.01 | % | | 0.92 | % | | 31.32 | % | |
Year Ended October 31, 2006 | | 32.70 | % | | | | 283,749 | | | 0.97 | % | | 2.02 | % | | 0.97 | % | | 33.39 | % | |
Year Ended October 31, 2007 | | 25.41 | %(e)(f) | | | | 385,717 | | | 0.87 | %(e) | | 2.15 | %(e) | | 0.89 | % | | 26.08 | % | |
Year Ended October 31, 2008 | | (51.92 | ) % | | | | 161,053 | | | 0.84 | % | | 2.69 | % | | 0.84 | % | | 28.98 | % | |
|
|
|
|
|
|
|
|
|
|
|
|
|
|
|
|
|
|
|
|
|
|
| |
(a) | The per share amounts and percentages reflect income and expense assuming inclusion of the Fund’s proportionate share of the income and expenses of the HSBC Investor International Portfolio. |
| |
(b) | Total return calculations do not include any sales or redemption charges. |
| |
(c) | During the period certain fees were reduced. If such fee reductions had not occurred, the ratio would have been as indicated. |
| |
(d) | Portfolio turnover rate is calculated on the basis of the respective Portfolio in which the Fund invests all of its investable assets. |
| |
(e) | During the year ended October 31, 2007, HSBC reimbursed amounts to certain Funds related to past marketing arrangements. The corresponding impact to the net expense ratio, net income ratio, and the total return were 0.02% for the Advisor Shares. |
| |
(f) | During the year ended October 31, 2007, the Fund received monies related to certain nonrecurring litigation settlements. The corresponding impact to the total return was 0.18%. |
| | |
53 | HSBC INVESTOR FAMILY OF FUNDS | See notes to financial statements. |
|
HSBC INVESTOR FUNDS—MID-CAP FUND |
|
Financial Highlights |
Selected data for a share outstanding throughout the periods indicated.
| | | | | | | | | | | | | | | | | | | | | | | | | | |
| | | | | Investment Activities | | Dividends | | | | |
| | | | |
| |
| | | | |
| | Net Asset
Value,
Beginning
of Period | | Net
Investment
Income
(Loss) | | Net
Realized and
Unrealized
Gains from
Investments | | Total from
Investment
Activities | | Net
Realized
Gains from
Investment
Transactions | | Total
Dividends | | Net Asset
Value, End
of Period | |
|
|
|
|
|
|
|
|
|
|
|
|
|
|
|
|
CLASS A SHARES | | | | | | | | | | | | | | | | | | | | | | | | | | |
Year Ended October 31, 2004 | | | $ | 7.95 | | | (0.04 | )* | | 0.53 | | | 0.49 | | | — | | | — | | | | $ | 8.44 | | |
Year Ended October 31, 2005 | | | | 8.44 | | | (0.06 | )* | | 1.49 | | | 1.43 | | | — | | | — | | | | | 9.87 | | |
Year Ended October 31, 2006 | | | | 9.87 | | | (0.00 | )> | | 1.19 | | | 1.19 | | | (2.18 | ) | | (2.18 | ) | | | | 8.88 | | |
Year Ended October 31, 2007 | | | | 8.88 | | | (0.04 | )* | | 2.59 | | | 2.55 | | | (0.62 | ) | | (0.62 | ) | | | | 10.81 | | |
Year Ended October 31, 2008 | | | | 10.81 | | | (0.03 | )* | | (4.17 | ) | | (4.20 | ) | | (1.23 | ) | | (1.23 | ) | | | | 5.38 | | |
|
|
|
|
|
|
|
|
|
|
|
|
|
|
|
|
|
|
|
|
|
|
|
|
|
|
|
CLASS B SHARES | | | | | | | | | | | | | | | | | | | | | | | | | | |
Year Ended October 31, 2004 | | | $ | 7.75 | | | (0.10 | )* | | 0.51 | | | 0.41 | | | — | | | — | | | | $ | 8.16 | | |
Year Ended October 31, 2005 | | | | 8.16 | | | (0.13 | )* | | 1.45 | | | 1.32 | | | — | | | — | | | | | 9.48 | | |
Year Ended October 31, 2006 | | | | 9.48 | | | (0.06 | )* | | 1.13 | | | 1.07 | | | (2.18 | ) | | (2.18 | ) | | | | 8.37 | | |
Year Ended October 31, 2007 | | | | 8.37 | | | (0.10 | )* | | 2.42 | | | 2.32 | | | (0.62 | ) | | (0.62 | ) | | | | 10.07 | | |
Year Ended October 31, 2008 | | | | 10.07 | | | (0.09 | )* | | (3.83 | ) | | (3.92 | ) | | (1.23 | ) | | (1.23 | ) | | | | 4.92 | | |
|
|
|
|
|
|
|
|
|
|
|
|
|
|
|
|
|
|
|
|
|
|
|
|
|
|
|
CLASS C SHARES | | | | | | | | | | | | | | | | | | | | | | | | | | |
Year Ended October 31, 2004 | | | $ | 7.80 | | | (0.10 | )* | | 0.52 | | | 0.42 | | | — | | | — | | | | $ | 8.22 | | |
Year Ended October 31, 2005 | | | | 8.22 | | | (0.13 | )* | | 1.45 | | | 1.32 | | | — | | | — | | | | | 9.54 | | |
Year Ended October 31, 2006 | | | | 9.54 | | | (0.06 | )* | | 1.15 | | | 1.09 | | | (2.18 | ) | | (2.18 | ) | | | | 8.45 | | |
Year Ended October 31, 2007 | | | | 8.45 | | | (0.10 | )* | | 2.43 | | | 2.33 | | | (0.62 | ) | | (0.62 | ) | | | | 10.16 | | |
Year Ended October 31, 2008 | | | | 10.16 | | | (0.10 | )* | | (3.86 | ) | | (3.96 | ) | | (1.23 | ) | | (1.23 | ) | | | | 4.97 | | |
|
|
|
|
|
|
|
|
|
|
|
|
|
|
|
|
|
|
|
|
|
|
|
|
|
|
|
CLASS I SHARES | | | | | | | | | | | | | | | | | | | | | | | | | | |
Year Ended October 31, 2004 | | | $ | 8.01 | | | (0.02 | )* | | 0.53 | | | 0.51 | | | — | | | — | | | | $ | 8.52 | | |
Year Ended October 31, 2005 | | | | 8.52 | | | (0.02 | )* | | 1.48 | | | 1.46 | | | — | | | — | | | | | 9.98 | | |
Year Ended October 31, 2006 | | | | 9.98 | | | 0.03 | * | | 1.20 | | | 1.23 | | | (2.18 | ) | | (2.18 | ) | | | | 9.03 | | |
Year Ended October 31, 2007 | | | | 9.03 | | | (0.02 | )* | | 2.64 | | | 2.62 | | | (0.62 | ) | | (0.62 | ) | | | | 11.03 | | |
Year Ended October 31, 2008 | | | | 11.03 | | | (0.01 | )* | | (4.28 | ) | | (4.29 | ) | | (1.23 | ) | | (1.23 | ) | | | | 5.51 | | |
|
|
|
|
|
|
|
|
|
|
|
|
|
|
|
|
|
|
|
|
|
|
|
|
|
|
|
| | | | | | | | | | | | | | | | | | | | | |
| | | | | Ratios/Supplementary Data | |
| | | | |
| |
| | Total
Return(a) | | Net Assets
at End of
Period
(000’s) | | Ratio of Net
Expenses to
Average Net
Assets | | Ratio of Net
Investment
Income to
Average
Net Assets | | Ratio of
Expenses to
Average Net
Assets(b) | | Portfolio
Turnover
Rate(c) | |
|
|
|
|
|
|
|
|
|
|
|
|
|
|
|
|
|
|
|
|
CLASS A SHARES | | | | | | | | | | | | | | | | | | | | | |
Year Ended October 31, 2004 | | 6.16 | % | | | $ | 1,878 | | | 1.09 | % | | (0.54 | )% | | 1.09 | % | | 106.72 | % | |
Year Ended October 31, 2005 | | 16.94 | %(d) | | | | 2,151 | | | 1.38 | %(d) | | (0.65 | )%(d) | | 1.53 | % | | 169.62 | % | |
Year Ended October 31, 2006 | | 13.66 | % | | | | 3,185 | | | 1.48 | % | | (0.01 | )% | | 1.85 | % | | 53.16 | % | |
Year Ended October 31, 2007 | | 30.51 | %(e) | | | | 5,897 | | | 1.19 | %(e) | | (0.45 | )%(e) | | 1.70 | % | | 66.16 | % | |
Year Ended October 31, 2008 | | (43.49 | )% | | | | 3,584 | | | 1.35 | % | | (0.36 | )% | | 1.80 | % | | 64.65 | % | |
|
|
|
|
|
|
|
|
|
|
|
|
|
|
|
|
|
|
|
|
|
|
CLASS B SHARES | | | | | | | | | | | | | | | | | | | | | |
Year Ended October 31, 2004 | | 5.29 | % | | | $ | 7,037 | | | 1.84 | % | | (1.29 | )% | | 1.84 | % | | 106.72 | % | |
Year Ended October 31, 2005 | | 16.18 | %(d) | | | | 7,415 | | | 2.11 | %(d) | | (1.38 | )%(d) | | 2.27 | % | | 169.62 | % | |
Year Ended October 31, 2006 | | 12.78 | % | | | | 7,425 | | | 2.25 | % | | (0.72 | )% | | 2.60 | % | | 53.16 | % | |
Year Ended October 31, 2007 | | 29.56 | %(e) | | | | 6,285 | | | 1.92 | %(e) | | (1.15 | )%(e) | | 2.48 | % | | 66.16 | % | |
Year Ended October 31, 2008 | | (43.97 | )% | | | | 1,975 | | | 2.09 | % | | (1.15 | )% | | 2.51 | % | | 64.65 | % | |
|
|
|
|
|
|
|
|
|
|
|
|
|
|
|
|
|
|
|
|
|
|
CLASS C SHARES | | | | | | | | | | | | | | | | | | | | | |
Year Ended October 31, 2004 | | 5.38 | % | | | $ | 94 | | | 1.84 | % | | (1.29 | )% | | 1.84 | % | | 106.72 | % | |
Year Ended October 31, 2005 | | 16.06 | %(d) | | | | 111 | | | 2.13 | %(d) | | (1.40 | )%(d) | | 2.28 | % | | 169.62 | % | |
Year Ended October 31, 2006 | | 12.93 | % | | | | 95 | | | 2.25 | % | | (0.72 | )% | | 2.60 | % | | 53.16 | % | |
Year Ended October 31, 2007 | | 29.40 | %(e) | | | | 79 | | | 1.93 | %(e) | | (1.16 | )%(e) | | 2.46 | % | | 66.16 | % | |
Year Ended October 31, 2008 | | (43.97 | )% | | | | 12 | | | 2.09 | % | | (1.20 | )% | | 2.49 | % | | 64.65 | % | |
|
|
|
|
|
|
|
|
|
|
|
|
|
|
|
|
|
|
|
|
|
|
CLASS I SHARES | | | | | | | | | | | | | | | | | | | | | |
Year Ended October 31, 2004 | | 6.37 | % | | | $ | 117,354 | | | 0.84 | % | | (0.28 | )% | | 0.84 | % | | 106.72 | % | |
Year Ended October 31, 2005 | | 17.14 | %(d) | | | | 19,618 | | | 0.89 | %(d) | | (0.19 | )%(d) | | 1.02 | % | | 169.62 | % | |
Year Ended October 31, 2006 | | 13.97 | % | | | | 17,029 | | | 1.26 | % | | 0.29 | % | | 1.60 | % | | 53.16 | % | |
Year Ended October 31, 2007 | | 30.80 | %(e) | | | | 20,671 | | | 0.93 | %(e) | | (0.19 | )%(e) | | 1.47 | % | | 66.16 | % | |
Year Ended October 31, 2008 | | (43.44 | )% | | | | 11,080 | | | 1.10 | % | | (0.12 | )% | | 1.54 | % | | 64.65 | % | |
|
|
|
|
|
|
|
|
|
|
|
|
|
|
|
|
|
|
|
|
|
|
| |
* | Calculated based on average shares outstanding. |
| |
> | Less than $0.005 per share. |
| |
(a) | Total return calculations do not include any sales or redemption charges. |
| |
(b) | During the period certain fees were reduced. If such fee reductions had not occurred, the ratio would have been indicated. |
| |
(c) | Portfolio turnover rate is calculated on the basis of the Fund as a whole, without the distinguishing between the classes of shares issued. |
| |
(d) | During the year ended October 31, 2005, HSBC reimbursed certain amounts to the Fund related to violation of certain investment policies and limitations. The corresponding impact to the net expense ratio and net income ratio were 0.10%, 0.10%, 0.10% and 0.09% for Class A Shares, Class B Shares, Class C Shares and Trust Shares, respectively. The corresponding impact to the total return was 0.57%, 0.57%, 0.57% and 0.56% for Class A. |
| |
(e) | During the year ended October 31, 2007, HSBC reimbursed amounts to certain Funds related to past marketing arrangements. The corresponding impact to the net expense ratio, net income ratio, and the total returns were 0.16%, 0.18%, 0.17%, and 0.17% for Class A Shares, Class B Shares, Class C Shares and Class Y Shares, respectively. |
| | |
See notes to financial statements. | HSBC INVESTOR FAMILY OF FUNDS | 54 |
|
HSBC INVESTOR FUNDS—OPPORTUNITY FUND |
|
Financial Highlights |
|
Selected data for a share outstanding throughout the periods indicated. (a) |
| | | | | | | | | | | | | | | | | | | | | | | | | | |
| | | | Investment Activities | | Dividends | | | |
| | | |
| |
| | | |
| | Net Asset
Value,
Beginning
of Period | | Net
Investment
Income
(Loss) | | Net
Realized and
Unrealized
Gains from
Investments | | Total from
Investment
Activities | | Net
Realized
Gains from
Investment
Transactions | | Total
Dividends | | Net Asset
Value, End
of Period | |
|
|
|
|
|
|
|
|
|
|
|
|
|
|
|
|
CLASS A SHARES | | | | | | | | | | | | | | | | | | | | | | |
Year Ended October 31, 2004 | | | $ | 10.36 | | | (0.13 | ) | | 0.68 | | | 0.55 | | | — | | | — | | | | $ | 10.91 | | |
Year Ended October 31, 2005 | | | | 10.91 | | | (0.14 | ) | | 1.62 | | | 1.48 | | | — | | | — | | | | | 12.39 | | |
Year Ended October 31, 2006 | | | | 12.39 | | | (0.14 | )* | | 2.43 | | | 2.29 | | | (0.39 | ) | | (0.39 | ) | | | | 14.29 | | |
Year Ended October 31, 2007 | | | | 14.29 | | | (0.16 | )* | | 4.01 | | | 3.85 | | | (1.73 | ) | | (1.73 | ) | | | | 16.41 | | |
Year Ended October 31, 2008 | | | | 16.41 | | | (0.12 | )* | | (4.04 | ) | | (4.16 | ) | | (5.16 | ) | | (5.16 | ) | | | | 7.09 | | |
|
|
|
|
|
|
|
|
|
|
|
|
|
|
|
|
|
|
|
|
|
|
|
|
|
|
|
CLASS B SHARES | | | | | | | | | | | | | | | | | | | | | | | | | | |
Year Ended October 31, 2004 | | | $ | 9.85 | | | (0.20 | ) | | 0.64 | | | 0.44 | | | — | | | — | | | | $ | 10.29 | | |
Year Ended October 31, 2005 | | | | 10.29 | | | (0.22 | ) | | 1.53 | | | 1.31 | | | — | | | — | | | | | 11.60 | | |
Year Ended October 31, 2006 | | | | 11.60 | | | (0.23 | )* | | 2.27 | | | 2.04 | | | (0.39 | ) | | (0.39 | ) | | | | 13.25 | | |
Year Ended October 31, 2007 | | | | 13.25 | | | (0.25 | )* | | 3.67 | | | 3.42 | | | (1.73 | ) | | (1.73 | ) | | | | 14.94 | | |
Year Ended October 31, 2008 | | | | 14.94 | | | (0.18 | )* | | (3.50 | ) | | (3.68 | ) | | (5.16 | ) | | (5.16 | ) | | | | 6.10 | | |
|
|
|
|
|
|
|
|
|
|
|
|
|
|
|
|
|
|
|
|
|
|
|
|
|
|
|
CLASS C SHARES | | | | | | | | | | | | | | | | | | | | | | | | | | |
Year Ended October 31, 2004 | | | $ | 9.94 | | | (0.22 | ) | | 0.67 | | | 0.45 | | | — | | | — | | | | $ | 10.39 | | |
Year Ended October 31, 2005 | | | | 10.39 | | | (0.21 | ) | | 1.53 | | | 1.32 | | | — | | | — | | | | | 11.71 | | |
Year Ended October 31, 2006 | | | | 11.71 | | | (0.23 | )* | | 2.29 | | | 2.06 | | | (0.39 | ) | | (0.39 | ) | | | | 13.38 | | |
Year Ended October 31, 2007 | | | | 13.38 | | | (0.26 | )* | | 3.72 | | | 3.46 | | | (1.73 | ) | | (1.73 | ) | | | | 15.11 | | |
Year Ended October 31, 2008 | | | | 15.11 | | | (0.17 | )* | | (3.57 | ) | | (3.74 | ) | | (5.16 | ) | | (5.16 | ) | | | | 6.21 | | |
|
|
|
|
|
|
|
|
|
|
|
|
|
|
|
|
|
|
|
|
|
|
|
|
|
|
|
| | | | | | | | | | | | | | | | | | | | | |
| | | | Ratios/Supplementary Data | |
| | | |
|
|
| | Total
Return(b) | | Net Assets
at End of
Period
(000’s) | | Ratio of Net
Expenses to
Average Net
Assets | | Ratio of Net
Investment
Income to
Average
Net Assets | | Ratio of
Expenses to
Average Net
Assets(c) | | Portfolio
Turnover
Rate(d) | |
|
|
|
|
|
|
|
|
|
|
|
|
|
|
CLASS A SHARES | | | | | | | | | | | | | | | | | | | | | |
Year Ended October 31, 2004 | | 5.31 | % | | | $ | 20,902 | | | 1.61 | % | | (1.24 | )% | | 1.72 | % | | 81.75 | % | |
Year Ended October 31, 2005 | | 13.57 | % (e) | | | | 22,875 | | | 1.51 | %(e) | | (1.11 | )%(e) | | 1.69 | %(e) | | 63.95 | % | |
Year Ended October 31, 2006 | | 18.81 | % | | | | 24,463 | | | 1.55 | % | | (1.04 | )% | | 1.70 | % | | 60.83 | % | |
Year Ended October 31, 2007 | | 30.28 | %(f) | | | | 15,057 | | | 1.52 | %(f) | | (1.13 | )%(f) | | 1.77 | % | | 69.41 | % | |
Year Ended October 31, 2008 | | (35.84 | )% | | | | 9,600 | | | 1.55 | % | | (1.13 | )% | | 1.82 | % | | 80.42 | % | |
|
|
|
|
|
|
|
|
|
|
|
|
|
|
|
|
|
|
|
|
|
|
CLASS B SHARES | | | | | | | | | | | | | | | | | | | | | |
Year Ended October 31, 2004 | | 4.47 | % | | | $ | 4,611 | | | 2.36 | % | | (2.00 | )% | | 2.47 | % | | 81.75 | % | |
Year Ended October 31, 2005 | | 12.73 | %(e) | | | | 4,539 | | | 2.26 | %(e) | | (1.86 | )%(e) | | 2.44 | %(e) | | 63.95 | % | |
Year Ended October 31, 2006 | | 17.91 | % | | | | 4,768 | | | 2.30 | % | | (1.79 | )% | | 2.45 | % | | 60.83 | % | |
Year Ended October 31, 2007 | | 29.30 | %(f) | | | | 4,928 | | | 2.26 | %(f) | | (1.91 | )%(f) | | 2.52 | % | | 69.41 | % | |
Year Ended October 31, 2008 | | (36.30 | )% | | | | 1,578 | | | 2.29 | % | | (1.88 | )% | | 2.58 | % | | 80.42 | % | |
|
|
|
|
|
|
|
|
|
|
|
|
|
|
|
|
|
|
|
|
|
|
CLASS C SHARES | | | | | | | | | | | | | | | | | | | | | |
Year Ended October 31, 2004 | | 4.53 | % | | | $ | 344 | | | 2.37 | % | | (2.00 | )% | | 2.48 | % | | 81.75 | % | |
Year Ended October 31, 2005 | | 12.70 | %(e) | | | | 306 | | | 2.26 | %(e) | | (1.86 | )%(e) | | 2.44 | %(e) | | 63.95 | % | |
Year Ended October 31, 2006 | | 17.92 | % | | | | 299 | | | 2.30 | % | | (1.78 | )% | | 2.45 | % | | 60.83 | % | |
Year Ended October 31, 2007 | | 29.32 | %(f) | | | | 334 | | | 2.27 | %(f) | | (1.91 | )%(f) | | 2.50 | % | | 69.41 | % | |
Year Ended October 31, 2008 | | (36.27 | )% | | | | 189 | | | 2.30 | % | | (1.88 | )% | | 2.58 | % | | 80.42 | % | |
|
|
|
|
|
|
|
|
|
|
|
|
|
|
|
|
|
|
|
|
|
|
| |
* | Calculated based on average shares outstanding. |
| |
(a) | The per share amounts and percentages reflect income and expense assuming inclusion of the Fund’s proportionate share of the income and expenses of the HSBC Investor Opportunity Portfolio. |
| |
(b) | Total return calculations do not include any sales or redemption charges. |
| |
(c) | During the period certain fees were reduced. If such fee reductions had not occurred, the ratio would have been as indicated. |
| |
(d) | Portfolio turnover rate is calculated on the basis of the respective Portfolio in which the Fund invests all of its investable assets. |
| |
(e) | During the year ended October 31, 2005, HSBC reimbursed certain amounts to the respective Portfolio in which the Fund invests related to violation of certain investment policies and limitations. The corresponding impact to the net expense ratio, net income ratio, gross expense ratio and total return were 0.04%, 0.04% and 0.04% for Class A Shares, Class B Shares and Class C Shares, respectively. |
| |
(f) | During the year ended October 31, 2007, HSBC reimbursed amounts to certain Funds related to past marketing arrangements. The corresponding impact to the net expense ratio, net income ratio, and the total returns were 0.03%, 0.04%, and 0.03% for Class A Shares, Class B Shares, and Class C Shares, respectively. |
| | |
55 | HSBC INVESTOR FAMILY OF FUNDS | See notes to financial statements. |
|
HSBC INVESTOR ADVISOR FUNDS TRUST—OPPORTUNITY FUND (ADVISOR) |
|
Financial Highlights |
Selected data for a share outstanding throughout the periods indicated. (a)
| | | | | | | | | | | | | | | | | | | | | | | | | | |
| | | | | | | Investment Activities | | Dividends | | | | | | |
| | | | | | |
| |
| | | | | | |
| | Net Asset
Value,
Beginning
of Period | | Net
Investment
Income
(Loss) | | Net
Realized and
Unrealized
Gains from
Investments | | Total from
Investment
Activities | | Net
Realized
Gains from
Investment
Transactions | | Total
Dividends | | Net Asset
Value, End
of Period | |
|
|
|
|
|
|
|
|
|
|
|
|
|
|
|
|
CLASS I SHARES | | | | | | | | | | | | | | | | | | | | | | | | | | |
Year Ended October 31, 2004 | | | $ | 12.36 | | | (0.08 | ) | | 0.79 | | | 0.71 | | | — | | | — | | | | $ | 13.07 | | |
Year Ended October 31, 2005 | | | | 13.07 | | | (0.10 | ) | | 1.97 | | | 1.87 | | | — | | | — | | | | | 14.94 | | |
Year Ended October 31, 2006 | | | | 14.94 | | | (0.09 | ) | | 2.93 | | | 2.84 | | | (0.50 | ) | | (0.50 | ) | | | | 17.28 | | |
Year Ended October 31, 2007 | | | | 17.28 | | | (0.11 | ) | | 4.48 | | | 4.37 | | | (2.71 | ) | | (2.71 | ) | | | | 18.94 | | |
Year Ended October 31, 2008 | | | | 18.94 | | | (0.07 | ) | | (4.99 | ) | | (5.06 | ) | | (4.97 | ) | | (4.97 | ) | | | | 8.91 | | |
|
|
|
|
|
|
|
|
|
|
|
|
|
|
|
|
|
|
|
|
|
|
|
|
|
|
|
| | | | | | | | | | | | | | | | | | | | | |
| | | | Ratios/Supplementary Data |
| | | |
|
| | Total
Return(b) | | Net Assets
at End of
Period
(000’s) | | Ratio of Net
Expenses to
Average Net
Assets | | Ratio of Net
Investment
Income to
Average
Net Assets | | Ratio of
Expenses to
Average Net
Assets(c) | | Portfolio
Turnover
Rate(d) | |
|
|
|
|
|
|
|
|
|
|
|
|
|
|
CLASS I SHARES | | | | | | | | | | | | | | | | | | | | | |
Year Ended October 31, 2004 | | 5.74 | % | | | $ | 279,669 | | | 0.98 | % | | (0.62 | )% | | 0.98 | % | | 81.75 | % | |
Year Ended October 31, 2005 | | 14.31 | %(e) | | | | 177,519 | | | 0.94 | %(e) | | (0.54 | )%(e) | | 0.94 | % | | 63.95 | % | |
Year Ended October 31, 2006 | | 19.40 | % | | | | 192,124 | | | 1.03 | % | | (0.51 | )% | | 1.03 | % | | 60.83 | % | |
Year Ended October 31, 2007 | | 29.42 | %(f) | | | | 176,593 | | | 0.96 | %(f) | | (0.60 | )% | | 1.03 | % | | 69.41 | % | |
Year Ended October 31, 2008 | | (35.39 | )% | | | | 97,841 | | | 0.97 | % | | (0.55 | )% | | 0.97 | % | | 80.42 | % | |
|
|
|
|
|
|
|
|
|
|
|
|
|
|
|
|
|
|
|
|
|
|
| |
(a) | The per share amounts and percentages reflect income and expense assuming inclusion of the Fund’s proportionate share of the income and expenses of the HSBC Investor Opportunity Portfolio. |
|
(b) | Total return calculations do not include any sales or redemption charges. |
|
(c) | During the period certain fees were reduced. If such fee reductions had not occurred, the ratio would have been as indicated. |
|
(d) | Portfolio turnover rate is calculated on the basis of the respective Portfolio in which the Fund invests all of its investable assets. |
|
(e) | During the year ended October 31, 2005, HSBC reimbursed certain amounts to the respective Portfolio in which the Fund invests related to violation of certain investment policies and limitations. The corresponding impact to the net expense ratio, net income ratio, gross expense ratio and total return was 0.04% for the Advisor Shares. |
|
(f) | During the year ended October 31, 2007, HSBC reimbursed amounts to certain Funds related to past marketing arrangements. The corresponding impact to the net expense ratio, net income ratio, and the total return were 0.07% for the Advisor Shares. |
| | |
See notes to financial statements. | HSBC INVESTOR FAMILY OF FUNDS | 56 |
|
HSBC INVESTOR FUNDS—OVERSEAS EQUITY FUND |
|
Financial Highlights |
|
Selected data for a share outstanding throughout the periods indicated. (a) |
| | | | | | | | | | | | | | | | | | | | | | | | | | | | | |
| | | | | Investment Activities | | Dividends | | | | |
| | | | |
| |
| | | | |
| | Net Asset
Value,
Beginning
of Period | | Net
Investment
Income (Loss) | | Net Realized
and Unrealized
Gains (Losses)
from
Investments | | Total from
Investment
Activities | | Net
Investment
Income | | Net
Realized
Gains from
Investment
Transactions | | Total
Dividends | | Net Asset
Value, End
of Period | |
|
|
|
|
|
|
|
|
|
|
|
|
|
|
|
|
|
|
|
|
|
|
|
|
|
|
CLASS A SHARES | | | | | | | | | | | | | | | | | | | | | | | | | |
Year Ended October 31, 2004 | | | $ | 11.73 | | | 0.08 | | | 2.19 | | | 2.27 | | | (0.07 | ) | | — | | | (0.07 | ) | | | $ | 13.93 | | |
Year Ended October 31, 2005 | | | | 13.93 | | | 0.18 | | | 2.33 | | | 2.51 | | | (0.06 | ) | | (0.79 | ) | | (0.85 | ) | | | | 15.59 | | |
Year Ended October 31, 2006 | | | | 15.59 | | | 0.22 | | | 4.45 | | | 4.67 | | | (0.25 | ) | | (1.16 | ) | | (1.41 | ) | | | | 18.85 | | |
Year Ended October 31, 2007 | | | | 18.85 | | | 0.22 | * | | 3.92 | | | 4.14 | | | (0.40 | ) | | (2.11 | ) | | (2.51 | ) | | | | 20.48 | | |
Year Ended October 31, 2008 | | | | 20.48 | | | 0.24 | * | | (9.41 | ) | | (9.17 | ) | | (0.15 | ) | | (3.31 | ) | | (3.46 | ) | | | | 7.85 | | |
|
|
|
|
|
|
|
|
|
|
|
|
|
|
|
|
|
|
|
|
|
|
|
|
|
|
|
|
|
|
CLASS B SHARES | | | | | | | | | | | | | | | | | | | | | | | | | | | | | |
Year Ended October 31, 2004 | | | $ | 11.34 | | | 0.01 | * | | 2.08 | | | 2.09 | | | — | | | — | | | — | | | | $ | 13.43 | | |
Year Ended October 31, 2005 | | | | 13.43 | | | 0.07 | | | 2.24 | | | 2.31 | | | — | | | (0.79 | ) | | (0.79 | ) | | | | 14.95 | | |
Year Ended October 31, 2006 | | | | 14.95 | | | 0.09 | | | 4.26 | | | 4.35 | | | (0.14 | ) | | (1.16 | ) | | (1.30 | ) | | | | 18.00 | | |
Year Ended October 31, 2007 | | | | 18.00 | | | 0.10 | * | | 3.70 | | | 3.80 | | | (0.27 | ) | | (2.11 | ) | | (2.38 | ) | | | | 19.42 | | |
Year Ended October 31, 2008 | | | | 19.42 | | | 0.14 | * | | (8.86 | ) | | (8.72 | ) | | (0.03 | ) | | (3.31 | ) | | (3.34 | ) | | | | 7.36 | | |
|
|
|
|
|
|
|
|
|
|
|
|
|
|
|
|
|
|
|
|
|
|
|
|
|
|
|
|
|
|
CLASS C SHARES | | | | | | | | | | | | | | | | | | | | | | | | | | | | | |
Year Ended October 31, 2004 | | | $ | 11.54 | | | (0.01 | ) | | 2.14 | | | 2.13 | | | — | | | — | | | — | | | | $ | 13.67 | | |
Year Ended October 31, 2005 | | | | 13.67 | | | 0.06 | | | 2.29 | | | 2.35 | | | — | | | (0.79 | ) | | (0.79 | ) | | | | 15.23 | | |
Year Ended October 31, 2006 | | | | 15.23 | | | 0.11 | | | 4.33 | | | 4.44 | | | (0.14 | ) | | (1.16 | ) | | (1.30 | ) | | | | 18.37 | | |
Year Ended October 31, 2007 | | | | 18.37 | | | 0.11 | * | | 3.80 | | | 3.91 | | | (0.23 | ) | | (2.11 | ) | | (2.34 | ) | | | | 19.94 | | |
Year Ended October 31, 2008 | | | | 19.94 | | | 0.15 | * | | (9.15 | ) | | (9.00 | ) | | (0.02 | ) | | (3.31 | ) | | (3.33 | ) | | | | 7.61 | | |
|
|
|
|
|
|
|
|
|
|
|
|
|
|
|
|
|
|
|
|
|
|
|
|
|
|
|
|
|
|
| | | | | | | | | | | | | | | | | | | | | |
| | | | | Ratios/Supplementary Data | |
| | | | |
|
| | Total
Return(b) | | Net Assets
at End of
Period
(000’s) | | Ratio of Net
Expenses to
Average Net
Assets | | Ratio of Net
Investment
Income to
Average
Net Assets | | Ratio of
Expenses to
Average Net
Assets(c) | | Portfolio
Turnover
Rate(d) | |
|
|
|
|
|
|
|
|
|
|
|
|
|
|
|
|
|
|
|
|
CLASS A SHARES | | | | | | | | | | | | | | | | | | | |
Year Ended October 31, 2004 | | 19.40 | % | | | $ | 17,721 | | | 1.78 | % | | 0.79 | % | | 1.88 | % | | 106.11 | % | |
Year Ended October 31, 2005 | | 18.64 | % | | | | 20,680 | | | 1.66 | % | | 1.21 | % | | 1.66 | % | | 31.32 | % | |
Year Ended October 31, 2006 | | 31.85 | % | | | | 22,761 | | | 1.67 | % | | 1.24 | % | | 1.67 | % | | 33.39 | % | |
Year Ended October 31, 2007 | | 24.19 | %(e) | | | | 16,078 | | | 1.62 | %(e) | | 1.15 | %(e) | | 1.64 | % | | 26.08 | % | |
Year Ended October 31, 2008 | | (52.63 | )% | | | | 6,645 | | | 1.70 | % | | 1.75 | % | | 1.81 | % | | 28.98 | % | |
|
|
|
|
|
|
|
|
|
|
|
|
|
|
|
|
|
|
|
|
|
|
CLASS B SHARES | | | | | | | | | | | | | | | | | | | | | |
Year Ended October 31, 2004 | | 18.43 | % | | | $ | 2,061 | | | 2.53 | % | | 0.05 | % | | 2.63 | % | | 106.11 | % | |
Year Ended October 31, 2005 | | 17.72 | % | | | | 2,403 | | | 2.41 | % | | 0.47 | % | | 2.41 | % | | 31.32 | % | |
Year Ended October 31, 2006 | | 30.87 | % | | | | 3,234 | | | 2.42 | % | | 0.58 | % | | 2.42 | % | | 33.39 | % | |
Year Ended October 31, 2007 | | 23.26 | %(e) | | | | 3,698 | | | 2.37 | %(e) | | 0.59 | %(e) | | 2.40 | % | | 26.08 | % | |
Year Ended October 31, 2008 | | (52.97 | )% | | | | 1,249 | | | 2.45 | % | | 1.05 | % | | 2.56 | % | | 28.98 | % | |
|
|
|
|
|
|
|
|
|
|
|
|
|
|
|
|
|
|
|
|
|
|
CLASS C SHARES | | | | | | | | | | | | | | | | | | | | | |
Year Ended October 31, 2004 | | 18.46 | % | | | $ | 137 | | | 2.54 | % | | (0.10 | )% | | 2.66 | % | | 106.11 | % | |
Year Ended October 31, 2005 | | 17.70 | % | | | | 164 | | | 2.41 | % | | 0.48 | % | | 2.41 | % | | 31.32 | % | |
Year Ended October 31, 2006 | | 30.92 | % | | | | 163 | | | 2.41 | % | | 0.58 | % | | 2.41 | % | | 33.39 | % | |
Year Ended October 31, 2007 | | 23.39 | %(e) | | | | 147 | | | 2.30 | %(e) | | 0.59 | %(e) | | 2.32 | % | | 26.08 | % | |
Year Ended October 31, 2008 | | (52.96 | )% | | | | 58 | | | 2.45 | % | | 1.12 | % | | 2.57 | % | | 28.98 | % | |
|
|
|
|
|
|
|
|
|
|
|
|
|
|
|
|
|
|
|
|
|
|
| |
* | Calculated based on average shares outstanding. |
| |
(a) | The per share amounts and percentages reflect income and expense assuming inclusion of the Fund’s proportionate share of the income and expenses of the HSBC Investor International Portfolio. |
| |
(b) | Total return calculations do not include any sales or redemption charges. |
| |
(c) | During the period certain fees were reduced. If such fee reductions had not occurred, the ratio would have been as indicated. |
| |
(d) | Portfolio turnover rate is calculated on the basis of the respective Portfolio in which the Fund invests all of its investable assets. |
| |
(e) | During the year ended October 31, 2007, HSBC reimbursed amounts to certain Funds related to past marketing arrangements. The corresponding impact to the net expense ratio, net income ratio, and the total returns were 0.02%, 0.03%, and 0.02% for Class A Shares, Class B Shares, and Class C Shares, respectively. |
| | |
57 | HSBC INVESTOR FAMILY OF FUNDS | See notes to financial statements. |
|
HSBC INVESTOR FUNDS—VALUE FUND |
|
Financial Highlights |
|
Selected data for a share outstanding throughout the periods indicated. (a) |
| | | | | | | | | | | | | | | | | | | | | | | | | | | | | |
| | | | | Investment Activities | | Dividends | | | | |
| | | | |
| |
| | | | |
| | Net Asset
Value,
Beginning
of Period | | Net
Investment
Income (Loss) | | Net Realized
and Unrealized
Gains (Losses)
from
Investments | | Total from
Investment
Activities | | Net
Investment
Income | | Net
Realized
Gains from
Investment
Transactions | | Total
Dividends | | Net Asset
Value, End
of Period | |
|
|
|
|
|
|
|
|
|
|
|
|
|
|
|
|
|
|
|
|
|
|
|
|
|
|
|
|
|
|
CLASS A SHARES | | | | | | | | | | | | | | | | | | | | | | | | | | | | | |
Year Ended October 31, 2004(f) | | | $ | 12.68 | | | 0.05 | | | 0.69 | | | 0.74 | | | (0.04 | ) | | — | | | (0.04 | ) | | | $ | 13.38 | | |
Year Ended October 31, 2005 | | | | 13.38 | | | 0.10 | | | 1.86 | | | 1.96 | | | (0.08 | ) | | (0.13 | ) | | (0.21 | ) | | | | 15.13 | | |
Year Ended October 31, 2006 | | | | 15.13 | | | 0.12 | * | | 2.95 | | | 3.07 | | | (0.19 | ) | | (1.29 | ) | | (1.48 | ) | | | | 16.72 | | |
Year Ended October 31, 2007 | | | | 16.72 | | | 0.14 | * | | 1.38 | | | 1.52 | | | (0.13 | ) | | (1.57 | ) | | (1.70 | ) | | | | 16.54 | | |
Year Ended October 31, 2008 | | | | 16.54 | | | 0.13 | * | | (6.30 | ) | | (6.17 | ) | | (0.13 | ) | | (1.30 | ) | | (1.43 | ) | | | | 8.94 | | |
|
|
|
|
|
|
|
|
|
|
|
|
|
|
|
|
|
|
|
|
|
|
|
|
|
|
|
|
|
|
CLASS B SHARES | | | | | | | | | | | | | | | | | | | | | | | | | | | | | |
Year Ended October 31, 2004(f) | | | $ | 12.28 | | | — | | | 0.68 | | | 0.68 | | | (0.01 | ) | | — | | | (0.01 | ) | | | $ | 12.95 | | |
Year Ended October 31, 2005 | | | | 12.95 | | | (0.02 | ) | | 1.80 | | | 1.78 | | | — | | | (0.13 | ) | | (0.13 | ) | | | | 14.60 | | |
Year Ended October 31, 2006 | | | | 14.60 | | | — | * | | 2.84 | | | 2.84 | | | (0.07 | ) | | (1.29 | ) | | (1.36 | ) | | | | 16.08 | | |
Year Ended October 31, 2007 | | | | 16.08 | | | 0.02 | * | | 1.32 | | | 1.34 | | | (0.02 | ) | | (1.57 | ) | | (1.59 | ) | | | | 15.83 | | |
Year Ended October 31, 2008 | | | | 15.83 | | | 0.03 | * | | (6.01 | ) | | (5.98 | ) | | (0.02 | ) | | (1.30 | ) | | (1.32 | ) | | | | 8.53 | | |
|
|
|
|
|
|
|
|
|
|
|
|
|
|
|
|
|
|
|
|
|
|
|
|
|
|
|
|
|
|
CLASS C SHARES | | | | | | | | | | | | | | | | | | | | | | | | | | | | | |
Year Ended October 31, 2004(f) | | | $ | 12.35 | | | 0.01 | | | 0.67 | | | 0.68 | | | (0.02 | ) | | — | | | (0.02 | ) | | | $ | 13.01 | | |
Year Ended October 31, 2005 | | | | 13.01 | | | (0.02 | ) | | 1.82 | | | 1.80 | | | (0.01 | ) | | (0.13 | ) | | (0.14 | ) | | | | 14.67 | | |
Year Ended October 31, 2006 | | | | 14.67 | | | — | * | | 2.85 | | | 2.85 | | | (0.05 | ) | | (1.29 | ) | | (1.34 | ) | | | | 16.18 | | |
Year Ended October 31, 2007 | | | | 16.18 | | | 0.02 | * | | 1.32 | | | 1.34 | | | (0.01 | ) | | (1.57 | ) | | (1.58 | ) | | | | 15.94 | | |
Year Ended October 31, 2008 | | | | 15.94 | | | 0.03 | * | | (6.05 | ) | | (6.02 | ) | | (0.02 | ) | | (1.30 | ) | | (1.32 | ) | | | | 8.60 | | |
|
|
|
|
|
|
|
|
|
|
|
|
|
|
|
|
|
|
|
|
|
|
|
|
|
|
|
|
|
|
CLASS I SHARES | | | | | | | | | | | | | | | | | | | | | | | | | | | | | |
Year Ended October 31, 2004(f) | | | $ | 12.67 | | | 0.07 | | | 0.70 | | | 0.77 | | | (0.06 | ) | | — | | | (0.06 | ) | | | $ | 13.38 | | |
Year Ended October 31, 2005 | | | | 13.38 | | | 0.13 | | | 1.86 | | | 1.99 | | | (0.11 | ) | | (0.13 | ) | | (0.24 | ) | | | | 15.13 | | |
Year Ended October 31, 2006 | | | | 15.13 | | | 0.15 | * | | 2.94 | | | 3.09 | | | (0.23 | ) | | (1.29 | ) | | (1.52 | ) | | | | 16.70 | | |
Year Ended October 31, 2007 | | | | 16.70 | | | 0.18 | * | | 1.38 | | | 1.56 | | | (0.17 | ) | | (1.57 | ) | | (1.74 | ) | | | | 16.52 | | |
Year Ended October 31, 2008 | | | | 16.52 | | | 0.16 | * | | (6.28 | ) | | (6.12 | ) | | (0.17 | ) | | (1.30 | ) | | (1.47 | ) | | | | 8.93 | | |
|
|
|
|
|
|
|
|
|
|
|
|
|
|
|
|
|
|
|
|
|
|
|
|
|
|
|
|
|
|
| | | | | | | | | | | | | | | | | | | | | |
| | | | | Ratios/Supplementary Data | |
| | | | |
|
|
| | Total
Return(b) | | Net Assets
at End of
Period
(000’s) | | Ratio of Net
Expenses to
Average Net
Assets(c) | | Ratio of Net
Investment
Income to
Average
Net Assets(c) | | Ratio of
Expenses to
Average Net
Assets(c)(d) | | Portfolio
Turnover
Rate(e) | |
|
|
|
|
|
|
|
|
|
|
|
|
|
|
|
|
|
|
|
|
|
|
CLASS A SHARES | | | | | | | | | | | | | | | | | | | | | |
Year Ended October 31, 2004(f) | | 7.79 | % | | | $ | 20,933 | | | 1.20 | % | | 0.81 | % | | 1.25 | % | | 10.33 | % | |
Year Ended October 31, 2005 | | 14.69 | %(g) | | | | 23,315 | | | 1.15 | %(g) | | 0.64 | %(g) | | 1.30 | %(g) | | 16.45 | % | |
Year Ended October 31, 2006 | | 21.70 | % | | | | 24,688 | | | 1.20 | % | | 0.74 | % | | 1.43 | % | | 20.63 | % | |
Year Ended October 31, 2007 | | 9.77 | %(h) | | | | 27,225 | | | 1.11 | %(h) | | 0.84 | %(h) | | 1.25 | % | | 18.67 | % | |
Year Ended October 31, 2008 | | (40.46 | )%(i) | | | | 14,881 | | | 1.20 | % | | 0.99 | % | | 1.23 | % | | 24.61 | % | |
|
|
|
|
|
|
|
|
|
|
|
|
|
|
|
|
|
|
|
|
|
|
CLASS B SHARES | | | | | | | | | | | | | | | | | | | | | |
Year Ended October 31, 2004(f) | | 9.06 | % | | | $ | 1,938 | | | 1.95 | % | | 0.05 | % | | 2.00 | % | | 10.33 | % | |
Year Ended October 31, 2005 | | 13.78 | %(g) | | | | 1,767 | | | 1.90 | %(g) | | (0.10 | )%(g) | | 2.04 | %(g) | | 16.45 | % | |
Year Ended October 31, 2006 | | 20.78 | % | | | | 1,939 | | | 1.95 | % | | (0.01 | )% | | 2.18 | % | | 20.63 | % | |
Year Ended October 31, 2007 | | 8.92 | %(h) | | | | 1,772 | | | 1.87 | %(h) | | 0.10 | %(h) | | 2.00 | % | | 18.67 | % | |
Year Ended October 31, 2008 | | (40.89 | )%(i) | | | | 717 | | | 1.95 | % | | 0.24 | % | | 1.98 | % | | 24.61 | % | |
|
|
|
|
|
|
|
|
|
|
|
|
|
|
|
|
|
|
|
|
|
|
CLASS C SHARES | | | | | | | | | | | | | | | | | | | | | |
Year Ended October 31, 2004(f) | | 8.47 | % | | | $ | 399 | | | 1.95 | % | | 0.04 | % | | 2.00 | % | | 10.33 | % | |
Year Ended October 31, 2005 | | 13.86 | %(g) | | | | 388 | | | 1.90 | %(g) | | (0.12 | )%(g) | | 2.05 | %(g) | | 16.45 | % | |
Year Ended October 31, 2006 | | 20.72 | % | | | | 157 | | | 1.95 | % | | 0.01 | % | | 2.17 | % | | 20.63 | % | |
Year Ended October 31, 2007 | | 8.95 | %(h) | | | | 126 | | | 1.87 | %(h) | | 0.11 | %(h) | | 1.99 | % | | 18.67 | % | |
Year Ended October 31, 2008 | | (40.89 | )%(i) | | | | 66 | | | 1.95 | % | | 0.24 | % | | 1.98 | % | | 24.61 | % | |
|
|
|
|
|
|
|
|
|
|
|
|
|
|
|
|
|
|
|
|
|
|
CLASS I SHARES | | | | | | | | | | | | | | | | | | | | | |
Year Ended October 31, 2004(f) | | 6.05 | % | | | $ | 25,600 | | | 0.95 | % | | 1.05 | % | | 1.00 | % | | 10.33 | % | |
Year Ended October 31, 2005 | | 14.96 | %(g) | | | | 15,044 | | | 0.90 | %(g) | | 0.91 | %(g) | | 1.02 | %(g) | | 16.45 | % | |
Year Ended October 31, 2006 | | 21.90 | % | | | | 18,036 | | | 0.95 | % | | 0.99 | % | | 1.18 | % | | 20.63 | % | |
Year Ended October 31, 2007 | | 10.04 | %(h) | | | | 28,692 | | | 0.87 | %(h) | | 1.07 | %(h) | | 0.99 | % | | 18.67 | % | |
Year Ended October 31, 2008 | | (40.29 | )%(i) | | | | 17,779 | | | 0.95 | % | | 1.24 | % | | 0.98 | % | | 24.61 | % | |
|
|
|
|
|
|
|
|
|
|
|
|
|
|
|
|
|
|
|
|
|
|
| |
* | Calculated based on average shares outstanding. |
| |
(a) | The per share amounts and percentages reflect income and expenses assuming inclusion of the Fund’s proportionate share of the income and expenses of the HSBC Investor Value Portfolio. |
| |
(b) | Not annualized for periods less than one year. Total return calculations do not include any sales or redemption charges. |
| |
(c) | Annualized for periods less than one year. |
| |
(d) | During the period certain fees were reduced. If such fee reductions had not occurred, the ratio would have been as indicated. |
| |
(e) | Portfolio turnover rate is calculated on the basis of the respective Portfolio in which the Fund invests all its investable assets. |
| |
(f) | Class A Shares, Class B Shares, Class C Shares and Class I Shares commenced operations on May 10, 2004. |
| |
(g) | During the year ended October 31, 2005, HSBC reimbursed certain amounts to the respective Portfolio in which the Fund invests related to violation of certain investment policies and limitations. The corresponding impact to the net expense ratio, net income ratio, gross expense ratio and total return were 0.05%, 0.05%, 0.05% and 0.05% for Class A Shares, Class B Shares, Class C Shares and Class I Shares, respectively. |
| |
(h) | During the year ended October 31, 2007, HSBC reimbursed amounts to certain Funds related to past marketing arrangements. The corresponding impact to the net expense ratio, net income ratio, and the total returns were 0.09%, 0.08%, 0.08%, and 0.08% for Class A Shares, Class B Shares, Class C Shares and Class I Shares, respectively. |
| |
(i) | During the year ended October 31, 2008, the respective Portfolio in which the Fund invests in received monies related to certain nonrecurring litigations settlements. The corresponding impact to the total return was 0.22%, 0.22%, 0.22% and 0.22% for Class A Shares, Class B Shares, Class C Shares and Class I Shares, respectively. |
| | |
See notes to financial statements. | HSBC INVESTOR FAMILY OF FUNDS | 58 |
|
HSBC INVESTOR FAMILY OF FUNDS |
|
Notes to Financial Statements—as of October 31, 2008 |
| |
1. | Organization: |
| |
| The HSBC Investor Funds (the “Trust”), a Massachusetts business trust organized on April 22, 1987, and the HSBC Advisor Funds Trust (the “Advisor Trust”), a Massachusetts business trust organized on April 5, 1996, are registered under the Investment Company Act of 1940, as amended (the “Act”), as open-end management investment companies. As of October 31, 2008, the Trust is comprised of 19 separate operational funds and the Advisor Trust is comprised of 3 separate operational funds. The accompanying financial statements are presented for the following 12 funds (individually a “Fund”, collectively the “Funds”) of the Trust and Advisor Trust (collectively the “Trusts”): |
| | | | | |
| Fund | | Short Name | | Trust |
|
| |
| |
|
| HSBC Investor Core Plus Fixed Income Fund (Advisor) | | Core Plus Fixed Income Fund (Advisor) | | Advisor Trust |
| HSBC Investor Core Plus Fixed Income Fund | | Core Plus Fixed Income Fund | | Trust |
| HSBC Investor High Yield Fixed Income Fund | | High Yield Fixed Income Fund | | Trust |
| HSBC Investor Intermediate Duration Fixed Income Fund | | Intermediate Duration Fixed Income Fund | | Trust |
| HSBC Investor New York Tax-Free Bond Fund | | New York Tax-Free Bond Fund | | Trust |
| HSBC Investor Growth Fund | | Growth Fund | | Trust |
| HSBC Investor International Equity Fund | | International Equity Fund | | Advisor Trust |
| HSBC Investor Mid-Cap Fund | | Mid-Cap Fund | | Trust |
| HSBC Investor Opportunity Fund | | Opportunity Fund | | Trust |
| HSBC Investor Opportunity Fund (Advisor) | | Opportunity Fund (Advisor) | | Advisor Trust |
| HSBC Investor Overseas Equity Fund | | Overseas Fund | | Trust |
| HSBC Investor Value Fund | | Value Fund | | Trust |
| |
| All the funds in the Trusts’, except the New York Tax-Free Bond Fund are diversified funds. The New York Tax-Free Bond Fund is a non-diversified fund which means they may concentrate their investments in the securities of a limited number of issuers. Each Fund is a part of the HSBC Family of Funds. |
| |
| Financial statements for all other funds of the HSBC Investor Family of Funds are published separately. The Core Plus Fixed Income Fund (Advisor), Core Plus Fixed Income Fund, High Yield Fixed Income Fund, Intermediate Duration Fixed Income Fund, Growth Fund, International Equity Fund, Opportunity Fund, Opportunity Fund (Advisor), Overseas Equity Fund, and the Value Fund (individually a “Feeder Fund”, collectively the “Feeder Funds”) utilize the master-feeder fund structure and seek to achieve their investment objectives by investing all of their investable assets in their respective Portfolios (as defined below). |
| | | | | | |
| Fund | | Respective Portfolio | | Proportionate
Interest on
October 31, 2008 |
|
| |
| |
|
| Core Plus Fixed Income Fund (Advisor) | | HSBC Investor Core Plus Fixed Income Portfolio | | 68.5 | % |
| Core Plus Fixed Income Fund | | HSBC Investor Core Plus Fixed Income Portfolio | | 13.0 | % |
| High Yield Fixed Income Fund | | HSBC Investor High Yield Fixed Income Portfolio | | 63.0 | % |
| Intermediate Duration Fixed Income Fund | | HSBC Investor Intermediate Duration | | 95.2 | % |
| Growth Fund | | HSBC Investor Growth Portfolio | | 71.7 | % |
| International Equity Fund | | HSBC Investor International Equity Portfolio | | 80.9 | % |
| Opportunity Fund | | HSBC Investor Opportunity Portfolio | | 8.9 | % |
| Opportunity Fund (Advisor) | | HSBC Investor Opportunity Portfolio | | 76.9 | % |
| Overseas Equity Fund | | HSBC Investor International Equity Portfolio | | 3.9 | % |
| Value Fund | | HSBC Investor Value Portfolio | | 66.0 | % |
| |
59 | HSBC INVESTOR FAMILY OF FUNDS |
|
HSBC INVESTOR FAMILY OF FUNDS |
|
Notes to Financial Statements—as of October 31, 2008 (continued) |
| |
| Financial statements for all other funds of the HSBC Investor Family of Funds are published separately. The HSBC Investor Core Plus Fixed Income Portfolio, HSBC Investor High Yield Fixed Income Portfolio, HSBC Investor Intermediate Duration Fixed Income Portfolio, HSBC Investor Growth Portfolio, HSBC Investor International Equity Portfolio, HSBC Investor Opportunity Portfolio and the HSBC Investor Value Portfolio (individually a “Portfolio”, collectively the “Portfolios”) are diversified series of the HSBC Investor Portfolios (the “Portfolio Trust”). The Portfolios operate as master funds in master-feeder arrangements. |
| |
| The financial statements of the Portfolios, including the Schedules of Portfolio Investments, are included elsewhere in this report. The financial statements of the Portfolios should be read in conjunction with the financial statements of the Feeder Funds. |
| |
| The Funds are authorized to issue an unlimited number of shares of beneficial interest with a par value of $0.001 per share. The High Yield Fixed Income Fund, Intermediate Duration Fixed Income Fund, New York Tax-Free Bond Fund, Growth Fund, Mid-Cap Fund, and the Value Fund each offer four classes of shares: Class A Shares, Class B Shares, Class C Shares, and Class I Shares. The Core Plus Fixed Income Fund (Advisor), International Equity Fund, and the Opportunity Fund (Advisor) each offer one class of shares: Class I Shares. The Core Plus Fixed Income Fund, Opportunity Fund, and the Overseas Equity Fund each offer three classes of shares: Class A Shares, Class B Shares, and Class C Shares. Class A Shares of the Growth Fund, Mid-Cap Fund, Opportunity Fund, Overseas Fund, and Value Fund have a maximum sales charge of 5.00% as a percentage of the original purchase price while Class A Shares of the Core Plus Fixed Income Fund, High Yield Fixed Income Fund, Intermediate Duration Fixed Income Fund, and New York Tax-Free Bond Fund have a maximum sales charge of 4.75% as a percentage of the original purchase price. The Class B Shares of the Funds are offered without any front-end sales charge but will be subject to a contingent deferred sales charge (“CDSC”) ranging from a maximum of 4.00% if redeemed less than one year after purchase to 0.00% if redeemed more than four years after purchase. Class C Shares of the Funds are offered without any front-end sales charge but will be subject to a maximum CDSC of 1.00% if redeemed less than one year after purchase. No sales charges are assessed with respect to Class I Shares of the Funds. Each class of shares in the Funds has identical rights and privileges except with respect to arrangements pertaining to shareholder servicing or distribution, class-related expenses, voting rights on matters affecting a single class of shares, and the exchange privilege of each class of shares. |
| |
| Under the Trusts’ organizational documents, the Funds’ officers and trustees are indemnified against certain liabilities arising out of the performance of their duties to the Funds. In addition, in the normal course of business, the Funds enter into contracts with service providers, which also provide for indemnifications by the Funds. The Funds’ maximum exposure under these arrangements is unknown, as this would involve any future claims that may be made against the Funds. However, based on experience, the Funds expect that risk of loss to be remote. |
| |
2. | Significant Accounting Policies: |
| |
| The following is a summary of the significant accounting policies followed by the Funds in the preparation of their financial statements. The policies are in conformity with U.S. generally accepted accounting principles (“GAAP”). The preparation of financial statements requires management to make estimates and assumptions that affect the reported amounts of assets and liabilities and disclosure of contingent assets and liabilities at the date of the financial statements and the reported amounts of income and expenses for the period. Actual results could differ from those estimates. |
| |
| Securities Valuation: |
| |
| A. New York Tax-Free Bond Fund and Mid-Cap Fund |
| |
| Bonds and other fixed income securities (other than short-term obligations but including listed issues) are valued on the basis of valuations furnished by a pricing service, the use of which has been approved by the Funds’ Board of Trustees. In making such valuations, the pricing service utilizes both dealer-supplied valuations and the use of matrix techniques which take into account appropriate factors such as the institutional-size trading in similar groups of securities, yield, quality, coupon rate, maturity, type of issue, trading characteristics other than market data and without exclusive reliance upon quoted prices or exchanges or over-the-counter prices, since such valuations are believed to reflect more accurately the fair value of such securities. |
| |
HSBC INVESTOR FAMILY OF FUNDS | 60 |
|
HSBC INVESTOR FAMILY OF FUNDS |
|
Notes to Financial Statements—as of October 31, 2008 (continued) |
| |
| The value of each equity security is based either on the last sale price on a national securities exchange, or in the absence of recorded sales, at the closing bid prices on such exchanges, or at the quoted bid price in the over-the-counter market. Securities or other assets for which market quotations are not readily available, or are deemed unreliable due to a significant event or otherwise, are valued by or at the direction of the Funds’ Board of Trustees. In addition, specific securities may need to be valued by or at the direction of the Funds’ Board of Trustees due to potentially significant events. Examples of potentially significant events that could affect the value of an individual security include corporate actions by the issuer, announcements by the issuer relating to its earnings or profits, regulatory news, natural disasters and litigation. Examples of potentially significant events that could affect multiple securities held by a Fund include governmental actions, natural disasters and armed conflicts. |
| |
| B. Feeder Funds |
| |
| The Feeder Funds record their investments in their respective Portfolios at fair value. Securities of the Portfolios are recorded at fair value as more fully discussed in the notes to those financial statements. |
| |
| Investment Transactions and Related Income: |
| |
| A. New York Tax-Free Bond Fund and Mid-Cap Fund |
| |
| Investment transactions are accounted for no later than one business day after trade date. For financial reporting purposes, changes in holdings are accounted for on trade date on the last business day of the reporting period. Investment gains and losses are calculated on the identified cost basis. Interest income is recognized on the accrual basis and includes, where applicable, the amortization or accretion of premium or discount. Dividend income is recorded on the ex-dividend date. |
| |
| B. Feeder Funds |
| |
| The Feeder Funds record daily their pro-rata share of income, expenses, changes in unrealized appreciation and depreciation and realized gains and losses derived from their respective portfolios. In addition, the Feeder Funds accrue their own expenses daily as incurred. |
| |
| Futures Contracts: |
| |
| The New York Tax-Free Bond Fund and Mid-Cap Fund may invest in futures contracts for the purpose of hedging existing portfolio securities or securities it intends to purchase against fluctuations in fair value caused by changes in prevailing market interest rates. Upon entering into a futures contract, a Fund is required to pledge to the broker an amount of cash and/or other assets equal to a certain percentage of the contract amount (initial margin deposit). Subsequent payments, known as “variation margin,” are made each day, depending on the daily fluctuations in the fair value of the underlying security. A gain or loss equal to the daily variation margin is recognized on a daily basis. |
| |
| Should market conditions move unexpectedly, a Fund may not achieve the anticipated benefits of the futures contracts and may realize a loss. The use of futures transactions involves the risk of imperfect correlation in movements in the price of futures contracts, interest rates and the underlying hedged assets. As of October 31, 2008, the Funds did not hold any investments in futures contracts. |
| |
| Options: |
| |
| The Mid-Cap Fund may write covered call options against some of the securities in their portfolios provided the securities are listed on a national securities exchange. A call option is “covered” if the Fund owns the underlying securities covered by the call. The premium received is recorded as a liability and is subsequently adjusted to the current fair value of the option written. Premiums received from writing options that expire unexercised are treated on the expiration date as realized gains from investments. The difference between the premium and the amount paid on effecting a closing purchase transaction, including brokerage commissions, is also treated as a realized gain or loss. If the call option is exercised, the premium is added to the proceeds from the sale of the underlying security in determining a realized gain or loss. For the year ended October 31, 2008, the Fund did not write any covered call options. |
| |
| Allocations: |
| |
| Expenses directly attributable to a Fund are charged to that Fund. Expenses not directly attributable to a Fund are allocated proportionately among various or all Funds within the HSBC Investor Family of Funds in relation to the net assets of each Fund or on another reasonable basis. Class specific expenses are charged directly to the class incurring the |
| |
61 | HSBC INVESTOR FAMILY OF FUNDS |
|
HSBC INVESTOR FAMILY OF FUNDS |
|
Notes to Financial Statements—as of October 31, 2008 (continued) |
| |
| expense. In addition, income, expenses (other than class specific expenses), and unrealized/realized gains and losses in investments are allocated to each class of shares based on its relative net assets on a daily basis. |
| |
| Dividends to Shareholders: |
| |
| The Core Plus Fixed Income Fund (Advisor), Core Plus Fixed Income Fund, High Yield Fixed Income, Intermediate Duration Fixed Income Fund, and the New York Tax-Free Bond Fund declare all net investment income daily as dividends to their shareholders and distribute such dividends monthly. Dividends from net investment income, if any, are declared and distributed semi-annually in the case of the Growth Fund, Opportunity Fund, Opportunity (Advisor) and the Value Fund, and annually in the case of the International Equity Fund, Mid-Cap Fund, and Overseas Fund. |
| |
| The Funds’ net realized gains, if any, are distributed to shareholders at least annually. Additional distributions are also made to the Funds’ shareholders to the extent necessary to avoid the federal excise tax on certain undistributed income and net capital gains of regulated investment companies. |
| |
| The amount and character of net investment income and net realized gains distributions are determined in accordance with federal income tax regulations which may differ from GAAP. These “book/tax” differences are either considered temporary or permanent in nature. To the extent these differences are permanent in nature (e.g., reclassification of market discounts, certain gain/loss, paydowns, and certain distributions), such amounts are reclassified within the composition of net assets; temporary differences (e.g., wash losses and post-october loss deferrals) do not require reclassification. The Funds may utilize equalization accounting for tax purposes and designate earnings and profits, including net realized gains distributed to shareholders on redemption of shares, as a part of the dividends paid deduction for income tax purposes. To the extent distributions from net investment income and net realized gains exceed net investment income and net realized gains for tax purposes, they are reported as distributions of capital. |
| |
| Redemption Fee: |
| |
| A redemption fee of 2.00% is charged and recorded as paid-in-capital for any shares redeemed or exchanged after holding them for less than 30 days. This fee does not apply to shares purchased through reinvested dividends or capital gains or shares held in certain omnibus accounts or retirement plans that cannot implement the fee. For the fiscal years ended October 31, 2007 and October 31, 2008, the following Funds collected redemption fees as follows: |
| | | | | | | |
Fund | | Fees Collected
October 31, 2007 | | Fees Collected
October 31, 2008 | |
| |
| |
| |
Core Plus Fixed Income Fund (Advisor) | | $ | 12 | | $ | 2,944 | |
Core Plus Fixed Income Fund | | | 356 | | | 2,237 | |
High Yield Fixed Income Fund | | | 66 | | | 574 | |
Intermediate Duration Fixed Income Fund | | | 46 | | | 4 | |
New York Tax-Free Bond Fund | | | 2,570 | | | — | |
Growth Fund | | | 1,191 | | | 1,549 | |
International Equity Fund | | | 9,912 | | | 868 | |
Mid-Cap Fund | | | 110 | | | 20 | |
Opportunity Fund (Advisor) | | | — | | | 5 | |
Opportunity Fund | | | 158 | | | 749 | |
Overseas Equity Fund | | | 396 | | | 1,711 | |
Value Fund | | | 550 | | | 761 | |
| |
| Federal Income Taxes: |
| |
| Each Fund is a separate taxable entity for federal income tax purposes. Each Fund has qualified and intends to continue to qualify each year as a “regulated investment company” under Subchapter M of the Internal Revenue Code, as amended and to distribute substantially all of their taxable net investment income and net realized gains, if any, to their shareholders. Accordingly, no provision for federal income or excise tax is required. |
| |
| In addition, effective April 30, 2008, the Funds adopted Financial Accounting Standards Board Interpretation No. 48, Accounting for Uncertainty in Income Taxes (“FIN 48”). FIN 48 provides guidance for how uncertain tax positions should be recognized, measured, presented and disclosed in the financial statements. FIN 48 requires the affirmative evaluation of tax positions taken or expected to be taken in the course of preparing the Trust’s tax returns to determine whether it is |
| |
HSBC INVESTOR FAMILY OF FUNDS | 62 |
|
HSBC INVESTOR FAMILY OF FUNDS |
|
Notes to Financial Statements—as of October 31, 2008 (continued) |
| |
| more-likely-than-not (i.e., greater than 50-percent) that each tax position will be sustained upon examination by a taxing authority based on the technical merits of the position. A tax position that meets the more-likely-than-not recognition threshold is measured to determine the amount of benefit to recognize in the financial statements. Differences between tax positions taken in a tax return and amounts recognized in the financial statements will generally result in an increase in a liability for taxes payable (or a reduction of a tax refund receivable), including the recognition of any related interest and penalties as an operating expense. Implementation of FIN 48 included a review of tax positions taken in tax years that remain subject to examination by tax authorities in all major tax jurisdictions, including federal (i.e., the last 4 tax year ends and the interim tax period since then, as applicable). The adoption of FIN 48 did not impact the Funds’ net assets or results of operations. |
| |
| New Accounting Pronouncements: |
| |
| In September 2006, the Financial Accounting Standards Board (“FASB”) issued Statement on Financial Accounting Standards (“SFAS”) No. 157, “Fair Value Measurements” (“SFAS No. 157”). This standard establishes a single authoritative definition of fair value, sets out a framework for measuring fair value and requires additional disclosures about fair value measurements. SFAS No. 157 applies to fair value measurements already required or permitted by existing standards. SFAS No. 157 is effective for financial statements issued for fiscal years beginning after November 15, 2007 and interim periods within those fiscal years. The changes to current generally accepted accounting principles from the application of this Statement relate to the definition of fair value, the methods used to measure fair value, and the expanded disclosures about fair value measurements. Effective November 1, 2008 the Trust adopted SFAS No. 157. The adoption of this standard did not have an impact to the net assets or results of operations of the Fund, however, additional disclosures will be required about the inputs used to develop fair value measurements and the effect of certain measurements on the changes in net assets in fiscal reporting periods subsequent to the adoption date. |
| |
| In March 2008, the FASB issued the SFAS No. 161, “Disclosures about Derivative Instruments and Hedging Activities” (“SFAS 161”). SFAS 161 is effective for fiscal years and interim periods beginning after November 15, 2008. SFAS 161 requires enhanced disclosures about the Funds’ derivative and hedging activities, including how such activities are accounted for and their effect on the Funds’ financial position, performance and cash flows. Management is currently evaluating the impact the adoption of SFAS 161 will have on the Funds’ financial statements and related disclosures. |
| |
3. | Related Party Transactions: |
| |
| Investment Management: |
| |
| HSBC Global Asset Management (USA) Inc. (“HSBC” or the “Investment Adviser”), a wholly owned subsidiary of HSBC Bank USA, N.A., a national bank organized under the laws of the United States, acts as Investment Adviser to the New York Tax-Free Bond Fund and the Mid-Cap Fund. As Investment Adviser, HSBC manages the investments of the Funds and continuously reviews, supervises, and administers the Funds’ investments. Sub-Investment Adviser services are provided by Munder Capital Management (“Munder”) for the Mid-Cap Fund and Halbis Capital Management (“Halbis”), a wholly owned subsidiary of Halbis Capital Management (UK) Limited an affiliate of the Investment Adviser, for the New York Tax-Free Bond Fund. |
| |
| For its services as Investment Adviser and Sub-Investment Adviser, respectively, HSBC and Halbis receive, in the aggregate, a fee, accrued daily and paid monthly at an annual rate of 0.25% of the New York Tax-Free Bond Fund’s average daily net assets. |
| |
| For its services as Investment Adviser and Sub-Investment Adviser, respectively, HSBC and Munder receive, in the aggregate, a fee, accrued daily and paid monthly at an annual rate of 0.75% of the Mid-Cap Fund’s average daily net assets. |
| |
| Feeder Funds are not directly charged any investment management fees. |
| |
| Administration: |
| |
| HSBC serves the Funds as Administrator. Under the terms of the Administration Agreement, HSBC receives from the Funds a fee, accrued daily and paid monthly, at an annual rate of: |
| | | | |
Based on Average Daily Net Assets of | | Fee Rate | |
| |
| |
Up to $12 billion | | | 0.0525% | |
In excess of $12 billion | | | 0.0350% | |
| |
63 | HSBC INVESTOR FAMILY OF FUNDS |
|
HSBC INVESTOR FAMILY OF FUNDS |
|
Notes to Financial Statements—as of October 31, 2008 (continued) |
| |
| The fee breakpoints are determined on the basis of the aggregate average daily net assets of the HSBC Investor Family of Funds. The fee is allocated to each series of the HSBC Investor Family of Funds based upon its pro-rata share of net assets for each class. For assets invested in the underlying Portfolios by the Feeder Funds, the Portfolios pay half of the administration fee and the Feeder Funds pay half, for a combination of the total fee rate above. |
| |
| The administration fees accrued for each class by fund, of which 50% of such fees are deemed to be class specific, are as follows: |
| | | | | | | | | | | | | | | | | | | |
| | Core Plus
Fixed
Income
Fund
(Advisor) | | Core Plus
Fixed
Income
Fund | | High Yield
Fixed
Income
Fund | | Intermediate
Duration
Fixed
Income
Fund | | New York
Tax-Free
Bond Fund | | Growth
Fund | |
| |
| |
| |
| |
| |
| |
| |
| | | | | | | | | | | | | | | | | | | |
Class A | | $ | — | | $ | 2,672 | | $ | 772 | | $ | 308 | | $ | 12,880 | | $ | 5,166 | |
| | | | | | | | | | | | | | | | | | | |
Class B | | | — | | | 601 | | | 442 | | | 462 | | | 2,806 | | | 330 | |
| | | | | | | | | | | | | | | | | | | |
Class C | | | — | | | 20 | | | 72 | | | 57 | | | 235 | | | 18 | |
| | | | | | | | | | | | | | | | | | | |
Class I | | | 15,018 | | | — | | | 544 | | | 2,093 | | | 8,261 | | | 6,071 | |
| |
|
| |
|
| |
|
| |
|
| |
|
| |
|
| |
| | | | | | | | | | | | | | | | | | | |
Total | | $ | 15,018 | | $ | 3,293 | | $ | 1,830 | | $ | 2,920 | | $ | 24,182 | | $ | 11,585 | |
| |
|
| |
|
| |
|
| |
|
| |
|
| |
|
| |
| | | | | | | | | | | | | | | | | | | |
| | International
Equity Fund | | Mid-Cap
Fund | | Opportunity
Fund | | Opportunity
Fund
(Advisor) | | Overseas
Equity
Fund | | Value
Fund | |
| |
| |
| |
| |
| |
| |
| |
| | | | | | | | | | | | | | | | | | | |
Class A | | $ | — | | $ | 2,095 | | $ | 2,763 | | $ | — | | $ | 2,320 | | $ | 4,446 | |
| | | | | | | | | | | | | | | | | | | |
Class B | | | — | | | 1,786 | | | 745 | | | — | | | 554 | | | 281 | |
| | | | | | | | | | | | | | | | | | | |
Class C | | | — | | | 21 | | | 63 | | | — | | | 24 | | | 21 | |
| | | | | | | | | | | | | | | | | | | |
Class I | | | 62,887 | | | 6,899 | | | — | | | 30,962 | | | — | | | 5,179 | |
| |
|
| |
|
| |
|
| |
|
| |
|
| |
|
| |
| | | | | | | | | | | | | | | | | | | |
Total | | $ | 62,887 | | $ | 10,801 | | $ | 3,571 | | $ | 30,962 | | $ | 2,898 | | $ | 9,927 | |
| |
|
| |
|
| |
|
| |
|
| |
|
| |
|
| |
| |
| Pursuant to a Sub-Administration Agreement with HSBC, Citi Fund Services Ohio, Inc. (“Citi Ohio’’), a wholly-owned subsidiary of Citigroup, Inc., serves as the Trust’s sub-administrator, subject to the general supervision of the Funds’ Board of Trustees and HSBC. For these services, Citi Ohio is entitled to a fee, payable by HSBC, at an annual rate equivalent to the fee rates set forth above, minus 0.02% (2 basis points) which is retained by HSBC. |
| |
| Under a Compliance Services Agreement between the Funds and Citi Ohio (the “CCO Agreement’’), Citi Ohio makes an employee available to serve as the Funds’ Chief Compliance Officer (the “CCO’’). Under the CCO Agreement, Citi Ohio also provides infrastructure and support in implementing the written policies and procedures comprising the Funds’ compliance program, including support services to the CCO. For the services provided under the CCO Agreement, the HSBC Investor Family of Funds paid Citi Ohio $250,800 for the year ended October 31, 2008, plus reimbursement of certain expenses. Expenses incurred by each fund are reflected on the Statements of Operations as “Compliance Service.’’ Citi Ohio pays the salary and other compensation earned by any such individuals as employees of Citi Ohio. |
| |
| Distribution Plan: |
| |
| Foreside Distribution Services, L.P. (“Foreside”), a wholly-owned subsidiary of Foreside Financial Group LLC, serves the Trusts’ as Distributor (the “Distributor’’). The Trusts have adopted a non-compensatory Distribution Plan and Agreement (the “Plan’’) pursuant to Rule 12b-1 of the Act. The Plan provides for reimbursement of expenses incurred by the Distributor related to distribution and marketing, at a rate not to exceed 0.25%, 1.00%, and 1.00% of the average daily net assets of Class A Shares (currently not being charged), Class B Shares (currently charging 0.75%), and Class C Shares (currently charging 0.75%) of the Funds, respectively. Foreside, as Distributor, also received $609,707, $380,866 and $21,569 in commissions from sales of HSBC Investor Family of Funds, for Class A Shares, Class B Shares, and Class C Shares, respectively of which $433,949, $280,535 and $14,592 were reallowed to HSBC affiliated brokers and dealers, for Class A Shares, Class B Shares, and Class C Shares, respectively. |
| |
HSBC INVESTOR FAMILY OF FUNDS | 64 |
|
HSBC INVESTOR FAMILY OF FUNDS |
|
Notes to Financial Statements—as of October 31, 2008 (continued) |
| |
| Shareholder Servicing: |
| |
| The Trusts have adopted an Shareholder Services Plan which provides for payments to shareholder servicing agents (which currently consist of HSBC and its affiliates) for providing various shareholder services. For performing these services, the shareholder servicing agents receive a fee up to 0.25%, 0.25%, and 0.25% that is computed daily and paid monthly equal to a percentage of average daily net assets of Class A Shares, Class B Shares, and Class C Shares of the Funds, respectively. The aggregate fees paid to the Distributor pursuant to the Distribution Plan and to shareholder servicing agents pursuant to the Administrative Services Plans currently are not intended to exceed 0.25% of the average daily net assets of Class A Shares, and 1.00% of the average daily net assets of Class B Shares and Class C Shares. |
| |
| Fund Accounting, Transfer Agency and Trustee: |
| |
| Citi Ohio provides fund accounting and transfer agency services for each Fund. As transfer agent for the Funds, Citi Ohio receives a fee based on the number of Funds and shareholder accounts, subject to certain minimums and reimbursement of certain expenses. As fund accountant for the Funds, Citi Ohio receives an annual fee per Fund and share class, subject to certain minimums and reimbursement of certain expenses. |
| |
| Effective April 1, 2008 each of the non-interested Trustees are compensated with a $60,000 annual Board retainer, as well as a $3,000 annual retainer for each Committee of the Board. Each non-interested Trustee also receives a $5,000 and $3,000 meeting fee for each regular in-person Board meeting and Committee meeting, respectively. Furthermore, each non-interested Trustee receives compensation for attending special meetings and/or functioning as a Committee Chairperson or Lead Trustee. In addition, the non-interested Trustees are reimbursed for certain expenses incurred in connection with their Board membership. |
| |
| Prior to April 1, 2008 each of the non-interested Trustees were compensated with a $35,000 annual Board retainer, as well as a $3,000 annual retainer for each Committee of the Board. Each non-interested Trustee also received a $5,000 and $3,000 meeting fee for each regular in-person Board meeting and Committee meeting, respectively. Furthermore, each non-interested Trustee receives compensation for attending special meetings and/or functioning as a Committee Chairperson or Lead Trustee. In addition, the non-interested Trustees are reimbursed for certain expenses incurred in connection with their Board membership. |
| |
| Fee Reductions: |
| |
| The Investment Adviser has agreed to contractually waive 0.05% of its management fee, computed daily and paid monthly, and based on the average daily net assets of the Mid-Cap Fund. |
| |
| The Investment Adviser has also agreed to contractually limit, through March 1, 2009, the total expenses, exclusive of interest, taxes, brokerage commissions and extraordinary expenses, of certain Funds. Each affected Fund Class has its own expense limitations based on the average daily net assets for any full fiscal year as follows: |
| | | | | | | |
Fund | | Class | | Current Contractual
Expense
Limitation | |
| |
| |
| |
Core Plus Fixed Income Fund (Advisor) | | I | | | 0.45 | % | |
Core Plus Fixed Income Fund | | A | | | 0.70 | % | |
Core Plus Fixed Income Fund | | B | | | 1.45 | % | |
Core Plus Fixed Income Fund | | C | | | 1.45 | % | |
High Yield Fixed Income Fund | | A | | | 0.80 | % | |
High Yield Fixed Income Fund | | B | | | 1.55 | % | |
High Yield Fixed Income Fund | | C | | | 1.55 | % | |
High Yield Fixed Income Fund | | I | | | 0.55 | % | |
Intermediate Duration Fixed Income Fund | | A | | | 0.65 | % | |
Intermediate Duration Fixed Income Fund | | B | | | 1.40 | % | |
Intermediate Duration Fixed Income Fund | | C | | | 1.40 | % | |
Intermediate Duration Fixed Income Fund | | I | | | 0.40 | % | |
Growth Fund | | A | | | 1.20 | % | |
Growth Fund | | B | | | 1.95 | % | |
Growth Fund | | C | | | 1.95 | % | |
Growth Fund | | I | | | 0.95 | % | |
| |
65 | HSBC INVESTOR FAMILY OF FUNDS |
|
HSBC INVESTOR FAMILY OF FUNDS |
|
Notes to Financial Statements—as of October 31, 2008 (continued) |
| | | | | | |
Fund | | Class | | Current Contractual
Expense
Limitation | |
| |
| |
| |
Mid-Cap Fund | | A | | 1.35 | % | |
Mid-Cap Fund | | B | | 2.10 | % | |
Mid-Cap Fund | | C | | 2.10 | % | |
Mid-Cap Fund | | I | | 1.10 | % | |
Opportunity Fund | | A | | 1.65 | % | |
Opportunity Fund | | B | | 2.40 | % | |
Opportunity Fund | | C | | 2.40 | % | |
Overseas Equity Fund | | A | | 1.85 | % | |
Overseas Equity Fund | | B | | 2.60 | % | |
Overseas Equity Fund | | C | | 2.60 | % | |
Value Fund | | A | | 1.20 | % | |
Value Fund | | B | | 1.95 | % | |
Value Fund | | C | | 1.95 | % | |
Value Fund | | I | | 0.95 | % | |
| |
| The Administrator and Citi Ohio may voluntarily waive/reimburse fees to help support the expense limits of the Funds. In addition, the Investment Adviser may waive/reimburse additional fees at their discretion. Amounts waived/reimbursed by the Investment Adviser, Administrator and Citi Ohio are reported separately on the Statements of Operations, as applicable. All contractual and any voluntary fee waivers/reimbursements are not subject to recoupment in subsequent fiscal periods. Voluntary waivers/reimbursements may be stopped at any time. |
| |
4. | Investment Transactions: |
| |
| Purchases and sales of securities (excluding securities maturing less than one year from acquisition) for the year ended October 31, 2008 were as follows: |
| | | | | | | |
Fund | | Purchases | | Sales | |
| |
| |
| |
New York Tax-Free Bond Fund | | $ | — | | $ | 10,709,910 | |
Mid-Cap Fund | | | 16,643,519 | | | 19,558,351 | |
| | | | | | | |
There were no long-term U.S. Government securities held during the year ended October 31, 2008. |
| | | | | | | |
Contributions and withdrawals of the respective Portfolios for the year ended October 31, 2008 totaled: |
| | | | | |
Fund | | Contributions | | Withdrawals | |
| |
| |
| |
Core Plus Fixed Income Fund (Advisor) | | $ | 8,534,003 | | $ | 28,151,090 | |
Core Plus Fixed Income Fund | | | 414,970 | | | 5,999,986 | |
High Yield Fixed Income Fund | | | 1,509,977 | | | 1,953,711 | |
Intermediate Duration Fixed Income Fund | | | 3,385,817 | | | 3,623,753 | |
Growth Fund | | | 37,570,173 | | | 12,104,965 | |
International Equity Fund | | | 26,435,655 | | | 65,614,165 | |
Opportunity Fund | | | 2,426,829 | | | 5,062,499 | |
Opportunity Fund (Advisor) | | | 12,476,160 | | | 34,995,988 | |
Overseas Equity Fund | | | 1,255,707 | | | 5,169,435 | |
Value Fund | | | 5,508,161 | | | 9,271,071 | |
| |
5. | Concentration of Credit Risk: |
| |
| The New York Tax-Free Bond Fund invests primarily in debt obligations issued by the State of New York and its respective political subdivisions, agencies, and public authorities. The Fund is more susceptible to economic and political factors adversely affecting issuers of New York specific municipal securities than are municipal bond funds that are not concentrated in these issuers to the same extent. |
| |
6. | Acquisitions and Mergers: |
| |
| On September 19, 2008, net assets of the Growth and Income Fund were exchanged in a tax-free conversion for shares of the Growth Fund. All fees and expenses incurred by the Funds in connection with the consummation of the trans- |
| |
HSBC INVESTOR FAMILY OF FUNDS | 66 |
|
HSBC INVESTOR FAMILY OF FUNDS |
|
Notes to Financial Statements—as of October 31, 2008 (continued) |
| |
| action were borne by the Investment Adviser, and these fees are included on the Statement of Operations within the fees waived by the Investment Adviser. The following is a summary of shares issued, net assets before conversion, net assets converted and net asset value per share issued as of the conversion date: |
| | | | | | | | | | | | |
| | Net Asset
Value Per
Share Issued ($) | | Shares Issued | | Net Assets before
Conversion ($) | | Net Assets
Converted ($) | |
| |
| |
| |
| |
| |
Growth Fund | | | | | | | | | | | | |
A Shares | | 14.14 | | | 154,250 | | | 20,640,774 | | | 2,181,685 | |
B Shares | | 13.20 | | | 229,821 | | | 1,050,833 | | | 3,033,945 | |
C Shares | | 13.28 | | | 2,045 | | | 72,238 | | | 27,158 | |
I Shares | | 14.24 | | | 2,043,578 | | | 22,724,685 | | | 29,095,081 | |
| |
7. | Federal Income Tax Information: |
| |
| At October 31, 2008, the cost basis for federal income tax purposes, gross unrealized appreciation, gross unrealized depreciation and net unrealized appreciation/depreciation were as follows: |
| | | | | | | | | | | | | |
Fund | | Tax Cost | | Tax Unrealized
Appreciation | | Tax Unrealized
Depreciation | | Net Unrealized
Appreciation
(Depreciation) | |
| |
| |
| |
| |
| |
New York Tax-Free Bond Fund | | $ | 46,957,910 | | $ | 346,445 | | $ | (2,074,577 | ) | $ | (1,728,132 | ) |
Mid-Cap Fund | | | 20,560,514 | | | 961,322 | | | (4,984,720 | ) | | (4,023,398 | ) |
| |
| The tax character of dividends paid by the Funds as of the latest tax year ended October 31, 2008 were as follows: |
| | | | | | | | | | | | | | | | |
| | Dividends
paid from
Ordinary
Income | | Net
Long Term
Capital
Gains | | Total
Taxable
Dividends | | Tax
Exempt
Distributions | | Total Dividends
Paid* | |
| |
| |
| |
| |
| |
| |
Core Plus Fixed Income (Advisor) | | $ | 3,640,676 | | $ | 562,425 | | $ | 4,203,101 | | $ | — | | $ | 4,203,101 | |
Core Plus Fixed Income | | | 740,557 | | | — | | | 740,557 | | | — | | | 740,557 | |
High Yield Fixed Income Fund | | | 750,419 | | | 69,024 | | | 819,443 | | | — | | | 819,443 | |
Intermediate Duration Fixed Income Fund | | | 635,917 | | | 53,298 | | | 689,215 | | | — | | | 689,215 | |
New York Tax-Free Bond Fund | | | 27,836 | | | 56,103 | | | 83,939 | | | 2,095,822 | | | 2,179,761 | |
Growth Fund | | | — | | | 2,892,355 | | | 2,892,355 | | | — | | | 2,892,355 | |
International Equity Fund (Advisor) | | | 10,817,657 | | | 24,126,978 | | | 34,944,635 | | | — | | | 34,944,635 | |
Mid-Cap Fund | | | — | | | 3,530,283 | | | 3,530,283 | | | — | | | 3,530,283 | |
Opportunity Fund | | | 1,084,594 | | | 4,960,716 | | | 6,045,310 | | | — | | | 6,045,310 | |
Opportunity Fund (Advisor) | | | 9,223,734 | | | 35,976,501 | | | 45,200,235 | | | — | | | 45,200,235 | |
Overseas Equity Fund | | | 562,242 | | | 2,487,633 | | | 3,049,875 | | | — | | | 3,049,875 | |
Value Fund | | | 868,977 | | | 4,085,539 | | | 4,954,516 | | | — | | | 4,954,516 | |
| |
67 | HSBC INVESTOR FAMILY OF FUNDS |
|
HSBC INVESTOR FAMILY OF FUNDS |
|
Notes to Financial Statements—as of October 31, 2008 (continued) |
| | | | | | | | | | | | | | | | |
The tax character of dividends paid by the Funds as of October 31, 2007, were as follows: |
| | | | | | | | | | | | | | | | |
| | Dividends
paid from
Ordinary
Income | | Net
Long Term
Capital
Gains | | Total
Taxable
Dividends | | Tax
Exempt
Distributions | | Total Dividends
Paid* | |
| |
| |
| |
| |
| |
| |
Core Plus Fixed Income (Advisor) | | $ | 4,297,819 | | $ | — | | $ | 4,297,819 | | $ | — | | $ | 4,297,819 | |
Core Plus Fixed Income | | | 873,677 | | | — | | | 873,677 | | | — | | | 873,677 | |
High Yield Fixed Income Fund | | | 704,138 | | | — | | | 704,138 | | | — | | | 704,138 | |
Intermediate Duration Fixed Income Fund | | | 886,868 | | | — | | | 886,868 | | | — | | | 886,868 | |
New York Tax-Free Bond Fund | | | 19,599 | | | 9,094 | | | 28,693 | | | 2,085,602 | | | 2,114,295 | |
Growth Fund | | | 25,419 | | | 3,019,000 | | | 3,044,419 | | | — | | | 3,044,419 | |
International Equity Fund (Advisor) | | | 8,337,987 | | | 22,931,569 | | | 31,269,556 | | | — | | | 31,269,556 | |
Mid-Cap Fund | | | 647,121 | | | 1,300,752 | | | 1,947,873 | | | — | | | 1,947,873 | |
Opportunity Fund | | | 75,818 | | | 3,560,217 | | | 3,636,035 | | | — | | | 3,636,035 | |
Opportunity Fund (Advisor) | | | 3,149,480 | | | 26,789,336 | | | 29,938,816 | | | — | | | 29,938,816 | |
Overseas Equity Fund | | | 667,589 | | | 2,786,165 | | | 3,453,754 | | | — | | | 3,453,754 | |
Value Fund | | | 677,034 | | | 4,064,790 | | | 4,741,824 | | | — | | | 4,741,824 | |
| |
|
* | Total dividends paid may differ from the amount reported in the Statements of Changes in Net Assets because dividends are recognized when actually paid for tax purposes. |
| |
| As of the latest tax year ended October 31, 2008, the components of accumulated earnings/(deficit) on a tax basis for the Funds were as follows: |
| | | | | | | | | | | | | | | | | | | | | | | | | | | |
| | Undistributed
Ordinary
Income | | Undistributed
Tax
Exempt
Income | | Undistributed
Long Term
Capital
Gains | | Accumulated
Earnings | | Dividends
Payable | | Accumulated
Capital and
Other
Losses | | Unrealized
Appreciation/
(Depreciation)(1) | | Total
Accumulated
Earnings/
(Deficit) | |
| |
| |
| |
| |
| |
| |
| |
| |
| |
Core Plus Fixed Income (Advisor) | | $ | 329,363 | | | $ | — | | | $ | — | | $ | 329,363 | | $ | (277,012 | ) | $ | (1,002,028 | ) | $ | (8,450,309 | ) | $ | (9,399,986 | ) |
Core Plus Fixed Income | | | 50,521 | | | | — | | | | — | | | 50,521 | | | (52,252 | ) | | (787,733 | ) | | (1,776,131 | ) | | (2,565,595 | ) |
High Yield Fixed Income Fund | | | 53,175 | | | | — | | | | — | | | 53,175 | | | (61,523 | ) | | (326,249 | ) | | (2,813,646 | ) | | (3,148,243 | ) |
Intermediate Duration Fixed Income Fund | | | 57,749 | | | | — | | | | — | | | 57,749 | | | (49,016 | ) | | (85,092 | ) | | (1,555,362 | ) | | (1,631,721 | ) |
New York Tax-Free Bond Fund | | | 9,870 | | | | 164,572 | | | | 142,012 | | | 316,454 | | | (164,213 | ) | | — | | | (1,728,132 | ) | | (1,575,891 | ) |
Growth Fund | | | — | | | | — | | | | — | | | — | | | — | | | (211,343 | ) | | (14,122,081 | ) | | (14,333,424 | ) |
International Equity Fund (Advisor) | | | 6,999,097 | | | | — | | | | 8,461,419 | | | 15,460,516 | | | — | | | — | | | (100,679,157 | ) | | (85,218,641 | ) |
Mid-Cap Fund | | | — | | | | — | | | | 1,150,505 | | | 1,150,505 | | | — | | | — | | | (4,023,398 | ) | | (2,872,893 | ) |
Opportunity Fund | | | — | | | | — | | | | 660,465 | | | 660,465 | | | — | | | — | | | (2,882,931 | ) | | (2,222,466 | ) |
Opportunity Fund (Advisor) | | | — | | | | — | | | | 2,746,625 | | | 2,746,625 | | | — | | | — | | | (24,545,877 | ) | | (21,799,252 | ) |
Overseas Equity Fund | | | 651,141 | | | | — | | | | 3,347,318 | | | 3,998,459 | | | — | | | — | | | (3,912,493 | ) | | 85,966 | |
Value Fund | | | 126,892 | | | | — | | | | — | | | 126,892 | | | — | | | (4,701,437 | ) | | (7,956,386 | ) | | (12,530,931 | ) |
| |
|
(1) | The differences between book-basis and tax-basis unrealized appreciation/depreciation are attributable primarily to: tax deferral of losses on wash sales, the realization for tax purposes of unrealized gains/losses on certain derivative instruments, the difference between book and tax amortization methods for premium and market discount, the realization for tax purposes of unrealized gains/losses on investments in passive foreign investment companies, and the return of capital adjustments from real estate investment trusts. |
| |
HSBC INVESTOR FAMILY OF FUNDS | 68 |
|
HSBC INVESTOR FAMILY OF FUNDS |
|
Notes to Financial Statements—as of October 31, 2008 (continued) |
| |
| As of the latest tax year ended of October 31, 2008, the following Funds have net capital loss carryforwards, which are available to offset future realized gains, if any, to the extent provided by the Treasury regulations. To the extent that these carryforwards are used to offset future capital gains, it is probable that the gains that are offset will not be distributed to shareholders. |
| | | | | | |
Fund | | Amount | | Expires | |
| |
| |
| |
Core Plus Fixed Income Fund (Advisor) | | $ | 1,002,028 | | 2016 | |
Core Plus Fixed Income Fund | | | 185,453 | | 2012 | |
| | | 372,525 | | 2014 | |
| | | 229,755 | | 2016 | |
High Yield Fixed Income Fund | | | 326,249 | | 2016 | |
Intermediate Duration Fixed Income Fund | | | 85,092 | | 2016 | |
Growth Fund | | | 211,343 | | 2016 | |
Value Fund | | | 4,701,437 | | 2016 | |
| |
8. | Legal and Regulatory Matters: |
| |
| On September 26, 2006 BISYS Fund Services, Inc. (“BISYS”), an affiliate of BISYS Fund Services Ohio, Inc. which provided various services to the Funds, reached a settlement with the Securities and Exchange Commission (“the SEC”) regarding the SEC’s investigation related to BISYS’ past payment of certain marketing and other expenses with respect to certain of its mutual fund clients. Although BISYS has reached a settlement with the SEC, the Funds’ management is not aware that any determination has been made as to how the BISYS settlement monies will be distributed. While the Funds’ management is currently unable to determine the impact, if any, of such matters on the Funds or the Funds’ financial statements, management does not anticipate a material, adverse impact to the Funds or the Funds’ financial statements. |
| |
9. | Subsequent Events: |
| |
| The HSBC Investor New York Tax-Free Bond Fund (the “Fund”) is currently sub-advised by Halbis Capital Management (USA) Inc. (“Halbis”), an affiliate of the Fund’s investment adviser, HSBC Global Asset Management (USA) Inc. (the “Adviser”). |
| |
| Due to changes in its U.S. business model, Halbis has determined to resign as sub-adviser to the Fund effective January 31, 2009. The Adviser is actively exploring options for the Fund. Options under consideration are reorganizing the Fund into an unaffiliated fund family or liquidation of the Fund. |
| |
| The Adviser anticipates presenting its recommendations to the Board of Trustees of the Fund in the near future. Once the Board of Trustees has made a determination as to the course of action, the Adviser will provide notice to the Fund shareholders. |
| |
| On December 10, 2008, the International Equity Fund (the “Fund”) received information from the Bear Stearns Fair Fund Administrator (“Fair Fund Administrator”) in regards to a Consent Order and settlement between the SEC and Bear Stearns & Co. and Bear Stearns Securities Corp. The Fund submitted the information requested to the Fair Fund Administrator on December 18, 2008, and pending validation, may be entitled to receive a payment from the related Fair Fund that has been established to distribute monies to impacted entities, including the Fund. The estimate of payment to the Fund, as included in the notice received by the Fund from the Fair Fund Administrator, was $2,354,067. There was no indication of a payment date, and there are no assurances that the full amount of the estimate will ultimately be received. |
| |
69 | HSBC INVESTOR FAMILY OF FUNDS |
REPORT OF INDEPENDENT REGISTERED PUBLIC ACCOUNTING FIRM
To the Shareholders and Board of Trustees of
HSBC Investor Funds
HSBC Advisor Funds Trust:
We have audited the accompanying statements of assets and liabilities of HSBC Investor Core Plus Fixed Income Fund (Advisor), HSBC Investor Core Plus Fixed Income Fund, HSBC Investor High Yield Fixed Income Fund, HSBC Investor Intermediate Duration Fixed Income Fund, HSBC Investor New York Tax-Free Bond Fund, HSBC Investor Growth Fund, HSBC Investor International Equity Fund, HSBC Investor Mid-Cap Fund, HSBC Investor Opportunity Fund, HSBC Investor Overseas Equity Fund, HSBC Investor Opportunity Fund (Advisor) and HSBC Investor Value Fund (the Funds), including the schedules of portfolio investments of HSBC Investor New York Tax-Free Bond Fund and HSBC Investor Mid-Cap Fund, as of October 31, 2008, and the related statements of operations for the year then ended, the statements of changes in net assets for each year in the two-year period then ended, and the financial highlights for each period in the five-year period then ended. These financial statements and financial highlights are the responsibility of the Funds’ management. Our responsibility is to express an opinion on these financial statements and financial highlights based on our audits.
We conducted our audits in accordance with the standards of the Public Company Accounting Oversight Board (United States). Those standards require that we plan and perform the audit to obtain reasonable assurance about whether the financial statements and financial highlights are free of material misstatement. An audit includes examining, on a test basis, evidence supporting the amounts and disclosures in the financial statements. Our procedures included confirmation of securities owned as of October 31, 2008, by correspondence with custodians and brokers; or other appropriate auditing procedures. An audit also includes assessing the accounting principles used and significant estimates made by management, as well as evaluating the overall financial statement presentation. We believe that our audits provide a reasonable basis for our opinion.
In our opinion, the financial statements and financial highlights referred to above present fairly, in all material respects, the financial position of the Funds as of October 31, 2008, the results of their operations for the year then ended, the changes in their net assets for each year in the two-year period then ended, and the financial highlights for each period in the five-year period then ended, in conformity with U.S. generally accepted accounting principles.
KPMG LLP
Columbus, Ohio
December 19, 2008
| |
HSBC INVESTOR FAMILY OF FUNDS | 70 |
|
HSBC INVESTOR FAMILY OF FUNDS |
|
Special Meetings of Shareholders (Unaudited)
|
At a Special Meeting of Shareholders of the HSBC Growth Fund (the “Fund”), a series of the HSBC Family of Funds, held on June 13, 2008, shareholders of the Fund voted to approve a new investment advisory contract between HSBC Global Asset Management (USA) Inc. (the “Adviser”) and HSBC Investor Funds, on behalf of the Fund, for the purpose of increasing the management fee in order to provide the Adviser with increased flexibility in hiring subadvisers. The results of the voting are as follows:
| | | | |
Affirmative | | Against | | Abstain |
| |
| |
|
1,464,073 | | 203,306 | | 72,915 |
At a Special Meeting of Shareholders of the HSBC Investor Growth and Income Fund (the “Acquired Fund”), a series of the HSBC Family of Funds, held on September 10, 2008, shareholders of the Acquired Fund voted to approve a Plan of Reorganization for (1) the acquisition of all the assets and liabilities the Acquired Fund in exchange for shares of the HSBC Investor Growth Fund and (2) subsequent termination and liquidation of the Acquired Fund. The results of the voting are as follows:
| | | | |
Affirmative | | Against | | Abstain |
| |
| |
|
1,573,628 | | — | | 3,136 |
| |
71 | HSBC INVESTOR FAMILY OF FUNDS |
|
HSBC INVESTOR FAMILY OF FUNDS |
|
Other Federal Income Tax Information (Unaudited)—as of October 31, 2008 |
For the year ended October 31, 2008, the following percentages of the total ordinary income dividends paid by the Funds qualify for the corporate dividends received deduction available to corporate shareholders:
| | | | | | |
| Fund | | | | Dividends
Received
Deduction | |
|
| | | |
| |
Opportunity Fund | | | | 5.68 | % |
Opportunity Fund (Advisor) | | | 4.92 | % |
Value Fund | | | | 100.00 | % |
The International Equity Fund and the Overseas Equity Fund intend to elect to pass through to shareholders the income tax credit for taxes paid to foreign countries. Foreign source income and foreign tax expense per outstanding share on October 31, 2008 are as follows:
| | | | | | | | | |
| Fund | | | Foreign
Source Income | | Foreign Tax
Expense | |
|
| | |
| |
| |
International Equity Fund | | $ | 0.65 | | $ | 0.08 | |
Overseas Fund | | | 0.43 | | | 0.05 | |
For the year ended October 31, 2008, dividends paid by the Funds may be subject to a maximum tax rate of 15%, as provided for by the Jobs and Growth Tax Relief Reconciliation Act of 2003. The Funds intend to designate the maximum amount allowable as taxed at a maximum rate of 15%. Complete information will be reported in conjunction with your 2008 Form 1099-DIV:
| | | | | | |
| Fund | | | Qualified
Dividend
Income | |
|
| | |
| |
International Equity Fund | | | 66.41 | % |
Opportunity Fund | | | 6.02 | % |
Opportunity Fund (Advisor) | | | 5.21 | % |
Overseas Fund | | | 66.35 | % |
Value Fund | | | 100.00 | % |
| | | | |
During the year ended October 31, 2008 the following Fund declared tax-exempt income distributions: |
| | | | | | |
| Fund | | | Amount | |
|
| | |
| |
New York Tax-Free Bond Fund | | $ | 2,095,822 | |
| | | | |
During the year ended October 31, 2008, the following Funds declared net long term capital gain distributions:
| | | | | | |
| Fund | | | Amount | |
|
| | |
| |
Core Plus Fixed Income Fund (Advisor) | | $ | 562,425 | |
High Yield Fixed Income Fund | | | 69,024 | |
Intermediate Duration Fixed Income Fund | | | 53,298 | |
New York Tax-Free Bond Fund | | | 56,103 | |
Growth Fund | | | 2,892,355 | |
International Equity Fund | | | 24,126,978 | |
Mid-Cap Fund | | | 3,530,283 | |
Opportunity Fund | | | 4,960,716 | |
Opportunity Fund (Advisor) | | | 35,976,501 | |
Overseas Fund | | | 2,487,633 | |
Value Fund | | | 4,085,539 | |
| |
HSBC INVESTOR FAMILY OF FUNDS | 72 |
|
HSBC INVESTOR FAMILY OF FUNDS |
|
Table of Shareholder Expenses (Unaudited)—as of October 31, 2008 |
As a shareholder of the HSBC Investor Funds (“Funds”), you incur two types of costs: (1) transaction costs, including sales charges (loads) on purchases, redemption fees and exchange fees, (2) ongoing costs, including management fees; distribution and /or shareholder servicing fees; and other Fund expenses. These examples are intended to help you understand your ongoing costs (in dollars) of investing in the Funds and to compare these cost with the ongoing costs of investing in other mutual funds.
These examples are based on an investment of $1,000 invested at the beginning of the period and held for the entire period from May 1, 2008 through October 31, 2008.
Actual Example
The table below provides information about actual account values and actual expenses. You may use the information below, together with the amount you invested, to estimate the expenses that you paid over the period. Simply divide your account value by $1,000 (for example, an $8,600 account value divided by $1,000 = 8.6), then multiply the result by the number in the table under the heading entitled “Expenses Paid During Period” to estimate the expenses you paid on your account during this period.
| | | | | | | | | | | | | | |
| | | | Beginning
Account Value
5/1/08 | | Ending
Account
Value
10/31/08 | | Expenses Paid
During Period*
5/1/08 - 10/31/08 | | Annualized
Expense Ratio
During Period
5/1/08 - 10/31/08 |
| | | |
| |
| |
| |
|
Core Plus Fixed Income Fund
(I Shares) | | Class I Shares | | $1,000.00 | | | $921.50 | | | $2.17 | | | 0.45 | % |
Core Plus Fixed Income Fund | | Class A Shares | | 1,000.00 | | | 919.70 | | | 3.38 | | | 0.70 | % |
| | Class B Shares | | 1,000.00 | | | 916.30 | | | 6.98 | | | 1.45 | % |
| | Class C Shares | | 1,000.00 | | | 916.10 | | | 6.98 | | | 1.45 | % |
High Yield Fixed Income Fund | | Class A Shares | | 1,000.00 | | | 752.30 | | | 3.52 | | | 0.80 | % |
| | Class B Shares | | 1,000.00 | | | 748.60 | | | 6.81 | | | 1.55 | % |
| | Class C Shares | | 1,000.00 | | | 748.80 | | | 6.81 | | | 1.55 | % |
| | Class I Shares | | 1,000.00 | | | 753.30 | | | 2.42 | | | 0.55 | % |
Intermediate Duration Fixed Income Fund | | Class A Shares | | 1,000.00 | | | 945.00 | | | 3.18 | | | 0.65 | % |
| | Class B Shares | | 1,000.00 | | | 941.60 | | | 6.83 | | | 1.40 | % |
| | Class C Shares | | 1,000.00 | | | 941.60 | | | 6.83 | | | 1.40 | % |
| | Class I Shares | | 1,000.00 | | | 946.30 | | | 1.96 | | | 0.40 | % |
New York Tax-Free Bond Fund | | Class A Shares | | 1,000.00 | | | 967.20 | | | 4.15 | | | 0.84 | % |
| | Class B Shares | | 1,000.00 | | | 963.50 | | | 7.85 | | | 1.59 | % |
| | Class C Shares | | 1,000.00 | | | 964.50 | | | 7.85 | | | 1.59 | % |
| | Class I Shares | | 1,000.00 | | | 968.40 | | | 2.92 | | | 0.59 | % |
Growth Fund | | Class A Shares | | 1,000.00 | | | 676.30 | | | 5.14 | | | 1.22 | % |
| | Class B Shares | | 1,000.00 | | | 674.70 | | | 8.25 | | | 1.96 | % |
| | Class C Shares | | 1,000.00 | | | 674.60 | | | 8.29 | | | 1.97 | % |
| | Class I Shares | | 1,000.00 | | | 677.30 | | | 4.05 | | | 0.96 | % |
International Equity Fund | | Class I Shares | | 1,000.00 | | | 539.20 | | | 3.13 | | | 0.81 | % |
Mid-Cap Fund | | Class A Shares | | 1,000.00 | | | 632.20 | | | 5.54 | | | 1.35 | % |
| | Class B Shares | | 1,000.00 | | | 629.20 | | | 8.60 | | | 2.10 | % |
| | Class C Shares | | 1,000.00 | | | 629.10 | | | 8.60 | | | 2.10 | % |
| | Class I Shares | | 1,000.00 | | | 631.90 | | | 4.51 | | | 1.10 | % |
Overseas Equity Fund | | Class A Shares | | 1,000.00 | | | 533.70 | | | 6.55 | | | 1.70 | % |
| | Class B Shares | | 1,000.00 | | | 531.80 | | | 9.43 | | | 2.45 | % |
| | Class C Shares | | 1,000.00 | | | 532.20 | | | 9.44 | | | 2.45 | % |
| |
73 | HSBC INVESTOR FAMILY OF FUNDS |
|
HSBC INVESTOR FAMILY OF FUNDS |
|
Table of Shareholder Expenses (Unaudited)—as of October 31, 2008 (continued) |
| | | | | | | | | | | | | | |
| | | | Beginning
Account Value
5/1/08 | | Ending
Account
Value
10/31/08 | | Expenses Paid
During Period*
5/1/08 - 10/31/08 | | Annualized
Expense Ratio
During Period
5/1/08 - 10/31/08 |
| | | |
| |
| |
| |
|
Opportunity Fund | | Class A Shares | | $1,000.00 | | | $661.40 | | | $6.47 | | | 1.55 | % |
| | Class B Shares | | 1,000.00 | | | 658.70 | | | 9.59 | | | 2.30 | % |
| | Class C Shares | | 1,000.00 | | | 659.20 | | | 9.59 | | | 2.30 | % |
Opportunity Fund (I Shares) | | Class I Shares | | 1,000.00 | | | 663.90 | | | 4.02 | | | 0.96 | % |
Value Fund | | Class A Shares | | 1,000.00 | | | 666.80 | | | 5.07 | | | 1.21 | % |
| | Class B Shares | | 1,000.00 | | | 664.40 | | | 8.20 | | | 1.96 | % |
| | Class C Shares | | 1,000.00 | | | 664.60 | | | 8.20 | | | 1.96 | % |
| | Class I Shares | | 1,000.00 | | | 667.90 | | | 4.02 | | | 0.96 | % |
| |
* | Expenses are equal to the average account value over the period multiplied by the Fund’s annualized expense ratio, multiplied by the number of days in the most recent fiscal half-year divided by the number of days in the fiscal year (to reflect the one half year period). |
| |
HSBC INVESTOR FAMILY OF FUNDS | 74 |
|
HSBC INVESTOR FAMILY OF FUNDS |
|
Table of Shareholder Expenses (Unaudited)—as of October 31, 2008 (continued) |
Hypothetical Example for Comparison Purposes
�� The table below provides information about hypothetical account values and hypothetical expenses based on each Fund’s actual expense ratio and an assumed rate of return of 5% per year before expenses, which is not the Fund’s actual return. The hypothetical account values and expenses may not be used to estimate the actual ending account balance or expenses you paid for the period. You may use this information to compare this 5% hypothetical example with the 5% hypothetical examples that appear in the shareholder reports of other funds.
Please note that the expenses shown in the table are meant to highlight your ongoing costs only and do not reflect any transactional costs, such as sales charges (loads), redemption fees, or exchange fees. Therefore, the table is useful in comparing ongoing costs only, and will not help you determine the relative total costs of owning different funds. In addition, if these transactional costs were included, your costs would have been higher.
| | | | | | | | | | | | | | |
| | | | Beginning
Account Value
5/1/08 | | Ending
Account
Value
10/31/08 | | Expenses Paid
During Period*
5/1/08 - 10/31/08 | | Annualized
Expense Ratio
During Period
5/1/08 - 10/31/08 |
| | | |
| |
| |
| |
|
Core Plus Fixed Income Fund
(I Shares) | | Class I Shares | | $1,000.00 | | | $1,022.87 | | | $2.29 | | | 0.45 | % |
Core Plus Fixed Income Fund | | Class A Shares | | 1,000.00 | | | 1,021.62 | | | 3.56 | | | 0.70 | % |
| | Class B Shares | | 1,000.00 | | | 1,017.85 | | | 7.35 | | | 1.45 | % |
| | Class C Shares | | 1,000.00 | | | 1,017.85 | | | 7.35 | | | 1.45 | % |
High Yield Fixed Income Fund | | Class A Shares | | 1,000.00 | | | 1,021.11 | | | 4.06 | | | 0.80 | % |
| | Class B Shares | | 1,000.00 | | | 1,017.34 | | | 7.86 | | | 1.55 | % |
| | Class C Shares | | 1,000.00 | | | 1,017.34 | | | 7.86 | | | 1.55 | % |
| | Class I Shares | | 1,000.00 | | | 1,022.37 | | | 2.80 | | | 0.55 | % |
Intermediate Duration Fixed Income Fund | | Class A Shares | | 1,000.00 | | | 1,021.87 | | | 3.30 | | | 0.65 | % |
| | Class B Shares | | 1,000.00 | | | 1,018.10 | | | 7.10 | | | 1.40 | % |
| | Class C Shares | | 1,000.00 | | | 1,018.10 | | | 7.10 | | | 1.40 | % |
| | Class I Shares | | 1,000.00 | | | 1,023.13 | | | 2.03 | | | 0.40 | % |
New York Tax-Free Bond Fund | | Class A Shares | | 1,000.00 | | | 1,020.91 | | | 4.27 | | | 0.84 | % |
| | Class B Shares | | 1,000.00 | | | 1,017.14 | | | 8.06 | | | 1.59 | % |
| | Class C Shares | | 1,000.00 | | | 1,017.14 | | | 8.06 | | | 1.59 | % |
| | Class I Shares | | 1,000.00 | | | 1,022.17 | | | 3.00 | | | 0.59 | % |
Growth Fund | | Class A Shares | | 1,000.00 | | | 1,019.00 | | | 6.19 | | | 1.22 | % |
| | Class B Shares | | 1,000.00 | | | 1,015.28 | | | 9.93 | | | 1.96 | % |
| | Class C Shares | | 1,000.00 | | | 1,015.23 | | | 9.98 | | | 1.97 | % |
| | Class I Shares | | 1,000.00 | | | 1,020.31 | | | 4.88 | | | 0.96 | % |
International Equity Fund | | Class I Shares | | 1,000.00 | | | 1,021.06 | | | 4.12 | | | 0.81 | % |
Mid-Cap Fund | | Class A Shares | | 1,000.00 | | | 1,018.35 | | | 6.85 | | | 1.35 | % |
| | Class B Shares | | 1,000.00 | | | 1,014.58 | | | 10.63 | | | 2.10 | % |
| | Class C Shares | | 1,000.00 | | | 1,014.58 | | | 10.63 | | | 2.10 | % |
| | Class I Shares | | 1,000.00 | | | 1,019.61 | | | 5.58 | | | 1.10 | % |
Overseas Equity Fund | | Class A Shares | | 1,000.00 | | | 1,016.59 | | | 8.62 | | | 1.70 | % |
| | Class B Shares | | 1,000.00 | | | 1,012.82 | | | 12.40 | | | 2.45 | % |
| | Class C Shares | | 1,000.00 | | | 1,012.82 | | | 12.40 | | | 2.45 | % |
| |
75 | HSBC INVESTOR FAMILY OF FUNDS |
|
HSBC INVESTOR FAMILY OF FUNDS |
|
Table of Shareholder Expenses (Unaudited)—as of October 31, 2008 (continued) |
| | | | | | | | | | | | | | |
| | | | Beginning
Account Value
5/1/08 | | Ending
Account
Value
10/31/08 | | Expenses Paid
During Period*
5/1/08 - 10/31/08 | | Annualized
Expense Ratio
During Period
5/1/08 - 10/31/08 |
| | | |
| |
| |
| |
|
| | | | | | | | | | | | | | |
Opportunity Fund | | Class A Shares | | $1,000.00 | | | 1,017.34 | | | 7.86 | | | 1.55 | % |
| | Class B Shares | | 1,000.00 | | | 1,013.57 | | | 11.64 | | | 2.30 | % |
| | Class C Shares | | 1,000.00 | | | 1,013.57 | | | 11.64 | | | 2.30 | % |
Opportunity Fund (I Shares) | | Class I Shares | | 1,000.00 | | | 1,020.31 | | | 4.88 | | | 0.96 | % |
Value Fund | | Class A Shares | | 1,000.00 | | | 1,019.05 | | | 6.14 | | | 1.21 | % |
| | Class B Shares | | 1,000.00 | | | 1,015.28 | | | 9.93 | | | 1.96 | % |
| | Class C Shares | | 1,000.00 | | | 1,015.28 | | | 9.93 | | | 1.96 | % |
| | Class I Shares | | 1,000.00 | | | 1,020.31 | | | 4.88 | | | 0.96 | % |
| |
* Expenses are equal to the average account value over the period multiplied by the Fund’s annualized expense ratio, multiplied by the number of days in the most recent fiscal half-year divided by the number of days in the fiscal year (to reflect the one half year period). |
| |
HSBC INVESTOR FAMILY OF FUNDS | 76 |
|
HSBC INVESTOR CORE PLUS FIXED INCOME PORTFOLIO |
|
Schedule of Portfolio Investments—as of October 31, 2008 |
| | | | | | | |
Certificates of Deposit—0.1% | | | | | | | |
|
|
|
|
|
|
|
|
| | | | | | | |
| | Shares or
Principal
Amount($) | | Value($) | |
| |
| |
| |
Banking—0.1% | | | | | | | |
First Tennessee Bank, 2.96%,
12/17/09 (a) | | | 100,000 | | | 99,029 | |
| | | | |
|
| |
TOTAL CERTIFICATES OF DEPOSIT
(COST $94,978) | | | | | | 99,029 | |
| | | | |
|
| |
| | | | | | | |
U.S. Government and Government Agency Obligations—43.4% | | | | | | | |
|
|
|
|
|
|
|
|
Federal Home Loan Mortgage Corp.—10.8% | | | | | | | |
Pool #1B2655, 6.21%, 12/1/34 (a)(h) | | | 487,814 | | | 490,212 | |
Pool #1J1313, 6.37%, 6/1/36 (a) | | | 1,142,823 | | | 1,159,719 | |
Pool #847557, 5.85%, 7/1/34 (a)(h) | | | 585,641 | | | 598,062 | |
Pool #C00368, 8.50%, 10/1/24 | | | 23,979 | | | 25,815 | |
Pool #C00922, 8.00%, 2/1/30 | | | 142,230 | | | 150,163 | |
Pool #C54447, 7.00%, 7/1/31 | | | 32,243 | | | 33,088 | |
Pool #C60712, 6.50%, 11/1/31 | | | 472,414 | | | 482,778 | |
Pool #C80387, 6.50%, 4/1/26 | | | 23,016 | | | 23,571 | |
Pool #D62926, 6.50%, 8/1/25 | | | 19,016 | | | 19,479 | |
Pool #G01317, 7.00%, 10/1/31 | | | 116,043 | | | 119,084 | |
Pool #G02981, 6.00%, 6/1/37 | | | 1,009,949 | | | 1,008,749 | |
TBA November: | | | | | | | |
5.00%, 11/15/22 | | | 3,865,000 | | | 3,773,206 | |
5.50%, 11/15/22 | | | 960,000 | | | 955,500 | |
| | | | |
|
| |
| | | | | | 8,839,426 | |
| | | | |
|
| |
Federal National Mortgage Association—23.7% | | | | | | | |
Pool #253438, 8.50%, 9/1/30 | | | 31,300 | | | 33,652 | |
Pool #256723, 6.50%, 5/1/37 | | | 982,919 | | | 996,901 | |
Pool #329530, 7.00%, 12/1/25 | | | 52,627 | | | 54,838 | |
Pool #329655, 7.00%, 11/1/25 | | | 21,900 | | | 22,820 | |
Pool #356905, 5.66%, 10/1/36 (a) | | | 140,731 | | | 142,435 | |
Pool #398958, 6.50%, 10/1/12 | | | 24,077 | | | 24,644 | |
Pool #535332, 8.50%, 4/1/30 | | | 34,148 | | | 36,727 | |
Pool #535440, 8.50%, 8/1/30 | | | 38,193 | | | 41,063 | |
Pool #548965, 8.50%, 7/1/30 | | | 38,096 | | | 40,959 | |
Pool #568486, 7.00%, 1/1/31 | | | 38,058 | | | 39,422 | |
Pool #573752, 8.50%, 2/1/31 | | | 29,026 | | | 31,208 | |
Pool #575328, 6.50%, 4/1/31 | | | 48,163 | | | 49,220 | |
Pool #922090, 5.84%, 3/1/37 (a) | | | 1,676,596 | | | 1,693,705 | |
TBA November: | | | | | | | |
5.00%, 11/15/36 | | | 3,100,000 | | | 2,936,283 | |
5.50%, 11/15/36 | | | 8,690,000 | | | 8,489,044 | |
6.00%, 11/15/37 | | | 4,800,000 | | | 4,797,000 | |
| | | | |
|
| |
| | | | | | 19,429,921 | |
| | | | |
|
| |
Government National Mortgage Association—6.3% | | | | | | | |
Pool #346406, 7.50%, 2/15/23 | | | 41,467 | | | 43,910 | |
Pool #412530, 7.50%, 12/15/25 | | | 68,806 | | | 72,830 | |
Pool #781300, 7.00%, 6/15/31 | | | 112,141 | | | 114,877 | |
TBA November: | | | | | | | |
5.00%, 11/15/36 | | | 2,800,000 | | | 2,671,374 | |
5.50%, 11/15/36 | | | 610,000 | | | 598,181 | |
6.00%, 11/15/36 | | | 1,680,000 | | | 1,680,000 | |
| | | | |
|
| |
| | | | | | 5,181,172 | |
| | | | |
|
| |
U.S. Treasury Bonds—2.3% | | | | | | | |
5.00%, 5/15/37 | | | 1,685,000 | | | 1,855,869 | |
| | | | |
|
| |
| | | | | | | |
U.S. Government and Government Agency Obligations, cont’d | | | | | | | |
|
|
|
|
|
|
|
|
| | | | | | | |
| | Shares or
Principal
Amount($) | | Value($) | |
| |
| |
| |
U.S. Treasury Notes—0.3% | | | | | | | |
3.13%, 9/30/13 | | | 245,000 | | | 248,981 | |
| | | | |
|
| |
TOTAL U.S. GOVERNMENT AND
GOVERNMENT AGENCY
OBLIGATIONS
(COST $35,928,025) | | | | | | 35,555,369 | |
| | | | |
|
| |
| | | | | | | |
Corporate Obligations—38.3% | | | | | | | |
|
|
|
|
|
|
|
|
Agricultural Chemicals—1.3% | | | | | | | |
Agrium, Inc., 6.75%, 1/15/19 | | | 600,000 | | | 541,220 | |
Cargill, Inc., 5.60%, 9/15/12 (b) | | | 600,000 | | | 557,003 | |
| | | | |
|
| |
| | | | | | 1,098,223 | |
| | | | |
|
| |
Banking—0.6% | | | | | | | |
American Express Centurion Bank,
5.95%, 6/12/17 | | | 700,000 | | | 517,176 | |
| | | | |
|
| |
Building & Construction Products—1.3% | | | | | | | |
Martin Marietta Materials, Inc.,
3.62%, 4/30/10 (a)(h) | | | 600,000 | | | 579,362 | |
Masco Corp., 3.12%, 3/12/10 (a)(h) | | | 550,000 | | | 518,006 | |
| | | | |
|
| |
| | | | | | 1,097,368 | |
| | | | |
|
| |
Cable Television—0.6% | | | | | | | |
Time Warner Cable, Inc.,
7.30%, 7/1/38 | | | 625,000 | | | 522,927 | |
| | | | |
|
| |
Chemicals—0.1% | | | | | | | |
Chemtura Corp., 6.88%, 6/1/16 | | | 175,000 | | | 109,375 | |
| | | | |
|
| |
Computer Services—0.8% | | | | | | | |
Electronic Data Systems, Series B,
6.00%, 8/1/13 | | | 700,000 | | | 660,792 | |
| | | | |
|
| |
Consumer Products—1.0% | | | | | | | |
Clorox Co. (The), 5.45%, 10/15/12 | | | 900,000 | | | 832,055 | |
| | | | |
|
| |
Electric—5.7% | | | | | | | |
Commonwealth Edison Co., 6.45%,
1/15/38 | | | 700,000 | | | 524,802 | |
Dominion Resources, Inc., 6.40%,
6/15/18 | | | 250,000 | | | 211,832 | |
Duke Energy Corp., 5.65%, 6/15/13 | | | 450,000 | | | 406,335 | |
Florida Power Corp., 5.65%, 6/15/18 | | | 550,000 | | | 486,898 | |
MidAmerican Energy Co., 5.95%,
7/15/17 | | | 2,900,000 | | | 2,535,000 | |
Puget Sound Energy, Inc., 6.97%,
6/1/67, Callable 6/1/17 @ 100 | | | 600,000 | | | 501,000 | |
| | | | |
|
| |
| | | | | | 4,665,867 | |
| | | | |
|
| |
Finance—8.2% | | | | | | | |
American Honda Finance Corp.,
4.63%, 4/2/13, MTN (b) | | | 250,000 | | | 226,784 | |
Bear Stearns Co., Inc.: | | | | | | | |
4.50%, 10/28/10 | | | 600,000 | | | 583,206 | |
Series B, 6.95%, 8/10/12, MTN | | | 950,000 | | | 937,422 | |
Citigroup, Inc., 6.50%, 8/19/13 | | | 225,000 | | | 213,291 | |
Countrywide Home Loans, Series L,
4.00%, 3/22/11, MTN | | | 1,150,000 | | | 1,060,545 | |
Ford Motor Credit Co., LLC,
9.75%, 9/15/10 | | | 1,550,000 | | | 1,054,076 | |
| | |
77 | HSBC INVESTOR PORTFOLIOS | See notes to financial statements. |
|
HSBC INVESTOR CORE PLUS FIXED INCOME PORTFOLIO |
|
Schedule of Portfolio Investments—as of October 31, 2008 (continued) |
| | | | | | | |
Corporate Obligations, continued | | | | | | | |
|
|
|
|
|
|
|
|
| | | | | | | |
| | Shares or
Principal
Amount($) | | Value($) | |
| |
| |
| |
Lehman Brothers Holdings, Series I,
6.88%, 5/2/18, MTN (g) | | | 500,000 | | | 65,000 | |
Morgan Stanley, Series F, 6.00%,
4/28/15, MTN | | | 565,000 | | | 459,090 | |
Preferred Term Securities Ltd.,
8.79%, 9/15/30, Callable 9/15/10
@ 104.395 (b) | | | 768,227 | | | 556,004 | |
Wells Fargo Financial, 5.50%, 8/1/12 | | | 850,000 | | | 841,140 | |
XTRA Finance Corp., 5.15%, 4/1/17 | | | 750,000 | | | 681,810 | |
| | | | |
|
| |
| | | | | | 6,678,368 | |
| | | | |
|
| |
Forestry/Paper—0.2% | | | | | | | |
Georgia-Pacific Corp., 7.70%,
6/15/15 | | | 250,000 | | | 173,750 | |
| | | | |
|
| |
Gaming—0.1% | | | | | | | |
MGM MIRAGE, Inc., 6.75%, 4/1/13 | | | 175,000 | | | 109,375 | |
| | | | |
|
| |
Health Services—0.2% | | | | | | | |
Community Health Systems, Inc., 8.88%,
7/15/15, Callable 7/15/11 @ 104.44 | | | 175,000 | | | 146,562 | |
| | | | |
|
| |
Hospitals—1.2% | | | | | | | |
Covidien International Finance SA, 5.45%,
10/15/12 | | | 550,000 | | | 530,755 | |
HCA, Inc., 5.75%, 3/15/14 | | | 750,000 | | | 442,500 | |
| | | | |
|
| |
| | | | | | 973,255 | |
| | | | |
|
| |
Media—0.9% | | | | | | | |
News America Holdings, 7.90%, 12/1/95 | | | 500,000 | | | 376,145 | |
Vivendi, 5.75%, 4/4/13 (b) | | | 350,000 | | | 321,553 | |
| | | | |
|
| |
| | | | | | 697,698 | |
| | | | |
|
| |
Media - Cable—0.2% | | | | | | | |
Cablevision Systems Corp., Series B,
8.00%, 4/15/12 | | | 175,000 | | | 147,219 | |
| | | | |
|
| |
Office Equipment & Services—0.6% | | | | | | | |
Xerox Corp., 3.63%, 12/18/09 (a)(h) | | | 550,000 | | | 501,750 | |
| | | | |
|
| |
Oil & Gas—0.2% | | | | | | | |
Pioneer Natural Resources Co., 5.88%,
7/15/16 | | | 175,000 | | | 127,860 | |
| | | | |
|
| |
Pipelines—0.6% | | | | | | | |
Dynegy Holdings, Inc., 7.75%, 6/1/19 | | | 175,000 | | | 117,250 | |
Transcontinental Gas Pipeline Corp.,
6.05%, 6/15/18 | | | 450,000 | | | 359,968 | |
| | | | |
|
| |
| | | | | | 477,218 | |
| | | | |
|
| |
Retail—2.5% | | | | | | | |
Kohl’s Corp., 6.25%, 12/15/17 | | | 550,000 | | | 433,181 | |
Kroger Co. (The), 5.00%, 4/15/13 | | | 250,000 | | | 225,420 | |
Wal-Mart Stores, Inc., 6.50%, 8/15/37 | | | 1,500,000 | | | 1,346,407 | |
| | | | |
|
| |
| | | | | | 2,005,008 | |
| | | | |
|
| |
Support - Services—0.4% | | | | | | | |
Aramark Services, Inc., 8.50%, 2/1/15,
Callable 2/1/11 @104.25 | | | 175,000 | | | 149,625 | |
Iron Mountain, Inc., 8.00%, 6/15/20,
Callable 6/15/13 @ 104 | | | 175,000 | | | 137,375 | |
| | | | |
|
| |
| | | | | | 287,000 | |
| | | | |
|
| |
|
Corporate Obligations, continued | | | | | | | |
|
|
|
|
|
|
|
|
| | | | | | | |
| | Shares or
Principal
Amount($) | | Value($) | |
| |
| |
| |
Telecom - Integrated/Services—0.2% | | | | | | | |
Qwest Corp., 7.63%, 6/15/15 | | | 175,000 | | | 133,875 | |
| | | | |
|
| |
Telecommunications—5.3% | | | | | | | |
AOL Time Warner, Inc.: | | | | | | | |
6.88%, 5/1/12 | | | 600,000 | | | 539,112 | |
7.70%, 5/1/32 | | | 550,000 | | | 444,292 | |
BellSouth Telecommunications, 7.00%,
12/1/95 | | | 700,000 | | | 510,027 | |
GTE Corp., 6.84%, 4/15/18 | | | 750,000 | | | 677,726 | |
Sprint Nextel Corp., 6.00%, 12/1/16 | | | 1,110,000 | | | 768,675 | |
Time Warner Entertainment Co., 8.38%,
3/15/23 | | | 800,000 | | | 713,912 | |
Verizon Communications, Inc., 6.10%,
4/15/18 | | | 750,000 | | | 655,259 | |
| | | | |
|
| |
| | | | | | 4,309,003 | |
| | | | |
|
| |
Transportation—6.1% | | | | | | | |
American Airlines, Inc.: | | | | | | | |
Series 2001-2, Class A1, 6.98%,
4/1/11 | | | 386,067 | | | 354,216 | |
Series 2001-2, Class A2, 7.86%,
10/1/11 | | | 1,250,000 | | | 993,750 | |
Burlington North Santa Fe: | | | | | | | |
5.65%, 5/1/17 | | | 600,000 | | | 525,046 | |
7.57%, 1/2/21 | | | 277,493 | | | 272,529 | |
Continental Airlines, Inc., 5.98%, 4/19/22 | | | 750,000 | | | 521,250 | |
Norfolk Southern Corp., 5.75%, 4/1/18 | | | 250,000 | | | 215,192 | |
Union Pacific Corp.: | | | | | | | |
5.75%, 11/15/17 | | | 1,200,000 | | | 1,017,030 | |
6.85%, 1/2/19 | | | 1,104,592 | | | 1,090,806 | |
| | | | |
|
| |
| | | | | | 4,989,819 | |
| | | | |
|
| |
TOTAL CORPORATE OBLIGATIONS
(COST $37,217,408) | | | | | | 31,261,543 | |
| | | | |
|
| |
| | | | | | | |
Asset Backed Securities—25.1% | | | | | | | |
|
|
|
|
|
|
|
|
Asset Backed Funding Certificates,
Series 2003-AHL1, Class A1,
3.68%, 3/25/33 | | | 738,743 | | | 611,712 | |
Cairn Mezzanine plc, Series 2007-3A,
Class B1, 3.70%, 8/13/47 (a)(b) | | | 905,000 | | | 0 | |
Capital Auto Receivables Asset Trust: | | | | | | | |
Series 2005-1, Class A5, 4.66%,
1/15/10 (a)(h) | | | 338,358 | | | 337,515 | |
Series 2006-SN1A, Class A3, 5.31%,
10/20/09 (b)(h) | | | 222,717 | | | 222,717 | |
Series 2006-SN1A, Class A4B, 4.39%,
3/20/10 (a)(b)(h) | | | 810,000 | | | 797,815 | |
Series 2007-SN1, Class A3A, 5.38%,
7/15/10 (h) | | | 740,000 | | | 732,665 | |
Series 2007-SN1, Class A3B, 4.62%,
7/15/10 (a)(h) | | | 860,000 | | | 840,073 | |
Capital One Prime Auto Receivables Trust: | | | | | | | |
Series 2005-1, Class A4, 4.58%,
4/15/11 (a)(h) | | | 398,489 | | | 390,219 | |
Series 2006-1, Class A3, 4.99%,
9/15/10 (h) | | | 694,871 | | | 694,856 | |
Carmax Auto Owner Trust, Series 2008-2,
Class A2B, 5.46%, 9/15/11 (a)(h) | | | 1,400,000 | | | 1,346,140 | |
| | |
See notes to financial statements. | HSBC INVESTOR PORTFOLIOS | 78 |
|
HSBC INVESTOR CORE PLUS FIXED INCOME PORTFOLIO |
|
Schedule of Portfolio Investments—as of October 31, 2008 (continued) |
| | | | | | | |
Asset Backed Securities, continued | | | | | | | |
|
|
|
|
|
|
|
|
| | | | | | | |
| | Shares or
Principal
Amount($) | | Value($) | |
| |
| |
| |
Chase Issuance Trust, Series 2005-A12,
Class A, 4.57%, 2/15/11 (a)(h) | | | 1,250,000 | | | 1,244,194 | |
Countrywide Asset-Backed Certificates: | | | | | | | |
Series 2006-S2, Class A5, 5.75%,
7/25/27 (a) | | | 1,023,000 | | | 286,360 | |
Series 2006-S4, Class A3, 5.80%,
7/25/34 | | | 1,056,485 | | | 613,547 | |
Dominos Pizza Master Issuer LLC,
Series 2007-1, Class A2, 5.26%,
4/25/37 (b) | | | 1,200,000 | | | 986,561 | |
Duane Street CLO, Series 2007-4A, Class C,
3.80%, 11/14/21 (a)(b) | | | 850,000 | | | 306,850 | |
Ford Credit Auto Owner Trust, Series 2006-C,
Class A2A, 5.29%, 12/15/09 (h) | | | 649,602 | | | 649,356 | |
GE Business Loan Trust, Series 2006-2A,
Class A, 4.74%, 11/15/34 (a)(b)(h) | | | 1,371,669 | | | 1,135,950 | |
GE Equipment Small Ticket LLC,
Series 2005-2A, Class A3, 4.88%,
10/22/09 (b)(h) | | | 116,827 | | | 116,553 | |
GMAC Mortgage Corp., Loan Trust,
Series 2006-HE3, Class A3, 5.81%,
10/25/36 | | | 900,000 | | | 504,450 | |
Hyundai Auto Receivables Trust: | | | | | | | |
Series 2007-A, Class A2B, 4.91%,
1/15/10 (a)(h) | | | 180,360 | | | 180,014 | |
Series 2008-A, Class A2, 4.16%,
5/16/11 (h) | | | 1,020,000 | | | 1,000,608 | |
IOWA Student Loan Liquidity Corp.,
Series 2005-1, Class A1, 3.24%,
6/25/14 (a)(h) | | | 354,144 | | | 352,230 | |
National Collegiate Student Loan Trust,
Series 2006-3, Class A1, 3.29%,
9/25/19 (a)(h) | | | 763,889 | | | 677,437 | |
Nissan Auto Receivables Owner Trust,
Series 2006-B, Class A3, 5.16%,
2/15/10 (h) | | | 410,838 | | | 410,563 | |
Preferred Term Securities XXII Ltd., 3.16%,
9/22/36, Callable 6/22/11 @ 100 (a)(b)(h) | | | 1,079,503 | | | 583,472 | |
Residential Funding Mortgage Securities,
Series 2006-HSA1, Class A5, 5.31%,
2/25/36 | | | 490,000 | | | 125,573 | |
SLM Student Loan Trust: | | | | | | | |
Series 2005-4, Class A2, 3.62%,
4/26/21 (a)(h) | | | 490,000 | | | 455,390 | |
Series 2005-9, Class A4, 3.64%,
1/25/23 (a)(h) | | | 1,360,000 | | | 1,286,200 | |
Series 2006-7, Class A2, 3.53%,
10/25/16 (a)(h) | | | 1,214,374 | | | 1,212,078 | |
Series 2006-9, Class A2, 3.54%,
4/25/17 (a)(h) | | | 264,353 | | | 263,039 | |
Series 2006-B, Class A1, 2.83%,
9/15/20 (a)(h) | | | 1,085,646 | | | 1,015,079 | |
South Carolina Student Loan Corp.,
Series 2008-1, Class A1, 3.31%,
9/2/14 (a)(h) | | | 942,901 | | | 923,748 | |
World Omni Auto Receivables Trust,
Series 2007-B, Class A2B, 4.88%,
2/16/10 (a)(h) | | | 245,333 | | | 244,941 | |
| | | | |
|
| |
TOTAL ASSET BACKED SECURITIES
(COST $24,334,833) | | | | | | 20,547,905 | |
| | | | |
|
| |
| | | | | | | |
Collateralized Mortgage Obligations—5.9% | | | | | | | |
|
|
|
|
|
|
|
|
| | | | | | | |
| | Shares or
Principal
Amount($) | | Value($) | |
| |
| |
| |
Banc of America Mortgage Securities,
Series 2005-D, Class 2A4, 4.79%,
5/25/35 (a)(h) | | | 968,912 | | | 931,909 | |
Deutsche Mortgage Securities, Inc.,
Series 2006-WF1, Class 1A1, 5.09%,
6/26/35 (a)(b) | | | 824,958 | | | 821,186 | |
Fannie Mae IO: | | | | | | | |
Series 270, Class 2, 8.50%, 9/1/23 (c) | | | 37,649 | | | 10,022 | |
Series 296, Class 2, 8.00%, 4/1/24 (c) | | | 45,014 | | | 11,879 | |
Series 306, Class IO, 8.00%, 5/1/30 (c) | | | 53,648 | | | 12,238 | |
Series 2000-16, Class PS, 5.34%,
10/25/29 (a)(c) | | | 25,030 | | | 880 | |
Series 2001-4, Class SA, 3.19%,
2/17/31 (a)(c) | | | 177,348 | | | 17,877 | |
FHA Weyerhauser, 7.43%, 1/1/24 (e)(f) | | | 26,158 | | | 26,158 | |
Freddie Mac: | | | | | | | |
Series 2988, Class AF, 4.89%,
6/15/35 (a)(h) | | | 979,755 | | | 922,366 | |
Series 3212, Class BK, 5.50%, 9/15/36 | | | 900,000 | | | 827,195 | |
Freddie Mac IO: | | | | | | | |
Series 1534, Class K, 2.78%,
6/15/23 (a)(c) | | | 119,246 | | | 15,870 | |
Series 2141, Class SD, 3.56%,
4/15/29 (a)(c) | | | 100,776 | | | 14,795 | |
Series 2247, Class SC, 2.91%,
8/15/30 (a)(c) | | | 50,605 | | | 5,882 | |
Government National Mortgage
Association IO: | | | | | | | |
Series 1999-30, Class S, 4.13%,
8/16/29 (a)(c) | | | 43,767 | | | 6,419 | |
Series 1999-30, Class SA, 3.53%,
4/16/29 (a)(c) | | | 61,089 | | | 6,151 | |
Residential Asset Securitization Trust,
Series 2003-A15, Class 1A2, 3.71%,
2/25/34 (a)(h) | | | 1,325,412 | | | 1,177,631 | |
| | | | |
|
| |
TOTAL COLLATERALIZED
MORTGAGE OBLIGATIONS
(COST $5,029,101) | | | | | | 4,808,458 | |
| | | | |
|
| |
| | | | | | | |
Commercial Mortgage Backed Securities—11.4% | | | | | | | |
|
|
|
|
|
|
|
|
Citigroup Commercial Mortgage Trust,
Series 2006-C5, Class A2, 5.38%,
10/15/49 | | | 1,100,000 | | | 984,285 | |
Citigroup/Deutsche Bank Commercial
Mortgage Trust, Series 2007-CD4,
Class A2B, 5.21%, 12/11/49 | | | 1,300,000 | | | 1,134,177 | |
Commercial Mortgage Pass -
Through Certificate: | | | | | | | |
Series 2005-LP5, Class AJ, 5.05%,
5/10/43 | | | 1,550,000 | | | 1,050,694 | |
Series 2006-FL12, Class A2, 4.66%,
12/15/20 (a)(b)(h) | | | 1,443,883 | | | 1,228,923 | |
CWCapital Cobalt, Series 2006-C1, Class A2,
5.17%, 8/15/48 | | | 1,232,000 | | | 1,115,979 | |
DLJ Mortgage Acceptance Corp., IO,
Series 1997-CF1, Class S, 1.19%,
5/15/30 (a)(c)(e) | | | 17,984 | | | 1 | |
Greenwich Capital Commercial Funding Corp.: | | | | | | | |
Series 2006-GG7, Class A2, 5.91%,
7/10/38 (a) | | | 640,000 | | | 591,822 | |
| | |
79 | HSBC INVESTOR PORTFOLIOS | See notes to financial statements. |
|
HSBC INVESTOR CORE PLUS FIXED INCOME PORTFOLIO |
|
Schedule of Portfolio Investments—as of October 31, 2008 (continued) |
| | | | | | | |
Commercial Mortgage Backed Securities, continued | | | | | | | |
|
|
|
|
|
|
|
|
| | | | | | | |
| | Shares or
Principal
Amount($) | | Value($) | |
| |
| |
| |
Series 2006-GG7, Class A4, 5.91%,
7/10/38 (a) | | | 1,040,000 | | | 829,480 | |
GS Mortgage Securities Corp., IO,
Series 1997-GL, Class X2, 0.29%,
7/13/30 (a)(c)(e) | | | 35,694 | | | 414 | |
LB-UBS Commercial Mortgage Trust,
Series 2006-C6, Class A2, 5.26%,
9/15/39 | | | 480,000 | | | 440,906 | |
Morgan Stanley Capital I, Series 2007-IQ14,
Class A2, 5.61%, 4/15/49 | | | 1,380,000 | | | 1,197,531 | |
Washington Mutual Commercial Mortgage
Securities Trust, Series 2006-SL1,
Class A, 5.30%, 11/23/43 (a)(b) | | | 963,607 | | | 722,705 | |
| | | | |
|
| |
TOTAL COMMERCIAL MORTGAGE
BACKED SECURITIES
(COST $11,075,016) | | | | | | 9,296,917 | |
| | | | |
|
| |
| | | | | | | |
Foreign Bonds—0.6% | | | | | | | |
|
|
|
|
|
|
|
|
United Kingdom—0.6% | | | | | | | |
Barclays Bank plc, 5.93%, 12/31/49 (b) | | | 850,000 | | | 456,304 | |
| | | | |
|
| |
TOTAL FOREIGN BONDS
(COST $862,060) | | | | | | 456,304 | |
| | | | |
|
| |
| | | | | | | |
Municipal Bonds—2.4% | | | | | | | |
|
|
|
|
|
|
|
|
Arizona Educational Loan Marketing Corp.
Educational Loan Revenue, Series A-1-B,
3.71%, 1/25/10, (Credit Support
Guaranteed Student Loans) (a)(h) | | | 534,000 | | | 521,985 | |
Chicago Transit Authority Sales & Transfer
Tax Receipts Revenue, Series A, 6.90%,
12/1/40, AMT | | | 800,000 | | | 723,216 | |
Connecticut State, GO, Series B, 5.00%,
4/15/18 | | | 650,000 | | | 678,834 | |
| | | | |
|
| |
TOTAL MUNICIPAL BONDS
(COST $2,034,869) | | | | | | 1,924,035 | |
| | | | |
|
| |
| | | | | | | |
Investment Company—2.7% | | | | | | | |
|
|
|
|
|
|
|
|
| | | | | | | |
| | Shares or
Principal
Amount($) | | Value($) | |
| |
| |
| |
Northern Institutional Diversified Assets
Portfolio, Shares Class, 0.82% (d)(h) | | | 2,193,345 | | | 2,193,345 | |
| | | | |
|
| |
TOTAL INVESTMENT COMPANY
(COST $2,193,345) | | | | | | 2,193,345 | |
| | | | |
|
| |
TOTAL INVESTMENTS
(COST $118,769,635) — 129.9% | | | | | | 106,142,905 | |
| | | | |
|
| |
| |
|
| Percentages indicated are based on net assets of $81,727,877. |
| |
(a) | Variable rate security. The interest rates on these securities are adjusted periodically to reflect then-current short-term interest rates. The rates presented represent the rates in effect on October 31, 2008. The maturity dates presented reflect the final maturity dates. However, some of these securities may contain put or demand features that allow the fund to require the issuer to repurchase the security from the fund within various time periods, including daily, weekly, monthly, or semi-annually. |
| |
(b) | Security exempt from registration under Rule 144a of the Securities Act of 1933. This security may be resold in transactions exempt from registration, normally to qualified institutional buyers. This security has been deemed liquid by the Investment Adviser based on procedures approved by the Board of Trustees. |
| |
(c) | Interest-Only represents securities that entitle holders to receive only interest payments on the underlying mortgages. The yield to maturity of an Interest-Only is extremely sensitive to the rate of principal payments on the underlying mortgage assets. A rapid (slow) rate of principal repayments may have an adverse (positive) effect on yield to maturity. Interest rate adjusts periodically based on the pay off of the underlying mortgage. The interest rate presented represents the rates in effect on October 31, 2008. The principal amount shown is the notional amount of the underlying mortgages. |
| |
(d) | The rates presented represent the annualized one day yield that was in effect on October 31, 2008. |
| |
(e) | Rule 144a, section 4(2) or other security which is restricted as to resale to institutional investors. The Investment Adviser, using Board approved procedures, has deemed these securities to be illiquid. Represents 0.03% of total net assets. |
| |
(f) | Security was fair valued as of October 31, 2008. Represents 0.03% of net assets. |
| |
(g) | Security is non-income producing; Defaulted Bond. |
| |
(h) | Security held as collateral for to be announced securities. |
| | |
AMT | — | Interest on security is subject to federal alternative minimum tax |
CLO | — | Collateralized Loan Obligation |
FHA | — | Federal Housing Administration |
GO | — | General Obligation |
IO | — | Interest-Only security. Represents 0.13% of net assets. |
LLC | — | Limited Liability Co. |
MTN | — | Medium Term Note |
PLC | — | Public Limited Co. |
TBA | — | Security was traded on a “to be announced” basis. Represents 31.7% of net assets. |
| | |
See notes to financial statements. | HSBC INVESTOR PORTFOLIOS | 80 |
|
HSBC INVESTOR HIGH YIELD FIXED INCOME PORTFOLIO |
|
Schedule of Portfolio Investments—as of October 31, 2008 |
| | | | | | | |
Common Stock—0.0% | | | | | | | |
|
|
| | Shares or
Principal
Amount($) | | Value($) | |
| |
| |
| |
Consumer Discretionary—0.0% | | | | | | | |
Tembec, Inc. (a) | | | 937 | | | 1,012 | |
| | | | |
|
| |
TOTAL COMMON STOCK
(COST $18,548) | | | | | | 1,012 | |
| | | | |
|
| |
Corporate Obligations—96.8% | | | | | | | |
|
|
|
|
|
|
|
|
Aerospace & Defense—3.4% | | | | | | | |
BE Aerospace, Inc., 8.50%, 7/1/18,
Callable 7/1/13 @ 104.25 | | | 25,000 | | | 21,500 | |
Bombardier, Inc., 8.00%, 11/15/14,
Callable 11/15/10 @ 104.00 (b) | | | 25,000 | | | 21,375 | |
DRS Technologies, Inc., 7.63%, 2/1/18,
Callable 2/1/11 @ 103.81 | | | 100,000 | | | 99,000 | |
Hawker Beechcraft Acquisition Co.: | | | | | | | |
8.50%, 4/1/15, Callable 4/1/11 @ 104.25 | | | 50,000 | | | 30,000 | |
9.75%, 4/1/17, Callable 4/1/12 @ 104.88 | | | 25,000 | | | 14,000 | |
L-3 Communications Holdings, Inc.,
5.88%, 1/15/15, Callable 1/15/10
@ 102.94 | | | 100,000 | | | 82,000 | |
Sequa Corp., 11.75%, 12/1/15,
Callable 12/1/11 @ 105.88 (b) | | | 50,000 | | | 31,000 | |
TransDigm Group, Inc., 7.75%, 7/15/14,
Callable 7/15/09 @ 105.81 | | | 50,000 | | | 40,000 | |
| | | | |
|
| |
| | | | | | 338,875 | |
| | | | |
|
| |
Airline—0.4% | | | | | | | |
DAE Aviation Holdings, Inc., 11.25%,
8/1/15, Callable 8/1/11 @ 105.62 (b) | | | 50,000 | | | 37,500 | |
| | | | |
|
| |
Apparel/Textiles—1.4% | | | | | | | |
AGY Holding Corp., 11.00%, 11/15/14,
Callable 11/15/10 @ 105.50 | | | 50,000 | | | 35,000 | |
Levi Strauss & Co., 8.88%, 4/1/16,
Callable 4/1/11 @ 104.44 | | | 50,000 | | | 32,750 | |
Quiksilver, Inc., 6.88%, 4/15/15,
Callable 4/15/10 @ 103.44 | | | 150,000 | | | 72,000 | |
| | | | |
|
| |
| | | | | | 139,750 | |
| | | | |
|
| |
Auto Loans—3.8% | | | | | | | |
Ford Motor Credit Co.: | | | | | | | |
7.38%, 10/28/09 | | | 250,000 | | | 207,526 | |
7.38%, 2/1/11 | | | 50,000 | | | 31,112 | |
General Motors Acceptance Corp., 6.88%,
8/28/12 | | | 250,000 | | | 136,825 | |
| | | | |
|
| |
| | | | | | 375,463 | |
| | | | |
|
| |
Auto Parts & Equipment—2.2% | | | | | | | |
Altra Industrial Motion, Inc., 9.00%,
12/1/11, Callable 12/1/08 @ 104.50 | | | 50,000 | | | 45,000 | |
Cooper Tire & Rubber Co., 8.00%,
12/15/19 | | | 50,000 | | | 27,500 | |
Cooper-Standard Automotive, Inc.,
8.38%, 12/15/14, Callable 12/15/09
@ 104.19 | | | 50,000 | | | 21,000 | |
MSX International, 12.50%, 4/1/12,
Callable 4/1/09 @ 110.00 (b) | | | 25,000 | | | 11,250 | |
Stoneridge, Inc., 11.50%, 5/1/12,
Callable 12/8/08 @ 103.83 | | | 50,000 | | | 45,000 | |
The Goodyear Tire & Rubber Co., 8.63%,
12/1/11, Callable 12/1/09 @ 104.31 | | | 17,000 | | | 14,365 | |
| | | | | | | |
Corporate Obligations, continued | | | | | | | |
|
|
| | Shares or
Principal
Amount($) | | Value($) | |
| |
| |
| |
Auto Parts & Equipment, continued | | | | | | | |
TRW Automotive, Inc., 7.25%, 3/15/17 (b) | | | 50,000 | | | 28,750 | |
UCI Holdco, Inc., 10.32%, 12/15/13,
Callable 12/15/09 @ 102.00 (c) | | | 61,214 | | | 23,261 | |
| | | | |
|
| |
| | | | | | 216,126 | |
| | | | |
|
| |
Automotive—0.5% | | | | | | | |
General Motors Corp., 7.13%, 7/15/13 | | | 150,000 | | | 51,000 | |
| | | | |
|
| |
Beverages—0.9% | | | | | | | |
Beverages & More, Inc., 9.25%, 3/1/12,
Callable 9/1/09 @ 104.63 (b) | | | 50,000 | | | 42,500 | |
Constellation Brands, Inc., 8.38%, 12/15/14 | | | 50,000 | | | 44,500 | |
| | | | |
|
| |
| | | | | | 87,000 | |
| | | | |
|
| |
Building Materials—2.8% | | | | | | | |
Belden, Inc., 7.00%, 3/15/17,
Callable 3/15/12 @ 103.50 | | | 50,000 | | | 38,250 | |
Coleman Cable, Inc., 9.88%, 10/1/12,
Callable 10/1/09 @ 102.47 | | | 50,000 | | | 35,625 | |
General Cable Technologies Corp., 7.13%,
4/1/17, Callable 4/1/12 @ 103.56 | | | 50,000 | | | 32,000 | |
Gibraltar Industries, Inc., 8.00%, 12/1/15,
Callable 12/1/10 @ 104.00 | | | 100,000 | | | 67,000 | |
Interline Brands, Inc., 8.13%, 6/15/14,
Callable 6/15/10 @ 104.06 | | | 50,000 | | | 38,500 | |
Maax Corp., 9.75%, 6/15/12,
Callable 6/15/09 @ 102.44 (d) | | | 50,000 | | | 250 | |
Ply Gem Industries, Inc., 11.75%, 6/15/13,
Callable 4/1/11 @ 105.88 (b) | | | 50,000 | | | 33,000 | |
U.S. Concrete, Inc., 8.38%, 4/1/14,
Callable 4/1/09 @ 104.19 | | | 50,000 | | | 31,250 | |
| | | | |
|
| |
| | | | | | 275,875 | |
| | | | |
|
| |
Chemicals—3.8% | | | | | | | |
Airgas, Inc., 7.13%, 10/1/18,
Callable 10/1/13 @ 103.56 (b) | | | 50,000 | | | 41,250 | |
Chemtura Corp., 6.88%, 6/1/16 | | | 25,000 | | | 15,625 | |
Georgia Gulf Corp., 9.50%, 10/15/14,
Callable 10/15/10 @ 104.75 | | | 75,000 | | | 31,500 | |
Huntsman International LLC, 7.88%,
11/15/14, Callable 11/15/10 @ 103.94 | | | 35,000 | | | 31,150 | |
Innophos, Inc., 8.88%, 8/15/14,
Callable 8/16/09 @ 104.44 | | | 50,000 | | | 44,000 | |
Koppers Holdings, Inc., 9.88%, 11/15/14,
Callable 11/15/09 @ 104.94 | | | 25,000 | | | 20,000 | |
LyondellBasell Industries AF, 8.38%,
8/15/15, Callable 8/15/10 @ 104.19 (b) | | | 50,000 | | | 17,500 | |
Momentive Performance Materials, Inc.,
9.75%, 12/1/14, Callable 12/1/10
@ 104.88 | | | 50,000 | | | 28,000 | |
Mosaic Co., 7.63%, 12/1/16,
Callable 12/1/11 @ 103.81 (b) | | | 25,000 | | | 21,832 | |
Nalco Finance Holdings, Inc., 0.00%, 2/1/14,
Callable 2/1/09 @ 104.50 (e) | | | 50,000 | | | 40,000 | |
Nova Chemicals Corp., 6.50%, 1/15/12 | | | 50,000 | | | 39,500 | |
Terra Capital, Inc., 7.00%, 2/1/17,
Callable 2/1/12 @ 103.50 | | | 50,000 | | | 42,500 | |
| | | | |
|
| |
| | | | | | 372,857 | |
| | | | |
|
| |
| | |
81 | HSBC INVESTOR PORTFOLIOS | See notes to financial statements. |
|
HSBC INVESTOR HIGH YIELD FIXED INCOME PORTFOLIO |
|
Schedule of Portfolio Investments—as of October 31, 2008 (continued) |
| | | | | | | |
Corporate Obligations, continued |
|
|
| | Shares or
Principal
Amount($) | | Value($) | |
| |
| |
| |
Computer Hardware—0.3% | | | | | | | |
Activant Solutions, Inc., 9.50%, 5/1/16,
Callable 5/1/11 @ 104.75 | | | 50,000 | | | 30,500 | |
Consumer Products—1.5% | | | | | | | |
Central Garden & Pet Co., 9.13%, 2/1/13,
Callable 2/1/09 @ 103.04 | | | 50,000 | | | 30,500 | |
Chattem, Inc., 7.00%, 3/1/14,
Callable 3/1/09 @ 103.50 | | | 50,000 | | | 43,375 | |
Jarden Corp., 7.50%, 5/1/17,
Callable 5/1/12 @ 103.75 | | | 25,000 | | | 18,625 | |
MCBC Holdings, Inc., 10.75%, 10/15/14,
Callable 10/15/09 @ 103.00 (b)(c) | | | 25,000 | | | 12,500 | |
Spectrum Brands, Inc., 7.38%, 2/1/15,
Callable 2/1/10 @ 103.69 | | | 75,000 | | | 25,125 | |
True Temper Sports, Inc., 8.38%, 9/15/11,
Callable 3/15/09 @ 102.09 | | | 50,000 | | | 19,000 | |
| | | | |
|
| |
| | | | | | 149,125 | |
| | | | |
|
| |
Diversified Capital Goods—1.8% | | | | | | | |
Greenbrier Cos., Inc., 8.38%, 5/15/15,
Callable 5/15/10 @ 104.19 | | | 50,000 | | | 38,125 | |
Mueller Water Products, Inc., 7.38%, 6/1/17,
Callable 6/1/12 @ 103.69 | | | 50,000 | | | 32,750 | |
Sensata Technologies, 8.00%, 5/1/14,
Callable 5/1/10 @ 104.00 | | | 50,000 | | | 27,500 | |
TriMas Corp., 9.88%, 6/15/12,
Callable 6/15/09 @ 101.65 | | | 77,000 | | | 42,350 | |
Trinity Industries, Inc., 6.50%, 3/15/14, | | | | | | | |
Callable 3/15/09 @ 103.25 | | | 50,000 | | | 41,500 | |
| | | | |
|
| |
| | | | | | 182,225 | |
| | | | |
|
| |
Electric - Generation—4.8% | | | | | | | |
AES Corp.: | | | | | | | |
7.75%, 3/1/14 | | | 60,000 | | | 48,600 | |
7.75%, 10/15/15 | | | 50,000 | | | 39,188 | |
Dynegy Holdings, Inc., 8.38%, 5/1/16 | | | 150,000 | | | 111,000 | |
Edison Mission Energy: | | | | | | | |
7.00%, 5/15/17 | | | 25,000 | | | 19,781 | |
7.20%, 5/15/19 | | | 50,000 | | | 37,500 | |
Energy Future Holdings, 10.88%, 11/1/17,
Callable 11/1/12 @ 105.44 (b) | | | 125,000 | | | 96,250 | |
Mirant North America LLC, 7.38%, 12/31/13,
Callable 12/31/09 @ 103.69 | | | 50,000 | | | 43,687 | |
NRG Energy, Inc., 7.38%, 2/1/16,
Callable 2/1/11 @ 103.69 | | | 50,000 | | | 43,125 | |
Reliant Energy, Inc., 7.63%, 6/15/14 | | | 50,000 | | | 38,500 | |
| | | | |
|
| |
| | | | | | 477,631 | |
| | | | |
|
| |
Electric - Integrated—0.8% | | | | | | | |
CMS Energy Corp., 6.88%, 12/15/15 | | | 100,000 | | | 81,776 | |
| | | | |
|
| |
Electronics—0.2% | | | | | | | |
Freescale Semiconductor, Inc., 10.13%,
12/15/16, Callable 12/15/11 @ 105.06 | | | 50,000 | | | 19,625 | |
| | | | |
|
| |
Energy - Exploration & Production—5.7% | | | | | | | |
Chaparral Energy, Inc., 8.50%, 12/1/15,
Callable 12/1/10 @ 104.25 | | | 100,000 | | | 51,000 | |
Chesapeake Energy Corp., 6.88%, 1/15/16,
Callable 1/15/09 @ 103.44 | | | 100,000 | | | 80,250 | |
| | | | | | | |
Corporate Obligations, continued | | | | | |
|
|
| | Shares or
Principal
Amount($) | | Value($) | |
| |
| |
| |
Energy - Exploration & Production, continued | | | | | | | |
Cimarex Energy Co., 7.13%, 5/1/17,
Callable 5/1/12 @ 103.56 | | | 50,000 | | | 40,000 | |
Clayton Williams Energy, Inc., 7.75%, 8/1/13,
Callable 8/1/09 @ 103.88 | | | 100,000 | | | 61,500 | |
Compton Petroleum Finance Corp., 7.63%,
12/1/13, Callable 12/1/09 @ 103.81 | | | 100,000 | | | 58,000 | |
Forest Oil Corp., 7.25%, 6/15/19,
Callable 6/15/12 @ 103.63 | | | 50,000 | | | 34,000 | |
Linn Energy LLC, 9.88%, 7/1/18,
Callable 7/1/13 @ 104.94 (b) | | | 50,000 | | | 33,750 | |
Newfield Exploration Co., 6.63%, 9/1/14,
Callable 9/1/09 @ 103.31 | | | 100,000 | | | 77,250 | |
Opti Canada, Inc., 7.88%, 12/15/14,
Callable 12/15/10 @ 104.13 | | | 50,000 | | | 30,000 | |
Plains Exploration & Production Co.: | | | | | | | |
7.75%, 6/15/15, Callable 6/15/11 @ 103.88 | | | 50,000 | | | 36,500 | |
7.63%, 6/1/18, Callable 6/1/13 @ 103.81 | | | 25,000 | | | 16,375 | |
Swift Energy Co., 7.63%, 7/15/11,
Callable 7/15/09 @ 101.91 | | | 50,000 | | | 42,250 | |
| | | | |
|
| |
| | | | | | 560,875 | |
| | | | |
|
| |
Environmental—0.8% | | | | | | | |
Waste Services, Inc., 9.50%, 4/15/14,
Callable 4/15/09 @ 104.75 | | | 50,000 | | | 40,000 | |
WCA Waste Corp., 9.25%, 6/15/14,
Callable 6/15/10 @ 104.63 | | | 50,000 | | | 41,000 | |
| | | | |
|
| |
| | | | | | 81,000 | |
| | | | |
|
| |
Food & Drug Retailers—0.4% | | | | | | | |
Stater Bros. Holdings, Inc., 7.75%, 4/15/15,
Callable 4/15/11 @ 103.88 | | | 50,000 | | | 41,000 | |
| | | | |
|
| |
Food - Wholesale—0.3% | | | | | | | |
Smithfield Foods, Inc., 7.75%, 7/1/17 | | | 50,000 | | | 31,500 | |
| | | | |
|
| |
Forestry/Paper—2.8% | | | | | | | |
Catalyst Paper Corp., Series D, 8.63%, 6/15/11,
Callable 6/15/09 @ 100.00 | | | 50,000 | | | 29,500 | |
Cellu Tissue Holdings, Inc., 9.75%, 3/15/10,
Callable 3/15/09 @ 100.00 | | | 50,000 | | | 40,000 | |
Georgia-Pacific Corp., 7.70%, 6/15/15 | | | 50,000 | | | 34,750 | |
NewPage Corp., 10.00%, 5/1/12,
Callable 5/1/09 @ 106.00 | | | 25,000 | | | 17,000 | |
Norampac, Inc., 6.75%, 6/1/13,
Callable 6/1/09 @ 102.25 | | | 100,000 | | | 57,000 | |
Stone Container Finance Co. of Canada,
7.38%, 7/15/14, Callable 7/15/09
@ 103.69 | | | 150,000 | | | 73,500 | |
Verso Paper Holdings LLC, Series B, 9.13%,
8/1/14, Callable 8/1/10 @ 104.56 | | | 50,000 | | | 26,500 | |
| | | | |
|
| |
| | | | | | 278,250 | |
| | | | |
|
| |
Gaming—8.0% | | | | | | | |
Buffalo Thunder Development Authority,
9.38%, 12/15/14, Callable 12/15/10
@ 104.69 (b) | | | 25,000 | | | 8,750 | |
CCM Merger, Inc., 8.00%, 8/1/13,
Callable 8/1/09 @ 104.00 (b) | | | 100,000 | | | 59,000 | |
| | |
See notes to financial statements. | HSBC INVESTOR PORTFOLIOS | 82 |
|
HSBC INVESTOR HIGH YIELD FIXED INCOME PORTFOLIO |
|
Schedule of Portfolio Investments—as of October 31, 2008 (continued) |
| | | | | | | |
Corporate Obligations, continued | |
|
|
| | Shares or
Principal
Amount($) | | Value($) | |
| |
| |
| |
Gaming, continued | | | | | | | |
Choctaw Resort Development Entertainment,
7.25%, 11/15/19, Callable 11/15/11
@ 103.63 (b) | | | 46,000 | | | 26,220 | |
Chukchansi Economic Development Authority,
8.00%, 11/15/13, Callable 11/15/09
@ 104.00 (b) | | | 25,000 | | | 13,250 | |
Fontainebleau Las Vegas, 10.25%, 6/15/15,
Callable 6/15/11 @ 105.13 (b) | | | 100,000 | | | 13,500 | |
Great Canadian Gaming Co., 7.25%, 2/15/15,
Callable 2/15/11 @ 103.63 (b) | | | 50,000 | | | 37,500 | |
Greektown Holdings, Inc., 10.75%, 12/1/13,
Callable 12/1/10 @ 105.38 (b)(d) | | | 75,000 | | | 16,125 | |
Indianapolis Downs LLC, 11.00%, 11/1/12,
Callable 11/1/10 @ 105.50 (b) | | | 25,000 | | | 12,500 | |
Inn of the Mountain Gods, 12.00%, 11/15/10,
Callable 11/15/08 @ 103.00 | | | 50,000 | | | 22,000 | |
Isle of Capri Casinos, Inc., 7.00%, 3/1/14,
Callable 3/1/09 @ 103.50 | | | 100,000 | | | 48,500 | |
Mashantucket Pequot Tribal Nation, Series A,
8.50%, 11/15/15, Callable 11/15/11
@ 104.25 (b) | | | 50,000 | | | 27,500 | |
MGM MIRAGE, Inc., 6.75%, 4/1/13 | | | 100,000 | | | 62,500 | |
Mohegan Tribal Gaming, 7.13%, 8/15/14,
Callable 8/15/09 @ 103.56 | | | 50,000 | | | 30,000 | |
MTR Gaming Group, Inc., 9.00%, 6/1/12,
Callable 6/1/09 @ 104.50 | | | 100,000 | | | 55,500 | |
Pokagon Gaming Authority, 10.38%, 6/15/14,
Callable 6/15/10 @ 105.19 (b) | | | 69,000 | | | 62,790 | |
San Pasqual Casino, 8.00%, 9/15/13,
Callable 9/15/09 @ 104.00 (b) | | | 25,000 | | | 19,250 | |
Scientific Games Corp., 6.25%, 12/15/12,
Callable 12/15/08 @ 103.13 | | | 50,000 | | | 38,125 | |
Seminole Hard Rock Entertainment,
5.32%, 3/15/14, Callable 3/15/09
@ 102.00 (b)(c) | | | 50,000 | | | 33,000 | |
Seneca Gaming Corp., 7.25%, 5/1/12,
Callable 5/1/09 @ 101.81 | | | 50,000 | | | 33,500 | |
Shingle Springs, 9.38%, 6/15/15,
Callable 6/15/11@ 104.69 (b) | | | 50,000 | | | 24,500 | |
Snoqualmie Entertainment Authority, 6.88%,
2/1/14, Callable 2/1/09 @ 103.00 (b)(c) | | | 25,000 | | | 16,125 | |
Turning Stone Resort Casino, 9.13%, 9/15/14,
Callable 9/15/10 @ 104.56 (b) | | | 75,000 | | | 59,250 | |
Waterford Gaming LLC, 8.63%, 9/15/14 (b) | | | 21,000 | | | 19,845 | |
Wynn Las Vegas LLC, 6.63%, 12/1/14,
Callable 12/1/09 @ 103.31 | | | 50,000 | | | 36,875 | |
| | | | |
|
| |
| | | | | | 776,105 | |
| | | | |
|
| |
Gas Distribution—6.2% | | | | | | | |
Atlas Pipeline Partners LP, 8.13%, 12/15/15,
Callable 12/15/10 @ 104.06 | | | 50,000 | | | 34,875 | |
Colorado Interstate Gas Co., 6.80%,
11/15/15 | | | 150,000 | | | 126,956 | |
Copano Energy LLC, 8.13%, 3/1/16,
Callable 3/1/11 @ 104.06 | | | 50,000 | | | 36,750 | |
El Paso Corp., 7.00%, 6/15/17 | | | 100,000 | | | 76,320 | |
Ferrellgas Partners LP, 6.75%, 5/1/14,
Callable 5/1/09 @ 103.38 (b) | | | 50,000 | | | 35,500 | |
Inergy LP/Inergy Finance, 8.25%, 3/1/16,
Callable 3/1/11 @ 104.13 | | | 100,000 | | | 76,750 | |
| | | | | | | |
Corporate Obligations, continued | | | | | | | |
|
|
| | Shares or
Principal
Amount($) | | Value($) | |
| |
| |
| |
Gas Distribution, continued | | | | | | | |
Regency Energy Partners LP, 8.38%, 12/15/13,
Callable 12/15/10 @ 104.19 | | | 17,000 | | | 12,920 | |
Southern Star Central Corp., Inc., 6.75%, 3/1/16,
Callable 3/1/11 @ 103.38 | | | 50,000 | | | 43,250 | |
Suburban Propane Partners LP, 6.88%, 12/15/13,
Callable 12/15/08 @ 103.44 | | | 50,000 | | | 38,500 | |
Williams Cos., Inc., 6.38%, 10/1/10 (b) | | | 100,000 | | | 89,000 | |
Williams Partners LP, 7.25%, 2/1/17 | | | 50,000 | | | 39,750 | |
| | | | |
|
| |
| | | | | | 610,571 | |
| | | | |
|
| |
Health Services—3.4% | | | | | | | |
Advanced Medical Optics, 7.50%, 5/1/17,
Callable 5/1/12 @ 103.75 | | | 50,000 | | | 33,000 | |
Carriage Services, Inc., 7.88%, 1/15/15,
Callable 1/15/10 @ 103.94 | | | 50,000 | | | 41,750 | |
Community Health Systems, Inc., 8.88%,
7/15/15, Callable 7/15/11 @ 104.44 | | | 50,000 | | | 41,875 | |
DJO Finance LLC, 10.88%, 11/15/14,
Callable 11/15/11 @ 105.44 | | | 25,000 | | | 20,125 | |
HCA, Inc., 9.25%, 11/15/16,
Callable 11/15/11 @ 104.63 | | | 25,000 | | | 21,250 | |
MultiPlan, Inc., 10.38%, 4/15/16,
Callable 4/15/11 @ 105.19 (b) | | | 100,000 | | | 92,000 | |
Omnicare, Inc., 6.75%, 12/15/13,
Callable 12/15/09 @ 103.38 | | | 100,000 | | | 83,000 | |
| | | | |
|
| |
| | | | | | 333,000 | |
| | | | |
|
| |
Hotels & Lodging—0.3% | | | | | | | |
Gaylord Entertainment Co., 8.00%,
11/15/13, Callable 11/15/08
@ 104.00 | | | 50,000 | | | 34,125 | |
| | | | |
|
| |
Household & Leisure Products—0.3% | | | | | | | |
Sealy Mattress Co., 8.25%, 6/15/14,
Callable 6/15/09 @ 104.13 | | | 50,000 | | | 28,250 | |
| | | | |
|
| |
Integrated Energy—0.3% | | | | | | | |
VeraSun Energy Corp.: | | | | | | | |
9.88%, 12/15/12, Callable 12/15/09
@ 104.94 (d) | | | 50,000 | | | 20,500 | |
9.38%, 6/1/17, Callable 6/1/12
@ 104.69 (d) | | | 50,000 | | | 4,250 | |
| | | | |
|
| |
| | | | | | 24,750 | |
| | | | |
|
| |
Investments & Miscellaneous Financial Services—0.1% | | | | | | | |
Nuveen Investments, Inc., 10.50%, 11/15/15,
Callable 11/15/11 @ 105.25 (b) | | | 50,000 | | | 13,500 | |
| | | | |
|
| |
Machinery—1.0% | | | | | | | |
Baldor Electric Co., 8.63%, 2/15/17,
Callable 2/15/12 @ 104.31 | | | 50,000 | | | 38,250 | |
Case New Holland, Inc., 7.13%, 3/1/14,
Callable 3/1/10 @ 103.56 | | | 50,000 | | | 37,250 | |
Terex Corp., 8.00%, 11/15/17,
Callable 11/15/12 @ 104.00 | | | 25,000 | | | 18,500 | |
| | | | |
|
| |
| | | | | | 94,000 | |
| | | | |
|
| |
| | |
83 | HSBC INVESTOR PORTFOLIOS | See notes to financial statements. |
|
HSBC INVESTOR HIGH YIELD FIXED INCOME PORTFOLIO |
|
Schedule of Portfolio Investments—as of October 31, 2008 (continued) |
| | | | | | | |
Corporate Obligations, continued | | | | | | | |
|
|
| | Shares or
Principal
Amount($) | | Value($) | |
| |
| |
| |
Media - Broadcast—1.2% | | | | | | | |
Barrington Broadcasting Group LLC,
10.50%, 8/15/14, Callable 8/15/10
@ 105.25 | | | 50,000 | | | 24,500 | |
Bonten Media Acquisition, 9.00%, 6/1/15,
Callable 6/1/11@ 104.50 (b) | | | 75,000 | | | 29,250 | |
Local TV Finance LLC, 9.25%, 6/15/15,
Callable 6/15/11 @ 104.63 (b) | | | 50,000 | | | 25,000 | |
Newport Television LLC, 13.00%, 3/15/17,
Callable 3/15/12 @ 106.50 (b) | | | 50,000 | | | 21,250 | |
Radio One, Inc., 6.38%, 2/15/13,
Callable 2/15/09 @ 103.19 | | | 50,000 | | | 22,500 | |
| | | | |
|
| |
| | | | | | 122,500 | |
| | | | |
|
| |
Media - Cable—3.6% | | | | | | | |
Atlantic Broadband Finance LLC,
9.38%, 1/15/14, Callable 1/15/09
@104.69 | | | 50,000 | | | 36,000 | |
Cablevision Systems Corp., Series B,
8.00%, 4/15/12 | | | 25,000 | | | 21,031 | |
Charter Communications Operating LLC,
10.88%, 9/15/14, Callable 3/15/12
@ 105.44 (b) | | | 50,000 | | | 40,625 | |
DIRECTV Holdings LLC, 7.63%, 5/15/16,
Callable 5/15/12 @ 103.81 (b) | | | 50,000 | | | 42,000 | |
Mediacom LLC, 7.88%, 2/15/11,
Callable 1/12/09 @ 100.00 | | | 100,000 | | | 85,000 | |
Videotron Ltd., 9.13%, 4/15/18,
Callable 4/15/13 @ 104.56 (b) | | | 50,000 | | | 44,375 | |
Virgin Media Finance plc, 9.13%, 8/15/16,
Callable 8/15/11 @ 104.56 | | | 125,000 | | | 82,500 | |
| | | | |
|
| |
| | | | | | 351,531 | |
| | | | |
|
| |
Media - Diversified—0.9% | | | | | | | |
Block Communications, Inc., 8.25%,
12/15/15, Callable 12/15/10
@ 104.13 (b) | | | 50,000 | | | 37,000 | |
Canwest Mediaworks LP, 9.25%, 8/1/15,
Callable 8/1/11 @ 104.63 (b) | | | 50,000 | | | 30,500 | |
Quebecor Media, Inc., 7.75%, 3/15/16,
Callable 3/15/11 @ 103.88 | | | 25,000 | | | 17,313 | |
| | | | |
|
| |
| | | | | | 84,813 | |
| | | | |
|
| |
Media - Services—1.0% | | | | | | | |
Baker & Taylor, Inc., 11.50%, 7/1/13,
Callable 7/1/10 @ 105.75 (b) | | | 100,000 | | | 59,125 | |
Lamar Media Corp., 6.63%, 8/15/15,
Callable 8/15/10 @ 103.31 | | | 50,000 | | | 36,750 | |
| | | | |
|
| |
| | | | | | 95,875 | |
| | | | |
|
| |
Metals/Mining Excluding Steel—1.9% | | | | | | | |
Freeport-McMoran Copper & Gold, Inc.,
8.25%, 4/1/15, Callable 4/1/11 @ 104.13 | | | 50,000 | | | 40,000 | |
International Coal Group, Inc., 10.25%,
7/15/14, Callable 7/15/10 @ 105.13 | | | 50,000 | | | 42,000 | |
Massey Energy Co., 6.88%, 12/15/13,
Callable 12/15/09 @ 103.44 | | | 100,000 | | | 81,000 | |
Noranda Aluminum Acquisition, 6.83%,
5/15/15, Callable 5/15/09 @ 101.00 (c) | | | 50,000 | | | 22,500 | |
| | | | |
|
| |
| | | | | | 185,500 | |
| | | | |
|
| |
| | | | | | | |
Corporate Obligations, continued | | | | | | | |
|
|
| | Shares or
Principal
Amount($) | | Value($) | |
| |
| |
| |
Non-Food & Drug Retailers—2.7% | | | | | | | |
ACE Hardware Corp., 9.13%, 6/1/16,
Callable 6/1/12 @ 104.56 (b) | | | 25,000 | | | 18,750 | |
AutoNation, Inc., 7.00%, 4/15/14,
Callable 4/15/09 @ 105.25 | | | 50,000 | | | 32,500 | |
Claire’s Stores, Inc., 9.63%, 6/1/15,
Callable 6/1/11 @ 104.81 | | | 50,000 | | | 9,000 | |
Hanesbrands, Inc., 6.51%, 12/15/14,
Callable 12/15/08 @ 102.00 (c) | | | 50,000 | | | 33,937 | |
Libbey Glass, Inc., 9.93%, 6/1/11,
Callable 6/11/09 @ 102.50 (c) | | | 25,000 | | | 16,125 | |
Penske Automotive Group, Inc., 7.75%,
12/15/16, Callable 12/15/11 @ 103.88 | | | 50,000 | | | 23,875 | |
Pep Boys, 7.50%, 12/15/14, Callable
12/15/09 @ 103.75 | | | 50,000 | | | 24,000 | |
Susser Holdings LLC, 10.63%, 12/15/13,
Callable 12/15/09 @ 105.31 | | | 103,000 | | | 87,550 | |
Yankee Acquisition Corp., 9.75%, 2/15/17,
Callable 2/15/12 @ 104.88 | | | 50,000 | | | 24,813 | |
| | | | |
|
| |
| | | | | | 270,550 | |
| | | | |
|
| |
Oil & Gas—0.4% | | | | | | | |
Pioneer Natural Resources Co., 5.88%,
7/15/16 | | | 50,000 | | | 36,532 | |
| | | | |
|
| |
Oil Field Equipment & Services—0.9% | | | | | | | |
Bristow Group, Inc., 7.50%, 9/15/17,
Callable 9/15/12 @ 103.75 | | | 50,000 | | | 37,500 | |
CIE Gener de Geophysique, 7.50%, 5/15/15,
Callable 5/15/10 @ 103.75 | | | 50,000 | | | 33,500 | |
National Oilwell Varco, Inc., Series B,
6.13%, 8/15/15, Callable 8/15/10
@ 103.06 | | | 25,000 | | | 21,843 | |
| | | | |
|
| |
| | | | | | 92,843 | |
| | | | |
|
| |
Oil Refining & Marketing—1.0% | | | | | | | |
Petroplus Finance Ltd., 7.00%, 5/1/17,
Callable 5/1/12 @ 103.50 (b) | | | 50,000 | | | 32,750 | |
Tesoro Corp.: | | | | | | | |
6.63%, 11/1/15, Callable 11/1/10
@ 103.31 | | | 50,000 | | | 34,000 | |
6.50%, 6/1/17, Callable 6/1/12 @
103.25 | | | 50,000 | | | 33,500 | |
| | | | |
|
| |
| | | | | | 100,250 | |
| | | | |
|
| |
Packaging—2.8% | | | | | | | |
Exopack Holding Corp., 11.25%, 2/1/14,
Callable 2/1/10 @ 105.62 | | | 50,000 | | | 38,500 | |
Intertape Polymer U.S., Inc., 8.50%, 8/1/14,
Callable 8/1/09 @ 104.25 | | | 75,000 | | | 60,000 | |
Owens-Brockway Glass Containers, 6.75%,
12/1/14, Callable 12/1/09 @ 103.38 | | | 50,000 | | | 43,250 | |
Solo Cup Co., 8.50%, 2/15/14,
Callable 2/15/09 @ 104.25 | | | 200,000 | | | 134,000 | |
| | | | |
|
| |
| | | | | | 275,750 | |
| | | | |
|
| |
Printing & Publishing—2.0% | | | | | | | |
Cenveo Corp., 10.50%, 8/15/16,
Callable 8/15/12 @ 105.25 (b) | | | 50,000 | | | 42,250 | |
Morris Publishing, 7.00%, 8/1/13,
Callable 8/1/09 @ 102.33 | | | 100,000 | | | 10,000 | |
| | |
See notes to financial statements. | HSBC INVESTOR PORTFOLIOS | 84 |
|
HSBC INVESTOR HIGH YIELD FIXED INCOME PORTFOLIO |
|
Schedule of Portfolio Investments—as of October 31, 2008 (continued) |
| | | | | | | |
Corporate Obligations, continued | | | | | | | |
|
|
| | Shares or
Principal
Amount($) | | Value($) | |
| |
| |
| |
Printing & Publishing, continued | | | | | | | |
R.H. Donnelley Corp., 6.88%, 1/15/13,
Callable 1/15/09 @ 103.44 | | | 2,000 | | | 460 | |
R.H. Donnelley, Inc., 11.75%, 5/15/15,
Callable 5/15/12 @ 105.88 (b) | | | 127,000 | | | 49,530 | |
Sheridan Group, Inc., 10.25%, 8/15/11,
Callable 8/15/09 @ 100.00 | | | 100,000 | | | 83,000 | |
Valassis Communications, Inc., 8.25%,
3/1/15, Callable 3/1/11 @ 104.13 | | | 25,000 | | | 13,500 | |
| | | | |
|
| |
| | | | | | 198,740 | |
| | | | |
|
| |
Restaurants—2.1% | | | | | | | |
Buffets, Inc., 12.50%, 11/1/14,
Callable 11/1/10 @ 106.25 (d) | | | 50,000 | | | 125 | |
Dave & Buster’s, Inc., 11.25%, 3/15/14,
Callable 3/15/10 @ 105.62 | | | 50,000 | | | 37,250 | |
Landry’s Restaurants, Inc., 9.45%, 12/15/14,
Callable 2/28/09 @ 101.00 | | | 100,000 | | | 89,500 | |
NPC International, Inc., 9.50%, 5/1/14,
Callable 5/1/10 @ 104.75 | | | 50,000 | | | 31,000 | |
Rare Restaurant Group LLC, 9.25%,
5/15/14, Callable 5/15/11 @ 104.63 (b) | | | 50,000 | | | 25,000 | |
Sbarro, Inc., 10.38%, 2/1/15,
Callable 2/1/10 @ 107.78 | | | 50,000 | | | 29,000 | |
| | | | |
|
| |
| | | | | | 211,875 | |
| | | | |
|
| |
Software/Services—0.7% | | | | | | | |
CompuCom Systems, Inc., 12.50%, 10/1/15,
Callable 10/1/11 @ 106.25 (b) | | | 50,000 | | | 40,000 | |
Unisys Corp., 12.50%, 1/15/16,
Callable 1/15/12 @ 106.25 | | | 35,000 | | | 24,413 | |
| | | | |
|
| |
| | | | | | 64,413 | |
| | | | |
|
| |
Steel Producers/Products—1.4% | | | | | | | |
AK Steel Corp., 7.75%, 6/15/12,
Callable 6/15/09 @ 101.29 | | | 100,000 | | | 80,000 | |
Ryerson, Inc., 12.00%, 11/1/15,
Callable 11/1/11 @ 106.00 (b) | | | 50,000 | | | 34,000 | |
Tube City IMS Corp., 9.75%, 2/1/15,
Callable 2/1/11 @ 104.88 | | | 50,000 | | | 29,000 | |
| | | | |
|
| |
| | | | | | 143,000 | |
| | | | |
|
| |
Support - Services—6.3% | | | | | | | |
Aramark Services, Inc., 8.50%, 2/1/15,
Callable 2/1/11 @104.25 | | | 75,000 | | | 64,125 | |
Avis Budget Car Rental, Inc., 7.63%, 5/15/14,
Callable 5/15/10 @ 103.81 | | | 100,000 | | | 36,000 | |
Education Management LLC: | | | | | | | |
8.75%, 6/1/14, Callable 6/1/10 @ 104.38 | | | 25,000 | | | 18,250 | |
10.25%, 6/1/16, Callable 6/1/11 @ 105.13 | | | 25,000 | | | 17,250 | |
H&E Equipment Services, Inc., 8.38%,
7/15/16, Callable 7/15/11 @ 104.19 | | | 75,000 | | | 39,750 | |
Hertz Corp., 8.88%, 1/1/14,
Callable 1/1/10 @104.44 | | | 100,000 | | | 73,000 | |
Iron Mountain, Inc., 8.63%, 4/1/13,
Callable 4/1/09 @ 100.00 | | | 100,000 | | | 91,250 | |
JohnsonDiversey, Inc., 9.63%, 5/15/12,
Callable 5/15/09 @ 101.60 | | | 100,000 | | | 89,000 | |
KAR Holdings, Inc., 8.75%, 5/1/14,
Callable 5/1/10 @ 104.38 | | | 50,000 | | | 32,500 | |
| | | | | | | |
Corporate Obligations, continued | | | | | | | |
|
|
| | Shares or
Principal
Amount($) | | Value($) | |
| |
| |
| |
Support - Services, continued | | | | | | | |
MediMedia USA, Inc., 11.38%, 11/15/14,
Callable 11/15/09 @ 105.69 (b) | | | 50,000 | | | 40,000 | |
Pegasus Solutions, Inc., 10.50%, 4/15/15,
Callable 4/15/11 @ 105.25 (b) | | | 50,000 | | | 34,500 | |
RSC Equipment Rental, Inc., 9.50%, 12/1/14,
Callable 12/1/10 @ 104.75 | | | 50,000 | | | 30,000 | |
Sotheby’s, 7.75%, 6/15/15 (b) | | | 50,000 | | | 29,500 | |
United Rentals, Inc., 6.50%, 2/15/12,
Callable 12/15/09 @ 101.53 | | | 25,000 | | | 17,500 | |
West Corp., 11.00%, 10/15/16,
Callable 10/15/11 @ 105.50 | | | 25,000 | | | 11,687 | |
| | | | |
|
| |
| | | | | | 624,312 | |
| | | | |
|
| |
Telecom - Integrated/Services—3.7% | | | | | | | |
Broadview Networks Holdings, Inc., 11.38%,
9/1/12, Callable 9/1/09 @ 105.69 | | | 25,000 | | | 18,000 | |
Cincinnati Bell, Inc., 8.38%, 1/15/14,
Callable 1/15/09 @ 104.19 | | | 85,000 | | | 61,413 | |
Citizens Communications Co., 7.13%,
3/15/19 | | | 50,000 | | | 30,750 | |
Fairpoint Communications, Inc., 13.13%,
4/1/18, Callable 4/1/13 @ 106.56 (b) | | | 25,000 | | | 17,625 | |
Level 3 Financing, Inc., 9.25%, 11/1/14,
Callable 11/1/10 @ 104.63 | | | 50,000 | | | 28,500 | |
Nordic Telephone Co., Holdings, 8.88%,
5/1/16, Callable 5/1/11 @ 104.44 (b) | | | 50,000 | | | 42,000 | |
PAETEC Holding Corp., 9.50%, 7/15/15,
Callable 7/15/11 @ 104.75 | | | 50,000 | | | 28,375 | |
Qwest Corp., 7.63%, 6/15/15 | | | 150,000 | | | 114,750 | |
Windstream Corp., 8.63%, 8/1/16,
Callable 8/1/11 @ 104.31 | | | 25,000 | | | 18,875 | |
| | | | |
|
| |
| | | | | | 360,288 | |
| | | | |
|
| |
Telecom - Wireless—4.5% | | | | | | | |
Centennial Communications Corp., 10.00%,
1/1/13, Callable 1/1/09 @ 107.50 | | | 100,000 | | | 88,500 | |
Cricket Communications, 9.38%, 11/1/14,
Callable 11/1/10 @ 104.69 | | | 50,000 | | | 40,625 | |
iPCS, Inc., 6.05%, 5/1/14,
Callable 5/1/09 @ 101.00 (c) | | | 100,000 | | | 69,000 | |
MetroPCS Wireless, Inc., 9.25%, 11/1/14,
Callable 11/1/10 @ 104.63 | | | 100,000 | | | 83,250 | |
Sprint Capital Corp., 8.38%, 3/15/12 | | | 100,000 | | | 80,500 | |
Wind Acquisition Financial SA, 10.75%,
12/1/15, Callable 12/1/10 @ 105.38 (b) | | | 100,000 | | | 77,000 | |
| | | | |
|
| |
| | | | | | 438,875 | |
| | | | |
|
| |
Theaters & Entertainment—0.8% | | | | | | | |
AMC Entertainment, Inc., 11.00%, 2/1/16,
Callable 2/1/11@ 105.50 | | | 100,000 | | | 79,000 | |
| | | | |
|
| |
Tobacco—0.4% | | | | | | | |
Alliance One International, Inc., 8.50%,
5/15/12 | | | 50,000 | | | 38,500 | |
| | | | |
|
| |
Transportation Excluding Air/Rail—0.3% | | | | | | | |
Navios Maritime Holdings, Inc., 9.50%,
12/15/14, Callable 12/15/10 @ 104.75 | | | 25,000 | | | 20,500 | |
Swift Transportation Co., Inc., 10.55%,
5/15/15, Callable 5/15/09 @ 102.00 (b)(c) | | | 50,000 | | | 10,000 | |
| | | | |
|
| |
| | | | | | 30,500 | |
| | | | |
|
| |
| | |
85 | HSBC INVESTOR PORTFOLIOS | See notes to financial statements. |
|
HSBC INVESTOR HIGH YIELD FIXED INCOME PORTFOLIO |
|
Schedule of Portfolio Investments—as of October 31, 2008 (continued) |
| | | | | | | |
Corporate Obligations, continued | | | | | | | |
|
|
| | Shares or
Principal
Amount($) | | Value($) | |
| |
| |
| |
TOTAL CORPORATE OBLIGATIONS
(COST $13,987,036) | | | | | | 9,547,901 | |
| | | | |
|
| |
TOTAL INVESTMENTS
(COST $14,005,584) — 96.8% | | | | | | 9,548,913 | |
| | | | |
|
| |
| |
|
| Percentages indicated are based on net assets of $9,862,202. |
| |
(a) | Represents non-income producing security. |
| |
(b) | Security exempt from registration under Rule 144a of the Securities Act of 1933. This security may be resold in transactions exempt from registration, normally to qualified institutional buyers. This security has been deemed liquid by the Investment Adviser based on procedures approved by the Board of Trustees. |
| |
(c) | Variable rate security. The interest rates on these securities are adjusted periodically to reflect then-current short-term interest rates. The rates presented represent the rates in effect on October 31, 2008. The maturity dates presented reflect the final maturity dates. However, some of these securities may contain put or demand features that allow the fund to require the issuer to repurchase the security from the fund within various time periods, including daily, weekly, monthly, or semi-annually. |
| |
(d) | Non-Income Producing; Defaulted Bond. |
| |
(e) | Step Bond. Income recognition is on the effective yield method for Step Bonds. |
| | |
LLC | — | Limited Liability Co. |
LP | — | Limited Partnership |
PLC | — | Public Limited Co. |
| | |
See notes to financial statements. | HSBC INVESTOR PORTFOLIOS | 86 |
|
HSBC INVESTOR INTERMEDIATE DURATION FIXED INCOME PORTFOLIO |
|
Schedule of Portfolio Investments—as of October 31, 2008 |
| | | | | | | |
Certificates of Deposit—0.7% | | | | | | | |
|
|
|
|
|
|
|
|
| | | | | | | |
| | Shares or
Principal
Amount($) | | Value($) | |
| |
| |
| |
Banking—0.7% | | | | | | | |
First Tennessee Bank, 2.96%,
12/17/09 (a) | | | 100,000 | | | 99,029 | |
| | | | |
|
| |
TOTAL CERTIFICATES OF DEPOSIT
(COST $94,978) | | | | | | 99,029 | |
| | | | |
|
| |
| | | | | | | |
U.S. Government and Government Agency Obligations—59.2% | | | | | | | |
|
|
|
|
|
|
|
|
Federal Home Loan Mortgage Corp.—13.0% | | | | | | | |
5.13%, 11/17/17 | | | 400,000 | | | 396,699 | |
Pool #1B2655, 6.21%, 12/1/34 (a)(d) | | | 90,336 | | | 90,780 | |
Pool #1J1313, 6.37%, 6/1/36 (a) | | | 212,618 | | | 215,762 | |
Pool #847557, 5.89%, 7/1/34 (a)(d) | | | 93,181 | | | 95,158 | |
Pool #G02981, 6.00%, 6/1/37 | | | 162,895 | | | 162,701 | |
TBA November: | | | | | | | |
5.00%, 11/15/22 | | | 660,000 | | | 644,325 | |
5.50%, 11/15/22 | | | 150,000 | | | 149,297 | |
| | | | |
|
| |
| | | | | | 1,754,722 | |
| | | | |
|
| |
Federal National Mortgage Association—32.6% | | | | | | | |
3.25%, 8/12/10 | | | 150,000 | | | 150,374 | |
Pool #922090, 5.84%, 3/1/37 (a) | | | 268,540 | | | 271,281 | |
TBA November: | | | | | | | |
5.00%, 11/15/36 | | | 350,000 | | | 331,516 | |
5.50%, 11/15/36 | | | 2,175,000 | | | 2,124,703 | |
6.00%, 11/15/37 | | | 975,000 | | | 974,391 | |
6.50%, 11/15/37 | | | 550,000 | | | 557,391 | |
| | | | |
|
| |
| | | | | | 4,409,656 | |
| | | | |
|
| |
Government National Mortgage Association—4.6% | | | | | | | |
TBA November: | | | | | | | |
5.00%, 11/15/36 | | | 300,000 | | | 286,218 | |
5.50%, 11/15/36 | | | 90,000 | | | 88,256 | |
6.00%, 11/15/36 | | | 250,000 | | | 250,000 | |
| | | | |
|
| |
| | | | | | 624,474 | |
| | | | |
|
| |
U.S. Treasury Notes—9.0% | | | | | | | |
4.75%, 2/15/10 | | | 340,000 | | | 353,919 | |
2.63%, 5/31/10 | | | 68,000 | | | 69,232 | |
4.75%, 1/31/12 | | | 35,000 | | | 38,101 | |
2.75%, 2/28/13 | | | 382,000 | | | 387,282 | |
3.38%, 7/31/13 | | | 185,000 | | | 190,434 | |
3.88%, 5/15/18 | | | 45,000 | | | 44,926 | |
4.00%, 8/15/18 | | | 130,000 | | | 130,173 | |
| | | | |
|
| |
| | | | | | 1,214,067 | |
| | | | |
|
| |
TOTAL U.S. GOVERNMENT AND
GOVERNMENT AGENCY
OBLIGATIONS (COST $8,085,101) | | | | | | 8,002,919 | |
| | | | |
|
| |
Corporate Obligations—29.4% | | | | | | | |
|
|
|
|
|
|
|
|
Agricultural Chemicals—0.7% | | | | | | | |
Agrium, Inc., 6.75%, 1/15/19 | | | 100,000 | | | 90,203 | |
| | | | |
|
| |
Banking—0.5% | | | | | | | |
American Express Centurion Bank,
5.95%, 6/12/17 | | | 100,000 | | | 73,882 | |
| | | | |
|
| |
| | | | | | | |
Corporate Obligations, continued | | | | | | | |
|
|
|
|
|
|
|
|
|
| | Shares or
Principal
Amount($) | | Value($) | |
| |
| |
| |
Building & Construction Products—1.4% | | | | | | | |
Martin Marietta Materials, Inc.,
3.62%, 4/30/10 (a) | | | 100,000 | | | 96,560 | |
Masco Corp., 3.12%, 3/12/10 (a)(d) | | | 100,000 | | | 94,183 | |
| | | | |
|
| |
| | | | | | 190,743 | |
| | | | |
|
| |
Chemicals—0.1% | | | | | | | |
Chemtura Corp., 6.88%, 6/1/16 | | | 25,000 | | | 15,625 | |
| | | | |
|
| |
Computer Services—0.7% | | | | | | | |
Electronic Data Systems, Series B,
6.00%, 8/1/13 | | | 100,000 | | | 94,399 | |
| | | | |
|
| |
Electric—4.5% | | | | | | | |
Duke Energy Corp., 5.65%, 6/15/13 | | | 75,000 | | | 67,723 | |
Florida Power Corp., 5.65%, 6/15/18 | | | 75,000 | | | 66,395 | |
MidAmerican Energy Co., 5.95%, 7/15/17 | | | 450,000 | | | 393,362 | |
Puget Sound Energy, Inc., 6.97%, 6/1/67,
Callable 6/1/17 @ 100 | | | 100,000 | | | 83,500 | |
| | | | |
|
| |
| | | | | | 610,980 | |
| | | | |
|
| |
Finance—5.9% | | | | | | | |
Bear Stearns Co., Inc.: | | | | | | | |
4.50%, 10/28/10 | | | 75,000 | | | 72,901 | |
Series B, 6.95%, 8/10/12, MTN | | | 150,000 | | | 148,014 | |
Citigroup, Inc., 6.50%, 8/19/13 | | | 25,000 | | | 23,699 | |
Countrywide Home Loans, Series L, 4.00%,
3/22/11, MTN | | | 150,000 | | | 138,332 | |
Ford Motor Credit Co., LLC, 9.75%,
9/15/10 | | | 300,000 | | | 204,015 | |
Lehman Brothers Holdings, Series I,
0.00%, 5/2/18, MTN (e)(f) | | | 75,000 | | | 9,750 | |
Morgan Stanley, Series F, 6.00%,
4/28/15, MTN | | | 75,000 | | | 60,941 | |
XTRA Finance Corp., 5.15%, 4/1/17 | | | 150,000 | | | 136,362 | |
| | | | |
|
| |
| | | | | | 794,014 | |
| | | | |
|
| |
Forestry/Paper—0.1% | | | | | | | |
Georgia-Pacific Corp., 7.70%, 6/15/15 | | | 25,000 | | | 17,375 | |
| | | | |
|
| |
Gaming—0.1% | | | | | | | |
MGM MIRAGE, Inc., 6.75%, 4/1/13 | | | 25,000 | | | 15,625 | |
| | | | |
|
| |
Health Services—0.2% | | | | | | | |
Community Health Systems, Inc., 8.88%,
7/15/15, Callable 7/15/11 @ 104.44 | | | 25,000 | | | 20,938 | |
| | | | |
|
| |
Hospitals—0.4% | | | | | | | |
HCA, Inc., 5.75%, 3/15/14 | | | 100,000 | | | 59,000 | |
| | | | |
|
| |
Media—2.9% | | | | | | | |
Time Warner Entertainment, 8.88%,
10/1/12 | | | 350,000 | | | 344,075 | |
Vivendi, 5.75%, 4/4/13 (b) | | | 50,000 | | | 45,936 | |
| | | | |
|
| |
| | | | | | 390,011 | |
| | | | |
|
| |
Media - Cable—0.2% | | | | | | | |
Cablevision Systems Corp., Series B,
8.00%, 4/15/12 | | | 25,000 | | | 21,031 | |
| | | | |
|
| |
Medical—0.2% | | | | | | | |
Glaxosmithkline Capital, Inc., 4.85%,
5/15/13 | | | 25,000 | | | 23,713 | |
| | | | |
|
| |
| | |
87 | HSBC INVESTOR PORTFOLIOS | See notes to financial statements. |
|
HSBC INVESTOR INTERMEDIATE DURATION FIXED INCOME PORTFOLIO |
|
Schedule of Portfolio Investments—as of October 31, 2008 (continued) |
| | | | | | | |
Corporate Obligations, continued | | | | | | | |
|
|
|
|
|
|
|
|
| | | | | | | |
| | Shares or
Principal
Amount($) | | Value($) | |
| |
| |
| |
Office Equipment & Services—0.7% | | | | | | | |
Xerox Corp., 3.63%, 12/18/09 (a)(d) | | | 100,000 | | | 91,227 | |
| | | | |
|
| |
Oil & Gas—0.1% | | | | | | | |
Pioneer Natural Resources Co., 5.88%,
7/15/16 | | | 25,000 | | | 18,266 | |
| | | | |
|
| |
Pipelines—0.7% | | | | | | | |
Dynegy Holdings, Inc., 7.75%, 6/1/19 | | | 25,000 | | | 16,750 | |
Transcontinental Gas Pipeline Corp., 6.05%,
6/15/18 | | | 100,000 | | | 79,993 | |
| | | | |
|
| |
| | | | | | 96,743 | |
| | | | |
|
| |
Retail—0.2% | | | | | | | |
Kroger Co. (The), 5.00%, 4/15/13 | | | 25,000 | | | 22,542 | |
| | | | |
|
| |
Support - Services—0.3% | | | | | | | |
Aramark Services, Inc., 8.50%, 2/1/15,
Callable 2/1/11 @104.25 | | | 25,000 | | | 21,375 | |
Iron Mountain, Inc., 8.00%, 6/15/20,
Callable 6/15/13 @ 104 | | | 25,000 | | | 19,625 | |
| | | | |
|
| |
| | | | | | 41,000 | |
| | | | |
|
| |
Telecom - Integrated/Services—0.1% | | | | | | | |
Qwest Corp., 7.63%, 6/15/15 | | | 25,000 | | | 19,125 | |
| | | | |
|
| |
Telecommunications—2.6% | | | | | | | |
Sprint Nextel Corp., 6.00%, 12/1/16 | | | 135,000 | | | 93,487 | |
Verizon Pennsylvania, Inc., 5.65%, 11/15/11 | | | 275,000 | | | 257,789 | |
| | | | |
|
| |
| | | | | | 351,276 | |
| | | | |
|
| |
Transportation—6.9% | | | | | | | |
American Airlines, Inc.: | | | | | | | |
Series 2001-2, Class A1, 6.98%, 4/1/11 | | | 56,774 | | | 52,091 | |
Series 2001-2, Class A2, 7.86%, 10/1/11 | | | 200,000 | | | 159,000 | |
Burlington Northern Santa Fe Railway Co.,
4.83%, 1/15/23 | | | 230,919 | | | 222,400 | |
Continental Airlines, Inc., 5.98%, 4/19/22 | | | 100,000 | | | 69,500 | |
Norfolk Southern Corp., 5.75%, 4/1/18 | | | 50,000 | | | 43,038 | |
Union Pacific Corp., 5.75%, 11/15/17 | | | 150,000 | | | 127,129 | |
Union Pacific Railroad, 5.08%, 1/2/29 | | | 293,571 | | | 247,530 | |
| | | | |
|
| |
| | | | | | 920,688 | |
| | | | |
|
| |
TOTAL CORPORATE OBLIGATIONS
(COST $4,664,535) | | | | | | 3,978,406 | |
| | | | |
|
| |
| | | | | | | |
Asset Backed Securities—21.4% | | | | | | | |
|
|
|
|
|
|
|
|
Asset Backed Funding Certificates,
Series 2003-AHL1, Class A1, 3.68%,
3/25/33 | | | 210,318 | | | 174,153 | |
Cairn Mezzanine plc, Series 2007-3A,
Class B1, 3.70%, 8/13/47 (a)(b) | | | 145,000 | | | 0 | |
Capital Auto Receivables Asset Trust: | | | | | | | |
Series 2005-1, Class A5, 4.66%,
1/15/10 (a)(d) | | | 47,113 | | | 46,996 | |
Series 2006-SN1A, Class A3, 5.31%,
10/20/09 (b)(d) | | | 30,933 | | | 30,933 | |
Series 2006-SN1A, Class A4B, 4.39%,
3/20/10 (a)(b)(d) | | | 150,000 | | | 147,743 | |
Series 2007-SN1, Class A3A, 5.47%,
7/15/10 (a)(d) | | | 100,000 | | | 99,009 | |
| | | | | | | |
Asset Backed Securities, continued | | | | | | | |
|
|
|
|
|
|
|
|
| | | | | | | |
| | Shares or
Principal
Amount($) | | Value($) | |
| |
| |
| |
Series 2007-SN1, Class A3B, 4.62%, | | | | | | | |
7/15/10 (a)(d) | | | 110,000 | | | 107,451 | |
Capital One Prime Auto Receivables Trust: | | | | | | | |
Series 2005-1, Class A4, 4.58%,
4/15/11 (a)(d) | | | 56,927 | | | 55,746 | |
Series 2006-1, Class A3, 4.99%, 9/15/10 (d) | | | 103,464 | | | 103,462 | |
Carmax Auto Owner Trust, Series 2008-2,
Class A2B, 5.46%, 9/15/11 (a)(d) | | | 190,000 | | | 182,690 | |
Chase Issuance Trust, Series 2005-A12,
Class A, 4.57%, 2/15/11 (a)(d) | | | 190,000 | | | 189,117 | |
Countrywide Asset-Backed Certificates: | | | | | | | |
Series 2006-S2, Class A5, 5.75%,
7/25/27 (a) | | | 134,000 | | | 37,510 | |
Series 2006-S4, Class A3, 5.80%,
7/25/34 | | | 209,304 | | | 121,552 | |
Ford Credit Auto Owner Trust,
Series 2006-C, Class A2A, 5.29%,
12/15/09 (d) | | | 99,232 | | | 99,194 | |
GE Business Loan Trust, Series 2006-2A,
Class A, 4.74%, 11/15/34 (a)(b)(d) | | | 234,628 | | | 194,307 | |
GMAC Mortgage Corp., Loan Trust,
Series 2006-HE3, Class A3, 5.81%,
10/25/36 | | | 170,000 | | | 95,285 | |
Hyundai Auto Receivables Trust: | | | | | | | |
Series 2007-A, Class A2B, 4.91%,
1/15/10 (a)(d) | | | 27,636 | | | 27,583 | |
Series 2008-A, Class A2, 4.16%,
5/16/11 (d) | | | 140,000 | | | 137,338 | |
IOWA Student Loan Liquidity Corp.,
Series 2005-1, Class A1, 3.24%,
6/25/14 (a)(d) | | | 46,087 | | | 45,838 | |
National Collegiate Student Loan Trust,
Series 2006-3, Class A1, 3.29%,
9/25/19 (a)(d) | | | 105,364 | | | 93,440 | |
Nissan Auto Receivables Owner Trust,
Series 2006-B, Class A3, 5.16%,
2/15/10 (d) | | | 53,588 | | | 53,552 | |
Preferred Term Securities XXII Ltd., 3.16%,
9/22/36, Callable 6/22/11 @ 100 (a)(b)(d) | | | 196,273 | | | 106,086 | |
Residential Funding Mortgage Securities,
Series 2006-HSA1, Class A5, 5.31%,
2/25/36 | | | 65,000 | | | 16,658 | |
SLM Student Loan Trust: | | | | | | | |
Series 2005-4, Class A2, 3.62%,
4/26/21 (a)(d) | | | 60,000 | | | 55,762 | |
Series 2005-9, Class A4, 3.64%,
1/25/23 (a)(d) | | | 190,000 | | | 179,690 | |
Series 2006-7, Class A2, 3.53%,
10/25/16 (a)(d) | | | 167,543 | | | 167,226 | |
Series 2006-9, Class A2, 3.54%,
4/25/17 (a)(d) | | | 33,569 | | | 33,402 | |
Series 2006-B, Class A1, 2.83%,
9/15/20 (a)(d) | | | 147,433 | | | 137,850 | |
South Carolina Student Loan Corp.,
Series 2008-1, Class A1, 3.31%,
9/2/14 (a)(d) | | | 126,487 | | | 123,917 | |
World Omni Auto Receivables Trust,
Series 2007-B, Class A2B, 4.88%,
2/16/10 (a)(d) | | | 38,426 | | | 38,364 | |
| | | | |
|
| |
TOTAL ASSET BACKED SECURITIES
(COST $3,444,458) | | | | | | 2,901,854 | |
| | | | |
|
| |
| | |
See notes to financial statements. | HSBC INVESTOR PORTFOLIOS | 88 |
|
HSBC INVESTOR INTERMEDIATE DURATION FIXED INCOME PORTFOLIO |
|
Schedule of Portfolio Investments—as of October 31, 2008 (continued) |
| | | | | | | |
Collateralized Mortgage Obligations—5.6% | | | | | | | |
|
|
|
|
|
|
|
|
| | | | | | | |
| | Shares or
Principal
Amount($) | | Value($) | |
| |
| |
| |
Banc of America Mortgage Securities,
Series 2005-D, Class 2A4, 4.79%,
5/25/35 (a)(d) | | | 176,166 | | | 169,438 | |
Deutsche Mortgage Securities, Inc.,
Series 2006-WF1, Class 1A1, 5.09%,
6/26/35 (a)(b) | | | 125,537 | | | 124,963 | |
Freddie Mac: | | | | | | | |
Series 2988, Class AF, 4.89%,
6/15/35 (a)(d) | | | 146,963 | | | 138,355 | |
Series 3212, Class BK, 5.40%,
9/15/36 | | | 150,000 | | | 137,866 | |
Residential Asset Securitization Trust,
Series 2003-A15, Class 1A2, 3.71%,
2/25/34 (a)(d) | | | 214,932 | | | 190,967 | |
| | | | |
|
| |
TOTAL COLLATERALIZED
MORTGAGE OBLIGATIONS
(COST $806,547) | | | | | | 761,589 | |
| | | | |
|
| |
| | | | | | | |
Commercial Mortgage Backed Securities—7.9% | | | | | | | |
|
|
|
|
|
|
|
|
Citigroup/Deutsche Bank Commercial
Mortgage Trust, Series 2007-CD4,
Class A2B, 5.21%, 12/11/49 | | | 200,000 | | | 174,489 | |
Commercial Mortgage Pass -
Through Certificate: | | | | | | | |
Series 2005-LP5, Class AJ, 5.05%,
5/10/43 | | | 200,000 | | | 135,573 | |
Series 2006-FL12, Class A2, 4.66%,
12/15/20 (a)(b)(d) | | | 239,553 | | | 203,889 | |
Greenwich Capital Commercial Funding Corp.: | | | | | | | |
Series 2006-GG7, Class A2, 5.91%,
7/10/38 (a) | | | 90,000 | | | 83,225 | |
Series 2006-GG7, Class A4, 5.91%,
7/10/38 (a) | | | 140,000 | | | 111,661 | |
LB-UBS Commercial Mortgage Trust,
Series 2006-C6, Class A2, 5.26%,
9/15/39 | | | 70,000 | | | 64,299 | |
Morgan Stanley Capital I, Series 2007-IQ14,
Class A2, 5.61%, 4/15/49 | | | 220,000 | | | 190,911 | |
Washington Mutual Commercial Mortgage
Securities Trust, Series 2006-SL1,
Class A, 5.30%, 11/23/43 (a)(b) | | | 144,541 | | | 108,406 | |
| | | | |
|
| |
TOTAL COMMERCIAL MORTGAGE
BACKED SECURITIES
(COST $1,295,102) | | | | | | 1,072,453 | |
| | | | |
|
| |
| | | | | | | |
Foreign Bonds—0.6% | | | | | | | |
|
|
|
|
|
|
|
|
United Kingdom—0.6% | | | | | | | |
Barclays Bank plc, 5.93%, 12/31/49 (b) | | | 150,000 | | | 80,524 | |
| | | | |
|
| |
TOTAL FOREIGN BONDS
(COST $151,088) | | | | | | 80,524 | |
| | | | |
|
| |
| | | | | | | |
Municipal Bonds—0.5% | | | | | | | |
|
|
|
|
|
|
|
|
Arizona Educational Loan Marketing Corp.
Educational Loan Revenue, Series A-1-B,
3.71%, 1/25/10, (Credit Support Guaranteed
Student Loans) (a)(d) | | | 74,000 | | | 72,335 | |
| | | | |
|
| |
TOTAL MUNICIPAL BONDS
(COST $73,934) | | | | | | 72,335 | |
| | | | |
|
| |
| | | | | | | |
Investment Company—13.6% | | | | | | | |
|
|
|
|
|
|
|
|
| | | | | | | |
| | Shares or
Principal
Amount($) | | Value($) | |
| |
| |
| |
Northern Institutional Diversified Assets
Portfolio, Shares Class, 0.82% (c)(d) | | | 1,838,531 | | | 1,838,531 | |
| | | | |
|
| |
TOTAL INVESTMENT COMPANY
(COST $1,838,531) | | | | | | 1,838,531 | |
| | | | |
|
| |
TOTAL INVESTMENTS
(COST $20,454,274) — 139.0% | | | | | | 18,807,640 | |
| | | | |
|
| |
| | |
| |
| Percentages indicated are based on net assets of $13,530,986. |
| |
(a) | Variable rate security. The interest rates on these securities are adjusted periodically to reflect then-current short-term interest rates. The rates presented represent the rates in effect on October 31, 2008. The maturity dates presented reflect the final maturity dates. However, some of these securities may contain put or demand features that allow the fund to require the issuer to repurchase the security from the fund within various time periods, including daily, weekly, monthly, or semi-annually. |
| | |
(b) | Security exempt from registration under Rule 144a of the Securities Act of 1933. This security may be resold in transactions exempt from registration, normally to qualified institutional buyers. This security has been deemed liquid by the Investment Adviser based on procedures approved by the Board of Trustees. |
| | |
(c) | The rates presented represent the annualized one day yield that was in effect on October 31, 2008. |
| | |
(d) | Security held as collateral for to be announced securities. |
| | |
(e) | Security is non-income producing; Defaulted Bond. |
| | |
(f) | In connection with the Lehman Brothers Holdings, Inc. bankruptcy filing announcement on September 15, 2008, the Fund stopped accruing prospective interest amounts on that date. |
| | |
LB | — | Lehman Brothers |
LLC | — | Limited Liability Co. |
MTN | — | Medium Term Note |
PLC | — | Public Limited Co. |
TBA | — | Security was traded on a “to be announced” basis. Represents 40.0% of net assets. |
| | |
89 | HSBC INVESTOR PORTFOLIOS | See notes to financial statements. |
|
HSBC INVESTOR GROWTH PORTFOLIO |
|
Schedule of Portfolio Investments—as of October 31, 2008 |
| | | | | | | |
Common Stocks—97.1% | | | | | | | |
|
|
|
|
|
|
|
|
| | | | | | | |
| | Shares | | Value($) | |
| |
| |
| |
Aerospace & Defense—2.3% | | | | | | | |
Precision Castparts Corp. | | | 15,400 | | | 998,074 | |
Rockwell Collins, Inc. | | | 24,500 | | | 912,135 | |
| | | | |
|
| |
| | | | | | 1,910,209 | |
| | | | |
|
| |
Agriculture—3.1% | | | | | | | |
Monsanto Co. | | | 28,800 | | | 2,562,624 | |
| | | | |
|
| |
Biotechnology—8.3% | | | | | | | |
Cephalon, Inc. (a) | | | 10,700 | | | 767,404 | |
Genzyme Corp. (a) | | | 34,900 | | | 2,543,512 | |
Gilead Sciences, Inc. (a) | | | 58,900 | | | 2,700,565 | |
Illumina, Inc. (a) | | | 24,900 | | | 767,667 | |
| | | | |
|
| |
| | | | | | 6,779,148 | |
| | | | |
|
| |
Business Services—0.7% | | | | | | | |
Ecolab, Inc. | | | 14,900 | | | 555,174 | |
| | | | |
|
| |
Coal—0.8% | | | | | | | |
Consol Energy, Inc. | | | 21,200 | | | 665,468 | |
| | | | |
|
| |
Communication Equipment—3.5% | | | | | | | |
Cisco Systems, Inc. (a) | | | 117,800 | | | 2,093,306 | |
Juniper Networks, Inc. (a) | | | 39,500 | | | 740,230 | |
| | | | |
|
| |
| | | | | | 2,833,536 | |
| | | | |
|
| |
Computer Storage—1.1% | | | | | | | |
EMC Corp. (a) | | | 76,200 | | | 897,636 | |
| | | | |
|
| |
Credit Card—4.3% | | | | | | | |
MasterCard, Inc., Class A | | | 9,600 | | | 1,419,072 | |
Visa, Inc., Class A | | | 37,800 | | | 2,092,230 | |
| | | | |
|
| |
| | | | | | 3,511,302 | |
| | | | |
|
| |
Distribution & Wholesale—1.8% | | | | | | | |
Fastenal Co. | | | 37,000 | | | 1,489,620 | |
| | | | |
|
| |
Electric, Gas & Water—0.8% | | | | | | | |
FirstEnergy Corp. | | | 12,800 | | | 667,648 | |
| | | | |
|
| |
Engineering & Construction—2.0% | | | | | | | |
Fluor Corp. | | | 19,100 | | | 762,663 | |
Quanta Services, Inc. (a) | | | 46,000 | | | 908,960 | |
| | | | |
|
| |
| | | | | | 1,671,623 | |
| | | | |
|
| |
Exchanges—1.5% | | | | | | | |
IntercontinentalExchange, Inc. (a) | | | 14,800 | | | 1,266,288 | |
| | | | |
|
| |
Hardware & Peripherals—4.6% | | | | | | | |
Apple, Inc. (a) | | | 12,000 | | | 1,291,080 | |
Hewlett-Packard Co. | | | 63,800 | | | 2,442,264 | |
| | | | |
|
| |
| | | | | | 3,733,344 | |
| | | | |
|
| |
Household Products—1.6% | | | | | | | |
The Procter & Gamble Co. | | | 19,800 | | | 1,277,892 | |
| | | | |
|
| |
Industrial Conglomerates—6.9% | | | | | | | |
Danaher Corp. | | | 40,900 | | | 2,422,916 | |
SPX Corp. | | | 33,300 | | | 1,290,042 | |
United Technologies Corp. | | | 36,000 | | | 1,978,560 | |
| | | | |
|
| |
| | | | | | 5,691,518 | |
| | | | |
|
| |
Internet—2.4% | | | | | | | |
Google, Inc., Class A (a) | | | 5,480 | | | 1,969,293 | |
| | | | |
|
| |
| | | | | | | |
Common Stocks, continued | | | | | | | |
|
|
|
|
|
|
|
|
|
| | Shares | | Value($) | |
| |
| |
| |
Investment Management—2.5% | | | | | | | |
BlackRock, Inc. | | | 6,100 | | | 801,174 | |
The Charles Schwab Corp. | | | 66,500 | | | 1,271,480 | |
| | | | |
|
| |
| | | | | | 2,072,654 | |
| | | | |
|
| |
Medical Products—6.8% | | | | | | | |
Alcon, Inc. ADR | | | 8,300 | | | 731,396 | |
Allergan, Inc. | | | 24,100 | | | 956,047 | |
Baxter International, Inc. | | | 26,000 | | | 1,572,740 | |
Mindray Medical International Ltd. ADR | | | 33,690 | | | 726,356 | |
St. Jude Medical, Inc. (a) | | | 42,500 | | | 1,616,275 | |
| | | | |
|
| |
| | | | | | 5,602,814 | |
| | | | |
|
| |
Medical Services & Distributors—6.9% | | | | | | | |
Medco Health Solutions, Inc. (a) | | | 94,300 | | | 3,578,685 | |
Thermo Fisher Scientific, Inc. (a) | | | 50,800 | | | 2,062,480 | |
| | | | |
|
| |
| | | | | | 5,641,165 | |
| | | | |
|
| |
Oil & Gas Drill & Equipment—2.2% | | | | | | | |
FMC Technologies, Inc. (a) | | | 23,300 | | | 815,267 | |
Weatherford International Ltd. (a) | | | 56,800 | | | 958,784 | |
| | | | |
|
| |
| | | | | | 1,774,051 | |
| | | | |
|
| |
Oil & Gas Exploration & Production—1.4% | | | | | | | |
Southwestern Energy Co. (a) | | | 32,400 | | | 1,154,088 | |
| | | | |
|
| |
Pharmaceuticals—2.2% | | | | | | | |
Teva Pharmaceutical Industries Ltd. ADR | | | 41,100 | | | 1,762,368 | |
| | | | |
|
| |
Railroad—3.4% | | | | | | | |
Norfolk Southern Corp. | | | 17,900 | | | 1,072,926 | |
Union Pacific Corp. | | | 25,400 | | | 1,695,958 | |
| | | | |
|
| |
| | | | | | 2,768,884 | |
| | | | |
|
| |
Retail—7.4% | | | | | | | |
Costco Wholesale Corp. | | | 17,800 | | | 1,014,778 | |
Kohl’s Corp. (a) | | | 24,100 | | | 846,633 | |
Lowe’s Cos., Inc. | | | 37,700 | | | 818,090 | |
Target Corp. | | | 29,200 | | | 1,171,504 | |
Wal-Mart Stores, Inc. | | | 40,100 | | | 2,237,981 | |
| | | | |
|
| |
| | | | | | 6,088,986 | |
| | | | |
|
| |
Retail Pharmacy—2.4% | | | | | | | |
CVS Caremark Corp. | | | 63,000 | | | 1,930,950 | |
| | | | |
|
| |
Software Services—7.4% | | | | | | | |
Cognizant Technology Solutions Corp. (a) | | | 78,400 | | | 1,505,280 | |
Dolby Laboratories, Inc., Class A (a) | | | 24,800 | | | 782,936 | |
Microsoft Corp. | | | 110,700 | | | 2,471,931 | |
Oracle Corp. (a) | | | 71,000 | | | 1,298,590 | |
| | | | |
|
| |
| | | | | | 6,058,737 | |
| | | | |
|
| |
Solar—1.0% | | | | | | | |
First Solar, Inc. (a) | | | 5,700 | | | 819,090 | |
| | | | |
|
| |
Telecommunication—5.5% | | | | | | | |
Equinix, Inc. (a) | | | 19,400 | | | 1,210,948 | |
QUALCOMM, Inc. | | | 86,000 | | | 3,290,360 | |
| | | | |
|
| |
| | | | | | 4,501,308 | |
| | | | |
|
| |
Transportation—1.3% | | | | | | | |
C.H. Robinson Worldwide, Inc. | | | 20,700 | | | 1,071,846 | |
| | | | |
|
| |
| | |
See notes to financial statements. | HSBC INVESTOR PORTFOLIOS | 90 |
|
HSBC INVESTOR GROWTH PORTFOLIO |
|
Schedule of Portfolio Investments—as of October 31, 2008 (continued) |
| | | | | | | |
Common Stocks, continued | | | | | | | |
|
|
|
|
|
|
| | | | | |
| | Shares | | Value($) | |
| |
| |
| |
Travel & Leisure—1.0% | | | | | | | |
Priceline.com, Inc. (a) | | | 15,500 | | | 815,765 | |
| | | | |
|
| |
TOTAL COMMON STOCKS
(COST $99,596,095) | | | | | | 79,545,029 | |
| | | | |
|
| |
| | | | | | | |
Investment Company—5.8% | | | | | | | |
|
|
|
|
|
|
|
|
Northern Institutional Diversified Assets
Portfolio, Shares Class, 0.82% (b) | | | 4,761,126 | | | 4,761,126 | |
| | | | |
|
| |
TOTAL INVESTMENT COMPANY
(COST $4,761,126) | | | | | | 4,761,126 | |
| | | | |
|
| |
TOTAL INVESTMENTS
(COST $104,357,221) — 102.9% | | | | | | 84,306,155 | |
| | | | |
|
| |
| | |
| |
| Percentages indicated are based on net assets of $81,941,512. |
| | |
(a) | Represents non-income producing security. |
| | |
(b) | The rates presented represent the annualized one day yield that was in effect on October 31, 2008. |
| | |
ADR | — | American Depositary Receipt |
| | |
91 | HSBC INVESTOR PORTFOLIOS | See notes to financial statements. |
|
HSBC INVESTOR INTERNATIONAL EQUITY PORTFOLIO |
|
Schedule of Portfolio Investments—as of October 31, 2008 |
| | | | | | | |
Common Stocks—96.5% | | | | | | | |
|
|
|
|
|
|
|
|
| | | | | | | |
| | Shares | | Value($) | |
| |
| |
| |
Australia—2.3% | | | | | | | |
BHP Billiton Ltd. | | | 98,200 | | | 1,885,840 | |
Caltex Australia Ltd. | | | 66,600 | | | 419,310 | |
Lend Lease Corp., Ltd. | | | 143,700 | | | 664,688 | |
National Australia Bank Ltd. | | | 47,565 | | | 771,507 | |
OZ Minerals Ltd. | | | 316,752 | | | 198,914 | |
Qantas Airways Ltd. | | | 412,833 | | | 670,300 | |
| | | | |
|
| |
| | | | | | 4,610,559 | |
| | | | |
|
| |
Austria—0.6% | | | | | | | |
Voestalpine AG | | | 51,400 | | | 1,254,245 | |
| | | | |
|
| |
Belgium—1.2% | | | | | | | |
Fortis | | | 60,632 | | | 68,770 | |
Solvay SA, Class A | | | 24,600 | | | 2,287,892 | |
| | | | |
|
| |
| | | | | | 2,356,662 | |
| | | | |
|
| |
Brazil—0.2% | | | | | | | |
Banco Do Brasil SA | | | 60,000 | | | 396,305 | |
| | | | |
|
| |
Canada—5.1% | | | | | | | |
Barrick Gold Corp. | | | 37,500 | | | 857,819 | |
Canadian Imperial Bank of Commerce | | | 21,000 | | | 952,739 | |
Fairfax Financial Holdings Ltd. | | | 5,200 | | | 1,428,619 | |
Gerdau Ameristeel Corp. | | | 89,300 | | | 478,075 | |
Industrial Alliance Insurance and
Financial Services, Inc. | | | 26,100 | | | 541,584 | |
Inmet Mining Corp. | | | 11,300 | | | 253,706 | |
Nexen, Inc. | | | 40,284 | | | 639,970 | |
Petro-Canada | | | 90,000 | | | 2,251,494 | |
Royal Bank of Canada | | | 45,400 | | | 1,765,053 | |
Teck Cominco Ltd., B Shares | | | 41,100 | | | 409,362 | |
WestJet Airlines Ltd. | | | 59,300 | | | 508,440 | |
| | | | |
|
| |
| | | | | | 10,086,861 | |
| | | | |
|
| |
China—0.6% | | | | | | | |
China Petroleum & Chemical Corp. | | | 1,920,000 | | | 1,260,840 | |
| | | | |
|
| |
Finland—2.1% | | | | | | | |
Nokia Oyj | | | 129,400 | | | 1,981,949 | |
Stora Enso Oyj, R Shares | | | 236,600 | | | 2,199,992 | |
| | | | |
|
| |
| | | | | | 4,181,941 | |
| | | | |
|
| |
France—14.7% | | | | | | | |
Air France-KLM | | | 28,700 | | | 413,454 | |
BNP Paribas SA | | | 64,580 | | | 4,662,229 | |
Compagnie Generale des Establissements
Michelin, B Shares | | | 39,700 | | | 2,043,167 | |
Credit Agricole SA | | | 185,402 | | | 2,681,907 | |
France Telecom SA | | | 107,200 | | | 2,702,802 | |
Lagardere SCA | | | 46,400 | | | 1,844,655 | |
Renault SA | | | 51,500 | | | 1,578,181 | |
Sanofi-Aventis | | | 68,900 | | | 4,364,808 | |
Societe Generale | | | 44,231 | | | 2,410,536 | |
Total SA | | | 109,700 | | | 6,034,287 | |
Vallourec SA | | | 4,500 | | | 503,308 | |
| | | | |
|
| |
| | | | | | 29,239,334 | |
| | | | |
|
| |
Germany—13.5% | | | | | | | |
Allianz SE | | | 39,800 | | | 2,994,584 | |
BASF AG | | | 127,200 | | | 4,269,723 | |
| | | | | | | |
Common Stocks, continued | | | | | | | |
|
|
|
|
|
|
|
|
| | | | | | | |
| | Shares | | Value($) | |
| |
| |
| |
Germany, continued | | | | | | | |
Deutsche Bank AG | | | 64,400 | | | 2,447,181 | |
Deutsche Lufthansa AG | | | 162,600 | | | 2,262,064 | |
Deutsche Telekom AG | | | 220,300 | | | 3,270,737 | |
E.ON AG | | | 115,500 | | | 4,419,777 | |
Infineon Technologies AG (a) | | | 304,300 | | | 951,825 | |
Muenchener Rueckversicherungs-
Gesellschaft AG | | | 27,700 | | | 3,668,974 | |
RWE AG | | | 31,860 | | | 2,649,103 | |
| | | | |
|
| |
| | | | | | 26,933,968 | |
| | | | |
|
| |
India—0.4% | | | | | | | |
State Bank of India GDR | | | 17,600 | | | 805,200 | |
| | | | |
|
| |
Italy—3.1% | | | | | | | |
ENI SpA | | | 189,900 | | | 4,532,045 | |
Fondiaria-SAI SpA | | | 52,400 | | | 984,315 | |
Telecom Italia SpA | | | 536,000 | | | 615,668 | |
| | | | |
|
| |
| | | | | | 6,132,028 | |
| | | | |
|
| |
Japan—18.4% | | | | | | | |
Alps Electric Co., Ltd. | | | 55,000 | | | 302,628 | |
FUJITSU Ltd. | | | 573,000 | | | 2,253,381 | |
Hitachi Ltd. | | | 170,000 | | | 798,321 | |
Honda Motor Co., Ltd. | | | 99,000 | | | 2,462,174 | |
JFE Holdings, Inc. | | | 86,100 | | | 2,197,321 | |
Mitsubishi Chemical Holdings Corp. | | | 303,000 | | | 1,225,178 | |
Mitsubishi Corp. | | | 129,000 | | | 2,162,718 | |
Mitsui & Co., Ltd. | | | 149,000 | | | 1,444,030 | |
Mitsui O.S.K. Lines Ltd. | | | 234,000 | | | 1,222,176 | |
NAMCO BANDAI Holdings, Inc. | | | 123,800 | | | 1,273,343 | |
Nippon Mining Holdings, Inc. | | | 360,000 | | | 1,102,311 | |
Nippon Steel Corp. | | | 329,000 | | | 1,107,611 | |
Nippon Telegraph & Telephone Corp. | | | 630 | | | 2,571,377 | |
Nippon Yusen Kabushiki Kaisha | | | 50,000 | | | 241,833 | |
Nissan Motor Co., Ltd. | | | 534,700 | | | 2,656,072 | |
ORIX Corp. | | | 21,300 | | | 2,188,873 | |
Sharp Corp. | | | 261,000 | | | 1,863,202 | |
Sony Corp. | | | 12,510 | | | 296,552 | |
Sumitomo Mitsui Financial Group, Inc. | | | 570 | | | 2,285,517 | |
The Tokyo Electric Power Co., Inc. | | | 100,900 | | | 2,858,120 | |
Toshiba Corp. | | | 543,000 | | | 1,963,027 | |
Toyota Motor Corp. | | | 56,700 | | | 2,214,637 | |
| | | | |
|
| |
| | | | | | 36,690,402 | |
| | | | |
|
| |
Luxembourg—0.8% | | | | | | | |
ArcelorMittal | | | 64,352 | | | 1,673,566 | |
| | | | |
|
| |
Netherlands—2.6% | | | | | | | |
ING Groep NV | | | 155,768 | | | 1,460,992 | |
Koninklijke Ahold NV | | | 266,720 | | | 2,863,012 | |
Koninklijke DSM NV | | | 32,100 | | | 893,832 | |
| | | | |
|
| |
| | | | | | 5,217,836 | |
| | | | |
|
| |
Norway—1.5% | | | | | | | |
StatoilHydro ASA | | | 153,100 | | | 3,081,362 | |
| | | | |
|
| |
Russian Federation—0.7% | | | | | | | |
JSC MMC Norilsk Nickel ADR | | | 68,750 | | | 689,953 | |
LUKOIL ADR | | | 16,550 | | | 635,372 | |
| | | | |
|
| |
| | | | | | 1,325,325 | |
| | | | |
|
| |
| | |
See notes to financial statements. | HSBC INVESTOR PORTFOLIOS | 92 |
|
HSBC INVESTOR INTERNATIONAL EQUITY PORTFOLIO |
|
Schedule of Portfolio Investments—as of October 31, 2008 (continued) |
| | | | | | | |
Common Stocks, continued | | | | | | | |
|
|
|
|
|
|
|
|
| | | | | | | |
| | Shares | | Value($) | |
| |
| |
| |
Singapore—0.4% | | | | | | | |
Flextronics International Ltd. (a) | | | 80,400 | | | 336,072 | |
Neptune Orient Lines Ltd. | | | 427,000 | | | 360,769 | |
| | | | |
|
| |
| | | | | | 696,841 | |
| | | | |
|
| |
South Africa—0.6% | | | | | | | |
Sanlam Ltd. | | | 554,040 | | | 910,406 | |
Standard Bank Group Ltd. | | | 31,023 | | | 246,649 | |
| | | | |
|
| |
| | | | | | 1,157,055 | |
| | | | |
|
| |
South Korea—1.1% | | | | | | | |
Honam Petrochemical Corp. | | | 8,100 | | | 331,597 | |
Hynix Semiconductor, Inc. (a) | | | 24,700 | | | 211,635 | |
Industrial Bank of Korea GDR | | | 88,300 | | | 488,915 | |
KB Financial Group, Inc. ADR (a) | | | 14,600 | | | 359,306 | |
Samsung Electronics Co., Ltd., Preferred | | | 2,900 | | | 761,674 | |
| | | | |
|
| |
| | | | | | 2,153,127 | |
| | | | |
|
| |
Spain—1.1% | | | | | | | |
Repsol YPF SA | | | 118,600 | | | 2,255,028 | |
| | | | |
|
| |
Sweden—1.5% | | | | | | | |
Ericsson LM, B Shares | | | 83,000 | | | 565,321 | |
Nordea Bank AB | | | 73,600 | | | 590,233 | |
Svenska Cellusoa AB (SCA), B Shares | | | 189,700 | | | 1,401,579 | |
Volvo AB, B Shares | | | 86,500 | | | 452,262 | |
| | | | |
|
| |
| | | | | | 3,009,395 | |
| | | | |
|
| |
Switzerland—3.8% | | | | | | | |
Credit Suisse Group | | | 81,100 | | | 3,033,689 | |
Novartis AG | | | 90,330 | | | 4,586,554 | |
| | | | |
|
| |
| | | | | | 7,620,243 | |
| | | | |
|
| |
Taiwan—1.0% | | | | | | | |
China Steel Corp. GDR | | | 40,044 | | | 572,629 | |
Compal Electronics, Inc. | | | 581,895 | | | 417,870 | |
Taiwan Semiconductor
Manufacturing Co., Ltd. | | | 510,961 | | | 743,872 | |
United Microelectronics Corp. | | | 1,143,805 | | | 314,232 | |
| | | | |
|
| |
| | | | | | 2,048,603 | |
| | | | |
|
| |
Thailand—0.3% | | | | | | | |
PTT Public Co., Ltd. | | | 121,400 | | | 558,102 | |
| | | | |
|
| |
United Kingdom—18.9% | | | | | | | |
Associated British Foods plc | | | 199,300 | | | 2,229,597 | |
Aviva plc | | | 352,191 | | | 2,100,382 | |
Barclays plc | | | 591,100 | | | 1,694,081 | |
BP plc | | | 319,500 | | | 2,603,851 | |
British Energy Group plc | | | 277,000 | | | 3,312,478 | |
GlaxoSmithKline plc | | | 259,600 | | | 4,989,491 | |
HBOS plc | | | 853,235 | | | 1,396,818 | |
Kazakhmys plc | | | 84,600 | | | 396,563 | |
Lloyds TSB Group plc | | | 370,300 | | | 1,196,597 | |
Royal Bank of Scotland Group plc | | | 1,065,102 | | | 1,172,982 | |
Royal Dutch Shell plc, A Shares | | | 277,887 | | | 7,701,302 | |
Royal Dutch Shell plc, B Shares | | | 45,973 | | | 1,246,147 | |
RSA Insurance Group plc | | | 776,127 | | | 1,725,616 | |
Vodafone Group plc | | | 2,624,658 | | | 5,048,034 | |
Xstrata plc | | | 51,700 | | | 884,107 | |
| | | | |
|
| |
| | | | | | 37,698,046 | |
| | | | |
|
| |
| | | | | | | |
Common Stocks, continued | | | | | | | |
|
|
|
|
|
|
|
|
| | | | | | | |
| | Shares | | Value($) | |
| |
| |
| |
TOTAL COMMON STOCKS
(COST $313,588,837) | | | | | | 192,442,874 | |
| | | | |
|
| |
Right—0.0% | | | | | | | |
|
|
|
|
|
|
|
|
Belgium—0.0% | | | | | | | |
Fortis (a) | | | 121,532 | | | 0 | |
| | | | |
|
| |
Investment Company—2.4% | | | | | | | |
|
|
|
|
|
|
|
|
Northern Institutional Diversified Assets
Portfolio, Shares Class, 0.82% (b) | | | 4,744,098 | | | 4,744,098 | |
| | | | |
|
| |
TOTAL INVESTMENT COMPANY
(COST $4,744,098) | | | | | | 4,744,098 | |
| | | | |
|
| |
TOTAL INVESTMENTS
(COST $318,332,935) — 98.9% | | | | | | 197,186,972 | |
| | | | |
|
| |
| |
|
| Percentages indicated are based on net assets of $199,308,910. |
| |
(a) | Represents non-income producing security. |
| |
(b) | The rates presented represent the annualized one day yield that was in effect on October 31, 2008. |
| | |
ADR | — | American Depositary Receipt |
GDR | — | Global Depositary Receipt |
PLC | — | Public Limited Co. |
SPA | — | Standby Purchase Agreement |
| | | | |
Schedule Portfolio Investments - October 31, 2008 | | | | |
|
|
|
|
|
| | | |
Industry | | Percent of Net Assets | |
| |
| |
Automotive | | 5.5 | % | |
Banking & Financial Services | | 17.6 | % | |
Broadcasting | | 0.0 | % | |
Building & Construction | | 0.7 | % | |
Cash & Cash Equivalents | | 2.4 | % | |
Chemicals | | 4.5 | % | |
Drugs - Medical | | 7.0 | % | |
Electrical | | 7.6 | % | |
Electronic Components & Semiconductors | | 4.7 | % | |
Food & Beverage | | 1.1 | % | |
Import/Export | | 0.7 | % | |
Insurance | | 6.5 | % | |
Manufacturing | | 1.9 | % | |
Metals & Mining | | 6.7 | % | |
Oil & Gas | | 17.4 | % | |
Paper & Related Products | | 1.1 | % | |
Publishing | | 0.9 | % | |
Retail | | 1.4 | % | |
Telecommunications | | 8.4 | % | |
Transportation Services | | 2.8 | % | |
| |
|
| |
Total Investments | | 98.9 | % | |
| |
|
| |
At October 31, 2008 the portfolio’s open forward currency contracts were as follows:
| | | | | | | | | | | | | | | | |
Currency | | Delivery
Date | | Amount
(Local
Currency) | | Contract
Value
(U.S. Dollars)
($) | | Value
($) | | Unrealized
Appreciation/
(Depreciation)
($) | |
| |
|
| |
|
| |
|
| |
|
| |
|
| |
SHORT CONTRACTS | | | | | | | | | | | | | | | | |
Canadian Dollar | | | 12/15/08 | | | 7,997,000 | | | 6,689,531 | | | 6,638,553 | | | 50,978 | |
| | |
93 | HSBC INVESTOR PORTFOLIOS | See notes to financial statements. |
|
HSBC INVESTOR OPPORTUNITY PORTFOLIO |
|
Schedule of Portfolio Investments—as of October 31, 2008 |
| | | | | | | |
Common Stocks—96.8% | | | | | | | |
|
|
|
|
|
|
|
|
| | | | | | | |
| | Shares | | Value($) | |
| |
| |
| |
Aerospace & Defense—1.4% | | | | | | | |
BE Aerospace, Inc. (a) | | | 142,500 | | | 1,833,975 | |
| | | | |
|
| |
Biotechnology—5.2% | | | | | | | |
Illumina, Inc. (a) | | | 144,300 | | | 4,448,769 | |
Invitrogen Corp. (a) | | | 76,900 | | | 2,213,951 | |
| | | | |
|
| |
| | | | | | 6,662,720 | |
| | | | |
|
| |
Business Services—2.3% | | | | | | | |
Navigant Consulting, Inc. (a) | | | 179,550 | | | 2,903,324 | |
| | | | |
|
| |
Computer Software—14.9% | | | | | | | |
ACI Worldwide, Inc. (a) | | | 92,200 | | | 1,263,140 | |
BMC Software, Inc. (a) | | | 127,400 | | | 3,289,468 | |
Brocade Communications Systems, Inc. (a) | | | 342,200 | | | 1,290,094 | |
Check Point Software Technologies Ltd. (a) | | | 155,450 | | | 3,143,199 | |
Citrix Systems, Inc. (a) | | | 108,200 | | | 2,788,314 | |
NetApp, Inc. (a) | | | 91,400 | | | 1,236,642 | |
Nuance Communications, Inc. (a) | | | 262,850 | | | 2,405,077 | |
Satyam Computer Services Ltd. ADR | | | 135,400 | | | 2,129,842 | |
VeriFone Holdings, Inc. (a) | | | 138,400 | | | 1,572,224 | |
| | | | |
|
| |
| | | | | | 19,118,000 | |
| | | | |
|
| |
Consumer Products—8.1% | | | | | | | |
AptarGroup, Inc. | | | 58,500 | | | 1,773,720 | |
Church & Dwight Co., Inc. | | | 72,100 | | | 4,260,389 | |
Crown Holdings, Inc. (a) | | | 135,400 | | | 2,732,372 | |
Packaging Corp. of America | | | 93,800 | | | 1,578,654 | |
| | | | |
|
| |
| | | | | | 10,345,135 | |
| | | | |
|
| |
Diversified Manufacturing Operations—2.6% | | | | | | | |
Actuant Corp., Class A | | | 44,800 | | | 803,264 | |
AMETEK, Inc. | | | 74,500 | | | 2,477,125 | |
| | | | |
|
| |
| | | | | | 3,280,389 | |
| | | | |
|
| |
Education—4.7% | | | | | | | |
Corinthian Colleges, Inc. (a) | | | 154,429 | | | 2,205,246 | |
DeVry, Inc. | | | 67,350 | | | 3,818,072 | |
| | | | |
|
| |
| | | | | | 6,023,318 | |
| | | | |
|
| |
Electronic Components & Semiconductors—0.5% | | | | | | | |
ATMI, Inc. (a) | | | 51,300 | | | 623,808 | |
| | | | |
|
| |
Financial Services—5.4% | | | | | | | |
Annaly Capital Management, Inc. | | | 72,100 | | | 1,002,190 | |
Huntington Bancshares, Inc. | | | 152,600 | | | 1,442,070 | |
PrivateBancorp, Inc. | | | 86,600 | | | 3,118,466 | |
Zions Bancorporation | | | 36,900 | | | 1,406,259 | |
| | | | |
|
| |
| | | | | | 6,968,985 | |
| | | | |
|
| |
Health Care—8.2% | | | | | | | |
DaVita, Inc. (a) | | | 71,300 | | | 4,046,275 | |
DENTSPLY International, Inc. | | | 58,500 | | | 1,777,230 | |
Gen-Probe, Inc. (a) | | | 65,700 | | | 3,091,842 | |
Pediatrix Medical Group, Inc. (a) | | | 40,450 | | | 1,563,392 | |
| | | | |
|
| |
| | | | | | 10,478,739 | |
| | | | |
|
| |
Homebuilders—1.3% | | | | | | | |
Toll Brothers, Inc. (a) | | | 70,500 | | | 1,629,960 | |
| | | | |
|
| |
| | | | | | | |
Common Stocks, continued | | | | | | | |
|
|
|
|
|
|
|
|
| | | | | | | |
| | Shares | | Value($) | |
| |
| |
| |
Industrial Manufacturing—5.7% | | | | | | | |
IDEX Corp. | | | 99,400 | | | 2,304,092 | |
Mettler-Toledo International, Inc. (a) | | | 49,650 | | | 3,800,211 | |
WESCO International, Inc. (a) | | | 62,500 | | | 1,242,500 | |
| | | | |
|
| |
| | | | | | 7,346,803 | |
| | | | |
|
| |
Internet Related—1.4% | | | | | | | |
VeriSign, Inc. (a) | | | 85,000 | | | 1,802,000 | |
| | | | |
|
| |
Media—1.4% | | | | | | | |
DreamWorks Animation SKG, Inc. (a) | | | 61,700 | | | 1,733,770 | |
| | | | |
|
| |
Oil & Gas—9.5% | | | | | | | |
BJ Services Co. | | | 54,900 | | | 705,465 | |
Consol Energy, Inc. | | | 35,700 | | | 1,120,623 | |
Denbury Resources, Inc. (a) | | | 247,700 | | | 3,148,267 | |
Exterran Holdings, Inc. (a) | | | 64,900 | | | 1,454,409 | |
Massey Energy Co. | | | 143,250 | | | 3,307,642 | |
Range Resources Corp. | | | 56,900 | | | 2,402,318 | |
| | | | |
|
| |
| | | | | | 12,138,724 | |
| | | | |
|
| |
Pharmaceuticals—12.6% | | | | | | | |
Alexion Pharmaceuticals, Inc. (a) | | | 121,350 | | | 4,945,012 | |
Elan Corp. plc ADR (a) | | | 262,900 | | | 2,005,927 | |
OSI Pharmaceuticals, Inc. (a) | | | 125,050 | | | 4,745,648 | |
Santarus, Inc. (a) | | | 236,400 | | | 397,152 | |
Shire plc ADR | | | 102,600 | | | 4,047,570 | |
| | | | |
|
| |
| | | | | | 16,141,309 | |
| | | | |
|
| |
Retail—4.7% | | | | | | | |
Foot Locker, Inc. | | | 111,400 | | | 1,628,668 | |
O’Reilly Automotive, Inc. (a) | | | 80,900 | | | 2,193,199 | |
PetSmart, Inc. | | | 110,600 | | | 2,177,714 | |
| | | | |
|
| |
| | | | | | 5,999,581 | |
| | | | |
|
| |
Telecommunications—3.2% | | | | | | | |
Comverse Technology, Inc. (a) | | | 218,800 | | | 1,590,676 | |
Polycom, Inc. (a) | | | 116,250 | | | 2,442,413 | |
| | | | |
|
| |
| | | | | | 4,033,089 | |
| | | | |
|
| |
Transportation—2.3% | | | | | | | |
Kansas City Southern (a) | | | 96,200 | | | 2,969,694 | |
| | | | |
|
| |
Utilities—1.4% | | | | | | | |
Equitable Resources, Inc. | | | 52,900 | | | 1,836,159 | |
| | | | |
|
| |
TOTAL COMMON STOCKS
(COST $154,485,572) | | | | | | 123,869,482 | |
| | | | |
|
| |
Investment Company—3.7% | | | | | | | |
|
|
|
|
|
|
|
|
Northern Institutional Government
Select Portfolio, Shares Class, 1.19% (b) | | | 4,716,252 | | | 4,716,252 | |
TOTAL INVESTMENT COMPANY
(COST $4,716,252) | | | | | | 4,716,252 | |
| | | | |
|
| |
TOTAL INVESTMENTS
(COST $159,201,824) — 100.5% | | | | | | 128,585,734 | |
| | | | |
|
| |
| |
|
Percentages indicated are based on net assets of $127,969,639. |
| |
(a) | Represents non-income producing security. |
| |
(b) | The rates presented represent the annualized one day yield that was in effect on October 31, 2008. |
| | |
ADR | — | American Depositary Receipt |
PLC | — | Public Limited Co. |
| | |
See notes to financial statements. | HSBC INVESTOR PORTFOLIOS | 94 |
|
HSBC INVESTOR VALUE PORTFOLIO |
|
Schedule of Portfolio Investments—as of October 31, 2008 |
| | | | | | | |
Common Stocks—91.4% | | | | | | | |
|
|
|
|
|
|
|
|
| | | | | |
| | Shares | | Value($) | |
| |
| |
| |
Aerospace & Defense—5.5% | | | | | | | |
Lockheed Martin Corp. | | | 14,900 | | | 1,267,245 | |
Raytheon Co. | | | 28,300 | | | 1,446,413 | |
| | | | |
|
| |
| | | | | | 2,713,658 | |
| | | | |
|
| |
Banking—3.5% | | | | | | | |
Wells Fargo & Co. | | | 50,700 | | | 1,726,335 | |
| | | | |
|
| |
Business Services—3.6% | | | | | | | |
Pitney Bowes, Inc. | | | 71,600 | | | 1,774,248 | |
| | | | |
|
| |
Computer Software—9.3% | | | | | | | |
CA, Inc. | | | 135,600 | | | 2,413,680 | |
Microsoft Corp. | | | 98,900 | | | 2,208,437 | |
| | | | |
|
| |
| | | | | | 4,622,117 | |
| | | | |
|
| |
Conglomerates—2.6% | | | | | | | |
Loews Corp. | | | 38,332 | | | 1,273,006 | |
| | | | |
|
| |
Consumer Products—6.0% | | | | | | | |
Altria Group, Inc. | | | 30,800 | | | 591,052 | |
Kimberly-Clark Corp. | | | 27,500 | | | 1,685,475 | |
Kraft Foods, Inc. | | | 25,069 | | | 730,511 | |
| | | | |
|
| |
| | | | | | 3,007,038 | |
| | | | |
|
| |
Diversified Manufacturing Operations—2.4% | | | | | | | |
Illinois Tool Works, Inc. | | | 18,400 | | | 614,376 | |
Ingersoll-Rand Co., Class A | | | 32,400 | | | 597,780 | |
| | | | |
|
| |
| | | | | | 1,212,156 | |
| | | | |
|
| |
Energy—1.6% | | | | | | | |
NRG Energy, Inc. (a) | | | 33,800 | | | 785,850 | |
| | | | |
|
| |
Financial Services—4.2% | | | | | | | |
JP Morgan Chase & Co. | | | 50,750 | | | 2,093,437 | |
| | | | |
|
| |
Insurance—7.4% | | | | | | | |
Aetna, Inc. | | | 18,800 | | | 467,556 | |
Aon Corp. | | | 32,700 | | | 1,383,210 | |
Genworth Financial, Inc., Class A | | | 93,500 | | | 452,540 | |
MetLife, Inc. | | | 30,100 | | | 999,922 | |
The Hartford Financial
Services Group, Inc. | | | 37,300 | | | 384,936 | |
| | | | |
|
| |
| | | | | | 3,688,164 | |
| | | | |
|
| |
Media—6.5% | | | | | | | |
CBS Corp., Class B | | | 34,350 | | | 333,538 | |
Comcast Corp., Class A | | | 51,650 | | | 796,443 | |
Liberty Media Corp. Interactive,
Class A (a) | | | 37,087 | | | 180,985 | |
Viacom, Inc., Class B (a) | | | 94,000 | | | 1,900,680 | |
| | | | |
|
| |
| | | | | | 3,211,646 | |
| | | | |
|
| |
Metals & Mining—6.4% | | | | | | | |
AngloGold Ashanti Ltd. ADR | | | 70,027 | | | 1,277,993 | |
Barrick Gold Corp. | | | 62,600 | | | 1,422,272 | |
United States Steel Corp. | | | 13,800 | | | 508,944 | |
| | | | |
|
| |
| | | | | | 3,209,209 | |
| | | | |
|
| |
| | | | | | | |
Common Stocks, continued | | | | | | | |
|
|
|
|
|
|
|
|
| | | | | |
| | Shares | | Value($) | |
| |
| |
| |
Oil & Gas—12.1% | | | | | | | |
Apache Corp. | | | 24,400 | | | 2,008,852 | |
ConocoPhillips | | | 9,571 | | | 497,883 | |
Hess Corp. | | | 13,600 | | | 818,856 | |
Noble Energy, Inc. | | | 40,700 | | | 2,109,074 | |
Talisman Energy, Inc. | | | 55,200 | | | 556,416 | |
| | | | |
|
| |
| | | | | | 5,991,081 | |
| | | | |
|
| |
Paper & Related Products—0.8% | | | | | | | |
International Paper Co. | | | 22,300 | | | 384,006 | |
| | | | |
|
| |
Pharmaceuticals—6.0% | | | | | | | |
Amgen, Inc. (a) | | | 27,000 | | | 1,617,030 | |
Sanofi-Aventis ADR | | | 42,700 | | | 1,350,174 | |
| | | | |
|
| |
| | | | | | 2,967,204 | |
| | | | |
|
| |
Telecommunications—6.6% | | | | | | | |
AT&T, Inc. | | | 51,791 | | | 1,386,445 | |
Motorola, Inc. | | | 202,400 | | | 1,086,888 | |
Verizon Communications, Inc. | | | 27,800 | | | 824,826 | |
| | | | |
|
| |
| | | | | | 3,298,159 | |
| | | | |
|
| |
Tobacco—4.5% | | | | | | | |
Lorillard, Inc. | | | 13,627 | | | 897,474 | |
Philip Morris International, Inc. | | | 30,800 | | | 1,338,876 | |
| | | | |
|
| |
| | | | | | 2,236,350 | |
| | | | |
|
| |
Transportation—2.4% | | | | | | | |
Union Pacific Corp. | | | 18,000 | | | 1,201,860 | |
| | | | |
|
| |
TOTAL COMMON STOCKS
(COST $58,020,424 | | | | | | 45,395,524 | |
| | | | |
|
| |
Investment Company—9.8% | | | | | | | |
|
|
|
|
|
|
|
|
Northern Institutional Government
Select Portfolio, Shares Class, 1.19% (b) | | | 4,851,586 | | | 4,851,586 | |
| | | | |
|
| |
TOTAL INVESTMENT COMPANY
(COST $4,851,586) | | | | | | 4,851,586 | |
| | | | |
|
| |
TOTAL INVESTMENTS
(COST $62,864,410) — 101.2% | | | | | | 50,247,110 | |
| | | | |
|
| |
| |
|
| Percentages indicated are based on net assets of $49,663,172. |
| |
(a) | Represents non-income producing security. |
| |
(b) | The rates presented represent the annualized one day yield that was in effect on October 31, 2008. |
| |
ADR — American Depositary Receipt |
| | |
95 | HSBC INVESTOR PORTFOLIOS | See notes to financial statements. |
[This Page Intentionally Left Blank]
HSBC INVESTOR PORTFOLIOS
Statements of Assets and Liabilities—as of October 31, 2008
| | | | | | | | | | | | | | | | |
| | Core Plus
Fixed Income
Portfolio | | High Yield
Fixed Income
Portfolio | | Intermediate
Duration
Fixed Income
Portfolio | | Growth
Portfolio | | International
Equity
Portfolio | |
|
|
|
|
|
|
|
|
|
|
|
|
Assets: | | | | | | | | | | | | | | | | |
Investments in non-affiliates, at value | | $ | 106,142,905 | | $ | 9,548,913 | | $ | 18,807,640 | | $ | 84,306,155 | | $ | 197,186,972 | |
Foreign currency, at value | | | — | | | — | | | — | | | — | | | 887,216 | |
Variation margin on forward foreign currency exchange contracts | | | — | | | — | | | — | | | — | | | 50,978 | |
Segregated cash balances with brokers for futures contracts | | | 226,031 | | | — | | | 42,034 | | | — | | | — | |
Variation margin on futures contracts | | | 228,891 | | | — | | | 45,938 | | | — | | | — | |
Interest and dividends receivable | | | 826,801 | | | 360,084 | | | 114,507 | | | 17,099 | | | 855,270 | |
Receivable for investments sold | | | 6,946,604 | | | 84,625 | | | 7,467 | | | 673,542 | | | 485,998 | |
Prepaid expenses and other assets | | | 174 | | | 540 | | | — | | | 384 | | | 493 | |
| |
|
| |
|
| |
|
| |
|
| |
|
| |
Total Assets | | | 114,371,406 | | | 9,994,162 | | | 19,017,586 | | | 84,997,180 | | | 199,466,927 | |
| |
|
| |
|
| |
|
| |
|
| |
|
| |
|
Liabilities: | | | | | | | | | | | | | | | | |
Cash overdraft | | | — | | | 125,637 | | | — | | | — | | | — | |
Payable for investments purchased | | | 32,592,501 | | | — | | | 5,476,635 | | | 2,930,835 | | | — | |
Accrued expenses and other liabilities: | | | | | | | | | | | | | | | | |
Investment Management | | | 40,706 | | | 5,517 | | | 4,707 | | | 119,846 | | | 122,908 | |
Administration | | | 1,579 | | | 183 | | | 236 | | | 1,396 | | | 3,455 | |
Compliance Service | | | 150 | | | 9 | | | 9 | | | 51 | | | 490 | |
Trustee | | | 77 | | | 11 | | | 11 | | | 67 | | | 203 | |
Other | | | 8,516 | | | 603 | | | 5,002 | | | 3,473 | | | 30,961 | |
| |
|
| |
|
| |
|
| |
|
| |
|
| |
Total Liabilities | | | 32,643,529 | | | 131,960 | | | 5,486,600 | | | 3,055,668 | | | 158,017 | |
| |
|
| |
|
| |
|
| |
|
| |
|
| |
|
Net Assets: | | | | | | | | | | | | | | | | |
Applicable to investors’ beneficial interest | | $ | 81,727,877 | | $ | 9,862,202 | | $ | 13,530,986 | | $ | 81,941,512 | | $ | 199,308,910 | |
| |
|
| |
|
| |
|
| |
|
| |
|
| |
Total Investments, at cost | | $ | 118,769,635 | | $ | 14,005,584 | | $ | 20,454,274 | | $ | 104,357,221 | | $ | 318,332,935 | |
| |
|
| |
|
| |
|
| |
|
| |
|
| |
Foreign currency, at cost | | $ | — | | $ | — | | $ | — | | $ | — | | $ | 891,417 | |
| |
|
| |
|
| |
|
| |
|
| |
|
| |
| | |
97 | HSBC INVESTOR PORTFOLIOS | See notes to financial statements. |
HSBC INVESTOR PORTFOLIOS
Statements of Assets and Liabilities—as of October 31, 2008 (continued)
| | | | | | | |
| | Opportunity
Portfolio | | Value
Portfolio | |
|
|
|
|
|
|
Assets: | | | | | | | |
Investments in non-affiliates, at value | | $ | 128,585,734 | | $ | 50,247,110 | |
Interest and dividends receivable | | | 21,479 | | | 63,780 | |
Receivable for investments sold | | | 1,964,302 | | | — | |
Prepaid expenses and other assets | | | 254 | | | 76 | |
| |
|
| |
|
| |
Total Assets | | | 130,571,769 | | | 50,310,966 | |
| |
|
| |
|
| |
|
Liabilities: | | | | | | | |
Payable for investments purchased | | | 2,501,090 | | | 623,619 | |
Accrued expenses and other liabilities: | | | | | | | |
Investment Management | | | 86,166 | | | 20,875 | |
Administration | | | 2,111 | | | 783 | |
Compliance Services | | | 116 | | | 42 | |
Trustee | | | 135 | | | 54 | |
Other | | | 12,512 | | | 2,421 | |
| |
|
| |
|
| |
Total Liabilities | | | 2,602,130 | | | 647,794 | |
| |
|
| |
|
| |
|
Net Assets: | | | | | | | |
Applicable to investors’ beneficial interest | | $ | 127,969,639 | | $ | 49,663,172 | |
| |
|
| |
|
| |
Total Investments, at cost | | $ | 159,201,824 | | $ | 62,864,410 | |
| |
|
| |
|
| |
| | |
See notes to financial statements. | HSBC INVESTOR PORTFOLIOS | 98 |
HSBC INVESTOR PORTFOLIOS
Statements of Operations—For the year ended October 31, 2008
| | | | | | | | | | | | | | | | |
| | Core Plus
Fixed Income
Portfolio | | High Yield
Fixed Income
Portfolio | | Intermediate
Duration
Fixed Income
Portfolio | | Growth
Portfolio | | International
Equity
Portfolio | |
|
|
|
|
|
|
|
|
|
|
|
|
Investment Income: | | | | | | | | | | | | | | | | |
Interest | | $ | 5,571,151 | | $ | 1,238,822 | | $ | 697,529 | | $ | — | | $ | 62,754 | |
Dividends | | | 159,338 | | | 6,169 | | | 37,052 | | | 663,139 | | | 13,819,514 | |
Foreign tax withholding | | | — | | | — | | | — | | | — | | | (1,896,444 | ) |
| |
|
| |
|
| |
|
| |
|
| |
|
| |
Total Investment Income | | | 5,730,489 | | | 1,244,991 | | | 734,581 | | | 663,139 | | | 11,985,824 | |
| |
|
| |
|
| |
|
| |
|
| |
|
| |
|
Expenses: | | | | | | | | | | | | | | | | |
Investment Management | | | 512,368 | | | 80,253 | | | 58,198 | | | 419,329 | | | 2,264,311 | |
Administration | | | 22,821 | | | 2,861 | | | 3,115 | | | 17,490 | | | 75,275 | |
Accounting | | | 68,386 | | | 81,154 | | | 63,439 | | | 53,618 | | | 96,381 | |
Compliance Service | | | 518 | | | 55 | | | 56 | | | 342 | | | 1,769 | |
Custodian | | | 8,469 | | | 1,011 | | | 1,741 | | | 6,991 | | | 187,083 | |
Printing | | | 3,398 | | | 836 | | | 924 | | | 2,767 | | | 11,793 | |
Professional fees | | | 3,277 | | | 712 | | | 338 | | | 2,742 | | | 10,731 | |
Trustee | | | 1,541 | | | 192 | | | 203 | | | 1,175 | | | 5,260 | |
Other | | | 6,134 | | | 833 | | | 3,729 | | | 4,908 | | | 20,989 | |
| |
|
| |
|
| |
|
| |
|
| |
|
| |
Total expenses before fee reductions | | | 626,912 | | | 167,907 | | | 131,743 | | | 509,362 | | | 2,673,592 | |
Fees reduced by Investment Adviser | | | — | | | — | | | — | | | (4,476 | ) | | — | |
| |
|
| |
|
| |
|
| |
|
| |
|
| |
Total Expenses | | | 626,912 | | | 167,907 | | | 131,743 | | | 504,886 | | | 2,673,592 | |
| |
|
| |
|
| |
|
| |
|
| |
|
| |
|
Net Investment Income (Loss) | | | 5,103,577 | | | 1,077,084 | | | 602,838 | | | 158,253 | | | 9,312,232 | |
| |
|
| |
|
| |
|
| |
|
| |
|
| |
|
Net Realized/Unrealized Gains (Losses) from Investments: | | | | | | | | | | | | | | | | |
Net realized gains (losses) from investments and foreign currency transactions | | | (1,716,057 | ) | | (527,678 | ) | | (133,789 | ) | | (145,266 | ) | | 10,348,234 | |
Net realized gains (losses) from futures | | | (44,872 | ) | | — | | | (4,155 | ) | | — | | | — | |
Payment by affiliate for the violation of certain investment policies and limitations | | | — | | | — | | | — | | | 64,658 | | | — | |
Change in unrealized appreciation/depreciation from investments, futures and foreign currencies | | | (12,280,378 | ) | | (4,243,608 | ) | | (1,515,259 | ) | | (42,269,939 | ) | | (242,760,619 | ) |
| |
|
| |
|
| |
|
| |
|
| |
|
| |
|
Net realized/unrealized gains/losses from investment, future and foreign currency transactions | | | (14,041,307 | ) | | (4,771,286 | ) | | (1,653,203 | ) | | (42,350,547 | ) | | (232,412,385 | ) |
| |
|
| |
|
| |
|
| |
|
| |
|
| |
Change In Net Assets Resulting From Operations | | $ | (8,937,730 | ) | $ | (3,694,202 | ) | $ | (1,050,365 | ) | $ | (42,192,294 | ) | $ | (223,100,153 | ) |
| |
|
| |
|
| |
|
| |
|
| |
|
| |
| | |
99 | HSBC INVESTOR PORTFOLIOS | See notes to financial statements. |
HSBC INVESTOR PORTFOLIOS
Statements of Operations—For the year ended October 31, 2008 (continued)
| | | | | | | |
| | Opportunity
Portfolio | | Value
Portfolio | |
|
|
|
|
|
|
Investment Income: | | | | | | | |
Dividends | | $ | 774,001 | | $ | 1,505,621 | |
| |
|
| |
|
| |
Total Investment Income | | | 774,001 | | | 1,505,621 | |
| |
|
| |
|
| |
|
Expenses: | | | | | | | |
Investment Management | | | 1,494,232 | | | 361,899 | |
Administration | | | 39,939 | | | 14,767 | |
Accounting | | | 54,168 | | | 53,235 | |
Compliance Service | | | 660 | | | 279 | |
Custodian | | | 14,652 | | | 3,847 | |
Printing | | | 6,180 | | | 2,131 | |
Professional fees | | | 5,212 | | | 2,028 | |
Trustee | | | 2,470 | | | 1,007 | |
Other | | | 10,784 | | | 4,032 | |
| |
|
| |
|
| |
Total Expenses | | | 1,628,297 | | | 443,225 | |
| |
|
| |
|
| |
|
Net Investment Income (Loss) | | | (854,296 | ) | | 1,062,396 | |
| |
|
| |
|
| |
|
Net Realized/Unrealized Gains (Losses) from Investments: | | | | | | | |
Net realized gains (losses) from investments transactions | | | 2,354,698 | | | (7,776,127 | ) |
Change in unrealized appreciation/depreciation from investments and foreign currencies | | | (73,360,727 | ) | | (25,258,253 | ) |
| |
|
| |
|
| |
|
Net realized/unrealized gains/losses from investment transactions | | | (71,006,029 | ) | | (33,034,380 | ) |
| |
|
| |
|
| |
Change In Net Assets Resulting From Operations | | $ | (71,860,325 | ) | $ | (31,971,984 | ) |
| |
|
| |
|
| |
| | |
See notes to financial statements. | HSBC INVESTOR PORTFOLIOS | 100 |
HSBC INVESTOR PORTFOLIOS
Statements of Changes in Net Assets
| | | | | | | | | | | | | |
| | Core Plus
Fixed Income
Portfolio | | High Yield
Fixed Income
Portfolio | |
|
|
|
|
|
|
| | For the year
ended
October 31,
2008 | | For the year
ended
October 31,
2007 | | For the year
ended
October 31,
2008 | | For the year
ended
October 31,
2007 | |
|
|
|
|
|
|
|
|
|
|
Investment Activities: | | | | | | | | | | | | | |
Operations: | | | | | | | | | | | | | |
Net investment income (loss) | | $ | 5,103,577 | | $ | 5,909,376 | | $ | 1,077,084 | | $ | 931,443 | |
Net realized gains (losses) from investment transactions | | | (1,760,929 | ) | | 2,910,717 | | | (527,678 | ) | | 119,132 | |
Change in unrealized appreciation/depreciation from investments | | | (12,280,378 | ) | | (1,031,793 | ) | | (4,243,608 | ) | | (279,652 | ) |
| |
|
| |
|
| |
|
| |
|
| |
Change in net assets resulting from operations | | | (8,937,730 | ) | | 7,788,300 | | | (3,694,202 | ) | | 770,923 | |
| |
|
| |
|
| |
|
| |
|
| |
Proceeds from contributions | | | 13,894,668 | | | 24,166,324 | | | 3,041,484 | | | 5,258,548 | |
Value of withdrawals | | | (43,040,969 | ) | | (23,334,647 | ) | | (3,972,343 | ) | | (4,260,973 | ) |
| |
|
| |
|
| |
|
| |
|
| |
Change in net assets resulting from transactions in investors’ beneficial interest | | | (29,146,301 | ) | | 831,677 | | | (930,859 | ) | | 997,575 | |
| |
|
| |
|
| |
|
| |
|
| |
Change in net assets | | | (38,084,031 | ) | | 8,619,977 | | | (4,625,061 | ) | | 1,768,498 | |
| | | | | | | | | | | | | |
Net Assets: | | | | | | | | | | | | | |
Beginning of period | | | 119,811,908 | | | 111,191,931 | | | 14,487,263 | | | 12,718,765 | |
| |
|
| |
|
| |
|
| |
|
| |
End of period | | $ | 81,727,877 | | $ | 119,811,908 | | $ | 9,862,202 | | $ | 14,487,263 | |
| |
|
| |
|
| |
|
| |
|
| |
| | |
101 | HSBC INVESTOR PORTFOLIOS | See notes to financial statements. |
HSBC INVESTOR PORTFOLIOS
Statements of Changes in Net Assets (continued)
| | | | | | | |
| | Intermediate Duration
Fixed Income
Portfolio | |
|
|
|
|
| | For the year
ended
October 31,
2008 | | For the year
ended
October 31,
2007 | |
|
|
|
|
|
|
Investment Activities: | | | | | | | |
Operations: | | | | | | | |
Net investment income (loss) | | $ | 602,838 | | $ | 882,974 | |
Net realized gains (losses) from investment transactions | | | (137,944 | ) | | 848,391 | |
Change in unrealized appreciation/depreciation from investments | | | (1,515,259 | ) | | (182,994 | ) |
| |
|
| |
|
| |
Change in net assets resulting from operations | | | (1,050,365 | ) | | 1,548,371 | |
| |
|
| |
|
| |
Proceeds from contributions | | | 3,554,894 | | | 2,605,895 | |
Value of withdrawals | | | (4,032,112 | ) | | (8,612,265 | ) |
| |
|
| |
|
| |
Change in net assets resulting from transactions in investors’ beneficial interest | | | (477,218 | ) | | (6,006,370 | ) |
| |
|
| |
|
| |
Change in net assets | | | (1,527,583 | ) | | (4,457,999 | ) |
| | | | | | | |
Net Assets: | | | | | | | |
Beginning of period | | | 15,058,569 | | | 19,516,568 | |
| |
|
| |
|
| |
End of period | | $ | 13,530,986 | | $ | 15,058,569 | |
| |
|
| |
|
| |
| | |
See notes to financial statements. | HSBC INVESTOR PORTFOLIOS | 102 |
HSBC INVESTOR PORTFOLIOS
Statements of Changes in Net Assets (continued)
| | | | | | | | | | | | | |
| | Growth
Portfolio | | International Equity
Portfolio | |
|
|
|
|
|
|
| | For the year
ended
October 31,
2008 | | For the year
ended
October 31,
2007 | | For the year
ended
October 31,
2008 | | For the year
ended
October 31,
2007 | |
|
|
|
|
|
|
|
|
|
|
Investment Activities: | | | | | | | | | | | | | |
Operations: | | | | | | | | | | | | | |
Net investment income (loss) | | $ | 158,253 | | $ | 334,013 | | $ | 9,312,232 | | $ | 8,527,724 | |
Net realized gains (losses) from investment transactions | | | (80,608 | ) | | 4,271,356 | | | 10,348,234 | | | 36,079,080 | |
Change in unrealized appreciation/depreciation from investments and foreign currencies | | | (42,269,939 | ) | | 16,611,654 | | | (242,760,619 | ) | | 42,586,569 | |
| |
|
| |
|
| |
|
| |
|
| |
Change in net assets resulting from operations | | | (42,192,294 | ) | | 21,217,023 | | | (223,100,153 | ) | | 87,193,373 | |
| |
|
| |
|
| |
|
| |
|
| |
Proceeds from contributions | | | 50,198,227 | | | 25,944,124 | | | 43,694,202 | | | 90,634,524 | |
Value of withdrawals | | | (15,750,298 | ) | | (17,303,034 | ) | | (76,346,748 | ) | | (56,520,981 | ) |
| |
|
| |
|
| |
|
| |
|
| |
Change in net assets resulting from transactions in investors’ beneficial interest | | | 34,447,929 | | | 8,641,090 | | | (32,652,546 | ) | | 34,113,543 | |
| |
|
| |
|
| |
|
| |
|
| |
Change in net assets | | | (7,744,365 | ) | | 29,858,113 | | | (255,752,699 | ) | | 121,306,916 | |
|
Net Assets: | | | | | | | | | | | | | |
Beginning of period | | | 89,685,877 | | | 59,827,764 | | | 455,061,609 | | | 333,754,693 | |
| |
|
| |
|
| |
|
| |
|
| |
End of period | | $ | 81,941,512 | | $ | 89,685,877 | | $ | 199,308,910 | | $ | 455,061,609 | |
| |
|
| |
|
| |
|
| |
|
| |
| | |
103 | HSBC INVESTOR PORTFOLIOS | See notes to financial statements. |
HSBC INVESTOR PORTFOLIOS
Statements of Changes in Net Assets (continued)
| | | | | | | | | | | | | |
| | Opportunity
Portfolio | | Value
Portfolio | |
|
|
|
|
|
|
| | For the year
ended
October 31,
2008 | | For the year
ended
October 31,
2007 | | For the year
ended
October 31,
2008 | | For the year
ended
October 31,
2007 | |
|
|
|
|
|
|
|
|
|
|
Investment Activities: | | | | | | | | | | | | | |
Operations: | | | | | | | | | | | | | |
Net investment income (loss) | | $ | (854,296 | ) | $ | (1,201,508 | ) | $ | 1,062,396 | | $ | 992,431 | |
Net realized gains (losses) from investment transactions | | | 2,354,698 | | | 58,390,322 | | | (7,776,127 | ) | | 6,083,399 | |
Change in unrealized appreciation/depreciation from investments | | | (73,360,727 | ) | | 1,890,389 | | | (25,258,253 | ) | | 71,241 | |
| |
|
| |
|
| |
|
| |
|
| |
| | | | | | | | | | | | | |
Change in net assets resulting from operations | | | (71,860,325 | ) | | 59,079,203 | | | (31,971,984 | ) | | 7,147,071 | |
| |
|
| |
|
| |
|
| |
|
| |
Proceeds from contributions | | | 20,402,348 | | | 77,393,032 | | | 12,224,588 | | | 23,927,675 | |
Value of withdrawals | | | (44,840,850 | ) | | (153,698,612 | ) | | (13,247,672 | ) | | (15,848,601 | ) |
| |
|
| |
|
| |
|
| |
|
| |
Change in net assets resulting from transactions in investors’ beneficial interest | | | (24,438,502 | ) | | (76,305,580 | ) | | (1,023,084 | ) | | 8,079,074 | |
| |
|
| |
|
| |
|
| |
|
| |
Change in net assets | | | (96,298,827 | ) | | (17,226,377 | ) | | (32,995,068 | ) | | 15,226,145 | |
| | | | | | | | | | | | | |
Net Assets: | | | | | | | | | | | | | |
Beginning of period | | | 224,268,466 | | | 241,494,843 | | | 82,658,240 | | | 67,432,095 | |
| |
|
| |
|
| |
|
| |
|
| |
End of period | | $ | 127,969,639 | | $ | 224,268,466 | | $ | 49,663,172 | | $ | 82,658,240 | |
| |
|
| |
|
| |
|
| |
|
| |
| | |
See notes to financial statements. | HSBC INVESTOR PORTFOLIOS | 104 |
|
HSBC INVESTOR PORTFOLIOS |
|
Financial Highlights |
| | | | | | | | | | | | | | | | | | | |
| | | | | Ratios/Supplementary Data | |
| | | | |
|
|
| | Total
Return(a) | | Net Assets
at End of
Period
(000’s) | | Ratio of Net
Expenses
to Average
Net Assets(b) | | Ratio of Net
Investment
Income (Loss)
to Average
Net Assets(b) | | Ratio of
Expenses
to Average
Net Assets(b)(c) | | Portfolio
Turnover
Rate(a) | |
|
|
|
|
|
|
|
|
|
|
|
|
|
|
|
|
|
|
|
|
CORE PLUS FIXED INCOME PORTFOLIO | | | | | | | | | | | | | | | | | | | |
Year Ended October 31, 2004 | | | 5.56 | % | $ | 169,459 | | | 0.52 | % | | 4.31 | % | | 0.52 | % | | 34.88 | % |
Year Ended October 31, 2005 | | | 1.64 | %(d) | | 122,530 | | | 0.40 | %(d) | | 4.25 | %(d) | | 0.53 | % | | 176.60 | % |
Year Ended October 31, 2006 | | | 5.55 | % | | 111,192 | | | 0.63 | % | | 4.96 | % | | 0.63 | % | | 273.91 | % |
Year Ended October 31, 2007 | | | 6.94 | % | | 119,812 | | | 0.59 | % | | 4.99 | % | | 0.59 | % | | 252.56 | % |
Year Ended October 31, 2008 | | | (8.78 | )% | | 81,728 | | | 0.59 | % | | 4.80 | % | | 0.59 | % | | 119.38 | % |
|
|
|
|
|
|
|
|
|
|
|
|
|
|
|
|
|
|
|
|
HIGH YIELD FIXED INCOME PORTFOLIO | | | | | | | | | | | | | | | | | | | |
Period Ended October 31, 2006(f) | | | 7.41 | % | $ | 12,719 | | | 1.86 | % | | 6.33 | % | | 1.86 | % | | 13.61 | % |
Year Ended October 31, 2007 | | | 6.41 | % | | 14,487 | | | 1.37 | % | | 7.12 | % | | 1.37 | % | | 30.77 | % |
Year Ended October 31, 2008 | | | (26.32 | )% | | 9,862 | | | 1.26 | % | | 8.06 | % | | 1.26 | % | | 24.10 | % |
|
|
|
|
|
|
|
|
|
|
|
|
|
|
|
|
|
|
|
|
INTERMEDIATE DURATION FIXED INCOME PORTFOLIO | | | | | | | | | | | | | | | | | | | |
Year Ended October 31, 2004 | | | 4.48 | % | $ | 63,697 | | | 0.57 | % | | 3.54 | % | | 0.57 | % | | 50.06 | % |
Year Ended October 31, 2005 | | | 0.76 | %(d) | | 32,810 | | | 0.49 | %(d) | | 3.85 | %(d) | | 0.58 | % | | 107.26 | % |
Year Ended October 31, 2006 | | | 5.29 | % | | 19,517 | | | 0.78 | % | | 4.58 | % | | 0.78 | % | | 236.51 | % |
Year Ended October 31, 2007 | | | 8.38 | % | | 15,059 | | | 0.84 | % | | 4.68 | % | | 0.84 | % | | 219.76 | % |
Year Ended October 31, 2008 | | | (7.08 | )% | | 13,531 | | | 0.91 | % | | 4.15 | % | | 0.91 | % | | 124.23 | % |
|
|
|
|
|
|
|
|
|
|
|
|
|
|
|
|
|
|
|
|
GROWTH PORTFOLIO | | | | | | | | | | | | | | | | | | | |
Period Ended October 31, 2004(f) | | | (0.86 | )% | $ | 49,680 | | | 0.72 | % | | 0.06 | % | | 0.72 | % | | 53.08 | % |
Year Ended October 31, 2005 | | | 13.59 | %(d) | | 49,415 | | | 0.63 | %(d) | | 0.77 | %(d) | | 0.68 | % | | 79.54 | % |
Year Ended October 31, 2006 | | | 7.53 | % | | 59,828 | | | 0.69 | % | | 0.38 | % | | 0.69 | % | | 75.06 | % |
Year Ended October 31, 2007 | | | 31.11 | % | | 89,686 | | | 0.62 | % | | 0.45 | % | | 0.62 | % | | 57.04 | % |
Year Ended October 31, 2008 | | | (37.75 | )%(e) | | 81,942 | | | 0.62 | % | | 0.19 | % | | 0.62 | % | | 157.87 | % |
|
|
|
|
|
|
|
|
|
|
|
|
|
|
|
|
|
|
|
|
INTERNATIONAL EQUITY PORTFOLIO | | | | | | | | | | | | | | | | | | | |
Year Ended October 31, 2004 | | | 20.29 | % | $ | 220,025 | | | 0.94 | % | | 1.53 | % | | 0.94 | % | | 106.11 | % |
Year Ended October 31, 2005 | | | 19.54 | % | | 230,230 | | | 0.84 | % | | 1.92 | % | | 0.84 | % | | 31.32 | % |
Year Ended October 31, 2006 | | | 32.79 | % | | 333,755 | | | 0.86 | % | | 2.03 | % | | 0.86 | % | | 33.39 | % |
Year Ended October 31, 2007 | | | 25.17 | % | | 455,062 | | | 0.79 | % | | 2.16 | % | | 0.79 | % | | 26.08 | % |
Year Ended October 31, 2008 | | | (51.95 | )% | | 199,309 | | | 0.76 | % | | 2.65 | % | | 0.76 | % | | 28.98 | % |
|
|
|
|
|
|
|
|
|
|
|
|
|
|
|
|
|
|
|
|
OPPORTUNITY PORTFOLIO | | | | | | | | | | | | | | | | | | | |
Year Ended October 31, 2004 | | | 5.93 | % | $ | 359,333 | | | 0.88 | % | | (0.52 | )% | | 0.88 | % | | 81.75 | % |
Year Ended October 31, 2005 | | | 14.35 | %(d) | | 218,778 | | | 0.85 | %(d) | | (0.45 | )%(d) | | 0.90 | % | | 63.95 | % |
Year Ended October 31, 2006 | | | 19.54 | % | | 241,495 | | | 0.91 | % | | (0.40 | )% | | 0.91 | % | | 60.83 | % |
Year Ended October 31, 2007 | | | 30.54 | % | | 224,268 | | | 0.91 | % | | (0.55 | )% | | 0.91 | % | | 69.41 | % |
Year Ended October 31, 2008 | | | (35.30 | )% | | 127,970 | | | 0.87 | % | | (0.46 | )% | | 0.87 | % | | 80.42 | % |
|
|
|
|
|
|
|
|
|
|
|
|
|
|
|
|
|
|
|
|
VALUE PORTFOLIO | | | | | | | | | | | | | | | | | | | |
Period Ended October 31, 2004(f) | | | 6.12 | % | $ | 61,414 | | | 0.71 | % | | 1.28 | % | | 0.71 | % | | 10.33 | % |
Year Ended October 31, 2005 | | | 15.23 | %(d) | | 54,150 | | | 0.64 | %(d) | | 1.15 | %(d) | | 0.69 | % | | 16.45 | % |
Year Ended October 31, 2006 | | | 22.21 | % | | 67,432 | | | 0.71 | % | | 1.23 | % | | 0.71 | % | | 20.63 | % |
Year Ended October 31, 2007 | | | 10.28 | % | | 82,658 | | | 0.66 | % | | 1.29 | % | | 0.66 | % | | 18.67 | % |
Year Ended October 31, 2008 | | | (39.91 | )% | | 49,663 | | | 0.64 | % | | 1.54 | % | | 0.64 | % | | 24.61 | % |
|
|
|
|
|
|
|
|
|
|
|
|
|
|
|
|
|
|
|
|
| |
(a) | Not annualized for periods less than one year. |
| |
(b) | Annualized for periods less than one year. |
| |
(c) | During the period, certain fees were reduced. If such fee reductions had not occurred, the ratio would have been as indicated. |
| |
(d) | During the year ended October 31, 2005, HSBC reimbursed certain amounts to the Portfolios related to violations of certain investment policies and limitations. The corresponding impact to the net expense ratio, net income ratio and total return were 0.12%, 0.09%, 0.05%, 0.04% and 0.05% for the Core Plus Fixed Income Portfolio, Intermediate Duration Fixed Income Portfolio, Growth Portfolio, Opportunity Portfolio and Value Portfolio, respectively. |
| |
(e) | During the year ended October 31, 2008, Winslow Capital Management, Inc. reimbursed $64,658 to the Portfolio related to violations of certain investment policies and limitations. The corresponding impact to the total return was 0.08%. |
| |
(f) | High Yield Fixed Income Portfolio commenced operations on November 18, 2005. |
| |
| Growth Portfolio commenced operations on May 7, 2004. |
| |
| Value Portfolio commenced operations on May 7, 2004. |
| | |
105 | HSBC INVESTOR PORTFOLIOS | See notes to financial statements. |
|
HSBC INVESTOR PORTFOLIOS |
|
Notes to Financial Statements—as of October 31, 2008 |
| |
1. | Organization: |
| |
| The HSBC Investor Portfolios (the “Portfolio Trust”), is an open-end management investment company organized as a New York trust under the laws of the State of New York on November 1, 1994. The Portfolio Trust contains the following master funds (individually a “Portfolio,” collectively the “Portfolios”): |
| | |
Portfolio | | Short Name |
| |
|
HSBC Investor Core Plus Fixed Income Portfolio | | Core Plus Fixed Income Portfolio |
HSBC Investor High Yield Fixed Income Portfolio | | High Yield Fixed Income Portfolio |
HSBC Investor Intermediate Duration Fixed Income Portfolio | | Intermediate Duration Fixed Income Portfolio |
HSBC Investor Growth Portfolio | | Growth Portfolio |
HSBC Investor International Equity Portfolio | | International Equity Portfolio |
HSBC Investor Opportunity Portfolio | | Opportunity Portfolio |
HSBC Investor Value Portfolio | | Value Portfolio |
| |
| The Portfolios operate as master funds in master-feeder arrangements, in which other funds invest all of their investable assets in the Portfolios. The Declaration of Trust permits the Board of Trustees to issue an unlimited number of beneficial interests in the Portfolios. |
| |
| The Portfolios are diversified series of the Portfolio Trust and are part of the HSBC Investor Family of Funds. Financial statements for all other funds of the HSBC Investor Family of Funds are published separately. |
| |
| Under the Portfolio Trust’s organizational documents, the Portfolios’ Officers and Trustees are indemnified against certain liabilities arising out of the performance of their duties to the Portfolios. In addition, in the normal course of business, the Portfolios may enter into contracts with their service providers, which also provide for indemnifications by the Portfolios. The Portfolios’ maximum exposure under these arrangements is unknown as this would involve any future claims that may be made against the Portfolios. However, based on experience, the Portfolios expect that risk of loss to be remote. |
| |
2. | Significant Accounting Policies: |
| |
| The following is a summary of the significant accounting policies followed by the Portfolios in the preparation of their financial statements. The policies are in conformity with U.S. generally accepted accounting principles (“GAAP”). The preparation of financial statements requires management to make estimates and assumptions that affect the reported amounts of assets and liabilities and disclosure of contingent assets and liabilities at the date of the financial statements and the reported amounts of income and expenses for the period. Actual results could differ from those estimates. |
| |
Securities Valuation: |
| |
| Bonds and other fixed income securities (other than short-term obligations but including listed issues) are valued on the basis of valuations furnished by a pricing service, the use of which has been approved by the Portfolios’ Board of Trustees. In making such valuations, the pricing service utilizes both dealer-supplied valuations and the use of matrix techniques which take into account appropriate factors such as institutional-size trading in similar groups of securities, yield, quality, coupon rate, maturity, type of issue, trading characteristics other than market data and without exclusive reliance upon quoted prices or exchanges or over-the-counter prices, since such valuations are believed to reflect more accurately the fair value of such securities. |
| |
| The value of each equity security is based either on the last sale price on a national securities exchange, or in the absence of recorded sales, at the closing bid prices on such exchanges, or at the quoted bid price in the over-the-counter market. Securities or other assets for which market quotations are not readily available, or are deemed unreliable due to a significant event or otherwise, are valued by or at the direction of the Portfolios’ Board of Trustees. Examples of potentially significant events that could affect the value of an individual security include corporate actions by the issuer, announcements by the issuer relating to its earnings or products, regulatory news, natural disasters, and litigation. Examples of potentially significant events that could affect multiple securities held by a Portfolio include governmental actions, natu- |
| |
HSBC INVESTOR PORTFOLIOS | 106 |
|
HSBC INVESTOR PORTFOLIOS |
|
Notes to Financial Statements—as of October 31, 2008 (continued) |
| |
| ral disasters, and armed conflicts. In addition, if events materially affecting the value of foreign securities occur between the time when the exchange on which they are traded closes and the time when the Portfolios’ net assets are calculated, such securities may be valued using fair value pricing in accordance with procedures adopted by the Board of Trustees. Management identifies possible fluctuations in foreign securities by monitoring the rise or fall in the value of a designated benchmark index. In the event of a rise or fall greater than predetermined levels, the International Equity Portfolio may use a systematic valuation model provided by an independent third party to value its foreign securities, rather than local market closing prices. When the International Equity Portfolio uses such a valuation model, the value assigned to the International Equity Portfolio’s foreign securities may not be the quoted or published prices of the investment on their primary markets or exchanges. |
| |
Investment Transactions and Related Income: |
| |
| Investment transactions are accounted for no later than one business day after trade date. For financial reporting purposes, changes in holdings are accounted for on trade date on the last business day of the reporting period. Investment gains and losses are calculated on the identified cost basis. Interest income is recognized on the accrual basis and includes, where applicable, the amortization or accretion of premium or discount. Dividend income is recorded on the ex-dividend date. |
|
Foreign Currency Translation: |
| |
| The accounting records of the Portfolios are maintained in U.S. dollars. Foreign currency amounts are translated into U.S. dollars at the current rate of exchange to determine the value of investments, assets and liabilities. Purchases and sales of securities, and income and expenses are translated at the prevailing rate of exchange on the respective dates of such transactions. The Portfolios do not isolate the portion of the results of operations resulting from changes in foreign exchange rates on investments from fluctuations arising from changes in market prices of securities held. Such fluctuations are included with the net realized and unrealized gain or loss from investments and foreign currencies. |
|
Forward Foreign Currency Exchange Contracts: |
| |
| The Portfolios may enter into forward foreign currency exchange contracts in connection with planned purchases or sales of securities or to hedge the U.S. dollar value of portfolio securities denominated in a particular currency. The Portfolios could be exposed to risks if the counterparties to the contracts are unable to meet the terms of their contracts and from unanticipated movements in the value of a foreign currency relative to the U.S. dollar. The forward foreign currency exchange contracts are adjusted by the daily exchange rate of the underlying currency and any gains or losses are recorded for financial statement purposes as unrealized gains or losses until the contract settlement date. |
|
Futures Contracts: |
| |
| Each Portfolio may invest in futures contracts for the purpose of hedging their existing portfolio securities or securities it intends to purchase against fluctuations in fair value caused by changes in prevailing market interest rates. Upon entering into a futures contract, the Portfolio is required to pledge to the broker an amount of cash and/or other assets equal to a certain percentage of the contract amount (initial margin deposit). Subsequent payments, known as “variation margin,” are made or received by the Portfolio each day, depending on the daily fluctuations in the fair value of the underlying security. The Portfolio recognizes a gain or loss equal to the daily variation margin. Should market conditions move unexpectedly, the Portfolio may not achieve the anticipated benefits of the futures contracts and may realize a loss. The use of futures transactions involves the risk of imperfect correlation in movements in the price of futures contracts, interest rates, and the underlying hedged assets. The Core Plus Fixed Income Portfolio and the Intermediate Duration Fixed Income Portfolio had the following open futures contracts at October 31, 2008: |
| |
107 | HSBC INVESTOR PORTFOLIOS |
|
HSBC INVESTOR PORTFOLIOS |
|
Notes to Financial Statements—as of October 31, 2008 (continued) |
| | | | | | | | |
| | | Position | | Contracts | | Unrealized
Appreciation
(Depreciation)($) | |
| | |
| |
| |
| |
| Core Plus Fixed Income Portfolio | | | | | | | |
| US Treasury Two Year Note Futures Contract expiring December 31, 2008 (Notional Value At $5,155,870) | | Long | | 24 | | 63,375 | |
| | | | | | | | |
| US Treasury Ten Year Note Futures Contract expiring December 31, 2008 (Notional Value At $7,463,156) | | Short | | 66 | | 165,516 | |
| | | | | | | | |
| Intermediate Duration Fixed Income Portfolio | | | | | | | |
| US Treasury Two Year Note Futures Contract expiring December 31, 2008 (Notional Value At $1,288,969) | | Long | | 6 | | 15,844 | |
| | | | | | | | |
| US Treasury Ten Year Note Futures Contract expiring December 31, 2008 (Notional Value At $1,356,938) | | Short | | 12 | | 30,094 | |
| |
Mortgage Dollar Roll Transactions: |
| |
| The Core Plus Fixed Income Portfolio, the High Yield Fixed Income Portfolio and the Intermediate Duration Fixed Income Portfolio may engage in dollar roll transactions with respect to mortgage securities issued by the Government National Mortgage Association, the Federal National Mortgage Association and the Federal Home Loan Mortgage Corporation. In a dollar roll transaction, the Portfolio sells a mortgage-backed security and simultaneously agrees to repurchase a similar security on a specified future date at an agreed upon price. During the roll period, the Portfolio will not be entitled to receive any interest or principal paid on the securities sold. The Portfolio is compensated for the lost interest on the securities sold by the difference between the sales price and the lower price for the future repurchase as well as by the interest earned on the reinvestment of the sales proceeds. The Portfolio may also be compensated by receipt of a commitment fee. |
| |
Restricted and Illiquid Securities: |
| |
| A restricted security is a security which has been purchased through a private offering and cannot be resold to the general public without prior registration under the Securities Act of 1933 (the “1933 Act’’) or pursuant to the resale limitations provided by Rule 144 under the 1933 Act, or an exemption from the registration requirements of the 1933 Act. Certain restricted securities may be resold in transactions exempt from registration, normally to qualified institutional buyers, and may be deemed liquid by the investment adviser based on procedures established by the Board of Trustees. Therefore, not all restricted securities are considered illiquid. At October 31, 2008 the HSBC Core Plus Fixed Income Portfolio held restricted securities that were illiquid, representing 0.03% of net assets, as follows: |
| | | | | | | | | | | |
| Security Name | | Acquisition
Date | | Acquisition
Cost($) | | Principal
Amount($) | | Value($) | |
|
| |
| |
| |
| |
| |
| DLJ Mortgage Acceptance Corp. IO, Series 1997-CFI, Class S, 1.19%, 5/15/30 | | 5/16/1997 | | 1,344 | | | 17,984 | | 1 | |
| | | | | | | | | | | |
| FHA Weyerhauser, 7.43%, 1/1/24 | | 3/28/2002 | | 24,933 | | | 26,158 | | 26,158 | |
| | | | | | | | | | | |
| GS Mortgage Securities Corp. IO, Series 1997-GL, Class X2, 0.29 7/13/30 | | 8/14/1997 | | 1,349 | | | 35,694 | | 414 | |
Repurchase Agreements:
| |
| The Portfolios may enter into repurchase agreements with an entity which is a member of the Federal Reserve System or which is a “primary dealer’’ (as designated by the Federal Reserve Bank of New York) in U.S. Government obligations. The repurchase price generally equals the price paid by a Portfolio plus interest negotiated on the basis of current short-term rates, which may be more or less than the rate on the underlying portfolio securities. The seller, under a repurchase agreement, is required to maintain the collateral held pursuant to the agreement, with a fair value equal to or greater than the repurchase price (including accrued interest). Collateral subject to repurchase agreements is held by the Portfolios’ Custodian or another qualified Custodian or in the Federal Reserve/Treasury book-entry system. In the event of counter-party default, the Portfolio has the right to use the collateral to offset losses incurred. There is a potential for loss to the Portfolio in the event the Portfolio is delayed or prevented from exercising its rights to dispose of the collateral securities, including the risk of a possible decline in the fair value of the underlying securities during the period while the Portfolio seeks to assert its rights. |
| |
HSBC INVESTOR PORTFOLIOS | 108 |
|
HSBC INVESTOR PORTFOLIOS |
|
Notes to Financial Statements—as of October 31, 2008 (continued) |
| |
Expense Allocations: |
|
| Expenses directly attributable to a Portfolio are charged to that Portfolio. Expenses not directly attributable to a Portfolio are allocated proportionally among various or all funds within the HSBC Investor Family of Funds in relation to net assets or on another reasonable basis. |
| |
Federal Income Taxes: |
| |
| Each Portfolio will be treated as a partnership for U.S. Federal income tax purposes. Accordingly, each Portfolio passes through all of its net investment income and gains and losses to its feeder funds, and is therefore not subject to U.S. Federal income tax. As such, investors in the Portfolios will be taxed on their respective share of the Portfolios’ ordinary income and realized gains. It is intended that the Portfolios will be managed in such a way that an investor will be able to satisfy the requirements of the Internal Revenue Code applicable to regulated investment companies. |
| |
| In addition, effective April 30, 2008, the Trust adopted Financial Accounting Standards Board Interpretation No. 48, Accounting for Uncertainty in Income Taxes (“FIN 48”). FIN 48 provides guidance for how uncertain tax positions should be recognized, measured, presented and disclosed in the financial statements. FIN 48 requires the affirmative evaluation of tax positions taken or expected to be taken in the course of preparing the Portfolio Trust’s tax returns to determine whether it is more-likely-than-not (i.e., greater than 50-percent) that each tax position will be sustained upon examination by a taxing authority based on the technical merits of the position. A tax position that meets the more-likely-than-not recognition threshold is measured to determine the amount of benefit to recognize in the financial statements. Differences between tax positions taken in a tax return and amounts recognized in the financial statements will generally result in an increase in a liability for taxes payable (or a reduction of a tax refund receivable), including the recognition of any related interest and penalties as an operating expense. Implementation of FIN 48 included a review of tax positions taken in tax years that remain subject to examination by tax authorities in all major tax jurisdictions, including federal (i.e., the last 4 tax year ends and the interim tax period since then, as applicable). The adoption of FIN 48 did not impact the Portfolios’ net assets or results of operations. |
| |
New Accounting Pronouncements: |
|
| In September 2006, the Financial Accounting Standards Board (“FASB”) issued Statement on Financial Accounting Standards (“SFAS”) No. 157, “Fair Value Measurements” (“SFAS No. 157”). This standard establishes a single authoritative definition of fair value, sets out a framework for measuring fair value and requires additional disclosures about fair value measurements. SFAS No. 157 applies to fair value measurements already required or permitted by existing standards. SFAS No. 157 is effective for financial statements issued for fiscal years beginning after November 15, 2007 and interim periods within those fiscal years. The changes to current generally accepted accounting principles from the application of this Statement relate to the definition of fair value, the methods used to measure fair value, and the expanded disclosures about fair value measurements. Effective November 1, 2008 the Trust adopted SFAS No. 157. The adoption of this standard did not have an impact to the net assets or results of operations of the Fund, however, additional disclosures will be required about the inputs used to develop fair value measurements and the effect of certain measurements on the changes in net assets in fiscal reporting periods subsequent to the adoption date. |
| |
| In March 2008, the FASB issued the SFAS No. 161, “Disclosures about Derivative Instruments and Hedging Activities” (“SFAS 161”). SFAS 161 is effective for fiscal years and interim periods beginning after November 15, 2008. SFAS 161 requires enhanced disclosures about the Fund’s derivative and hedging activities, including how such activities are accounted for and their effect on the Portfolio’s financial position, performance and cash flows. Management is currently evaluating the impact, the adoption of SFAS 161 will have on the Funds’ financial statements and related disclosures. |
| |
109 | HSBC INVESTOR PORTFOLIOS |
|
HSBC INVESTOR PORTFOLIOS |
|
Notes to Financial Statements—as of October 31, 2008 (continued) |
| |
3. | Related Party Transactions: |
|
Investment Management: |
| |
| HSBC Global Asset Management (USA) Inc. (“HSBC’’ or the “Investment Adviser’’), a wholly owned subsidiary of HSBC Bank USA, N.A., a national bank organized under the laws of the United States, acts as the Investment Adviser to the Portfolios pursuant to an investment management contract with the Portfolio Trust. As Investment Adviser, HSBC manages the investments of the Portfolios and continuously reviews, supervises, and administers the Portfolios’ investments, except that Winslow Capital Management, Inc., AllianceBernstein Investment Research and Management, Westfield Capital Management, LLC and NWQ Investment Management Co., LLC serve as Sub-Investment Advisers for the Growth Portfolio, International Equity Portfolio, Opportunity Portfolio, and the Value Portfolio, respectively, and are paid for their services directly by the respective Portfolios. |
| |
| For its services, the Investment Adviser receives a fee, accrued daily and paid monthly, at an annual rate of 0.60% of the High Yield Fixed Income Portfolio’s average daily net assets and 0.40% of the Intermediate Duration Fixed Income Portfolio’s average daily net assets. Halbis Capital Management, a wholly owned subsidiary of Halbis Capital Management (UK) Limited an affiliate of the Investment Adviser, serves as the Sub-Investment Advisor and is paid by the Investment Adviser. |
| |
| For its services as Investment Adviser, HSBC receives, from the Core Plus Fixed Income Portfolio, a fee, accrued daily and paid monthly, at an annual rate of: |
| | | |
| Based on Average Daily Net Assets of | | Fee Rate |
|
| |
|
| Up to $50 million | | 0.575% |
| In excess of $50 million but not exceeding $95 million | | 0.450% |
| In excess of $95 million but not exceeding $150 million | | 0.200% |
| In excess of $150 million but not exceeding $250 million | | 0.400% |
| In excess of $250 million | | 0.350% |
| |
| Effective May 12, 2008, Winslow Capital Management, Inc. (“Winslow”) serves as the Sub-Adviser to the Growth Portfolio. For their services, the Investment Adviser and Winslow Capital Management, Inc. receive in aggregate, from the Growth Portfolio, a fee, accrued daily and paid monthly, at an annual rate of: |
| | | |
| Based on Sub-Advised HSBC Investor Family of Funds Average Daily Net Assets of | | Fee Rate |
|
| |
|
| Up to $250 million | | 0.400% |
| In excess of $250 million but not exceeding $500 million | | 0.350% |
| In excess of $500 million but not exceeding $750 million | | 0.300% |
| In excess of $750 million but not exceeding $1 billion | | 0.250% |
| In excess of $1 billion | | 0.200% |
| |
| Prior to May 12, 2008, Waddell and Reed Investment Management Company(“Waddell & Reed”) served as the Sub-Adviser to the Growth Portfolio. For their services, the Investment Adviser and Waddell & Reed Investment Management Company receive in aggregate, from the Growth Portfolio, a fee, accrued daily and paid monthly, at an annual rate of: |
| | | |
| Based on Average Daily Net Assets of | | Fee Rate |
|
| |
|
| Up to $50 million | | 0.500% |
| In excess of $50 million but not exceeding $100 million | | 0.425% |
| In excess of $100 million but not exceeding $200 million | | 0.375% |
| In excess of $200 million | | 0.325% |
| |
| For their services, the Investment Adviser and AllianceBernstein Investment Research and Management receive in aggregate, from the International Equity Portfolio, a fee, accrued daily and paid monthly, at an annual rate of: |
| | | | |
| Based on Average Daily Net Assets of: | | Fee Rate |
|
| |
|
| Up to $10 million | | 1.015 | % |
| In excess of $10 million but not exceeding $25 million | | 0.925 | % |
| In excess of $25 million but not exceeding $50 million | | 0.79 | % |
| In excess of $50 million but not exceeding $100 million | | 0.70 | % |
| In excess of $100 million | | 0.61 | % |
| |
HSBC INVESTOR PORTFOLIOS | 110 |
|
HSBC INVESTOR PORTFOLIOS |
|
Notes to Financial Statements—as of October 31, 2008 (continued) |
| |
| For their services, the Investment Adviser and Westfield Capital Management, LLC receive in aggregate, a fee, accrued daily and paid monthly, at an annual rate of 0.80% of the Opportunity Portfolio’s average daily net assets. |
| |
| For their services, the Investment Adviser and NWQ Investment Management Co., LLC receive in aggregate, from the Value Portfolio, a fee, accrued daily and paid monthly, at an annual rate of: |
| | | |
| Based on Average Daily Net Assets of | | Fee Rate |
|
| |
|
| Up to $500 million | | 0.525% |
| In excess of $500 million but not exceeding $1 billion | | 0.475% |
| In excess of $1 billion | | 0.425% |
| |
| All contractual and any voluntary fee waivers/reimbursements are not subject to recoupment in subsequent fiscal periods. Voluntary waiver/reimbursements may be stopped at any time. |
| |
Administration: |
| |
| HSBC serves the Portfolios as Administrator. Under the terms of the Administration Agreement, HSBC receives from the Portfolios a fee, accrued daily and paid monthly, at an annual rate of: |
| | | |
| Based on Average Daily Net Assets of | | Fee Rate |
|
| |
|
| Up to $12 billion | | 0.0525% |
| In excess of $12 billion | | 0.0350% |
| |
| The fee rates and breakpoints are determined on the basis of the aggregate average daily net assets of the HSBC Investor Family of Funds, however, the assets of the Portfolios and Feeder Funds that invest in the Portfolios are not double-counted. The total administration fee paid to HSBC is allocated to each series in the HSBC Investor Family of Funds based upon its proportionate share of the aggregate net assets of the Family of Funds. For assets invested in the Portfolios by Feeder Funds, the Portfolios pay half of the administration fee and the Feeder Funds pay half of the administration fee, for a combination of the total fee rate set forth above. |
| |
| Pursuant to a Sub-Administration Agreement with HSBC, Citi Fund Services Ohio, Inc. (“Citi Ohio’’), a wholly-owned subsidiary of The Citigroup, Inc., serves as the Portfolio Trust’s Sub-Administrator subject to the general supervision of the Portfolio Trust’s Board of Trustees and HSBC. For these services, Citi Ohio is entitled to a fee, payable by HSBC, at an annual rate equivalent to the fee rates set forth above, minus 0.02% (2 basis points) which is retained by HSBC. |
| |
| Under a Compliance Services Agreement between the Portfolios and Citi Ohio (the “CCO Agreement’’), Citi Ohio makes an employee available to serve as the Portfolios’ Chief Compliance Officer (the “CCO’’). Under the CCO Agreement, Citi Ohio also provides infrastructure and support in implementing the written policies and procedures comprising the Portfolios’ compliance program, including support services to the CCO. For the services provided under the CCO Agreement, the HSBC Investor Family of Funds paid Citi Ohio $250,800 for the year ended October 31, 2008, plus reimbursement of certain expenses. Expenses incurred by each Portfolio are reflected on the Statements of Operations as “Compliance Service.’’ Citi Ohio pays the salary and other compensation earned by any such individuals as employees of Citi Ohio. |
| |
Fund Accounting and Trustee: |
|
| Citi Ohio provides fund accounting services for the Portfolios. For its services to the Portfolios, Citi Ohio receives an annual fee per Portfolio, including reimbursement of certain expenses, that is accrued daily and paid monthly. |
| |
| Effective April 1, 2008 each of the non-interested Trustees are compensated with a $60,000 annual Board retainer, as well as a $3,000 annual retainer for each Committee of the Board. Each non-interested Trustee also receives a $5,000 and $3,000 meeting fee for each regular in-person Board meeting and Committee meeting, respectively. Furthermore, each non-interested Trustee receives compensation for attending special meetings and/or functioning as a Committee Chairperson or Lead Trustee. In addition, the non-interested Trustees are reimbursed for certain expenses incurred in connection with their Board membership. |
| |
| Prior to April 1, 2008 each of the non-interested Trustees were compensated with a $35,000 annual Board retainer, as well as a $3,000 annual retainer for each Committee of the Board. Each non-interested Trustee also received a $5,000 and $3,000 meeting fee for each regular in-person Board meeting and Committee meeting, respectively. Furthermore, each non-interested Trustee received compensation for attending special meetings and/or functioning as a Committee Chairperson or Lead Trustee. In addition, the non-interested Trustees were reimbursed for certain expenses incurred in connection with their Board membership. |
| |
111 | HSBC INVESTOR PORTFOLIOS |
|
HSBC INVESTOR PORTFOLIOS |
|
Notes to Financial Statements—as of October 31, 2008 (continued) |
| |
4. | Investment Transactions: |
| |
| Purchases and sales of securities (excluding securities maturing less than one year from acquisition) for the year ended October 31, 2008 were as follows: |
| | | | | | | | | | | | | |
Portfolio Name | | Purchases
(excluding U.S.
Government) | | Sales
(excluding U.S.
Government) | | Purchases
of U.S.
Government | | Sales
of U.S.
Government | |
| |
| |
| |
| |
| |
Core Plus Fixed Income Portfolio | | $ | 69,036,342 | | $ | 80,690,896 | | $ | 49,065,754 | | $ | 55,677,401 | |
High Yield Fixed Income Portfolio | | | 3,234,787 | | | 3,081,017 | | | — | | | — | |
Intermediate Duration Fixed Income Portfolio | | | 8,739,811 | | | 10,328,525 | | | 7,299,067 | | | 6,054,432 | |
Growth Portfolio | | | 161,944,892 | | | 127,516,379 | | | — | | | — | |
International Equity Portfolio | | | 100,701,900 | | | 116,158,373 | | | — | | | — | |
Opportunity Portfolio | | | 147,097,284 | | | 172,313,505 | | | — | | | — | |
Value Portfolio | | | 18,574,861 | | | 16,117,722 | | | — | | | — | |
| |
5. | Federal Income Tax Information: |
| |
| At October 31, 2008, the cost, gross unrealized appreciation and gross unrealized depreciation on securities for federal income tax purposes, were as follows: |
| | | | | | | | | | | | | |
| | | | | | | | | | | | | |
Fund | | Tax Cost | | Tax
Unrealized
Appreciation | | Tax
Unrealized
Depreciation | | Net Unrealized
Appreciation
(Depreciation)* | |
| |
| |
| |
| |
| |
Core Plus Fixed Income Portfolio | | $ | 118,920,436 | | $ | 404,331 | | $ | (13,181,862 | ) | $ | (12,777,531 | ) |
High Yield Fixed Income Portfolio | | | 14,005,674 | | | — | | | (4,456,761 | ) | | (4,456,761 | ) |
Intermediate Duration Fixed Income Portfolio | | | 20,454,405 | | | 65,632 | | | (1,712,397 | ) | | (1,646,765 | ) |
Growth Portfolio | | | 104,366,399 | | | 1,301,129 | | | (21,361,373 | ) | | (20,060,244 | ) |
International Portfolio | | | 319,238,690 | | | 4,981,933 | | | (127,033,651 | ) | | (122,051,718 | ) |
Opportunity Portfolio | | | 160,227,856 | | | 5,851,082 | | | (37,493,204 | ) | | (31,642,122 | ) |
Value Portfolio | | | 62,715,935 | | | 4,905,550 | | | (17,374,375 | ) | | (12,468,825 | ) |
| | |
|
|
| * | The difference between book-basis and tax-basis unrealized appreciation (depreciation) is attributable primarily to: tax deferral of losses on wash sales. |
| |
6. | Legal and Regulatory Matters: |
| |
| On September 26, 2006 BISYS Fund Services, Inc. (“BISYS’’), an affiliate of BISYS Fund Services Ohio, Inc. which provides various services to the Portfolios as described in footnote 3, reached a settlement with the Securities and Exchange Commission (“the SEC’’) regarding the SEC’s investigation related to BISYS’ past payment of certain marketing and other expenses with respect to certain of its mutual fund clients. Although BISYS has reached a settlement with the SEC, the Portfolios’ management is not aware that any determination has been made as to how the BISYS settlement monies will be distributed. While the Portfolios’ management is currently unable to determine the impact, if any, of such matters on the Portfolios or the Portfolios’ financial statements, management does not anticipate a material, adverse impact to the Portfolios or the Portfolios’ financial statements. |
| |
7. | Subsequent Event: |
| |
| HSBC Investor Core Plus Fixed Income Portfolio
HSBC Investor High Yield Fixed Income Portfolio
HSBC Investor Intermediate Duration Fixed Income Portfolio
(the “Fixed Income Portfolios”) |
| |
�� | Each of the Fixed Income Portfolios is currently sub-advised by Halbis Capital Management (USA) Inc. (“Halbis”), an affiliate of the Portfolios’ investment adviser, HSBC Global Asset Management (USA) Inc. (the “Adviser”). |
| |
HSBC INVESTOR PORTFOLIOS | 112 |
|
HSBC INVESTOR PORTFOLIOS |
|
Notes to Financial Statements—as of October 31, 2008 (continued) |
| |
| Due to changes in its U.S. business model, Halbis has determined to resign as sub-adviser to the Fixed Income Portfolios effective January 31, 2009. The Adviser is actively exploring options for the Fixed Income Portfolios. Options under consideration are reorganizing the Fixed Income Portfolios into an unaffiliated fund family or liquidation of the Fixed Income Portfolios. |
| |
| The Adviser anticipates presenting its recommendations to the Board of Trustees of the Fixed Income Portfolios in the near future. Once the Board of Trustees has made a determination as to the course of action, the Adviser will provide notice to the shareholders. |
| |
113 | HSBC INVESTOR PORTFOLIOS |
REPORT OF INDEPENDENT REGISTERED PUBLIC ACCOUNTING FIRM
To the Shareholders and Board of Trustees of
HSBC Investor Portfolios:
We have audited the accompanying statements of assets and liabilities of HSBC Investor Portfolios – HSBC Investor Core Plus Fixed Income Portfolio, HSBC Investor High Yield Fixed Income Portfolio, HSBC Investor Intermediate Duration Fixed Income Portfolio, HSBC Investor Growth Portfolio, HSBC Investor International Equity Portfolio, HSBC Investor Opportunity Portfolio and HSBC Investor Value Portfolio (the Funds), including the schedules of portfolio investments, as of October 31, 2008, and the related statements of operations for the year then ended, the changes in net assets for each year in the two-year period then ended, and the financial highlights for each period in the five-year period then ended. These financial statements and financial highlights are the responsibility of the Funds’ management. Our responsibility is to express an opinion on these financial statements and financial highlights based on our audits.
We conducted our audits in accordance with the standards of the Public Company Accounting Oversight Board (United States). Those standards require that we plan and perform the audit to obtain reasonable assurance about whether the financial statements and financial highlights are free of material misstatement. An audit includes examining, on a test basis, evidence supporting the amounts and disclosures in the financial statements. Our procedures included confirmation of securities owned as of October 31, 2008, by correspondence with custodians and brokers; or other appropriate auditing procedures. An audit also includes assessing the accounting principles used and significant estimates made by management, as well as evaluating the overall financial statement presentation. We believe that our audits provide a reasonable basis for our opinion.
In our opinion, the financial statements and financial highlights referred to above present fairly, in all material respects, the financial position of the Funds as of October 31, 2008, the results of their operations for the year then ended, the changes in their net assets for each year in the two-year period then ended, and the financial highlights for each period in the five-year period then ended, in conformity with U.S. generally accepted accounting principles.
KPMG LLP
Columbus, Ohio
December 19, 2008
| |
HSBC INVESTOR PORTFOLIOS | 114 |
|
HSBC INVESTOR PORTFOLIOS |
|
Table of Shareholder Expenses (Unaudited)—as of October 31, 2008 |
| |
| As a shareholder of the HSBC Investor Portfolios (“Portfolios”), you incur ongoing costs, including management fees and other Fund expenses. |
| |
| These examples are intended to help you understand your ongoing costs (in dollars) of investing in the Portfolios and to compare these costs with the ongoing costs of investing in other mutual funds. |
| |
| These examples are based on an investment of $1,000 invested at the beginning of the period and held for the entire period from May 1, 2008 through October 31, 2008. |
| |
| Actual Example |
| |
| The table below provides information about actual account values and actual expenses. You may use the information below, together with the amount you invested, to estimate the expenses that you paid over the period. Simply divide your account value by $1,000 (for example, an $8,600 account value divided by $1,000 = 8.6), then multiply the result by the number in the table under the heading entitled “Expenses Paid During Period” to estimate the expenses you paid on your account during this period. |
| | | | | | | | | | | | | |
| | Beginning
Account Value
5/1/08 | | Ending Account
Value
10/31/08 | | Expenses Paid
During Period*
5/1/08 - 10/31/08 | | Annualized
Expense Ratio
During Period
5/1/08 - 10/31/08 | |
| |
| |
| |
| |
| |
Core Plus Fixed Income Portfolio | | $ | 1,000.00 | | $ | 920.30 | | $ | 2.90 | | | 0.60 | % |
High Yield Fixed Income Portfolio | | | 1,000.00 | | | 750.40 | | | 5.63 | | | 1.28 | % |
Intermediate Duration Fixed Income Portfolio | | | 1,000.00 | | | 943.70 | | | 4.49 | | | 0.92 | % |
Growth Portfolio | | | 1,000.00 | | | 679.10 | | | 2.70 | | | 0.64 | % |
International Equity Portfolio | | | 1,000.00 | | | 538.60 | | | 2.86 | | | 0.74 | % |
Opportunity Portfolio | | | 1,000.00 | | | 664.50 | | | 3.64 | | | 0.87 | % |
Value Portfolio | | | 1,000.00 | | | 670.60 | | | 2.73 | | | 0.65 | % |
| | |
| * | Expenses are equal to the average account value over the period multiplied by the Portfolio’s annualized expense ratio, multiplied by the number of days in the most recent fiscal half-year divided by the number of days in the fiscal year (to reflect the one half year period). |
| |
115 | HSBC INVESTOR PORTFOLIOS |
|
HSBC INVESTOR FAMILY OF FUNDS |
|
Table of Shareholder Expenses (Unaudited)—as of October 31, 2008 (continued) |
| |
| Hypothetical Example for Comparison Purposes |
| |
| The table below provides information about hypothetical account values and hypothetical expenses based on each Portfolio’s actual expense ratio and an assumed rate of return of 5% per year before expenses, which is not the Portfolio’s actual return. The hypothetical account values and expenses may not be used to estimate the actual ending account balance or expenses you paid for the period. You may use this information to compare this 5% hypothetical example with the 5% hypothetical examples that appear in the shareholder reports of other funds. |
| |
| Please note that the expenses shown in the table are meant to highlight your ongoing costs only and do not reflect any transactional costs, such as sales charges (loads), redemption fees, or exchange fees. Therefore, the table is useful in comparing ongoing costs only, and will not help you determine the relative total costs of owning different funds. In addition, if these transactional costs were included, your costs would have been higher. |
| | | | | | | | | | | | | |
| | Beginning
Account Value
5/1/08 | | Ending Account
Value
10/31/08 | | Expenses Paid
During Period*
5/1/08 - 10/31/08 | | Annualized
Expense Ratio
During Period
5/1/08 - 10/31/08 | |
| |
| |
| |
| |
| |
Core Plus Fixed Income Portfolio | | $ | 1,000.00 | | $ | 1,022.12 | | $ | 3.05 | | | 0.60 | % |
High Yield Fixed Income Portfolio | | | 1,000.00 | | | 1,018.70 | | | 6.50 | | | 1.28 | % |
Intermediate Duration Fixed Income Portfolio | | | 1,000.00 | | | 1,020.51 | | | 4.67 | | | 0.92 | % |
Growth Portfolio | | | 1,000.00 | | | 1,021.92 | | | 3.25 | | | 0.64 | % |
International Equity Portfolio | | | 1,000.00 | | | 1,021.42 | | | 3.76 | | | 0.74 | % |
Opportunity Portfolio | | | 1,000.00 | | | 1,020.76 | | | 4.42 | | | 0.87 | % |
Value Portfolio | | | 1,000.00 | | | 1,021.87 | | | 3.30 | | | 0.65 | % |
| | |
| * | Expenses are equal to the average account value over the period multiplied by the Portfolio’s annualized expense ratio, multiplied by the number of days in the most recent fiscal half-year divided by the number of days in the fiscal year (to reflect the one half year period). |
| |
HSBC INVESTOR PORTFOLIOS | 116 |
|
HSBC INVESTOR FAMILY OF FUNDS |
|
Board of Trustees and Officers (unaudited) |
MANAGEMENT OF THE TRUST
The following table contains information regarding HSBC Investor Family of Funds Board of Trustees (“Trustees”). Asterisks indicate those Trustees who are “interested persons,” as defined in the Investment company act of 1940, as amended, of the Funds. The Funds’ Statement of Additional Information includes additional information about the Trustees and is available by calling (888) 525-5757.
| | | | | | | | | | |
Name, Address,
and Age | | Position(s)
Held with
Funds | | Term of Office and
Length of Time Served
with the Funds | | Principal Occupation(s)
During Past 5 Years | | Number of
Portfolios in Fund
Complex Overseen
by Trustee* | | Other
Directorships
Held by Trustee |
|
|
|
|
|
|
|
|
|
|
|
|
NON-INTERESTED TRUSTEE |
| | | | | | | | | | |
Marcia L. Beck
P.O. Box 182845
Columbus, OH 43218
Date of Birth:
October 29, 1955 | | Trustee | | Indefinite; June 2008
to present | | Private Investor; Executive Vice President and Chief Operating Officer of Prudential Investments (1997-1999) | | 40 | | None |
|
|
|
|
|
|
|
|
|
|
|
Susan S. Huang
P.O. Box 182845
Columbus, OH 43218
Date of Birth:
May 14, 1954 | | Trustee | | Indefinite; June 2008
to present | | Investment Consultant, self employed (2001 to present); Senior Vice President, Schroeder Investment Management (2001 - 2004) | | 40 | | United Church Foundation; Huntington’s Disease Society; Second Congregational Church (Greenwich) Endowment, Inc. |
|
|
|
|
|
|
|
|
|
|
|
Alan S. Parsow
P.O. Box 182845
Columbus, OH 43218
Date of Birth:
January 16, 1950 | | Trustee | | Indefinite; 1987
to present | | General Partner of Elkhorn Partners, L.P. (a private investment partnership) (since 1989) | | 40 | | None |
|
|
|
|
|
|
|
|
|
|
|
Thomas F. Robards
P.O. Box 182845
Columbus, OH 43218
Date of Birth:
June 10, 1946 | | Trustee | | Indefinite; 2005
to present | | Partner, Robards & Co. LLC (2005-present); Chief Financial Officer, American Museum of Natural History (2003 to 2004) | | 40 | | Ellington Financial LLC and Overseas Shipholding Group |
|
|
|
|
|
|
|
|
|
|
|
Larry M. Robbins
P.O. Box 182845
Columbus, OH 43218
Date of Birth:
December 12, 1938 | | Trustee | | Indefinite; 1987
to present | | Private Investor; Director, Center for Teaching and Learning, University of Pennsylvania (1999-2006) | | 40 | | None |
|
|
|
|
|
|
|
|
|
|
|
Michael Seely
P.O. Box 182845
Columbus, OH 43218
Date of Birth:
June 7, 1945 | | Trustee | | Indefinite; 1987
to present | | Private Investor; Global Multi Manager Partners (1999-2003); President of Investor Access Corporation (1981-2003) | | 40 | | None |
|
|
|
|
|
|
|
|
|
|
|
|
INTERESTED TRUSTEE |
| | | | | | | | | | |
Stephen J. Baker**
P.O. Box 182845
Columbus, OH 43218
Date of Birth:
June 23, 1956 | | Trustee | | Indefinite; 2004
to present | | Chief Executive Officer, HSBC Global Asset Management (USA) Inc. and Executive Vice President, HSBC (USA), N.A. (2003 to present); Chief Executive Officer, HSBC Asset Management (Canada) Limited (1998 to 2003) | | 40 | | None |
|
|
|
|
|
|
|
|
|
|
|
| |
* | Includes both the fund and the underlying Portfolio for Funds with a master/feeder structure. |
| |
** | Mr. Baker is an “interested person” of the Trust, as defined by the 1940 Act, because of his employment with the Adviser. |
| |
117 | HSBC INVESTOR PORTFOLIOS |
|
HSBC INVESTOR FAMILY OF FUNDS |
|
Board of Trustees and Officers (unaudited) (continued) |
The names of the officers, their addresses, ages, position(s) held with the Trust, and principal occupation(s) during the past five years are described in the table below.
| | | | | | |
Name, Address,
and Age/Date
of Birth | | Position(s)
Held with
Fund | | Term of Office and
Length of Time Served
With the Funds | | Principal Occupation(s)
During Past 5 Years |
|
|
|
|
|
|
|
Richard A. Fabietti
452 Fifth Avenue
New York, NY 10018
Date of Birth:
October 8, 1958 | | President | | Indefinite; 2004
to present | | Senior Vice President, Head of Product Management, HSBC Global Asset Management (USA) Inc. (1998 to present) |
|
|
|
|
|
|
|
Elba L. Vasquez
452 Fifth Avenue
New York, NY 10018
Date of Birth:
December 14, 1961 | | Vice President | | Indefinite; 2006
to present | | Vice President of Product Administration, HSBC Global Asset Management (USA) Inc. (2005 to present); Vice President of Client Services, Citi (1996 to 2005) |
|
|
|
|
|
|
|
Troy Sheets*
3435 Stelzer Road
Columbus, OH 43219-3035
Date of Birth:
May 29, 1971 | | Treasurer | | Indefinite; 2004
to present | | Senior Vice President, Citi (2002 to present) |
|
|
|
|
|
|
|
Jennifer A English*
100 Summer Street
Suite 1500
Boston, MA 02110
Date of Birth:
March 5, 1972 | | Secretary | | Indefinite; September
2008 to present | | Vice President, Regulatory Administration, Citi (2005 to present); Assistant Vice President and Assistant Counsel, PFPC, Inc. (2002-2005) |
|
|
|
|
|
|
|
F. Martin Fox
100 Summer Street
Suite 1500
Boston, MA 02110
Date of Birth:
May 5, 1963 | | Assistant Secretary | | Indefinite; September
2008 to present | | Assistant Vice President, Regulatory Administration, Citi (May 2008 to present); Contract Attorney, Update Legal LLC (2002 to 2008) |
|
|
|
|
|
|
|
Frederick J. Schmidt*
585 Stewart Avenue
Garden City, NY 11530
Date of Birth:
July 10, 1959 | | Chief Compliance
Officer | | Term expires 2009;
2004 to present | | Senior Vice President and Chief Compliance Officer, CCO Services, Citi (2004 to present); President, FJS Associates (2002 to 2004) |
|
|
|
|
|
|
|
| |
* | Mr. Sheets, Mr. Schmidt and Ms. English also are officers of certain other investment companies of which Citi (or an affiliate) is the administrator or sub-administrator. |
| |
HSBC INVESTOR PORTFOLIOS | 118 |
Other Information:
A description of the policies and procedures that the Funds use to determine how to vote proxies relating to the portfolio securities is available without charge, upon request, by calling 1-800-525-5757 for HSBC Bank USA and HSBC Brokerage (USA) Inc. clients and 1-800-782-8183 for all other shareholders or on the Fund’s website at www.investorfunds.us.hsbc.com and the Securities and Exchange Commission’s (“Commission”) website at http://www.sec.gov. A copy of the Fund’s voting record for the most recent 12 month period ending June 30 is available at the Commission’s website at http://www.sec.gov.
Schedules of Portfolio Investments for fiscal quarters ending January 31 and July 31 will be available no later than 60 days after each period end, without charge, on the Fund’s website at www.investorfunds.us.hsbc.com and on the Commission’s web-site at http://www.sec.gov.
An investment in a Fund is not a deposit of HSBC Bank USA, National Association, and is not insured or guaranteed by the Federal Deposit Insurance Corporation or any other government agency.
| |
119 | HSBC INVESTOR PORTFOLIOS |
(This Page Intentionally Left Blank)
(This Page Intentionally Left Blank)
| | |
HSBC INVESTOR FAMILY OF FUNDS: | | SHAREHOLDER SERVICING AGENTS |
| | For HSBC Bank USA, N.A. and |
INVESTMENT ADVISER AND ADMINISTRATOR | | HSBC Securities (USA) Inc. Clients |
HSBC Global Asset Management (USA) Inc. | | HSBC Bank USA, N.A. |
452 Fifth Avenue | | 452 Fifth Avenue |
New York, NY 10018 | | New York, NY 10018 |
| | 1-888-525-5757 |
SUB-ADVISERS | | |
HSBC Investor Growth Portfolio | | For All Other Shareholders |
Winslow Capital Management, Inc. | | HSBC Investor Funds |
4720 IDS Tower | | P.O. Box 182845 |
80th South Eighth Street | | Columbus, OH 43218-2845 |
Minneapolis, MN 55402 | | 1-800-782-8183 |
| | |
HSBC Investor International Equity Portfolio | | TRANSFER AGENT AND SPONSOR |
AllianceBernstein Investment Research and Management | | Citi Fund Services |
1345 Avenue of the Americas, 39th Floor | | 3435 Stelzer Road |
New York, NY 10105 | | Columbus, OH 43219 |
| | |
HSBC Investor Mid-Cap Fund | | DISTRIBUTOR |
Munder Capital Management | | Foreside Distribution Services, L.P. |
Munder Capital Center | | 690 Taylor Road, Suite 150 |
480 Pierce Street | | Gahanna, Ohio 43230-3202 |
Birmingham, MI 48009-6063 | | |
| | CUSTODIAN |
HSBC Investor Opportunity Portfolio | | HSBC Investor Core Plus Fixed Income Portfolio |
Westfield Capital Management, LLC | | HSBC Investor New York Tax-Free Bond Fund |
One Financial Center | | HSBC Investor High Yield Fixed Income Portfolio |
Boston, MA 02111 | | HSBC Investor Intermediate Duration Fixed Income Portfolio |
HSBC Investor Value Portfolio | | HSBC Investor Growth Portfolio |
NWQ Investment Management Co., LLC | | HSBC Investor Growth and Income Fund |
2049 Century Park East, 16th Floor | | HSBC Investor International Equity Portfolio |
Los Angeles, CA 90067 | | HSBC Investor Mid-Cap Fund |
| | HSBC Investor Opportunity Portfolio |
HSBC Investor Core Plus Fixed Income Portfolio | | HSBC Investor Value Portfolio |
HSBC Investor High Yield Fixed Income Portfolio | | The Northern Trust Company |
HSBC Investor Intermediate Duration Fixed Income Portfolio | | 50 South LaSalle Street
Chicago, IL 60603 |
HSBC Investor New York Tax-Free Bond Fund | | |
Halbis Capital Management (USA) Inc. | | INDEPENDENT REGISTERED PUBLIC |
452 Fifth Avenue, 18th Floor | | ACCOUNTING FIRM |
New York, NY 10018 | | KPMG LLP |
| | 191 West Nationwide Blvd., Suite 500 |
| | Columbus, OH 43215 |
| | |
| | LEGAL COUNSEL |
| | Dechert LLP |
| | 1775 I Street, N.W. |
| | Washington, D.C. 20006 |
The HSBC Investor Family of Funds are distributed by Foreside Distribution Services, L.P. This document must be preceded or accompanied by a current prospectus for the HSBC Investor Funds, which you should read carefully before you invest or send money.
| | | | |
— NOT FDIC INSURED | | — NO BANK GUARANTEE | | — MAY LOSE VALUE |

HSBC Global Asset Management (USA) Inc.
October 31st, 2008
HSBC Investor Funds
Annual Report
MONEY MARKET FUNDS
HSBC Investor California Tax-Free Money Market Fund
HSBC Investor Prime Money Market Fund
HSBC Investor New York Tax-Free Money Market Fund
HSBC Investor Tax-Free Money Market Fund
HSBC Investor U.S. Government Money Market Fund
HSBC Investor U.S. Treasury Money Market Fund
(This Page Intentionally Left Blank)
Barclays Capital U.S. Aggregate Index (formerly Lehman Brothers U.S. Aggregate Index) is an unmanaged index generally representative of investment-grade fixed-rate debt issues, including government, corporate, asset-backed, and mortgage-backed securities, with maturities of at least one year.
Gross Domestic Product (“GDP”) is the measure of the market value of the goods and services produced by labor and property in the United States.
Lipper California Tax-Exempt Money Market Funds Average is an average of managed mutual funds that invests in high quality municipal obligations with dollar-weighted average maturities of less than 90 days. The mutual funds intend to keep constant net asset value which is exempt from taxation in California, with dollar-weighted average maturities of five- to ten-years.
Lipper Money Market Funds Average is an average of managed mutual funds that invest in high-quality financial instruments rated in the top two grades, with dollar-weighted average maturities of less than 90 days.
Lipper New York Tax-Exempt Money Market Funds Average is an average of managed mutual funds that invest in municipal obligations of New York with dollar-weighted average maturities of less than 90 days.
Lipper Tax-Exempt Money Market Funds Average is an average of managed mutual funds that invest in high quality municipal obligations with dollar-weighted average maturities of less than 90 days. Intended to keep constant net asset value.
Lipper U.S. Government Money Market Funds Average is an average of managed mutual funds that invest principally in financial instruments issued or guaranteed by the U.S. government, its agencies, or its instrumentalities with dollar-weighted average maturities of less than 90 days.
Lipper U.S. Treasury Money Market Funds Average is an average of managed mutual funds that invest principally in U.S. Treasury obligations with dollar-weighted average maturities of less than 90 days.
Morgan Stanley Capital International Europe, Australasia and Far East (“MSCI EAFE”) Index is an unmanaged free float-adjusted market capitalization index that is designed to measure the equity market performance of developed markets, excluding the U.S. & Canada. As of June 2007 the MSCI EAFE Index consisted of the following 21 developed market country indices: Australia, Austria, Belgium, Denmark, Finland, France, Germany, Greece, Hong Kong, Ireland, Italy, Japan, the Netherlands, New Zealand, Norway, Portugal, Singapore, Spain, Sweden, Switzerland, and the United Kingdom.
Standard & Poor’s 500 (“S&P 500”) Index is an unmanaged index that is widely regarded as a gauge of the U.S. equities market, this index includes 500 leading companies in leading industries of the U.S. economy. The S&P 500 focuses on the large cap segment of the market, with approximately 75% coverage of U.S. equities.
The Russell Universe - Russell is a recognized leader in consulting, multi-manager investing and institutional investment management. Our consultants advise clients on more than $2 trillion in assets. We deliver investment programs to over 2,000 clients in 44 countries. With more than $230 billion in assets in our funds, Russell researchers meet with over 4,000 investment managers around the world to evaluate their investment process.
Russell 2000® Index is an unmanaged index which easures the performance of the 2,000 smallest companies in the Russell 3000 Index, which represents approximately 8% of the total market capitalization of the Russell 3000 Index. The companies which comprise this index have high price-to-book ratios and higher forecasted growth values.
Lipper is an independent mutual fund performance monitor whose results are based on total return and do not reflect a sales charge.
Securities indexes assume reinvestment of all distributions and interest payments and do not take in account brokerage fees or expenses. Securities in the Fund do not match those in the indexes and performance of the Fund will differ. Investors cannot invest directly in an index.
Dear Shareholder,
Over the past eighteen months, the financial markets have experienced arguably the most difficult conditions in recent history. The underlying causes of the market’s significant and persistent downturn have had devastating effects on corporations around the world. The value of equity, fixed income and even money market securities has all been affected by the slowing economy, decreasing corporate earnings and the lack of available credit to support business operations. Many organizations with renowned histories of success and profitability are now seeking government relief in order to remain solvent. The result has been significant double-digit losses for U.S. and international market indices over the past year.
During this period of extreme volatility, the HSBC Investor Funds (the “Funds”) were committed to offering sound, long-term investment solutions to investors. Now, more than ever, the Funds are diligently seeking and working with investment sub-advisers who can assist in navigating through this market environment. Moreover, the Board of Trustees is also aware that the Funds’ ability to execute shareholder instructions in an accurate and timely manner is also an important part of a fund’s overall performance. In performing its oversight role, the Board continuously attempts to maintain the highest level of responsiveness to shareholders.
Recognizing its responsibility to shareholders, the Board considers a wide range of factors including relative expertise and the financial viability in selecting the Funds’ service providers. We believe that aligning the Funds’ interests with strong partners provides a tangible benefit to shareholders, now and in the future.
We understand that these are extremely challenging times in the financial markets. We remain committed to managing the HSBC Investor Funds in a prudent and consistent manner for long-term performance.
For further market insight and investment results for the Funds, please see our portfolio manager commentary in this Annual Report.
Thank you for your investment in the HSBC Investor Funds.
Sincerely,

Larry M. Robbins, Chairman, HSBC Investor Funds
| |
1 | HSBC INVESTOR FAMILY OF FUNDS |
|
Commentary From the Investment Manager |
|
HSBC Global Asset Management (USA) Inc.
U.S. Economic Review
The 12-month period from November 1, 2007 through October 31, 2008 was extraordinarily challenging for the U.S. economy and the global financial system. Over the course of this period, a growing number of signs indicated that the health of the economy was deteriorating and the risk of a recession was rising. In addition, a number of financial institutions faced serious problems and incurred heavy financial losses that threatened their ability to operate.
These issues largely stemmed from the housing market’s prolonged downturn. Rising default rates on subprime mortgages during the period generated huge losses for a wide variety of global financial institutions, which had invested heavily in securities that were backed by those risky mortgages. The losses were so severe that they eventually resulted in the collapse of Bear Sterns, Lehman Brothers and others, the nationalization of Fannie Mae and Freddie Mac, the failure of some banks and the forced mergers of several financial institutions. In that environment, lenders became suspicious of borrowers’ financial health and significantly reduced their willingness to lend money. The result was a crisis that effectively froze the credit markets and depressed economic growth.
The economic slowdown and declining home prices were particularly hard on consumers, who account for approximately two-thirds of U.S. economic activity. Retail sales fell sharply, real personal incomes declined, unemployment rose to its highest levels in years and consumer confidence plummeted. Corporate profits declined and U.S. Gross Domestic Product1 growth fell during two of the past four quarters (through the third quarter of 2008).
Problems in the U.S. economy spread overseas, creating fears of a global economic downturn. Consensus 2009 forecasts for economic growth in Europe and Asia declined during the third quarter, driven lower by factors such as falling business activities and confidence.
Aggressive steps were taken during the period to stabilize the credit markets and respark the economy. For example, the Federal Reserve Board (the “Fed”) cut its target short-term interest rate, the federal funds rate, from 4.50% in November to 1.00% by the end of October in an effort to inject liquidity into the markets. The Fed also established and increased auction lending facilities. Additionally, the U.S. government began implementing a $700 billion financial bailout package, and helped engineer the rescue of several large financial institutions and guaranteed senior debt issued by banks. Governments in Europe and Asia adopted similar strategies to improve sentiment and ease the strains in their financial systems.
The weak economy did have some relatively positive consequences. Energy prices, which had risen sharply during the first half of the period as the price of oil soared to record highs, fell significantly during later months. Falling commodity prices also reduced inflationary pressures, giving central banks around the world a greater ability to target their monetary policy to support growth, liquidity and financial market stability.
Market Review
The U.S. stock market was extremely volatile during the period as investors reacted strongly to new developments in the economy, the housing sector and the financial markets. Investors during most of the period fled from stocks into assets that were perceived to be safer, such as high-quality government bonds and cash. The S&P 500 Index1 returned -36.08% for the 12-month period ended October 31, 2008. Small-company stocks, represented by the Russell 2000® Index1, returned
-34.16%.
Shares of financial services firms suffered particularly large declines during the period due to the turmoil in the credit and banking system and concerns that more problems could occur if the subprime mortgage crisis spread. Consumer discretionary stocks also posted significant losses as increasingly nervous consumers cut their spending on non-essential items. Investors also shunned shares of auto-related companies, which faced critical credit shortages and an uncertain future.
The energy sector posted strong returns during the first half of the period as the price of oil and other commodities rose, but lagged later in the period as oil prices fell sharply. Conversely, health care stocks outperformed the overall market, especially as economic conditions worsened during the final months of the period.
Foreign stocks also delivered negative returns, as banks worldwide suffered from their exposure to problem assets related to the mortgage industry and the outlook for global economic growth worsened. The MSCI EAFE Index1 of developed foreign stock markets returned -46.34% during the period. Emerging markets stocks also suffered as investors avoided the perceived riskiness of developing markets in favor of assets they believed to be more stable. Falling commodity prices during the second half of the period also hurt some emerging economies, which are heavily dependent on commodity exports.
The Barclays Capital U.S. Aggregate Index1, which tracks the broad fixed-income markets, returned 0.3% for the period. High-quality government bonds, such as those issued by the U.S. Treasury, performed well as investors seeking to avoid risk fled into these securities. The rally pushed yields for government bonds lower, particularly among short-term fixed-income securities. Investors favored shorter maturities as they focused on liquidity and safety during the period of heightened market volatility. Other types of fixed-income securities—including corporate bonds and high-yield bonds—performed poorly, as investors favored the stability of government-backed bonds and worried about companies’ ability to fulfill their debt obligations in a weak economic environment. As a result, the spread between yields on government securities and corporate bonds widened substantially.
| |
1 | For additional information, please refer to the Glossary of Terms. |
| |
HSBC INVESTOR FAMILY OF FUNDS | 2 |
|
Portfolio Reviews |
|
HSBC Investor California Tax-Free Money Market Fund |
(Class A Shares, C Shares, D Shares and Y Shares) |
|
by Jason Moshos
Portfolio Manager |
Investment Concerns
An investment in the fund is not insured or guaranteed by the FDIC or any other government agency. Although the Fund seeks to preserve the value of your investment at $1.00 per share, it is possible to lose money by investing in this fund. The fund’s income may be subject to the federal alternative minimum tax and to certain state and local taxes. Regional funds may be subject to additional risk, since companies they invest in are located in one geographical location.
The 12-month period ended October 31, 2008 was extremely challenging. Rising subprime mortgage defaults created a crisis that effectively shut down the credit markets and eroded investors’ confidence in the banking and financial system. In that environment, three of the four monoline bond insurers (which provide insurance to certain municipal issuers) saw their credit ratings downgraded. Credit crisis fears caused yields on tax-free money market securities to rise well above their normal levels.
The Federal Reserve Board (the “Fed”) attempted to unfreeze the credit markets and restore investor confidence in part by aggressively cutting the federal funds rate by 350 basis points (3.50%)—from 4.50% to 1.00%. The Fed’s rate cuts, along with strong investor demand for high-quality and highly liquid securities, caused yields on short-term Treasuries to decline to extremely low levels. Municipal money market securities therefore offered attractive yields compared to similar taxable money market securities.
We positioned the Fund defensively given the significant volatility and uncertainty throughout the period. For example, the Fund’s weighted average maturity was shorter than that of its benchmark. This approach helped to enhance overall liquidity. We also favored highly liquid securities, such as 1- and 7-day floating rate notes, and rebalanced opportunistically as market conditions changed—shifting away from those securities that presented significant credit risk and into issues with stronger credit ratings. These decisions benefited the Fund, as the types of securities we favored held up relatively well. Additionally, we took advantage of a program by the U.S. Treasury to insure money market funds.†,*
Shifting levels of supply and demand of tax-free money market securities also influenced our strategy. At times, the challenging environment made it difficult for bond issuers to issue new bonds. During these periods of low supply, we invested a small amount of the Fund’s assets in taxable government issues.*
* Portfolio composition is subject to change.
| |
† | On October 7, 2008 and December 4, 2008 the Fund participated in the Treasury Money Market Guarantee Program and related extension. The Program is for shareholders as of September 19, 2008 and generally covers the lesser of the amount that the shareholder held on September 19 or the amount they hold on the date the fund needs to utilize the guarantee. If a shareholder closes their account with the Fund or broker dealer after September 19, any future investment in the Fund will not be guaranteed. The extended guarantee is through April 30, 2009, but may be further extended at the Treasury’s discretion. |
| | | | | | | | | | | | | | | | | | | | | | |
Fund Performance | | | | Average Annual
Total Return (%) | | Yield (%)2 | | Expense
Ratio (%)3 | |
|
|
|
|
|
|
|
|
|
|
As of October 31, 2008 | | Inception
Date | | 1
Year | | 5
Year | | Since
Inception | | 7-Day
Average | | Gross | | Net | |
|
|
|
|
|
|
|
|
|
|
|
|
|
|
|
|
Class A Shares† | | | 3/2/07 | | | — | | | — | | 1.48 | | | 1.60 | | | | 0.80 | | | 0.80 | |
|
|
|
|
|
|
|
|
|
|
|
|
|
|
|
|
|
|
|
|
|
|
|
Class C Shares**† | | | 5/7/07 | | | — | | | — | | 1.74 | | | — | | | | 1.40 | | | 1.40 | |
|
|
|
|
|
|
|
|
|
|
|
|
|
|
|
|
|
|
|
|
|
|
|
Class D Shares | | | 6/17/02 | | | 1.90 | | | 1.98 | | 1.71 | | | 1.07 | | | | 0.65 | | | 0.65 | |
|
|
|
|
|
|
|
|
|
|
|
|
|
|
|
|
|
|
|
|
|
|
|
Class Y Shares | | | 7/18/02 | | | 2.16 | | | 2.24 | | 1.98 | | | 1.32 | | | | 0.40 | | | 0.40 | |
|
|
|
|
|
|
|
|
|
|
|
|
|
|
|
|
|
|
|
|
|
|
|
Lipper California Tax-Exempt | | | | | | | | | | | | | | | | | | | | | | |
Money Market Funds Average1 | | | — | | | 1.98 | | | 1.99 | | N/A | | | N/A | | | | N/A | | | N/A | |
|
|
|
|
|
|
|
|
|
|
|
|
|
|
|
|
|
|
|
|
|
|
|
Past performance does not guarantee future results. The performance data quoted represents past performance and current returns may be lower or higher. Total return figures include change in share price, reinvestment of dividends and capital gains and do not reflect taxes that a shareholder would pay on fund distributions or on the redemption of fund shares. The investment return and principal value will fluctuate so that an investor’s shares, when redeemed may be worth more or less than the original cost. To obtain performance information current to the most recent month end, please call 1-800-782-8183.
The performance above reflects any fee waivers that have been in effect during the applicable periods, as well as any expense reimbursements that have periodically been made. Absent such waivers and reimbursements, returns would have been lower. Currently, contractual fee waivers are in effect from March 1, 2008 through March 1, 2009.
| |
** | Reflects the applicable contingent deferred sales charge, maximum of 1.00%. |
| |
† | Class A Shares were operational during a portion of the periods presented. Amounts reflect performance for the period of the time the class had operations, which was 3 days during the year ended October 31, 2007 and 332 days during the period ended October 31, 2008. Class C shares were operational during a portion of the periods presented. Amounts reflect performance for the period of the time the class had operations, which was 165 days during the year ended October 31, 2007 and 152 days during the period ended October 31, 2008. |
| |
1 | For additional information, please refer to the Glossary of Terms. |
| |
2 | The 7-day yield quotation more closely reflects the current earnings of the Fund than the total return quotation. |
| |
3 | Reflects the expense ratio as reported in the prospectus dated February 28, 2008. |
| |
3 | HSBC INVESTOR FAMILY OF FUNDS |
| |
| Portfolio Reviews |
|
|
|
HSBC Investor Prime Money Market Fund | Moody’s and Standard & Poor’s |
(Class A Shares, B Shares, C Shares, D Shares, I Shares and Y Shares) | has assigned an “Aaa” and “AAAm” |
| rating to the HSBC Investor Prime |
by John Chiodi | Money Market Fund.1 |
Senior Portfolio Manager |
|
Investment Concerns
An investment in the fund is not insured or guaranteed by the FDIC or any other government agency. Although the fund seeks to preserve the value of your investment at $1.00 per share, it is possible to lose money by investing in the fund.
The money markets experienced a turbulent environment during the 12-month period under review, as rising defaults on subprime mortgages brought on a credit and liquidity crisis. The Federal Reserve Board (the “Fed”) attempted to address the financial system’s problems by lowering its target short-term interest rate from 4.50% to 1.00% between November 2007 and October 2008, causing yields on money market securities to decline.
We sought to protect shareholders’ principal in this uncertain environment. In particular, we sacrificed some yield in exchange for increased liquidity during periods of extreme stress in the money markets. We favored intermediate-term assets to help offset the effect of falling rates on the Fund’s yield while also meeting our conservative liquidity goals. As the markets settled somewhat during the fiscal third quarter, we took advantage of strategic opportunities to capture higher yields available on longer-term securities. Additionally, we took advantage of a program by the U.S. Treasury to insure money market funds.*†
We also looked to safeguard shareholder assets by increasing our position in government securities. This strategy also reduced the Fund’s yield, but provided greater security as the credit and liquidity crisis roiled the money markets.*
* Portfolio composition is subject to change.
| |
† | On October 7, 2008 and December 4, 2008 the Fund participated in the Treasury Money Market Guarantee Program and related extension. The Program is for shareholders as of September 19, 2008 and generally covers the lesser of the amount that the shareholder held on September 19 or the amount they hold on the date the fund needs to utilize the guarantee. If a shareholder closes their account with the Fund or broker dealer after September 19, any future investment in the Fund will not be guaranteed. The extended guarantee is through April 30, 2009, but may be further extended at the Treasury’s discretion. |
| | | | | | | | | | | | | | | | | | | | | | |
Fund Performance | | | | Average Annual
Total Return (%) | | Yield (%)3 | | Expense
Ratio (%)4 | |
|
|
|
|
|
|
|
|
|
|
As of October 31, 2008 | | Inception
Date | | 1
Year | | 5
Year | | Since
Inception | | 7-Day
Average | | Gross | | Net | |
|
|
|
|
|
|
|
|
|
|
|
|
|
|
|
|
Class A Shares | | | 11/13/98 | | | 2.71 | | | 2.88 | | 3.10 | | | 1.73 | | | | 0.70 | | | 0.70 | |
|
|
|
|
|
|
|
|
|
|
|
|
|
|
|
|
|
|
|
|
|
|
|
Class B Shares** | | | 4/4/01 | | | -1.90 | | | 2.32 | | 1.99 | | | 1.14 | | | | 1.30 | | | 1.30 | |
|
|
|
|
|
|
|
|
|
|
|
|
|
|
|
|
|
|
|
|
|
|
|
Class C Shares*** | | | 3/23/01 | | | 1.10 | | | 2.32 | | 1.89 | | | 1.14 | | | | 1.30 | | | 1.30 | |
|
|
|
|
|
|
|
|
|
|
|
|
|
|
|
|
|
|
|
|
|
|
|
Class D Shares | | | 4/1/99 | | | 2.86 | | | 3.03 | | 3.19 | | | 1.88 | | | | 0.55 | | | 0.55 | |
|
|
|
|
|
|
|
|
|
|
|
|
|
|
|
|
|
|
|
|
|
|
|
Class I Shares | | | 1/9/02 | | | 3.23 | | | 3.42 | | 2.91 | | | 2.23 | | | | 0.20 | | | 0.20 | |
|
|
|
|
|
|
|
|
|
|
|
|
|
|
|
|
|
|
|
|
|
|
|
Class Y Shares | | | 11/12/98 | | | 3.12 | | | 3.29 | | 3.51 | | | 2.13 | | | | 0.30 | | | 0.30 | |
|
|
|
|
|
|
|
|
|
|
|
|
|
|
|
|
|
|
|
|
|
|
|
Lipper Money Market Funds Average2 | | | — | | | 2.54 | | | 2.70 | | N/A | | | N/A | | | | N/A | | | N/A | |
|
|
|
|
|
|
|
|
|
|
|
|
|
|
|
|
|
|
|
|
|
|
|
Past performance does not guarantee future results. The performance data quoted represents past performance and current returns may be lower or higher. Total return figures include change in share price, reinvestment of dividends and capital gains and do not reflect taxes that a shareholder would pay on fund distributions or on the redemption of fund shares. The investment return and principal value will fluctuate so that an investor’s shares, when redeemed may be worth more or less than the original cost. To obtain performance information current to the most recent month end, please call 1-800-782-8183.
The performance above reflects any fee waivers that have been in effect during the applicable periods, as well as any expense reimbursements that have periodically been made. Absent such waivers and reimbursements, returns would have been lower. Currently, for Class I contractual fee waivers are in effect from March 1, 2008 through March 1, 2009.
** Reflects the applicable contingent deferred sales charge, maximum of 4.00%.
*** Reflects the applicable contingent deferred sales charge, maximum of 1.00%.
| |
1 | The “Aaa” and “AAAm” money market fund rating is historical and reflects the superior quality of the Fund’s investments, sound liquidity management, and strong operations and trading support. Periodic reviews are conducted to ensure a secure operations environment. Moody’s and Standard & Poor’s ratings represent an opinion only, not a recommendation to buy or sell. |
| |
2 | For additional information, please refer to the Glossary of Terms. |
| |
3 | The 7-day yield quotation more closely reflects the current earnings of the Fund than the total return quotation. |
| |
4 | Reflects the expense ratio as reported in the prospectus dated February 28, 2008. |
| |
HSBC INVESTOR FAMILY OF FUNDS | 4 |
|
Portfolio Reviews |
|
HSBC Investor New York Tax-Free Money Market Fund |
(Class A Shares, B Shares, C Shares, D Shares and Y Shares) |
|
by Jason Moshos
Portfolio Manager |
Investment Concerns
An investment in the fund is not insured or guaranteed by the FDIC or any other government agency. Although the fund seeks to preserve the value of your investment at $1.00 per share, it is possible to lose money by investing in the fund. The Fund’s income may be subject to the federal alternative minimum tax and to certain state and local taxes. Regional funds may be subject to additional risk, since companies they invest in are located in one geographical location.
The period from November 1, 2007 through October 31, 2008 was characterized by a severe credit crisis brought on largely by rising default rates among subprime mortgages. These defaults eroded the credit ratings of many banks and financial services firms that invested in mortgage-related securities, and caused investors to worry about the financial health of a wide variety of companies. For example, the credit ratings of three of the four monoline bond insurers (which provide insurance to certain municipal issuers) were downgraded. Such developments caused yields on many tax-free money market securities to rise significantly.
In an attempt to take pressure off of the credit markets, the Federal Reserve Board (the “Fed”) cut the federal funds rate from 4.50% to 1.00%—its lowest level since 2004. The Fed’s rate cuts, along with strong investor demand for securities with a high degree of perceived safety, pushed down yields on Treasury bills significantly. In that environment, municipal money market securities offered very attractive yields relative to Treasuries.
We positioned the Fund in a defensive manner due to the high levels of turbulence and uncertainty in the financial markets. One aspect of this strategy was to maintain a weighted average maturity for the Fund that was shorter than that of its benchmark in order to enhance the Fund’s liquidity. We also favored securities such as 1- and 7-day floating rate notes, which are highly liquid, while selling securities that presented significant credit risk and buying issues with stronger credit ratings. Additionally, we took advantage of a program by the U.S. Treasury to insure money market funds.*†
Our strategy also was influenced by shifting levels of supply and demand through the period. At times, weak demand for municipal securities made it difficult for bond issuers to issue new bonds. During these periods of low supply, we invested a small amount of the Fund’s assets in taxable government issues. We kept the Fund’s taxable holdings well within the parameters set by the SEC and the Fund’s prospectus at all times.*
* Portfolio composition is subject to change.
| |
† | On October 7, 2008 and December 4, 2008 the Fund participated in the Treasury Money Market Guarantee Program and related extension. The Program is for shareholders as of September 19, 2008 and generally covers the lesser of the amount that the shareholder held on September 19 or the amount they hold on the date the fund needs to utilize the guarantee. If a shareholder closes their account with the Fund or broker dealer after September 19, any future investment in the Fund will not be guaranteed. The extended guarantee is through April 30, 2009, but may be further extended at the Treasury’s discretion. |
| | | | | | | | | | | | | | | | | | | | | | | | |
Fund Performance | | | | Average Annual
Total Return (%) | | Yield (%)2 | | Expense
Ratio (%)3 | |
|
|
|
|
|
|
|
|
|
|
As of October 31, 2008 | | Inception
Date | | 1
Year | | 5
Year | | 10
Year | | Since
Inception | | 7-Day
Average | | Gross | | Net | |
|
|
|
|
|
|
|
|
|
|
|
|
|
|
|
|
|
|
Class A Shares | | 11/17/94 | | | 1.94 | | | 1.88 | | | 1.87 | | 2.22 | | | 1.65 | | | | 0.67 | | | 0.67 | |
|
|
|
|
|
|
|
|
|
|
|
|
|
|
|
|
|
|
|
|
|
|
|
|
|
Class B Shares** | | 4/29/98 | | | -2.67 | | | 1.37 | | | 0.96 | | 1.00 | | | 1.05 | | | | 1.27 | | | 1.27 | |
|
|
|
|
|
|
|
|
|
|
|
|
|
|
|
|
|
|
|
|
|
|
|
|
|
Class C Shares*** | | 3/19/01 | | | — | | | — | | | — | | 0.77 | | | — | | | | 1.27 | | | 1.27 | |
|
|
|
|
|
|
|
|
|
|
|
|
|
|
|
|
|
|
|
|
|
|
|
|
|
Class D Shares | | 4/1/99 | | | 2.09 | | | 2.04 | | | — | | 2.01 | | | 1.80 | | | | 0.52 | | | 0.52 | |
|
|
|
|
|
|
|
|
|
|
|
|
|
|
|
|
|
|
|
|
|
|
|
|
|
Class Y Shares | | 7/1/96 | | | 2.35 | | | 2.29 | | | 2.27 | | 2.45 | | | 2.05 | | | | 0.27 | | | 0.27 | |
|
|
|
|
|
|
|
|
|
|
|
|
|
|
|
|
|
|
|
|
|
|
|
|
|
Lipper New York Tax-Exempt | | | | | | | | | | | | | | | | | | | | | | | | |
Money Market Funds Average1 | | — | | | 2.04 | | | 2.01 | | | 1.98 | | N/A | | | N/A | | | | N/A | | | N/A | |
|
|
|
|
|
|
|
|
|
|
|
|
|
|
|
|
|
|
|
|
|
|
|
|
|
Past performance does not guarantee future results. The performance data quoted represents past performance and current returns may be lower or higher. Total return figures include change in share price, reinvestment of dividends and capital gains and do not reflect taxes that a shareholder would pay on fund distributions or on the redemption of fund shares. The investment return and principal value will fluctuate so that an investor’s shares, when redeemed may be worth more or less than the original cost. To obtain performance information current to the most recent month end, please call 1-800-782-8183.
The performance above reflects any fee waivers that have been in effect during the applicable periods, as well as any expense reimbursements that have periodically been made. Absent such waivers and reimbursements, returns would have been lower.
| |
** | Reflects the applicable contingent deferred sales charge, maximum of 4.00%. |
| |
*** | Reflects the applicable contingent deferred sales charge, maximum of 1.00%. Class C Shares were operational during a portion of the periods presented. Amounts reflect performance for the period of the time the class had operations, which was 81 days, 81 days, 145 days and 227 days during the year ended October 31, 2004, 2003, 2002, and 2001, respectively. |
| |
1 | For additional information, please refer to the Glossary of Terms. |
| |
2 | The 7-day yield quotation more closely reflects the current earnings of the Fund than the total return quotation. |
| |
3 | Reflects the expense ratio as reported in the prospectus dated February 28, 2008. |
| |
5 | HSBC INVESTOR FAMILY OF FUNDS |
| |
| Portfolio Reviews |
|
HSBC Investor Tax-Free Money Market Fund | |
(Class A Shares, D Shares, I Shares and Y Shares) | |
| |
by Jason Moshos | |
Portfolio Manager | |
Investment Concerns
An investment in the fund is not insured or guaranteed by the FDIC or any other government agency. Although the fund seeks to preserve the value of your investment at $1.00 per share, it is possible to lose money by investing in the fund. The Fund’s income may be subject to the federal alternative minimum tax and to certain state and local taxes.
Rising default rates on subprime mortgages throughout the period hurt the credit ratings of many banks and financial services firms that invested in securities tied to these mortgages. The result was a severe credit and liquidity crisis that made many financial institutions unwilling to lend money and that shook investor confidence. For example, the credit ratings of three of the four monoline bond insurers (which provide insurance to certain municipal issuers) were downgraded as investors worried about the insurers’ ability to meet their obligations. The credit crisis pushed yields on tax-free money market securities well above their historical norms.
The Federal Reserve Board (the Fed) cut short-term interest rates aggressively—from 4.50% at the beginning of the period to 1.00% by the end of October—in an effort to shore up the credit markets and encourage lending. Those rate cuts, coupled with a “flight to quality” from investors looking for safety and liquidity, pushed yields on Treasury bills to extremely low levels. As a result, municipal money market securities offered attractive yields relative to comparable taxable money market securities.
The challenging and uncertain environment prompted us to position the Fund in a defensive stance. We maintained a weighted average maturity that was shorter than that of its benchmark throughout the period, which helped provide a high level of liquidity and preservation of principal. We also shifted the Fund’s allocation to the most liquid securities available, such as 1- and 7-day floating rate notes, while consistently rebalancing our holdings away from issues with the biggest credit risks and into relatively strong credits. These decisions benefited the Fund, as the types of securities we favored weathered the storm well. Additionally, we took advantage of a program by the U.S. Treasury to insure money market funds.*†
The supply of tax-free money market securities fluctuated considerably throughout the period as market conditions and overall demand levels shifted. During periods when there was a low supply of municipal securities, we invested a small amount of the Fund’s assets in taxable government issues. At all times, we kept the Fund’s taxable holdings well within the parameters set by the SEC and the Fund’s prospectus.*
* Portfolio composition is subject to change.
| |
† | On October 7, 2008 and December 4, 2008 the Fund participated in the Treasury Money Market Guarantee Program and related extension. The Program is for shareholders as of September 19, 2008 and generally covers the lesser of the amount that the shareholder held on September 19 or the amount they hold on the date the fund needs to utilize the guarantee. If a shareholder closes their account with the Fund or broker dealer after September 19, any future investment in the Fund will not be guaranteed. The extended guarantee is through April 30, 2009, but may be further extended at the Treasury’s discretion. |
| | | | | | | | | | | | | | | | | | | | | |
Fund Performance | | | | Average Annual
Total Return (%) | | Yield (%)2 | | Expense
Ratio (%)3 | |
|
|
|
|
|
|
|
|
|
|
As of October 31, 2008 | | Inception
Date | | 1
Year | | 3
Year | | Since
Inception | | 7-Day
Average | | Gross | | Net | |
|
|
|
|
|
|
|
|
|
|
|
|
|
|
|
|
Class A Shares** | | 8/27/04 | | | — | | | — | | 0.69 | | | — | | | | 0.94 | | | 0.94 | |
|
|
|
|
|
|
|
|
|
|
|
|
|
|
|
|
|
|
|
|
|
|
Class D Shares | | 8/24/04 | | | 2.13 | | | 2.65 | | 2.33 | | | 1.52 | | | | 0.79 | | | 0.79 | |
|
|
|
|
|
|
|
|
|
|
|
|
|
|
|
|
|
|
|
|
|
|
Class I Shares*** | | 6/25/04 | | | — | | | — | | 0.26 | | | — | | | | 0.44 | | | 0.44 | |
|
|
|
|
|
|
|
|
|
|
|
|
|
|
|
|
|
|
|
|
|
|
Class Y Shares | | 6/8/04 | | | 2.38 | | | 2.90 | | 2.51 | | | 1.77 | | | | 0.54 | | | 0.54 | |
|
|
|
|
|
|
|
|
|
|
|
|
|
|
|
|
|
|
|
|
|
|
Lipper Tax-Exempt Money | | | | | | | | | | | | | | | | | | | | | |
Market Funds Average1 | | — | | | 2.04 | | | 2.60 | | N/A | | | N/A | | | | N/A | | | N/A | |
|
|
|
|
|
|
|
|
|
|
|
|
|
|
|
|
|
|
|
|
|
|
Past performance does not guarantee future results. The performance data quoted represents past performance and current returns may be lower or higher. Total return figures include change in share price, reinvestment of dividends and capital gains and do not reflect taxes that a shareholder would pay on fund distributions or on the redemption of fund shares. The investment return and principal value will fluctuate so that an investor’s shares, when redeemed may be worth more or less than the original cost. To obtain performance information current to the most recent month end, please call 1-800-782-8183.
The performance above reflects any fee waivers that have been in effect during the applicable periods, as well as any expense reimbursements that have periodically been made. Absent such waivers and reimbursements, returns would have been lower.
| |
** | Class A Shares were operational during a portion of the periods presented. Amounts reflect performance for the period of the time the class had operations, which was 24 days, 78 days and 5 days during the years ended October 31, 2007, 2006 and 2004, respectively. |
| |
*** | Class I Shares were operational during a portion of the periods presented. Amounts reflect performance for the period of the time the class had operations, which was 27 and 40 days during the years ended October 31, 2005 and 2004, respectively. |
| |
1 | For additional information, please refer to the Glossary of Terms. |
| |
2 | The 7-day yield quotation more closely reflects the current earnings of the Fund than the total return quotation. |
| |
3 | Reflects the expense ratio as reported in the prospectus dated February 28, 2008. |
| |
HSBC INVESTOR FAMILY OF FUNDS | 6 |
| |
|
|
HSBC Investor U.S. Government Money Market Fund
(Class A Shares, B Shares, C Shares, D Shares, I Shares and Y Shares)
by John Chiodi
Senior Portfolio Manager | Moody’s and Standard & Poor’s
has assigned an “Aaa” and
“AAAm” rating to the HSBC
Investor U.S. Government
Money Market Fund.1 |
|
|
Investment Concerns
An investment in the fund is not insured or guaranteed by the FDIC or any other government agency. Although the fund seeks to preserve the value of your investment at $1.00 per share, it is possible to lose money by investing in the fund.
The credit crisis resulting from rising defaults on subprime mortgages deepened during the period under review, creating considerable turbulence in the money markets. The Federal Reserve Board (the “Fed”) attempted to improve liquidity and ease investor concerns by lowering its short-term interest rate from 4.50% to 1.00% between November 2007 and October 2008. The Fed’s easing policy caused a decline in money market securities’ yields.
Concerns about the financial system’s problems led to a widespread flight to quality. Investors shifted money out of assets they considered at greater risk from the credit and liquidity crisis, and into the markets’ most stable and liquid assets. That trend led to large inflows into the Fund, and pushed down yields on the types of securities in which the Fund invests. Additionally, we took advantage of a program by the U.S. Treasury to insure money market funds.*,†
During this challenging period, we primarily focused on ensuring liquidity in the event of sudden outflows. For example, we invested new assets in the Fund in securities with relatively short maturities that could be sold quickly and easily. The convergence of large inflows, low available yields and the need to position the Fund conservatively caused us to invest a large percentage of the Fund’s assets in securities paying low yields. That in turn, reduced the yield the Fund was able to pay to shareholders.*
* Portfolio composition is subject to change.
| |
† | On October 7, 2008 and December 4, 2008 the Fund participated in the Treasury Money Market Guarantee Program and related extension. The Program is for shareholders as of September 19, 2008 and generally covers the lesser of the amount that the shareholder held on September 19 or the amount they hold on the date the fund needs to utilize the guarantee. If a shareholder closes their account with the Fund or broker dealer after September 19, any future investment in the Fund will not be guaranteed. The extended guarantee is through April 30, 2009, but may be further extended at the Treasury’s discretion. |
| | | | | | | | | | | | | | | |
Fund Performance | | | | Average Annual
Total Return (%) | | Yield (%)3 | | Expense
Ratio (%)4 | |
|
|
|
|
|
|
|
|
As of October 31, 2008 | | Inception
Date | | 1
Year | | 5
Year | | 10
Year | | Since
Inception | | 7-Day
Average | | Gross | | Net | |
|
|
|
|
|
|
|
|
|
|
|
|
|
|
|
|
|
|
Class A Shares | | 5/3/90 | | 2.20 | | 2.71 | | 2.90 | | 3.73 | | 1.10 | | 0.67 | | 0.67 | |
|
|
|
|
|
|
|
|
|
|
|
|
|
|
|
|
|
|
Class B Shares** | | 9/11/98 | | -2.33 | | 2.53 | | 2.60 | | 2.62 | | 0.50 | | 1.27 | | 1.27 | |
|
|
|
|
|
|
|
|
|
|
|
|
|
|
|
|
|
|
Class C Shares*** | | 11/20/06 | | 0.59 | | — | | — | | 2.76 | | 0.99 | | 1.27 | | 1.27 | |
|
|
|
|
|
|
|
|
|
|
|
|
|
|
|
|
|
|
Class D Shares | | 4/1/99 | | 2.36 | | 2.87 | | — | | 2.99 | | 1.25 | | 0.52 | | 0.52 | |
|
|
|
|
|
|
|
|
|
|
|
|
|
|
|
|
|
|
Class I Shares**** | | 12/24/03 | | 2.72 | | — | | — | | 3.84 | | 2.09 | | 0.17 | | 0.17 | |
|
|
|
|
|
|
|
|
|
|
|
|
|
|
|
|
|
|
Class Y Shares | | 7/1/96 | | 2.61 | | 3.12 | | 3.30 | | 3.65 | | 1.50 | | 0.27 | | 0.27 | |
|
|
|
|
|
|
|
|
|
|
|
|
|
|
|
|
|
|
Lipper U.S. Government
Money Market Funds Average2 | | — | | 2.23 | | 2.66 | | 2.93 | | N/A | | N/A | | N/A | | N/A | |
|
|
|
|
|
|
|
|
|
|
|
|
|
|
|
|
|
|
Past performance does not guarantee future results. The performance data quoted represents past performance and current returns may be lower or higher. Total return figures include change in share price, reinvestment of dividends and capital gains and do not reflect taxes that a shareholder would pay on fund distributions or on the redemption of fund shares. The investment return and principal value will fluctuate so that an investor’s shares, when redeemed may be worth more or less than the original cost. To obtain performance information current to the most recent month end, please call 1-800-782-8183.
The performance above reflects any fee waivers that have been in effect during the applicable periods, as well as any expense reimbursements that have periodically been made. Absent such waivers and reimbursements, returns would have been lower. Currently, for Class I Shares contractual fee waivers are in effect from March 1, 2008 through March 1, 2009.
| |
** | Reflects the applicable contingent deferred sales charge, maximum of 4.00%. |
| |
*** | Reflects the applicable contingent deferred sales charge, maximum of 1.00%. |
| |
**** | Class I Shares were operational during a portion of the periods presented. Amounts reflect performance for the period of the time the class had operations, which was 357 days, 136 days, 89 days and 10 days during the years ended October 31, 2007, 2006, 2005 and 2004, respectively. |
| |
1 | The “Aaa” and “AAAm” money market fund rating is historical and reflects the superior quality of the Fund’s investments, sound liquidity management, and strong operations and trading support. Periodic reviews are conducted to ensure a secure operations environment. Moody’s and Standard & Poor’s ratings represent an opinion only, not a recommendation to buy or sell. |
| |
2 | For additional information, please refer to the Glossary of Terms. |
| |
3 | The 7-day yield quotation more closely reflects the current earnings of the Fund than the total return quotation. |
| |
4 | Reflects the expense ratio as reported in the prospectus dated February 28, 2008. |
| |
7 | HSBC INVESTOR FAMILY OF FUNDS |
| |
HSBC Investor U.S. Treasury Money Market Fund |
|
(Class A Shares, B Shares, C Shares, D Shares, I Shares and Y Shares)
by John Chiodi
Senior Portfolio Manager | Standard & Poor’s has assigned an
“AAA” rating to the HSBC Investor
U.S. Treasury Money Market Fund.1 |
|
|
Investment Concerns
An investment in the fund is not insured or guaranteed by the FDIC or any other government agency. Although the fund seeks to preserve the value of your investment at $1.00 per share, it is possible to lose money by investing in the fund. The Fund’s income may be subject to the federal alternative minimum tax and to certain state and local taxes.
Rising subprime mortgage defaults led to a credit and liquidity crisis during the 12-month period ended October 31, 2008. The Federal Reserve Board (the “Fed”) attempted to address these problems by cutting the federal funds rate from 4.50% to 1.00% between November 2007 and October 2008. The Fed’s actions caused yields on money market securities to fall.
Investors worried about the financial system’s troubles fled to the market’s highest-quality and most liquid securities, such as those issued by the U.S. Treasury. That development caused the Fund to experience very large inflows, while simultaneously pushing down yields on the types of securities in which the Fund invests.*
We sought to protect shareholders’ principal in this uncertain environment. We were concerned that an improvement in the financial markets could result in new assets flowing out of the Fund. As a result, we invested these new assets in securities with relatively short maturities to achieve a high level of liquidity. The convergence of large amounts of new assets, extremely low available yields and the need to invest conservatively caused us to invest a significant percentage of the Fund’s assets in securities that paid low yields, which in turn reduced the yield the Fund was able to pay to shareholders.*
* Portfolio composition is subject to change.
| | | | | | | | | | | | | | | |
Fund Performance | | | | Average Annual
Total Return (%) | | Yield (%)3 | | Expense
Ratio (%)4 | |
|
|
|
|
|
|
|
|
As of October 31, 2008 | | Inception
Date | | 1
Year | | 5
Year | | Since
Inception | | 7-Day
Average | | Gross | | Net | |
|
|
|
|
|
|
|
|
|
|
|
|
|
|
|
|
Class A Shares | | 5/24/01 | | 1.38 | | 2.31 | | 1.88 | | 0.20 | | 0.72 | | 0.72 | |
|
|
|
|
|
|
|
|
|
|
|
|
|
|
|
|
Class B Shares** | | 8/13/04 | | -3.14 | | — | | 2.10 | | 0.20 | | 1.32 | | 1.32 | |
|
|
|
|
|
|
|
|
|
|
|
|
|
|
|
|
Class C Shares*** | | 8/6/08 | | — | | — | | 0.01 | | 0.20 | | 1.32 | | 1.32 | |
|
|
|
|
|
|
|
|
|
|
|
|
|
|
|
|
Class D Shares | | 5/14/01 | | 1.53 | | 2.46 | | 2.04 | | 0.33 | | 0.57 | | 0.57 | |
|
|
|
|
|
|
|
|
|
|
|
|
|
|
|
|
Class I Shares**** | | 12/30/03 | | 1.90 | | — | | 2.68 | | 0.68 | | 0.22 | | 0.20 | |
|
|
|
|
|
|
|
|
|
|
|
|
|
|
|
|
Class Y Shares | | 5/11/01 | | 1.78 | | 2.72 | | 2.29 | | 0.58 | | 0.32 | | 0.32 | |
|
|
|
|
|
|
|
|
|
|
|
|
|
|
|
|
Lipper U.S. Treasury Money Market Funds Average2 | | — | | 1.63 | | 2.43 | | N/A | | N/A | | N/A | | N/A | |
|
|
|
|
|
|
|
|
|
|
|
|
|
|
|
|
Past performance does not guarantee future results. The performance data quoted represents past performance and current returns may be lower or higher. Total return figures include change in share price, reinvestment of dividends and capital gains and do not reflect taxes that a shareholder would pay on fund distributions or on the redemption of fund shares. The investment return and principal value will fluctuate so that an investor’s shares, when redeemed may be worth more or less than the original cost. To obtain performance information current to the most recent month end, please call 1-800-782-8183.
The performance above reflects any fee waivers that have been in effect during the applicable periods, as well as any expense reimbursements that have periodically been made. Absent such waivers and reimbursements, returns would have been lower. Currently, for Class I contractual fee waivers are in effect from March 1, 2008 through March 1, 2009.
| |
** | Reflects the applicable contingent deferred sales charge, maximum of 4.00%. |
| |
*** | Reflects the applicable contingent deferred sales charge, maximum of 1.00%. |
| |
**** | Class I Shares were operational during a portion of the periods presented. Amounts reflect performance for the period of the time the class had operations, which was 280 and 13 days during the year ended October 31, 2005 and 2004, respectively. |
| |
1 | The “AAA” money market fund rating is historical and reflects the superior quality of the Fund’s investments, sound liquidity management, and strong operations and trading support. Periodic reviews are conducted to ensure a secure operations environment. Standard & Poor’s rating represent an opinion only, not a recommendation to buy or sell. |
| |
2 | For additional information, please refer to the Glossary of Terms. |
| |
3 | The 7-day yield quotation more closely reflects the current earnings of the Fund than the total return quotation. |
| |
4 | Reflects the expense ratio as reported in the prospectus dated February 28, 2008. |
| |
HSBC INVESTOR FAMILY OF FUNDS | 8 |
Portfolio Composition*
October 31, 2008
(Unaudited)
| | | | |
HSBC Investor California Tax-Free Money Market Fund | | | | |
|
|
|
|
|
|
Investment Allocation | | Percentage of Investments at Value | |
|
|
|
|
Variable Rate Notes | | 73.7 | % | |
|
|
|
|
|
Tax-Free Notes and Commercial Paper | | 18.9 | % | |
|
|
|
|
|
Cash and Equivalents | | 7.4 | % | |
|
|
|
|
|
Total | | 100.0 | % | |
|
|
|
|
|
| | | | |
HSBC Investor Prime Money Market Fund | | | | |
|
|
|
|
|
|
Investment Allocation | | Percentage of Investments at Value | |
|
|
|
|
Commercial Paper and Notes | | 41.1 | % | |
|
|
|
|
|
Certificates of Deposit | | 16.2 | % | |
|
|
|
|
|
U.S. Government and Government Agency Obligations | | 12.9 | % | |
|
|
|
|
|
Repurchase Agreements | | 10.8 | % | |
|
|
|
|
|
Corporate Obligations | | 10.2 | % | |
|
|
|
|
|
Time Deposits | | 6.5 | % | |
|
|
|
|
|
Yankee Dollars | | 2.3 | % | |
|
|
|
|
|
Total | | 100.0 | % | |
|
|
|
|
|
| | | | |
HSBC Investor N.Y. Tax-Free Money Market Fund | | | | |
|
|
|
|
|
|
Investment Allocation | | Percentage of Investments at Value | |
|
|
|
|
Variable Rate Notes | | 84.8 | % | |
|
|
|
|
|
Tax-Free Notes and Commercial Paper | | 11.5 | % | |
|
|
|
|
|
Cash and Equivalents | | 3.7 | % | |
|
|
|
|
|
Total | | 100.0 | % | |
|
|
|
|
|
| | | | |
HSBC Investor Tax-Free Money Market Fund | | | | |
|
|
|
|
|
|
Investment Allocation | | Percentage of Investments at Value | |
|
|
|
|
Variable Rate Notes | | 78.9 | % | |
|
|
|
|
|
Commercial Paper and Tax-Free Notes | | 15.7 | % | |
|
|
|
|
|
Cash and Equivalents | | 5.4 | % | |
|
|
|
|
|
Total | | 100.0 | % | |
|
|
|
|
|
| | | | |
HSBC Investor U.S. Government Money Market Fund | | | | |
|
|
|
|
|
|
Investment Allocation | | Percentage of Investments at Value | |
|
|
|
|
U.S. Government and Government Agency Obligations | | 84.6 | % | |
|
|
|
|
|
Repurchase Agreements | | 15.4 | % | |
|
|
|
|
|
Total | | 100.0 | % | |
|
|
|
|
|
| | | | |
HSBC Investor U.S. Treasury Money Market Fund | | | | |
|
|
|
|
|
|
Investment Allocation | | Percentage of Investments at Value | |
|
|
|
|
U.S. Treasury Bills | | 100.0 | % | |
|
|
|
|
|
U.S. Treasury Notes | | 0.0 | % | |
|
|
|
|
|
Total | | 100.0 | % | |
|
|
|
|
|
* Portfolio composition is subject to change.
| |
9 | HSBC INVESTOR FAMILY OF FUNDS |
|
HSBC INVESTOR CALIFORNIA TAX-FREE MONEY MARKET FUND |
|
Schedule of Portfolio Investments—as of October 31, 2008 |
| | | | | | | |
Variable Rate Demand Notes—73.6% | | | | | | | |
|
|
|
|
|
|
|
|
| | | | | | | |
| | Principal
Amount ($) | | Value ($) | |
| |
|
| |
|
| |
California – 73.6% | | | | | | | |
ABAG Finance Authority for Nonprofit
Corps. Multi-family Revenue, Series A,
1.55%, 12/15/32, (Credit Support
FNMA) (a) | | | 1,975,000 | | | 1,975,000 | |
ABAG Finance Authority for Nonprofit
Corps. Revenue, 1.30%, 9/1/23, (LOC
Bank of America N.A.) (a) | | | 515,000 | | | 515,000 | |
ABAG Finance Authority for Nonprofit
Corps. Revenue, 1.70%, 8/1/31, (LOC
Allied Irish Bank plc) (a) | | | 480,000 | | | 480,000 | |
ABAG Finance Authority for Nonprofit
Corps. Revenue, 1.70%, 8/1/34, (LOC
Allied Irish Bank plc) (a) | | | 1,150,000 | | | 1,150,000 | |
ABAG Finance Authority for Nonprofit
Corps. Revenue, Series A, 1.70%,
4/1/35, (LOC Allied Irish
Bank plc) (a) | | | 1,670,000 | | | 1,670,000 | |
ABAG Finance Authority for Nonprofit
Corps. Revenue, 1.40%, 7/1/35, (LOC
Wells Fargo Bank N.A., U.S. Bank
N.A.) (a) | | | 1,955,000 | | | 1,955,000 | |
ABAG Finance Authority for Nonprofit
Corps. Revenue, 1.55%, 9/1/35, (LOC
Bank of New York) (a) | | | 775,000 | | | 775,000 | |
ABAG Finance Authority for Nonprofit
Corps. Revenue, 1.70%, 9/1/36, (LOC
Allied Irish Bank plc) (a) | | | 1,525,000 | | | 1,525,000 | |
ABAG Finance Authority for Nonprofit
Corps. Revenue, 1.55%, 3/1/37, (LOC
Bank of America N.A.) (a) | | | 1,500,000 | | | 1,500,000 | |
Alameda Public Financing Authority
Multi-family Revenue, Series A,
1.80%, 5/15/35, (Credit Support
FNMA) (a) | | | 2,165,000 | | | 2,165,000 | |
California Municipal Finance Authority
Solid Waste Disposal Revenue,
Series A, 1.55%, 2/1/19, (LOC JP
Morgan Chase Bank) (a) | | | 2,500,000 | | | 2,500,000 | |
California Economic Development
Financing Authority IDR, 1.83%,
5/1/23, AMT, (LOC Wells Fargo Bank
N.A.) (a) | | | 1,430,000 | | | 1,430,000 | |
California Health Facilities Financing
Authority Revenue, Series A, 1.65%,
8/1/21, (LOC U.S. Bank N.A.) (a) | | | 500,000 | | | 500,000 | |
California Infrastructure & Economic
Development Bank Revenue, Series A,
0.95%, 9/1/37, (LOC Allied Irish
Bank plc) (a) | | | 500,000 | | | 500,000 | |
California Infrastructure & Economic
Development Bank Revenue, 1.50%,
11/15/37, (LOC Bank of New York,
California State Teacher’s
Retirement) (a) | | | 1,500,000 | | | 1,500,000 | |
California Infrastructure & Economic
Development Bank Revenue, Series B,
0.60%, 4/1/42, (LOC Bank of
America N.A.) (a) | | | 500,000 | | | 500,000 | |
California Municipal Finance Authority
Revenue, 1.40%, 7/1/38, (LOC U.S.
Bank N.A.) (a) | | | 1,500,000 | | | 1,500,000 | |
| | | | | | | |
Variable Rate Demand Notes, continued | | | | | | | |
|
|
|
|
|
|
|
|
| | | | | | | |
| | Principal
Amount ($) | | Value ($) | |
| |
| |
| |
California, continued | | | | | | | |
California Pollution Control Financing
Authority Revenue, Series C, 1.00%,
11/1/26, (LOC JP Morgan Chase
Bank) (a) | | | 300,000 | | | 300,000 | |
California School Facilities Financing
Corp. Certificates of Participation,
Series C, 1.75%, 7/1/22, (LOC KBC
Bank NV) (a) | | | 375,000 | | | 375,000 | |
California State Department of Water
Resources Power Supply Revenue,
Subseries G-7, 2.25%, 5/1/17, (Credit
Support FSA, SpA Societe
Generale) (a) | | | 2,000,000 | | | 2,000,000 | |
California State Department of Water
Resources Power Supply Revenue,
0.90%, 5/1/20, (LOC JP Morgan
Chase Bank, Societe Generale) (a) | | | 300,000 | | | 300,000 | |
California State Department of Water
Resources Power Supply Revenue,
Sub-series I-1, 0.70%, 5/1/22, (LOC
Allied Irish Bank plc) (a) | | | 600,000 | | | 600,000 | |
California State Department of Water
Resources Power Supply Revenue,
0.70%, 5/1/22, (LOC Bank of New
York, California State Teachers
Retirement) (a) | | | 600,000 | | | 600,000 | |
California State Department of Water
Resources Power Supply Revenue,
Series C-11, 1.00%, 5/1/22, (LOC KBC
Bank NV) (a) | | | 650,000 | | | 650,000 | |
California State Department of Water
Resources Power Supply Revenue,
Series C-5, 3.10%, 5/1/22, (LOC Dexia
Credit Local) (a) | | | 4,500,000 | | | 4,500,000 | |
California State Department of Water
Resources Supply Revenue, Series B-5,
0.60%, 5/1/22, (LOC Bayerische
Landesbank, Westdeutsche
Landesbank) (a) | | | 1,300,000 | | | 1,300,000 | |
California State Economic Development
Financing Authority IDR, 1.83%,
4/1/16, AMT, (LOC Wells Fargo
Bank N.A.) (a) | | | 800,000 | | | 800,000 | |
California State GO, Series A-3, 0.60%,
5/1/33, (LOC Westdeutsche
Landesbank AG, JP Morgan Chase
Bank) (a) | | | 1,400,000 | | | 1,400,000 | |
California State GO, Series A-2, 0.70%,
5/1/33, (LOC Westdeutsche
Landesbank, JP Morgan Chase
Bank) (a) | | | 1,185,000 | | | 1,185,000 | |
California State GO, 0.90%, 5/1/33,
(LOC Westlandesbank AG, JP Morgan
Chase Bank) (a) | | | 4,400,000 | | | 4,400,000 | |
California State GO, Series B-3, 1.25%,
5/1/33, (LOC BNP Paribas, Bank of
New York, California State Teacher’s
Retirement) (a) | | | 510,000 | | | 510,000 | |
California State GO, Series A-5, 0.70%,
5/1/34, (LOC Citibank N.A.,
California State Tchrs Ret) (a) | | | 500,000 | | | 500,000 | |
| | |
See notes to financial statements | HSBC INVESTOR FAMILY OF FUNDS | 10 |
|
HSBC INVESTOR CALIFORNIA TAX-FREE MONEY MARKET FUND |
|
Schedule of Portfolio Investments—as of October 31, 2008 (continued) |
| | | | | | | |
Variable Rate Demand Notes, continued | | | | | | | |
|
|
|
|
|
|
|
|
| | | | | | | |
| | Principal
Amount ($) | | Value ($) | |
| |
| |
| |
California, continued | | | | | | | |
California State GO, 1.25%, 5/1/34,
(LOC Citibank N.A.) (a) | | | 3,500,000 | | | 3,500,000 | |
California State GO, 0.95%, 5/1/40,
(LOC Landesbank Hessen) (a) | | | 1,520,000 | | | 1,520,000 | |
California Statewide Communities
Development Authority Revenue,
1.70%, 5/1/35, (LOC Allied Irish
Bank plc) (a) | | | 900,000 | | | 900,000 | |
California Statewide Communities
Development Authority Revenue,
Series B, 1.21%, 6/1/35, (LOC
Citibank N.A.) (a) | | | 3,000,000 | | | 3,000,000 | |
California Statewide Communities
Development Authority Revenue,
1.70%, 7/1/36, (LOC Allied Irish
Bank plc) (a) | | | 250,000 | | | 250,000 | |
California Statewide Communities
Development Authority Revenue,
Series A, 1.17%, 12/1/37, (LOC Wells
Fargo Bank N.V.) (a) | | | 2,000,000 | | | 2,000,000 | |
Contra Costa County California Housing
Authority Multifamily Revenue, 1.40%,
11/15/17, (Credit Support
FHLMC) (a) | | | 535,000 | | | 535,000 | |
Corona-Norco California Unified School
District Certificates of Participation,
4.00%, 11/1/21, (Credit Support FSA,
SpA Dexia Credit Local) (a) | | | 1,100,000 | | | 1,100,000 | |
Fremont California Certificates of
Participation, 1.60%, 8/1/22, (LOC
KBC Bank NV) (a) | | | 1,100,000 | | | 1,100,000 | |
Irvine California Improvement Bond Act
1915 Revenue, Series B, 0.60%, 9/2/30,
(LOC KBC Bank NV) (a) | | | 300,000 | | | 300,000 | |
Irvine California Improvement Bond Act
1915 Special Assessment, 0.60%,
9/2/24, (LOC KBC Bank NV) (a) | | | 393,000 | | | 393,000 | |
Irvine Public Facilities & Infrastructure
Authority Lease Revenue, 2.45%,
11/1/10, (LOC State Street B&T
Co.) (a) | | | 1,085,000 | | | 1,085,000 | |
Irvine Ranch California Water District
Revenue, 1.10%, 10/1/10, (LOC
Landesbank Hessen-Thuringen) (a) | | | 500,000 | | | 500,000 | |
Loma Linda California Hospital Revenue,
Series B-2, 0.90%, 12/1/37, (LOC
Bank of America N.A.) (a) | | | 1,000,000 | | | 1,000,000 | |
Los Angeles California Certificates of
Participation, Series A, 1.70%, 7/1/37,
(LOC Allied Irish Bank plc) (a) | | | 250,000 | | | 250,000 | |
Los Angeles California Wastewater
System Revenue, Series A, 1.40%,
6/1/28, (LOC Bank of Nova
Scotia) (a) | | | 500,000 | | | 500,000 | |
Los Angeles Community Redevelopment
Agency Certificates of Participation,
1.50%, 12/1/14, (LOC Wells Fargo
Bank N.A.) (a) | | | 1,000,000 | | | 1,000,000 | |
Los Angeles County Housing Authority
Multi-family Housing Revenue, 1.30%,
5/1/33, (Credit Support FHLMC) (a) | | | 1,150,000 | | | 1,150,000 | |
| | | | | | | |
Variable Rate Demand Notes, continued | | | | | | | |
|
|
|
|
|
|
|
|
| | | | | | | |
| | Principal
Amount ($) | | Value ($) | |
| |
| |
| |
California, continued | | | | | | | |
Los Angeles Unified School District
Certificates of Participation,
Series A, 1.25%, 12/1/17, (LOC
Bank of New York) (a) | | | 1,000,000 | | | 1,000,000 | |
Modesto California Multi-family
Housing Revenue, 1.65%, 5/15/31,
(Credit Support FNMA) (a) | | | 1,470,000 | | | 1,470,000 | |
Oakland-Alameda County California
Coliseum Authority Lease Revenue,
Series C-1, 1.80%, 2/1/25, (LOC Bank
of New York, California State
Teacher’s Retirement) (a) | | | 1,600,000 | | | 1,600,000 | |
Orange County California Apartment
Development Revenue, Series 2,
1.35%, 11/15/28, (Credit Support
FNMA) (a) | | | 800,000 | | | 800,000 | |
Redondo Beach Public Financing
Authority Revenue, 1.20%, 9/1/22,
(LOC Allied Irish Bank plc) (a) | | | 455,000 | | | 455,000 | |
Redwood City California Certificates of
Participation, 1.70%, 7/1/21, (LOC
KBC Bank NV) (a) | | | 1,995,000 | | | 1,995,000 | |
Sacramento California Suburban Water
District Certificates of Participation,
Series A-2, 1.17%, 11/1/28, (LOC
Allied Irish Bank plc) (a) | | | 600,000 | | | 600,000 | |
Sacramento County California Sanitation
District Financing Authority Revenue,
1.40%, 12/1/30, (LOC Bank of
America N.A.) (a) | | | 950,000 | | | 950,000 | |
San Bernardino County California
Certificates of Participation, 1.18%,
7/1/15, (LOC BNP Paribas) (a) | | | 500,000 | | | 500,000 | |
San Diego County California
Certificates of Participation, 1.30%,
11/1/30, (LOC Bank of America
N.A.) (a) | | | 515,000 | | | 515,000 | |
San Jose California Financing Authority
Lease Revenue, Series C, 1.18%,
6/1/27, (LOC Bank of Nova
Scotia) (a) | | | 2,700,000 | | | 2,700,000 | |
San Mateo County California Board of
Education Certificate of Participation,
Series A, 1.80%, 5/1/35, (LOC Allied
Irish Bank plc) (a) | | | 1,150,000 | | | 1,150,000 | |
San Rafael California Redev Agency
Multi-family Revenue, series A, 1.55%,
9/1/31, (LOC Citibank N.V..) (a) | | | 500,000 | | | 500,000 | |
Santa Ana Unified School District
Certificates of Participation, 1.40%,
7/1/15, (LOC BNP Paribas) (a) | | | 1,700,000 | | | 1,700,000 | |
Santa Clara California Electric Revenue,
Sub-series B, 2.87%, 7/1/27, (LOC
Dexia Credit Local) (a) | | | 1,600,000 | | | 1,600,000 | |
Simi Valley Community Development
Agency Multi-family Revenue, 1.55%,
5/1/10 (a) | | | 1,000,000 | | | 1,000,000 | |
| | |
11 | HSBC INVESTOR FAMILY OF FUNDS | See notes to financial statements |
|
HSBC INVESTOR CALIFORNIA TAX-FREE MONEY MARKET FUND |
|
Schedule of Portfolio Investments—as of October 31, 2008 (continued) |
| | | | | | | |
Variable Rate Demand Notes, continued | | | | | | | |
|
|
|
|
|
|
|
|
| | | | | | | |
| | Principal
Amount ($) | | Value ($) | |
| |
| |
| |
California, continued | | | | | | | |
Stockton California Health Facilities
Revenue, Series A, 1.30%, 12/1/32,
(LOC Citibank N.V.) (a) | | | 700,000 | | | 700,000 | |
| | | | |
|
| |
| | | | | | 80,878,000 | |
| | | | |
|
| |
TOTAL VARIABLE RATE DEMAND
NOTES (COST $80,878,000) | | | | | | 80,878,000 | |
| | | | |
|
| |
| | | | | | | |
Tax-Free Notes And Commercial Paper—18.8% | | | | | | | |
|
|
|
|
|
|
|
|
California – 18.8% | | | | | | | |
California State University, Series A,
1.43%, 1/6/09, (LOC State Street
Bank) | | | 2,000,000 | | | 2,000,000 | |
Los Angeles Muni Improvement,
Series A-2, 1.85%, 11/3/08, (LOC
Bank of America N.V.) | | | 2,200,000 | | | 2,200,000 | |
Los Angeles Municipal Improvement
Corp., Series A-2, 1.56%, 11/5/08,
(LOC Bank of America N.A.) | | | 1,000,000 | | | 1,000,000 | |
Orange County Local Transit, Series A,
1.60%, 2/3/09 | | | 3,275,000 | | | 3,275,000 | |
Riverside County Teeter Finance,
Series B, 1.55%, 11/12/08, (LOC
Bank of Nova Scotia) | | | 2,500,000 | | | 2,500,000 | |
San Diego County Regional Airport,
Series B, 1.55%, 12/11/08, AMT,
(LOC Lloyds Bank) | | | 2,500,000 | | | 2,500,000 | |
San Diego County Regional Airport
Authority Revenue, Series B, 1.55%,
12/4/08, AMT, (LOC Lloyds Bank) | | | 2,500,000 | | | 2,500,000 | |
San Gabriel Valley Government, 1.47%,
12/1/08, (LOC Bayerische
Landesbank) | | | 3,500,000 | | | 3,500,000 | |
Ventura County California Public
Financing Authority Lease Revenue
Notes, 1.48%, 11/6/08, (LOC Bank of
Nova Scotia) | | | 1,200,000 | | | 1,200,000 | |
| | | | |
|
| |
| | | | | | 20,675,000 | |
| | | | |
|
| |
TOTAL TAX-FREE NOTES AND
COMMERCIAL PAPER
(COST $20,675,000) | | | | | | 20,675,000 | |
| | | | |
|
| |
Investment Companies—7.4% | | | | | | | |
|
|
|
|
|
|
|
|
BlackRock Provident California
Institutional Shares, 1.43% (b) | | | 3,848,708 | | | 3,848,708 | |
Northern Institutional Tax Exempt
Portfolio, 1.86% (b) | | | 4,265,966 | | | 4,265,966 | |
| | | | |
|
| |
TOTAL INVESTMENT COMPANIES
(COST $8,114,674) | | | | | | 8,114,674 | |
| | | | |
|
| |
TOTAL INVESTMENTS
(COST $109,667,674)—99.8% | | | | | | 109,667,674 | |
| | | | |
|
| |
| |
| Percentages indicated are based on net assets of $109,866,043. |
| |
(a) | Variable rate security. The interest rates on these securities are adjusted periodically to reflect then-current short term interest rates. The rates presented represent the rates in effect on October 31, 2008. The maturity dates presented reflect final maturity dates. However, some of these securities may contain put or demand features that allow the issuer to repurchase the security from the fund within various time periods, including daily, weekly, monthly, or semi-annually. |
| |
(b) | The rates presented represent the annualized one day yield that was in effect on October 31, 2008. |
| | |
AMT | — | Interest on security is subject to federal alternative minimum tax |
FHLMC | — | Federal Home Loan Mortgage Corporation |
FNMA | — | Federal National Mortgage Association |
FSA | — | Financial Security Assurance |
GO | — | General Obligation |
IDR | — | Industrial Development Revenue |
LOC | — | Letter of Credit |
PLC | — | Public Limited Co. |
SPA | — | Standby Purchase Agreement |
| | |
See notes to financial statements | HSBC INVESTOR FAMILY OF FUNDS | 12 |
|
HSBC INVESTOR PRIME MONEY MARKET FUND |
|
Schedule of Portfolio Investments—as of October 31, 2008 |
|
Corporate Obligations—10.4% |
|
| | | | | | | |
| | Principal
Amount ($) | | Value ($) | |
| |
| |
| |
Banking – 7.4% | | | | | | | |
Bank of America Corp., Series BKNT,
4.35%, 10/3/09 (a) | | | 80,000,000 | | | 80,000,000 | |
Wells Fargo & Co., 4.71%, 5/15/09 (a) | | | 50,000,000 | | | 50,009,429 | |
BNP Paribas, 3.01%, 8/13/09 (a) | | | 65,000,000 | | | 65,000,000 | |
Rabobank Nederland NV, 2.78%,
11/14/08 (a) | | | 154,000,000 | | | 154,000,000 | |
National Australia Bank, 3.03%,
2/6/09 (a) | | | 60,000,000 | | | 60,000,000 | |
Westpac Banking Corp., 2.95%,
2/6/09 (a) | | | 100,000,000 | | | 99,989,472 | |
Royal Bank of Canada, 3.10%,
11/13/09 (a) | | | 50,000,000 | | | 50,000,000 | |
U.S. Bank N.A., Series BKNT, 2.91%,
9/10/09 (a) | | | 75,000,000 | | | 75,000,000 | |
| | | | |
|
| |
| | | | | | 633,998,901 | |
| | | | |
|
| |
| | | | | | | |
Finance – 3.0% | | | | | | | |
American Honda Finance, 3.03%,
9/18/09, MTN (a) | | | 50,000,000 | | | 50,000,000 | |
American Honda Finance, 2.86%,
5/12/09, MTN (a) | | | 50,000,000 | | | 49,993,597 | |
Citigroup, Inc., 3.51%, 1/30/09 (a) | | | 77,990,000 | | | 77,931,356 | |
JP Morgan Chase & Co., Series C,
4.19%, 4/3/09 (a) | | | 75,000,000 | | | 75,000,949 | |
| | | | |
|
| |
| | | | | | 252,925,902 | |
| | | | |
|
| |
| | | | | | | |
TOTAL CORPORATE OBLIGATIONS
(COST $886,924,803) | | | | | | 886,924,803 | |
| | | | |
|
| |
| | | | | | | |
U.S. Government and Government Agency Obligations—13.0% | | | | | | | |
|
|
|
|
|
|
|
|
Federal Home Loan Bank – 7.0% | | | | | | | |
2.55%, 1/26/09 (c) | | | 100,000,000 | | | 99,402,778 | |
2.71%, 2/23/09 (c) | | | 100,000,000 | | | 99,160,833 | |
Series 2, 3.77%, 3/27/09 (a) | | | 100,000,000 | | | 100,000,000 | |
Series 1, 3.59%, 4/30/09 (a) | | | 75,000,000 | | | 75,000,000 | |
2.95%, 7/28/09, Callable
1/28/09 @ 100 | | | 50,000,000 | | | 50,000,000 | |
Series 1, 2.82%, 9/10/09 (a) | | | 100,000,000 | | | 99,963,297 | |
Series 1, 3.16%, 12/28/09 (a) | | | 75,000,000 | | | 74,960,210 | |
| | | | |
|
| |
| | | | | | 598,487,118 | |
| | | | |
|
| |
| | | | | | | |
Federal Home Loan Mortgage
Corp. – 3.1% | | | | | | | |
Series RB, 2.35%, 2/10/09 (c) | | | 50,000,000 | | | 49,677,361 | |
2.33%, 3/16/09 (c) | | | 74,500,000 | | | 73,871,594 | |
Series RB, 2.51%, 3/17/09 (c) | | | 100,000,000 | | | 99,074,444 | |
2.90%, 6/12/09, Callable
12/12/08 @ 100 | | | 43,000,000 | | | 43,000,000 | |
| | | | |
|
| |
| | | | | | 265,623,399 | |
| | | | |
|
| |
| | | | | | | |
U.S. Government and Government Agency Obligations, continued | | | | | | | |
|
|
|
|
|
|
|
|
| | | | | |
| | Principal
Amount ($) | | Value ($) | |
| |
| |
| |
Federal National Mortgage
Association – 2.9% | | | | | | | |
2.36%, 1/21/09 (c) | | | 50,000,000 | | | 49,735,625 | |
2.55%, 2/9/09 (c) | | | 50,000,000 | | | 49,652,778 | |
2.39%, 2/25/09 (c) | | | 100,000,000 | | | 99,249,222 | |
2.32%, 4/6/09 (c) | | | 50,000,000 | | | 49,501,667 | |
| | | | |
|
| |
| | | | | | 248,139,292 | |
| | | | |
|
| |
TOTAL U.S. GOVERNMENT AND
GOVERNMENT AGENCY
OBLIGATIONS
(COST $1,112,249,809) | | | | | | 1,112,249,809 | |
| | | | |
|
| |
| | | | | | | |
Commercial Paper And Notes—41.7% | | | | | | | |
|
|
|
|
|
|
|
|
Banking – 19.0% | | | | | | | |
Allied Irish Banks N.A., 2.89%, 12/1/08,
(LOC Allied Irish Banks) (c) | | | 100,000,000 | | | 99,762,500 | |
Australia & New Zealand Banking
Group, 2.41%, 12/2/08 (b)(c) | | | 50,000,000 | | | 49,896,667 | |
Bank of America Corp., 2.80%,
11/17/08 (c) | | | 75,000,000 | | | 74,906,833 | |
Bank of Ireland, 2.87%,
11/17/08 (b)(c) | | | 75,000,000 | | | 74,905,000 | |
Barclays U.S. Funding LLC, 2.81%,
12/9/08 (c) | | | 50,000,000 | | | 49,852,750 | |
Bayerische Landesbank Giro, 2.64%,
11/4/08 (c) | | | 50,000,000 | | | 49,989,042 | |
Depfa Bank plc, 3.20%, 3/3/09 (b)(c) | | | 50,000,000 | | | 49,466,250 | |
Dexia Delaware LLC, 0.74%,
11/3/08 (c) | | | 250,000,000 | | | 249,989,722 | |
DNB Norbank ASA, 2.84%,
12/3/08 (b)(c) | | | 75,000,000 | | | 74,812,667 | |
DNB Norbank ASA, 3.07%,
2/9/09 (b)(c) | | | 75,000,000 | | | 74,379,167 | |
Intesa Funding LLC, 2.78%, 12/1/08,
(LOC Intesa Sanpaolo SpA) (c) | | | 75,000,000 | | | 74,827,500 | |
Intesa Funding LLC, 2.83%, 12/5/08,
(LOC Intesa Sanpaolo S.p.A) (c) | | | 75,000,000 | | | 74,802,375 | |
Lloyds TSB Bank plc, N.Y., 2.59%,
11/4/08 (c) | | | 50,000,000 | | | 49,989,250 | |
National Australia Funding, 3.02%,
1/15/09, (LOC National Australia
Bank Ltd.) (c) | | | 50,000,000 | | | 49,690,625 | |
Royal Bank of Scotland Group plc,
2.84%, 12/1/08 (c) | | | 50,000,000 | | | 49,883,333 | |
Skandinav Enskilda Bank, 2.81%,
11/25/08 (b)(c) | | | 75,000,000 | | | 74,860,500 | |
Skandinaviska Enskilda Banken AB,
3.15%, 2/13/09 (b)(c) | | | 75,000,000 | | | 74,338,083 | |
Swedbank, 3.06%, 12/9/08 (c) | | | 25,000,000 | | | 24,920,833 | |
Swedbank Mortgage AB, 3.30%,
3/3/09 (c) | | | 50,000,000 | | | 49,449,305 | |
U.S. Bank N.A., 2.72%, 11/3/08 | | | 75,000,000 | | | 75,000,000 | |
UBS Finance Delaware LLC, 2.82%,
11/5/08 (c) | | | 75,000,000 | | | 74,976,667 | |
UBS Finance Delaware LLC, 2.95%,
12/2/08 (b)(c) | | | 100,000,000 | | | 99,750,279 | |
| | | | |
|
| |
| | | | | | 1,620,449,348 | |
| | | | |
|
| |
| | |
13 | HSBC INVESTOR FAMILY OF FUNDS | See notes to financial statements |
|
HSBC INVESTOR PRIME MONEY MARKET FUND |
|
Schedule of Portfolio Investments—as of October 31, 2008 (continued) |
| | | | | | | |
Commercial Paper And Notes, continued | | | | | | | |
|
|
|
|
|
|
|
|
| | | | | |
| | Principal
Amount ($) | | Value ($) | |
| |
| |
| |
Finance – 22.7% | | | | | | | |
American Express Credit Corp., 2.77%,
12/2/08 (c) | | | 75,000,000 | | | 74,822,396 | |
ASB Finance Ltd., 3.18%, 12/15/08,
(LOC ASB Bank Ltd.) (c) | | | 75,000,000 | | | 74,713,083 | |
Calyon N.A., Inc., 2.81%, 12/8/08,
(LOC Calyon) (c) | | | 75,000,000 | | | 74,786,479 | |
CBA Finance Delaware, 2.61%, 11/5/08,
(LOC Commonwealth Bank
Australia) (c) | | | 50,000,000 | | | 49,985,556 | |
CBA Finance Delaware, 1.70%, 12/4/08,
(LOC Commonwealth Bank
Australia) (c) | | | 50,000,000 | | | 49,929,167 | |
Chariot Funding LLC, 1.50%,
11/14/08 (b)(c) | | | 25,000,000 | | | 24,986,458 | |
Chariot Funding LLC, 2.66%, 11/26/08,
(LOC JP Morgan Chase
Bank) (b)(c) | | | 25,000,000 | | | 24,953,993 | |
Chariot Funding LLC, 2.66%, 12/1/08,
(LOC JP Morgan Chase
Bank) (b)(c) | | | 25,000,000 | | | 24,944,792 | |
Ciesco LLC, 2.00%, 12/1/08, (LOC
Citibank N.A.) (b)(c) | | | 28,100,000 | | | 28,053,167 | |
Danske Corp., 3.08%, 2/9/09, (Danske
Bank AS) (b)(c) | | | 75,000,000 | | | 74,377,083 | |
Falcon Asset Securitization Co. LLC,
2.60%, 11/18/08 (b)(c) | | | 50,000,000 | | | 49,938,611 | |
Falcon Asset Securitization Co. LLC,
3.01%, 11/20/08, (LOC JP Morgan
Chase Bank NV) (b)(c) | | | 25,000,000 | | | 24,960,417 | |
Falcon Asset Securitization Co. LLC,
2.66%, 12/1/08, (LOC JP Morgan
Chase Bank NV) (b)(c) | | | 75,000,000 | | | 74,834,375 | |
Fortis Funding LLC, 2.84%, 11/12/08,
(LOC Fortis Bank) (b)(c) | | | 75,000,000 | | | 74,935,375 | |
Gemini Securitization Co. LLC, 0.30%,
11/3/08 (b)(c) | | | 75,000,000 | | | 74,998,750 | |
Gemini Securitization Corp. LLC,
4.01%, 11/18/08 (b)(c) | | | 75,000,000 | | | 74,858,333 | |
General Electric Capital Corp., 2.59%,
11/24/08 (c) | | | 150,000,000 | | | 149,753,708 | |
ING Funding LLC, 2.92%, 12/11/08,
(LOC ING Bank NV) (c) | | | 75,000,000 | | | 74,760,000 | |
JP Morgan Chase & Co., 2.91%,
2/9/09 (c) | | | 75,000,000 | | | 74,408,333 | |
Jupiter Securitization Co. LLC, 3.71%,
11/18/08, (LOC JP Morgan Chase
Bank NA) (b)(c) | | | 75,000,000 | | | 74,868,958 | |
Jupiter Securitization Co. LLC, 2.66%,
11/24/08, (LOC JP Morgan Chase
Bank NA) (b)(c) | | | 75,000,000 | | | 74,873,021 | |
Natexis Banque U.S. Finance Co.,
2.65%, 11/4/08 (c) | | | 50,000,000 | | | 49,989,021 | |
Natixis, 3.12%, 3/3/09 (b)(c) | | | 50,000,000 | | | 49,479,806 | |
Old Line Funding LLC, 3.16%,
11/12/08, (LOC Royal Bank of
Canada) (b)(c) | | | 28,600,000 | | | 28,572,472 | |
Old Line Funding LLC, 3.66%,
11/17/08, (LOC Royal Bank of
Canada) (b)(c) | | | 12,400,000 | | | 12,379,884 | |
| | | | | | | |
Commercial Paper And Notes, continued | | | | | | | |
|
|
|
|
|
|
|
|
| | | | | |
| | Principal
Amount ($) | | Value ($) | |
| |
| |
| |
Finance, continued | | | | | | | |
Old Line Funding LLC, 3.66%,
11/18/08, (LOC Royal Bank of
Canada) (b)(c) | | | 35,000,000 | | | 34,939,674 | |
Old Line Funding LLC, 1.90%, 12/1/08,
(LOC Royal Bank of Canada) (b)(c) | | | 75,000,000 | | | 74,889,167 | |
Park Avenue Receivables Corp., 2.66%,
12/1/08, (LOC JP Morgan Chase
Bank) (b)(c) | | | 25,000,000 | | | 24,944,792 | |
Ranger Funding Co. LLC, 3.51%,
11/14/08, (LOC Bank of
America) (b)(c) | | | 10,000,000 | | | 9,987,361 | |
Ranger Funding Co. LLC, 3.51%,
11/18/08, (LOC Bank of
America) (b)(c) | | | 65,000,000 | | | 64,892,569 | |
Ranger Funding Co. LLC, 2.45%,
11/26/08, (LOC Bank of
America) (b)(c) | | | 75,000,000 | | | 74,872,396 | |
Sheffield Receivables Corp., 3.79%,
11/18/08, (LOC Barclays
Bank plc) (b)(c) | | | 75,000,000 | | | 74,866,125 | |
Sheffield Receivables Corp., 2.86%,
12/1/08, (LOC Barclays Bank
plc) (b)(c) | | | 75,000,000 | | | 74,821,875 | |
Thames Asset Global Securitization
No. 1, Inc., 2.00%, 11/20/08, (LOC
Royal Bank of Scotland plc) (b)(c) | | | 42,437,000 | | | 42,396,921 | |
| | | | |
|
| |
| | | | | | 1,941,774,118 | |
| | | | |
|
| |
| | | | | | | |
TOTAL COMMERCIAL PAPER AND
NOTES (COST $3,562,223,466) | | | | | | 3,562,223,466 | |
| | | | |
|
| |
| | | | | | | |
Certificates of Deposit—16.4% | | | | | | | |
|
|
|
|
|
|
|
|
Banking - 16.4% | | | | | | | |
ABN AMRO Bank NV, 3.06%, 3/2/09 | | | 75,000,000 | | | 75,000,000 | |
Banco Santander, N.Y., 3.25%, 12/1/08 | | | 75,000,000 | | | 75,000,000 | |
Banco Santander, N.Y., 2.54%, 12/3/08 | | | 75,000,000 | | | 75,000,000 | |
Bank of Ireland, 3.05%, 12/2/08 | | | 50,000,000 | | | 50,000,000 | |
Bank of Nova Scotia, 2.70%, 12/1/08 | | | 50,000,000 | | | 50,000,000 | |
Bank of Nova Scotia, 3.00%, 12/1/08 | | | 50,000,000 | | | 50,000,416 | |
Bank of Scotland plc, N.Y., 3.01%,
5/6/09 (a) | | | 125,000,000 | | | 125,000,000 | |
Banque Paribas, N.Y., 3.01%, 11/28/08 | | | 25,000,000 | | | 25,000,000 | |
Barclays Bank plc, N.Y., 4.79%,
1/16/09 (a) | | | 100,000,000 | | | 100,000,000 | |
BNP Paribas, N.Y., 2.85%, 12/9/08 | | | 50,000,000 | | | 50,000,000 | |
Canadian Imperial Bank of Commerce,
N.Y., 2.68%, 11/12/08 | | | 75,000,000 | | | 75,000,000 | |
Canadian Imperial Bank of Commerce,
N.Y., 2.84%, 12/8/08 | | | 75,000,000 | | | 75,000,000 | |
Deutsche Bank, N.Y., 3.41%,
7/21/09 (a) | | | 100,000,000 | | | 100,000,000 | |
Lloyds TSB Bank plc, N.Y., 3.00%,
12/1/08 | | | 50,000,000 | | | 50,000,000 | |
Lloyds TSB Bank plc, N.Y., 3.05%,
12/1/08 | | | 50,000,000 | | | 50,000,000 | |
Natixis, N.Y., 3.25%, 12/2/08 | | | 50,000,000 | | | 50,000,000 | |
Royal Bank of Canada, N.Y., 2.20%,
11/28/08 | | | 50,000,000 | | | 50,000,000 | |
Royal Bank of Scotland plc, N.Y., 2.64%,
11/10/08 | | | 100,000,000 | | | 100,000,000 | |
| | |
See notes to financial statements | HSBC INVESTOR FAMILY OF FUNDS | 14 |
|
HSBC INVESTOR PRIME MONEY MARKET FUND |
|
Schedule of Portfolio Investments—as of October 31, 2008 (continued) |
| | | | | | | |
Certificates of Deposit, continued | | | | | | | |
|
|
|
|
|
|
|
|
| | | | | | | |
| | Principal
Amount ($) | | Value ($) | |
| |
| |
| |
Banking, continued | | | | | | | |
SunTrust Bank, 3.05%, 1/15/09 | | | 100,000,000 | | | 100,000,000 | |
Svenska Handelsbanken, 3.16%,
8/20/09 (a) | | | 75,000,000 | | | 75,000,000 | |
| | | | |
|
| |
| | | | | | 1,400,000,416 | |
| | | | |
|
| |
TOTAL CERTIFICATES OF DEPOSIT
(COST $1,400,000,416) | | | | | | 1,400,000,416 | |
| | | | |
|
| |
| | | | | | | |
Repurchase Agreements—10.9% | | | | | | | |
|
|
|
|
|
|
|
|
BNP Paribas, purchased on 10/31/08,
0.20%, due 11/3/08 with a maturity
value of $250,004,167 (collateralized
fully by various U.S. Government and
Government Agency Obligations) | | | 250,000,000 | | | 250,000,000 | |
Deutsche Bank, purchased on 10/31/08,
0.25%, due 11/3/08 with a maturity
value of $680,014,167 (collateralized
fully by various U.S. Government and
Government Agency Obligations) | | | 680,000,000 | | | 680,000,000 | |
| | | | |
|
| |
TOTAL REPURCHASE AGREEMENTS
(COST $930,000,000) | | | | | | 930,000,000 | |
| | | | |
|
| |
| | | | | | | |
Yankee Dollars—2.4% | | | | | | | |
|
|
|
|
|
|
|
|
Credit Agricole (London), 3.43%,
7/22/09 (a) | | | 75,000,000 | | | 75,000,000 | |
Westpac Banking Corp., 3.11%,
8/20/09 (a) | | | 50,000,000 | | | 50,000,000 | |
Australia & New Zealand Banking
Group, 3.02%, 10/2/09 (a) | | | 75,000,000 | | | 75,000,000 | |
| | | | |
|
| |
TOTAL YANKEE DOLLARS
(COST $200,000,000) | | | | | | 200,000,000 | |
| | | | |
|
| |
| | | | | | | |
Time Deposits—6.5% | | | | | | | |
|
|
|
|
|
|
|
|
Bank of Ireland Time Deposit, 0.19%,
11/3/08 | | | 150,000,000 | | | 150,000,000 | |
Societe Generale Cayman Time Deposit,
0.25%, 11/3/08 | | | 408,000,000 | | | 408,000,000 | |
| | | | |
|
| |
TOTAL TIME DEPOSITS
(COST $558,000,000) | | | | | | 558,000,000 | |
| | | | |
|
| |
TOTAL INVESTMENTS
(COST $8,649,398,494)—101.3% | | | | | | 8,649,398,494 | |
| | | | |
|
| |
| |
| Percentages indicated are based on net assets of $8,537,248,813. |
| |
(a) | Variable rate security. The interest rates on these securities are adjusted periodically to reflect then-current short-term interest rates. The rates presented represent the rates in effect on October 31, 2008. The maturity dates presented reflect the final maturity dates. However, some of these securities may contain put or demand features that allow the fund to require the issuer to repurchase the security from the fund within various time periods, including daily, weekly, monthly, or semi-annually. |
| |
(b) | Security exempt from registration under Rule 144a of the Securities Act of 1933. This security may be resold in transactions exempt from registration, normally to qualified institutional buyers. This security has been deemed liquid by the Investment Adviser based on procedures approved by the Board of Trustees. |
| |
(c) | Discount note. Rate presented represents the effective yield at time of purchase. |
| | |
LLC | — | Limited Liability Co. |
LOC | — | Letter of Credit |
MTN | — | Medium Term Note |
PLC | — | Public Limited Co. |
RB | — | Revenue Bond |
| | |
15 | HSBC INVESTOR FAMILY OF FUNDS | See notes to financial statements |
| | | | | | | |
Variable Rate Demand Notes—82.8% |
|
|
| | Principal
Amount ($) | | Value ($) | |
| |
| |
| |
New York – 82.8% | | | | | | | |
Albany IDA Civic Facility Revenue,
3.30%, 5/1/27, (LOC KeyBank
N.A.) (a) | | | 1,650,000 | | | 1,650,000 | |
Albany IDA Civic Facility Revenue,
Series A, 0.70%, 7/1/37, (Credit
Support MBIA, LOC Bank of
America N.A.) (a) | | | 8,350,000 | | | 8,350,000 | |
Bethlehem IDA Civic Facility Revenue,
Series A, 1.70%, 12/1/36, (LOC
Citizens Bank N.A.) (a) | | | 740,000 | | | 740,000 | |
Buffalo Municipal Water Finance
Authority Water Systems Revenue,
1.38%, 7/1/35, (LOC JP Morgan
Chase Bank) (a) | | | 7,125,000 | | | 7,125,000 | |
Clinton County IDA Civic Facility
Revenue, Series A, 2.65%, 7/1/42,
(Credit Support Radian, LOC
KeyBank N.A.) (a) | | | 4,000,000 | | | 4,000,000 | |
Columbia County IDA Civic Facility
Revenue, Series A, 3.30%, 7/1/33,
(LOC KeyBank N.A.) (a) | | | 5,785,000 | | | 5,785,000 | |
Dutchess County IDA Civic Facility
Revenue, Series A, 6.00%, 7/1/38,
(LOC KeyBank N.A.) (a) | | | 7,000,000 | | | 7,000,000 | |
Franklin County IDA Civic Facility
Revenue, 1.40%, 5/1/19, (LOC Fleet
National Bank) (a) | | | 1,000,000 | | | 1,000,000 | |
Guilderland IDA Revenue, Series A,
1.40%, 12/1/08, (LOC Fleet Bank of
New York) (a)(b) | | | 1,500,000 | | | 1,500,000 | |
Long Island Power Authority Electrical
Systems Revenue, 7.00%, 12/1/29,
(Credit Support FSA, SpA Dexia
Credit Local) (a) | | | 8,930,000 | | | 8,930,000 | |
Long Island Power Authority Electrical
Systems Revenue, Series G, 5.40%,
12/1/29, (Credit Support FSA, SpA
Dexia Credit Local) (a) | | | 5,550,000 | | | 5,550,000 | |
Metropolitan Transportation Authority
Revenue, Sub-series B-2, 1.25%,
11/1/34, (LOC BNP Paribas) (a) | | | 7,500,000 | | | 7,500,000 | |
Metropolitan Transportation Authority
Revenue, Sub-series B-3, 1.65%,
11/1/34, (LOC Lloyds TSB Bank plc) (a) | | | 10,000,000 | | | 10,000,000 | |
Metropolitan Transportation Authority
Revenue, Sub-series B-4, 1.70%,
11/1/34, (LOC KBC Bank NV) (a) | | | 4,100,000 | | | 4,100,000 | |
Metropolitan Transportation Authority
Revenue, Sub-series E1, 2.50%,
11/1/35, (LOC Fortis Bank) (a) | | | 10,000,000 | | | 10,000,000 | |
Metropolitan Transportation Authority
Revenue, Sub-series E2, 1.80%,
11/1/35, (LOC Fortis Bank
S.A./N.V.) (a) | | | 7,800,000 | | | 7,800,000 | |
Monroe County IDA Civic Facility
Revenue, 1.65%, 1/15/32, (LOC JP
Morgan Chase Bank) (a) | | | 4,000,000 | | | 4,000,000 | |
Monroe County IDA Civic Facility
Revenue, 1.70%, 4/1/35, (LOC JP
Morgan Chase Bank) (a) | | | 4,050,000 | | | 4,050,000 | |
| | | | | | | |
Variable Rate Demand Notes, continued | | | | | | | |
|
|
|
|
|
|
|
|
| | | | | |
| | Principal
Amount ($) | | Value ($) | |
| |
| |
| |
New York, continued | | | | | | | |
Monroe County IDA Civic Facility
Revenue, 1.65%, 6/1/36, (LOC JP
Morgan Chase Bank) (a) | | | 3,800,000 | | | 3,800,000 | |
Monroe County IDA Civic Facility
Revenue, 1.85%, 2/1/38, (LOC JP
Morgan Chase Bank) (a) | | | 2,000,000 | | | 2,000,000 | |
Monroe County IDA Civic Facility
Revenue, 1.85%, 4/1/38, (LOC JP
Morgan Chase Bank) (a) | | | 2,200,000 | | | 2,200,000 | |
Nassau County Interim Finance
Authority Revenue, 6.75%, 11/15/22,
(Credit Support FSA, SpA BNP
Paribas) (a)(b) | | | 31,080,000 | | | 31,080,000 | |
Nassau County Interim Finance
Authority Revenue, Series A, 6.75%,
11/15/22, (Credit Support FSA, SpA
Dexia Credit Local) (a)(b) | | | 1,380,000 | | | 1,380,000 | |
Nassau Health Care Corp. Revenue,
Sub-series 2004-C2, 6.00%, 8/1/29,
(Credit Support FSA County
Guaranteed, SpA Dexia Credit
Local) (a)(b) | | | 2,800,000 | | | 2,800,000 | |
New York City Capital Resources Corp.
Revenue, Series B1, 1.40%, 7/1/37,
(LOC Bank of America N.A.) (a) | | | 5,920,000 | | | 5,920,000 | |
New York City GO, 1.80%, 9/1/35,
(LOC Royal Bank of Scotland) (a) | | | 11,475,000 | | | 11,475,000 | |
New York City GO, Series J,
Sub-series J2, 1.73%, 2/15/16, (LOC
Westdeutsche Landesbank) (a) | | | 4,800,000 | | | 4,800,000 | |
New York City GO, Sub-series A6,
1.90%, 11/1/26, (Credit Support FSA,
SPA Dexia Credit Local) (a) | | | 10,090,000 | | | 10,090,000 | |
New York City GO, Sub-series A7,
1.15%, 8/1/21, (LOC Morgan Guaranty
Trust) (a) | | | 2,700,000 | | | 2,700,000 | |
New York City Health & Hospital
Corporation Revenue, Series B, 1.25%,
2/15/31, (LOC TD Bank N.A.) (a) | | | 7,400,000 | | | 7,400,000 | |
New York City Housing Development
Corp. Multi-family Housing Revenue,
Series A, 1.40%, 4/1/31, (Credit
Support FHLMC) (a) | | | 1,135,000 | | | 1,135,000 | |
New York City Housing Development
Corp. Multi-family Mortgage Revenue,
1.45%, 6/15/32, (Credit Support
FNMA) (a) | | | 8,965,000 | | | 8,965,000 | |
New York City Housing Development
Corp. Multi-family Mortgage Revenue,
1.80%, 12/1/36, (LOC Landesbank
Hessen) (a) | | | 17,035,000 | | | 17,035,000 | |
New York City Housing Development
Corp. Multi-family Mortgage Revenue,
1.80%, 6/1/39, (LOC Landesbank
Hessen) (a) | | | 13,000,000 | | | 13,000,000 | |
New York City Housing Development
Corporation Revenue, Series A, 1.75%,
3/1/38, (LOC Freddie Mac) (a)(b) | | | 4,900,000 | | | 4,900,000 | |
New York City IDA Civic Facility
Revenue, 1.70%, 5/1/21, (LOC JP
Morgan Chase Bank) (a) | | | 2,500,000 | | | 2,500,000 | |
| | |
See notes to financial statements | HSBC INVESTOR FAMILY OF FUNDS | 16 |
|
HSBC INVESTOR NEW YORK TAX-FREE MONEY MARKET FUND |
|
Schedule of Portfolio Investments—as of October 31, 2008 (continued) |
| | | | | | | |
Variable Rate Demand Notes, continued | | | | | | | |
|
|
|
|
|
|
|
|
| | | | | | | |
| | Principal
Amount ($) | | Value ($) | |
| |
| |
| |
New York, continued | | | | | | | |
New York City IDA Civic Facility
Revenue, 1.87%, 12/30/21, (LOC
Allied Irish Bank plc) (a) | | | 1,400,000 | | | 1,400,000 | |
New York City IDA Civic Facility
Revenue, 1.87%, 9/30/31, (LOC Allied
Irish Bank plc) (a) | | | 1,450,000 | | | 1,450,000 | |
New York City IDA Civic Facility
Revenue, 1.90%, 4/1/32, (LOC Allied
Irish Bank plc) (a) | | | 3,000,000 | | | 3,000,000 | |
New York City IDA Civic Facility
Revenue, 1.87%, 12/1/34, (LOC Allied
Irish Bank plc) (a) | | | 4,610,000 | | | 4,610,000 | |
New York City IDA Civic Facility
Revenue, 1.87%, 12/1/34, (LOC Allied
Irish Bank plc) (a) | | | 6,200,000 | | | 6,200,000 | |
New York City IDA Civic Facility
Revenue, 1.84%, 12/1/36, (LOC JP
Morgan Chase Bank) (a) | | | 4,515,000 | | | 4,515,000 | |
New York City IDA Civic Facility
Revenue, 1.45%, 1/1/31, (LOC JP
Morgan Chase Bank) (a) | | | 2,000,000 | | | 2,000,000 | |
New York City IDA Civic Facility
Revenue, 0.70%, 11/1/39, (LOC Bank
of America, Citibank N.A.) (a) | | | 10,000,000 | | | 10,000,000 | |
New York City IDA Special Facility
Revenue, Series B, 1.40%, 5/1/33,
(LOC Bank of America N.A.) (a) | | | 2,960,000 | | | 2,960,000 | |
New York City Municipal Water Finance
Authority Water & Sewer System
Revenue, Sub-series B4, 1.31%,
6/15/23, (SpA BNP Paribas) (a) | | | 2,000,000 | | | 2,000,000 | |
New York City Transitional Finance
Authority Revenue, 0.75%, 11/1/22,
(SpA Royal Bank Of Canada) (a) | | | 10,000,000 | | | 10,000,000 | |
New York City Transitional Finance
Authority Revenue, Series 3,
Sub-series 3-F, 1.15%, 11/1/22, (SpA
Royal Bank of Canada) (a) | | | 9,400,000 | | | 9,400,000 | |
New York City Transitional Finance
Authority Revenue, Series 3,
Sub-series 3C, 4.50%, 11/1/22, (SpA
Dexia Credit Local) (a) | | | 6,145,000 | | | 6,145,000 | |
New York City Transitional Finance
Authority Revenue, Series 3,
Sub-series 3D, 4.50%, 11/1/22, (SpA
Dexia Credit Local) (a) | | | 12,910,000 | | | 12,910,000 | |
New York City Transitional Finance
Authority Revenue, Series 3,
Sub-series 3G, 1.25%, 11/1/22, (SpA
Bank of New York) (a) | | | 2,085,000 | | | 2,085,000 | |
New York City Transitional Finance
Authority Revenue, Series A2, 1.70%,
11/15/27, (SpA Bank of Nova
Scotia) (a) | | | 6,100,000 | | | 6,100,000 | |
New York City Trust for Cultural
Resources Revenue, 1.38%, 7/1/33,
(LOC Citibank N.A.) (a) | | | 2,000,000 | | | 2,000,000 | |
New York City Trust for Cultural
Resources Revenue, 0.70%, 12/1/35,
(LOC Citibank N.A.) (a) | | | 10,000,000 | | | 10,000,000 | |
| | | | | | | |
Variable Rate Demand Notes, continued | | | | | | | |
|
|
|
|
|
|
|
|
|
| | Principal
Amount ($) | | Value ($) | |
| |
| |
| |
New York, continued | | | | | | | |
New York City Trust for Cultural
Resources Revenue, Series A1,
0.80%, 12/1/35, (LOC Bank of
America N.A.) (a) | | | 7,000,000 | | | 7,000,000 | |
New York Local Government Assistance
Corp., 5.00%, 4/1/18, (Credit Support
FSA, SpA KBC Bank) (a) | | | 2,000,000 | | | 2,000,000 | |
New York Local Government Assistance
Corp., 1.35%, 4/1/25, (LOC Bank of
Nova Scotia) (a) | | | 20,200,000 | | | 20,200,000 | |
New York Local Government Assistance
Corp., 1.35%, 4/1/25, (LOC Societe
Generale) (a) | | | 11,850,000 | | | 11,850,000 | |
New York State Dormitory Authority
Revenue, 5.50%, 2/15/21, (Credit
Support FSA, SpA Dexia Credit
Local) (a) | | | 7,900,000 | | | 7,900,000 | |
New York State Dormitory Authority
Revenue, 1.60%, 7/1/25, (LOC Fleet
National Bank) (a) | | | 2,900,000 | | | 2,900,000 | |
New York State Dormitory Authority
Revenue, 1.25%, 7/1/30, (SpA JP
Morgan Chase Bank) (a) | | | 7,700,000 | | | 7,700,000 | |
New York State Dormitory Authority
Revenue, Series D, 1.65%, 7/1/34,
(LOC TD Banknorth N.A.) (a) | | | 4,875,000 | | | 4,875,000 | |
New York State Dormitory Authority
Revenue, Non State Supported Debt,
1.65%, 7/1/36, (Credit Support XLCA,
LOC TD Banknorth N.A.) (a) | | | 1,975,000 | | | 1,975,000 | |
New York State Dormitory Authority
Revenue, Non State Supported Debt,
1.65%, 7/1/38, (LOC Citizens
Bank N.A.) (a) | | | 4,950,000 | | | 4,950,000 | |
New York State Dormitory Authority
Revenue, Non State Supported Debt,
1.70%, 7/1/38, (LOC RBS
Citizens N.A.) (a) | | | 4,000,000 | | | 4,000,000 | |
New York State Dormitory Authority
Revenue, Non State Supported Debt,
Series A, 1.40%, 11/15/36, (Credit
Support FNMA, Liquidity Facility
FNMA) (a) | | | 10,000,000 | | | 10,000,000 | |
New York State Dormitory Authority
Revenue, Non State Supported Debt,
Series A-2, 1.75%, 9/1/26, (LOC RBS
Citizens N.A.) (a) | | | 2,075,000 | | | 2,075,000 | |
New York State Dormitory Authority
Revenue, Non State Supported Debt,
Series A-2, 1.75%, 9/1/36, (LOC RBS
Citizens N.A.) (a) | | | 4,000,000 | | | 4,000,000 | |
New York State Dormitory Authority
Revenue, Non State Supported Debt,
Series A-2, 1.70%, 6/1/38, (LOC RBS
Citizens N.A.) (a) | | | 4,000,000 | | | 4,000,000 | |
New York State Dormitory Authority
Revenue, Non State Supported Debt,
Series B, 1.40%, 5/15/39, (LOC
Bayerische Landesbank) (a) | | | 19,500,000 | | | 19,500,000 | |
| | |
17 | HSBC INVESTOR FAMILY OF FUNDS | See notes to financial statements |
|
HSBC INVESTOR NEW YORK TAX-FREE MONEY MARKET FUND |
|
Schedule of Portfolio Investments—as of October 31, 2008 (continued) |
| | | | | | | |
Variable Rate Demand Notes, continued | | | | | | | |
|
|
|
|
|
|
|
|
| | | | | | | |
| | Principal
Amount ($) | | Value ($) | |
| |
| |
| |
New York, continued | | | | | | | |
New York State Energy Research &
Development Authority Facilities
Revenue, 1.50%, 11/1/39, AMT, (LOC
Citibank N.A.) (a) | | | 4,300,000 | | | 4,300,000 | |
New York State Energy Research &
Development Authority Facilities
Revenue, 1.83%, 11/1/39, AMT, (LOC
Citibank N.A.) (a) | | | 1,000,000 | | | 1,000,000 | |
New York State Energy Research &
Development Authority Facilities
Revenue, Series C2, 2.00%, 11/1/39,
AMT, (LOC Citibank N.A.) (a) | | | 11,100,000 | | | 11,100,000 | |
New York State GO, 1.25%, 8/1/19,
(LOC Bayerische Helaba) (a) | | | 2,740,000 | | | 2,740,000 | |
New York State GO, 1.67%, 3/15/30,
(LOC Dexia Credit Local) (a) | | | 8,450,000 | | | 8,450,000 | |
New York State Housing Finance Agency
Revenue, 1.40%, 5/15/15, (LOC
Landesbank Hessen - Thuringen) (a) | | | 800,000 | | | 800,000 | |
New York State Housing Finance Agency
Revenue, 1.85%, 5/15/28, AMT,
(Credit Support FNMA, LOC
FNMA) (a) | | | 13,000,000 | | | 13,000,000 | |
New York State Housing Finance Agency
Revenue, 1.85%, 5/15/31, AMT,
(Credit Support FNMA) (a) | | | 1,700,000 | | | 1,700,000 | |
New York State Housing Finance Agency
Revenue, 2.20%, 5/15/33, AMT,
(Credit Support FNMA) (a) | | | 2,000,000 | | | 2,000,000 | |
New York State Housing Finance Agency
Revenue, 1.75%, 5/15/34, (Credit
Support FNMA) (a) | | | 10,000,000 | | | 10,000,000 | |
New York State Housing Finance Agency
Revenue, 1.80%, 11/15/36, (Credit
Support FNMA) (a) | | | 10,050,000 | | | 10,050,000 | |
New York State Housing Finance Agency
Revenue, 1.75%, 11/15/37, (Credit
Support FNMA) (a) | | | 10,000,000 | | | 10,000,000 | |
New York State Housing Finance Agency
Revenue, 1.75%, 11/1/41, AMT, (LOC
Bank of New York) (a) | | | 10,000,000 | | | 10,000,000 | |
New York State Housing Finance Agency
Revenue, Series A, 2.50%, 5/15/32,
AMT, (Credit Support FNMA) (a) | | | 1,600,000 | | | 1,600,000 | |
New York State Housing Finance Agency
Revenue, Series A, 1.50%, 11/1/32,
AMT, (Credit Support FHLMC,
Liquidity Facility FHLMC) (a) | | | 2,050,000 | | | 2,050,000 | |
New York State Housing Finance Agency
Revenue, Series A, 1.75%, 5/15/34,
(Credit Support FNMA) (a) | | | 1,400,000 | | | 1,400,000 | |
New York State Housing Finance Agency
Revenue, Series A, 1.40%, 5/1/35,
(Credit Support FHLMC) (a) | | | 9,365,000 | | | 9,365,000 | |
New York State Housing Finance Agency
Revenue, Series A, 1.50%, 11/1/36,
(LOC Landesbank Hessen -
Thuringen) (a) | | | 16,255,000 | | | 16,255,000 | |
New York State Housing Finance Agency
Revenue, Series A, 1.25%, 11/1/37,
(LOC Landesbank Hessen -
Thuringen) (a) | | | 3,200,000 | | | 3,200,000 | |
| | | | | | | |
Variable Rate Demand Notes, continued | | | | | | | |
|
|
|
|
|
|
|
|
| | | | | | | |
| | Principal
Amount ($) | | Value ($) | |
| |
| |
| |
New York, continued | | | | | | | |
New York State Housing Finance Agency
Revenue, Series A, 2.40%, 11/1/39,
AMT, (LOC Citibank N.A.) (a) | | | 9,700,000 | | | 9,700,000 | |
New York State Housing Finance Agency
Revenue, Series A, 1.70%, 5/1/45,
(Credit Support FHLMC, Liquidity
Facility FHLMC) (a) | | | 9,750,000 | | | 9,750,000 | |
New York State Local Government
Assistance Corp. Revenue, Series 4V,
2.70%, 4/1/22, (Credit Support FSA,
SpA Westlandesbank AG) (a) | | | 8,300,000 | | | 8,300,000 | |
New York State Local Government
Assistance Corp. Revenue, Series A,
1.70%, 4/1/22, (Credit Support GO of
Corp., LOC Bayerische Landesbank,
Westdeutsche Landesbank) (a) | | | 30,000,000 | | | 30,000,000 | |
New York State Power Authority,
Finance & Administration GO, 1.60%,
3/1/20, (Liquidity Facility Bank of
Novia Scotia) (a) | | | 11,000,000 | | | 11,000,000 | |
New York State Urban Development
Corp. Revenue, Series A5, 1.70%,
1/1/30, (LOC TD Banknorth
N.A.) (a) | | | 2,000,000 | | | 2,000,000 | |
Newburgh IDA Civic Facility Revenue,
3.30%, 10/1/30, (LOC KeyBank
N.A.) (a) | | | 3,400,000 | | | 3,400,000 | |
Oneida County IDA Civic Facility
Revenue, 3.30%, 11/1/37, (LOC
KeyBank N.A.) (a) | | | 7,420,000 | | | 7,420,000 | |
Oneida County IDA Civic Facility
Revenue, 3.30%, 11/1/37, (LOC
KeyBank N.A.) (a) | | | 3,000,000 | | | 3,000,000 | |
Onondaga County IDA Civic Facility
Revenue, Series A, 3.30%, 1/1/23,
(LOC KeyBank N.A.) (a) | | | 7,510,000 | | | 7,510,000 | |
Onondaga County IDA Civic Facility
Revenue, Series A, 3.30%, 7/1/33,
(LOC KeyBank N.A.) (a) | | | 4,000,000 | | | 4,000,000 | |
Onondaga County IDA Revenue,
Series B, 1.40%, 7/1/37, (LOC JP
Morgan Chase Bank) (a) | | | 1,940,000 | | | 1,940,000 | |
Orange County IDA Civic Facility
Revenue, 3.30%, 7/1/32, (LOC
KeyBank N.A.) (a) | | | 3,900,000 | | | 3,900,000 | |
Otsego County IDA Civic Facility
Revenue, Series A, 2.65%, 5/1/27,
(LOC KeyBank N.A.) (a) | | | 4,375,000 | | | 4,375,000 | |
Port Chester IDA Revenue, 1.80%,
9/1/21, AMT, (LOC JP Morgan
Chase & Co) (a)(b) | | | 3,170,000 | | | 3,170,000 | |
Saratoga County IDA Civic Facility
Revenue, Series A, 3.30%, 12/1/32,
(LOC KeyBank N.A.) (a) | | | 7,900,000 | | | 7,900,000 | |
Saratoga County IDA Civic Facility
Revenue, Series A, 1.70%, 12/1/36,
(LOC Citizens Bank N.A.) (a) | | | 4,045,000 | | | 4,045,000 | |
Schenectady County IDA Civic Facility
Revenue, Series B, 3.15%, 8/1/33,
(LOC KeyBank N.A.) (a) | | | 2,205,000 | | | 2,205,000 | |
| | |
See notes to financial statements | HSBC INVESTOR FAMILY OF FUNDS | 18 |
|
HSBC INVESTOR NEW YORK TAX-FREE MONEY MARKET FUND |
|
Schedule of Portfolio Investments—as of October 31, 2008 (continued) |
| | | | | | | |
Variable Rate Demand Notes, continued | | | | | | | |
|
|
|
|
|
|
|
|
| | | | | | | |
| | Principal
Amount ($) | | Value ($) | |
| |
| |
| |
New York, continued | | | | | | | |
Schenectady County IDA Revenue,
Series A, 1.40%, 6/1/09, (LOC Fleet
Bank of New York) (a) | | | 900,000 | | | 900,000 | |
St. Lawrence County IDA, 3.30%,
12/1/31, (LOC KeyBank N.A.) (a) | | | 5,720,000 | | | 5,720,000 | |
Suffolk County Water Authority, 1.30%,
12/1/09, (SpA Bank of Nova
Scotia) (a) | | | 1,200,000 | | | 1,200,000 | |
Syracuse IDA Civic Facility Revenue,
Series A, 1.80%, 1/1/23, (LOC Fleet
National Bank) (a) | | | 10,950,000 | | | 10,950,000 | |
Syracuse IDA Civic Facility Revenue,
Series A, 3.30%, 1/1/23, (LOC
KeyBank N.A.) (a) | | | 10,000,000 | | | 10,000,000 | |
Syracuse IDA Civic Facility Revenue,
Series A-1, 1.05%, 7/1/37, (LOC JP
Morgan Chase Bank) (a) | | | 2,000,000 | | | 2,000,000 | |
Syracuse IDA Civic Facility Revenue,
Series A2, 1.05%, 12/1/37, (LOC JP
Morgan Chase Bank) (a) | | | 5,700,000 | | | 5,700,000 | |
Triborough Bridge & Tunnel Authority
Revenue, Series C, 4.65%, 1/1/32,
(LOC Bayerische Landesbank) (a) | | | 15,000,000 | | | 15,000,000 | |
Triborough Bridge & Tunnel Authority
Revenue, Sub-series CD, 2.40%,
1/1/19, (Credit Support FSA, SpA
Lloyds TSB Bank plc) (a) | | | 15,000,000 | | | 15,000,000 | |
Troy IDA Civic Facility Revenue,
Series B, 1.50%, 9/1/37, (LOC Bank
of America N.A.) (a) | | | 10,000,000 | | | 10,000,000 | |
Troy IDA Civic Facility Revenue,
Series C, 1.50%, 9/1/42, (LOC Allied
Irish Bank plc) (a) | | | 20,000,000 | | | 20,000,000 | |
Westchester County IDA Civic Facility
Revenue, 1.87%, 12/1/32, (LOC
Allied Irish Bank plc) (a) | | | 5,980,000 | | | 5,980,000 | |
| | | | |
|
| |
TOTAL VARIABLE RATE DEMAND
NOTES (COST $789,035,000) | | | | | | 789,035,000 | |
| | | | |
|
| |
| | | | | | | |
Tax-Free Notes And Commercial Paper—11.2% | | | | | | | |
|
|
|
|
|
|
|
|
New York – 11.2% | | | | | | | |
Long Island Power Authority,
Series CP-1, 2.00%, 12/17/08, (LOC
JP Morgan Chase Bank) | | | 16,800,000 | | | 16,800,000 | |
Metropolitan Transportation Authority,
Series 1C, Sub-series C, 1.65%,
11/5/08, (LOC ABN AMRO Bank
N.V.) | | | 20,000,000 | | | 20,000,000 | |
New York City Municipal Water Industry
Regional Authority, Series 5-A, 1.63%,
1/6/09, (LOC Landesbank
Hessen-Thuringen, Bayerische
Landesbank, Westdeutsche
Landesbank) | | | 20,000,000 | | | 20,000,000 | |
New York City Municipal Water Industry
Regional Authority, Series 5-B, 1.63%,
1/22/09, (LOC Westdeutsche
Landesbank, Bayerische
Landesbank) | | | 17,500,000 | | | 17,500,000 | |
| | | | | | | |
Tax-Free Notes And Commercial Paper, continued | | | | | | | |
|
|
|
|
|
|
|
|
| | | | | | | |
| | Principal
Amount ($) | | Value ($) | |
| |
| |
| |
New York, continued | | | | | | | |
New York City Municipal Water Industry
Regional Authority, Series 5-B, 1.75%,
1/22/09, (LOC Westdeutsche
Landesbank, Bayerische
Landesbank) | | | 15,000,000 | | | 15,000,000 | |
New York State Industry Regional
Authority, Series N, 1.65%, 12/4/08,
(LOC Westdeutsche Landesbank) | | | 2,500,000 | | | 2,500,000 | |
New York State Industry Regional
Authority, Series 97-A, 1.55%, 1/5/09,
(LOC Bayerische Landesbank,
Heleba) | | | 15,000,000 | | | 15,000,000 | |
| | | | |
|
| |
| | | | | | 106,800,000 | |
| | | | |
|
| |
TOTAL TAX-FREE NOTES AND
COMMERCIAL PAPER
(COST $106,800,000) | | | | | | 106,800,000 | |
| | | | |
|
| |
| | | | | | | |
Investment Companies—3.6% | | | | | | | |
|
|
|
|
|
|
|
|
| | | | | |
| | Shares | | Value ($) | |
| |
| |
| |
BlackRock Liquidity New York Money
Fund, Portfolio Institutional Shares,
1.51% (c) | | | 28,062,072 | | | 28,062,072 | |
Northern Institutional Tax Exempt
Portfolio, Shares Class, 1.86% (c) | | | 5,950,613 | | | 5,950,613 | |
| | | | |
|
| |
TOTAL INVESTMENT COMPANIES
(COST $34,012,685) | | | | | | 34,012,685 | |
| | | | |
|
| |
TOTAL INVESTMENTS
(COST $929,847,685)—97.6% | | | | | | 929,847,685 | |
| | | | |
|
| |
| |
|
| Percentages indicated are based on net assets of $952,412,861. |
| |
(a) | Variable rate security. The interest rates on these securities are adjusted periodically to reflect then-current short-term interest rates. The rates presented represent the rates in effect on October 31, 2008. The maturity dates presented reflect the final maturity dates. However, some of these securities may contain put or demand features that allow the fund to require the issuer to repurchase the security from the fund within various time periods, including daily, weekly, monthly, or semi-annually. |
| |
(b) | Security exempt from registration under Rule 144A of the Securities Act of 1933. This security may be resold in transactions exempt from registration, normally to qualified institutional buyers. This security has been deemed liquid by the Investment Adviser based on procedures approved by the Board of Trustees. |
| |
(c) | The rates presented represent the annualized one day yield that was in effect on October 31, 2008. |
| |
AMT | — Interest on security is subject to federal alternative minimum tax |
FHLMC | — Federal Home Loan Mortgage Corporation |
FNMA | — Federal National Mortgage Association |
FSA | — Financial Security Assurance |
GO | — General Obligation |
IDA | — Industrial Development Agency |
LOC | — Letter of Credit |
MBIA | — Municipal Bond Insurance Association |
PLC | — Public Limited Co. |
SPA | — Standby Purchase Agreement |
XLCA | — XL Capital Assurance |
| | |
19 | HSBC INVESTOR FAMILY OF FUNDS | See notes to financial statements |
|
HSBC INVESTOR TAX-FREE MONEY MARKET FUND |
|
Schedule of Portfolio Investments—as of October 31, 2008 |
| | | | | | | |
Variable Rate Demand Notes—78.7% | | | | | | | |
| |
| | | | | | | |
| | Principal
Amount ($) | | Value ($) | |
| |
| |
| |
Alabama – 0.9% | | | | | | | |
Birmingham Alabama Medical Clinic
Board Revenue, 1.85%, 12/1/26,
(LOC SunTrust Bank) (a) | | | 2,000,000 | | | 2,000,000 | |
| | | | |
|
| |
Arizona – 1.1% | | | | | | | |
Apache County Arizona Industrial
Development Authority Revenue,
Series 83A, 1.75%, 12/15/18, (LOC
ABN AMRO Bank N.V.) (a) | | | 600,000 | | | 600,000 | |
Apache County Arizona Industrial
Development Authority Revenue,
Series 83C, 1.75%, 12/15/18, (LOC
Bank of New York) (a) | | | 700,000 | | | 700,000 | |
Yuma Arizona Industrial Development
Authority Multi-family Revenue,
1.60%, 4/15/33, (Credit Support
FNMA) (a) | | | 1,050,000 | | | 1,050,000 | |
| | | | |
|
| |
| | | | | | 2,350,000 | |
| | | | |
|
| |
California – 0.8% | | | | | | | |
Irvine California Improvement Bond Act
of 1915, 0.60%, 9/2/22, (LOC State
Street B&T Co.) (a) | | | 500,000 | | | 500,000 | |
Northern California Transmission
Agency Revenue, 8.00%, 5/1/24,
(LOC FSA, SpA Dexia Credit
Local) (a) | | | 1,110,000 | | | 1,110,000 | |
| | | | |
|
| |
| | | | | | 1,610,000 | |
| | | | |
|
| |
Colorado – 3.5% | | | | | | | |
Colorado Educational & Cultural
Facilities Authority Revenue, 1.25%,
9/1/35, (LOC Bank of America) (a) | | | 1,280,000 | | | 1,280,000 | |
Colorado Educational & Cultural
Facilities Authority Revenue,
Series C-2, 1.30%, 3/1/36, (LOC U.S.
Bank N.A.) (a) | | | 2,100,000 | | | 2,100,000 | |
Denver Colorado City & County Airport
Revenue, Series F, 1.83%, 11/15/25,
AMT, (LOC Lloyds TSB Bank
plc) (a) | | | 3,975,000 | | | 3,975,000 | |
| | | | |
|
| |
| | | | | | 7,355,000 | |
| | | | |
|
| |
Delaware – 0.6% | | | | | | | |
Delaware State Economic Development
Authority Revenue, Series B, 1.87%,
12/1/15, (LOC JP Morgan Chase
Bank) (a) | | | 1,300,000 | | | 1,300,000 | |
| | | | |
|
| |
Florida – 7.6% | | | | | | | |
Broward County Florida Housing
Finance Authority Multi-family
Housing Revenue, 1.75%, 12/1/29,
(Credit Support Freddie Mac) (a) | | | 2,000,000 | | | 1,999,982 | |
Broward County Florida School Board
Certificates of Participation, 1.50%,
7/1/21, (Credit Support FSA, SpA
Bank of America N.A.) (a) | | | 2,000,000 | | | 2,000,000 | |
Florida Housing Finance Agency
Revenue, 1.40%, 9/15/26, (Credit
Support FNMA) (a) | | | 1,600,000 | | | 1,600,000 | |
| | | | | | | |
Variable Rate Demand Notes, continued | |
| |
| | | | | | | |
| | Principal
Amount ($) | | Value ($) | |
| |
| |
| |
Florida, continued | | | | | | | |
Highlands County Florida Health
Facilities Authority Revenue,
Series B, 2.30%, 11/15/09, (LOC
SunTrust Bank) (a) | | | 2,005,000 | | | 2,005,000 | |
Jacksonville Florida Health Facilities
Authority Hospital Revenue, Series B,
1.25%, 8/15/33, (LOC Bank of
America N.A.) (a) | | | 1,000,000 | | | 1,000,000 | |
Orange County Florida Housing Finance
Authority Multi-family Revenue,
1.75%, 7/1/32, (Credit Support
Freddie Mac) (a) | | | 1,000,000 | | | 999,981 | |
Sarasota County Florida Public Hospital
District Revenue, Series A, 1.20%,
7/1/37, (LOC Northern Trust
Co.) (a) | | | 4,000,000 | | | 4,000,000 | |
Seminole County Florida Industrial
Development Authority Healthcare
Facilities Revenue, 2.10%, 12/1/25,
(LOC Fifth Third Bank) (a) | | | 1,900,000 | | | 1,900,000 | |
Volusia County Florida Housing Finance
Authority Multi-family Revenue,
1.75%, 10/15/32, (Credit Support
FNMA) (a) | | | 700,000 | | | 699,998 | |
| | | | |
|
| |
| | | | | | 16,204,961 | |
| | | | |
|
| |
Georgia – 5.3% | | | | | | | |
De Kalb County Georgia Housing
Authority Multi-family Housing
Revenue, 1.85%, 12/1/25, (Credit
Support Freddie Mac) (a) | | | 1,000,000 | | | 1,000,000 | |
De Kalb Private Hospital Authority
Georgia Revenue, Series A, 1.50%,
12/1/17, (LOC SunTrust Bank,
Atlanta) (a) | | | 2,200,000 | | | 2,200,000 | |
De Kalb Private Hospital Authority
Georgia Revenue, Series A, 1.50%,
3/1/24, (LOC SunTrust Bank,
Atlanta) (a) | | | 1,440,000 | | | 1,440,000 | |
Georgia State Ports Authority Revenue,
1.85%, 8/1/11, (LOC SunTrust
Bank) (a) | | | 1,000,000 | | | 1,000,000 | |
Gwinnett County Georgia Development
Authority Revenue, 1.85%, 3/1/21,
(LOC SunTrust Bank) (a) | | | 1,000,000 | | | 1,000,000 | |
Gwinnett County Georgia Hospital
Authority Revenue, Series B, 1.80%,
7/1/42, (LOC SunTrust Bank) (a) | | | 2,000,000 | | | 2,000,000 | |
Roswell Georgia Housing Authority
Multi-family Revenue, 1.65%, 6/15/25,
(Credit Support FNMA) (a) | | | 1,400,000 | | | 1,400,000 | |
Roswell Georgia Housing Authority
Multi-family Revenue, 1.60%,
11/15/32, (Credit Support
FNMA) (a) | | | 1,300,000 | | | 1,300,000 | |
| | | | |
|
| |
| | | | | | 11,340,000 | |
| | | | |
|
| |
Illinois – 7.9% | | | | | | | |
Chicago Illinois O’Hare International
Airport Revenue, Series C, 2.00%,
1/1/18, (LOC Societe Generale) (a) | | | 1,800,000 | | | 1,800,000 | |
| | |
See notes to financial statements | HSBC INVESTOR FAMILY OF FUNDS | 20 |
|
HSBC INVESTOR TAX-FREE MONEY MARKET FUND |
|
Schedule of Portfolio Investments—as of October 31, 2008 (continued) |
| | | | | | | |
Variable Rate Demand Notes, continued | | | | | | | |
| |
| | | | | |
| | Principal
Amount ($) | | Value ($) | |
| |
| |
| |
Illinois, continued | | | | | | | |
Chicago Illinois O’Hare International
Airport Revenue, Series B, 2.15%,
1/1/18, (LOC Societe Generale) (a) | | | 2,000,000 | | | 2,000,000 | |
Elmhurst Illinois Revenue, 1.50%,
7/1/18, (LOC JP Morgan Chase
Bank) (a) | | | 2,000,000 | | | 2,000,000 | |
Illinois Development Finance Authority
Revenue, 1.75%, 12/1/28, (LOC
Northern Trust Co.) (a) | | | 1,300,000 | | | 1,300,000 | |
Illinois Development Finance Authority
Revenue, 1.95%, 6/1/37, (LOC Bank
One N.A.) (a) | | | 2,000,000 | | | 2,000,000 | |
Illinois Finance Authority Revenue,
1.80%, 3/1/36, (LOC JP Morgan
Chase Bank) (a) | | | 1,300,000 | | | 1,300,000 | |
Illinois Finance Authority Revenue,
1.80%, 4/1/37, (LOC JP Morgan
Chase Bank) (a) | | | 600,000 | | | 600,000 | |
Illinois Finance Authority Revenue,
1.80%, 12/1/37, (LOC JP Morgan
Chase Bank) (a) | | | 1,000,000 | | | 1,000,000 | |
Illinois Finance Authority Revenue,
Series A, 1.48%, 4/1/36, (LOC JP
Morgan Chase Bank, Credit Support
RADIAN) (a) | | | 3,000,000 | | | 3,000,000 | |
Illinois Finance Authority Revenue,
Series B, 1.73%, 1/1/16, (LOC JP
Morgan Chase Bank) (a) | | | 1,950,000 | | | 1,950,000 | |
| | | | |
|
| |
| | | | | | 16,950,000 | |
| | | | |
|
| |
Indiana – 0.5% | | | | | | | |
Indiana Municipal Power Agency Power
Supply System Revenue, 5.50%,
1/1/18, (LOC Dexia Credit) (a) | | | 1,040,000 | | | 1,040,000 | |
| | | | |
|
| |
Iowa – 0.6% | | | | | | | |
Iowa Higher Education Loan Authority
Revenue, 1.48%, 10/1/33, (LOC Allied
Irish Bank plc) (a) | | | 1,200,000 | | | 1,200,000 | |
| | | | |
|
| |
Kentucky – 3.1% | | | | | | | |
Henderson County Kentucky Industrial
Development Revenue, 2.38%, 11/1/19,
AMT, (LOC Fifth Third Bank) (a) | | | 1,915,000 | | | 1,915,000 | |
Lexington-Fayette Urban County
Kentucky Government Industrial
Building Revenue, 2.10%, 3/1/35,
(LOC Fifth Third Bank) (a) | | | 3,000,000 | | | 3,000,000 | |
Madison County Kentucky Economic
Development Revenue, 2.10%, 8/1/18,
(LOC Fifth Third Bank) (a) | | | 1,770,000 | | | 1,770,000 | |
| | | | |
|
| |
| | | | | | 6,685,000 | |
| | | | |
|
| |
Louisiana – 1.9% | | | | | | | |
Louisiana Housing Finance Agency
Revenue, 1.55%, 12/1/25, (LOC
Societe Generale) (a) | | | 4,000,000 | | | 4,000,000 | |
| | | | |
|
| |
Maryland – 1.8% | | | | | | | |
Baltimore Maryland Industrial
Development Authority Revenue,
1.85%, 8/1/16, (LOC Bayerische
Landesbank) (a) | | | 1,725,000 | | | 1,725,000 | |
| | | | | | | |
Variable Rate Demand Notes, continued | | | | | | | |
| |
| | | | | | | |
| | Principal
Amount ($) | | Value ($) | |
| |
| |
| |
Maryland, continued | | | | | | | |
Maryland State Health & Higher
Educational Facilities Authority
Revenue, 1.85%, 7/1/38, (LOC
UBS AG) (a) | | | 2,000,000 | | | 2,000,000 | |
| | | | |
|
| |
| | | | | | 3,725,000 | |
| | | | |
|
| |
Michigan – 2.8% | | | | | | | |
Ann Arbor Michigan Economic
Development Corp. Ltd. Obligation
Revenue, 2.10%, 4/1/34, (LOC Fifth
Third Bank) (a) | | | 1,200,000 | | | 1,200,000 | |
Detroit Michigan Economic
Development Corp. Revenue, Series A,
1.50%, 5/1/09, (LOC Deutsche
Bank AG) (a) | | | 785,000 | | | 785,000 | |
Michigan State Hospital Finance
Authority Revenue, Series B, 1.75%,
11/15/40, (LOC Landesbank Hessen -
Thuringen) (a) | | | 2,440,000 | | | 2,440,000 | |
Michigan State Strategic Fund Ltd.
Obligation Revenue, Series KT, 2.45%,
7/1/20, (LOC KeyBank N.A.) (a) | | | 1,575,000 | | | 1,575,000 | |
| | | | |
|
| |
| | | | | | 6,000,000 | |
| | | | |
|
| |
Minnesota – 5.8% | | | | | | | |
Bloomington Minnesota Housing
Revenue, 1.80%, 7/1/38, (LOC
Freddie Mac) (a) | | | 2,000,000 | | | 2,000,000 | |
Brooklyn Center Minnesota Revenue,
1.20%, 12/1/14, (LOC U.S. Bank
N.A.) (a) | | | 3,000,000 | | | 3,000,000 | |
Oakdale Minnesota Multi-family
Revenue, 2.00%, 6/1/45, AMT, (LOC
Freddie Mac) (a) | | | 2,000,000 | | | 2,000,000 | |
Robbinsdale Minnesota Revenue,
Series A-1, 1.75%, 5/1/33, (LOC
Wells Fargo Bank N.A.) (a) | | | 2,400,000 | | | 2,400,000 | |
St. Paul Minnesota Housing &
Redevelopment Authority Revenue,
1.45%, 10/1/25, (LOC Allied Irish
Bank plc) (a) | | | 3,020,000 | | | 3,020,000 | |
| | | | |
|
| |
| | | | | | 12,420,000 | |
| | | | |
|
| |
Missouri – 2.5% | | | | | | | |
Kansas City Missouri Special Obligation
Revenue, Series E, 1.48%, 4/15/34,
(LOC Bank of America N.A.) (a) | | | 3,000,000 | | | 3,000,000 | |
Missouri State Health & Educational
Facilities Authority Revenue, 1.20%,
8/1/37, (LOC U.S. Bank N.A.) (a) | | | 1,000,000 | | | 1,000,000 | |
Missouri State Health & Educational
Facilities Authority Revenue,
Series A-1, 1.20%, 10/1/35, (LOC
Wells Fargo Bank N.A.) (a) | | | 1,300,000 | | | 1,300,000 | |
| | | | |
|
| |
| | | | | | 5,300,000 | |
| | | | |
|
| |
Nebraska – 1.7% | | | | | | | |
Lancaster County Nebraska Hospital
Authority No. 1 Hospital Revenue,
Series B-1, 1.45%, 6/1/31, (LOC U.S.
Bank N.A.) (a) | | | 5,000 | | | 5,000 | |
| | |
21 HSBC INVESTOR FAMILY OF FUNDS | See notes to financial statements |
|
HSBC INVESTOR TAX-FREE MONEY MARKET FUND |
|
Schedule of Portfolio Investments—as of October 31, 2008 (continued) |
| | | | | | | |
Variable Rate Demand Notes, continued | | | | | | | |
| |
| | | | | | | |
| | Principal
Amount ($) | | Value ($) | |
| |
| |
| |
Nebraska, continued | | | | | | | |
Lancaster County Nebraska Hospital
Authority No. 1 Hospital Revenue,
Series B-2, 1.80%, 6/1/31, (LOC U.S.
Bank N.A.) (a) | | | 2,500,000 | | | 2,500,000 | |
Saline County Nebraska Hospital
Authority No. 1 Hospital Revenue,
Series C, 1.80%, 6/1/31, (LOC U.S.
Bank N.A.) (a) | | | 1,075,000 | | | 1,075,000 | |
| | | | |
|
| |
| | | | | | 3,580,000 | |
| | | | |
|
| |
New Jersey – 1.4% | | | | | | | |
New Jersey State Educational Facilities
Authority Revenue, Series F, 1.50%,
7/1/36, (LOC RBS Citizens N.A.) (a) | | | 3,000,000 | | | 3,000,000 | |
| | | | |
|
| |
New Mexico – 0.2% | | | | | | | |
Farmington New Mexico Hospital
Revenue, 1.78%, 6/1/28, (LOC Bank
of Nova Scotia) (a) | | | 500,000 | | | 500,000 | |
| | | | |
|
| |
New York – 6.8% | | | | | | | |
Long Island Power Authority New York
Electrical Systems Revenue, Series J,
9.00%, 12/1/29, (Credit Support FSA,
SpA Dexia Credit Local) (a) | | | 2,000,000 | | | 2,000,000 | |
Metropolitan Transportation Authority
Revenue, Sub-series G-2, 0.80%,
11/1/26, (LOC BNP Paribas) (a) | | | 2,100,000 | | | 2,100,000 | |
New York City GO, Sub-series E4,
1.30%, 8/1/21, (LOC Fortis Bank
S.A./N.V.) (a) | | | 5,000,000 | | | 5,000,000 | |
New York City Transitional Finance
Authority Revenue, Series 3,
Sub-series 3-F, 1.15%, 11/1/22,
(SpA Royal Bank of Canada) (a) | | | 5,500,000 | | | 5,500,000 | |
| | | | |
|
| |
| | | | | | 14,600,000 | |
| | | | |
|
| |
North Carolina – 0.9% | | | | | | | |
North Carolina Capital Facilities Finance
Agency Solid Waste Disposal Revenue,
Series B, 1.80%, 11/1/40, AMT, (LOC
Wells Fargo Bank N.A.) (a) | | | 2,000,000 | | | 2,000,000 | |
| | | | |
|
| |
Ohio – 4.5% | | | | | | | |
Cleveland-Cuyahoga County Ohio Port
Authority Revenue, 1.70%, 1/1/37,
(LOC JP Morgan Chase Bank) (a) | | | 875,000 | | | 875,000 | |
Hamilton County Ohio Health Care
Facilities Revenue, Series B, 5.00%,
6/1/35, (LOC KeyBank N.A.) (a) | | | 1,000,000 | | | 1,000,000 | |
Kent State University Ohio Revenue,
2.65%, 5/1/28, (LOC KeyBank
N.A.) (a) | | | 1,000,000 | | | 1,000,000 | |
Lorain County Ohio Hospital Revenue,
1.85%, 11/1/21, (LOC JP Morgan
Chase Bank) (a) | | | 1,000,000 | | | 1,000,000 | |
Ohio State Air Quality Development
Authority Revenue, Series A, 2.45%,
12/1/23, (LOC KeyBank N.A.) (a) | | | 1,000,000 | | | 1,000,000 | |
Ohio State Higher Educational Facility
Commission Revenue, Series E, 1.95%,
1/15/35, (LOC RBS Citizens
N.A.) (a) | | | 2,000,000 | | | 2,000,000 | |
| | | | | | | |
Variable Rate Demand Notes, continued | | | | | | | |
| |
| | | | | | | |
| | Principal
Amount ($) | | Value ($) | |
| |
| |
| |
Ohio, continued | | | | | | | |
Ohio State Water Development Authority
Pollution Control Facilities Revenue,
Series A, 1.75%, 8/1/29, (LOC
Barclays Bank plc) (a) | | | 1,000,000 | | | 1,000,000 | |
Parma Ohio Healthcare Facilities
Revenue, 2.23%, 10/1/29, (RBS
Citizens N.A.) (a) | | | 1,800,000 | | | 1,800,000 | |
| | | | |
|
| |
| | | | | | 9,675,000 | |
| | | | |
|
| |
Oregon – 0.5% | | | | | | | |
Oregon State Health Housing
Educational & Cultural Facilities
Authority Revenue, 2.65%, 3/1/33,
(LOC KeyBank N.A.) (a) | | | 1,000,000 | | | 1,000,000 | |
| | | | |
|
| |
Pennsylvania - 4.9% | | | | | | | |
Beaver County Pennsylvania Industrial
Development Authority Pollution
Control Revenue, 1.00%, 4/1/41,
(LOC Barclays Bank plc) (a) | | | 700,000 | | | 700,000 | |
Beaver County Pennsylvania Industrial
Development Authority Pollution
Control Revenue, Series A, 1.70%,
1/1/35, (LOC Barclays Bank plc) (a) | | | 1,500,000 | | | 1,500,000 | |
Beaver County Pennsylvania Industrial
Development Authority Pollution
Control Revenue, Series A, 2.45%,
3/1/17, (LOC KeyBank N.A.) (a) | | | 1,000,000 | | | 1,000,000 | |
Dauphin County Pennsylvania General
Authority Revenue, Sub-series S,
4.50%, 6/1/26, (Credit Support FSA,
SpA Bank of Nova Scotia, KBC
Bank N.V.) (a) | | | 1,160,000 | | | 1,160,000 | |
Delaware Valley Pennsylvania Regional
Financing Authority Local
Government Revenue, 1.80%, 8/1/16,
(LOC Bayerische Landesbank) (a) | | | 1,700,000 | | | 1,700,000 | |
Lancaster County Pennsylvania Hospital
Authority Revenue, 0.72%, 7/1/41,
(LOC Bank of America N.A.) (a) | | | 2,200,000 | | | 2,200,000 | |
Philadelphia Pennsylvania Gas Works
Revenue, Series A-2, 1.70%, 9/1/34,
(LOC JP Morgan Chase Bank, Bank
of Nova Scotia) (a) | | | 2,150,000 | | | 2,150,000 | |
| | | | |
|
| |
| | | | | | 10,410,000 | |
| | | | |
|
| |
Tennessee – 1.5% | | | | | | | |
Hamilton County Tennessee Industrial
Development Board IDR, 1.50%,
3/1/15, (LOC Bank of America
N.A.) (a)(b) | | | 1,050,000 | | | 1,050,000 | |
Jackson Tennessee Health Educational &
Housing Facility Board Multi-family
Revenue, 1.75%, 5/15/31, (Credit
Support FNMA) (a) | | | 1,375,000 | | | 1,375,000 | |
Metropolitan Government Nashville &
Davidson County IDR, 1.75%, 2/15/34,
(Credit Support FNMA) (a) | | | 800,000 | | | 800,000 | |
| | | | |
|
| |
| | | | | | 3,225,000 | |
| | | | |
|
| |
| | |
See notes to financial statements | HSBC INVESTOR FAMILY OF FUNDS | 22 |
|
HSBC INVESTOR TAX-FREE MONEY MARKET FUND |
|
Schedule of Portfolio Investments—as of October 31, 2008 (continued) |
| | | | | | | |
Variable Rate Demand Notes, continued | | | | | |
|
|
|
|
|
|
| | | | | |
| | Principal
Amount ($) | | Value ($) | |
| |
| |
| |
Texas – 1.9% | | | | | | | |
Garland Texas Industrial Development
Authority Revenue, 1.95%, 12/1/14,
(LOC Wells Fargo Bank N.A.) (b)(a) | | | 1,625,000 | | | 1,625,000 | |
Tarrant County Texas Cultural Education
Facilities Finance Corp. Hospital
Revenue, Series A, 1.40%, 8/15/41,
(LOC Bank of America N.A.) (a) | | | 1,000,000 | | | 1,000,000 | |
Tarrant County Texas Housing Finance
Corp. Revenue, 1.60%, 2/15/36,
(Credit Support FNMA) (a) | | | 1,400,000 | | | 1,400,000 | |
| | | | |
|
| |
| | | | | | 4,025,000 | |
| | | | |
|
| |
Vermont – 1.4% | | | | | | | |
Vermont Housing Finance Agency Single
Family Revenue, Series 21A, 6.50%,
11/1/34, AMT, (Credit Support FSA,
SpA Dexia Credit Local) (a) | | | 940,000 | | | 940,000 | |
Vermont State Student Assistance Corp.
Education Loan Revenue, Series C-1,
1.58%, 12/15/40, AMT, (LOC Lloyds
Bank) (a) | | | 2,000,000 | | | 2,000,000 | |
| | | | |
|
| |
| | | | | | 2,940,000 | |
| | | | |
|
| |
Washington – 3.9% | | | | | | | |
Washington State Health Care Facilities
Authority Lease Revenue, 1.80%,
1/1/32, (LOC BNP Paribas) (a) | | | 1,000,000 | | | 1,000,000 | |
Washington State Health Care Facilities
Authority Revenue, 1.58%, 11/15/26,
(LOC Citibank N.A.) (a)(b) | | | 1,500,000 | | | 1,500,000 | |
Washington State Housing Finance
Commission Nonprofit Revenue,
1.48%, 6/1/32, (LOC Northern Trust
Co.) (a) | | | 2,925,000 | | | 2,925,000 | |
Washington State Housing Finance
Commission Nonprofit Revenue,
2.05%, 1/1/27, (LOC KeyBank
N.A.) (a) | | | 1,480,000 | | | 1,480,000 | |
Washington State Housing Finance
Commission Nonprofit Revenue,
2.65%, 4/1/43, (LOC KeyBank
N.A.) (a) | | | 1,500,000 | | | 1,500,000 | |
| | | | |
|
| |
| | | | | | 8,405,000 | |
| | | | |
|
| |
Wisconsin – 1.5% | | | | | | | |
Wisconsin State Health & Educational
Facilities Authority Revenue, Series B,
1.20%, 12/1/26, (LOC U.S. Bank
N.A.) (a) | | | 1,300,000 | | | 1,300,000 | |
Wisconsin State Health & Educational
Facilities Authority Revenue, Series B,
1.47%, 8/15/33, (LOC U.S. Bank
N.A.) (a) | | | 1,990,000 | | | 1,990,000 | |
| | | | |
|
| |
| | | | | | 3,290,000 | |
| | | | |
|
| |
Wyoming – 0.9% | | | | | | | |
Sweetwater County Wyoming Hospital
Revenue, Series B, 2.36%, 9/1/37,
(LOC KeyBank N.A.) (a) | | | 2,000,000 | | | 2,000,000 | |
| | | | |
|
| |
TOTAL VARIABLE RATE DEMAND
NOTES (COST $168,129,961) | | | | | | 168,129,961 | |
| | | | |
|
| |
| | | | | | | |
Tax-Free Notes And Commercial Paper—15.7% | | | | | | | |
|
|
|
|
|
|
|
|
| | | | | |
| | Shares or
Principal
Amount ($) | | Value ($) | |
| |
| |
| |
California – 1.8% | | | | | | | |
San Diego County Regional Airport
Authority Revenue, Series B, 1.55%,
12/4/08, AMT, (LOC Lloyds Bank) | | | 3,750,000 | | | 3,750,000 | |
| | | | |
|
| |
Connecticut – 1.7% | | | | | | | |
City of New Haven Connecticut,
Series 02-A, 1.60%, 12/1/08, (LOC
Landesbank Hessen) | | | 3,680,000 | | | 3,680,000 | |
| | | | |
|
| |
Florida – 1.4% | | | | | | | |
Florida Local Government Finance
Commission, Series A, 1.60%,
12/9/08, (LOC First Union National
Bank) | | | 1,075,000 | | | 1,075,000 | |
Hillsborough County Florida, Series A,
1.65%, 4/23/09, (LOC State Street
B&T Co.) | | | 2,000,000 | | | 2,000,000 | |
| | | | |
|
| |
| | | | | | 3,075,000 | |
| | | | |
|
| |
Georgia – 2.0% | | | | | | | |
Municipal Electric Authority Georgia,
Series TE-A, 1.55%, 11/6/08, (LOC
Bayerische Landesbank Girozen,
Wachovia Bank, Westlandesbank
Girozen) | | | 4,320,000 | | | 4,320,000 | |
| | | | |
|
| |
Hawaii – 0.9% | | | | | | | |
Honolulu City & County GO, Series H,
1.55%, 12/2/08, (LOC Helaba) | | | 2,000,000 | | | 2,000,000 | |
| | | | |
|
| |
Nevada – 1.4% | | | | | | | |
Las Vegas Convention & Visitors
Authority Revenue, Series 06-A,
1.60%, 11/4/08, (LOC Fortis Bank
S.V./N.A., Bank of Nova Scotia, State
Street B&T Co.) | | | 3,000,000 | | | 3,000,000 | |
| | | | |
|
| |
Pennsylvania – 1.9% | | | | | | | |
Montgomery County Pennsylvania
Industrial Pollution Control Revenue,
Series 94-A, 1.50%, 11/12/08, (LOC
BNP Paribas) | | | 4,000,000 | | | 4,000,000 | |
| | | | |
|
| |
Texas – 3.4% | | | | | | | |
Harris County Texas, Series F, 1.85%,
11/13/08, (LOC Helaba) | | | 3,190,000 | | | 3,190,000 | |
Houston Texas, Series A, 1.68%,
11/5/08, (LOC Bank of New York) | | | 4,000,000 | | | 4,000,000 | |
| | | | |
|
| |
| | | | | | 7,190,000 | |
| | | | |
|
| |
Wisconsin – 0.5% | | | | | | | |
City of Milwaukee, Series 8-C2, 1.60%,
12/11/08, (LOC State Street B&T
Co.) | | | 1,000,000 | | | 1,000,000 | |
| | | | |
|
| |
Wyoming – 0.7% | | | | | | | |
Sweetwater County Wyoming Pollution
Control Revenue, Series 88-A, 1.60%,
2/3/09, (LOC Barclays Bank plc) | | | 1,500,000 | | | 1,500,000 | |
| | | | |
|
| |
TOTAL TAX-FREE NOTES AND
COMMERCIAL PAPER
(COST $33,515,000) | | | | | | 33,515,000 | |
| | | | |
|
| |
| | |
23 | HSBC INVESTOR FAMILY OF FUNDS | See notes to financial statements |
|
HSBC INVESTOR TAX-FREE MONEY MARKET FUND |
|
Schedule of Portfolio Investments—as of October 31, 2008 (continued) |
| | | | | | | |
Investment Companies—5.4% | | | | | |
|
|
|
|
|
|
| | | | | |
| | Principal
Amount ($) | | Value ($) | |
| |
| |
| |
BlackRock Liquidity Funds MuniFund
Portfolio Institutional Shares,
1.87% (c) | | | 9,900,000 | | | 9,900,000 | |
Northern Institutional Tax Exempt
Portfolio, 1.86% (c) | | | 1,591,226 | | | 1,591,226 | |
| | | | |
|
| |
TOTAL INVESTMENT COMPANIES
(COST $11,491,226) | | | | | | 11,491,226 | |
| | | | |
|
| |
TOTAL INVESTMENTS
(COST $213,136,187)—99.8% | | | | | | 213,136,187 | |
| | | | |
|
| |
| |
| Percentages indicated are based on net assets of $213,517,021. |
| |
(a) | Variable rate security. The interest rates on these securities are adjusted periodically to reflect then-current short-term interest rates. The rates presented represent the rates in effect on October 31, 2008. The maturity dates presented reflect the final maturity dates. However, some of these securities may contain put or demand features that allow the fund to require the issuer to repurchase the security from the fund within various time periods, including daily, weekly, monthly, or semi-annually. |
| |
(b) | Security exempt from registration under Rule 144a of the Securities Act of 1933. This security may be resold in transactions exempt from registration, normally to qualified institutional buyers. This security has been deemed liquid by the Investment Adviser based on procedures approved by the Board of Trustees. |
| |
(c) | The rates presented represent the annualized one day yield that was in effect on October 31, 2008. |
| |
AMT | — Interest on security is subject to federal alternative minimum tax |
FNMA | — Federal National Mortgage Association |
FSA | — Financial Security Assurance |
GO | — General Obligation |
IDR | — Industrial Development Revenue |
LOC | — Letter of Credit |
PLC | — Public Limited Co. |
SPA | — Standby Purchase Agreement |
| | |
See notes to financial statements | HSBC INVESTOR FAMILY OF FUNDS | 24 |
|
HSBC INVESTOR U.S. GOVERNMENT MONEY MARKET FUND |
|
Schedule of Portfolio Investments—as of October 31, 2008 |
| | | | | | | |
U.S. Government and Government Agency Obligations—84.5% | | | | | | | |
|
|
|
|
|
|
|
|
| | | | | | | |
| | Principal
Amount ($) | | Value ($) | |
| |
| |
| |
Federal Farm Credit Bank – 13.2% | | | | | | | |
2.23%, 11/10/08 (a) | | | 20,000,000 | | | 19,988,900 | |
2.11%, 11/12/08 (a) | | | 50,000,000 | | | 49,968,528 | |
0.97%, 11/24/08 (b) | | | 50,000,000 | | | 49,999,534 | |
2.32%, 12/3/08 (a) | | | 20,000,000 | | | 19,959,822 | |
2.31%, 12/4/08 (a) | | | 20,000,000 | | | 19,958,750 | |
1.07%, 1/7/09 (b) | | | 300,000,000 | | | 300,000,000 | |
1.07%, 1/14/09 (b) | | | 26,000,000 | | | 25,998,407 | |
2.74%, 1/16/09 (a) | | | 50,000,000 | | | 49,718,167 | |
0.96%, 1/23/09 (b) | | | 21,000,000 | | | 20,993,300 | |
2.20%, 3/25/09 | | | 200,000,000 | | | 200,000,000 | |
0.96%, 5/11/09 (b) | | | 150,000,000 | | | 149,992,495 | |
1.10%, 5/15/09 (b) | | | 300,000,000 | | | 300,000,000 | |
0.96%, 6/8/09 (b) | | | 100,000,000 | | | 99,994,263 | |
2.81%, 7/13/09 (a) | | | 74,000,000 | | | 72,590,300 | |
1.07%, 7/22/09 (b) | | | 25,000,000 | | | 24,992,751 | |
4.50%, 10/14/09 (b) | | | 68,000,000 | | | 68,000,000 | |
4.08%, 10/21/09 (b) | | | 150,000,000 | | | 149,985,572 | |
1.06%, 11/16/09 (b) | | | 200,000,000 | | | 200,000,000 | |
| | | | |
|
| |
| | | | | | 1,822,140,789 | |
| | | | |
|
| |
Federal Home Loan Bank – 71.3% | | | | | | | |
0.39%, 11/3/08 (a) | | | 38,435,000 | | | 38,434,167 | |
0.90%, 11/5/08 (a) | | | 300,000,000 | | | 299,970,000 | |
2.48%, 11/12/08 (a) | | | 100,000,000 | | | 99,925,444 | |
2.64%, 11/14/08 (b) | | | 100,000,000 | | | 99,998,959 | |
1.25%, 11/17/08 (a) | | | 214,640,000 | | | 214,520,755 | |
1.27%, 11/18/08 (a) | | | 197,000,000 | | | 196,883,715 | |
1.27%, 11/21/08 (a) | | | 602,315,000 | | | 601,896,726 | |
1.05%, 11/24/08 (a) | | | 1,343,800,000 | | | 1,342,699,872 | |
1.27%, 11/25/08 (a) | | | 1,661,000,000 | | | 1,659,058,107 | |
1.34%, 11/26/08 (a) | | | 250,000,000 | | | 249,770,833 | |
2.60%, 11/28/08 | | | 300,000,000 | | | 300,000,000 | |
1.34%, 12/1/08 (a) | | | 101,000,000 | | | 100,888,900 | |
1.11%, 12/3/08 (b) | | | 200,000,000 | | | 200,000,000 | |
1.37%, 12/30/08 (a) | | | 227,083,000 | | | 226,580,579 | |
5.25%, 1/16/09 | | | 209,000,000 | | | 210,419,632 | |
2.69%, 2/18/09 (b) | | | 200,000,000 | | | 200,000,000 | |
2.36%, 3/6/09 (a) | | | 200,000,000 | | | 198,402,778 | |
2.36%, 3/10/09 (a) | | | 200,000,000 | | | 198,351,667 | |
2.63%, 3/12/09 | | | 200,000,000 | | | 200,000,000 | |
2.85%, 3/17/09 | | | 9,523,810 | | | 9,523,810 | |
2.38%, 4/7/09 | | | 41,545,000 | | | 41,562,756 | |
3.19%, 4/15/09 (a) | | | 200,000,000 | | | 197,158,333 | |
2.63%, 4/30/09 | | | 34,835,000 | | | 34,841,178 | |
2.57%, 5/5/09 | | | 90,000,000 | | | 90,135,041 | |
2.65%, 5/6/09 | | | 50,000,000 | | | 50,000,000 | |
2.48%, 5/7/09 | | | 46,095,000 | | | 46,138,140 | |
2.75%, 5/7/09 | | | 18,550,000 | | | 18,591,296 | |
2.62%, 5/13/09 (b) | | | 200,000,000 | | | 199,567,146 | |
2.63%, 5/20/09 (b) | | | 45,000,000 | | | 44,993,759 | |
2.95%, 7/28/09, Callable 1/28/09 @ 100 | | | 100,000,000 | | | 100,000,000 | |
2.65%, 8/5/09 (b) | | | 100,000,000 | | | 99,977,536 | |
2.65%, 8/5/09 (b) | | | 500,000,000 | | | 499,520,579 | |
2.66%, 8/7/09 (b) | | | 300,000,000 | | | 300,035,278 | |
4.00%, 9/4/09 (b) | | | 470,000,000 | | | 470,000,000 | |
| | | | | | | |
U.S. Government and Government Agency Obligations, continued | | | | | | | |
|
|
|
|
|
|
|
|
| | | | | | | |
| | Principal
Amount ($) | | Value ($) | |
| |
| |
| |
Federal Home Loan Bank, continued | | | | | | | |
4.11%, 10/5/09 (b) | | | 400,000,000 | | | 400,037,245 | |
4.39%, 10/16/09 (b) | | | 300,000,000 | | | 299,942,682 | |
4.23%, 4/16/10 (b) | | | 300,000,000 | | | 300,000,000 | |
| | | | |
|
| |
| | | | | | 9,839,826,913 | |
| | | | |
|
| |
TOTAL U.S. GOVERNMENT AND GOVERNMENT AGENCY OBLIGATIONS
(COST $11,661,967,702) | | | | | | 11,661,967,702 | |
| | | | |
|
| |
| | | | | | | |
Repurchase Agreements—15.4% | | | | | | | |
|
|
|
|
|
|
|
|
BNP Paribas, purchased on 10/31/08,
0.20%, due 11/3/08 with a maturity
value of $750,012,500 (collateralized
fully by various U.S. Government and
Government Agency Obligations) | | | 750,000,000 | | | 750,000,000 | |
Deutsche Bank, purchased on 10/28/08,
1.25%, due 11/4/08 with a maturity
value of $400,097,222 (Collateralized
fully by various U.S. Government and
Government Agency Obligations) | | | 400,000,000 | | | 400,000,000 | |
Deutsche Bank, purchased on 10/31/08,
0.25%, due 11/3/08 with a maturity
value of $720,015,000 (collateralized
fully by various U.S. Government and
Government Agency Obligations) | | | 720,000,000 | | | 720,000,000 | |
Goldman Sachs, purchased on 10/31/08,
0.10%, due 11/3/08 with a maturity
value of $250,002,083 (Collateralized
fully by various U.S. Government and
Government Agency Obligations) | | | 250,000,000 | | | 250,000,000 | |
| | | | |
|
| |
TOTAL REPURCHASE AGREEMENTS
(COST $2,120,000,000) | | | | | | 2,120,000,000 | |
| | | | |
|
| |
TOTAL INVESTMENTS
(COST $13,781,967,702)—99.9% | | | | | | 13,781,967,702 | |
| | | | |
|
| |
| |
|
| Percentages indicated are based on net assets of $13,798,709,649. |
| |
(a) | Discount note. Rate presented represents the effective yield at time of purchase. |
| |
(b) | Variable rate security. The interest rates on these securities are adjusted periodically to reflect then-current short-term interest rates. The rates presented represent the rates in effect on October 31, 2008. The maturity dates presented reflect the final maturity dates. However, some of these securities may contain put or demand features that allow the fund to require the issuer to repurchase the security from the fund within various time periods, including daily, weekly, monthly, or semi-annually. |
| | |
25 | HSBC INVESTOR FAMILY OF FUNDS | See notes to financial statements |
|
HSBC INVESTOR U.S. TREASURY MONEY MARKET FUND |
|
Schedule of Portfolio Investments—as of October 31, 2008 |
| | | | | | | |
U.S. Treasury Obligations—99.3% | | | | | | | |
|
|
|
|
|
|
|
|
| | | | | | | |
| | Principal
Amount ($) | | Value ($) | |
| |
| |
| |
U.S. Treasury Bills – 99.3% | | | | | | | |
1.36%, 11/6/08 (a) | | | 1,103,500,000 | | | 1,103,362,725 | |
1.10%, 11/13/08 (a) | | | 737,000,000 | | | 736,757,463 | |
3.38%, 11/15/08 (a) | | | 100,000,000 | | | 100,117,711 | |
4.38%, 11/15/08 (a) | | | 133,000,000 | | | 133,204,003 | |
1.11%, 11/20/08 (a) | | | 1,051,000,000 | | | 1,050,584,016 | |
0.78%, 11/28/08 (a) | | | 680,000,000 | | | 679,655,975 | |
0.76%, 12/4/08 (a) | | | 479,200,000 | | | 478,880,076 | |
0.82%, 12/11/08 (a) | | | 539,100,000 | | | 538,651,356 | |
0.69%, 12/18/08 (a) | | | 605,000,000 | | | 604,555,605 | |
1.50%, 12/26/08 (a) | | | 193,600,000 | | | 193,274,252 | |
0.60%, 1/2/09 (a) | | | 200,000,000 | | | 199,793,549 | |
0.57%, 1/8/09 (a) | | | 92,500,000 | | | 92,399,393 | |
0.98%, 1/15/09 (a) | | | 225,000,000 | | | 224,606,563 | |
1.27%, 1/22/09 (a) | | | 150,000,000 | | | 149,588,605 | |
1.61%, 1/29/09 (a) | | | 50,000,000 | | | 49,815,703 | |
1.90%, 2/5/09 (a) | | | 25,000,000 | | | 24,874,500 | |
1.67%, 2/12/09 (a) | | | 25,000,000 | | | 24,881,300 | |
1.76%, 2/19/09 (a) | | | 25,000,000 | | | 24,866,931 | |
1.86%, 2/26/09 (a) | | | 25,000,000 | | | 24,850,541 | |
4.75%, 2/28/09 (a) | | | 25,000,000 | | | 25,226,240 | |
1.87%, 3/5/09 (a) | | | 25,000,000 | | | 24,840,307 | |
1.85%, 3/12/09 (a) | | | 25,000,000 | | | 24,833,111 | |
0.94%, 3/19/09 (a) | | | 25,000,000 | | | 24,909,965 | |
1.00%, 4/2/09 (a) | | | 25,000,000 | | | 24,895,131 | |
1.11%, 4/9/09 (a) | | | 25,000,000 | | | 24,878,542 | |
1.36%, 4/29/09 (a) | | | 25,000,000 | | | 24,832,187 | |
| | | | |
|
| |
| | | | | | 6,609,135,750 | |
| | | | |
|
| |
TOTAL INVESTMENTS (COST $6,609,135,750)—99.3% | | | | | | 6,609,135,750 | |
| | | | |
|
| |
| |
|
| Percentages indicated are based on net assets of $6,655,170,611. |
| |
(a) | Discount note. Rate presented represents the effective yield at time of purchase. |
| | |
See notes to financial statements | HSBC INVESTOR FAMILY OF FUNDS | 26 |
HSBC INVESTOR FAMILY OF FUNDS
Statements of Assets and Liabilities—as of October 31, 2008
| | | | | | | | | | |
| | California
Tax-Free
Money Market
Fund | | Prime
Money Market
Fund | | New York
Tax-Free
Money Market
Fund | |
|
|
|
|
|
|
|
|
|
|
|
Assets: | | | | | | | | | | |
Investments, at amortized cost | | $ | 109,667,674 | | $ | 7,719,398,494 | | $ | 929,847,685 | |
Repurchase agreements, at cost | | | — | | | 930,000,000 | | | — | |
| |
|
| |
|
| |
|
| |
Total Investments | | | 109,667,674 | | | 8,649,398,494 | | | 929,847,685 | |
Cash | | | — | | | 49,140,125 | | | — | |
Interest and dividends receivable | | | 320,005 | | | 12,633,996 | | | 3,813,506 | |
Receivable for capital shares issued | | | 92,595 | | | 8,350,803 | | | 2,153,617 | |
Receivable for investments sold | | | — | | | — | | | 19,500,000 | |
Treasury Guarantee Program Fees (See Note 8) | | | 8,249 | | | 547,517 | | | 71,495 | |
Prepaid expenses and other assets | | | 14,868 | | | 115,847 | | | 27,765 | |
| |
|
| |
|
| |
|
| |
Total Assets | | | 110,103,391 | | | 8,720,186,782 | | | 955,414,068 | |
| |
|
| |
|
| |
|
| |
Liabilities: | | | | | | | | | | |
Dividends payable | | | 195,764 | | | 12,941,787 | | | 2,640,870 | |
Payable for investments purchased | | | — | | | 167,215,254 | | | — | |
Accrued expenses and other liabilities: | | | | | | | | | | |
Investment Management | | | 4,279 | | | 1,077,895 | | | 126,134 | |
Administration | | | 3,651 | | | 269,545 | | | 34,415 | |
Distribution | | | — | | | 218,143 | | | 50 | |
Shareholder Servicing | | | 15,877 | | | 780,135 | | | 145,786 | |
Compliance Service | | | 234 | | | 9,691 | | | 1,244 | |
Transfer Agent | | | 11,635 | | | 52,882 | | | 14,747 | |
Trustee | | | — | | | 12,583 | | | 1,189 | |
Other | | | 5,908 | | | 360,054 | | | 36,772 | |
| |
|
| |
|
| |
|
| |
Total Liabilities | | | 237,348 | | | 182,937,969 | | | 3,001,207 | |
| |
|
| |
|
| |
|
| |
Net Assets | | $ | 109,866,043 | | $ | 8,537,248,813 | | $ | 952,412,861 | |
| |
|
| |
|
| |
|
| |
| | | | | | | | | | |
Composition of Net Assets: | | | | | | | | | | |
Capital | | $ | 109,868,967 | | $ | 8,541,208,378 | | $ | 952,404,644 | |
Accumulated net investment income (loss) | | | — | | | (539 | ) | | — | |
Accumulated net realized gains (losses) from investment transactions | | | (2,924 | ) | | (3,959,026 | ) | | 8,217 | |
| |
|
| |
|
| |
|
| |
Net Assets | | $ | 109,866,043 | | $ | 8,537,248,813 | | $ | 952,412,861 | |
| |
|
| |
|
| |
|
| |
| | | | | | | | | | |
Net Assets: | | | | | | | | | | |
Class A Shares | | $ | 442,019 | | $ | 308,498,725 | | $ | 45,790,509 | |
Class B Shares | | | — | | | 198,637 | | | 34,642 | |
Class C Shares | | | — | | | 316,778,898 | | | 1 | |
Class D Shares | | | 83,261,236 | | | 2,720,592,147 | | | 586,791,042 | |
Class I Shares | | | — | | | 2,954,253,182 | | | — | |
Class Y Shares | | | 26,162,788 | | | 2,236,927,224 | | | 319,796,667 | |
| |
|
| |
|
| |
|
| |
| | $ | 109,866,043 | | $ | 8,537,248,813 | | $ | 952,412,861 | |
| |
|
| |
|
| |
|
| |
| | | | | | | | | | |
Shares Outstanding | | | | | | | | | | |
($0.001 par value, unlimited number of shares authorized): | | | | | | | | | | |
Class A Shares | | | 442,023 | | | 308,734,702 | | | 45,788,691 | |
Class B Shares | | | — | | | 198,748 | | | 34,603 | |
Class C Shares | | | — | | | 316,920,844 | | | 1 | |
Class D Shares | | | 83,257,382 | | | 2,722,716,094 | | | 586,791,082 | |
Class I Shares | | | — | | | 2,955,186,327 | | | — | |
Class Y Shares | | | 26,171,182 | | | 2,237,466,316 | | | 319,790,347 | |
Net Asset Value, Offering Price and Redemption Price per share: | | | | | | | | | | |
Class A Shares | | $ | 1.00 | | $ | 1.00 | | $ | 1.00 | |
Class B Shares* | | $ | — | | $ | 1.00 | | $ | 1.00 | |
Class C Shares* | | $ | — | | $ | 1.00 | | $ | 1.00 | |
Class D Shares | | $ | 1.00 | | $ | 1.00 | | $ | 1.00 | |
Class I Shares | | $ | — | | $ | 1.00 | | $ | — | |
Class Y Shares | | $ | 1.00 | | $ | 1.00 | | $ | 1.00 | |
| |
|
| |
|
| |
|
| |
Total Investments, at amortized cost | | $ | 109,667,674 | | $ | 8,649,398,494 | | $ | 929,847,685 | |
| |
|
| |
|
| |
|
| |
| |
| |
* Redemption price per share varies by length of time shares are held. |
| | |
27 | HSBC INVESTOR FAMILY OF FUNDS | See notes to financial statements |
HSBC INVESTOR FAMILY OF FUNDS
Statements of Assets and Liabilities—as of October 31, 2008 (continued)
| | | | | | | | | | |
| | Tax-Free
Money Market
Fund | | U.S. Government
Money Market
Fund | | U.S. Treasury
Money Market
Fund | |
|
|
|
|
|
|
|
|
|
|
|
Assets: | | | | | | | | | | |
Investments, at amortized cost | | $ | 213,136,187 | | $ | 11,661,967,702 | | $ | 6,609,135,750 | |
Repurchase agreements, at cost | | | — | | | 2,120,000,000 | | | — | |
| |
|
| |
|
| |
|
| |
Total Investments | | | 213,136,187 | | | 13,781,967,702 | | | 6,609,135,750 | |
Cash | | | — | | | 1,483,325 | | | 43,456,339 | |
Interest and dividends receivable | | | 708,624 | | | 26,346,020 | | | 4,450,497 | |
Receivable for capital shares issued | | | 210,669 | | | 15,083,904 | | | 2,258,023 | |
Treasury Guarantee Program Fees (See Note 8) | | | 14,146 | | | 1,423,071 | | | — | |
Prepaid expenses and other assets | | | 18,653 | | | 286,910 | | | 162,421 | |
| |
|
| |
|
| |
|
| |
Total Assets | | | 214,088,279 | | | 13,826,590,932 | | | 6,659,463,030 | |
| |
|
| |
|
| |
|
| |
Liabilities: | | | | | | | | | | |
Dividends payable | | | 525,961 | | | 21,398,744 | | | 2,780,074 | |
Accrued expenses and other liabilities: | | | | | | | | | | |
Investment Management | | | — | | | 2,875,344 | | | 725,291 | |
Administration | | | 7,274 | | | 667,385 | | | 182,257 | |
Distribution | | | 9 | | | 853 | | | 479 | |
Shareholder Servicing | | | 14,903 | | | 1,602,790 | | | 342,418 | |
Compliance Service | | | 268 | | | 25,304 | | | 4,058 | |
Transfer Agent | | | 13,049 | | | 89,411 | | | 23,255 | |
Trustee | | | 461 | | | 37,996 | | | 7,531 | |
Other | | | 9,333 | | | 1,183,456 | | | 227,056 | |
| |
|
| |
|
| |
|
| |
Total Liabilities | | | 571,258 | | | 27,881,283 | | | 4,292,419 | |
| |
|
| |
|
| |
|
| |
Net Assets | | $ | 213,517,021 | | $ | 13,798,709,649 | | $ | 6,655,170,611 | |
| |
|
| |
|
| |
|
| |
| | | | | | | | | | |
Composition of Net Assets: | | | | | | | | | | |
Capital | | $ | 213,516,305 | | $ | 13,797,859,298 | | $ | 6,655,204,876 | |
Accumulated net investment income (loss) | | | — | | | (1 | ) | | (602 | ) |
Accumulated net realized gains (losses) from investment transactions | | | 716 | | | 850,352 | | | (33,663 | ) |
| |
|
| |
|
| |
|
| |
Net Assets | | $ | 213,517,021 | | $ | 13,798,709,649 | | $ | 6,655,170,611 | |
| |
|
| |
|
| |
|
| |
| | | | | | | | | | |
Net Assets: | | | | | | | | | | |
Class A Shares | | $ | — | | $ | 703,711,615 | | $ | 580,458,474 | |
Class B Shares | | | — | | | 53,872 | | | 131,390 | |
Class C Shares | | | — | | | 100,661 | | | 1,102,851 | |
Class D Shares | | | 69,786,946 | | | 1,438,198,531 | | | 937,905,270 | |
Class I Shares | | | — | | | 4,908,887,405 | | | 3,771,262,460 | |
Class Y Shares | | | 143,730,075 | | | 6,747,757,565 | | | 1,364,310,166 | |
| |
|
| |
|
| |
|
| |
| | $ | 213,517,021 | | $ | 13,798,709,649 | | $ | 6,655,170,611 | |
| |
|
| |
|
| |
|
| |
| | | | | | | | | | |
Shares Outstanding | | | | | | | | | | |
($0.001 par value, unlimited number of shares authorized): | | | | | | | | | | |
Class A Shares | | | — | | | 703,278,011 | | | 580,492,590 | |
Class B Shares | | | — | | | 53,873 | | | 131,392 | |
Class C Shares | | | — | | | 100,612 | | | 1,102,851 | |
Class D Shares | | | 69,785,101 | | | 1,437,899,111 | | | 937,894,557 | |
Class I Shares | | | — | | | 4,908,769,558 | | | 3,771,287,695 | |
Class Y Shares | | | 143,730,836 | | | 6,747,758,490 | | | 1,364,307,659 | |
Net Asset Value, Offering Price and Redemption Price per share: | | | | | | | | |
Class A Shares | | $ | — | | $ | 1.00 | | $ | 1.00 | |
Class B Shares* | | $ | — | | $ | 1.00 | | $ | 1.00 | |
Class C Shares* | | $ | — | | $ | 1.00 | | $ | 1.00 | |
Class D Shares | | $ | 1.00 | | $ | 1.00 | | $ | 1.00 | |
Class I Shares | | $ | — | | $ | 1.00 | | $ | 1.00 | |
Class Y Shares | | $ | 1.00 | | $ | 1.00 | | $ | 1.00 | |
| |
|
| |
|
| |
|
| |
Total Investments, at cost | | $ | 213,136,187 | | $ | 13,781,967,702 | | $ | 6,609,135,750 | |
| |
|
| |
|
| |
|
| |
| |
| |
* Redemption price per share varies by length of time shares are held. |
| | |
See notes to financial statements | HSBC INVESTOR FAMILY OF FUNDS | 28 |
HSBC INVESTOR FAMILY OF FUNDS
Statements of Operations—For the year ended October 31, 2008
| | | | | | | | | | |
| | California
Tax-Free
Money Market
Fund | | Prime
Money Market
Fund | | New York
Tax-Free
Money Market
Fund | |
|
|
|
|
|
|
|
|
|
|
|
Investment Income: | | | | | | | | | | |
Interest | | $ | 4,030,708 | | $ | 266,677,431 | | $ | 26,538,778 | |
Dividends | | | 155,038 | | | — | | | 974,942 | |
| |
|
| |
|
| |
|
| |
Total Investment Income (Loss) | | | 4,185,746 | | | 266,677,431 | | | 27,513,720 | |
| | | | | | | | | | |
Expenses: | | | | | | | | | | |
Investment Management | | | 187,763 | | | 7,984,317 | | | 1,101,736 | |
Advisory Services: | | | | | | | | | | |
Operational Support—Class A Shares | | | 35 | | | 391,924 | | | 34,977 | |
Operational Support—Class B Shares | | | — | | | 203 | | | 17 | |
Operational Support—Class C Shares | | | 402 | | | 368,549 | | | — | |
Operational Support—Class D Shares | | | 104,185 | | | 3,399,664 | | | 341,199 | |
Operational Support—Class Y Shares | | | 83,140 | | | 1,308,216 | | | 174,675 | |
Administration | | | 76,578 | | | 3,386,971 | | | 445,509 | |
Distribution: | | | | | | | | | | |
Class B Shares | | | — | | | 1,525 | | | 259 | |
Class C Shares | | | 3,018 | | | 2,764,155 | | | — | |
Shareholder Servicing: | | | | | | | | | | |
Class A Shares | | | 138 | | | 1,567,723 | | | 279,931 | |
Class B Shares | | | — | | | 509 | | | 87 | |
Class C Shares | | | 1,006 | | | 921,385 | | | — | |
Class D Shares | | | 260,462 | | | 8,499,274 | | | 1,705,918 | |
Accounting | | | 80,406 | | | 83,294 | | | 87,202 | |
Compliance Service | | | 1,645 | | | 67,788 | | | 8,839 | |
Custodian | | | 13,605 | | | 376,180 | | | 57,222 | |
Printing | | | 1,454 | | | 202,438 | | | 23,240 | |
Professional fees | | | 6,769 | | | 361,250 | | | 46,800 | |
Transfer Agent | | | 42,500 | | | 101,281 | | | 44,621 | |
Treasury Guarantee Program fees (See Note 8) | | | 4,224 | | | 279,528 | | | 36,504 | |
Trustee | | | 5,964 | | | 238,011 | | | 31,953 | |
Registration fees | | | 60,951 | | | 227,515 | | | 74,189 | |
Other | | | 7,441 | | | 309,666 | | | 32,793 | |
| |
|
| |
|
| |
|
| |
Total expenses before fee reductions | | | 941,686 | | | 32,841,366 | | | 4,527,671 | |
Fees reduced by Investment Adviser | | | (281,645 | ) | | (2,027 | ) | | — | |
Fees reduced by Administrator | | | — | | | (196,808 | ) | | — | |
Fees reduced by Custody Credits | | | — | | | (48,756 | ) | | — | |
| |
|
| |
|
| |
|
| |
Net Expenses | | | 660,041 | | | 32,593,775 | | | 4,527,671 | |
| |
|
| |
|
| |
|
| |
|
Net Investment Income (Loss) | | | 3,525,705 | | | 234,083,656 | | | 22,986,049 | |
| |
|
| |
|
| |
|
| |
Net Realized Gains/(Losses) From Investments: | | | | | | | | | | |
Net realized gains/(losses) from investment transactions | | | (2,900 | ) | | (20,431,385 | ) | | 19,955 | |
Net realized gain payment from affiliate for purchase of certain defaulted securities (See Note 6) | | | — | | | 16,746,382 | | | — | |
| |
|
| |
|
| |
|
| |
| | | | | | | | | | |
Net realized gains (losses) from investments transactions | | | (2,900 | ) | | (3,685,003 | ) | | 19,955 | |
| |
|
| |
|
| |
|
| |
Change In Net Assets Resulting From Operations | | $ | 3,522,805 | | $ | 230,398,653 | | $ | 23,006,004 | |
| |
|
| |
|
| |
|
| |
| | |
29 | HSBC INVESTOR FAMILY OF FUNDS | See notes to financial statements |
HSBC INVESTOR FAMILY OF FUNDS
Statements of Operations—For the year ended October 31, 2008 (continued)
| | | | | | | | | | |
| | Tax-Free
Money Market
Fund | | U.S.
Government
Money Market
Fund | | U.S. Treasury
Money Market
Fund | |
|
|
|
|
|
|
|
|
|
|
|
Investment Income: | | | | | | | | | | |
Interest | | $ | 3,535,716 | | $ | 446,363,782 | | $ | 38,440,284 | |
Dividends | | | 133,787 | | | — | | | — | |
| |
|
| |
|
| |
|
| |
Total Investment Income (Loss) | | | 3,669,503 | | | 446,363,782 | | | 38,440,284 | |
| |
|
| |
|
| |
|
| |
Expenses: | | | | | | | | | | |
Investment Management | | | 146,217 | | | 16,862,384 | | | 2,381,981 | |
Advisory Services: | | | | | | | | | | |
Operational Support—Class A Shares | | | — | | | 906,481 | | | 220,376 | |
Operational Support—Class B Shares | | | — | | | 18 | | | 36 | |
Operational Support—Class C Shares | | | — | | | 391 | | | 55 | |
Operational Support—Class D Shares | | | 73,121 | | | 5,751,075 | | | 644,015 | |
Operational Support—Class Y Shares | | | 73,096 | | | 8,567,322 | | | 608,661 | |
Administration | | | 59,806 | | | 7,100,277 | | | 995,876 | |
Distribution: | | | | | | | | | | |
Class B Shares | | | — | | | 126 | | | 272 | |
Class C Shares | | | — | | | 2,934 | | | 414 | |
Shareholder Servicing: | | | | | | | | | | |
Class A Shares | | | — | | | 3,625,983 | | | 881,521 | |
Class B Shares | | | — | | | 43 | | | 90 | |
Class C Shares | | | — | | | 978 | | | 138 | |
Class D Shares | | | 182,806 | | | 14,377,891 | | | 1,610,061 | |
Accounting | | | 84,192 | | | 78,264 | | | 73,776 | |
Compliance Service | | | 1,151 | | | 148,389 | | | 15,747 | |
Custodian | | | 8,875 | | | 678,395 | | | 111,622 | |
Printing | | | 2,590 | | | 309,350 | | | 33,637 | |
Professional fees | | | 8,275 | | | 1,131,344 | | | 119,730 | |
Transfer Agent | | | 47,817 | | | 149,680 | | | 58,850 | |
Treasury Guarantee Program fees (See Note 8) | | | 7,224 | | | 726,696 | | | — | |
Trustee | | | 4,063 | | | 476,880 | | | 57,418 | |
Registration fees | | | 74,683 | | | 710,487 | | | 270,660 | |
Other | | | 6,560 | | | 432,646 | | | 76,269 | |
| |
|
| |
|
| |
|
| |
Total expenses before fee reductions | | | 780,476 | | | 62,038,034 | | | 8,161,205 | |
Fees reduced by Investment Adviser | | | (292,440 | ) | | — | | | (19,767 | ) |
Fees reduced by Administrator | | | — | | | (93,745 | ) | | (133,584 | ) |
Fees reduced by Custody Credits | | | | | | (178,051 | ) | | (93,065 | ) |
| |
|
| |
|
| |
|
| |
Net Expenses | | | 488,036 | | | 61,766,238 | | | 7,914,789 | |
| |
|
| |
|
| |
|
| |
|
Net Investment Income (Loss) | | | 3,181,467 | | | 384,597,544 | | | 30,525,495 | |
| |
|
| |
|
| |
|
| |
| | | | | | | | | | |
Net realized gains from investments transactions | | | 716 | | | 852,522 | | | 56,374 | |
| |
|
| |
|
| |
|
| |
Change In Net Assets Resulting From Operations | | $ | 3,182,183 | | $ | 385,450,066 | | $ | 30,581,869 | |
| |
|
| |
|
| |
|
| |
| | |
See notes to financial statements | HSBC INVESTOR FAMILY OF FUNDS | 30 |
HSBC INVESTOR FAMILY OF FUNDS
Statements of Changes in Net Assets
All capital share transactions have been processed at a net asset value of $1.00 per share.
| | | | | | | | | | | | | |
| | California Tax-Free
Money Market Fund | | Prime Money Market Fund | |
|
|
|
|
|
|
| | For the
year ended
October 31, 2008 | | For the
year ended
October 31, 2007 | | For the
year ended
October 31, 2008 | | For the
year ended
October 31, 2007 | |
|
|
|
|
|
|
|
|
|
|
|
|
|
|
Investment Activities: | | | | | | | | | | | | | |
Operations: | | | | | | | | | | | | | |
Net investment income (loss) | | $ | 3,525,705 | | $ | 4,203,723 | | $ | 234,083,656 | | $ | 326,556,509 | |
Net realized gains (losses) from investments transactions | | | (2,900 | ) | | — | | | (3,685,003 | ) | | (197,657 | ) |
| |
|
| |
|
| |
|
| |
|
| |
Change in net assets resulting from operations | | | 3,522,805 | | | 4,203,723 | | | 230,398,653 | | | 326,358,852 | |
| |
|
| |
|
| |
|
| |
|
| |
| | | | | | | | | | | | | |
Dividends: | | | | | | | | | | | | | |
Net investment income: | | | | | | | | | | | | | |
Class A Shares | | | (518 | ) | | (210 | ) | | (10,717,376 | ) | | (18,350,728 | ) |
Class B Shares | | | — | | | — | | | (4,255 | ) | | (6,369 | ) |
Class C Shares | | | (6,483 | ) | | (17,686 | ) | | (7,530,526 | ) | | (11,381,430 | ) |
Class D Shares | | | (1,842,641 | ) | | (3,123,504 | ) | | (98,458,039 | ) | | (151,729,252 | ) |
Class I Shares | | | — | | | — | | | (79,246,127 | ) | | (97,641,625 | ) |
Class Y Shares | | | (1,697,267 | ) | | (1,041,119 | ) | | (38,841,857 | ) | | (46,569,350 | ) |
| |
|
| |
|
| |
|
| |
|
| |
Change in net assets resulting from shareholder dividends | | | (3,546,909 | ) | | (4,182,519 | ) | | (234,798,180 | ) | | (325,678,754 | ) |
| |
|
| |
|
| |
|
| |
|
| |
|
Change in net assets resulting from capital transactions | | | (14,176,303 | ) | | (5,754,555 | ) | | 1,134,798,302 | | | 1,982,137,166 | |
| |
|
| |
|
| |
|
| |
|
| |
Change in net assets | | | (14,200,407 | ) | | (5,733,351 | ) | | 1,130,398,775 | | | 1,982,817,264 | |
| |
|
| |
|
| |
|
| |
|
| |
| | | | | | | | | | | | | |
Net Assets: | | | | | | | | | | | | | |
Beginning of period | | | 124,066,450 | | | 129,799,801 | | | 7,406,850,038 | | | 5,424,032,774 | |
| |
|
| |
|
| |
|
| |
|
| |
End of period | | $ | 109,866,043 | | $ | 124,066,450 | | $ | 8,537,248,813 | | $ | 7,406,850,038 | |
| |
|
| |
|
| |
|
| |
|
| |
Accumulated net investment income (loss) | | $ | — | | $ | 21,204 | | $ | (539 | ) | $ | 713,985 | |
| |
|
| |
|
| |
|
| |
|
| |
| | |
31 | HSBC INVESTOR FAMILY OF FUNDS | See notes to financial statements |
HSBC INVESTOR FAMILY OF FUNDS
Statements of Changes in Net Assets (continued)
All capital share transactions have been processed at a net asset value of $1.00 per share.
| | | | | | | | | | | | | |
| | California Tax-Free
Money Market Fund | | Prime Money Market
Fund | |
|
|
|
|
|
|
| | For the
year ended
October 31, 2008 | | For the
year ended
October 31, 2007 | | For the
year ended
October 31, 2008 | | For the
year ended
October 31, 2007 | |
|
|
|
|
|
|
|
|
|
|
CAPITAL TRANSACTIONS: | | | | | | | | | | | | | |
Class A Shares: | | | | | | | | | | | | | |
Proceeds from shares issued | | $ | 681,499 | | $ | 937,407 | | $ | 812,447,094 | | $ | 1,113,134,505 | |
Dividends reinvested | | | 518 | | | 210 | | | 8,967,364 | | | 14,136,518 | |
Value of shares redeemed | | | (239,994 | ) | | (937,617 | ) | | (983,783,863 | ) | | (1,071,695,496 | ) |
| |
|
| |
|
| |
|
| |
|
| |
Class A Shares capital transactions | | | 442,023 | | | — | | | (162,369,405 | ) | | 55,575,527 | |
| |
|
| |
|
| |
|
| |
|
| |
| | | | | | | | | | | | | |
Class B Shares: | | | | | | | | | | | | | |
Proceeds from shares issued | | | — | | | — | | | 200,130 | | | 160,209 | |
Dividends reinvested | | | — | | | — | | | 1,251 | | | 1,890 | |
Value of shares redeemed | | | — | | | — | | | (206,424 | ) | | (67,124 | ) |
| |
|
| |
|
| |
|
| |
|
| |
Class B Shares capital transactions | | | — | | | — | | | (5,043 | ) | | 94,975 | |
| |
|
| |
|
| |
|
| |
|
| |
| | | | | | | | | | | | | |
Class C Shares: | | | | | | | | | | | | | |
Proceeds from shares issued | | | 784 | | | 2,000,790 | | | 1,414,798,792 | | | 1,188,423,887 | |
Dividends reinvested | | | 6,483 | | | 17,686 | | | 7,530,526 | | | 11,378,953 | |
Value of shares redeemed | | | (1,025,743 | ) | | (1,000,000 | ) | | (1,422,597,259 | ) | | (1,150,696,268 | ) |
| |
|
| |
|
| |
|
| |
|
| |
Class C Shares capital transactions | | | (1,018,476 | ) | | 1,018,476 | | | (267,941 | ) | | 49,106,572 | |
| |
|
| |
|
| |
|
| |
|
| |
| | | | | | | | | | | | | |
Class D Shares: | | | | | | | | | | | | | |
Proceeds from shares issued | | | 415,175,969 | | | 251,892,899 | | | 14,056,339,720 | | | 15,074,712,309 | |
Dividends reinvested | | | 1,228,442 | | | 2,969,176 | | | 73,917,807 | | | 108,056,590 | |
Value of shares redeemed | | | (423,974,744 | ) | | (250,722,067 | ) | | (15,118,065,887 | ) | | (13,570,728,999 | ) |
| |
|
| |
|
| |
|
| |
|
| |
Class D Shares capital transactions | | | (7,570,333 | ) | | 4,140,008 | | | (987,808,360 | ) | | 1,612,039,900 | |
| |
|
| |
|
| |
|
| |
|
| |
| | | | | | | | | | | | | |
Class I Shares: | | | | | | | | | | | | | |
Proceeds from shares issued | | | — | | | — | | | 20,082,620,039 | | | 16,058,465,472 | |
Dividends reinvested | | | — | | | — | | | 35,720,314 | | | 45,106,479 | |
Value of shares redeemed | | | — | | | — | | | (19,033,614,412 | ) | | (16,344,390,225 | ) |
| |
|
| |
|
| |
|
| |
|
| |
Class I Shares capital transactions | | | — | | | — | | | 1,084,725,941 | | | (240,818,274 | ) |
| |
|
| |
|
| |
|
| |
|
| |
| | | | | | | | | | | | | |
Class Y Shares: | | | | | | | | | | | | | |
Proceeds from shares issued | | | 542,672,399 | | | 175,769,011 | | | 7,458,133,919 | | | 5,261,868,061 | |
Dividends reinvested | | | 1,121,256 | | | 825,829 | | | 35,421,479 | | | 42,696,076 | |
Value of shares redeemed | | | (549,823,172 | ) | | (187,507,879 | ) | | (6,293,032,288 | ) | | (4,798,425,671 | ) |
| |
|
| |
|
| |
|
| |
|
| |
Class Y Shares capital transactions | | | (6,029,517 | ) | | (10,913,039 | ) | | 1,200,523,110 | | | 506,138,466 | |
| |
|
| |
|
| |
|
| |
|
| |
Change in net assets resulting from capital transactions | | $ | (14,176,303 | ) | $ | (5,754,555 | ) | $ | 1,134,798,302 | | $ | 1,982,137,166 | |
| |
|
| |
|
| |
|
| |
|
| |
| | |
See notes to financial statements | HSBC INVESTOR FAMILY OF FUNDS | 32 |
HSBC INVESTOR FAMILY OF FUNDS
Statements of Changes in Net Assets (continued)
All capital share transactions have been processed at a net asset value of $1.00 per share.
| | | | | | | | | | | | | |
| | New York Tax-Free
Money Market Fund | | Tax-Free
Money Market Fund | |
|
|
|
|
|
|
| | For the
year ended
October 31, 2008 | | For the
year ended
October 31, 2007 | | For the
year ended
October 31, 2008 | | For the
year ended
October 31, 2007 | |
|
|
|
|
|
|
|
|
|
|
Investment Activities: | | | | | | | | | | | | | |
Operations: | | | | | | | | | | | | | |
Net investment income (loss) | | $ | 22,986,049 | | $ | 27,880,125 | | $ | 3,181,467 | | $ | 2,112,555 | |
Net realized gains (losses) from investment transactions | | | 19,955 | | | 4,817 | | | 716 | | | 26 | |
| |
|
| |
|
| |
|
| |
|
| |
Change in net assets resulting from operations | | | 23,006,004 | | | 27,884,942 | | | 3,182,183 | | | 2,112,581 | |
| |
|
| |
|
| |
|
| |
|
| |
| | | | | | | | | | | | | |
Dividends: | | | | | | | | | | | | | |
Net investment income: | | | | | | | | | | | | | |
Class A Shares | | | (1,479,339 | ) | | (3,816,004 | ) | | — | | | (51 | ) |
Class B Shares | | | (455 | ) | | (816 | ) | | — | | | — | |
Class C Shares | | | — | | | — | | | — | | | (104 | ) |
Class D Shares | | | (13,705,945 | ) | | (13,462,790 | ) | | (1,494,796 | ) | | (1,356,885 | ) |
Class Y Shares | | | (7,966,517 | ) | | (10,434,308 | ) | | (1,686,697 | ) | | (727,629 | ) |
| |
|
| |
|
| |
|
| |
|
| |
Change in net assets resulting from shareholder dividends | | | (23,152,256 | ) | | (27,713,918 | ) | | (3,181,493 | ) | | (2,084,669 | ) |
| |
|
| |
|
| |
|
| |
|
| |
|
Change in net assets resulting from capital transactions | | | (39,845,047 | ) | | 222,837,670 | | | 154,396,548 | | | (1,834,600 | ) |
| |
|
| |
|
| |
|
| |
|
| |
Change in net assets | | | (39,991,299 | ) | | 223,008,694 | | | 154,397,238 | | | (1,806,688 | ) |
| | | | | | | | | | | | | |
Net Assets: | | | | | | | | | | | | | |
Beginning of period | | | 992,404,160 | | | 769,395,466 | | | 59,119,783 | | | 60,926,471 | |
| |
|
| |
|
| |
|
| |
|
| |
End of period | | $ | 952,412,861 | | $ | 992,404,160 | | $ | 213,517,021 | | $ | 59,119,783 | |
| |
|
| |
|
| |
|
| |
|
| |
Accumulated net investment income (loss) | | $ | — | | $ | 166,207 | | $ | — | | $ | 26 | |
| |
|
| |
|
| |
|
| |
|
| |
| | |
33 | HSBC INVESTOR FAMILY OF FUNDS | See notes to financial statements |
HSBC INVESTOR FAMILY OF FUNDS
Statements of Changes in Net Assets (continued)
All capital share transactions have been processed at a net asset value of $1.00 per share.
| | | | | | | | | | | | | |
| | New York Tax-Free
Money Market Fund | | Tax-Free
Money Market Fund | |
|
|
|
|
|
|
| | For the
year ended
October 31, 2008 | | For the
year ended
October 31, 2007 | | For the
year ended
October 31, 2008 | | For the
year ended
October 31, 2007 | |
|
|
|
|
|
|
|
|
|
|
CAPITAL TRANSACTIONS: | | | | | | | | | | | | | |
Class A Shares: | | | | | | | | | | | | | |
Proceeds from shares issued | | $ | 210,390,939 | | $ | 239,851,195 | | $ | 828 | | $ | 636,790 | |
Dividends reinvested | | | 1,443,966 | | | 3,475,379 | | | — | | | 51 | |
Value of shares redeemed | | | (286,871,286 | ) | | (276,037,704 | ) | | (828 | ) | | (637,474 | ) |
| |
|
| |
|
| |
|
| |
|
| |
Class A Shares capital transactions | | | (75,036,381 | ) | | (32,711,130 | ) | | — | | | (633 | ) |
| |
|
| |
|
| |
|
| |
|
| |
| | | | | | | | | | | | | |
Class B Shares: | | | | | | | | | | | | | |
Dividends reinvested | | | 455 | | | 798 | | | — | | | — | |
Value of shares redeemed | | | (54 | ) | | (21,856 | ) | | — | | | — | |
| |
|
| |
|
| |
|
| |
|
| |
Class B Shares capital transactions | | | 401 | | | (21,058 | ) | | — | | | — | |
| |
|
| |
|
| |
|
| |
|
| |
| | | | | | | | | | | | | |
Class C Shares: | | | | | | | | | | | | | |
Proceeds from shares issued | | | — | | | — | | | — | | | 108,846 | |
Dividends reinvested | | | — | | | — | | | — | | | 14 | |
Value of shares redeemed | | | — | | | — | | | — | | | (108,860 | ) |
| |
|
| |
|
| |
|
| |
|
| |
Class C Shares capital transactions | | | — | | | — | | | — | | | — | |
| |
|
| |
|
| |
|
| |
|
| |
| | | | | | | | | | | | | |
Class D Shares: | | | | | | | | | | | | | |
Proceeds from shares issued | | | 2,052,625,049 | | | 2,182,879,545 | | | 197,036,869 | | | 110,671,452 | |
Dividends reinvested | | | 11,715,496 | | | 11,952,900 | | | 298,710 | | | 332,852 | |
Value of shares redeemed | | | (2,009,326,659 | ) | | (2,015,682,505 | ) | | (167,733,619 | ) | | (119,339,588 | ) |
| |
|
| |
|
| |
|
| |
|
| |
Class D Shares capital transactions | | | 55,013,886 | | | 179,149,940 | | | 29,601,960 | | | (8,335,284 | ) |
| |
|
| |
|
| |
|
| |
|
| |
| | | | | | | | | | | | | |
Class Y Shares: | | | | | | | | | | | | | |
Proceeds from shares issued | | | 1,210,332,698 | | | 1,086,228,581 | | | 300,761,859 | | | 188,182,168 | |
Dividends reinvested | | | 5,947,200 | | | 7,182,631 | | | 807,043 | | | 26,952 | |
Value of shares redeemed | | | (1,236,102,851 | ) | | (1,016,991,294 | ) | | (176,774,314 | ) | | (181,707,803 | ) |
| |
|
| |
|
| |
|
| |
|
| |
Class Y Shares capital transactions | | | (19,822,953 | ) | | 76,419,918 | | | 124,794,588 | | | 6,501,317 | |
| |
|
| |
|
| |
|
| |
|
| |
Change in net assets resulting from capital transactions | | $ | (39,845,047 | ) | $ | 222,837,670 | | $ | 154,396,548 | | $ | (1,834,600 | ) |
| |
|
| |
|
| |
|
| |
|
| |
| | |
See notes to financial statements | HSBC INVESTOR FAMILY OF FUNDS | 34 |
HSBC INVESTOR FAMILY OF FUNDS
Statements of Changes in Net Assets (continued)
All capital share transactions have been processed at a net asset value of $1.00 per share.
| | | | | | | | | | | | | |
| | U.S. Government
Money Market Fund | | U.S. Treasury
Money Market Fund | |
|
|
|
|
|
|
| | For the
year ended
October 31, 2008 | | For the
year ended
October 31, 2007 | | For the
year ended
October 31, 2008 | | For the
year ended
October 31, 2007 | |
|
|
|
|
|
|
|
|
|
|
Investment Activities: | | | | | | | | | | | | | |
Operations: | | | | | | | | | | | | | |
Net investment income (loss) | | $ | 384,597,544 | | $ | 189,841,861 | | $ | 30,525,495 | | $ | 20,576,019 | |
Net realized gains (losses) from investments transactions | | | 852,522 | | | (1,018 | ) | | 56,374 | | | 139,929 | |
| |
|
| |
|
| |
|
| |
|
| |
Change in net assets resulting from operations | | | 385,450,066 | | | 189,840,843 | | | 30,581,869 | | | 20,715,948 | |
| |
|
| |
|
| |
|
| |
|
| |
| | | | | | | | | | | | | |
Dividends: | | | | | | | | | | | | | |
Net investment income: | | | | | | | | | | | | | |
Class A Shares | | | (20,761,810 | ) | | (71,043,425 | ) | | (2,345,769 | ) | | (3,084,367 | ) |
Class B Shares | | | (208 | ) | | (29 | ) | | (368 | ) | | (1,423 | ) |
Class C Shares | | | (4,999 | ) | | (8,895 | ) | | (113 | ) | | — | |
Class D Shares | | | (110,537,831 | ) | | (43,853,778 | ) | | (8,589,362 | ) | | (13,800,295 | ) |
Class I Shares | | | (36,476,266 | ) | | (9,829,013 | ) | | (11,454,843 | ) | | (581,597 | ) |
Class Y Shares | | | (217,291,492 | ) | | (64,575,625 | ) | | (8,162,220 | ) | | (3,098,850 | ) |
| |
|
| |
|
| |
|
| |
|
| |
Change in net assets resulting from shareholder dividends | | | (385,072,606 | ) | | (189,310,765 | ) | | (30,552,675 | ) | | (20,566,532 | ) |
| |
|
| |
|
| |
|
| |
|
| |
Change in net assets resulting from capital transactions | | | 4,729,251,775 | | | 6,273,956,981 | | | 6,158,909,368 | | | 76,089,402 | |
| |
|
| |
|
| |
|
| |
|
| |
Change in net assets | | | 4,729,629,235 | | | 6,274,487,059 | | | 6,158,938,562 | | | 76,238,818 | |
| | | | | | | | | | | | | |
Net Assets: | | | | | | | | | | | | | |
Beginning of period | | | 9,069,080,414 | | | 2,794,593,355 | | | 496,232,049 | | | 419,993,231 | |
| |
|
| |
|
| |
|
| |
|
| |
End of period | | $ | 13,798,709,649 | | $ | 9,069,080,414 | | $ | 6,655,170,611 | | $ | 496,232,049 | |
| |
|
| |
|
| |
|
| |
|
| |
Accumulated net investment income (loss) | | $ | (1 | ) | $ | 475,061 | | $ | (602 | ) | $ | 26,578 | |
| |
|
| |
|
| |
|
| |
|
| |
| | |
35 | HSBC INVESTOR FAMILY OF FUNDS | See notes to financial statements |
HSBC INVESTOR FAMILY OF FUNDS
Statements of Changes in Net Assets (continued)
All capital share transactions have been processed at a net asset value of $1.00 per share.
| | | | | | | | | | | | | |
| | U.S. Government
Money Market Fund | | U.S. Treasury
Money Market Fund | |
|
|
|
|
|
|
| | For the
year ended
October 31, 2008 | | For the
year ended
October 31, 2007 | | For the
year ended
October 31, 2008 | | For the
year ended
October 31, 2007 | |
|
|
|
|
|
|
|
|
|
|
CAPITAL TRANSACTIONS: | | | | | | | | | | | | | |
Class A Shares: | | | | | | | | | | | | | |
Proceeds from shares issued | | $ | 2,218,184,757 | | $ | 13,157,924,757 | | $ | 1,146,228,416 | | $ | 323,975,779 | |
Dividends reinvested | | | 20,748,773 | | | 71,043,019 | | | 2,345,451 | | | 3,084,367 | |
Value of shares redeemed | | | (2,626,012,754 | ) | | (13,425,627,497 | ) | | (652,469,814 | ) | | (310,583,467 | ) |
| |
|
| |
|
| |
|
| |
|
| |
Class A Shares capital transactions | | | (387,079,224 | ) | | (196,659,721 | ) | | 496,104,053 | | | 16,476,679 | |
| |
|
| |
|
| |
|
| |
|
| |
| | | | | | | | | | | | | |
Class B Shares: | | | | | | | | | | | | | |
Proceeds from shares issued | | | 53,672 | | | — | | | 156,651 | | | — | |
Dividends reinvested | | | 208 | | | 29 | | | 368 | | | 1,423 | |
Value of shares redeemed | | | (635 | ) | | — | | | (66,940 | ) | | — | |
| |
|
| |
|
| |
|
| |
|
| |
Class B Shares capital transactions | | | 53,245 | | | 29 | | | 90,079 | | | 1,423 | |
| |
|
| |
|
| |
|
| |
|
| |
| | | | | | | | | | | | | |
Class C Shares: | | | | | | | | | | | | | |
Proceeds from shares issued | | | 10,271,297 | | | 7,196,454 | | | 1,308,712 | | | — | |
Dividends reinvested | | | 4,310 | | | 8,895 | | | 113 | | | — | |
Value of shares redeemed | | | (10,602,789 | ) | | (6,777,555 | ) | | (205,984 | ) | | — | |
| |
|
| |
|
| |
|
| |
|
| |
Class C Shares capital transactions | | | (327,182 | ) | | 427,794 | | | 1,102,841 | | | — | |
| |
|
| |
|
| |
|
| |
|
| |
| | | | | | | | | | | | | |
Class D Shares: | | | | | | | | | | | | | |
Proceeds from shares issued | | | 21,742,131,804 | | | 9,801,176,211 | | | 3,861,433,949 | | | 1,024,267,661 | |
Dividends reinvested | | | 12,459,719 | | | 38,651,057 | | | 5,493,923 | | | 3,782,702 | |
Value of shares redeemed | | | (21,077,754,961 | ) | | (10,046,292,131 | ) | | (3,226,179,507 | ) | | (1,033,661,626 | ) |
| |
|
| |
|
| |
|
| |
|
| |
Class D Shares capital transactions | | | 676,836,562 | | | (206,464,863 | ) | | 640,748,365 | | | (5,611,263 | ) |
| |
|
| |
|
| |
|
| |
|
| |
| | | | | | | | | | | | | |
Class I Shares: | | | | | | | | | | | | | |
Proceeds from shares issued | | | 15,079,578,869 | | | 2,230,388,261 | | | 6,937,308,780 | | | 143,911,760 | |
Dividends reinvested | | | 31,259,496 | | | 7,937,887 | | | 10,722,081 | | | 581,597 | |
Value of shares redeemed | | | (11,151,199,818 | ) | | (1,312,199,247 | ) | | (3,250,211,911 | ) | | (77,558,211 | ) |
| |
|
| |
|
| |
|
| |
|
| |
Class I Shares capital transactions | | | 3,959,638,547 | | | 926,126,901 | | | 3,697,818,950 | | | 66,935,146 | |
| |
|
| |
|
| |
|
| |
|
| |
| | | | | | | | | | | | | |
Class Y Shares: | | | | | | | | | | | | | |
Proceeds from shares issued | | | 37,523,017,690 | | | 13,496,500,181 | | | 4,734,361,422 | | | 712,980,472 | |
Dividends reinvested | | | 216,736,458 | | | 63,886,403 | | | 7,992,936 | | | 2,827,030 | |
Value of shares redeemed | | | (37,259,624,321 | ) | | (7,809,859,743 | ) | | (3,419,309,278 | ) | | (717,520,085 | ) |
| |
|
| |
|
| |
|
| |
|
| |
Class Y Shares capital transactions | | | 480,129,827 | | | 5,750,526,841 | | | 1,323,045,080 | | | (1,712,583 | ) |
| |
|
| |
|
| |
|
| |
|
| |
Change in net assets resulting from capital transactions | | $ | 4,729,251,775 | | $ | 6,273,956,981 | | $ | 6,158,909,368 | | $ | 76,089,402 | |
| |
|
| |
|
| |
|
| |
|
| |
| | |
See notes to financial statements | HSBC INVESTOR FAMILY OF FUNDS | 36 |
|
HSBC INVESTOR CALIFORNIA TAX-FREE MONEY MARKET FUND |
|
Financial Highlights |
Selected data for a share outstanding throughout the periods indicated.
| | | | | | | | | | | | | | | | | | | | | | | |
| | | | | Investment Activities | | Dividends | | | | |
| | | | |
| |
| | | | |
| | Net Asset
Value,
Beginning
of Period | | Net
Investment
Income(Loss) | | Total from
Investment
Activities | | Net
Investment
Income | | Total
Dividends | | Net Asset
Value, End
of Period | |
|
|
|
|
|
|
|
|
|
|
|
|
|
|
CLASS A SHARES | | | | | | | | | | | | | | | | | | | | | | | |
Period Ended October 31, 2007 (d) | | | $ | 1.00 | | | 0.00 | * | | 0.00 | * | | (0.00 | )* | | (0.00 | )* | | | $ | 1.00 | | |
Year Ended October 31, 2008 (i) | | | | 1.00 | | | 0.01 | | | 0.01 | | | (0.01 | ) | | (0.01 | ) | | | | 1.00 | | |
|
|
|
|
|
|
|
|
|
|
|
|
|
|
|
|
|
|
|
|
|
|
|
|
CLASS C SHARES | | | | | | | | | | | | | | | | | | | | | | | |
Period Ended October 31, 2007 (e) | | | $ | 1.00 | | | 0.01 | | | 0.01 | | | (0.01 | ) | | (0.01 | ) | | | $ | 1.00 | | |
Year Ended October 31, 2008 (f) | | | | 1.00 | | | 0.01 | | | 0.01 | | | (0.01 | ) | | (0.01 | ) | | | | 1.00 | | |
|
|
|
|
|
|
|
|
|
|
|
|
|
|
|
|
|
|
|
|
|
|
|
|
CLASS D SHARES | | | | | | | | | | | | | | | | | | | | | | | |
Year Ended October 31, 2004 | | | $ | 1.00 | | | 0.01 | | | 0.01 | | | (0.01 | ) | | (0.01 | ) | | | $ | 1.00 | | |
Year Ended October 31, 2005 | | | | 1.00 | | | 0.02 | | | 0.02 | | | (0.02 | ) | | (0.02 | ) | | | | 1.00 | | |
Year Ended October 31, 2006 | | | | 1.00 | | | 0.03 | | | 0.03 | | | (0.03 | ) | | (0.03 | ) | | | | 1.00 | | |
Year Ended October 31, 2007 | | | | 1.00 | | | 0.03 | | | 0.03 | | | (0.03 | ) | | (0.03 | ) | | | | 1.00 | | |
Year Ended October 31, 2008 | | | | 1.00 | | | 0.02 | | | 0.02 | | | (0.02 | ) | | (0.02 | ) | | | | 1.00 | | |
|
|
|
|
|
|
|
|
|
|
|
|
|
|
|
|
|
|
|
|
|
|
|
|
CLASS Y SHARES | | | | | | | | | | | | | | | | | | | | | | | |
Year Ended October 31, 2004 | | | $ | 1.00 | | | 0.01 | | | 0.01 | | | (0.01 | ) | | (0.01 | ) | | | $ | 1.00 | | |
Year Ended October 31, 2005 | | | | 1.00 | | | 0.02 | | | 0.02 | | | (0.02 | ) | | (0.02 | ) | | | | 1.00 | | |
Year Ended October 31, 2006 | | | | 1.00 | | | 0.03 | | | 0.03 | | | (0.03 | ) | | (0.03 | ) | | | | 1.00 | | |
Year Ended October 31, 2007 | | | | 1.00 | | | 0.03 | | | 0.03 | | | (0.03 | ) | | (0.03 | ) | | | | 1.00 | | |
Year Ended October 31, 2008 | | | | 1.00 | | | 0.02 | | | 0.02 | | | (0.02 | ) | | (0.02 | ) | | | | 1.00 | | |
|
|
|
|
|
|
|
|
|
|
|
|
|
|
|
|
|
|
|
|
|
|
|
|
| | | | | | | | | | | | | | | | | | |
| | | | | Ratios/Supplementary Data | |
| | | | |
| |
| | Total
Return(a) | | Net Assets
at End of
Period
(000’s) | | Ratio of Net
Expenses to
Average Net
Assets(b) | | Ratio of Net
Investment
Income to
Average
Net Assets(b) | | Ratio of
Expenses to
Average Net
Assets(b)(c) | |
|
|
|
|
|
|
|
|
|
|
|
|
CLASS A SHARES | | | | | | | | | | | | | | | | | | |
Period Ended October 31, 2007 (d) | | 0.00 | % | | | $ | — | | | 0.72 | % | | 2.71 | % | | 0.87 | % | |
Year Ended October 31, 2008 (i) | | 1.48 | % | | | | 442 | | | 0.67 | % | | 1.49 | % | | 0.82 | % | |
|
|
|
|
|
|
|
|
|
|
|
|
|
|
|
|
|
|
|
CLASS C SHARES | | | | | | | | | | | | | | | | | | |
Period Ended October 31, 2007 (e) | | 1.08 | % | | | $ | 1,018 | | | 1.22 | % | | 2.41 | % | | 1.37 | % | |
Year Ended October 31, 2008 (f) | | 0.65 | % | | | | — | | | 1.21 | % | | 1.62 | % | | 1.36 | % | |
|
|
|
|
|
|
|
|
|
|
|
|
|
|
|
|
|
|
|
CLASS D SHARES | | | | | | | | | | | | | | | | | | |
Year Ended October 31, 2004 | | 0.58 | % | | | $ | 122,260 | | | 0.52 | % | | 0.59 | % | | 0.71 | % | |
Year Ended October 31, 2005 | | 1.64 | %(g) | | | | 132,649 | | | 0.50 | %(g) | | 1.64 | %(g) | | 0.65 | % | |
Year Ended October 31, 2006 | | 2.73 | % | | | | 86,686 | | | 0.57 | % | | 2.66 | % | | 0.72 | % | |
Year Ended October 31, 2007 | | 3.09 | %(h) | | | | 90,843 | | | 0.50 | %(h) | | 3.08 | %(h) | | 0.66 | % | |
Year Ended October 31, 2008 | | 1.90 | % | | | | 83,261 | | | 0.47 | % | | 1.76 | % | | 0.62 | % | |
|
|
|
|
|
|
|
|
|
|
|
|
|
|
|
|
|
|
|
CLASS Y SHARES | | | | | | | | | | | | | | | | | | |
Year Ended October 31, 2004 | | 0.83 | % | | | $ | 2,013 | | | 0.27 | % | | 0.82 | % | | 0.46 | % | |
Year Ended October 31, 2005 | | 1.89 | %(g) | | | | 43,722 | | | 0.25 | %(g) | | 2.04 | %(g) | | 0.40 | % | |
Year Ended October 31, 2006 | | 2.98 | % | | | | 43,114 | | | 0.31 | % | | 2.95 | % | | 0.46 | % | |
Year Ended October 31, 2007 | | 3.35 | %(h) | | | | 32,205 | | | 0.24 | %(h) | | 3.32 | %(h) | | 0.40 | % | |
Year Ended October 31, 2008 | | 2.16 | % | | | | 26,163 | | | 0.20 | % | | 2.03 | % | | 0.35 | % | |
|
|
|
|
|
|
|
|
|
|
|
|
|
|
|
|
|
|
|
| |
* | Less than $0.005 per share. |
| |
(a) | Not annualized for periods less than one year. Total returns do not include redemption charges. |
| |
(b) | Annualized for periods less than one year. |
| |
(c) | During the period, certain fees were reduced. If such fee reductions had not occurred, the ratio would have been as indicated. |
| |
(d) | Class A Shares commenced operations on March 2, 2007 and was operational during a portion of the period only. Amounts reflect performance for the period of time the class had operations, which was 3 days during the period. |
| |
(e) | Class C Shares commenced operations on May 7, 2007. |
| |
(f) | Class C Shares were operational during a portion of the year only. Amounts reflect performance for the period of time the class had operations, which was 152 days during the period. |
| |
(g) | During the year ended October 31, 2005, HSBC reimbursed certain amounts to the Fund related to violation of certain investment policies and limitations. There was no rounded impact to the net expense ratio, net income ratio or total return for Class D Shares and Class Y Shares. |
| |
(h) | During the year ended October 31, 2007, HSBC reimbursed amounts to certain Funds related to past marketing arrangements. The corresponding impact to the net expense ratio, net income ratio and the total return were 0.02% and 0.01% for Class D Shares and Class Y Shares, respectively. |
| |
(i) | Class A Shares were operational during a portion of the year only. Amounts reflect performance for the period of time the class had operations, which was 332 days during the period. |
| | |
37 | HSBC INVESTOR FAMILY OF FUNDS | See notes to financial statements. |
|
HSBC INVESTOR PRIME MONEY MARKET FUND |
|
Financial Highlights |
Selected data for a share outstanding throughout the periods indicated.
| | | | | | | | | | | | | | | | | | | | | | | |
| | | | | Investment Activities | | Dividends | | | | |
| | | | |
| |
| | | | |
| | Net Asset
Value,
Beginning
of Period | | Net
Investment
Income (Loss) | | Total from
Investment
Activities | | Net
Investment
Income | | Total
Dividends | | Net Asset
Value, End
of Period | |
|
|
|
|
|
|
|
|
|
|
|
|
|
|
CLASS A SHARES | | | | | | | | | | | | | | | | | | | | | | | |
Year Ended October 31, 2004 | | | $ | 1.00 | | | 0.01 | | | 0.01 | | | (0.01 | ) | | (0.01 | ) | | | $ | 1.00 | | |
Year Ended October 31, 2005 | | | | 1.00 | | | 0.02 | | | 0.02 | | | (0.02 | ) | | (0.02 | ) | | | | 1.00 | | |
Year Ended October 31, 2006 | | | | 1.00 | | | 0.04 | | | 0.04 | | | (0.04 | ) | | (0.04 | ) | | | | 1.00 | | |
Year Ended October 31, 2007 | | | | 1.00 | | | 0.05 | | | 0.05 | | | (0.05 | ) | | (0.05 | ) | | | | 1.00 | | |
Year Ended October 31, 2008 | | | | 1.00 | | | 0.03 | | | 0.03 | | | (0.03 | ) | | (0.03 | ) | | | | 1.00 | | |
|
|
|
|
|
|
|
|
|
|
|
|
|
|
|
|
|
|
|
|
|
|
|
|
CLASS B SHARES | | | | | | | | | | | | | | | | | | | | | | | |
Year Ended October 31, 2004 | | | $ | 1.00 | | | 0.00 | * | | 0.00 | * | | (0.00 | )* | | (0.00 | )* | | | $ | 1.00 | | |
Year Ended October 31, 2005 | | | | 1.00 | | | 0.02 | | | 0.02 | | | (0.02 | ) | | (0.02 | ) | | | | 1.00 | | |
Year Ended October 31, 2006 | | | | 1.00 | | | 0.04 | | | 0.04 | | | (0.04 | ) | | (0.04 | ) | | | | 1.00 | | |
Year Ended October 31, 2007 | | | | 1.00 | | | 0.04 | | | 0.04 | | | (0.04 | ) | | (0.04 | ) | | | | 1.00 | | |
Year Ended October 31, 2008 | | | | 1.00 | | | 0.02 | | | 0.02 | | | (0.02 | ) | | (0.02 | ) | | | | 1.00 | | |
|
|
|
|
|
|
|
|
|
|
|
|
|
|
|
|
|
|
|
|
|
|
|
|
CLASS C SHARES | | | | | | | | | | | | | | | | | | | | | | | |
Year Ended October 31, 2004 | | | $ | 1.00 | | | 0.00 | * | | 0.00 | * | | (0.00 | )* | | (0.00 | )* | | | $ | 1.00 | | |
Year Ended October 31, 2005 | | | | 1.00 | | | 0.02 | | | 0.02 | | | (0.02 | ) | | (0.02 | ) | | | | 1.00 | | |
Year Ended October 31, 2006 | | | | 1.00 | | | 0.04 | | | 0.04 | | | (0.04 | ) | | (0.04 | ) | | | | 1.00 | | |
Year Ended October 31, 2007 | | | | 1.00 | | | 0.04 | | | 0.04 | | | (0.04 | ) | | (0.04 | ) | | | | 1.00 | | |
Year Ended October 31, 2008 | | | | 1.00 | | | 0.02 | | | 0.02 | | | (0.02 | ) | | (0.02 | ) | | | | 1.00 | | |
|
|
|
|
|
|
|
|
|
|
|
|
|
|
|
|
|
|
|
|
|
|
|
|
CLASS D SHARES | | | | | | | | | | | | | | | | | | | | | | | |
Year Ended October 31, 2004 | | | $ | 1.00 | | | 0.01 | | | 0.01 | | | (0.01 | ) | | (0.01 | ) | | | $ | 1.00 | | |
Year Ended October 31, 2005 | | | | 1.00 | | | 0.02 | | | 0.02 | | | (0.02 | ) | | (0.02 | ) | | | | 1.00 | | |
Year Ended October 31, 2006 | | | | 1.00 | | | 0.04 | | | 0.04 | | | (0.04 | ) | | (0.04 | ) | | | | 1.00 | | |
Year Ended October 31, 2007 | | | | 1.00 | | | 0.05 | | | 0.05 | | | (0.05 | ) | | (0.05 | ) | | | | 1.00 | | |
Year Ended October 31, 2008 | | | | 1.00 | | | 0.03 | | | 0.03 | | | (0.03 | ) | | (0.03 | ) | | | | 1.00 | | |
|
|
|
|
|
|
|
|
|
|
|
|
|
|
|
|
|
|
|
|
|
|
|
|
CLASS I SHARES | | | | | | | | | | | | | | | | | | | | | | | |
Year Ended October 31, 2004 | | | $ | 1.00 | | | 0.01 | | | 0.01 | | | (0.01 | ) | | (0.01 | ) | | | $ | 1.00 | | |
Year Ended October 31, 2005 | | | | 1.00 | | | 0.03 | | | 0.03 | | | (0.03 | ) | | (0.03 | ) | | | | 1.00 | | |
Year Ended October 31, 2006 | | | | 1.00 | | | 0.05 | | | 0.05 | | | (0.05 | ) | | (0.05 | ) | | | | 1.00 | | |
Year Ended October 31, 2007 | | | | 1.00 | | | 0.05 | | | 0.05 | | | (0.05 | ) | | (0.05 | ) | | | | 1.00 | | |
Year Ended October 31, 2008 | | | | 1.00 | | | 0.03 | | | 0.03 | | | (0.03 | ) | | (0.03 | ) | | | | 1.00 | | |
|
|
|
|
|
|
|
|
|
|
|
|
|
|
|
|
|
|
|
|
|
|
|
|
CLASS Y SHARES | | | | | | | | | | | | | | | | | | | | | | | |
Year Ended October 31, 2004 | | | $ | 1.00 | | | 0.01 | | | 0.01 | | | (0.01 | ) | | (0.01 | ) | | | $ | 1.00 | | |
Year Ended October 31, 2005 | | | | 1.00 | | | 0.03 | | | 0.03 | | | (0.03 | ) | | (0.03 | ) | | | | 1.00 | | |
Year Ended October 31, 2006 | | | | 1.00 | | | 0.05 | | | 0.05 | | | (0.05 | ) | | (0.05 | ) | | | | 1.00 | | |
Year Ended October 31, 2007 | | | | 1.00 | | | 0.05 | | | 0.05 | | | (0.05 | ) | | (0.05 | ) | | | | 1.00 | | |
Year Ended October 31, 2008 | | | | 1.00 | | | 0.03 | | | 0.03 | | | (0.03 | ) | | (0.03 | ) | | | | 1.00 | | |
|
|
|
|
|
|
|
|
|
|
|
|
|
|
|
|
|
|
|
|
|
|
|
|
| | | | | | | | | | | | | | | | | | |
| | | | | Ratios/Supplementary Data | |
| | | | |
| |
| | Total
Return(a) | | Net Assets
at End of
Period
(000’s) | | Ratio of Net
Expenses to
Average Net
Assets | | Ratio of Net
Investment
Income to
Average
Net Assets | | Ratio of
Expenses to
Average Net
Assets(b) | |
|
|
|
|
|
|
|
|
|
|
|
|
CLASS A SHARES | | | | | | | | | | | | | | | | | | |
Year Ended October 31, 2004 | | 0.57 | % | | | $ | 301,384 | | | 0.72 | % | | 0.56 | % | | 0.72 | % | |
Year Ended October 31, 2005 | | 2.17 | % | | | | 243,772 | | | 0.73 | % | | 2.10 | % | | 0.73 | % | |
Year Ended October 31, 2006 | | 4.24 | % | | | | 415,514 | | | 0.72 | % | | 4.20 | % | | 0.73 | % | |
Year Ended October 31, 2007 | | 4.77 | %(c) | | | | 471,148 | | | 0.67 | %(c) | | 4.68 | %(c) | | 0.70 | % | |
Year Ended October 31, 2008 | | 2.71 | %(d) | | | | 308,499 | | | 0.67 | % | | 2.73 | % | | 0.67 | % | |
|
|
|
|
|
|
|
|
|
|
|
|
|
|
|
|
|
|
|
CLASS B SHARES | | | | | | | | | | | | | | | | | | |
Year Ended October 31, 2004 | | 0.23 | % | | | $ | 195 | | | 1.04 | % | | 0.23 | % | | 1.32 | % | |
Year Ended October 31, 2005 | | 1.56 | % | | | | 88 | | | 1.33 | % | | 1.40 | % | | 1.33 | % | |
Year Ended October 31, 2006 | | 3.61 | % | | | | 109 | | | 1.32 | % | | 3.60 | % | | 1.33 | % | |
Year Ended October 31, 2007 | | 4.14 | %(c) | | | | 204 | | | 1.27 | %(c) | | 4.07 | %(c) | | 1.30 | % | |
Year Ended October 31, 2008 | | 2.10 | %(d) | | | | 199 | | | 1.27 | % | | 2.08 | % | | 1.27 | % | |
|
|
|
|
|
|
|
|
|
|
|
|
|
|
|
|
|
|
|
CLASS C SHARES | | | | | | | | | | | | | | | | | | |
Year Ended October 31, 2004 | | 0.23 | % | | | $ | 170,451 | | | 1.05 | % | | 0.23 | % | | 1.32 | % | |
Year Ended October 31, 2005 | | 1.56 | % | | | | 195,246 | | | 1.33 | % | | 1.54 | % | | 1.33 | % | |
Year Ended October 31, 2006 | | 3.61 | % | | | | 268,071 | | | 1.32 | % | | 3.59 | % | | 1.33 | % | |
Year Ended October 31, 2007 | | 4.14 | %(c) | | | | 317,217 | | | 1.27 | %(c) | | 4.08 | %(c) | | 1.30 | % | |
Year Ended October 31, 2008 | | 2.10 | %(d) | | | | 316,779 | | | 1.27 | % | | 2.04 | % | | 1.27 | % | |
|
|
|
|
|
|
|
|
|
|
|
|
|
|
|
|
|
|
|
CLASS D SHARES | | | | | | | | | | | | | | | | | | |
Year Ended October 31, 2004 | | 0.72 | % | | | $ | 1,013,427 | | | 0.57 | % | | 0.72 | % | | 0.57 | % | |
Year Ended October 31, 2005 | | 2.32 | % | | | | 1,351,695 | | | 0.58 | % | | 2.36 | % | | 0.58 | % | |
Year Ended October 31, 2006 | | 4.39 | % | | | | 2,098,413 | | | 0.57 | % | | 4.38 | % | | 0.58 | % | |
Year Ended October 31, 2007 | | 4.92 | %(c) | | | | 3,710,803 | | | 0.52 | %(c) | | 4.83 | %(c) | | 0.55 | % | |
Year Ended October 31, 2008 | | 2.86 | %(d) | | | | 2,720,592 | | | 0.52 | % | | 2.89 | % | | 0.52 | % | |
|
|
|
|
|
|
|
|
|
|
|
|
|
|
|
|
|
|
|
CLASS I SHARES | | | | | | | | | | | | | | | | | | |
Year Ended October 31, 2004 | | 1.09 | % | | | $ | 2,777,675 | | | 0.20 | % | | 1.07 | % | | 0.22 | % | |
Year Ended October 31, 2005 | | 2.71 | % | | | | 1,476,725 | | | 0.20 | % | | 2.55 | % | | 0.23 | % | |
Year Ended October 31, 2006 | | 4.79 | % | | | | 2,111,147 | | | 0.19 | % | | 4.70 | % | | 0.22 | % | |
Year Ended October 31, 2007 | | 5.33 | %(c) | | | | 1,870,485 | | | 0.14 | %(c) | | 5.21 | %(c) | | 0.21 | % | |
Year Ended October 31, 2008 | | 3.23 | %(d) | | | | 2,954,253 | | | 0.16 | % | | 3.14 | % | | 0.17 | % | |
|
|
|
|
|
|
|
|
|
|
|
|
|
|
|
|
|
|
|
CLASS Y SHARES | | | | | | | | | | | | | | | | | | |
Year Ended October 31, 2004 | | 0.97 | % | | | $ | 512,287 | | | 0.32 | % | | 0.95 | % | | 0.32 | % | |
Year Ended October 31, 2005 | | 2.58 | % | | | | 420,576 | | | 0.33 | % | | 2.49 | % | | 0.33 | % | |
Year Ended October 31, 2006 | | 4.65 | % | | | | 530,780 | | | 0.32 | % | | 4.59 | % | | 0.33 | % | |
Year Ended October 31, 2007 | | 5.19 | %(c) | | | | 1,036,994 | | | 0.27 | %(c) | | 5.08 | %(c) | | 0.30 | % | |
Year Ended October 31, 2008 | | 3.12 | %(d) | | | | 2,236,927 | | | 0.27 | % | | 2.96 | % | | 0.27 | % | |
|
|
|
|
|
|
|
|
|
|
|
|
|
|
|
|
|
|
|
| |
* | Less than $0.005 per share. |
| |
(a) | Total returns do not include redemption charges. |
| |
(b) | During the period, certain fees were reduced. If such fee reductions had not occurred, the ratio would have been as indicated. |
| |
(c) | During the year ended October 31, 2007, HSBC reimbursed amounts to certain Funds related to past marketing arrangements. The corresponding impact to the net expense ratio, net income ratio and the total return were 0.02%, 0.02%, 0.02%, 0.02%, 0.02% and 0.02% for Class A Shares, Class B Shares, Class C Shares, Class D Shares, Class I Shares and Class Y Shares, respectively. |
| |
(d) | During the year ended October 31, 2008, an affiliate of the Fund’s investment adviser purchased certain defaulted securities at $16,746,382 in excess of their fair value on the purchase date. The corresponding impact of this excess amount to the total returns were 0.20%, 0.20%, 0.20%, 0.20%, 0.20%, 0.20% for Class A Shares, Class B Shares, Class C Shares, Class D Shares, Class I Shares, and Class Y Shares, respectively. See Note 6. |
| | |
See notes to financial statements | HSBC INVESTOR FAMILY OF FUNDS | 38 |
|
HSBC INVESTOR NEW YORK TAX-FREE MONEY MARKET FUND |
|
Financial Highlights
Selected data for a share outstanding throughout the periods indicated.
| | | | | | | | | | | | | | | | | | | | | | | |
| | | | | Investment Activities | | Dividends | | | | |
| | | | |
| |
| | | | |
| | Net Asset
Value,
Beginning
of Period | | Net
Investment
Income (Loss) | | Total from
Investment
Activities | | Net
Investment
Income | | Total
Dividends | | Net Asset
Value, End
of Period | |
|
|
|
|
|
|
|
|
|
|
|
|
|
|
|
|
|
|
|
|
|
|
|
|
CLASS A SHARES | | | | | | | | | | | | | | | | | | | | | | | |
Year Ended October 31, 2004 | | | $ | 1.00 | | | 0.00 | * | | 0.00 | * | | (0.00 | )* | | (0.00 | )* | | | $ | 1.00 | | |
Year Ended October 31, 2005 | | | | 1.00 | | | 0.01 | | | 0.01 | | | (0.01 | ) | | (0.01 | ) | | | | 1.00 | | |
Year Ended October 31, 2006 | | | | 1.00 | | | 0.03 | | | 0.03 | | | (0.03 | ) | | (0.03 | ) | | | | 1.00 | | |
Year Ended October 31, 2007 | | | | 1.00 | | | 0.03 | | | 0.03 | | | (0.03 | ) | | (0.03 | ) | | | | 1.00 | | |
Year Ended October 31, 2008 | | | | 1.00 | | | 0.02 | | | 0.02 | | | (0.02 | ) | | (0.02 | ) | | | | 1.00 | | |
|
|
|
|
|
|
|
|
|
|
|
|
|
|
|
|
|
|
|
|
|
|
|
|
CLASS B SHARES | | | | | | | | | | | | | | | | | | | | | | | |
Year Ended October 31, 2004 | | | $ | 1.00 | | | 0.00 | * | | 0.00 | * | | (0.00 | )* | | (0.00 | ) | | | $ | 1.00 | | |
Year Ended October 31, 2005 | | | | 1.00 | | | 0.01 | | | 0.01 | | | (0.01 | ) | | (0.01 | ) | | | | 1.00 | | |
Year Ended October 31, 2006 | | | | 1.00 | | | 0.02 | | | 0.02 | | | (0.02 | ) | | (0.02 | ) | | | | 1.00 | | |
Year Ended October 31, 2007 | | | | 1.00 | | | 0.02 | | | 0.02 | | | (0.02 | ) | | (0.02 | ) | | | | 1.00 | | |
Year Ended October 31, 2008 | | | | 1.00 | | | 0.01 | | | 0.01 | | | (0.01 | ) | | (0.01 | ) | | | | 1.00 | | |
|
|
|
|
|
|
|
|
|
|
|
|
|
|
|
|
|
|
|
|
|
|
|
|
CLASS C SHARES | | | | | | | | | | | | | | | | | | | | | | | |
Year Ended October 31, 2004(f) | | | $ | 1.00 | | | 0.00 | * | | 0.00 | * | | (0.00 | ) | | (0.00 | )* | | | $ | 1.00 | | |
Year Ended October 31, 2005(g) | | | | 1.00 | | | — | | | — | | | — | | | — | | | | | 1.00 | | |
Year Ended October 31, 2006(g) | | | | 1.00 | | | — | | | — | | | — | | | — | | | | | 1.00 | | |
Year Ended October 31, 2007(g) | | | | 1.00 | | | — | | | — | | | — | | | — | | | | | 1.00 | | |
Year Ended October 31, 2008(g) | | | | 1.00 | | | — | | | — | | | — | | | — | | | | | 1.00 | | |
|
|
|
|
|
|
|
|
|
|
|
|
|
|
|
|
|
|
|
|
|
|
|
|
CLASS D SHARES | | | | | | | | | | | | | | | | | | | | | | | |
Year Ended October 31, 2004 | | | $ | 1.00 | | | 0.01 | | | 0.01 | | | (0.01 | ) | | (0.01 | ) | | | $ | 1.00 | | |
Year Ended October 31, 2005 | | | | 1.00 | | | 0.02 | | | 0.02 | | | (0.02 | ) | | (0.02 | ) | | | | 1.00 | | |
Year Ended October 31, 2006 | | | | 1.00 | | | 0.03 | | | 0.03 | | | (0.03 | ) | | (0.03 | ) | | | | 1.00 | | |
Year Ended October 31, 2007 | | | | 1.00 | | | 0.03 | | | 0.03 | | | (0.03 | ) | | (0.03 | ) | | | | 1.00 | | |
Year Ended October 31, 2008 | | | | 1.00 | | | 0.02 | | | 0.02 | | | (0.02 | ) | | (0.02 | ) | | | | 1.00 | | |
|
|
|
|
|
|
|
|
|
|
|
|
|
|
|
|
|
|
|
|
|
|
|
|
CLASS Y SHARES | | | | | | | | | | | | | | | | | | | | | | | |
Year Ended October 31, 2004 | | | $ | 1.00 | | | 0.01 | | | 0.01 | | | (0.01 | ) | | (0.01 | ) | | | $ | 1.00 | | |
Year Ended October 31, 2005 | | | | 1.00 | | | 0.02 | | | 0.02 | | | (0.02 | ) | | (0.02 | ) | | | | 1.00 | | |
Year Ended October 31, 2006 | | | | 1.00 | | | 0.03 | | | 0.03 | | | (0.03 | ) | | (0.03 | ) | | | | 1.00 | | |
Year Ended October 31, 2007 | | | | 1.00 | | | 0.03 | | | 0.03 | | | (0.03 | ) | | (0.03 | ) | | | | 1.00 | | |
Year Ended October 31, 2008 | | | | 1.00 | | | 0.02 | | | 0.02 | | | (0.02 | ) | | (0.02 | ) | | | | 1.00 | | |
|
|
|
|
|
|
|
|
|
|
|
|
|
|
|
|
|
|
|
|
|
|
|
|
| | | | | | | | | | | | | | | | | | |
| | | | | Ratios/Supplementary Data | |
| | | | |
|
|
| | Total
Return(a) | | Net Assets
at End of
Period
(000’s) | | Ratio of Net
Expenses to
Average Net
Assets(b) | | Ratio of Net
Investment
Income to
Average
Net Assets(b) | | Ratio of
Expenses to
Average Net
Assets(b)(c) | |
|
|
|
|
|
|
|
|
|
|
|
|
|
|
|
|
|
|
|
CLASS A SHARES | | | | | | | | | | | | | | | | | | |
Year Ended October 31, 2004 | | 0.40 | % | | | $ | 217,659 | | | 0.70 | % | | 0.42 | % | | 0.70 | % | |
Year Ended October 31, 2005 | | 1.46 | %(d) | | | | 128,218 | | | 0.70 | %(d) | | 1.38 | %(d) | | 0.71 | % | |
Year Ended October 31, 2006 | | 2.63 | % | | | | 153,523 | | | 0.70 | % | | 2.61 | % | | 0.70 | % | |
Year Ended October 31, 2007 | | 3.00 | %(e) | | | | 120,841 | | | 0.65 | %(e) | | 2.98 | %(e) | | 0.67 | % | |
Year Ended October 31, 2008 | | 1.94 | % | | | | 45,791 | | | 0.63 | % | | 2.09 | % | | 0.63 | % | |
|
|
|
|
|
|
|
|
|
|
|
|
|
|
|
|
|
|
|
CLASS B SHARES | | | | | | | | | | | | | | | | | | |
Year Ended October 31, 2004 | | 0.26 | % | | | $ | 683 | | | 0.96 | % | | 0.26 | % | | 1.31 | % | |
Year Ended October 31, 2005 | | 0.85 | %(d) | | | | 228 | | | 1.29 | %(d) | | 0.77 | %(d) | | 1.31 | % | |
Year Ended October 31, 2006 | | 2.01 | % | | | | 55 | | | 1.30 | % | | 1.88 | % | | 1.30 | % | |
Year Ended October 31, 2007 | | 2.39 | %(e) | | | | 34 | | | 1.25 | %(e) | | 2.38 | %(e) | | 1.27 | % | |
Year Ended October 31, 2008 | | 1.33 | % | | | | 35 | | | 1.23 | % | | 1.30 | % | | 1.23 | % | |
|
|
|
|
|
|
|
|
|
|
|
|
|
|
|
|
|
|
|
CLASS C SHARES | | | | | | | | | | | | | | | | | | |
Year Ended October 31, 2004(f) | | 0.06 | % | | | $ | 0 | ** | | 0.78 | % | | 0.26 | % | | 1.29 | % | |
Year Ended October 31, 2005(g) | | — | | | | | 0 | ** | | — | | | — | | | — | | |
Year Ended October 31, 2006(g) | | — | | | | | 0 | ** | | — | | | — | | | — | | |
Year Ended October 31, 2007(g) | | — | | | | | 0 | ** | | — | | | — | | | — | | |
Year Ended October 31, 2008(g) | | — | | | | | 0 | ** | | — | | | — | | | — | | |
|
|
|
|
|
|
|
|
|
|
|
|
|
|
|
|
|
|
|
CLASS D SHARES | | | | | | | | | | | | | | | | | | |
Year Ended October 31, 2004 | | 0.56 | % | | | $ | 171,151 | | | 0.55 | % | | 0.54 | % | | 0.55 | % | |
Year Ended October 31, 2005 | | 1.61 | %(d) | | | | 189,538 | | | 0.55 | %(d) | | 1.61 | %(d) | | 0.56 | % | |
Year Ended October 31, 2006 | | 2.78 | % | | | | 352,630 | | | 0.55 | % | | 2.78 | % | | 0.55 | % | |
Year Ended October 31, 2007 | | 3.16 | %(e) | | | | 531,864 | | | 0.50 | %(e) | | 3.14 | %(e) | | 0.52 | % | |
Year Ended October 31, 2008 | | 2.09 | % | | | | 586,791 | | | 0.48 | % | | 1.99 | % | | 0.48 | % | |
|
|
|
|
|
|
|
|
|
|
|
|
|
|
|
|
|
|
|
CLASS Y SHARES | | | | | | | | | | | | | | | | | | |
Year Ended October 31, 2004 | | 0.81 | % | | | $ | 98,260 | | | 0.30 | % | | 0.79 | % | | 0.30 | % | |
Year Ended October 31, 2005 | | 1.86 | %(d) | | | | 280,683 | | | 0.30 | %(d) | | 1.89 | %(d) | | 0.31 | % | |
Year Ended October 31, 2006 | | 3.04 | % | | | | 263,187 | | | 0.30 | % | | 2.99 | % | | 0.30 | % | |
Year Ended October 31, 2007 | | 3.42 | %(e) | | | | 339,665 | | | 0.25 | %(e) | | 3.39 | %(e) | | 0.27 | % | |
Year Ended October 31, 2008 | | 2.35 | % | | | | 319,797 | | | 0.23 | % | | 2.27 | % | | 0.23 | % | |
|
|
|
|
|
|
|
|
|
|
|
|
|
|
|
|
|
|
|
| |
* | Less than $0.005 per share. |
| |
** | Less than $500. |
| |
(a) | Not annualized for periods less than one year. Total returns do not include redemption charges. |
| |
(b) | Annualized for periods less than one year. |
| |
(c) | During the period, certain fees were reduced. If such fee reductions had not occurred, the ratio would have been as indicated. |
| |
(d) | During the year ended October 31, 2005, HSBC reimbursed certain amounts to the Fund related to violation of certain investment policies and limitations. The corresponding impact to the net expense ratio, net income ratio and total return were 0.01%, 0.01%, 0.01% and 0.01% for Class A Shares, Class B Shares, Class D Shares and Class Y Shares, respectively. |
| |
(e) | During the year ended October 31, 2007, HSBC reimbursed amounts to certain Funds related to past marketing arrangements. The corresponding impact to the net expense ratio, net income ratio and the total return were 0.02%, 0.02%, 0.02%, and 0.02% for Class A Shares, Class B Shares, Class D Shares, and Class Y Shares, respectively. |
| |
(f) | Class C Shares were operational during a portion of the year only. Amounts reflect performance for the period of time the class had operations, which was 81 days during the period. |
| |
(g) | During the year ended, Class C Shares had no operations. Net assets at the end of the period represent seed money. |
| | |
39 | HSBC INVESTOR FAMILY OF FUNDS | See notes to financial statements. |
|
HSBC INVESTOR TAX-FREE MONEY MARKET FUND |
|
Financial Highlights
Selected data for a share outstanding throughout the periods indicated.
| | | | | | | | | | | | | | | | | | | | | | | |
| | | | | Investment Activities | | Dividends | | | | |
| | | | |
| |
| | | | |
| | Net Asset
Value,
Beginning
of Period | | Net
Investment
Income (Loss) | | Total from
Investment
Activities | | Net
Investment
Income | | Total
Dividends | | Net Asset
Value, End
of Period | |
|
|
|
|
|
|
|
|
|
|
|
|
|
|
|
|
|
|
|
|
|
|
|
|
CLASS A SHARES | | | | | | | | | | | | | | | | | | | | | | | |
Period Ended October 31, 2004(d) | | | $ | 1.00 | | | 0.00 | * | | 0.00 | * | | (0.00 | )* | | (0.00 | )* | | | $ | 1.00 | | |
Year Ended October 31, 2005(e) | | | | 1.00 | | | — | | | — | | | — | | | — | | | | | 1.00 | | |
Year Ended October 31, 2006(f) | | | | 1.00 | | | 0.01 | | | 0.01 | | | (0.01 | ) | | (0.01 | ) | | | | 1.00 | | |
Year Ended October 31, 2007(g) | | | | 1.00 | | | 0.00 | * | | 0.00 | * | | (0.00 | )* | | (0.00 | )* | | | | 1.00 | | |
Year Ended October 31, 2008(k) | | | | 1.00 | | | — | | | — | | | — | | | — | | | | | 1.00 | | |
|
|
|
|
|
|
|
|
|
|
|
|
|
|
|
|
|
|
|
|
|
|
|
|
CLASS C SHARES | | | | | | | | | | | | | | | | | | | | | | | |
Period Ended October 31, 2007(h) | | | $ | 1.00 | | | 0.00 | * | | 0.00 | * | | (0.00 | )* | | (0.00 | )* | | | $ | 1.00 | | |
Year Ended October 31, 2008(k) | | | | 1.00 | | | — | | | — | | | — | | | — | | | | | 1.00 | | |
|
|
|
|
|
|
|
|
|
|
|
|
|
|
|
|
|
|
|
|
|
|
|
|
CLASS D SHARES | | | | | | | | | | | | | | | | | | | | | | | |
Period Ended October 31, 2004(i) | | | $ | 1.00 | | | 0.00 | * | | 0.00 | * | | (0.00 | )* | | (0.00 | )* | | | $ | 1.00 | | |
Year Ended October 31, 2005 | | | | 1.00 | | | 0.02 | | | 0.02 | | | (0.02 | ) | | (0.02 | ) | | | | 1.00 | | |
Year Ended October 31, 2006 | | | | 1.00 | | | 0.03 | | | 0.03 | | | (0.03 | ) | | (0.03 | ) | | | | 1.00 | | |
Year Ended October 31, 2007 | | | | 1.00 | | | 0.03 | | | 0.03 | | | (0.03 | ) | | (0.03 | ) | | | | 1.00 | | |
Year Ended October 31, 2008(k) | | | | 1.00 | | | 0.02 | | | 0.02 | | | (0.02 | ) | | (0.02 | ) | | | | 1.00 | | |
|
|
|
|
|
|
|
|
|
|
|
|
|
|
|
|
|
|
|
|
|
|
|
|
CLASS I SHARES | | | | | | | | | | | | | | | | | | | | | | | |
Period Ended October 31, 2004(d) | | | $ | 1.00 | | | 0.00 | * | | 0.00 | * | | (0.00 | )* | | (0.00 | )* | | | $ | 1.00 | | |
Year Ended October 31, 2005(j) | | | | 1.00 | | | 0.00 | * | | 0.00 | * | | (0.00 | )* | | (0.00 | )* | | | | 1.00 | | |
Year Ended October 31, 2006(k) | | | | 1.00 | | | — | | | — | | | — | | | — | | | | | 1.00 | | |
Year Ended October 31, 2007(k) | | | | 1.00 | | | — | | | — | | | — | | | — | | | | | 1.00 | | |
Year Ended October 31, 2008 | | | | 1.00 | | | — | | | — | | | — | | | — | | | | | 1.00 | | |
|
|
|
|
|
|
|
|
|
|
|
|
|
|
|
|
|
|
|
|
|
|
|
|
CLASS Y SHARES | | | | | | | | | | | | | | | | | | | | | | | |
Year Ended October 31, 2004(i) | | | $ | 1.00 | | | 0.00 | * | | 0.00 | * | | (0.00 | )* | | (0.00 | )* | | | $ | 1.00 | | |
Year Ended October 31, 2005 | | | | 1.00 | | | 0.02 | | | 0.02 | | | (0.02 | ) | | (0.02 | ) | | | | 1.00 | | |
Year Ended October 31, 2006 | | | | 1.00 | | | 0.03 | | | 0.03 | | | (0.03 | ) | | (0.03 | ) | | | | 1.00 | | |
Year Ended October 31, 2007 | | | | 1.00 | | | 0.03 | | | 0.03 | | | (0.03 | ) | | (0.03 | ) | | | | 1.00 | | |
Year Ended October 31, 2008 | | | | 1.00 | | | 0.02 | | | 0.02 | | | (0.02 | ) | | (0.02 | ) | | | | 1.00 | | |
|
|
|
|
|
|
|
|
|
|
|
|
|
|
|
|
|
|
|
|
|
|
|
|
| | | | | | | | | | | | | | | | | | |
| | | | | Ratios/Supplementary Data | |
| | | | |
|
|
| | Total
Return(a) | | Net Assets
at End of
Period
(000’s) | | Ratio of Net
Expenses to
Average Net
Assets(b) | | Ratio of Net
Investment
Income to
Average
Net Assets(b) | | Ratio of
Expenses to
Average Net
Assets(b)(c) | |
|
|
|
|
|
|
|
|
|
|
|
|
|
|
|
|
|
|
|
CLASS A SHARES | | | | | | | | | | | | | | | | | | |
Period Ended October 31, 2004(d) | | 0.00 | % | | | $ | 0 | ** | | 0.44 | % | | 0.51 | % | | 2.12 | % | |
Year Ended October 31, 2005(e) | | — | | | | | 0 | ** | | — | | | — | | | — | | |
Year Ended October 31, 2006(f) | | 0.56 | % | | | | 1 | | | 1.06 | % | | 3.35 | % | | 1.49 | % | |
Year Ended October 31, 2007(g) | | 0.18 | % | | | | — | | | 0.72 | % | | 2.96 | % | | 0.92 | % | |
Year Ended October 31, 2008(k) | | — | | | | | — | | | — | | | — | | | — | | |
|
|
|
|
|
|
|
|
|
|
|
|
|
|
|
|
|
|
|
CLASS C SHARES | | | | | | | | | | | | | | | | | | |
Period Ended October 31, 2007(h) | | 0.09 | % | | | $ | — | | | 1.34 | % | | 2.24 | % | | 1.54 | % | |
Year Ended October 31, 2008(k) | | — | | | | | — | | | — | | | — | | | — | | |
|
|
|
|
|
|
|
|
|
|
|
|
|
|
|
|
|
|
|
CLASS D SHARES | | | | | | | | �� | | | | | | | | | | |
Period Ended October 31, 2004(i) | | 0.23 | % | | | $ | 3,248 | | | 0.27 | % | | 1.34 | % | | 1.50 | % | |
Year Ended October 31, 2005 | | 1.60 | % | | | | 11,892 | | | 0.57 | % | | 1.71 | % | | 1.11 | % | |
Year Ended October 31, 2006 | | 2.77 | % | | | | 48,502 | | | 0.66 | % | | 2.76 | % | | 0.99 | % | |
Year Ended October 31, 2007 | | 3.04 | % | | | | 40,184 | | | 0.63 | % | | 3.04 | % | | 0.83 | % | |
Year Ended October 31, 2008(k) | | 2.13 | % | | | | 69,787 | | | 0.46 | % | | 2.05 | % | | 0.66 | % | |
|
|
|
|
|
|
|
|
|
|
|
|
|
|
|
|
|
|
|
CLASS I SHARES | | | | | | | | | | | | | | | | | | |
Period Ended October 31, 2004(d) | | 0.12 | % | | | $ | 0 | ** | | 0.00 | % | | 1.07 | % | | 1.80 | % | |
Year Ended October 31, 2005(j) | | 0.15 | % | | | | 0 | ** | | 0.33 | % | | 2.11 | % | | 0.74 | % | |
Year Ended October 31, 2006(k) | | — | | | | | — | | | — | | | — | | | — | | |
Year Ended October 31, 2007(k) | | — | | | | | — | | | — | | | — | | | — | | |
Year Ended October 31, 2008 | | — | | | | | — | | | — | | | — | | | — | | |
|
|
|
|
|
|
|
|
|
|
|
|
|
|
|
|
|
|
|
CLASS Y SHARES | | | | | | | | | | | | | | | | | | |
Year Ended October 31, 2004(i) | | 0.50 | % | | | $ | 15,544 | | | 0.03 | % | | 1.27 | % | | 1.48 | % | |
Year Ended October 31, 2005 | | 1.86 | % | | | | 26,569 | | | 0.31 | % | | 1.86 | % | | 0.87 | % | |
Year Ended October 31, 2006 | | 3.02 | % | | | | 12,424 | | | 0.39 | % | | 2.92 | % | | 0.77 | % | |
Year Ended October 31, 2007 | | 3.30 | % | | | | 18,936 | | | 0.34 | % | | 3.31 | % | | 0.54 | % | |
Year Ended October 31, 2008 | | 2.38 | % | | | | 143,730 | | | 0.20 | % | | 2.31 | % | | 0.40 | % | |
|
|
|
|
|
|
|
|
|
|
|
|
|
|
|
|
|
|
|
| |
* | Less than $0.005 per share. |
| |
** | Less than $500. |
| |
(a) | Not annualized for periods less than one year. Total returns do not include redemption charges. |
| |
(b) | Annualized for periods less than one year. |
| |
(c) | During the period, certain fees were reduced. If such fee reductions had not occurred, the ratio would have been as indicated. |
| |
(d) | Class A Shares commenced operations on August 27, 2004 and was operational during a portion of the year only. Amounts reflect performance for the period of time the class had operations, which was 5 days dur-ing the period. Class I Shares commenced operations on June 25, 2004 and were operational during a portion of the year only. Amounts reflect performance for the period of time the class had operations, which was 40 days during the period. |
| |
(e) | During the period, Class A shares had no operations. Net Assets at the end of the year represent seed money. |
| |
(f) | Class A Shares was operational during a portion of the year only. Amounts reflect performance for the period of the time the class had operations, which was 78 days during the period. |
| |
(g) | Class A Shares was operational during a portion of the period only. Amounts reflect performance for the period of the time the class had operations, which was 24 days during the period. |
| |
(h) | Class C Shares commenced operations on July 30, 2007 and was operational during a portion of the year only. Amounts reflect performance for the period of time the class had operations, which was 15 days during the period. |
| |
(i) | Class D Shares commenced operations on August 24, 2004. Class Y Shares commenced operations on June 8, 2004. |
| |
(j) | Class I Shares were operational during a portion of the year only. Amounts reflect performance for the period of the time the class had operations, which was 27 days during the period. |
| |
(k) | During the period, class had no operations. |
| | |
See notes to financial statements | HSBC INVESTOR FAMILY OF FUNDS | 40 |
|
HSBC INVESTOR U.S. GOVERNMENT MONEY MARKET FUND |
|
Financial Highlights |
Selected data for a share outstanding throughout the periods indicated.
| | | | | | | | | | | | | | | | | | | | | | | |
| | | | Investment Activities | | Dividends | | | |
| | | |
| |
| | | |
| | Net Asset
Value,
Beginning
of Period | | Net
Investment
Income (Loss) | | Total from
Investment
Activities | | Net
Investment
Income | | Total
Dividends | | Net Asset
Value, End
of Period | |
|
|
|
|
|
|
|
|
|
|
|
|
|
|
CLASS A SHARES | | | | | | | | | | | | | | | | | | | |
Year Ended October 31, 2004 | | | $ | 1.00 | | | 0.01 | | | 0.01 | | | (0.01 | ) | | (0.01 | ) | | | $ | 1.00 | | |
Year Ended October 31, 2005 | | | | 1.00 | | | 0.02 | | | 0.02 | | | (0.02 | ) | | (0.02 | ) | | | | 1.00 | | |
Year Ended October 31, 2006 | | | | 1.00 | | | 0.04 | | | 0.04 | | | (0.04 | ) | | (0.04 | ) | | | | 1.00 | | |
Year Ended October 31, 2007 | | | | 1.00 | | | 0.05 | | | 0.05 | | | (0.05 | ) | | (0.05 | ) | | | | 1.00 | | |
Year Ended October 31, 2008 | | | | 1.00 | | | 0.02 | | | 0.02 | | | (0.02 | ) | | (0.02 | ) | | | | 1.00 | | |
|
|
|
|
|
|
|
|
|
|
|
|
|
|
|
|
|
|
|
|
|
|
|
|
CLASS B SHARES | | | | | | | | | | | | | | | | | | | | | | | |
Year Ended October 31, 2004 | | | $ | 1.00 | | | 0.00 | * | | 0.00 | * | | (0.00 | )* | | (0.00 | )* | | | $ | 1.00 | | |
Year Ended October 31, 2005 | | | | 1.00 | | | 0.02 | | | 0.02 | | | (0.02 | ) | | (0.02 | ) | | | | 1.00 | | |
Year Ended October 31, 2006 | | | | 1.00 | | | 0.04 | | | 0.04 | | | (0.04 | ) | | (0.04 | ) | | | | 1.00 | | |
Year Ended October 31, 2007 | | | | 1.00 | | | 0.05 | | | 0.05 | | | (0.05 | ) | | (0.05 | ) | | | | 1.00 | | |
Year Ended October 31, 2008 | | | | 1.00 | | | 0.02 | | | 0.02 | | | (0.02 | ) | | (0.02 | ) | | | | 1.00 | | |
|
|
|
|
|
|
|
|
|
|
|
|
|
|
|
|
|
|
|
|
|
|
|
|
CLASS C SHARES | | | | | | | | | | | | | | | | | | | | | | | |
Period Ended October 31, 2007(e) | | | $ | 1.00 | | | 0.04 | | | 0.04 | | | (0.04 | ) | | (0.04 | ) | | | $ | 1.00 | | |
Year Ended October 31, 2008 | | | | 1.00 | | | 0.02 | | | 0.02 | | | (0.02 | ) | | (0.02 | ) | | | | 1.00 | | |
|
|
|
|
|
|
|
|
|
|
|
|
|
|
|
|
|
|
|
|
|
|
|
|
CLASS D SHARES | | | | | | | | | | | | | | | | | | | | | | | |
Year Ended October 31, 2004 | | | $ | 1.00 | | | 0.01 | | | 0.01 | | | (0.01 | ) | | (0.01 | ) | | | $ | 1.00 | | |
Year Ended October 31, 2005 | | | | 1.00 | | | 0.02 | | | 0.02 | | | (0.02 | ) | | (0.02 | ) | | | | 1.00 | | |
Year Ended October 31, 2006 | | | | 1.00 | | | 0.04 | | | 0.04 | | | (0.04 | ) | | (0.04 | ) | | | | 1.00 | | |
Year Ended October 31, 2007 | | | | 1.00 | | | 0.05 | | | 0.05 | | | (0.05 | ) | | (0.05 | ) | | | | 1.00 | | |
Year Ended October 31, 2008 | | | | 1.00 | | | 0.02 | | | 0.02 | | | (0.02 | ) | | (0.02 | ) | | | | 1.00 | | |
|
|
|
|
|
|
|
|
|
|
|
|
|
|
|
|
|
|
|
|
|
|
|
|
CLASS I SHARES | | | | | | | | | | | | | | | | | | | | | | | |
Period Ended October 31, 2004(f) | | | $ | 1.00 | | | 0.00 | * | | 0.00 | * | | (0.00 | )* | | (0.00 | )* | | | $ | 1.00 | | |
Year Ended October 31, 2005(g) | | | | 1.00 | | | 0.01 | | | 0.01 | | | (0.01 | ) | | (0.01 | ) | | | | 1.00 | | |
Year Ended October 31, 2006(h) | | | | 1.00 | | | 0.02 | | | 0.02 | | | (0.02 | ) | | (0.02 | ) | | | | 1.00 | | |
Year Ended October 31, 2007(i) | | | | 1.00 | | | 0.05 | | | 0.05 | | | (0.05 | ) | | (0.05 | ) | | | | 1.00 | | |
Year Ended October 31, 2008 | | | | 1.00 | | | 0.03 | | | 0.03 | | | (0.03 | ) | | (0.03 | ) | | | | 1.00 | | |
|
|
|
|
|
|
|
|
|
|
|
|
|
|
|
|
|
|
|
|
|
|
|
|
CLASS Y SHARES | | | | | | | | | | | | | | | | | | | | | | | |
Year Ended October 31, 2004 | | | $ | 1.00 | | | 0.01 | | | 0.01 | | | (0.01 | ) | | (0.01 | ) | | | $ | 1.00 | | |
Year Ended October 31, 2005 | | | | 1.00 | | | 0.02 | | | 0.02 | | | (0.02 | ) | | (0.02 | ) | | | | 1.00 | | |
Year Ended October 31, 2006 | | | | 1.00 | | | 0.04 | | | 0.04 | | | (0.04 | ) | | (0.04 | ) | | | | 1.00 | | |
Year Ended October 31, 2007 | | | | 1.00 | | | 0.05 | | | 0.05 | | | (0.05 | ) | | (0.05 | ) | | | | 1.00 | | |
Year Ended October 31, 2008 | | | | 1.00 | | | 0.03 | | | 0.03 | | | (0.03 | ) | | (0.03 | ) | | | | 1.00 | | |
|
|
|
|
|
|
|
|
|
|
|
|
|
|
|
|
|
|
|
|
|
|
|
|
| | | | | | | | | | | | | | | | |
| | | | Ratios/Supplementary Data | |
| | | |
| |
| | Total
Return(a) | | Net Assets
at End of
Period
(000’s) | | Ratio of Net
Expenses to
Average Net
Assets(b) | | Ratio of Net
Investment
Income to
Average
Net Assets(b) | | Ratio of
Expenses to
Average Net
Assets(b)(c) | |
|
|
|
|
|
|
|
|
|
|
|
|
CLASS A SHARES | | | | | | | | | | | | | | | | |
Year Ended October 31, 2004 | | 0.53 | % | | $ | 640,096 | | 0.73 | % | | 0.53 | % | | 0.73 | % | |
Year Ended October 31, 2005 | | 2.09 | % | | | 725,469 | | 0.73 | % | | 2.08 | % | | 0.74 | % | |
Year Ended October 31, 2006 | | 4.16 | % | | | 1,287,045 | | 0.72 | % | | 4.13 | % | | 0.73 | % | |
Year Ended October 31, 2007 | | 4.63 | %(d) | | | 1,090,807 | | 0.65 | %(d) | | 4.56 | %(d) | | 0.70 | % | |
Year Ended October 31, 2008 | | 2.20 | % | | | 703,712 | | 0.67 | % | | 2.29 | % | | 0.67 | % | |
|
|
|
|
|
|
|
|
|
|
|
|
|
|
|
|
|
CLASS B SHARES | | | | | | | | | | | | | | | | |
Year Ended October 31, 2004 | | 0.28 | % | | $ | 17 | | 0.98 | % | | 0.28 | % | | 1.34 | % | |
Year Ended October 31, 2005 | | 1.72 | % | | | 1 | | 1.32 | % | | 1.10 | % | | 1.32 | % | |
Year Ended October 31, 2006 | | 4.29 | % | | | 1 | | 1.31 | % | | 3.95 | % | | 1.32 | % | |
Year Ended October 31, 2007 | | 4.76 | %(d) | | | 1 | | 1.25 | %(d) | | 4.01 | %(d) | | 1.28 | % | |
Year Ended October 31, 2008 | | 1.67 | % | | | 54 | | 1.29 | % | | 1.24 | % | | 1.29 | % | |
|
|
|
|
|
|
|
|
|
|
|
|
|
|
|
|
|
CLASS C SHARES | | | | | | | | | | | | | | | | |
Period Ended October 31, 2007(e) | | 3.79 | %(d) | | $ | 428 | | 1.20 | %(d) | | 3.78 | %(d) | | 1.25 | % | |
Year Ended October 31, 2008 | | 1.59 | % | | | 101 | | 1.27 | % | | 1.28 | % | | 1.27 | % | |
|
|
|
|
|
|
|
|
|
|
|
|
|
|
|
|
|
CLASS D SHARES | | | | | | | | | | | | | | | | |
Year Ended October 31, 2004 | | 0.68 | % | | $ | 517,500 | | 0.58 | % | | 0.67 | % | | 0.58 | % | |
Year Ended October 31, 2005 | | 2.24 | % | | | 525,937 | | 0.58 | % | | 2.21 | % | | 0.59 | % | |
Year Ended October 31, 2006 | | 4.32 | % | | | 967,456 | | 0.57 | % | | 4.27 | % | | 0.58 | % | |
Year Ended October 31, 2007 | | 4.79 | %(d) | | | 761,155 | | 0.50 | %(d) | | 4.66 | %(d) | | 0.54 | % | |
Year Ended October 31, 2008 | | 2.36 | % | | | 1,438,199 | | 0.52 | % | | 1.92 | % | | 0.52 | % | |
|
|
|
|
|
|
|
|
|
|
|
|
|
|
|
|
|
CLASS I SHARES | | | | | | | | | | | | | | | | |
Period Ended October 31, 2004(f) | | 0.01 | % | | $ | 0 | ** | 0.20 | % | | 0.93 | % | | 0.21 | % | |
Year Ended October 31, 2005(g) | | 0.73 | % | | | 0 | ** | 0.20 | % | | 3.08 | % | | 0.24 | % | |
Year Ended October 31, 2006(h) | | 1.80 | % | | | 23,002 | | 0.17 | % | | 5.08 | % | | 0.23 | % | |
Year Ended October 31, 2007(i) | | 4.99 | %(d) | | | 949,095 | | 0.15 | %(d) | | 4.73 | %(d) | | 0.17 | % | |
Year Ended October 31, 2008 | | 2.72 | % | | | 4,908,887 | | 0.17 | % | | 2.23 | % | | 0.18 | % | |
|
|
|
|
|
|
|
|
|
|
|
|
|
|
|
|
|
CLASS Y SHARES | | | | | | | | | | | | | | | | |
Year Ended October 31, 2004 | | 0.93 | % | | $ | 337,343 | | 0.32 | % | | 0.91 | % | | 0.32 | % | |
Year Ended October 31, 2005 | | 2.50 | % | | | 465,996 | | 0.34 | % | | 2.49 | % | | 0.34 | % | |
Year Ended October 31, 2006 | | 4.58 | % | | | 517,089 | | 0.32 | % | | 4.49 | % | | 0.33 | % | |
Year Ended October 31, 2007 | | 5.05 | %(d) | | | 6,267,594 | | 0.26 | %(d) | | 4.78 | %(d) | | 0.28 | % | |
Year Ended October 31, 2008 | | 2.61 | % | | | 6,747,758 | | 0.27 | % | | 2.53 | % | | 0.27 | % | |
|
|
|
|
|
|
|
|
|
|
|
|
|
|
|
|
|
| |
* | Less than $0.005 per share. |
| |
** | Less than $500. |
| |
(a) | Not annualized for periods less than one year. Total returns do not include redemption charges. |
| |
(b) | Annualized for periods less than one year. |
| |
(c) | During the period, certain fees were reduced. If such fee reductions had not occurred, the ratio would have been as indicated. |
| |
(d) | During the year ended October 31, 2007, HSBC reimbursed amounts to certain Funds related to past marketing arrangements. The corresponding impact to the net expense ratio, net income ratio and the total return were 0.03%, 0.03%, 0.02%, 0.02%, 0.00% and 0.01% for Class A Shares, Class B Shares, Class C Shares, Class D Shares, Class I Shares and Class Y Shares, respectively. |
| |
(e) | Class C Shares commenced operations on November 20, 2006 and were operational during a portion of the year only. Amounts reflect performance for the period of time the class had operations, which was 346 days during the period. |
| |
(f) | Class I Shares commenced operations on December 24, 2003 and was operational during a portion of the year only. Amounts reflect performance for the period of time the class had operations, which was 10 days during the period. |
| |
(g) | Class I Shares were operational during a portion of the year only. Amounts reflect performance for the period of time the class had operations, which was 89 days during the period. |
| |
(h) | Class I Shares were operational during a portion of the year only. Amounts reflect performance for the period of time the class had operations, which was 136 days during the period. |
| |
(i) | Class I Shares were operational during a portion of the year only. Amounts reflect performance for the period of time the class had operations, which was 357 days during the period. |
| | |
41 | HSBC INVESTOR FAMILY OF FUNDS | See notes to financial statements. |
|
HSBC INVESTOR U.S. TREASURY MONEY MARKET FUND |
|
Financial Highlights |
Selected data for a share outstanding throughout the periods indicated.
| | | | | | | | | | | | | | | | | | | | | | | |
| | | | Investment Activities | | Dividends | | | |
| | | |
| |
| | | |
| | Net Asset
Value,
Beginning
of Period | | Net
Investment
Income (Loss) | | Total from
Investment
Activities | | Net
Investment
Income | | Total
Dividends | | Net Asset
Value, End
of Period | |
|
|
|
|
|
|
|
|
|
|
|
|
|
|
|
|
|
|
|
|
CLASS A SHARES | | | | | | | | | | | | | | | | | | | |
Year Ended October 31, 2004 | | | $ | 1.00 | | | 0.00 | * | | 0.00 | * | | (0.00 | )* | | (0.00 | )* | | | $ | 1.00 | | |
Year Ended October 31, 2005 | | | | 1.00 | | | 0.02 | | | 0.02 | | | (0.02 | ) | | (0.02 | ) | | | | 1.00 | | |
Year Ended October 31, 2006 | | | | 1.00 | | | 0.04 | | | 0.04 | | | (0.04 | ) | | (0.04 | ) | | | | 1.00 | | |
Year Ended October 31, 2007 | | | | 1.00 | | | 0.04 | | | 0.04 | | | (0.04 | ) | | (0.04 | ) | | | | 1.00 | | |
Year Ended October 31, 2008 | | | | 1.00 | | | 0.01 | | | 0.01 | | | (0.01 | ) | | (0.01 | ) | | | | 1.00 | | |
|
|
|
|
|
|
|
|
|
|
|
|
|
|
|
|
|
|
|
|
|
|
|
|
CLASS B SHARES | | | | | | | | | | | | | | | | | | | | | | | |
Period Ended October 31, 2004(e) | | | $ | 1.00 | | | 0.00 | * | | 0.00 | * | | (0.00 | )* | | (0.00 | )* | | | $ | 1.00 | | |
Year Ended October 31, 2005 | | | | 1.00 | | | 0.01 | | | 0.01 | | | (0.01 | ) | | (0.01 | ) | | | | 1.00 | | |
Year Ended October 31, 2006 | | | | 1.00 | | | 0.03 | | | 0.03 | | | (0.03 | ) | | (0.03 | ) | | | | 1.00 | | |
Year Ended October 31, 2007 | | | | 1.00 | | | 0.04 | | | 0.04 | | | (0.04 | ) | | (0.04 | ) | | | | 1.00 | | |
Year Ended October 31, 2008 | | | | 1.00 | | | 0.01 | | | 0.01 | | | (0.01 | ) | | (0.01 | ) | | | | 1.00 | | |
|
|
|
|
|
|
|
|
|
|
|
|
|
|
|
|
|
|
|
|
|
|
|
|
CLASS C SHARES | | | | | | | | | | | | | | | | | | | | | | | |
Year Ended October 31, 2008(f) | | | $ | 1.00 | | | 0.00 | * | | 0.00 | * | | (0.00 | )* | | (0.00 | )* | | | $ | 1.00 | | |
|
|
|
|
|
|
|
|
|
|
|
|
|
|
|
|
|
|
|
|
|
|
|
|
CLASS D SHARES | | | | | | | | | | | | | | | | | | | | | | | |
Year Ended October 31, 2004 | | | $ | 1.00 | | | 0.01 | | | 0.01 | | | (0.01 | ) | | (0.01 | ) | | | $ | 1.00 | | |
Year Ended October 31, 2005 | | | | 1.00 | | | 0.02 | | | 0.02 | | | (0.02 | ) | | (0.02 | ) | | | | 1.00 | | |
Year Ended October 31, 2006 | | | | 1.00 | | | 0.04 | | | 0.04 | | | (0.04 | ) | | (0.04 | ) | | | | 1.00 | | |
Year Ended October 31, 2007 | | | | 1.00 | | | 0.04 | | | 0.04 | | | (0.04 | ) | | (0.04 | ) | | | | 1.00 | | |
Year Ended October 31, 2008 | | | | 1.00 | | | 0.02 | | | 0.02 | | | (0.02 | ) | | (0.02 | ) | | | | 1.00 | | |
|
|
|
|
|
|
|
|
|
|
|
|
|
|
|
|
|
|
|
|
|
|
|
|
CLASS I SHARES | | | | | | | | | | | | | | | | | | | | | | | |
Period Ended October 31, 2004(g) | | | $ | 1.00 | | | 0.00 | * | | 0.00 | * | | (0.00 | )* | | (0.00 | )* | | | $ | 1.00 | | |
Year Ended October 31, 2005(h) | | | | 1.00 | | | 0.02 | | | 0.02 | | | (0.02 | ) | | (0.02 | ) | | | | 1.00 | | |
Year Ended October 31, 2006 | | | | 1.00 | | | 0.04 | | | 0.04 | | | (0.04 | ) | | (0.04 | ) | | | | 1.00 | | |
Year Ended October 31, 2007 | | | | 1.00 | | | 0.05 | | | 0.05 | | | (0.05 | ) | | (0.05 | ) | | | | 1.00 | | |
Year Ended October 31, 2008 | | | | 1.00 | | | 0.02 | | | 0.02 | | | (0.02 | ) | | (0.02 | ) | | | | 1.00 | | |
|
|
|
|
|
|
|
|
|
|
|
|
|
|
|
|
|
|
|
|
|
|
|
|
CLASS Y SHARES | | | | | | | | | | | | | | | | | | | | | | | |
Year Ended October 31, 2004 | | | $ | 1.00 | | | 0.01 | | | 0.01 | | | (0.01 | ) | | (0.01 | ) | | | $ | 1.00 | | |
Year Ended October 31, 2005 | | | | 1.00 | | | 0.02 | | | 0.02 | | | (0.02 | ) | | (0.02 | ) | | | | 1.00 | | |
Year Ended October 31, 2006 | | | | 1.00 | | | 0.04 | | | 0.04 | | | (0.04 | ) | | (0.04 | ) | | | | 1.00 | | |
Year Ended October 31, 2007 | | | | 1.00 | | | 0.05 | | | 0.05 | | | (0.05 | ) | | (0.05 | ) | | | | 1.00 | | |
Year Ended October 31, 2008 | | | | 1.00 | | | 0.02 | | | 0.02 | | | (0.02 | ) | | (0.02 | ) | | | | 1.00 | | |
|
|
|
|
|
|
|
|
|
|
|
|
|
|
|
|
|
|
|
|
|
|
|
|
| | | | | | | | | | | | | | | | |
| | | | Ratios/Supplementary Data | |
| | | |
| |
| | Total
Return(a) | | Net Assets
at End of
Period
(000’s) | | Ratio of Net
Expenses to
Average Net
Assets(b) | | Ratio of Net
Investment
Income to
Average
Net Assets(b) | | Ratio of
Expenses to
Average Net
Assets(b)(c) | |
|
|
|
|
|
|
|
|
|
|
|
|
CLASS A SHARES | | | | | | | | | | | | | | | | |
Year Ended October 31, 2004 | | 0.39 | % | | $ | 85,882 | | 0.71 | % | | 0.39 | % | | 0.76 | % | |
Year Ended October 31, 2005 | | 1.89 | % | | | 56,307 | | 0.76 | % | | 1.84 | % | | 0.76 | % | |
Year Ended October 31, 2006 | | 3.74 | % | | | 67,861 | | 0.74 | % | | 3.75 | % | | 0.77 | % | |
Year Ended October 31, 2007 | | 4.19 | %(d) | | | 84,355 | | 0.68 | %(d) | | 4.09 | %(d) | | 0.74 | % | |
Year Ended October 31, 2008 | | 1.38 | % | | | 580,458 | | 0.67 | % | | 1.06 | % | | 0.67 | % | |
|
|
|
|
|
|
|
|
|
|
|
|
|
|
|
|
|
CLASS B SHARES | | | | | | | | | | | | | | | | |
Period Ended October 31, 2004(e) | | 0.04 | % | | $ | 38 | | 1.31 | % | | 0.18 | % | | 1.35 | % | |
Year Ended October 31, 2005 | | 1.29 | % | | | 39 | | 1.36 | % | | 1.28 | % | | 1.36 | % | |
Year Ended October 31, 2006 | | 3.12 | % | | | 40 | | 1.35 | % | | 3.09 | % | | 1.38 | % | |
Year Ended October 31, 2007 | | 3.57 | %(d) | | | 41 | | 1.28 | %(d) | | 3.51 | %(d) | | 1.35 | % | |
Year Ended October 31, 2008 | | 0.86 | % | | | 131 | | 1.11 | % | | 1.01 | % | | 1.28 | % | |
|
|
|
|
|
|
|
|
|
|
|
|
|
|
|
|
|
CLASS C SHARES | | | | | | | | | | | | | | | | |
Year Ended October 31, 2008(f) | | 0.01 | % | | $ | 1,103 | | 0.64 | % | | 0.20 | % | | 1.26 | % | |
|
|
|
|
|
|
|
|
|
|
|
|
|
|
|
|
|
CLASS D SHARES | | | | | | | | | | | | | | | | |
Year Ended October 31, 2004 | | 0.54 | % | | $ | 208,633 | | 0.56 | % | | 0.54 | % | | 0.60 | % | |
Year Ended October 31, 2005 | | 2.04 | % | | | 293,480 | | 0.62 | % | | 2.08 | % | | 0.62 | % | |
Year Ended October 31, 2006 | | 3.90 | % | | | 302,637 | | 0.60 | % | | 3.85 | % | | 0.62 | % | |
Year Ended October 31, 2007 | | 4.34 | %(d) | | | 297,120 | | 0.53 | %(d) | | 4.28 | %(d) | | 0.59 | % | |
Year Ended October 31, 2008 | | 1.53 | % | | | 937,905 | | 0.52 | % | | 1.33 | % | | 0.52 | % | |
|
|
|
|
|
|
|
|
|
|
|
|
|
|
|
|
|
CLASS I SHARES | | | | | | | | | | | | | | | | |
Period Ended October 31, 2004(g) | | 0.02 | % | | $ | 0 | ** | 0.17 | % | | 0.77 | % | | 0.23 | % | |
Year Ended October 31, 2005(h) | | 2.02 | % | | | 30,518 | | 0.20 | % | | 2.62 | % | | 0.26 | % | |
Year Ended October 31, 2006 | | 4.37 | % | | | 6,521 | | 0.19 | % | | 4.12 | % | | 0.27 | % | |
Year Ended October 31, 2007 | | 4.74 | %(d) | | | 73,460 | | 0.15 | %(d) | | 4.38 | %(d) | | 0.22 | % | |
Year Ended October 31, 2008 | | 1.90 | % | | | 3,771,262 | | 0.16 | % | | 1.26 | % | | 0.16 | % | |
|
|
|
|
|
|
|
|
|
|
|
|
|
|
|
|
|
CLASS Y SHARES | | | | | | | | | | | | | | | | |
Year Ended October 31, 2004 | | 0.79 | % | | $ | 172,704 | | 0.31 | % | | 0.82 | % | | 0.35 | % | |
Year Ended October 31, 2005 | | 2.30 | % | | | 47,804 | | 0.36 | % | | 2.13 | % | | 0.36 | % | |
Year Ended October 31, 2006 | | 4.16 | % | | | 42,934 | | 0.35 | % | | 4.07 | % | | 0.37 | % | |
Year Ended October 31, 2007 | | 4.60 | %(d) | | | 41,256 | | 0.27 | %(d) | | 4.34 | %(d) | | 0.32 | % | |
Year Ended October 31, 2008 | | 1.78 | % | | | 1,364,310 | | 0.27 | % | | 1.34 | % | | 0.27 | % | |
|
|
|
|
|
|
|
|
|
|
|
|
|
|
|
|
|
| |
* | Less than $0.005 per share. |
| |
** | Less than $500. |
| |
(a) | Not annualized for periods less than one year. Total returns do not include redemption charges. |
| |
(b) | Annualized for periods less than one year. |
| |
(c) | During the period, certain fees were reduced. If such fee reductions had not occurred, the ratio would have been as indicated. |
| |
(d) | During the year ended October 31, 2007, HSBC reimbursed amounts to certain Funds related to past marketing arrangements. The corresponding impact to the net expense ratio, net income ratio and the total return were 0.01%, 0.01%, 0.01%, 0.01% and 0.01% for Class A Shares, Class B Shares, Class D Shares, Class I Shares and Class Y Shares, respectively. |
| |
(e) | Class B Shares commenced operations on August 13, 2004. |
| |
(f) | Class C Shares were operational during a portion of the year only. Amounts reflect performance for the period of time the class had operations, which was 26 days during the period. |
| |
(g) | Class I Shares commenced operations on December 30, 2003 and were operational during a portion of the year only. Amounts reflect performance for the period of time the class had operations, which was 13 days during the period. |
| |
(h) | Class I Shares were operational during a portion of the year only. Amounts reflect performance for the period of time the class had operations, which was 280 days during the period. |
| | |
See notes to financial statements | HSBC INVESTOR FAMILY OF FUNDS | 42 |
|
HSBC INVESTOR FAMILY OF FUNDS |
|
Notes to Financial Statements—as of October 31, 2008 |
| |
1. | Organization: |
| |
| HSBC Investor Funds (the “Trust’’), a Massachusetts business trust organized on April 22, 1987, is registered under the Investment Company Act of 1940, as amended (the “Act’’), as an open-end management investment company. As of October 31, 2008, the Trust is comprised of 19 separate operational funds, each a series of the HSBC Investor Family of Funds. The accompanying financial statements are presented for the following 6 funds (individually a “Fund,’’ collectively the “Funds’’): |
| | | |
| Fund | | Short Name |
|
| |
|
| HSBC Investor California Tax-Free Money Market Fund | | California Tax-Free Money Market Fund |
| HSBC Investor Prime Money Market Fund | | Prime Money Market Fund |
| HSBC Investor New York Tax-Free Money Market Fund | | N.Y. Tax-Free Money Market Fund |
| HSBC Investor Tax-Free Money Market Fund | | Tax-Free Money Market Fund |
| HSBC Investor U.S. Government Money Market Fund | | U.S. Government Money Market Fund |
| HSBC Investor U.S. Treasury Money Market Fund | | U.S Treasury Money Market Fund |
| |
| Each Fund except the N.Y. Tax-Free Money Market Fund are diversified funds under the Act. The N.Y. Tax-Free Money Market Fund is a non-diversified fund, which means they may concentrate their investments in the investments of a limited number of issuers. |
| |
| Financial statements for all other Funds of HSBC Investor Family of Funds are published separately. |
| |
| The Funds are authorized to issue an unlimited number of shares of beneficial interest with a par value of $0.001 per share. The Funds are authorized to issue five classes of shares: Class A Shares, Class B Shares, Class C Shares, Class D Shares, and Class Y Shares. In addition, the Prime Money Market Fund, Tax-Free Money Market Fund, U.S. Government Money Market Fund and U.S. Treasury Money Market Fund are authorized to issue Class I Shares. The Class B Shares of the Funds are offered without any front-end sales charge but will be subject to a contingent deferred sales charge (“CDSC’’) ranging from a maximum of 4.00% if redeemed less than one year after purchase to 0.00% if redeemed more than four years after purchase. Class C Shares of the Funds are offered without any front-end sales charge but will be subject to a maximum CDSC of 1.00% if redeemed less than one year after purchase. No sales charges are assessed with respect to Class A, Class D, Class I or Class Y Shares of the Funds. Each class of shares in each Fund has identical rights and privileges, except with respect to arrangements pertaining to shareholder servicing and/or distribution, class-related expenses, voting rights on matters affecting a single class of shares, and exchange privileges. |
| |
| Under the Trust’s organizational documents, the Funds’ officers and trustees are indemnified against certain liabilities arising out of the performance of their duties to the Funds. In addition, in the normal course of business, the Funds may enter into contracts with its service providers, which also provide for indemnifications by the Funds. The Funds’ maximum exposure under these arrangements is unknown as this would involve future claims that may be made against the Funds. However, based on experience, the Funds expect that risk of loss to be remote. |
| |
2. | Significant Accounting Policies: |
| |
| The following is a summary of the significant accounting policies followed by the Funds in the preparation of their financial statements. The policies are in conformity with U.S. generally accepted accounting principles (“GAAP’’). The preparation of financial statements requires management to make estimates and assumptions that affect the reported amounts of assets and liabilities and disclosure of contingent assets and liabilities at the date of the financial statements and the reported amounts of income and expenses for the period. Actual results could differ from those estimates. |
| |
| Securities Valuation: |
| |
| Investments of the Funds are valued at amortized cost, which approximates fair value. Investments in other money market funds are priced at net asset value as reported by such companies. Under the amortized cost method, premium or discount, if any, is amortized or accreted, respectively, on a constant (straight-line) basis to the maturity of the security. |
| |
| Investment Transactions and Related Income: |
| |
| Investment transactions are accounted for no later than one business day after trade date. For financial reporting purposes, changes in holdings are accounted for on trade date on the last business day of the reporting period. Investment gains and losses are calculated on the identified cost basis. Interest income is recognized on the accrual basis and includes, where applicable, the amortization or accretion of premium or discount. Dividend income is recorded on the ex-dividend date. |
| | |
43 | HSBC INVESTOR FAMILY OF FUNDS | See notes to financial statements. |
|
HSBC INVESTOR FAMILY OF FUNDS |
|
Notes to Financial Statements—as of October 31, 2008 (continued) |
| |
| Restricted and Illiquid Securities: |
| |
| A restricted security is a security which has been purchased through a private offering and cannot be resold to the general public without prior registration under the Securities Act of 1933 (the “1933 Act’’) or pursuant to the resale limitations provided by Rule 144 under the 1933 Act, or an exemption from the registration requirements of the 1933 Act. Certain restricted securities may be resold in transactions exempt from registration, normally to qualified institutional buyers, and may be deemed liquid by the Investment Adviser based on procedures established by the Board of Trustees. Therefore, not all restricted securities are considered illiquid. As of October 31, 2008 there were no restricted securities that were illiquid. |
| |
| Repurchase Agreements: |
| |
| The Funds (except U.S. Treasury Money Market Fund) may enter into repurchase agreements with an entity which is a member of the Federal Reserve System or which is a “primary dealer’’ (as designated by the Federal Reserve Bank of New York) in U.S. Government obligations. The repurchase price generally equals the price paid by a Fund plus interest negotiated on the basis of current short-term rates, which may be more or less than the rate on the underlying Portfolio securities. The seller, under a repurchase agreement, is required to maintain the collateral held pursuant to the agreement, with a fair value equal to or greater than the repurchase price (including accrued interest). Collateral subject to repurchase agreements is held by the Funds’ custodian or another qualified custodian or in the Federal Reserve/Treasury book-entry system. In the event of counterparty default, the Fund has the right to use the collateral to offset losses incurred. There is potential for loss to the Fund in the event the Fund is delayed or prevented from exercising its rights to dispose of the collateral securities, including the risk of a possible decline in the fair value of the underlying securities during the period while the Fund seeks to assert its rights. |
| |
| Allocations: |
| |
| Expenses directly attributable to a Fund are charged to that Fund. Expenses not directly attributable to a Fund are allocated proportionately among various or all Funds within the HSBC Investor Family of Funds in relation to the net assets of each Fund or on another reasonable basis. Class specific expenses are charged directly to the class incurring the expense. In addition, income, expenses (other than class specific expenses), and unrealized/realized gains and losses in investments are allocated to each class of shares based on its relative net assets on a daily basis. |
| |
| Dividends to Shareholders: |
| |
| Dividends from net investment income are declared daily and paid monthly from each Fund. Dividends from net realized gains, if any, are declared and paid at least annually by the Funds. Additional distributions are also made to the Funds’ shareholders to the extent necessary to avoid the federal excise tax on certain undistributed income and net realized gains of regulated investment companies. |
| |
| The character of net investment income and net realized gains distributed are determined in accordance with federal income tax regulations, which may differ from GAAP. These “book/tax’’ differences are either considered temporary or permanent in nature. To the extent these differences are permanent in nature (e.g., reclassification of market discounts, certain gain/loss, paydowns, and distributions), such amounts are reclassified within the composition of net assets based on their federal tax-basis treatment; temporary differences (e.g., wash losses and post-october loss deferrals) do not require reclassification. To the extent distributions from net investment income and net realized gains exceed net investment income and net realized gains for tax purposes, they are reported as distributions of capital. |
| |
| Federal Income Taxes: |
| |
| Each Fund is a separate taxable entity for federal income tax purposes. Each Fund has qualified and intends to continue to qualify each year as a “regulated investment company’’ under Subchapter M of the Internal Revenue Code, as amended and to distribute substantially all of their taxable net investment income and net realized gains, if any, to their shareholders. Accordingly, no provision for federal income or excise tax is required. |
| |
| In addition, effective April 30, 2008, the Funds adopted Financial Accounting Standards Board Interpretation No. 48, Accounting for Uncertainty in Income Taxes (“FIN 48”). FIN 48 provides guidance for how uncertain tax positions should be recognized, measured, presented and disclosed in the financial statements. FIN 48 requires the affirmative evaluation of tax positions taken or expected to be taken in the course of preparing the Trust’s tax returns to determine whether it is more-likely-than-not (i.e., greater than 50-percent) that each tax position will be sustained upon examination by a taxing authority based on the technical merits of the position. A tax position that meets the more-likely-than-not recognition threshold is measured |
| |
HSBC INVESTOR FAMILY OF FUNDS | 44 |
|
HSBC INVESTOR FAMILY OF FUNDS |
|
Notes to Financial Statements—as of October 31, 2008 (continued) |
| |
| to determine the amount of benefit to recognize in the financial statements. Differences between tax positions taken in a tax return and amounts recognized in the financial statements will generally result in an increase in a liability for taxes payable (or a reduction of a tax refund receivable), including the recognition of any related interest and penalties as an operating expense. Implementation of FIN 48 included a review of tax positions taken in tax years that remain subject to examination by tax authorities in all major tax jurisdictions, including federal (i.e., the last 4 tax year ends and the interim tax period since then, as applicable). The adoption of FIN 48 did not impact the Funds’ net assets or results of operations. |
| |
| New Accounting Pronouncements: |
| |
| In September 2006, the Financial Accounting Standards Board (“FASB”) issued Statement on Financial Accounting Standards (“SFAS”) No. 157, “Fair Value Measurements” (“SFAS No. 157”). This standard establishes a single authoritative definition of fair value, sets out a framework for measuring fair value and requires additional disclosures about fair value measurements. SFAS No. 157 applies to fair value measurements already required or permitted by existing standards. SFAS No. 157 is effective for financial statements issued for fiscal years beginning after November 15, 2007 and interim periods within those fiscal years. The changes to current generally accepted accounting principles from the application of this Statement relate to the definition of fair value, the methods used to measure fair value, and the expanded disclosures about fair value measurements. Effective November 1, 2008 the Trust adopted SFAS No. 157. The adoption of this standard did not have an impact to the net assets or results of operations of the Funds, however, additional disclosures will be required about the inputs used to develop fair value measurements and the effect of certain measurements on the changes in net assets in fiscal reporting periods subsequent to the adoption date. |
| |
| In March 2008, the Financial Accounting Standards Board issued the Statement of Financial Accounting Standards No. 161, “Disclosures about Derivative Instruments and Hedging Activities” (“SFAS 161”). SFAS 161 is effective for fiscal years and interim periods beginning after November 15, 2008. SFAS 161 requires enhanced disclosures about the Funds derivative and hedging activities, including how such activities are accounted for and their effect on the Fund’s financial position, performance and cash flows. Management is currently evaluating the impact, the adoption of SFAS 161 will have on the Funds’ financial statements and related disclosures. |
| |
| |
3. | Related Party Transactions: |
| |
| Investment Management: |
| |
| HSBC Global Asset Management (USA) Inc. (“HSBC’’ or the “Investment Adviser’’), a wholly owned subsidiary of HSBC Bank USA, N.A., a national bank organized under the laws of the United States, acts as Investment Adviser to the Funds. As Investment Adviser, HSBC manages the investments of the Funds and continuously reviews, supervises and administers the Funds’ investments pursuant to an Investment Advisory Agreement. For its services, HSBC receives a fee, accrued daily and paid monthly, based on the average daily net assets, at an annual rate of: |
| | | | |
| Fund | | Fee Rate | |
|
| |
| |
| California Tax-Free Money Market Fund | | 0.10% | |
| Prime Money Market Fund | | 0.10% | |
| N.Y. Tax-Free Money Market Fund | | 0.10% | |
| Tax-Free Money Market Fund | | 0.10% | |
| U.S. Government Money Market Fund | | 0.10% | |
| U.S. Treasury Money Market Fund | | 0.10% | |
| |
| HSBC also provides operational support services to the Funds pursuant to an Operational Support Services Agreement. For its services, HSBC receives a fee, accrued daily and paid monthly, based on the average daily net assets of Class A Shares, Class B Shares, Class C Shares, Class D Shares and Class Y Shares, at an annual rate of: |
| | | | |
| Fund | | Fee Rate | |
|
| |
| |
| California Tax-Free Money Market Fund | | 0.10% | |
| Prime Money Market Fund | | 0.10% | |
| N.Y. Tax-Free Money Market Fund | | 0.05% | |
| Tax-Free Money Market Fund | | 0.10% | |
| U.S. Government Money Market Fund | | 0.10% | |
| U.S. Treasury Money Market Fund | | 0.10% | |
| |
45 | HSBC INVESTOR FAMILY OF FUNDS |
|
HSBC INVESTOR FAMILY OF FUNDS |
|
Notes to Financial Statements—as of October 31, 2008 (continued) |
| |
| Administration: |
| |
| HSBC serves the Funds as Administrator. Under the terms of the Administration Agreement, HSBC receives from the Funds a fee, accrued daily and paid monthly, at an annual rate of: |
| | | |
| Based on Average Daily Net Assets of | | Fee Rate |
|
| |
|
| Up to $12 billion | | 0.0525% |
| In excess of $12 billion | | 0.035% |
| |
| The fee breakpoints are determined on the basis of the aggregate average daily net assets of the HSBC Investor Family of Funds. The fee is allocated to each of the HSBC Investor Family of Funds based upon its pro-rata share of net assets for each class. |
|
| The administration fees accrued for each class by fund, of which 50% of such fees are deemed to be class specific, are as follows: |
| | | | | | | | | | | | | | | | | | | | |
| | | California
Tax-Free
Money
Market Fund | |
Prime Money
Market Fund
| | New York
Tax-Free
Money
Market Fund | | Tax-Free
Money
Market Fund | | U.S.
Government
Money
Market Fund | | U.S.
Treasury
Money
Market Fund | |
| | |
| |
| |
| |
| |
| |
| |
| Class A | | $ | 15 | | $ | 166,607 | | $ | 29,533 | | $ | — | | $ | 390,259 | | $ | 92,131 | |
| Class B | | | — | | | 85 | | | 15 | | | — | | | 8 | | | 17 | |
| Class C | | | 189 | | | 155,738 | | | — | | | — | | | 158 | | | 23 | |
| Class D | | | 41,795 | | | 1,447,458 | | | 274,477 | | | 30,516 | | | 2,367,526 | | | 274,778 | |
| Class I | | | — | | | 1,065,126 | | | — | | | — | | | 676,088 | | | 373,826 | |
| Class Y | | | 34,579 | | | 551,957 | | | 141,484 | | | 29,290 | | | 3,666,238 | | | 255,101 | |
| | |
|
| |
|
| |
|
| |
|
| |
|
| |
|
| |
| Total | | $ | 76,578 | | $ | 3,386,971 | | $ | 445,509 | | $ | 59,806 | | $ | 7,100,277 | | $ | 995,876 | |
| | |
|
| |
|
| |
|
| |
|
| |
|
| |
|
| |
| |
| Pursuant to a Sub-Administration Agreement with HSBC, Citi Fund Services Ohio, Inc. (“Citi Ohio’’), a wholly-owned subsidiary of Citigroup, Inc., serves as the Trust’s sub-administrator, subject to the general supervision of the Funds’ Board of Trustees and HSBC. For these services, Citi Ohio is entitled to a fee, payable by HSBC, at an annual rate equivalent to the fee rates set forth above, minus 0.02% (2 basis points) which is retained by HSBC. During the year ended October 31, 2008, HSBC reduced its administrative fees by $424,137. |
| |
| Under a Compliance Services Agreement between the Funds and Citi Ohio (the “CCO Agreement’’), Citi Ohio makes an employee available to serve as the Funds’ Chief Compliance Officer (the “CCO’’). Under the CCO Agreement, Citi Ohio also provides infrastructure and support in implementing the written policies and procedures comprising the Funds’ compliance program, including support services to the CCO. For the services provided under the CCO Agreement, the HSBC Investor Family of Funds paid Citi Ohio $250,800 for the year ended October 31, 2008 plus reimbursement of certain expenses. Expenses incurred by each fund are reflected on the Statements of Operations as “Compliance Service.’’ Citi Ohio pays the salary and other compensation earned by any such individuals as employees of Citi Ohio. |
| |
| Distribution Plan: |
| |
| Foreside Distribution Services, L.P. (“Foreside”), a wholly-owned subsidiary of Foreside Financial Group LLC, serves the Trust as Distributor (the “Distributor’’). The Trust has adopted a non-compensatory Distribution Plan and Agreement (the “Plan’’) pursuant to Rule 12b-1 of the Act. The Plan provides for reimbursement of expenses incurred by the Distributor related to distribution and marketing, at a rate not to exceed 0.25%, 1.00%, 1.00% and 0.25% of the average daily net assets of Class A Shares (currently not being charged), Class B Shares (currently charging 0.75%), Class C Shares (currently charging 0.75%) and Class D Shares (currently not being charged) of the Funds, respectively. Foreside, as Distributor, also received $609,707, $380,866 and $21,569 in commissions from sales of HSBC Investor Family of Funds, for Class A Shares, Class B Shares and Class C Shares, respectively, of which $433,949, $280,535 and $14,592 were reallowed to affiliated brokers and dealers for Class A Shares, Class B Shares and Class C Shares, respectively. |
| |
| Shareholder Servicing: |
| |
| The Trust has adopted an Shareholder Services Plan, formerly known as administrative services plan, which provides for payments to shareholder servicing agents (which currently consist of HSBC and its affiliates) for providing various shareholder services. For performing these services, the shareholder servicing agents receive a fee that is computed daily and paid monthly up to 0.60%, 0.25%, 0.25% and 0.25% of the average daily net assets of Class A Shares (currently |
| |
HSBC INVESTOR FAMILY OF FUNDS | 46 |
|
HSBC INVESTOR FAMILY OF FUNDS |
|
Notes to Financial Statements—as of October 31, 2008 (continued) |
| |
| charging 0.40%), Class B Shares, Class C Shares and Class D Shares of the Funds, respectively. The fees paid to the Distributor pursuant to the Distribution Plan and to shareholder servicing agents pursuant to the Shareholder Services Plan may not exceed, in the aggregate, 0.85%, 1.00%, 1.00% and 0.50% annually of each Fund’s average daily net assets of Class A Shares, Class B Shares, Class C Shares and Class D Shares, respectively. |
| |
| Fund Accounting, Transfer Agent and Trustee: |
| |
| Citi Ohio provides fund accounting and transfer agency services for each Fund. As transfer agent for the Funds, Citi Ohio receives a fee based on the number of Funds and shareholder accounts, subject to certain minimums and reimbursement of certain expenses. As fund accountant for the Funds, Citi Ohio receives an annual fee per Fund and share class, subject to certain minimums and reimbursement of certain expenses. |
| |
| Effective April 1, 2008 each of the non-interested Trustees are compensated with a $60,000 annual Board retainer, as well as a $3,000 annual retainer for each Committee of the Board. Each non-interested Trustee also receives a $5,000 and $3,000 meeting fee for each regular in-person Board meeting and Committee meeting, respectively. Furthermore, each non-interested Trustee receives compensation for attending special meetings and/or functioning as a Committee Chairperson or Lead Trustee. In addition, the non-interested Trustees are reimbursed for certain expenses incurred in connection with their Board membership. |
| |
| Prior to April 1, 2008 each of the non-interested Trustees were compensated with a $35,000 annual Board retainer, as well as a $3,000 annual retainer for each Committee of the Board. Each non-interested Trustee also received a $5,000 and $3,000 meeting fee for each regular in-person Board meeting and Committee meeting, respectively. Furthermore, each non-interested Trustee receives compensation for attending special meetings and/or functioning as a Committee Chairperson or Lead Trustee. In addition, the non-interested Trustees are reimbursed for certain expenses incurred in connection with their Board membership. |
| |
| Fee Reductions: |
| |
| The Investment Adviser has agreed to contractually limit through March 1, 2009 the annual total expenses, exclusive of interest, taxes, brokerage commissions, and extraordinary expenses, of the California Tax-Free Money Market Fund, Money Market Fund, U.S. Government Money Market Fund and U.S. Treasury Money Market Fund. Each Fund Class has its own expense limitations based on the average daily net assets for any full fiscal year as follows: |
| | | | | | | | |
| Fund | | Class | | Contractual
Expense
Limitations |
|
| |
| |
|
|
| California Tax-Free Money Market Fund | | | A | | | 0.80 | % |
| California Tax-Free Money Market Fund | | | B | | | 1.40 | %* |
| California Tax-Free Money Market Fund | | | C | | | 1.40 | % |
| California Tax-Free Money Market Fund | | | D | | | 0.65 | % |
| California Tax-Free Money Market Fund | | | Y | | | 0.40 | % |
| Prime Money Market Fund | | | I | | | 0.20 | % |
| U.S. Government Money Market Fund | | | I | | | 0.20 | % |
| U.S. Treasury Money Market Fund | | | I | | | 0.20 | % |
| | |
|
|
| * | The California Tax-Free Money Market Fund Class B Shares have not commenced operations as of October 31, 2008. |
| |
| The Administrator and Citi Ohio may voluntarily waive/reimburse fees to help support the expense limits of the Funds. In addition, the Administrator and Investment Adviser may waive/reimburse additional fees at their discretion. Amounts waived/reimbursed by the Investment Adviser, Administrator and Citi Ohio are reported separately on the Statements of Operations, as applicable. All contractual and any voluntary fee waivers/reimbursements are not subject to recoupment in subsequent fiscal periods. Voluntary waivers/reimbursements may be stopped at any time. |
| |
| The Funds’ have entered into an arrangement with its custodian whereby credits realized as a result of uninvested cash balances are used to reduce a portion of the Funds’ custodian expenses. Expenses reduced during the year ended October 31, 2008 are reflected on the Statements of Operations as “Fees Reduced by Custody Credits.” |
| |
4. | Investment Transactions: |
| |
| The California Tax-Free Money Market Fund and N.Y. Tax-Free Money Market Fund invest primarily in debt obligations issued by the State of California and the State of New York, respectively, and their respective political subdivi- |
| |
47 | HSBC INVESTOR FAMILY OF FUNDS |
|
HSBC INVESTOR FAMILY OF FUNDS |
|
Notes to Financial Statements—as of October 31, 2008 (continued) |
| |
| sions, agencies and public authorities. The Funds are more susceptible to economic and political factors adversely affecting issuers of California and New York municipal securities than are municipal money market funds that are not concentrated in these issuers to the same extent. |
| |
5. | Federal Income Tax Information: |
| |
| At October 31, 2008, the cost basis for federal income tax purposes, gross unrealized appreciation, gross unrealized depreciation and net unrealized appreciation/depreciation were as follows: |
| | | | | | | | | | | | | | | | | |
Fund | | Tax Cost | | Tax Unrealized
Appreciation | | Tax Unrealized
Depreciation* | | Net Unrealized
Appreciation
(Depreciation)* | |
| |
| |
| |
| |
| |
California Tax-Free Money Market Fund | | $ | 109,667,674 | | $ | — | | $ | — | | $ | — | |
Prime Money Market Fund | | | 8,649,398,494 | | | — | | | — | | | — | |
New York Tax-Free Money Market Fund | | | 929,847,685 | | | — | | | — | | | — | |
Tax-Free Money Market Fund | | | 213,136,187 | | | — | | | — | | | — | |
U.S. Government Money Market Fund | | | 13,781,967,702 | | | — | | | — | | | — | |
U.S Treasury Money Market Fund | | | 6,609,451,306 | | | — | | | (315,556 | ) | | (315,556 | ) |
| |
|
* | The difference between book-basis and tax-basis unrealized appreciation/(depreciation) is attributable primarily to: tax-deferral of losses on wash sales. |
| |
| The tax character of dividends paid by the Funds as of the latest tax year ended October 31, 2008 were as follows: |
| | | | | | | | | | | | | | | | | |
| | | Dividends paid from | |
| | |
| |
| | | Ordinary
Income | | Net Long
Term
Capital Gains | | Total Taxable
Dividends | | Tax Exempt
Distributions | | Total
Dividends
Paid(1) | |
| | |
| |
| |
| |
| |
| |
California Tax-Free Money Market Fund | | $ | 40,728 | | $ | — | | $ | 40,728 | | $ | 3,640,204 | | $ | 3,680,932 | |
Prime Money Market Fund | | | 250,554,750 | | | — | | | 250,554,750 | | | — | | | 250,554,750 | |
New York Tax-Free Money Market Fund | | | 153,488 | | | — | | | 153,488 | | | 22,999,078 | | | 23,152,566 | |
Tax-Free Money Market Fund | | 8,629 | | | — | | | 8,629 | | | 2,832,608 | | | 2,841,237 | |
U.S. Government Money Market Fund | | | 398,399,999 | | | — | | | 398,399,999 | | | — | | | 398,399,999 | |
U.S Treasury Money Market Fund | | | 29,192,297 | | | — | | | 29,192,297 | | | — | | | 29,192,297 | |
The tax character of dividends paid by the Funds during the year ended October 31, 2007 were as follows:
| | | | | | | | | | | | | | | | | |
| | Dividends paid from | |
| |
| |
| | Ordinary
Income | | Net Long
Term
Capital Gains | | Total Taxable
Dividends | | Tax Exempt
Distributions | | Total
Dividends
Paid(1) | |
| |
| |
| |
| |
| |
| |
California Tax-Free Money Market Fund | | $ | 16,259 | | $ | — | | $ | 16,259 | | $ | 4,157,109 | | $ | 4,173,368 | |
Prime Money Market Fund | | | 318,454,790 | | | — | | | 318,454,790 | | | — | | | 318,454,790 | |
New York Tax-Free Money Market Fund | | | 77,595 | | | — | | | 77,595 | | | 26,821,094 | | | 26,898,689 | |
Tax-Free Money Market Fund | | | 8,885 | | | — | | | 8,885 | | | 2,048,024 | | | 2,056,909 | |
U.S. Government Money Market Fund | | | 165,188,430 | | | — | | | 165,188,430 | | | — | | | 165,188,430 | |
U.S Treasury Money Market Fund | | | 20,779,844 | | | — | | | 20,779,844 | | | — | | | 20,779,844 | |
| |
|
(1) Total dividends paid may differ from the amount reported in the Statement of Changes in Net Assets because dividends are recognized when actually paid for tax purposes. |
| |
HSBC INVESTOR FAMILY OF FUNDS | 48 |
|
HSBC INVESTOR FAMILY OF FUNDS |
|
Notes to Financial Statements—as of October 31, 2008 (continued) |
| |
| As of October 31, 2008, the components of accumulated earnings/(deficit) on a tax basis for the Funds were as follows: |
| | | | | | | | | | | | | | | | | | | | | | | | | |
| | Undistributed
Ordinary
Income | | Undistributed
Tax Exempt
Income | | Undistributed
Long Term
Capital Gains | | Accumulated
Earnings | | Dividends
Payable | | Accumulated
Capital and
Other Losses | | Unrealized
Appreciation/
(Depreciation)* | | Total
Accumulated
Earnings/
(Deficit) | |
| |
| |
| |
| |
| |
| |
| |
| |
| |
California Tax-Free Money Market Fund | | $ | — | | $ | 195,764 | | $ | — | | $ | 195,764 | | $ | (195,764 | ) | $ | (2,924 | ) | $ | — | | $ | (2,924 | ) |
Prime Money Market Fund | | | 12,941,248 | | | — | | | — | | | 12,941,248 | | | (12,941,787 | ) | | (3,959,026 | ) | | — | | | (3,959,565 | ) |
New York Tax-Free Money Market Fund | | | 8,217 | | | 2,640,870 | | | — | | | 2,649,087 | | | (2,640,870 | ) | | — | | | — | | | 8,217 | |
Tax-Free Money Market Fund | | | 716 | | | 525,961 | | | — | | | 526,677 | | | (525,961 | ) | | — | | | — | | | 716 | |
U.S. Government Money Market Fund | | | 22,249,095 | | | — | | | — | | | 22,249,095 | | | (21,398,744 | ) | | — | | | — | | | 850,351 | |
U.S Treasury Money Market Fund | | | 3,061,365 | | | — | | | — | | | 3,061,365 | | | (2,780,074 | ) | | — | | | (315,556 | ) | | (34,265 | ) |
| |
|
* | The difference between book-basis and tax-basis unrealized appreciation/(depreciation) is attributable to: tax-deferral of losses on wash sales. |
| |
| As of the latest tax year ended of October 31, 2008, the following Funds have net capital loss carryforwards, which are available to offset future realized gains, if any, to the extent provided by the Treasury regulations. To the extent that these carryforwards are used to offset future capital gains, it is probable that the gains that are offset will not be distributed to shareholders. |
| | | | | | | |
Fund | | Amount | | Expires | |
| |
| |
| |
California Tax-Free Money Market Fund | | $ | 24 | | | 2014 | |
| | | 2,900 | | | 2016 | |
Prime Money Market Fund | | | 59,832 | | | 2012 | |
| | | 12,537 | | | 2013 | |
| | | 3,997 | | | 2014 | |
| | | 197,657 | | | 2015 | |
| | | 3,685,003 | | | 2016 | |
| |
| During the year ended October 31, 2008, the following Funds utilized capital loss carryforwards to offset capital gains realized: |
| | | | | | | |
Fund | | Amount | | | |
| |
| | | |
New York Tax-Free Money Market Fund | | $ | 11,738 | | | | |
U.S. Government Money Market Fund | | | 2,170 | | | | |
U.S. Treasury Money Market Fund | | | 90,038 | | | | |
| |
6. | Affiliated Transactions: |
| |
| The HSBC Investor Prime Money Market Fund (the “Fund”) held notes (the “Notes”) issued by certain structured investment vehicles (“SIVs”) during the year. In order to mitigate the negative impact of holding these SIVs in light of the ongoing credit conditions in the market, including the downgrade in credit rating for one of the holdings, on January 9, 2008, the Trust, on behalf of the Fund, entered into a Letter of Indemnity (as subsequently amended, the “Agreement”) with HSBC Group Investment Businesses Limited (“HGIB”), an affiliate to the Fund’s Investment Adviser, HSBC Global Asset Management (USA) Inc., pursuant to which HGIB agreed to provide capital support to the Fund under certain circumstances. |
| |
| The Agreement required HGIB to contribute capital to the Fund, subject to an aggregate limit of $69 million, if as a result of realized losses on the Notes the Fund’s mark-to-market net asset value would drop below $0.9975. In such event, HGIB would pay to the Fund the lesser of the following amounts: (i) the amount of the loss realized on the Notes; (ii) the amount, if any, necessary to restore the mark-to-market net asset value per share of the Fund to $0.9975, or (iii) the |
| |
| |
49 | HSBC INVESTOR FAMILY OF FUNDS |
|
HSBC INVESTOR FAMILY OF FUNDS |
|
Notes to Financial Statements—as of October 31, 2008 (continued) |
| |
| remaining amount of the aggregate limit under the Agreement, taking into account all prior contributions by HGIB. |
| |
| The Board of Trustees determined that HGIB’s commitment under the Agreement was of comparable quality to a First Tier Security as defined in Rule 2a-7. |
| |
| The termination date of the Agreement was the earlier of: (i) the full payment in cash of all amounts due by the issuers of the Notes; (ii) the payment in cash by HGIB of all amounts due under the provisions of the Agreement; (iii) the determination that HGIB’s commitment under the Agreement no longer qualified as a First Tier Security; or (iv) December 31, 2008. If the Fund continued to hold Notes on the December 31, 2008 termination date of the Agreement, the Fund would sell such Notes on the termination date if a sale would trigger a required capital payment from HGIB to the Fund under the provisions of the Agreement. Additionally, in the event that the Agreement terminated based on a determination by the Board that HGIB’s commitment under the Agreement no longer qualified as a First Tier Security, the Fund would sell the Notes and HGIB would pay any amounts owed under the provisions of the Agreement. |
| |
| Since January 9, 2008 all SIVs, except for those issued by Stanfield Victoria Funding LLC (“Stanfield”) and Whistlejacket Capital LLC (“Whistlejacket”), matured as expected and the Fund received all related payments. The Stanfield and Whistlejacket holdings defaulted in payment of their scheduled principal and interest amounts since that date. On October 3, 2008 HGIB purchased the Stanfield and Whistlejacket holdings from the Fund at their amortized cost value, including accrued interest. |
| |
| The following table summarizes the Stanfield and Whistlejacket holdings and their amortized cost value, fair value, unrealized depreciation, and accrued interest as of October 3, 2008: |
| | | | | | | | | | | | | | | | |
Description | | Principal
Amount ($) | | Amortized
Cost ($) | | Fair Value
($) | | Unrealized
Depreciation
($) | | Accrued
Interest ($) | |
| |
| |
| |
| |
| |
| |
Stanfield Victoria Funding LLC, 0.00%, 1/25/08 | | | 21,000,000 | | | 21,000,000 | | | 18,929,400 | | | (2,070,600 | ) | | 238,257 | |
Stanfield Victoria Funding LLC, 0.00%, 3/3/08 | | | 40,000,000 | | | 39,999,427 | | | 36,056,000 | | | (3,943,427 | ) | | 266,022 | |
Stanfield Victoria Funding LLC, 0.00%, 7/15/08 | | | 42,000,000 | | | 41,996,067 | | | 37,858,800 | | | (4,137,267 | ) | | 544,016 | |
Whistlejacket Capital LLC,
0.00%, 5/15/08 | | | 50,000,000 | | | 49,998,698 | | | 47,360,000 | | | (2,638,698 | ) | | 691,722 | |
Whistlejacket Capital LLC,
0.00%, 6/23/08 | | | 75,000,000 | | | 74,996,390 | | | 71,040,000 | | | (3,956,390 | ) | | 674,844 | |
| |
|
| |
|
| |
|
| |
|
| |
|
| |
| | | 228,000,000 | | | 227,990,582 | | | 211,244,200 | | | (16,746,382 | ) | | 2,414,861 | |
| |
|
| |
|
| |
|
| |
|
| |
|
| |
| |
| HGIB purchased the Stanfield and Whistlejacket holdings at $16,746,382 in excess of their fair value on October 3, 2008. Although this transaction results in no net realized gain or loss to the Fund, for financial reporting purposes, $16,746,382 is included as “Net Realized Losses from Investment Transactions” and an offsetting amount is separately reflected as “net realized gain payment from affiliate for purchase of certain defaulted securities” on the Statement of Operations. Additionally, the $16,746,382 amount that was paid in excess of fair value on that date contributed 0.20% to the total return of each class of the Fund as further disclosed in the Financial Highlights. |
| |
| HGIB’s acquisition of the Stanfield and Whistlejacket holdings on October 3, 2008 terminated the Capital Support Agreement on that date. No separate payments were required from HGIB under the terms of the Agreement while it was in effect. |
| |
7. | Legal and Regulatory Matters: |
| |
| On September 26, 2006 BISYS Fund Services, Inc. (“BISYS’’), an affiliate of BISYS Fund Services Ohio, Inc. which provided various services to the Funds, reached a settlement with the Securities and Exchange Commission (“the SEC’’) regarding the SEC’s investigation related to BISYS’ past payment of certain marketing and other expenses with respect to certain of its mutual fund clients. Although BISYS has reached a settlement with the SEC, the Funds’ management is not aware that any determination has been made as to how the BISYS settlement monies will be distributed. While the Funds’ management is currently unable to determine the impact, if any, of such matters on the Funds or the Funds’ financial |
| |
HSBC INVESTOR FAMILY OF FUNDS | 50 |
|
HSBC INVESTOR FAMILY OF FUNDS |
|
Notes to Financial Statements—as of October 31, 2008 (continued) |
| |
| statements, management does not anticipate a material, adverse impact to the Funds or the Funds’ financial statements. |
| |
8. | Participation in the U.S. Department of Treasury’s Temporary Guarantee Program for Money Market Funds: |
| |
| On October 6, 2008, the Board of Trustees of the Funds approved the participation by each of the Money Market Funds, excluding the U.S. Treasury Money Market Fund, in the U.S. Department of the Treasury’s Temporary Guarantee Program for Money Market Funds (the “Program”). The Funds participation agreement was reviewed and accepted by the Treasury on October 16, 2008. The Program protects the shares of money market fund investors as of September 19, 2008. Any shares held by investors in the Funds as of the close of business on September 19, 2008 are insured against loss under the Program in the event any Fund liquidates and the per share value at the time of liquidation is less than $1 per share. Shares acquired by investors after September 19, 2008 are not eligible for protection under the Program. The Program provides a guarantee based on the number of shares held at the close of business on September 19, 2008 and any increase in the number of shares held in an account after the close of business on September 19, 2008 will not be guaranteed. If the number of shares held in an account fluctuates over the period, investors will be covered for either the number of shares held as of the close of business on September 19, 2008 or the amount held at liquidation, whichever is less. |
| |
| Participation in the Program required a payment to the U.S. Department of Treasury in the amount of $3,118,655, which represented 0.01% based on the net asset value of each Fund as of September 19, 2008. This payment covers participation in the Program until December 18, 2008 and is being expensed by each Fund through that date without regard to any expense limitation in effect for the Funds. Amounts expensed during the year ended October 31, 2008 are reflected in the Statements of Operations as “Treasury Guarantee Program fees”. |
| |
| The program was subsequently extended by the Treasury Department through April 30, 2009, and the Board of Trustees of the Funds approved the continued participation by each of the Money Market Funds, excluding the U.S. Treasury Money Market Fund, in the extended program. The terms of the extended Program are essentially the same as the Program providing protection through April 30, 2009, as well as the extended Program participation fee which represented 0.015% based on the net asset value of each Fund as of September 19, 2008. The payment amounted to $4,677,982 and is being expensed from December 19, 2008 through April 30, 2009 without regard to any expense limitation in effect for the Funds. |
| |
| If the Program is further extended, the Funds will consider whether to continue to participate. If the Program is extended beyond that date and the Funds decide to participate, additional payments may be required. This expense will be borne by the Funds without regard to any expense limitation currently in effect for the Funds. |
| |
51 | HSBC INVESTOR FAMILY OF FUNDS |
REPORT OF INDEPENDENT REGISTERED PUBLIC ACCOUNTING FIRM
To the Shareholders and Board of Trustees of
HSBC Investor Funds:
We have audited the accompanying statements of assets and liabilities of HSBC Investor California Tax-Free Money Market Fund, HSBC Investor Prime Money Market Fund, HSBC Investor New York Tax-Free Money Market Fund, HSBC Investor Tax-Free Money Market Fund, HSBC Investor U.S. Government Money Market Fund and HSBC Investor U.S. Treasury Money Market Fund (the Funds), including the schedules of portfolio investments, as of October 31, 2008, and the related statements of operations for the year then ended, the statements of changes in net assets for each year in the two-year period then ended, and the financial highlights for each period in the five-year period then ended. These financial statements and financial highlights are the responsibility of the Funds’ management. Our responsibility is to express an opinion on these financial statements and financial highlights based on our audits.
We conducted our audits in accordance with the standards of the Public Company Accounting Oversight Board (United States). Those standards require that we plan and perform the audits to obtain reasonable assurance about whether the financial statements and financial highlights are free of material misstatement. An audit includes examining, on a test basis, evidence supporting the amounts and disclosures in the financial statements. Our procedures included confirmation of securities owned as of October 31, 2008, by correspondence with custodians and brokers or by other appropriate auditing procedures where replies from brokers were not received. An audit also includes assessing the accounting principles used and significant estimates made by management, as well as evaluating the overall financial statement presentation. We believe that our audits provide a reasonable basis for our opinion.
In our opinion, the financial statements and financial highlights referred to above present fairly, in all material respects, the financial position of the Funds as of October 31, 2008, the results of their operations for the year then ended, the changes in their net assets for each year in the two-year period then ended, and the financial highlights for each period in the five-year period then ended, in conformity with U.S. generally accepted accounting principles.
KPMG LLP
Columbus, Ohio
December 19, 2008
| |
HSBC INVESTOR FAMILY OF FUNDS | 52 |
|
HSBC INVESTOR FAMILY OF FUNDS |
|
Other Federal Income Tax Information—as of October 31, 2008 (Unaudited) |
| | | | | |
During the year ended October 31, 2008 the following funds designated income dividends as exempt-interest dividends: |
| | | | |
| Fund | | Amount ($) | |
|
| |
| |
| California Tax-Free Money Market Fund | | | 3,640,204 | |
| New York Tax-Free Money Market Fund | | | 22,999,078 | |
| Tax-Free Money Market Fund | | | 2,832,608 | |
| |
53 | HSBC INVESTOR FAMILY OF FUNDS |
|
HSBC INVESTOR FAMILY OF FUNDS |
|
Table of Shareholder Expenses (Unaudited)—as of October 31, 2008 |
As a shareholder of the HSBC Investor Funds (“Funds”), you incur two types of costs: (1) transaction costs, shareholder servicing fees; and exchange fees: (2) ongoing costs, including management fees; distribution; and other Fund expenses. These examples are intended to help you understand your ongoing costs (in dollars) of investing in the Funds (“Funds”) and to compare the cost with the ongoing costs of investing in other mutual funds.
These examples are based on an investment of $1,000 invested at the beginning of the period and held for the entire period from May 1, 2008 through October 31, 2008.
Actual Example
The table below provides information about actual account values and actual expenses. You may use the information below, together with the amount you invested, to estimate the expenses that you paid over the period. Simply divide your account value by $1,000 (for example, an $8,600 account value divided by $1,000 = 8.6), then multiply the result by the number in the table under the heading entitled “Expenses Paid During Period” to estimate the expenses you paid on your account during this period.
| | | | | | | | | | | | | | | | |
| | | | Beginning
Account Value
5/1/08 | | Ending
Account Value
10/31/08 | | Expenses Paid
During Period*
5/1/08 – 10/31/08 | | Annualized
Expense Ratio
During Period
5/1/08 – 10/31/08 | |
| | | |
| |
| |
| |
| |
California Tax-Free Money
Market Fund | | Class A Shares | | $ | 1,000.00 | | $ | 1,007.30 | | | $ | 3.63 | | 0.72 | % | |
| | Class C Shares** | | | 1,000.00 | | | 1,006.50 | | | | 6.10 | | 1.21 | % | |
| | Class D Shares | | | 1,000.00 | | | 1,008.10 | | | | 2.42 | | 0.48 | % | |
| | Class Y Shares | | | 1,000.00 | | | 1,009.40 | | | | 1.11 | | 0.22 | % | |
Prime Money Market Fund | | Class A Shares | | | 1,000.00 | | | 1,009.70 | | | | 3.38 | | 0.67 | % | |
| | Class B Shares | | | 1,000.00 | | | 1,006.70 | | | | 6.41 | | 1.27 | % | |
| | Class C Shares | | | 1,000.00 | | | 1,006.70 | | | | 6.41 | | 1.27 | % | |
| | Class D Shares | | | 1,000.00 | | | 1,010.50 | | | | 2.63 | | 0.52 | % | |
| | Class I Shares | | | 1,000.00 | | | 1,012.30 | | | | 0.86 | | 0.17 | % | |
| | Class Y Shares | | | 1,000.00 | | | 1,011.80 | | | | 1.37 | | 0.27 | % | |
New York Tax-Free Money
Market Fund | | Class A Shares | | | 1,000.00 | | | 1,008.70 | | | | 3.18 | | 0.63 | % | |
| | Class B Shares | | | 1,000.00 | | | 1,005.70 | | | | 6.20 | | 1.23 | % | |
| | Class D Shares | | | 1,000.00 | | | 1,009.50 | | | | 2.42 | | 0.48 | % | |
| | Class Y Shares | | | 1,000.00 | | | 1,010.70 | | | | 1.16 | | 0.23 | % | |
Tax-Free Money Market Fund | | Class D Shares | | | 1,000.00 | | | 1,009.60 | | | | 2.22 | | 0.44 | % | |
| | Class Y Shares | | | 1,000.00 | | | 1,010.80 | | | | 0.96 | | 0.19 | % | |
U.S. Government Money
Market Fund | | Class A Shares | | | 1,000.00 | | | 1,007.30 | | | | 3.38 | | 0.67 | % | |
| | Class B Shares | | | 1,000.00 | | | 1,004.20 | | | | 6.55 | | 1.30 | % | |
| | Class C Shares | | | 1,000.00 | | | 1,004.30 | | | | 6.40 | | 1.27 | % | |
| | Class D Shares | | | 1,000.00 | | | 1,008.10 | | | | 2.62 | | 0.52 | % | |
| | Class I Shares | | | 1,000.00 | | | 1,009.90 | | | | 0.91 | | 0.18 | % | |
| | Class Y Shares | | | 1,000.00 | | | 1,009.40 | | | | 1.36 | | 0.27 | % | |
U.S. Treasury Money
Market Fund | | Class A Shares | | | 1,000.00 | | | 1,003.70 | | | | 3.32 | | 0.66 | % | |
| | Class B Shares | | | 1,000.00 | | | 1,001.50 | | | | 3.82 | | 0.76 | % | |
| | Class C Shares *** | | | 1,000.00 | | | 1,000.10 | | | | 0.45 | | 0.64 | % | |
| | Class D Shares | | | 1,000.00 | | | 1,004.40 | | | | 2.62 | | 0.52 | % | |
| | Class I Shares | | | 1,000.00 | | | 1,006.30 | | | | 0.81 | | 0.16 | % | |
| | Class Y Shares | | | 1,000.00 | | | 1,005.70 | | | | 1.36 | | 0.27 | % | |
| |
|
* | Expenses are equal to the average account value over the period multiplied by the Fund’s annualized expense ratio, multiplied by the number of days in the most recent fiscal half-year divided by the number of days in the fiscal year (to reflect the one half year period). |
| |
** | Information shown reflects values using the expense ratios for the 152 days of operations during the period for California Tax-Free Money Market Fund Class C shares, and has been annualized to reflect values for the period May 1, 2008 to October 31, 2008. |
| |
*** | Information shown reflects values using the expense ratios for the 26 days of operations during the period for U.S. Treasury Money Market Fund Class C shares, and has been annualized to reflect values for the period May 1, 2008 to October 31, 2008. |
| |
HSBC INVESTOR FAMILY OF FUNDS | 54 |
|
HSBC INVESTOR FAMILY OF FUNDS |
|
Table of Shareholder Expenses (Unaudited)—as of October 31, 2008 (continued) |
Hypothetical Example for Comparison Purposes
The table below provides information about hypothetical account values and hypothetical expenses based on each Fund’s actual expense ratio and an assumed rate of return of 5% per year before expenses, which is not the Fund’s actual return. The hypothetical account values and expenses may not be used to estimate the actual ending account balance or expenses you paid for the period. You may use this information to compare this 5% hypothetical example with the 5% hypothetical examples that appear in the shareholder reports of other funds.
Please note that the expenses shown in the table are meant to highlight your ongoing costs only and do not reflect any transactional costs, such as sales charges (loads), redemption fees, or exchange fees. Therefore, the table is useful in comparing ongoing costs only, and will not help you determine the relative total costs of owning different funds. In addition, if these transactional costs were included, your costs would have been higher.
| | | | | | | | | | | | | | | | |
| | | | Beginning
Account Value
11/1/07 | | Ending
Account Value
4/30/08 | | Expenses Paid
During Period*
11/1/07 – 4/30/08 | | Annualized
Expense Ratio
During Period
11/1/07 – 4/30/08 | |
| | | |
| |
| |
| |
| |
California Tax-Free Money
Market Fund | | Class A Shares | | $ | 1,000.00 | | $ | 1,021.52 | | | $ 3.66 | | 0.72 | % | |
| | Class C Shares | | | 1,000.00 | | | 1,019.00 | | | 6.19 | | 1.22 | % | |
| | Class D Shares | | | 1,000.00 | | | 1,022.72 | | | 2.44 | | 0.48 | % | |
| | Class Y Shares | | | 1,000.00 | | | 1,024.03 | | | 1.12 | | 0.22 | % | |
Prime Money Market Fund | | Class A Shares | | | 1,000.00 | | | 1,021.77 | | | 3.40 | | 0.67 | % | |
| | Class B Shares | | | 1,000.00 | | | 1,018.75 | | | 6.44 | | 1.27 | % | |
| | Class C Shares | | | 1,000.00 | | | 1,018.75 | | | 6.44 | | 1.27 | % | |
| | Class D Shares | | | 1,000.00 | | | 1,022.52 | | | 2.64 | | 0.52 | % | |
| | Class I Shares | | | 1,000.00 | | | 1,024.28 | | | 0.87 | | 0.17 | % | |
| | Class Y Shares | | | 1,000.00 | | | 1,023.78 | | | 1.37 | | 0.27 | % | |
New York Tax-Free Money
Market Fund | | Class A Shares | | | 1,000.00 | | | 1,021.97 | | | 3.20 | | 0.63 | % | |
| | Class B Shares | | | 1,000.00 | | | 1,018.95 | | | 6.24 | | 1.23 | % | |
| | Class D Shares | | | 1,000.00 | | | 1,022.72 | | | 2.44 | | 0.48 | % | |
| | Class Y Shares | | | 1,000.00 | | | 1,023.98 | | | 1.17 | | 0.23 | % | |
Tax-Free Money Market Fund | | Class D Shares | | | 1,000.00 | | | 1,022.92 | | | 2.24 | | 0.44 | % | |
| | Class Y Shares | | | 1,000.00 | | | 1,024.18 | | | 0.97 | | 0.19 | % | |
U.S. Government Money
Market Fund | | Class A Shares | | | 1,000.00 | | | 1,021.77 | | | 3.40 | | 0.67 | % | |
| | Class B Shares | | | 1,000.00 | | | 1,018.60 | | | 6.60 | | 1.30 | % | |
| | Class C Shares | | | 1,000.00 | | | 1,018.75 | | | 6.44 | | 1.27 | % | |
| | Class D Shares | | | 1,000.00 | | | 1,022.52 | | | 2.64 | | 0.52 | % | |
| | Class I Shares | | | 1,000.00 | | | 1,024.23 | | | 0.92 | | 0.18 | % | |
| | Class Y Shares | | | 1,000.00 | | | 1,023.78 | | | 1.37 | | 0.27 | % | |
U.S. Treasury Money
Market Fund | | Class A Shares | | | 1,000.00 | | | 1,021.82 | | | 3.35 | | 0.66 | % | |
| | Class B Shares | | | 1,000.00 | | | 1,021.32 | | | 3.86 | | 0.76 | % | |
| | Class C Shares | | | 1,000.00 | | | 1,021.92 | | | 3.25 | | 0.64 | % | |
| | Class D Shares | | | 1,000.00 | | | 1,022.52 | | | 2.64 | | 0.52 | % | |
| | Class I Shares | | | 1,000.00 | | | 1,024.33 | | | 0.81 | | 0.16 | % | |
| | Class Y Shares | | | 1,000.00 | | | 1,023.78 | | | 1.37 | | 0.27 | % | |
| |
|
* | Expenses are equal to the average account value over the period multiplied by the Fund’s annualized expense ratio, multiplied by the number of days in the most recent fiscal half-year divided by the number of days in the fiscal year (to reflect the one half year period). |
| |
55 | HSBC INVESTOR FAMILY OF FUNDS |
|
HSBC INVESTOR FAMILY OF FUNDS |
|
Board of Trustees and Officers (Unaudited) |
MANAGEMENT OF THE TRUST
The following table contains information regarding HSBC Investor Family of Funds Board of Trustees (“Trustees”). Asterisks indicate those Trustees who are “interested persons,” as defined in the Investment company act of 1940, as amended, of the Funds. The Funds’ Statement of Additional Information includes additional information about the Trustees and is available by calling (888) 525-5757.
| | | | | | | | | | |
Name, Address,
and Age | | Position(s)
Held with
Funds | | Term of Office and
Length of Time Served
With the Funds | | Principal Occupation(s)
During Past 5 Years | | Number of
Portfolios in Fund
Complex Overseen
By Trustee* | | Other
Directorships
Held by Trustee |
|
|
|
|
|
|
|
|
|
|
|
| | | | | | | | | | |
NON-INTERESTED TRUSTEE | | | | | | | | | | |
| | | | | | | | | | |
Marcia L. Beck
P.O. Box 182845
Columbus, OH 43218
Date of Birth:
October 29, 1955 | | Trustee | | Indefinite; June 2008
to present | | Private Investor; Executive Vice President and Chief Operating Officer of Prudential Investments (1997-1999) | | 40 | | None |
|
|
|
|
|
|
|
|
|
|
|
Susan S. Huang
P.O. Box 182845
Columbus, OH 43218
Date of Birth:
May 14, 1954 | | Trustee | | Indefinite; June 2008
to present | | Investment Consultant, self employed (2001 to present); Senior Vice President, Schroeder Investment Management (2001-2004) | | 40 | | United Church
Foundation;
Huntington’s Disease
Society; Second
Congregational
Church (Greenwich)
Endowment, Inc. |
|
|
|
|
|
|
|
|
|
|
|
Alan S. Parsow
P.O. Box 182845
Columbus, OH 43218
Date of Birth:
January 16, 1950 | | Trustee | | Indefinite; 1987
to present | | General Partner of Elkhorn Partners, L.P. (a private investment partnership) (since 1989) | | 40 | | None |
|
|
|
|
|
|
|
|
|
|
|
Thomas F. Robards
P.O. Box 182845
Columbus, OH 43218
Date of Birth:
June 10, 1946 | | Trustee | | Indefinite; 2005
to present | | Partner, Robards & Co. LLC (2005- present); Chief Financial Officer, American Museum of Natural History (2003 to 2004) | | 40 | | Ellington Financial
LLC and Overseas
Shipholding Group |
|
|
|
|
|
|
|
|
|
|
|
Larry M. Robbins
P.O. Box 182845
Columbus, OH 43218
Date of Birth:
December 12, 1938 | | Trustee | | Indefinite; 1987
to present | | Private Investor; Director, Center for Teaching and Learning, University of Pennsylvania (1999-2006) | | 40 | | None |
|
|
|
|
|
|
|
|
|
|
|
Michael Seely
P.O. Box 182845
Columbus, OH 43218
Date of Birth:
June 7, 1945 | | Trustee | | Indefinite; 1987
to present | | Private Investor; Global Multi Manager Partners (1999-2003); President of Investor Access Corporation (1981-2003) | | 40 | | None |
|
|
|
|
|
|
|
|
|
|
|
| | | | | | | | | | |
INTERESTED TRUSTEE | | | | | | | | |
| | | | | | | | | | |
Stephen J. Baker**
P.O. Box 182845
Columbus, OH 43218
Date of Birth:
June 23, 1956 | | Trustee | | Indefinite; 2004
to present | | Chief Executive Officer, HSBC Global Asset Management (USA) Inc. and Executive Vice President, HSBC (USA), N.A. (2003 to present); Chief Executive Officer, HSBC Asset Management (Canada) Limited (1998 to 2003) | | 40 | | None |
|
|
|
|
|
|
|
|
|
|
|
| |
* | Includes both the fund and the underlying Portfolio for Funds with a master/feeder structure. |
| |
** | Mr. Baker is an “interested person” of the Trust, as defined by the 1940 Act, because of his employment with the Adviser. |
| |
HSBC INVESTOR FAMILY OF FUNDS | 56 |
|
HSBC INVESTOR FAMILY OF FUNDS |
|
Board of Trustees and Officers (Unaudited) (continued) |
The names of the officers, their addresses, ages, position(s) held with the Trust, and principal occupation(s) during the past five years are described in the table below.
| | | | | | |
Name, Address,
and Age/Date
of Birth | | Position(s)
Held with
Funds | | Term of Office and
Length of Time Served
With the Funds | | Principal Occupation(s)
During Past 5 Years |
|
|
|
|
|
|
|
| | | | | | |
Richard A. Fabietti
452 Fifth Avenue
New York, NY 10018
Date of Birth:
October 8, 1958 | | President | | Indefinite; 2004
to present | | Senior Vice President, Head of Product Management, HSBC Global Asset Management (USA) Inc. (1998 to present) |
|
|
|
|
|
|
|
Elba L. Vasquez
452 Fifth Avenue
New York, NY 10018
Date of Birth:
December 14, 1961 | | Vice President | | Indefinite; 2006
to present | | Vice President of Product Administration, HSBC Global Asset Management (USA) Inc. (2005 to present); Vice President of Client Services, Citi (1996 to 2005) |
|
|
|
|
|
|
|
Troy Sheets*
3435 Stelzer Road
Columbus, OH 43219-3035
Date of Birth:
May 29, 1971 | | | | Treasurer
to present | | Indefinite; 2004 Senior Vice President, Citi (2002 to present) |
|
|
|
|
|
|
|
Jennifer A English*
100 Summer Street
Suite 1500
Boston, MA 02110
Date of Birth:
March 5, 1972 | | Secretary | | Indefinite; September 2008
to present | | Vice President, Regulatory Administration, Citi (2005 to present); Assistant Vice President and Assistant Counsel, PFPC, Inc. (2002-2005) |
|
|
|
|
|
|
|
F. Martin Fox
100 Summer Street
Suite 1500
Boston, MA 02110
Date of Birth:
May 5, 1963 | | Assistant Secretary | | Indefinite; September 2008
to present | | Assistant Vice President, Regulatory Administration, Citi (May 2008 to present); Contract Attorney, Update Legal LLC (2002 to 2008) |
|
|
|
|
|
|
|
Frederick J. Schmidt*
585 Stewart Avenue
Garden City, NY 11530
Date of Birth:
July 10, 1959 | | Chief
Compliance Officer | | Term expires 2009;
2004 to present | | Senior Vice President and Chief Compliance Officer, CCO Services, Citi (2004 to present); President, FJS Associates (2002 to 2004) |
|
|
|
|
|
|
|
| |
* | Mr. Sheets, Mr. Schmidt and Ms. English also are officers of certain other investment companies of which Citi (or an affiliate) is the administrator or sub-administrator. |
| |
57 | HSBC INVESTOR FAMILY OF FUNDS |
Other Information:
A description of the policies and procedures that the Funds use to determine how to vote proxies relating to the portfolio securities is available without charge, upon request, by calling 1-800-525-5757 for HSBC Bank USA and HSBC Brokerage (USA) Inc. clients and 1-800-782-8183 for all other shareholders or on the Fund’s website at www.investorfunds.us.hsbc.com and the Securities and Exchange Commission’s (“Commission”) website at http://www.sec.gov. A copy of the Fund’s voting record for the most recent 12 month period ending June 30 is available at the Commission’s website at http://www.sec.gov.
Schedules of Portfolio Investments for fiscal quarters ending January 31 and July 31 will be available no later than 60 days after each period end, without charge, on the Fund’s website at www.investorfunds.us.hsbc.com and on the Commission’s website at http://www.sec.gov.
An investment in a Fund is not a deposit of HSBC Bank USA, National Association, and is not insured or guaranteed by the Federal Deposit Insurance Corporation or any other government agency.
| |
HSBC INVESTOR FAMILY OF FUNDS | 58 |
| | |
HSBC INVESTOR FAMILY OF FUNDS: | | CUSTODIAN |
| | The Northern Trust Company |
INVESTMENT ADVISER AND ADMINISTRATOR | | 50 South LaSalle Street |
HSBC Global Asset Management (USA) Inc. | | Chicago, IL 60603 |
452 Fifth Avenue | | |
New York, NY 10018 | | INDEPENDENT REGISTERED |
| | PUBLIC ACCOUNTING FIRM |
SHAREHOLDER SERVICING AGENTS | | KPMG LLP |
For HSBC Bank USA, N.A. and | | 191 West Nationwide Blvd. |
HSBC Securities (USA) Inc. Clients: | | Suite 500 |
HSBC Bank USA, N.A. | | Columbus, OH 43215 |
452 Fifth Avenue | | |
New York, NY 10018 | | LEGAL COUNSEL |
1-888-525-5757 | | Dechert LLP |
| | 1775 I Street, N.W. |
For All Other Shareholders: | | Washington, D.C. 20006 |
HSBC Investor Funds | | |
P.O. Box 182845 | | |
Columbus, OH 43218-2845 | | |
1-800-782-8183 | | |
| | |
TRANSFER AGENT AND SPONSOR | | |
Citi Fund Services | | |
3435 Stelzer Road | | |
Columbus, OH 43219 | | |
| | |
DISTRIBUTOR | | |
Foreside Distribution Services, L.P. | | |
690 Taylor Road, Suite 150 | | |
Gahanna, Ohio 43230-3202 | | |
The HSBC Investor Family of Funds are distributed by Foreside Distribution Services, L.P. This document must be preceded or accompanied by a current prospectus for the HSBC Investor Funds, which you should read carefully before you invest or send money.
�� | | | | |
— NOT FDIC INSURED | | — NO BANK GUARANTEE | | — MAY LOSE VALUE |

HSBC Global Asset Management (USA) Inc.
October 31st, 2008
HSBC Investor LifeLine FundsTM
Annual Report
HSBC Investor Aggressive Growth Strategy Fund
HSBC Investor Growth Strategy Fund
HSBC Investor Moderate Growth Strategy Fund
HSBC Investor Conservative Growth Strategy Fund
(This Page Intentionally Left Blank)
Barclays Capital U.S. Aggregate Index (formerly Lehman Brothers U.S. Aggregate Index) is an unmanaged index generally representative of investment-grade fixed-rate debt issues, including government, corporate, asset-backed, and mortgage-backed securities, with maturities of at least one year.
Barclays Capital Intermediate U.S. Aggregate Index (formerly Lehman Bros. U.S. Intermerdiate Aggregate Index) is an unmanaged index generally representative of investment-grade issues with maturities between three- and ten-years.
Citigroup U.S. Domestic Three Month Treasury Bill Index is government guaranteed and offers a fixed rate of return. Return and principal of stocks and bonds will vary with market conditions. Treasury bills are less volatile than longer-term fixed-income securities and are guaranteed as to timely payment of principal and interest by the U.S. Government.
Citigroup U.S. High Yield Market Capped Index, the “U.S. High Yield Market Capped Index” uses the U.S. High-Yield Market Index as its foundation imposing a cap on the par amount of each issuer in order to limit the impact of large issuers while retaining the characteristics of the issuer’s distribution across different maturities. The U.S. High-Yield Market Index captures the performance of below-investments-grade debt issued by corporations domiciled in the United States or Canada.
Gross Domestic Product (GDP) is the measure of the market value of the goods and services produced by labor and property in the United States.
Morgan Stanley Capital International Europe, Australasia and Far East (“MSCI EAFE”) Index is an unmanaged free float-adjusted market capitalization index that is designed to measure the equity market performance of developed markets, excluding the U.S. & Canada. As of June 2007 the MSCI EAFE Index consisted of the following 21 developed market country indices: Australia, Austria, Belgium, Denmark, Finland, France, Germany, Greece, Hong Kong, Ireland, Italy, Japan, the Netherlands, New Zealand, Norway, Portugal, Singapore, Spain, Sweden, Switzerland, and the United Kingdom.
The Russell Universe - Russell is a recognized leader in consulting, multi-manager investing and institutional investment management. Our consultants advise clients on more than $2 trillion in assets. We deliver investment programs to over 2,000 clients in 44 countries. With more than $230 billion in assets in our funds, Russell researchers meet with over 4,000 investment managers around the world to evaluate their investment process.
Russell 1000® Growth Index is an unmanaged index which measures the performance of the large-cap growth segment of the U.S. equity universe. It includes those Russell 1000 companies with higher price-to-book ratios and higher forecasted growth values.
Russell 1000® Value Index is an unmanaged index which measures the performance of the large-cap value segment of the U.S. equity universe. It includes those Russell 1000 companies with lower price-to-book ratios and lower expected growth values.
Russell 2000® Index is an unmanaged index which easures the performance of the 2,000 smallest companies in the Russell 3000 Index, which represents approximately 8% of the total market capitalization of the Russell 3000 Index. The companies which comprise this index have high price-to-book ratios and higher forecasted growth values.
Russell 2500™ Growth Index is an unmanaged index which measures the performance of the small to mid-cap growth segment of the U.S. equity universe. It includes those Russell 2500 companies with higher price-to-book ratios and higher forecasted growth values.
Standard & Poor’s (“S&P 500”) 500 Index is an unmanaged index that is widely regarded as a gauge of the U.S. equities market, this index includes 500 leading companies in leading industries of the U.S. economy. The S&P 500 focuses on the large cap segment of the market, with approximately 75% coverage of U.S. equities.
Securities indexes assume reinvestment of all distributions and interest payments and do not take in account brokerage fees or expenses. Securities in the Fund do not match those in the indexes and performance of the Fund will differ. Investors cannot invest directly in an index.
Dear Shareholder,
Over the past eighteen months, the financial markets have experienced arguably the most difficult conditions in recent history. The underlying causes of the market’s significant and persistent downturn have had devastating effects on corporations around the world. The value of equity, fixed income and even money market securities has all been affected by the slowing economy, decreasing corporate earnings and the lack of available credit to support business operations. Many organizations with renowned histories of success and profitability are now seeking government relief in order to remain solvent. The result has been significant double-digit losses for U.S. and international market indices over the past year.
During this period of extreme volatility, the HSBC Investor Funds (the “Funds”) were committed to offering sound, long-term investment solutions to investors. Now, more than ever, the Funds are diligently seeking and working with investment sub-advisers who can assist in navigating through this market environment. Moreover, the Board of Trustees is also aware that the Funds’ ability to execute shareholder instructions in an accurate and timely manner is also an important part of a fund’s overall performance. In performing its oversight role, the Board continuously attempts to maintain the highest level of responsiveness to shareholders.
Recognizing its responsibility to shareholders, the Board considers a wide range of factors including relative expertise and the financial viability in selecting the Funds’ service providers. We believe that aligning the Funds’ interests with strong partners provides a tangible benefit to shareholders, now and in the future.
We understand that these are extremely challenging times in the financial markets. We remain committed to managing the HSBC Investor Funds in a prudent and consistent manner for long-term performance.
For further market insight and investment results for the Funds, please see our portfolio manager commentary in this Annual Report.
Thank you for your investment in the HSBC Investor Funds.
Sincerely,

Larry M. Robbins, Chairman, HSBC Investor Funds
| |
1 | HSBC INVESTOR FAMILY OF FUNDS |
|
Commentary From the Investment Manager |
|
HSBC Global Asset Management (USA) Inc.
U.S. Economic Review
The 12-month period from November 1, 2007 through October 31, 2008 was extraordinarily challenging for the U.S. economy and the global financial system. Over the course of this period, a growing number of signs indicated that the health of the economy was deteriorating and the risk of a recession was rising. In addition, a number of financial institutions faced serious problems and incurred heavy financial losses that threatened their ability to operate.
These issues largely stemmed from the housing market’s prolonged downturn. Rising default rates on subprime mortgages during the period generated huge losses for a wide variety of global financial institutions, which had invested heavily in securities that were backed by those risky mortgages. The losses were so severe that they eventually resulted in the collapse of Bear Sterns, Lehman Brothers and others, the nationalization of Fannie Mae and Freddie Mac, the failure of some banks and the forced mergers of several financial institutions. In that environment, lenders became suspicious of borrowers’ financial health and significantly reduced their willingness to lend money. The result was a crisis that effectively froze the credit markets and depressed economic growth.
The economic slowdown and declining home prices were particularly hard on consumers, who account for approximately two-thirds of U.S. economic activity. Retail sales fell sharply, real personal incomes declined, unemployment rose to its highest levels in years and consumer confidence plummeted. Corporate profits declined and U.S. Gross Domestic Product1 growth fell during two of the past four quarters (through the third quarter of 2008).
Problems in the U.S. economy spread overseas, creating fears of a global economic downturn. Consensus 2009 forecasts for economic growth in Europe and Asia declined during the third quarter, driven lower by factors such as falling business activities and confidence.
Aggressive steps were taken during the period to stabilize the credit markets and respark the economy. For example, the Federal Reserve Board (the “Fed”) cut its target short-term interest rate, the federal funds rate, from 4.50% in November to 1.00% by the end of October in an effort to inject liquidity into the markets. The Fed also established and increased auction lending facilities. Additionally, the U.S. government began implementing a $700 billion financial bailout package, and helped engineer the rescue of several large financial institutions and guaranteed senior debt issued by banks. Governments in Europe and Asia adopted similar strategies to improve sentiment and ease the strains in their financial systems.
The weak economy did have some relatively positive consequences. Energy prices, which had risen sharply during the first half of the period as the price of oil soared to record highs, fell significantly during later months. Falling commodity prices also reduced inflationary pressures, giving central banks around the world a greater ability to target their monetary policy to support growth, liquidity and financial market stability.
Market Review
The U.S. stock market was extremely volatile during the period as investors reacted strongly to new developments in the economy, the housing sector and the financial markets. Investors during most of the period fled from stocks into assets that were perceived to be safer, such as high-quality government bonds and cash. The S&P 500 Index1 returned -36.08% for the 12-month period ended October 31, 2008. Small-company stocks, represented by the Russell 2000® Index1, returned
-34.16%.
Shares of financial services firms suffered particularly large declines during the period due to the turmoil in the credit and banking system and concerns that more problems could occur if the subprime mortgage crisis spread. Consumer discretionary stocks also posted significant losses as increasingly nervous consumers cut their spending on non-essential items. Investors also shunned shares of auto-related companies, which faced critical credit shortages and an uncertain future.
The energy sector posted strong returns during the first half of the period as the price of oil and other commodities rose, but lagged later in the period as oil prices fell sharply. Conversely, health care stocks outperformed the overall market, especially as economic conditions worsened during the final months of the period.
Foreign stocks also delivered negative returns, as banks worldwide suffered from their exposure to problem assets related to the mortgage industry and the outlook for global economic growth worsened. The MSCI EAFE Index1 of developed foreign stock markets returned -46.34% during the period. Emerging markets stocks also suffered as investors avoided the perceived riskiness of developing markets in favor of assets they believed to be more stable. Falling commodity prices during the second half of the period also hurt some emerging economies, which are heavily dependent on commodity exports.
The Barclays Capital U.S. Aggregate Index1, which tracks the broad fixed-income markets, returned 0.3% for the period. High-quality government bonds, such as those issued by the U.S. Treasury, performed well as investors seeking to avoid risk fled into these securities. The rally pushed yields for government bonds lower, particularly among short-term fixed-income securities. Investors favored shorter maturities as they focused on liquidity and safety during the period of heightened market volatility. Other types of fixed-income securities—including corporate bonds and high-yield bonds—performed poorly, as investors favored the stability of government-backed bonds and worried about companies’ ability to fulfill their debt obligations in a weak economic environment. As a result, the spread between yields on government securities and corporate bonds widened substantially.
| |
1 | For additional information, please refer to the Glossary of Terms. |
| |
HSBC INVESTOR FAMILY OF FUNDS | 2 |
|
Portfolio Reviews |
|
HSBC Investor Aggressive Growth Strategy Fund
HSBC Investor Growth Strategy Fund
HSBC Investor Moderate Growth Strategy Fund
HSBC Investor Conservative Growth Strategy Fund |
Investment Concerns
Common stocks, and funds investing in common stocks, generally provide greater return potential when compared with other types of investments.
Equity securities (stocks) are more volatile and carry more risk than other forms of investments, including investments in high-grade fixed income securities. The net asset value per share of this Fund will fluctuate as the value of the securities in the portfolio changes.
There are risks associated with investing in foreign companies, such as erratic market conditions, economic and political instability and fluctuations in currency and exchange rates.
Value-based investments are subject to the risk that the broad market may not recognize their intrinsic value.
Small capitalization funds typically carry additional risks, since smaller companies generally have a higher risk of failure and historically have experienced a greater degree of market volatility than average. There are risks associated with investing in a fund that invests in securities of foreign countries, such as erratic market conditions, economic and political instabilities and fluctuations in currency exchanges.
Bonds offer a relatively stable level of income, although bond prices will fluctuate providing the potential for principal gain or loss. Intermediate-term, higher-quality bonds generally offer less risk than longer-term bonds and a lower rate of return.
The mortgage market in the U.S. recently experienced difficulties that may adversely affect the performance and market value of certain mortgage-related investments.
An investment in money market funds is not insured or guaranteed by the FDIC or any other government agency. Although the money market funds seek to preserve the value of your investment at $1.00.
The HSBC Investor Funds feature a number of funds that are structured as “master/feeder” funds. Under this two-tier structure, one fund (the “feeder fund”) invests all of its investable assets in a second fund (the “master fund”). The LifeLine Funds, through this master/feeder structure, provide an asset allocation option to investors who seek to diversify their investment across a variety of asset classes. Each LifeLine Fund provides an asset allocation option corresponding to different investment objectives and risk tolerances. Each LifeLine Fund is a feeder fund. However, unlike most feeder funds, a LifeLine Fund will not direct all of its assets to a single master fund. Instead, the LifeLine Fund will allocate its assets to different master funds in accordance with its asset allocation model. HSBC Global Asset Management (USA) Inc. (the “Adviser”), according to specific target allocations, invested each LifeLine Fund’s assets in some or all of the following master funds (“underlying Portfolios”):
HSBC Investor Growth Portfolio (“Growth Portfolio”); HSBC Investor Value Portfolio (“Value Portfolio”); HSBC Investor Opportunity Portfolio (“Small Cap Equity Portfolio”); HSBC Investor International Equity Portfolio (“International Equity Portfolio”); HSBC Investor Core Plus Fixed Income Portfolio (“Core Plus Fixed Income Portfolio”); HSBC Investor High Yield Fixed Income Portfolio (High Yield Fixed Income Fund); HSBC Investor Intermediate Duration Fixed Income Portfolio (“Intermediate Duration Fixed Income Portfolio”); and the HSBC Investor Money Market Fund (“Money Market Fund”).
| |
3 | HSBC INVESTOR FAMILY OF FUNDS |
During the last period, each LifeLine Fund invested in a different combination of the underlying Portfolios according to the various target percentage weightings selected by the Adviser, approximately as set forth in the table below.
| | | | | | | | | | | | | |
Underlying Portfolio | | HSBC Investor
Aggressive Growth
Strategy
Fund | | HSBC Investor
Growth
Strategy
Fund | | HSBC Investor
Moderate Growth
Strategy
Fund | | HSBC Investor
Conservative Growth
Strategy
Fund | |
|
|
|
|
|
|
|
|
|
|
Prime Money Market Fund | | 1 | % | | 1 | % | | 6 | % | | 21 | % | |
|
|
|
|
|
|
|
|
|
|
|
|
|
|
Core Plus Fixed Income Portfolio | | None | | | 15 | % | | 26 | % | | 25 | % | |
|
|
|
|
|
|
|
|
|
|
|
|
|
|
High Yield Fixed Income Portfolio | | None | | | 2 | % | | 5 | % | | 8 | % | |
|
|
|
|
|
|
|
|
|
|
|
|
|
|
Intermediate Duration Fixed Income Portfolio | | None | | | None | | | None | | | 3 | % | |
|
|
|
|
|
|
|
|
|
|
|
|
|
|
Growth Portfolio | | 21 | % | | 21 | % | | 19 | % | | 15 | % | |
|
|
|
|
|
|
|
|
|
|
|
|
|
|
International Equity Portfolio | | 23 | % | | 20 | % | | 15 | % | | 10 | % | |
|
|
|
|
|
|
|
|
|
|
|
|
|
|
Opportunity Portfolio | | 34 | % | | 20 | % | | 11 | % | | 4 | % | |
|
|
|
|
|
|
|
|
|
|
|
|
|
|
Value Portfolio | | 21 | % | | 21 | % | | 18 | % | | 14 | % | |
|
|
|
|
|
|
|
|
|
|
|
|
|
|
Total: | | 100 | % | | 100 | % | | 100 | % | | 100 | % | |
|
|
|
|
|
|
|
|
|
|
|
|
|
|
| |
HSBC INVESTOR FAMILY OF FUNDS | 4 |
HSBC Investor Aggressive Growth Strategy Fund
|
Value of a $10,000 Investment |
|
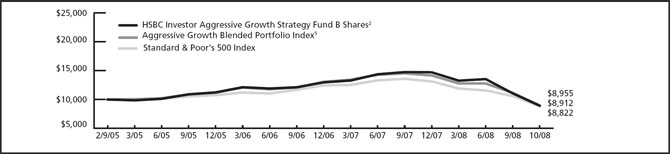
The charts above represent a comparison of a hypothetical $10,000 investment in the indicated share class versus a similar investment in the Funds’ benchmark and represents the reinvestment of dividends and capital gains in the Funds. The above Indexes and Benchmarks are for the period beginning 1/31/05.
| | | | | | | | | | | | | |
Fund Performance | | | | Average Annual
Total Return (%) | | Expense
Ratio (%)4 | |
|
|
|
|
|
|
|
|
As of October 31, 2008 | | Inception
Date | | 1
Year | | 3
Year | | Since
Inception | | Gross | | Net | |
|
|
|
|
|
|
|
|
|
|
|
|
|
|
HSBC Investor Aggressive Growth Strategy Fund Class A1 | | 2/14/05 | | -43.88 | | -6.12 | | -3.49 | | 2.27 | | 1.50 | |
|
|
|
|
|
|
|
|
|
|
|
|
|
|
HSBC Investor Aggressive Growth Strategy Fund Class B2 | | 2/9/05 | | -43.56 | | -5.82 | | -3.05 | | 3.02 | | 2.25 | |
|
|
|
|
|
|
|
|
|
|
|
|
|
|
HSBC Investor Aggressive Growth Strategy Fund Class C3 | | 6/10/05 | | -41.87 | | -5.17 | | -3.07 | | 3.02 | | 2.25 | |
|
|
|
|
|
|
|
|
|
|
|
|
|
|
Standard & Poor’s 500 Index | | — | | -36.08 | | -5.21 | | N/A | | N/A | | N/A | |
|
|
|
|
|
|
|
|
|
|
|
|
|
|
Aggressive Growth Blended Portfolio Index5 | | — | | -40.14 | | -5.45 | | N/A | | N/A | | N/A | |
|
|
|
|
|
|
|
|
|
|
|
|
|
|
Past performance does not guarantee future results. The performance data quoted represents past performance and current returns may be lower or higher. Total return figures include change in share price, reinvestment of dividends and capital gains and do not reflect the taxes that a shareholder would pay on fund distributions or on the redemption of fund shares. The investment return and principal value will fluctuate so that an investor’s shares, when redeemed may be worth more or less than the original cost. To obtain performance information current to the most recent month end, please call 1-800-782-8183.
The performance above reflects any fee waivers that have been in effect during the applicable periods, as well as any expense reimbursements that have periodically been made. Absent such waivers and reimbursements, returns would have been lower. Currently, contractual fee waivers are in effect from March 1, 2008 through March 1, 2009.
During the year ended October 31, 2008, the respective Portfolios the Fund invests in received monies related to certain nonrecurring litigation settlements. Without the receipt of this payment, the returns for the applicable periods would have been lower.
| |
1 | Reflects the maximum sales charge of 5.00%. |
| |
2 | Reflects the applicable contingent deferred sales charge, maximum of 4.00%. |
| |
3 | Reflects the applicable contingent deferred sales charge, maximum of 1.00%. |
| |
4 | Reflects the expense ratio as reported in the prospectus dated February 28, 2008. |
| |
5 | The performance of the HSBC Investor Aggressive Growth Strategy Fund is compared to a Blended Portfolio Index, which is a hypothetical combination of broad-based indexes. The components of the Blended Portfolio Index and their weighting are as follows: The Citigroup U.S. Domestic Three-Month T-Bill Index (1%); Russell 1000® Growth Index (21%); Russell 1000® Value Index (21%); Russell 2500™ Growth Index (34%) and the MSCI EAFE Index (23%). These indices are unmanaged and do not reflect the expenses associated with a mutual fund, such as investment management and fund accounting fees. The Fund’s performance reflects the deduction of fees for these value-added services. Investors cannot invest directly in an index. For a complete definition of the above referenced indices, please refer to the Glossary of Terms. |
| |
5 | HSBC INVESTOR FAMILY OF FUNDS |
HSBC Investor Growth Strategy Fund
|
Value of a $10,000 Investment |
|
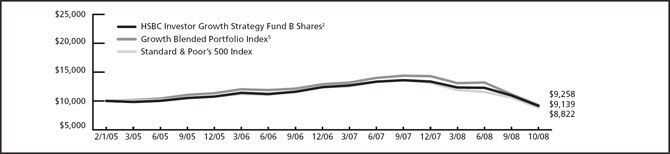
The charts above represent a comparison of a hypothetical $10,000 investment in the indicated share class versus a similar investment in the Funds’ benchmark and represents the reinvestment of dividends and capital gains in the Funds. The above Indexes and Benchmarks are for the period beginning 1/31/05.
| | | | | | | | | | | | | |
Fund Performance | | | | Average Annual
Total Return (%) | | Expense
Ratio (%)4 | |
|
|
|
|
|
|
|
|
As of October 31, 2008 | | Inception
Date | | 1
Year | | 3
Year | | Since
Inception | | Gross | | Net | |
|
|
|
|
|
|
|
|
|
|
|
|
|
|
HSBC Investor Growth Strategy Fund Class A1 | | 2/8/05 | | -39.63 | | -5.52 | | -2.69 | | 1.65 | | 1.50 | |
|
|
|
|
|
|
|
|
|
|
|
|
|
|
HSBC Investor Growth Strategy Fund Class B2 | | 2/1/05 | | -39.34 | | -5.25 | | -2.04 | | 2.40 | | 2.25 | |
|
|
|
|
|
|
|
|
|
|
|
|
|
|
HSBC Investor Growth Strategy Fund Class C3 | | 4/27/05 | | -37.54 | | -4.62 | | -1.78 | | 2.40 | | 2.25 | |
|
|
|
|
|
|
|
|
|
|
|
|
|
|
Standard & Poor’s 500 Index | | — | | -36.08 | | -5.21 | | N/A | | N/A | | N/A | |
|
|
|
|
|
|
|
|
|
|
|
|
|
|
Growth Blended Portfolio Index5 | | — | | -34.39 | | -3.86 | | N/A | | N/A | | N/A | |
|
|
|
|
|
|
|
|
|
|
|
|
|
|
Past performance does not guarantee future results. The performance data quoted represents past performance and current returns may be lower or higher. Total return figures include change in share price, reinvestment of dividends and capital gains and do not reflect the taxes that a shareholder would pay on fund distributions or on the redemption of fund shares. The investment return and principal value will fluctuate so that an investor’s shares, when redeemed may be worth more or less than the original cost. To obtain performance information current to the most recent month end, please call 1-800-782-8183.
The performance above reflects any fee waivers that have been in effect during the applicable periods, as well as any expense reimbursements that have periodically been made. Absent such waivers and reimbursements, returns would have been lower. Currently, contractual fee waivers are in effect from March 1, 2008 through March 1, 2009.
During the years ended October 31, 2007, and 2008, the respective Portfolios the Fund invests in received monies related to certain nonrecurring litigation settlements. Without the receipt of this payment, the returns for applicable periods would have been lower.
| |
1 | Reflects the maximum sales charge of 5.00%. |
| |
2 | Reflects the applicable contingent deferred sales charge, maximum of 4.00%. |
| |
3 | Reflects the applicable contingent deferred sales charge, maximum of 1.00%. |
| |
4 | Reflects the expense ratio as reported in the prospectus dated February 28, 2008. |
| |
5 | The performance of the HSBC Investor Growth Strategy Fund is compared to a Blended Portfolio Index, which is a hypothetical combination of broad-based indexes. The components of the Blended Portfolio Index and their weighting are as follows: The Citigroup U.S. Domestic Three-Month T-Bill Index (1%); Barclays Capital U.S. Aggregate Index (formerly Lehman Brothers U.S. Aggregate Index) (15%); Citigroup U.S. High Yield Market Capped Index (2%); Russell 1000® Growth Index (21%); Russell 1000® Value Index (21%); Russell 2500™ Growth Index (20%) and the MSCI EAFE Index (20%). The stated performance for the Blended Index from April 30, 2006 to February 28, 2008 reflects a 2% allocation for the Merrill Lynch U.S. High Yield Master II Index. On February 29, 2008, the Merrill Lynch U.S. High Yield Master II Index was replaced with the Citigroup U.S. High Yield Market Capped Index. These indices are unmanaged and do not reflect the expenses associated with a mutual fund, such as investment management and fund accounting fees. The Fund’s performance reflects the deduction of fees for these value-added services. Investors cannot invest directly in an index. For a complete definition of the above referenced indices, please refer to the Glossary of Terms. |
| |
HSBC INVESTOR FAMILY OF FUNDS | 6 |
HSBC Investor Moderate Growth Strategy Fund
|
Value of a $10,000 Investment |
|
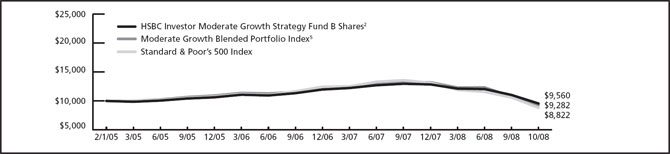
The charts above represent a comparison of a hypothetical $10,000 investment in the indicated share class versus a similar investment in the Funds’ benchmark and represents the reinvestment of dividends and capital gains in the Funds. The above Indexes and Benchmarks are for the period beginning 1/31/05.
| | | | | | | | | | | | | |
Fund Performance | | | | Average Annual
Total Return (%) | | Expense
Ratio (%)4 | |
|
|
|
|
|
|
|
|
As of October 31, 2008 | | Inception
Date | | 1
Year | | 3
Year | | Since
Inception | | Gross | | Net | |
|
|
|
|
|
|
|
|
|
|
|
|
|
|
HSBC Investor Moderate Growth Strategy Fund Class A1 | | 2/3/05 | | -34.12 | | -4.62 | | -2.49 | | 1.60 | | 1.50 | |
|
|
|
|
|
|
|
|
|
|
|
|
|
|
HSBC Investor Moderate Growth Strategy Fund Class B2 | | 2/1/05 | | -33.79 | | -4.33 | | -1.97 | | 2.35 | | 2.25 | |
|
|
|
|
|
|
|
|
|
|
|
|
|
|
HSBC Investor Moderate Growth Strategy Fund Class C3 | | 6/10/05 | | -31.74 | | -3.69 | | -2.48 | | 2.35 | | 2.25 | |
|
|
|
|
|
|
|
|
|
|
|
|
|
|
Standard & Poor’s 500 Index | | — | | -36.08 | | -5.21 | | N/A | | N/A | | N/A | |
|
|
|
|
|
|
|
|
|
|
|
|
|
|
Moderate Growth Blended Portfolio Index5 | | — | | -27.70 | | -2.28 | | N/A | | N/A | | N/A | |
|
|
|
|
|
|
|
|
|
|
|
|
|
|
Past performance does not guarantee future results. The performance data quoted represents past performance and current returns may be lower or higher. Total return figures include change in share price, reinvestment of dividends and capital gains and do not reflect the taxes that a shareholder would pay on fund distributions or on the redemption of fund shares. The investment return and principal value will fluctuate so that an investor’s shares, when redeemed may be worth more or less than the original cost. To obtain performance information current to the most recent month end, please call 1-800-782-8183.
The performance above reflects any fee waivers that have been in effect during the applicable periods, as well as any expense reimbursements that have periodically been made. Absent such waivers and reimbursements, returns would have been lower. Currently, contractual fee waivers are in effect from March 1, 2008 through March 1, 2009.
During the years ended October 31, 2007 and 2008, the respective Portfolios the Fund invests in received monies related to certain nonrecurring litigation settlements. Without the receipt of this payment, the returns for applicable periods would have been lower.
| |
1 | Reflects the maximum sales charge of 5.00%. |
| |
2 | Reflects the applicable contingent deferred sales charge, maximum of 4.00%. |
| |
3 | Reflects the applicable contingent deferred sales charge, maximum of 1.00%. |
| |
4 | Reflects the expense ratio as reported in the prospectus dated February 28, 2008. |
| |
5 | The performance of the HSBC Investor Moderate Growth Strategy Fund is compared to a Blended Portfolio Index, which is a hypothetical combination of broad-based indexes. The components of the Blended Portfolio Index and their weighting are as follows: The Citigroup U.S. Domestic Three-Month T-Bill Index (6%); Citigroup U.S. High Yield Market Capped Index (5%); Barclays Capital U.S. Aggregate Index (formerly Lehman Brothers U.S. Aggregate Index) (26%); Russell 1000® Growth Index (19%); Russell 1000® Value Index (18%); Russell 2500™ Growth Index (11%) and the MSCI EAFE Index (15%). The stated performance for the Blended Index from April 30, 2006 to February 28, 2008 reflects a 5% allocation for the Merrill Lynch U.S. High Yield Master II Index. On February 29, 2008, the Merrill Lynch U.S. High Yield Master II Index was replaced with the Citigroup U.S. High Yield Market Capped Index. These indices are unmanaged and do not reflect the expenses associated with a mutual fund, such as investment management and fund accounting fees. The Fund’s performance reflects the deduction of fees for these value-added services. Investors cannot invest directly in an index. For a complete definition of the above referenced indices, please refer to the Glossary of Terms. |
| |
7 | HSBC INVESTOR FAMILY OF FUNDS |
HSBC Investor Conservative Growth Strategy Fund
|
Value of a $10,000 Investment |
|
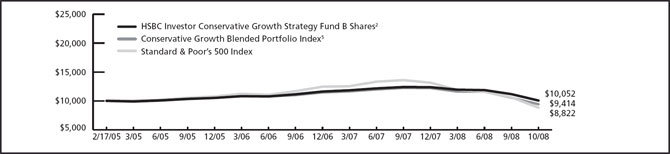
The charts above represent a comparison of a hypothetical $10,000 investment in the indicated share class versus a similar investment in the Funds’ benchmark and represents the reinvestment of dividends and capital gains in the Funds. The above Indexes and Benchmarks are for the period beginning 1/31/05.
| | | | | | | | | | | | | |
Fund Performance | | | | Average Annual
Total Return (%) | | Expense
Ratio (%)4 | |
|
|
|
|
|
|
|
|
As of October 31, 2008 | | Inception
Date | | 1
Year | | 3
Year | | Since
Inception | | Gross | | Net | |
|
|
|
|
|
|
|
|
|
|
|
|
|
|
HSBC Investor Conservative Growth Strategy Fund Class A1 | | 2/23/05 | | -26.99 | | -3.30 | | -1.93 | | 2.06 | | 1.50 | |
|
|
|
|
|
|
|
|
|
|
|
|
|
|
HSBC Investor Conservative Growth Strategy Fund Class B2 | | 2/17/05 | | -26.69 | | -2.92 | | -1.62 | | 2.81 | | 2.25 | |
|
|
|
|
|
|
|
|
|
|
|
|
|
|
HSBC Investor Conservative Growth Strategy Fund Class C3 | | 4/19/05 | | -24.47 | | -2.16 | | -0.72 | | 2.81 | | 2.25 | |
|
|
|
|
|
|
|
|
|
|
|
|
|
|
Standard & Poor’s 500 Index | | — | | -36.08 | | -5.21 | | N/A | | N/A | | N/A | |
|
|
|
|
|
|
|
|
|
|
|
|
|
|
Conservative Growth Blended Portfolio Index5 | | — | | -20.06 | | -0.54 | | N/A | | N/A | | N/A | |
|
|
|
|
|
|
|
|
|
|
|
|
|
|
Past performance does not guarantee future results. The performance data quoted represents past performance and current returns may be lower or higher. Total return figures include change in share price, reinvestment of dividends and capital gains and do not reflect the taxes that a shareholder would pay on fund distributions or on the redemption of fund shares. The investment return and principal value will fluctuate so that an investor’s shares, when redeemed may be worth more or less than the original cost. To obtain performance information current to the most recent month end, please call 1-800-782-8183.
The performance above reflects any fee waivers that have been in effect during the applicable periods, as well as any expense reimbursements that have periodically been made. Absent such waivers and reimbursements, returns would have been lower. Currently, contractual fee waivers are in effect from March 1, 2008 through March 1, 2009.
During the years ended October 31, 2007 and 2008, the respective Portfolios the Fund invests in received monies related to certain nonrecurring litigation settlements. Without the receipt of this payment, the returns for applicable periods would have been lower.
| |
1 | Reflects the maximum sales charge of 5.00%. |
| |
2 | Reflects the applicable contingent deferred sales charge, maximum of 4.00%. |
| |
3 | Reflects the applicable contingent deferred sales charge, maximum of 1.00%. |
| |
4 | Reflects the expense ratio as reported in the prospectus dated February 28, 2008. |
| |
5 | The performance of the HSBC Investor Conservative Growth Strategy Fund is compared to a Blended Portfolio Index, which is a hypothetical combination of broad-based indexes. The components of the Blended Portfolio Index and their weighting are as follows: The Citigroup U.S. Domestic 3-Month T-Bill Index (21%); Citigroup U.S. High Yield Market Capped Index (8%); Barclays Capital U.S. Aggregate Index (formerly Lehman Bros. U.S. Aggregate Index) (25%); Barclays Capital U.S. Interm. Aggregate Index (formerly Lehman Bros. U.S. Interm. Aggregate Index) (3%); Russell 1000® Growth Index (15%); Russell 1000® Value Index (14%); Russell 2500™ Growth Index (4%) and the MSCI EAFE Index (10%). The stated performance for the Blended Index from April 30, 2006 to February 28, 2008 reflects an 8% allocation for the Merrill Lynch U.S. High Yield Master II Index. On February 29, 2008, the Merrill Lynch U.S. High Yield Master II Index was replaced with the Citigroup U.S. High Yield Market Capped Index. These indices are unmanaged and do not reflect the expenses associated with a mutual fund, such as investment management and fund accounting fees. The Fund’s performance reflects the deduction of fees for these value-added services. Investors cannot invest directly in an index. For a complete definition of the above referenced indices, please refer to the Glossary of Terms. |
| |
HSBC INVESTOR FAMILY OF FUNDS | 8 |
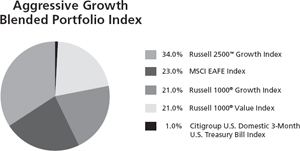
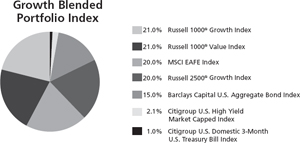
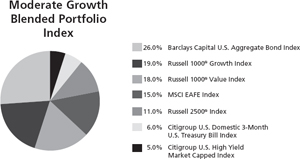
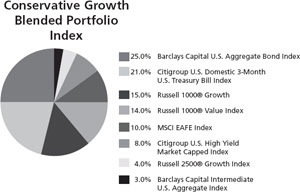
| | | |
|
|
|
|
Standardized Performance Benchmark Indices for the
period ended October 31, 2008 | | 1
Year (%) | |
|
|
|
|
Citigroup U.S. Domestic 3-Month U.S. Treasury Bill Index | | 2.31 | |
Citigroup U.S. High Yield Market Capped Index | | -24.05 | |
Barclays Capital U.S. Aggregate Index | | 0.30 | |
Barclays Capital Intermediate U.S. Aggregate Index | | 1.48 | |
MSCI EAFE Index | | -46.34 | |
Russell 1000® Growth Index | | -36.95 | |
Russell 1000® Value Index | | -36.80 | |
Russell 2500™ Growth Index | | -41.00 | |
Citigroup U.S. Domestic 3-Month U.S. Treasury Bill Index is government guaranteed and offers a fixed rate of return. Return and principal of stocks and bonds will vary with market conditions. Treasury bills are less volatile than longer-term fixed-income securities and are guaranteed as to timely payment of principal and interest by the U.S. Government.
Citigroup U.S. High Yield Market Capped Index uses the U.S. High-Yield Market Index as its foundation imposing a cap on the par amount of each issuer in order to limit the impact of large issuers while retaining the characteristics of the issuer’s distribution across different maturities. The U.S. High-Yield Market Index captures the performance of below-investments-grade debt issued by corporations domiciled in the United States or Canada.
Barclays Capital U.S. Aggregate Index (formerly Lehman Brothers U.S. Aggregate Index) is an unmanaged index generally representative of the investment-grade debt issues with at least one year to final maturity.
Barclays Capital Intermediate U.S. Aggregate Index (formerly Lehman Brothers Intermediate U.S. Aggregate Index) is an unmanaged index market value-weighted performance benchmark for investment-grade fixed-rate debt issues, including government, corporate, asset-backed, and mortgage-backed securities, with maturities of at least one year.
Morgan Stanley Capital International Europe, Australasia and Far East Index (MSCI EAFE) is an unmanaged free float-adjusted market capitalization index that is designed to measure the equity market performance of developed markets, excluding the U.S. & Canada. As of June 2007 the MSCI EAFE Index consisted of the following 21 developed market country indices: Australia, Austria, Belgium, Denmark, Finland, France, Germany, Greece, Hong Kong, Ireland, Italy, Japan, the Netherlands, New Zealand, Norway, Portugal, Singapore, Spain, Sweden, Switzerland, and the United Kingdom.
Russell 1000® Growth Index is an unmanaged index which measures the performance of the large-cap growth segment of the U.S. equity universe. It includes those Russell 1000 companies with higher price-to-book ratios and higher forecasted growth values.
Russell 1000® Value Index is an unmanaged index which measures the performance of the large-cap value segment of the U.S. equity universe. It includes those Russell 1000 companies with lower price-to-book ratios and lower expected growth values.
Russell 2500™ Growth Index is an unmanaged index which measures the performance of the small to mid-cap growth segment of the U.S. equity universe. It includes those Russell 2500 companies with higher price-to-book ratios and higher forecasted growth values.
| |
9 | HSBC INVESTOR FAMILY OF FUNDS |
| |
| Portfolio Reviews |
|
|
|
HSBC Investor Prime Money Market Fund | Moody’s and Standard & Poor’s |
| has assigned an “Aaa” and “AAAm” |
| rating to the HSBC Investor Prime |
by John Chiodi | Money Market Fund.1 |
Senior Portfolio Manager |
|
Investment Concerns
An investment in the fund is not insured or guaranteed by the FDIC or any other government agency. Although the fund seeks to preserve the value of your investment at $1.00 per share, it is possible to lose money by investing in the fund.
The money markets experienced a turbulent environment during the 12-month period under review, as rising defaults on subprime mortgages brought on a credit and liquidity crisis. The Federal Reserve Board (the “Fed”) attempted to address the financial system’s problems by lowering its target short-term interest rate from 4.50% to 1.00% between November 2007 and October 2008, causing yields on money market securities to decline.
We sought to protect shareholders’ principal in this uncertain environment. In particular, we sacrificed some yield in exchange for increased liquidity during periods of extreme stress in the money markets. We favored intermediate-term assets to help offset the effect of falling rates on the Fund’s yield while also meeting our conservative liquidity goals. As the markets settled somewhat during the fiscal third quarter, we took advantage of strategic opportunities to capture higher yields available on longer-term securities. Additionally, we took advantage of a program by the U.S. Treasury to insure money market funds.†
We also looked to safeguard shareholder assets by increasing our position in government securities. This strategy also reduced the Fund’s yield, but provided greater security as the credit and liquidity crisis roiled the money markets.*
| |
* | Portfolio composition is subject to change. |
| |
† | On October 7, 2008 and December 4, 2008 the Fund participated in the Treasury Money Market Guarantee Program and related extension. The Program is for shareholders as of September 19, 2008 and generally covers the lesser of the amount that the shareholder held on September 19 or the amount they hold on the date the fund needs to utilize the guarantee. If a shareholder closes their account with the Fund or broker dealer after September 19, any future investment in the Fund will not be guaranteed. The extended guarantee is through April 30, 2009, but may be further extended at the Treasury’s discretion. |
Past performance does not guarantee future results. The performance data quoted represents past performance and current returns may be lower or higher. Total return figures include change in share price, reinvestment of dividends and capital gains and do not reflect taxes that a shareholder would pay on fund distributions or on the redemption of fund shares. The investment return and principal value will fluctuate so that an investor’s shares, when redeemed may be worth more or less than the original cost. To obtain performance information current to the most recent month end, please call 1-800-782-8183.
| |
HSBC INVESTOR FAMILY OF FUNDS | 10 |
|
Portfolio Reviews |
|
HSBC Investor Core Plus Fixed Income Portfolio |
by Halbis Capital Management (USA) Inc., U.S. Core Fixed Income Team |
The HSBC Investor Fixed Income Fund (the “Portfolio”) seeks to maximize total return, consistent with reasonable risk. The “total return” sought by the Fund consists of income earned on investments, plus capital appreciation, if any, which generally arises from decreases in interest rates or improving credit fundamentals for a particular sector or security. The Portfolio employs Halbis Capital Management (USA) Inc. as subadviser to the Portfolio.
Investment Concerns
Bonds offer a relatively stable level of income, although bond prices will fluctuate providing the potential for principal gain or loss. Intermediate-term, higher-quality bonds generally offer less risk than longer-term bonds and a lower rate of return.
The mortgage market in the U.S. recently experienced difficulties that may adversely affect the performance and market value of certain mortgage-related investments.
Market Commentary
The period was marked by a worsening of the credit crisis, which led to the failure of several financial institutions as well as federal bailouts for select banks and insurers. Liquidity in the credit markets and money markets evaporated in that environment, which led to a standstill in investment activity. Investors during the period favored the relative safety of Treasury securities and shunned all other fixed-income securities. Sector exposure in anything other than Treasury securities resulted in negative returns.
The main driver of the Fund’s underperformance relative to its benchmarks was its overweight positions in mortgage-backed and corporate securities. Our strategy of emphasizing various types of “spread” bonds—bonds that offer higher yields than Treasuries—is designed to provide shareholders with greater income over time. Although these securities offered attractive yields relative to Treasury bonds, they performed poorly as investors flocked to Treasuries and avoided other sectors of the bond market.*
For much of the period, the Fund focused on intermediate-term securities and maintained a duration slightly longer than that of its benchmarks. That strategy benefited the fund as such securities offered more attractive yields shorter-term issues.*
| |
* | Portfolio composition is subject to change. |
Past performance does not guarantee future results. The performance data quoted represents past performance and current returns may be lower or higher. Total return figures include change in share price, reinvestment of dividends and capital gains and do not reflect taxes that a shareholder would pay on fund distributions or on the redemption of fund shares. The investment return and principal value will fluctuate so that an investor’s shares, when redeemed may be worth more or less than the original cost. To obtain performance information current to the most recent month end, please call 1-800-782-8183.
| |
11 | HSBC INVESTOR FAMILY OF FUNDS |
|
Portfolio Reviews |
|
HSBC Investor High Yield Fixed Income Portfolio |
by Halbis Capital Management (USA) Inc., High Yield Team |
The HSBC Investor High Yield Fixed Income Portfolio (the “Portfolio”) seeks to provide a high level of current income and capital appreciation. HSBC Global Asset Management (USA) Inc. serves as investment adviser to the Fund. The Halbis High Yield Team provides the day to day management of the portfolio. The Team’s philosophy is focused on delivering sustainable value added performance in the high yield fixed income market. The investment approach is a combination of top-down sector/ industry selection and bottom-up security/quality selection. The team rotates sectors and themes within the high yield universe during different market environments seeking to add value, endeavoring to take advantage of market inefficiencies in order to outperform in both up and down markets. The Portfolio employs Halbis Capital Management (USA) Inc. as subadviser to the Portfolio.
Investment Concerns
Bond funds will tend to experience smaller fluctuations in value than stock funds. However, investors in any bond fund should anticipate fluctuations in price, especially for longer-term issues and in environments of rising interest rates. High yield bonds are subject to greater risks than investment grade bonds, such as the increased risk of default because of the lower credit quality of the issues.
Market Commentary
High-yield bonds performed poorly during the period under review, which was characterized by a severe economic slowdown and a deepening credit crisis that led to unprecedented moves by the U.S. government to attempt to shore up the economy and the financial system. Investors in that environment flocked to Treasury securities with extremely high levels of liquidity and safety, and shunned high-yield bonds due to fears that the companies issuing such bonds would default on their obligations. In addition, liquidity in the high-yield market was often extremely tight, making it difficult to buy and sell securities.
The Fund’s performance remained relatively in line or slightly under its benchmark indices during the period which was the result of several key strategies. Our decision to underweight the homebuilding, building products and financial sectors contributed to strong relative performance, as these industries suffered due to the weak economy, the credit crisis and the prolonged downturn in the housing market. We also overweighted the energy and utilities sectors. Energy prices soared during the first half of the period, and energy companies remained healthy despite a downturn in energy prices during the second half of the period. Additionally, we increased the Fund’s overall credit quality whenever possible. That benefited performance as investors favored higher-quality bonds.*
The Fund’s relatively large position in bonds of gaming companies dampened performance somewhat. As the economic environment deteriorated throughout the period, consumers cut back on their discretionary spending—hurting revenues among companies in the gaming sector.*
| |
* | Portfolio composition is subject to change. |
Past performance does not guarantee future results. The performance data quoted represents past performance and current returns may be lower or higher. Total return figures include change in share price, reinvestment of dividends and capital gains and do not reflect taxes that a shareholder would pay on fund distributions or on the redemption of fund shares. The investment return and principal value will fluctuate so that an investor’s shares, when redeemed may be worth more or less than the original cost. To obtain performance information current to the most recent month end, please call 1-800-782-8183.
| |
HSBC INVESTOR FAMILY OF FUNDS | 12 |
|
Portfolio Reviews |
|
HSBC Investor Intermediate Duration Fixed Income Portfolio |
by Halbis Capital Management (USA) Inc., U.S. Core Fixed Income Team |
The HSBC Investor Intermediate Duration Fixed Income Portfolio (the “Portfolio”) seeks to maximize total return, consistent with reasonable risk. The “total return” sought by the Fund consists of income earned on investments, plus capital appreciation, if any, which generally arises from decreases in interest rates or improving credit fundamentals for a particular sector or security. Under normal market conditions, the Portfolio invest at least 80% of its net assets in fixed income securities. The Portfolio expects to maintain an average portfolio duration with respect to fixed income securities of 3 to 6 years. The Portfolio employs Halbis Capital Management (USA) Inc. as subadviser to the Portfolio.
Investment Concerns
Bonds offer a relatively stable level of income, although bond prices will fluctuate providing the potential for principal gain or loss. Intermediate-term, higher-quality bonds generally offer less risk than longer-term bonds and a lower rate of return.
The mortgage market in the U.S. recently experienced difficulties that may adversely affect the performance and market value of certain mortgage-related investments.
Market Commentary
The collapse of the subprime mortgage market led to the failure of several financial institutions during the period as the credit market dried up and lending activity froze. Other financial institutions, including banks and insurers, were rescued by federal bailouts. In that environment, investors fled to high-quality issues, favoring Treasury bonds over other securities in the fixed-income market.
The Fund underperformed its benchmarks in large part due to its focus on sectors other than Treasuries. Our strategy of emphasizing various types of “spread” bonds—bonds that offer higher yields than Treasuries—is designed to provide shareholders with greater income over time. However, such issues significantly underperformed during the period as investors shunned any fixed-income securities outside of the Treasury market.*
As investors sought liquidity and relative safety in short-term Treasury issues, the yield curve steepened and longer-term securities offered higher yields. The Fund maintained a duration slightly longer than that of its benchmarks. That strategy benefited the fund as such securities offered higher yields than shorter-term issues.*
| |
* | Portfolio composition is subject to change. |
Past performance does not guarantee future results. The performance data quoted represents past performance and current returns may be lower or higher. Total return figures include change in share price, reinvestment of dividends and capital gains and do not reflect taxes that a shareholder would pay on fund distributions or on the redemption of fund shares. The investment return and principal value will fluctuate so that an investor’s shares, when redeemed may be worth more or less than the original cost. To obtain performance information current to the most recent month end, please call 1-800-782-8183.
| |
13 | HSBC INVESTOR FAMILY OF FUNDS |
|
Portfolio Reviews |
|
HSBC Investor Growth Portfolio |
by Clark J. Winslow, Chief Executive Officer/Portfolio Manager
Justin H. Kelly, CFA, Managing Director/Portfolio Manager
R. Bart Wear CFA, Managing Director/Portfolio Manager |
The HSBC Investor Growth Portfolio (the “Portfolio”) seeks long-term growth of capital by investing primarily in U.S. and foreign equity securities of high quality companies with market capitalization generally in excess of $2 billion, which the subadviser believes have the potential to generate superior levels of long-term profitability and growth. Effective May 12, 2008, Winslow Capital Management Inc, replaced Waddell & Reed Investment Management Company (Waddell & Reed) as subadviser.
Investment Concerns
Equity securities (stocks) are more volatile and carry more risk than other forms of investments, including investments in high-grade fixed income securities. The net asset value per share of this Fund will fluctuate as the value of the securities in the portfolio changes.
Market Commentary
The subprime mortgage crisis continued to worsen during the period, forcing the federal government to bail out several failing financial institutions. That environment had a significantly negative impact on both the domestic and international equity markets.
The Fund’s returns relative to the benchmark benefited from its overweight position in the health care sector. Health care stocks outperformed the market as a whole—especially during the three months through September, which were among the most difficult of the 12-month period under review. Stock selection among financial services shares also benefited performance relative to the benchmark, despite the poor performance of the overall sector throughout the period.*
Stock selection in the consumer staples and technology sectors hurt performance relative to the benchmark. The Fund’s holdings in the energy sector hurt relative returns as well. Oil prices declined steeply off of July highs, and investors sold energy shares as a result.*
It is clear that the global economic outlook is negative. However, we see valuations for many companies at levels similar to those we encountered in late 2002 and early 2003. We remain focused on implementing our investment discipline: we will continue to focus on companies with strong potential future earnings growth, attractive absolute valuations, favorable risk/reward and downside protection, and catalysts/ inflection points to improve /sustain profitability or recognize value.
| |
* | Portfolio composition is subject to change. |
Past performance does not guarantee future results. The performance data quoted represents past performance and current returns may be lower or higher. Total return figures include change in share price, reinvestment of dividends and capital gains and do not reflect taxes that a shareholder would pay on fund distributions or on the redemption of fund shares. The investment return and principal value will fluctuate so that an investor’s shares, when redeemed may be worth more or less than the original cost. To obtain performance information current to the most recent month end, please call 1-800-782-8183.
| |
HSBC INVESTOR FAMILY OF FUNDS | 14 |
|
Portfolio Reviews |
|
HSBC Investor International Equity Portfolio |
by Kevin F. Simms |
Co-CIO International Value Equities and Director of Research – Global and International Value Equities AllianceBernstein Investment Research and Management |
The HSBC Investor International Equity Portfolio (the “Portfolio”) seek to provide their shareholders with long-term growth of capital and future income by investing at least 80% of its net assets in equity securities of companies organized and domiciled in developed nations outside the United States or for which the principal trading market is outside the United States, including Europe, Canada, Australia and the Far East. The Portfolio may invest up to 20% of its assets in equity securities of companies in emerging markets. The Portfolio employs AllianceBernstein L.P. (“AllianceBernstein”), a unit of AllianceBernstein Investment Research and Management as subadviser.
Investment Concerns
There are risks associated with investing in foreign companies, such as erratic market conditions, economic and political instability and fluctuations in currency and exchange rates.
Equity securities (stocks) are more volatile and carry more risk than other forms of investments, including investments in high-grade fixed income securities. The net asset value per share of this Fund will fluctuate as the value of the securities in the portfolio changes.
Market Commentary
Investor worries about slowing global economic growth and further repercussions from the subprime mortgage crisis dominated financial markets during the period under review, contributing to the Fund’s negative performance. The U.S. and U.K. housing markets continued to decline, and banks worldwide suffered from exposure to problem assets related to the mortgage industry. Global stocks declined during the period as prospects for economic growth fell sharply.
The Fund’s sector selection hurt relative returns, due primarily to underweight positions in shares of consumer staples, medical and utilities firms. The Fund’s overweight position in financials also dragged on returns, as these companies suffered some of the period’s largest losses.*
Security selection weighed on the Fund’s performance relative to its benchmark. Key detractors included shares of U.K. banks with significant exposure to that country’s housing market. Meanwhile, softening consumer spending hurt performance among shares of certain automakers in the Fund’s portfolio. Those events cascaded through the supply chain, eventually weakening shares of some materials firms in the Fund’s portfolio.
The Fund’s investment in shares of certain securities enhanced its relative performance. Such securities included a major Japanese utility, a French financial services firm and a global energy company.*
| |
* | Portfolio composition is subject to change. |
Past performance does not guarantee future results. The performance data quoted represents past performance and current returns may be lower or higher. Total return figures include change in share price, reinvestment of dividends and capital gains and do not reflect taxes that a shareholder would pay on fund distributions or on the redemption of fund shares. The investment return and principal value will fluctuate so that an investor’s shares, when redeemed may be worth more or less than the original cost. To obtain performance information current to the most recent month end, please call 1-800-782-8183.
| |
15 | HSBC INVESTOR FAMILY OF FUNDS |
|
Portfolio Reviews |
|
HSBC Investor Opportunity Portfolio |
by William A. Muggia |
President–Chief Investment Officer
Westfield Capital Management, LLC |
The HSBC Investor Opportunity Fund (“the Fund”) seeks to provide its shareholders with long-term growth of capital by investing in equity securities of small cap companies. The Portfolio may also invest in bonds, notes, commercial paper, U.S. Government securities, and foreign securities. Small cap companies generally are defined as those that have market capitalizations within the range of market capitalizations represented in the Russell 2500™ Growth Index1. The Portfolio may also invest in equity securities of larger, more established companies if they are expected to show increased earnings. The Portfolio employs Westfield Capital Management Company, LLC as subadviser.
Investment Concerns
Equity securities (stocks) are more volatile and carry more risk than other forms of investments, including investments in high-grade fixed income securities. The net asset value per share of this Fund will fluctuate as the value of the securities in the portfolio changes.
Small-capitalization funds typically carry additional risks since smaller companies generally have a higher risk of failure, and historically, their stocks have experienced a greater degree of market volatility than stocks on average.
Market Commentary
The fallout from the subprime mortgage crisis intensified during the 12 months under review, leading to larger credit and liquidity crises in the financial markets. Fears of U.S. and global recessions grew as a result, particularly toward the end of the period. Stocks of almost all kinds posted heavy losses.
The Fund benefited from holding a larger position than its benchmark in the health care sector. The Fund did not have a bullish view on the sector as a whole, but managed to identify a number of attractive investments in sub-sectors such as biotechnology and health care equipment, and those holdings helped relative performance. The Fund also held an underweight position in consumer discretionary stocks. Consumer discretionary proved to be the second-worst performing sector during the period, following only the financial services sector, so the Fund’s underweight position benefited relative performance.*
Stock selection within the industrial sector was the greatest drag on the Fund’s relative performance during the period. We believe that the pace of development in foreign countries would continue to increase, making shares of building and construction firms attractive. But stocks of such companies suffered as the economic woes in the United States spread globally. Stock selection in the financial services sector also weighed on returns relative to the benchmark.
The economic realities are grim, but we believe that this is largely reflected in stocks. Valuation levels of US stocks are well below their ten-year averages. Stocks have traded down as an asset class, with little regard for company specific prospects or fundamentals. We believe that once the financial markets have stabilized, we will look back on this period as an opportunity to invest in high quality growth companies trading at very attractive historical valuations. We remain focused on company fundamentals and are committed to upgrading quality in the portfolio wherever possible.
| |
1 | For additional information, please refer to the Glossary of Terms. |
| |
* | Portfolio composition is subject to change. |
Past performance does not guarantee future results. The performance data quoted represents past performance and current returns may be lower or higher. Total return figures include change in share price, reinvestment of dividends and capital gains and do not reflect taxes that a shareholder would pay on fund distributions or on the redemption of fund shares. The investment return and principal value will fluctuate so that an investor’s shares, when redeemed may be worth more or less than the original cost. To obtain performance information current to the most recent month end, please call 1-800-782-8183.
| |
HSBC INVESTOR FAMILY OF FUNDS | 16 |
|
Portfolio Reviews |
|
HSBC Investor Value Portfolio |
by Jon D. Bosse, CFA
Chief Investment Officer |
NWQ Investment Management Company, LLC |
The HSBC Investor Value Portfolio (the “Portfolio”) seeks long-term growth of capital and income by investing primarily in U.S. and foreign companies with large and medium capitalizations that the subadviser believes possess opportunities underappreciated or misperceived by the market. The Portfolio employs NWQ Investment Management Company, LLC (“NWQ”) as subadviser.
Investment Concerns
Value-based investments are subject to the risk that the broad market may not recognize their intrinsic value.
Equity securities (stocks) are more volatile and carry more risk than other forms of investments, including investments in high-grade fixed income securities. The net asset value per share of this Fund will fluctuate as the value of the securities in the Portfolio changes.
Market Commentary
U.S and Global Equity markets experienced significant declines during the period under review, with most of the decline occurring during the last weeks. This has been an unprecedented period and one of the most challenging investment environments in our country’s history. Given the crisis of confidence, the U.S. Government took decisive action regarding the fate of many companies. The U.S. Government has either: assumed control of companies; sponsored/engineered “takeovers;” or allowed companies to fail. In many cases, such events might signal a bottom and thereby provide a floor in equity valuations. However, the magnitude of recent events and continued economic deterioration combined with the realization that a company’s financial well-being could quickly evaporate, have heightened investor fears and market volatility. The U.S. Treasury/the Federal Reserve Board (as well as Central Banks broadly) have begun implementing broad and meaningful financial rescue measures in order to stabilize global markets.
There were few places to “hide” during the period under review; and most of the Fund’s holdings declined. The credit markets dysfunction has led to fear and panic, particularly within the financial sector. While the Fund was underweighted in the financial sector (relative to the Russell 1000® Value Index1), the sector adversely impacted absolute and relative performance. The Fund’s positions within the materials/processing sector adversely impacted the portfolio. These stocks came under pressure as commodity prices declined amid a deteriorating outlook for global growth. Oil and gas prices declined during the latter part of the period adversely affecting the Fund’s energy holdings. We would like to note that we reduced the energy position in Fund during the first half of the period — at higher share prices. Finally, the Fund’s consumer discretionary sector, primarily media, adversely impacted the portfolio. There were positive contributors during the period. One of the Fund’s health care companies, as well as the Fund’s railroad holding, appreciated during the period. Consumer staples contributed positively to the portfolio.*
It is clear that the global economic outlook is negative. However, we see valuations for many companies at levels similar to those we encountered in late 2002 and early 2003. We remain focused on implementing our investment discipline: we will continue to focus on companies with attractive absolute valuations, favorable risk/reward and downside protection, and catalysts/inflection points to improve/sustain profitability or recognize value.
It is clear that the global economic outlook is negative. However, we see valuations for many companies at levels similar to those we encountered in late 2002 and early 2003. We remain focused on implementing our investment discipline: we will continue to focus on companies with attractive absolute valuations, favorable risk/reward and downside protection, and catalysts/ inflection points to improve /sustain profitability or recognize value.
| |
1 | For additional information, please refer to the Glossary of Terms. |
| |
* | Portfolio composition is subject to change. |
Past performance does not guarantee future results. The performance data quoted represents past performance and current returns may be lower or higher. Total return figures include change in share price, reinvestment of dividends and capital gains and do not reflect taxes that a shareholder would pay on fund distributions or on the redemption of fund shares. The investment return and principal value will fluctuate so that an investor’s shares, when redeemed may be worth more or less than the original cost. To obtain performance information current to the most recent month end, please call 1-800-782-8183.
| |
17 | HSBC INVESTOR FAMILY OF FUNDS |
|
Portfolio Reviews |
|
Portfolio Composition* |
October 31, 2008 |
(Unaudited) |
| | | | |
HSBC Investor Core Plus Fixed Income Portfolio | | | | |
|
|
|
|
|
| | | | |
Investment Allocation | | Percentage of Investments at Value | |
|
|
|
|
U.S. Government and Government Agency Obligations | | 33.4 | % | |
|
|
|
|
|
Corporate Obligations | | 29.5 | % | |
|
|
|
|
|
Asset Backed Securities | | 19.4 | % | |
|
|
|
|
|
Commercial Mortgage Backed Securities | | 8.8 | % | |
|
|
|
|
|
Collateralized Mortgage Obligations | | 4.5 | % | |
|
|
|
|
|
Cash and Equivalents | | 2.1 | % | |
|
|
|
|
|
Municipal Bonds | | 1.8 | % | |
|
|
|
|
|
Foreign Bonds | | 0.4 | % | |
|
|
|
|
|
Certificates of Deposit | | 0.1 | % | |
|
|
|
|
|
Total | | 100.0 | % | |
|
|
|
|
|
| | | | |
HSBC Investor High Yield Fixed Income Portfolio | | | | |
|
|
|
|
|
| | | | |
Investment Allocation | | Percentage of Investments at Value | |
|
|
|
|
Corporate Obligations | | 100.0 | % | |
|
|
|
|
|
Common Stock | | 0.0 | % | |
|
|
|
|
|
Total | | 100.0 | % | |
|
|
|
|
|
| | | | |
HSBC Investor Intermediate Duration Fixed Income Portfolio | | | | |
|
|
|
|
|
| | | | |
Investment Allocation | | Percentage of Investments at Value | |
|
|
|
|
|
U.S. Government and Government Agency Obligations | | 42.6 | % | |
|
|
|
|
|
Corporate Obligations | | 21.2 | % | |
|
|
|
|
|
Asset Backed Securities | | 15.4 | % | |
|
|
|
|
|
Cash and Equivalents | | 9.8 | % | |
|
|
|
|
|
Commercial Mortgage Backed Securities | | 5.7 | % | |
|
|
|
|
|
Collateralized Mortgage Obligations | | 4.0 | % | |
|
|
|
|
|
Municipal Bonds | | 0.4 | % | |
|
|
|
|
|
Foreign Bonds | | 0.4 | % | |
|
|
|
|
|
Certificates of Deposit | | 0.5 | % | |
|
|
|
|
|
Total | | 100.0 | % | |
|
|
|
|
|
| | | | |
HSBC Investor Growth Portfolio | | | | |
|
|
|
|
|
| | | | |
Investment Allocation | | Percentage of Investments at Value | |
|
|
|
|
Biotechnology | | 7.8 | % | |
|
|
|
|
|
Retail | | 7.2 | % | |
|
|
|
|
|
Software Services | | 7.2 | % | |
|
|
|
|
|
Industrial Conglomerates | | 6.8 | % | |
|
|
|
|
|
Medical Services & Distributors | | 6.7 | % | |
|
|
|
|
|
Medical Products | | 6.6 | % | |
|
|
|
|
|
Cash and Equivalents | | 5.6 | % | |
|
|
|
|
|
Telecommunication | | 5.3 | % | |
|
|
|
|
|
Hardware & Peripherals | | 4.4 | % | |
|
|
|
|
|
Credit Card | | 4.2 | % | |
|
|
|
|
|
Communication Equipment | | 3.4 | % | |
|
|
|
|
|
Railroad | | 3.3 | % | |
|
|
|
|
|
Agriculture | | 3.0 | % | |
|
|
|
|
|
Investment Management | | 2.5 | % | |
|
|
|
|
|
Internet | | 2.3 | % | |
|
|
|
|
|
Retail Pharmacy | | 2.3 | % | |
|
|
|
|
|
Aerospace & Defense | | 2.3 | % | |
|
|
|
|
|
Oil & Gas Drill & Equipment | | 2.1 | % | |
|
|
|
|
|
Pharmaceuticals | | 2.1 | % | |
|
|
|
|
|
Engineering & Construction | | 2.0 | % | |
|
|
|
|
|
Distribution & Wholesale | | 1.8 | % | |
|
|
|
|
|
Household Products | | 1.5 | % | |
|
|
|
|
|
Exchanges | | 1.5 | % | |
|
|
|
|
|
Oil & Gas Exploration & Production | | 1.4 | % | |
|
|
|
|
|
Transportation | | 1.3 | % | |
|
|
|
|
|
Computer Storage | | 1.1 | % | |
|
|
|
|
|
Solar | | 1.0 | % | |
|
|
|
|
|
Travel & Leisure | | 1.0 | % | |
|
|
|
|
|
Electric, Gas & Water | | 0.8 | % | |
|
|
|
|
|
Coal | | 0.8 | % | |
|
|
|
|
|
Business Services | | 0.7 | % | |
|
|
|
|
|
Total | | 100.0 | % | |
|
|
|
|
|
| | | | |
HSBC International Equity Portfolio | | | | |
|
|
|
|
|
| | | | |
Investment Allocation | | Percentage of Investments at Value | |
|
|
|
|
Europe | | 66.9 | % | |
|
|
|
|
|
Japan | | 18.6 | % | |
|
|
|
|
|
Australia & Far East | | 6.2 | % | |
|
|
|
|
|
Canada | | 5.1 | % | |
|
|
|
|
|
Cash and Equivalents | | 2.4 | % | |
|
|
|
|
|
Other | | 0.8 | % | |
|
|
|
|
|
Total | | 100.0 | % | |
|
|
|
|
|
| |
HSBC INVESTOR FAMILY OF FUNDS | 18 |
|
Portfolio Reviews |
|
Portfolio Composition* |
October 31, 2008 |
(Unaudited) |
| | | | |
HSBC Investor Opportunity Portfolio | | | | |
|
|
|
|
|
| | | | |
Investment Allocation | | Percentage of Investments at Value | |
|
|
|
|
Computer Software | | 14.9 | % | |
|
|
|
|
|
Pharmaceuticals | | 12.6 | % | |
|
|
|
|
|
Oil & Gas | | 9.4 | % | |
|
|
|
|
|
Health Care | | 8.1 | % | |
|
|
|
|
|
Consumer Products | | 8.0 | % | |
|
|
|
|
|
Industrial Manufacturing | | 5.7 | % | |
|
|
|
|
|
Financial Services | | 5.4 | % | |
|
|
|
|
|
Biotechnology | | 5.2 | % | |
|
|
|
|
|
Education | | 4.7 | % | |
|
|
|
|
|
Retail | | 4.7 | % | |
|
|
|
|
|
Cash and Equivalents | | 3.7 | % | |
|
|
|
|
|
Telecommunications | | 3.1 | % | |
|
|
|
|
|
Diversified Manufacturing Operations | | 2.6 | % | |
|
|
|
|
|
Transportation | | 2.3 | % | |
|
|
|
|
|
Business Services | | 2.3 | % | |
|
|
|
|
|
Utilities | | 1.4 | % | |
|
|
|
|
|
Aerospace & Defense | | 1.4 | % | |
|
|
|
|
|
Internet Related | | 1.4 | % | |
|
|
|
|
|
Media | | 1.3 | % | |
|
|
|
|
|
Homebuilders | | 1.3 | % | |
|
|
|
|
|
Electronic Components & Semiconductors | | 0.5 | % | |
|
|
|
|
|
Total | | 100.0 | % | |
| | | | |
HSBC Investor Value Portfolio | | | | |
|
|
|
|
|
| | | | |
Investment Allocation | | Percentage of Investments at Value | |
|
|
|
|
Oil & Gas | | 11.8 | % | |
|
|
|
|
|
Cash and Equivalents | | 9.7 | % | |
|
|
|
|
|
Computer Software | | 9.2 | % | |
|
|
|
|
|
Insurance | | 7.3 | % | |
|
|
|
|
|
Telecommunications | | 6.6 | % | |
|
|
|
|
|
Media | | 6.4 | % | |
|
|
|
|
|
Metals & Mining | | 6.4 | % | |
|
|
|
|
|
Consumer Products | | 6.0 | % | |
|
|
|
|
|
Pharmaceuticals | | 5.9 | % | |
|
|
|
|
|
Aerospace & Defense | | 5.4 | % | |
|
|
|
|
|
Tobacco | | 4.5 | % | |
|
|
|
|
|
Financial Services | | 4.2 | % | |
|
|
|
|
|
Business Services | | 3.5 | % | |
|
|
|
|
|
Banking | | 3.4 | % | |
|
|
|
|
|
Conglomerates | | 2.5 | % | |
|
|
|
|
|
Diversified Manufacturing Operations | | 2.4 | % | |
|
|
|
|
|
Transportation | | 2.4 | % | |
|
|
|
|
|
Energy | | 1.6 | % | |
|
|
|
|
|
Paper & Related Products | | 0.8 | % | |
|
|
|
|
|
Total | | 100.0 | % | |
|
|
|
|
|
| |
* | Portfolio composition is subject to change. |
| |
19 | HSBC INVESTOR FAMILY OF FUNDS |
(This Page Intentionally Left Blank)
HSBC INVESTOR LIFELINE FUNDS
Statements of Assets and Liabilities—As of October 31, 2008
| | | | | | | | | | | | | |
| | Aggressive
Growth
Strategy Fund | | Growth
Strategy
Fund | | Moderate
Growth
Strategy Fund | | Conservative
Growth
Strategy Fund | |
|
|
|
|
|
|
|
|
|
|
Assets: | | | | | | | | | | | | | |
Investments in Affiliated Portfolios | | $ | 7,993,224 | | $ | 24,179,015 | | $ | 26,458,188 | | $ | 7,559,224 | |
Investments in Affiliated Fund, at value(a) | | | 74,513 | | | 230,718 | | | 1,629,963 | | | 1,974,707 | |
| |
|
| |
|
| |
|
| |
|
| |
Total Investments | | | 8,067,737 | | | 24,409,733 | | | 28,088,151 | | | 9,533,931 | |
| |
|
| |
|
| |
|
| |
|
| |
Receivable for capital shares issued | | | 3,851 | | | 7,077 | | | 5,624 | | | 7,500 | |
Reclaims receivable | | | 2,950 | | | 10,161 | | | 7,960 | | | 239 | |
Receivable from Investment Adviser | | | 9,045 | | | 10,157 | | | — | | | 5,118 | |
Prepaid expenses and other assets | | | 5,593 | | | 4,609 | | | 5,367 | | | 3,808 | |
| |
|
| |
|
| |
|
| |
|
| |
Total Assets | | | 8,089,176 | | | 24,441,737 | | | 28,107,102 | | | 9,550,596 | |
| |
|
| |
|
| |
|
| |
|
| |
Liabilities: | | | | | | | | | | | | | |
Payable for capital shares redeemed | | | 1,340 | | | 12,018 | | | 43,732 | | | — | |
Accrued expenses and other liabilities: | | | | | | | | | | | | | |
Investment Management | | | 348 | | | 1,053 | | | 1,213 | | | 420 | |
Administration | | | 136 | | | 413 | | | 478 | | | 166 | |
Distribution | | | 2,314 | | | 6,855 | | | 8,989 | | | 3,136 | |
Shareholder Servicing | | | 1,754 | | | 5,292 | | | 6,092 | | | 2,110 | |
Compliance Service | | | 7 | | | 22 | | | 23 | | | 8 | |
Transfer Agent | | | 17,096 | | | 27,702 | | | 30,180 | | | 13,472 | |
Trustee | | | 9 | | | 27 | | | 28 | | | 11 | |
Other | | | 8,934 | | | 27,290 | | | 28,893 | | | 6,211 | |
| |
|
| |
|
| |
|
| |
|
| |
Total Liabilities | | | 31,938 | | | 80,672 | | | 119,628 | | | 25,534 | |
| |
|
| |
|
| |
|
| |
|
| |
Net Assets | | $ | 8,057,238 | | $ | 24,361,065 | | $ | 27,987,474 | | $ | 9,525,062 | |
| |
|
| |
|
| |
|
| |
|
| |
| | | | | | | | | | | | | |
Composition of Net Assets: | | | | | | | | | | | | | |
Capital | | $ | 11,673,697 | | $ | 33,631,352 | | $ | 37,025,703 | | $ | 12,010,124 | |
Accumulated net investment income (loss) | | | — | | | 117,076 | | | — | | | — | |
Accumulated net realized gains (losses) from investment and foreign currency transactions | | | (962,096 | ) | | (2,238,069 | ) | | (2,057,829 | ) | | (558,957 | ) |
Unrealized appreciation/depreciation from investments and foreign currencies | | | (2,654,363 | ) | | (7,149,294 | ) | | (6,980,400 | ) | | (1,926,105 | ) |
| |
|
| |
|
| |
|
| |
|
| |
Net Assets | | $ | 8,057,238 | | $ | 24,361,065 | | $ | 27,987,474 | | $ | 9,525,062 | |
| |
|
| |
|
| |
|
| |
|
| |
| | | | | | | | | | | | | |
Net Assets: | | | | | | | | | | | | | |
Class A Shares | | $ | 4,572,025 | | $ | 13,908,165 | | $ | 14,225,654 | | $ | 4,747,154 | |
Class B Shares | | | 3,165,735 | | | 9,516,049 | | | 12,354,009 | | | 4,347,825 | |
Class C Shares | | | 319,478 | | | 936,851 | | | 1,407,811 | | | 430,083 | |
| |
|
| |
|
| |
|
| |
|
| |
| | $ | 8,057,238 | | $ | 24,361,065 | | $ | 27,987,474 | | $ | 9,525,062 | |
| |
|
| |
|
| |
|
| |
|
| |
| | | | | | | | | | | | | |
Shares Outstanding | | | | | | | | | | | | | |
($0.001 par value, unlimited number of shares authorized): | | | | | | | | | | | | | |
Class A Shares | | | 530,382 | | | 1,579,475 | | | 1,636,612 | | | 536,918 | |
Class B Shares | | | 377,234 | | | 1,086,027 | | | 1,420,997 | | | 496,386 | |
Class C Shares | | | 38,091 | | | 106,453 | | | 165,887 | | | 47,798 | |
| | | | | | | | | | | | | |
Net Asset Value, Offering Price and Redemption Price per share: | | | | | | | | | | | | | |
Class A Shares | | $ | 8.62 | | $ | 8.81 | | $ | 8.69 | | $ | 8.84 | |
Class B Shares* | | $ | 8.39 | | $ | 8.76 | | $ | 8.69 | | $ | 8.76 | |
Class C Shares* | | $ | 8.39 | | $ | 8.80 | | $ | 8.49 | | $ | 9.00 | |
Maximum Sales Charge — Class A Shares | | | 5.00 | % | | 5.00 | % | | 5.00 | % | | 5.00 | % |
| |
|
| |
|
| |
|
| |
|
| |
Maximum Offering Price per share (Net Asset Value/(100%—maximum sales charge)) — Class A Shares | | $ | 9.07 | | $ | 9.27 | | $ | 9.15 | | $ | 9.31 | |
| |
|
| |
|
| |
|
| |
|
| |
Investments in Affiliated Fund, at cost (a) | | $ | 74,513 | | $ | 230,718 | | $ | 1,629,963 | | $ | 1,974,707 | |
| |
|
| |
|
| |
|
| |
|
| |
| |
|
* | Redemption Price per share varies by length of time shares are held. |
| |
(a) | The investment in the affiliated fund are holdings of the HSBC Investor Prime Money Market Fund Class I Shares (See Note 1). The shares are held in the Fund are identical to value since it is at a $1.00 net asset value per share. In addition, value and cost for financial reporting and federal income tax purposes are the same. |
| | |
21 | HSBC INVESTOR LIFELINE FUNDS | See notes to financial statements. |
HSBC INVESTOR LIFELINE FUNDS
Statements of Operations—For the year ended October 31, 2008
| | | | | | | | | | | | | |
| | Aggressive
Growth
Strategy Fund | | Growth
Strategy
Fund | | Moderate
Growth
Strategy Fund | | Conservative
Growth
Strategy Fund | |
|
|
|
|
|
|
|
|
|
|
|
|
|
|
Investment Income: | | | | | | | | | | | | | |
Investment Income from Affiliated Portfolios (a) | | $ | 200,481 | | $ | 850,561 | | $ | 1,135,367 | | $ | 370,160 | |
Investment Income from Affiliated Fund | | | 3,956 | | | 11,215 | | | 72,600 | | | 81,348 | |
Tax reclaims (a) | | | 2,950 | | | 10,161 | | | 7,960 | | | 239 | |
Foreign tax withholding from Affiliated Portfolios (a) | | | (14,909 | ) | | (35,955 | ) | | (29,356 | ) | | (6,324 | ) |
Expenses from Affiliated Portfolios (a) | | | (87,214 | ) | | (237,243 | ) | | (241,779 | ) | | (67,484 | ) |
| |
|
| |
|
| |
|
| |
|
| |
Total Investment Income (Loss) | | | 105,264 | | | 598,739 | | | 944,792 | | | 377,939 | |
| |
|
| |
|
| |
|
| |
|
| |
| | | | | | | | | | | | | |
Expenses: | | | | | | | | | | | | | |
Investment Management | | | 5,924 | | | 16,836 | | | 18,382 | | | 5,975 | |
Administration | | | 2,523 | | | 7,185 | | | 7,842 | | | 2,547 | |
Distribution: | | | | | | | | | | | | | |
Class B Shares | | | 34,993 | | | 96,743 | | | 119,950 | | | 38,520 | |
Class C Shares | | | 3,652 | | | 9,519 | | | 13,455 | | | 3,703 | |
Shareholder Servicing: | | | | | | | | | | | | | |
Class A Shares | | | 16,738 | | | 48,760 | | | 47,443 | | | 15,799 | |
Class B Shares | | | 11,664 | | | 32,248 | | | 39,983 | | | 12,840 | |
Class C Shares | | | 1,217 | | | 3,173 | | | 4,485 | | | 1,235 | |
Accounting | | | 23,499 | | | 23,499 | | | 23,499 | | | 23,787 | |
Compliance Service | | | 50 | | | 142 | | | 155 | | | 52 | |
Printing | | | 15,164 | | | 40,963 | | | 44,685 | | | 17,393 | |
Professional fees | | | 360 | | | 1,008 | | | 1,117 | | | 4,373 | |
Transfer Agent | | | 59,513 | | | 92,864 | | | 98,260 | | | 46,935 | |
Trustee | | | 174 | | | 494 | | | 536 | | | 176 | |
Registration fees | | | 187 | | | 545 | | | 577 | | | 168 | |
Other | | | 10,548 | | | 10,443 | | | 14,175 | | | 7,197 | |
| |
|
| |
|
| |
|
| |
|
| |
Total expenses before fee reductions | | | 186,206 | | | 384,422 | | | 434,544 | | | 180,700 | |
Fees reduced by Investment Adviser | | | (57,390 | ) | | (11,222 | ) | | — | | | (26,936 | ) |
| |
|
| |
|
| |
|
| |
|
| |
Net Expenses | | | 128,816 | | | 373,200 | | | 434,544 | | | 153,764 | |
| |
|
| |
|
| |
|
| |
|
| |
| | | | | | | | | | | | | |
Net Investment Income (Loss) | | | (23,552 | ) | | 225,539 | | | 510,248 | | | 224,175 | |
| |
|
| |
|
| |
|
| |
|
| |
| | | | | | | | | | | | | |
Net Realized/Unrealized Gains (Losses) from Investments: (a) | | | | | | | | | | | | | |
Net realized losses from investments and foreign currency transactions | | | (1,008,442 | ) | | (2,323,453 | ) | | (2,119,789 | ) | | (572,415 | ) |
Change in unrealized appreciation/depreciation from investments and foreign currencies | | | (4,611,582 | ) | | (12,045,449 | ) | | (11,008,540 | ) | | (2,729,503 | ) |
| |
|
| |
|
| |
|
| |
|
| |
| | | | | | | | | | | | | |
Net realized/unrealized gains/losses from investments and foreign currency transactions | | | (5,620,024 | ) | | (14,368,902 | ) | | (13,128,329 | ) | | (3,301,918 | ) |
| |
|
| |
|
| |
|
| |
|
| |
Change In Net Assets Resulting From Operations | | $ | (5,643,576 | ) | $ | (14,143,363 | ) | $ | (12,618,081 | ) | $ | (3.077,743 | ) |
| |
|
| |
|
| |
|
| |
|
| |
| |
|
(a) | Represents amounts allocated from the respective Affiliated Portfolios. |
| | |
See notes to financial statements. | HSBC INVESTOR LIFELINE FUNDS | 22 |
HSBC INVESTOR LIFELINE FUNDS
Statements of Changes in Net Assets
| | | | | | | | | | | | | |
| | Aggressive Growth Strategy Fund | | Growth Strategy Fund | |
|
|
|
|
|
|
| | For the year
ended
October 31, 2008 | | For the year
ended
October 31, 2007 | | For the year
ended
October 31, 2008 | | For the year
ended
October 31, 2007 | |
|
|
|
|
|
|
|
|
|
|
Investment Activities: | | | | | | | | | | | | | |
Operations: | | | | | | | | | | | | | |
Net investment income (loss) | | $ | (23,552 | ) | $ | (35,215 | ) | $ | 225,539 | | $ | 155,873 | |
Net realized gains (losses) from investment transactions | | | (1,008,442 | ) | | 810,981 | | | (2,323,453 | ) | | 1,888,561 | |
Change in unrealized appreciation/depreciation from investments and foreign currencies | | | (4,611,582 | ) | | 1,335,250 | | | (12,045,449 | ) | | 3,251,636 | |
| |
|
| |
|
| |
|
| |
|
| |
Change in net assets resulting from operations | | | (5,643,576 | ) | | 2,111,016 | | | (14,143,363 | ) | | 5,296,070 | |
| |
|
| |
|
| |
|
| |
|
| |
| | | | | | | | | | | | | |
Dividends: | | | | | | | | | | | | | |
Net investment income: | | | | | | | | | | | | | |
Class A Shares | | | — | | | — | | | (137,880 | ) | | (91,507 | ) |
Class B Shares | | | — | | | — | | | (1,259 | ) | | (11,110 | ) |
Class C Shares | | | — | | | — | | | (816 | ) | | (784 | ) |
| | | | | | | | | | | | | |
Net realized gains: | | | | | | | | | | | | | |
Class A Shares | | | (420,292 | ) | | — | | | (1,103,525 | ) | | (94,565 | ) |
Class B Shares | | | (302,904 | ) | | — | | | (702,526 | ) | | (64,734 | ) |
Class C Shares | | | (31,294 | ) | | — | | | (63,975 | ) | | (5,227 | ) |
Return of Capital: | | | | | | | | | | | | | |
Class A Shares | | | (1,758 | ) | | — | | | — | | | — | |
Class B Shares | | | (1,250 | ) | | — | | | — | | | — | |
Class C Shares | | | (126 | ) | | — | | | — | | | — | |
| |
|
| |
|
| |
|
| |
|
| |
Change in net assets resulting from shareholder dividends | | | (757,624 | ) | | — | | | (2,009,981 | ) | | (267,927 | ) |
| |
|
| |
|
| |
|
| |
|
| |
Change in net assets resulting from capital transactions | | | 1,942,878 | | | 3,061,815 | | | 3,984,572 | | | 9,652,802 | |
| |
|
| |
|
| |
|
| |
|
| |
Change in net assets | | | (4,458,322 | ) | | 5,172,831 | | | (12,168,772 | ) | | 14,680,945 | |
| | | | | | | | | | | | | |
Net Assets: | | | | | | | | | | | | | |
Beginning of period | | | 12,515,560 | | | 7,342,729 | | | 36,529,837 | | | 21,848,892 | |
| |
|
| |
|
| |
|
| |
|
| |
End of period | | $ | 8,057,238 | | $ | 12,515,560 | | $ | 24,361,065 | | $ | 36,529,837 | |
| |
|
| |
|
| |
|
| |
|
| |
Accumulated net investment income (loss) | | $ | — | | $ | (4,459 | ) | $ | 117,076 | | $ | 112,089 | |
| |
|
| |
|
| |
|
| |
|
| |
| | |
23 | HSBC INVESTOR LIFELINE FUNDS | See notes to financial statements. |
HSBC INVESTOR LIFELINE FUNDS
Statements of Changes in Net Assets (continued)
| | | | | | | | | | | | | |
| | Aggressive Growth Strategy Fund | | Growth Strategy Fund | |
|
|
|
|
|
|
| | For the year
ended
October 31, 2008 | | For the year
ended
October 31, 2007 | | For the year
ended
October 31, 2008 | | For the year
ended
October 31, 2007 | |
|
|
|
|
|
|
|
|
|
|
CAPITAL TRANSACTIONS: | | | | | | | | | | | | | |
Class A Shares: | | | | | | | | | | | | | |
Proceeds from shares issued | | $ | 1,808,587 | | $ | 2,836,042 | | $ | 4,094,924 | | $ | 7,969,359 | |
Dividends reinvested | | | 421,632 | | | — | | | 1,235,211 | | | 185,652 | |
Value of shares redeemed | | | (1,135,189 | ) | | (1,111,410 | ) | | (3,486,779 | ) | | (2,339,143 | ) |
| |
|
| |
|
| |
|
| |
|
| |
Class A Shares capital transactions | | | 1,095,030 | | | 1,724,632 | | | 1,843,356 | | | 5,815,868 | |
| |
|
| |
|
| |
|
| |
|
| |
| | | | | | | | | | | | | |
Class B Shares: | | | | | | | | | | | | | |
Proceeds from shares issued | | | 1,075,628 | | | 1,516,999 | | | 2,700,023 | | | 4,252,061 | |
Dividends reinvested | | | 303,827 | | | — | | | 701,613 | | | 75,546 | |
Value of shares redeemed | | | (597,445 | ) | | (405,168 | ) | | (1,552,870 | ) | | (1,033,237 | ) |
| |
|
| |
|
| |
|
| |
|
| |
Class B Shares capital transactions | | | 782,010 | | | 1,111,831 | | | 1,848,766 | | | 3,294,370 | |
| |
|
| |
|
| |
|
| |
|
| |
| | | | | | | | | | | | | |
Class C Shares: | | | | | | | | | | | | | |
Proceeds from shares issued | | | 160,943 | | | 328,562 | | | 471,136 | | | 768,456 | |
Dividends reinvested | | | 31,420 | | | — | | | 64,791 | | | 6,011 | |
Value of shares redeemed | | | (126,525 | ) | | (103,210 | ) | | (243,477 | ) | | (231,903 | ) |
| |
|
| |
|
| |
|
| |
|
| |
Class C Shares capital transactions | | | 65,838 | | | 225,352 | | | 292,450 | | | 542,564 | |
| |
|
| |
|
| |
|
| |
|
| |
| | | | | | | | | | | | | |
Change in net assets resulting from capital transactions | | $ | 1,942,878 | | $ | 3,061,815 | | $ | 3,984,572 | | $ | 9,652,802 | |
| |
|
| |
|
| |
|
| |
|
| |
| | | | | | | | | | | | | |
SHARE TRANSACTIONS: | | | | | | | | | | | | | |
Class A Shares: | | | | | | | | | | | | | |
Issued | | | 140,000 | | | 206,802 | | | 323,501 | | | 599,873 | |
Reinvested | | | 30,686 | | | — | | | 93,719 | | | 14,632 | |
Redeemed | | | (93,561 | ) | | (81,057 | ) | | (287,477 | ) | | (173,704 | ) |
| |
|
| |
|
| |
|
| |
|
| |
Change in Class A Shares | | | 77,125 | | | 125,745 | | | 129,743 | | | 440,801 | |
| |
|
| |
|
| |
|
| |
|
| |
| | | | | | | | | | | | | |
Class B Shares: | | | | | | | | | | | | | |
Issued | | | 84,358 | | | 112,606 | | | 218,579 | | | 318,815 | |
Reinvested | | | 22,556 | | | — | | | 53,152 | | | 5,949 | |
Redeemed | | | (53,351 | ) | | (29,929 | ) | | (133,643 | ) | | (77,193 | ) |
| |
|
| |
|
| |
|
| |
|
| |
Change in Class B Shares | | | 53,563 | | | 82,677 | | | 138,088 | | | 247,571 | |
| |
|
| |
|
| |
|
| |
|
| |
| | | | | | | | | | | | | |
Class C Shares: | | | | | | | | | | | | | |
Issued | | | 12,747 | | | 24,063 | | | 37,995 | | | 56,478 | |
Reinvested | | | 2,334 | | | — | | | 4,890 | | | 471 | |
Redeemed | | | (11,560 | ) | | (7,943 | ) | | (22,815 | ) | | (17,406 | ) |
| |
|
| |
|
| |
|
| |
|
| |
Change in Class C Shares | | | 3,521 | | | 16,120 | | | 20,070 | | | 39,543 | |
| |
|
| |
|
| |
|
| |
|
| |
| | |
See notes to financial statements. | HSBC INVESTOR LIFELINE FUNDS | 24 |
HSBC INVESTOR LIFELINE FUNDS
Statements of Changes in Net Assets (continued)
| | | | | | | | | | | | | |
| | Moderate Growth Strategy Fund | | Conservative Growth Strategy Fund | |
|
|
|
|
|
|
| | For the year
ended
October 31, 2008 | | For the year
ended
October 31, 2007 | | For the year
ended
October 31, 2008 | | For the year
ended
October 31, 2007 | |
|
|
|
|
|
|
|
|
|
|
Investment Activities: | | | | | | | | | | | | | |
Operations: | | | | | | | | | | | | | |
Net investment income (loss) | | $ | 510,248 | | $ | 409,400 | | $ | 224,175 | | $ | 168,893 | |
Net realized gains (losses) from investment transactions | | | (2,119,789 | ) | | 1,499,302 | | | (572,415 | ) | | 267,881 | |
Change in unrealized appreciation/depreciation from investments and foreign currencies | | | (11,008,540 | ) | | 2,609,124 | | | (2,729,503 | ) | | 433,433 | |
| |
|
| |
|
| |
|
| |
|
| |
Change in net assets resulting from operations | | | (12,618,081 | ) | | 4,517,826 | | | (3,077,743 | ) | | 870,207 | |
| |
|
| |
|
| |
|
| |
|
| |
| | | | | | | | | | | | | |
Dividends: | | | | | | | | | | | | | |
Net investment income: | | | | | | | | | | | | | |
Class A Shares | | | (306,761 | ) | | (262,090 | ) | | (141,579 | ) | | (94,234 | ) |
Class B Shares | | | (139,765 | ) | | (132,843 | ) | | (79,044 | ) | | (56,207 | ) |
Class C Shares | | | (16,616 | ) | | (11,916 | ) | | (7,481 | ) | | (6,383 | ) |
| | | | | | | | | | | | | |
Net realized gains: | | | | | | | | | | | | | |
Class A Shares | | | (772,146 | ) | | (107,302 | ) | | (146,067 | ) | | (34,028 | ) |
Class B Shares | | | (634,501 | ) | | (94,696 | ) | | (110,864 | ) | | (29,598 | ) |
Class C Shares | | | (74,952 | ) | | (6,378 | ) | | (9,305 | ) | | (3,582 | ) |
Return of Capital: | | | | | | | | | | | | | |
Class A Shares | | | (20,619 | ) | | — | | | (262 | ) | | — | |
Class B Shares | | | (17,902 | ) | | — | | | (242 | ) | | — | |
Class C Shares | | | (2,090 | ) | | — | | | (23 | ) | | — | |
| |
|
| |
|
| |
|
| |
|
| |
Change in net assets resulting from shareholder dividends | | | (1,985,352 | ) | | (615,225 | ) | | (494,867 | ) | | (224,032 | ) |
| |
|
| |
|
| |
|
| |
|
| |
Change in net assets resulting from capital transactions | | | 4,171,062 | | | 11,050,090 | | | 1,063,369 | | | 5,431,997 | |
| |
|
| |
|
| |
|
| |
|
| |
Change in net assets | | | (10,432,371 | ) | | 14,952,691 | | | (2,509,241 | ) | | 6,078,172 | |
| | | | | | | | | | | | | |
Net Assets: | | | | | | | | | | | | | |
Beginning of period | | | 38,419,845 | | | 23,467,154 | | | 12,034,303 | | | 5,956,131 | |
| |
|
| |
|
| |
|
| |
|
| |
End of period | | $ | 27,987,474 | | $ | 38,419,845 | | $ | 9,525,062 | | $ | 12,034,303 | |
| |
|
| |
|
| |
|
| |
|
| |
Accumulated net investment income (loss) | | $ | — | | $ | 14,138 | | $ | — | | $ | 18,083 | |
| |
|
| |
|
| |
|
| |
|
| |
| | |
25 | HSBC INVESTOR LIFELINE FUNDS | See notes to financial statements. |
HSBC INVESTOR LIFELINE FUNDS
Statements of Changes in Net Assets (continued)
| | | | | | | | | | | | | |
| | Moderate Growth Strategy Fund | | Conservative Growth Strategy Fund | |
|
|
|
|
|
|
| | For the year
ended
October 31, 2008 | | For the year
ended
October 31, 2007 | | For the year
ended
October 31, 2008 | | For the year
ended
October 31, 2007 | |
|
|
|
|
|
|
|
|
|
|
CAPITAL TRANSACTIONS: | | | | | | | | | | | | | |
Class A Shares: | | | | | | | | | | | | | |
Proceeds from shares issued | | $ | 4,477,845 | | $ | 7,912,763 | | $ | 1,702,567 | | $ | 1,988,365 | |
Proceeds from shares issued in conversion | | | — | | | — | | | — | | | 1,774,237 | |
Dividends reinvested | | | 1,096,649 | | | 366,055 | | | 277,201 | | | 127,648 | |
Value of shares redeemed | | | (3,953,091 | ) | | (2,131,003 | ) | | (2,025,309 | ) | | (631,447 | ) |
| |
|
| |
|
| |
|
| |
|
| |
Class A Shares capital transactions | | | 1,621,403 | | | 6,147,815 | | | (45,541 | ) | | 3,258,803 | |
| |
|
| |
|
| |
|
| |
|
| |
| | | | | | | | | | | | | |
Class B Shares: | | | | | | | | | | | | | |
Proceeds from shares issued | | | 3,948,083 | | | 4,788,564 | | | 1,595,118 | | | 1,387,844 | |
Proceeds from shares issued in conversion | | | — | | | — | | | — | | | 981,527 | |
Dividends reinvested | | | 790,250 | | | 226,308 | | | 183,107 | | | 84,374 | |
Value of shares redeemed | | | (2,551,316 | ) | | (966,698 | ) | | (813,124 | ) | | (366,939 | ) |
| |
|
| |
|
| |
|
| |
|
| |
Class B Shares capital transactions | | | 2,187,017 | | | 4,048,174 | | | 965,101 | | | 2,086,806 | |
| |
|
| |
|
| |
|
| |
|
| |
| | | | | | | | | | | | | |
Class C Shares: | | | | | | | | | | | | | |
Proceeds from shares issued | | | 778,453 | | | 1,158,749 | | | 203,099 | | | 109,629 | |
Proceeds from shares issued in conversion | | | — | | | — | | | — | | | 23,289 | |
Dividends reinvested | | | 93,634 | | | 18,281 | | | 16,809 | | | 9,965 | |
Value of shares redeemed | | | (509,445 | ) | | (322,929 | ) | | (76,099 | ) | | (56,495 | ) |
| |
|
| |
|
| |
|
| |
|
| |
Class C Shares capital transactions | | | 362,642 | | | 854,101 | | | 143,809 | | | 86,388 | |
| |
|
| |
|
| |
|
| |
|
| |
Change in net assets resulting from capital transactions | | $ | 4,171,062 | | $ | 11,050,090 | | $ | 1,063,369 | | $ | 5,431,997 | |
| |
|
| |
|
| |
|
| |
|
| |
| | | | | | | | | | | | | |
SHARE TRANSACTIONS: | | | | | | | | | | | | | |
Class A Shares: | | | | | | | | | | | | | |
Issued | | | 382,474 | | | 638,805 | | | 157,831 | | | 172,826 | |
Issued in conversion | | | — | | | — | | | — | | | 148,136 | |
Reinvested | | | 91,761 | | | 29,777 | | | 25,060 | | | 11,167 | |
Redeemed | | | (355,687 | ) | | (173,246 | ) | | (199,713 | ) | | (54,690 | ) |
| |
|
| |
|
| |
|
| |
|
| |
Change in Class A Shares | | | 118,548 | | | 495,336 | | | (16,822 | ) | | 277,439 | |
| |
|
| |
|
| |
|
| |
|
| |
| | | | | | | | | | | | | |
Class B Shares: | | | | | | | | | | | | | |
Issued | | | 340,238 | | | 387,531 | | | 148,878 | | | 121,528 | |
Issued in conversion | | | — | | | — | | | — | | | 82,738 | |
Reinvested | | | 65,629 | | | 18,521 | | | 16,609 | | | 7,465 | |
Redeemed | | | (229,160 | ) | | (77,311 | ) | | (81,932 | ) | | (31,991 | ) |
| |
|
| |
|
| |
|
| |
|
| |
Change in Class B Shares | | | 176,707 | | | 328,741 | | | 83,555 | | | 179,740 | |
| |
|
| |
|
| |
|
| |
|
| |
| | | | | | | | | | | | | |
Class C Shares: | | | | | | | | | | | | | |
Issued | | | 68,169 | | | 95,099 | | | 18,026 | | | 9,224 | |
Issued in conversion | | | — | | | — | | | — | | | 1,922 | |
Reinvested | | | 7,964 | | | 1,520 | | | 1,489 | | | 864 | |
Redeemed | | | (46,372 | ) | | (27,016 | ) | | (7,369 | ) | | (4,861 | ) |
| |
|
| |
|
| |
|
| |
|
| |
Change in Class C Shares | | | 29,761 | | | 69,603 | | | 12,146 | | | 7,149 | |
| |
|
| |
|
| |
|
| |
|
| |
| | |
See notes to financial statements. | HSBC INVESTOR LIFELINE FUNDS | 26 |
|
HSBC INVESTOR AGGRESSIVE GROWTH STRATEGY FUND |
|
Financial Highlights |
|
Selected data for a share outstanding throughout the periods indicated. (a) |
| | | | | | | | | | | | | | | | | | | | | | |
| | | | Investment Activities | | Dividends | | | |
| | | |
| |
| | | |
| | Net Asset
Value,
Beginning
of Period | | Net
Investment
Income
(Loss) | | Net Realized
and Unrealized
Gains
(Losses) from
Investment
Transactions | | Total from
Investment
Activities | | Net
Realized
Gains from
Investment
Transactions | | Total
Dividends | | Net Asset
Value, End
of Period | |
|
|
|
|
|
|
|
|
|
|
|
|
|
|
|
|
CLASS A SHARES | | | | | | | | | | | | | | | | | | | | | | |
Period Ended October 31, 2005(h) | | $ | 10.00 | | | (0.01 | ) | | 0.61 | | | 0.60 | | | — | | | — | | $ | 10.60 | |
Year Ended October 31, 2006 | | | 10.60 | | | 0.01 | | | 2.01 | | | 2.02 | | | (0.05 | ) | | (0.05 | ) | | 12.57 | |
Year Ended October 31, 2007 | | | 12.57 | | | — | *(g) | | 2.98 | | | 2.98 | | | — | | | — | | | 15.55 | |
Year Ended October 31, 2008 | | | 15.55 | | | 0.02 | * | | (6.05 | ) | | (6.03 | ) | | (0.90 | ) | | (0.90 | ) | | 8.62 | |
|
|
|
|
|
|
|
|
|
|
|
|
|
|
|
|
|
|
|
|
|
|
|
CLASS B SHARES | | | | | | | | | | | | | | | | | | | | | | |
Period Ended October 31, 2005(i) | | $ | 10.00 | | | (0.04 | ) | | 0.61 | | | 0.57 | | | — | | | — | | $ | 10.57 | |
Year Ended October 31, 2006 | | | 10.57 | | | (0.05 | ) | | 1.97 | | | 1.92 | | | (0.05 | ) | | (0.05 | ) | | 12.44 | |
Year Ended October 31, 2007 | | | 12.44 | | | (0.11 | )* | | 2.94 | | | 2.83 | | | — | | | — | | | 15.27 | |
Year Ended October 31, 2008 | | | 15.27 | | | (0.08 | )* | | (5.90 | ) | | (5.98 | ) | | (0.90 | ) | | (0.90 | ) | | 8.39 | |
|
|
|
|
|
|
|
|
|
|
|
|
|
|
|
|
|
|
|
|
|
|
|
CLASS C SHARES | | | | | | | | | | | | | | | | | | | | | | |
Period Ended October 31, 2005(j) | | $ | 10.00 | | | (0.05 | ) | | 0.60 | | | 0.55 | | | — | | | — | | $ | 10.55 | |
Year Ended October 31, 2006 | | | 10.55 | | | (0.04 | ) | | 1.95 | | | 1.91 | | | (0.05 | ) | | (0.05 | ) | | 12.41 | |
Year Ended October 31, 2007 | | | 12.41 | | | (0.11 | )* | | 2.96 | | | 2.85 | | | — | | | — | | | 15.26 | |
Year Ended October 31, 2008 | | | 15.26 | | | (0.08 | )* | | (5.89 | ) | | (5.97 | ) | | (0.90 | ) | | (0.90 | ) | | 8.39 | |
|
|
|
|
|
|
|
|
|
|
|
|
|
|
|
|
|
|
|
|
|
|
|
| | | | | | | | | | | | | | | | | | | |
| | | | Ratios/Supplementary Data | |
| | | |
|
| | Total
Return(b) | | Net Assets
at End of
Period
(000’s) | | Ratio of Net
Expenses to
Average
Net Assets(c) | | Ratio of Net
Investment
Income (Loss)
to Average
Net Assets(c) | | Ratio of
Expenses to
Average Net
Assets(c)(d) | | Portfolio
Turnover
Rate(e) | |
|
|
|
|
|
|
|
|
|
|
|
|
|
|
CLASS A SHARES | | | | | | | | | | | | | | | | | | | |
Period Ended October 31, 2005(h) | | | 6.00 | % | $ | 726 | | | 1.50 | % | | (0.20 | )% | | 11.72 | % | | 49.10 | % |
Year Ended October 31, 2006 | | | 19.15 | % | | 4,116 | | | 1.50 | % | | 0.05 | % | | 3.52 | % | | 48.46 | % |
Year Ended October 31, 2007 | | | 23.71 | % | | 7,046 | | | 1.50 | % | | (0.03 | )% | | 2.27 | % | | 45.50 | % |
Year Ended October 31, 2008 | | | (40.92 | )%(f) | | 4,572 | | | 1.50 | % | | 0.13 | % | | 1.98 | % | | 72.33 | % |
|
|
|
|
|
|
|
|
|
|
|
|
|
|
|
|
|
|
|
|
CLASS B SHARES | | | | | | | | | | | | | | | | | | | |
Period Ended October 31, 2005(i) | | | 5.70 | % | $ | 700 | | | 2.25 | % | | (1.01 | )% | | 11.63 | % | | 49.10 | % |
Year Ended October 31, 2006 | | | 18.25 | % | | 2,998 | | | 2.25 | % | | (0.70 | )% | | 4.33 | % | | 48.46 | % |
Year Ended October 31, 2007 | | | 22.75 | % | | 4,942 | | | 2.25 | % | | (0.77 | )% | | 3.02 | % | | 45.50 | % |
Year Ended October 31, 2008 | | | (41.36 | )%(f) | | 3,166 | | | 2.25 | % | | (0.62 | )% | | 2.73 | % | | 72.33 | % |
|
|
|
|
|
|
|
|
|
|
|
|
|
|
|
|
|
|
|
|
CLASS C SHARES | | | | | | | | | | | | | | | | | | | |
Period Ended October 31, 2005(j) | | | 5.50 | % | $ | 21 | | | 2.25 | % | | (1.15 | )% | | 9.79 | % | | 49.10 | % |
Year Ended October 31, 2006 | | | 18.19 | % | | 229 | | | 2.25 | % | | (0.69 | )% | | 4.20 | % | | 48.46 | % |
Year Ended October 31, 2007 | | | 22.97 | % | | 528 | | | 2.25 | % | | (0.79 | )% | | 2.99 | % | | 45.50 | % |
Year Ended October 31, 2008 | | | (41.32 | )%(f) | | 319 | | | 2.25 | % | | (0.64 | )% | | 2.73 | % | | 72.33 | % |
|
|
|
|
|
|
|
|
|
|
|
|
|
|
|
|
|
|
|
|
| |
* | Calculated based on average shares outstanding. |
| |
(a) | The per share amounts and percentages reflect income and expenses assuming inclusion of the Fund’s proportionate share of the income and expenses of the applicable HSBC Investor Portfolios. |
| |
(b) | Not annualized for periods less than one year. Total return calculations do not include any sales or redemption charges. |
| |
(c) | Annualized for periods less than one year. |
| |
(d) | During the period certain fees were reduced. If such fee reductions had not occurred, the ratio would have been as indicated. |
| |
(e) | Portfolio turnover rate is calculated by aggregating the results of multiplying the Fund’s investment percentage in the respective Portfolios by the corresponding Portfolio’s portfolio turnover rates. Portfolio turnover rate is calculated on the basis of the Fund as a whole without distinguishing between classes of shares issued. |
| |
(f) | During the year ended October 31, 2008, certain HSBC Investor Portfolios in which the Fund invests in received certain nonrecurring litigation settlements. The corresponding impact to the total return was 0.11%, 0.11% and 0.11% for Class A Shares, Class B Shares and Class C Shares, respectively. |
| |
(g) | Rounds to less than $0.01. |
| |
(h) | Class A Shares commenced operations on February 14, 2005. |
| |
(i) | Class B Shares commenced operations on February 9, 2005. |
| |
(j) | Class C Shares commenced operations on June 9, 2005. |
| | |
27 | HSBC INVESTOR LIFELINE FUNDS | See notes to financial statements. |
|
HSBC INVESTOR GROWTH STRATEGY FUND |
|
Financial Highlights |
Selected data for a share outstanding throughout the periods indicated. (a)
| | | | | | | | | | | | | | | | | | | | | | | | | | | | | |
| | | | | Investment Activities | | Dividends | | | | |
| | | | |
| |
| | | | |
| | Net Asset
Value,
Beginning
of Period | | Net
Investment
Income
(Loss) | | Net Realized
and Unrealized
Gains
(Losses) from
Investment
Transactions | | Total from
Investment
Activities | | Net
Investment
Income | | Net
Realized
Gains from
Investment
Transactions | | Total
Dividends | | Net Asset
Value, End
of Period | |
|
|
|
|
|
|
|
|
|
|
|
|
|
|
|
|
|
|
CLASS A SHARES | | | | | | | | | | | | | | | | | | | | | | | | | | | | | |
Period Ended October 31, 2005(f) | | | $ | 10.00 | | | 0.02 | | | 0.70 | | | 0.72 | | | — | | | — | | | — | | | | $ | 10.72 | | |
Year Ended October 31, 2006 | | | | 10.72 | | | 0.07 | | | 1.69 | | | 1.76 | | | — | | | (0.03 | ) | | (0.03 | ) | | | | 12.45 | | |
Year Ended October 31, 2007 | | | | 12.45 | | | 0.11 | * | | 2.34 | | | 2.45 | | | (0.08 | ) | | (0.09 | ) | | (0.17 | ) | | | | 14.73 | | |
Year Ended October 31, 2008 | | | | 14.73 | | | 0.12 | * | | (5.21 | ) | | (5.09 | ) | | (0.09 | ) | | (0.74 | ) | | (0.83 | ) | | | | 8.81 | | |
|
|
|
|
|
|
|
|
|
|
|
|
|
|
|
|
|
|
|
|
|
|
|
|
|
|
|
|
|
|
CLASS B SHARES | | | | | | | | | | | | | | | | | | | | | | | | | | | | | |
Period Ended October 31, 2005(i) | | | $ | 10.00 | | | (0.01 | ) | | 0.79 | | | 0.78 | | | — | | | — | | | — | | | | $ | 10.78 | | |
Year Ended October 31, 2006 | | | | 10.78 | | | 0.02 | | | 1.66 | | | 1.68 | | | — | | | (0.03 | ) | | (0.03 | ) | | | | 12.43 | | |
Year Ended October 31, 2007 | | | | 12.43 | | | 0.01 | * | | 2.34 | | | 2.35 | | | (0.02 | ) | | (0.09 | ) | | (0.11 | ) | | | | 14.67 | | |
Year Ended October 31, 2008 | | | | 14.67 | | | 0.03 | * | | (5.20 | ) | | (5.17 | ) | | — | (k) | | (0.74 | ) | | (0.74 | ) | | | | 8.76 | | |
|
|
|
|
|
|
|
|
|
|
|
|
|
|
|
|
|
|
|
|
|
|
|
|
|
|
|
|
|
|
CLASS C SHARES | | | | | | | | | | | | | | | | | | | | | | | | | | | | | |
Period Ended October 31, 2005(j) | | | $ | 10.00 | | | (0.02 | ) | | 0.84 | | | 0.82 | | | — | | | — | | | — | | | | $ | 10.82 | | |
Year Ended October 31, 2006 | | | | 10.82 | | | 0.02 | | | 1.67 | | | 1.69 | | | — | | | (0.03 | ) | | (0.03 | ) | | | | 12.48 | | |
Year Ended October 31, 2007 | | | | 12.48 | | | 0.01 | * | | 2.35 | | | 2.36 | | | (0.01 | ) | | (0.09 | ) | | (0.10 | ) | | | | 14.74 | | |
Year Ended October 31, 2008 | | | | 14.74 | | | 0.03 | * | | (5.22 | ) | | (5.19 | ) | | (0.01 | ) | | (0.74 | ) | | (0.75 | ) | | | | 8.80 | | |
|
|
|
|
|
|
|
|
|
|
|
|
|
|
|
|
|
|
|
|
|
|
|
|
|
|
|
|
|
|
| | | | | | | | | | | | | | | | | | | | | |
| | | | | Ratios/Supplementary Data | |
| | | | |
|
| | | | | | |
| | Total
Return(b) | | Net Assets
at End of
Period
(000’s) | | Ratio of Net
Expenses to
Average
Net Assets(c) | | Ratio of Net
Investment
Income (Loss)
to Average
Net Assets(c) | | Ratio of
Expenses to
Average Net
Assets(c)(d) | | Portfolio
Turnover
Rate(e) | |
|
|
|
|
|
|
|
|
|
|
|
|
|
|
CLASS A SHARES | | | | | | | | | | | | | | | | | | | | | |
Period Ended October 31, 2005(f) | | 7.20 | % | | | $ | 2,814 | | | 1.50 | % | | 0.42 | % | | 5.19 | % | | 69.23 | % | |
Year Ended October 31, 2006 | | 16.41 | % | | | | 12,562 | | | 1.50 | % | | 0.87 | % | | 2.19 | % | | 80.30 | % | |
Year Ended October 31, 2007 | | 19.92 | %(g) | | | | 21,352 | | | 1.50 | % | | 0.84 | % | | 1.65 | % | | 73.45 | % | |
Year Ended October 31, 2008 | | (36.43 | )%(h) | | | | 13,908 | | | 1.50 | % | | 0.98 | % | | 1.53 | % | | 78.59 | % | |
|
|
|
|
|
|
|
|
|
|
|
|
|
|
|
|
|
|
|
|
|
|
CLASS B SHARES | | | | | | | | | | | | | | | | | | | | | |
Period Ended October 31, 2005(i) | | 7.80 | % | | | $ | 2,670 | | | 2.25 | % | | (0.38 | )% | | 5.74 | % | | 69.23 | % | |
Year Ended October 31, 2006 | | 15.57 | % | | | | 8,702 | | | 2.25 | % | | 0.11 | % | | 2.94 | % | | 80.30 | % | |
Year Ended October 31, 2007 | | 18.98 | %(g) | | | | 13,905 | | | 2.25 | % | | 0.09 | % | | 2.40 | % | | 73.45 | % | |
Year Ended October 31, 2008 | | (36.95 | )%(h) | | | | 9,516 | | | 2.25 | % | | 0.24 | % | | 2.28 | % | | 78.59 | % | |
|
|
|
|
|
|
|
|
|
|
|
|
|
|
|
|
|
|
|
|
|
|
CLASS C SHARES | | | | | | | | | | | | | | | | | | | | | |
Period Ended October 31, 2005(j) | | 8.20 | % | | | $ | 106 | | | 2.25 | % | | (0.55 | )% | | 5.24 | % | | 69.23 | % | |
Year Ended October 31, 2006 | | 15.61 | % | | | | 585 | | | 2.25 | % | | 0.14 | % | | 2.90 | % | | 80.30 | % | |
Year Ended October 31, 2007 | | 19.04 | %(g) | | | | 1,273 | | | 2.25 | % | | 0.07 | % | | 2.39 | % | | 73.45 | % | |
Year Ended October 31, 2008 | | (36.94 | )%(h) | | | | 937 | | | 2.25 | % | | 0.25 | % | | 2.29 | % | | 78.59 | % | |
|
|
|
|
|
|
|
|
|
|
|
|
|
|
|
|
|
|
|
|
|
|
| |
* | Calculated based on average shares outstanding. |
| |
(a) | The per share amounts and percentages reflect income and expenses assuming inclusion of the Fund’s proportionate share of the income and expenses of the applicable HSBC Investor Portfolios. |
| |
(b) | Not annualized for periods less than one year. Total return calculations do not include any sales or redemption charges. |
| |
(c) | Annualized for periods less than one year. |
| |
(d) | During the period certain fees were reduced. If such fee reductions had not occurred, the ratio would have been as indicated. |
| |
(e) | Portfolio turnover rate is calculated by aggregating the results of multiplying the Fund’s investment percentage in the respective Portfolios by the corresponding Portfolio’s portfolio turnover rates. Portfolio turnover rate is calculated on the basis of the Fund as a whole without distinguishing between classes of shares issued. |
| |
(f) | Class A Shares commenced operations on February 8, 2005. |
| |
(g) | During the year ended October 31, 2007, certain HSBC Investor Portfolios in which the Fund invests in received monies related to certain nonrecurring litigation settlements. The corresponding impact to the total return was 0.23%, 0.24% and 0.23% for Class A Shares, Class B Shares and Class C Shares, respectively. |
| |
(h) | During the year ended October 31, 2008, certain HSBC Investor Portfolios in which the Fund invests in received monies related to certain nonrecurring litigation settlements. The corresponding impact to the total return was 0.15%, 0.15% and 0.15% for Class A Shares, Class B Shares and Class C Shares, respectively. |
| |
(i) | Class B Shares commenced operations on February 1, 2005. |
| |
(j) | Class C Shares commenced operations on April 27, 2005. |
| |
(k) | Rounds to less than $0.01. |
| | |
See notes to financial statements. | HSBC INVESTOR LIFELINE FUNDS | 28 |
|
HSBC INVESTOR MODERATE GROWTH STRATEGY FUND |
|
Financial Highlights |
Selected data for a share outstanding throughout the periods indicated. (a)
| | | | | | | | | | | | | | | | | | | | | | | | | | | | | | | | |
| | | | | Investment Activities | | Dividends | | | | |
| | | | |
| |
| | | | |
| | Net Asset
Value,
Beginning
of Period | | Net
Investment
Income
(Loss) | | Net Realized
and Unrealized
Gains
(Losses) from
Investment
Transactions | | Total from
Investment
Activities | | Net
Investment
Income | | Net
Realized
Gains from
Investment
Transactions | | Return
of
Capital | | Total
Dividends | | Net Asset
Value, End
of Period | |
|
|
|
|
|
|
|
|
|
|
|
|
|
|
|
|
|
|
|
|
CLASS A SHARES | | | | | | | | | | | | | | | | | | | | | | | | | | | | | | | | |
Period Ended October 31, 2005(f) | | | $ | 10.00 | | | 0.04 | | | 0.45 | | | 0.49 | | | — | (g) | | — | | | — | | | — | (g) | | | $ | 10.49 | | |
Year Ended October 31, 2006 | | | | 10.49 | | | 0.17 | | | 1.23 | | | 1.40 | | | (0.17 | ) | | (0.01 | ) | | — | | | (0.18 | ) | | | | 11.71 | | |
Year Ended October 31, 2007 | | | | 11.71 | | | 0.21 | * | | 1.65 | | | 1.86 | | | (0.20 | ) | | (0.10 | ) | | — | | | (0.30 | ) | | | | 13.27 | | |
Year Ended October 31, 2008 | | | | 13.27 | | | 0.20 | * | | (4.08 | ) | | (3.88 | ) | | (0.19 | ) | | (0.50 | ) | | (0.01 | ) | | (0.70 | ) | | | | 8.69 | | |
|
|
|
|
|
|
|
|
|
|
|
|
|
|
|
|
|
|
|
|
|
|
|
|
|
|
|
|
|
|
|
|
|
CLASS B SHARES | | | | | | | | | | | | | | | | | | | | | | | | | | | | | | | | |
Period Ended October 31, 2005(j) | | | $ | 10.00 | | | 0.01 | | | 0.49 | | | 0.50 | | | — | (g) | | — | | | — | | | — | (g) | | | $ | 10.50 | | |
Year Ended October 31, 2006 | | | | 10.50 | | | 0.09 | | | 1.22 | | | 1.31 | | | (0.08 | ) | | (0.01 | ) | | — | | | (0.09 | ) | | | | 11.72 | | |
Year Ended October 31, 2007 | | | | 11.72 | | | 0.12 | * | | 1.65 | | | 1.77 | | | (0.12 | ) | | (0.10 | ) | | — | | | (0.22 | ) | | | | 13.27 | | |
Year Ended October 31, 2008 | | | | 13.27 | | | 0.11 | * | | (4.08 | ) | | (3.97 | ) | | (0.10 | ) | | (0.50 | ) | | (0.01 | ) | | (0.61 | ) | | | | 8.69 | | |
|
|
|
|
|
|
|
|
|
|
|
|
|
|
|
|
|
|
|
|
|
|
|
|
|
|
|
|
|
|
|
|
|
CLASS C SHARES | | | | | | | | | | | | | | | | | | | | | | | | | | | | | | | | |
Period Ended October 31, 2005(k) | | | $ | 10.00 | | | — | (g) | | 0.28 | | | 0.28 | | | — | | | — | | | — | | | — | | | | $ | 10.28 | | |
Year Ended October 31, 2006 | | | | 10.28 | | | 0.09 | | | 1.19 | | | 1.28 | | | (0.08 | ) | | (0.01 | ) | | — | | | (0.09 | ) | | | | 11.47 | | |
Year Ended October 31, 2007 | | | | 11.47 | | | 0.12 | * | | 1.60 | | | 1.72 | | | (0.12 | ) | | (0.10 | ) | | — | | | (0.22 | ) | | | | 12.97 | | |
Year Ended October 31, 2008 | | | | 12.97 | | | 0.11 | * | | (3.97 | ) | | (3.86 | ) | | (0.11 | ) | | (0.50 | ) | | (0.01 | ) | | (0.62 | ) | | | | 8.49 | | |
|
|
|
|
|
|
|
|
|
|
|
|
|
|
|
|
|
|
|
|
|
|
|
|
|
|
|
|
|
|
|
|
|
| | | | | | | | | | | | | | | | | | | | | |
| | | | | Ratios/Supplementary Data | |
| | | | |
|
| | | | | | |
| | Total
Return(b) | | Net Assets
at End of
Period
(000’s) | | Ratio of Net
Expenses to
Average
Net Assets(c) | | Ratio of Net
Investment
Income (Loss)
to Average
Net Assets(c) | | Ratio of
Expenses to
Average Net
Assets(c)(d) | | Portfolio
Turnover
Rate(e) | |
|
|
|
|
|
|
|
|
|
|
|
|
|
|
CLASS A SHARES | | | | | | | | | | | | | | | | | | | | | |
Period Ended October 31, 2005(f) | | 4.94 | % | | | $ | 3,241 | | | 1.50 | % | | 0.95 | % | | 4.30 | % | | 84.55 | % | |
Year Ended October 31, 2006 | | 13.40 | % | | | | 11,973 | | | 1.50 | % | | 1.65 | % | | 2.12 | % | | 101.57 | % | |
Year Ended October 31, 2007 | | 16.12 | %(h) | | | | 20,140 | | | 1.50 | % | | 1.70 | % | | 1.60 | % | | 92.87 | % | |
Year Ended October 31, 2008 | | (30.65 | )%(i) | | | | 14,226 | | | 1.48 | % | | 1.75 | % | | 1.48 | % | | 79.86 | % | |
|
|
|
|
|
|
|
|
|
|
|
|
|
|
|
|
|
|
|
|
|
|
CLASS B SHARES | | | | | | | | | | | | | | | | | | | | | |
Period Ended October 31, 2005(j) | | 5.03 | % | | | $ | 3,604 | | | 2.25 | % | | 0.18 | % | | 5.01 | % | | 84.55 | % | |
Year Ended October 31, 2006 | | 12.45 | % | | | | 10,731 | | | 2.25 | % | | 0.91 | % | | 2.87 | % | | 101.57 | % | |
Year Ended October 31, 2007 | | 15.25 | %(h) | | | | 16,513 | | | 2.25 | % | | 0.95 | % | | 2.35 | % | | 92.87 | % | |
Year Ended October 31, 2008 | | (31.17 | )%(i) | | | | 12,354 | | | 2.23 | % | | 1.00 | % | | 2.23 | % | | 79.86 | % | |
|
|
|
|
|
|
|
|
|
|
|
|
|
|
|
|
|
|
|
|
|
|
CLASS C SHARES | | | | | | | | | | | | | | | | | | | | | |
Period Ended October 31, 2005(k) | | 2.80 | % | | | $ | 278 | | | 2.25 | % | | 0.05 | % | | 4.69 | % | | 84.55 | % | |
Year Ended October 31, 2006 | | 12.53 | % | | | | 763 | | | 2.25 | % | | 0.87 | % | | 2.83 | % | | 101.57 | % | |
Year Ended October 31, 2007 | | 15.20 | %(h) | | | | 1,766 | | | 2.25 | % | | 0.95 | % | | 2.33 | % | | 92.87 | % | |
Year Ended October 31, 2008 | | (31.09 | )%(i) | | | | 1,408 | | | 2.23 | % | | 1.00 | % | | 2.23 | % | | 79.86 | % | |
|
|
|
|
|
|
|
|
|
|
|
|
|
|
|
|
|
|
|
|
|
|
| |
* | Calculated based on average shares outstanding. |
| |
(a) | The per share amounts and percentages reflect income and expenses assuming inclusion of the Fund’s proportionate share of the income and expenses of the applicable HSBC Investor Portfolios. |
| |
(b) | Not annualized for periods less than one year. Total return calculations do not include any sales or redemption charges. |
| |
(c) | Annualized for periods less than one year. |
| |
(d) | During the period certain fees were reduced. If such fee reductions had not occurred, the ratio would have been as indicated. |
| |
(e) | Portfolio turnover rate is calculated by aggregating the results of multiplying the Fund’s investment percentage in the respective Portfolios by the corresponding Portfolio’s portfolio turnover rates. Portfolio turnover rate is calculated on the basis of the Fund as a whole without distinguishing between classes of shares issued. |
| |
(f) | Class A Shares commenced operations on February 3, 2005. |
| |
(g) | Rounds to less than $0.01. |
| |
(h) | During the year ended October 31, 2007, certain HSBC Investor Portfolios in which the Fund invests in received monies related to certain nonrecurring litigation settlements. The corresponding impact to the total return was 0.41%, 0.41% and 0.33% for Class A Shares, Class B Shares and Class C Shares, respectively. |
| |
(i) | During the year ended October 31, 2008, certain HSBC Investor Portfolios in which the Fund invests in received monies related to certain nonrecurring litigation settlements. The corresponding impact to the total return was 0.19%, 0.19% and 0.19% for Class A Shares, Class B Shares and Class C Shares, respectively. |
| |
(j) | Class B Shares commenced operations on February 1, 2005. |
| |
(k) | Class C Shares commenced operations on June 9, 2005. |
| | |
29 | HSBC INVESTOR LIFELINE FUNDS | See notes to financial statements. |
|
HSBC INVESTOR CONSERVATIVE GROWTH STRATEGY FUND |
|
Financial Highlights |
Selected data for a share outstanding throughout the periods indicated. (a)
| | | | | | | | | | | | | | | | | | | | | | | | | | | | | |
| | | | | Investment Activities | | Dividends | | | | |
| | | | |
| |
| | | | |
| | Net Asset
Value,
Beginning
of Period | | Net
Investment
Income
(Loss) | | Net Realized
and Unrealized
Gains
(Losses) from
Investment
Transactions | | Total from
Investment
Activities | | Net
Investment
Income | | Net
Realized
Gains from
Investment
Transactions | | Total
Dividends | | Net Asset
Value, End
of Period | |
|
|
|
|
|
|
|
|
|
|
|
|
|
|
|
|
|
|
CLASS A SHARES | | | | | | | | | | | | | | | | | | | | | | | | | | | | | |
Period Ended October 31, 2005(i) | | | $ | 10.00 | | | 0.04 | | | 0.26 | | | 0.30 | | | (0.01 | ) | | — | | | (0.01 | ) | | | $ | 10.29 | | |
Year Ended October 31, 2006 | | | | 10.29 | | | 0.22 | | | 0.85 | | | 1.07 | | | (0.25 | ) | | — | | | (0.25 | ) | | | | 11.11 | | |
Year Ended October 31, 2007 | | | | 11.11 | | | 0.29 | * | | 1.03 | | | 1.32 | | | (0.27 | ) | | (0.12 | ) | | (0.39 | ) | | | | 12.04 | | |
Year Ended October 31, 2008 | | | | 12.04 | | | 0.24 | * | | (2.93 | ) | | (2.69 | ) | | (0.25 | ) | | (0.26 | ) | | (0.51 | ) | | | | 8.84 | | |
|
|
|
|
|
|
|
|
|
|
|
|
|
|
|
|
|
|
|
|
|
|
|
|
|
|
|
|
|
|
CLASS B SHARES | | | | | | | | | | | | | | | | | | | | | | | | | | | | | |
Period Ended October 31, 2005(j) | | | $ | 10.00 | | | 0.03 | | | 0.16 | | | 0.19 | | | — | (f) | | — | | | — | (f) | | | $ | 10.19 | | |
Year Ended October 31, 2006 | | | | 10.19 | | | 0.15 | | | 0.83 | | | 0.98 | | | (0.16 | ) | | — | | | (0.16 | ) | | | | 11.01 | | |
Year Ended October 31, 2007 | | | | 11.01 | | | 0.20 | * | | 1.05 | | | 1.25 | | | (0.20 | ) | | (0.12 | ) | | (0.32 | ) | | | | 11.94 | | |
Year Ended October 31, 2008 | | | | 11.94 | | | 0.16 | * | | (2.91 | ) | | (2.75 | ) | | (0.17 | ) | | (0.26 | ) | | (0.43 | ) | | | | 8.76 | | |
|
|
|
|
|
|
|
|
|
|
|
|
|
|
|
|
|
|
|
|
|
|
|
|
|
|
|
|
|
|
CLASS C SHARES | | | | | | | | | | | | | | | | | | | | | | | | | | | | | |
Period Ended October 31, 2005(k) | | | $ | 10.00 | | | 0.03 | | | 0.38 | | | 0.41 | | | — | | | — | | | — | | | | $ | 10.41 | | |
Year Ended October 31, 2006 | | | | 10.41 | | | 0.15 | | | 0.85 | | | 1.00 | | | (0.17 | ) | | — | | | (0.17 | ) | | | | 11.24 | | |
Year Ended October 31, 2007 | | | | 11.24 | | | 0.21 | * | | 1.11 | | | 1.32 | | | (0.19 | ) | | (0.12 | ) | | (0.31 | ) | | | | 12.25 | | |
Year Ended October 31, 2008 | | | | 12.25 | | | 0.16 | * | | (2.98 | ) | | (2.82 | ) | | (0.17 | ) | | (0.26 | ) | | (0.43 | ) | | | | 9.00 | | |
|
|
|
|
|
|
|
|
|
|
|
|
|
|
|
|
|
|
|
|
|
|
|
|
|
|
|
|
|
|
| | | | | | | | | | | | | | | | | | | |
| | | | | Ratios/Supplementary Data | |
| | | | |
|
| | | | | | | | | | | | | |
| | Total
Return(b) | | Net Assets
at End of
Period
(000’s) | | Ratio of Net
Expenses to
Average
Net Assets(c) | | Ratio of Net
Investment
Income (Loss)
to Average
Net Assets(c) | | Ratio of
Expenses to
Average Net
Assets(c)(d) | | Portfolio
Turnover
Rate(e) | |
|
|
|
|
|
|
|
|
|
|
|
|
|
|
CLASS A SHARES | | | | | | | | | | | | | | | | | | | |
Period Ended October 31, 2005(i) | | 2.96 | % | | $ | 1,054 | | 1.50 | % | | 1.28 | % | | 8.01 | % | | 72.14 | % | |
Year Ended October 31, 2006 | | 10.48 | % | | | 3,069 | | 1.50 | % | | 2.33 | % | | 3.22 | % | | 96.58 | % | |
Year Ended October 31, 2007 | | 12.13 | %(g) | | | 6,669 | | 1.50 | % | | 2.52 | % | | 2.06 | % | | 88.67 | % | |
Year Ended October 31, 2008 | | (23.17 | )%(h) | | | 4,747 | | 1.50 | % | | 2.24 | % | | 1.72 | % | | 68.74 | % | |
|
|
|
|
|
|
|
|
|
|
|
|
|
|
|
|
|
|
|
|
CLASS B SHARES | | | | | | | | | | | | | | | | | | | |
Period Ended October 31, 2005(j) | | 1.92 | % | | $ | 1,306 | | 2.25 | % | | 0.53 | % | | 9.21 | % | | 72.14 | % | |
Year Ended October 31, 2006 | | 9.65 | % | | | 2,567 | | 2.25 | % | | 1.54 | % | | 3.98 | % | | 96.58 | % | |
Year Ended October 31, 2007 | | 11.51 | %(g) | | | 4,928 | | 2.25 | % | | 1.77 | % | | 2.82 | % | | 88.67 | % | |
Year Ended October 31, 2008 | | (23.76 | )%(h) | | | 4,348 | | 2.25 | % | | 1.48 | % | | 2.48 | % | | 68.74 | % | |
|
|
|
|
|
|
|
|
|
|
|
|
|
|
|
|
|
|
|
|
CLASS C SHARES | | | | | | | | | | | | | | | | | | | |
Period Ended October 31, 2005(k) | | 4.10 | % | | $ | 82 | | 2.25 | % | | 0.66 | % | | 7.94 | % | | 72.14 | % | |
Year Ended October 31, 2006 | | 9.66 | % | | | 320 | | 2.25 | % | | 1.56 | % | | 3.92 | % | | 96.58 | % | |
Year Ended October 31, 2007 | | 11.97 | %(g) | | | 437 | | 2.25 | % | | 1.78 | % | | 2.85 | % | | 88.67 | % | |
Year Ended October 31, 2008 | | (23.73 | )%(h) | | | 430 | | 2.25 | % | | 1.46 | % | | 2.48 | % | | 68.74 | % | |
|
|
|
|
|
|
|
|
|
|
|
|
|
|
|
|
|
|
|
|
| |
* | Calculated based on average shares outstanding. |
| |
(a) | The per share amounts and percentages reflect income and expenses assuming inclusion of the Fund’s proportionate share of the income and expenses of the applicable HSBC Investor Portfolios. |
| |
(b) | Not annualized for periods less than one year. Total return calculations do not include any sales or redemption charges. |
| |
(c) | Annualized for periods less than one year. |
| |
(d) | During the period certain fees were reduced. If such fee reductions had not occurred, the ratio would have been as indicated. |
| |
(e) | Portfolio turnover rate is calculated by aggregating the results of multiplying the Fund’s investment percentage in the respective Portfolios by the corresponding Portfolio’s portfolio turnover rates. Portfolio turnover rate is calculated on the basis of the Fund as a whole without distinguishing between classes of shares issued. |
| |
(f) | Rounds to less than $0.01. |
| |
(g) | During the year ended October 31, 2007, certain HSBC Investor Portfolios in which the Fund invests in received monies related to certain nonrecurring litigation settlements. The corresponding impact to the total return was 0.44%, 0.47% and 0.48% for Class A Shares, Class B Shares and Class C Shares, respectively. |
| |
(h) | During the year ended October 31, 2008, certain HSBC Investor Portfolios in which the Fund invests in received monies related to certain nonrecurring litigation settlements. The corresponding impact to the total return was 0.19%, 0.19% and 0.19% for Class A Shares, Class B Shares and Class C Shares, respectively. |
| |
(i) | Class A Shares commenced operations on February 23, 2005. |
| |
(j) | Class B Shares commenced operations on February 17, 2005. |
| |
(k) | Class C Shares commenced operations on April 19, 2005. |
| | |
See notes to financial statements. | HSBC INVESTOR LIFELINE FUNDS | 30 |
|
HSBC INVESTOR LIFELINE FUNDS |
|
Notes to Financial Statements—As of October 31, 2008 |
| |
1. | Organization: |
| |
| The HSBC Investor Funds (the “Trust”), a Massachusetts business trust organized on April 22, 1987, is registered under the Investment Company Act of 1940, as amended (the “Act”), as an open-end management investment company. As of October 31, 2008, the Trust is comprised of 19 separate operational funds, each a series of the HSBC Investor Family of Funds. The accompanying financial statements are presented for the following 4 funds (individually a “Fund”, collectively the “LifeLine Funds”): |
| | | | | |
| Fund | | | Short Name | |
|
| | |
| |
| HSBC Investor Aggressive Growth Strategy Fund | | Aggressive Growth Fund |
| HSBC Investor Growth Strategy Fund | | Growth Strategy Fund |
| HSBC Investor Moderate Growth Strategy Fund | | Moderate Growth Fund |
| HSBC Investor Conservative Growth Strategy Fund | | Conservative Growth Fund |
| |
| The LifeLine Funds are diversified series of the Trust and part of the HSBC Investor Family of Funds. Financial statements for all other funds of the HSBC Investor Family of Funds are published separately. |
| |
| The HSBC Investor Core Plus Fixed Income Portfolio, HSBC Investor High Yield Fixed Income Portfolio, HSBC Investor Intermediate Duration Fixed Income Portfolio, HSBC Investor Growth Portfolio, HSBC Investor International Equity Portfolio, HSBC Investor Opportunity Portfolio and the HSBC Investor Value Portfolio (individually a “Portfolio,” collectively the “Portfolios”) are each diversified series of the HSBC Investor Portfolios (the “Portfolio Trust”). The Portfolios operate as master funds in master-feeder arrangements. |
| |
| The HSBC Investor Prime Money Market Fund (the “Prime Money Market Fund”) is an open-end management investment company and is a diversified series of the Trust. |
| |
| The financial statements of the Portfolios, including the Schedules of Portfolio Investments, are included elsewhere in this report. The financial statements of the Portfolios should be read in conjunction with the financial statements of the LifeLine Funds. |
| |
| The LifeLine Funds utilize a master-feeder fund structure and seek to achieve its investment objectives by investing all of its investable assets in the Portfolios and the Prime Money Market Fund (collectively the “Underlying Portfolios”) as follows: |
| |
| LifeLine Funds Portfolio Weightings |
| | | | | | | | | | | | | |
Underlying Portfolios | | Aggressive
Growth
Fund | | Growth
Strategy
Fund | | Moderate
Growth
Fund | | Conservative
Growth
Fund | |
| |
| |
| |
| |
| |
Core Plus Fixed Income Portfolio | | | None | | | 14 | % | | 25 | % | | 25 | % |
High Yield Fixed Income Portfolio | | | None | | | 2 | % | | 5 | % | | 8 | % |
Intermediate Duration Fixed Income Portfolio | | | None | | | None | | | None | | | 3 | % |
Growth Portfolio | | | 21 | % | | 21 | % | | 19 | % | | 15 | % |
International Equity Portfolio | | | 23 | % | | 20 | % | | 16 | % | | 10 | % |
Opportunity Portfolio | | | 34 | % | | 21 | % | | 11 | % | | 4 | % |
Value Portfolio | | | 21 | % | | 21 | % | | 18 | % | | 14 | % |
Prime Money Market Fund | | | 1 | % | | 1 | % | | 6 | % | | 21 | % |
| |
|
| |
|
| |
|
| |
|
| |
Total | | | 100 | % | | 100 | % | | 100 | % | | 100 | % |
| |
|
| |
|
| |
|
| |
|
| |
| |
31 | HSBC INVESTOR LIFELINE FUNDS |
|
HSBC INVESTOR LIFELINE FUNDS |
|
Notes to Financial Statements—As of October 31, 2008 (continued) |
LifeLine Funds Portfolio Investments
| | | | | | | | | | | | | |
Underlying Portfolios | | Aggressive
Growth
Fund | | Growth
Strategy
Fund | | Moderate
Growth
Fund | | Conservative
Growth
Fund | |
| |
| |
| |
| |
| |
Core Plus Fixed Income Portfolio | | $ | — | | $ | 3,514,143 | | $ | 7,079,763 | | $ | 2,329,883 | |
High Yield Fixed Income Portfolio | | | — | | | 468,980 | | | 1,362,730 | | | 746,240 | |
Intermediate Duration Fixed Income Portfolio | | | — | | | — | | | — | | | 279,768 | |
Growth Portfolio | | | 1,691,953 | | | 5,169,383 | | | 5,435,928 | | | 1,468,786 | |
International Equity Portfolio | | | 1,841,669 | | | 4,892,903 | | | 4,265,057 | | | 973,151 | |
Opportunity Portfolio | | | 2,775,443 | | | 4,988,081 | | | 3,188,581 | | | 396,836 | |
Value Portfolio | | | 1,684,159 | | | 5,145,525 | | | 5,126,129 | | | 1,364,560 | |
Prime Money Market Fund | | | 74,513 | | | 230,718 | | | 1,629,963 | | | 1,974,707 | |
| |
|
| |
|
| |
|
| |
|
| |
Total | | $ | 8,067,737 | | $ | 24,409,733 | | $ | 28,088,151 | | $ | 9,533,931 | |
| |
|
| |
|
| |
|
| |
|
| |
| |
| The LifeLine Funds are authorized to issue an unlimited number of shares of beneficial interest with a par value of $0.001 per share. Each Fund offers three classes of shares: Class A Shares, Class B Shares and Class C Shares. Class A Shares of the Aggressive Growth Fund, Growth Strategy Fund, Moderate Growth Fund, and the Conservative Growth Fund have a maximum sales charge of 5.00% as a percentage of the original purchase price. The Class B Shares of the LifeLine Funds are offered without any front-end sales charge, but will be subject to a contingent deferred sales charge (“CDSC”) ranging from a maximum of 4.00% if redeemed less than one year after purchase to 0.00% if redeemed more than four years after purchase. Class C Shares of the LifeLine Funds are offered without any front-end sales charge, but will be subject to a maximum CDSC of 1.00% if redeemed less than one year after purchase. Each class of shares in the LifeLine Funds has identical rights and privileges except with respect to arrangements pertaining to shareholder servicing or distribution, class-related expenses, voting rights on matters affecting a single class of shares, and the exchange privileges of each class of shares. |
| |
| Under the Trust’s organizational documents, the LifeLine Funds’ Officers and Trustees are indemnified against certain liabilities arising out of the performance of their duties to the LifeLine Funds. In addition, in the normal course of business, the LifeLine Funds enter into contracts with its service providers, which also provide for indemnifications by the LifeLine Funds. The LifeLine Funds’ maximum exposure under these arrangements is unknown as this would involve any future claims that may be made against the LifeLine Funds. However, based on experience, the LifeLine Funds expect that risk of loss to be remote. |
| |
2. | Significant Accounting Policies: |
| |
| The following is a summary of the significant accounting policies followed by the LifeLine Funds in the preparation of their financial statements. The policies are in conformity with U.S. generally accepted accounting principles (“GAAP”). The preparation of financial statements requires management to make estimates and assumptions that affect the reported amounts of assets and liabilities and disclosure of contingent assets and liabilities at the date of the financial statements and the reported amounts of income and expenses for the period. Actual results could differ from those estimates. |
| |
| Securities Valuation: |
| |
| The LifeLine Funds record their investments in the Underlying Portfolios at fair value. The LifeLine Funds record their investments in the Prime Money Market Fund at the respective net asset value reported by the fund. The underlying securities of the Portfolios and the Prime Money Market Fund are recorded at fair value and at amortized cost, respectively, as more fully discussed in the notes to those financial statements. |
| |
| Investment Transactions and Related Income: |
| |
| The LifeLine Funds record daily their pro-rata income, expenses and unrealized/realized gains and losses derived from their respective Portfolio. Dividend income is recorded on the ex-dividend date for the Prime Money Market Fund. Changes in holdings of the Prime Money Market Fund for each LifeLine Fund are reflected no later than the first business day following trade date. However, for financial reporting purposes, changes in holdings of the Prime Money Market Fund are reflected as of trade date. In addition, the LifeLine Funds accrue their own expenses daily as incurred. |
| |
HSBC INVESTOR LIFELINE FUNDS | 32 |
|
HSBC INVESTOR LIFELINE FUNDS |
|
Notes to Financial Statements—As of October 31, 2008 (continued) |
| |
| Allocations: |
| |
| Expenses directly attributable to a Fund are charged to that Fund. Expenses not directly attributable to a Fund are allocated proportionately among various or all LifeLine Funds within the HSBC Investor Family of Funds in relation to the net assets of each Fund or on another reasonable basis. Class specific expenses are charged directly to the class incurring the expense. In addition, income, expenses (other than class specific expenses), and unrealized/realized gains and losses are allocated to each class based on relative net assets on a daily basis. |
| |
| Dividends to Shareholders: |
| |
| Dividends from net investment income, if any, are declared and distributed quarterly in the case of the Moderate Growth Fund and Conservative Growth Fund, and annually in the case of the Aggressive Growth Fund and Growth Strategy Fund. |
| |
| The LifeLine Funds’ net realized gains, if any, are distributed to shareholders at least annually. Additional distributions are also made to the LifeLine Funds’ shareholders to the extent necessary to avoid the federal excise tax on certain undistributed income and net capital gains of regulated investment companies. |
| |
| The amount and character of net investment income and net realized gains distributions are determined in accordance with federal income tax regulations which may differ from GAAP. These “book/tax” differences are either considered temporary or permanent in nature. To the extent these differences are permanent in nature (e.g., reclassification of market discounts, certain gain/loss, paydowns, and certain distributions), such amounts are reclassified within the composition of net assets; temporary differences (e.g., wash losses and post-october loss deferrals) do not require reclassification. The LifeLine Funds may utilize equalization accounting for tax purposes and designate earnings and profits, including net realized gains distributed to shareholders on redemption of shares, as a part of the dividends paid deduction for income tax purposes. |
| |
| Redemption Fee: |
| |
| A redemption fee of 2.00% will be charged and recorded as paid-in-capital for any shares redeemed or exchanged after holding them for less than 30 days. This fee does not apply to shares purchased through reinvested dividends or capital gains or shares held in certain omnibus accounts or retirement plans that cannot implement the fee. For the fiscal years ended October 31, 2007 and October 31, 2008, respective of the following LifeLine Funds collected redemption fees as follows: |
| | | | | | | | | | | |
Fund | | Fees Collected
October 31, 2007 | | Fees Collected
October 31, 2008 | |
| |
| |
| |
Aggressive Growth Fund | | | $ | 1,573 | | | | $ | 119 | | |
Growth Strategy Fund | | | | 729 | | | | | 1,152 | | |
Moderate Growth Fund | | | | 515 | | | | | 187 | | |
Conservative Growth Fund | | | | 1,305 | | | | | 2,849 | | |
| |
| Federal Income Taxes: |
| |
| Each Fund is a separate taxable entity for federal income tax purposes. Each Fund has qualified and intends to continue to qualify each year as a “regulated investment company” under Subchapter M of the Internal Revenue Code, as amended and to distribute substantially all of their taxable net investment income and net realized gains, if any, to their shareholders. Accordingly, no provision for federal income or excise tax is required. |
| |
| In addition, effective April 30, 2008, the Funds adopted Financial Accounting Standards Board Interpretation No. 48, Accounting for Uncertainty in Income Taxes (“FIN 48”). FIN 48 provides guidance for how uncertain tax positions should be recognized, measured, presented and disclosed in the financial statements. FIN 48 requires the affirmative evaluation of tax positions taken or expected to be taken in the course of preparing the Trust’s tax returns to determine whether it is more-likely-than-not (i.e., greater than 50-percent) that each tax position will be sustained upon examination by a taxing authority based on the technical merits of the position. A tax position that meets the more-likely-than-not recognition threshold is measured to determine the amount of benefit to recognize in the financial statements. Differences between tax positions taken in a tax return and amounts recognized in the financial statements will generally result in an increase in a liability for taxes payable (or a reduction of a tax refund receivable), including the recognition of any related interest and penalties as an operating expense. Implementation of FIN 48 included a review of tax positions taken in tax years that remain subject to examination by tax authorities in all major tax jurisdictions, including federal (i.e., the last 4 tax year ends and the interim tax period since then, as applicable). The adoption of FIN 48 did not impact the Funds’ net assets or results of operations. |
| |
33 | HSBC INVESTOR LIFELINE FUNDS |
|
HSBC INVESTOR LIFELINE FUNDS |
|
Notes to Financial Statements—As of October 31, 2008 (continued) |
| |
| New Accounting Pronouncements: |
| |
| In September 2006, the Financial Accounting Standards Board (“FASB”) issued Statement on Financial Accounting Standards (“SFAS”) No. 157, “Fair Value Measurements” (“SFAS No. 157”). This standard establishes a single authoritative definition of fair value, sets out a framework for measuring fair value and requires additional disclosures about fair value measurements. SFAS No. 157 applies to fair value measurements already required or permitted by existing standards. SFAS No. 157 is effective for financial statements issued for fiscal years beginning after November 15, 2007 and interim periods within those fiscal years. The changes to current generally accepted accounting principles from the application of this Statement relate to the definition of fair value, the methods used to measure fair value, and the expanded disclosures about fair value measurements. Effective November 1, 2008 the Trust adopted SFAS No. 157. The adoption of this standard did not have an impact to the net assets or results of operations of the Fund, however, additional disclosures will be required about the inputs used to develop fair value measurements and the effect of certain measurements on the changes in net assets in fiscal reporting periods subsequent to the adoption date. |
| |
| In March 2008, the FASB issued the SFAS No. 161, “Disclosures about Derivative Instruments and Hedging Activities” (“SFAS 161”). SFAS 161 is effective for fiscal years and interim periods beginning after November 15, 2008. SFAS 161 requires enhanced disclosures about the Fund’s derivative and hedging activities, including how such activities are accounted for and their effect on the Lifeline Funds financial position, performance and cash flows. Management is currently evaluating the impact, the adoption of SFAS 161 will have on the Fund’s financial statements and related disclosures. |
| |
3. | Related Party Transactions: |
| |
| Investment Management: |
| |
| HSBC Global Asset Management (USA) Inc. (“HSBC” or the “Investment Adviser”), a wholly owned subsidiary of HSBC Bank USA, N.A., a national bank organized under the laws of the United States, acts as Investment Adviser to the LifeLine Funds. As Investment Adviser, HSBC manages the investments of the LifeLine Funds and continuously reviews, supervises and administers the LifeLine Funds’ investments. For its services as Investment Adviser, HSBC is entitled to receive a fee, computed daily and paid monthly, based on average daily net assets, at an annual rate of 0.05% for each Fund. |
| |
| Administration: |
| |
| HSBC serves the LifeLine Funds as Administrator. Under the terms of the Administration Agreement, HSBC receives from the LifeLine Funds a fee, accrued daily and paid monthly, at an annual rate of: |
| | | |
Based on Average Daily Net Assets of | | Fee Rate | |
| |
| |
Up to $12 billion | | 0.0525% | |
In excess of $12 billion | | 0.0350% | |
| |
| The fee breakpoints are determined on the basis of the aggregate average daily net assets of the HSBC Investor Family of Funds. The fee is allocated to each series of the HSBC Investor Family of Funds based upon its pro-rata share of net assets. For assets invested in Underlying Portfolios by LifeLine Funds, the Portfolios pay half of the administration fee and the LifeLine Funds pay half, for a combination of the total fee rate above. |
| |
| The administration fees accrued for each class by Fund, of which 50% of such fees are deemed to be class specific, are as follows: |
| | | | | | | | | | | | | | | | | | | | | |
| | Aggressive
Growth
Strategy Fund | | Growth
Strategy Fund | | Moderate
Growth
Fund | | Conservative
Growth
Fund | |
| |
| |
| |
| |
| |
Class A | | | $ | 1,432 | | | | $ | 4,101 | | | | $ | 3,986 | | | | $ | 1,270 | | |
Class B | | | | 991 | | | | | 2,808 | | | | | 3,461 | | | | | 1,163 | | |
Class C | | | | 100 | | | | | 276 | | | | | 395 | | | | | 114 | | |
| | |
|
| | | |
|
| | | |
|
| | | |
|
| | |
Total | | | $ | 2,523 | | | | $ | 7,185 | | | | $ | 7,842 | | | | $ | 2,547 | | |
| | |
|
| | | |
|
| | | |
|
| | | |
|
| | |
| |
| Pursuant to a Sub-Administration Agreement with HSBC, Citi Fund Services Ohio, Inc. (“Citi Ohio”), a wholly-owned subsidiary of Citigroup, Inc., serves as the Trust’s Sub-Administrator, subject to the general supervision of the Trusts’ Board of Trustees and HSBC. For these services, Citi Ohio is entitled to a fee, payable by HSBC, at an annual rate equivalent to the fee rates set forth above, minus 0.02% (2 basis points) which is retained by HSBC. |
| |
HSBC INVESTOR LIFELINE FUNDS | 34 |
|
HSBC INVESTOR LIFELINE FUNDS |
|
Notes to Financial Statements—As of October 31, 2008 (continued) |
| |
| Under a Compliance Services Agreement between the Trusts and Citi Ohio (the “CCO Agreement”), Citi Ohio makes an employee available to serve as the Trusts’ Chief Compliance Officer (the “CCO”). Under the CCO Agreement, Citi Ohio also provides infrastructure and support in implementing the written policies and procedures comprising the Trusts’ compliance program, including support services to the CCO. For the services provided under the CCO Agreement, the HSBC Investor Family of Funds paid Citi Ohio $250,800 for the year ended October 31, 2008, plus reimbursement of certain out of pocket expenses. Expenses incurred are reflected on the Statements of Operations as “Compliance Service.” Citi Ohio pays the salary and other compensation earned by any such individuals as employees of Citi Ohio. |
| |
| Distribution Plan: |
| |
| Foreside Distribution Services, L.P. (“Foreside”), a wholly-owned subsidiary of Foreside Financial Group LLC, serves the Trust as Distributor (the “Distributor”). The Trust has adopted a non-compensatory Distribution Plan and Agreement (the “Plan”) pursuant to Rule 12b-1 of the Act. The Plan provides for reimbursement of expenses incurred by the Distributor related to distribution and marketing, at a rate not to exceed 0.25%, 1.00%, and 1.00% of the average daily net assets of Class A Shares (currently not being charged), Class B Shares (currently charging 0.75%), and Class C Shares (currently charging 0.75%) of the LifeLine Funds, respectively. Foreside, as Distributor, also received $609,707, $380,866 and $21,569 in commissions from sales of HSBC Investor Family of Funds, for Class A Shares, Class B Shares, and Class C Shares, respectively of which $433,949, $280,535, and $14,592 were reallowed to affiliated brokers and dealers, for Class A Shares, Class B Shares, and Class C Shares, respectively. |
| |
| Shareholder Servicing: |
| |
| The Trust has adopted an Shareholder Services Plan, formerly known as Administrative Service Plan, which provides for payments to Shareholder Servicing Agents (which currently consist of HSBC and its affiliates) for providing various shareholder services. For performing these services, the Shareholder Servicing Agents receive a fee up to 0.25%, 0.25%, and 0.25% that is computed daily and paid monthly equal to a percentage of average daily net assets of Class A Shares, Class B Shares and Class C Shares of the Lifeline Funds, respectively. The fees paid to the Distributor pursuant to the Distribution Plan and to shareholder servicing agents pursuant to the Shareholder Services Plan currently are not intended to exceed, in the aggregate, 0.25% of the average daily net assets of Class A Shares, 1.00% of the average daily net assets of Class B Shares and Class C Shares. |
| |
| Fund Accounting, Transfer Agency and Trustee: |
| |
| Citi Ohio provides fund accounting and transfer agency services for each Fund. As Transfer Agent for the LifeLine Funds, Citi Ohio receives a fee based on the number of LifeLine Funds and shareholder accounts, subject to certain minimums and reimbursement of certain expenses. As Fund Accountant for the LifeLine Funds, Citi Ohio receives an annual fee per Fund and share class, subject to minimums and reimbursement of certain expenses. |
| |
| Effective April 1, 2008 each of the non-interested Trustees are compensated with a $60,000 annual Board retainer, as well as a $3,000 annual retainer for each Committee of the Board. Each non-interested Trustee also receives a $5,000 and $3,000 meeting fee for each regular in-person Board meeting and Committee meeting, respectively. Furthermore, each non-interested Trustee receives compensation for attending special meetings and/or functioning as a Committee Chairperson or Lead Trustee. In addition, the non-interested Trustees are reimbursed for certain expenses incurred in connection with their Board membership. |
| |
| Prior to April 1, 2008 each of the non-interested Trustees were compensated with a $35,000 annual Board retainer, as well as a $3,000 annual retainer for each Committee of the Board. Each non-interested Trustee also received a $5,000 and $3,000 meeting fee for each regular in-person Board meeting and Committee meeting, respectively. Furthermore, each non-interested Trustee received compensation for attending special meetings and/or functioning as a Committee Chairperson or Lead Trustee. In addition, the non-interested Trustees were reimbursed for certain expenses incurred in connection with their Board membership. |
| |
| Fee Reductions: |
| |
| The Investment Adviser has agreed to contractually limit through March 1, 2009 the total expenses, exclusive of interest, taxes, brokerage commissions, and extraordinary expenses of the LifeLine Funds. Each Fund Class has its own expense limitations based on the average daily net assets for any full fiscal year as follows: Class A Shares 1.50%, Class B Shares 2.25%, Class C Shares 2.25%. |
| |
35 | HSBC INVESTOR LIFELINE FUNDS |
|
HSBC INVESTOR LIFELINE FUNDS |
|
Notes to Financial Statements—As of October 31, 2008 (continued) |
| |
| The Administrator and Citi Ohio may voluntarily waive/reimburse fees to help support the expense limits of each Fund. In addition, the Investment Adviser may waive/reimburse additional fees at their discretion. Amounts waived/reimbursed by the Investment Adviser, Administrator, and Citi Ohio are reported separately on the Statements of Operations, as applicable. All contractual and any voluntary fee waivers/reimbursements are not subject to recoupment in subsequent fiscal periods. Voluntary waivers/reimbursements may be stopped at any time. |
| |
4. | Investment Transactions: |
| |
| Aggregate contributions and withdrawals of the Underlying Portfolios for the year ended October 31, 2008 totaled: |
| | | | | | | |
| | Contributions | | Withdrawals | |
| |
| |
| |
Aggressive Growth Fund | | $ | 3,120,255 | | $ | 2,057,906 | |
Growth Strategy Fund | | | 8,228,397 | | | 6,694,064 | |
Moderate Growth Fund | | | 10,956,451 | | | 8,966,405 | |
Conservative Growth Fund | | | 4,525,048 | | | 4,097,349 | |
| |
5. | Federal Tax Information: |
| |
| The tax character of dividends paid by the LifeLine Funds as of the latest tax year ended October 31, 2008 were as follows: |
| | | | | | | | | | | | | | | | |
| | Distributions paid from | | | | |
| |
| | | | |
| | Ordinary
Income | | Net
Long-Term
Gains | | Total
Taxable
Dividends | | Return of
Capital | | Total
Dividends
Paid* | |
| |
| |
| |
| |
| |
| |
Aggressive Growth Fund | | $ | 87,226 | | $ | 667,264 | | $ | 754,490 | | $ | 3,134 | | $ | 757,624 | |
Growth Strategy Fund | | | 434,489 | | | 1,575,492 | | | 2,009,981 | | | — | | | 2,009,981 | |
Moderate Growth Fund | | | 686,794 | | | 1,257,947 | | | 1,944,741 | | | 40,611 | | | 1,985,352 | |
Conservative Growth Fund | | | 265,882 | | | 228,458 | | | 494,340 | | | 527 | | | 494,867 | |
| | | | | | | | | | | | | | | | |
The tax character of dividends paid by the LifeLine Funds as of the latest tax year ended October 31, 2007 were as follows:
| | | | | | | | | | | | | | | | |
| | Distributions paid from | | | | |
| |
| | | | |
| | Ordinary
Income | | Net
Long-Term
Gains | | Total
Taxable
Dividends | | Return of
Capital | | Total
Dividends
Paid* | |
| |
| |
| |
| |
| |
| |
Aggressive Growth Fund | | $ | — | | $ | — | | $ | — | | $ | — | | $ | — | |
Growth Strategy Fund | | | 103,401 | | | 164,526 | | | 267,927 | | | — | | | 267,927 | |
Moderate Growth Fund | | | 406,849 | | | 208,376 | | | 615,225 | | | — | | | 615,225 | |
Conservative Growth Fund | | | 156,824 | | | 67,208 | | | 224,032 | | | — | | | 224,032 | |
| | |
| |
* | Total dividends paid may differ from the amount reported in the Statement of Changes in Net Assets because dividends are recognized when actually paid for tax purposes. |
| |
| As of the latest tax year end October 31, 2008, the components of accumulated earnings/(deficit) on a tax basis for the LifeLine Funds were as follows: |
| | | | | | | | | | | | | | | | | | | | | | |
| | Undistributed
Ordinary
Income | | Undistributed
Long-Term
Capital Gains
(Losses) | | Accumulated
Earnings | | Dividends
Payable | | Accumulated
Capital and
Other Losses | | Unrealized
Appreciation
(Depreciation)(1) | | Total
Accumulated
Earnings/
(Deficit) | |
| |
| |
| |
| |
| |
| |
| |
| |
Aggressive Growth Fund | | $ | — | | $ | — | | $ | — | | $ | — | | $ | (911,837 | ) | $ | (2,704,622 | ) | $ | (3,616,459 | ) |
Growth Strategy Fund | | | 117,076 | | | — | | | 117,076 | | | — | | | (2,102,770 | ) | | (7,284,593 | ) | | (9,270,287 | ) |
Moderate Growth Fund | | | — | | | — | | | — | | | — | | | (1,920,789 | ) | | (7,117,440 | ) | | (9,038,229 | ) |
Conservative Growth Fund | | | — | | | — | | | — | | | — | | | (522,075 | ) | | (1,962,987 | ) | | (2,485,062 | ) |
| | |
| |
(1) | The differences between book-basis and tax-basis unrealized appreciation/depreciation are attributable primarily to: tax deferral of losses on wash sales, the realization for tax purposes of unrealized gains/losses on certain derivative instruments, the difference between book and tax amortization methods for premium and market discount, the realization for tax purposes of unrealized gains/losses on investments in passive foreign investment companies, and the return of capital adjustments from real estate investment trusts. |
| |
HSBC INVESTOR LIFELINE FUNDS | 36 |
|
HSBC INVESTOR LIFELINE FUNDS |
|
Notes to Financial Statements—As of October 31, 2008 (continued) |
| |
| As of the latest tax year ended of October 31, 2008, the following Funds have net capital loss carryforwards, which are available to offset future realized gains, if any, to the extent provided by the Treasury regulations. To the extent that these carryforwards are used to offset future capital gains, it is probable that the gains that are offset will not be distributed to shareholders. |
| | | | | | |
Fund | | Amount | | Expires | |
| |
| |
| |
Aggressive Growth Fund | | $ | 911,837 | | 2016 | |
Growth Strategy Fund | | | 2,102,771 | | 2016 | |
Moderate Growth Fund | | | 1,920,789 | | 2016 | |
Conservative Growth Fund | | | 522,075 | | 2016 | |
| |
6. | Legal and Regulatory Matters: |
| |
| On September 26, 2006 BISYS Fund Services, Inc. (“BISYS”), an affiliate of BISYS Fund Services Ohio, Inc. which provides various services to the LifeLine Funds as described in footnote 3, reached a settlement with the Securities and Exchange Commission (“the SEC”) regarding the SEC’s investigation related to BISYS’ past payment of certain marketing and other expenses with respect to certain of its mutual fund clients. Although BISYS has reached a settlement with the SEC, the LifeLine Funds’ management is not aware that any determination has been made as to how the BISYS settlement monies will be distributed. While the LifeLine Funds’ management is currently unable to determine the impact, if any, of such matters on the Portfolios or the LifeLine Funds’ financial statements, management does not anticipate a material, adverse impact to the LifeLine Funds or the LifeLine Funds’ financial statements. |
| |
7. | Subsequent Event (unaudited): |
| |
| Each of the Underlying Portfolios represents a different asset class. At a Board meeting held on December 8-9, 2008, HSBC Global Asset Management (USA) Inc. (the “Adviser”), the investment adviser to the LifeLine Funds, received approval from the Board to restructure the LifeLine Funds and how the Funds invest in their respective asset classes in order to provide the Funds with greater flexibility. The LifeLine Funds normally invest in affiliated Underlying Portfolios, i.e., those funds within the HSBC Family of Funds. The change in structure will allow a LifeLine Fund to invest in unaffiliated underlying funds in order to gain access to other managers with similar asset classes. The change in structure will also allow a LifeLine Fund to invest in a specified asset class as opposed to a specified underlying fund. As an example, the HSBC Investor Aggressive Growth Strategy Fund currently invests 21% of its portfolio in the HSBC Growth Portfolio. After the change, the HSBC Investor Aggressive Growth Strategy Fund may invest 21% of its assets in an underlying fund or combination of funds that invest in a portfolio of large cap growth securities. A revised target portfolio weightings table is presented below. Other than as noted below with regard to the HSBC Investor Conservative Growth Strategy Fund, the portfolio weightings of the Funds in the various asset classes remain unchanged. The Adviser will have the discretion to select and substitute underlying funds and to establish target weightings. Should the Adviser determine to change the portfolio weightings of a LifeLine Fund, shareholders of that Fund will receive 60 days’ advance notice. |
| |
| In addition to the above changes applicable to each LifeLine Fund, the HSBC Investor Conservative Growth Strategy Fund will no longer allocate 3% of its assets to the Intermediate Duration Fixed Income Portfolio (an intermediate duration fixed income asset class); rather it will allocate 28% instead of 25% to a fixed income asset class. This change is reflected in the portfolio weightings table below. |
| |
| The changes to the structure of the LifeLine Funds and the allocation of the HSBC Investor Conservative Growth Strategy Fund will become effective February 9, 2009. |
| | | | | | | | | | | | | | | | | |
Asset Class | | HSBC Investor
Aggressive
Growth
Strategy
Fund | | HSBC Investor
Growth
Strategy
Fund | | HSBC Investor
Moderate
Growth
Strategy
Fund | | HSBC Investor
Conservative
Growth
Strategy
Fund | |
| |
| |
| |
| |
| |
Large Cap Growth | | | 21 | % | | | 21 | % | | | 19 | % | | | 15 | % | |
Large Cap Value | | | 21 | % | | | 21 | % | | | 18 | % | | | 14 | % | |
Small-cap | | | 34 | % | | | 20 | % | | | 11 | % | | | 4 | % | |
International Equity | | | 23 | % | | | 20 | % | | | 15 | % | | | 10 | % | |
Fixed Income | | | None | | | | 15 | % | | | 26 | % | | | 28 | % | |
High Yield Fixed Income | | | None | | | | 2 | % | | | 5 | % | | | 8 | % | |
Money Market | | | 1 | % | | | 1 | % | | | 6 | % | | | 21 | % | |
| | |
| | | |
| | | |
| | | |
| | |
Total: | | | 100 | % | | | 100 | % | | | 100 | % | | | 100 | % | |
| | |
| | | |
| | | |
| | | |
| | |
| |
37 | HSBC INVESTOR LIFELINE FUNDS |
REPORT OF INDEPENDENT REGISTERED PUBLIC ACCOUNTING FIRM
To the Shareholders and Board of Trustees of
HSBC Investor LifeLine Funds:
We have audited the accompanying statements of assets and liabilities of HSBC Investor LifeLine Funds – HSBC Investor Aggressive Growth Strategy Fund, HSBC Investor Growth Strategy Fund, HSBC Investor Moderate Growth Strategy Fund and HSBC Investor Conservative Growth Strategy Fund (the Funds), as of October 31, 2008, and the related statements of operations for the year then ended, the statements of changes in net assets for each year in the two-year period then ended and the financial highlights for each period in the four-year period then ended. These financial statements and financial highlights are the responsibility of the Funds’ management. Our responsibility is to express an opinion on these financial statements and financial highlights based on our audits.
We conducted our audits in accordance with the standards of the Public Company Accounting Oversight Board (United States). Those standards require that we plan and perform the audits to obtain reasonable assurance about whether the financial statements and financial highlights are free of material misstatement. An audit includes examining, on a test basis, evidence supporting the amounts and disclosures in the financial statements. An audit also includes assessing the accounting principles used and significant estimates made by management, as well as evaluating the overall financial statement presentation. We believe that our audits provide a reasonable basis for our opinion.
In our opinion, the financial statements and financial highlights referred to above present fairly, in all material respects, the financial position of the Funds as of October 31, 2008, the results of their operations for the year then ended, the changes in their net assets for each year in the two-year period then ended, and the financial highlights for each period in the four-year period then ended, in conformity with U.S. generally accepted accounting principles.
KPMG LLP
Columbus, Ohio
December 19, 2008
| |
HSBC INVESTOR LIFELINE FUNDS | 38 |
|
HSBC INVESTOR LIFELINE FUNDS |
|
Other Federal Income Tax Information (Unaudited) |
| |
| For the year ended October 31, 2008, the following percentages of the total ordinary income dividends paid by the LifeLine Funds qualify for the corporate dividends received deduction available to corporate shareholders: |
| | | | | | |
Fund | | Dividends
Received Deduction | |
| |
| |
Aggressive Growth Fund | | | | 67.01 | % | |
Growth Strategy Fund | | | | 40.45 | % | |
Moderate Growth Strategy Fund | | | | 34.27 | % | |
Conservative Growth Strategy Fund | | | | 19.28 | % | |
| |
| For the year ended October 31, 2008, dividends paid by the LifeLine Funds may be subject to a maximum tax rate of 15%, as provided for by the Jobs and Growth Tax Relief Reconciliation Act of 2003. The LifeLine Funds intend to designate the maximum amount allowable as taxed at a maximum rate of 15%. Complete information will be reported in conjunction with your 2008 Form 1099-DIV: |
| | | | | | |
Fund | | Qualified
Dividend
Income | |
| |
| |
Aggressive Growth Fund | | | | 100.00 | % | |
Growth Strategy Fund | | | | 71.25 | % | |
Moderate Growth Strategy Fund | | | | 72.72 | % | |
Conservative Growth Strategy Fund | | | | 39.29 | % | |
| |
| During the year ended October 31, 2008, the following LifeLine Funds declared net long term capital gain distributions: |
| | | | |
Fund | | Amount | |
| |
| |
Aggressive Growth Fund | | $ | 667,264 | |
Growth Strategy Fund | | | 1,575,492 | |
Moderate Growth Strategy Fund | | | 1,257,947 | |
Conservative Growth Strategy Fund | | | 228,458 | |
| |
39 | HSBC INVESTOR LIFELINE FUNDS |
|
HSBC INVESTOR LIFELINE FUNDS |
|
Table of Shareholder Expenses (Unaudited)—As of October 31, 2008 |
| |
| As a shareholder of the HSBC Investor LifeLine Funds (“Funds”), you incur two types of costs: (1) transaction costs, including sales charges (loads) on purchases, redemption fees; and exchange fees; (2) ongoing costs, including management fees; distribution and/or shareholder servicing fees; and other Fund expenses. These examples are intended to help you understand your ongoing costs (in dollars) of investing in the Funds and to compare these costs with the ongoing costs of investing in other mutual funds. |
| |
| These examples are based on an investment of $1,000 invested at the beginning of the period and held for the entire period from May 1, 2008 through November 31, 2008. |
| |
| Actual Example |
| |
| The table below provides information about actual account values and actual expenses. You may use the information below, together with the amount you invested, to estimate the expenses that you paid over the period. Simply divide your account value by $1,000 (for example, an $8,600 account value divided by $1,000 = 8.6), then multiply the result by the number in the table under the heading entitled “Expenses Paid During Period” to estimate the expenses you paid on your account during this period. |
| | | | | | | | | | | | | | | | | |
| | | | Beginning
Account
Value
5/1/08 | | Ending
Account
Value
10/31/08 | | Expenses
Paid During
Period*
5/1/08 — 10/31/08 | | Annualized
Expense Ratio
During Period
5/1/08 — 10/31/08 | |
| | | |
| |
| |
| |
| |
Aggressive Growth Strategy Fund | | Class A Shares | | $ | 1,000.00 | | $ | 639.90 | | | $ | 6.18 | | | 1.50 | % | |
| | Class B Shares | | | 1,000.00 | | | 637.50 | | | | 9.26 | | | 2.25 | % | |
| | Class C Shares | | | 1,000.00 | | | 638.00 | | | | 9.26 | | | 2.25 | % | |
Growth Strategy Fund | | Class A Shares | | | 1,000.00 | | | 684.00 | | | | 6.43 | | | 1.52 | % | |
| | Class B Shares | | | 1,000.00 | | | 681.20 | | | | 9.59 | | | 2.27 | % | |
| | Class C Shares | | | 1,000.00 | | | 681.10 | | | | 9.59 | | | 2.27 | % | |
Moderate Growth Strategy Fund | | Class A Shares | | | 1,000.00 | | | 736.60 | | | | 6.68 | | | 1.53 | % | |
| | Class B Shares | | | 1,000.00 | | | 733.60 | | | | 9.94 | | | 2.28 | % | |
| | Class C Shares | | | 1,000.00 | | | 734.20 | | | | 9.94 | | | 2.28 | % | |
Conservative Growth Strategy Fund | | Class A Shares | | | 1,000.00 | | | 801.60 | | | | 6.79 | | | 1.50 | % | |
| | Class B Shares | | | 1,000.00 | | | 799.20 | | | | 10.18 | | | 2.25 | % | |
| | Class C Shares | | | 1,000.00 | | | 798.60 | | | | 10.17 | | | 2.25 | % | |
| |
|
* | Expenses are equal to the average account value over the period multiplied by the Funds’ annualized expense ratio, multiplied by the number of days in the most recent fiscal half-year divided by the number of days in the fiscal year (to reflect the one half year period). |
| |
HSBC INVESTOR LIFELINE FUNDS | 40 |
|
HSBC INVESTOR LIFELINE FUNDS |
|
Table of Shareholder Expenses (Unaudited)—As of October 31, 2008 (continued) |
| |
| Hypothetical Example for Comparison Purposes |
| |
| The table below provides information about hypothetical account values and hypothetical expenses based on the Fund’s actual expense ratio and an assumed rate of return of 5% per year before expenses, which is not the Fund’s actual return. The hypothetical account values and expenses may not be used to estimate the actual ending account balance or expenses you paid for the period. You may use this information to compare this 5% hypothetical example with the 5% hypothetical examples that appear in the shareholder reports of other funds. |
| |
| Please note that the expenses shown in the table are meant to highlight your ongoing costs only and do not reflect any transactional costs, such as sales charges (loads), redemption fees, or exchange fees. Therefore, the table is useful in comparing ongoing costs only, and will not help you determine the relative total costs of owning different funds. In addition, if these transactional costs were included, your costs would have been higher. |
| | | | | | | | | | | | | | | | | |
| | | | Beginning
Account
Value
5/1/08 | | Ending
Account
Value
10/31/08 | | Expenses
Paid During
Period*
5/1/08 — 10/31/08 | | Annualized
Expense Ratio
During Period
5/1/08 — 10/31/08 | |
| | | |
| |
| |
| |
| |
Aggressive Growth Strategy Fund | | Class A Shares | | $ | 1,000.00 | | $ | 1,017.60 | | | $ | 7.61 | | | 1.50 | % | |
| | Class B Shares | | | 1,000.00 | | | 1,013.83 | | | | 11.39 | | | 2.25 | % | |
| | Class C Shares | | | 1,000.00 | | | 1,013.83 | | | | 11.39 | | | 2.25 | % | |
Growth Strategy Fund | | Class A Shares | | | 1,000.00 | | | 1,017.50 | | | | 7.71 | | | 1.52 | % | |
| | Class B Shares | | | 1,000.00 | | | 1,013.72 | | | | 11.49 | | | 2.27 | % | |
| | Class C Shares | | | 1,000.00 | | | 1,013.72 | | | | 11.49 | | | 2.27 | % | |
Moderate Growth Strategy Fund | | Class A Shares | | | 1,000.00 | | | 1,017.44 | | | | 7.76 | | | 1.53 | % | |
| | Class B Shares | | | 1,000.00 | | | 1,013.67 | | | | 11.54 | | | 2.28 | % | |
| | Class C Shares | | | 1,000.00 | | | 1,013.67 | | | | 11.54 | | | 2.28 | % | |
Conservative Growth Strategy Fund | | Class A Shares | | | 1,000.00 | | | 1,017.60 | | | | 7.61 | | | 1.50 | % | |
| | Class B Shares | | | 1,000.00 | | | 1,013.83 | | | | 11.39 | | | 2.25 | % | |
| | Class C Shares | | | 1,000.00 | | | 1,013.83 | | | | 11.39 | | | 2.25 | % | |
| |
|
* | Expenses are equal to the average account value over the period multiplied by the Funds’ annualized expense ratio, multiplied by the number of days in the most recent fiscal half-year divided by the number of days in the fiscal year (to reflect the one half year period). |
| |
41 | HSBC INVESTOR LIFELINE FUNDS |
|
HSBC INVESTOR CORE PLUS FIXED INCOME PORTFOLIO |
|
Schedule of Portfolio Investments—as of October 31, 2008 |
| | | | | | | |
Certificates of Deposit—0.1% | | | | | | | |
|
|
|
|
|
|
|
|
| | | | | | | |
| | Shares or
Principal
Amount($) | | Value($) | |
| |
| |
| |
Banking—0.1% | | | | | | | |
First Tennessee Bank, 2.96%,
12/17/09 (a) | | | 100,000 | | | 99,029 | |
| | | | |
|
| |
TOTAL CERTIFICATES OF DEPOSIT
(COST $94,978) | | | | | | 99,029 | |
| | | | |
|
| |
| | | | | | | |
U.S. Government and Government Agency Obligations—43.4% | | | | | | | |
|
|
|
|
|
|
|
|
Federal Home Loan Mortgage Corp.—10.8% | | | | | | | |
Pool #1B2655, 6.21%, 12/1/34 (a)(h) | | | 487,814 | | | 490,212 | |
Pool #1J1313, 6.37%, 6/1/36 (a) | | | 1,142,823 | | | 1,159,719 | |
Pool #847557, 5.85%, 7/1/34 (a)(h) | | | 585,641 | | | 598,062 | |
Pool #C00368, 8.50%, 10/1/24 | | | 23,979 | | | 25,815 | |
Pool #C00922, 8.00%, 2/1/30 | | | 142,230 | | | 150,163 | |
Pool #C54447, 7.00%, 7/1/31 | | | 32,243 | | | 33,088 | |
Pool #C60712, 6.50%, 11/1/31 | | | 472,414 | | | 482,778 | |
Pool #C80387, 6.50%, 4/1/26 | | | 23,016 | | | 23,571 | |
Pool #D62926, 6.50%, 8/1/25 | | | 19,016 | | | 19,479 | |
Pool #G01317, 7.00%, 10/1/31 | | | 116,043 | | | 119,084 | |
Pool #G02981, 6.00%, 6/1/37 | | | 1,009,949 | | | 1,008,749 | |
TBA November: | | | | | | | |
5.00%, 11/15/22 | | | 3,865,000 | | | 3,773,206 | |
5.50%, 11/15/22 | | | 960,000 | | | 955,500 | |
| | | | |
|
| |
| | | | | | 8,839,426 | |
| | | | |
|
| |
Federal National Mortgage Association—23.7% | | | | | | | |
Pool #253438, 8.50%, 9/1/30 | | | 31,300 | | | 33,652 | |
Pool #256723, 6.50%, 5/1/37 | | | 982,919 | | | 996,901 | |
Pool #329530, 7.00%, 12/1/25 | | | 52,627 | | | 54,838 | |
Pool #329655, 7.00%, 11/1/25 | | | 21,900 | | | 22,820 | |
Pool #356905, 5.66%, 10/1/36 (a) | | | 140,731 | | | 142,435 | |
Pool #398958, 6.50%, 10/1/12 | | | 24,077 | | | 24,644 | |
Pool #535332, 8.50%, 4/1/30 | | | 34,148 | | | 36,727 | |
Pool #535440, 8.50%, 8/1/30 | | | 38,193 | | | 41,063 | |
Pool #548965, 8.50%, 7/1/30 | | | 38,096 | | | 40,959 | |
Pool #568486, 7.00%, 1/1/31 | | | 38,058 | | | 39,422 | |
Pool #573752, 8.50%, 2/1/31 | | | 29,026 | | | 31,208 | |
Pool #575328, 6.50%, 4/1/31 | | | 48,163 | | | 49,220 | |
Pool #922090, 5.84%, 3/1/37 (a) | | | 1,676,596 | | | 1,693,705 | |
TBA November: | | | | | | | |
5.00%, 11/15/36 | | | 3,100,000 | | | 2,936,283 | |
5.50%, 11/15/36 | | | 8,690,000 | | | 8,489,044 | |
6.00%, 11/15/37 | | | 4,800,000 | | | 4,797,000 | |
| | | | |
|
| |
| | | | | | 19,429,921 | |
| | | | |
|
| |
Government National Mortgage Association—6.3% | | | | | | | |
Pool #346406, 7.50%, 2/15/23 | | | 41,467 | | | 43,910 | |
Pool #412530, 7.50%, 12/15/25 | | | 68,806 | | | 72,830 | |
Pool #781300, 7.00%, 6/15/31 | | | 112,141 | | | 114,877 | |
TBA November: | | | | | | | |
5.00%, 11/15/36 | | | 2,800,000 | | | 2,671,374 | |
5.50%, 11/15/36 | | | 610,000 | | | 598,181 | |
6.00%, 11/15/36 | | | 1,680,000 | | | 1,680,000 | |
| | | | |
|
| |
| | | | | | 5,181,172 | |
| | | | |
|
| |
U.S. Treasury Bonds—2.3% | | | | | | | |
5.00%, 5/15/37 | | | 1,685,000 | | | 1,855,869 | |
| | | | |
|
| |
| | | | | | | |
U.S. Government and Government Agency Obligations, cont’d | | | | | | | |
|
|
|
|
|
|
|
|
| | | | | | | |
| | Shares or
Principal
Amount($) | | Value($) | |
| |
| |
| |
U.S. Treasury Notes—0.3% | | | | | | | |
3.13%, 9/30/13 | | | 245,000 | | | 248,981 | |
| | | | |
|
| |
TOTAL U.S. GOVERNMENT AND
GOVERNMENT AGENCY
OBLIGATIONS
(COST $35,928,025) | | | | | | 35,555,369 | |
| | | | |
|
| |
| | | | | | | |
Corporate Obligations—38.3% | | | | | | | |
|
|
|
|
|
|
|
|
Agricultural Chemicals—1.3% | | | | | | | |
Agrium, Inc., 6.75%, 1/15/19 | | | 600,000 | | | 541,220 | |
Cargill, Inc., 5.60%, 9/15/12 (b) | | | 600,000 | | | 557,003 | |
| | | | |
|
| |
| | | | | | 1,098,223 | |
| | | | |
|
| |
Banking—0.6% | | | | | | | |
American Express Centurion Bank,
5.95%, 6/12/17 | | | 700,000 | | | 517,176 | |
| | | | |
|
| |
Building & Construction Products—1.3% | | | | | | | |
Martin Marietta Materials, Inc.,
3.62%, 4/30/10 (a)(h) | | | 600,000 | | | 579,362 | |
Masco Corp., 3.12%, 3/12/10 (a)(h) | | | 550,000 | | | 518,006 | |
| | | | |
|
| |
| | | | | | 1,097,368 | |
| | | | |
|
| |
Cable Television—0.6% | | | | | | | |
Time Warner Cable, Inc.,
7.30%, 7/1/38 | | | 625,000 | | | 522,927 | |
| | | | |
|
| |
Chemicals—0.1% | | | | | | | |
Chemtura Corp., 6.88%, 6/1/16 | | | 175,000 | | | 109,375 | |
| | | | |
|
| |
Computer Services—0.8% | | | | | | | |
Electronic Data Systems, Series B,
6.00%, 8/1/13 | | | 700,000 | | | 660,792 | |
| | | | |
|
| |
Consumer Products—1.0% | | | | | | | |
Clorox Co. (The), 5.45%, 10/15/12 | | | 900,000 | | | 832,055 | |
| | | | |
|
| |
Electric—5.7% | | | | | | | |
Commonwealth Edison Co., 6.45%,
1/15/38 | | | 700,000 | | | 524,802 | |
Dominion Resources, Inc., 6.40%,
6/15/18 | | | 250,000 | | | 211,832 | |
Duke Energy Corp., 5.65%, 6/15/13 | | | 450,000 | | | 406,335 | |
Florida Power Corp., 5.65%, 6/15/18 | | | 550,000 | | | 486,898 | |
MidAmerican Energy Co., 5.95%,
7/15/17 | | | 2,900,000 | | | 2,535,000 | |
Puget Sound Energy, Inc., 6.97%,
6/1/67, Callable 6/1/17 @ 100 | | | 600,000 | | | 501,000 | |
| | | | |
|
| |
| | | | | | 4,665,867 | |
| | | | |
|
| |
Finance—8.2% | | | | | | | |
American Honda Finance Corp.,
4.63%, 4/2/13, MTN (b) | | | 250,000 | | | 226,784 | |
Bear Stearns Co., Inc.: | | | | | | | |
4.50%, 10/28/10 | | | 600,000 | | | 583,206 | |
Series B, 6.95%, 8/10/12, MTN | | | 950,000 | | | 937,422 | |
Citigroup, Inc., 6.50%, 8/19/13 | | | 225,000 | | | 213,291 | |
Countrywide Home Loans, Series L,
4.00%, 3/22/11, MTN | | | 1,150,000 | | | 1,060,545 | |
Ford Motor Credit Co., LLC,
9.75%, 9/15/10 | | | 1,550,000 | | | 1,054,076 | |
| | |
See notes to financial statements. | HSBC INVESTOR PORTFOLIOS | 42 |
|
HSBC INVESTOR CORE PLUS FIXED INCOME PORTFOLIO |
|
Schedule of Portfolio Investments—as of October 31, 2008 (continued) |
| | | | | | | |
Corporate Obligations, continued | | | | | | | |
|
|
|
|
|
|
|
|
| | | | | | | |
| | Shares or
Principal
Amount($) | | Value($) | |
| |
| |
| |
Lehman Brothers Holdings, Series I,
6.88%, 5/2/18, MTN (g) | | | 500,000 | | | 65,000 | |
Morgan Stanley, Series F, 6.00%,
4/28/15, MTN | | | 565,000 | | | 459,090 | |
Preferred Term Securities Ltd.,
8.79%, 9/15/30, Callable 9/15/10
@ 104.395 (b) | | | 768,227 | | | 556,004 | |
Wells Fargo Financial, 5.50%, 8/1/12 | | | 850,000 | | | 841,140 | |
XTRA Finance Corp., 5.15%, 4/1/17 | | | 750,000 | | | 681,810 | |
| | | | |
|
| |
| | | | | | 6,678,368 | |
| | | | |
|
| |
Forestry/Paper—0.2% | | | | | | | |
Georgia-Pacific Corp., 7.70%,
6/15/15 | | | 250,000 | | | 173,750 | |
| | | | |
|
| |
Gaming—0.1% | | | | | | | |
MGM MIRAGE, Inc., 6.75%, 4/1/13 | | | 175,000 | | | 109,375 | |
| | | | |
|
| |
Health Services—0.2% | | | | | | | |
Community Health Systems, Inc., 8.88%,
7/15/15, Callable 7/15/11 @ 104.44 | | | 175,000 | | | 146,562 | |
| | | | |
|
| |
Hospitals—1.2% | | | | | | | |
Covidien International Finance SA, 5.45%,
10/15/12 | | | 550,000 | | | 530,755 | |
HCA, Inc., 5.75%, 3/15/14 | | | 750,000 | | | 442,500 | |
| | | | |
|
| |
| | | | | | 973,255 | |
| | | | |
|
| |
Media—0.9% | | | | | | | |
News America Holdings, 7.90%, 12/1/95 | | | 500,000 | | | 376,145 | |
Vivendi, 5.75%, 4/4/13 (b) | | | 350,000 | | | 321,553 | |
| | | | |
|
| |
| | | | | | 697,698 | |
| | | | |
|
| |
Media - Cable—0.2% | | | | | | | |
Cablevision Systems Corp., Series B,
8.00%, 4/15/12 | | | 175,000 | | | 147,219 | |
| | | | |
|
| |
Office Equipment & Services—0.6% | | | | | | | |
Xerox Corp., 3.63%, 12/18/09 (a)(h) | | | 550,000 | | | 501,750 | |
| | | | |
|
| |
Oil & Gas—0.2% | | | | | | | |
Pioneer Natural Resources Co., 5.88%,
7/15/16 | | | 175,000 | | | 127,860 | |
| | | | |
|
| |
Pipelines—0.6% | | | | | | | |
Dynegy Holdings, Inc., 7.75%, 6/1/19 | | | 175,000 | | | 117,250 | |
Transcontinental Gas Pipeline Corp.,
6.05%, 6/15/18 | | | 450,000 | | | 359,968 | |
| | | | |
|
| |
| | | | | | 477,218 | |
| | | | |
|
| |
Retail—2.5% | | | | | | | |
Kohl’s Corp., 6.25%, 12/15/17 | | | 550,000 | | | 433,181 | |
Kroger Co. (The), 5.00%, 4/15/13 | | | 250,000 | | | 225,420 | |
Wal-Mart Stores, Inc., 6.50%, 8/15/37 | | | 1,500,000 | | | 1,346,407 | |
| | | | |
|
| |
| | | | | | 2,005,008 | |
| | | | |
|
| |
Support - Services—0.4% | | | | | | | |
Aramark Services, Inc., 8.50%, 2/1/15,
Callable 2/1/11 @104.25 | | | 175,000 | | | 149,625 | |
Iron Mountain, Inc., 8.00%, 6/15/20,
Callable 6/15/13 @ 104 | | | 175,000 | | | 137,375 | |
| | | | |
|
| |
| | | | | | 287,000 | |
| | | | |
|
| |
| | | | | | | |
Corporate Obligations, continued | | | | | | | |
|
|
|
|
|
|
|
|
| | | | | | | |
| | Shares or
Principal
Amount($) | | Value($) | |
| |
| |
| |
Telecom - Integrated/Services—0.2% | | | | | | | |
Qwest Corp., 7.63%, 6/15/15 | | | 175,000 | | | 133,875 | |
| | | | |
|
| |
Telecommunications—5.3% | | | | | | | |
AOL Time Warner, Inc.: | | | | | | | |
6.88%, 5/1/12 | | | 600,000 | | | 539,112 | |
7.70%, 5/1/32 | | | 550,000 | | | 444,292 | |
BellSouth Telecommunications, 7.00%,
12/1/95 | | | 700,000 | | | 510,027 | |
GTE Corp., 6.84%, 4/15/18 | | | 750,000 | | | 677,726 | |
Sprint Nextel Corp., 6.00%, 12/1/16 | | | 1,110,000 | | | 768,675 | |
Time Warner Entertainment Co., 8.38%,
3/15/23 | | | 800,000 | | | 713,912 | |
Verizon Communications, Inc., 6.10%,
4/15/18 | | | 750,000 | | | 655,259 | |
| | | | |
|
| |
| | | | | | 4,309,003 | |
| | | | |
|
| |
Transportation—6.1% | | | | | | | |
American Airlines, Inc.: | | | | | | | |
Series 2001-2, Class A1, 6.98%, 4/1/11 | | | 386,067 | | | 354,216 | |
Series 2001-2, Class A2, 7.86%, 10/1/11 | | | 1,250,000 | | | 993,750 | |
Burlington North Santa Fe: | | | | | | | |
5.65%, 5/1/17 | | | 600,000 | | | 525,046 | |
7.57%, 1/2/21 | | | 277,493 | | | 272,529 | |
Continental Airlines, Inc., 5.98%, 4/19/22 | | | 750,000 | | | 521,250 | |
Norfolk Southern Corp., 5.75%, 4/1/18 | | | 250,000 | | | 215,192 | |
Union Pacific Corp.: | | | | | | | |
5.75%, 11/15/17 | | | 1,200,000 | | | 1,017,030 | |
6.85%, 1/2/19 | | | 1,104,592 | | | 1,090,806 | |
| | | | |
|
| |
| | | | | | 4,989,819 | |
| | | | |
|
| |
TOTAL CORPORATE OBLIGATIONS
(COST $37,217,408) | | | | | | 31,261,543 | |
| | | | |
|
| |
| | | | | | | |
Asset Backed Securities—25.1% | | | | | | | |
|
|
|
|
|
|
|
|
Asset Backed Funding Certificates,
Series 2003-AHL1, Class A1,
3.68%, 3/25/33 | | | 738,743 | | | 611,712 | |
Cairn Mezzanine plc, Series 2007-3A,
Class B1, 3.70%, 8/13/47 (a)(b) | | | 905,000 | | | 0 | |
Capital Auto Receivables Asset Trust: | | | | | | | |
Series 2005-1, Class A5, 4.66%,
1/15/10 (a)(h) | | | 338,358 | | | 337,515 | |
Series 2006-SN1A, Class A3, 5.31%,
10/20/09 (b)(h) | | | 222,717 | | | 222,717 | |
Series 2006-SN1A, Class A4B, 4.39%,
3/20/10 (a)(b)(h) | | | 810,000 | | | 797,815 | |
Series 2007-SN1, Class A3A, 5.38%,
7/15/10 (h) | | | 740,000 | | | 732,665 | |
Series 2007-SN1, Class A3B, 4.62%,
7/15/10 (a)(h) | | | 860,000 | | | 840,073 | |
Capital One Prime Auto Receivables Trust: | | | | | | | |
Series 2005-1, Class A4, 4.58%,
4/15/11 (a)(h) | | | 398,489 | | | 390,219 | |
Series 2006-1, Class A3, 4.99%,
9/15/10 (h) | | | 694,871 | | | 694,856 | |
Carmax Auto Owner Trust, Series 2008-2,
Class A2B, 5.46%, 9/15/11 (a)(h) | | | 1,400,000 | | | 1,346,140 | |
| | |
43 | HSBC INVESTOR PORTFOLIOS | See notes to financial statements. |
|
HSBC INVESTOR CORE PLUS FIXED INCOME PORTFOLIO |
|
Schedule of Portfolio Investments—as of October 31, 2008 (continued) |
| | | | | | | |
Asset Backed Securities, continued | | | | | | | |
|
|
|
|
|
|
|
|
| | | | | | | |
| | Shares or
Principal
Amount($) | | Value($) | |
| |
| |
| |
Chase Issuance Trust, Series 2005-A12,
Class A, 4.57%, 2/15/11 (a)(h) | | | 1,250,000 | | | 1,244,194 | |
Countrywide Asset-Backed Certificates: | | | | | | | |
Series 2006-S2, Class A5, 5.75%,
7/25/27 (a) | | | 1,023,000 | | | 286,360 | |
Series 2006-S4, Class A3, 5.80%,
7/25/34 | | | 1,056,485 | | | 613,547 | |
Dominos Pizza Master Issuer LLC,
Series 2007-1, Class A2, 5.26%,
4/25/37 (b) | | | 1,200,000 | | | 986,561 | |
Duane Street CLO, Series 2007-4A, Class C,
3.80%, 11/14/21 (a)(b) | | | 850,000 | | | 306,850 | |
Ford Credit Auto Owner Trust, Series 2006-C,
Class A2A, 5.29%, 12/15/09 (h) | | | 649,602 | | | 649,356 | |
GE Business Loan Trust, Series 2006-2A,
Class A, 4.74%, 11/15/34 (a)(b)(h) | | | 1,371,669 | | | 1,135,950 | |
GE Equipment Small Ticket LLC,
Series 2005-2A, Class A3, 4.88%,
10/22/09 (b)(h) | | | 116,827 | | | 116,553 | |
GMAC Mortgage Corp., Loan Trust,
Series 2006-HE3, Class A3, 5.81%,
10/25/36 | | | 900,000 | | | 504,450 | |
Hyundai Auto Receivables Trust: | | | | | | | |
Series 2007-A, Class A2B, 4.91%,
1/15/10 (a)(h) | | | 180,360 | | | 180,014 | |
Series 2008-A, Class A2, 4.16%,
5/16/11 (h) | | | 1,020,000 | | | 1,000,608 | |
IOWA Student Loan Liquidity Corp.,
Series 2005-1, Class A1, 3.24%,
6/25/14 (a)(h) | | | 354,144 | | | 352,230 | |
National Collegiate Student Loan Trust,
Series 2006-3, Class A1, 3.29%,
9/25/19 (a)(h) | | | 763,889 | | | 677,437 | |
Nissan Auto Receivables Owner Trust,
Series 2006-B, Class A3, 5.16%,
2/15/10 (h) | | | 410,838 | | | 410,563 | |
Preferred Term Securities XXII Ltd., 3.16%,
9/22/36, Callable 6/22/11 @ 100 (a)(b)(h) | | | 1,079,503 | | | 583,472 | |
Residential Funding Mortgage Securities,
Series 2006-HSA1, Class A5, 5.31%,
2/25/36 | | | 490,000 | | | 125,573 | |
SLM Student Loan Trust: | | | | | | | |
Series 2005-4, Class A2, 3.62%,
4/26/21 (a)(h) | | | 490,000 | | | 455,390 | |
Series 2005-9, Class A4, 3.64%,
1/25/23 (a)(h) | | | 1,360,000 | | | 1,286,200 | |
Series 2006-7, Class A2, 3.53%,
10/25/16 (a)(h) | | | 1,214,374 | | | 1,212,078 | |
Series 2006-9, Class A2, 3.54%,
4/25/17 (a)(h) | | | 264,353 | | | 263,039 | |
Series 2006-B, Class A1, 2.83%,
9/15/20 (a)(h) | | | 1,085,646 | | | 1,015,079 | |
South Carolina Student Loan Corp.,
Series 2008-1, Class A1, 3.31%,
9/2/14 (a)(h) | | | 942,901 | | | 923,748 | |
World Omni Auto Receivables Trust,
Series 2007-B, Class A2B, 4.88%,
2/16/10 (a)(h) | | | 245,333 | | | 244,941 | |
| | | | |
|
| |
TOTAL ASSET BACKED SECURITIES
(COST $24,334,833) | | | | | | 20,547,905 | |
| | | | |
|
| |
| | | | | | | |
Collateralized Mortgage Obligations—5.9% | | | | | | | |
|
|
|
|
|
|
|
|
| | | | | | | |
| | Shares or
Principal
Amount($) | | Value($) | |
| |
| |
| |
Banc of America Mortgage Securities,
Series 2005-D, Class 2A4, 4.79%,
5/25/35 (a)(h) | | | 968,912 | | | 931,909 | |
Deutsche Mortgage Securities, Inc.,
Series 2006-WF1, Class 1A1, 5.09%,
6/26/35 (a)(b) | | | 824,958 | | | 821,186 | |
Fannie Mae IO: | | | | | | | |
Series 270, Class 2, 8.50%, 9/1/23 (c) | | | 37,649 | | | 10,022 | |
Series 296, Class 2, 8.00%, 4/1/24 (c) | | | 45,014 | | | 11,879 | |
Series 306, Class IO, 8.00%, 5/1/30 (c) | | | 53,648 | | | 12,238 | |
Series 2000-16, Class PS, 5.34%,
10/25/29 (a)(c) | | | 25,030 | | | 880 | |
Series 2001-4, Class SA, 3.19%,
2/17/31 (a)(c) | | | 177,348 | | | 17,877 | |
FHA Weyerhauser, 7.43%, 1/1/24 (e)(f) | | | 26,158 | | | 26,158 | |
Freddie Mac: | | | | | | | |
Series 2988, Class AF, 4.89%,
6/15/35 (a)(h) | | | 979,755 | | | 922,366 | |
Series 3212, Class BK, 5.50%, 9/15/36 | | | 900,000 | | | 827,195 | |
Freddie Mac IO: | | | | | | | |
Series 1534, Class K, 2.78%,
6/15/23 (a)(c) | | | 119,246 | | | 15,870 | |
Series 2141, Class SD, 3.56%,
4/15/29 (a)(c) | | | 100,776 | | | 14,795 | |
Series 2247, Class SC, 2.91%,
8/15/30 (a)(c) | | | 50,605 | | | 5,882 | |
Government National Mortgage
Association IO: | | | | | | | |
Series 1999-30, Class S, 4.13%,
8/16/29 (a)(c) | | | 43,767 | | | 6,419 | |
Series 1999-30, Class SA, 3.53%,
4/16/29 (a)(c) | | | 61,089 | | | 6,151 | |
Residential Asset Securitization Trust,
Series 2003-A15, Class 1A2, 3.71%,
2/25/34 (a)(h) | | | 1,325,412 | | | 1,177,631 | |
| | | | |
|
| |
TOTAL COLLATERALIZED
MORTGAGE OBLIGATIONS
(COST $5,029,101) | | | | | | 4,808,458 | |
| | | | |
|
| |
| | | | | | | |
Commercial Mortgage Backed Securities—11.4% | | | | | | | |
|
|
|
|
|
|
|
|
Citigroup Commercial Mortgage Trust,
Series 2006-C5, Class A2, 5.38%,
10/15/49 | | | 1,100,000 | | | 984,285 | |
Citigroup/Deutsche Bank Commercial
Mortgage Trust, Series 2007-CD4,
Class A2B, 5.21%, 12/11/49 | | | 1,300,000 | | | 1,134,177 | |
Commercial Mortgage Pass -
Through Certificate: | | | | | | | |
Series 2005-LP5, Class AJ, 5.05%,
5/10/43 | | | 1,550,000 | | | 1,050,694 | |
Series 2006-FL12, Class A2, 4.66%,
12/15/20 (a)(b)(h) | | | 1,443,883 | | | 1,228,923 | |
CWCapital Cobalt, Series 2006-C1, Class A2,
5.17%, 8/15/48 | | | 1,232,000 | | | 1,115,979 | |
DLJ Mortgage Acceptance Corp., IO,
Series 1997-CF1, Class S, 1.19%,
5/15/30 (a)(c)(e) | | | 17,984 | | | 1 | |
Greenwich Capital Commercial Funding Corp.: | | | | | | | |
Series 2006-GG7, Class A2, 5.91%,
7/10/38 (a) | | | 640,000 | | | 591,822 | |
| | |
See notes to financial statements. | HSBC INVESTOR PORTFOLIOS | 44 |
|
HSBC INVESTOR CORE PLUS FIXED INCOME PORTFOLIO |
|
Schedule of Portfolio Investments—as of October 31, 2008 (continued) |
| | | | | | | |
Commercial Mortgage Backed Securities, continued | | | | | | | |
|
|
|
|
|
|
|
|
| | | | | | | |
| | Shares or
Principal
Amount($) | | Value($) | |
| |
| |
| |
Series 2006-GG7, Class A4, 5.91%,
7/10/38 (a) | | | 1,040,000 | | | 829,480 | |
GS Mortgage Securities Corp., IO,
Series 1997-GL, Class X2, 0.29%,
7/13/30 (a)(c)(e) | | | 35,694 | | | 414 | |
LB-UBS Commercial Mortgage Trust,
Series 2006-C6, Class A2, 5.26%,
9/15/39 | | | 480,000 | | | 440,906 | |
Morgan Stanley Capital I, Series 2007-IQ14,
Class A2, 5.61%, 4/15/49 | | | 1,380,000 | | | 1,197,531 | |
Washington Mutual Commercial Mortgage
Securities Trust, Series 2006-SL1,
Class A, 5.30%, 11/23/43 (a)(b) | | | 963,607 | | | 722,705 | |
| | | | |
|
| |
TOTAL COMMERCIAL MORTGAGE
BACKED SECURITIES
(COST $11,075,016) | | | | | | 9,296,917 | |
| | | | |
|
| |
| | | | | | | |
Foreign Bonds—0.6% | | | | | | | |
|
|
|
|
|
|
|
|
United Kingdom—0.6% | | | | | | | |
Barclays Bank plc, 5.93%, 12/31/49 (b) | | | 850,000 | | | 456,304 | |
| | | | |
|
| |
TOTAL FOREIGN BONDS
(COST $862,060) | | | | | | 456,304 | |
| | | | |
|
| |
| | | | | | | |
Municipal Bonds—2.4% | | | | | | | |
|
|
|
|
|
|
|
|
Arizona Educational Loan Marketing Corp.
Educational Loan Revenue, Series A-1-B,
3.71%, 1/25/10, (Credit Support
Guaranteed Student Loans) (a)(h) | | | 534,000 | | | 521,985 | |
Chicago Transit Authority Sales & Transfer
Tax Receipts Revenue, Series A, 6.90%,
12/1/40, AMT | | | 800,000 | | | 723,216 | |
Connecticut State, GO, Series B, 5.00%,
4/15/18 | | | 650,000 | | | 678,834 | |
| | | | |
|
| |
TOTAL MUNICIPAL BONDS
(COST $2,034,869) | | | | | | 1,924,035 | |
| | | | |
|
| |
| | | | | | | |
Investment Company—2.7% | | | | | | | |
|
|
|
|
|
|
|
|
| | | | | | | |
| | Shares or
Principal
Amount($) | | Value($) | |
| |
| |
| |
Northern Institutional Diversified Assets
Portfolio, Shares Class, 0.82% (d)(h) | | | 2,193,345 | | | 2,193,345 | |
TOTAL INVESTMENT COMPANY
(COST $2,193,345) | | | | | | 2,193,345 | |
| | | | |
|
| |
TOTAL INVESTMENTS
(COST $118,769,635) — 129.9% | | | | | | 106,142,905 | |
| | | | |
|
| |
| |
|
| Percentages indicated are based on net assets of $81,727,877. |
| |
(a) | Variable rate security. The interest rates on these securities are adjusted periodically to reflect then-current short-term interest rates. The rates presented represent the rates in effect on October 31, 2008. The maturity dates presented reflect the final maturity dates. However, some of these securities may contain put or demand features that allow the fund to require the issuer to repurchase the security from the fund within various time periods, including daily, weekly, monthly, or semi-annually. |
| |
(b) | Security exempt from registration under Rule 144a of the Securities Act of 1933. This security may be resold in transactions exempt from registration, normally to qualified institutional buyers. This security has been deemed liquid by the Investment Adviser based on procedures approved by the Board of Trustees. |
| |
(c) | Interest-Only represents securities that entitle holders to receive only interest payments on the underlying mortgages. The yield to maturity of an Interest-Only is extremely sensitive to the rate of principal payments on the underlying mortgage assets. A rapid (slow) rate of principal repayments may have an adverse (positive) effect on yield to maturity. Interest rate adjusts periodically based on the pay off of the underlying mortgage. The interest rate presented represents the rates in effect on October 31, 2008. The principal amount shown is the notional amount of the underlying mortgages. |
| |
(d) | The rates presented represent the annualized one day yield that was in effect on October 31, 2008. |
| |
(e) | Rule 144a, section 4(2) or other security which is restricted as to resale to institutional investors. The Investment Adviser, using Board approved procedures, has deemed these securities to be illiquid. Represents 0.03% of total net assets. |
| |
(f) | Security was fair valued as of October 31, 2008. Represents 0.03% of net assets. |
| |
(g) | Security is non-income producing; Defaulted Bond. |
| |
(h) | Security held as collateral for to be announced securities. |
| | |
AMT | — | Interest on security is subject to federal alternative minimum tax |
CLO | — | Collateralized Loan Obligation |
FHA | — | Federal Housing Administration |
GO | — | General Obligation |
IO | — | Interest-Only security. Represents 0.13% of net assets. |
LLC | — | Limited Liability Co. |
MTN | — | Medium Term Note |
PLC | — | Public Limited Co. |
TBA | — | Security was traded on a “to be announced” basis. Represents 31.7% of net assets. |
| | |
45 | HSBC INVESTOR PORTFOLIOS | See notes to financial statements. |
|
HSBC INVESTOR HIGH YIELD FIXED INCOME PORTFOLIO |
|
Schedule of Portfolio Investments—as of October 31, 2008 |
| | | | | | | |
Common Stock—0.0% | | | | | | | |
|
|
|
|
|
|
|
|
| | | | | | | |
| | Shares or
Principal
Amount($) | | Value($) | |
| |
| |
| |
Consumer Discretionary—0.0% | | | | | | | |
Tembec, Inc. (a) | | | 937 | | | 1,012 | |
| | | | |
|
| |
TOTAL COMMON STOCK
(COST $18,548) | | | | | | 1,012 | |
| | | | |
|
| |
| | | | | | | |
Corporate Obligations—96.8% | | | | | | | |
|
|
|
|
|
|
|
|
Aerospace & Defense—3.4% | | | | | | | |
BE Aerospace, Inc., 8.50%, 7/1/18,
Callable 7/1/13 @ 104.25 | | | 25,000 | | | 21,500 | |
Bombardier, Inc., 8.00%, 11/15/14,
Callable 11/15/10 @ 104.00 (b) | | | 25,000 | | | 21,375 | |
DRS Technologies, Inc., 7.63%, 2/1/18,
Callable 2/1/11 @ 103.81 | | | 100,000 | | | 99,000 | |
Hawker Beechcraft Acquisition Co.: | | | | | | | |
8.50%, 4/1/15, Callable 4/1/11 @ 104.25 | | | 50,000 | | | 30,000 | |
9.75%, 4/1/17, Callable 4/1/12 @ 104.88 | | | 25,000 | | | 14,000 | |
L-3 Communications Holdings, Inc.,
5.88%, 1/15/15, Callable 1/15/10
@ 102.94 | | | 100,000 | | | 82,000 | |
Sequa Corp., 11.75%, 12/1/15,
Callable 12/1/11 @ 105.88 (b) | | | 50,000 | | | 31,000 | |
TransDigm Group, Inc., 7.75%, 7/15/14,
Callable 7/15/09 @ 105.81 | | | 50,000 | | | 40,000 | |
| | | | |
|
| |
| | | | | | 338,875 | |
| | | | |
|
| |
Airline—0.4% | | | | | | | |
DAE Aviation Holdings, Inc., 11.25%,
8/1/15, Callable 8/1/11 @ 105.62 (b) | | | 50,000 | | | 37,500 | |
| | | | |
|
| |
Apparel/Textiles—1.4% | | | | | | | |
AGY Holding Corp., 11.00%, 11/15/14,
Callable 11/15/10 @ 105.50 | | | 50,000 | | | 35,000 | |
Levi Strauss & Co., 8.88%, 4/1/16,
Callable 4/1/11 @ 104.44 | | | 50,000 | | | 32,750 | |
Quiksilver, Inc., 6.88%, 4/15/15,
Callable 4/15/10 @ 103.44 | | | 150,000 | | | 72,000 | |
| | | | |
|
| |
| | | | | | 139,750 | |
| | | | |
|
| |
Auto Loans—3.8% | | | | | | | |
Ford Motor Credit Co.: | | | | | | | |
7.38%, 10/28/09 | | | 250,000 | | | 207,526 | |
7.38%, 2/1/11 | | | 50,000 | | | 31,112 | |
General Motors Acceptance Corp., 6.88%,
8/28/12 | | | 250,000 | | | 136,825 | |
| | | | |
|
| |
| | | | | | 375,463 | |
| | | | |
|
| |
Auto Parts & Equipment—2.2% | | | | | | | |
Altra Industrial Motion, Inc., 9.00%,
12/1/11, Callable 12/1/08 @ 104.50 | | | 50,000 | | | 45,000 | |
Cooper Tire & Rubber Co., 8.00%,
12/15/19 | | | 50,000 | | | 27,500 | |
Cooper-Standard Automotive, Inc.,
8.38%, 12/15/14, Callable 12/15/09
@ 104.19 | | | 50,000 | | | 21,000 | |
MSX International, 12.50%, 4/1/12,
Callable 4/1/09 @ 110.00 (b) | | | 25,000 | | | 11,250 | |
Stoneridge, Inc., 11.50%, 5/1/12,
Callable 12/8/08 @ 103.83 | | | 50,000 | | | 45,000 | |
The Goodyear Tire & Rubber Co., 8.63%,
12/1/11, Callable 12/1/09 @ 104.31 | | | 17,000 | | | 14,365 | |
| | | | | | | |
Corporate Obligations, continued | | | | | | | |
|
|
|
|
|
|
|
|
| | | | | | | |
| | Shares or
Principal
Amount($) | | Value($) | |
| |
| |
| |
Auto Parts & Equipment, continued | | | | | | | |
TRW Automotive, Inc., 7.25%, 3/15/17 (b) | | | 50,000 | | | 28,750 | |
UCI Holdco, Inc., 10.32%, 12/15/13,
Callable 12/15/09 @ 102.00 (c) | | | 61,214 | | | 23,261 | |
| | | | |
|
| |
| | | | | | 216,126 | |
| | | | |
|
| |
Automotive—0.5% | | | | | | | |
General Motors Corp., 7.13%, 7/15/13 | | | 150,000 | | | 51,000 | |
| | | | |
|
| |
Beverages—0.9% | | | | | | | |
Beverages & More, Inc., 9.25%, 3/1/12,
Callable 9/1/09 @ 104.63 (b) | | | 50,000 | | | 42,500 | |
Constellation Brands, Inc., 8.38%, 12/15/14 | | | 50,000 | | | 44,500 | |
| | | | |
|
| |
| | | | | | 87,000 | |
| | | | |
|
| |
Building Materials—2.8% | | | | | | | |
Belden, Inc., 7.00%, 3/15/17,
Callable 3/15/12 @ 103.50 | | | 50,000 | | | 38,250 | |
Coleman Cable, Inc., 9.88%, 10/1/12,
Callable 10/1/09 @ 102.47 | | | 50,000 | | | 35,625 | |
General Cable Technologies Corp., 7.13%,
4/1/17, Callable 4/1/12 @ 103.56 | | | 50,000 | | | 32,000 | |
Gibraltar Industries, Inc., 8.00%, 12/1/15,
Callable 12/1/10 @ 104.00 | | | 100,000 | | | 67,000 | |
Interline Brands, Inc., 8.13%, 6/15/14,
Callable 6/15/10 @ 104.06 | | | 50,000 | | | 38,500 | |
Maax Corp., 9.75%, 6/15/12,
Callable 6/15/09 @ 102.44 (d) | | | 50,000 | | | 250 | |
Ply Gem Industries, Inc., 11.75%, 6/15/13,
Callable 4/1/11 @ 105.88 (b) | | | 50,000 | | | 33,000 | |
U.S. Concrete, Inc., 8.38%, 4/1/14,
Callable 4/1/09 @ 104.19 | | | 50,000 | | | 31,250 | |
| | | | |
|
| |
| | | | | | 275,875 | |
| | | | |
|
| |
Chemicals—3.8% | | | | | | | |
Airgas, Inc., 7.13%, 10/1/18,
Callable 10/1/13 @ 103.56 (b) | | | 50,000 | | | 41,250 | |
Chemtura Corp., 6.88%, 6/1/16 | | | 25,000 | | | 15,625 | |
Georgia Gulf Corp., 9.50%, 10/15/14,
Callable 10/15/10 @ 104.75 | | | 75,000 | | | 31,500 | |
Huntsman International LLC, 7.88%,
11/15/14, Callable 11/15/10 @ 103.94 | | | 35,000 | | | 31,150 | |
Innophos, Inc., 8.88%, 8/15/14,
Callable 8/16/09 @ 104.44 | | | 50,000 | | | 44,000 | |
Koppers Holdings, Inc., 9.88%, 11/15/14,
Callable 11/15/09 @ 104.94 | | | 25,000 | | | 20,000 | |
LyondellBasell Industries AF, 8.38%,
8/15/15, Callable 8/15/10 @ 104.19 (b) | | | 50,000 | | | 17,500 | |
Momentive Performance Materials, Inc.,
9.75%, 12/1/14, Callable 12/1/10
@ 104.88 | | | 50,000 | | | 28,000 | |
Mosaic Co., 7.63%, 12/1/16,
Callable 12/1/11 @ 103.81 (b) | | | 25,000 | | | 21,832 | |
Nalco Finance Holdings, Inc., 0.00%, 2/1/14,
Callable 2/1/09 @ 104.50 (e) | | | 50,000 | | | 40,000 | |
Nova Chemicals Corp., 6.50%, 1/15/12 | | | 50,000 | | | 39,500 | |
Terra Capital, Inc., 7.00%, 2/1/17,
Callable 2/1/12 @ 103.50 | | | 50,000 | | | 42,500 | |
| | | | |
|
| |
| | | | | | 372,857 | |
| | | | |
|
| |
| | |
See notes to financial statements. | HSBC INVESTOR PORTFOLIOS | 46 |
|
HSBC INVESTOR HIGH YIELD FIXED INCOME PORTFOLIO |
|
Schedule of Portfolio Investments—as of October 31, 2008 (continued) |
| | | | | | | |
Corporate Obligations, continued | | | | | | | |
|
|
|
|
|
|
|
|
| | | | | | | |
| | Shares or
Principal
Amount($) | | Value($) | |
| |
| |
| |
Computer Hardware—0.3% | | | | | | | |
Activant Solutions, Inc., 9.50%, 5/1/16,
Callable 5/1/11 @ 104.75 | | | 50,000 | | | 30,500 | |
Consumer Products—1.5% | | | | | | | |
Central Garden & Pet Co., 9.13%, 2/1/13,
Callable 2/1/09 @ 103.04 | | | 50,000 | | | 30,500 | |
Chattem, Inc., 7.00%, 3/1/14,
Callable 3/1/09 @ 103.50 | | | 50,000 | | | 43,375 | |
Jarden Corp., 7.50%, 5/1/17,
Callable 5/1/12 @ 103.75 | | | 25,000 | | | 18,625 | |
MCBC Holdings, Inc., 10.75%, 10/15/14,
Callable 10/15/09 @ 103.00 (b)(c) | | | 25,000 | | | 12,500 | |
Spectrum Brands, Inc., 7.38%, 2/1/15,
Callable 2/1/10 @ 103.69 | | | 75,000 | | | 25,125 | |
True Temper Sports, Inc., 8.38%, 9/15/11,
Callable 3/15/09 @ 102.09 | | | 50,000 | | | 19,000 | |
| | | | |
|
| |
| | | | | | 149,125 | |
| | | | |
|
| |
Diversified Capital Goods—1.8% | | | | | | | |
Greenbrier Cos., Inc., 8.38%, 5/15/15,
Callable 5/15/10 @ 104.19 | | | 50,000 | | | 38,125 | |
Mueller Water Products, Inc., 7.38%, 6/1/17,
Callable 6/1/12 @ 103.69 | | | 50,000 | | | 32,750 | |
Sensata Technologies, 8.00%, 5/1/14,
Callable 5/1/10 @ 104.00 | | | 50,000 | | | 27,500 | |
TriMas Corp., 9.88%, 6/15/12,
Callable 6/15/09 @ 101.65 | | | 77,000 | | | 42,350 | |
Trinity Industries, Inc., 6.50%, 3/15/14,
Callable 3/15/09 @ 103.25 | | | 50,000 | | | 41,500 | |
| | | | |
|
| |
| | | | | | 182,225 | |
| | | | |
|
| |
Electric - Generation—4.8% | | | | | | | |
AES Corp.: | | | | | | | |
7.75%, 3/1/14 | | | 60,000 | | | 48,600 | |
7.75%, 10/15/15 | | | 50,000 | | | 39,188 | |
Dynegy Holdings, Inc., 8.38%, 5/1/16 | | | 150,000 | | | 111,000 | |
Edison Mission Energy: | | | | | | | |
7.00%, 5/15/17 | | | 25,000 | | | 19,781 | |
7.20%, 5/15/19 | | | 50,000 | | | 37,500 | |
Energy Future Holdings, 10.88%, 11/1/17,
Callable 11/1/12 @ 105.44 (b) | | | 125,000 | | | 96,250 | |
Mirant North America LLC, 7.38%, 12/31/13,
Callable 12/31/09 @ 103.69 | | | 50,000 | | | 43,687 | |
NRG Energy, Inc., 7.38%, 2/1/16,
Callable 2/1/11 @ 103.69 | | | 50,000 | | | 43,125 | |
Reliant Energy, Inc., 7.63%, 6/15/14 | | | 50,000 | | | 38,500 | |
| | | | |
|
| |
| | | | | | 477,631 | |
| | | | |
|
| |
Electric - Integrated—0.8% | | | | | | | |
CMS Energy Corp., 6.88%, 12/15/15 | | | 100,000 | | | 81,776 | |
| | | | |
|
| |
Electronics—0.2% | | | | | | | |
Freescale Semiconductor, Inc., 10.13%,
12/15/16, Callable 12/15/11 @ 105.06 | | | 50,000 | | | 19,625 | |
| | | | |
|
| |
Energy - Exploration & Production—5.7% | | | | | | | |
Chaparral Energy, Inc., 8.50%, 12/1/15,
Callable 12/1/10 @ 104.25 | | | 100,000 | | | 51,000 | |
Chesapeake Energy Corp., 6.88%, 1/15/16,
Callable 1/15/09 @ 103.44 | | | 100,000 | | | 80,250 | |
| | | | | | | |
Corporate Obligations, continued | | | | | | | |
|
|
|
|
|
|
|
| | | | | | |
| | Shares or
Principal
Amount($) | | Value($) | |
| |
| |
| |
Energy - Exploration & Production, continued | | | | | | | |
Cimarex Energy Co., 7.13%, 5/1/17,
Callable 5/1/12 @ 103.56 | | | 50,000 | | | 40,000 | |
Clayton Williams Energy, Inc., 7.75%, 8/1/13,
Callable 8/1/09 @ 103.88 | | | 100,000 | | | 61,500 | |
Compton Petroleum Finance Corp., 7.63%,
12/1/13, Callable 12/1/09 @ 103.81 | | | 100,000 | | | 58,000 | |
Forest Oil Corp., 7.25%, 6/15/19,
Callable 6/15/12 @ 103.63 | | | 50,000 | | | 34,000 | |
Linn Energy LLC, 9.88%, 7/1/18,
Callable 7/1/13 @ 104.94 (b) | | | 50,000 | | | 33,750 | |
Newfield Exploration Co., 6.63%, 9/1/14,
Callable 9/1/09 @ 103.31 | | | 100,000 | | | 77,250 | |
Opti Canada, Inc., 7.88%, 12/15/14,
Callable 12/15/10 @ 104.13 | | | 50,000 | | | 30,000 | |
Plains Exploration & Production Co.: | | | | | | | |
7.75%, 6/15/15, Callable 6/15/11 @ 103.88 | | | 50,000 | | | 36,500 | |
7.63%, 6/1/18, Callable 6/1/13 @ 103.81 | | | 25,000 | | | 16,375 | |
Swift Energy Co., 7.63%, 7/15/11,
Callable 7/15/09 @ 101.91 | | | 50,000 | | | 42,250 | |
| | | | |
|
| |
| | | | | | 560,875 | |
| | | | |
|
| |
Environmental—0.8% | | | | | | | |
Waste Services, Inc., 9.50%, 4/15/14,
Callable 4/15/09 @ 104.75 | | | 50,000 | | | 40,000 | |
WCA Waste Corp., 9.25%, 6/15/14,
Callable 6/15/10 @ 104.63 | | | 50,000 | | | 41,000 | |
| | | | |
|
| |
| | | | | | 81,000 | |
| | | | |
|
| |
Food & Drug Retailers—0.4% | | | | | | | |
Stater Bros. Holdings, Inc., 7.75%, 4/15/15,
Callable 4/15/11 @ 103.88 | | | 50,000 | | | 41,000 | |
| | | | |
|
| |
Food - Wholesale—0.3% | | | | | | | |
Smithfield Foods, Inc., 7.75%, 7/1/17 | | | 50,000 | | | 31,500 | |
| | | | |
|
| |
Forestry/Paper—2.8% | | | | | | | |
Catalyst Paper Corp., Series D, 8.63%, 6/15/11,
Callable 6/15/09 @ 100.00 | | | 50,000 | | | 29,500 | |
Cellu Tissue Holdings, Inc., 9.75%, 3/15/10,
Callable 3/15/09 @ 100.00 | | | 50,000 | | | 40,000 | |
Georgia-Pacific Corp., 7.70%, 6/15/15 | | | 50,000 | | | 34,750 | |
NewPage Corp., 10.00%, 5/1/12,
Callable 5/1/09 @ 106.00 | | | 25,000 | | | 17,000 | |
Norampac, Inc., 6.75%, 6/1/13,
Callable 6/1/09 @ 102.25 | | | 100,000 | | | 57,000 | |
Stone Container Finance Co. of Canada,
7.38%, 7/15/14, Callable 7/15/09
@ 103.69 | | | 150,000 | | | 73,500 | |
Verso Paper Holdings LLC, Series B, 9.13%,
8/1/14, Callable 8/1/10 @ 104.56 | | | 50,000 | | | 26,500 | |
| | | | |
|
| |
| | | | | | 278,250 | |
| | | | |
|
| |
Gaming—8.0% | | | | | | | |
Buffalo Thunder Development Authority,
9.38%, 12/15/14, Callable 12/15/10
@ 104.69 (b) | | | 25,000 | | | 8,750 | |
CCM Merger, Inc., 8.00%, 8/1/13,
Callable 8/1/09 @ 104.00 (b) | | | 100,000 | | | 59,000 | |
| | |
47 | HSBC INVESTOR PORTFOLIOS | See notes to financial statements. |
|
HSBC INVESTOR HIGH YIELD FIXED INCOME PORTFOLIO |
|
Schedule of Portfolio Investments—as of October 31, 2008 (continued) |
| | | | | | | |
Corporate Obligations, continued | | | | | | | |
|
|
|
|
|
|
|
|
| | | | | | | |
| | Shares or
Principal
Amount($) | | Value($) | |
| |
| |
| |
Gaming, continued | | | | | | | |
Choctaw Resort Development Entertainment,
7.25%, 11/15/19, Callable 11/15/11
@ 103.63 (b) | | | 46,000 | | | 26,220 | |
Chukchansi Economic Development Authority,
8.00%, 11/15/13, Callable 11/15/09
@ 104.00 (b) | | | 25,000 | | | 13,250 | |
Fontainebleau Las Vegas, 10.25%, 6/15/15,
Callable 6/15/11 @ 105.13 (b) | | | 100,000 | | | 13,500 | |
Great Canadian Gaming Co., 7.25%, 2/15/15,
Callable 2/15/11 @ 103.63 (b) | | | 50,000 | | | 37,500 | |
Greektown Holdings, Inc., 10.75%, 12/1/13,
Callable 12/1/10 @ 105.38 (b)(d) | | | 75,000 | | | 16,125 | |
Indianapolis Downs LLC, 11.00%, 11/1/12,
Callable 11/1/10 @ 105.50 (b) | | | 25,000 | | | 12,500 | |
Inn of the Mountain Gods, 12.00%, 11/15/10,
Callable 11/15/08 @ 103.00 | | | 50,000 | | | 22,000 | |
Isle of Capri Casinos, Inc., 7.00%, 3/1/14,
Callable 3/1/09 @ 103.50 | | | 100,000 | | | 48,500 | |
Mashantucket Pequot Tribal Nation, Series A,
8.50%, 11/15/15, Callable 11/15/11
@ 104.25 (b) | | | 50,000 | | | 27,500 | |
MGM MIRAGE, Inc., 6.75%, 4/1/13 | | | 100,000 | | | 62,500 | |
Mohegan Tribal Gaming, 7.13%, 8/15/14,
Callable 8/15/09 @ 103.56 | | | 50,000 | | | 30,000 | |
MTR Gaming Group, Inc., 9.00%, 6/1/12,
Callable 6/1/09 @ 104.50 | | | 100,000 | | | 55,500 | |
Pokagon Gaming Authority, 10.38%, 6/15/14,
Callable 6/15/10 @ 105.19 (b) | | | 69,000 | | | 62,790 | |
San Pasqual Casino, 8.00%, 9/15/13,
Callable 9/15/09 @ 104.00 (b) | | | 25,000 | | | 19,250 | |
Scientific Games Corp., 6.25%, 12/15/12,
Callable 12/15/08 @ 103.13 | | | 50,000 | | | 38,125 | |
Seminole Hard Rock Entertainment,
5.32%, 3/15/14, Callable 3/15/09
@ 102.00 (b)(c) | | | 50,000 | | | 33,000 | |
Seneca Gaming Corp., 7.25%, 5/1/12,
Callable 5/1/09 @ 101.81 | | | 50,000 | | | 33,500 | |
Shingle Springs, 9.38%, 6/15/15,
Callable 6/15/11@ 104.69 (b) | | | 50,000 | | | 24,500 | |
Snoqualmie Entertainment Authority, 6.88%,
2/1/14, Callable 2/1/09 @ 103.00 (b)(c) | | | 25,000 | | | 16,125 | |
Turning Stone Resort Casino, 9.13%, 9/15/14,
Callable 9/15/10 @ 104.56 (b) | | | 75,000 | | | 59,250 | |
Waterford Gaming LLC, 8.63%, 9/15/14 (b) | | | 21,000 | | | 19,845 | |
Wynn Las Vegas LLC, 6.63%, 12/1/14,
Callable 12/1/09 @ 103.31 | | | 50,000 | | | 36,875 | |
| | | | |
|
| |
| | | | | | 776,105 | |
| | | | |
|
| |
Gas Distribution—6.2% | | | | | | | |
Atlas Pipeline Partners LP, 8.13%, 12/15/15,
Callable 12/15/10 @ 104.06 | | | 50,000 | | | 34,875 | |
Colorado Interstate Gas Co., 6.80%,
11/15/15 | | | 150,000 | | | 126,956 | |
Copano Energy LLC, 8.13%, 3/1/16,
Callable 3/1/11 @ 104.06 | | | 50,000 | | | 36,750 | |
El Paso Corp., 7.00%, 6/15/17 | | | 100,000 | | | 76,320 | |
Ferrellgas Partners LP, 6.75%, 5/1/14,
Callable 5/1/09 @ 103.38 (b) | | | 50,000 | | | 35,500 | |
Inergy LP/Inergy Finance, 8.25%, 3/1/16,
Callable 3/1/11 @ 104.13 | | | 100,000 | | | 76,750 | |
| | | | | | | |
Corporate Obligations, continued | | | | | | | |
|
|
|
|
|
|
|
|
| | | | | | | |
| | Shares or
Principal
Amount($) | | Value($) | |
| |
| |
| |
Gas Distribution, continued | | | | | | | |
Regency Energy Partners LP, 8.38%, 12/15/13,
Callable 12/15/10 @ 104.19 | | | 17,000 | | | 12,920 | |
Southern Star Central Corp., Inc., 6.75%, 3/1/16,
Callable 3/1/11 @ 103.38 | | | 50,000 | | | 43,250 | |
Suburban Propane Partners LP, 6.88%, 12/15/13,
Callable 12/15/08 @ 103.44 | | | 50,000 | | | 38,500 | |
Williams Cos., Inc., 6.38%, 10/1/10 (b) | | | 100,000 | | | 89,000 | |
Williams Partners LP, 7.25%, 2/1/17 | | | 50,000 | | | 39,750 | |
| | | | |
|
| |
| | | | | | 610,571 | |
| | | | |
|
| |
Health Services—3.4% | | | | | | | |
Advanced Medical Optics, 7.50%, 5/1/17,
Callable 5/1/12 @ 103.75 | | | 50,000 | | | 33,000 | |
Carriage Services, Inc., 7.88%, 1/15/15,
Callable 1/15/10 @ 103.94 | | | 50,000 | | | 41,750 | |
Community Health Systems, Inc., 8.88%,
7/15/15, Callable 7/15/11 @ 104.44 | | | 50,000 | | | 41,875 | |
DJO Finance LLC, 10.88%, 11/15/14,
Callable 11/15/11 @ 105.44 | | | 25,000 | | | 20,125 | |
HCA, Inc., 9.25%, 11/15/16,
Callable 11/15/11 @ 104.63 | | | 25,000 | | | 21,250 | |
MultiPlan, Inc., 10.38%, 4/15/16,
Callable 4/15/11 @ 105.19 (b) | | | 100,000 | | | 92,000 | |
Omnicare, Inc., 6.75%, 12/15/13,
Callable 12/15/09 @ 103.38 | | | 100,000 | | | 83,000 | |
| | | | |
|
| |
| | | | | | 333,000 | |
| | | | |
|
| |
Hotels & Lodging—0.3% | | | | | | | |
Gaylord Entertainment Co., 8.00%,
11/15/13, Callable 11/15/08
@ 104.00 | | | 50,000 | | | 34,125 | |
| | | | |
|
| |
Household & Leisure Products—0.3% | | | | | | | |
Sealy Mattress Co., 8.25%, 6/15/14,
Callable 6/15/09 @ 104.13 | | | 50,000 | | | 28,250 | |
| | | | |
|
| |
Integrated Energy—0.3% | | | | | | | |
VeraSun Energy Corp.: | | | | | | | |
9.88%, 12/15/12, Callable 12/15/09
@ 104.94 (d) | | | 50,000 | | | 20,500 | |
9.38%, 6/1/17, Callable 6/1/12
@ 104.69 (d) | | | 50,000 | | | 4,250 | |
| | | | |
|
| |
| | | | | | 24,750 | |
| | | | |
|
| |
Investments & Miscellaneous Financial Services—0.1% | | | | | | | |
Nuveen Investments, Inc., 10.50%, 11/15/15,
Callable 11/15/11 @ 105.25 (b) | | | 50,000 | | | 13,500 | |
| | | | |
|
| |
Machinery—1.0% | | | | | | | |
Baldor Electric Co., 8.63%, 2/15/17,
Callable 2/15/12 @ 104.31 | | | 50,000 | | | 38,250 | |
Case New Holland, Inc., 7.13%, 3/1/14,
Callable 3/1/10 @ 103.56 | | | 50,000 | | | 37,250 | |
Terex Corp., 8.00%, 11/15/17,
Callable 11/15/12 @ 104.00 | | | 25,000 | | | 18,500 | |
| | | | |
|
| |
| | | | | | 94,000 | |
| | | | |
|
| |
| | |
See notes to financial statements. | HSBC INVESTOR PORTFOLIOS | 48 |
|
HSBC INVESTOR HIGH YIELD FIXED INCOME PORTFOLIO |
|
Schedule of Portfolio Investments—as of October 31, 2008 (continued) |
| | | | | | | |
Corporate Obligations, continued | | | | | | | |
|
|
|
|
|
|
|
|
| | | | | | | |
| | Shares or
Principal
Amount($) | | Value($) | |
| |
| |
| |
Media - Broadcast—1.2% | | | | | | | |
Barrington Broadcasting Group LLC,
10.50%, 8/15/14, Callable 8/15/10
@ 105.25 | | | 50,000 | | | 24,500 | |
Bonten Media Acquisition, 9.00%, 6/1/15,
Callable 6/1/11@ 104.50 (b) | | | 75,000 | | | 29,250 | |
Local TV Finance LLC, 9.25%, 6/15/15,
Callable 6/15/11 @ 104.63 (b) | | | 50,000 | | | 25,000 | |
Newport Television LLC, 13.00%, 3/15/17,
Callable 3/15/12 @ 106.50 (b) | | | 50,000 | | | 21,250 | |
Radio One, Inc., 6.38%, 2/15/13,
Callable 2/15/09 @ 103.19 | | | 50,000 | | | 22,500 | |
| | | | |
|
| |
| | | | | | 122,500 | |
| | | | |
|
| |
Media - Cable—3.6% | | | | | | | |
Atlantic Broadband Finance LLC,
9.38%, 1/15/14, Callable 1/15/09
@104.69 | | | 50,000 | | | 36,000 | |
Cablevision Systems Corp., Series B,
8.00%, 4/15/12 | | | 25,000 | | | 21,031 | |
Charter Communications Operating LLC,
10.88%, 9/15/14, Callable 3/15/12
@ 105.44 (b) | | | 50,000 | | | 40,625 | |
DIRECTV Holdings LLC, 7.63%, 5/15/16,
Callable 5/15/12 @ 103.81 (b) | | | 50,000 | | | 42,000 | |
Mediacom LLC, 7.88%, 2/15/11,
Callable 1/12/09 @ 100.00 | | | 100,000 | | | 85,000 | |
Videotron Ltd., 9.13%, 4/15/18,
Callable 4/15/13 @ 104.56 (b) | | | 50,000 | | | 44,375 | |
Virgin Media Finance plc, 9.13%, 8/15/16,
Callable 8/15/11 @ 104.56 | | | 125,000 | | | 82,500 | |
| | | | |
|
| |
| | | | | | 351,531 | |
| | | | |
|
| |
Media - Diversified—0.9% | | | | | | | |
Block Communications, Inc., 8.25%,
12/15/15, Callable 12/15/10
@ 104.13 (b) | | | 50,000 | | | 37,000 | |
Canwest Mediaworks LP, 9.25%, 8/1/15,
Callable 8/1/11 @ 104.63 (b) | | | 50,000 | | | 30,500 | |
Quebecor Media, Inc., 7.75%, 3/15/16,
Callable 3/15/11 @ 103.88 | | | 25,000 | | | 17,313 | |
| | | | |
|
| |
| | | | | | 84,813 | |
| | | | |
|
| |
Media - Services—1.0% | | | | | | | |
Baker & Taylor, Inc., 11.50%, 7/1/13,
Callable 7/1/10 @ 105.75 (b) | | | 100,000 | | | 59,125 | |
Lamar Media Corp., 6.63%, 8/15/15,
Callable 8/15/10 @ 103.31 | | | 50,000 | | | 36,750 | |
| | | | |
|
| |
| | | | | | 95,875 | |
| | | | |
|
| |
Metals/Mining Excluding Steel—1.9% | | | | | | | |
Freeport-McMoran Copper & Gold, Inc.,
8.25%, 4/1/15, Callable 4/1/11 @ 104.13 | | | 50,000 | | | 40,000 | |
International Coal Group, Inc., 10.25%,
7/15/14, Callable 7/15/10 @ 105.13 | | | 50,000 | | | 42,000 | |
Massey Energy Co., 6.88%, 12/15/13,
Callable 12/15/09 @ 103.44 | | | 100,000 | | | 81,000 | |
Noranda Aluminum Acquisition, 6.83%,
5/15/15, Callable 5/15/09 @ 101.00 (c) | | | 50,000 | | | 22,500 | |
| | | | |
|
| |
| | | | | | 185,500 | |
| | | | |
|
| |
| | | | | | | |
Corporate Obligations, continued | | | | | | | |
|
|
|
|
|
|
|
|
| | | | | | | |
| | Shares or
Principal
Amount($) | | Value($) | |
| |
| |
| |
Non-Food & Drug Retailers—2.7% | | | | | | | |
ACE Hardware Corp., 9.13%, 6/1/16,
Callable 6/1/12 @ 104.56 (b) | | | 25,000 | | | 18,750 | |
AutoNation, Inc., 7.00%, 4/15/14,
Callable 4/15/09 @ 105.25 | | | 50,000 | | | 32,500 | |
Claire’s Stores, Inc., 9.63%, 6/1/15,
Callable 6/1/11 @ 104.81 | | | 50,000 | | | 9,000 | |
Hanesbrands, Inc., 6.51%, 12/15/14,
Callable 12/15/08 @ 102.00 (c) | | | 50,000 | | | 33,937 | |
Libbey Glass, Inc., 9.93%, 6/1/11,
Callable 6/11/09 @ 102.50 (c) | | | 25,000 | | | 16,125 | |
Penske Automotive Group, Inc., 7.75%,
12/15/16, Callable 12/15/11 @ 103.88 | | | 50,000 | | | 23,875 | |
Pep Boys, 7.50%, 12/15/14, Callable
12/15/09 @ 103.75 | | | 50,000 | | | 24,000 | |
Susser Holdings LLC, 10.63%, 12/15/13,
Callable 12/15/09 @ 105.31 | | | 103,000 | | | 87,550 | |
Yankee Acquisition Corp., 9.75%, 2/15/17,
Callable 2/15/12 @ 104.88 | | | 50,000 | | | 24,813 | |
| | | | |
|
| |
| | | | | | 270,550 | |
| | | | |
|
| |
Oil & Gas—0.4% | | | | | | | |
Pioneer Natural Resources Co., 5.88%,
7/15/16 | | | 50,000 | | | 36,532 | |
| | | | |
|
| |
Oil Field Equipment & Services—0.9% | | | | | | | |
Bristow Group, Inc., 7.50%, 9/15/17,
Callable 9/15/12 @ 103.75 | | | 50,000 | | | 37,500 | |
CIE Gener de Geophysique, 7.50%, 5/15/15,
Callable 5/15/10 @ 103.75 | | | 50,000 | | | 33,500 | |
National Oilwell Varco, Inc., Series B,
6.13%, 8/15/15, Callable 8/15/10
@ 103.06 | | | 25,000 | | | 21,843 | |
| | | | |
|
| |
| | | | | | 92,843 | |
| | | | |
|
| |
Oil Refining & Marketing—1.0% | | | | | | | |
Petroplus Finance Ltd., 7.00%, 5/1/17,
Callable 5/1/12 @ 103.50 (b) | | | 50,000 | | | 32,750 | |
Tesoro Corp.: | | | | | | | |
6.63%, 11/1/15, Callable 11/1/10
@ 103.31 | | | 50,000 | | | 34,000 | |
6.50%, 6/1/17, Callable 6/1/12 @
103.25 | | | 50,000 | | | 33,500 | |
| | | | |
|
| |
| | | | | | 100,250 | |
| | | | |
|
| |
Packaging—2.8% | | | | | | | |
Exopack Holding Corp., 11.25%, 2/1/14,
Callable 2/1/10 @ 105.62 | | | 50,000 | | | 38,500 | |
Intertape Polymer U.S., Inc., 8.50%, 8/1/14,
Callable 8/1/09 @ 104.25 | | | 75,000 | | | 60,000 | |
Owens-Brockway Glass Containers, 6.75%,
12/1/14, Callable 12/1/09 @ 103.38 | | | 50,000 | | | 43,250 | |
Solo Cup Co., 8.50%, 2/15/14,
Callable 2/15/09 @ 104.25 | | | 200,000 | | | 134,000 | |
| | | | |
|
| |
| | | | | | 275,750 | |
| | | | |
|
| |
Printing & Publishing—2.0% | | | | | | | |
Cenveo Corp., 10.50%, 8/15/16,
Callable 8/15/12 @ 105.25 (b) | | | 50,000 | | | 42,250 | |
Morris Publishing, 7.00%, 8/1/13,
Callable 8/1/09 @ 102.33 | | | 100,000 | | | 10,000 | |
| | |
49 | HSBC INVESTOR PORTFOLIOS | See notes to financial statements. |
|
HSBC INVESTOR HIGH YIELD FIXED INCOME PORTFOLIO |
|
Schedule of Portfolio Investments—as of October 31, 2008 (continued) |
| | | | | | | |
Corporate Obligations, continued | | | | | | | |
|
|
|
|
|
|
|
|
| | | | | | | |
| | Shares or
Principal
Amount($) | | Value($) | |
| |
| |
| |
Printing & Publishing, continued | | | | | | | |
R.H. Donnelley Corp., 6.88%, 1/15/13,
Callable 1/15/09 @ 103.44 | | | 2,000 | | | 460 | |
R.H. Donnelley, Inc., 11.75%, 5/15/15,
Callable 5/15/12 @ 105.88 (b) | | | 127,000 | | | 49,530 | |
Sheridan Group, Inc., 10.25%, 8/15/11,
Callable 8/15/09 @ 100.00 | | | 100,000 | | | 83,000 | |
Valassis Communications, Inc., 8.25%,
3/1/15, Callable 3/1/11 @ 104.13 | | | 25,000 | | | 13,500 | |
| | | | |
|
| |
| | | | | | 198,740 | |
| | | | |
|
| |
Restaurants—2.1% | | | | | | | |
Buffets, Inc., 12.50%, 11/1/14,
Callable 11/1/10 @ 106.25 (d) | | | 50,000 | | | 125 | |
Dave & Buster’s, Inc., 11.25%, 3/15/14,
Callable 3/15/10 @ 105.62 | | | 50,000 | | | 37,250 | |
Landry’s Restaurants, Inc., 9.45%, 12/15/14,
Callable 2/28/09 @ 101.00 | | | 100,000 | | | 89,500 | |
NPC International, Inc., 9.50%, 5/1/14,
Callable 5/1/10 @ 104.75 | | | 50,000 | | | 31,000 | |
Rare Restaurant Group LLC, 9.25%,
5/15/14, Callable 5/15/11 @ 104.63 (b) | | | 50,000 | | | 25,000 | |
Sbarro, Inc., 10.38%, 2/1/15,
Callable 2/1/10 @ 107.78 | | | 50,000 | | | 29,000 | |
| | | | |
|
| |
| | | | | | 211,875 | |
| | | | |
|
| |
Software/Services—0.7% | | | | | | | |
CompuCom Systems, Inc., 12.50%, 10/1/15,
Callable 10/1/11 @ 106.25 (b) | | | 50,000 | | | 40,000 | |
Unisys Corp., 12.50%, 1/15/16,
Callable 1/15/12 @ 106.25 | | | 35,000 | | | 24,413 | |
| | | | |
|
| |
| | | | | | 64,413 | |
| | | | |
|
| |
Steel Producers/Products—1.4% | | | | | | | |
AK Steel Corp., 7.75%, 6/15/12,
Callable 6/15/09 @ 101.29 | | | 100,000 | | | 80,000 | |
Ryerson, Inc., 12.00%, 11/1/15,
Callable 11/1/11 @ 106.00 (b) | | | 50,000 | | | 34,000 | |
Tube City IMS Corp., 9.75%, 2/1/15,
Callable 2/1/11 @ 104.88 | | | 50,000 | | | 29,000 | |
| | | | |
|
| |
| | | | | | 143,000 | |
| | | | |
|
| |
Support - Services—6.3% | | | | | | | |
Aramark Services, Inc., 8.50%, 2/1/15,
Callable 2/1/11 @104.25 | | | 75,000 | | | 64,125 | |
Avis Budget Car Rental, Inc., 7.63%, 5/15/14,
Callable 5/15/10 @ 103.81 | | | 100,000 | | | 36,000 | |
Education Management LLC: | | | | | | | |
8.75%, 6/1/14, Callable 6/1/10 @ 104.38 | | | 25,000 | | | 18,250 | |
10.25%, 6/1/16, Callable 6/1/11 @ 105.13 | | | 25,000 | | | 17,250 | |
H&E Equipment Services, Inc., 8.38%,
7/15/16, Callable 7/15/11 @ 104.19 | | | 75,000 | | | 39,750 | |
Hertz Corp., 8.88%, 1/1/14,
Callable 1/1/10 @104.44 | | | 100,000 | | | 73,000 | |
Iron Mountain, Inc., 8.63%, 4/1/13,
Callable 4/1/09 @ 100.00 | | | 100,000 | | | 91,250 | |
JohnsonDiversey, Inc., 9.63%, 5/15/12,
Callable 5/15/09 @ 101.60 | | | 100,000 | | | 89,000 | |
KAR Holdings, Inc., 8.75%, 5/1/14,
Callable 5/1/10 @ 104.38 | | | 50,000 | | | 32,500 | |
| | | | | | | |
Corporate Obligations, continued | | | | | | | |
|
|
|
|
|
|
|
|
| | | | | | | |
| | Shares or
Principal
Amount($) | | Value($) | |
| |
| |
| |
Support - Services, continued | | | | | | | |
MediMedia USA, Inc., 11.38%, 11/15/14,
Callable 11/15/09 @ 105.69 (b) | | | 50,000 | | | 40,000 | |
Pegasus Solutions, Inc., 10.50%, 4/15/15,
Callable 4/15/11 @ 105.25 (b) | | | 50,000 | | | 34,500 | |
RSC Equipment Rental, Inc., 9.50%, 12/1/14,
Callable 12/1/10 @ 104.75 | | | 50,000 | | | 30,000 | |
Sotheby’s, 7.75%, 6/15/15 (b) | | | 50,000 | | | 29,500 | |
United Rentals, Inc., 6.50%, 2/15/12,
Callable 12/15/09 @ 101.53 | | | 25,000 | | | 17,500 | |
West Corp., 11.00%, 10/15/16,
Callable 10/15/11 @ 105.50 | | | 25,000 | | | 11,687 | |
| | | | |
|
| |
| | | | | | 624,312 | |
| | | | |
|
| |
Telecom - Integrated/Services—3.7% | | | | | | | |
Broadview Networks Holdings, Inc., 11.38%,
9/1/12, Callable 9/1/09 @ 105.69 | | | 25,000 | | | 18,000 | |
Cincinnati Bell, Inc., 8.38%, 1/15/14,
Callable 1/15/09 @ 104.19 | | | 85,000 | | | 61,413 | |
Citizens Communications Co., 7.13%,
3/15/19 | | | 50,000 | | | 30,750 | |
Fairpoint Communications, Inc., 13.13%,
4/1/18, Callable 4/1/13 @ 106.56 (b) | | | 25,000 | | | 17,625 | |
Level 3 Financing, Inc., 9.25%, 11/1/14,
Callable 11/1/10 @ 104.63 | | | 50,000 | | | 28,500 | |
Nordic Telephone Co., Holdings, 8.88%,
5/1/16, Callable 5/1/11 @ 104.44 (b) | | | 50,000 | | | 42,000 | |
PAETEC Holding Corp., 9.50%, 7/15/15,
Callable 7/15/11 @ 104.75 | | | 50,000 | | | 28,375 | |
Qwest Corp., 7.63%, 6/15/15 | | | 150,000 | | | 114,750 | |
Windstream Corp., 8.63%, 8/1/16,
Callable 8/1/11 @ 104.31 | | | 25,000 | | | 18,875 | |
| | | | |
|
| |
| | | | | | 360,288 | |
| | | | |
|
| |
Telecom - Wireless—4.5% | | | | | | | |
Centennial Communications Corp., 10.00%,
1/1/13, Callable 1/1/09 @ 107.50 | | | 100,000 | | | 88,500 | |
Cricket Communications, 9.38%, 11/1/14,
Callable 11/1/10 @ 104.69 | | | 50,000 | | | 40,625 | |
iPCS, Inc., 6.05%, 5/1/14,
Callable 5/1/09 @ 101.00 (c) | | | 100,000 | | | 69,000 | |
MetroPCS Wireless, Inc., 9.25%, 11/1/14,
Callable 11/1/10 @ 104.63 | | | 100,000 | | | 83,250 | |
Sprint Capital Corp., 8.38%, 3/15/12 | | | 100,000 | | | 80,500 | |
Wind Acquisition Financial SA, 10.75%,
12/1/15, Callable 12/1/10 @ 105.38 (b) | | | 100,000 | | | 77,000 | |
| | | | |
|
| |
| | | | | | 438,875 | |
| | | | |
|
| |
Theaters & Entertainment—0.8% | | | | | | | |
AMC Entertainment, Inc., 11.00%, 2/1/16,
Callable 2/1/11@ 105.50 | | | 100,000 | | | 79,000 | |
| | | | |
|
| |
Tobacco—0.4% | | | | | | | |
Alliance One International, Inc., 8.50%,
5/15/12 | | | 50,000 | | | 38,500 | |
| | | | |
|
| |
Transportation Excluding Air/Rail—0.3% | | | | | | | |
Navios Maritime Holdings, Inc., 9.50%,
12/15/14, Callable 12/15/10 @ 104.75 | | | 25,000 | | | 20,500 | |
Swift Transportation Co., Inc., 10.55%,
5/15/15, Callable 5/15/09 @ 102.00 (b)(c) | | | 50,000 | | | 10,000 | |
| | | | |
|
| |
| | | | | | 30,500 | |
| | | | |
|
| |
| | |
See notes to financial statements. | HSBC INVESTOR PORTFOLIOS | 50 |
|
HSBC INVESTOR HIGH YIELD FIXED INCOME PORTFOLIO |
|
Schedule of Portfolio Investments—as of October 31, 2008 (continued) |
| | | | | | | |
Corporate Obligations, continued | | | | | | | |
|
|
|
|
|
|
|
|
| | Shares or |