Barclays Capital U.S. Aggregate Bond Index is an unmanaged index generally representative of investment-grade fixed-rate debt issues, including government, corporate, asset-backed, and mortgage-backed securities, with maturities of at least one year.
Barclays Capital U.S. Corporate Bond Index is an unmanaged index includes publicly issued U.S. corporate and specified foreign debentures and secured notes that meet the specified maturity, liquidity, and quality requirements. To qualify, bonds must be SEC-registered.
Barclays Capital U.S. Corporate High-Yield Bond Index is an unmanaged index that covers the USD-denominated, non-investment grade, fixed-rate, taxable corporate bond market. Securities are classified as high-yield if the middle rating of Moody’s, Fitch, and S&P is Ba1/BB+/BB+ or below. The index excludes emerging markets debt.
Lipper International Large-Cap Value Funds Average is an equally weighted average of mutual funds that, by portfolio practice, invest at least 75% of their equity assets in companies strictly outside of the U.S. with market capitalizations (on a three-year weighted basis) above Lipper’s international large-cap floor. International large-cap value funds typically have a below-average price-to-cash flow ratio, price-to-book ratio, and three-year sales-per-share growth value compared to their large-cap-specific subset of the S&P/Citigroup World ex-U.S. BMI.
Lipper Large-Cap Core Funds Average is an equally weighted average of mutual funds that, by portfolio practice, invest at least 75% of their equity assets in companies with market capitalizations (on a three-year weighted basis) above Lipper’s U.S. Diversified Equity large-cap floor. Large-cap core funds have more latitude in the companies in which they invest. These funds typically have an average price-to-earnings ratio, price-to-book ratio, and three-year sales-per-share growth value, compared to the S&P 500 Index.
Lipper Large-Cap Growth Funds Average is an equally weighted average of mutual funds that, by portfolio practice, invest at least 75% of their equity assets in companies with market capitalizations (on a three-year weighted basis) above Lipper’s U.S. Diversified Equity large-cap floor. Large-cap growth funds typically have an above-average price-to-earnings ratio, price-to-book ratio, and three-year sales-per-share growth value, compared to the S&P 500 Index.
Lipper Mid-Cap Growth Funds Average is an equally weighted average of mutual funds that, by portfolio practice, invest at least 75% of their equity assets in companies with market capitalizations (on a three-year weighted basis) below Lipper’s U.S. Diversified Equity large-cap floor. Mid-cap growth funds typically have an above-average price-to-earnings ratio, price-to-book ratio, and three-year sales-per-share growth value, compared to the S&P MidCap 400 Index.
MSCI EAFE Index (Europe, Australasia, Far East) is an unmanaged free float-adjusted market capitalization index that is designed to measure the equity market performance of developed markets, excluding the U.S. & Canada. The MSCI EAFE Index currently consists of the following 22 developed market country indices: Australia, Austria, Belgium, Denmark, Finland, France, Germany, Greece, Hong Kong, Ireland, Israel, Italy, Japan, the Netherlands, New Zealand, Norway, Portugal, Singapore, Spain, Sweden, Switzerland and the United Kingdom.
Russell Midcap® Index measures the performance of the mid-cap segment of the U.S. equity universe. The Russell Midcap® Index is a subset of the Russell 1000® Index. It includes approximately 800 of the smallest securities based on a combination of their market cap and current index membership. The Russell Midcap® Index represents approximately 31% of the total market capitalization of the Russell 1000 companies.
Russell 1000® Growth Index is an unmanaged index that measures the performance of the large-cap growth segment of the U.S. equity universe. It includes those Russell 1000 companies with higher price-to-book ratios and higher forecasted growth values.
Russell 1000® Value Index is an unmanaged index that measures the performance of the large-cap value segment of the U.S. equity universe. It includes those Russell 1000 companies with lower price-to-book ratios and lower expected growth values.
Russell 2000® Index is an unmanaged index which measures the performance of the small-cap segment of the U.S. equity universe. The Russell 2000 Index is a subset of the Russell 3000® Index representing approximately 8% of the total market capitalization of that index. It includes approximately 2000 of the smallest securities based on a combination of their market cap and current index membership.
Russell 2500™ Growth Index is an unmanaged index that measures the performance of the small- to mid-cap growth segment of the U.S. equity universe. It includes those Russell 2500 companies with higher price-to-book ratios and higher forecasted growth values.
Standard & Poor’s MidCap 400 Index (“S&P MidCap 400”) is an unmanaged index that is the most widely used index for mid-sized companies. The S&P MidCap 400 covers 7% of the U.S. equities market, and is part of a series of S&P U.S. indices that can be used as building blocks for portfolio composition.
Standard & Poor’s 500 Index (“S&P 500”) is an unmanaged index that is widely regarded as a gauge of the U.S. equities market, this index includes 500 leading companies in leading industries of the U.S. economy. The S&P 500 focuses on the large cap segment of the market, with approximately 75% coverage of U.S. equities.
Lipper is an independent mutual fund performance monitor whose results are based on total return and do not reflect a sales charge.
Securities indices assume reinvestment of all distributions and interest payments and do not take in account brokerage fees or expenses. Securities in the Funds do not match those in the indices and performance of the Funds will differ. Investors cannot invest directly in an index.
December 16, 2010
To Our Shareholders:
For the 12-month period ended October 31, 2010, equity and debt markets performed well, with returns of 16.52% for the S&P 500 Index1, 8.82% for the MSCI EAFE Index1, 26.58% for the Russell 2000 Index1 and 8.01% for the Barclays Capital U.S. Aggregate Bond Index1.
The period began with several encouraging economic indicators, which helped buoy investor sentiment. However, concerns about a “double-dip” recession in the U.S. increased, as did questions about the financial strength of certain countries in the European Union, such as Greece, whose debt was downgraded by credit rating agencies. The market declines associated with these concerns and events proved short-lived, though, and the markets strengthened late in the period. We are pleased that our funds also performed well during the 12 months under review. In the case of our money market funds, by far the largest asset class in our fund family, this performance comes despite the conservatism of our investment discipline—a discipline the investment adviser adopted ahead of Securities and Exchange Commission (“SEC”) mandated guidelines. These guidelines include, but are not limited to, daily and weekly portfolio liquidity requirements of 10% and 30%, respectively; portfolio quality limitations on second-tier securities; and a reduction in the overall weighted average maturity of money market funds.
These funds’ yields have been supported by significant fee waivers by the investment adviser and our other service providers, as shown in the chart below:
| | | | |
Fund | | Fees Waived | |
California Tax-Free Money Market Fund | | $ | 327,580 | |
New York Tax-Free Money Market Fund | | | 1,274,087 | |
Prime Money Market Fund | | | 7,423,993 | |
Tax-Free Money Market Fund | | | 438,252 | |
U.S. Government Money Market Fund | | | 6,211,568 | |
U.S. Treasury Money Market Fund | | | 6,910,492 | |
Such waivers have become common in the money market fund industry. A more detailed discussion of these fee waivers can be found in the footnotes that accompany the financial statements of the money market funds.
Overall, we are pleased with the performance of the equity funds. The HSBC Investor International Equity Fund has, however, lagged its benchmark for 1-, 3- and 5- year periods. In December 2010, the Board approved a change in sub-advisor for this fund; Lord Abbett & Co. was hired as the new sub-adviser to the fund, effective January 2010. Shareholders of this fund will receive more information about this change in the future.
The Board and the investment adviser continue to pursue appropriate expansion and positioning of the fund family. HSBC has a long history of operating and investing in emerging markets, and the possibility of offering U.S. investors funds that capitalize on that experience and expertise is intriguing. While it is increasingly difficult to find asset classes that provide real diversification (investment professionals describe this as “narrowing correlation coefficients”), at this time emerging markets appear to offer such diversification. Emerging markets are widely favored by the pundits at this time. They cite valuations that are attractive by historic measures, rising capital inflows (though they remain below prior highs) and “QEII”—the Fed’s second round of monetary easing, which some observers feel is likely to further boost such investment inflows, thereby increasing these valuations. Some concern remains about these markets’ abilities to absorb these inflows. We look forward to providing you with more information on this topic at the appropriate time in the future.
QEII, the Federal Reserve’s $600 billion program to buy long-term Treasuries over the next three quarters, is both controversial and problematic when banks are highly liquid and lending is trivial. At best, I believe that the program might stimulate U.S. Gross Domestic Product (“GDP”)1 growth by 0.5%—a paltry increment that comes at high cost given the twin deficits. So, we think it best to view this effort as effectively another effort to lift the value of risk assets and to recapitalize the banks, which may borrow from the Fed at 0.25% and buy Treasuries yielding 3% or more.
| |
1 | HSBC INVESTOR FAMILY OF FUNDS |
|
Chairman’s Message (continued) |
|
At year end, the Board accepted with great regret the resignation of long-time independent chair Dr. Larry Robbins, a founding trustee of the predecessor fund family almost 25 years ago. We are delighted that Larry agreed to serve as trustee emeritus for a year, so his warmth and insight will still be available to us.
Finally, we note that Andrew Donohue stepped down as Director of the Division of Investment Management of the Securities and Exchange Commission effective November 19, 2010. “Buddy”, as he’s better known to his many friends in the fund industry, was a superb regulator—tough-minded but fair, creative, and single-minded in serving the needs of American investors. We all recall fondly his visit to a Board dinner—an outreach practice he followed throughout his SEC tenure and one that other government figures would do well to emulate.
This is my second letter as chairman to our shareholders. In drafting both reports, I’ve thought of how Charles Dickens began his novel about the French Revolution, A Tale of Two Cities: “It was the best of times, it was the worst of times...” So, too, might any money manager opine of any moment. Today, there are deep global economic imbalances—between east and west, north and south. And within our most advanced economies a growing gap prevails between governments’ promises and their ability to honor those promises. This challenge comes at a time of discouraging demographics in the OECD countries. We believe this challenge confers a special responsibility to provide the best possible risk-adjusted performance to those investors who entrust us with their capital.
I can assure you that my colleagues and I, as well as the investment adviser and other service providers, take this duty very seriously and pledge our very best effort to that good end.
Cordially,

Michael Seely
Chairman, HSBC Investor Funds
| |
1 | For additional information, please refer to the Glossary of Terms. |
| |
HSBC INVESTOR FAMILY OF FUNDS | 2 |
Dear Shareholder,
Welcome to the HSBC Investor Funds annual report, covering the period between November 1, 2009 and October 31, 2010. This report offers detailed information about your Funds’ results. We encourage you to review it carefully.
Inside these pages you will find a letter from the Funds’ Chairman, Michael Seely, in which he comments on recent market developments. As always, the report includes the financial statements covering the fiscal year for each of the funds. The report also includes commentary from the Funds’ portfolio managers in which they discuss the investment markets during the period and their respective Fund’s performance. Each commentary is accompanied by the Fund’s return for the period, listed alongside the returns of its benchmark index and peer group average for comparative purposes.
The near-zero short-term rate environment has persisted throughout the Funds’ fiscal year and is likely to continue for some time. In response, HSBC has continued to waive a portion of its advisory and shareholder servicing fees from the various money market funds in order to maintain a positive yield for the Funds’ shareholders.
Our Multimanager team continues to review and monitor the subadvisors that manage the Equity Funds. The team also reviews and monitors the third party funds in which the World Selection Funds invest. We believe that this level of review and oversight helps to provide the Funds’ shareholders with significant benefits, including competitive performance.
In closing, we would like to thank you for investing through the HSBC Investor Funds. We appreciate the trust you place in us, and will continue working to earn it. Please contact us at any time with questions or concerns.
Sincerely,

Richard A. Fabietti
President
| |
3 | HSBC INVESTOR FAMILY OF FUNDS |
|
Commentary From the Investment Manager |
|
HSBC Global Asset Management (USA) Inc. |
U.S. Economic Review
The 12-month period between November 1, 2009 and October 31, 2010 began with continued global macroeconomic improvements. Central banks around the developed world fueled the recovery by maintaining interest rates at record lows, and governments provided stimulus programs to spark growth. In the U.S., the Federal Reserve positioned the federal funds rate—a key factor in lending rates—at a historically low target range between 0.00% to 0.25%, and maintained its quantitative easing program throughout the 12-month period.
Early in the period, several encouraging U.S. economic indicators, including positive manufacturing data and improving consumer spending levels, suggested the rebound was gaining strength. However, as the year progressed, signs emerged that the U.S. economic recovery was losing momentum. For example, the index of leading indicators in April 2010 was worse than expected, falling for the first time since March 2009. Although this period of moderation continued, several economic indicators appeared to stabilize as the period wore on, reducing fears of a “double-dip” recession. Nevertheless, there are still some areas of concern—including high U.S. unemployment figures—and forecasts now point towards a slower recovery than was anticipated at the beginning of the period.
Meanwhile, the year was regularly punctuated by periods of volatility due to sovereign debt issues in the Eurozone. This was most apparent in April when credit rating downgrades of Greece and other peripheral Eurozone countries caused bond yields in those countries to rocket upwards. In response to the deterioration of the debt situation, the International Monetary Fund (IMF) and the European Central Bank (ECB) stepped in. They agreed to a $1 trillion package, providing loan guarantees and credits, not just to Greece but to all Eurozone states in financial difficulty, restoring a measure of comfort to investors. More recently, however, debt concerns have resurfaced and the fiscal situation of countries throughout the developed world, including the U.S., continue to cause concern.
Market Review
The financial markets rallied during the first half of the period driven by positive earnings surprises, attractive valuations and ample liquidity. Investors in this environment were more comfortable with higher-risk areas of the markets, helping emerging markets and small-cap stocks produce strong gains during the six months through April.
The fiscal troubles in the Eurozone largely halted the rally in international stocks. Investors became more risk averse in this environment, which in turn pushed down equity markets around the world. In May 2010, developed markets declined by an average of 9%, while emerging markets fell by roughly 8%. However, thanks to a financial support facility from the ECB and IMF, these declines generally were short-lived. Emerging markets stocks staged a particularly strong rebound, driven by strong macroeconomic data and performed well for the period as a whole. Developed market international stocks did not perform as well for the fiscal year, in large part because of the impact of the Eurozone’s sovereign debt issues. The MSCI EAFE Index1 (Europe, Australasia and Far East) of international stocks returned 8.82%, in U.S. Dollar terms, for the 12-month period.
Domestic stocks experienced much stronger returns than their counterparts in developed foreign markets. The S&P 500 Index1 of large-company stocks returned 16.52% for the 12 months through October 2010. Small-cap and mid-cap stocks were among the period’s strongest performers: The Russell 2000® Index1 of small-company stocks returned 26.58%, and the Russell Midcap® Index1 returned 27.71%. The small- and mid-cap categories especially benefited early in the period, due to the early strength and breadth of the U.S. economic recovery and strong corporate earnings results.
Within fixed income, the performance of U.S. Treasuries was mixed over the period. Initially, the pursuit of higher yielding assets led to lower demand for government bonds. As the period progressed, investors responded to increased market volatility by returning to the relative safety of U.S. government bonds, improving their performance. Still, Treasuries lagged the rest of the fixed-income market for the 12 months as a whole. Investment grade corporate bonds and high-yield bonds benefited from attractive valuation levels and a strong improvement in corporate earnings and microeconomic conditions.
The Barclays Capital U.S. Corporate Bond Index1, which tracks the broad investment-grade fixed-income market, returned 11.61% for the 12 months through October, while the Barclays Capital U.S. Corporate High-Yield Bond Index1 returned 19.35%.
| |
1 | For additional information, please refer to the Glossary of Terms. |
| |
HSBC INVESTOR FAMILY OF FUNDS | 4 |
|
Portfolio Reviews |
|
HSBC Investor Growth Fund |
(Class A Shares, B Shares, C Shares and I Shares) |
by Clark J. Winslow, Chief Executive Officer/Portfolio Manager |
Justin H. Kelly, CFA, Senior Managing Director/Portfolio Manager |
R. Bartlett Wear, CFA, Senior Managing Director/Portfolio Manager |
Winslow Capital Management, Inc. |
The HSBC Investor Growth Fund (the “Fund”) seeks long-term growth of capital. Under normal market conditions, the Fund invests primarily in U.S. and foreign equity securities of high quality companies with market capitalization generally in excess of $2 billion which the subadviser believes the potential to generate superior levels of long-term profitability and growth. The Fund utilizes a two-tier structure, commonly known as a “master-feeder” structure, in which the Fund invests all of its investable assets in the HSBC Investor Growth Portfolio (the “Portfolio”). The Portfolio employs Winslow Capital Management, Inc. as subadviser.
Investment Concerns
Equity securities (stocks) are more volatile and carry more risk than other forms of investments, including investments in high-grade fixed income securities.
The growth investment style may fall out of favor in the marketplace and result in significant declines in the value of the Portfolio’s securities. Securities of companies considered to be growth investments may have rapid price swings in the event of earnings disappointments or during periods of market, political, regulatory and economics uncertainty.
The net asset value per share of this Fund will fluctuate as the value of the securities in the portfolio changes.
Market Commentary
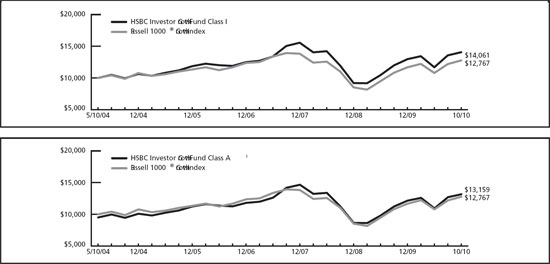
The Fund returned 19.78% (without sales charge) for the Class A Shares and 20.08% for the Class I Shares for the 12-month period ended October 31, 2010. That compared to a 19.65% return for the Russell 1000® Growth Index1 and a 17.70% return for the Lipper Large-Cap Growth Funds Average1.
Portfolio Performance
The Fund and the market posted strong absolute performance during the period in question, although returns dragged at times due to concerns about the possibility of a “double dip” recession.
The period began with solid equity returns. Stocks pulled back briefly in January, but continued to climb as investors became encouraged by improvements in the economy and corporate profits. However, uncertainty about the strength of the economic recovery set in midway through the period due to concerns about European sovereign debt, increased government regulation and sluggish employment growth. Equity performance varied during the latter half of the period.
The Fund outperformed its benchmark due to strong stock selection in the technology, consumer discretionary and industrials sectors. The information technology sector was among the strongest performing sectors during the period. The Fund’s stock selection in the sector—in particular its long-held position in shares of a top provider of technology consulting services—allowed it to benefit more from the technology sector’s performance than its benchmark.*
Selection in the consumer discretionary sector also helped boost the Fund’s relative returns. Likewise, holding three top-performing industrials stocks also helped it outpace its benchmark. Meanwhile, the Fund consistently underweighted the consumer staples sector. It performed poorly during the period, resulting in positive relative results for the Fund.*
Both stock selection and an overweight allocation in the financials sector hurt the Fund’s performance relative to its benchmark. The Fund’s exposure to energy stocks dragged on performance as the sector experienced volatile crosscurrents during the period. On balance, for the 12 months ended October 31, 2010, the overall gain in the Fund was favorable.*
| |
* | Portfolio composition is subject to change. |
|
1 | For additional information, please refer to the Glossary of Terms. |
Past performance does not guarantee future results. The performance data quoted represents past performance and current returns may be lower or higher. Total return figures include change in share price, reinvestment of dividends and capital gains and do not reflect taxes that a shareholder would pay on Fund distributions or on the redemption of Fund shares. The investment return and principal value will fluctuate so that an investor’s shares, when redeemed may be worth more or less than the original cost. To obtain performance information current to the most recent month end, please call 1-800-782-8183.
| |
5 | HSBC INVESTOR FAMILY OF FUNDS |
|
Portfolio Reviews |
|
HSBC Investor Growth Fund - As of October 31, 2010 |
|
Value of a $10,000 Investment |
|
The charts above represent a comparison of a hypothetical $10,000 investment in the indicated share class versus a similar investment in the Fund’s benchmark and represents the reinvestment of dividends and capital gains in the Fund.
| | | | | | | | | | | | | |
Fund Performance | | | | Average Annual
Total Return (%) | | Expense
Ratio (%)6 | |
|
|
|
|
|
|
|
|
|
|
|
|
|
|
As of October 31, 2010 | | Inception
Date | | 1
Year* | | 5
Year | | Since
Inception | | Gross | | Net | |
|
|
|
|
|
|
|
|
|
|
|
|
|
|
HSBC Investor Growth Fund Class A1 | | 5/7/045 | | 13.79 | | 3.11 | | 4.33 | | 1.41 | | 1.20 | |
|
|
|
|
|
|
|
|
|
|
|
|
|
|
HSBC Investor Growth Fund Class B2 | | 5/7/045 | | 14.97 | | 3.39 | | 4.41 | | 2.16 | | 1.95 | |
|
|
|
|
|
|
|
|
|
|
|
|
|
|
HSBC Investor Growth Fund Class C3 | | 5/7/045 | | 17.92 | | 3.40 | | 4.37 | | 2.16 | | 1.95 | |
|
|
|
|
|
|
|
|
|
|
|
|
|
|
HSBC Investor Growth Fund Class I | | 5/7/045 | | 20.08 | | 4.42 | | 5.40 | | 1.16 | | 0.95 | |
|
|
|
|
|
|
|
|
|
|
|
|
|
|
Russell 1000® Growth Index4 | | — | | 19.65 | | 3.21 | | 3.857 | | N/A | | N/A | |
|
|
|
|
|
|
|
|
|
|
|
|
|
|
Lipper Large-Cap Growth Funds Average4 | | — | | 17.70 | | 2.12 | | 3.317 | | N/A | | N/A | |
|
|
|
|
|
|
|
|
|
|
|
|
|
|
Past performance does not guarantee future results. The performance data quoted represents past performance and current returns may be lower or higher. Total return figures include change in share price, reinvestment of dividends and capital gains and do not reflect the taxes that a shareholder would pay on Fund distributions or on the redemption of Fund shares. The investment return and principal value will fluctuate so that an investor’s shares, when redeemed may be worth more or less than the original cost. To obtain performance information current to the most recent month end, please call 1-800-782-8183.
The performance above reflects any fee waivers that have been in effect during the applicable periods, as well as any expense reimbursements that have periodically been made. Absent such waivers and reimbursements, returns would have been lower. Currently, contractual fee waivers are in effect from March 1, 2010 through March 1, 2011.
During the fiscal periods ended October 31, 2008, 2009 and 2010, the Portfolio in which the Fund invests, received monies related to certain nonrecurring litigation settlements which enhanced performance. Without the receipt of these payments, the returns for applicable periods would be lower.
| |
* | The recent growth rate in the stock market has helped to produce short-term returns that are not typical and may not continue in the future. Because of ongoing market volatility, Fund performance may be subject to substantial short-term changes. |
| |
1 | Reflects the maximum sales charge of 5.00%. |
| |
2 | Reflects the applicable contingent deferred sales charge maximum of 4.00%. |
| |
3 | Reflects the applicable contingent deferred sales charge maximum of 1.00%. |
| |
4 | For additional information, please refer to the Glossary of Terms. |
| |
5 | The HSBC Investor Growth Fund was initially offered for purchase effective May 7, 2004, however, no shareholder activity occurred until May 10, 2004. |
| |
6 | Reflects the expense ratio as reported in the prospectus dated March 1, 2010. |
| |
7 | Return for the period 5/10/04 to 10/31/10. |
The Fund’s performance is measured against the Russell 1000® Growth Index, an unmanaged index that measures the performance of the large-cap growth segment of the U.S. equity universe. It includes those Russell 1000 companies with higher price-to-book ratios and higher forecasted growth values. The performance of the index does not reflect the deduction of expenses associated with a mutual fund, such as investment management and fund accounting fees. The Fund’s performance reflects the deduction of fees for these value-added services. Investors cannot invest directly in an index.
| |
HSBC INVESTOR FAMILY OF FUNDS | 6 |
|
Portfolio Reviews |
|
HSBC Investor International Equity Fund
HSBC Investor Overseas Equity Fund |
(Class A Shares, B Shares, and C Shares) |
by Sharon Fay, CFA, Executive Vice President and CIO Global Value Equities
Kevin Simms, Co-CIO International Equities
Giulio Martini, Head Currency Team
Henry D’Auria, CFA, Co-CIO International Equities
AllianceBernstein L.P. |
The HSBC Investor International Equity Fund and the HSBC Investor Overseas Equity Fund (the “Funds”) seek to provide their shareholders with long-term growth of capital and future income. Under normal market conditions, each Fund invests at least 80% of its net assets in equity securities of companies organized and domiciled in developed nations outside the United States or for which the principal trading market is outside the United States, including Europe, Canada, Australia and the Far East. Each Fund may invest up to 20% of its assets in equity securities of companies in emerging markets. The Funds employ a two-tier fund structure, known as a “master-feeder” structure, in which the Funds invest all of their investable assets in the HSBC Investor International Equity Portfolio (the “Portfolio”). AllianceBernstein L.P., acting through the Bernstein Value Equities Unit (“AllianceBernstein”), serves as the subadviser to the Portfolio and manages its investments.
Investment Concerns
There are risks associated with investing in foreign companies, such as erratic market conditions, economic and political instability and fluctuations in currency and exchange rates.
Equity securities (stocks) are more volatile and carry more risk than other forms of investments, including investments in high-grade fixed income securities.
The net asset value per share of this Fund will fluctuate as the value of the securities in the portfolio changes.
Market Commentary
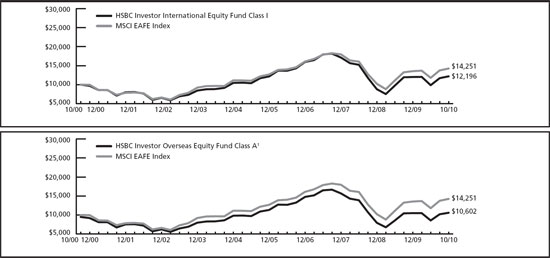
The HSBC Investor International Fund returned 5.99% for the Class I Shares and the HSBC Investor Overseas Equity Fund Class A Shares returned 5.17% (without sales charge) during the 12-month period ended October 31, 2010. That compared to an 8.82% return for the Fund’s benchmark, the MSCI EAFE Index 1 (Europe, Australasia and Far East).
Portfolio Performance
The Fund’s absolute return reflects the modest gains produced by international equity markets during the period. While international markets generated moderate, positive returns for the full fiscal year, they experienced extreme volatility within the period, in part due to concerns about sovereign debt issues in Greece and the stability of the European economy. The Fund’s benchmark experienced wide swings, falling by 11% in one month and gaining 9% during each of two separate months.
The Fund’s performance relative to its benchmark was hurt by stock selection in the technology and energy sectors. Investments in two Japanese technology companies, which experienced pressure from a strengthening yen and increased competition from Korean technology companies, weighed on relative return. Certain holdings in the energy sector also dragged on performance against the benchmark.*
Regionally, an overweight position in emerging markets and, to a lesser extent, Japan and the U.K., produced positive returns for the Fund relative to its benchmark. Underweight positions in Australia and Japan hindered relative performance, due to currency appreciation in those countries.*
Stock selection in the manufacturing, financial and health care sectors boosted the Fund’s return against its benchmark. Positions in two European auto manufacturers produced positive relative performance, as did a position in a British manufacturer of aircraft engines. While sales in aircraft engines remained weak, cash flow associated with the service of engines was robust. In the health care sector, the Fund’s relative performance benefited from its position in a pharmaceutical company that received a favorable resolution regarding patent litigation.
During the period, the Fund used derivative instruments in the management of its portfolio. These instruments represented a small portion of the Fund’s portfolio—on average less than 1% of its overall value.*
Specifically, the Fund invested in foreign currency forwards as a defensive hedge for the Fund’s base currency, the U.S. dollar. The purpose of this hedging strategy is to insulate the Fund’s returns from adverse currency movements. Though currency forwards are not traded on a regulated exchange, the forward market is extremely liquid. All currency exposures are marked to market daily, and therefore we believe that the risks of the forwards are the same as the risk of the underlying currency.*
| |
* | Portfolio composition is subject to change. |
| |
1 | For additional information, please refer to the Glossary of Terms. |
Past performance does not guarantee future results. The performance data quoted represents past performance and current returns may be lower or higher. Total return figures include change in share price, reinvestment of dividends and capital gains and do not reflect taxes that a shareholder would pay on Fund distributions or on the redemption of Fund shares. The investment return and principal value will fluctuate so that an investor’s shares, when redeemed may be worth more or less than the original cost. To obtain performance information current to the most recent month end, please call 1-800-782-8183.
| |
7 | HSBC INVESTOR FAMILY OF FUNDS |
|
Portfolio Reviews |
|
HSBC Investor International Equity Fund |
HSBC Investor Overseas Equity Fund - As of October 31, 2010 |
|
Value of a $10,000 Investment |
|
The charts above represent a comparison of a hypothetical $10,000 investment in the indicated share class versus a similar investment in the Fund’s benchmark and represents the reinvestment of dividends and capital gains in the Fund.
| | | | | | | | | | | | | |
Fund Performance | | | | Average Annual Total
Return (%) | | Expense
Ratio (%)5 | |
|
|
|
|
|
|
|
|
|
|
|
|
|
|
As of October 31, 2010 | | Inception
Date | | 1
Year | | 5
Year | | 10
Year | | Gross | | Net | |
|
|
|
|
|
|
|
|
|
|
|
|
|
|
HSBC Investor International Equity Fund Class I* | | 1/9/95 | | 5.99 | | 1.64 | | 2.01 | | 0.97 | | 0.97 | |
|
|
|
|
|
|
|
|
|
|
|
|
|
|
HSBC Investor Overseas Equity Fund Class A1 | | 8/26/96 | | -0.19 | | -0.80 | | 0.59 | | 2.52 | | 1.85 | |
|
|
|
|
|
|
|
|
|
|
|
|
|
|
HSBC Investor Overseas Equity Fund Class B2 | | 1/6/98 | | 0.52 | | -0.49 | | 0.64 | | 3.27 | | 2.60 | |
|
|
|
|
|
|
|
|
|
|
|
|
|
|
HSBC Investor Overseas Equity Fund Class C3 | | 11/4/98 | | 3.43 | | -0.48 | | 0.36 | | 3.27 | | 2.60 | |
|
|
|
|
|
|
|
|
|
|
|
|
|
|
MSCI EAFE Index4 | | — | | 8.82 | | 3.79 | | 3.61 | | N/A | | N/A | |
|
|
|
|
|
|
|
|
|
|
|
|
|
|
Lipper International Large-Cap Value Funds Average4 | | — | | 7.86 | | 2.19 | | 4.33 | | N/A | | N/A | |
|
|
|
|
|
|
|
|
|
|
|
|
|
|
Past performance does not guarantee future results. The performance data quoted represents past performance and current returns may be lower or higher. Total return figures include change in share price, reinvestment of dividends and capital gains and do not reflect the taxes that a shareholder would pay on Fund distributions or on the redemption of Fund shares. The investment return and principal value will fluctuate so that an investor’s shares, when redeemed may be worth more or less than the original cost. To obtain performance information current to the most recent month end, please call 1-800-782-8183.
The performance above reflects any fee waivers that have been in effect during the applicable periods, as well as any expense reimbursements that have periodically been made. Absent such waivers and reimbursements, returns would have been lower. Currently, contractual fee waivers are in effect from March 1, 2010 through March 1, 2011 for the Overseas Equity Fund.
During the fiscal periods ended October 31, 2007 and 2010, the Portfolio in which the Fund invests, received monies related to certain nonrecurring litigation settlements which enhanced performance. Without the receipt of this payment, the returns for applicable periods would be lower.
| |
* | The Class I Shares are issued by HSBC Investor International Equity Fund, a series of HSBC Advisor Funds Trust. |
| |
1 | Reflects the maximum sales charge of 5.00%. |
| |
2 | Reflects the applicable contingent deferred sales charge maximum of 4.00%. |
| |
3 | Reflects the applicable contingent deferred sales charge maximum of 1.00%. |
| |
4 | For additional information, please refer to the Glossary of Terms. |
| |
5 | Reflects the expense ratio as reported in the prospectus dated March 1, 2010. |
The Fund’s performance is measured against the MSCI EAFE Index (Europe, Australasia, Far East), an unmanaged free float-adjusted market capitalization index that is designed to measure the equity market performance of developed markets, excluding the U.S. & Canada. The MSCI EAFE Index currently consists of the following 21 developed market country indices: Australia, Austria, Belgium, Denmark, Finland, France, Germany, Greece, Hong Kong, Ireland, Italy, Japan, the Netherlands, New Zealand, Norway, Portugal, Singapore, Spain, Sweden, Switzerland and the United Kingdom. The performance of the index does not reflect the deduction of expenses associated with a mutual fund, such as investment management and fund accounting fees. The Funds’ performance reflects the deduction of fees for these value-added services. Investors cannot invest directly in an index.
| |
HSBC INVESTOR FAMILY OF FUNDS | 8 |
|
Portfolio Reviews |
|
HSBC Investor Mid-Cap Fund |
(Class A Shares, B Shares, C Shares and Class I Shares) |
by Tony Y. Dong, CFA, CIO and Lead Manager, Mid-Cap Team
Geoffrey A. Wilson, CFA, Co-CIO and Senior Portfolio Manager |
Brian S. Matuszak, CFA, Senior Equity Analyst
Andy Y. Mui, CPA, Senior Equity Analyst
George L. Sanders II, Senior Equity Research Associate
Munder Capital Management |
The HSBC Investor Mid-Cap Fund (the “Fund”) seeks to achieve long-term growth of capital by investing at least 80% of its net assets in equity securities, i.e., common stocks, preferred stocks, convertible securities and rights and warrants, of mid-capitalization companies. Mid-capitalization companies are those companies with market capitalization within the range of companies included in the S&P MidCap 400® Index1, or within the range of companies included in the Russell Midcap® Index1. The Fund employs Munder Capital Management (“Munder”) as subadviser.
Investment Concerns
Equity securities (stocks) are more volatile and carry more risk than other forms of investments, including investments in high-grade fixed income securities.
The net asset value per share of this Fund will fluctuate as the value of the securities in the portfolio changes.
Mid-capitalization funds typically carry additional risks since smaller companies generally have a higher risk of failure, and historically, their stocks have experienced a greater degree of market volatility than stocks on average.
Market Commentary
The Fund’s Class I Shares posted a total return of 25.48% and the Class A Shares (without sales charge) returned 25.14% for the 12-month period ended October 31, 2010. That compared to 27.64% and 26.94% for the Fund’s benchmarks, the S&P MidCap 400 Index1 and the Lipper Mid-Cap Growth Funds Average1, respectively.
Portfolio Performance
The period was marked by a strengthening economy, and particularly by a stronger than expected economic rebound in the third quarter of 2010. An increase in merger and acquisition activity, a decline in corporate defaults, and the Federal Reserve Bank’s continued commitment to maintaining low interest rates helped fuel that economic recovery.
Stocks within the Fund performed very well for the 12-month period as a whole, with almost every major sector posting double-digit gains. The lone exception was consumer staples, which gained just 5% during the 12 months through October 2010. The Fund benefited in absolute terms from the strong performance in the stock market.
The technology sector was among the period’s best-performing, and added considerably to the Fund’s performance relative to its benchmark. The Fund’s technology holdings gained more than 54% during the 12-month period, compared to a 33% gain for the benchmark’s technology allocation.*
The Fund lagged the benchmark during the period largely due to stock selection within the industrials, health care, energy and consumer staples sectors. Though the stock selection within these sectors trailed those of the returns of the benchmark, the majority of the Fund’s individual stock holdings performed strongly in absolute terms. The Fund was also underweight in materials stocks, which performed well during the period under review, contributing to the Fund’s underperformance of its benchmark.*
| |
* | Portfolio composition is subject to change. |
| |
1 | For additional information, please refer to the Glossary of Terms. |
Past performance does not guarantee future results. The performance data quoted represents past performance and current returns may be lower or higher. Total return figures include change in share price, reinvestment of dividends and capital gains and do not reflect taxes that a shareholder would pay on Fund distributions or on the redemption of Fund shares. The investment return and principal value will fluctuate so that an investor’s shares, when redeemed may be worth more or less than the original cost. To obtain performance information current to the most recent month end, please call 1-800-782-8183.
| |
9 | HSBC INVESTOR FAMILY OF FUNDS |
|
Portfolio Reviews |
|
HSBC Investor Mid-Cap Fund - As of October 31, 2010 |
|
Value of a $10,000 Investment |
|
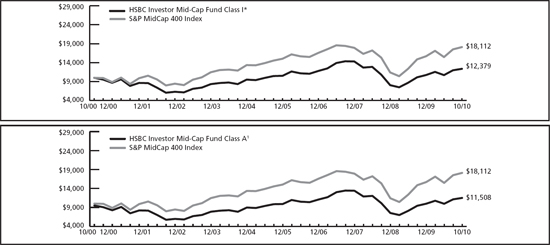
The charts above represent a comparison of a hypothetical $10,000 investment in the indicated share class versus a similar investment in the Fund’s benchmark and represents the reinvestment of dividends and capital gains in the Fund.
| | | | | | | | | | | | | |
Fund Performance | | | | Average Annual Total
Return (%) | | Expense
Ratio (%)5 | |
|
|
|
|
|
|
|
|
As of October 31, 2010 | | Inception
Date | | 1
Year* | | 5
Year | | 10
Year† | | Gross | | Net | |
|
|
|
|
|
|
|
|
|
|
|
|
|
|
HSBC Investor Mid-Cap Fund Class A1 | | 7/1/93 | | 18.86 | | 2.95 | | 1.41 | | 2.21 | | 1.35 | |
|
|
|
|
|
|
|
|
|
|
|
|
|
|
HSBC Investor Mid-Cap Fund Class B2 | | 7/1/93 | | 20.27 | | 3.24 | | 1.16 | | 2.96 | | 2.10 | |
|
|
|
|
|
|
|
|
|
|
|
|
|
|
HSBC Investor Mid-Cap Fund Class C3 | | 7/1/93 | | 23.18 | | 3.23 | | 1.22 | | 2.96 | | 2.10 | |
|
|
|
|
|
|
|
|
|
|
|
|
|
|
HSBC Investor Mid-Cap Fund Class I | | 7/1/93 | | 25.48 | | 4.26 | | 2.16 | | 1.96 | | 1.10 | |
|
|
|
|
|
|
|
|
|
|
|
|
|
|
S&P MidCap 400 Index4 | | — | | 27.64 | | 4.93 | | 6.12 | | N/A | | N/A | |
|
|
|
|
|
|
|
|
|
|
|
|
|
|
Lipper Mid-Cap Growth Funds Average4 | | — | | 26.94 | | 3.87 | | 1.33 | | N/A | | N/A | |
|
|
|
|
|
|
|
|
|
|
|
|
|
|
Past performance does not guarantee future results. The performance data quoted represents past performance and current returns may be lower or higher. Total return figures include change in share price, reinvestment of dividends and capital gains and do not reflect the taxes that a shareholder would pay on Fund distributions or on the redemption of Fund shares. The investment return and principal value will fluctuate so that an investor’s shares, when redeemed may be worth more or less than the original cost. To obtain performance information current to the most recent month end, please call 1-800-782-8183.
The performance above reflects any fee waivers that have been in effect during the applicable periods, as well as any expense reimbursements that have periodically been made. Absent such waivers and reimbursements, returns would have been lower. Currently, contractual fee waivers are in effect from March 1, 2010 through March 1, 2011.
During the fiscal periods ended October 31, 2009 and 2010, the Fund received monies related to certain nonrecurring litigation settlements which enhanced performance. Without the receipt of this payment, the returns for applicable periods would be lower.
| |
* | The recent growth rate in the stock market has helped to produce short-term returns that are not typical and may not continue in the future. Because of ongoing market volatility, Fund performance may be subject to substantial short-term changes. |
| |
† | For periods prior to July 1, 2000, the performance shown above includes the total return (adjusted for Fund expenses) generated by HSBC Global Asset Management (USA) Inc.’s management of a pooled investment vehicle called a collective investment trust (“CIT”) with the same investment objective as the Fund. The assets from that CIT were converted into the HSBC Investor Mid-Cap Fund on July 1, 2000. The CIT was not registered with the Securities & Exchange Commission (SEC) and thus was not subject to certain investment restrictions that are imposed on the Fund. If the CIT had been registered with the SEC, its performance might have been adversely affected. Performance assumes reinvestment of dividends and distributions. |
| |
1 | Reflects the maximum sales charge of 5.00%. |
| |
2 | Reflects the applicable contingent deferred sales charge, maximum of 4.00%. |
| |
3 | Reflects the applicable contingent deferred sales charge, maximum of 1.00%. |
| |
4 | For additional information, please refer to the Glossary of Terms. |
| |
5 | Reflects the expense ratio as reported in the prospectus dated March 1, 2010. |
The Fund’s performance is measured against the Standard & Poor’s MidCap 400 Index (“S&P MidCap 400”), an unmanaged index that is the most widely used index for mid-sized companies. The S&P MidCap 400 covers over 7% of the U.S. equities market, and is part of a series of S&P U.S. indices that can be used as building blocks for portfolio composition. The performance of the index does not reflect the deduction of expenses associated with a mutual fund, such as investment management and fund accounting fees. The Fund’s performance reflects the deduction of fees for these value-added services. Investors cannot invest directly in an index.
| |
HSBC INVESTOR FAMILY OF FUNDS | 10 |
|
Portfolio Reviews |
|
HSBC Investor Opportunity Fund |
(Class A Shares, B Shares, C Shares and I Shares) |
by Arthur J. Bauernfeind, Chairman |
William A. Muggia, President, CEO and CIO |
Matthew W. Strobeck, Partner |
Ethan J. Meyers, Partner |
Scott R. Emerman, Partner |
Westfield Capital Management Company, L.P. |
The HSBC Investor Opportunity Fund (the “Fund”) seeks to provide its shareholders with long-term growth of capital by investing in equity securities of small cap companies. The Fund may also invest in bonds, notes, commercial paper, U.S. Government securities, and foreign securities. Small cap companies generally are defined as those that have market capitalizations within the range of market capitalizations represented in the Russell 2500™ Growth Index1. The Fund may also invest in equity securities of larger, more established companies if they are expected to show increased earnings. The Fund employs a two-tier structure, commonly referred to as a “master-feeder” structure, in which the Fund invests all of its investable assets in the HSBC Investor Opportunity Portfolio (the “Portfolio”). The Portfolio employs Westfield Capital Management Company, L.P. as subadviser.
Investment Concerns
Equity securities (stocks) are more volatile and carry more risk than other forms of investments, including investments in high-grade fixed income securities.
The net asset value per share of this Fund will fluctuate as the value of the securities in the portfolio changes.
Small-capitalization funds typically carry additional risks since smaller companies generally have a higher risk of failure, and historically, their stocks have experienced a greater degree of market volatility than stocks on average.
The growth investment style may fall out of favor in the marketplace and result in significant declines in the value of the Portfolio’s securities. Securities of companies considered to be growth investments may have rapid price swings in the event of earnings disappointments or during periods of market, political, regulatory and economics uncertainty.
Market Commentary
For the 12-month period ended October 31, 2010, the Class I Shares of the HSBC Investor Opportunity Fund (Advisor) produced a 28.60% return, and the Class A Shares of the Fund produced a 27.91% return (without sales charge). The Fund’s benchmarks, the Russell 2500™ Growth Index1 and the Lipper Mid-Cap Growth Funds Average1, returned 28.76% and 26.94%, respectively.
Portfolio Performance
The economy experienced a strong rebound, thanks in part to the Federal Reserve’s decision to maintain historically low interest rates. However, the sustainability of that rebound came into question due to persistent unemployment and other challenging economic indicators. As a result, investors during the first quarter of 2010 began worrying about the possibility of a “double-dip” recession. Investor confidence rebounded later in the period in response to more upbeat economic data, helping to fuel substantial gains in the equity markets for the period as a whole.
The Fund enjoyed strong absolute performance in that environment. The telecommunications sector experienced strong gains, and was the top-performing sector within the Fund’s portfolio. The Fund’s telecommunications holdings consisted of one stock, which surged by 55%.*
Stock selection in the industrial sector helped performance compared to the benchmark. Aerospace and defense, electrical equipment and environmental services stocks all added to the Fund’s strong relative performance. Many of its holdings in the industrials sector experienced robust earnings growth during the period. The Fund also benefited from an underweight position in biotechnology stocks relative to its benchmark, as well as strong performance by two individual biotechnology stocks in the Fund’s portfolio.*
The Fund was hurt by stock selection in the consumer staples sector. The Fund’s worst performing sector, in absolute and relative terms, was the materials sector, in which the Fund’s holdings significantly trailed the materials stocks in the benchmark.*
The Fund’s bottom-up approach to portfolio construction focuses on choosing attractive individual stocks rather than actively managing sector exposures. That said, relative return was hurt by its significantly overweight position to the energy sector, and by an underweight stake in consumer discretionary stocks.*
| |
* | Portfolio composition is subject to change. |
| |
1 | For additional information, please refer to the Glossary of Terms. |
Past performance does not guarantee future results. The performance data quoted represents past performance and current returns may be lower or higher. Total return figures include change in share price, reinvestment of dividends and capital gains and do not reflect taxes that a shareholder would pay on Fund distributions or on the redemption of Fund shares. The investment return and principal value will fluctuate so that an investor’s shares, when redeemed may be worth more or less than the original cost. To obtain performance information current to the most recent month end, please call 1-800-782-8183.
| |
11 | HSBC INVESTOR FAMILY OF FUNDS |
|
Portfolio Reviews |
|
HSBC Investor Opportunity Fund - As of October 31, 2010 |
|
Value of a $10,000 Investment |
|
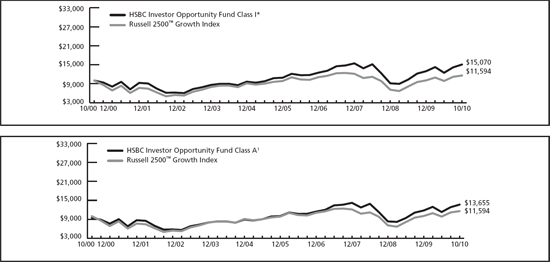
The charts above represent a comparison of a hypothetical $10,000 investment in the indicated share class versus a similar investment in the Fund’s benchmark and represents the reinvestment of dividends and capital gains in the Fund.
| | | | | | | | | | | | | |
Fund Performance | | | | Average Annual Total
Return (%) | | Expense
Ratio (%)5 | |
|
|
|
|
|
|
|
|
As of October 31, 2010 | | Inception
Date | | 1
Year* | | 5
Year | | 10
Year | | Gross | | Net | |
|
|
|
|
|
|
|
|
|
|
|
|
|
|
HSBC Investor Opportunity Fund Class A1 | | 9/23/96 | | 21.48 | | 6.75 | | 3.16 | | 2.30 | | 1.65 | |
|
|
|
|
|
|
|
|
|
|
|
|
|
|
HSBC Investor Opportunity Fund Class B2 | | 1/6/98 | | 23.00 | | 7.04 | | 3.23 | | 3.05 | | 2.40 | |
|
|
|
|
|
|
|
|
|
|
|
|
|
|
HSBC Investor Opportunity Fund Class C3 | | 11/4/98 | | 26.12 | | 7.06 | | 2.93 | | 3.05 | | 2.40 | |
|
|
|
|
|
|
|
|
|
|
|
|
|
|
HSBC Investor Opportunity Fund Class I** | | 9/3/96 | | 28.60 | | 8.19 | | 4.19 | | 1.02 | | 1.02 | |
|
|
|
|
|
|
|
|
|
|
|
|
|
|
Russell 2500™ Growth Index4 | | — | | 28.76 | | 4.55 | | 1.49 | | N/A | | N/A | |
|
|
|
|
|
|
|
|
|
|
|
|
|
|
Lipper Mid-Cap Growth Funds Average4 | | — | | 26.94 | | 3.87 | | 1.33 | | N/A | | N/A | |
|
|
|
|
|
|
|
|
|
|
|
|
|
|
Past performance does not guarantee future results. The performance data quoted represents past performance and current returns may be lower or higher. Total return figures include change in share price, reinvestment of dividends and capital gains and do not reflect the taxes that a shareholder would pay on Fund distributions or on the redemption of Fund shares. The investment return and principal value will fluctuate so that an investor’s shares, when redeemed may be worth more or less than the original cost. To obtain performance information current to the most recent month end, please call 1-800-782-8183.
The performance above reflects any fee waivers that have been in effect during the applicable periods, as well as any expense reimbursements that have periodically been made. Absent such waivers and reimbursements, returns would have been lower. Currently, contractual fee waivers are in effect from March 1, 2010 through March 1, 2011 for Class A Shares, Class B Shares and Class C Shares.
| |
* | The recent growth rate in the stock market has helped to produce short-term returns that are not typical and may not continue in the future. Because of ongoing market volatility, Fund performance may be subject to substantial short-term changes. |
| |
** | The Class I Shares are issued by a series of HSBC Advisor Funds Trust also named the HSBC Investor Opportunity Fund. |
| |
1 | Reflects the maximum sales charge of 5.00%. |
| |
2 | Reflects the applicable contingent deferred sales charge, maximum of 4.00%. |
| |
3 | Reflects the applicable contingent deferred sales charge, maximum of 1.00%. |
| |
4 | For additional information, please refer to the Glossary of Terms. |
| |
5 | Reflects the expense ratio as reported in the prospectus dated March 1, 2010. |
The Fund’s performance is measured against the Russell 2500™ Growth Index, an unmanaged index that measures the performance of the small- to mid-cap growth segment of the U.S. equity universe. It includes those Russell 2500 companies with higher price-to-book ratios and higher forecasted growth values. The performance for the index does not reflect the deduction of expenses associated with a mutual fund, such as investment management and fund accounting fees. The Fund’s performance reflects the deduction of fees for these value-added services. Investors cannot invest directly in an index.
| |
HSBC INVESTOR FAMILY OF FUNDS | 12 |
|
Portfolio Reviews |
|
HSBC Investor Value Fund |
(Class A Shares, B Shares, C Shares and I Shares) |
by Jon D. Bosse, CFA, Co-President and CIO |
Craig (Chip) O. Bailey, Jr., Managing Director/Portfolio Manager |
NWQ Investment Management Company, LLC |
The HSBC Investor Value Fund (the “Fund”) seeks long-term growth of capital and income. Under normal market conditions, the Fund invests primarily in U.S. and foreign companies with large and medium capitalizations that the subadviser believes possess opportunities underappreciated or misperceived by the market. The Fund utilizes a two-tier structure, commonly known as a “master-feeder” structure, in which the Fund invests all of its investable assets in the HSBC Investor Value Portfolio (the “Portfolio”). The Portfolio employs NWQ Investment Management Company, LLC (“NWQ”) as subadviser.
Investment Concerns
Value-based investments are subject to the risk that the broad market may not recognize their intrinsic value.
Equity securities (stocks) are more volatile and carry more risk than other forms of investments, including investments in high-grade fixed income securities.
The net asset value per share of this Fund will fluctuate as the value of the securities in the Portfolio changes.
Market Commentary
The Fund returned 13.05% (without sales charge) for the Class A Shares and 13.35% for the Class I Shares for the 12-month period ended October 31, 2010. That compared to a 15.71% return for the Russell 1000® Value Index1 and a 14.47% return for the Lipper Large-Cap Core Funds Average1.
Portfolio Performance
The Fund generated positive absolute performance despite tremendous volatility within the U.S. equity markets during the 12 months under review. The Fund’s performance in the first half of the period benefited as the financial markets digested news that the U.S. and global economy continued to improve. However, during the second half of the period, that performance was somewhat muted as concerns mounted over the financial viability of various sovereign nations such as Greece, renewing fears of another global financial crisis.
The Fund’s absolute return was enhanced by all economic sectors with the exception of utilities, where the Fund’s investment in one holding adversely affected absolute performance. The Fund’s largest contributors to performance came from positions within the materials and processing, energy, and financial services sectors. In the materials and processing sector, the Fund benefited from its investments within the gold industry. The Fund was underweight in financials relative to its benchmark, but benefitted from strong stock selection in that sector. Many of the Fund’s investments within this sector performed well due to improving balance sheets and asset credit quality.*
The Fund’s investments in the health care sector were positive on an absolute basis. However, the Fund’s performance in this sector lagged its benchmark. This was mostly due to poor stock selection. Lastly, some of the Fund’s technology sector positions detracted from performance relative to the benchmark.*
| |
* | Portfolio composition is subject to change. |
| |
1 | For additional information, please refer to the Glossary of Terms. |
Past performance does not guarantee future results. The performance data quoted represents past performance and current returns may be lower or higher. Total return figures include change in share price, reinvestment of dividends and capital gains and do not reflect taxes that a shareholder would pay on Fund distributions or on the redemption of Fund shares. The investment return and principal value will fluctuate so that an investor’s shares, when redeemed may be worth more or less than the original cost. To obtain performance information current to the most recent month end, please call 1-800-782-8183.
| |
13 | HSBC INVESTOR FAMILY OF FUNDS |
|
Portfolio Reviews |
|
HSBC Investor Value Fund - As of October 31, 2010 |
|
Value of a $10,000 Investment |
|
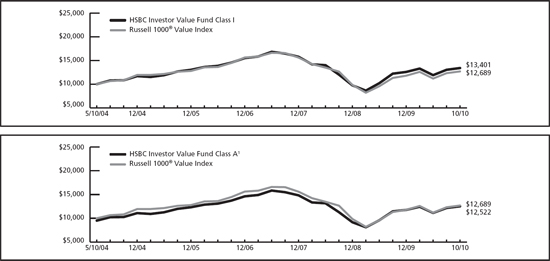
The charts above represent a comparison of a hypothetical $10,000 investment in the indicated share class versus a similar investment in the Fund’s benchmark and represents the reinvestment of dividends and capital gains in the Fund.
| | | | | | | | | | | | | |
Fund Performance | | | | Average Annual
Total Return (%) | | Expense
Ratio (%)6 | |
|
|
|
|
|
|
|
|
As of October 31, 2010 | | Inception
Date | | 1
Year | | 5
Year | | Since
Inception | | Gross | | Net | |
|
|
|
|
|
|
|
|
|
|
|
|
|
|
HSBC Investor Value Fund Class A1 | | 5/7/04 | 5 | 7.35 | | 0.42 | | 3.53 | | 1.40 | | 1.20 | |
|
|
|
|
|
|
|
|
|
|
|
|
|
|
HSBC Investor Value Fund Class B2 | | 5/7/04 | 5 | 8.30 | | 0.71 | | 3.64 | | 2.15 | | 1.95 | |
|
|
|
|
|
|
|
|
|
|
|
|
|
|
HSBC Investor Value Fund Class C3 | | 5/7/04 | 5 | 11.32 | | 0.70 | | 3.58 | | 2.15 | | 1.95 | |
|
|
|
|
|
|
|
|
|
|
|
|
|
|
HSBC Investor Value Fund Class I | | 5/7/04 | 5 | 13.35 | | 1.70 | | 4.62 | | 1.15 | | 0.95 | |
|
|
|
|
|
|
|
|
|
|
|
|
|
|
Russell 1000® Value Index4 | | — | | 15.71 | | 0.62 | | 3.757 | | N/A | | N/A | |
|
|
|
|
|
|
|
|
|
|
|
|
|
|
Lipper Large-Cap Core Funds Average4 | | — | | 14.47 | | 1.48 | | 2.867 | | N/A | | N/A | |
|
|
|
|
|
|
|
|
|
|
|
|
|
|
Past performance does not guarantee future results. The performance data quoted represents past performance and current returns may be lower or higher. Total return figures include change in share price, reinvestment of dividends and capital gains and do not reflect the taxes that a shareholder would pay on Fund distributions or on the redemption of Fund shares. The investment return and principal value will fluctuate so that an investor’s shares, when redeemed may be worth more or less than the original cost. To obtain performance information current to the most recent month end, please call 1-800-782-8183.
The performance above reflects any fee waivers that have been in effect during the applicable periods, as well as any expense reimbursements that have periodically been made. Absent such waivers and reimbursements, returns would have been lower. Currently, contractual fee waivers are in effect from March 1, 2010 through March 1, 2011.
During the fiscal periods ended October 31, 2008, 2009 and 2010, the Portfolio in which the Fund invests, received monies related to certain nonrecurring litigation settlements. Without the receipt of these payments, the returns for applicable periods would have been lower.
| |
1 | Reflects the maximum sales charge of 5.00%. |
| |
2 | Reflects the applicable contingent deferred sales charge, maximum of 4.00%. |
| |
3 | Reflects the applicable contingent deferred sales charge, maximum of 1.00%. |
| |
4 | For additional information, please refer to the Glossary of Terms. |
| |
5 | The HSBC Investor Value Fund was initially offered for purchase effective May 7, 2004, however, no shareholder activity occurred until May 10, 2004. |
| |
6 | Reflects the expense ratio as reported in the prospectus dated March 1, 2010. |
| |
7 | Return for the period 5/6/04 to 10/31/10. |
The Fund’s performance is measured against the Russell 1000® Value Index, an unmanaged index that measures the performance of the large-cap value segment of the U.S. equity universe. It includes those Russell 1000 companies with lower price-to-book ratios and lower expected growth values. The performance of the index does not reflect the deduction of expenses associated with a mutual fund, such as investment management and fund accounting fees. The Fund’s performance reflects the deduction of fees for these value-added services. Investors cannot invest directly in an index.
| |
HSBC INVESTOR FAMILY OF FUNDS | 14 |
|
Portfolio Reviews |
|
Portfolio Composition* |
October 31, 2010 |
(Unaudited) |
| | | | |
HSBC Investor Mid-Cap Fund | | | | |
|
| | | |
Investment Allocation | | Percentage of Investments at Value | |
|
Machinery | | 7.4 | % | |
|
Real Estate Investment Trusts (REITs) | | 6.6 | % | |
|
Oil, Gas & Consumable Fuels | | 4.8 | % | |
|
Capital Markets | | 4.5 | % | |
|
Software | | 4.5 | % | |
|
IT Services | | 3.9 | % | |
|
Auto Components | | 3.8 | % | |
|
Media | | 3.8 | % | |
|
Chemicals | | 3.7 | % | |
|
Commercial Banks | | 3.7 | % | |
|
Semiconductors & Semiconductor Equipment | | 3.5 | % | |
|
Electric Utilities | | 3.0 | % | |
|
Health Care Equipment & Supplies | | 3.0 | % | |
|
Insurance | | 3.0 | % | |
|
Hotels, Restaurants & Leisure | | 2.9 | % | |
|
Health Care Providers & Services | | 2.9 | % | |
|
Specialty Retail | | 2.9 | % | |
|
Wireless Telecommunication Services | | 2.5 | % | |
|
Energy Equipment & Services | | 2.4 | % | |
|
Road & Rail | | 2.2 | % | |
|
Food Products | | 2.1 | % | |
|
Aerospace & Defense | | 1.9 | % | |
|
Containers & Packaging | | 1.8 | % | |
|
Biotechnology | | 1.7 | % | |
|
Commercial Services & Supplies | | 1.5 | % | |
|
Life Sciences Tools & Services | | 1.5 | % | |
|
Distributors | | 1.4 | % | |
|
Diversified Financial Services | | 1.4 | % | |
|
Multi-Utilities | | 1.4 | % | |
|
Household Durables | | 1.2 | % | |
|
Household Products | | 1.2 | % | |
|
Internet Software & Services | | 1.2 | % | |
|
Metals & Mining | | 1.2 | % | |
|
Construction & Engineering | | 1.1 | % | |
|
Professional Services | | 1.1 | % | |
|
Electrical Equipment | | 1.0 | % | |
|
Consumer Finance | | 0.8 | % | |
|
Investment Companies | | 0.8 | % | |
|
Diversified Consumer Services | | 0.7 | % | |
|
Total | | 100.0 | % | |
|
|
|
|
|
| | | | |
HSBC Investor Growth Portfolio | | | | |
|
| | | |
Investment Allocation | | Percentage of Investments at Value | |
|
Computers & Peripherals | | 8.6 | % | |
|
Software | | 7.1 | % | |
|
IT Services | | 6.9 | % | |
|
Internet & Catalog Retail | | 6.5 | % | |
|
Machinery | | 6.0 | % | |
|
Communications Equipment | | 5.8 | % | |
|
Capital Markets | | 5.4 | % | |
|
Internet Software & Services | | 4.8 | % | |
|
Energy Equipment & Services | | 4.2 | % | |
|
Diversified Financial Services | | 3.5 | % | |
|
Road & Rail | | 3.1 | % | |
|
Aerospace & Defense | | 2.9 | % | |
|
Pharmaceuticals | | 2.9 | % | |
|
Metals & Mining | | 2.8 | % | |
|
Health Care Providers & Services | | 2.8 | % | |
|
Specialty Retail | | 2.3 | % | |
|
Hotels, Restaurants & Leisure | | 2.2 | % | |
|
Oil, Gas & Consumable Fuels | | 2.0 | % | |
|
Electronic Equipment, Instruments & Components | | 2.0 | % | |
|
Wireless Telecommunication Services | | 1.8 | % | |
|
Multiline Retail | | 1.5 | % | |
|
Construction & Engineering | | 1.4 | % | |
|
Investment Companies | | 1.3 | % | |
|
Air Freight & Logistics | | 1.2 | % | |
|
Semiconductors & Semiconductor Equipment | | 1.1 | % | |
|
Health Care Technology | | 1.1 | % | |
|
Personal Products | | 1.1 | % | |
|
Biotechnology | | 1.1 | % | |
|
Beverages | | 1.0 | % | |
|
Food & Staples Retailing | | 1.0 | % | |
|
Textiles, Apparel & Luxury Goods | | 1.0 | % | |
|
Chemicals | | 0.9 | % | |
|
Food Products | | 0.9 | % | |
|
Health Care Equipment & Supplies | | 0.8 | % | |
|
Auto Components | | 0.5 | % | |
|
Media | | 0.5 | % | |
|
Total | | 100.0 | % | |
|
| | | | |
HSBC International Equity Portfolio | | | | |
|
| | | |
Investment Allocation | | Percentage of Investments at Value | |
|
Europe | | 61.2 | % | |
|
Japan | | 23.6 | % | |
|
Australia & Far East | | 8.0 | % | |
|
Canada | | 4.9 | % | |
|
Other | | 1.3 | % | |
|
Cash | | 1.0 | % | |
|
Total | | 100.0 | % | |
|
| |
15 | HSBC INVESTOR FAMILY OF FUNDS |
|
Portfolio Reviews |
|
Portfolio Composition* |
October 31, 2010
(Unaudited) |
| | | | |
HSBC Investor Opportunity Portfolio | | | | |
|
| | | | |
Investment Allocation | | Percentage of Investments at Value | |
|
Oil, Gas & Consumable Fuels | | 9.2 | % | |
|
Semiconductors & Semiconductor Equipment | | 6.7 | % | |
|
Software | | 6.0 | % | |
|
Machinery | | 5.1 | % | |
|
Hotels, Restaurants & Leisure | | 4.7 | % | |
|
Life Sciences Tools & Services | | 4.5 | % | |
|
Health Care Equipment & Supplies | | 3.7 | % | |
|
Auto Components | | 3.4 | % | |
|
Specialty Retail | | 3.3 | % | |
|
Health Care Providers & Services | | 3.2 | % | |
|
Food Products | | 3.1 | % | |
|
Commercial Services & Supplies | | 3.0 | % | |
|
Biotechnology | | 2.9 | % | |
|
Investment Companies | | 2.9 | % | |
|
Pharmaceuticals | | 2.5 | % | |
|
Media | | 2.5 | % | |
|
Containers & Packaging | | 2.3 | % | |
|
Chemicals | | 2.3 | % | |
|
Aerospace & Defense | | 2.2 | % | |
|
Internet Software & Services | | 2.1 | % | |
|
Wireless Telecommunication Services | | 2.1 | % | |
|
Textiles, Apparel & Luxury Goods | | 2.1 | % | |
|
Electrical Equipment | | 2.1 | % | |
|
Metals & Mining | | 2.0 | % | |
|
Communications Equipment | | 2.0 | % | |
|
Real Estate Investment Trusts (REITs) | | 1.8 | % | |
|
Capital Markets | | 1.8 | % | |
|
Road & Rail | | 1.7 | % | |
|
IT Services | | 1.6 | % | |
|
Diversified Financial Services | | 1.6 | % | |
|
Household Products | | 1.5 | % | |
|
Trading Companies & Distributors | | 1.4 | % | |
|
Energy Equipment & Services | | 1.3 | % | |
|
Commercial Banks | | 1.0 | % | |
|
Diversified Consumer Services | | 0.4 | % | |
|
Total | | 100.0 | % | |
|
| | | | |
HSBC Investor Value Portfolio | | | | |
|
| | | | |
Electrical Equipment | | Percentage of Investments at Value | |
|
Insurance | | 16.7 | % | |
|
Oil, Gas & Consumable Fuels | | 13.0 | % | |
|
Pharmaceuticals | | 8.5 | % | |
|
Metals & Mining | | 8.1 | % | |
|
Software | | 7.1 | % | |
|
Investment Companies | | 6.5 | % | |
|
Media | | 6.1 | % | |
|
Communications Equipment | | 4.7 | % | |
|
Biotechnology | | 4.3 | % | |
|
Diversified Financial Services | | 3.8 | % | |
|
Aerospace & Defense | | 3.7 | % | |
|
Commercial Banks | | 2.1 | % | |
|
Food & Staples Retailing | | 2.1 | % | |
|
Tobacco | | 2.0 | % | |
|
Machinery | | 1.8 | % | |
|
Road & Rail | | 1.7 | % | |
|
Commercial Services & Supplies | | 1.7 | % | |
|
Household Products | | 1.3 | % | |
|
Energy Equipment & Services | | 1.3 | % | |
|
Independent Power Producers & Energy Traders | | 1.3 | % | |
|
Health Care Providers & Services | | 1.2 | % | |
|
Capital Markets | | 1.0 | % | |
|
Total | | 100.0 | % | |
|
| | |
* | Portfolio composition is subject to change. | |
| | |
| HSBC INVESTOR FAMILY OF FUNDS | 16 |
|
HSBC INVESTOR MID-CAP FUND |
|
Schedule of Portfolio Investments—as of October 31, 2010 |
| | | | | | | |
Common Stocks – 98.4% | | | | | | | |
|
| | | | | |
| | Shares | | Value ($) | |
| |
| |
| |
Aerospace & Defense – 1.9% | | | | | | | |
Elbit Systems Ltd. | | | 700 | | | 37,891 | |
ITT Corp. | | | 3,300 | | | 155,727 | |
Precision Castparts Corp. | | | 750 | | | 102,435 | |
| | | | |
|
| |
| | | | | | 296,053 | |
| | | | |
|
| |
Auto Components – 3.8% | | | | | | | |
BorgWarner, Inc. (a) | | | 7,050 | | | 395,575 | |
Gentex Corp. | | | 9,800 | | | 195,804 | |
| | | | |
|
| |
| | | | | | 591,379 | |
| | | | |
|
| |
Biotechnology – 1.7% | | | | | | | |
BioMarin Pharmaceuticals, Inc. (a) | | | 10,150 | | | 265,524 | |
| | | | |
|
| |
Capital Markets – 4.4% | | | | | | | |
Affiliated Managers Group, Inc. (a) | | | 3,500 | | | 299,635 | |
Eaton Vance Corp. | | | 6,775 | | | 194,917 | |
TD AMERITRADE Holding Corp. (a) | | | 11,250 | | | 192,262 | |
| | | | |
|
| |
| | | | | | 686,814 | |
| | | | |
|
| |
Chemicals – 3.7% | | | | | | | |
Airgas, Inc. | | | 3,400 | | | 241,162 | |
LyondellBasell Industries NV, Class A (a) | | | 5,900 | | | 158,474 | |
Valspar Corp. (The) | | | 5,300 | | | 170,130 | |
| | | | |
|
| |
| | | | | | 569,766 | |
| | | | |
|
| |
Commercial Banks – 3.7% | | | | | | | |
Comerica, Inc. | | | 4,450 | | | 159,221 | |
Fifth Third Bancorp | | | 12,750 | | | 160,140 | |
FirstMerit Corp. | | | 4,050 | | | 69,579 | |
Signature Bank (a) | | | 4,400 | | | 185,856 | |
| | | | |
|
| |
| | | | | | 574,796 | |
| | | | |
|
| |
Commercial Services & Supplies – 1.5% | | | | | | | |
Stericycle, Inc. (a) | | | 3,125 | | | 224,187 | |
| | | | |
|
| |
Construction & Engineering – 1.1% | | | | | | | |
Shaw Group, Inc. (The) (a) | | | 5,600 | | | 171,136 | |
URS Corp. (a) | | | 150 | | | 5,840 | |
| | | | |
|
| |
| | | | | | 176,976 | |
| | | | |
|
| |
Consumer Finance – 0.8% | | | | | | | |
EZCORP, Inc., Class A (a) | | | 5,900 | | | 126,732 | |
| | | | |
|
| |
Containers & Packaging – 1.8% | | | | | | | |
Crown Holdings, Inc. (a) | | | 8,800 | | | 283,272 | |
| | | | |
|
| |
Distributors – 1.4% | | | | | | | |
LKQ Corp. (a) | | | 9,675 | | | 210,335 | |
| | | | |
|
| |
Diversified Consumer Services – 0.7% | | | | | | | |
New Oriental Education & Technology
Group, Inc. ADR (a) | | | 1,050 | | | 112,739 | |
| | | | |
|
| |
Diversified Financial Services – 1.3% | | | | | | | |
MSCI, Inc., Class A (a) | | | 5,800 | | | 207,930 | |
| | | | |
|
| |
Electric Utilities – 3.0% | | | | | | | |
ITC Holdings Corp. | | | 2,975 | | | 186,265 | |
Northeast Utilities | | | 6,125 | | | 191,590 | |
Portland General Electric Co. | | | 4,050 | | | 84,645 | |
| | | | |
|
| |
| | | | | | 462,500 | |
| | | | |
|
| |
Common Stocks, continued | | | | | | | |
|
| | | | | | | |
| | Shares | | Value ($) | |
| |
| |
| |
Electrical Equipment – 1.0% | | | | | | | |
American Superconductor Corp. (a) | | | 4,800 | | | 161,520 | |
| | | | |
|
| |
Energy Equipment & Services – 2.4% | | | | | | | |
Atwood Oceanics, Inc. (a) | | | 5,750 | | | 186,932 | |
Core Laboratories N.V. | | | 2,300 | | | 178,871 | |
| | | | |
|
| |
| | | | | | 365,803 | |
| | | | |
|
| |
Food Products – 2.0% | | | | | | | |
J.M. Smucker Co. (The) | | | 2,450 | | | 157,486 | |
TreeHouse Foods, Inc. (a) | | | 3,400 | | | 158,780 | |
| | | | |
|
| |
| | | | | | 316,266 | |
| | | | |
|
| |
Health Care Equipment & Supplies – 3.0% | | | | | | | |
Haemonetics Corp. (a) | | | 2,800 | | | 153,020 | |
Intuitive Surgical, Inc. (a) | | | 250 | | | 65,738 | |
ResMed, Inc. (a) | | | 7,650 | | | 243,805 | |
| | | | |
|
| |
| | | | | | 462,563 | |
| | | | |
|
| |
Health Care Providers & Services – 2.8% | | | | | | | |
Catalyst Health Solutions, Inc. (a) | | | 4,300 | | | 162,755 | |
DaVita, Inc. (a) | | | 2,700 | | | 193,725 | |
Laboratory Corp. of America Holdings (a) | | | 1,025 | | | 83,353 | |
| | | | |
|
| |
| | | | | | 439,833 | |
| | | | |
|
| |
Hotels, Restaurants & Leisure – 2.9% | | | | | | | |
Chipotle Mexican Grill, Inc., Class A (a) | | | 850 | | | 178,678 | |
Choice Hotels International, Inc. | | | 7,000 | | | 266,210 | |
| | | | |
|
| |
| | | | | | 444,888 | |
| | | | |
|
| |
Household Durables – 1.2% | | | | | | | |
Tupperware Brands Corp. | | | 4,150 | | | 185,962 | |
| | | | |
|
| |
Household Products – 1.2% | | | | | | | |
Church & Dwight Co., Inc. | | | 2,750 | | | 181,088 | |
| | | | |
|
| |
Insurance – 3.0% | | | | | | | |
Axis Capital Holdings Ltd. | | | 2,400 | | | 81,624 | |
Lincoln National Corp. | | | 10,400 | | | 254,592 | |
Proassurance Corp. (a) | | | 2,300 | | | 132,227 | |
| | | | |
|
| |
| | | | | | 468,443 | |
| | | | |
|
| |
Internet Software & Services – 1.2% | | | | | | | |
Akamai Technologies, Inc. (a) | | | 3,700 | | | 191,179 | |
| | | | |
|
| |
IT Services – 3.9% | | | | | | | |
Cognizant Technology Solutions Corp. (a) | | | 4,925 | | | 321,061 | |
Fiserv, Inc. (a) | | | 2,400 | | | 130,848 | |
Teradata Corp. (a) | | | 3,750 | | | 147,600 | |
| | | | |
|
| |
| | | | | | 599,509 | |
| | | | |
|
| |
Life Sciences Tools & Services – 1.5% | | | | | | | |
Mettler-Toledo International, Inc. (a) | | | 1,725 | | | 225,216 | |
| | | | |
|
| |
Machinery – 7.4% | | | | | | | |
AGCO Corp. (a) | | | 3,600 | | | 152,892 | |
Eaton Corp. | | | 1,350 | | | 119,921 | |
Flowserve Corp. | | | 2,650 | | | 265,000 | |
Joy Global, Inc. | | | 3,550 | | | 251,872 | |
Terex Corp. (a) | | | 8,450 | | | 189,702 | |
Valmont Industries, Inc. | | | 2,100 | | | 165,585 | |
| | | | |
|
| |
| | | | | | 1,144,972 | |
| | | | |
|
| |
| | |
17 | HSBC INVESTOR FAMILY OF FUNDS | See notes to financial statements. |
|
HSBC INVESTOR MID-CAP FUND |
|
Schedule of Portfolio Investments—as of October 31, 2010 (continued) |
| | | | | | | |
Common Stocks, continued | | | | | | | |
|
|
|
|
|
|
|
|
| | | | | | | |
| | Shares | | Value ($) | |
| |
| |
| |
Media – 3.8% | | | | | | | |
Cinemark Holdings, Inc. | | | 8,200 | | | 143,910 | |
Discovery Communications, Inc., Class C (a) | | | 3,200 | | | 124,352 | |
Liberty Media Corp. Capital Group,
Series A (a) | | | 2,400 | | | 138,096 | |
Liberty Media-Starz, Series A (a) | | | 2,750 | | | 180,180 | |
| | | | |
|
| |
| | | | | | 586,538 | |
| | | | |
|
| |
Metals & Mining – 1.2% | | | | | | | |
Compass Minerals International, Inc. | | | 2,250 | | | 177,458 | |
| | | | |
|
| |
Multi-Utilities – 1.3% | | | | | | | |
NorthWestern Corp. | | | 7,000 | | | 208,390 | |
| | | | |
|
| |
Oil, Gas & Consumable Fuels – 4.8% | | | | | | | |
Atlas Energy, Inc. (a) | | | 6,512 | | | 189,629 | |
Denbury Resources, Inc. (a) | | | 9,100 | | | 154,882 | |
EQT Corp. | | | 4,925 | | | 184,392 | |
SandRidge Energy, Inc. (a) | | | 16,125 | | | 88,204 | |
Southwestern Energy Co. (a) | | | 3,500 | | | 118,475 | |
| | | | |
|
| |
| | | | | | 735,582 | |
| | | | |
|
| |
Professional Services – 1.1% | | | | | | | |
IHS, Inc., Class A (a) | | | 2,250 | | | 162,540 | |
| | | | |
|
| |
Real Estate Investment Trusts
(REITs) – 6.5% | | | | | | | |
Annaly Capital Management, Inc. | | | 9,500 | | | 168,245 | |
Corporate Office Properties Trust | | | 3,350 | | | 118,891 | |
Digital Realty Trust, Inc. | | | 4,000 | | | 238,920 | |
Essex Property Trust, Inc. | | | 1,500 | | | 169,440 | |
Macerich Co. (The) | | | 7,000 | | | 312,270 | |
| | | | |
|
| |
| | | | | | 1,007,766 | |
| | | | |
|
| |
Road & Rail – 2.2% | | | | | | | |
Kansas City Southern (a) | | | 7,750 | | | 339,605 | |
| | | | |
|
| |
Semiconductors & Semiconductor
Equipment – 3.5% | | | | | | | |
ARM Holdings plc ADR | | | 10,400 | | | 183,872 | |
Cree, Inc. (a) | | | 3,300 | | | 169,257 | |
Microchip Technology, Inc. | | | 5,800 | | | 186,644 | |
| | | | |
|
| |
| | | | | | 539,773 | |
| | | | |
|
| |
Software – 4.4% | | | | | | | |
Check Point Software Technologies Ltd. (a) | | | 3,150 | | | 134,663 | |
FactSet Research Systems, Inc. | | | 1,250 | | | 109,725 | |
MICROS Systems, Inc. (a) | | | 4,600 | | | 208,794 | |
Solera Holdings, Inc. | | | 4,850 | | | 233,042 | |
| | | | |
|
| |
| | | | | | 686,224 | |
| | | | |
|
| |
Specialty Retail – 2.8% | | | | | | | |
Aeropostale, Inc. (a) | | | 7,100 | | | 173,098 | |
O’Reilly Automotive, Inc. (a) | | | 1,600 | | | 93,600 | |
Tiffany & Co. | | | 3,250 | | | 172,250 | |
| | | | |
|
| |
| | | | | | 438,948 | |
| | | | |
|
| |
Wireless Telecommunication Services – 2.5% | | | | | | | |
American Tower Corp., Class A (a) | | | 4,750 | | | 245,147 | |
NII Holdings, Inc. (a) | | | 3,400 | | | 142,154 | |
| | | | |
|
| |
| | | | | | 387,301 | |
| | | | |
|
| |
| | | | | | | |
Common Stocks, continued | | | | | | | |
|
|
|
|
|
|
|
|
| | | | | | | |
| | Shares | | Value ($) | |
| |
| |
| |
TOTAL COMMON STOCKS
(COST $11,781,379) | | | | | | 15,246,370 | |
| | | | |
|
| |
|
Investment Companies – 0.8% | | | | | | | |
|
|
|
|
|
|
|
|
Midcap SPDR Trust Series 1 | | | 760 | | | 114,403 | |
Northern Institutional Diversified Assets
Portfolio, Institutional Shares, 0.04% (b) | | | 10,253 | | | 10,253 | |
| | | | |
|
| |
| | | | | | | |
TOTAL INVESTMENT COMPANIES
(COST $109,379) | | | | | | 124,656 | |
| | | | |
|
| |
TOTAL INVESTMENTS
(COST $11,890,758) — 99.2% | | | | | | 15,371,026 | |
| | | | |
|
| |
| | |
| |
| Percentages indicated are based on net assets of $15,491,456. |
ADR — American Depositary Receipt
plc — Public Limited Company
SPDR — Standard & Poor’s Depositary Receipt
| |
(a) | Represents non-income producing security. |
| |
(b) | The rate represents the annualized one-day yield that was in effect on October 31, 2010. |
| | |
See notes to financial statements. | HSBC INVESTOR FAMILY OF FUNDS | 18 |
HSBC INVESTOR FAMILY OF FUNDS
Statements of Assets and Liabilities—as of October 31, 2010
| | | | | | | | | | | | | | | | |
| | Growth
Fund | | International
Equity Fund | | Mid-Cap
Fund | | Opportunity
Fund | | Opportunity
Fund
(Advisor) | |
|
|
|
|
|
|
|
|
|
|
|
|
Assets: | | | | | | | | | | | | | | | | |
Investments in Affiliated Portfolios | | $ | 67,292,333 | | $ | 12,887,941 | | $ | — | | $ | 12,315,145 | | $ | 117,127,395 | |
Investments in non-affiliates, at value | | | — | | | — | | | 15,371,026 | | | — | | | — | |
Dividends receivable | | | — | | | — | | | 1,502 | | | — | | | — | |
Receivable for capital shares issued | | | 289,859 | | | 79,289 | | | 9,460 | | | 585 | | | 92,862 | |
Receivable for investments sold | | | — | | | — | | | 197,373 | | | — | | | — | |
Reclaims receivable | | | — | | | 799,263 | | | — | | | — | | | — | |
Receivable from Custodian | | | — | | | 33,809 | | | — | | | — | | | — | |
Receivable from Investment Adviser | | | 5,216 | | | 25,122 | | | 10,475 | | | 1,900 | | | — | |
Prepaid expenses and other assets | | | 18,834 | | | 6,572 | | | 7,509 | | | 8,160 | | | 3,884 | |
| |
|
| |
|
| |
|
| |
|
| |
|
| |
Total Assets | | | 67,606,242 | | | 13,831,996 | | | 15,597,345 | | | 12,325,790 | | | 117,224,141 | |
| |
|
| |
|
| |
|
| |
|
| |
|
| |
Liabilities: | | | | | | | | | | | | | | | | |
Payable for investments purchased | | | — | | | — | | | 29,866 | | | — | | | — | |
Payable for capital shares redeemed | | | 235,234 | | | 53,882 | | | 45,922 | | | 26,005 | | | 98,320 | |
Accrued expenses and other liabilities: | | | | | | | | | | | | | | | | |
Investment Management | | | — | | | — | | | 10,021 | | | — | | | — | |
Administration | | | 1,177 | | | 218 | | | 558 | | | 213 | | | 2,033 | |
Distribution | | | 901 | | | — | | | 650 | | | 629 | | | — | |
Shareholder Servicing | | | 3,871 | | | — | | | 1,337 | | | 2,547 | | | — | |
Compliance Services | | | 1 | | | 1 | | | — | | | 1 | | | 3 | |
Accounting | | | — | | | — | | | 19 | | | — | | | — | |
Custodian | | | — | | | — | | | 1,672 | | | — | | | — | |
Transfer Agent | | | 13,885 | | | 6,418 | | | 10,621 | | | 10,215 | | | 7,745 | |
Trustee | | | 116 | | | — | | | 74 | | | 23 | | | 208 | |
Other | | | 27,956 | | | 4,392 | | | 5,149 | | | 5,072 | | | 51,500 | |
| |
|
| |
|
| |
|
| |
|
| |
|
| |
Total Liabilities | | | 283,141 | | | 64,911 | | | 105,889 | | | 44,705 | | | 159,809 | |
| |
|
| |
|
| |
|
| |
|
| |
|
| |
Net Assets | | $ | 67,323,101 | | $ | 13,767,085 | | $ | 15,491,456 | | $ | 12,281,085 | | $ | 117,064,332 | |
| |
|
| |
|
| |
|
| |
|
| |
|
| |
| | | | | | | | | | | | | | | | |
Composition of Net Assets: | | | | | | | | | | | | | | | | |
Capital | | $ | 61,307,396 | | $ | 82,478,566 | | $ | 14,656,081 | | $ | 10,766,135 | | $ | 101,357,545 | |
Accumulated net investment income (loss) | | | — | | | 2,214,566 | | | — | | | — | | | — | |
Accumulated net realized gains (losses) from investment and foreign currency transactions | | | (6,809,360 | ) | | (71,530,484 | ) | | (2,644,893 | ) | | (78,181 | ) | | 561,853 | |
Unrealized appreciation/depreciation from investments and foreign currencies | | | 12,825,065 | | | 604,437 | | | 3,480,268 | | | 1,593,131 | | | 15,144,934 | |
| |
|
| |
|
| |
|
| |
|
| |
|
| |
Net Assets | | $ | 67,323,101 | | $ | 13,767,085 | | $ | 15,491,456 | | $ | 12,281,085 | | $ | 117,064,332 | |
| |
|
| |
|
| |
|
| |
|
| |
|
| |
| | | | | | | | | | | | | | | | |
Net Assets: | | | | | | | | | | | | | | | | |
Class A Shares | | $ | 16,452,181 | | $ | — | | $ | 5,126,211 | | $ | 11,281,556 | | $ | — | |
Class B Shares | | | 1,212,547 | | | — | | | 975,557 | | | 658,383 | | | — | |
Class C Shares | | | 184,305 | | | — | | | 21,269 | | | 341,146 | | | — | |
Class I Shares | | | 49,474,068 | | | 13,767,085 | | | 9,368,419 | | | — | | | 117,064,332 | |
| |
|
| |
|
| |
|
| |
|
| |
|
| |
Total | | $ | 67,323,101 | | $ | 13,767,085 | | $ | 15,491,456 | | $ | 12,281,085 | | $ | 117,064,332 | |
| |
|
| |
|
| |
|
| |
|
| |
|
| |
| | | | | | | | | | | | | | | | |
Shares Outstanding ($0.001 par value, unlimited number of shares authorized): | | | | | | | | | | | | | | | | |
| | | | | | | | | | | | | | | | |
Class A Shares | | | 1,095,554 | | | — | | | 722,314 | | | 1,166,915 | | | — | |
Class B Shares | | | 87,873 | | | — | | | 153,690 | | | 81,405 | | | — | |
Class C Shares | | | 13,273 | | | — | | | 3,313 | | | 41,364 | | | — | |
Class I Shares | | | 3,256,705 | | | 1,084,736 | | | 1,281,459 | | | — | | | 9,170,664 | |
| | | | | | | | | | | | | | | | |
Net Asset Value, Offering Price and Redemption Price per share: | | | | | | | | | | | | | | | | |
Class A Shares | | $ | 15.02 | | $ | — | | $ | 7.10 | | $ | 9.67 | | $ | — | |
Class B Shares* | | $ | 13.80 | | $ | — | | $ | 6.35 | | $ | 8.09 | | $ | — | |
Class C Shares* | | $ | 13.89 | | $ | — | | $ | 6.42 | | $ | 8.25 | | $ | — | |
Class I Shares | | $ | 15.19 | | $ | 12.69 | | $ | 7.31 | | $ | — | | $ | 12.77 | |
Maximum Sales Charge – Class A Shares | | | 5.00 | % | | — | % | | 5.00 | % | | 5.00 | % | | — | % |
| | | | | | | | | | | | | | | | |
Maximum Offering Price per share (Net Asset Value/ (100%-maximum sales charge)) – Class A Shares | | $ | 15.81 | | $ | — | | $ | 7.47 | | $ | 10.18 | | $ | — | |
| |
|
| |
|
| |
|
| |
|
| |
|
| |
Total Investments, at cost | | | | | | | | $ | 11,890,758 | | | | | | | |
| | | | | | | |
|
| | | | | | | |
| | |
| |
* | Redemption Price per share varies by length of time shares are held. |
| | |
19 | HSBC INVESTOR FAMILY OF FUNDS | See notes to financial statements. |
HSBC INVESTOR FAMILY OF FUNDS
Statements of Assets and Liabilities—as of October 31, 2010 (continued)
| | | | | | | |
| �� | Overseas
Equity Fund | | Value Fund | |
|
|
|
|
|
|
Assets: | | | | | | | |
Investments in Affiliated Portfolios | | $ | 6,103,648 | | $ | 32,404,763 | |
Receivable for capital shares issued | | | 36,328 | | | 204,390 | |
Reclaims receivable | | | 47,482 | | | — | |
Receivable from Custodian | | | 1,470 | | | — | |
Receivable from Investment Adviser | | | 5,755 | | | 5,321 | |
Prepaid expenses and other assets | | | 8,371 | | | 11,078 | |
| |
|
| |
|
| |
Total Assets | | | 6,203,054 | | | 32,625,552 | |
| |
|
| |
|
| |
Liabilities: | | | | | | | |
Payable for capital shares redeemed | | | 8,880 | | | 164,232 | |
Accrued expenses and other liabilities: | | | | | | | |
Administration | | | 109 | | | 573 | |
Distribution | | | 418 | | | 212 | |
Shareholder Servicing | | | 1,316 | | | 2,773 | |
Compliance Service | | | 3 | | | 67 | |
Transfer Agent | | | 8,007 | | | 10,981 | |
Trustee | | | 9 | | | 58 | |
Other | | | 2,144 | | | 15,360 | |
| |
|
| |
|
| |
Total Liabilities | | | 20,886 | | | 194,256 | |
| |
|
| |
|
| |
Net Assets | | $ | 6,182,168 | | $ | 32,431,296 | |
| |
|
| |
|
| |
| | | | | | | |
Composition of Net Assets: | | | | | | | |
Capital | | | 6,948,236 | | | 37,130,051 | |
Accumulated net investment income | | | 176,079 | | | — | |
Accumulated net realized gains (losses) from investment and foreign currency transactions | | | (1,155,275 | ) | | (5,592,847 | ) |
Unrealized appreciation/depreciation from investments and foreign currencies | | | 213,128 | | | 894,092 | |
| |
|
| |
|
| |
Net Assets | | $ | 6,182,168 | | $ | 32,431,296 | |
| |
|
| |
|
| |
| | | | | | | |
Net Assets: | | | | | | | |
Class A Shares | | $ | 5,540,796 | | $ | 12,084,812 | |
Class B Shares | | | 585,484 | | | 249,628 | |
Class C Shares | | | 55,888 | | | 79,072 | |
Class I Shares | | | — | | | 20,017,784 | |
| |
|
| |
|
| |
Total | | $ | 6,182,168 | | $ | 32,431,296 | |
| |
|
| |
|
| |
| | | | | | | |
Shares Outstanding ($0.001 par value, unlimited number of shares authorized): | | | | | | | |
Class A Shares | | | 1,306,290 | | | 1,016,074 | |
Class B Shares | | | 157,812 | | | 22,059 | |
Class C Shares | | | 13,901 | | | 6,940 | |
Class I Shares | | | — | | | 1,685,948 | |
| | | | | | | |
Net Asset Value, Offering Price and Redemption Price per share: | | | | | | | |
Class A Shares | | $ | 4.24 | | $ | 11.89 | |
Class B Shares* | | $ | 3.71 | | $ | 11.32 | |
Class C Shares* | | $ | 4.02 | | $ | 11.39 | |
Class I Shares | | $ | — | | $ | 11.87 | |
Maximum Sales Charge—Class A Shares | | | 5.00 | % | | 5.00 | % |
| |
|
| |
|
| |
Maximum Offering Price per share (Net Asset Value/(100%-maximum sales charge))—Class A Shares | | $ | 4.46 | | $ | 12.52 | |
| |
|
| |
|
| |
| | |
| |
* | Redemption Price per share varies by length of time shares are held. |
| | |
See notes to financial statements. | HSBC INVESTOR FAMILY OF FUNDS | 20 |
HSBC INVESTOR FAMILY OF FUNDS
Statements of Operations—For the year ended October 31, 2010
| | | | | | | | | | | | | | | | |
| | Growth
Fund | | International
Equity Fund | | Mid-Cap
Fund | | Opportunity
Fund | | Opportunity
Fund (Advisor) | |
|
|
|
|
|
|
|
|
|
|
|
|
Investment Income: | | | | | | | | | | | | | | | | |
Dividends | | $ | — | | $ | — | | $ | 191,404 | | $ | — | | $ | — | |
Investment Income from Affiliated Portfolios (a) | | | 392,229 | | | 4,384,985 | | | — | | | 63,139 | | | 590,383 | |
Tax reclaims from Affiliated Portfolios (a) | | | — | | | 186,402 | | | — | | | — | | | — | |
Foreign tax withholding from Affiliated Portfolios (a) | | | — | | | (610,900 | ) | | — | | | (2 | ) | | 3 | |
Expenses from Affiliated Portfolios (a) | | | (416,011 | ) | | (1,059,082 | ) | | — | | | (103,862 | ) | | (969,564 | ) |
Other Income (b) | | | 10,161 | | | 8,062 | | | 5,436 | | | 796 | | | 10,753 | |
| |
|
| |
|
| |
|
| |
|
| |
|
| |
Total Investment Income (Loss) | | | (13,621 | ) | | 2,909,467 | | | 196,840 | | | (39,929 | ) | | (368,425 | ) |
| |
|
| |
|
| |
|
| |
|
| |
|
| |
| | | | | | | | | | | | | | | | |
Expenses: | | | | | | | | | | | | | | | | |
Investment Management | | | — | | | — | | | 119,088 | | | — | | | — | |
Administration: | | | | | | | | | | | | | | | | |
Class A Shares | | | 3,233 | | | — | | | 1,981 | | | 2,147 | | | — | |
Class B Shares | | | 318 | | | — | | | 509 | | | 160 | | | — | |
Class C Shares | | | 30 | | | — | | | 6 | | | 62 | | | — | |
Class I Shares | | | 8,848 | | | 25,490 | | | 3,939 | | | — | | | 22,137 | |
Distribution: | | | | | | | | | | | | | | | | |
Class B Shares | | | 11,713 | | | — | | | 9,387 | | | 5,880 | | | — | |
Class C Shares | | | 1,125 | | | — | | | 119 | | | 2,293 | | | — | |
Shareholder Servicing: | | | | | | | | | | | | | | | | |
Class A Shares | | | 39,671 | | | — | | | 12,192 | | | 21,629 | | | — | |
Class B Shares | | | 3,904 | | | — | | | 3,129 | | | 1,960 | | | — | |
Class C Shares | | | 375 | | | — | | | 40 | | | 764 | | | — | |
Accounting | | | 24,000 | | | 8,999 | | | 57,575 | | | 19,000 | | | 9,000 | |
Compliance Services | | | 270 | | | 597 | | | 154 | | | 53 | | | 486 | |
Transfer Agent | | | 82,344 | | | 37,113 | | | 63,685 | | | 60,484 | | | 47,353 | |
Trustee | | | 939 | | | 2,021 | | | 544 | | | 181 | | | 1,674 | |
Other | | | 68,849 | | | 3,258 | | | 34,425 | | | 31,453 | | | 56,485 | |
| |
|
| |
|
| |
|
| |
|
| |
|
| |
Total expenses before fee reductions | | | 245,619 | | | 77,478 | | | 306,773 | | | 146,066 | | | 137,135 | |
Fees contractually reduced by Investment Advisor | | | (22,001 | ) | | — | | | (107,107 | ) | | (49,041 | ) | | — | |
Fees voluntarily reduced by Investment Adviser | | | — | | | (39,043 | ) | | — | | | (11,678 | ) | | — | |
| |
|
| |
|
| |
|
| |
|
| |
|
| |
Net Expenses | | | 223,618 | | | 38,435 | | | 199,666 | | | 85,347 | | | 137,135 | |
| |
|
| |
|
| |
|
| |
|
| |
|
| |
|
Net Investment Income (Loss) | | | (237,239 | ) | | 2,871,032 | | | (2,826 | ) | | (125,276 | ) | | (505,560 | ) |
| |
|
| |
|
| |
|
| |
|
| |
|
| |
| | | | | | | | | | | | | | | | |
Net Realized/Unrealized Gains (Losses) from Investments: (a) | | | | | | | | | | | | | | | | |
Net realized gains (losses) from investments and foreign currency transactions | | | 2,754,614 | | | (23,700,569 | ) | | 1,035,360 | | | 1,493,153 | | | 13,711,938 | |
Change in unrealized appreciation/depreciation from investments and foreign currencies | | | 8,698,898 | | | 10,508,917 | | | 2,307,361 | | | 1,480,059 | | | 14,318,171 | |
| |
|
| |
|
| |
|
| |
|
| |
|
| |
| | | | | | | | | | | | | | | | |
Net realized/unrealized gains from investments and foreign currency transactions | | | 11,453,512 | | | (13,191,652 | ) | | 3,342,721 | | | 2,973,212 | | | 28,030,109 | |
| |
|
| |
|
| |
|
| |
|
| |
|
| |
Change In Net Assets Resulting From Operations | | $ | 11,216,273 | | $ | (10,320,620 | ) | $ | 3,339,895 | | $ | 2,847,936 | | $ | 27,524,549 | |
| |
|
| |
|
| |
|
| |
|
| |
|
| |
| | |
| |
(a) | Represents amounts allocated from the respective Affiliated Portfolios, where applicable. |
| |
(b) | See Note 7 in the Notes to Financial Statements. |
| | |
21 | HSBC INVESTOR FAMILY OF FUNDS | See notes to financial statements. |
HSBC INVESTOR FAMILY OF FUNDS
Statements of Operations—For the year ended October 31, 2010 (continued)
| | | | | | | |
| | Overseas
Equity Fund | | Value
Fund | |
|
|
|
|
|
|
Investment Income: | | | | | | | |
Investment Income from Affiliated Portfolios (a) | | $ | 193,874 | | $ | 485,348 | |
Tax reclaims from Affiliated Portfolios (a) | | | 4,469 | | | — | |
Foreign tax withholding from Affiliated Portfolios (a) | | | (25,028 | ) | | (3,372 | ) |
Expenses from Affiliated Portfolios (a) | | | (59,877 | ) | | (209,522 | ) |
Other Income (b) | | | 453 | | | 3,669 | |
| |
|
| |
|
| |
Total Investment Income (Loss) | | | 113,891 | | | 276,123 | |
| |
|
| |
|
| |
| | | | | | | |
Expenses: | | | | | | | |
Administration: | | | | | | | |
Class A Shares | | | 1,105 | | | 2,492 | |
Class B Shares | | | 147 | | | 68 | |
Class C Shares | | | 11 | | | 15 | |
Class I Shares | | | — | | | 3,762 | |
Distribution: | | | | | | | |
Class B Shares | | | 5,421 | | | 2,484 | |
Class C Shares | | | 410 | | | 568 | |
Shareholder Servicing: | | | | | | | |
Class A Shares | | | 13,612 | | | 30,470 | |
Class B Shares | | | 1,807 | | | 828 | |
Class C Shares | | | 137 | | | 189 | |
Accounting | | | 19,000 | | | 24,001 | |
Compliance Service | | | 27 | | | 151 | |
Transfer Agent | | | 46,911 | | | 62,934 | |
Trustee | | | 95 | | | 484 | |
Other | | | 25,973 | | | 39,036 | |
| |
|
| |
|
| |
Total expenses before fee reductions | | | 114,656 | | | 167,482 | |
Fees contractually reduced by Investment Adviser | | | (53,391 | ) | | (45,129 | ) |
Fees voluntarily reduced by Investment Adviser | | | (9,349 | ) | | — | |
| |
|
| |
|
| |
Net Expenses | | | 51,916 | | | 122,353 | |
| |
|
| |
|
| |
|
Net Investment Income (Loss) | | | 61,975 | | | 153,770 | |
| |
|
| |
|
| |
| | | | | | | |
Net Realized/Unrealized Gains (Losses) from Investments: (a) | | | | | | | |
Net realized gains (losses) from investments and foreign currency transactions | | | (292,078 | ) | | 222,525 | |
Change in unrealized appreciation/depreciation from investments and foreign currencies | | | 543,769 | | | 3,453,894 | |
| |
|
| |
|
| |
| | | | | | | |
Net realized/unrealized gains from investments and foreign currency transactions | | | 251,691 | | | 3,676,419 | |
| |
|
| |
|
| |
Change In Net Assets Resulting From Operations | | $ | 313,666 | | $ | 3,830,189 | |
| |
|
| |
|
| |
| |
| |
(a) | Represents amounts allocated from the respective Affiliated Portfolios. |
| |
(b) | See Note 7 in the Notes to Financial Statements. |
| | |
See notes to financial statements. | HSBC INVESTOR FAMILY OF FUNDS | 22 |
HSBC INVESTOR FAMILY OF FUNDS
Statements of Changes in Net Assets
| | | | | | | |
| | Growth Fund | |
|
|
|
|
| | For the
year ended
October 31, 2010 | | For the
year ended
October 31, 2009 | |
|
|
|
|
|
|
Investment Activities: | | | | | | | |
| | | | | | | |
Operations: | | | | | | | |
Net investment income (loss) | | $ | (237,239 | ) | $ | (106,102 | ) |
Net realized gains (losses) from investments transactions | | | 2,754,614 | | | (9,717,237 | ) |
Change in unrealized appreciation/depreciation from investments and foreign currencies | | | 8,698,898 | | | 18,612,853 | |
| |
|
| |
|
| |
Change in net assets resulting from operations | | | 11,216,273 | | | 8,789,514 | |
| |
|
| |
|
| |
Change in net assets resulting from capital transactions | | | (1,368,340 | ) | | (10,272,668 | ) |
| |
|
| |
|
| |
Change in net assets | | | 9,847,933 | | | (1,483,154 | ) |
| | | | | | | |
Net Assets: | | | | | | | |
Beginning of period | | | 57,475,168 | | | 58,958,322 | |
| |
|
| |
|
| |
End of period | | $ | 67,323,101 | | $ | 57,475,168 | |
| |
|
| |
|
| |
Accumulated net investment income (loss) | | $ | — | | $ | — | |
| |
|
| |
|
| |
| | |
23 | HSBC INVESTOR FAMILY OF FUNDS | See notes to financial statements. |
HSBC INVESTOR FAMILY OF FUNDS
Statements of Changes in Net Assets (continued)
| | | | | | | |
| | Growth Fund | |
|
|
|
|
| | For the
year ended
October 31, 2010 | | For the
year ended
October 31, 2009 | |
|
|
|
|
|
|
CAPITAL TRANSACTIONS: | | | | | | | |
Class A Shares: | | | | | | | |
Proceeds from shares issued | | $ | 1,474,696 | | $ | 1,225,814 | |
Value of shares redeemed | | | (3,830,531 | ) | | (5,063,199 | ) |
| |
|
| |
|
| |
Class A Shares capital transactions | | | (2,355,835 | ) | | (3,837,385 | ) |
| |
|
| |
|
| |
| | | | | | | |
Class B Shares: | | | | | | | |
Proceeds from shares issued | | | 45,443 | | | 66,339 | |
Value of shares redeemed | | | (1,185,170 | ) | | (1,164,836 | ) |
| |
|
| |
|
| |
Class B Shares capital transactions | | | (1,139,727 | ) | | (1,098,497 | ) |
| |
|
| |
|
| |
| | | | | | | |
Class C Shares: | | | | | | | |
Proceeds from shares issued | | | 37,690 | | | 36,704 | |
Value of shares redeemed | | | (672 | ) | | (5,976 | ) |
| |
|
| |
|
| |
Class C Shares capital transactions | | | 37,018 | | | 30,728 | |
| |
|
| |
|
| |
Class I Shares: | | | | | | | |
Proceeds from shares issued | | | 9,912,289 | | | 4,547,877 | |
Value of shares redeemed | | | (7,822,085 | ) | | (9,915,391 | ) |
| |
|
| |
|
| |
Class I Shares capital transactions | | | 2,090,204 | | | (5,367,514 | ) |
| |
|
| |
|
| |
Change in net assets resulting from capital transactions | | $ | (1,368,340 | ) | $ | (10,272,668 | ) |
| |
|
| |
|
| |
| | | | | | | |
SHARE TRANSACTIONS: | | | | | | | |
Class A Shares: | | | | | | | |
Issued | | | 105,581 | | | 112,735 | |
Redeemed | | | (278,015 | ) | | (472,708 | ) |
| |
|
| |
|
| |
Change in Class A Shares | | | (172,434 | ) | | (359,973 | ) |
| |
|
| |
|
| |
| | | | | | | |
Class B Shares: | | | | | | | |
Issued | | | 3,490 | | | 6,818 | |
Redeemed | | | (93,088 | ) | | (117,668 | ) |
| |
|
| |
|
| |
Change in Class B Shares | | | (89,598 | ) | | (110,850 | ) |
| |
|
| |
|
| |
| | | | | | | |
Class C Shares: | | | | | | | |
Issued | | | 3,029 | | | 3,677 | |
Redeemed | | | (54 | ) | | (631 | ) |
| |
|
| |
|
| |
Change in Class C Shares | | | 2,975 | | | 3,046 | |
| |
|
| |
|
| |
| | | | | | | |
Class I Shares: | | | | | | | |
Issued | | | 705,610 | | | 418,087 | |
Redeemed | | | (563,535 | ) | | (961,622 | ) |
| |
|
| |
|
| |
Change in Class I Shares | | | 142,075 | | | (543,535 | ) |
| |
|
| |
|
| |
| | |
See notes to financial statements. | HSBC INVESTOR FAMILY OF FUNDS | 24 |
HSBC INVESTOR FAMILY OF FUNDS
Statements of Changes in Net Assets (continued)
| | | | | | | | | | | | | |
| | International Equity Fund | | Mid-Cap Fund | |
|
|
|
|
|
|
| | For the
year ended
October 31, 2010 | | For the
year ended
October 31, 2009 | | For the
year ended
October 31, 2010 | | For the
year ended
October 31, 2009 | |
|
|
|
|
|
|
|
|
|
|
Investment Activities: | | | | | | | | | | | | | |
Operations: | | | | | | | | | | | | | |
Net investment income (loss) | | $ | 2,871,032 | | $ | 3,354,935 | | $ | (2,826 | ) | $ | 37,965 | |
Net realized gains (losses) from investments transactions | | | (23,700,569 | ) | | (59,981,220 | ) | | 1,035,360 | | | (3,509,959 | ) |
Change in unrealized appreciation/depreciation from investments and foreign currencies | | | 10,508,917 | | | 90,089,864 | | | 2,307,361 | | | 5,026,011 | |
| |
|
| |
|
| |
|
| |
|
| |
Change in net assets resulting from operations | | | (10,320,620 | ) | | 33,463,579 | | | 3,339,895 | | | 1,554,017 | |
| |
|
| |
|
| |
|
| |
|
| |
| | | | | | | | | | | | | |
Dividends: | | | | | | | | | | | | | |
Net investment income: | | | | | | | | | | | | | |
Class A Shares | | | — | | | — | | | (5,190 | ) | | — | |
Class I Shares | | | (2,826,752 | ) | | (7,354,738 | ) | | (32,776 | ) | | — | |
Net realized gains: | | | | | | | | | | | | | |
Class A Shares | | | — | | | — | | | — | | | (294,264 | ) |
Class B Shares | | | — | | | — | | | — | | | (174,161 | ) |
Class C Shares | | | — | | | — | | | — | | | (1,041 | ) |
Class I Shares | | | — | | | (8,461,420 | ) | | — | | | (681,038 | ) |
| |
|
| |
|
| |
|
| |
|
| |
Change in net assets resulting from shareholder dividends | | | (2,826,752 | ) | | (15,816,158 | ) | | (37,966 | ) | | (1,150,504 | ) |
| |
|
| |
|
| |
|
| |
|
| |
Change in net assets resulting from capital transactions | | | (153,327,685 | ) | | 1,541,373 | | | (1,014,778 | ) | | (3,850,002 | ) |
| |
|
| |
|
| |
|
| |
|
| |
Change in net assets | | | (166,475,057 | ) | | 19,188,794 | | | 2,287,151 | | | (3,446,489 | ) |
| | | | | | | | | | | | | |
Net Assets: | | | | | | | | | | | | | |
Beginning of period | | | 180,242,142 | | | 161,053,348 | | | 13,204,305 | | | 16,650,794 | |
| |
|
| |
|
| |
|
| |
|
| |
End of period | | $ | 13,767,085 | | $ | 180,242,142 | | $ | 15,491,456 | | $ | 13,204,305 | |
| |
|
| |
|
| |
|
| |
|
| |
Accumulated net investment income (loss) | | $ | 2,214,566 | | $ | 2,365,154 | | $ | — | | $ | 37,965 | |
| |
|
| |
|
| |
|
| |
|
| |
| | |
25 | HSBC INVESTOR FAMILY OF FUNDS | See notes to financial statements. |
HSBC INVESTOR FAMILY OF FUNDS
Statements of Changes in Net Assets (continued)
| | | | | | | | | | | | | |
| | International Equity Fund | | Mid-Cap Fund | |
|
|
|
|
|
|
| | For the
year ended
October 31, 2010 | | For the
year ended
October 31, 2009 | | For the
year ended
October 31, 2010 | | For the
year ended
October 31, 2009 | |
|
|
|
|
|
|
|
|
|
|
CAPITAL TRANSACTIONS: | | | | | | | | | | | | | |
Class A Shares: | | | | | | | | | | | | | |
Proceeds from shares issued | | $ | — | | $ | — | | $ | 766,866 | | $ | 566,784 | |
Dividends reinvested | | | — | | | — | | | 5,110 | | | 290,977 | |
Value of shares redeemed | | | — | | | — | | | (899,336 | ) | | (541,791 | ) |
| |
|
| |
|
| |
|
| |
|
| |
Class A Shares capital transactions | | | — | | | — | | | (127,360 | ) | | 315,970 | |
| |
|
| |
|
| |
|
| |
|
| |
| | | | | | | | | | | | | |
Class B Shares: | | | | | | | | | | | | | |
Proceeds from shares issued | | | — | | | — | | | 40,946 | | | 82,819 | |
Dividends reinvested | | | — | | | — | | | — | | | 169,310 | |
Value of shares redeemed | | | — | | | — | | | (923,255 | ) | | (686,734 | ) |
| |
|
| |
|
| |
|
| |
|
| |
Class B Shares capital transactions | | | — | | | — | | | (882,309 | ) | | (434,605 | ) |
| |
|
| |
|
| |
|
| |
|
| |
| | | | | | | | | | | | | |
Class C Shares: | | | | | | | | | | | | | |
Proceeds from shares issued | | | — | | | — | | | 4,998 | | | 11 | |
Dividends reinvested | | | — | | | — | | | — | | | 1,041 | |
Value of shares redeemed | | | — | | | — | | | — | | | (508 | ) |
| |
|
| |
|
| |
|
| |
|
| |
Class C Shares capital transactions | | | — | | | — | | | 4,998 | | | 544 | |
| |
|
| |
|
| |
|
| |
|
| |
| | | | | | | | | | | | | |
Class I Shares: | | | | | | | | | | | | | |
Proceeds from shares issued | | | 17,089,243 | | | 26,914,666 | | | 3,806,298 | | | 341,422 | |
Dividends reinvested | | | 2,134,231 | | | 11,845,280 | | | 21,153 | | | 462,791 | |
Value of shares redeemed | | | (172,551,159 | ) | | (37,218,573 | ) | | (3,837,558 | ) | | (4,536,124 | ) |
| |
|
| |
|
| |
|
| |
|
| |
Class I Shares capital transactions | | | (153,327,685 | ) | | 1,541,373 | | | (10,107 | ) | | (3,731,911 | ) |
| |
|
| |
|
| |
|
| |
|
| |
Change in net assets resulting from capital transactions | | $ | (153,327,685 | ) | $ | 1,541,373 | | $ | (1,014,778 | ) | $ | (3,850,002 | ) |
| |
|
| |
|
| |
|
| |
|
| |
| | | | | | | | | | | | | |
SHARE TRANSACTIONS: | | | | | | | | | | | | | |
Class A Shares: | | | | | | | | | | | | | |
Issued | | | — | | | — | | | 120,715 | | | 116,639 | |
Reinvested | | | — | | | — | | | 829 | | | 65,535 | |
Redeemed | | | — | | | — | | | (136,224 | ) | | (111,962 | ) |
| |
|
| |
|
| |
|
| |
|
| |
Change in Class A Shares | | | — | | | — | | | (14,680 | ) | | 70,212 | |
| |
|
| |
|
| |
|
| |
|
| |
| | | | | | | | | | | | | |
Class B Shares: | | | | | | | | | | | | | |
Issued | | | — | | | — | | | 6,986 | | | 18,945 | |
Reinvested | | | — | | | — | | | — | | | 42,117 | |
Redeemed | | | — | | | — | | | (161,076 | ) | | (154,800 | ) |
| |
|
| |
|
| |
|
| |
|
| |
Change in Class B Shares | | | — | | | — | | | (154,090 | ) | | (93,738 | ) |
| |
|
| |
|
| |
|
| |
|
| |
| | | | | | | | | | | | | |
Class C Shares: | | | | | | | | | | | | | |
Issued | | | — | | | — | | | 836 | | | — | |
Reinvested | | | — | | | — | | | — | | | 256 | |
Redeemed | | | — | | | — | | | — | | | (138 | ) |
| |
|
| |
|
| |
|
| |
|
| |
Change in Class C Shares | | | — | | | — | | | 836 | | | 118 | |
| |
|
| |
|
| |
|
| |
|
| |
| | | | | | | | | | | | | |
Class I Shares: | | | | | | | | | | | | | |
Issued | | | 1,420,299 | | | 2,374,315 | | | 577,349 | | | 70,062 | |
Reinvested | | | 173,656 | | | 1,323,495 | | | 3,342 | | | 101,267 | |
Redeemed | | | (15,335,841 | ) | | (3,874,180 | ) | | (568,717 | ) | | (911,670 | ) |
| |
|
| |
|
| |
|
| |
|
| |
Change in Class I Shares | | | (13,741,886 | ) | | (176,370 | ) | | 11,974 | | | (740,341 | ) |
| |
|
| |
|
| |
|
| |
|
| |
| | |
See notes to financial statements. | HSBC INVESTOR FAMILY OF FUNDS | 26 |
HSBC INVESTOR FAMILY OF FUNDS
Statements of Changes in Net Assets (continued)
| | | | | | | | | | | | | |
| | Opportunity Fund | | Opportunity Fund (Advisor) | |
|
|
|
|
|
|
| | For the
year ended
October 31, 2010 | | For the
year ended
October 31, 2009 | | For the
year ended
October 31, 2010 | | For the
year ended
October 31, 2009 | |
|
|
|
|
|
|
|
|
|
|
Investment Activities: | | | | | | | | | | | | | |
Operations: | | | | | | | | | | | | | |
Net investment income (loss) | | $ | (125,276 | ) | $ | (112,648 | ) | $ | (505,560 | ) | $ | (434,015 | ) |
Net realized gains (losses) from investments transactions | | | 1,493,153 | | | (1,474,598 | ) | | 13,711,938 | | | (12,341,854 | ) |
Change in unrealized appreciation/depreciation from investments and foreign currencies | | | 1,480,059 | | | 2,899,270 | | | 14,318,171 | | | 24,564,409 | |
| |
|
| |
|
| |
|
| |
|
| |
Change in net assets resulting from operations | | | 2,847,936 | | | 1,312,024 | | | 27,524,549 | | | 11,788,540 | |
| |
|
| |
|
| |
|
| |
|
| |
Dividends: | | | | | | | | | | | | | |
Net realized gains: | | | | | | | | | | | | | |
Class A Shares | | | — | | | (539,992 | ) | | — | | | — | |
Class B Shares | | | — | | | (107,053 | ) | | — | | | — | |
Class C Shares | | | — | | | (13,420 | ) | | — | | | — | |
Class I Shares | | | — | | | — | | | — | | | (2,746,629 | ) |
| |
|
| |
|
| |
|
| |
|
| |
Change in net assets resulting from shareholder dividends | | | — | | | (660,465 | ) | | — | | | (2,746,629 | ) |
| |
|
| |
|
| |
|
| |
|
| |
Change in net assets resulting from capital transactions | | | (1,603,281 | ) | | (981,801 | ) | | (10,745,516 | ) | | (6,597,185 | ) |
| |
|
| |
|
| |
|
| |
|
| |
Change in net assets | | | 1,244,655 | | | (330,242 | ) | | 16,779,033 | | | 2,444,726 | |
| | | | | | | | | | | | | |
Net Assets: | | | | | | | | | | | | | |
Beginning of period | | | 11,036,430 | | | 11,366,672 | | | 100,285,299 | | | 97,840,573 | |
| |
|
| |
|
| |
|
| |
|
| |
End of period | | $ | 12,281,085 | | $ | 11,036,430 | | $ | 117,064,332 | | $ | 100,285,299 | |
| |
|
| |
|
| |
|
| |
|
| |
Accumulated net investment income (loss) | | $ | — | | $ | — | | $ | — | | $ | — | |
| |
|
| |
|
| |
|
| |
|
| |
| | |
27 | HSBC INVESTOR FAMILY OF FUNDS | See notes to financial statements. |
HSBC INVESTOR FAMILY OF FUNDS
Statements of Changes in Net Assets (continued)
| | | | | | | | | | | | | |
| | Opportunity Fund | | Opportunity Fund (Advisor) | |
|
|
|
|
|
|
| | For the
year ended
October 31, 2010 | | For the
year ended
October 31, 2009 | | For the
year ended
October 31, 2010 | | For the
year ended
October 31, 2009 | |
|
|
|
|
|
|
|
|
|
|
CAPITAL TRANSACTIONS: | | | | | | | | | | | | | |
Class A Shares: | | | | | | | | | | | | | |
Proceeds from shares issued | | $ | 958,979 | | $ | 1,180,248 | | $ | — | | $ | — | |
Dividends reinvested | | | — | | | 537,467 | | | — | | | — | |
Value of shares redeemed | | | (1,934,533 | ) | | (2,263,523 | ) | | — | | | — | |
| |
|
| |
|
| |
|
| |
|
| |
Class A Shares capital transactions | | | (975,554 | ) | | (545,808 | ) | | — | | | — | |
| |
|
| |
|
| |
|
| |
|
| |
| | | | | | | | | | | | | |
Class B Shares: | | | | | | | | | | | | | |
Proceeds from shares issued | | | 64,053 | | | 66,965 | | | — | | | — | |
Dividends reinvested | | | — | | | 106,455 | | | — | | | — | |
Value of shares redeemed | | | (692,276 | ) | | (667,369 | ) | | — | | | — | |
| |
|
| |
|
| |
|
| |
|
| |
Class B Shares capital transactions | | | (628,223 | ) | | (493,949 | ) | | — | | | — | |
| |
|
| |
|
| |
|
| |
|
| |
|
Class C Shares: | | | | | | | | | | | | | |
Proceeds from shares issued | | | 15,200 | | | 54,586 | | | — | | | — | |
Dividends reinvested | | | — | | | 13,420 | | | — | | | — | |
Value of shares redeemed | | | (14,704 | ) | | (10,050 | ) | | — | | | — | |
| |
|
| |
|
| |
|
| |
|
| |
Class C Shares capital transactions | | | 496 | | | 57,956 | | | — | | | — | |
| |
|
| |
|
| |
|
| |
|
| |
|
Class I Shares: | | | | | | | | | | | | | |
Proceeds from shares issued | | | — | | | — | | | 15,064,090 | | | 9,048,783 | |
Dividends reinvested | | | — | | | — | | | — | | | 2,020,969 | |
Value of shares redeemed | | | — | | | — | | | (25,809,606 | ) | | (17,666,937 | ) |
| |
|
| |
|
| |
|
| |
|
| |
Class I Shares capital transactions | | | — | | | — | | | (10,745,516 | ) | | (6,597,185 | ) |
| |
|
| |
|
| |
|
| |
|
| |
Change in net assets resulting from capital transactions | | $ | (1,603,281 | ) | $ | (981,801 | ) | $ | (10,745,516 | ) | $ | (6,597,185 | ) |
| |
|
| |
|
| |
|
| |
|
| |
| | | | | | | | | | | | | |
SHARE TRANSACTIONS: | | | | | | | | | | | | | |
Class A Shares: | | | | | | | | | | | | | |
Issued | | | 111,213 | | | 173,171 | | | — | | | — | |
Reinvested | | | — | | | 95,805 | | | — | | | — | |
Redeemed | | | (226,379 | ) | | (340,092 | ) | | — | | | — | |
| |
|
| |
|
| |
|
| |
|
| |
Change in Class A Shares | | | (115,166 | ) | | (71,116 | ) | | — | | | — | |
| |
|
| |
|
| |
|
| |
|
| |
| | | | | | | | | | | | | |
Class B Shares: | | | | | | | | | | | | | |
Issued | | | 8,548 | | | 12,358 | | | — | | | — | |
Reinvested | | | — | | | 22,363 | | | — | | | — | |
Redeemed | | | (97,089 | ) | | (123,288 | ) | | — | | | — | |
| |
|
| |
|
| |
|
| |
|
| |
Change in Class B Shares | | | (88,541 | ) | | (88,567 | ) | | — | | | — | |
| |
|
| |
|
| |
|
| |
|
| |
| | | | | | | | | | | | | |
Class C Shares: | | | | | | | | | | | | | |
Issued | | | 2,110 | | | 9,847 | | | — | | | — | |
Reinvested | | | — | | | 2,768 | | | — | | | — | |
Redeemed | | | (1,877 | ) | | (1,959 | ) | | — | | | — | |
| |
|
| |
|
| |
|
| |
|
| |
Change in Class C Shares | | | 233 | | | 10,656 | | | — | | | — | |
| |
|
| |
|
| |
|
| |
|
| |
| | | | | | | | | | | | | |
Class I Shares: | | | | | | | | | | | | | |
Issued | | | — | | | — | | | 1,318,081 | | | 1,063,736 | |
Reinvested | | | — | | | — | | | — | | | 275,712 | |
Redeemed | | | — | | | — | | | (2,249,632 | ) | | (2,220,201 | ) |
| |
|
| |
|
| |
|
| |
|
| |
Change in Class I Shares | | | — | | | — | | | (931,551 | ) | | (880,753 | ) |
| |
|
| |
|
| |
|
| |
|
| |
| | |
See notes to financial statements. | HSBC INVESTOR FAMILY OF FUNDS | 28 |
HSBC INVESTOR FAMILY OF FUNDS
Statements of Changes in Net Assets (continued)
| | | | | | | | | | | | | |
| | Overseas Equity Fund | | Value Fund | |
|
| | For the
year ended
October 31, 2010 | | For the
year ended
October 31, 2009 | | For the
year ended
October 31, 2010 | | For the
year ended
October 31, 2009 | |
|
Investment Activities: | | | | | | | | | | | | | |
Operations: | | | | | | | | | | | | | |
Net investment income (loss) | | $ | 61,975 | | $ | 96,154 | | $ | 153,770 | | $ | 294,429 | |
Net realized gains (losses) from investments transactions | | | (292,078 | ) | | (2,354,316 | ) | | 222,525 | | | (1,353,212 | ) |
Change in unrealized appreciation/depreciation from investments and foreign currencies | | | 543,769 | | | 3,553,124 | | | 3,453,894 | | | 5,610,790 | |
| |
|
| |
|
| |
|
| |
|
| |
Change in net assets resulting from operations | | | 313,666 | | | 1,294,962 | | | 3,830,189 | | | 4,552,007 | |
| |
|
| |
|
| |
|
| |
|
| |
| | | | | | | | | | | | | |
Dividends: | | | | | | | | | | | | | |
Net investment income: | | | | | | | | | | | | | |
Class A Shares | | | (97,964 | ) | | (374,072 | ) | | (47,448 | ) | | (155,138 | ) |
Class B Shares | | | (10,236 | ) | | (62,669 | ) | | — | | | (2,255 | ) |
Class C Shares | | | (616 | ) | | (2,972 | ) | | — | | | (298 | ) |
Class I Shares | | | — | | | — | | | (115,714 | ) | | (232,742 | ) |
Net realized gains: | | | | | | | | | | | | | |
Class A Shares | | | — | | | (2,912,698 | ) | | — | | | — | |
Class B Shares | | | — | | | (617,230 | ) | | — | | | — | |
Class C Shares | | | — | | | (28,817 | ) | | — | | | — | |
| |
|
| |
|
| |
|
| |
|
| |
Change in net assets resulting from shareholder dividends | | | (108,816 | ) | | (3,998,458 | ) | | (163,162 | ) | | (390,433 | ) |
| |
|
| |
|
| |
|
| |
|
| |
Change in net assets resulting from capital transactions | | | (981,210 | ) | | 1,710,202 | | | (1,252,262 | ) | | (7,588,940 | ) |
| |
|
| |
|
| |
|
| |
|
| |
Change in net assets | | | (776,360 | ) | | (993,294 | ) | | 2,414,765 | | | (3,427,366 | ) |
| | | | | | | | | | | | | |
Net Assets: | | | | | | | | | | | | | |
Beginning of period | | | 6,958,528 | | | 7,951,822 | | | 30,016,531 | | | 33,443,897 | |
| |
|
| |
|
| |
|
| |
|
| |
End of period | | $ | 6,182,168 | | $ | 6,958,528 | | $ | 32,431,296 | | $ | 30,016,531 | |
| |
|
| |
|
| |
|
| |
|
| |
Accumulated net investment income (loss) | | $ | 176,079 | | $ | 108,816 | | $ | — | | $ | 14,848 | |
| |
|
| |
|
| |
|
| |
|
| |
| | |
29 | HSBC INVESTOR FAMILY OF FUNDS | See notes to financial statements. |
HSBC INVESTOR FAMILY OF FUNDS
Statements of Changes in Net Assets (continued)
| | | | | | | | | | | | | |
| | Overseas Equity Fund | | Value Fund | |
|
| | For the
year ended
October 31, 2010 | | For the
year ended
October 31, 2009 | | For the
year ended
October 31, 2010 | | For the
year ended
October 31, 2009 | |
|
CAPITAL TRANSACTIONS: | | | | | | | | | | | | | |
Class A Shares: | | | | | | | | | | | | | |
Proceeds from shares issued | | $ | 583,913 | | $ | 405,226 | | $ | 710,206 | | $ | 493,761 | |
Dividends reinvested | | | 97,142 | | | 3,262,709 | | | 47,084 | | | 154,141 | |
Value of shares redeemed | | | (1,265,995 | ) | | (2,210,404 | ) | | (2,905,337 | ) | | (4,681,860 | ) |
| |
|
| |
|
| |
|
| |
|
| |
Class A Shares capital transactions | | | (584,940 | ) | | 1,457,531 | | | (2,148,047 | ) | | (4,033,958 | ) |
| |
|
| |
|
| |
|
| |
|
| |
| | | | | | | | | | | | | |
Class B Shares: | | | | | | | | | | | | | |
Proceeds from shares issued | | | 18,410 | | | 33,259 | | | 9,750 | | | 13,994 | |
Dividends reinvested | | | 10,191 | | | 667,369 | | | — | | | 2,250 | |
Value of shares redeemed | | | (421,250 | ) | | (468,176 | ) | | (270,952 | ) | | (336,758 | ) |
| |
|
| |
|
| |
|
| |
|
| |
Class B Shares capital transactions | | | (392,649 | ) | | 232,452 | | | (261,202 | ) | | (320,514 | ) |
| |
|
| |
|
| |
|
| |
|
| |
| | | | | | | | | | | | | |
Class C Shares: | | | | | | | | | | | | | |
Proceeds from shares issued | | | — | | | — | | | 110 | | | — | |
Dividends reinvested | | | 616 | | | 31,789 | | | — | | | 298 | |
Value of shares redeemed | | | (4,237 | ) | | (11,570 | ) | | (850 | ) | | (5,546 | ) |
| |
|
| |
|
| |
|
| |
|
| |
Class C Shares capital transactions | | | (3,621 | ) | | 20,219 | | | (740 | ) | | (5,248 | ) |
| |
|
| |
|
| |
|
| |
|
| |
| | | | | | | | | | | | | |
Class I Shares: | | | | | | | | | | | | | |
Proceeds from shares issued | | | — | | | — | | | 4,792,318 | | | 2,374,352 | |
Dividends reinvested | | | — | | | — | | | 104,270 | | | 209,767 | |
Value of shares redeemed | | | — | | | — | | | (3,738,861 | ) | | (5,813,339 | ) |
| |
|
| |
|
| |
|
| |
|
| |
Class I Shares capital transactions | | | — | | | — | | | 1,157,727 | | | (3,229,220 | ) |
| |
|
| |
|
| |
|
| |
|
| |
Change in net assets resulting from capital transactions | | $ | (981,210 | ) | $ | 1,710,202 | | $ | (1,252,262 | ) | $ | (7,588,940 | ) |
| |
|
| |
|
| |
|
| |
|
| |
| | | | | | | | | | | | | |
SHARE TRANSACTIONS: | | | | | | | | | | | | | |
Class A Shares: | | | | | | | | | | | | | |
Issued | | | 145,520 | | | 108,012 | | | 60,743 | | | 53,511 | |
Reinvested | | | 23,521 | | | 1,049,103 | | | 4,327 | | | 17,816 | |
Redeemed | | | (312,739 | ) | | (553,300 | ) | | (255,968 | ) | | (529,179 | ) |
| |
|
| |
|
| |
|
| |
|
| |
Change in Class A Shares | | | (143,698 | ) | | 603,815 | | | (190,898 | ) | | (457,852 | ) |
| |
|
| |
|
| |
|
| |
|
| |
|
Class B Shares: | | | | | | | | | | | | | |
Issued | | | 5,508 | | | 8,391 | | | 870 | | | 1,659 | |
Reinvested | | | 2,807 | | | 243,565 | | | — | | | 274 | |
Redeemed | | | (118,364 | ) | | (153,763 | ) | | (25,045 | ) | | (39,815 | ) |
| |
|
| |
|
| |
|
| |
|
| |
Change in Class B Shares | | | (110,049 | ) | | 98,193 | | | (24,175 | ) | | (37,882 | ) |
| |
|
| |
|
| |
|
| |
|
| |
| | | | | | | | | | | | | |
Class C Shares: | | | | | | | | | | | | | |
Reinvested | | | 156 | | | 10,703 | | | — | | | 36 | |
Redeemed | | | (1,132 | ) | | (3,505 | ) | | (80 | ) | | (751 | ) |
| |
|
| |
|
| |
|
| |
|
| |
Change in Class C Shares | | | (976 | ) | | 7,198 | | | (80 | ) | | (715 | ) |
| |
|
| |
|
| |
|
| |
|
| |
|
Class I Shares: | | | | | | | | | | | | | |
Issued | | | — | | | — | | | 418,459 | | | 249,723 | |
Reinvested | | | — | | | — | | | 9,616 | | | 24,319 | |
Redeemed | | | — | | | — | | | (330,213 | ) | | (677,423 | ) |
| |
|
| |
|
| |
|
| |
|
| |
Change in Class I Shares | | | — | | | — | | | 97,862 | | | (403,381 | ) |
| |
|
| |
|
| |
|
| |
|
| |
| | |
See notes to financial statements. | HSBC INVESTOR FAMILY OF FUNDS | 30 |
|
HSBC INVESTOR FUNDS—GROWTH FUND |
|
Financial Highlights |
|
Selected data for a share outstanding throughout the periods indicated. (a) |
| | | | | | | | | | | | | | | | | | | | | | | | | | | | | |
| | | | Investment Activities | | Dividends | | | |
| | | |
| |
| | | |
| | Net Asset
Value,
Beginning
of Period | | Net
Investment
Income
(Loss) | | Net Realized
and Unrealized
Gains
(Losses) from
Investment
Transactions | | Total from
Investment
Activities | | Net
Investment
Income | | Net
Realized
Gains from
Investment
Transactions | | Total
Dividends | | Net Asset
Value, End
of Period | |
|
|
|
|
|
|
|
|
|
|
|
|
|
|
|
|
|
|
CLASS A SHARES | | | | | | | | | | | | | | | | | | | | | | | | | |
Year Ended October 31, 2006 | | | $ | 14.12 | | | (0.02 | )* | | 0.99 | | | 0.97 | | | — | | | (0.23 | ) | | (0.23 | ) | | | $ | 14.86 | | |
Year Ended October 31, 2007 | | | | 14.86 | | | — | *(e) | | 4.23 | | | 4.23 | | | (0.01 | ) | | (1.13 | ) | | (1.14 | ) | | | | 17.95 | | |
Year Ended October 31, 2008 | | | | 17.95 | | | (0.05 | )* | | (6.51 | ) | | (6.56 | ) | | — | | | (0.84 | ) | | (0.84 | ) | | | | 10.55 | | |
Year Ended October 31, 2009 | | | | 10.55 | | | (0.04 | )* | | 2.03 | | | 1.99 | | | — | | | — | | | — | | | | | 12.54 | | |
Year Ended October 31, 2010 | | | | 12.54 | | | (0.07 | )* | | 2.55 | | | 2.48 | | | — | | | — | | | — | | | | | 15.02 | | |
|
|
|
|
|
|
|
|
|
|
|
|
|
|
|
|
|
|
|
|
|
|
|
|
|
|
|
|
|
|
CLASS B SHARES | | | | | | | | | | | | | | | | | | | | | | | | | | | | | |
Year Ended October 31, 2006 | | | $ | 13.57 | | | (0.12 | )* | | 0.95 | | | 0.83 | | | — | | | (0.23 | ) | | (0.23 | ) | | | $ | 14.17 | | |
Year Ended October 31, 2007 | | | | 14.17 | | | (0.11 | )* | | 3.99 | | | 3.88 | | | — | | | (1.13 | ) | | (1.13 | ) | | | | 16.92 | | |
Year Ended October 31, 2008 | | | | 16.92 | | | (0.16 | )* | | (6.07 | ) | | (6.23 | ) | | — | | | (0.84 | ) | | (0.84 | ) | | | | 9.85 | | |
Year Ended October 31, 2009 | | | | 9.85 | | | (0.10 | )* | | 1.85 | | | 1.75 | | | — | | | — | | | — | | | | | 11.60 | | |
Year Ended October 31, 2010 | | | | 11.60 | | | (0.16 | )* | | 2.36 | | | 2.20 | | | — | | | — | | | — | | | | | 13.80 | | |
|
|
|
|
|
|
|
|
|
|
|
|
|
|
|
|
|
|
|
|
|
|
|
|
|
|
|
|
|
|
CLASS C SHARES | | | | | | | | | | | | | | | | | | | | | | | | | | | | | |
Year Ended October 31, 2006 | | | $ | 13.64 | | | (0.16 | )* | | 0.99 | | | 0.83 | | | — | | | (0.23 | ) | | (0.23 | ) | | | $ | 14.24 | | |
Year Ended October 31, 2007 | | | | 14.24 | | | (0.11 | )* | | 4.02 | | | 3.91 | | | — | | | (1.13 | ) | | (1.13 | ) | | | | 17.02 | | |
Year Ended October 31, 2008 | | | | 17.02 | | | (0.16 | )* | | (6.11 | ) | | (6.27 | ) | | — | | | (0.84 | ) | | (0.84 | ) | | | | 9.91 | | |
Year Ended October 31, 2009 | | | | 9.91 | | | (0.12 | )* | | 1.89 | | | 1.77 | | | — | | | — | | | — | | | | | 11.68 | | |
Year Ended October 31, 2010 | | | | 11.68 | | | (0.17 | )* | | 2.38 | | | 2.21 | | | — | | | — | | | — | | | | | 13.89 | | |
|
|
|
|
|
|
|
|
|
|
|
|
|
|
|
|
|
|
|
|
|
|
|
|
|
|
|
|
|
|
CLASS I SHARES | | | | | | | | | | | | | | | | | | | | | | | | | | | | | |
Year Ended October 31, 2006 | | | $ | 14.12 | | | 0.02 | * | | 0.99 | | | 1.01 | | | — | | | (0.23 | ) | | (0.23 | ) | | | $ | 14.90 | | |
Year Ended October 31, 2007 | | | | 14.90 | | | 0.03 | * | | 4.24 | | | 4.27 | | | (0.02 | ) | | (1.13 | ) | | (1.15 | ) | | | | 18.02 | | |
Year Ended October 31, 2008 | | | | 18.02 | | | (0.02 | )* | | (6.54 | ) | | (6.56 | ) | | — | | | (0.84 | ) | | (0.84 | ) | | | | 10.62 | | |
Year Ended October 31, 2009 | | | | 10.62 | | | (0.01 | )* | | 2.04 | | | 2.03 | | | — | | | — | | | — | | | | | 12.65 | | |
Year Ended October 31, 2010 | | | | 12.65 | | | (0.04 | )* | | 2.58 | | | 2.54 | | | — | | | — | | | — | | | | | 15.19 | | |
|
|
|
|
|
|
|
|
|
|
|
|
|
|
|
|
|
|
|
|
|
|
|
|
|
|
|
|
|
|
| | | | | | | | | | | | | | | | | | | | | |
| | | | Ratios/Supplementary Data | |
| | | |
| |
| | Total
Return(b) | | Net Assets
at End of
Period
(000’s) | | Ratio of Net
Expenses to
Average Net
Assets | | Ratio of Net
Investment
Income
(Loss) to
Average
Net Assets | | Ratio of
Expenses to
Average Net
Assets(c) | | Portfolio
Turnover(d) | |
|
|
|
|
|
|
|
|
|
|
|
|
|
|
CLASS A SHARES | | | | | | | | | | | | | | | | | | | |
Year Ended October 31, 2006 | | 6.92 | % | | | $ | 21,985 | | | 1.20 | % | | (0.14 | )% | | 1.44 | % | | 75.06 | % | |
Year Ended October 31, 2007 | | 30.45 | %(f) | | | | 30,858 | | | 1.11 | %(f) | | (0.03 | )%(f) | | 1.22 | % | | 57.04 | % | |
Year Ended October 31, 2008 | | (38.23 | )%(g) | | | | 17,180 | | | 1.20 | % | | (0.36 | )% | | 1.22 | % | | 157.87 | % | |
Year Ended October 31, 2009 | | 18.86 | %(h) | | | | 15,896 | | | 1.20 | % | | (0.33 | )% | | 1.31 | % | | 65.67 | % | |
Year Ended October 31, 2010 | | 19.78 | %(i)(j) | | | | 16,452 | | | 1.20 | % | | (0.54 | )%(j) | | 1.23 | % | | 89.14 | % | |
|
|
|
|
|
|
|
|
|
|
|
|
|
|
|
|
|
|
|
|
|
|
CLASS B SHARES | | | | | | | | | | | | | | | | | | | | | |
Year Ended October 31, 2006 | | 6.16 | % | | | $ | 1,446 | | | 1.95 | % | | (0.88 | )% | | 2.19 | % | | 75.06 | % | |
Year Ended October 31, 2007 | | 29.43 | %(f) | | | | 1,630 | | | 1.86 | %(f) | | (0.78 | )%(f) | | 1.98 | % | | 57.04 | % | |
Year Ended October 31, 2008 | | (38.62 | )%(g) | | | | 2,839 | | | 1.95 | % | | (1.20 | )% | | 1.96 | % | | 157.87 | % | |
Year Ended October 31, 2009 | | 17.87 | %(h) | | | | 2,059 | | | 1.95 | % | | (1.06 | )% | | 2.06 | % | | 65.67 | % | |
Year Ended October 31, 2010 | | 18.97 | %(i)(j) | | | | 1,213 | | | 1.95 | % | | (1.28 | )%(j) | | 1.98 | % | | 89.14 | % | |
|
|
|
|
|
|
|
|
|
|
|
|
|
|
|
|
|
|
|
|
|
|
CLASS C SHARES | | | | | | | | | | | | | | | | | | | | | |
Year Ended October 31, 2006 | | 6.13 | % | | | $ | 270 | | | 1.95 | % | | (0.89 | )% | | 2.18 | % | | 75.06 | % | |
Year Ended October 31, 2007 | | 29.49 | %(f) | | | | 98 | | | 1.86 | %(f) | | (0.79 | )%(f) | | 1.96 | % | | 57.04 | % | |
Year Ended October 31, 2008 | | (38.63 | )%(g) | | | | 72 | | | 1.95 | % | | (1.13 | )% | | 1.97 | % | | 157.87 | % | |
Year Ended October 31, 2009 | | 17.86 | %(h) | | | | 120 | | | 1.95 | % | | (1.12 | )% | | 2.05 | % | | 65.67 | % | |
Year Ended October 31, 2010 | | 18.92 | %(i)(j) | | | | 184 | | | 1.95 | % | | (1.30 | )%(j) | | 1.99 | % | | 89.14 | % | |
|
|
|
|
|
|
|
|
|
|
|
|
|
|
|
|
|
|
|
|
|
|
CLASS I SHARES | | | | | | | | | | | | | | | | | | | | | |
Year Ended October 31, 2006 | | 7.21 | % | | | $ | 15,042 | | | 0.95 | % | | 0.12 | % | | 1.19 | % | | 75.06 | % | |
Year Ended October 31, 2007 | | 30.73 | %(f) | | | | 30,295 | | | 0.87 | %(f) | | 0.20 | %(f) | | 0.96 | % | | 57.04 | % | |
Year Ended October 31, 2008 | | (38.07 | )%(g) | | | | 38,868 | | | 0.95 | % | | (0.16 | )% | | 0.97 | % | | 157.87 | % | |
Year Ended October 31, 2009 | | 19.11 | %(h) | | | | 39,400 | | | 0.95 | % | | (0.08 | )% | | 1.06 | % | | 65.67 | % | |
Year Ended October 31, 2010 | | 20.08 | %(i)(j) | | | | 49,474 | | | 0.95 | % | | (0.30 | )%(j) | | 0.99 | % | | 89.14 | % | |
|
|
|
|
|
|
|
|
|
|
|
|
|
|
|
|
|
|
|
|
|
|
| |
* | Calculated based on average shares outstanding. |
| |
(a) | The per share amounts and percentages reflect income and expenses assuming the inclusion of the Fund’s proporationate share of the income and expenses of the HSBC Investor Growth Portfolio. |
| |
(b) | Total return calculations do not include any sales or redemption charges. |
| |
(c) | Excludes fee reductions. If such fee reductions had not occurred, the ratio would have been as indicated. |
| |
(d) | Portfolio Turnover rate is calculated on the basis of the respective Portfolio in which the Fund invests all its investable assets. Portfolio turnover rate is calculated on the basis of the Fund as a whole without distinguishing between the classes of shares issued. |
| |
(e) | Represents less than $0.005 or $(0.005). |
| |
(f) | During the year ended October 31, 2007, the Investment Adviser reimbursed amounts to certain Funds (including the Fund) related to past marketing arrangements. The corresponding impact to the net expense ratio, net income ratio, and the total returns were 0.09%, 0.09%, 0.09%, and 0.08%, for Class A Shares, Class B Shares, Class C Shares, and Class I Shares, respectively. |
| |
(g) | During the year ended October 31, 2008, the respective Portfolio in which the Fund invests received monies related to certain nonrecurring litigation settlements. The corresponding impact to the total return was 0.19%, 0.19%, 0.19%, and 0.19%, for Class A Shares, Class B Shares, Class C Shares, and Class I Shares, respectively. |
| |
(h) | During the year ended October 31, 2009, the respective Portfolio in which the Fund invests received monies related to certain nonrecurring litigation settlements. The corresponding impact to the total return was 0.50%, 0.54%, 0.53%, and 0.49%, for Class A Shares, Class B Shares, Class C Shares, and Class I Shares, respectively. |
| |
(i) | During the year ended October 31, 2010, the respective Portfolio in which the Fund invests received monies related to certain nonrecurring litigation settlements. The corresponding impact to the total return was 0.17%, 0.17%, 0.17% and 0.17% for Class A Shares, Class B Shares, Class C Shares, and Class I Shares. |
| |
(j) | During the year ended October 31, 2010, certain Funds (including the Fund) received a distribution from a “fair fund” established by the SEC in connection with a consent order against BISYS Fund Services, Inc. (See Note 7 in Notes to Financial Statements). The corresponding impact to the net income ratio and the total return was 0.02%, 0.02%, 0.02% and 0.02% for Class A Shares, Class B Shares, Class C Shares and Class I Shares, respectively. |
| | |
31 | HSBC INVESTOR FAMILY OF FUNDS | See notes to financial statements. |
|
HSBC INVESTOR ADVISORS TRUST—INTERNATIONAL EQUITY FUND |
|
Financial Highlights |
|
Selected data for a share outstanding throughout the periods indicated. (a) |
| | | | | | | | | | | | | | | | | | | | | | | | | | |
| | | | Investment Activities | | Dividends | | | |
| | | |
| |
| | | |
| | Net Asset
Value,
Beginning
of Period | | Net
Investment
Income
(Loss) | | Net Realized
and Unrealized
Gains
(Losses) from
Investment
Transactions | | Total from
Investment
Activities | | Net
Investment
Income | | Net
Realized
Gains from
Investment
Transactions | | Total
Dividends | | Net Asset
Value, End
of Period | |
|
|
|
|
|
|
|
|
|
|
|
|
|
|
|
|
|
|
CLASS I SHARES | | | | | | | | | | | | | | | | | | | | | | |
Year Ended October 31, 2006 | | | $ | 17.54 | | | 0.38 | | 5.14 | | | 5.52 | | | (0.36) | | (0.60 | ) | | (0.96) | | | $ | 22.10 | | |
Year Ended October 31, 2007 | | | | 22.10 | | | 0.50 | | 4.69 | | | 5.19 | | | (0.55) | | (1.84 | ) | | (2.39) | | | | 24.90 | | |
Year Ended October 31, 2008 | | | | 24.90 | | | 0.53 | | (12.41 | ) | | (11.88 | ) | | (0.39) | | (1.90 | ) | | (2.29) | | | | 10.73 | | |
Year Ended October 31, 2009 | | | | 10.73 | | | 0.28 | | 2.31 | | | 2.59 | | | (0.54) | | (0.62 | ) | | (1.16) | | | | 12.16 | | |
Year Ended October 31, 2010 | | | | 12.16 | | | 2.25 | | (1.53 | ) | | 0.72 | | | (0.19) | | — | | | (0.19) | | | | 12.69 | | |
|
|
|
|
|
|
|
|
|
|
|
|
|
|
|
|
|
|
|
|
|
|
|
|
|
|
|
| | | | | | | | | | | | | | | | | | |
| | | | Ratios/Supplementary Data | |
| | | |
| |
| | Total
Return(b) | | Net Assets
at End of
Period
(000’s) | | Ratio of Net
Expenses to
Average Net
Assets | | Ratio of Net
Investment
Income to
Average
Net Assets | | Ratio of
Expenses to
Average Net
Assets(c) | | Portfolio
Turnover(d) | |
|
|
|
|
|
|
|
|
|
|
|
|
|
|
CLASS I SHARES | | | | | | | | | | | | | | | | | | |
Year Ended October 31, 2006 | | 32.70 | % | | $ 283,749 | | 0.97 | % | | 2.02 | % | | 0.97% | | 33.39% | |
Year Ended October 31, 2007 | | 25.41 | %(e)(f) | | | 385,717 | | 0.87 | %(e) | | 2.15 | %(e) | | 0.89% | | 26.08% | |
Year Ended October 31, 2008 | | (51.92 | )% | | | 161,053 | | 0.84 | % | | 2.69 | % | | 0.84% | | 28.98% | |
Year Ended October 31, 2009 | | 27.90 | % | | | 180,242 | | 0.97 | % | | 2.27 | % | | 0.97% | | 58.31% | |
Year Ended October 31, 2010 | | 5.99 | %(g)(h) | | | 13,767 | | 0.87 | % | | 2.27 | %(h) | | 0.90% | | 63.35% | |
|
|
|
|
|
|
|
|
|
|
|
|
|
|
|
|
|
|
| |
(a) | The per share amounts and percentages reflect income and expenses assuming the inclusion of the Fund’s proporationate share of the income and expenses of the HSBC Investor International Equity Portfolio. |
| |
(b) | Total return calculations do not include any sales or redemption charges. |
| |
(c) | Excludes fee reductions. If such fee reductions had not occurred, the ratio would have been as indicated. |
| |
(d) | Portfolio Turnover rate is calculated on the basis of the respective Portfolio in which the Fund invests all its investable assets. Portfolio turnover rate is calculated on the basis of the Fund as a whole without distinguishing between the classes of shares issued. |
| |
(e) | During the year ended October 31, 2007, the Investment Adviser reimbursed amounts to certain Funds (including the Fund) related to past marketing arrangements. The corresponding impact to the net expense ratio, net income ratio, and the total returns were 0.02% for Class I Shares. |
| |
(f) | During the year ended October 31, 2007, the respective Portfolio in which the Fund invests received monies related to certain nonrecurring litigation settlements. The corresponding impact to the total return was 0.18% for Class I Shares. |
| |
(g) | During the year ended October 31, 2010, the respective Portfolio in which the Fund invests received monies related to certain nonrecurring litigation settlements. The corresponding impact of the total return was 0.32% for Class I Shares. |
| |
(h) | During the year ended October 31, 2010, certain Funds (including the Fund) received a distribution from a “fair fund” established by the SEC in connection with a consent order against BISYS Fund Services, Inc.(See Note 7 in Notes to Financial Statements). The corresponding impact to the net income ratio and total return was 0.01% and 0.06%, respectively, for Class I Shares. |
| | |
See notes to financial statements. | HSBC INVESTOR FAMILY OF FUNDS | 32 |
|
HSBC INVESTOR FUNDS—MID-CAP FUND |
|
Financial Highlights |
Selected data for a share outstanding throughout the periods indicated.
| | | | | | | | | | | | | | | | | | | | | | | | | | | | | |
| | | | | Investment Activities | | Dividends | | | | |
| | | | |
| |
| | | | |
| | Net Asset
Value,
Beginning
of Period | | Net
Investment
Income
(Loss) | | Net Realized
and Unrealized
Gains
(Losses) from
Investment
Transactions | | Total from
Investment
Activities | | Net
Investment
Income | | Net Realized
Gains from
Investment
Transactions | | Total
Dividends | | Net Asset
Value, End
of Period | |
|
|
|
|
|
|
|
|
|
|
|
|
|
|
|
|
|
|
CLASS A SHARES | | | | | | | | | | | | | | | | | | | | | | | | | |
Year Ended October 31, 2006 | | | $ | 9.87 | | | — | *(d) | | 1.19 | | | 1.19 | | | — | | | (2.18 | ) | | (2.18 | ) | | | $ | 8.88 | | |
Year Ended October 31, 2007 | | | | 8.88 | | | (0.04 | )* | | 2.59 | | | 2.55 | | | — | | | (0.62 | ) | | (0.62 | ) | | | | 10.81 | | |
Year Ended October 31, 2008 | | | | 10.81 | | | (0.03 | )* | | (4.17 | ) | | (4.20 | ) | | — | | | (1.23 | ) | | (1.23 | ) | | | | 5.38 | | |
Year Ended October 31, 2009 | | | | 5.38 | | | 0.01 | * | | 0.73 | | | 0.74 | | | — | | | (0.44 | ) | | (0.44 | ) | | | | 5.68 | | |
Year Ended October 31, 2010 | | | | 5.68 | | | (0.01 | )* | | 1.44 | | | 1.43 | | | (0.01 | ) | | — | | | (0.01 | ) | | | | 7.10 | | |
|
|
|
|
|
|
|
|
|
|
|
|
|
|
|
|
|
|
|
|
|
|
|
|
|
|
|
|
|
|
CLASS B SHARES | | | | | | | | | | | | | | | | | | | | | | | | | | | | | |
Year Ended October 31, 2006 | | | $ | 9.48 | | | (0.06 | )* | | 1.13 | | | 1.07 | | | — | | | (2.18 | ) | | (2.18 | ) | | | $ | 8.37 | | |
Year Ended October 31, 2007 | | | | 8.37 | | | (0.10 | )* | | 2.42 | | | 2.32 | | | — | | | (0.62 | ) | | (0.62 | ) | | | | 10.07 | | |
Year Ended October 31, 2008 | | | | 10.07 | | | (0.09 | )* | | (3.83 | ) | | (3.92 | ) | | — | | | (1.23 | ) | | (1.23 | ) | | | | 4.92 | | |
Year Ended October 31, 2009 | | | | 4.92 | | | (0.02 | )* | | 0.65 | | | 0.63 | | | — | | | (0.44 | ) | | (0.44 | ) | | | | 5.11 | | |
Year Ended October 31, 2010 | | | | 5.11 | | | (0.05 | )* | | 1.29 | | | 1.24 | | | — | | | — | | | — | | | | | 6.35 | | |
|
|
|
|
|
|
|
|
|
|
|
|
|
|
|
|
|
|
|
|
|
|
|
|
|
|
|
|
|
|
CLASS C SHARES | | | | | | | | | | | | | | | | | | | | | | | | | | | | | |
Year Ended October 31, 2006 | | | $ | 9.54 | | | (0.06 | )* | | 1.15 | | | 1.09 | | | — | | | (2.18 | ) | | (2.18 | ) | | | $ | 8.45 | | |
Year Ended October 31, 2007 | | | | 8.45 | | | (0.10 | )* | | 2.43 | | | 2.33 | | | — | | | (0.62 | ) | | (0.62 | ) | | | | 10.16 | | |
Year Ended October 31, 2008 | | | | 10.16 | | | (0.10 | )* | | (3.86 | ) | | (3.96 | ) | | — | | | (1.23 | ) | | (1.23 | ) | | | | 4.97 | | |
Year Ended October 31, 2009 | | | | 4.97 | | | (0.02 | )* | | 0.66 | | | 0.64 | | | — | | | (0.44 | ) | | (0.44 | ) | | | | 5.17 | | |
Year Ended October 31, 2010 | | | | 5.17 | | | (0.05 | )* | | 1.30 | | | 1.25 | | | — | | | — | | | — | | | | | 6.42 | | |
|
|
|
|
|
|
|
|
|
|
|
|
|
|
|
|
|
|
|
|
|
|
|
|
|
|
|
|
|
|
CLASS I SHARES | | | | | | | | | | | | | | | | | | | | | | | | | | | | | |
Year Ended October 31, 2006 | | | $ | 9.98 | | | 0.03 | * | | 1.20 | | | 1.23 | | | — | | | (2.18 | ) | | (2.18 | ) | | | $ | 9.03 | | |
Year Ended October 31, 2007 | | | | 9.03 | | | (0.02 | )* | | 2.64 | | | 2.62 | | | — | | | (0.62 | ) | | (0.62 | ) | | | | 11.03 | | |
Year Ended October 31, 2008 | | | | 11.03 | | | (0.01 | )* | | (4.28 | ) | | (4.29 | ) | | — | | | (1.23 | ) | | (1.23 | ) | | | | 5.51 | | |
Year Ended October 31, 2009 | | | | 5.51 | | | 0.03 | * | | 0.75 | | | 0.78 | | | — | | | (0.44 | ) | | (0.44 | ) | | | | 5.85 | | |
Year Ended October 31, 2010 | | | | 5.85 | | | 0.01 | * | | 1.48 | | | 1.49 | | | (0.03 | ) | | — | | | (0.03 | ) | | | | 7.31 | | |
|
|
|
|
|
|
|
|
|
|
|
|
|
|
|
|
|
|
|
|
|
|
|
|
|
|
|
|
|
|
| | | | | | | | | | | | | | | | | | | | | |
| | | | | Ratios/Supplementary Data | |
| | | | |
| |
| | Total
Return(a) | | Net Assets
at End of
Period
(000’s) | | Ratio of Net
Expenses to
Average Net
Assets | | Ratio of Net
Investment
Income
(Loss) to
Average
Net Assets | | Ratio of
Expenses to
Average Net
Assets(b) | | Portfolio
Turnover(c) | |
|
|
|
|
|
|
|
|
|
|
|
|
|
|
CLASS A SHARES | | | | | | | | | | | | | | | | | | | |
Year Ended October 31, 2006 | | 13.66 | % | | | $ | 3,185 | | | 1.48 | % | | (0.01 | )% | | 1.85 | % | | 53.16 | % | |
Year Ended October 31, 2007 | | 30.51 | %(e) | | | | 5,897 | | | 1.19 | %(e) | | (0.45 | )%(e) | | 1.70 | % | | 66.16 | % | |
Year Ended October 31, 2008 | | (43.49 | )% | | | | 3,584 | | | 1.35 | % | | (0.36 | )% | | 1.80 | % | | 64.65 | % | |
Year Ended October 31, 2009 | | 16.07 | %(f) | | | | 4,186 | | | 1.35 | % | | 0.22 | % | | 2.17 | % | | 46.49 | % | |
Year Ended October 31, 2010 | | 25.14 | %(g)(h) | | | | 5,126 | | | 1.35 | % | | (0.11 | )%(h) | | 2.03 | % | | 71.38 | % | |
|
|
|
|
|
|
|
|
|
|
|
|
|
|
|
|
|
|
|
|
|
|
CLASS B SHARES | | | | | | | | | | | | | | | | | | | | | |
Year Ended October 31, 2006 | | 12.78 | % | | | $ | 7,425 | | | 2.25 | % | | (0.72 | )% | | 2.60 | % | | 53.16 | % | |
Year Ended October 31, 2007 | | 29.56 | %(e) | | | | 6,285 | | | 1.92 | %(e) | | (1.15 | )%(e) | | 2.48 | % | | 66.16 | % | |
Year Ended October 31, 2008 | | (43.97 | )% | | | | 1,975 | | | 2.09 | % | | (1.15 | )% | | 2.51 | % | | 64.65 | % | |
Year Ended October 31, 2009 | | 15.26 | %(f) | | | | 1,574 | | | 2.10 | % | | (0.48 | )% | | 2.94 | % | | 46.49 | % | |
Year Ended October 31, 2010 | | 24.27 | %(g)(h) | | | | 976 | | | 2.10 | % | | (0.83 | )%(h) | | 2.77 | % | | 71.38 | % | |
|
|
|
|
|
|
|
|
|
|
|
|
|
|
|
|
|
|
|
|
|
|
CLASS C SHARES | | | | | | | | | | | | | | | | | | | | | |
Year Ended October 31, 2006 | | 12.93 | % | | | $ | 95 | | | 2.25 | % | | (0.72 | )% | | 2.60 | % | | 53.16 | % | |
Year Ended October 31, 2007 | | 29.40 | %(e) | | | | 79 | | | 1.93 | %(e) | | (1.16 | )%(e) | | 2.46 | % | | 66.16 | % | |
Year Ended October 31, 2008 | | (43.97 | )% | | | | 12 | | | 2.09 | % | | (1.20 | )% | | 2.49 | % | | 64.65 | % | |
Year Ended October 31, 2009 | | 15.30 | %(f) | | | | 13 | | | 2.10 | % | | (0.53 | )% | | 2.91 | % | | 46.49 | % | |
Year Ended October 31, 2010 | | 24.18 | %(g)(h) | | | | 21 | | | 2.10 | % | | (0.86) | %(h) | | 2.79 | % | | 71.38 | % | |
|
|
|
|
|
|
|
|
|
|
|
|
|
|
|
|
|
|
|
|
|
|
CLASS I SHARES | | | | | | | | | | | | | | | | | | | | | |
Year Ended October 31, 2006 | | 13.97 | % | | | $ | 17,029 | | | 1.26 | % | | 0.29 | % | | 1.60 | % | | 53.16 | % | |
Year Ended October 31, 2007 | | 30.80 | %(e) | | | | 20,671 | | | 0.93 | %(e) | | (0.19) | %(e) | | 1.47 | % | | 66.16 | % | |
Year Ended October 31, 2008 | | (43.44 | )% | | | | 11,080 | | | 1.10 | % | | (0.12 | )% | | 1.54 | % | | 64.65 | % | |
Year Ended October 31, 2009 | | 16.42 | %(f) | | | | 7,432 | | | 1.10 | % | | 0.51 | % | | 1.95 | % | | 46.49 | % | |
Year Ended October 31, 2010 | | 25.48 | %(g)(h) | | | | 9,368 | | | 1.10 | % | | 0.14 | %(h) | | 1.77 | % | | 71.38 | % | |
|
|
|
|
|
|
|
|
|
|
|
|
|
|
|
|
|
|
|
|
|
|
| |
* | Calculated based on average shares outstanding. |
| |
(a) | Total return calculations do not include any sales or redemption charges. |
| |
(b) | Excludes fee reductions. If such fee reductions had not occurred, the ratio would have been as indicated. |
| |
(c) | Portfolio turnover rate is calculated on the basis of the Fund as a whole without distinguishing between the classes of shares issued. |
| |
(d) | Represents less than $0.005 or $(0.005). |
| |
(e) | During the year ended October 31, 2007, the Investment Adviser reimbursed amounts to certain Funds (including the Fund) related to past marketing arrangements. The corresponding impact to the net expense ratio, net income ratio, and the total returns were 0.10%, 0.10%, 0.10%, and 0.09%, for Class A Shares, Class B Shares, Class C Shares, and Class I Shares, respectively. |
| |
(f) | During the year ended October 31, 2009, the respective Portfolio in which the Fund invests received monies related to certain nonrecurring litigation settlements. The corresponding impact to the total return was 0.04%, 0.04%, 0.04%, and 0.04%, for Class A Shares, Class B Shares, Class C Shares, and Class I Shares, respectively. |
| |
(g) | During the year ended October 31, 2010, the respective Portfolio in which the Fund invests received monies related to certain nonrecurring litigation settlements. The corresponding impact to the total return was 0.24%, 0.24%, 0.24% and 0.24% for Class A Shares, Class B Shares, Class C Shares, and Class I Shares, respectively. |
| |
(h) | During the year ended October 31, 2010, certain Funds (including the Fund) received a distribution from a “fair fund” established by the SEC in connection with a consent order against BISYS Fund Services, Inc. (See Note 7 in Notes to Financial Statements). The corresponding impact to the net income ratio was 0.03%, 0.03%, 0.03% and 0.03% for Class A Shares, Class B Shares, Class C Shares, and Class I Shares, respectively. The corresponding impact to the total return was less than 0.005%. |
| | |
33 | HSBC INVESTOR FAMILY OF FUNDS | See notes to financial statements. |
|
HSBC INVESTOR FUNDS—OPPORTUNITY FUND |
|
Financial Highlights |
Selected data for a share outstanding throughout the periods indicated. (a)
| | | | | | | | | | | | | | | | | | | | | | | | | | |
| | | | | Investment Activities | | Dividends | | | | |
| | | | |
| |
| | | | |
| | Net Asset
Value,
Beginning
of Period | | Net
Investment
Income
(Loss) | | Net Realized
and Unrealized
Gains
(Losses) from
Investment
Transactions | | Total from
Investment
Activities | | Net
Realized
Gains from
Investment
Transactions | | Total
Dividends | | Net Asset
Value, End
of Period | |
|
|
|
|
|
|
|
|
|
|
|
|
|
|
|
|
CLASS A SHARES | | | | | | | | | | | | | | | | | | | | | | |
Year Ended October 31, 2006 | | | $ | 12.39 | | | (0.14 | )* | | 2.43 | | | 2.29 | | | (0.39 | ) | | (0.39 | ) | | | $ | 14.29 | | |
Year Ended October 31, 2007 | | | | 14.29 | | | (0.16 | )* | | 4.01 | | | 3.85 | | | (1.73 | ) | | (1.73 | ) | | | | 16.41 | | |
Year Ended October 31, 2008 | | | | 16.41 | | | (0.12 | )* | | (4.04 | ) | | (4.16 | ) | | (5.16 | ) | | (5.16 | ) | | | | 7.09 | | |
Year Ended October 31, 2009 | | | | 7.09 | | | (0.07 | )* | | 0.97 | | | 0.90 | | | (0.43 | ) | | (0.43 | ) | | | | 7.56 | | |
Year Ended October 31, 2010 | | | | 7.56 | | | (0.09 | )* | | 2.20 | | | 2.11 | | | — | | | — | | | | | 9.67 | | |
|
|
|
|
|
|
|
|
|
|
|
|
|
|
|
|
|
|
|
|
|
|
|
|
|
|
|
CLASS B SHARES | | | | | | | | | | | | | | | | | | | | | | | | | | |
Year Ended October 31, 2006 | | | $ | 11.60 | | | (0.23 | )* | | 2.27 | | | 2.04 | | | (0.39 | ) | | (0.39 | ) | | | $ | 13.25 | | |
Year Ended October 31, 2007 | | | | 13.25 | | | (0.25 | )* | | 3.67 | | | 3.42 | | | (1.73 | ) | | (1.73 | ) | | | | 14.94 | | |
Year Ended October 31, 2008 | | | | 14.94 | | | (0.18 | )* | | (3.50 | ) | | (3.68 | ) | | (5.16 | ) | | (5.16 | ) | | | | 6.10 | | |
Year Ended October 31, 2009 | | | | 6.10 | | | (0.10 | )* | | 0.80 | | | 0.70 | | | (0.43 | ) | | (0.43 | ) | | | | 6.37 | | |
Year Ended October 31, 2010 | | | | 6.37 | | | (0.13 | )* | | 1.85 | | | 1.72 | | | — | | | — | | | | | 8.09 | | |
|
|
|
|
|
|
|
|
|
|
|
|
|
|
|
|
|
|
|
|
|
|
|
|
|
|
|
CLASS C SHARES | | | | | | | | | | | | | | | | | | | | | | | | | | |
Year Ended October 31, 2006 | | | $ | 11.71 | | | (0.23 | )* | | 2.29 | | | 2.06 | | | (0.39 | ) | | (0.39 | ) | | | $ | 13.38 | | |
Year Ended October 31, 2007 | | | | 13.38 | | | (0.26 | )* | | 3.72 | | | 3.46 | | | (1.73 | ) | | (1.73 | ) | | | | 15.11 | | |
Year Ended October 31, 2008 | | | | 15.11 | | | (0.17 | )* | | (3.57 | ) | | (3.74 | ) | | (5.16 | ) | | (5.16 | ) | | | | 6.21 | | |
Year Ended October 31, 2009 | | | | 6.21 | | | (0.10 | )* | | 0.81 | | | 0.71 | | | (0.43 | ) | | (0.43 | ) | | | | 6.49 | | |
Year Ended October 31, 2010 | | | | 6.49 | | | (0.13 | )* | | 1.89 | | | 1.76 | | | — | | | — | | | | | 8.25 | | |
|
|
|
|
|
|
|
|
|
|
|
|
|
|
|
|
|
|
|
|
|
|
|
|
|
|
|
| | | | | | | | | | | | | | | | | | | | | |
| | | | | Ratios/Supplementary Data | |
| | | | |
| |
| | Total
Return(b) | | Net Assets
at End of
Period
(000’s) | | Ratio of Net
Expenses to
Average Net
Assets | | Ratio of Net
Investment
Income
(Loss) to
Average
Net Assets | | Ratio of
Expenses to
Average Net
Assets(c) | | Portfolio
Turnover(d) | |
|
|
|
|
|
|
|
|
|
|
|
|
|
|
CLASS A SHARES | | | | | | | | | | | | | | | | | | | |
Year Ended October 31, 2006 | | 18.81 | % | | | $ | 24,463 | | | 1.55 | % | | (1.04 | )% | | 1.70 | % | | 60.83 | % | |
Year Ended October 31, 2007 | | 30.28 | %(e) | | | | 15,057 | | | 1.52 | %(e) | | (1.13 | )%(e) | | 1.77 | % | | 69.41 | % | |
Year Ended October 31, 2008 | | (35.84 | )% | | | | 9,600 | | | 1.55 | % | | (1.13 | )% | | 1.82 | % | | 80.42 | % | |
Year Ended October 31, 2009 | | 14.85 | % | | | | 9,687 | | | 1.55 | % | | (1.02 | )% | | 2.30 | % | | 64.91 | % | |
Year Ended October 31, 2010 | | 27.91 | %(f)(g) | | | | 11,282 | | | 1.55 | % | | (1.00 | )%(g) | | 2.07 | % | | 67.62 | % | |
|
|
|
|
|
|
|
|
|
|
|
|
|
|
|
|
|
|
|
|
|
|
CLASS B SHARES | | | | | | | | | | | | | | | | | | | | | |
Year Ended October 31, 2006 | | 17.91 | % | | | $ | 4,768 | | | 2.30 | % | | (1.79 | )% | | 2.45 | % | | 60.83 | % | |
Year Ended October 31, 2007 | | 29.30 | %(e) | | | | 4,928 | | | 2.26 | %(e) | | (1.91 | )%(e) | | 2.52 | % | | 69.41 | % | |
Year Ended October 31, 2008 | | (36.30 | )% | | | | 1,578 | | | 2.29 | % | | (1.88 | )% | | 2.58 | % | | 80.42 | % | |
Year Ended October 31, 2009 | | 13.92 | % | | | | 1,082 | | | 2.30 | % | | (1.77 | )% | | 3.10 | % | | 64.91 | % | |
Year Ended October 31, 2010 | | 27.00 | %(f)(g) | | | | 658 | | | 2.30 | % | | (1.78 | )%(g) | | 2.86 | % | | 67.62 | % | |
|
|
|
|
|
|
|
|
|
|
|
|
|
|
|
|
|
|
|
|
|
|
CLASS C SHARES | | | | | | | | | | | | | | | | | | | | | |
Year Ended October 31, 2006 | | 17.92 | % | | | $ | 299 | | | 2.30 | % | | (1.78 | )% | | 2.45 | % | | 60.83 | % | |
Year Ended October 31, 2007 | | 29.32 | %(e) | | | | 334 | | | 2.27 | %(e) | | (1.91 | )%(e) | | 2.50 | % | | 69.41 | % | |
Year Ended October 31, 2008 | | (36.27 | )% | | | | 189 | | | 2.30 | % | | (1.88 | )% | | 2.58 | % | | 80.42 | % | |
Year Ended October 31, 2009 | | 13.83 | % | | | | 267 | | | 2.30 | % | | (1.78 | )% | | 3.08 | % | | 64.91 | % | |
Year Ended October 31, 2010 | | 27.12 | %(f)(g) | | | | 341 | | | 2.30 | % | | (1.75 | )%(g) | | 2.86 | % | | 67.62 | % | |
|
|
|
|
|
|
|
|
|
|
|
|
|
|
|
|
|
|
|
|
|
|
| |
* | Calculated based on average shares outstanding. |
| |
(a) | The per share amounts and percentages reflect income and expenses assuming the inclusion of the Fund’s proporationate share of the income and expenses of the HSBC Investor Opportunity Portfolio. |
| |
(b) | Total return calculations do not include any sales or redemption charges. |
| |
(c) | Excludes fee reductions. If such fee reductions had not occurred, the ratio would have been as indicated. |
| |
(d) | Portfolio Turnover rate is calculated on the basis of the respective Portfolio in which the Fund invests all its investable assets. Portfolio turnover rate is calculated on the basis of the Fund as a whole without distinguishing between the classes of shares issued. |
| |
(e) | During the year ended October 31, 2007, the Investment Adviser reimbursed amounts to certain Funds (including the Fund) related to past marketing arrangements. The corresponding impact to the net expense ratio, net income ratio, and the total returns were 0.03%, 0.04%, and 0.03%, for Class A Shares, Class B Shares, and Class C Shares, respectively. |
| |
(f) | During the year ended October 31, 2010, the respective Portfolio in which the Fund invests received monies related to certain nonrecurring litigation settlements. The corresponding impact to the total return was 0.15%, 0.15% and 0.15% for Class A Shares, Class B Shares and Class C Shares, respectively. |
| |
(g) | During the year ended October 31, 2010, certain Funds (including the Fund) received a distribution from a “fair fund” established by the SEC in connection with a consent order against BISYS Fund Services, Inc. (See Note 7 in Notes to Financial Statements). The corresponding impact to the net income ratio and the total return was 0.01%, 0.01% and 0.01% for Class A Shares, Class B Shares and Class C Shares, respectively. |
| | |
See notes to financial statements. | HSBC INVESTOR FAMILY OF FUNDS | 34 |
|
HSBC INVESTOR ADVISOR FUNDS TRUST—OPPORTUNITY FUND (ADVISOR) |
|
Financial Highlights |
|
Selected data for a share outstanding throughout the periods indicated. (a) |
| | | | | | | | | | | | | | | | | | | | | | | | | | |
| | | | Investment Activities | | Dividends | | | |
| | | |
| |
| | | |
| | Net Asset
Value,
Beginning
of Period | | Net
Investment
Income
(Loss) | | Net Realized
and Unrealized
Gains
(Losses) from
Investment
Transactions | | Total from
Investment
Activities | | Net
Realized
Gains from
Investment
Transactions | | Total
Dividends | | Net Asset
Value, End
of Period | |
|
|
|
|
|
|
|
|
|
|
|
|
|
|
|
|
CLASS I SHARES | | | | | | | | | | | | | | | | | | | | | | | | |
Year Ended October 31, 2006 | | | $ | 14.94 | | | (0.09 | ) | | 2.93 | | | 2.84 | | | (0.50 | ) | | (0.50 | ) | | | $ | 17.28 | | |
Year Ended October 31, 2007 | | | | 17.28 | | | (0.11 | ) | | 4.48 | | | 4.37 | | | (2.71 | ) | | (2.71 | ) | | | | 18.94 | | |
Year Ended October 31, 2008 | | | | 18.94 | | | (0.07 | ) | | (4.99 | ) | | (5.06 | ) | | (4.97 | ) | | (4.97 | ) | | | | 8.91 | | |
Year Ended October 31, 2009 | | | | 8.91 | | | (0.04 | ) | | 1.32 | | | 1.28 | | | (0.26 | ) | | (0.26 | ) | | | | 9.93 | | |
Year Ended October 31, 2010 | | | | 9.93 | | | (0.06 | ) | | 2.90 | | | 2.84 | | | — | | | — | | | | | 12.77 | | |
|
|
|
|
|
|
|
|
|
|
|
|
|
|
|
|
|
|
|
|
|
|
|
|
|
|
|
| | | | | | | | | | | | | | | | | | | | | |
| | | | Ratios/Supplementary Data | |
| | | |
|
|
| | Total
Return(b) | | Net Assets
at End of
Period
(000’s) | | Ratio of Net
Expenses to
Average Net
Assets | | Ratio of Net
Investment
Income
(Loss) to
Average
Net Assets | | Ratio of
Expenses to
Average Net
Assets(c) | | Portfolio
Turnover(d) | |
|
|
|
|
|
|
|
|
|
|
|
|
|
|
CLASS I SHARES | | | | | | | | | | | | | | | | | | | |
Year Ended October 31, 2006 | | 19.40 | % | | | $ | 192,124 | | | 1.03 | % | | (0.51 | )% | | 1.03 | % | | 60.83 | % | |
Year Ended October 31, 2007 | | 29.42 | %(e) | | | | 176,593 | | | 0.96 | %(e) | | (0.60 | )%(e) | | 1.03 | % | | 69.41 | % | |
Year Ended October 31, 2008 | | (35.39 | )% | | | | 97,841 | | | 0.97 | % | | (0.55 | )% | | 0.97 | % | | 80.42 | % | |
Year Ended October 31, 2009 | | 15.47 | % | | | | 100,285 | | | 1.02 | % | | (0.50 | )% | | 1.02 | % | | 64.91 | % | |
Year Ended October 31, 2010 | | 28.60 | %(f)(g) | | | | 117,064 | | | 1.01 | % | | (0.46 | )%(g) | | 1.01 | % | | 67.62 | % | |
|
|
|
|
|
|
|
|
|
|
|
|
|
|
|
|
|
|
|
|
|
|
| |
(a) | The per share amounts and percentages reflect income and expenses assuming the inclusion of the Fund’s proporationate share of the income and expenses of the HSBC Investor Opportunity Portfolio. |
| |
(b) | Total return calculations do not include any sales or redemption charges. |
| |
(c) | Excludes fee reductions. If such fee reductions had not occurred, the ratio would have been as indicated. |
| |
(d) | Portfolio Turnover rate is calculated on the basis of the respective Portfolio in which the Fund invests all its investable assets. Portfolio turnover rate is calculated on the basis of the Fund as a whole without distinguishing between the classes of shares issued. |
| |
(e) | During the year ended October 31, 2007, the Investment Adviser reimbursed amounts to certain Funds (including the Fund) related to past marketing arrangements. The corresponding impact to the net expense ratio, net income ratio, and the total returns were 0.07% for the Class I Shares. |
| |
(f) | During the year ended October 31, 2010, the respective Portfolio in which the Fund invests received monies related to certain nonrecurring litigation settlements. The corresponding impact to the total return was 0.15% for Class I Shares. |
| |
(g) | During the year ended October 31, 2010, certain Funds (including the Fund) received a distribution from a “fair fund” established by the SEC in connection with a consent order against BISYS Fund Services, Inc. (See Note 7 in Notes to Financial Statements). The corresponding impact to the net income ratio and the total return was 0.01% for the Class I Shares. |
| | |
35 | HSBC INVESTOR FAMILY OF FUNDS | See notes to financial statements. |
|
HSBC INVESTOR FUNDS—OVERSEAS EQUITY FUND |
|
Financial Highlights |
|
Selected data for a share outstanding throughout the periods indicated. (a) |
| | | | | | | | | | | | | | | | | | | | | | | | | | | | | |
| | | | Investment Activities | | Dividends | | | |
| | | |
| |
| | | |
| | Net Asset
Value,
Beginning
of Period | | Net
Investment
Income
(Loss) | | Net Realized
and Unrealized
Gains
(Losses) from
Investments | | Total from
Investment
Activities | | Net
Investment
Income | | Net Realized
Gains from
Investment
Transactions | | Total
Dividends | | Net Asset
Value, End
of Period | |
|
|
|
|
|
|
|
|
|
|
|
|
|
|
|
|
|
|
CLASS A SHARES | | | | | | | | | | | | | | | | | | | | | | | | | | | |
Year Ended October 31, 2006 | | | $ | 15.59 | | | 0.22 | | | 4.45 | | | 4.67 | | | (0.25 | ) | | (1.16 | ) | | (1.41 | ) | | | $ | 18.85 | | |
Year Ended October 31, 2007 | | | | 18.85 | | | 0.22 | * | | 3.92 | | | 4.14 | | | (0.40 | ) | | (2.11 | ) | | (2.51 | ) | | | | 20.48 | | |
Year Ended October 31, 2008 | | | | 20.48 | | | 0.24 | * | | (9.41 | ) | | (9.17 | ) | | (0.15 | ) | | (3.31 | ) | | (3.46 | ) | | | | 7.85 | | |
Year Ended October 31, 2009 | | | | 7.85 | | | 0.06 | * | | 0.47 | | | 0.53 | | | (0.49 | ) | | (3.79 | ) | | (4.28 | ) | | | | 4.10 | | |
Year Ended October 31, 2010 | | | | 4.10 | | | 0.04 | * | | 0.17 | | | 0.21 | | | (0.07 | ) | | — | | | (0.07 | ) | | | | 4.24 | | |
|
|
|
|
|
|
|
|
|
|
|
|
|
|
|
|
|
|
|
|
|
|
|
|
|
|
|
|
|
|
CLASS B SHARES | | | | | | | | | | | | | | | | | | | | | | | | | | | | | |
Year Ended October 31, 2006 | | | | 14.95 | | | 0.09 | | | 4.26 | | | 4.35 | | | (0.14 | ) | | (1.16 | ) | | (1.30 | ) | | | $ | 18.00 | | |
Year Ended October 31, 2007 | | | | 18.00 | | | 0.10 | * | | 3.70 | | | 3.80 | | | (0.27 | ) | | (2.11 | ) | | (2.38 | ) | | | | 19.42 | | |
Year Ended October 31, 2008 | | | | 19.42 | | | 0.14 | * | | (8.86 | ) | | (8.72 | ) | | (0.03 | ) | | (3.31 | ) | | (3.34 | ) | | | | 7.36 | | |
Year Ended October 31, 2009 | | | | 7.36 | | | 0.03 | * | | 0.37 | | | 0.40 | | | (0.38 | ) | | (3.79 | ) | | (4.17 | ) | | | | 3.59 | | |
Year Ended October 31, 2010 | | | | 3.59 | | | 0.01 | * | | 0.15 | | | 0.16 | | | (0.04 | ) | | — | | | (0.04 | ) | | | | 3.71 | | |
|
|
|
|
|
|
|
|
|
|
|
|
|
|
|
|
|
|
|
|
|
|
|
|
|
|
|
|
|
|
CLASS C SHARES | | | | | | | | | | | | | | | | | | | | | | | | | | | | | |
Year Ended October 31, 2006 | | | $ | 15.23 | | | 0.11 | | | 4.33 | | | 4.44 | | | (0.14 | ) | | (1.16 | ) | | (1.30 | ) | | | $ | 18.37 | | |
Year Ended October 31, 2007 | | | | 18.37 | | | 0.11 | * | | 3.80 | | | 3.91 | | | (0.23 | ) | | (2.11 | ) | | (2.34 | ) | | | | 19.94 | | |
Year Ended October 31, 2008 | | | | 19.94 | | | 0.15 | * | | (9.15 | ) | | (9.00 | ) | | (0.02 | ) | | (3.31 | ) | | (3.33 | ) | | | | 7.61 | | |
Year Ended October 31, 2009 | | | | 7.61 | | | 0.03 | * | | 0.43 | | | 0.46 | | | (0.39 | ) | | (3.79 | ) | | (4.18 | ) | | | | 3.89 | | |
Year Ended October 31, 2010 | | | | 3.89 | | | 0.01 | * | | 0.16 | | | 0.17 | | | (0.04 | ) | | — | | | (0.04 | ) | | | | 4.02 | | |
|
|
|
|
|
|
|
|
|
|
|
|
|
|
|
|
|
|
|
|
|
|
|
|
|
|
|
|
|
|
| | | | | | | | | | | | | | | | | | | | | |
| | | | Ratios/Supplementary Data | |
| | | |
|
|
| | Total
Return(b) | | Net Assets
at End of
Period
(000’s) | | Ratio of Net
Expenses to
Average Net
Assets | | Ratio of Net
Investment
Income
(Loss) to
Average
Net Assets | | Ratio of
Expenses to
Average Net
Assets(c) | | Portfolio
Turnover(d) | |
|
|
|
|
|
|
|
|
|
|
|
|
|
|
CLASS A SHARES | | | | | | | | | | | | | | | | | | | |
Year Ended October 31, 2006 | | 31.85 | % | | | $ | 22,761 | | | 1.67 | % | | 1.24 | % | | 1.67 | % | | 33.39 | % | |
Year Ended October 31, 2007 | | 24.19 | %(e) | | | | 16,078 | | | 1.62 | %(e) | | 1.15 | %(e) | | 1.64 | % | | 26.08 | % | |
Year Ended October 31, 2008 | | (52.63 | )% | | | | 6,645 | | | 1.70 | % | | 1.75 | % | | 1.81 | % | | 28.98 | % | |
Year Ended October 31, 2009 | | 23.99 | % | | | | 5,939 | | | 1.70 | % | | 1.56 | % | | 2.52 | % | | 58.31 | % | |
Year Ended October 31, 2010 | | 5.17 | %(f)(g) | | | | 5,541 | | | 1.70 | % | | 1.10 | %(g) | | 2.71 | % | | 63.35 | % | |
|
|
|
|
|
|
|
|
|
|
|
|
|
|
|
|
|
|
|
|
|
|
CLASS B SHARES | | | | | | | | | | | | | | | | | | | | | |
Year Ended October 31, 2006 | | 30.87 | % | | | $ | 3,234 | | | 2.42 | % | | 0.58 | % | | 2.42 | % | | 33.39 | % | |
Year Ended October 31, 2007 | | 23.26 | %(e) | | | | 3,698 | | | 2.37 | %(e) | | 0.59 | %(e) | | 2.40 | % | | 26.08 | % | |
Year Ended October 31, 2008 | | (52.97 | )% | | | | 1,249 | | | 2.45 | % | | 1.05 | % | | 2.56 | % | | 28.98 | % | |
Year Ended October 31, 2009 | | 23.03 | % | | | | 962 | | | 2.45 | % | | 0.79 | % | | 3.28 | % | | 58.31 | % | |
Year Ended October 31, 2010 | | 4.52 | %(f)(g) | | | | 585 | | | 2.45 | % | | 0.28 | %(g) | | 3.44 | % | | 63.35 | % | |
|
|
|
|
|
|
|
|
|
|
|
|
|
|
|
|
|
|
|
|
|
|
CLASS C SHARES | | | | | | | | | | | | | | | | | | | | | |
Year Ended October 31, 2006 | | 30.92 | % | | | $ | 163 | | | 2.41 | % | | 0.58 | % | | 2.41 | % | | 33.39 | % | |
Year Ended October 31, 2007 | | 23.39 | %(e) | | | | 147 | | | 2.30 | %(e) | | 0.59 | %(e) | | 2.32 | % | | 26.08 | % | |
Year Ended October 31, 2008 | | (52.96 | )% | | | | 58 | | | 2.45 | % | | 1.12 | % | | 2.57 | % | | 28.98 | % | |
Year Ended October 31, 2009 | | 23.01 | % | | | | 58 | | | 2.45 | % | | 0.92 | % | | 3.28 | % | | 58.31 | % | |
Year Ended October 31, 2010 | | 4.43 | %(f)(g) | | | | 56 | | | 2.45 | % | | 0.33 | %(g) | | 3.46 | % | | 63.35 | % | |
|
|
|
|
|
|
|
|
|
|
|
|
|
|
|
|
|
|
|
|
|
|
| |
* | Calculated based on average shares outstanding. |
| |
(a) | The per share amounts and percentages reflect income and expenses assuming the inclusion of the Fund’s proporationate share of the income and expenses of the HSBC Investor International Equity Portfolio. |
| |
(b) | Total return calculations do not include any sales or redemption charges. |
| |
(c) | Excludes fee reductions. If such fee reductions had not occurred, the ratio would have been as indicated. |
| |
(d) | Portfolio Turnover rate is calculated on the basis of the respective Portfolio in which the Fund invests all its investable assets. Portfolio turnover rate is calculated on the basis of the Fund as a whole without distinguishing between the classes of shares issued. |
| |
(e) | During the year ended October 31, 2007, the Investment Adviser reimbursed amounts to certain Funds (including the Fund) related to past marketing arrangements. The corresponding impact to the net expense ratio, net income ratio, and the total returns were 0.02%, 0.03%, and 0.02%, for Class A Shares, Class B Shares, and Class C Shares, respectively. |
| |
(f) | During the year ended October 31, 2010, the respective Portfolio in which the Fund invests received monies related to certain nonrecurring litigation settlements. The corresponding impact to the total return was 0.34%, 0.34% and 0.34% for Class A Shares, Class B Shares and Class C Shares, respectively. |
| |
(g) | During the year ended October 31, 2010, certain Funds (including the Fund) received a distribution from a “fair fund” established by the SEC in connection with a consent order against BISYS Fund Services, Inc. (See Note 7 in Notes to Financial Statements). The corresponding impact to the net income ratio and the total return was 0.01%, 0.01% and 0.01% for Class A Shares, Class B Shares and Class C Shares, respectively. |
| | |
See notes to financial statements. | HSBC INVESTOR FAMILY OF FUNDS | 36 |
|
HSBC INVESTOR FUNDS—VALUE FUND |
|
Financial Highlights |
Selected data for a share outstanding throughout the periods indicated. (a)
| | | | | | | | | | | | | | | | | | | | | | | | | | | | | |
| | | | Investment Activities | | Dividends | | | |
| | | |
| |
| | | |
| | Net Asset
Value,
Beginning
of Period | | Net
Investment
Income
(Loss) | | Net Realized
and Unrealized
Gains
(Losses) from
Investment
Transactions | | Total from
Investment
Activities | | Net
Investment
Income | | Net
Realized
Gains from
Investment
Transactions | | Total
Dividends | | Net Asset
Value, End
of Period | |
|
|
|
|
|
|
|
|
|
|
|
|
|
|
|
|
|
|
CLASS A SHARES | | | | | | | | | | | | | | | | | | | | | | | | | |
Year Ended October 31, 2006 | | | $ | 15.13 | | | 0.12 | * | | 2.95 | | | 3.07 | | | (0.19 | ) | | (1.29 | ) | | (1.48 | ) | | | $ | 16.72 | | |
Year Ended October 31, 2007 | | | | 16.72 | | | 0.14 | * | | 1.38 | | | 1.52 | | | (0.13 | ) | | (1.57 | ) | | (1.70 | ) | | | | 16.54 | | |
Year Ended October 31, 2008 | | | | 16.54 | | | 0.13 | * | | (6.30 | ) | | (6.17 | ) | | (0.13 | ) | | (1.30 | ) | | (1.43 | ) | | | | 8.94 | | |
Year Ended October 31, 2009 | | | | 8.94 | | | 0.09 | * | | 1.64 | | | 1.73 | | | (0.11 | ) | | — | | | (0.11 | ) | | | | 10.56 | | |
Year Ended October 31, 2010 | | | | 10.56 | | | 0.03 | * | | 1.34 | | | 1.37 | | | (0.04 | ) | | — | | | (0.04 | ) | | | | 11.89 | | |
|
|
|
|
|
|
|
|
|
|
|
|
|
|
|
|
|
|
|
|
|
|
|
|
|
|
|
|
|
|
CLASS B SHARES | | | | | | | | | | | | | | | | | | | | | | | | | | | | | |
Year Ended October 31, 2006 | | | $ | 14.60 | | | — | * | | 2.84 | | | 2.84 | | | (0.07 | ) | | (1.29 | ) | | (1.36 | ) | | | $ | 16.08 | | |
Year Ended October 31, 2007 | | | | 16.08 | | | 0.02 | * | | 1.32 | | | 1.34 | | | (0.02 | ) | | (1.57 | ) | | (1.59 | ) | | | | 15.83 | | |
Year Ended October 31, 2008 | | | | 15.83 | | | 0.03 | * | | (6.01 | ) | | (5.98 | ) | | (0.02 | ) | | (1.30 | ) | | (1.32 | ) | | | | 8.53 | | |
Year Ended October 31, 2009 | | | | 8.53 | | | 0.04 | * | | 1.54 | | | 1.58 | | | (0.03 | ) | | — | | | (0.03 | ) | | | | 10.08 | | |
Year Ended October 31, 2010 | | | | 10.08 | | | (0.04 | )* | | 1.28 | | | 1.24 | | | — | | | — | | | — | | | | | 11.32 | | |
|
|
|
|
|
|
|
|
|
|
|
|
|
|
|
|
|
|
|
|
|
|
|
|
|
|
|
|
|
|
CLASS C SHARES | | | | | | | | | | | | | | | | | | | | | | | | | | | | | |
Year Ended October 31, 2006 | | | $ | 14.67 | | | — | * | | 2.85 | | | 2.85 | | | (0.05 | ) | | (1.29 | ) | | (1.34 | ) | | | $ | 16.18 | | |
Year Ended October 31, 2007 | | | | 16.18 | | | 0.02 | * | | 1.32 | | | 1.34 | | | (0.01 | ) | | (1.57 | ) | | (1.58 | ) | | | | 15.94 | | |
Year Ended October 31, 2008 | | | | 15.94 | | | 0.03 | * | | (6.05 | ) | | (6.02 | ) | | (0.02 | ) | | (1.30 | ) | | (1.32 | ) | | | | 8.60 | | |
Year Ended October 31, 2009 | | | | 8.60 | | | 0.02 | * | | 1.57 | | | 1.59 | | | (0.04 | ) | | — | | | (0.04 | ) | | | | 10.15 | | |
Year Ended October 31, 2010 | | | | 10.15 | | | (0.04 | )* | | 1.28 | | | 1.24 | | | — | | | — | | | — | | | | | 11.39 | | |
|
|
|
|
|
|
|
|
|
|
|
|
|
|
|
|
|
|
|
|
|
|
|
|
|
|
|
|
|
|
CLASS I SHARES | | | | | | | | | | | | | | | | | | | | | | | | | | | | | |
Year Ended October 31, 2006 | | | $ | 15.13 | | | 0.15 | * | | 2.94 | | | 3.09 | | | (0.23 | ) | | (1.29 | ) | | (1.52 | ) | | | $ | 16.70 | | |
Year Ended October 31, 2007 | | | | 16.70 | | | 0.18 | * | | 1.38 | | | 1.56 | | | (0.17 | ) | | (1.57 | ) | | (1.74 | ) | | | | 16.52 | | |
Year Ended October 31, 2008 | | | | 16.52 | | | 0.16 | * | | (6.28 | ) | | (6.12 | ) | | (0.17 | ) | | (1.30 | ) | | (1.47 | ) | | | | 8.93 | | |
Year Ended October 31, 2009 | | | | 8.93 | | | 0.11 | * | | 1.63 | | | 1.74 | | | (0.13 | ) | | — | | | (0.13 | ) | | | | 10.54 | | |
Year Ended October 31, 2010 | | | | 10.54 | | | 0.06 | * | | 1.34 | | | 1.40 | | | (0.07 | ) | | — | | | (0.07 | ) | | | | 11.87 | | |
|
|
|
|
|
|
|
|
|
|
|
|
|
|
|
|
|
|
|
|
|
|
|
|
|
|
|
|
|
|
| | | | | | | | | | | | | | | | | | | | | |
| | | | Ratios/Supplementary Data | |
| | | |
|
| | Total
Return(b) | | Net Assets
at End of
Period
(000’s) | | Ratio of Net
Expenses to
Average Net
Assets | | Ratio of Net
Investment
Income
(Loss) to
Average
Net Assets | | Ratio of
Expenses to
Average Net
Assets(c) | | Portfolio
Turnover(d) | |
|
|
|
|
|
|
|
|
|
|
|
|
|
|
CLASS A SHARES | | | | | | | | | | | | | | | | | | | |
Year Ended October 31, 2006 | | 21.70 | % | | | $ | 24,688 | | | 1.20 | % | | 0.74 | % | | 1.43 | % | | 20.63 | % | |
Year Ended October 31, 2007 | | 9.77 | %(e) | | | | 27,225 | | | 1.11 | %(e) | | 0.84 | %(e) | | 1.25 | % | | 18.67 | % | |
Year Ended October 31, 2008 | | (40.46 | )%(f) | | | | 14,881 | | | 1.20 | % | | 0.99 | % | | 1.23 | % | | 24.61 | % | |
Year Ended October 31, 2009 | | 19.59 | %(g) | | | | 12,742 | | | 1.20 | % | | 0.91 | % | | 1.40 | % | | 19.77 | % | |
Year Ended October 31, 2010 | | 13.05 | %(h)(i) | | | | 12,085 | | | 1.20 | % | | 0.36 | %(i) | | 1.34 | % | | 26.36 | % | |
|
|
|
|
|
|
|
|
|
|
|
|
|
|
|
|
|
|
|
|
|
|
CLASS B SHARES | | | | | | | | | | | | | | | | | | | | | |
Year Ended October 31, 2006 | | 20.78 | % | | | $ | 1,939 | | | 1.95 | % | | (0.01 | )% | | 2.18 | % | | 20.63 | % | |
Year Ended October 31, 2007 | | 8.92 | %(e) | | | | 1,772 | | | 1.87 | %(e) | | 0.10 | %(e) | | 2.00 | % | | 18.67 | % | |
Year Ended October 31, 2008 | | (40.89 | )%(f) | | | | 717 | | | 1.95 | % | | 0.24 | % | | 1.98 | % | | 24.61 | % | |
Year Ended October 31, 2009 | | 18.63 | %(g) | | | | 466 | | | 1.95 | % | | 0.23 | % | | 2.14 | % | | 19.77 | % | |
Year Ended October 31, 2010 | | 12.30 | %(h)(i) | | | | 250 | | | 1.95 | % | | (0.34 | )%(i) | | 2.08 | % | | 26.36 | % | |
|
|
|
|
|
|
|
|
|
|
|
|
|
|
|
|
|
|
|
|
|
|
CLASS C SHARES | | | | | | | | | | | | | | | | | | | | | |
Year Ended October 31, 2006 | | 20.72 | % | | | $ | 157 | | | 1.95 | % | | 0.01 | % | | 2.17 | % | | 20.63 | % | |
Year Ended October 31, 2007 | | 8.95 | %(e) | | | | 126 | | | 1.87 | %(e) | | 0.11 | %(e) | | 1.99 | % | | 18.67 | % | |
Year Ended October 31, 2008 | | (40.89 | )%(f) | | | | 66 | | | 1.95 | % | | 0.24 | % | | 1.98 | % | | 24.61 | % | |
Year Ended October 31, 2009 | | 18.60 | %(g) | | | | 71 | | | 1.95 | % | | 0.12 | % | | 2.14 | % | | 19.77 | % | |
Year Ended October 31, 2010 | | 12.32 | %(h)(i) | | | | 79 | | | 1.95 | % | | (0.40 | )%(i) | | 2.10 | % | | 26.36 | % | |
|
|
|
|
|
|
|
|
|
|
|
|
|
|
|
|
|
|
|
|
|
|
CLASS I SHARES | | | | | | | | | | | | | | | | | | | | | |
Year Ended October 31, 2006 | | 21.90 | % | | | $ | 18,036 | | | 0.95 | % | | 0.99 | % | | 1.18 | % | | 20.63 | % | |
Year Ended October 31, 2007 | | 10.04 | %(e) | | | | 28,692 | | | 0.87 | %(e) | | 1.07 | %(e) | | 0.99 | % | | 18.67 | % | |
Year Ended October 31, 2008 | | (40.29 | )%(f) | | | | 17,779 | | | 0.95 | % | | 1.24 | % | | 0.98 | % | | 24.61 | % | |
Year Ended October 31, 2009 | | 19.82 | %(g) | | | | 16,737 | | | 0.95 | % | | 1.16 | % | | 1.15 | % | | 19.77 | % | |
Year Ended October 31, 2010 | | 13.35 | %(h)(i) | | | | 20,018 | | | 0.95 | % | | 0.60 | %(i) | | 1.10 | % | | 26.36 | % | |
|
|
|
|
|
|
|
|
|
|
|
|
|
|
|
|
|
|
|
|
|
|
| |
* | Calculated based on average shares outstanding. |
| |
(a) | The per share amounts and percentages reflect income and expenses assuming the inclusion of the Fund’s proporationate share of the income and expenses of the HSBC Investor Value Portfolio. |
| |
(b) | Total return calculations do not include any sales or redemption charges. |
| |
(c) | Excludes fee reductions. If such fee reductions had not occurred, the ratio would have been as indicated. |
| |
(d) | Portfolio Turnover rate is calculated on the basis of the respective Portfolio in which the Fund invests all its investable assets. Portfolio turnover rate is calculated on the basis of the Fund as a whole without distinguishing between the classes of shares issued. |
| |
(e) | During the year ended October 31, 2007, the Investment Adviser reimbursed amounts to certain Funds (including the Fund) related to past marketing arrangements. The corresponding impact to the net expense ratio, net income ratio, and the total returns were 0.09%, 0.08%, 0.08%, and 0.08%, for Class A Shares, Class B Shares, Class C Shares, and Class I Shares, respectively. |
| |
(f) | During the year ended October 31, 2008, the respective Portfolio in which the Fund invests received monies related to certain nonrecurring litigation settlements. The corresponding impact to the total return was 0.22%, 0.22%, 0.22%, and 0.22%, for Class A Shares, Class B Shares, Class C Shares, and Class I Shares, respectively. |
| |
(g) | During the year ended October 31, 2009, the respective Portfolio in which the Fund invests received monies related to certain nonrecurring litigation settlements. The corresponding impact to the total return was 0.03%, 0.03%, 0.03%, and 0.03%, for Class A Shares, Class B Shares, Class C Shares, and Class I Shares, respectively. |
| |
(h) | During the year ended October 31, 2010, the respective Portfolio in which the Fund invests received monies related to certain nonrecurring litigation settlements. The corresponding impact to the total return was 0.06%, 0.06%, 0.06% and 0.06% for Class A Shares, Class B Shares, Class C Shares, and Class I Shares, respectively. |
| |
(i) | During the year ended October 31, 2010, certain Funds (including the Fund) received a distribution from a “fair fund” established by the SEC in connection with a consent order against BISYS Fund Services, Inc. (See Note 7 in Notes to Financial Statements). The corresponding impact to the net income ratio and the total return was 0.01%, 0.01%, 0.01% and 0.01% for Class A Shares, Class B Shares, Class C Chares and Class I Shares, respectively. |
| | |
37 | HSBC INVESTOR FAMILY OF FUNDS | See notes to financial statements. |
|
HSBC INVESTOR FAMILY OF FUNDS |
|
Notes to Financial Statements—as of October 31, 2010 |
| |
1. | Organization: |
| |
| The HSBC Investor Funds (the “Trust”), a Massachusetts business trust organized on April 22, 1987, and the HSBC Advisor Funds Trust (the “Advisor Trust”), a Massachusetts business trust organized on April 5, 1996, are registered under the Investment Company Act of 1940, as amended (the “Act”), as open-end management investment companies. As of October 31, 2010, the Trust is comprised of 15 separate operational funds and the Advisor Trust is comprised of 2 separate operational funds. The accompanying financial statements are presented for the following 7 funds (individually a “Fund”, collectively the “Funds”) of the Trust and Advisor Trust (collectively the “Trusts”): |
| | | | |
Fund | | Short Name | | Trust |
| |
| |
|
| | | | |
HSBC Investor Growth Fund | | Growth Fund | | Trust |
HSBC Investor International Equity Fund | | International Equity Fund | | Advisor Trust |
HSBC Investor Mid-Cap Fund | | Mid-Cap Fund | | Trust |
HSBC Investor Opportunity Fund | | Opportunity Fund | | Trust |
HSBC Investor Opportunity Fund (Advisor) | | Opportunity Fund (Advisor) | | Advisor Trust |
HSBC Investor Overseas Equity Fund | | Overseas Equity Fund | | Trust |
HSBC Investor Value Fund | | Value Fund | | Trust |
| |
| All the Funds are diversified funds. Each Fund is a part of the HSBC Investor Family of Funds. |
| |
| Financial statements for all other funds of the HSBC Investor Family of Funds are published separately. The Growth Fund, International Equity Fund, Opportunity Fund, Opportunity Fund (Advisor), Overseas Equity Fund, and the Value Fund (individually a “Feeder Fund”, collectively the “Feeder Funds”) utilize the master-feeder fund structure and seek to achieve their investment objectives by investing all of their investable assets in their respective Portfolios (as defined below). |
| | | | | |
Fund | | Respective Portfolio | | Proportionate
Interest on
October 31, 2010 |
| |
| |
|
|
Growth Fund | | HSBC Investor Growth Portfolio | | 68.1 | % |
International Equity Fund | | HSBC Investor International Equity Portfolio | | 30.8 | % |
Opportunity Fund | | HSBC Investor Opportunity Portfolio | | 8.8 | % |
Opportunity Fund (Advisor) | | HSBC Investor Opportunity Portfolio | | 84.0 | % |
Overseas Equity Fund | | HSBC Investor International Equity Portfolio | | 14.6 | % |
Value Fund | | HSBC Investor Value Portfolio | | 62.6 | % |
| |
| The HSBC Investor Growth Portfolio, HSBC Investor International Equity Portfolio, HSBC Investor Opportunity Portfolio and the HSBC Investor Value Portfolio (individually a “Portfolio”, collectively the “Portfolios”) are diversified series of the HSBC Investor Portfolios (the “Portfolio Trust”). The Portfolios operate as master funds in master-feeder arrangements and also receive investments from certain fund of funds. |
| |
| The financial statements of the Portfolios, including the Schedules of Portfolio Investments, are included elsewhere in this report. The financial statements of the Portfolios should be read in conjunction with the financial statements of the Feeder Funds. |
| |
| The Funds are authorized to issue an unlimited number of shares of beneficial interest with a par value of $0.001 per share. The Growth Fund, Mid-Cap Fund, and the Value Fund each offer four classes of shares: Class A Shares, Class B Shares, Class C Shares, and Class I Shares. The International Equity Fund and the Opportunity Fund (Advisor) each offer one class of shares: Class I Shares. The Opportunity Fund and the Overseas Equity Fund each offer three classes of shares: Class A Shares, Class B Shares, and Class C Shares. Class A Shares of the Funds have a maximum sales charge of 5.00% as a percentage of the original purchase price. The Class B Shares of the Funds are offered without any front-end sales charge but will be subject to a contingent deferred sales charge (“CDSC”) ranging from a maximum of 4.00% if redeemed less than one year after purchase to 0.00% if redeemed more than four years after purchase. Class C Shares of the Funds are offered without any front-end sales charge but will be subject to a maximum CDSC of 1.00% if redeemed less than |
| |
HSBC INVESTOR FAMILY OF FUNDS | 38 |
|
HSBC INVESTOR FAMILY OF FUNDS |
|
Notes to Financial Statements—as of October 31, 2010 (continued) |
| |
| one year after purchase. No sales charges are assessed with respect to Class I Shares of the Funds. Each class of shares in the Funds has identical rights and privileges except with respect to arrangements pertaining to shareholder servicing or distribution, class-related expenses, voting rights on matters affecting a single class of shares, and the exchange privilege of each class of shares. |
| |
| Under the Trusts’ organizational documents, the Trusts’ officers and trustees are indemnified against certain liabilities arising out of the performance of their duties to the Funds. In addition, in the normal course of business, the Trusts enter into contracts with service providers, which also provide for indemnifications by the Funds. The Funds’ maximum exposure under these arrangements is unknown, as this would involve any future claims that may be made against the Funds. However, based on experience, the Trusts expect that risk of loss to be remote. |
| |
2. | Significant Accounting Policies: |
| |
| The following is a summary of the significant accounting policies followed by the Funds in the preparation of their financial statements. The policies are in conformity with U.S. generally accepted accounting principles (“GAAP”). The preparation of financial statements requires management to make certain estimates and assumptions that affect the reported amounts of assets and liabilities and disclosure of contingent assets and liabilities at the date of the financial statements and the reported amounts of increases and decreases in net assets from operations during the reporting period. Actual results could differ from those estimates. Management has evaluated events and transactions through the date the financial statements were available to be issued, for purposes of recognition or disclosure in these financial statements. |
| |
| Securities Valuation: |
| |
| The Funds record their investments at fair value. Fair value is defined as the price that would be received to sell an asset or paid to transfer a liability in an orderly transaction between market participants at the measurement date. The valuation techniques used to determine fair value are further described below in Note 3. |
| |
| Investment Transactions and Related Income: |
| |
| A. Mid-Cap Fund |
| |
| Investment transactions are accounted for no later than one business day after trade date. For financial reporting purposes, changes in holdings are accounted for on trade date on the last business day of the reporting period. Investment gains and losses are calculated on the identified cost basis. Interest income is recognized on the accrual basis and includes, where applicable, the amortization or accretion of premium or discount. Dividend income is recorded on the ex-dividend date. |
| |
| B. Feeder Funds |
| |
| The Feeder Funds record daily their pro-rata share of income, expenses, changes in unrealized appreciation and depreciation and realized gains and losses derived from their respective Portfolios. In addition, the Feeder Funds accrue their own expenses daily as incurred. |
| |
| Allocations: |
| |
| Expenses directly attributable to a Fund are charged to that Fund. Expenses not directly attributable to a Fund are allocated proportionately among various or all funds within the HSBC Investor Family of Funds in relation to the net assets of each fund or on another reasonable basis. Class specific expenses are charged directly to the class incurring the expense. In addition, income, expenses (other than class specific expenses), and unrealized/realized gains and losses are allocated to each class based on relative net assets on a daily basis. |
| |
| Dividends to Shareholders: |
| |
| Dividends to shareholders from net investment income, if any, are declared and distributed semi-annually in the case of the Growth Fund, Opportunity Fund, Opportunity (Advisor) and the Value Fund, and annually in the case of the International Equity Fund, Mid-Cap Fund, and Overseas Equity Fund. |
| |
| The Funds’ net realized gains, if any, are distributed to shareholders at least annually. Additional distributions are also made to the Funds’ shareholders to the extent necessary to avoid the federal excise tax on certain undistributed income and net capital gains of regulated investment companies. |
| |
39 | HSBC INVESTOR FAMILY OF FUNDS |
|
HSBC INVESTOR FAMILY OF FUNDS |
|
Notes to Financial Statements—as of October 31, 2010 (continued) |
| |
| The amount and character of net investment income and net realized gains distributions are determined in accordance with federal income tax regulations which may differ from GAAP. These “book/tax” differences are either considered temporary or permanent in nature. To the extent these differences are permanent in nature (e.g., reclassification of market discounts, certain gain/loss, paydowns, and certain distributions), such amounts are reclassified within the composition of net assets; temporary differences (e.g., wash losses and post-October loss deferrals) do not require reclassification. The Funds may utilize equalization accounting for tax purposes and designate earnings and profits, including net realized gains distributed to shareholders on redemption of shares, as a part of the dividends paid deduction for income tax purposes. To the extent distributions to shareholders from net investment income and net realized gains exceed net investment income and net realized gains for tax purposes, they are reported as distributions of capital. |
| |
| Redemption Fee: |
| |
| Prior to February 28, 2010, a redemption fee of 2.00% was charged and recorded as paid-in-capital for any shares redeemed or exchanged after being held for less than 30 days. This fee did not apply to shares purchased through reinvested dividends or capital gains or shares held in certain omnibus accounts or retirement plans that could not implement the fee. Effective February 28, 2010, the redemption fee has been removed. For the fiscal years ended October 31, 2009 and October 31, 2010, the following Funds collected redemption fees as follows: |
| | | | | | | | |
| Fund | | Fees Collected
2009 | | Fees Collected
2010 | |
|
| |
| |
| |
| Growth Fund | | $ | 2,635 | | $ | — | |
| International Equity Fund | | | 8,926 | | | 143 | |
| Mid-Cap Fund | | | 25 | | | 11 | |
| Opportunity Fund (Advisor) | | | 2,378 | | | 141 | |
| Opportunity Fund | | | 638 | | | 318 | |
| Overseas Equity Fund | | | 73 | | | 2 | |
| Value Fund | | | 2,519 | | | 55 | |
| |
| Federal Income Taxes: |
| |
| Each Fund is a separate taxable entity for federal income tax purposes. Each Fund has qualified and intends to continue to qualify each year as a “regulated investment company” under Subchapter M of the Internal Revenue Code, as amended and to distribute substantially all of its taxable net investment income and net realized gains, if any, to its shareholders. Accordingly, no provision for federal income or excise tax is required. |
| |
| Management of the Funds has reviewed tax positions taken in tax years that remain subject to examination by all major tax jurisdictions, including federal (i.e., the last four tax year ends and the interim tax period since then, as applicable). Management believes that there is no tax liability resulting from unrecognized tax benefits related to uncertain tax positions taken. |
| |
| Futures Contracts: |
| |
| The Mid-Cap Fund may invest in futures contracts for the purpose of hedging existing portfolio securities or securities it intends to purchase against fluctuations in fair value caused by changes in prevailing market conditions. Upon entering into a futures contract, the Fund is required to pledge to the broker an amount of cash and/or other assets equal to a certain percentage of the contract amount (initial margin deposit). Subsequent payments, known as “variation margin,” are made each day, depending on the daily fluctuations in the fair value of the underlying security. A gain or loss equal to the daily variation margin is recognized on a daily basis. |
| |
| Should market conditions move unexpectedly, the Mid-Cap Fund may not achieve the anticipated benefits of the futures contracts and may realize a loss. Futures contracts involve, to varying degrees, elements of market risk (generally equity price risk related to stock futures, interest rate risk related to bond futures, and foreign currency risk related to currency futures) and exposure to loss in excess of the variation margin. The primary risk associated with the of futures contracts are the imperfect correlation between the change in market value of the securities held by the Fund and the prices of futures contracts, the possibility of an illiquid market, and the inability of the counterparty to meet the terms of the contract. For the year ended October 31, 2010, the Mid-Cap Fund did not hold any futures contracts. |
| |
HSBC INVESTOR FAMILY OF FUNDS | 40 |
|
HSBC INVESTOR FAMILY OF FUNDS |
|
Notes to Financial Statements—as of October 31, 2010 (continued) |
| | | |
| Options: |
| |
| The Mid-Cap Fund may write covered call options against some of the securities in its portfolio provided the securities are listed on a national securities exchange. A call option is “covered” if the Fund owns the underlying securities covered by the call. The premium received is recorded as a liability and is subsequently adjusted to the current fair value of the option written. Premiums received from writing options that expire unexercised are treated on the expiration date as realized gains from investments. The difference between the premium and the amount paid on effecting a closing purchase transaction, including brokerage commissions, is also treated as a realized gain or loss. If the call option is exercised, the premium is added to the proceeds from the sale of the underlying security in determining a realized gain or loss. For the year ended October 31, 2010, the Mid-Cap Fund did not write any covered call options. |
| |
3. | Investment Valuation Summary: |
| |
| The valuation techniques maximize the use of observable inputs and minimize the use of unobservable inputs in determining fair value. The inputs used for valuing the Funds’ investments are summarized in the three broad levels listed below: |
| |
| | • | Level 1—quoted prices in active markets for identical assets |
| | | |
| | • | Level 2—other significant observable inputs (including quoted prices for similar securities, interest rates, prepayments speeds, credit risk, etc.) |
| | | |
| | • | Level 3—significant unobservable inputs (including the Fund’s own assumptions in determining the fair value of investments) |
| |
| The inputs or methodology used for valuing investments are not necessarily an indication of the risk associated with investing in those investments. |
| |
| Exchange traded, domestic equity securities are valued at the last sales price on a national securities exchange, or in the absence of recorded sales, at the readily available closing bid price on such exchanges, or at the quoted bid price in the over-the-counter market and are typically categorized as Level 1 in the fair value hierarchy. |
| |
| Shares of exchange traded and closed-end registered investment companies are valued in the same manner as other equity securities and are typically categorized as Level 1 in the fair value hierarchy. Mutual funds are valued at their net asset values, as reported by such companies and are typically categorized as Level 1 in the fair value hierarchy. |
| |
| Exchange traded futures contracts are valued at their settlement price on the exchange on which they are traded and are typically categorized as Level 1 in the fair value hierarchy. |
| |
| Securities or other assets for which market quotations are not readily available, or are deemed unreliable due to a significant event or otherwise, are valued pursuant to procedures adopted by the Funds’ Board of Trustees (“Trustees”). Examples of potentially significant events that could affect the value of an individual security and thus require pricing under the procedures include corporate actions by the issuer, announcements by the issuer relating to its earnings or profits, regulatory news, natural disasters and litigation. Examples of potentially significant events that could affect multiple securities held by the Fund include governmental actions, natural disasters and armed conflicts. |
| |
| The Feeder Funds record their investments in their respective Portfolios at fair value and are typically categorized as a Level 2 in the fair value hierarchy. The underlying securities of the Portfolios are recorded at fair value, respectively, as more fully discussed below. |
| |
| For the year ended October 31, 2010, there were no Level 3 investments for which significant unobservable inputs were used to determine fair value. |
| |
| The Schedule of Portfolio Investments include additional information regarding the investments for the Mid-Cap Fund. The following is a summary of the valuation inputs used as of October 31, 2010 in valuing the Funds’ investments based upon three levels defined above: |
| |
41 | HSBC INVESTOR FAMILY OF FUNDS |
|
HSBC INVESTOR FAMILY OF FUNDS |
|
Notes to Financial Statements—as of October 31, 2010 (continued) |
| | | | | | | | | | | | | |
| | LEVEL 1 | | LEVEL 2 | | LEVEL 3 | | Total | |
| |
| |
| |
| |
| |
Growth Fund | | | | | | | | | | | | | |
Investment Securities: | | | | | | | | | | | | | |
Affiliated Portfolios (a) | | $ | — | | $ | 67,292,333 | | $ | — | | $ | 67,292,333 | |
| |
|
| |
|
| |
|
| |
|
| |
Total Investment Securities | | $ | — | | $ | 67,292,333 | | $ | — | | $ | 67,292,333 | |
| |
|
| |
|
| |
|
| |
|
| |
| | | | | | | | | | | | | |
International Equity Fund | | | | | | | | | | | | | |
Investment Securities: | | | | | | | | | | | | | |
Affiliated Portfolios (a) | | $ | — | | $ | 12,887,941 | | $ | — | | $ | 12,887,941 | |
| |
|
| |
|
| |
|
| |
|
| |
Total Investment Securities | | $ | — | | $ | 12,887,941 | | $ | — | | $ | 12,887,941 | |
| |
|
| |
|
| |
|
| |
|
| |
| | | | | | | | | | | | | |
Mid-Cap Fund | | | | | | | | | | | | | |
Investment Securities: | | | | | | | | | | | | | |
Common Stocks (b) | | $ | 15,246,370 | | $ | — | | $ | — | | $ | 15,246,370 | |
Investment Companies | | | 124,656 | | | — | | | — | | | 124,656 | |
| |
|
| |
|
| |
|
| |
|
| |
Total Investment Securities | | $ | 15,371,026 | | $ | — | | $ | — | | $ | 15,371,026 | |
| |
|
| |
|
| |
|
| |
|
| |
| | | | | | | | | | | | | |
Opportunity Fund | | | | | | | | | | | | | |
Investment Securities: | | | | | | | | | | | | | |
Affiliated Portfolios (a) | | $ | — | | $ | 12,315,145 | | $ | — | | $ | 12,315,145 | |
| |
|
| |
|
| |
|
| |
|
| |
Total Investment Securities | | $ | — | | $ | 12,315,145 | | $ | — | | $ | 12,315,145 | |
| |
|
| |
|
| |
|
| |
|
| |
| | | | | | | | | | | | | |
Opportunity Fund (Advisor) | | | | | | | | | | | | | |
Investment Securities: | | | | | | | | | | | | | |
Affiliated Portfolios (a) | | $ | — | | $ | 117,127,395 | | $ | — | | $ | 117,127,395 | |
| |
|
| |
|
| |
|
| |
|
| |
Total Investment Securities | | $ | — | | $ | 117,127,395 | | $ | — | | $ | 117,127,395 | |
| |
|
| |
|
| |
|
| |
|
| |
| | | | | | | | | | | | | |
Overseas Equity Fund | | | | | | | | | | | | | |
Investment Securities: | | | | | | | | | | | | | |
Affiliated Portfolios (a) | | $ | — | | $ | 6,103,648 | | $ | — | | $ | 6,103,648 | |
| |
|
| |
|
| |
|
| |
|
| |
Total Investment Securities | | $ | — | | $ | 6,103,648 | | $ | — | | $ | 6,103,648 | |
| |
|
| |
|
| |
|
| |
|
| |
| | | | | | | | | | | | | |
Value Fund | | | | | | | | | | | | | |
Investment Securities: | | | | | | | | | | | | | |
Affiliated Portfolios (a) | | $ | — | | $ | 32,404,763 | | $ | — | | $ | 32,404,763 | |
| |
|
| |
|
| |
|
| |
|
| |
Total Investment Securities | | $ | — | | $ | 32,404,763 | | $ | — | | $ | 32,404,763 | |
| |
|
| |
|
| |
|
| |
|
| |
| | |
| |
(a) | Investments in Affiliated Portfolios represent ownership interests in the Portfolios. Due to the Funds’ master-feeder structure, the inputs used for valuing these investments are categorized as Level 2. |
|
(b) | For detailed industry descriptions, see the accompanying Schedule of Portfolio Investments. |
| |
| The Trust recognizes significant transfers between fair value hierarchy levels at the reporting period end. There were no significant transfers between Level 1 and 2 as of October 31, 2010. |
| |
4. | Related Party Transactions: |
| |
| Investment Management: |
| |
| HSBC Global Asset Management (USA) Inc. (“HSBC” or the “Investment Adviser”), a wholly owned subsidiary of HSBC Bank USA, N.A., a national bank organized under the laws of the United States, acts as Investment Adviser to the Mid-Cap Fund. As Investment Adviser, HSBC manages the investments of the Funds and continuously reviews, supervises, and administers the Funds’ investments. Investment sub-advisory services are provided by Munder Capital Management (“Munder”) for the Mid-Cap Fund. |
| |
HSBC INVESTOR FAMILY OF FUNDS | 42 |
|
HSBC INVESTOR FAMILY OF FUNDS |
|
Notes to Financial Statements—as of October 31, 2010 (continued) |
| |
| For their services as Investment Adviser and Investment sub-adviser, HSBC and Munder receive, in the aggregate, a fee, accrued daily and paid monthly at an annual rate of 0.75% of the Mid-Cap Fund’s average daily net assets. |
| |
| Feeder Funds are not directly charged any investment management fees. |
| |
| Administration: |
| |
| HSBC serves the Funds as Administrator. Under the terms of the Administration Agreement, HSBC received from the Funds (as well as other funds in the HSBC Investor Family of Funds) a fee, accrued daily and paid monthly, at the annual rates of: |
| | | | | |
| Based on Average Daily Net Assets of | | | Fee Rate | |
|
| | |
| |
| Up to $10 billion | | 0.0550% | |
| In excess of $10 billion but not exceeding $20 billion | | 0.0350% | |
| In excess of $20 billion but not exceeding $50 billion | | 0.0275% | |
| In excess of $50 billion | | 0.0250% | |
| |
| The fee breakpoints are determined on the basis of the aggregate average daily net assets of the HSBC Investor Family of Funds. The fee is allocated to each series of the HSBC Investor Family of Funds based upon its pro-rata share of net assets for each class. For assets invested in the underlying Portfolios by the Feeder Funds, the Portfolios pay half of the administration fee and the Feeder Funds pay half, for a combination of the total fee rates above. Certain administration fees of the Portfolios also may be reduced by treating them as apportioned in part to other funds making investments in the Portfolios. An amount equal to 50% of the administration fees is deemed to be class specific. |
| |
| Pursuant to a Sub-Administration Agreement with HSBC, Citi Fund Services Ohio, Inc. (“Citi Ohio”), a wholly-owned subsidiary of Citigroup, Inc., serves as the Trusts’ Sub-Administrator, subject to the general supervision of the Trusts’ Board of Trustees and HSBC. For these services, Citi Ohio is entitled to a fee, payable by HSBC, at an annual rate equivalent to the fee rates set forth above, minus 0.02% (2 basis points) which is retained by HSBC. |
| |
| Under a Compliance Services Agreement between the Trust and Citi Ohio (the “CCO Agreement”), Citi Ohio makes an employee available to serve as the Trusts’ Chief Compliance Officer (the “CCO”). Under the CCO Agreement, Citi Ohio also provides infrastructure and support in implementing the written policies and procedures comprising the Trusts’ compliance program, including support services to the CCO. For the services provided under the CCO Agreement, the HSBC Investor Family of Funds paid Citi Ohio $269,869 for the year ended October 31, 2010, plus reimbursement of certain out of pocket expenses. Expenses incurred by each Fund are reflected on the Statements of Operations as “Compliance Service.” Citi Ohio pays the salary and other compensation earned by individuals performing these services, as employees of Citi Ohio. |
| |
| Distribution Arrangements: |
| |
| Foreside Distribution Services, L.P. (“Foreside”), a wholly-owned subsidiary of Foreside Financial Group LLC, serves the Trusts as Distributor (the “Distributor”). The Trusts have adopted a non-compensatory Distribution Plan and Agreement (the “Distribution Plan”) pursuant to Rule 12b-1 of the Act. The Distribution Plan provides for reimbursement of expenses incurred by the Distributor related to distribution and marketing, at a rate not to exceed 0.25%, 1.00%, and 1.00% of the average daily net assets of Class A Shares (currently not being charged), Class B Shares (currently charging 0.75%), and Class C Shares (currently charging 0.75%) of the Funds, respectively. As of the most recent fiscal year end, Foreside, as Distributor, also received $628,328, $459,202 and $43,157 in commissions from sales of HSBC Investor Family of Funds, for Class A Shares, Class B Shares, and Class C Shares, respectively of which $60, $12 and $— were reallocated to HSBC-affiliated brokers and dealers, for Class A Shares, Class B Shares, and Class C Shares, respectively. |
| |
| Shareholder Servicing: |
| |
| The Trusts have adopted a Shareholder Services Plan, which provides for payments to shareholder servicing agents (which primarily consist of HSBC and its affiliates) for providing various shareholder services. For performing these services, the shareholder servicing agents receive a fee that is computed daily and paid monthly up to 0.25%, 0.25%, and 0.25% of the average daily net assets of Class A Shares, Class B Shares, and Class C Shares of the Funds, respectively. The aggregate fees paid to the Distributor pursuant to the Distribution Plan and to shareholder servicing agents pursuant to the Shareholder Services Plan currently are not intended to exceed 0.25% of the average daily net assets of Class A Shares, and 1.00% of the average daily net assets of Class B Shares and Class C Shares. |
| |
43 | HSBC INVESTOR FAMILY OF FUNDS |
|
HSBC INVESTOR FAMILY OF FUNDS |
|
Notes to Financial Statements—as of October 31, 2010 (continued) |
| |
| Fund Accounting, Transfer Agency and Trustees: |
| |
| Citi Ohio provides fund accounting and transfer agency services for each Fund. As transfer agent, Citi Ohio receives a fee based on the number of Funds and shareholder accounts, subject to certain minimums and reimbursement of certain expenses. As fund accountant, Citi Ohio receives an annual fee per Fund and share class, subject to certain minimums and reimbursement of certain expenses. Citi Ohio receives additional fees paid by the Trust for blue sky exemption services. |
| |
| Each non-interested Trustee is compensated with a $60,000 annual Board retainer for service as a Trustee of the Trusts and Portfolio Trust, as well as a $3,000 annual retainer for each Committee of the Board of the Trusts and Portfolio Trust. Each non-interested Trustee also receives a $5,000 and $3,000 meeting fee for each regular in-person Board meeting and Committee meeting, respectively. Furthermore, each non-interested Trustee receives compensation for attending special meetings and/or functioning as a Committee or Board Chairperson. In addition, the non-interested Trustees are reimbursed for certain expenses incurred in connection with their Board membership. |
| |
| Fee Reductions: |
| |
| The Investment Adviser has agreed to contractually waive 0.05% of its management fee, computed daily and paid monthly, and based on the average daily net assets of the Mid-Cap Fund. |
| |
| The Investment Adviser has also agreed to contractually limit, through March 1, 2011, the total expenses, exclusive of interest, taxes, brokerage commissions and extraordinary expenses, of certain Funds. Each affected Fund Class has its own expense limitations based on the average daily net assets for any full fiscal year as follows: |
| | | | | | | |
| Fund | | | Class | | Current Contractual
Expense
Limitation | |
|
| | |
| |
| |
| Growth Fund | | A | | 1.20% | |
| Growth Fund | | B | | 1.95% | |
| Growth Fund | | C | | 1.95% | |
| Growth Fund | | I | | 0.95% | |
| Mid-Cap Fund | | A | | 1.35% | |
| Mid-Cap Fund | | B | | 2.10% | |
| Mid-Cap Fund | | C | | 2.10% | |
| Mid-Cap Fund | | I | | 1.10% | |
| Opportunity Fund | | A | | 1.65% | |
| Opportunity Fund | | B | | 2.40% | |
| Opportunity Fund | | C | | 2.40% | |
| Overseas Equity Fund | | A | | 1.85% | |
| Overseas Equity Fund | | B | | 2.60% | |
| Overseas Equity Fund | | C | | 2.60% | |
| Value Fund | | A | | 1.20% | |
| Value Fund | | B | | 1.95% | |
| Value Fund | | C | | 1.95% | |
| Value Fund | | I | | 0.95% | |
| |
| Any amounts contractually waived or reimbursed by the Investment Adviser will be subject to repayment by the Fund to the Investment Adviser within three years to the extent that the repayment will not cause the Fund’s operating expenses to exceed the contractual expense limit was in effect at the time of such waiver or reimbursement. During the year ended October 31, 2010, the Investment Adviser did not recapture any of its prior contractual waivers or reimbursements. As of October 31, 2010, the repayments that may potentially be made by the Funds are as follows: |
| | | | | | | | | | | | |
| Fund | | | 2013* | | 2012* | | 2011* | |
|
| | |
| |
| |
| |
| Growth Fund | | $ | 22,001 | | $ | 56,048 | | $ | 7,580 | |
| Mid-Cap Fund | | | 107,107 | | | 69,632 | | | 35,881 | |
| Opportunity Fund | | | 49,041 | | | 65,792 | | | — | |
| Overseas Equity Fund | | | 53,391 | | | 45,169 | | | — | |
| Value Fund | | | 45,129 | | | 55,991 | | | 13,116 | |
| | |
| |
* | The year listed above the amounts is the fiscal year ending in which the amounts will no longer be recoupable. |
| |
HSBC INVESTOR FAMILY OF FUNDS | 44 |
|
HSBC INVESTOR FAMILY OF FUNDS |
|
Notes to Financial Statements—as of October 31, 2010 (continued) |
| |
| HSBC has agreed to voluntarily limit the annual total expenses, exclusive of interest, taxes, brokerage commissions and extraordinary expenses of the International Equity Fund. The expense limitation is based on average daily net assets for any full fiscal year as follows: |
| | | | | | | |
| Fund | | | Class | | Current Voluntary
Expense Limitation | |
|
| | |
| |
| |
| International Equity Fund | | I | | 1.00% | |
| |
| The Administrator and Citi Ohio may voluntarily waive/reimburse fees to help support the expense limits of the Funds. In addition, the Investment Adviser may waive/reimburse additional fees at its discretion. Any voluntary fee waivers/reimbursements are not subject to recoupment in subsequent fiscal periods. Voluntary waivers/reimbursements may be stopped at any time. Amounts waived/reimbursed by the Investment Adviser, Administrator and Citi Ohio are reported separately on the Statements of Operations, as applicable. |
| |
5. | Investment Transactions: |
| |
| Cost of purchases and proceeds from sales of securities (excluding securities maturing less than one year from acquisition) for the year ended October 31, 2010 were as follows: |
| | | | | | | | | |
| Fund | | | Purchases | | Sales | |
|
| | |
| |
| |
| Mid-Cap Fund | | | 11,019,970 | | | 12,077,441 | |
| |
| There were no long-term U.S. Government securities held during the year ended October 31, 2010. |
| |
| Contributions and withdrawals of the respective Portfolios for the year ended October 31, 2010 totaled: |
| | | | | | | | | |
| Fund | | | Contributions | | Withdrawals | |
|
| | |
| |
| |
| Growth Fund | | | 5,781,330 | | | 7,438,845 | |
| International Equity Fund | | | 12,583,991 | | | 168,956,511 | |
| Opportunity Fund | | | 325,268 | | | 1,969,615 | |
| Opportunity Fund (Advisor) | | | 8,677,830 | | | 19,415,774 | |
| Overseas Equity Fund | | | 206,142 | | | 1,373,859 | |
| Value Fund | | | 2,733,340 | | | 4,324,619 | |
| |
6. | Federal Income Tax Information: |
| |
| At October 31, 2010, the cost basis of securities for federal income tax purposes, gross unrealized appreciation, gross unrealized depreciation and net unrealized appreciation/depreciation were as follows: |
| | | | | | | | | | | | | | | |
| Fund | | | Tax Cost | | Tax Unrealized
Appreciation | | Tax Unrealized
Depreciation | | Net Unrealized
Appreciation
(Depreciation) | |
|
| | |
| |
| |
| |
| |
| Mid-Cap Fund | | $ | 12,146,015 | | $ | 3,375,298 | | $ | (150,287 | ) | $ | 3,225,011 | |
| | | | | | | | | | | | | | |
| The tax character of dividends paid by the Funds for the year ended October 31, 2010 was as follows: |
| | | | | | | | | | | |
| | | Dividends paid from | |
| | |
| |
| | | Ordinary Income | | Net Long Term
Capital Gains | | Total
Dividends Paid* | |
| | |
| |
| |
| |
| Growth Fund | | $ | — | | $ | — | | $ | — | |
| International Equity Fund | | | 2,826,752 | | | — | | | 2,826,752 | |
| Mid-Cap Fund | | | 37,966 | | | — | | | 37,966 | |
| Opportunity Fund | | | — | | | — | | | — | |
| Opportunity Fund (Advisor) | | | — | | | — | | | — | |
| Overseas Equity Fund | | | 108,816 | | | — | | | 108,816 | |
| Value Fund | | | 163,162 | | | — | | | 163,162 | |
| | |
| |
* | Total dividends paid may differ from the amount reported in the Statement of Changes in Net Assets because dividends are recognized when actually paid for tax purposes. |
| |
45 | HSBC INVESTOR FAMILY OF FUNDS |
|
HSBC INVESTOR FAMILY OF FUNDS |
|
Notes to Financial Statements—as of October 31, 2010 (continued) |
| | | | | | | | | | | |
| The tax character of dividends paid by the Funds for the year ended October 31, 2009 was as follows: |
| | | | | | | | | | | |
| | | Dividends paid from | |
| | |
| |
| | | Ordinary Income | | Net Long Term
Capital Gains | | Total
Dividends Paid* | |
| | |
| |
| |
| |
| Growth Fund | | $ | — | | $ | — | | $ | — | |
| International Equity Fund | | | 7,354,738 | | | 8,461,420 | | | 15,816,158 | |
| Mid-Cap Fund | | | — | | | 1,150,504 | | | 1,150,504 | |
| Opportunity Fund | | | — | | | 660,465 | | | 660,465 | |
| Opportunity Fund (Advisor) | | | — | | | 2,746,629 | | | 2,746,629 | |
| Overseas Equity Fund | | | 651,140 | | | 3,347,318 | | | 3,998,458 | |
| Value Fund | | | 390,433 | | | — | | | 390,433 | |
| | |
| |
* | Total dividends paid may differ from the amount reported in the Statements of Changes in Net Assets because dividends are recognized when actually paid for tax purposes. |
As of October 31, 2010, the components of accumulated earnings/(deficit) on a tax basis for the Funds were as follows:
| | | | | | | | | | | | | | | | | | | | | | | | | |
| | Undistributed
Ordinary
Income | | Undistributed
Tax Exempt
Income | | Undistributed
Long Term
Capital
Gains | | Accumulated
Earnings | | Dividends
Payable | | Accumulated
Capital and
Other
Losses | | Unrealized
Appreciation/
(Depreciation)(1) | | Total
Accumulated
Earnings/
(Deficit) | |
| |
| |
| |
| |
| |
| |
| |
| |
| |
Growth Fund | | $ | — | | $ | — | | $ | — | | $ | — | | $ | — | | $ | (9,748,249 | ) | $ | 12,347,061 | | $ | 2,598,812 | |
International Equity Fund | | | 2,252,180 | | | — | | | — | | | 2,252,180 | | | — | | | (71,453,812 | ) | | 490,152 | | | (68,711,480 | ) |
Mid-Cap Fund | | | — | | | — | | | — | | | — | | | — | | | (2,389,636 | ) | | 3,225,011 | | | 835,375 | |
Opportunity Fund | | | — | | | — | | | 201,742 | | | 201,742 | | | — | | | — | | | 1,313,207 | | | 1,514,949 | |
Opportunity Fund (Advisor) | | | — | | | — | | | 2,935,111 | | | 2,935,111 | | | — | | | — | | | 12,771,676 | | | 15,706,787 | |
Overseas Equity Fund | | | 193,893 | | | — | | | — | | | 193,893 | | | — | | | (1,183,101 | ) | | 223,139 | | | (766,069 | ) |
Value Fund | | | — | | | — | | | — | | | — | | | — | | | (5,476,316 | ) | | 777,561 | | | (4,698,755 | ) |
| | |
| |
(1) | The differences between book-basis and tax-basis unrealized appreciation/depreciation are attributable primarily to: tax deferral of losses on wash sales, the realization for tax purposes of unrealized gains/losses on certain derivative instruments, the difference between book and tax amortization methods for premium and market discount, the realization for tax purposes of unrealized gains/losses on investments in passive foreign investment companies, and the return of capital adjustments from real estate investment trusts. |
| |
| As of October 31, 2010, the following Funds have net capital loss carryforwards, which are available to offset future realized gains, if any, to the extent provided by the Treasury regulations. To the extent that these carryforwards are used to offset future capital gains, it is probable that the gains that are offset will not be distributed to shareholders. |
| | | | | | | | | |
| Fund | | | Amount | | Expires | |
|
| | |
| |
| |
| Growth Fund | | | 9,748,249 | | | 2017 | |
| International Equity Fund | | | 59,383,976 | | | 2017 | |
| International Equity Fund | | | 12,069,836 | | | 2018 | |
| Mid-Cap Fund | | | 2,389,636 | | | 2017 | |
| Overseas Fund | | | 1,183,101 | | | 2017 | |
| Value Fund | | | 4,161,559 | | | 2016 | |
| Value Fund | | | 1,314,757 | | | 2017 | |
| |
HSBC INVESTOR FAMILY OF FUNDS | 46 |
|
HSBC INVESTOR FAMILY OF FUNDS |
|
Notes to Financial Statements—as of October 31, 2010 (continued) |
| |
| During the tax year ended October 31, 2010, the following Funds utilized capital loss carryforwards to offset capital gains realized: |
| | | | | | | | | |
| Fund | | | | | | Amount | |
|
| | | | | |
| |
| Growth Fund | | | | | | 1,882,720 | |
| Mid-Cap Fund | | | | | | 972,155 | |
| Opportunity Fund | | | | | | 1,305,884 | |
| Opportunity Fund (Advisor) | | | | | | 10,911,778 | |
| Overseas Fund | | | | | | 1,185,304 | |
| Value Fund | | | | | | 539,878 | |
| |
7. | Legal and Regulatory Matters: |
| |
| On September 26, 2006 BISYS Fund Services, Inc. (“BISYS”), an affiliate of BISYS Fund Services Ohio, Inc. which provided various services to the Funds, reached a settlement with the Securities and Exchange Commission (the “SEC”) regarding the SEC’s investigation related to BISYS’ past payment of certain marketing and other expenses with respect to certain of its mutual fund clients. The related settlement monies were received by the Funds during the year ended October 31, 2010 and are disclosed in the Statements of Operations as “Other Income”. The corresponding impact to the net income ratio and total return for the year ended October 31, 2010 are disclosed in the Funds’ Financial Highlights. |
| |
8. | Subsequent Events (Unaudited): |
| |
| On September 14, 2010, the Trust’s Board of Trustees approved a Plan of Liquidation to close the Mid-Cap Fund. The Mid-Cap Fund was liquidated on November 19, 2010 at its net asset value on such date. |
| |
| Effective November 1, 2010, each non-interested Trustee is compensated with a $63,000 annual Board retainer for service as a Trustee of the Trust and the other HSBC Investor Funds, as well as a $3,000 annual retainer for each Committee of the Board of the Trust and other HSBC Investor Funds. Each non-interested Trustee also receives a $5,000 and $3,000 meeting fee for each regular in-person Board meeting and Committee meeting, respectively. Furthermore, each non-interested Trustee receives compensation for attending special meetings and/or functioning as a Committee or Board Chairperson. In addition, the noninterested Trustees are reimbursed for certain expenses incurred in connection with their Board membership. |
| |
47 | HSBC INVESTOR FAMILY OF FUNDS |
REPORT OF INDEPENDENT REGISTERED PUBLIC ACCOUNTING FIRM
To the Shareholders and Board of Trustees of
HSBC Investor Funds
HSBC Advisor Funds Trust:
We have audited the accompanying statements of assets and liabilities of HSBC Investor Growth Fund, HSBC Investor International Equity Fund, HSBC Investor Mid-Cap Fund, HSBC Investor Opportunity Fund, HSBC Investor Opportunity Fund (Advisor), HSBC Investor Overseas Equity Fund and HSBC Investor Value Fund (the Funds), including the schedule of portfolio investments of HSBC Investor Mid-Cap Fund as of October 31, 2010, and the related statements of operations for the year then ended, the statements of changes in net assets for each year in the two-year period then ended, and the financial highlights for each year in the five-year period then ended. These financial statements and financial highlights are the responsibility of the Funds’ management. Our responsibility is to express an opinion on these financial statements and financial highlights based on our audits.
We conducted our audits in accordance with the standards of the Public Company Accounting Oversight Board (United States). Those standards require that we plan and perform the audits to obtain reasonable assurance about whether the financial statements and financial highlights are free of material misstatement. An audit includes examining, on a test basis, evidence supporting the amounts and disclosures in the financial statements. Our procedures included confirmation of securities owned as of October 31, 2010, by correspondence with custodians and brokers or by other appropriate auditing procedures. An audit also includes assessing the accounting principles used and significant estimates made by management, as well as evaluating the overall financial statement presentation. We believe that our audits provide a reasonable basis for our opinion.
In our opinion, the financial statements and financial highlights referred to above present fairly, in all material respects, the financial position of the Funds as of October 31, 2010, the results of their operations for the year then ended, the changes in their net assets for each year in the two-year period then ended, and the financial highlights for each year in the five-year period then ended, in conformity with U.S. generally accepted accounting principles.
As discussed in note 8, the Board of Trustees approved a Plan of Liquidation to close the Mid-Cap Fund on September 14, 2010. The Mid-Cap Fund was liquidated on November 19, 2010 at its net asset value on such date.

Columbus, Ohio
December 22, 2010
| |
HSBC INVESTOR FAMILY OF FUNDS | 48 |
|
HSBC INVESTOR FAMILY OF FUNDS |
|
Other Federal Income Tax Information (Unaudited)—As of October 31, 2010 |
| |
| For the year ended October 31, 2010, the following percentages of the total ordinary income dividends paid by the Funds qualify for the corporate dividends received deduction available to corporate shareholders: |
| | | | | |
Fund | | | Dividends
Received Deduction | |
| | |
| |
Mid-Cap Fund | | | 100.00 | % |
Value Fund | | | 100.00 | % |
| |
| The International Equity Fund and the Overseas Equity Fund intend to elect to pass through to shareholders the income tax credit for taxes paid to foreign countries. Foreign source income and foreign tax expense per outstanding share on October 31, 2010 are as follows: |
| | | | | | | | |
Fund | | | Foreign
Source Income | | Foreign Tax
Expense | |
| | |
| |
| |
International Equity Fund | | $ | 3.49 | | $ | 0.36 | |
Overseas Equity Fund | | $ | 0.11 | | $ | 0.01 | |
| |
| For the year ended October 31, 2010, dividends paid by the Funds may be subject to a maximum tax rate of 15%, as provided for by the Jobs and Growth Tax Relief Reconciliation Act of 2003. The Funds intend to designate the maximum amount allowable as taxed at a maximum rate of 15%. Complete information will be reported in conjunction with your 2010 Form 1099-DIV: |
| | | | | |
Fund | | | Qualified
Dividend Income | |
| | |
| |
Mid-Cap Fund | | | 100.00 | % |
International Equity Fund | | | 100.00 | % |
Overseas Equity Fund | | | 96.52 | % |
Value Fund | | | 100.00 | % |
| |
49 | HSBC INVESTOR FAMILY OF FUNDS |
|
HSBC INVESTOR FAMILY OF FUNDS |
|
Table of Shareholder Expenses (Unaudited)—as of October 31, 2010 |
| |
| As a shareholder of the HSBC Investor Funds (“Funds”), you incur two types of costs: (1) transaction costs, including sales charges (loads) on purchases, redemption fees and exchange fees, (2) ongoing costs, including management fees; distribution and /or shareholder servicing fees; and other Fund expenses. These examples are intended to help you understand your ongoing costs (in dollars) of investing in the Funds and to compare these cost with the ongoing costs of investing in other mutual funds. |
| |
| These examples are based on an investment of $1,000 invested at the beginning of the period and held for the entire period from May 1, 2010 through October 31, 2010. |
| |
| Actual Example |
| |
| The table below provides information about actual account values and actual expenses. You may use the information below, together with the amount you invested, to estimate the expenses that you paid over the period. Simply divide your account value by $1,000 (for example, an $8,600 account value divided by $1,000 = 8.6), then multiply the result by the number in the table under the heading entitled “Expenses Paid During Period” to estimate the expenses you paid on your account during this period. |
| | | | | | | | | | | | | | | | | | | | | |
| | | | Beginning
Account Value
5/1/10 | | Ending
Account Value
10/31/10 | | Expenses Paid
During Period*
5/1/10 - 10/31/10 | | Annualized
Expense Ratio
During Period
5/1/10 - 10/31/10 | |
| | | |
| |
| |
| |
| |
Growth Fund | | Class A Shares | | | $ | 1,000.00 | | | | $ | 1,043.80 | | | | $ | 6.03 | | | 1.17 | % | |
| | Class B Shares | | | | 1,000.00 | | | | | 1,039.90 | | | | | 9.87 | | | 1.92 | % | |
| | Class C Shares | | | | 1,000.00 | | | | | 1,039.70 | | | | | 9.87 | | | 1.92 | % | |
| | Class I Shares | | | | 1,000.00 | | | | | 1,044.70 | | | | | 4.74 | | | 0.92 | % | |
International Equity Fund | | Class I Shares | | | | 1,000.00 | | | | | 1,044.40 | | | | | 0.62 | | | 0.12 | % | |
Mid-Cap Fund | | Class A Shares | | | | 1,000.00 | | | | | 1,030.50 | | | | | 6.55 | | | 1.28 | % | |
| | Class B Shares | | | | 1,000.00 | | | | | 1,025.80 | | | | | 10.37 | | | 2.03 | % | |
| | Class C Shares | | | | 1,000.00 | | | | | 1,025.60 | | | | | 10.31 | | | 2.02 | % | |
| | Class I Shares | | | | 1,000.00 | | | | | 1,031.00 | | | | | 5.27 | | | 1.03 | % | |
Opportunity Fund | | Class A Shares | | | | 1,000.00 | | | | | 1,032.00 | | | | | 7.89 | | | 1.54 | % | |
| | Class B Shares | | | | 1,000.00 | | | | | 1,029.30 | | | | | 11.71 | | | 2.29 | % | |
| | Class C Shares | | | | 1,000.00 | | | | | 1,028.70 | | | | | 11.71 | | | 2.29 | % | |
Opportunity Fund (I Shares) | | Class I Shares | | | | 1,000.00 | | | | | 1,034.80 | | | | | 5.28 | | | 1.03 | % | |
Overseas Equity Fund | | Class A Shares | | | | 1,000.00 | | | | | 1,041.80 | | | | | 7.00 | | | 1.36 | % | |
| | Class B Shares | | | | 1,000.00 | | | | | 1,039.20 | | | | | 10.85 | | | 2.11 | % | |
| | Class C Shares | | | | 1,000.00 | | | | | 1,038.80 | | | | | 10.84 | | | 2.11 | % | |
Value Fund | | Class A Shares | | | | 1,000.00 | | | | | 994.90 | | | | | 5.93 | | | 1.18 | % | |
| | Class B Shares | | | | 1,000.00 | | | | | 992.10 | | | | | 9.69 | | | 1.93 | % | |
| | Class C Shares | | | | 1,000.00 | | | | | 992.20 | | | | | 9.69 | | | 1.93 | % | |
| | Class I Shares | | | | 1,000.00 | | | | | 996.20 | | | | | 4.68 | | | 0.93 | % | |
| | |
| |
* | Expenses are equal to the average account value over the period multiplied by the Fund’s annualized expense ratio, multiplied by the number of days in the most recent fiscal half-year divided by the number of days in the fiscal year (to reflect the one half year period). |
| |
HSBC INVESTOR FAMILY OF FUNDS | 50 |
|
HSBC INVESTOR FAMILY OF FUNDS |
|
Table of Shareholder Expenses (Unaudited)—as of October 31, 2010 (continued) |
| |
| Hypothetical Example for Comparison Purposes |
| |
| The table below provides information about hypothetical account values and hypothetical expenses based on each Fund’s actual expense ratio and an assumed rate of return of 5% per year before expenses, which is not the Fund’s actual return. The hypothetical account values and expenses may not be used to estimate the actual ending account balance or expenses you paid for the period. You may use this information to compare this 5% hypothetical example with the 5% hypothetical examples that appear in the shareholder reports of other funds. |
| |
| Please note that the expenses shown in the table are meant to highlight your ongoing costs only and do not reflect any transactional costs, such as sales charges (loads), redemption fees, or exchange fees. Therefore, the table is useful in comparing ongoing costs only, and will not help you determine the relative total costs of owning different funds. In addition, if these transactional costs were included, your costs would have been higher. |
| | | | | | | | | | | | | | | | | | | | | |
| | | | Beginning
Account Value
5/1/10 | | Ending
Account Value
10/31/10 | | Expenses Paid
During Period*
5/1/10 - 10/31/10 | | Annualized
Expense Ratio
During Period
5/1/10 - 10/31/10 | |
| | | |
| |
| |
| |
| |
Growth Fund | | Class A Shares | | | $ | 1,000.00 | | | | $ | 1,019.31 | | | | $ | 5.96 | | | 1.17 | % | |
| | Class B Shares | | | | 1,000.00 | | | | | 1,015.53 | | | | | 9.75 | | | 1.92 | % | |
| | Class C Shares | | | | 1,000.00 | | | | | 1,015.53 | | | | | 9.75 | | | 1.92 | % | |
| | Class I Shares | | | | 1,000.00 | | | | | 1,020.57 | | | | | 4.69 | | | 0.92 | % | |
International Equity Fund | | Class I Shares | | | | 1,000.00 | | | | | 1,024.60 | | | | | 0.61 | | | 0.12 | % | |
Mid-Cap Fund | | Class A Shares | | | | 1,000.00 | | | | | 1,018.75 | | | | | 6.51 | | | 1.28 | % | |
| | Class B Shares | | | | 1,000.00 | | | | | 1,014.97 | | | | | 10.31 | | | 2.03 | % | |
| | Class C Shares | | | | 1,000.00 | | | | | 1,015.02 | | | | | 10.26 | | | 2.02 | % | |
| | Class I Shares | | | | 1,000.00 | | | | | 1,020.01 | | | | | 5.24 | | | 1.03 | % | |
Opportunity Fund | | Class A Shares | | | | 1,000.00 | | | | | 1,017.44 | | | | | 7.83 | | | 1.54 | % | |
| | Class B Shares | | | | 1,000.00 | | | | | 1,013.66 | | | | | 11.62 | | | 2.29 | % | |
| | Class C Shares | | | | 1,000.00 | | | | | 1,013.66 | | | | | 11.62 | | | 2.29 | % | |
Opportunity Fund (I Shares) | | Class I Shares | | | | 1,000.00 | | | | | 1,020.01 | | | | | 5.24 | | | 1.03 | % | |
Overseas Equity Fund | | Class A Shares | | | | 1,000.00 | | | | | 1,018.35 | | | | | 6.92 | | | 1.36 | % | |
| | Class B Shares | | | | 1,000.00 | | | | | 1,014.57 | | | | | 10.71 | | | 2.11 | % | |
| | Class C Shares | | | | 1,000.00 | | | | | 1,014.57 | | | | | 10.71 | | | 2.11 | % | |
Value Fund | | Class A Shares | | | | 1,000.00 | | | | | 1,019.26 | | | | | 6.01 | | | 1.18 | % | |
| | Class B Shares | | | | 1,000.00 | | | | | 1,015.48 | | | | | 9.80 | | | 1.93 | % | |
| | Class C Shares | | | | 1,000.00 | | | | | 1,015.48 | | | | | 9.80 | | | 1.93 | % | |
| | Class I Shares | | | | 1,000.00 | | | | | 1,020.52 | | | | | 4.74 | | | 0.93 | % | |
| | |
| |
* | Expenses are equal to the average account value over the period multiplied by the Fund’s annualized expense ratio, multiplied by the number of days in the most recent fiscal half-year divided by the number of days in the fiscal year (to reflect the one half year period). |
| |
51 | HSBC INVESTOR FAMILY OF FUNDS |
Other Information:
Information regarding how the Funds and Portfolios voted proxies relating to portfolio securities during the most recent 12-month period ended June 30th is available (i) without charge, upon request, by calling 1-800-525-5757 for HSBC Bank USA and HSBC Brokerage (USA) Inc. clients and 1-800-782-8183 for all other shareholders; (ii) on the Funds’ website at www.investorfunds.us.hsbc.com; and (iii) on the Security and Exchange Commission’s (“Commission”) website at http://www.sec.gov.
(i) The Funds and Portfolios file their complete schedules of portfolio holdings with the Commission for the first and third quarters of each fiscal year on Form N-Q; (ii) the Funds’ and Portfolios’ Forms N-Q are available on the Commission’s website at http://www.sec.gov; (iii) the Funds’ and Portfolios’ Forms N-Q may be reviewed and copied at the Commission’s Public Reference Room in Washington, DC and information on the operation of the Public Reference Room may be obtained by calling 1-800-SEC-0330; and (iv) the Funds’ and Portfolios’ Schedules of Investments will be available no later than 60 days after each period end, without charge, on the Funds’ website at www.investorfunds.us.hsbc.com.
An investment in a Fund is not a deposit of HSBC Bank USA, National Association, and is not insured or guaranteed by the Federal Deposit Insurance Corporation or any other government agency.
| |
HSBC INVESTOR FAMILY OF FUNDS | 52 |
(This Page Intentionally Left Blank)
| |
HSBC INVESTOR GROWTH PORTFOLIO |
|
Schedule of Portfolio Investments—as of October 31, 2010 |
| | | | | | | |
Common Stocks—98.1% | | | | | | | |
|
| | | | | | | |
| | Shares | | Value($) | |
| |
| |
| |
Aerospace & Defense – 2.9% | | | | | | | |
Goodrich Corp. | | | 11,800 | | | 968,426 | |
United Technologies Corp. | | | 25,200 | | | 1,884,204 | |
| | | | |
|
| |
| | | | | | 2,852,630 | |
| | | | |
|
| |
Air Freight & Logistics – 1.1% | | | | | | | |
C. H. Robinson Worldwide, Inc. | | | 16,100 | | | 1,134,728 | |
| | | | |
|
| |
Auto Components – 0.5% | | | | | | | |
BorgWarner, Inc. (a) | | | 9,700 | | | 544,267 | |
| | | | |
|
| |
Beverages – 1.0% | | | | | | | |
PepsiCo, Inc. | | | 14,800 | | | 966,440 | |
| | | | |
|
| |
Biotechnology – 1.0% | | | | | | | |
Celgene Corp. (a) | | | 16,700 | | | 1,036,569 | |
| | | | |
|
| |
Capital Markets – 5.4% | | | | | | | |
Franklin Resources, Inc. | | | 13,200 | | | 1,514,040 | |
Goldman Sachs Group, Inc. | | | 18,100 | | | 2,913,195 | |
TD AMERITRADE Holding Corp. (a) | | | 52,000 | | | 888,680 | |
| | | | |
|
| |
| | | | | | 5,315,915 | |
| | | | |
|
| |
Chemicals – 0.9% | | | | | | | |
Ecolab, Inc. | | | 17,900 | | | 882,828 | |
| | | | |
|
| |
Communications Equipment – 5.8% | | | | | | | |
Cisco Systems, Inc. (a) | | | 91,600 | | | 2,091,228 | |
Juniper Networks, Inc. (a) | | | 21,700 | | | 702,863 | |
QUALCOMM, Inc. | | | 64,100 | | | 2,892,833 | |
| | | | |
|
| |
| | | | | | 5,686,924 | |
| | | | |
|
| |
Computers & Peripherals – 8.6% | | | | | | | |
Apple, Inc. (a) | | | 16,480 | | | 4,958,338 | |
EMC Corp. (a) | | | 109,200 | | | 2,294,292 | |
NetApp, Inc. (a) | | | 22,700 | | | 1,208,775 | |
| | | | |
|
| |
| | | | | | 8,461,405 | |
| | | | |
|
| |
Construction & Engineering – 1.4% | | | | | | | |
Fluor Corp. | | | 28,600 | | | 1,378,234 | |
| | | | |
|
| |
Diversified Financial Services – 3.5% | | | | | | | |
CME Group, Inc. | | | 3,700 | | | 1,071,705 | |
IntercontinentalExchange, Inc. (a) | | | 7,700 | | | 884,499 | |
JP Morgan Chase & Co. | | | 40,100 | | | 1,508,963 | |
| | | | |
|
| |
| | | | | | 3,465,167 | |
| | | | |
|
| |
Electronic Equipment, Instruments & Components – 2.0% | | | | | | | |
Agilent Technologies, Inc. (a) | | | 27,200 | | | 946,560 | |
Amphenol Corp., Class A | | | 20,100 | | | 1,007,613 | |
| | | | |
|
| |
| | | | | | 1,954,173 | |
| | | | |
|
| |
Energy Equipment & Services – 4.2% | | | | | | | |
FMC Technologies, Inc. (a) | | | 25,700 | | | 1,852,970 | |
Schlumberger Ltd. | | | 33,200 | | | 2,320,348 | |
| | | | |
|
| |
| | | | | | 4,173,318 | |
| | | | |
|
| |
Financial Services – 2.8% | | | | | | | |
Visa, Inc., Class A | | | 35,800 | | | 2,798,486 | |
| | | | |
|
| |
Food & Staples Retailing – 1.0% | | | | | | | |
Costco Wholesale Corp. | | | 15,100 | | | 947,827 | |
| | | | |
|
| |
| | | | | | | |
Common Stocks, continued | | | | | | | |
|
|
| | Shares | | Value($) | |
| |
| |
| |
Food Products – 0.9% | | | | | | | |
Green Mountain Coffee Roasters, Inc. (a) | | | 25,600 | | | 844,544 | |
| | | | |
|
| |
Health Care Equipment & Supplies – 0.8% | | | | | | | |
Varian Medical Systems, Inc. (a) | | | 13,000 | | | 821,860 | |
| | | | |
|
| |
Health Care Providers & Services – 2.8% | | | | | | | |
Express Scripts, Inc. (a) | | | 56,300 | | | 2,731,676 | |
| | | | |
|
| |
Health Care Technology – 1.1% | | | | | | | |
Cerner Corp. (a) | | | 11,900 | | | 1,045,177 | |
| | | | |
|
| |
Hotels, Restaurants & Leisure – 2.2% | | | | | | | |
Ctrip.com International Ltd. ADR (a) | | | 20,400 | | | 1,062,228 | |
Yum! Brands, Inc. | | | 22,900 | | | 1,134,924 | |
| | | | |
|
| |
| | | | | | 2,197,152 | |
| | | | |
|
| |
Internet & Catalog Retail – 6.5% | | | | | | | |
Amazon.com, Inc. (a) | | | 14,500 | | | 2,394,530 | |
Netflix, Inc. (a) | | | 3,400 | | | 589,900 | |
Priceline.com, Inc. (a) | | | 9,000 | | | 3,391,290 | |
| | | | |
|
| |
| | | | | | 6,375,720 | |
| | | | |
|
| |
Internet Software & Services – 4.7% | | | | | | | |
Baidu, Inc. ADR (a) | | | 15,650 | | | 1,721,657 | |
Google, Inc., Class A (a) | | | 4,850 | | | 2,973,001 | |
| | | | |
|
| |
| | | | | | 4,694,658 | |
| | | | |
|
| |
IT Services – 4.1% | | | | | | | |
Cognizant Technology Solutions Corp. (a) | | | 61,600 | | | 4,015,704 | |
| | | | |
|
| |
Machinery – 6.0% | | | | | | | |
Danaher Corp. | | | 58,800 | | | 2,549,568 | |
Deere & Co. | | | 22,600 | | | 1,735,680 | |
Illinois Tool Works, Inc. | | | 35,500 | | | 1,622,350 | |
| | | | |
|
| |
| | | | | | 5,907,598 | |
| | | | |
|
| |
Media – 0.5% | | | | | | | |
Scripps Networks Interactive, Class A | | | 9,900 | | | 503,811 | |
| | | | |
|
| |
Metals & Mining – 2.8% | | | | | | | |
Cliffs Natural Resources, Inc. | | | 26,900 | | | 1,753,880 | |
Walter Energy, Inc. | | | 11,700 | | | 1,029,132 | |
| | | | |
|
| |
| | | | | | 2,783,012 | |
| | | | |
|
| |
Multiline Retail – 1.5% | | | | | | | |
Kohl’s Corp. (a) | | | 29,400 | | | 1,505,280 | |
| | | | |
|
| |
Oil, Gas & Consumable Fuels – 2.0% | | | | | | | |
Peabody Energy Corp. | | | 19,000 | | | 1,005,100 | |
Petroleo Brasileiro SA ADR | | | 31,200 | | | 973,128 | |
| | | | |
|
| |
| | | | | | 1,978,228 | |
| | | | |
|
| |
Personal Products – 1.0% | | | | | | | |
The Estee Lauder Cos., Inc., Class A | | | 14,600 | | | 1,039,082 | |
| | | | |
|
| |
Pharmaceuticals – 2.9% | | | | | | | |
Shire plc ADR | | | 20,900 | | | 1,465,090 | |
Teva Pharmaceutical Industries Ltd. ADR | | | 26,400 | | | 1,370,160 | |
| | | | |
|
| |
| | | | | | 2,835,250 | |
| | | | |
|
| |
Road & Rail – 3.0% | | | | | | | |
Union Pacific Corp. | | | 34,200 | | | 2,998,656 | |
| | | | |
|
| |
| | |
See notes to financial statements. | HSBC INVESTOR PORTFOLIOS | 54 |
| |
HSBC INVESTOR GROWTH PORTFOLIO |
|
Schedule of Portfolio Investments—as of October 31, 2010 (continued) |
| | | | | | | |
Common Stocks, continued | | | | | | | |
|
| | | | | | | |
| | Shares | | Value($) | |
| |
| |
| |
Semiconductors & Semiconductor Equipment – 1.1% | | | | | | | |
Texas Instruments, Inc. | | | 38,300 | | | 1,132,531 | |
| | | | |
|
| |
Software – 7.0% | | | | | | | |
Autodesk, Inc. (a) | | | 39,700 | | | 1,436,346 | |
Citrix Systems, Inc. (a) | | | 27,100 | | | 1,736,297 | |
Intuit, Inc. (a) | | | 13,200 | | | 633,600 | |
Oracle Corp. | | | 106,200 | | | 3,122,280 | |
| | | | |
|
| |
| | | | | | 6,928,523 | |
| | | | |
|
| |
Specialty Retail – 2.3% | | | | | | | |
Dick’s Sporting Goods, Inc. (a) | | | 17,500 | | | 504,350 | |
O’Reilly Automotive, Inc. (a) | | | 22,300 | | | 1,304,550 | |
Urban Outfitters, Inc. (a) | | | 13,600 | | | 418,472 | |
| | | | |
|
| |
| | | | | | 2,227,372 | |
| | | | |
|
| |
Textiles, Apparel & Luxury Goods – 1.0% | | | | | | | |
Nike, Inc., Class B | | | 11,600 | | | 944,704 | |
| | | | |
|
| |
| | | | | | | |
Wireless Telecommunication Services – 1.8% | | | | | | | |
American Tower Corp., Class A (a) | | | 33,600 | | | 1,734,096 | |
| | | | |
|
| |
TOTAL COMMON STOCKS
(COST $77,391,455) | | | | | | 96,843,545 | |
| | | | |
|
| |
| | | | | | | |
Investment Company—1.3% | | | | | | | |
|
|
|
|
|
|
|
|
Northern Institutional Diversified Assets
Portfolio, Institutional Shares, 0.04% (b) | | | 1,314,150 | | | 1,314,150 | |
| | | | |
|
| |
| | | | | | | |
TOTAL INVESTMENT COMPANY
(COST $1,314,150) | | | | | | 1,314,150 | |
| | | | |
|
| |
TOTAL INVESTMENTS
(COST $78,705,605) — 99.4% | | | | | | 98,157,695 | |
| | | | |
|
| |
| | |
| |
| Percentages indicated are based on net assets of $98,750,801. |
| | |
ADR — American Depositary Receipt
plc — Public Limited Company |
| |
(a) | Represents non-income producing security. |
| | |
(b) | The rate represents the annualized one-day yield that was in effect on October 31, 2010. |
| | |
55 | HSBC INVESTOR PORTFOLIOS | See notes to financial statements. |
| |
HSBC INVESTOR INTERNATIONAL EQUITY PORTFOLIO |
|
Schedule of Portfolio Investments—as of October 31, 2010 |
| | | | | | | |
Common Stocks—96.8% | | | | | | | |
|
| | | | | |
| | Shares | | Value($) | |
| |
| |
| |
Australia – 3.9% | | | | | | | |
Australia & New Zealand Banking Group Ltd. | | | 9,000 | | | 218,667 | |
Boral Ltd. | | | 51,520 | | | 221,491 | |
Incitec Pivot Ltd. | | | 46,600 | | | 169,763 | |
National Australia Bank Ltd. | | | 33,165 | | | 826,900 | |
Telstra Corp. Ltd. (a) | | | 70,200 | | | 183,554 | |
| | | | |
|
| |
| | | | | | 1,620,375 | |
| | | | |
|
| |
Austria – 0.8% | | | | | | | |
OMV AG | | | 8,600 | | | 321,273 | |
| | | | |
|
| |
Belgium – 1.3% | | | | | | | |
Delhaize Group SA | | | 5,634 | | | 393,502 | |
KBC Groep NV (b) | | | 3,300 | | | 143,531 | |
| | | | |
|
| |
| | | | | | 537,033 | |
| | | | |
|
| |
Brazil – 1.3% | | | | | | | |
Banco Do Brasil SA | | | 11,100 | | | 214,948 | |
Vale SA, Preferred ADR | | | 10,900 | | | 313,157 | |
| | | | |
|
| |
| | | | | | 528,105 | |
| | | | |
|
| |
Canada – 4.8% | | | | | | | |
Agrium, Inc. | | | 1,900 | | | 168,123 | |
Lundin Mining Corp. (b) | | | 45,600 | | | 288,913 | |
National Bank of Canada | | | 5,900 | | | 388,453 | |
Nexen, Inc. | | | 17,727 | | | 377,281 | |
Penn West Energy Trust | | | 20,523 | | | 467,585 | |
Suncor Energy, Inc. | | | 10,428 | | | 334,236 | |
| | | | |
|
| |
| | | | | | 2,024,591 | |
| | | | |
|
| |
China – 0.4% | | | | | | | |
China Petroleum & Chemical Corp. | | | 170,000 | | | 160,328 | |
| | | | |
|
| |
Denmark – 1.2% | | | | | | | |
Danske Bank A/S (b) | | | 18,800 | | | 500,075 | |
| | | | |
|
| |
France – 14.7% | | | | | | | |
Arkema | | | 4,200 | | | 271,369 | |
BNP Paribas SA | | | 8,986 | | | 657,131 | |
Bouygues SA | | | 12,600 | | | 555,217 | |
Cap Gemini SA | | | 7,900 | | | 402,970 | |
Compagnie Generale de Geophysique-
Veritas (b) | | | 7,000 | | | 163,165 | |
Electricite de France | | | 9,500 | | | 435,274 | |
France Telecom SA | | | 25,200 | | | 605,452 | |
Lagardere S.C.A | | | 10,300 | | | 439,248 | |
PPR | | | 1,300 | | | 213,109 | |
Renault SA (b) | | | 6,300 | | | 350,024 | |
Sanofi-Aventis | | | 9,400 | | | 656,404 | |
Societe Generale | | | 8,581 | | | 513,773 | |
Vallourec SA | | | 2,234 | | | 231,825 | |
Vivendi | | | 22,220 | | | 633,731 | |
| | | | |
|
| |
| | | | | | 6,128,692 | |
| | | | |
|
| |
Germany – 8.0% | | | | | | | |
Allianz SE | | | 5,800 | | | 726,816 | |
Bayer AG | | | 10,200 | | | 765,071 | |
Deutsche Bank AG | | | 6,800 | | | 393,843 | |
E.ON AG | | | 20,200 | | | 633,604 | |
| | | | | | | |
Common Stocks, continued | | | | | | | |
|
| | | | | | | |
| | Shares | | Value($) | |
| |
| |
| |
Germany, continued | | | | | | | |
Muenchener Rueckversicherungs-
Gesellschaft AG | | | 2,100 | | | 328,034 | |
Thyssenkrupp AG | | | 13,700 | | | 503,598 | |
| | | | |
|
| |
| | | | | | 3,350,966 | |
| | | | |
|
| |
Hong Kong – 1.5% | | | | | | | |
Esprit Holdings Ltd. | | | 57,577 | | | 310,133 | |
New World Development Co. Ltd. | | | 160,009 | | | 315,848 | |
| | | | |
|
| |
| | | | | | 625,981 | |
| | | | |
|
| |
Italy – 4.5% | | | | | | | |
ENI SpA | | | 25,200 | | | 567,754 | |
Telecom Italia RSP | | | 204,200 | | | 250,064 | |
Telecom Italia SpA | | | 286,200 | | | 438,899 | |
UniCredit SpA | | | 232,800 | | | 606,783 | |
| | | | |
|
| |
| | | | | | 1,863,500 | |
| | | | |
|
| |
Japan – 23.0% | | | | | | | |
AEON Co. Ltd. | | | 18,100 | | | 213,285 | |
Air Water, Inc. | | | 5,800 | | | 67,697 | |
Asahi Breweries Ltd. | | | 16,200 | | | 327,222 | |
Asahi Glass Co. Ltd. | | | 9,000 | | | 86,476 | |
DIC Corp. | | | 59,000 | | | 110,006 | |
Dowa Holdings Co. Ltd. | | | 19,800 | | | 120,351 | |
East Japan Railway Co. | | | 2,600 | | | 160,783 | |
ITOCHU Corp. | | | 39,700 | | | 348,393 | |
Japan Tobacco, Inc. | | | 179 | | | 556,914 | |
JFE Holdings, Inc. | | | 9,700 | | | 302,876 | |
JX Holdings, Inc. | | | 41,500 | | | 243,996 | |
KDDI Corp. | | | 62 | | | 334,083 | |
KONAMI Corp. | | | 6,300 | | | 111,043 | |
Konica Minolta Holdings, Inc. | | | 10,700 | | | 103,742 | |
Mitsubishi Corp. | | | 24,600 | | | 591,684 | |
Mitsubishi Materials Corp. (b) | | | 54,400 | | | 170,402 | |
Mitsui & Co. Ltd. | | | 33,000 | | | 518,894 | |
Mitsui Fudosan Co. Ltd. | | | 31,600 | | | 597,434 | |
NAMCO BANDAI Holdings, Inc. | | | 20,600 | | | 189,996 | |
NGK Spark Plug Co. Ltd. | | | 14,600 | | | 203,620 | |
Nippon Express Co. Ltd. | | | 33,000 | | | 131,262 | |
Nippon Telegraph & Telephone Corp. | | | 14,000 | | | 636,047 | |
Nissan Motor Co. Ltd. | | | 53,900 | | | 475,687 | |
Sharp Corp. | | | 39,800 | | | 393,300 | |
Sony Corp. | | | 16,910 | | | 565,418 | |
Sumitomo Electric Industries Ltd. | | | 21,500 | | | 274,462 | |
Sumitomo Mitsui Financial Group, Inc. | | | 15,500 | | | 464,711 | |
Sumitomo Realty & Development Co. Ltd. | | | 6,000 | | | 130,814 | |
Sumitomo Rubber Industries Ltd. | | | 6,200 | | | 66,817 | |
The Tokyo Electric Power Co., Inc. | | | 19,600 | | | 468,987 | |
Tokyo Gas Co. Ltd. | | | 49,000 | | | 230,839 | |
Toshiba Corp. | | | 86,900 | | | 435,310 | |
| | | | |
|
| |
| | | | | | 9,632,551 | |
| | | | |
|
| |
Kazakhstan – 0.3% | | | | | | | |
KazMunaiGas Exploration Production GDR | | | 7,050 | | | 121,260 | |
| | | | |
|
| |
| | |
See notes to financial statements. | HSBC INVESTOR PORTFOLIOS | 56 |
| |
HSBC INVESTOR INTERNATIONAL EQUITY PORTFOLIO |
|
Schedule of Portfolio Investments—as of October 31, 2010 (continued) |
| | | | | | | |
Common Stocks, continued | | | | | | | |
|
| | | | | |
| | Shares | | Value($) | |
| |
| |
| |
Netherlands – 1.3% | | | | | | | |
Koninklijke Ahold NV | | | 10,800 | | | 149,240 | |
Randstad Holding NV (b) | | | 8,593 | | | 408,963 | |
| | | | |
|
| |
| | | | | | 558,203 | |
| | | | |
|
| |
Norway – 0.4% | | | | | | | |
Petroleum Geo-Services ASA (b) | | | 12,150 | | | 151,940 | |
| | | | |
|
| |
Russian Federation – 0.3% | | | | | | | |
Gazprom OAO ADR | | | 5,600 | | | 122,752 | |
| | | | |
|
| |
South Korea – 1.4% | | | | | | | |
Hana Financial Group, Inc. | | | 4,400 | | | 124,949 | |
KB Financial Group, Inc. ADR | | | 3,679 | | | 165,187 | |
Samsung Electronics Co. Ltd., Preferred | | | 600 | | | 294,907 | |
| | | | |
|
| |
| | | | | | 585,043 | |
| | | | |
|
| |
Spain – 1.0% | | | | | | | |
Telefonica SA | | | 16,200 | | | 437,350 | |
| | | | |
|
| |
Switzerland – 2.3% | | | | | | | |
Novartis AG | | | 14,240 | | | 825,770 | |
UBS AG (b) | | | 8,783 | | | 148,734 | |
| | | | |
|
| |
| | | | | | 974,504 | |
| | | | |
|
| |
Taiwan – 0.6% | | | | | | | |
AU Optronics Corp. (b) | | | 210,030 | | | 209,598 | |
United Microelectronics Corp. | | | 118,000 | | | 56,084 | |
| | | | |
|
| |
| | | | | | 265,682 | |
| | | | |
|
| |
Turkey – 0.8% | | | | | | | |
Turkiye Garanti Bankasi AS | | | 30,900 | | | 189,623 | |
Turkiye Is Bankasi AS, Class C | | | 32,000 | | | 143,933 | |
| | | | |
|
| |
| | | | | | 333,556 | |
| | | | |
|
| |
United Kingdom – 23.0% | | | | | | | |
AstraZeneca plc | | | 17,300 | | | 867,384 | |
Aviva plc | | | 64,400 | | | 410,741 | |
BAE Systems plc | | | 82,300 | | | 454,497 | |
Barclays plc | | | 122,900 | | | 540,683 | |
BP plc | | | 101,900 | | | 695,136 | |
British American Tobacco plc | | | 5,400 | | | 205,902 | |
FirstGroup plc | | | 29,600 | | | 193,435 | |
Imperial Tobacco Group plc | | | 18,000 | | | 576,468 | |
Inchcape plc (b) | | | 27,440 | | | 153,294 | |
Informa plc | | | 20,900 | | | 145,990 | |
Marks & Spencer Group plc | | | 82,200 | | | 562,855 | |
Old Mutual plc | | | 257,800 | | | 536,516 | |
Rentokil Initial plc (b) | | | 60,700 | | | 96,372 | |
Rio Tinto plc | | | 14,000 | | | 905,252 | |
Royal Dutch Shell plc, A Shares | | | 44,687 | | | 1,449,249 | |
Thomas Cook Group plc | | | 39,000 | | | 113,030 | |
Tui Travel plc | | | 46,300 | | | 156,588 | |
Vodafone Group plc | | | 351,058 | | | 955,289 | |
Xstrata plc | | | 30,940 | | | 599,538 | |
| | | | |
|
| |
| | | | | | 9,618,219 | |
| | | | |
|
| |
TOTAL COMMON STOCKS
(COST $38,839,094) | | | | | | 40,461,979 | |
| | | | |
|
| |
| | | | | | | |
Investment Company—0.9% | | | | | | | |
|
| | | | | |
| | Shares | | Value($) | |
| |
| |
| |
Northern Institutional Diversified Assets
Portfolio, Institutional Shares, 0.04% (c) | | | 391,214 | | | 391,214 | |
| | | | |
|
| |
TOTAL INVESTMENT COMPANY
(COST $391,214) | | | | | | 391,214 | |
| | | | |
|
| |
TOTAL INVESTMENTS
(COST $39,230,308) — 97.7% | | | | | | 40,853,193 | |
| | | | |
|
| |
| |
|
| Percentages indicated are based on net assets of $41,817,594. |
| |
ADR — American Depositary Receipt |
GDR — Global Depositary Receipt |
plc — Public Limited Company |
| |
(a) | Rule 144A security or other security which is restricted as to resale to institutional investors. This security has been deemed liquid by the Investment Adviser based on procedures approved by the Board of Trustees. |
| |
(b) | Represents non-income producing security. |
| |
(c) | The rate represents the annualized one-day yield that was in effect on October 31, 2010. |
| |
Schedule of Portfolio Investments—October 31, 2010 |
|
The Portfolio invested, as a percentage of net assets, in the following industries, as of October 31, 2010:
| | | | |
Industry | | | Percent of Net Assets | |
| | |
| |
Commercial Banks | | | 13.4 | % | |
Oil, Gas & Consumable Fuels | | | 11.8 | % | |
Metals & Mining | | | 8.8 | % | |
Pharmaceuticals | | | 7.6 | % | |
Diversified Telecommunication Services | | | 6.3 | % | |
Insurance | | | 3.9 | % | |
Electric Utilities | | | 3.7 | % | |
Trading Companies & Distributors | | | 3.5 | % | |
Tobacco | | | 3.3 | % | |
Media | | | 3.1 | % | |
Wireless Telecommunication Services | | | 3.1 | % | |
Real Estate Management & Development | | | 2.6 | % | |
Household Durables | | | 2.4 | % | |
Automobiles | | | 2.1 | % | |
Food & Staples Retailing | | | 1.9 | % | |
Multiline Retail | | | 1.9 | % | |
Chemicals | | | 1.6 | % | |
Capital Markets | | | 1.4 | % | |
Construction & Engineering | | | 1.4 | % | |
Air Freight & Logistics | | | 1.4 | % | |
Computers & Peripherals | | | 1.1 | % | |
Investment Companies | | | 1.0 | % | |
IT Services | | | 1.0 | % | |
Professional Services | | | 1.0 | % | |
Road & Rail | | | 0.9 | % | |
Beverages | | | 0.8 | % | |
Energy Equipment & Services | | | 0.8 | % | |
Semiconductors & Semiconductor Equipment | | | 0.8 | % | |
Auto Components | | | 0.7 | % | |
Electrical Equipment | | | 0.7 | % | |
Hotels, Restaurants & Leisure | | | 0.7 | % | |
Specialty Retail | | | 0.7 | % | |
Machinery | | | 0.6 | % | |
Commercial Services & Supplies | | | 0.5 | % | |
Construction Materials | | | 0.5 | % | |
Electronic Equipment, Instruments & Components | | | 0.5 | % | |
Gas Utilities | | | 0.5 | % | |
Leisure Equipment & Products | | | 0.5 | % | |
Distributors | | | 0.4 | % | |
Diversified Financial Services | | | 0.4 | % | |
Software | | | 0.3 | % | |
Building Products | | | 0.2 | % | |
Office Electronics | | | 0.2 | % | |
| | |
| |
Total Investments | | | 100.0 | % | |
| | |
| |
| | |
57 | HSBC INVESTOR PORTFOLIOS | See notes to financial statements. |
| |
HSBC INVESTOR OPPORTUNITY PORTFOLIO |
|
Schedule of Portfolio Investments—as of October 31, 2010 |
| | | | | | | |
Common Stocks—97.1% | | | | | | | |
|
|
|
|
|
|
|
|
| | | | | | | |
| | Shares | | Value($) | |
| |
| |
| |
Aerospace & Defense – 2.2% | | | | | | | |
BE Aerospace, Inc. (a) | | | 84,600 | | | 3,109,896 | |
| | | | |
|
| |
Auto Components – 3.3% | | | | | | | |
Gentex Corp. | | | 125,800 | | | 2,513,484 | |
The Goodyear Tire & Rubber Co. (a) | | | 210,800 | | | 2,154,376 | |
| | | | |
|
| |
| | | | | | 4,667,860 | |
| | | | |
|
| |
Biotechnology – 2.9% | | | | | | | |
Alexion Pharmaceuticals, Inc. (a) | | | 59,800 | | | 4,084,340 | |
| | | | |
|
| |
Capital Markets – 1.8% | | | | | | | |
Waddell & Reed Financial, Inc., Class A | | | 87,900 | | | 2,555,253 | |
| | | | |
|
| |
Chemicals – 2.3% | | | | | | | |
Celanese Corp., Series A | | | 89,600 | | | 3,194,240 | |
| | | | |
|
| |
Commercial Banks – 1.0% | | | | | | | |
First Horizon National Corp. (a) | | | 1 | | | 10 | |
Huntington Bancshares, Inc. | | | 247,500 | | | 1,403,325 | |
| | | | |
|
| |
| | | | | | 1,403,335 | |
| | | | |
|
| |
Commercial Services & Supplies – 3.0% | | | | | | | |
Hertz Global Holdings, Inc. (a) | | | 178,900 | | | 2,025,148 | |
Waste Connections, Inc. | | | 52,450 | | | 2,136,813 | |
| | | | |
|
| |
| | | | | | 4,161,961 | |
| | | | |
|
| |
Communications Equipment – 2.0% | | | | | | | |
Brocade Communications Systems, Inc. (a) | | | 430,000 | | | 2,717,600 | |
| | | | |
|
| |
Containers & Packaging – 2.3% | | | | | | | |
Crown Holdings, Inc. (a) | | | 100,800 | | | 3,244,752 | |
| | | | |
|
| |
Diversified Consumer Services – 0.4% | | | | | | | |
New Oriental Education & Technology
Group, Inc. ADR (a) | | | 5,200 | | | 558,324 | |
| | | | |
|
| |
Diversified Financial Services – 1.6% | | | | | | | |
MSCI, Inc., Class A (a) | | | 60,800 | | | 2,179,680 | |
| | | | |
|
| |
Electrical Equipment – 2.1% | | | | | | | |
AMETEK, Inc. | | | 53,100 | | | 2,870,055 | |
| | | | |
|
| |
Energy Equipment & Services – 1.3% | | | | | | | |
Exterran Holdings, Inc. (a) | | | 70,000 | | | 1,761,900 | |
| | | | |
|
| |
Food Products – 3.1% | | | | | | | |
Green Mountain Coffee Roasters, Inc. (a) | | | 45,100 | | | 1,487,849 | |
Ralcorp Holdings, Inc. (a) | | | 45,450 | | | 2,820,627 | |
| | | | |
|
| |
| | | | | | 4,308,476 | |
| | | | |
|
| |
Health Care Equipment & Supplies – 3.7% | | | | | | | |
Hill-Rom Holdings, Inc. | | | 84,150 | | | 3,260,812 | |
IDEXX Laboratories, Inc. (a) | | | 31,050 | | | 1,861,758 | |
| | | | |
|
| |
| | | | | | 5,122,570 | |
| | | | |
|
| |
Health Care Providers & Services – 3.2% | | | | | | | |
Community Health Systems, Inc. (a) | | | 60,450 | | | 1,818,336 | |
Coventry Health Care, Inc. (a) | | | 89,200 | | | 2,089,064 | |
Skilled Healthcare Group, Inc., Class A (a) | | | 146,700 | | | 550,125 | |
| | | | |
|
| |
| | | | | | 4,457,525 | |
| | | | |
|
| |
| | | | | | | |
Common Stocks, continued | | | | | | | |
|
|
|
|
|
|
| | | | | |
| | Shares | | Value($) | |
| |
| |
| |
Hotels, Restaurants & Leisure – 4.7% | | | | | | | |
Ctrip.com International Ltd. ADR (a) | | | 59,600 | | | 3,103,372 | |
Scientific Games Corp., Class A (a) | | | 176,700 | | | 1,395,930 | |
WMS Industries, Inc. (a) | | | 48,350 | | | 2,109,510 | |
| | | | |
|
| |
| | | | | | 6,608,812 | |
| | | | |
|
| |
Household Products – 1.5% | | | | | | | |
Church & Dwight Co., Inc. | | | 32,300 | | | 2,126,955 | |
| | | | |
|
| |
Internet Software & Services – 2.2% | | | | | | | |
VeriSign, Inc. (a) | | | 86,200 | | | 2,995,450 | |
| | | | |
|
| |
IT Services – 1.6% | | | | | | | |
Alliance Data Systems Corp. (a) | | | 37,600 | | | 2,283,072 | |
| | | | |
|
| |
Life Sciences Tools & Services – 4.5% | | | | | | | |
Illumina, Inc. (a) | | | 31,250 | | | 1,697,188 | |
Life Technologies Corp. (a) | | | 49,600 | | | 2,488,928 | |
Mettler-Toledo International, Inc. (a) | | | 15,570 | | | 2,032,819 | |
| | | | |
|
| |
| | | | | | 6,218,935 | |
| | | | |
|
| |
Machinery – 5.1% | | | | | | | |
Crane Co. | | | 60,000 | | | 2,295,600 | |
IDEX Corp. | | | 72,100 | | | 2,601,368 | |
Snap-on, Inc. | | | 42,050 | | | 2,144,550 | |
| | | | |
|
| |
| | | | | | 7,041,518 | |
| | | | |
|
| |
Media – 2.5% | | | | | | | |
DreamWorks Animation SKG, Inc. (a) | | | 57,900 | | | 2,043,870 | |
Lamar Advertising Co. (a) | | | 40,400 | | | 1,373,196 | |
| | | | |
|
| |
| | | | | | 3,417,066 | |
| | | | |
|
| |
Metals & Mining – 2.0% | | | | | | | |
Compass Minerals International, Inc. | | | 35,630 | | | 2,810,138 | |
| | | | |
|
| |
Oil, Gas & Consumable Fuels – 9.2% | | | | | | | |
Consol Energy, Inc. | | | 83,880 | | | 3,083,429 | |
Denbury Resources, Inc. (a) | | | 148,700 | | | 2,530,874 | |
Ensco International plc ADR | | | 79,600 | | | 3,688,664 | |
Massey Energy Co. | | | 85,000 | | | 3,575,950 | |
| | | | |
|
| |
| | | | | | 12,878,917 | |
| | | | |
|
| |
Pharmaceuticals – 2.5% | | | | | | | |
Elan Corp. plc ADR (a) | | | 261,700 | | | 1,426,265 | |
Santarus, Inc. (a) | | | 179,200 | | | 560,896 | |
ViroPharma, Inc. (a) | | | 88,800 | | | 1,452,768 | |
| | | | |
|
| |
| | | | | | 3,439,929 | |
| | | | |
|
| |
Real Estate Investment Trusts (REITs) – 1.8% | | | | | | | |
Hospitality Properties Trust | | | 112,900 | | | 2,575,249 | |
| | | | |
|
| |
Road & Rail – 1.7% | | | | | | | |
Landstar System, Inc. | | | 61,650 | | | 2,319,273 | |
| | | | |
|
| |
Semiconductors & Semiconductor
Equipment – 6.7% | | | | | | | |
Lam Research Corp. (a) | | | 32,900 | | | 1,506,491 | |
LSI Corp. (a) | | | 418,300 | | | 2,191,892 | |
NXP Semiconductors N.V. (a) | | | 107,500 | | | 1,417,925 | |
ON Semiconductor Corp. (a) | | | 353,300 | | | 2,709,811 | |
Skyworks Solutions, Inc. (a) | | | 67,100 | | | 1,537,261 | |
| | | | |
|
| |
| | | | | | 9,363,380 | |
| | | | |
|
| |
| | |
See notes to financial statements. | HSBC INVESTOR PORTFOLIOS | 58 |
| |
HSBC INVESTOR OPPORTUNITY PORTFOLIO |
|
Schedule of Portfolio Investments—as of October 31, 2010 (continued) |
| | | | | | | |
Common Stocks, continued | | | | | | | |
|
|
|
|
|
|
|
|
| | | | | | | |
| | Shares | | Value($) | |
| |
| |
| |
Software – 6.0% | | | | | | | |
BMC Software, Inc. (a) | | | 46,550 | | | 2,116,163 | |
Check Point Software Technologies Ltd. (a) | | | 74,750 | | | 3,195,562 | |
Nuance Communications, Inc. (a) | | | 192,950 | | | 3,031,245 | |
| | | | |
|
| |
| | | | | | 8,342,970 | |
| | | | |
|
| |
Specialty Retail – 3.3% | | | | | | | |
Hibbett Sports, Inc. (a) | | | 77,950 | | | 2,100,753 | |
O’Reilly Automotive, Inc. (a) | | | 42,750 | | | 2,500,875 | |
| | | | |
|
| |
| | | | | | 4,601,628 | |
| | | | |
|
| |
Textiles, Apparel & Luxury Goods – 2.1% | | | | | | | |
Fossil, Inc. (a) | | | 50,000 | | | 2,949,500 | |
| | | | |
|
| |
Trading Companies & Distributors – 1.4% | | | | | | | |
WESCO International, Inc. (a) | | | 45,850 | | | 1,963,297 | |
| | | | |
|
| |
Wireless Telecommunication Services – 2.1% | | | | | | | |
NII Holdings, Inc. (a) | | | 71,500 | | | 2,989,415 | |
| | | | |
|
| |
TOTAL COMMON STOCKS
(COST $117,123,678) | | | | | | 135,323,271 | |
| | | | |
|
| |
Investment Company—2.8% | | | | | | | |
|
|
|
|
|
|
|
|
Northern Institutional Government Select
Portfolio, Shares Class, 0.02% (b) | | | 3,971,916 | | | 3,971,916 | |
| | | | |
|
| |
TOTAL INVESTMENT COMPANY
(COST $3,971,916) | | | | | | 3,971,916 | |
| | | | |
|
| |
TOTAL INVESTMENTS
(COST $121,095,594) — 99.9% | | | | | | 139,295,187 | |
| | | | |
|
| |
| | |
| |
| Percentages indicated are based on net assets of $139,401,552. |
ADR — American Depositary Receipt
plc — Public Limited Company
| |
(a) | Represents non-income producing security. |
| |
(b) | The rate represents the annualized one-day yield that was in effect on October 31, 2010. |
| | |
59 | HSBC INVESTOR PORTFOLIOS | See notes to financial statements. |
| |
HSBC INVESTOR VALUE PORTFOLIO |
|
Schedule of Portfolio Investments—as of October 31, 2010 |
| | | | | | | |
Common Stocks—94.2% | | | | | | | |
|
|
|
|
|
|
|
|
| | | | | | | |
| | Shares | | Value($) | |
| |
| |
| |
Aerospace & Defense – 3.7% | | | | | | | |
Lockheed Martin Corp. | | | 18,400 | | | 1,311,736 | |
Raytheon Co. | | | 13,400 | | | 617,472 | |
| | | | |
|
| |
| | | | | | 1,929,208 | |
| | | | |
|
| |
Biotechnology – 4.3% | | | | | | | |
Amgen, Inc. (a) | | | 39,000 | | | 2,230,410 | |
| | | | |
|
| |
Capital Markets – 1.0% | | | | | | | |
Goldman Sachs Group, Inc. | | | 3,200 | | | 515,040 | |
| | | | |
|
| |
Commercial Banks – 2.2% | | | | | | | |
Wells Fargo & Co. | | | 42,700 | | | 1,113,616 | |
| | | | |
|
| |
Commercial Services & Supplies – 1.7% | | | | | | | |
Pitney Bowes, Inc. | | | 39,500 | | | 866,630 | |
| | | | |
|
| |
Communications Equipment – 4.7% | | | | | | | |
Motorola, Inc. (a) | | | 297,700 | | | 2,426,255 | |
| | | | |
|
| |
Diversified Financial Services – 3.8% | | | | | | | |
Citigroup, Inc. (a) | | | 277,000 | | | 1,155,090 | |
JP Morgan Chase & Co. | | | 22,150 | | | 833,505 | |
| | | | |
|
| |
| | | | | | 1,988,595 | |
| | | | |
|
| |
Energy Equipment & Services – 1.3% | | | | | | | |
Halliburton Co. | | | 21,500 | | | 684,990 | |
| | | | |
|
| |
Food & Staples Retailing – 2.1% | | | | | | | |
CVS Caremark Corp. | | | 14,800 | | | 445,776 | |
Kroger Co. (The) | | | 28,200 | | | 620,400 | |
| | | | |
|
| |
| | | | | | 1,066,176 | |
| | | | |
|
| |
Health Care Providers & Services – 1.2% | | | | | | | |
Aetna, Inc. | | | 20,800 | | | 621,088 | |
| | | | |
|
| |
Household Products – 1.3% | | | | | | | |
Kimberly-Clark Corp. | | | 11,000 | | | 696,740 | |
| | | | |
|
| |
Independent Power Producers & Energy
Traders – 1.3% | | | | | | | |
NRG Energy, Inc. (a) | | | 33,800 | | | 672,958 | |
| | | | |
|
| |
Insurance – 16.9% | | | | | | | |
Aon Corp. | | | 38,500 | | | 1,530,375 | |
Genworth Financial, Inc., Class A (a) | | | 81,300 | | | 921,942 | |
Lincoln National Corp. | | | 25,900 | | | 634,032 | |
Loews Corp. | | | 41,240 | | | 1,628,155 | |
MetLife, Inc. | | | 42,000 | | | 1,693,860 | |
The Hartford Financial Services Group, Inc. | | | 43,900 | | | 1,052,722 | |
Unum Group | | | 56,100 | | | 1,257,762 | |
| | | | |
|
| |
| | | | | | 8,718,848 | |
| | | | |
|
| |
Machinery – 1.8% | | | | | | | |
Ingersoll-Rand plc | | | 23,900 | | | 939,509 | |
| | | | |
|
| |
Media – 6.2% | | | | | | | |
CBS Corp., Class B | | | 11,950 | | | 202,313 | |
Time Warner, Inc. | | | 24,900 | | | 809,499 | |
Viacom, Inc., Class B | | | 56,500 | | | 2,180,335 | |
| | | | |
|
| |
| | | | | | 3,192,147 | |
| | | | |
|
| |
| | | | | | | |
Common Stocks, continued | | | | | | | |
|
|
|
|
|
|
|
|
| | | | | | | |
| | Shares | | Value($) | |
| |
| |
| |
Metals & Mining – 8.2% | | | | | | | |
AngloGold Ashanti Ltd. ADR | | | 40,727 | | | 1,918,649 | |
Barrick Gold Corp. | | | 48,000 | | | 2,308,320 | |
| | | | |
|
| |
| | | | | | 4,226,969 | |
| | | | |
|
| |
Oil, Gas & Consumable Fuels – 13.1% | | | | | | | |
Apache Corp. | | | 19,400 | | | 1,959,788 | |
Canadian Natural Resources Ltd. | | | 32,000 | | | 1,167,040 | |
Hess Corp. | | | 12,100 | | | 762,663 | |
Noble Energy, Inc. | | | 13,310 | | | 1,084,499 | |
Occidental Petroleum Corp. | | | 12,000 | | | 943,560 | |
Talisman Energy, Inc. | | | 46,600 | | | 845,324 | |
| | | | |
|
| |
| | | | | | 6,762,874 | |
| | | | |
|
| |
Pharmaceuticals – 8.5% | | | | | | | |
Merck & Co., Inc. | | | 37,600 | | | 1,364,128 | |
Pfizer, Inc. | | | 92,000 | | | 1,600,800 | |
Sanofi-Aventis ADR | | | 41,500 | | | 1,457,065 | |
| | | | |
|
| |
| | | | | | 4,421,993 | |
| | | | |
|
| |
Road & Rail – 1.7% | | | | | | | |
Union Pacific Corp. | | | 10,000 | | | 876,800 | |
| | | | |
|
| |
Software – 7.2% | | | | | | | |
CA, Inc. | | | 112,800 | | | 2,618,088 | |
Microsoft Corp. | | | 40,900 | | | 1,089,576 | |
| | | | |
|
| |
| | | | | | 3,707,664 | |
| | | | |
|
| |
Tobacco – 2.0% | | | | | | | |
Philip Morris International, Inc. | | | 18,100 | | | 1,058,850 | |
| | | | |
|
| |
TOTAL COMMON STOCKS
(COST $47,273,100) | | | | | | 48,717,360 | |
| | | | |
|
| |
Investment Company—6.5% | | | | | | | |
|
|
|
|
|
|
|
|
Northern Institutional Government Select
Portfolio, Shares Class, 0.02% (b) | | | 3,379,613 | | | 3,379,613 | |
| | | | |
|
| |
TOTAL INVESTMENT COMPANY
(COST $3,379,613) | | | | | | 3,379,613 | |
| | | | |
|
| |
TOTAL INVESTMENTS
(COST $50,652,713) — 100.7% | | | | | | 52,096,973 | |
| | | | |
|
| |
| | |
| |
| Percentages indicated are based on net assets of $51,742,652. |
ADR — American Depositary Receipt
plc — Public Limited Company
| |
(a) | Represents non-income producing security. |
| |
(b) | The rate represents the annualized one-day yield that was in effect on October 31, 2010. |
| | |
See notes to financial statements. | HSBC INVESTOR PORTFOLIOS | 60 |
HSBC INVESTOR PORTFOLIOS
Statements of Assets and Liabilities—as of October 31, 2010
| | | | | | | | | | | | | |
| | Growth
Portfolio | | International
Equity
Portfolio | | Opportunity
Portfolio | | Value
Portfolio | |
|
|
|
|
|
|
|
|
|
|
Assets: | | | | | | | | | | | | | |
Investments in non-affiliates, at value | | $ | 98,157,695 | | $ | 40,853,193 | | $ | 139,295,187 | | $ | 52,096,973 | |
Foreign currency, at value | | | — | | | 369,458 | | | — | | | — | |
Dividends receivable | | | 25,966 | | | 127,818 | | | 79,334 | | | 20,518 | |
Receivable for investments sold | | | 1,751,496 | | | 587,832 | | | 682,522 | | | — | |
Prepaid expenses and other assets | | | 103 | | | 354 | | | 153 | | | 60 | |
| |
|
| |
|
| |
|
| |
|
| |
Total Assets | | | 99,935,260 | | | 41,938,655 | | | 140,057,196 | | | 52,117,551 | |
| |
|
| |
|
| |
|
| |
|
| |
| | | | | | | | | | | | | |
Liabilities: | | | | | | | | | | | | | |
Cash overdraft | | | — | | | 1,159 | | | — | | | — | |
Payable for investments purchased | | | 1,119,622 | | | 66,237 | | | 539,264 | | | 340,035 | |
Accrued expenses and other liabilities: | | | | | | | | | | | | | |
Investment Management | | | 47,529 | | | 31,785 | | | 92,434 | | | 22,878 | |
Administration | | | 1,938 | | | 821 | | | 2,718 | | | 1,025 | |
Compliance Services | | | 2 | | | 1 | | | 3 | | | 1 | |
Accounting | | | 24 | | | 285 | | | 4 | | | 31 | |
Custodian | | | — | | | 15,958 | | | — | | | — | |
Trustee | | | 167 | | | — | | | 240 | | | 91 | |
Other | | | 15,177 | | | 4,815 | | | 20,981 | | | 10,838 | |
| |
|
| |
|
| |
|
| |
|
| |
Total Liabilities | | | 1,184,459 | | | 121,061 | | | 655,644 | | | 374,899 | |
| |
|
| |
|
| |
|
| |
|
| |
Applicable to investors’ beneficial interest | | $ | 98,750,801 | | $ | 41,817,594 | | $ | 139,401,552 | | $ | 51,742,652 | |
| |
|
| |
|
| |
|
| |
|
| |
Total Investments, at cost | | $ | 78,705,605 | | $ | 39,230,308 | | $ | 121,095,594 | | $ | 50,652,713 | |
| |
|
| |
|
| |
|
| |
|
| |
Foreign currency, at cost | | $ | — | | $ | 366,489 | | $ | — | | $ | — | |
| |
|
| |
|
| |
|
| |
|
| |
| | |
61 | HSBC INVESTOR PORTFOLIOS | See notes to financial statements. |
HSBC INVESTOR PORTFOLIOS
Statements of Operations—For the year ended October 31, 2010
| | | | | | | | | | | | | |
| | Growth
Portfolio | | International
Equity
Portfolio | | Opportunity
Portfolio | | Value
Portfolio | |
|
|
|
|
|
|
|
|
|
|
|
|
|
|
Investment Income: | | | | | | | | | | | | | |
Dividends | | $ | 580,486 | | $ | 5,293,058 | | $ | 713,126 | | $ | 764,593 | |
Foreign tax withholding | | | — | | | (726,788 | ) | | — | | | (5,363 | ) |
| |
|
| |
|
| |
|
| |
|
| |
Total Investment Income | | | 580,486 | | | 4,566,270 | | | 713,126 | | | 759,230 | |
| |
|
| |
|
| |
|
| |
|
| |
| | | | | | | | | | | | | |
Expenses: | | | | | | | | | | | | | |
Investment Management | | | 520,858 | | | 1,111,069 | | | 1,058,022 | | | 258,230 | |
Administration | | | 19,646 | | | 33,110 | | | 28,676 | | | 10,664 | |
Accounting | | | 44,999 | | | 84,614 | | | 45,232 | | | 44,550 | |
Compliance Services | | | 403 | | | 392 | | | 588 | | | 218 | |
Custodian | | | 8,588 | | | 111,754 | | | 15,459 | | | 3,865 | |
Printing | | | 5,755 | | | 7,077 | | | 7,901 | | | 3,108 | |
Professional | | | 5,846 | | | 3,491 | | | 8,318 | | | 4,615 | |
Trustee | | | 1,370 | | | 2,406 | | | 2,009 | | | 748 | |
Other | | | 7,024 | | | (7,604 | ) | | 8,707 | | | 3,310 | |
| |
|
| |
|
| |
|
| |
|
| |
Total Expenses | | | 614,489 | | | 1,346,309 | | | 1,174,912 | | | 329,308 | |
| |
|
| |
|
| |
|
| |
|
| |
Net Investment Income (Loss) | | | (34,003 | ) | | 3,219,961 | | | (461,786 | ) | | 429,922 | |
| |
|
| |
|
| |
|
| |
|
| |
| | | | | | | | | | | | | |
Net Realized/Unrealized Gains (Losses) from Investments: | | | | | | | | | | | | | |
Net realized gains (losses) from investments and foreign currency transactions | | | 4,569,747 | | | (24,730,645 | ) | | 17,836,311 | | | 1,033,776 | |
Change in unrealized appreciation/depreciation from investments and foreign currencies | | | 12,751,375 | | | 13,409,621 | | | 17,016,734 | | | 5,043,263 | |
| |
|
| |
|
| |
|
| |
|
| |
Net realized/unrealized gains from investments and foreign currency transactions | | | 17,321,122 | | | (11,321,024 | ) | | 34,853,045 | | | 6,077,039 | |
| |
|
| |
|
| |
|
| |
|
| |
Change In Net Assets Resulting From Operations | | $ | 17,287,119 | | $ | (8,101,063 | ) | $ | 34,391,259 | | $ | 6,506,961 | |
| |
|
| |
|
| |
|
| |
|
| |
| | |
See notes to financial statements. | HSBC INVESTOR PORTFOLIOS | 62 |
HSBC INVESTOR PORTFOLIOS
Statements of Changes in Net Assets
| | | | | | | | | | | | | |
| | Growth
Portfolio | | International Equity
Portfolio | |
|
|
|
|
|
|
| | For the
year ended
October 31, 2010 | | For the
year ended
October 31, 2009 | | For the
year ended
October 31, 2010 | | For the
year ended
October 31, 2009 | |
|
|
|
|
|
|
|
|
|
|
|
|
|
|
Investment Activities: | | | | | | | | | | | | | |
Operations: | | | | | | | | | | | | | |
Net investment income (loss) | | $ | (34,003 | ) | $ | 136,286 | | $ | 3,219,961 | | $ | 4,063,044 | |
Net realized gains (losses) from investments transactions | | | 4,569,747 | | | (12,681,042 | ) | | (24,730,645 | ) | | (72,712,532 | ) |
Change in unrealized appreciation/depreciation from investments and foreign currencies | | | 12,751,375 | | | 26,751,782 | | | 13,409,621 | | | 109,291,830 | |
| |
|
| |
|
| |
|
| |
|
| |
Change in net assets resulting from operations | | | 17,287,119 | | | 14,207,026 | | | (8,101,063 | ) | | 40,642,342 | |
| |
|
| |
|
| |
|
| |
|
| |
Proceeds from contributions | | | 10,138,077 | | | 8,763,453 | | | 15,234,642 | | | 23,984,676 | |
Value of withdrawals | | | (16,837,279 | ) | | (16,749,107 | ) | | (182,464,190 | ) | | (46,787,723 | ) |
| |
|
| |
|
| |
|
| |
|
| |
Change in net assets resulting from transactions in investors’ beneficial interest | | | (6,699,202 | ) | | (7,985,654 | ) | | (167,229,548 | ) | | (22,803,047 | ) |
| |
|
| |
|
| |
|
| |
|
| |
Change in net assets | | | 10,587,917 | | | 6,221,372 | | | (175,330,611 | ) | | 17,839,295 | |
| | | | | | | | | | | | | |
Net Assets: | | | | | | | | | | | | | |
Beginning of period | | | 88,162,884 | | | 81,941,512 | | | 217,148,205 | | | 199,308,910 | |
| |
|
| |
|
| |
|
| |
|
| |
End of period | | $ | 98,750,801 | | $ | 88,162,884 | | $ | 41,817,594 | | $ | 217,148,205 | |
| |
|
| |
|
| |
|
| |
|
| |
| | |
63 | HSBC INVESTOR PORTFOLIOS | See notes to financial statements. |
HSBC INVESTOR PORTFOLIOS
Statements of Changes in Net Assets (continued)
| | | | | | | | | | | | | |
| | Opportunity
Portfolio | | Value
Portfolio | |
|
|
|
|
|
|
| | | For the
year ended
October 31, 2010 | | | For the
year ended
October 31, 2009 | | | For the
year ended
October 31, 2010 | | | For the
year ended
October 31, 2009 | |
|
|
|
|
|
|
|
|
|
|
|
|
|
|
Investment Activities: | | | | | | | | | | | | | |
Operations: | | | | | | | | | | | | | |
Net investment income (loss) | | $ | (461,786 | ) | $ | (424,078 | ) | $ | 429,922 | | $ | 644,544 | |
Net realized gains (losses) from investments transactions | | | 17,836,311 | | | (15,580,861 | ) | | 1,033,776 | | | (1,577,886 | ) |
Change in unrealized appreciation/depreciation from investments and foreign currencies | | | 17,016,734 | | | 31,798,950 | | | 5,043,263 | | | 9,018,297 | |
| |
|
| |
|
| |
|
| |
|
| |
Change in net assets resulting from operations | | | 34,391,259 | | | 15,794,011 | | | 6,506,961 | | | 8,084,955 | |
| |
|
| |
|
| |
|
| |
|
| |
Proceeds from contributions | | | 10,306,391 | | | 8,367,302 | | | 6,794,273 | | | 4,852,585 | |
Value of withdrawals | | | (35,044,419 | ) | | (22,382,631 | ) | | (11,244,738 | ) | | (12,914,556 | ) |
| |
|
| |
|
| |
|
| |
|
| |
Change in net assets resulting from transactions in investors’ beneficial interest | | | (24,738,028 | ) | | (14,015,329 | ) | | (4,450,465 | ) | | (8,061,971 | ) |
| |
|
| |
|
| |
|
| |
|
| |
Change in net assets | | | 9,653,231 | | | 1,778,682 | | | 2,056,496 | | | 22,984 | |
| | | | | | | | | | | | | |
Net Assets: | | | | | | | | | | | | | |
Beginning of period | | | 129,748,321 | | | 127,969,639 | | | 49,686,156 | | | 49,663,172 | |
| |
|
| |
|
| |
|
| |
|
| |
End of period | | $ | 139,401,552 | | $ | 129,748,321 | | $ | 51,742,652 | | $ | 49,686,156 | |
| |
|
| |
|
| |
|
| |
|
| |
| | |
See notes to financial statements. | HSBC INVESTOR PORTFOLIOS | 64 |
|
HSBC INVESTOR PORTFOLIOS |
|
Financial Highlights |
| | | | | | | | | | | | | | | | | | | | | |
| | | | | Ratio/Supplementary Data | |
| | | | |
| |
| | Total
Return | | Net Assets
at End of
Period
(000’s) | | Ratio of Net
Expenses
to Average
Net Assets | | Ratio of Net
Investment
Income (Loss)
to Average
Net Assets | | Ratio of
Expenses
to Average
Net Assets(a) | | Portfolio
Turnover | |
|
|
|
|
|
|
|
|
|
|
|
|
|
|
GROWTH PORTFOLIO | | | | | | | | | | | | | | | | | | | |
Year Ended October 31, 2006 | | 7.53 | % | | | $ | 59,828 | | | 0.69 | % | | 0.38 | % | | 0.69 | % | | 75.06 | % | |
Year Ended October 31, 2007 | | 31.11 | % | | | | 89,686 | | | 0.62 | % | | 0.45 | % | | 0.62 | % | | 57.04 | % | |
Year Ended October 31, 2008 | | (37.75 | )%(b) | | | | 81,942 | | | 0.62 | % | | 0.19 | % | | 0.62 | % | | 157.87 | % | |
Year Ended October 31, 2009 | | 19.31 | % | | | | 88,163 | | | 0.69 | % | | 0.17 | % | | 0.69 | % | | 65.67 | % | |
Year Ended October 31, 2010 | | 20.34 | % | | | | 98,751 | | | 0.68 | % | | (0.04 | )% | | 0.68 | % | | 89.14 | % | |
|
|
|
|
|
|
|
|
|
|
|
|
|
|
|
|
|
|
|
|
|
|
INTERNATIONAL EQUITY PORTFOLIO | | | | | | | | | | | | | | | | | | | | | |
Year Ended October 31, 2006 | | 32.79 | % | | | | 333,755 | | | 0.86 | % | | 2.03 | % | | 0.86 | % | | 33.39 | % | |
Year Ended October 31, 2007 | | 25.17 | % | | | | 455,062 | | | 0.79 | % | | 2.16 | % | | 0.79 | % | | 26.08 | % | |
Year Ended October 31, 2008 | | (51.79 | )% | | | | 199,309 | | | 0.76 | % | | 2.65 | % | | 0.76 | % | | 28.98 | % | |
Year Ended October 31, 2009 | | 24.16 | % | | | | 217,148 | | | 0.88 | % | | 2.23 | % | | 0.88 | % | | 58.31 | % | |
Year Ended October 31, 2010 | | 6.15 | % | | | | 41,818 | | | 0.87 | % | | 2.07 | % | | 0.87 | % | | 63.35 | % | |
|
|
|
|
|
|
|
|
|
|
|
|
|
|
|
|
|
|
|
|
|
|
OPPORTUNITY PORTFOLIO | | | | | | | | | | | | | | | | | | | | | |
Year Ended October 31, 2006 | | 19.54 | % | | | | 241,495 | | | 0.91 | % | | (0.40 | )% | | 0.91 | % | | 60.83 | % | |
Year Ended October 31, 2007 | | 30.54 | % | | | | 224,268 | | | 0.91 | % | | (0.55 | )% | | 0.91 | % | | 69.41 | % | |
Year Ended October 31, 2008 | | (35.30 | )% | | | | 127,970 | | | 0.87 | % | | (0.46 | )% | | 0.87 | % | | 80.42 | % | |
Year Ended October 31, 2009 | | 15.41 | % | | | | 129,748 | | | 0.90 | % | | (0.37 | )% | | 0.90 | % | | 64.91 | % | |
Year Ended October 31, 2010 | | 28.74 | % | | | | 139,402 | | | 0.89 | % | | (0.35 | )% | | 0.89 | % | | 67.62 | % | |
|
|
|
|
|
|
|
|
|
|
|
|
|
|
|
|
|
|
|
|
|
|
VALUE PORTFOLIO | | | | | | | | | | | | | | | | | | | | | |
Year Ended October 31, 2006 | | 22.21 | % | | | | 67,432 | | | 0.71 | % | | 1.23 | % | | 0.71 | % | | 20.63 | % | |
Year Ended October 31, 2007 | | 10.28 | % | | | | 82,658 | | | 0.66 | % | | 1.29 | % | | 0.66 | % | | 18.67 | % | |
Year Ended October 31, 2008 | | (39.91 | )% | | | | 49,663 | | | 0.64 | % | | 1.54 | % | | 0.64 | % | | 24.61 | % | |
Year Ended October 31, 2009 | | 20.05 | % | | | | 49,686 | | | 0.68 | % | | 1.41 | % | | 0.68 | % | | 19.77 | % | |
Year Ended October 31, 2010 | | 13.56 | % | | | | 51,743 | | | 0.67 | % | | 0.87 | % | | 0.67 | % | | 26.36 | % | |
|
|
|
|
|
|
|
|
|
|
|
|
|
|
|
|
|
|
|
|
|
|
| |
(a) | Excludes fee reductions. If such fee reductions had not occurred, the ratio would have been as indicated. |
| |
(b) | During the year ended October 31, 2008, Winslow Capital Management, Inc. reimbursed $64,658 to the Growth Portfolio related to violations of certain investment policies and limitations. The corresponding impact to the total return was 0.08%. |
| | |
65 | HSBC INVESTOR PORTFOLIOS | See notes to financial statements. |
|
HSBC INVESTOR PORTFOLIOS |
|
Notes to Financial Statements—as of October 31, 2010 |
| |
1. | Organization: |
| |
| The HSBC Investor Portfolios (the “Portfolio Trust”), is an open-end management investment company organized as a New York trust under the laws of the State of New York on November 1, 1994. The Portfolio Trust contains the following master funds (individually a “Portfolio,” collectively the “Portfolios”): |
| | |
Portfolio | | Short Name |
| |
|
HSBC Investor Growth Portfolio | | Growth Portfolio |
HSBC Investor International Equity Portfolio | | International Equity Portfolio |
HSBC Investor Opportunity Portfolio | | Opportunity Portfolio |
HSBC Investor Value Portfolio | | Value Portfolio |
| |
| The Portfolios operate as master funds in master-feeder arrangements, in which other funds invest all or part of their investable assets in the Portfolios. The Portfolios also receive investments from funds of funds. The Declaration of Trust permits the Board of Trustees to issue an unlimited number of beneficial interests in the Portfolios. |
| |
| The Portfolios are diversified series of the Portfolio Trust and are part of the HSBC Investor Family of Funds. Financial statements for all other funds of the HSBC Investor Family of Funds are published separately. |
| |
| Under the Portfolio Trust’s organizational documents, the Portfolio Trust’s Officers and Trustees are indemnified against certain liabilities arising out of the performance of their duties to the Portfolios. In addition, in the normal course of business, the Portfolio Trust may enter into contracts with its service providers, which also provide for indemnifications by the Portfolios. The Portfolios’ maximum exposure under these arrangements is unknown as this would involve any future claims that may be made against the Portfolios. However, based on experience, the Portfolio Trust expects that risk of loss to be remote. |
| |
2. | Significant Accounting Policies: |
| |
| The following is a summary of the significant accounting policies followed by the Portfolios in the preparation of their financial statements. The policies are in conformity with U.S. generally accepted accounting principles (“GAAP”). The preparation of financial statements requires management to make certain estimates and assumptions that affect the reported amounts of assets and liabilities and disclosure of contingent assets and liabilities at the date of the financial statements and the reported amounts of increases and decreases in net assets from operations during the reporting period. Actual results could differ from those estimates. Management has evaluated events and transactions through the date the financial statements were available to be issued, for purposes of recognition or disclosure in these financial statements. |
| |
| Securities Valuation: |
| |
| The Portfolios record their investments at fair value. Fair value is defined as the price that would be received to sell an asset or paid to transfer a liability in an orderly transaction between market participants at the measurement date. The valuation techniques used to determine fair value are further described in Note 3 below. |
| |
| Investment Transactions and Related Income: |
| |
| Investment transactions are accounted for no later than one business day after trade date. For financial reporting purposes, changes in holdings are accounted for on trade date on the last business day of the reporting period. Investment gains and losses are calculated on the identified cost basis. Interest income is recognized on the accrual basis and includes, where applicable, the amortization or accretion of premium or discount. Dividend income is recorded on the ex-dividend date. |
| |
| Foreign Currency Translation: |
| |
| The accounting records of the Portfolios are maintained in U.S. dollars. Foreign currency amounts are translated into U.S. dollars at the current rate of exchange to determine the value of investments, assets and liabilities. Purchases and sales of securities, and income and expenses are translated at the prevailing rate of exchange on the respective dates of such transactions. The Portfolios do not isolate the portion of the results of operations resulting from changes in foreign exchange rates on investments from fluctuations arising from changes in market prices of securities held. Such fluctuations are included with the net realized and unrealized gain or loss from investments and foreign currencies. |
| |
HSBC INVESTOR PORTFOLIOS | 66 |
|
HSBC INVESTOR PORTFOLIOS |
|
Notes to Financial Statements—as of October 31, 2010 |
| |
| Expense Allocations: |
| |
| Expenses directly attributable to a Portfolio are charged to that Portfolio. Expenses not directly attributable to a Portfolio are allocated proportionally among various or all funds within the HSBC Investor Family of Funds in relation to net assets or on another reasonable basis. |
| |
| Federal Income Taxes: |
| |
| Each Portfolio will be treated as a partnership for U.S. Federal income tax purposes. Accordingly, each Portfolio passes through all of its net investment income and gains and losses to its feeder funds, and is therefore not subject to U.S. Federal income tax. As such, investors in the Portfolios will be taxed on their respective share of the Portfolios’ ordinary income and realized gains. It is intended that the Portfolios will be managed in such a way that an investor will be able to satisfy the requirements of the Internal Revenue Code applicable to regulated investment companies. |
| |
| Management of the Portfolios has reviewed tax positions taken in tax years that remain subject to examination by all major tax jurisdictions, including federal (i.e., the last four tax year ends and the interim tax period since then, as applicable). Management believes that there is no tax liability resulting from unrecognized tax benefits related to uncertain tax positions taken. |
| |
| Derivative Instruments |
| |
| All open derivative positions at year end are reflected on the Portfolio’s Schedule of Portfolio Investments. The following is a description of the derivative instruments utilized by the Fund, including the primary underlying risk exposures related to each instrument type. |
| |
| Foreign Currency Exchange Contracts: |
| |
| Each Portfolio may enter into foreign currency exchange contracts. The Portfolios enter into foreign currency exchange contracts in connection with planned purchases or sales of securities or to hedge the U.S. dollar value of securities denominated in a particular currency. In addition to the foreign currency risk related to the use of these contracts, the Portfolios could be exposed to risks if the counterparties to the contracts are unable to meet the terms of their contracts and from unanticipated movements in the value of a foreign currency relative to the U.S. dollar. The foreign currency exchange contracts are adjusted by the daily exchange rate of the underlying currency and any gains or losses are recorded for financial statement purposes as unrealized gains or losses until the contract settlement date. For the year ended October 31, 2010, the International Equity Portfolio entered into foreign currency exchange contracts to hedge the U.S. dollar value of securities denominated in a particular currency. As of October 31, 2010, the Portfolios did not hold any foreign currency exchange contracts. For the year ended October 31, 2010, the monthly average contract amount of foreign exchange contracts held by the International Equity Portfolio was $6.24 million. |
| |
| Futures Contracts: |
| |
| Each Portfolio may invest in futures contracts. The Portfolios use futures contracts for the purpose of hedging their existing portfolio securities or securities they intend to purchase against fluctuations in fair value caused by changes in prevailing market interest rates. Upon entering into a futures contract, the Portfolio is required to pledge to the broker an amount of cash and/or other assets equal to a certain percentage of the contract amount (initial margin deposit). Subsequent payments, known as “variation margin,” are made or received by the Portfolio each day, depending on the daily fluctuations in the fair value of the underlying security. The Portfolio recognizes a gain or loss equal to the daily variation margin. Should market conditions move unexpectedly, the Portfolio may not achieve the anticipated benefits of the futures contracts and may realize a loss. Futures contracts involve, to varying degrees, elements of market risk (generally equity price risk related to stock futures, interest rate risk related to bond futures, and foreign currency risk related to currency futures) and exposure to loss in excess of the variation margin. The primary risks associated with the use of futures contracts are the imperfect correlation between the change in market value of the securities held by the Portfolios and the prices of futures contracts, the possibility of an illiquid market, and the inability of the counterparty to meet the terms of the contract. For the year ended October 31, 2010, the Portfolios did not hold any futures contracts. |
| |
67 | HSBC INVESTOR PORTFOLIOS |
|
HSBC INVESTOR PORTFOLIOS |
|
Notes to Financial Statements—as of October 31, 2010 (continued) |
| |
| Summary of Derivative Instruments: |
| |
| The following is a summary of the fair value of derivative instruments for the International Equity Portfolio as of October 31, 2010: |
| | | | | | | | | | | |
| | Asset Derivatives | | Liability Derivatives | |
| |
| |
| |
Primary Risk Exposure | | Statements of Assets
and Liabilities
Location | | Total Fair
Value* | | Statements of Assets
and Liabilities
Location | | Total Fair
Value* | |
| |
| |
| |
| |
| |
| | | | | | | | | | | |
Foreign Currency Exchange Contracts | | Unrealized appreciation on foreign currency exchange contracts | | | $ — | | Unrealized depreciation on foreign currency exchange contracts | | | $ — | |
| |
|
* | Total Fair Value is presented by Primary Risk Exposure. For foreign currency exchange contracts, such amounts represent the unrealized gain/appreciation (for asset derivatives) or loss/depreciation (for liability derivatives). |
| |
| The derivative instruments had the following impact on the Statements of Operations for the International Equity Portfolio for the period ended October 31, 2010: |
| | | | | | | | | |
Primary Risk Exposure | | Location of
Gain (Loss)
on Derivatives
Recognized in Income | | Realized
Gain (Loss)
on Derivatives
Recognized in Income | | Change in Unrealized
Appreciation/Depreciation
on Derivatives
Recognized in Income | |
| |
| |
| |
| |
| | | | | | | |
Foreign Currency Exchange Contracts | | Net realized gains (losses) from investments and foreign currency transactions/change in unrealized appreciation/ depreciation on investments and foreign currencies | | | $563,265 | | | $5,279 | |
| | | |
3. | Investment Valuation Summary: |
| | | |
| The valuation techniques employed by the Portfolios, as described below, maximize the use of observable inputs and minimize the use of unobservable inputs in determining fair value. The inputs used for valuing the Portfolios’ investments are summarized in the three broad levels listed below: |
| | | |
| | • | Level 1: quoted prices in active markets for identical assets |
| | | |
| | • | Level 2: other significant observable inputs (including quoted prices for similar securities, interest rates, prepayments speeds, credit risk, etc.) |
| | | |
| | • | Level 3: significant unobservable inputs (including the Portfolio’s own assumptions in determining the fair value of investments) |
| | | |
| The inputs or methodology used for valuing investments are not necessarily an indication of the risk associated with investing in those investments. |
| | | |
| Exchange traded, domestic equity securities are valued at the last sales price on a national securities exchange, or in the absence of recorded sales, at the readily available closing bid price on such exchanges, or at the quoted bid price in the over-the-counter market and are typically categorized as Level 1 in the fair value hierarchy. |
| | | |
| Exchange traded, foreign equity securities are valued in the appropriate currency on the last quoted sale price and are typically categorized as Level 1 in the fair value hierarchy. Foreign equity securities that are not exchanged traded are valued in the appropriate currency at the average of the quoted bid and asked prices in the over-the-counter market and are typically categorized as Level 2 in the fair value hierarchy. |
| | | |
| Shares of exchange traded and closed-end registered investment companies are valued in the same manner as other equity securities and are typically categorized as Level 1 in the fair value hierarchy. Mutual funds are valued at their net asset values, as reported by such companies and are typically categorized as Level 1 in the fair value hierarchy. |
| |
HSBC INVESTOR PORTFOLIOS | 68 |
|
HSBC INVESTOR PORTFOLIOS |
|
Notes to Financial Statements—as of October 31, 2010 (continued) |
| |
| Exchange traded futures contracts are valued at their settlement price on the exchange on which they are traded and are typically categorized as Level 1 in the fair value hierarchy. Forward foreign currency contracts are generally valued at the foreign currency exchange rate as of the close of the New York Stock Exchange and are typically categorized as Level 2 in the fair value hierarchy. Repurchase agreements are valued at original cost and are typically categorized as Level 2 in the fair value hierarchy. |
| |
| Securities or other assets for which market quotations are not readily available, or are deemed unreliable due to a significant event or otherwise, are valued pursuant to procedures adopted by the Portfolio Trust’s Board of Trustees. Depending on the source and relative significance of valuation inputs, these instruments may be classified as Level 2 or Level 3 in the fair value hierarchy. Examples of potentially significant events that could affect the value of an individual security and thus require pricing under the procedures include corporate actions by the issuer, announcements by the issuer relating to its earnings or products, regulatory news, natural disasters, and litigation. Examples of potentially significant events that could affect multiple securities held by a Portfolio include governmental actions, natural disasters, and armed conflicts. In addition, if events materially affecting the value of foreign securities occur between the time when the exchange on which they are traded closes and the time when the Portfolios’ net assets are calculated, such securities may be valued using fair value pricing in accordance with procedures adopted by the Board of Trustees. Management identifies possible fluctuations in foreign securities by monitoring the rise or fall in the value of a designated benchmark index. In the event of a rise or fall greater than predetermined levels, the International Equity Portfolio may use a systematic valuation model provided by an independent third party to value its foreign securities, rather than local market closing prices. When the International Equity Portfolio uses such a valuation model, the value assigned to the International Equity Portfolio’s foreign securities may not be the quoted or published prices of the investment on their primary markets or exchanges and are typically categorized as Level 2 in the fair value hierarchy. The valuation of these securities may represent a transfer between Levels 1 and 2. The number of days on which fair value prices will be used will depend on market activity and it is possible that fair value prices will be used by the International Equity Portfolio to a significant extent. |
| |
69 | HSBC INVESTOR PORTFOLIOS |
|
HSBC INVESTOR PORTFOLIOS |
|
Notes to Financial Statements—as of October 31, 2010 (continued) |
| |
| For the year ended October 31, 2010, there were no Level 3 investments for which significant unobservable inputs were used to determine fair value. |
| |
| The following is a summary of the valuation inputs used as of October 31, 2010 in valuing the Portfolios’ investments based upon three levels defined above: |
| | | | | | | | | | | | | |
| | LEVEL 1 | | LEVEL 2 | | LEVEL 3 | | Total | |
| |
| |
| |
| |
| |
Growth Portfolio | | | | | | | | | | | | | |
Investment Securities: | | | | | | | | | | | | | |
Common Stocks (a) | | $ | 96,843,545 | | $ | — | | $ | — | | $ | 96,843,545 | |
Investment Companies | | | 1,314,150 | | | — | | | — | | | 1,314,150 | |
| |
|
| |
|
| |
|
| |
|
| |
Total Investment Securities | | $ | 98,157,695 | | $ | — | | $ | — | | $ | 98,157,695 | |
| |
|
| |
|
| |
|
| |
|
| |
| | | | | | | | | | | | | |
International Equity Portfolio | | | | | | | | | | | | | |
Investment Securities: | | | | | | | | | | | | | |
Common Stocks: (+) | | | | | | | | | | | | | |
Brazil | | $ | 528,105 | | $ | — | | $ | — | | $ | 528,105 | |
Canada | | | 2,024,591 | | | — | | | — | | | 2,024,591 | |
Kazakhstan | | | 121,260 | | | — | | | — | | | 121,260 | |
Russian Federation | | | 122,752 | | | — | | | — | | | 122,752 | |
South Korea | | | 165,187 | | | 419,856 | | | — | | | 585,043 | |
All other Common Stocks (b) | | | — | | | 37,080,228 | | | — | | | 37,080,228 | |
Investment Companies | | | 391,214 | | | — | | | — | | | 391,214 | |
| |
|
| |
|
| |
|
| |
|
| |
Total Investment Securities | | $ | 3,353,109 | | $ | 37,500,084 | | $ | — | | $ | 40,853,193 | |
| |
|
| |
|
| |
|
| |
|
| |
| | | | | | | | | | | | | |
Opportunity Portfolio | | | | | | | | | | | | | |
Investment Securities: | | | | | | | | | | | | | |
Common Stocks (a) | | $ | 135,323,271 | | $ | — | | $ | — | | $ | 135,323,271 | |
Investment Companies | | | 3,971,916 | | | — | | | — | | | 3,971,916 | |
| |
|
| |
|
| |
|
| |
|
| |
Total Investment Securities | | $ | 139,295,187 | | $ | — | | $ | — | | $ | 139,295,187 | |
| |
|
| |
|
| |
|
| |
|
| |
| | | | | | | | | | | | | |
Value Portfolio | | | | | | | | | | | | | |
Investment Securities: | | | | | | | | | | | | | |
Common Stocks (a) | | $ | 48,717,360 | | $ | — | | $ | — | | $ | 48,717,360 | |
Investment Companies | | | 3,379,613 | | | — | | | — | | | 3,379,613 | |
| |
|
| |
|
| |
|
| |
|
| |
Total Investment Securities | | $ | 52,096,973 | | $ | — | | $ | — | | $ | 52,096,973 | |
| |
|
| |
|
| |
|
| |
|
| |
| |
|
(a) | For detailed industry descriptions, see the accompanying Schedules of Portfolio Investments. |
|
(b) | For detailed country descriptions, see the accompanying Schedules of Portfolio Investments. |
|
(+) | Based on the domicile of the security issuer. |
| |
| The Trust recognizes significant transfers between fair value hierarchy levels at the reporting period end. The only significant transfers between Levels 1 and 2 as of October 31, 2010 are related to the use of the systematic valuation model to value foreign securities in the International Equity Portfolio. |
| |
4. | Related Party Transactions: |
| |
| Investment Management: |
| |
| HSBC Global Asset Management (USA) Inc. (“HSBC” or the “Investment Adviser”), a wholly owned subsidiary of HSBC Bank USA, N.A., a national bank organized under the laws of the United States, acts as the Investment Adviser to the Portfolios pursuant to an investment management contract with the Portfolio Trust. As Investment Adviser, HSBC manages the investments of the Portfolios and continuously reviews, supervises, and administers the Portfolios’ investments, except that Winslow Capital Management, Inc., AllianceBernstein L.P., Westfield Capital Management Company, L.P. and NWQ Investment Management Company, LLC serve as Sub-Investment Advisers for the Growth Portfolio, International |
| |
HSBC INVESTOR PORTFOLIOS | 70 |
|
HSBC INVESTOR PORTFOLIOS |
|
Notes to Financial Statements—as of October 31, 2010 (continued) |
| |
| Equity Portfolio, Opportunity Portfolio, and the Value Portfolio, respectively, and are paid for their services directly by the respective Portfolios. |
| |
| For their services, the Investment Adviser and Winslow Capital Management, Inc. (“Winslow”) receive in aggregate, from the Growth Portfolio, a fee, accrued daily and paid monthly, at an annual rate of: |
| | | | |
Based on Average Daily Net Assets of all Sub-Adviser serviced funds and separate accounts affiliated with HSBC: | | Fee Rate* | |
| |
| |
Up to $250 million | | 0.575 | % | |
In excess of $250 million but not exceeding $500 million | | 0.525 | % | |
In excess of $500 million but not exceeding $750 million | | 0.475 | % | |
In excess of $750 million but not exceeding $1 billion | | 0.425 | % | |
In excess of $1 billion | | 0.375 | % | |
| | |
|
|
| * | The Growth Portfolio may pay the Investment Adviser and Winslow an aggregate maximum fee of up to 0.68%. Currently, the Investment Adviser’s contractual fee is 0.175% and Winslow’s maximum contractual fee is 0.40%. Accordingly, the current aggregate maximum fee rate is 0.575%. |
| |
For their services, the Investment Adviser and AllianceBernstein L.P. receive in aggregate, from the International Equity Portfolio, a fee, accrued daily and paid monthly, at an annual rate of: |
| | | | |
| | | | |
Based on Average Daily Net Assets of: | | Fee Rate | |
| |
| |
Up to $10 million | | 1.015 | % | |
In excess of $10 million but not exceeding $25 million | | 0.925 | % | |
In excess of $25 million but not exceeding $50 million | | 0.79 | % | |
In excess of $50 million but not exceeding $100 million | | 0.70 | % | |
In excess of $100 million | | 0.61 | % | |
| |
| For their services, the Investment Adviser and Westfield Capital Management Company, L.P. receive in aggregate, a fee, accrued daily and paid monthly, at an annual rate of 0.80% of the Opportunity Portfolio’s average daily net assets. |
| |
| For their services, the Investment Adviser and NWQ Investment Management Company, LLC receive in aggregate, from the Value Portfolio, a fee, accrued daily and paid monthly, at an annual rate of: |
| | | | |
Based on Average Daily Net Assets of | | Fee Rate | |
| |
| |
Up to $500 million | | 0.525 | % | |
In excess of $500 million but not exceeding $1 billion | | 0.475 | % | |
In excess of $1 billion | | 0.425 | % | |
| |
| Any voluntary fee waivers/reimbursements are not subject to recoupment in subsequent fiscal periods. Voluntary waiver/reimbursements may be stopped at any time. |
| |
| Administration: |
| |
| HSBC serves the Portfolios as Administrator. Under the terms of the Administration Agreement, HSBC receives from the Portfolios (as well as the other funds in the HSBC Investor Family of Funds) a fee, accrued daily and paid monthly at annual rate of: |
| | | | |
Based on Average Daily Net Assets of | | Fee Rate | |
| |
| |
Up to $10 billion | | 0.0550 | % | |
In excess of $10 billion but not exceeding $20 billion | | 0.0350 | % | |
In excess of $20 billion but not exceeding $50 billion | | 0.0275 | % | |
In excess of $50 billion | | 0.0250 | % | |
| |
| The fee rates and breakpoints are determined on the basis of the aggregate average daily net assets of the HSBC Investor Family of Funds, however, the assets of the Portfolios and HSBC Investor Funds that invest in the Portfolios are not double-counted. The total administration fee paid to HSBC is allocated to each series in the HSBC Investor Family of Funds based upon its proportionate share of the aggregate net assets of the Family of Funds. For assets invested in the Portfolios by the HSBC Investor Funds, the Portfolios pay half of the administration fee and the other funds pay half of the administration fee, for a combination of the total fee rate set forth above. Certain administrative fees of the Portfolios also may be received by treating them as apportioned in part to other funds makes investments in the Portfolios a master-feeder structure. |
| |
71 | HSBC INVESTOR PORTFOLIOS |
|
HSBC INVESTOR PORTFOLIOS |
|
Notes to Financial Statements—as of October 31, 2010 (continued) |
| |
| Pursuant to a Sub-Administration Agreement with HSBC, Citi Fund Services Ohio, Inc. (“Citi Ohio”), a wholly-owned subsidiary of Citigroup, Inc., serves as the Portfolio Trust’s Sub-Administrator subject to the general supervision of the Portfolio Trust’s Board of Trustees and HSBC. For these services, Citi Ohio is entitled to a fee, payable by HSBC, at an annual rate equivalent to the fee rates set forth above, minus 0.02% (2 basis points) which is retained by HSBC. |
| |
| Under a Compliance Services Agreement between the Portfolio Trust and the other HSBC Investor Funds (the “Trusts”) and Citi Ohio (the “CCO Agreement”), Citi Ohio makes an employee available to serve as the Trusts’ Chief Compliance Officer (the “CCO”). Under the CCO Agreement, Citi Ohio also provides infrastructure and support in implementing the written policies and procedures comprising the Portfolios’ compliance program, including support services to the CCO. For the services provided under the CCO Agreement, the HSBC Investor Family of Funds paid Citi Ohio $269,869 for the year ended October 31, 2010, plus reimbursement of certain expenses. Expenses incurred by each Portfolio are reflected on the Statements of Operations as “Compliance Services.” Citi Ohio pays the salary and other compensation earned by individuals as employees of Citi Ohio. |
| |
| Fund Accounting and Trustees: |
| |
| Citi Ohio provides fund accounting services for the Portfolio Trust. For its services to the Portfolios, Citi Ohio receives an annual fee per portfolio, including reimbursement of certain expenses, that is accrued daily and paid monthly. |
| |
| Each non-interested Trustee is compensated with a $60,000 annual Board retainer for services as a Trustee of the HSBC Investor Family of Funds (or the “Trusts”), as well as a $3,000 annual retainer for each Committee of the Board of the Trusts. Each non-interested Trustee also receives a $5,000 and $3,000 meeting fee for each regular in-person Board meeting and Committee meeting, respectively. Furthermore, each non-interested Trustee receives compensation for attending special meetings and/or functioning as a Committee or Board Chairperson. In addition, the non-interested Trustees are reimbursed for certain expenses incurred in connection with their Board membership. |
| |
5. | Investment Transactions: |
| |
| Cost of purchases and proceeds from sales of securities (excluding securities maturing less than one year from acquisition) for the year ended October 31, 2010 were as follows: |
| | | | | | | | | | | | | |
Portfolio Name | | | | | | Purchases
(excluding U.S.
Government) | | Sales
(excluding U.S.
Government) | |
| | | | | |
| |
| |
Growth Portfolio | | | | | | | | $ | 78,285,103 | | $ | 82,782,432 | |
International Equity Portfolio | | | | | | | | | 94,911,257 | | | 123,210,909 | |
Opportunity Portfolio | | | | | | | | | 86,072,250 | | | 105,288,751 | |
Value Portfolio | | | | | | | | | 12,420,582 | | | 17,955,334 | |
|
For the year ended October 31, 2010, there were no long-term U.S. Government securities held by the Portfolio Trust. |
| |
6. | Federal Income Tax Information: |
| |
| At October 31, 2010, the cost basis of securities for federal income tax purposes, gross unrealized appreciation, gross unrealized depreciation and net unrealized appreciation/depreciation were as follows: |
| | | | | | | | | | | | | |
Fund | | Tax Cost | | Tax Unrealized
Appreciation | | Tax Unrealized
Depreciation | | Net Unrealized
Appreciation
(Depreciation)* | |
| |
| |
| |
| |
| |
Growth Portfolio | | $ | 79,283,771 | | $ | 18,873,924 | | $ | — | | $ | 18,873,924 | |
International Equity Portfolio | | | 39,386,379 | | | 3,376,252 | | | (1,909,438 | ) | | 1,466,814 | |
Opportunity Portfolio | | | 124,125,662 | | | 23,999,412 | | | (8,829,887 | ) | | 15,169,525 | |
Value Portfolio | | | 50,811,505 | | | 6,302,313 | | | (5,016,845 | ) | | 1,285,468 | |
| | | |
| |
|
| | * | The difference between book-basis unrealized appreciation (depreciation) is attributable primarily to tax deferral of losses on wash sales. |
| |
HSBC INVESTOR PORTFOLIOS | 72 |
|
HSBC INVESTOR PORTFOLIOS |
|
Notes to Financial Statements—as of October 31, 2010 (continued) |
| |
7. | Legal and Regulatory Matters: |
| |
| On September 26, 2006 BISYS Fund Services, Inc. (“BISYS”), an affiliate of BISYS Fund Services Ohio, Inc. which provided various services to the Portfolios, reached a settlement with the Securities and Exchange Commission (“the SEC”) regarding the SEC’s investigation related to BISYS’ past payment of certain marketing and other expenses with respect to certain of its mutual fund clients. There was no impact on the Portfolios’ financial statements as the Portfolios did not receive any settlement monies. |
| |
8. | Subsequent Events (Unaudited): |
| |
| Effective November 1, 2010, each non-interested Trustee is compensated with a $63,000 annual Board retainer for service as a Trustee of the Trust and the other HSBC Investor Funds, as well as a $3,000 annual retainer for each Committee of the Board of the Trust and other HSBC Investor Funds. Each non-interested Trustee also receives a $5,000 and $3,000 meeting fee for each regular in-person Board meeting and Committee meeting, respectively. Furthermore, each non-interested Trustee receives compensation for attending special meetings and/or functioning as a Committee or Board Chairperson. In addition, the noninterested Trustees are reimbursed for certain expenses incurred in connection with their Board membership. |
| |
| Effective at the close of business on January 12, 2011, Lord, Abbett & Co. LLC will replace AllianceBernstein L.P. as Sub-Investment Adviser to the International Equity Portfolio. |
| |
73 | HSBC INVESTOR PORTFOLIOS |
REPORT OF INDEPENDENT REGISTERED PUBLIC ACCOUNTING FIRM
To the Shareholders and Board of Trustees of
HSBC Investor Portfolios:
We have audited the accompanying statements of assets and liabilities of HSBC Investor Portfolios – HSBC Investor Growth Portfolio, HSBC Investor International Equity Portfolio, HSBC Investor Opportunity Portfolio and HSBC Investor Value Portfolio (the Funds), including the schedules of portfolio investments, as of October 31, 2010, and the related statements of operations for the year then ended, the changes in net assets for each year in the two-year period then ended, and the financial highlights for each year in the five-year period then ended. These financial statements and financial highlights are the responsibility of the Funds’ management. Our responsibility is to express an opinion on these financial statements and financial highlights based on our audits.
We conducted our audits in accordance with the standards of the Public Company Accounting Oversight Board (United States). Those standards require that we plan and perform the audits to obtain reasonable assurance about whether the financial statements and financial highlights are free of material misstatement. An audit includes examining, on a test basis, evidence supporting the amounts and disclosures in the financial statements. Our procedures included confirmation of securities owned as of October 31, 2010, by correspondence with custodians and brokers or by other appropriate auditing procedures. An audit also includes assessing the accounting principles used and significant estimates made by management, as well as evaluating the overall financial statement presentation. We believe that our audits provide a reasonable basis for our opinion.
In our opinion, the financial statements and financial highlights referred to above present fairly, in all material respects, the financial position of the Funds as of October 31, 2010, the results of their operations for the year then ended, the changes in their net assets for each year in the two-year period then ended, and the financial highlights for each year in the five-year period then ended, in conformity with U.S. generally accepted accounting principles.

Columbus, Ohio
December 22, 2010
| |
HSBC INVESTOR PORTFOLIOS | 74 |
|
HSBC INVESTOR PORTFOLIOS |
|
Table of Shareholder Expenses (Unaudited)—as of October 31, 2010 |
| |
| As a shareholder of the HSBC Investor Portfolios (“Portfolios”), you incur ongoing costs, including management fees and other Fund expenses. |
| |
| These examples are intended to help you understand your ongoing costs (in dollars) of investing in the Portfolios and to compare these costs with the ongoing costs of investing in other mutual funds. |
| |
| These examples are based on an investment of $1,000 invested at the beginning of the period and held for the entire period from May 1, 2010 through October 31, 2010. |
| |
| Actual Example |
| |
| The table below provides information about actual account values and actual expenses. You may use the information below, together with the amount you invested, to estimate the expenses that you paid over the period. Simply divide your account value by $1,000 (for example, an $8,600 account value divided by $1,000 = 8.6), then multiply the result by the number in the table under the heading entitled “Expenses Paid During Period” to estimate the expenses you paid on your account during this period. |
| | | | | | | | | | | | | | | | | | | |
| | Beginning
Account Value
5/1/10 | | Ending
Account Value
10/31/10 | | Expenses Paid
During Period*
5/1/10 – 10/31/10 | | Annualized
Expense Ratio
During Period
5/1/10 – 10/31/10 | |
| |
| |
| |
| |
| |
Growth Portfolio | | | $ | 1,000.00 | | | | $ | 1,045.40 | | | | $ | 3.56 | | | 0.69 | % | |
International Equity Portfolio | | | | 1,000.00 | | | | | 1,044.60 | | | | | 4.59 | | | 0.89 | % | |
Opportunity Portfolio | | | | 1,000.00 | | | | | 1,035.30 | | | | | 4.62 | | | 0.90 | % | |
Value Portfolio | | | | 1,000.00 | | | | | 996.50 | | | | | 3.42 | | | 0.68 | % | |
| | |
| |
* | Expenses are equal to the average account value over the period multiplied by the Portfolio’s annualized expense ratio, multiplied by the number of days in the most recent fiscal half-year divided by the number of days in the fiscal year (to reflect the one half year period). |
| |
| Hypothetical Example for Comparison Purposes |
| |
| The table below provides information about hypothetical account values and hypothetical expenses based on each Portfolio’s actual expense ratio and an assumed rate of return of 5% per year before expenses, which is not the Portfolio’s actual return. The hypothetical account values and expenses may not be used to estimate the actual ending account balance or expenses you paid for the period. You may use this information to compare this 5% hypothetical example with the 5% hypothetical examples that appear in the shareholder reports of other funds. |
| |
| Please note that the expenses shown in the table are meant to highlight your ongoing costs only and do not reflect any transactional costs, such as sales charges (loads), redemption fees, or exchange fees. Therefore, the table is useful in comparing ongoing costs only, and will not help you determine the relative total costs of owning different funds. In addition, if these transactional costs were included, your costs would have been higher. |
| | | | | | | | | | | | | | | | | | | |
| | Beginning
Account Value
5/1/10 | | Ending
Account Value
10/31/10 | | Expenses Paid
During Period*
5/1/10 – 10/31/10 | | Annualized
Expense Ratio
During Period
5/1/10 – 10/31/10 | |
| |
| |
| |
| |
| |
Growth Portfolio | | | $ | 1,000.00 | | | | $ | 1,021.73 | | | | $ | 3.52 | | | 0.69 | % | |
International Equity Portfolio | | | | 1,000.00 | | | | | 1,020.72 | | | | | 4.53 | | | 0.89 | % | |
Opportunity Portfolio | | | | 1,000.00 | | | | | 1,020.67 | | | | | 4.58 | | | 0.90 | % | |
Value Portfolio | | | | 1,000.00 | | | | | 1,021.78 | | | | | 3.47 | | | 0.68 | % | |
| | |
| |
* | Expenses are equal to the average account value over the period multiplied by the Portfolio’s annualized expense ratio, multiplied by the number of days in the most recent fiscal half-year divided by the number of days in the fiscal year (to reflect the one half year period). |
| |
75 | HSBC INVESTOR PORTFOLIOS |
|
HSBC INVESTOR FAMILY OF FUNDS |
|
Board of Trustees and Officers (Unaudited) |
MANAGEMENT OF THE TRUST
The following table contains information regarding the HSBC Investor Family of Funds Board of Trustees (“Trustees”). Asterisks indicate those Trustees who are “interested persons,” as defined in the Investment Company Act of 1940, as amended, of the HSBC Investor Family of Funds. The HSBC Investor Family of Funds’ Statement of Additional Information includes additional information about the Trustees and is available by calling (888) 525-5757.
| | | | | | | | | | |
Name, Address
and Age | | Position(s)
Held with
the HSBC
Investor Family
of Funds | | Term of Office and
Length of Time Served
with the HSBC Investor
Family of Funds | | Principal Occupation(s)
During Past 5 Years | | Number of
Portfolios in Fund
Complex Overseen
By Trustee* | | Other Directorships
Held by Trustee |
|
|
|
|
|
|
|
|
|
|
|
| | | | | | | | | | |
NON-INTERESTED | | | | | | | | | | |
TRUSTEES | | | | | | | | | | |
| | | | | | | | | | |
Marcia L. Beck
P.O. Box 182845
Columbus, OH 43218-3035
Age: 55 | | Trustee | | Indefinite; June 2008
to present | | Private Investor (June 1999 – present); Executive Vice President, Prudential Investments (1997 – 1999); President and Trustee, The Goldman Sachs Mutual Funds (1992 – 1996) | | 32 | | None |
|
|
|
|
|
|
|
|
|
|
|
Susan S. Huang
P.O. Box 182845
Columbus, OH 43218-3035
Age: 56 | | Trustee | | Indefinite; June 2008
to present | | Private Investor (2000 – present); Senior Vice President, Schroder Investment Management (2001 – 2004); Managing Director, Chase Asset Management (1995 – 2000) | | 32 | | None |
|
|
|
|
|
|
|
|
|
|
|
Alan S. Parsow
P.O. Box 182845
Columbus, OH 43218-3035
Age: 60 | | Trustee | | Indefinite; 1987
to present | | General Partner, Elkhorn Partners, L.P. (a private investment partnership) (1989 – present) | | 32 | | Penn Treaty American Corporation (insurance) |
|
|
|
|
|
|
|
|
|
|
|
Thomas F. Robards
P.O. Box 182845
Columbus, OH 43218-3035
Age: 64 | | Trustee | | Indefinite; 2005
to present | | Partner, Robards & Co. LLC (investment and advisory services) (2005 – present); Chief Financial Officer, American Museum of Natural History (2003 – 2004) Chief Financial Officer, Datek Online Holdings (2000 – 2003); Previously EVP and CFO Republic New York Corporation | | 32 | | Overseas Shipholding Group (NYSE listed energy transportation); Ellington Financial LLC (NYSE listed financial services); Financial Federal Corporation (NYSE listed specialty finance) |
|
|
|
|
|
|
|
|
|
|
|
Michael Seely
P.O. Box 182845
Columbus, OH 43218-3035
Age: 65 | | Chairman and Trustee | | Indefinite; 1987
to present | | Private Investor (2003 – present); General Partner, Global Multi Manager Partners (1999 – 2003); President of Investor Access Corporation (1981 – 2003) | | 32 | | None |
|
|
|
|
|
|
|
|
|
|
|
| | | | | | | | | | |
EMERITUS TRUSTEE | | | | | | | | | | |
| | | | | | | | | | |
Larry M. Robbins
P.O. Box 182845
Columbus, OH 43218-3035
Age: 71 | | Emeritus Trustee | | Until December 31, 2011;
Trustee from 1987
to December 31, 2010 | | Private Investor (2007 – present); Director, Center for Teaching and Learning, University of Pennsylvania (1999 – 2007) | | 32 | | None |
|
|
|
|
|
|
|
|
|
|
|
| |
* | Includes both the Fund and the underlying fund for Funds with a master/feeder structure. |
| |
HSBC INVESTOR PORTFOLIOS | 76 |
|
HSBC INVESTOR FAMILY OF FUNDS |
|
Board of Trustees and Officers (Unaudited) (continued) |
The names of the officers, their addresses, ages, position(s) held with the Trust, and principal occupation(s) during the past five years are described in the table below.
| | | | | | |
Name, Address
and Age | | Position(s)
Held with
the HSBC
Investor Family
of Funds | | Term of Office and
Length of Time Served
with the HSBC Investor
Family of Funds | | Principal Occupation(s)
During Past 5 Years |
|
|
|
|
|
|
|
| | | | | | |
OFFICERS | | | | | | |
| | | | | | |
Richard A. Fabietti
452 Fifth Avenue
New York, NY 10018
Age: 52 | | President | | One year; 2004
to present | | Senior Vice President, Head of Product Management, HSBC Global Asset Management (USA) Inc. (1998 – present) |
|
|
|
|
|
|
|
Stephen Sivillo
452 Fifth Avenue
New York, NY 10018
Age: 39 | | Vice President | | One year; 2010
to present | | Vice President of Product Administration, HSBC Global Asset Management (USA) Inc. (2010 – present); Chief Compliance Officer, Managers Funds (2009 – 2010); Director, Mutual Fund Compliance, AllianceBernstein (2007 – 2009); Assistant Vice President, Compliance, AllianceBernstein (2005 – 2007) |
|
|
|
|
|
|
|
Ty Edwards*
3435 Stelzer Road
Columbus, OH 43219-3035
Age: 44 | | Treasurer | | One year; 2010
to present | | Senior Vice President, Citi Fund Services (2010 – present); Director, Product Management, Columbia Management (2007 – 2009); Deputy Treasurer, Columbia Funds, (2006 – 2007); Director, Fund Administration, Columbia Management (2004 – 2007) |
|
|
|
|
|
|
|
Jennifer A. English*
100 Summer Street
Suite 1500
Boston, MA 02110
Age: 38 | | Secretary | | One year; 2008
to present | | Senior Vice President, Regulatory Administration, Citi (2005 – present) |
|
|
|
|
|
|
|
F. Martin Fox
100 Summer Street
Suite 1500
Boston, MA 02110
Age: 47 | | Assistant Secretary | | One year; 2008
to present | | Assistant Vice President, Regulatory Administration, Citi (May 2008 – present); Contract Attorney, Update Legal LLC (2002 – 2008) |
|
|
|
|
|
|
|
Frederick J. Schmidt*
1 Rexcorp Plaza
Uniondale, NY 11556
Age: 51 | | Chief Compliance Officer | | One year; 2004
to present | | Senior Vice President and Chief Compliance Officer, CCO Services, Citi (2004 – present) |
|
|
|
|
|
|
|
| |
* | Mr. Edwards, Mr. Schmidt and Ms. English also are officers of certain other investment companies of which Citi (or an affiliate) is the administrator or sub-administrator. |
| |
77 | HSBC INVESTOR PORTFOLIOS |
Other Information:
Information regarding how the Portfolios voted proxies relating to portfolio securities during the most recent 12-month period ended June 30th is available (i) without charge, upon request, by calling 1-800-525-5757 for HSBC Bank USA and HSBC Brokerage (USA) Inc. clients and 1-800-782-8183 for all other shareholders; (ii) on the HSBC Investor Family of Funds’ web-site at www.investorfunds.us.hsbc.com; and (iii) on the Security and Exchange Commission’s (“Commission”) website at http://www.sec.gov.
(i) The Portfolios file their complete schedules of portfolio holdings with the Commission for the first and third quarters of each fiscal year on Form N-Q; (ii) the Portfolios’ Form N-Q are available on the Commission’s website at http://www.sec.gov; (iii) the Portfolios’ Forms N-Q may be reviewed and copied at the Commission’s Public Reference Room in Washington, DC and information on the operation of the Public Reference Room may be obtained by calling 1-800-SEC-0330; and (iv) the Portfolios’ Schedules of Investments will be available no later than 60 days after each period end, without charge, on the HSBC Investor Family of Funds’ website at www.investorfunds.us.hsbc.com.
An investment in a Portfolio is not a deposit of HSBC Bank USA, National Association, and is not insured or guaranteed by the Federal Deposit Insurance Corporation or any other government agency.
| |
HSBC INVESTOR PORTFOLIOS | 78 |
| | |
HSBC INVESTOR FAMILY OF FUNDS: | | SHAREHOLDER SERVICING AGENTS |
| | For HSBC Bank USA, N.A. and |
INVESTMENT ADVISER AND ADMINISTRATOR | | HSBC Securities (USA) Inc. Clients |
HSBC Global Asset Management (USA) Inc. | | HSBC Bank USA, N.A. |
452 Fifth Avenue | | 452 Fifth Avenue |
New York, NY 10018 | | New York, NY 10018 |
| | 1-888-525-5757 |
SUB-ADVISERS | | |
HSBC Investor Growth Portfolio | | For All Other Shareholders |
Winslow Capital Management, Inc. | | HSBC Investor Funds |
4720 IDS Tower | | P.O. Box 182845 |
80th South Eighth Street | | Columbus, OH 43218-2845 |
Minneapolis, MN 55402 | | 1-800-782-8183 |
| | |
HSBC Investor International Equity Portfolio | | TRANSFER AGENT |
AllianceBernstein L.P. | | Citi Fund Services |
1345 Avenue of the Americas, 39th Floor | | 3435 Stelzer Road |
New York, NY 10105 | | Columbus, OH 43219 |
| | |
HSBC Investor Mid-Cap Fund | | DISTRIBUTOR |
Munder Capital Management | | Foreside Distribution Services, L.P. |
Munder Capital Center | | 10 High Street, Suite 302 |
480 Pierce Street | | Boston, MA 02110 |
Birmingham, MI 48009-6063 | | |
| | CUSTODIAN |
HSBC Investor Opportunity Portfolio | | The Northern Trust Company |
Westfield Capital Management Company, L.P. | | 50 South LaSalle Street |
One Financial Center | | Chicago, IL 60675 |
Boston, MA 02111 | | |
| | INDEPENDENT REGISTERED PUBLIC |
HSBC Investor Value Portfolio | | ACCOUNTING FIRM |
NWQ Investment Management Company, LLC | | KPMG LLP |
2049 Century Park East, 16th Floor | | 191 West Nationwide Blvd., Suite 500 |
Los Angeles, CA 90067 | | Columbus, OH 43215 |
| | |
| | LEGAL COUNSEL |
| | Dechert LLP |
| | 1775 I Street, N.W. |
| | Washington, D.C. 20006 |


The HSBC Investor Family of Funds are distributed by Foreside Distribution Services, L.P. This document must be preceded or accompanied by a current prospectus for the HSBC Investor Funds, which you should read carefully before you invest or send money.
| | | |
| — NOT FDIC INSURED | — NO BANK GUARANTEE | — MAY LOSE VALUE |
| | | |
HSB-0008 | | | 12/10 |

HSBC Global Asset Management (USA) Inc.
October 31, 2010
HSBC Investor Funds
Annual Report
MONEY MARKET FUNDS
HSBC Investor California Tax-Free Money Market Fund
HSBC Investor New York Tax-Free Money Market Fund
HSBC Investor Prime Money Market Fund
HSBC Investor Tax-Free Money Market Fund
HSBC Investor U.S. Government Money Market Fund
HSBC Investor U.S. Treasury Money Market Fund
(This Page Intentionally Left Blank)
Barclays Capital U.S. Aggregate Bond Index is an unmanaged index generally representative of investment-grade fixed-rate debt issues, including government, corporate, asset-backed, and mortgage-backed securities, with maturities of at least one year.
Barclays Capital U.S. Corporate Bond Index is an unmanaged index includes publicly issued U.S. corporate and specified foreign debentures and secured notes that meet the specified maturity, liquidity, and quality requirements. To qualify, bonds must be SEC-registered.
Lipper California Tax-Exempt Money Market Funds Average is an equally weighted average of mutual funds that invest in California municipal obligations with dollar weighted average maturities of less than 90 days. These funds intend to keep a constant net asset value.
Lipper Money Market Funds Average is an equally weighted average of mutual funds that invest in high-quality financial instruments rated in the top two grades with dollar-weighted average maturities of less than 90 days. These funds intend to keep constant net asset value.
Lipper New York Tax-Exempt Money Market Funds Average is an equally weighted average of mutual funds that invest in New York municipal obligations with dollar weighted average maturities of less than 90 days. These funds intend to keep a constant net asset value.
Lipper Tax- Exempt Money Market Funds Average is an equally weighted average of mutual funds that invest in high-quality municipal obligations with dollar-weighted average maturities of less than 90 days. These funds intend to keep constant net asset value.
Lipper U.S. Government Money Market Funds Average is an equally weighted average of mutual funds that invest principally in financial instruments issued or guaranteed by the U.S. government, its agencies, or its instrumentalities, with dollar-weighted average maturities of less than 90 days. These funds intend to keep constant net asset value.
Lipper U.S. Treasury Money Market Funds Average is an equally weighted average of mutual funds that invest principally in U.S. Treasury obligations with dollar weighted average maturities of less than 90 days. These funds intend to keep a constant net asset value.
MSCI EAFE Index (Europe, Australasia, Far East) is an unmanaged free float-adjusted market capitalization index that is designed to measure the equity market performance of developed markets, excluding the U.S. & Canada. The MSCI EAFE Index currently consists of the following 22 developed market country indices: Australia, Austria, Belgium, Denmark, Finland, France, Germany, Greece, Hong Kong, Ireland, Israel, Italy, Japan, the Netherlands, New Zealand, Norway, Portugal, Singapore, Spain, Sweden, Switzerland and the United Kingdom.
Russell Midcap® Index measures the performance of the mid-cap segment of the U.S. equity universe. The Russell Midcap® Index is a subset of the Russell 1000® Index. It includes approximately 800 of the smallest securities based on a combination of their market cap and current index membership. The Russell Midcap® Index represents approximately 31% of the total market capitalization of the Russell 1000 companies.
Russell 2000® Index is an unmanaged index which measures the performance of the small-cap segment of the U.S. equity universe. The Russell 2000 Index is a subset of the Russell 3000® Index representing approximately 8% of the total market capitalization of that index. It includes approximately 2000 of the smallest securities based on a combination of their market cap and current index membership.
Standard & Poor’s 500 Index (“S&P 500”) is an unmanaged index that is widely regarded as a gauge of the U.S. equities market, this index includes 500 leading companies in leading industries of the U.S. economy. The S&P 500 focuses on the large cap segment of the market, with approximately 75% coverage of U.S. equities.
Lipper is an independent mutual fund performance monitor whose results are based on total return and do not reflect a sales charge.
Securities indices assume reinvestment of all distributions and interest payments and do not take in account brokerage fees or expenses. Securities in the Funds do not match those in the indices and performance of the Funds will differ. Investors cannot invest directly in an index.
December 16, 2010
To Our Shareholders:
For the 12-month period ended October 31, 2010, equity and debt markets performed well, with returns of 16.52% for the S&P 500 Index1, 8.82% for the MSCI EAFE Index1, 26.58% for the Russell 2000 Index1 and 8.01% for the Barclays Capital U.S. Aggregate Bond Index1.
The period began with several encouraging economic indicators, which helped buoy investor sentiment. However, concerns about a “double-dip” recession in the U.S. increased, as did questions about the financial strength of certain countries in the European Union, such as Greece, whose debt was downgraded by credit rating agencies. The market declines associated with these concerns and events proved short-lived, though, and the markets strengthened late in the period. We are pleased that our funds also performed well during the 12 months under review. In the case of our money market funds, by far the largest asset class in our fund family, this performance comes despite the conservatism of our investment discipline—a discipline the investment adviser adopted ahead of Securities and Exchange Commission (“SEC”) mandated guidelines. These guidelines include, but are not limited to, daily and weekly portfolio liquidity requirements of 10% and 30%, respectively; portfolio quality limitations on second-tier securities; and a reduction in the overall weighted average maturity of money market funds.
These funds’ yields have been supported by significant fee waivers by the investment adviser and our other service providers, as shown in the chart below:
| | | | |
Fund | | Fees Waived | |
California Tax-Free Money Market Fund | | $ | 327,580 | |
New York Tax-Free Money Market Fund | | | 1,274,087 | |
Prime Money Market Fund | | | 7,423,993 | |
Tax-Free Money Market Fund | | | 438,252 | |
U.S. Government Money Market Fund | | | 6,211,568 | |
U.S. Treasury Money Market Fund | | | 6,910,492 | |
Such waivers have become common in the money market fund industry. A more detailed discussion of these fee waivers can be found in the footnotes that accompany the financial statements of the money market funds.
Overall, we are pleased with the performance of the equity funds. The HSBC Investor International Equity Fund has, however, lagged its benchmark for 1-, 3- and 5- year periods. In December 2010, the Board approved a change in sub-advisor for this fund; Lord Abbett & Co. was hired as the new sub-adviser to the fund, effective January 2010. Shareholders of this fund will receive more information about this change in the future.
The Board and the investment adviser continue to pursue appropriate expansion and positioning of the fund family. HSBC has a long history of operating and investing in emerging markets, and the possibility of offering U.S. investors funds that capitalize on that experience and expertise is intriguing. While it is increasingly difficult to find asset classes that provide real diversification (investment professionals describe this as “narrowing correlation coefficients”), at this time emerging markets appear to offer such diversification. Emerging markets are widely favored by the pundits at this time. They cite valuations that are attractive by historic measures, rising capital inflows (though they remain below prior highs) and “QEII”—the Fed’s second round of monetary easing, which some observers feel is likely to further boost such investment inflows, thereby increasing these valuations. Some concern remains about these markets’ abilities to absorb these inflows. We look forward to providing you with more information on this topic at the appropriate time in the future.
QEII, the Federal Reserve’s $600 billion program to buy long-term Treasuries over the next three quarters, is both controversial and problematic when banks are highly liquid and lending is trivial. At best, I believe that the program might stimulate U.S. Gross Domestic Product (“GDP”)1 growth by 0.5%—a paltry increment that comes at high cost given the twin deficits. So, we think it best to view this effort as effectively another effort to lift the value of risk assets and to recapitalize the banks, which may borrow from the Fed at 0.25% and buy Treasuries yielding 3% or more.
| |
1 | HSBC INVESTOR FAMILY OF FUNDS |
|
Chairman’s Message (continued) |
|
At year end, the Board accepted with great regret the resignation of long-time independent chair Dr. Larry Robbins, a founding trustee of the predecessor fund family almost 25 years ago. We are delighted that Larry agreed to serve as trustee emeritus for a year, so his warmth and insight will still be available to us.
Finally, we note that Andrew Donohue stepped down as Director of the Division of Investment Management of the Securities and Exchange Commission effective November 19, 2010. “Buddy”, as he’s better known to his many friends in the fund industry, was a superb regulator—tough-minded but fair, creative, and single-minded in serving the needs of American investors. We all recall fondly his visit to a Board dinner—an outreach practice he followed throughout his SEC tenure and one that other government figures would do well to emulate.
This is my second letter as chairman to our shareholders. In drafting both reports, I’ve thought of how Charles Dickens began his novel about the French Revolution, A Tale of Two Cities: “It was the best of times, it was the worst of times...” So, too, might any money manager opine of any moment. Today, there are deep global economic imbalances—between east and west, north and south. And within our most advanced economies a growing gap prevails between governments’ promises and their ability to honor those promises. This challenge comes at a time of discouraging demographics in the OECD countries. We believe this challenge confers a special responsibility to provide the best possible risk-adjusted performance to those investors who entrust us with their capital.
I can assure you that my colleagues and I, as well as the investment adviser and other service providers, take this duty very seriously and pledge our very best effort to that good end.
Cordially,

Michael Seely
Chairman, HSBC Investor Funds
| |
1 | For additional information, please refer to the Glossary of Terms. |
| |
HSBC INVESTOR FAMILY OF FUNDS | 2 |
Dear Shareholder,
Welcome to the HSBC Investor Funds annual report, covering the period between November 1, 2009 and October 31, 2010. This report offers detailed information about your Funds’ results. We encourage you to review it carefully.
Inside these pages you will find a letter from the Funds’ Chairman, Michael Seely, in which he comments on recent market developments. As always, the report includes the financial statements covering the fiscal year for each of the funds. The report also includes commentary from the Funds’ portfolio managers in which they discuss the investment markets during the period and their respective Fund’s performance. Each commentary is accompanied by the Fund’s return for the period, listed alongside the returns of its benchmark index and peer group average for comparative purposes.
The near-zero short-term rate environment has persisted throughout the Funds’ fiscal year and is likely to continue for some time. In response, HSBC has continued to waive a portion of its advisory and shareholder servicing fees from the various money market funds in order to maintain a positive yield for the Funds’ shareholders.
Our Multimanager team continues to review and monitor the subadvisors that manage the Equity Funds. The team also reviews and monitors the third party funds in which the World Selection Funds invest. We believe that this level of review and oversight helps to provide the Funds’ shareholders with significant benefits, including competitive performance.
In closing, we would like to thank you for investing through the HSBC Investor Funds. We appreciate the trust you place in us, and will continue working to earn it. Please contact us at any time with questions or concerns.
Sincerely,

Richard A. Fabietti
President
| |
3 | HSBC INVESTOR FAMILY OF FUNDS |
|
Commentary From the Investment Manager |
|
HSBC Global Asset Management (USA) Inc. |
U.S. Economic Review
The 12-month period between November 1, 2009 and October 31, 2010 began with continued global macroeconomic improvements. Central banks around the developed world fueled the recovery by maintaining interest rates at record lows, and governments provided stimulus programs to spark growth. In the U.S., the Federal Reserve positioned the federal funds rate—a key factor in lending rates—at a historically low target range between 0.00% to 0.25%, and maintained its quantitative easing program throughout the 12-month period.
Early in the period, several encouraging U.S. economic indicators, including positive manufacturing data and improving consumer spending levels, suggested the rebound was gaining strength. However, as the year progressed, signs emerged that the U.S. economic recovery was losing momentum. For example, the index of leading indicators in April 2010 was worse than expected, falling for the first time since March 2009. Although this period of moderation continued, several economic indicators appeared to stabilize as the period wore on, reducing fears of a “double-dip” recession. Nevertheless, there are still some areas of concern—including high U.S. unemployment figures—and forecasts now point towards a slower recovery than was anticipated at the beginning of the period.
Meanwhile, the year was regularly punctuated by periods of volatility due to sovereign debt issues in the Eurozone. This was most apparent in April when credit rating downgrades of Greece and other peripheral Eurozone countries caused bond yields in those countries to rocket upwards. In response to the deterioration of the debt situation, the International Monetary Fund (IMF) and the European Central Bank (ECB) stepped in. They agreed to a $1 trillion package, providing loan guarantees and credits, not just to Greece but to all Eurozone states in financial difficulty, restoring a measure of comfort to investors. More recently, however, debt concerns have resurfaced and the fiscal situation of countries throughout the developed world, including the U.S., continue to cause concern.
Market Review
The financial markets rallied during the first half of the period driven by positive earnings surprises, attractive valuations and ample liquidity. Investors in this environment were more comfortable with higher-risk areas of the markets, helping emerging markets and small-cap stocks produce strong gains during the six months through April.
The fiscal troubles in the Eurozone largely halted the rally in international stocks. Investors became more risk averse in this environment, which in turn pushed down equity markets around the world. In May 2010, developed markets declined by an average of 9%, while emerging markets fell by roughly 8%. However, thanks to a financial support facility from the ECB and IMF, these declines generally were short-lived. Emerging markets stocks staged a particularly strong rebound, driven by strong macroeconomic data and performed well for the period as a whole. Developed market international stocks did not perform as well for the fiscal year, in large part because of the impact of the Eurozone’s sovereign debt issues. The MSCI EAFE Index1 (Europe, Australasia and Far East) of international stocks returned 8.82%, in U.S. Dollar terms, for the 12-month period.
Domestic stocks experienced much stronger returns than their counterparts in developed foreign markets. The S&P 500 Index1 of large-company stocks returned 16.52% for the 12 months through October 2010. Small-cap and mid-cap stocks were among the period’s strongest performers: The Russell 2000® Index1 of small-company stocks returned 26.58%, and the Russell Midcap® Index1 returned 27.71%. The small- and mid-cap categories especially benefited early in the period, due to the early strength and breadth of the U.S. economic recovery and strong corporate earnings results.
Within fixed income, the performance of U.S. Treasuries was mixed over the period. Initially, the pursuit of higher yielding assets led to lower demand for government bonds. As the period progressed, investors responded to increased market volatility by returning to the relative safety of U.S. government bonds, improving their performance. Still, Treasuries lagged the rest of the fixed-income market for the 12 months as a whole. Investment grade corporate bonds and high-yield bonds benefited from attractive valuation levels and a strong improvement in corporate earnings and microeconomic conditions.
The Barclays Capital U.S. Corporate Bond Index1, which tracks the broad investment-grade fixed-income market, returned 11.61% for the 12 months through October, while the Barclays Capital U.S. Corporate High-Yield Bond Index1 returned 19.35%.
| |
1 | For additional information, please refer to the Glossary of Terms. |
| |
HSBC INVESTOR FAMILY OF FUNDS | 4 |
|
Portfolio Reviews |
|
HSBC Investor California Tax-Free Money Market Fund |
(Class A Shares, C Shares, D Shares and Y Shares) |
|
by Jason Moshos |
Portfolio Manager |
Investment Concerns
An investment in the Fund is not insured or guaranteed by the FDIC or any other government agency. Although the Fund seeks to preserve the value of your investment at $1.00 per share, it is possible to lose money by investing in this Fund. The Fund’s income may be subject to the federal alternative minimum tax and to certain state and local taxes. Regional funds may be subject to additional risk, since issues they invest in are located in one geographical area.
Yields on money market securities remained at historic lows during the 12-month period ended October 31, 2010, as concerns over the economy’s health kept interest rates at depressed levels. For example, the federal funds rate (a key short-term interest rate) remained within a range of 0.00% to 0.25% throughout the period. Recent regulatory changes by the Securities and Exchange Commission that mandated money market funds to meet certain minimum liquidity requirements also led to lower yields across the industry. Low interest rates resulted in outflows throughout the money markets as investors sought securities with more attractive yields.
High unemployment and declining tax receipts put pressure on state and local governments’ budgets during the period. In that environment, credit quality diminished across the municipal sector. The managers took a defensive approach with the Fund’s portfolio in response to the difficult credit climate by focusing on high-quality issues and deemphasizing securities of weaker issues to pursue the Fund’s primary goal of capital preservation. Management also maintained a weighted average maturity that was shorter than that of its peers in order to enhance the Fund’s liquidity.*
Throughout the period, the supply of money market eligible tax-free securities was low. One reason for this was that municipalities issued longer-term debt to capitalize on historically low interest rates (and thus, borrowing costs) and to reduce their dependence on short-term funding, which can be less stable. Low supply also was due in part to the success of Build America, the federal government’s bond program that partially subsidizes interest that state and local governments pay.
| |
* | Portfolio composition is subject to change. |
| | | | | | | | | | | | | | | | | | | | | | |
Fund Performance | | | | Average Annual
Total Return (%) | | Yield (%)1 | | Expense
Ratio (%)2 | |
|
|
|
|
|
|
|
|
|
|
|
|
|
|
|
|
As of October 31, 2010 | | Inception
Date | | 1
Year | | 5
Year | | Since
Inception | | 7-Day
Average | | Gross | | Net | |
|
|
|
|
|
|
|
|
|
|
|
|
|
|
|
|
Class A3 | | | 3/2/07 | | — | | — | | 0.55 | | | — | | 0.82 | | 0.81 | |
|
|
|
|
|
|
|
|
|
|
|
|
|
|
|
|
|
|
|
|
|
Class C4 | | | 5/7/07 | | — | | — | | 1.75 | | | — | | 1.42 | | 1.41 | |
|
|
|
|
|
|
|
|
|
|
|
|
|
|
|
|
|
|
|
|
|
Class D | | | 6/17/02 | | 0.01 | | 1.56 | | 1.31 | | | 0.02 | | 0.67 | | 0.66 | |
|
|
|
|
|
|
|
|
|
|
|
|
|
|
|
|
|
|
|
|
|
Class Y | | | 7/18/02 | | 0.02 | | 1.74 | | 1.52 | | | 0.02 | | 0.42 | | 0.41 | |
|
|
|
|
|
|
|
|
|
|
|
|
|
|
|
|
|
|
|
|
|
|
Lipper California Tax-Exempt Money Market Funds Average5 | | | — | | 0.04 | | 1.61 | | 1.33 | 6 | | N/A | | N/A | | N/A | |
|
|
|
|
|
|
|
|
|
|
|
|
|
|
|
|
|
|
|
|
|
Past performance does not guarantee future results. The performance data quoted represents past performance and current returns may be lower or higher. Total return figures include change in share price, reinvestment of dividends and capital gains and do not reflect taxes that a shareholder would pay on Fund distributions or on the redemption of Fund shares. The investment return and principal value will fluctuate so that an investor’s shares, when redeemed may be worth more or less than the original cost. To obtain performance information current to the most recent month end, please call 1-800-782-8183.
The performance above reflects any fee waivers that have been in effect during the applicable periods, as well as any expense reimbursements that have periodically been made. Absent such waivers and reimbursements, returns would have been lower. Currently, contractual fee waivers are in effect from March 1, 2010 through March 1, 2011.
| |
1 | The 7-day yield quotation typically more closely reflects the current earnings of the Fund than the total return quotation. |
| |
2 | Reflects the expense ratio as reported in the prospectus dated March 1, 2010. |
| |
3 | Class A Shares were operational during a portion of the periods presented. Amounts reflect performance for the period of the time the class had operations, which was 334, 332 and 3 days during the year ended October 31, 2010, 2008 and 2007, respectively. The class was operational during the entire year ended October 31, 2009. |
| |
4 | Reflects the applicable contingent deferred sales charge, maximum of 1.00%. Class C Shares were operational during a portion of the periods presented. Amounts reflect performance for the period of the time the class had operations, which was 28, 152, and 165 days during the years ended October 31, 2009, 2008 and 2007, respectively. The class had no operations during the year ended October 31, 2010. |
| |
5 | For additional information, please refer to the Glossary of Terms. |
| |
6 | Return for the period 5/31/02 to 10/31/10. |
| |
5 | HSBC INVESTOR FAMILY OF FUNDS |
|
Portfolio Reviews |
|
HSBC Investor New York Tax-Free Money Market Fund |
(Class A Shares, B Shares, C Shares, D Shares and Y Shares) |
|
by Jason Moshos |
Portfolio Manager |
Investment Concerns
An investment in the Fund is not insured or guaranteed by the FDIC or any other government agency. Although the Fund seeks to preserve the value of your investment at $1.00 per share, it is possible to lose money by investing in the Fund. The Fund’s income may be subject to the federal alternative minimum tax and to certain state and local taxes. Regional funds may be subject to additional risk, since issues they invest in are located in one geographical area.
Concerns over the economy’s health kept interest rates and yields on money market securities at historic lows during the 12-month period ended October 31, 2010. For example, the federal funds rate (a key short-term interest rate) remained within a range of 0.00% to 0.25% throughout the period. The Securities and Exchange Commission’s recent regulatory changes requiring money market funds to maintain minimum liquidity also pushed yields lower across the industry. In that environment, investors withdrew funds from the money markets in search of securities with higher yields.
High unemployment and declining tax receipts put pressure on state and local governments’ budgets during the period. In that environment, credit quality diminished across the municipal sector. The managers took a defensive approach with the Fund’s portfolio in response to the difficult credit environment by focusing on high-quality issues and deemphasizing securities of weaker issues to pursue the Fund’s primary goal of capital preservation. Management also maintained a weighted average maturity that was shorter than that of its peers in order to enhance the Fund’s liquidity.*
Throughout the period, the supply of money market eligible tax-free securities was low. One reason for this was that municipalities issued longer-term debt to capitalize on historically low interest rates (and thus, borrowing costs) and to reduce their dependence on short-term funding, which can be less stable. Low supply also was due in part to the success of Build America, the federal government’s bond program that partially subsidizes interest that state and local governments pay.
* Portfolio composition is subject to change.
| | | | | | | | | | | | | | | | | | | | | | | | | |
Fund Performance | | | | Average Annual
Total Return (%) | | Yield (%)1 | | Expense
Ratio (%)2 | |
|
|
|
|
|
|
|
|
|
|
|
|
|
|
|
|
|
|
As of October 31, 2010 | | Inception
Date | | 1
Year | | 5
Year | | 10
Year | | Since
Inception | | 7-Day
Average | | Gross | | Net | |
|
|
|
|
|
|
|
|
|
|
|
|
|
|
|
|
|
|
Class A | | | 11/17/94 | | 0.02 | | 1.56 | | 1.33 | | 1.95 | | | 0.02 | | 0.64 | | 0.64 | |
|
|
|
|
|
|
|
|
|
|
|
|
|
|
|
|
|
|
|
|
Class B3 | | | 4/29/98 | | — | | 1.28 | | 0.89 | | 0.89 | | | — | | 1.24 | | 1.24 | |
|
|
|
|
|
|
|
|
|
|
|
|
|
|
|
|
|
|
|
|
Class C4 | | | 3/19/01 | | — | | — | | — | | 0.77 | | | — | | 1.24 | | 1.24 | |
|
|
|
|
|
|
|
|
|
|
|
|
|
|
|
|
|
|
|
|
Class D | | | 4/1/99 | | 0.02 | | 1.65 | | 1.46 | | 1.68 | | | 0.02 | | 0.49 | | 0.49 | |
|
|
|
|
|
|
|
|
|
|
|
|
|
|
|
|
|
|
|
|
Class Y | | | 7/1/96 | | 0.02 | | 1.83 | | 1.68 | | 2.14 | | | 0.02 | | 0.24 | | 0.24 | |
|
|
|
|
|
|
|
|
|
|
|
|
|
|
|
|
|
|
|
|
Lipper New York Tax-Exempt Money Market Funds Average5 | | | — | | 0.03 | | 1.66 | | 1.46 | | 2.08 | 6 | | N/A | | N/A | | N/A | |
|
|
|
|
|
|
|
|
|
|
|
|
|
|
|
|
|
|
|
|
Past performance does not guarantee future results. The performance data quoted represents past performance and current returns may be lower or higher. Total return figures include change in share price, reinvestment of dividends and capital gains and do not reflect taxes that a shareholder would pay on Fund distributions or on the redemption of Fund shares. The investment return and principal value will fluctuate so that an investor’s shares, when redeemed may be worth more or less than the original cost. To obtain performance information current to the most recent month end, please call 1-800-782-8183.
The performance above reflects any fee waivers that have been in effect during the applicable periods, as well as any expense reimbursements that have periodically been made. Absent such waivers and reimbursements, returns would have been lower.
| |
1 | The 7-day yield quotation typically more closely reflects the current earnings of the Fund than the total return quotation. |
| |
2 | Reflects the expense ratio as reported in the prospectus dated March 1, 2010. |
| |
3 | Reflects the applicable contingent deferred sales charge, maximum of 4.00%. Class B Shares were operational during a portion of the periods presented. Amounts reflect performance for the period of the time the class had operations, which was 190 days during the year ended October 31, 2010. The Class was operational during the entire years ended October 31, 2009, 2008, 2007, 2006, 2005, 2004, 2003, 2002 and 2001. |
| |
4 | Reflects the applicable contingent deferred sales charge, maximum of 1.00%. Class C Shares were operational during a portion of the periods presented. Amounts reflect performance for the period of time the class had operations, which was 81, 81, 145 and 227 days during the years ended October 31, 2004, 2003, 2002 and 2001, respectively. The class had no operations during the entire years ended October 31, 2010, 2009, 2008, 2007, 2006 and 2005. |
| |
5 | For additional information, please refer to the Glossary of Terms. |
| |
6 | Return for the period 10/31/94 to 10/31/10. |
| |
HSBC INVESTOR FAMILY OF FUNDS | 6 |
|
Portfolio Reviews |
|
HSBC Investor Prime Money Market Fund |
(Class A Shares, B Shares, C Shares, D Shares, I Shares and Y Shares) |
|
by John Chiodi |
Senior Portfolio Manager |
Investment Concerns
An investment in the Fund is not insured or guaranteed by the FDIC or any other government agency. Although the Fund seeks to preserve the value of your investment at $1.00 per share, it is possible to lose money by investing in the Fund.
Yields on money market securities remained at historic lows during the 12 months through October 31, 2010, as concerns over the economy’s health kept interest rates at depressed levels. The federal funds rate (a key short-term interest rate) remained within a range of 0.00% to 0.25% throughout the period. Recent regulatory changes by the Securities and Exchange Commission that required money market funds to maintain minimum liquidity also lead to lower yields across the industry. Low interest rates resulted in outflows from the money markets as investors sought securities with more attractive yields.
The Fund’s weighted average maturity at the beginning of the period was shorter than that of its benchmark index, due to our belief that the higher yield available on longer-term issues did not outweigh the additional risk given the uncertain economic environment. We also purchased floating-rate notes to prepare for the possibility that interest rates may move higher. Such securities are designed to adjust their interest rates quickly when the general level of interest rates shifts.*
This emphasis on relatively short-term issues and floating-rate notes enabled the Fund to more quickly reinvest in higher yielding securities during the second calendar quarter, when economic concerns in Europe pushed rates on short-term money market securities higher. The Fund extended its weighted average maturity later in the period, after it became clear that the global economy was stabilizing somewhat.*
| |
* | Portfolio composition is subject to change. |
| | | | | | | | | | | | | | | | | | |
Fund Performance | | | | Average Annual
Total Return (%) | | Yield (%)1 | | Expense
Ratio (%)2 | |
|
|
|
|
|
|
|
|
|
|
As of October 31, 2010 | | Inception
Date | | 1
Year | | 5
Year | | 10
Year | | Since
Inception | | 7-Day
Average | | Gross | | Net | |
|
|
|
|
|
|
|
|
|
|
|
|
|
|
|
|
|
|
Class A | | 11/13/98 | | 0.01 | | 2.39 | | 2.12 | | 2.60 | | | 0.01 | | 0.66 | | 0.66 | |
|
|
|
|
|
|
|
|
|
|
|
|
|
|
|
|
|
|
|
Class B3 | | 4/4/01 | | -3.99 | | 1.99 | | — | | 1.61 | | | 0.01 | | 1.26 | | 1.26 | |
|
|
|
|
|
|
|
|
|
|
|
|
|
|
|
|
|
|
|
Class C4 | | 3/23/01 | | -0.99 | | 1.99 | | — | | 1.51 | | | 0.01 | | 1.26 | | 1.26 | |
|
|
|
|
|
|
|
|
|
|
|
|
|
|
|
|
|
|
|
Class D | | 4/1/99 | | 0.01 | | 2.50 | | 2.25 | | 2.67 | | | 0.01 | | 0.51 | | 0.51 | |
|
|
|
|
|
|
|
|
|
|
|
|
|
|
|
|
|
|
|
Class I | | 1/9/02 | | 0.14 | | 2.81 | | — | | 2.34 | | | 0.14 | | 0.16 | | 0.16 | |
|
|
|
|
|
|
|
|
|
|
|
|
|
|
|
|
|
|
|
Class Y | | 11/12/98 | | 0.05 | | 2.70 | | 2.48 | | 2.97 | | | 0.05 | | 0.26 | | 0.26 | |
|
|
|
|
|
|
|
|
|
|
|
|
|
|
|
|
|
|
|
Lipper Money Market Funds Average5 | | — | | 0.03 | | 2.30 | | 2.00 | | 2.51 | 6 | | N/A | | N/A | | N/A | |
|
|
|
|
|
|
|
|
|
|
|
|
|
|
|
|
|
|
|
Past performance does not guarantee future results. The performance data quoted represents past performance and current returns may be lower or higher. Total return figures include change in share price, reinvestment of dividends and capital gains and do not reflect taxes that a shareholder would pay on Fund distributions or on the redemption of Fund shares. The investment return and principal value will fluctuate so that an investor’s shares, when redeemed may be worth more or less than the original cost. To obtain performance information current to the most recent month end, please call 1-800-782-8183.
The performance above reflects any fee waivers that have been in effect during the applicable periods, as well as any expense reimbursements that have periodically been made. Absent such waivers and reimbursements, returns would have been lower.
| |
1 | The 7-day yield quotation typically more closely reflects the current earnings of the Fund than the total return quotation. |
| |
2 | Reflects the expense ratio as reported in the prospectus dated March 1, 2010. |
| |
3 | Reflects the applicable contingent deferred sales charge, maximum of 4.00%. |
| |
4 | Reflects the applicable contingent deferred sales charge, maximum of 1.00%. |
| |
5 | For additional information, please refer to the Glossary of Terms. |
| |
6 | Return for the period 10/31/98 to 10/31/10. |
| |
7 | HSBC INVESTOR FAMILY OF FUNDS |
|
Portfolio Reviews |
|
HSBC Investor Tax-Free Money Market Fund |
(Class A Shares, C Shares, D Shares, I Shares and Y Shares) |
|
by Jason Moshos |
Portfolio Manager |
Investment Concerns
An investment in the Fund is not insured or guaranteed by the FDIC or any other government agency. Although the Fund seeks to preserve the value of your investment at $1.00 per share, it is possible to lose money by investing in the Fund. The Fund’s income may be subject to the federal alternative minimum tax and to certain state and local taxes.
Concerns about the health of the economy caused yields on money market securities to remain at historically low levels throughout the 12-month period ended October 31, 2010. The federal funds rate (a key short-term interest rate) remained within a range of 0.00% to 0.25% throughout the period. Recent regulatory changes by the Securities and Exchange Commission requiring money market funds to maintain minimum liquidity also resulted in lower yields across the industry. Low interest rates caused outflows throughout the money markets, as investors sought securities with more attractive yields.
High unemployment and declining tax receipts put pressure on state and local governments’ budgets during the period. In that environment, credit quality diminished across the municipal sector. The managers took a defensive approach with the Fund’s portfolio in response to the difficult credit environment by focusing on high-quality issues and deemphasizing securities of weaker issues to pursue the Fund’s primary goal of capital preservation. Management also maintained a weighted average maturity that was shorter than that of its peers in order to enhance the Fund’s liquidity.*
Throughout the period, the supply of money market eligible tax-free securities was low. One reason for this was that municipalities issued longer-term debt to capitalize on historically low interest rates (and thus, borrowing costs) and to reduce their dependence on short-term funding, which can be less stable. Low supply also was due in part to the success of Build America, the federal government’s bond program that partially subsidizes interest that state and local governments pay.
| |
* | Portfolio composition is subject to change. |
| | | | | | | | | | | | | | | | |
Fund Performance | | | | Average Annual
Total Return (%) | | | Yield (%)1 | | Expense
Ratio (%)2 | |
|
|
|
|
|
|
|
|
|
|
|
As of October 31, 2010 | | Inception
Date | | 1
Year | | 5
Year | | Since
Inception | | 7-Day
Average | | Gross | | Net | |
|
|
|
|
|
|
|
|
|
|
|
|
|
|
|
|
Class A3 | | 8/27/04 | | — | | — | | 0.35 | | | — | | 0.76 | | 0.76 | |
|
|
|
|
|
|
|
|
|
|
|
|
|
|
|
|
|
Class C4 | | 7/30/07 | | — | | — | | 0.09 | | | — | | 1.36 | | 1.36 | |
|
|
|
|
|
|
|
|
|
|
|
|
|
|
|
|
|
Class D | | 8/24/04 | | 0.01 | | 1.64 | | 1.63 | | | 0.01 | | 0.61 | | 0.61 | |
|
|
|
|
|
|
|
|
|
|
|
|
|
|
|
|
|
Class I5 | | 6/25/04 | | — | | — | | 0.27 | | | — | | 0.26 | | 0.26 | |
|
|
|
|
|
|
|
|
|
|
|
|
|
|
|
|
|
Class Y | | 6/8/04 | | 0.08 | | 1.86 | | 1.82 | | | 0.08 | | 0.36 | | 0.36 | |
|
|
|
|
|
|
|
|
|
|
|
|
|
|
|
|
|
Lipper Tax-Exempt Money Market Funds Average6 | | — | | 0.03 | | 1.63 | | 1.57 | 7 | | N/A | | N/A | | N/A | |
|
|
|
|
|
|
|
|
|
|
|
|
|
|
|
|
|
Past performance does not guarantee future results. The performance data quoted represents past performance and current returns may be lower or higher. Total return figures include change in share price, reinvestment of dividends and capital gains and do not reflect taxes that a shareholder would pay on Fund distributions or on the redemption of Fund shares. The investment return and principal value will fluctuate so that an investor’s shares, when redeemed may be worth more or less than the original cost. To obtain performance information current to the most recent month end, please call 1-800-782-8183.
The performance above reflects any fee waivers that have been in effect during the applicable periods, as well as any expense reimbursements that have periodically been made. Absent such waivers and reimbursements, returns would have been lower.
| |
1 | The 7-day yield quotation typically more closely reflects the current earnings of the Fund than the total return quotation. |
| |
2 | Reflects the expense ratio as reported in the prospectus dated March 1, 2010. |
| |
3 | Class A Shares were operational during a portion of the periods presented. Amounts reflect performance for the period of the time the class had operations, which was 262, 24, 78 and 5 days during the years ended October 31, 2009, 2007, 2006 and 2004, respectively. The class was operational during the entire year ended October 31, 2010. |
| |
4 | Reflects the applicable contingent deferred sales charge, maximum of 1.00%. Class C Shares were operational during a portion of the periods presented. Amounts reflect performance for the period of time the class had operations, which was 15 days during the year ended October 31, 2007. The class had no operations during the years ended October 31, 2010, 2009, and 2008. |
| |
5 | Class I Shares were operational during a portion of the periods presented. Amounts reflect performance for the period of the time the class had operations, which was 51, 27 and 40 days during the years ended October 31, 2010, 2005 and 2004, respectively. The class had no operations during the years ended October 31, 2009, 2008, 2007 and 2006. |
| |
6 | For additional information, please refer to the Glossary of Terms. |
| |
7 | Return for the period 5/31/04 to 10/31/10. |
| |
HSBC INVESTOR FAMILY OF FUNDS | 8 |
|
Portfolio Reviews |
|
HSBC Investor U.S. Government Money Market Fund |
(Class A Shares, B Shares, C Shares, D Shares, I Shares and Y Shares) |
|
by John Chiodi |
Senior Portfolio Manager |
Investment Concerns
An investment in the Fund is not insured or guaranteed by the FDIC or any other government agency. Although the Fund seeks to preserve the value of your investment at $1.00 per share, it is possible to lose money by investing in the Fund.
Interest rates remained at historically low levels throughout the 12-month period ended October 31, 2010, which was a reflection of investors’ concern about the pace of the economic recovery. The federal funds rate (a key short-term interest rate) ranged between 0.00% and 0.25% throughout the period.
Yields on money market securities remained at very low levels in that environment. Money market funds’ yields were further depressed as a result of regulatory changes requiring the funds to meet higher standards for liquidity. During the period investors withdrew assets from money market securities in search of higher yields in other areas of the market.
The Fund held a weighted average maturity longer than that of its index during the period, in an effort to capture additional yield available on longer-term money market securities. The Fund’s emphasis on longer-term issues with relatively high yields also was designed to help minimize the impact of yields falling to near 0.00% at the end of each quarter, which occurred as broker-dealers purchased large quantities of government securities in order to reduce the percentage of loans on their balance sheets and increase the percentage of securities. These large purchases pushed down yields on government securities. But while the fund maintained a relatively long average maturity, it held a significant percentage of its portfolio in repurchase agreements maturing within one day in order to provide additional liquidity in the uncertain environment.*
| |
* | Portfolio composition is subject to change. |
| | | | | | | | | | | | | | | | | | |
Fund Performance | | | | Average Annual
Total Return (%) | | Yield (%)1 | | Expense
Ratio (%)2 | |
|
|
|
|
|
|
|
|
|
|
As of October 31, 2010 | | Inception
Date | | 1
Year | | 5
Year | | 10
Year | | Since
Inception | | 7-Day
Average | | Gross | | Net | |
|
|
|
|
|
|
|
|
|
|
|
|
|
|
|
|
|
|
Class A | | 5/3/90 | | 0.02 | | 2.21 | | 1.96 | | 3.37 | | | 0.01 | | 0.66 | | 0.66 | |
|
|
|
|
|
|
|
|
|
|
|
|
|
|
|
|
|
|
|
Class B3 | | 9/11/98 | | -3.98 | | 2.14 | | 1.76 | | 2.20 | | | 0.01 | | 1.26 | | 1.26 | |
|
|
|
|
|
|
|
|
|
|
|
|
|
|
|
|
|
|
|
Class C4 | | 11/20/06 | | — | | — | | — | | 1.39 | | | — | | 1.26 | | 1.26 | |
|
|
|
|
|
|
|
|
|
|
|
|
|
|
|
|
|
|
|
Class D | | 4/1/99 | | 0.02 | | 2.31 | | 2.09 | | 2.49 | | | 0.01 | | 0.51 | | 0.51 | |
|
|
|
|
|
|
|
|
|
|
|
|
|
|
|
|
|
|
|
Class I5 | | 12/24/03 | | 0.08 | | — | | — | | 2.27 | | | 0.09 | | 0.16 | | 0.16 | |
|
|
|
|
|
|
|
|
|
|
|
|
|
|
|
|
|
|
|
Class Y | | 7/1/96 | | 0.02 | | 2.50 | | 2.31 | | 3.16 | | | 0.01 | | 0.26 | | 0.26 | |
|
|
|
|
|
|
|
|
|
|
|
|
|
|
|
|
|
|
|
Lipper U.S. Government Money Market Funds Average6 | | — | | 0.02 | | 2.19 | | 1.96 | | 3.40 | 7 | | N/A | | N/A | | N/A | |
|
|
|
|
|
|
|
|
|
|
|
|
|
|
|
|
|
|
|
Past performance does not guarantee future results. The performance data quoted represents past performance and current returns may be lower or higher. Total return figures include change in share price, reinvestment of dividends and capital gains and do not reflect taxes that a shareholder would pay on Fund distributions or on the redemption of Fund shares. The investment return and principal value will fluctuate so that an investor’s shares, when redeemed may be worth more or less than the original cost. To obtain performance information current to the most recent month end, please call 1-800-782-8183.
The performance above reflects any fee waivers that have been in effect during the applicable periods, as well as any expense reimbursements that have periodically been made. Absent such waivers and reimbursements, returns would have been lower.
| |
1 | The 7-day yield quotation typically more closely reflects the current earnings of the Fund than the total return quotation. |
| |
2 | Reflects the expense ratio as reported in the prospectus dated March 1, 2010. |
| |
3 | Reflects the applicable contingent deferred sales charge, maximum of 4.00%. |
| |
4 | Reflects the applicable contingent deferred sales charge, maximum of 1.00%. Class C Shares were operational during a portion of the periods presented. Amounts reflect performance for the period of time the class had operations, which was 351 and 346 days during the years end October 31, 2010 and 2007, respectively. The class has no operations during the years ended October 31, 2009 and 2008. |
| |
5 | Class I Shares were operational during a portion of the periods presented. Amounts reflect performance for the period of the time the class had operations, which was 357, 136, 89 and 10 days during the years ended October 31, 2007, 2006, 2005 and 2004, respectively. The class was operational during the entire years ended October 31, 2010, 2009 and 2008. |
| |
6 | For additional information, please refer to the Glossary of Terms. |
| |
7 | Return for the period 4/30/90 to 10/31/10. |
| |
9 | HSBC INVESTOR FAMILY OF FUNDS |
|
Portfolio Reviews |
|
HSBC Investor U.S. Treasury Money Market Fund |
(Class A Shares, B Shares, C Shares, D Shares, I Shares and Y Shares) |
|
by John Chiodi |
Senior Portfolio Manager |
|
Investment Concerns |
An investment in the Fund is not insured or guaranteed by the FDIC or any other government agency. Although the Fund seeks to preserve the value of your investment at $1.00 per share, it is possible to lose money by investing in the fund. The Fund’s income may be subject to the federal alternative minimum tax and to certain state and local taxes.
The 12-month period ended October 31, 2010 was characterized by historically low interest rates. Low rates resulted from investor concerns about the health of the economy as well as from regulatory changes by the Securities and Exchange Commission, which required money market funds to meet new standards for liquidity. The federal funds rate (a key short-term interest rate) ranged between 0.00% and 0.25% during the period.
In that environment, investors withdrew funds from money market securities in search of more attractive yields elsewhere.
The Fund maintained a weighted average maturity that was longer than that of its index, in an effort to capture additional yield available from longer-term Treasuries. Emphasizing slightly longer-term, higher yielding issues also helped offset the impact of quarter-end window dressing, which occurs when institutional investors purchase large quantities of Treasury securities near the end of a reporting period in order to show that their holdings consist of high-quality securities. The amount of buying during the period caused yields on many Treasury bills to fall to near 0.00% at the end of each quarter.*
| |
* | Portfolio composition is subject to change. |
| | | | | | | | | | | | | | | | |
Fund Performance | | | | Average Annual
Total Return (%) | | Yield (%)1 | | Expense
Ratio (%)2 | |
|
|
|
|
|
|
|
|
|
|
As of October 31, 2010 | | Inception
Date | | 1
Year | | 5
Year | | Since
Inception | | 7-Day
Average | | Gross | | Net | |
|
|
|
|
|
|
|
|
|
|
|
|
|
|
|
|
Class A | | 5/24/01 | | 0.01 | | 1.86 | | 1.49 | | | 0.01 | | 0.66 | | 0.66 | |
|
|
|
|
|
|
|
|
|
|
|
|
|
|
|
|
|
Class B3 | | 8/13/04 | | -3.99 | | 1.51 | | 1.43 | | | 0.01 | | 1.26 | | 1.26 | |
|
|
|
|
|
|
|
|
|
|
|
|
|
|
|
|
|
Class C4 | | 12/24/03 | | — | | — | | 0.04 | | | — | | 1.26 | | 1.26 | |
|
|
|
|
|
|
|
|
|
|
|
|
|
|
|
|
|
Class D | | 5/14/01 | | 0.01 | | 1.95 | | 1.61 | | | 0.01 | | 0.51 | | 0.51 | |
|
|
|
|
|
|
|
|
|
|
|
|
|
|
|
|
|
Class I5 | | 12/30/03 | | 0.01 | | 2.21 | | 1.91 | | | 0.01 | | 0.16 | | 0.16 | |
|
|
|
|
|
|
|
|
|
|
|
|
|
|
|
|
|
Class Y | | 5/11/01 | | 0.01 | | 2.11 | | 1.81 | | | 0.01 | | 0.26 | | 0.26 | |
|
|
|
|
|
|
|
|
|
|
|
|
|
|
|
|
|
Lipper U.S. Treasury Money Market Funds Average6 | | — | | 0.01 | | 1.92 | | 1.62 | 7 | | N/A | | N/A | | N/A | |
|
|
|
|
|
|
|
|
|
|
|
|
|
|
|
|
|
Past performance does not guarantee future results. The performance data quoted represents past performance and current returns may be lower or higher. Total return figures include change in share price, reinvestment of dividends and capital gains and do not reflect taxes that a shareholder would pay on Fund distributions or on the redemption of Fund shares. The investment return and principal value will fluctuate so that an investor’s shares, when redeemed may be worth more or less than the original cost. To obtain performance information current to the most recent month end, please call 1-800-782-8183.
The performance above reflects any fee waivers that have been in effect during the applicable periods, as well as any expense reimbursements that have periodically been made. Absent such waivers and reimbursements, returns would have been lower. Currently, for Class I contractual fee waivers are in effect from March 1, 2010 through March 1, 2011.
| |
1 | The 7-day yield quotation typically more closely reflects the current earnings of the Fund than the total return quotation. |
| |
2 | Reflects the expense ratio as reported in the prospectus dated March 1, 2010. |
| |
3 | Reflects the applicable contingent deferred sales charge, maximum of 4.00%. |
| |
4 | Reflects the applicable contingent deferred sales charge, maximum of 1.00%. Class C Shares were operational during a portion of the periods presented. Amounts reflect performance for the period of the time the class had operations, which was 351 and 26 days during the years ended October 31, 2010 and 2008, respectively. The class was operational during the entire year ended October 31, 2009. |
| |
5 | Class I Shares were operational during a portion of the periods presented. Amounts reflect performance for the period of the time the class had operations, which was 280 and 13 days during the years ended October 31, 2005 and 2004, respectively. The class was operational during the years ended October 31, 2010, 2009, 2008, 2007 and 2006. |
| |
6 | For additional information, please refer to the Glossary of Terms. |
| |
7 | Return for the period 4/30/01 to 10/31/10. |
| |
HSBC INVESTOR FAMILY OF FUNDS | 10 |
|
Portfolio Reviews |
|
Portfolio Composition* |
October 31, 2010 |
(Unaudited) |
| | | | |
HSBC Investor California Tax-Free Money Market Fund | | | |
|
|
|
|
| | | |
Investment Allocation | | Percentage of Investments at Value | |
|
|
|
|
Variable Rate Demand Notes | | 85.4 | % | |
|
|
|
|
|
Investment Companies | | 9.8 | % | |
|
|
|
|
|
Municipal Bonds | | 2.8 | % | |
|
|
|
|
|
Commercial Paper And Notes | | 2.0 | % | |
|
|
|
|
|
Total | | 100.0 | % | |
|
|
|
|
|
| | | | |
HSBC Investor N.Y. Tax-Free Money Market Fund | | | | |
|
|
|
|
|
| | | | |
Investment Allocation | | Percentage of Investments at Value | |
|
|
|
|
Variable Rate Demand Notes | | 93.2 | % | |
|
|
|
|
|
Investment Companies | | 2.8 | % | |
|
|
|
|
|
Municipal Bonds | | 2.0 | % | |
|
|
|
|
|
Commercial Paper And Notes | | 2.0 | % | |
|
|
|
|
|
Total | | 100.0 | % | |
|
|
|
|
|
| | | | |
HSBC Investor Prime Money Market Fund | | | | |
|
|
|
|
|
| | | | |
Investment Allocation | | Percentage of Investments at Value | |
|
|
|
|
Commercial Paper And Notes | | 36.4 | % | |
|
|
|
|
|
Certificates of Deposit | | 29.2 | % | |
|
|
|
|
|
U.S. Treasury Obligations | | 8.0 | % | |
|
|
|
|
|
Corporate Obligations | | 7.2 | % | |
|
|
|
|
|
Repurchase Agreements | | 5.8 | % | |
|
|
|
|
|
Time Deposits | | 5.6 | % | |
|
|
|
|
|
Variable Rate Demand Notes | | 5.6 | % | |
|
|
|
|
|
Municipal Bonds | | 2.2 | % | |
|
|
|
|
|
Total | | 100.0 | % | |
|
|
|
|
|
| | | | |
HSBC Investor Tax-Free Money Market Fund | | | | |
|
|
|
|
|
| | | | |
Investment Allocation | | Percentage of Investments at Value | |
|
|
|
|
Variable Rate Demand Notes | | 79.9 | % | |
|
|
|
|
|
Municipal Bonds | | 12.0 | % | |
|
|
|
|
|
Commercial Paper And Notes | | 4.5 | % | |
|
|
|
|
|
Investment Companies | | 3.6 | % | |
|
|
|
|
|
Total | | 100.0 | % | |
|
|
|
|
|
| | | | |
HSBC Investor U.S. Government Money Market Fund | | | | |
|
|
|
|
|
| | | | |
Investment Allocation | | Percentage of Investments at Value | |
|
|
|
|
U.S. Government and Government Agency Obligations | | 49.7 | % | |
|
|
|
|
|
Repurchase Agreements | | 43.9 | % | |
|
|
|
|
|
U.S. Treasury Obligations | | 6.4 | % | |
|
|
|
|
|
Total | | 100.0 | % | |
|
|
|
|
|
| | | | |
HSBC Investor U.S. Treasury Money Market Fund | | | | |
|
|
|
|
|
| | | | |
Investment Allocation | | Percentage of Investments at Value | |
|
|
|
|
U.S. Treasury Bills | | 100.0 | % | |
|
|
|
|
|
Total | | 100.0 | % | |
|
|
|
|
|
| |
* | Portfolio composition is subject to change. |
| |
11 | HSBC INVESTOR FAMILY OF FUNDS |
|
HSBC INVESTOR CALIFORNIA TAX-FREE MONEY MARKET FUND |
|
Schedule of Portfolio Investments—as of October 31, 2010 |
|
Variable Rate Demand Notes—85.8% |
|
| | | | | | | |
| | Principal
Amount($) | | Amortized
Cost($) | |
| |
| |
| |
California – 85.8% | | | | | | | |
ABAG Finance Authority for
Nonprofit Corps. Multi-family
Revenue, Series A, 0.27%,
12/15/32, (Credit Support FNMA,
Liquidity Facility FNMA) (a) | | | 1,000,000 | | | 1,000,000 | |
ABAG Finance Authority for
Nonprofit Corps. Revenue, 0.35%,
7/1/35, (LOC Wells Fargo Bank
N.A., U.S. Bank N.A.) (a) | | | 500,000 | | | 500,000 | |
ABAG Finance Authority for
Nonprofit Corps. Revenue, 0.29%,
9/1/35, (LOC Bank of New York) (a) | | | 775,000 | | | 775,000 | |
Beaumont California Utility Authority
Revenue, Series A, 0.26%, 9/1/41,
(LOC Union Bank of California
N.A., California State Teacher’s
Retirement) (a) | | | 900,000 | | | 900,000 | |
Berkeley California Revenue,
0.22%, 7/1/38, (LOC Wells Fargo
Bank N.A.) (a) | | | 500,000 | | | 500,000 | |
California Educational Facilities
Authority Revenue, 0.35%, 10/1/36,
(LOC Bank of America N.A.) (a) | | | 1,000,000 | | | 1,000,000 | |
California Health Facilities Financing
Authority Revenue, Series A, 0.22%,
8/1/21, (LOC U.S. Bank N.A.) (a) | | | 500,000 | | | 500,000 | |
California Health Facilities Financing
Authority Revenue, Series F,
0.23%, 10/1/31, (LOC Northern
Trust Co.) (a) | | | 925,000 | | | 925,000 | |
California Health Facilities Financing
Authority Revenue, Series A-2,
0.27%, 11/15/40, (LOC Bank of
America N.A.) (a) | | | 500,000 | | | 500,000 | |
California Infrastructure & Economic
Development Bank Revenue,
Series C, 0.25%, 9/1/38, (LOC Bank
of Nova Scotia) (a) | | | 500,000 | | | 500,000 | |
California Municipal Finance Authority
Revenue, Series A, 0.22%, 8/1/28,
(LOC Wells Fargo Bank N.A.) (a) | | | 500,000 | | | 500,000 | |
California Municipal Finance Authority
Revenue, 0.29%, 7/1/38, (LOC U.S.
Bank N.A.) (a) | | | 500,000 | | | 500,000 | |
California Pollution Control Financing
Authority Revenue, 0.25%, 11/1/26,
(LOC Bank One N.A.) (a) | | | 500,000 | | | 500,000 | |
California Pollution Control Financing
Authority Revenue, 0.25%, 11/1/26,
(LOC JP Morgan Chase & Co.) (a) | | | 500,000 | | | 500,000 | |
California State Economic Recovery,
GO, Series C, 0.22%, 7/1/23,
(LOC Bank of America N.A.) (a) | | | 500,000 | | | 500,000 | |
California State Economic Recovery,
GO, Series C, 0.25%, 7/1/23,
(LOC JP Morgan Chase & Co.) (a) | | | 655,000 | | | 655,000 | |
California State Kindergarten, 0.22%,
5/1/34, (LOC Citibank N.A.) (a) | | | 500,000 | | | 500,000 | |
California State Kindergarten,
0.24%, 5/1/34, (State Street
Bank & Trust Co.) (a) | | | 1,500,000 | | | 1,500,000 | |
|
Variable Rate Demand Notes, continued |
|
| | | | | | | |
| | Principal
Amount($) | | Amortized
Cost($) | |
| |
| |
| |
California, continued | | | | | | | |
California State, GO, Series A, 0.28%,
5/1/33, (LOC Bank of Montreal) (a) | | | 1,500,000 | | | 1,500,000 | |
California State, GO, 0.23%, 5/1/34,
(LOC Citibank N.A.) (a) | | | 500,000 | | | 500,000 | |
California Statewide Communities
Development Authority Multi-family
Revenue, Series B, 0.29%, 6/15/25,
AMT, (Credit Support FNMA,
Liquidity Facility FNMA) (a) | | | 500,000 | | | 500,000 | |
California Statewide Communities
Development Authority Multi-family
Revenue, Series Q, 0.31%, 10/1/38,
AMT, (LOC Citibank N.A.) (a) | | | 600,000 | | | 600,000 | |
California Statewide Communities
Development Authority Revenue,
Series C, 0.26%, 8/15/27,
(LOC Wells Fargo Bank N.A.) (a) | | | 500,000 | | | 500,000 | |
California Statewide Communities
Development Authority Revenue,
0.24%, 9/1/29, (LOC JP Morgan
Chase Bank) (a) | | | 500,000 | | | 500,000 | |
California Statewide Communities
Development Authority Revenue,
0.32%, 2/1/38, (LOC Wells Fargo
Bank N.A.) (a) | | | 700,000 | | | 700,000 | |
Calleguas-Las Virgenes Public
Financing Authority Revenue, Series A,
0.22%, 7/1/37, (LOC Wells Fargo
Bank N.A.) (a) | | | 500,000 | | | 500,000 | |
Chino Basin California Regional
Financing Authority Revenue,
Series B, 0.29%, 6/1/32, (LOC Dexia
Credit Local) (a) | | | 500,000 | | | 500,000 | |
Contra Costa County California Housing
Authority Multi-family Revenue,
0.31%, 11/15/17, (Credit Support
FHLMC) (a) | | | 500,000 | | | 500,000 | |
Easy Bay California Municipal Utility
District Water System Revenue,
Sub-series B, 0.28%, 6/1/25,
(Credit Support FSA, SPA Dexia
Credit Local) (a) | | | 500,000 | | | 500,000 | |
Hayward California Housing Authority
Multi-family Revenue, 0.30%, 3/1/27,
(Credit Support FHA, LOC State
Street B&T Co.) (a) | | | 500,000 | | | 500,000 | |
Hemet California Unified School
District Certificates of Participation,
0.25%, 10/1/36, (LOC State Street
B&T Co.) (a) | | | 1,000,000 | | | 1,000,000 | |
Hesperia California Unified School
District Certificates of Participation,
0.50%, 2/1/18, (Credit Support FSA,
SPA Dexia Bank) (a) | | | 750,000 | | | 750,000 | |
Irvine California Import Bond Act 1915,
0.23%, 9/2/25, (LOC Bank of
America N.A.) (a) | | | 500,000 | | | 500,000 | |
Irvine Public Facilities & Infrastructure
Authority Lease Revenue, 0.58%,
11/1/10, (LOC State Street
B&T Co.) (a) | | | 460,000 | | | 460,000 | |
| | |
See notes to financial statements | HSBC INVESTOR FAMILY OF FUNDS | 12 |
|
HSBC INVESTOR CALIFORNIA TAX-FREE MONEY MARKET FUND |
|
Schedule of Portfolio Investments—as of October 31, 2010 (continued) |
|
Variable Rate Demand Notes, continued |
|
| | | | | | | |
| | Principal
Amount($) | | Amortized
Cost($) | |
| |
| |
| |
California, continued | | | | | | | |
Irvine Ranch California Water District
GO, Series B, 0.25%, 10/1/41,
(LOC Bank of America N.A.) (a) | | | 500,000 | | | 500,000 | |
Kern California Water Bank Authority
Revenue, Series A, 0.22%, 7/1/28,
(LOC Wells Fargo Bank N.A.) (a) | | | 500,000 | | | 500,000 | |
Lancaster California Redevelopment
Agency Multi-family Housing
Revenue, Series C, 0.27%, 12/1/26,
(Credit Support FNMA, Liquidity
Facility FNMA) (a) | | | 500,000 | | | 500,000 | |
Los Angeles County California
Metropolitan Transportation Authority
Sales Tax Revenue, Series C-2, 0.24%,
7/1/25, (LOC U.S. Bank N.A.) (a) | | | 600,000 | | | 600,000 | |
Los Angeles County California
Metropolitan Transportation Authority
Sales Tax Revenue, Series C-3, 0.24%,
7/1/25, (LOC Sumitomo Mitsui
Banking Corp.) (a) | | | 1,000,000 | | | 1,000,000 | |
Los Angeles County Housing Authority
Multi-family Housing Revenue, 0.31%,
5/1/33, (Credit Support FHLMC) (a) | | | 500,000 | | | 500,000 | |
Manhattan Beach California Certificates
of Participation, 0.45%, 8/1/32,
(LOC Bank of America N.A.) (a) | | | 500,000 | | | 500,000 | |
Modesto California Public Financing
Authority Lease Revenue, 0.31%,
9/1/33, (LOC Bank of America
N.A.) (a) | | | 500,000 | | | 500,000 | |
Morgan Hill Redevelopment Agency
Tax Allocation, 0.25%, 9/1/33,
(LOC Scotiabank) (a) | | | 750,000 | | | 750,000 | |
Murrieta Valley California Unified
School District Certificates of
Participation, 0.27%, 5/1/41,
(LOC U.S. Bank N.A.) (a) | | | 1,000,000 | | | 1,000,000 | |
Oakland-Alameda County California
Coliseum Authority Lease Revenue,
Series C-1, 0.29%, 2/1/25, (LOC
Bank of New York, California State
Teacher’s Retirement) (a) | | | 1,000,000 | | | 1,000,000 | |
Orange County California Apartment
Development Revenue, 0.26%, 12/1/22,
(Credit Support FHLMC) (a) | | | 500,000 | | | 500,000 | |
Otay California Water District
Certificates of Participation, 0.28%,
9/1/26, (LOC Landesbank
Hessen-Thuringen) (a) | | | 1,000,000 | | | 1,000,000 | |
Perris California Union High School
District Certificates of Participation,
0.50%, 9/1/33, (Credit Support FSA,
SPA Dexia Credit Local) (a) | | | 1,000,000 | | | 1,000,000 | |
Riverside County California Certificates
of Participation, 0.30%, 12/1/15,
(LOC State Street B&T Co.) (a) | | | 1,000,000 | | | 1,000,000 | |
Sacramento California Suburban Water
District Certificates of Participation,
Series A-2, 0.25%, 11/1/28,
(LOC Allied Irish Bank plc) (a) | | | 1,000,000 | | | 1,000,000 | |
|
Variable Rate Demand Notes, continued |
|
| | | | | | | |
| | Principal
Amount($) | | Amortized
Cost($) | |
| |
| |
| |
California, continued | | | | | | | |
Sacramento California Suburban Water
District Certificates of Partifipation,
Series A, 0.25%, 11/1/34, (LOC
Sumitomo Mitsui Banking) (a) | | | 1,000,000 | | | 1,000,000 | |
San Francisco California City & County
Redevelopment Agency Community
Facilities District Special Obligation,
Series A, 0.29%, 8/1/36, (LOC JP
Morgan Chase & Co.) (a) | | | 750,000 | | | 750,000 | |
San Francisco California City & County
Redevelopment Agency Multi-family
Revenue, Series F, 0.29%, 12/1/33,
AMT, (LOC Citibank N.A.) (a) | | | 625,000 | | | 625,000 | |
San Jose California Multi-family
Housing Revenue, Series F, 0.50%,
7/15/35, AMT, (Credit Support FNMA,
Liquidity Facility FNMA) (a) | | | 835,000 | | | 835,000 | |
San Jose California Redevelopment
Agency Revenue, Series B, 0.30%,
8/1/32, (LOC JP Morgan Chase
Bank) (a) | | | 800,000 | | | 800,000 | |
Santa Clara California Electric Revenue,
Sub-series B, 0.28%, 7/1/27, (LOC
Dexia Credit Local) (a) | | | 500,000 | | | 500,000 | |
South Bay California Regional Public
Communications Authority Revenue,
Series C, 0.32%, 1/1/31, (LOC Bank
of America N.A.) (a) | | | 500,000 | | | 500,000 | |
South Placer California Wastewater
Authority Revenue, Series B, 0.26%,
11/1/27, (LOC State Street B&T Co.,
California State Teacher’s
Retirement) (a) | | | 500,000 | | | 500,000 | |
Southern California Public Power
Authority Transmission Project Revenue,
Series A, 0.34%, 7/1/21, (Credit Support
FSA, SPA Dexia Credit Local) (a) | | | 750,000 | | | 750,000 | |
Three Valleys California Municipal
Water District Certificates of
Participation, 0.29%, 11/1/14,
(LOC Wells Fargo Bank N.A.) (a) | | | 500,000 | | | 500,000 | |
Tracy California Multi-family Housing
Revenue, Series A, 0.29%, 5/1/15,
(LOC FHLMC) (a) | | | 1,000,000 | | | 1,000,000 | |
Turlock California Irrigation District
Certificates of Participation, 0.25%,
1/1/31, (LOC Societe Generale) (a) | | | 700,000 | | | 700,000 | |
Whittier California Health Facility
Revenue, Series B, 0.23%, 6/1/36,
(LOC U.S. Bank N.A.) (a) | | | 300,000 | | | 300,000 | |
| | | | |
|
| |
| | | | | | 42,875,000 | |
| | | | |
|
| |
TOTAL VARIABLE RATE DEMAND
NOTES (COST $42,875,000) | | | | | | 42,875,000 | |
| | | | |
|
| |
| | |
13 | HSBC INVESTOR FAMILY OF FUNDS | See notes to financial statements |
|
HSBC INVESTOR CALIFORNIA TAX-FREE MONEY MARKET FUND |
|
Schedule of Portfolio Investments—as of October 31, 2010 (continued) |
| | | | | | | |
| | Shares or
Principal
Amount($) | | Amortized
Cost($) | |
| |
| |
| |
California – 1.5% | | | | | | | |
California Educational Facilities
Authority Revenue, Series A,
5.00%, 10/1/32, prerefunded
10/1/11 @ 100 | | | 250,000 | | | 260,652 | |
Los Altos California School District,
GO, Series B, 5.00%, 8/1/17,
prerefunded 8/1/11 @ 100 | | | 500,000 | | | 517,721 | |
| | | | |
|
| |
| | | | | | 778,373 | |
| | | | |
|
| |
Puerto Rico – 1.3% | | | | | | | |
Puerto Rico Commonwealth, GO,
4.90%, 7/1/16, (Credit Support FSA),
prerefunded 7/1/11 @ 100 | | | 625,000 | | | 644,374 | |
| | | | |
|
| |
TOTAL MUNICIPAL BONDS
(COST $1,422,747) | | | | | | 1,422,747 | |
| | | | |
|
| |
|
Commercial Paper And Notes—2.0% |
|
| | | | | | | |
California – 2.0% | | | | | | | |
San Joaquin County Transportation
Authority, 0.27%, 11/17/10,
(LOC Citibank N.A.) | | | 1,000,000 | | | 1,000,000 | |
| | | | |
|
| |
TOTAL COMMERCIAL PAPER
AND NOTES (COST $1,000,000) | | | | | | 1,000,000 | |
| | | | |
|
| |
| | | | | | | |
Investment Companies—9.8% | | | | | | | |
|
BlackRock Liquidity Funds Money
Fund Portfolio, 0.11% (b) | | | 2,349,000 | | | 2,349,000 | |
Northern Institutional Tax Exempt
Portfolio, Shares Class, 0.02% (b) | | | 2,545,040 | | | 2,545,040 | |
| | | | |
|
| |
TOTAL INVESTMENT COMPANIES
(COST $4,894,040) | | | | | | 4,894,040 | |
| | | | |
|
| |
TOTAL INVESTMENTS
(COST $50,191,787) — 100.4% | | | | | | 50,191,787 | |
| | | | |
|
| |
| | |
|
| Percentages indicated are based on net assets of $49,977,065. |
|
(a) | Variable rate security. The interest rates on these securities are adjusted periodically to reflect then-current short-term interest rates. The rates presented represent the rates in effect on October 31, 2010. The maturity dates presented reflect the final maturity dates. However, some of these securities may contain put or demand features that allow the fund to require the issuer to repurchase the security from the fund within various time periods, including daily, weekly, monthly, or semi-annually. |
| |
(b) | The rate represents the annualized one-day yield that was in effect on October 31, 2010. |
| |
AMT | — Interest on security is subject to federal alternative minimum tax |
FHA | — Federal Housing Administration |
FHLMC | — Federal Home Loan Mortgage Corporation |
FNMA | — Federal National Mortgage Association |
FSA | — Financial Security Assurance |
GO | — General Obligation |
LOC | — Letter of Credit |
plc | — Public Limited Company |
SPA | — Standby Purchase Agreement |
| | |
See notes to financial statements | HSBC INVESTOR FAMILY OF FUNDS | 14 |
|
HSBC INVESTOR NEW YORK TAX-FREE MONEY MARKET FUND |
|
Schedule of Portfolio Investments—as of October 31, 2010 (continued) |
| | | | | | | |
Variable Rate Demand Notes—93.2% | |
|
|
| | | | | | | |
| | Principal
Amount($) | | Amortized
Cost($) | |
| |
| |
| |
New York – 93.2% | | | | | | | |
Buffalo Municipal Water Finance
Authority Water Systems Revenue,
0.24%, 7/1/35, (LOC JP Morgan
Chase Bank) (a) | | | 5,000,000 | | | 5,000,000 | |
Dutchess County IDA Civic Facility
Revenue, Series A, 0.27%, 7/1/38,
(LOC TD Bank N.A.) (a) | | | 4,900,000 | | | 4,900,000 | |
Long Island Power Authority Electrical
Systems Revenue, Series D, 0.31%,
12/1/29, (Credit Support AGM,
SPA Dexia Credit Local) (a) | | | 5,000,000 | | | 5,000,000 | |
Long Island Power Authority Electrical
Systems Revenue, Series J, 0.33%,
12/1/29, (Credit Support AGM,
SPA Dexia Credit Local) (a) | | | 6,000,000 | | | 6,000,000 | |
Long Island Power Authority Electrical
Systems Revenue, Series M, 0.32%,
12/1/29, (Credit Support FSA,
SPA Dexia Credit Local) (a) | | | 4,100,000 | | | 4,100,000 | |
Long Island Power Authority Electrical
Systems Revenue, Sub-series 1B,
0.25%, 5/1/33, (LOC State Street
B&T Co.) (a) | | | 10,000,000 | | | 10,000,000 | |
Metropolitan Transportation Authority
Revenue, Sub-series B-1, 0.25%,
11/1/34, (LOC Scotiabank) (a) | | | 7,000,000 | | | 7,000,000 | |
Metropolitan Transportation Authority
Revenue, Sub-series B-2, 0.25%,
11/1/34, (LOC BNP Paribas) (a) | | | 2,900,000 | | | 2,900,000 | |
Metropolitan Transportation Authority
Revenue, Sub-series B-3, 0.25%,
11/1/34, (LOC Lloyds TSB
Bank plc) (a) | | | 2,900,000 | | | 2,900,000 | |
Monroe County IDA Civic Facility
Revenue, 0.25%, 1/15/32,
(LOC JP Morgan Chase Bank) (a) | | | 4,945,000 | | | 4,945,000 | |
Monroe County IDA Civic Facility
Revenue, 0.26%, 4/1/35,
(LOC JP Morgan Chase Bank) (a) | | | 1,000,000 | | | 1,000,000 | |
Monroe County IDA Civic Facility
Revenue, 0.25%, 6/1/36,
(LOC JP Morgan Chase Bank) (a) | | | 3,800,000 | | | 3,800,000 | |
Monroe County IDA Civic Facility
Revenue, 0.28%, 2/1/38,
(LOC JP Morgan Chase Bank) (a) | | | 1,800,000 | | | 1,800,000 | |
Monroe County IDA Civic Facility
Revenue, 0.28%, 4/1/38,
(LOC JP Morgan Chase Bank) (a) | | | 2,200,000 | | | 2,200,000 | |
Nassau County IDA Civic Facility
Revenue, 0.55%, 6/1/19, AMT,
(LOC Fleet Bank N.A.) (a)(b) | | | 1,345,000 | | | 1,345,000 | |
Nassau Health Care Corp. Revenue,
0.22%, 8/1/29, (Credit Support County
Guaranteed, LOC TD Bank N.A.) (a) | | | 5,000,000 | | | 5,000,000 | |
Nassau Health Care Corp. Revenue,
Sub-series B-2, 0.25%, 8/1/29,
(Credit Support County Guaranteed,
LOC TD Bank N.A.) (a) | | | 3,000,000 | | | 3,000,000 | |
| | | | | | | |
Variable Rate Demand Notes, continued |
|
|
| | Principal
Amount($) | | Amortized
Cost($) | |
| |
| |
| |
New York, continued | | | | | | | |
Nassau Health Care Corp. Revenue,
Sub-series D-2, 0.32%, 8/1/29,
(Credit Support County Guaranteed,
LOC JP Morgan Chase Bank) (a) | | | 5,000,000 | | | 5,000,000 | |
New York City Capital Resources Corp.
Revenue, Series B1, 0.33%, 7/1/37,
(LOC Bank of America N.A.) (a) | | | 2,000,000 | | | 2,000,000 | |
New York City GO, 0.28%, 9/1/35,
(LOC Royal Bank of Scotland) (a) | | | 4,000,000 | | | 4,000,000 | |
New York City GO, 0.28%, 2/15/16,
(LOC Bayerische Landesbank) (a) | | | 3,000,000 | | | 3,000,000 | |
New York City GO, Series H,
Sub-series H-3, 0.27%, 8/1/19,
(Credit Support AGM, SPA State
Street B&T Co.) (a) | | | 4,000,000 | | | 4,000,000 | |
New York City GO, Sub-series H-4,
0.21%, 3/1/34, (LOC Bank of
New York) (a) | | | 5,930,000 | | | 5,930,000 | |
New York City GO, Sub-series L-4,
0.24%, 4/1/38, (LOC U.S.
Bank N.A.) (a) | | | 15,000,000 | | | 15,000,000 | |
New York City Health & Hospital Corp.
Revenue, Series B, 0.27%, 2/15/31,
(Credit Support GO of Corp.,
LOC TD Bank N.A.) (a) | | | 5,000,000 | | | 5,000,000 | |
New York City Housing Development
Corp. Multi-family Housing Revenue,
Series A, 0.26%, 11/15/19, (Credit
Support FNMA, Liquidity Facility
FNMA) (a) | | | 1,500,000 | | | 1,500,000 | |
New York City Housing Development
Corp. Multi-family Housing Revenue,
Series A, 0.28%, 4/1/31, (Credit
Support FHLMC) (a) | | | 1,135,000 | | | 1,135,000 | |
New York City Housing Development
Corp. Multi-family Housing Revenue,
Series A, 0.26%, 4/15/35, (Credit
Support FNMA, Liquidity Facility
FNMA) (a) | | | 1,600,000 | | | 1,600,000 | |
New York City Housing Development
Corp. Multi-family Mortgage Revenue,
0.26%, 6/15/32, (Credit Support
FNMA) (a) | | | 3,000,000 | | | 3,000,000 | |
New York City Housing Development
Corp. Multi-family Mortgage Revenue,
0.29%, 12/1/36, (LOC Landesbank
Hessen) (a) | | | 10,035,000 | | | 10,035,000 | |
New York City Housing Development
Corp. Multi-family Mortgage Revenue,
0.25%, 11/1/46, (Credit Support
FHLMC, Liquidity Facility
FHLMC) (a) | | | 4,000,000 | | | 4,000,000 | |
New York City Housing Development
Corp. Multi-family Mortgage Revenue,
Series A, 0.30%, 1/1/36, AMT,
(LOC Citibank N.A.) (a) | | | 5,000,000 | | | 5,000,000 | |
New York City Housing Development
Corp. Multi-family Mortgage Revenue,
Series A, 0.26%, 12/15/37, AMT,
(Credit Support FNMA, Liquidity
Facility FNMA) (a) | | | 3,000,000 | | | 3,000,000 | |
| | |
15 | HSBC INVESTOR FAMILY OF FUNDS | See notes to financial statements |
|
HSBC INVESTOR NEW YORK TAX-FREE MONEY MARKET FUND |
|
Schedule of Portfolio Investments—as of October 31, 2010 (continued) |
| | | | | | | |
Variable Rate Demand Notes, continued |
|
| | | | | | | |
| | Principal
Amount($) | | Amortized
Cost($) | |
| |
| |
| |
New York, continued | | | | | | | |
New York City Housing Development
Corp. Multi-family Mortgage Revenue,
Series A, 0.30%, 1/1/38, AMT,
(LOC Citibank N.A.) (a) | | | 1,500,000 | | | 1,500,000 | |
New York City Housing Development
Corp. Multi-family Mortgage Revenue,
Series A, 0.30%, 2/1/38, AMT,
(LOC Citibank N.A.) (a) | | | 500,000 | | | 500,000 | |
New York City Housing Development
Corp. Multi-family Mortgage Revenue,
Series A, 0.31%, 10/1/40, AMT,
(LOC Bank of America N.A.) (a) | | | 5,000,000 | | | 5,000,000 | |
New York City Housing Development
Corp. Multi-family Mortgage Revenue,
Series A, 0.25%, 10/15/41, (Credit
Support FNMA, Liquidity Facility
FNMA) (a) | | | 4,000,000 | | | 4,000,000 | |
New York City Housing Development
Corp. Multi-family Mortgage Revenue,
Series A, 0.28%, 7/1/43, (LOC
Citibank N.A.) (a) | | | 3,000,000 | | | 3,000,000 | |
New York City IDA Civic Facility
Revenue, 0.22%, 11/1/32,
(LOC Wachovia Bank N.A.) (a) | | | 1,500,000 | | | 1,500,000 | |
New York City IDA Civic Facility
Revenue, 0.31%, 12/1/36,
(LOC JP Morgan Chase Bank) (a) | | | 4,360,000 | | | 4,360,000 | |
New York City IDA Civic Facility
Revenue, Series B, 0.23%, 6/1/36,
(Credit Support Radian, LOC TD
Bank N.A.) (a) | | | 4,600,000 | | | 4,600,000 | |
New York City IDA Special Facility
Revenue, Series B, 0.29%, 5/1/33,
(LOC Bank of America N.A.) (a) | | | 8,000,000 | | | 8,000,000 | |
New York City Municipal Water Finance
Authority Revenue, Series F1, 0.30%,
6/15/33, (SPA Dexia Credit Local) (a) | | | 3,000,000 | | | 3,000,000 | |
New York City Municipal Water Finance
Authority Water & Sewer System
Revenue, Series BB-1, 0.24%, 6/15/36,
(LOC Fortis Bank S.A.) (a) | | | 5,000,000 | | | 5,000,000 | |
New York City Municipal Water Finance
Authority Water & Sewer System
Revenue, Series BB-3, 0.24%, 6/15/34,
(SPA BNP Paribas) (a) | | | 8,540,000 | | | 8,540,000 | |
New York City Municipal Water Finance
Authority Water & Sewer System
Revenue, Series CC, 0.24%, 6/15/41,
(SPA Barclays Bank plc) (a) | | | 7,000,000 | | | 7,000,000 | |
New York City Municipal Water Finance
Authority Water & Sewer System
Revenue, Sub-series B-4, 0.25%,
6/15/23, (SPA BNP Paribas) (a) | | | 2,000,000 | | | 2,000,000 | |
New York City Municipal Water Finance
Authority Water & Sewer System
Revenue, Sub-series B2, 0.25%, 6/15/24,
(SPA Lloyds TSB Bank plc) (a) | | | 5,000,000 | | | 5,000,000 | |
| | | | | | | |
Variable Rate Demand Notes, continued | | | | | | | |
|
|
|
|
|
|
|
|
|
| | Principal
Amount($) | | Amortized
Cost($) | |
| |
| |
| |
New York, continued | | | | | | | |
New York City Transitional Finance
Authority Revenue, Series 3,
Sub-series 3-F, 0.25%, 11/1/22,
(SPA Royal Bank of Canada) (a) | | | 4,270,000 | | | 4,270,000 | |
New York City Transitional Finance
Authority Revenue, Series 3,
Sub-series 3-H, 0.27%, 11/1/22,
(SPA Royal Bank of Canada) (a) | | | 10,300,000 | | | 10,300,000 | |
New York City Transitional Finance
Authority Revenue, Series 3,
Sub-series 3G, 0.24%, 11/1/22,
(SPA Bank of New York) (a) | | | 2,085,000 | | | 2,085,000 | |
New York City Transitional Finance
Authority Revenue, Series A2,
0.28%, 11/15/27, (SPA Bank of
Nova Scotia) (a) | | | 6,100,000 | | | 6,100,000 | |
New York City Transitional Finance
Authority Revenue, Sub-series 2-D,
0.27%, 11/1/22, (Liquidity Facility
Lloyds TSB Bank plc) (a) | | | 10,000,000 | | | 10,000,000 | |
New York City Trust for Cultural
Resources Revenue, 0.22%, 4/1/26,
(LOC Wachovia Bank N.A.) (a) | | | 9,000,000 | | | 9,000,000 | |
New York City Trust for Cultural
Resources Revenue, 0.26%, 4/1/30,
(LOC The Chase Manhattan Bank) (a) | | | 5,000,000 | | | 5,000,000 | |
New York City Trust for Cultural
Resources Revenue, Series B-1, 0.24%,
11/1/38, (LOC U.S. Bank N.A.) (a) | | | 6,950,000 | | | 6,950,000 | |
New York GO, Series B2, Sub-series B5,
0.27%, 8/15/11, (Credit Support MBIA,
SPA Bank of Nova Scotia) (a) | | | 3,770,000 | | | 3,770,000 | |
New York GO, Series H, Sub-series H-2,
0.27%, 8/1/13, (Credit Support NATL-RE,
SPA Wachovia Bank N.A.) (a) | | | 4,000,000 | | | 4,000,000 | |
New York GO, Sub-series D-4, 0.23%,
12/1/32, (SPA Calyon Bank) (a) | | | 5,000,000 | | | 5,000,000 | |
New York GO, Sub-series F-4-A, 0.24%,
9/1/35, (LOC Sumitomo Trust
Banking Corp.) (a) | | | 5,000,000 | | | 5,000,000 | |
New York State Dormitory Authority
Revenue, 0.22%, 7/1/28, (LOC TD
Bank N.A.) (a) | | | 1,400,000 | | | 1,400,000 | |
New York State Dormitory Authority
Revenue, Series D, 0.26%, 7/1/34,
(Credit Support XLCA, LOC TD
Bank N.A.) (a) | | | 4,675,000 | | | 4,675,000 | |
New York State Dormitory Authority
Revenue, Non State Supported Debt,
0.26%, 7/1/36, (Credit Support XLCA,
LOC TD Banknorth N.A.) (a) | | | 1,900,000 | | | 1,900,000 | |
New York State Dormitory Authority
Revenue, Non State Supported Debt,
0.27%, 12/1/36, (LOC TD
Bank N.A.) (a) | | | 4,500,000 | | | 4,500,000 | |
New York State Dormitory Authority
Revenue, Non State Supported Debt,
0.26%, 1/1/39, (LOC TD
Banknorth N.A.) (a) | | | 3,900,000 | | | 3,900,000 | |
| | |
See notes to financial statements | HSBC INVESTOR FAMILY OF FUNDS | 16 |
|
HSBC INVESTOR NEW YORK TAX-FREE MONEY MARKET FUND |
|
Schedule of Portfolio Investments—as of October 31, 2010 (continued) |
| | | | | | | |
Variable Rate Demand Notes, continued |
|
| | | | | | | |
| | Principal
Amount($) | | Amortized
Cost($) | |
| |
| |
| |
New York, continued | | | | | | | |
New York State Dormitory Authority
Revenue, Non State Supported Debt,
Series A, 0.26%, 11/15/36,
(Credit Support FNMA, Liquidity
Facility FNMA) (a) | | | 7,400,000 | | | 7,400,000 | |
New York State Dormitory Authority
Revenue, Non State Supported Debt,
Series B, 0.23%, 7/1/39, (LOC TD
Bank N.A.) (a) | | | 1,500,000 | | | 1,500,000 | |
New York State Dormitory Authority
Revenue, State Supported Debt,
Series C, 0.29%, 7/1/31, (LOC Bank
of America N.A.) (a) | | | 5,000,000 | | | 5,000,000 | |
New York State Energy Research &
Development Authority Facilities
Revenue, 0.25%, 11/1/39, AMT,
(LOC Mizuho Corporate Bank) (a) | | | 1,000,000 | | | 1,000,000 | |
New York State Energy Research &
Development Authority Facilities
Revenue, 0.27%, 11/1/39, AMT,
(LOC Mizuho Corporate Bank) (a) | | | 5,000,000 | | | 5,000,000 | |
New York State Energy Research &
Development Authority Facilities
Revenue, Series C2, 0.29%, 11/1/39,
AMT, (LOC Mizuho Corporate
Bank) (a) | | | 5,000,000 | | | 5,000,000 | |
New York State Energy Research &
Development Authority Facilities
Revenue, Sub-series A-3, 0.27%,
5/1/39, (LOC Wachovia Bank N.A.) (a) | | | 10,000,000 | | | 10,000,000 | |
New York State Housing Finance
Agency Revenue, 0.29%, 5/15/33,
AMT, (Credit Support FNMA) (a) | | | 2,000,000 | | | 2,000,000 | |
New York State Housing Finance
Agency Revenue, 0.25%, 5/15/34,
(Credit Support FNMA) (a) | | | 5,000,000 | | | 5,000,000 | |
New York State Housing Finance
Agency Revenue, 0.25%, 11/15/37,
(Credit Support FNMA) (a) | | | 5,000,000 | | | 5,000,000 | |
New York State Housing Finance Agency
Revenue, 0.27%, 5/15/15, (LOC
Landesbank Hessen-Thuringen) (a) | | | 800,000 | | | 800,000 | |
New York State Housing Finance
Agency Revenue, 0.30%, 5/15/28,
AMT, (Credit Support FNMA,
LOC FNMA) (a) | | | 5,000,000 | | | 5,000,000 | |
New York State Housing Finance Agency
Revenue, Series A, 0.31%, 5/15/32,
AMT, (Credit Support FNMA) (a) | | | 1,600,000 | | | 1,600,000 | |
New York State Housing Finance Agency
Revenue, Series A, 0.28%, 11/1/32,
AMT, (Credit Support FHLMC,
Liquidity Facility FHLMC) (a) | | | 2,050,000 | | | 2,050,000 | |
New York State Housing Finance Agency
Revenue, Series A, 0.25%, 5/15/34,
(Credit Support FNMA) (a) | | | 1,400,000 | | | 1,400,000 | |
New York State Housing Finance Agency
Revenue, Series A, 0.25%, 5/1/35,
(Credit Support FHLMC) (a) | | | 5,000,000 | | | 5,000,000 | |
| | | | | | | |
Variable Rate Demand Notes, continued |
|
|
| | Principal
Amount($) | | Amortized
Cost($) | |
| |
| |
| |
New York, continued | | | | | | | |
New York State Housing Finance Agency
Revenue, Series A, 0.29%, 11/1/39,
AMT, (LOC Citibank N.A.) (a) | | | 7,600,000 | | | 7,600,000 | |
New York State Housing Finance Agency
Revenue, Series A, 0.29%, 11/1/41,
(LOC Bank of New York) (a) | | | 10,000,000 | | | 10,000,000 | |
New York State Housing Finance Agency
Revenue, Series A, 0.25%, 5/1/42,
(LOC Wachovia Bank N.A.) (a) | | | 4,200,000 | | | 4,200,000 | |
New York State Housing Finance Agency
Revenue, Series A, 0.26%, 5/1/42,
(LOC Wachovia Bank N.A.) (a) | | | 5,000,000 | | | 5,000,000 | |
New York State Housing Finance Agency
Revenue, Series A, 0.26%, 5/1/44,
(LOC Bank of America N.A.) (a) | | | 5,000,000 | | | 5,000,000 | |
New York State Housing Finance Agency
Revenue, Series A, 0.25%, 5/1/45,
(Credit Support FHLMC, Liquidity
Facility FHLMC) (a) | | | 2,500,000 | | | 2,500,000 | |
New York State Local Government
Assistance Corp. Revenue, Series C,
0.29%, 4/1/25, (LOC Landesbank
Hessen-Thuringen) (a) | | | 4,089,000 | | | 4,089,000 | |
New York State Power Authority,
Finance & Administration GO, 0.29%,
3/1/20, (Liquidity Facility Bank of
Nova Scotia) (a) | | | 10,000,000 | | | 10,000,000 | |
New York State Urban Development
Corp. Revenue, Series A-5, 0.24%,
1/1/30, (LOC TD Banknorth N.A.) (a) | | | 3,300,000 | | | 3,300,000 | |
Port Authority of New York & New
Jersey Special Obligation Revenue,
0.29%, 4/1/24, AMT, (SPA Landesbank
Hessen-Thuringen) (a) | | | 9,500,000 | | | 9,500,000 | |
Port Authority of New York & New
Jersey Special Obligation Revenue,
0.29%, 8/1/28, AMT, (SPA Bayerische
Landesbank) (a) | | | 9,000,000 | | | 9,000,000 | |
Poughkeepsie Industrial Development
Agency Senior Living Facility Revenue,
0.34%, 4/1/40, AMT, (LOC JP Morgan
Chase & Co.) (a) | | | 8,000,000 | | | 8,000,000 | |
Ramapo Housing Authority Revenue,
Series A, 0.29%, 12/15/38, AMT,
(Credit Support FNMA, Liquidity
Facility FNMA) (a) | | | 500,000 | | | 500,000 | |
Rockland County IDA Civic Facility
Revenue, 0.22%, 12/1/32, (LOC
Wachovia Bank N.A.) (a) | | | 7,000,000 | | | 7,000,000 | |
Suffolk County IDA Civic Facility
Revenue, 0.22%, 11/1/14,
(LOC Bank of America N.A.) (a) | | | 6,965,000 | | | 6,965,000 | |
Suffolk County IDA Civic Facility
Revenue, 0.80%, 8/1/18, AMT,
(LOC Chase Manhattan Bank) (a) | | | 2,140,000 | | | 2,140,000 | |
Syracuse New York IDA Civic Facility
Revenue, Series A, 0.26%, 12/1/35,
(LOC JP Morgan Chase Bank) (a) | | | 1,000,000 | | | 1,000,000 | |
| | |
17 | HSBC INVESTOR FAMILY OF FUNDS | See notes to financial statements |
|
HSBC INVESTOR NEW YORK TAX-FREE MONEY MARKET FUND |
|
Schedule of Portfolio Investments—as of October 31, 2010 (continued) |
| | | | | | | |
Variable Rate Demand Notes, continued |
|
| | | | | | | |
| | Shares or
Principal
Amount($) | | Amortized
Cost($) | |
| |
| |
| |
New York, continued | | | | | | | |
Triborough Bridge & Tunnel Authority
Revenue, Series B, 0.23%, 1/1/32,
(LOC State Street B&T Co.) (a) | | | 10,000,000 | | | 10,000,000 | |
Ulster County IDA Civic Facility
Revenue, Series A, 0.55%, 7/1/21,
AMT, (LOC TD Banknorth N.A.,
ABN Amro Bank N.V.) (a) | | | 940,000 | | | 940,000 | |
Westchester County IDA Civic Facility
Revenue, 0.23%, 11/1/24,
(LOC Commerce Bank N.A.) (a) | | | 2,210,000 | | | 2,210,000 | |
| | | | |
|
| |
TOTAL VARIABLE RATE DEMAND
NOTES (COST $466,634,000) | | | | | | 466,634,000 | |
| | | | |
|
| |
|
Tax-Free Notes And Commercial Paper—2.0% | | | | | | | |
|
|
|
|
|
|
|
|
New York – 2.0% | | | | | | | |
New York State Power Authority,
Series 2, 0.28%, 1/4/11, (Credit
Support JP Morgan Chase Bank,
Bank of Nova Scotia, State Street
B&T Co., BNP Paribas, Bank of
New York) | | | 10,000,000 | | | 10,000,000 | |
| | | | |
|
| |
TOTAL TAX-FREE NOTES AND
COMMERCIAL PAPER
(COST $10,000,000) | | | | | | 10,000,000 | |
| | | | |
|
| |
|
Municipal Bond—2.0% | | | | | | | |
|
|
|
|
|
|
|
|
New York – 2.0% | | | | | | | |
New York State Urban Development
Corp. Revenue, Series D, 5.25%,
1/1/30, prerefunded 10/1/11 @ 100 | | | 10,000,000 | | | 10,083,061 | |
| | | | |
|
| |
TOTAL MUNICIPAL BONDS
(COST $10,083,061) | | | | | | 10,083,061 | |
| | | | |
|
| |
|
Investment Companies—2.8% | | | | | | | |
|
|
|
|
|
|
|
|
BlackRock Liquidity New York Money
Fund, Portfolio Institutional Shares,
0.11% (c) | | | 13,535,777 | | | 13,535,777 | |
| | | | | | | |
Investment Companies, continued |
|
| | | | | | | |
| | Shares or
Principal
Amount($) | | Amortized
Cost($) | |
| |
| |
| |
JPMorgan New York Municipal Money
Market Fund, 0.14% (c) | | | 100,000 | | | 100,000 | |
Northern Institutional Tax Exempt
Portfolio, Shares Class, 0.02% (c) | | | 171,120 | | | 171,120 | |
| | | | |
|
| |
TOTAL INVESTMENT COMPANIES
(COST $13,806,897) | | | | | | 13,806,897 | |
| | | | |
|
| |
TOTAL INVESTMENTS
(COST $500,523,958) — 100.0% | | | | | | 500,523,958 | |
| | | | |
|
| |
| |
|
| Percentages indicated are based on net assets of $500,755,488. |
| |
(a) | Variable rate security. The interest rates on these securities are adjusted periodically to reflect then-current short-term interest rates. The rates presented represent the rates in effect on October 31, 2010. The maturity dates presented reflect the final maturity dates. However, some of these securities may contain put or demand features that allow the fund to require the issuer to repurchase the security from the fund within various time periods, including daily, weekly, monthly, or semi-annually. |
| |
(b) | Rule 144A security or other security which is restricted as to resale to institutional investors. This security has been deemed liquid by the Investment Adviser based on procedures approved by the Board of Trustees. |
| |
(c) | The rate represents the annualized one-day yield that was in effect on October 31, 2010. |
| |
AGM | — Assured Guaranty Municipal Corporation |
AMT | — Interest on security is subject to federal alternative minimum tax |
FHLMC | — Federal Home Loan Mortgage Corporation |
FNMA | — Federal National Mortgage Association |
FSA | — Financial Security Assurance |
GO | — General Obligation |
IDA | — Industrial Development Agency |
LOC | — Letter of Credit |
MBIA | — Municipal Bond Insurance Association |
NATL-RE | — Reinsurance provided by the National Public Finance Guarantee Corporation |
plc | — Public Limited Company |
SPA | — Standby Purchase Agreement |
XLCA | — XL Capital Assurance |
| | |
See notes to financial statements | HSBC INVESTOR FAMILY OF FUNDS | 18 |
|
HSBC INVESTOR PRIME MONEY MARKET FUND |
|
Schedule of Portfolio Investments—as of October 31, 2010 |
|
Corporate Obligations—7.2% |
|
| | | | | | | |
| | Principal
Amount($) | | Amortized
Cost($) | |
| |
| |
| |
Banking – 6.9% | | | | | | | |
Citigroup, Inc., 6.50%, 1/18/11 | | | 45,000,000 | | | 45,579,958 | |
Commonwealth Bank of Australia,
0.26%, 11/4/10 (a)(b) | | | 80,000,000 | | | 80,000,000 | |
JP Morgan Chase Bank N.A., 0.26%,
10/21/11 (b) | | | 78,000,000 | | | 78,000,000 | |
National Australia Bank, 0.29%,
1/27/11 (a)(b) | | | 83,000,000 | | | 83,000,000 | |
U.S. Bank N.A., 0.25%, 11/29/10 | | | 143,000,000 | | | 143,000,902 | |
Westpac Banking Corp., 0.31%,
10/14/11 (a)(b) | | | 50,000,000 | | | 50,000,000 | |
Westpac Banking Corp., 0.31%,
11/4/11 (a)(b) | | | 35,000,000 | | | 35,000,000 | |
| | | | |
|
| |
| | | | | | 514,580,860 | |
| | | | |
|
| |
Finance – 0.3% | | | | | | | |
General Electric Capital Corp.,
Series A, 0.92%, 2/1/11 (b) | | | 24,000,000 | | | 24,025,789 | |
| | | | |
|
| |
TOTAL CORPORATE OBLIGATIONS
(COST $538,606,649) | | | | | | 538,606,649 | |
| | | | |
|
| |
| | | | | | | |
Variable Rate Demand Notes—5.6% | |
|
|
|
|
|
|
|
|
Colorado – 1.2% | | | | | | | |
Colorado Housing & Finance Authority
Multi-family Revenue, 0.30%, 5/1/25,
AMT, (LOC U.S. Bank N.A.) (b) | | | 13,250,000 | | | 13,250,000 | |
Denver Colorado City & County Airport
Revenue, Series B, 0.29%, 11/15/25,
AMT, (LOC Wachovia Bank N.A.) (b) | | | 75,700,000 | | | 75,700,000 | |
| | | | |
|
| |
| | | | | | 88,950,000 | |
| | | | |
|
| |
Connecticut – 0.2% | | | | | | | |
Connecticut State Health & Educational
Facilities Authority Revenue,
Series L-2, 0.25%, 7/1/36,
(LOC Bank of America N.A.) (b) | | | 17,030,000 | | | 17,030,000 | |
| | | | |
|
| |
Florida – 0.2% | | | | | | | |
Florida Keys Aqueduct Authority Water
Revenue, 0.23%, 9/1/35, (LOC TD
Bank N.A.) (b) | | | 11,700,000 | | | 11,700,000 | |
| | | | |
|
| |
Georgia – 0.5% | | | | | | | |
Gwinnett County Georgia Hospital
Authority Revenue, Series A,
0.24%, 7/1/34, (LOC Wachovia
Bank N.A.) (b) | | | 33,775,000 | | | 33,775,000 | |
Savannah Georgia Economic
Development Authority Revenue,
0.50%, 9/1/24, (LOC Bank of
America N.A.) (b) | | | 2,000,000 | | | 2,000,000 | |
| | | | |
|
| |
| | | | | | 35,775,000 | |
| | | | |
|
| |
Idaho – 0.2% | | | | | | | |
Power County Industrial Development
Corp. Exempt Facilities Revenue,
0.34%, 4/1/14, AMT, (LOC
Wachovia Bank N.A.) (b) | | | 16,000,000 | | | 16,000,000 | |
| | | | |
|
| |
| | | | | | | |
Variable Rate Demand Notes, continued | | | | | | | |
|
|
|
|
|
|
| |
|
| | Principal
Amount($) | | Amortized
Cost($) | |
| |
| |
| |
Illinois – 0.8% | | | | | | | |
Illinois Development Finance Authority
Revenue, 0.25%, 12/1/28,
(LOC Northern Trust Co.) (b) | | | 15,500,000 | | | 15,500,000 | |
Illinois Development Finance Authority
Solid Waste Disposal Revenue,
0.33%, 9/1/27, AMT, (LOC Wachovia
Bank N.A.) (b) | | | 24,900,000 | | | 24,900,000 | |
Illinois Educational Facilities Authority
Revenue, 0.40%, 3/1/28, (Credit
Support GO of Institution, LOC Bank
of America N.A.) (b) | | | 2,000,000 | | | 2,000,000 | |
Illinois Finance Authority Revenue,
Series A, 0.26%, 11/1/45, (LOC
Northern Trust Co.) (b) | | | 19,000,000 | | | 19,000,000 | |
| | | | |
|
| |
| | | | | | 61,400,000 | |
| | | | |
|
| |
Maine – 0.3% | | | | | | | |
Old Town Solid Waste Disposal Revenue,
0.35%, 12/1/24, AMT, (LOC Bank
of America N.A.) (b) | | | 22,260,000 | | | 22,260,000 | |
| | | | |
|
| |
New York – 0.4% | | | | | | | |
New York State Dormitory Authority
Revenue, Non State Supported Debt,
Series B, 0.23%, 7/1/39, (LOC TD
Bank N.A.) (b) | | | 19,000,000 | | | 19,000,000 | |
Syracuse IDA Civic Facility Revenue,
Series A, 0.28%, 1/1/23, (LOC Bank
of America N.A.) (b) | | | 9,905,000 | | | 9,905,000 | |
| | | | |
|
| |
| | | | | | 28,905,000 | |
| | | | |
|
| |
Ohio – 0.0% | | | | | | | |
Lorain County Ohio Hospital Revenue,
0.28%, 5/1/26, (LOC JP Morgan
Chase Bank) (b) | | | 1,900,000 | | | 1,900,000 | |
| | | | |
|
| |
Oregon – 0.3% | | | | | | | |
Port of Portland Oregon Airport Revenue,
Series 18A, 0.26%, 7/1/26, AMT,
(LOC Lloyds TSB Bank plc) (b) | | | 21,900,000 | | | 21,900,000 | |
| | | | |
|
| |
South Carolina – 0.3% | | | | | | | |
North Charleston South Carolina
Certificates of Participation,
0.35%, 9/1/19, (LOC Bank of
America N.A.) (b) | | | 3,000,000 | | | 3,000,000 | |
South Carolina State Housing Finance &
Development Authority Multi-family
Rental Housing Improvement Revenue,
0.34%, 7/15/39, AMT, (LOC Wachovia
Bank N.A.) (b) | | | 17,250,000 | | | 17,250,000 | |
| | | | |
|
| |
| | | | | | 20,250,000 | |
| | | | |
|
| |
Texas – 0.8% | | | | | | | |
Austin Hotel Occupancy Tax Revenue,
Sub-series B, 0.30%, 11/15/29,
(LOC Dexia Credit Local) (b) | | | 10,480,000 | | | 10,480,000 | |
Harris County Texas Industrial
Development Corp. Revenue, 0.25%,
2/1/20, (LOC Den Norske Bank) (b) | | | 8,000,000 | | | 8,000,000 | |
| | |
19 | HSBC INVESTOR FAMILY OF FUNDS | See notes to financial statements |
|
HSBC INVESTOR PRIME MONEY MARKET FUND |
|
Schedule of Portfolio Investments—as of October 31, 2010 (continued) |
| | | | | | | |
Variable Rate Demand Notes, continued | | | | | | | |
|
|
|
|
|
|
|
|
|
| | Principal
Amount($) | | Amortized
Cost($) | |
| |
| |
| |
Texas, continued | | | | | | | |
Montgomery County Housing Finance
Corp. Multi-family Housing Revenue,
0.31%, 2/1/38, AMT, (LOC
Citibank N.A.) (b) | | | 14,575,000 | | | 14,575,000 | |
San Antonio Empowerment Zone
Development Corp. Contract Revenue,
0.35%, 10/1/37, AMT, (LOC U.S.
Bank N.A.) (b) | | | 18,000,000 | | | 18,000,000 | |
Texas State Department of Housing &
Community Affairs Multi-family
Housing Revenue, 0.31%, 12/1/39,
AMT, (LOC Citibank N.A.) (b) | | | 7,200,000 | | | 7,200,000 | |
| | | | |
|
| |
| | | | | | 58,255,000 | |
| | | | |
|
| |
Wisconsin – 0.4% | | | | | | | |
Wisconsin Health & Educational
Facilities Authority Revenue,
0.27%, 6/1/35, (LOC Wells Fargo
Bank N.A.) (b) | | | 34,130,000 | | | 34,130,000 | |
| | | | |
|
| |
TOTAL VARIABLE RATE DEMAND
NOTES (COST $418,455,000) | | | | | | 418,455,000 | |
| | | | |
|
| |
| | | | | | | |
U.S. Treasury Obligations—8.0% | | | | | | | |
|
|
|
|
|
|
|
|
U.S. Treasury Bills – 4.7% | | | | | | | |
0.21%, 1/6/11(c) | | | 200,000,000 | | | 199,923,000 | |
0.88%, 4/30/11 | | | 50,000,000 | | | 50,150,010 | |
1.00%, 8/31/11 | | | 100,000,000 | | | 100,535,715 | |
| | | | |
|
| |
| | | | | | 350,608,725 | |
| | | | |
|
| |
U.S. Treasury Notes – 3.3% | | | | | | | |
0.88%, 5/31/11 | | | 50,000,000 | | | 50,173,579 | |
1.13%, 6/30/11 | | | 100,000,000 | | | 100,524,399 | |
1.00%, 7/31/11 | | | 100,000,000 | | | 100,464,315 | |
| | | | |
|
| |
| | | | | | 251,162,293 | |
| | | | |
|
| |
TOTAL U.S. TREASURY OBLIGATIONS
(COST $601,771,018) | | | | | | 601,771,018 | |
| | | | |
|
| |
| | | | | | | |
Commercial Paper And Notes—36.4% | | | | | | | |
|
|
|
|
|
|
|
|
Banking – 18.6% | | | | | | | |
Abbey National N.A. LLC, 0.46%,
11/18/10, (LOC Santander UK plc) (c) | | | 100,000,000 | | | 99,978,514 | |
ANZ National International Ltd.,
0.34%, 4/14/11, (LOC ANZ
National Bank Ltd.) (c) | | | 70,000,000 | | | 69,891,578 | |
Bank of America Corp., 0.28%,
1/4/11 (c) | | | 80,000,000 | | | 79,960,178 | |
Banque et Caisse d’Epargne de l’Etat,
0.35%, 2/9/11 (c) | | | 50,000,000 | | | 49,951,389 | |
Canadian Imperial Holdings, Inc.,
0.24%, 11/8/10, (LOC Canadian
Imperial Bank of Commerce) (c) | | | 90,000,000 | | | 89,995,800 | |
Canadian Imperial Holdings, Inc.,
0.24%, 1/5/11, (LOC Canadian
Imperial Bank of Commerce) (c) | | | 70,000,000 | | | 69,969,667 | |
Commerzbank U.S. Finance, Inc.,
0.35%, 11/19/10, (LOC
Commerzbank AG) (c) | | | 100,000,000 | | | 99,982,500 | |
| | | | | | | |
Commercial Paper And Notes, continued | | | | | | | |
|
|
|
|
|
|
|
|
| | | | | | | |
| | Principal
Amount($) | | Amortized
Cost($) | |
| |
| |
| |
Banking, continued | | | | | | | |
Deutsche Bank Financial LLC,
0.31%, 4/25/11, (LOC Deutsche
Bank AG) (c) | | | 70,000,000 | | | 69,894,514 | |
DnB NOR Bank ASA, N.Y., 0.32%,
4/26/11 (c) | | | 48,000,000 | | | 47,924,907 | |
Groupe BPCE, 0.48%, 11/3/10 (c) | | | 100,000,000 | | | 99,997,333 | |
Groupe BPCE, 0.34%, 12/1/10 (c) | | | 70,000,000 | | | 69,980,167 | |
Groupe BPCE, 0.58%, 2/8/11 (c) | | | 25,000,000 | | | 24,960,125 | |
Lloyds TSB Bank PLC, N.Y., 0.25%,
1/7/11 (c) | | | 100,000,000 | | | 99,953,473 | |
National Bank of Canada, N.Y., 0.28%,
11/2/10 (c) | | | 100,000,000 | | | 99,999,222 | |
NRW Bank, 0.33%, 4/4/11 (c) | | | 80,000,000 | | | 79,887,067 | |
State Street Corp., 0.25%, 1/10/11 (c) | | | 100,000,000 | | | 99,951,389 | |
Sumitomo Mitsui Banking Corp.,
0.28%, 1/19/11 (c) | | | 65,000,000 | | | 64,960,061 | |
Sumitomo Mitsui Banking Corp.,
0.33%, 4/7/11 (c) | | | 80,000,000 | | | 79,884,867 | |
| | | | |
|
| |
| | | | | | 1,397,122,751 | |
| | | | |
|
| |
Diversified – 0.7% | | | | | | | |
Total Capital Canada Ltd., 0.29%,
11/9/10, (LOC Total SA) (c) | | | 52,000,000 | | | 51,996,649 | |
| | | | |
|
| |
Finance – 17.1% | | | | | | | |
Chariot Funding LLC, 0.28%, 1/5/11,
(LOC JP Morgan Chase Bank) (c) | | | 50,000,000 | | | 49,974,723 | |
Ciesco LLC, 0.37%, 11/2/10 (c) | | | 100,000,000 | | | 99,998,972 | |
Citigroup Funding, Inc., 0.36%, 11/9/10,
(LOC Citigroup, Inc.) (c) | | | 100,000,000 | | | 99,992,000 | |
CRC Funding LLC, 0.37%, 11/2/10 (c) | | | 100,000,000 | | | 99,998,972 | |
Credit Agricole N.A., Inc., 0.44%,
11/1/10, (LOC Credit Agricole) (c) | | | 100,000,000 | | | 100,000,000 | |
Credit Agricole N.A., Inc., 0.52%,
2/9/11, (LOC Credit Agricole) (c) | | | 40,000,000 | | | 39,942,778 | |
Falcon Asset Securitization Co. LLC,
0.26%, 1/26/11, (LOC JP Morgan
Chase Bank N.A.) (c) | | | 75,000,000 | | | 74,953,417 | |
Gemini Securitization Corp. LLC,
0.27%, 1/6/11, (LOC Deustche
Bank AG, N.Y.) (c) | | | 60,000,000 | | | 59,970,300 | |
Gemini Securitization Corp. LLC,
0.27%, 1/14/11, (LOC Deustche
Bank AG, N.Y.) (c) | | | 35,000,000 | | | 34,980,575 | |
ING (US) Funding LLC, 0.24%,
11/19/10, (LOC ING Bank NV) (c) | | | 95,000,000 | | | 94,988,600 | |
Intesa Funding LLC, 0.47%, 4/4/11,
(LOC Intesa Sanpaolo S.p.A) (c) | | | 60,000,000 | | | 59,879,366 | |
Jupiter Securitization Co. LLC, 0.30%,
11/9/10, (LOC JP Morgan Chase
Bank N.A.) (c) | | | 50,000,000 | | | 49,996,666 | |
Jupiter Securitization Co. LLC, 0.26%,
1/28/11, (LOC JP Morgan Chase
Bank N.A.) (c) | | | 75,000,000 | | | 74,952,334 | |
Nationwide Building Society, 0.30%,
11/12/10 (c) | | | 47,000,000 | | | 46,995,692 | |
Nieuw Amsterdam Receivables Corp.,
0.28%, 1/26/11, (LOC Rabobank
Intl.) (c) | | | 20,000,000 | | | 19,986,622 | |
Nordea N.A., Inc., 0.26%, 1/27/11 (c) | | | 48,000,000 | | | 47,970,420 | |
| | |
See notes to financial statements | HSBC INVESTOR FAMILY OF FUNDS | 20 |
|
HSBC INVESTOR PRIME MONEY MARKET FUND |
|
Schedule of Portfolio Investments—as of October 31, 2010 (continued) |
| | | | | | | |
Commercial Paper And Notes, continued | | | | | | | |
|
|
|
|
|
|
|
|
| | | | | | | |
| | Principal
Amount($) | | Amortized
Cost($) | |
| |
| |
| |
Finance, continued | | | | | | | |
Nordea N.A., Inc., 0.36%, 2/14/11 (c) | | | 100,000,000 | | | 99,895,000 | |
Sheffield Receivables Corp., 0.24%,
11/2/10, (LOC Barclays Bank
plc, N.Y.) (c) | | | 55,000,000 | | | 54,999,633 | |
Unicredit Delaware, Inc., 0.26%,
11/22/10, (LOC Unicredit SPA) (c) | | | 75,000,000 | | | 74,988,625 | |
| | | | |
|
| |
| | | | | | 1,284,464,695 | |
| | | | |
|
| |
TOTAL COMMERCIAL PAPER AND
NOTES (COST $2,733,584,095) | | | | | | 2,733,584,095 | |
| | | | |
|
| |
|
Certificates of Deposit—29.2% | | | | | | | |
|
|
|
|
|
|
|
|
Banking – 29.2% | | | | | | | |
Abbey National Treasury Service,
0.36%, 1/21/11 | | | 45,000,000 | | | 45,000,000 | |
Australia & New Zealand Banking
Group, N.Y., 0.26%, 12/9/10 (b) | | | 34,000,000 | | | 34,000,000 | |
Bank of Montreal, 0.24%, 1/31/11 | | | 75,000,000 | | | 75,000,000 | |
Bank of Nova Scotia Houston, 0.28%,
11/5/10 | | | 100,000,000 | | | 100,000,000 | |
Bank of Nova Scotia Houston, 0.27%,
11/23/10 (b) | | | 80,000,000 | | | 80,000,000 | |
Bank of Tokyo-Mitsubishi UFJ, N.Y.,
0.28%, 1/18/11 | | | 50,000,000 | | | 50,000,000 | |
Bank of Tokyo-Mitsubishi UFJ, N.Y.,
0.37%, 2/28/11 | | | 100,000,000 | | | 100,000,000 | |
BNP Paribas, N.Y., 0.49%, 6/20/11 (b) | | | 100,000,000 | | | 100,000,000 | |
Chase Bank USA N.A., 0.24%,
11/15/10 | | | 100,000,000 | | | 100,000,000 | |
Credit Agricole CIB, N.Y., 0.50%,
2/15/11 | | | 60,000,000 | | | 60,000,000 | |
Deutsche Bank, N.Y., 0.46%,
1/10/11 (b) | | | 55,000,000 | | | 55,011,693 | |
DnB NOR Bank ASA, N.Y., 0.29%,
11/5/10 | | | 100,000,000 | | | 100,000,000 | |
Intesa Sanpaolo SpA, 0.42%, 11/17/10 | | | 100,000,000 | | | 100,000,428 | |
Intesa Sanpaolo, N.Y., 0.46%,
6/14/11 (b) | | | 100,000,000 | | | 100,000,000 | |
Landesbank Hessen-Thuringen, 0.25%,
11/30/10 | | | 85,000,000 | | | 85,000,000 | |
Lloyds TSB Bank plc, N.Y., 0.25%,
1/21/11 | | | 45,000,000 | | | 45,000,000 | |
National Bank of Canada, N.Y., 0.28%,
11/8/10 | | | 100,000,000 | | | 100,000,000 | |
Natixis, N.Y., 0.51%, 12/14/10 (b) | | | 100,000,000 | | | 100,000,000 | |
Norinchukin Bank, N.Y., 0.26%,
11/10/10 | | | 70,000,000 | | | 70,000,000 | |
Royal Bank of Canada, N.Y., 0.26%,
12/2/10 (b) | | | 70,000,000 | | | 70,000,000 | |
Royal Bank of Canada, N.Y., 0.26%,
12/14/10 (b) | | | 25,000,000 | | | 25,000,000 | |
Royal Bank of Canada, N.Y., 0.26%,
3/14/11 (b) | | | 65,000,000 | | | 65,000,187 | |
Royal Bank of Scotland plc, 0.42%,
11/9/10 | | | 100,000,000 | | | 100,000,000 | |
Royal Bank of Scotland plc, 0.32%,
11/24/10 | | | 100,000,000 | | | 100,000,000 | |
Societe Generale, N.Y., 0.38%, 2/22/11 | | | 100,000,000 | | | 100,000,000 | |
Svenska Handelsbanken, N.Y., 0.27%,
12/1/10 | | | 100,000,000 | | | 100,000,000 | |
| | | | | | | |
Certificates of Deposit, continued | | | | | | | |
|
|
|
|
|
|
|
|
| | | | | | | |
| | Principal
Amount($) | | Amortized
Cost($) | |
| |
| |
| |
Banking, continued | | | | | | | |
Svenska Handelsbanken, N.Y., 0.26%,
1/28/11 | | | 49,000,000 | | | 49,000,000 | |
Toronto Dominion Bank, 0.26%,
12/9/10 (b) | | | 85,000,000 | | | 85,000,000 | |
| | | | |
|
| |
| | | | | | 2,193,012,308 | |
| | | | |
|
| |
TOTAL CERTIFICATES OF DEPOSIT
(COST $2,193,012,308) | | | | | | 2,193,012,308 | |
| | | | |
|
| |
|
Municipal Bonds—2.2% | | | | | | | |
|
|
|
|
|
|
|
|
Florida – 1.0% | | | | | | | |
North Broward Florida Hospital District
Revenue, Series A, 0.23%, 1/15/31,
(LOC TD Bank N.A.) (b) | | | 22,600,000 | | | 22,600,000 | |
Orlando & Orange County Expressway
Authority Revenue, Sub-series B-4,
0.23%, 7/1/40, (LOC Wells Fargo
Bank N.A.) (b) | | | 49,720,000 | | | 49,720,000 | |
| | | | |
|
| |
| | | | | | 72,320,000 | |
| | | | |
|
| |
New York – 0.7% | | | | | | | |
New York State Dormitory Authority
Revenue, Non State Supported Debt,
Series B-1, 0.25%, 7/1/34, (LOC Bank
of America N.A.) (b) | | | 16,195,000 | | | 16,195,000 | |
New York State Dormitory Authority
Revenue, Non State Supported Debt,
Series D, 0.22%, 7/1/39, (LOC Bank
of America N.A.) (b) | | | 10,000,000 | | | 10,000,000 | |
New York State Housing Finance
Agency Revenue, Series A, 0.29%,
5/1/42, AMT, (LOC Wachovia
Bank N.A.) (b) | | | 25,000,000 | | | 25,000,000 | |
| | | | |
|
| |
| | | | | | 51,195,000 | |
| | | | |
|
| |
Ohio – 0.2% | | | | | | | |
Ohio State Air Quality Development
Authority Revenue, Series D,
0.25%, 2/1/26, (LOC Bank of
Tokyo-Mitsubishi UFJ Ltd.) (b) | | | 17,050,000 | | | 17,050,000 | |
| | | | |
|
| |
Oregon – 0.1% | | | | | | | |
Clackamas County Oregon Hospital
Facility Authority Revenue, Series B,
0.25%, 6/1/37, (LOC U.S.
Bank N.A.) (b) | | | 9,550,000 | | | 9,550,000 | |
| | | | |
|
| |
Vermont – 0.1% | | | | | | | |
Vermont Educational & Health Buildings
Financing Agency Revenue, Series A,
0.23%, 12/1/30, (LOC TD
Banknorth N.A.) (b) | | | 9,230,000 | | | 9,230,000 | |
| | | | |
|
| |
Virginia – 0.1% | | | | | | | |
Portsmouth Redevelopment & Housing
Authority Multi-family Housing
Revenue, 0.29%, 4/1/48, (LOC Bank
of America N.A., Liquidity Facility
FHLMC) (b) | | | 10,000,000 | | | 10,000,000 | |
| | | | |
|
| |
TOTAL MUNICIPAL BONDS
(COST $169,345,000) | | | | | | 169,345,000 | |
| | | | |
|
| |
| | |
21 | HSBC INVESTOR FAMILY OF FUNDS | See notes to financial statements |
| |
HSBC INVESTOR PRIME MONEY MARKET FUND |
|
Schedule of Portfolio Investments—as of October 31, 2010 (continued) |
| | | | | | | |
Repurchase Agreements—5.8% | | | | | | | |
|
|
|
|
|
|
|
|
| | | | | | | |
| | Principal
Amount($) | | Amortized
Cost($) | |
| |
| |
| |
Barclays Capital Group, purchased on
10/29/10, 0.24%, due on 11/1/10 with
a maturity value of $200,004,000,
collateralized by various Corporate
Obligations, 2.13%-2.90%,
12/1/10-7/12/2012, fair value
$204,000,000 | | | 200,000,000 | | | 200,000,000 | |
Goldman Sachs, purchased on 10/29/10,
0.24%, due on 11/1/10 with a maturity
value of 110,002,200, collateralized by
various Corporate Obligations, 2.13%,
4/30/12, fair value $112,200,000 | | | 110,000,000 | | | 110,000,000 | |
Royal Bank of Canada, purchased on
10/29/10, 0.22%, due on 11/1/10 with
a maturity value of $125,002,292,
collateralized by various U.S. Treasury
Obligations, 0.00%, 3/10/11,
fair value $127,500,089 | | | 125,000,000 | | | 125,000,000 | |
| | | | |
|
| |
TOTAL REPURCHASE AGREEMENTS
(COST $435,000,000) | | | | | | 435,000,000 | |
| | | | |
|
| |
|
Time Deposits—5.6% | | | | | | | |
|
|
|
|
|
|
|
|
Citi/Citinas Time Deposit, 0.20%,
11/1/10 | | | 200,000,000 | | | 200,000,000 | |
Northern Trust Premium Offshore
Time Deposit, 0.07%, 11/1/10 | | | 358,211 | | | 358,211 | |
Societe Generale Cayman Time Deposit,
0.21%, 11/1/10 | | | 224,000,000 | | | 224,000,000 | |
| | | | |
|
| |
TOTAL TIME DEPOSITS
(COST $424,358,211) | | | | | | 424,358,211 | |
| | | | |
|
| |
TOTAL INVESTMENTS
(COST $7,514,132,281) — 100.0% | | | | | | 7,514,132,281 | |
| | | | |
|
| |
| |
|
| Percentages indicated are based on net assets of $7,515,638,159. |
| |
(a) | Rule 144A security or other security which is restricted as to resale to institutional investors. This security has been deemed liquid by the Investment Adviser based on procedures approved by the Board of Trustees. |
| |
(b) | Variable rate security. The interest rates on these securities are adjusted periodically to reflect then-current short-term interest rates. The rates presented represent the rates in effect on October 31, 2010. The maturity dates presented reflect the final maturity dates. However, some of these securities may contain put or demand features that allow the fund to require the issuer to repurchase the security from the fund within various time periods, including daily, weekly, monthly, or semi-annually. |
| |
(c) | Discount note. Rate presented represents the effective yield at time of purchase. |
| |
AMT | — Interest on security is subject to federal alternative minimum tax |
FHLMC | — Federal Home Loan Mortgage Corporation |
GO | — General Obligation |
IDA | — Industrial Development Agency |
LLC | — Limited Liability Company |
LOC | — Letter of Credit |
plc | — Public Limited Company |
SPA | — Standby Purchase Agreement |
| | |
See notes to financial statements | HSBC INVESTOR FAMILY OF FUNDS | 22 |
|
HSBC INVESTOR TAX-FREE MONEY MARKET FUND |
|
Schedule of Portfolio Investments—as of October 31, 2010 |
| | | | | | | |
Variable Rate Demand Notes—76.4% |
|
| | | | | | | |
| | Principal
Amount($) | | Amortized
Cost($) | |
| |
| |
| |
Alabama – 2.4% | | | | | | | |
Infirmary Health System Special Care
Facilities Financing Authority
Revenue, Series B, 0.25%, 2/1/40,
(LOC Deutsche Bank A.G.) (a) | | | 1,500,000 | | | 1,500,000 | |
Mobile Alabama Industrial Development
Board Dock & Wharf Revenue,
Series A, 0.27%, 6/1/32, (LOC
Bayerische Landesbank) (a) | | | 1,000,000 | | | 1,000,000 | |
| | | |
| |
| | | | | | 2,500,000 | |
| | | |
| |
Arizona – 2.5% | | | | | | | |
Apache County Arizona Industrial
Development Authority Revenue,
Series 83A, 0.29%, 12/15/18,
(LOC ABN AMRO Bank N.V.) (a) | | | 600,000 | | | 600,000 | |
Arizona State Board of Regents
University System Revenue, Series B,
0.23%, 7/1/34, (LOC Lloyds
TSB Bank plc) (a) | | | 2,000,000 | | | 2,000,000 | |
| | | |
| |
| | | | | | 2,600,000 | |
| | | |
| |
California – 6.2% | | | | | | | |
California Statewide Communities
Development Authority Multi-family
|Revenue, Series BB, 0.36%, 12/1/34,
AMT, (LOC Citibank N.A.) (a) | | | 860,000 | | | 860,000 | |
Hayward California Housing Authority
Multi-family Revenue, 0.30%, 3/1/27,
(Credit Support FHA, LOC State
Street B&T Co.) (a) | | | 2,000,000 | | | 2,000,000 | |
Hesperia California Unified School
District Certificates of Participation,
0.50%, 2/1/38, (Credit Support FSA,
SPA Dexia Credit Bank) (a) | | | 500,000 | | | 500,000 | |
Perris California Unified High School
District Certificates of Participation,
0.50%, 9/1/18, (Credit Support FSA,
SPA Dexia Credit Local) (a) | | | 1,550,000 | | | 1,550,000 | |
Perris California Union High School
District Certificates of Participation,
0.50%, 9/1/33, (Credit Support FSA,
SPA Dexia Credit Local) (a) | | | 600,000 | | | 600,000 | |
San Francisco California City & County
Redevelopment Agency Multi-family
Revenue, Series F, 0.29%, 12/1/33,
AMT, (LOC Citibank N.A.) (a) | | | 1,000,000 | | | 1,000,000 | |
| | | |
| |
| | | | | | 6,510,000 | |
| | | |
| |
Colorado – 3.2% | | | | | | | |
Broomfield Colorado Urban Renewal
Authority Tax Increment Revenue,
0.29%, 12/1/30, (LOC BNP
Paribas) (a) | | | 650,000 | | | 650,000 | |
Colorado Housing & Finance Authority
Multi-family Revenue, Series B,
0.26%, 10/15/16, (Credit Support
FNMA, Liquidity Facility
FNMA) (a) | | | 1,000,000 | | | 1,000,000 | |
| | | | | | | |
Variable Rate Demand Notes, continued |
|
| | | | | |
| | Principal
Amount($) | | Amortized
Cost($) | |
| |
| |
| |
Colorado, continued | | | | | | | |
Colorado Housing & Finance Authority
Multi-family Revenue, 0.28%,
2/15/28, (Credit Support FNMA,
Liquidity Facility FNMA) (a) | | | 1,000,000 | | | 1,000,000 | |
Moffat County Colorado Pollution
Control Revenue, 0.27%, 3/1/36,
(LOC Bank of America N.A.) (a) | | | 750,000 | | | 750,000 | |
| | | |
| |
| | | | | | 3,400,000 | |
| | | |
| |
Florida – 3.4% | | | | | | | |
Florida Housing Finance Corp.
Multi-family Mortgage Revenue,
Series P, 0.31%, 8/1/35, AMT,
(LOC Citibank N.A.) (a) | | | 1,100,000 | | | 1,100,000 | |
Florida Keys Aqueduct Authority Water
Revenue, 0.23%, 9/1/35, (LOC TD
Bank N.A.) (a) | | | 1,500,000 | | | 1,500,000 | |
Miami-Dade County Florida Professional
Sports Franchise Facilities Tax Revenue,
Series E, 0.27%, 10/1/48, (LOC Wells
Fargo Bank N.A.) (a) | | | 1,000,000 | | | 1,000,000 | |
| | | |
| |
| | | | | | 3,600,000 | |
| | | |
| |
Georgia – 3.0% | | | | | | | |
Georgia Private Colleges & Universities
Authority Educational Facilities
Revenue, Series B, 0.27%, 6/1/23,
(LOC Wells Fargo Bank N.A.) (a) | | | 1,000,000 | | | 1,000,000 | |
Roswell Georgia Housing Authority
Multi-family Revenue, 0.28%, 6/15/25,
(Credit Support FNMA) (a) | | | 1,400,000 | | | 1,400,000 | |
Savannah Georgia Economic
Development Authority Revenue,
0.50%, 9/1/24, (LOC Bank of
America N.A.) (a) | | | 800,000 | | | 800,000 | |
| | | |
| |
| | | | | | 3,200,000 | |
| | | |
| |
Illinois – 5.6% | | | | | | | |
Chicago Illinois O’Hare International
Airport Revenue, Series C, 0.29%,
1/1/18, (LOC Societe Generale) (a) | | | 1,000,000 | | | 1,000,000 | |
Illinois Development Finance Authority
Revenue, 0.25%, 12/1/28, (LOC
Northern Trust Co.) (a) | | | 1,000,000 | | | 1,000,000 | |
Illinois Educational Facilities Authority
Revenue, 0.30%, 1/1/29, (LOC
Citibank N.A.) (a) | | | 1,400,000 | | | 1,400,000 | |
Illinois Finance Authority Revenue,
Series A, 0.26%, 11/1/45, (LOC
Northern Trust Co.) (a) | | | 1,500,000 | | | 1,500,000 | |
Lake County Illinois Multi-family
Housing Revenue, 0.35%, 11/1/34,
AMT, (Credit Support FHLMC,
Liquidity Facility FHLMC) (a) | | | 1,000,000 | | | 1,000,000 | |
| | | |
| |
| | | | | | 5,900,000 | |
| | | |
| |
Indiana – 1.7% | | | | | | | |
Indiana State Finance Authority Revenue,
Series A, 0.27%, 7/1/36, (LOC
Northern Trust Co.) (a) | | | 1,000,000 | | | 1,000,000 | |
| | |
23 | HSBC INVESTOR FAMILY OF FUNDS | See notes to financial statements |
|
HSBC INVESTOR TAX-FREE MONEY MARKET FUND |
|
Schedule of Portfolio Investments—as of October 31, 2010 (continued) |
| | | | | | | |
Variable Rate Demand Notes, continued |
|
| | | | | | | |
| | Principal
Amount($) | | Amortized
Cost($) | |
| |
| |
| |
Indiana, continued | | | | | | | |
Valparaiso Indiana Economic
Development Revenue, 0.55%, 5/1/19,
AMT, (LOC U.S. Bank N.A.) (a) | | | 805,000 | | | 805,000 | |
| | | | |
|
| |
| | | | | | 1,805,000 | |
| | | | |
|
| |
Kansas – 2.4% | | | | | | | |
Newton Kansas Economic Development
Revenue, Series A, 0.50%, 10/1/22,
(LOC Bank of America N.A.) (a) | | | 1,000,000 | | | 1,000,000 | |
Olathe Kansas Health Facilities Revenue,
Series B, 0.25%, 9/1/35, (LOC Bank
of America N.A.) (a) | | | 1,500,000 | | | 1,500,000 | |
| | | | |
|
| |
| | | | | | 2,500,000 | |
| | | | |
|
| |
Kentucky – 0.5% | | | | | | | |
Trimble County Kentucky Association
of Counties Leasing Trust Lease
Program Revenue, Series A, 0.27%,
12/1/38, (LOC U.S. Bank N.A.) (a) | | | 500,000 | | | 500,000 | |
| | | | |
|
| |
Louisiana – 0.9% | | | | | | | |
Louisiana Public Facilities Authority
Revenue, Series B-1, 0.29%, 7/1/47,
(LOC Bank of New York) (a) | | | 1,000,000 | | | 1,000,000 | |
| | | | |
|
| |
Maine – 1.0% | | | | | | | |
Gorham Maine Revenue Obligation
Securities, Series A, 0.55%, 7/1/21,
AMT, (LOC TD Banknorth N.A.) (a) | | | 1,030,000 | | | 1,030,000 | |
| | | | |
|
| |
Michigan – 1.9% | | | | | | | |
Central Michigan University Revenues,
Series A, 0.24%, 10/1/32, (LOC
JP Morgan Chase Bank) (a) | | | 1,000,000 | | | 1,000,000 | |
Wayne County Michigan Airport
Authority Revenue, Series C1, 0.30%,
12/1/21, AMT, (LOC Wachovia
Bank N.A.) (a) | | | 1,000,000 | | | 1,000,000 | |
| | | | |
|
| |
| | | | | | 2,000,000 | |
| | | | |
|
| |
Minnesota – 2.2% | | | | | | | |
St. Paul Minnesota Port Authority
District Heating Revenue, Series 7-Q,
0.27%, 12/1/28, (LOC Deutsche
Bank A.G.) (a) | | | 1,300,000 | | | 1,300,000 | |
St. Paul Minnesota Port Authority Tax
Increment Revenue, 0.28%, 2/1/15,
(LOC U.S. Bank N.A.) (a) | | | 1,000,000 | | | 1,000,000 | |
| | | | |
|
| |
| | | | | | 2,300,000 | |
| | | | |
|
| |
Missouri – 1.4% | | | | | | | |
Missouri State Health & Educational
Facilities Authority Revenue,
Series E, 0.23%, 6/1/45, (LOC PNC
Bank N.A.) (a) | | | 1,500,000 | | | 1,500,000 | |
| | | | |
|
| |
Nebraska – 0.9% | | | | | | | |
Saline County Nebraska Hospital
Authority No. 1 Hospital Revenue,
Series C, 0.27%, 6/1/31, (LOC U.S.
Bank N.A.) (a) | | | 985,000 | | | 985,000 | |
| | | | |
|
| |
| | | | | | | |
Variable Rate Demand Notes, continued |
|
| | | | | | | |
| | Principal
Amount($) | | Amortized
Cost($) | |
| |
| |
| |
New Jersey – 8.3% | | | | | | | |
New Jersey Economic Development
Authority Gas Facilities Revenue,
0.22%, 10/1/22, (LOC Bank of
Tokyo-Mitsubishi UFJ Ltd.) (a) | | | 2,000,000 | | | 2,000,000 | |
New Jersey Economic Development
Authority Revenue, 0.25%, 4/1/13,
(LOC Citibank N.A.) (a) | | | 1,000,000 | | | 1,000,000 | |
New Jersey Economic Development
Authority School Revenue,
Sub-series R-3, 0.22%, 9/1/31,
(LOC Bank of Nova Scotia, Lloyds
TSB Bank plc) (a) | | | 700,000 | | | 700,000 | |
New Jersey State Transportation Trust
Fund Authority Revenue, Series D,
0.25%, 6/15/32, (LOC Sumitomo
Mitisui Banking Corp.) (a) | | | 1,500,000 | | | 1,500,000 | |
New Jersey State Turnpike Authority
Revenue, Series D, 0.23%, 1/1/24,
(LOC Scotiabank) (a) | | | 2,000,000 | | | 2,000,000 | |
New Jersey State Turnpike Authority
Turnpike Revenue, Series D, 0.29%,
1/1/18, (Credit Support National
Reinsurance FGIC, LOC Societe
Generale) (a) | | | 1,500,000 | | | 1,500,000 | |
| | | | |
|
| |
| | | | | | 8,700,000 | |
| | | | |
|
| |
New Mexico – 2.4% | | | | | | | |
Farmington New Mexico Hospital
Revenue, 0.28%, 6/1/28, (LOC Bank
of Nova Scotia) (a) | | | 500,000 | | | 500,000 | |
New Mexico Educational Assistance
Foundation Revenue, Series A-1,
0.31%, 4/1/34, AMT, (Credit Support
Guaranteed Student Loans, LOC
Royal Bank of Canada) (a) | | | 2,000,000 | | | 2,000,000 | |
| | | | |
|
| |
| | | | | | 2,500,000 | |
| | | | |
|
| |
New York – 1.9% | | | | | | | |
New York City Housing Development
Corp. Multi-family Housing Revenue,
Series A, 0.28%, 9/15/28, AMT,
(Credit Support FNMA, Liquidity
Facility FNMA) (a) | | | 1,000,000 | | | 1,000,000 | |
Triborough Bridge & Tunnel Authority
Revenue, Series B, 0.23%, 1/1/32,
(LOC State Street B&T Co.) (a) | | | 1,000,000 | | | 1,000,000 | |
| | | | |
|
| |
| | | | | | 2,000,000 | |
| | | | |
|
| |
North Carolina – 1.9% | | | | | | | |
Charlotte-Mecklenburg Hospital
Authority North Carolina Health
Care System Revenue, Series F,
0.40%, 1/15/42, (Credit Support FSA,
SPA Dexia Credit Local) (a) | | | 1,000,000 | | | 1,000,000 | |
Lower Cape Fear North Carolina Water
& Sewer Authority Special Facility
Revenue, 0.27%, 12/1/34, (LOC
JP Morgan Chase Bank) (a) | | | 1,000,000 | | | 1,000,000 | |
| | | | |
|
| |
| | | | | | 2,000,000 | |
| | | | |
|
| |
| | |
See notes to financial statements | HSBC INVESTOR FAMILY OF FUNDS | 24 |
|
HSBC INVESTOR TAX-FREE MONEY MARKET FUND |
|
Schedule of Portfolio Investments—as of October 31, 2010 (continued) |
| | | | | | | |
Variable Rate Demand Notes, continued |
|
| | | | | | | |
| | Principal
Amount($) | | Amortized
Cost($) | |
| |
| |
| |
Ohio – 6.6% | | | | | | | |
Hamilton County Ohio Health Care
Revenue, Series B, 0.27%, 1/1/37,
(LOC PNC Bank N.A.) (a) | | | 500,000 | | | 500,000 | |
Hamilton County Ohio Hospital
Facilities Revenue, 0.29%, 7/1/22,
(LOC PNC Bank N.A.) (a) | | | 1,200,000 | | | 1,200,000 | |
Lucas County Ohio Hospital Revenue,
Series A, 0.21%, 11/15/34,
(LOC UBS AG) (a) | | | 2,000,000 | | | 2,000,000 | |
Ohio State Air Quality Development
Authority Revenue, Series A, 0.25%,
2/1/26, (LOC Bank of Nova Scotia) (a) | | | 1,250,000 | | | 1,250,000 | |
Ohio State Air Quality Development
Authority Revenue, Series C, 0.26%,
2/1/26, (LOC Bank of Tokyo-
Mitsubishi UFJ Ltd.) (a) | | | 2,000,000 | | | 2,000,000 | |
| | | | |
|
| |
| | | | | | 6,950,000 | |
| | | | |
|
| |
Oregon – 0.9% | | | | | | | |
Port of Portland Oregon Airport Revenue,
Series 18A, 0.26%, 7/1/26, AMT,
(LOC Lloyds TSB Bank plc) (a) | | | 1,000,000 | | | 1,000,000 | |
| | | | |
|
| |
Pennsylvania – 3.8% | | | | | | | |
Haverford Township Pennsylvania
School District GO, 0.28%, 3/1/30,
(Credit Support State Aid Withholding,
LOC TD Bank N.A.) (a) | | | 1,000,000 | | | 1,000,000 | |
Jackson Township Pennsylvania
Industrial Development Authority
Revenue, 0.33%, 12/1/34, AMT,
(LOC PNC Bank N.A.) (a) | | | 1,000,000 | | | 1,000,000 | |
Philadelphia Pennsylvania School
District GO, Series B-5, 0.37%, 9/1/30,
(Credit Support State Aid Withholding,
LOC Wachovia Bank N.A.) (a) | | | 1,030,000 | | | 1,030,000 | |
Pittsburgh Pennsylvania Water & Sewer
Authority System Revenue, Series B2,
0.25%, 9/1/39, (LOC PNC
Bank N.A.) (a) | | | 1,000,000 | | | 1,000,000 | |
| | | | |
|
| |
| | | | | | 4,030,000 | |
| | | | |
|
| |
Rhode Island – 0.8% | | | | | | | |
Rhode Island Health & Educational
Building Corp. Educational Institution
Revenue, 0.40%, 10/1/31, (LOC Bank
of America N.A.) (a) | | | 860,000 | | | 860,000 | |
| | | | |
|
| |
South Dakota – 1.0% | | | | | | | |
South Dakota State Health &
Educational Facilities Authority
Revenue, 0.29%, 9/1/27, (LOC U.S.
Bank N.A.) (a) | | | 1,000,000 | | | 1,000,000 | |
| | | | | | | |
Texas – 3.8% | | | | | | | |
Harris County Texas Hospital District
Revenue, 0.28%, 2/15/42,
(LOC JP Morgan Chase Bank) (a) | | | 2,000,000 | | | 2,000,000 | |
Houston Texas Utility System Revenue,
Series B-3, 0.25%, 5/15/34, (LOC
Sumitomo Mitsui Banking Corp.) (a) | | | 1,000,000 | | | 1,000,000 | |
| | | | | | | |
Variable Rate Demand Notes, continued |
|
| | | | | | | |
| | Principal
Amount($) | | Amortized
Cost($) | |
| |
| |
| |
Texas, continued | | | | | | | |
Mission Texas Economic Development
Corp. Solid Waste Disposal Revenue,
0.30%, 4/1/22, (LOC Bank of
America N.A.) (a) | | | 1,000,000 | | | 1,000,000 | |
| | | | |
|
| |
| | | | | | 4,000,000 | |
| | | | |
|
| |
Vermont – 1.0% | | | | | | | |
Vermont Educational & Health Buildings
Financing Agency Revenue, Series A,
0.30%, 10/1/38, (LOC TD
Banknorth N.A.) (a) | | | 1,000,000 | | | 1,000,000 | |
| | | | |
|
| |
Washington – 1.9% | | | | | | | |
Washington State Health Care Facilities
Authority Revenue, 0.31%, 11/15/26,
(LOC Citibank N.A.) (a)(b) | | | 1,000,000 | | | 1,000,000 | |
Washington State Housing Finance
Commission Multi-family Housing
Revenue, 0.28%, 7/1/44, (Credit
Support FHLMC, Liquidity Facility
FHLMC) (a) | | | 1,000,000 | | | 1,000,000 | |
| | | | |
|
| |
| | | | | | 2,000,000 | |
| | | | |
|
| |
West Virginia – 1.9% | | | | | | | |
West Virginia Economic Development
Authority Pollution Control Revenue,
Series B, 0.24%, 7/1/14, (LOC Royal
Bank of Scotland) (a) | | | 2,000,000 | | | 2,000,000 | |
| | | | |
|
| |
Wyoming – 1.0% | | | | | | | |
Sweetwater County Wyoming Pollution
Control Revenue, Series A, 0.24%,
7/1/15, (LOC Barclays Bank plc) (a) | | | 1,000,000 | | | 1,000,000 | |
| | | | |
|
| |
| | | | | | | |
TOTAL VARIABLE RATE DEMAND
NOTES (COST $80,370,000) | | | | | | 80,370,000 | |
| | | | |
|
| |
|
Commercial Paper And Notes—4.3% | | | | | | | |
|
|
|
|
|
|
|
|
Texas – 2.9% | | | | | | | |
Houston Texas, 0.33%, 11/9/10 | | | 1,500,000 | | | 1,500,000 | |
Houston Texas, 0.33%, 11/17/10 | | | 1,500,000 | | | 1,500,000 | |
| | | | |
|
| |
| | | | | | 3,000,000 | |
| | | | |
|
| |
Wyoming – 1.4% | | | | | | | |
Sweetwater County Wyoming Pollution,
Series 88-A, 0.29%, 11/1/10,
(LOC Barclays Bank plc) | | | 1,500,000 | | | 1,500,000 | |
| | | | |
|
| |
TOTAL COMMERCIAL PAPER AND
NOTES (COST $4,500,000) | | | | | | 4,500,000 | |
| | | | |
|
| |
|
Municipal Bonds—11.5% | | | | | | | |
|
|
|
|
|
|
|
|
Delaware – 1.0% | | | | | | | |
Delaware State GO, Series C, 5.00%,
7/1/12, prerefunded 7/1/11 @ 100 | | | 1,000,000 | | | 1,031,316 | |
| | | | |
|
| |
Massachusetts – 0.4% | | | 415,000 | | | 418,404 | |
Massachusetts State GO, Series A,
5.25%, 1/1/19, prerefunded
10/1/11 @ 100 | | | 415,000 | | | 418,404 | |
| | | | |
|
| |
| | |
25 | HSBC INVESTOR FAMILY OF FUNDS | See notes to financial statements |
|
HSBC INVESTOR TAX-FREE MONEY MARKET FUND |
|
Schedule of Portfolio Investments—as of October 31, 2010 (continued) |
| | | | | | | |
Municipal Bonds, continued |
|
| | | | | | | |
| | Principal
Amount($) | | Amortized
Cost($) | |
| |
| |
| |
Michigan—1.0% | | | | | | | |
Michigan State Trunk Line Revenue,
Series A, 5.25%, 11/1/30, (Credit
Support FSA), prerefunded
11/1/11 @ 100 | | | 1,000,000 | | | 1,049,280 | |
| | | | |
|
| |
Minnesota – 1.6% | | | | | | | |
Minnesota State GO, 5.00%, 11/1/20,
(Credit Support FSA), prerefunded
11/1/10 @ 100 | | | 675,000 | | | 675,000 | |
Minnesota State GO, 5.00%, 10/1/21,
prerefunded 10/1/11 @ 100 | | | 1,000,000 | | | 1,042,451 | |
| | | | |
|
| |
| | | | | | 1,717,451 | |
| | | | |
|
| |
Missouri – 1.2% | | | | | | | |
Mehlville Missouri School District
No. R-9 Certificates of Participation,
Series A, 5.50%, 3/1/14, (Credit Support
FSA), Prerefunded 3/1/11 @ 100 | | | 1,190,000 | | | 1,210,146 | |
| | | | |
|
| |
New Jersey – 1.0% | | | | | | | |
Branchburg Township Board of Education
GO, 5.00%, 7/15/28, (Credit Support
FGIC), prerefunded 7/15/11 @ 100 | | | 965,000 | | | 996,848 | |
| | | | |
|
| |
Pennsylvania – 0.8% | | | | | | | |
Pennsylvania State Turnpike Commission
Registration Fee Revenue, 5.00%,
7/15/41, (Credit Support AMBAC),
prerefunded 7/15/11 @ 101 | | | 820,000 | | | 855,222 | |
| | | | |
|
| |
Rhode Island – 0.9% | | | | | | | |
Rhode Island State & Providence
Plantations GO, Series C, 5.50%,
9/1/12, (Credit Support NATL-RE),
prerefunded 9/1/11 @ 101 | | | 880,000 | | | 926,578 | |
| | | | |
|
| |
Tennessee – 0.2% | | | | | | | |
Memphis Tennessee GO, 5.00%,
11/1/11, prerefunded 11/1/10 @ 101 | | | 250,000 | | | 252,500 | |
| | | | |
|
| |
Texas – 3.4% | | | | | | | |
Harris County Texas GO, 5.38%, 10/1/16,
prerefunded 10/1/11 @ 100 | | | 500,000 | | | 523,056 | |
Houston Texas GO, Series A, 5.38%,
3/1/15, (Credit Support FSA),
prerefunded 3/1/11 @ 100 | | | 2,000,000 | | | 2,033,554 | |
University of Texas Revenue, Series B,
5.38%, 8/15/15, prerefunded
8/15/11 @ 100 | | | 1,000,000 | | | 1,039,787 | |
| | | | |
|
| |
| | | | | | 3,596,397 | |
| | | | |
|
| |
TOTAL MUNICIPAL BONDS
(COST $12,054,142) | | | | | | 12,054,142 | |
| | | | |
|
| |
| | | | | | | |
Investment Companies—3.4% | | | | | | | |
|
| | | | | | | |
| | Shares | | Amortized
Cost($) | |
| |
| |
| |
BlackRock Liquidity Funds Muni Fund
Portfolio, Institutional Shares,
0.14% (c) | | | 1,109,439 | | | 1,109,439 | |
Northern Institutional Tax Exempt
Portfolio, Shares Class, 0.02% (c) | | | 2,531,141 | | | 2,531,141 | |
| | | | |
|
| |
TOTAL INVESTMENT COMPANIES
(COST $3,640,580) | | | | | | 3,640,580 | |
| | | | |
|
| |
TOTAL INVESTMENTS
(COST $100,564,722) — 95.6% | | | | | | 100,564,722 | |
| | | | |
|
| |
| |
|
| Percentages indicated are based on net assets of $105,167,866. |
| |
(a) | Variable rate security. The interest rates on these securities are adjusted periodically to reflect then-current short-term interest rates. The rates presented represent the rates in effect on October 31, 2010. The maturity dates presented reflect the final maturity dates. However, some of these securities may contain put or demand features that allow the fund to require the issuer to repurchase the security from the fund within various time periods, including daily, weekly, monthly, or semi-annually. |
| |
(b) | Rule 144A security or other security which is restricted as to resale to institutional investors. This security has been deemed liquid by the Investment Adviser based on procedures approved by the Board of Trustees. |
| |
(c) | The rate represents the annualized one-day yield that was in effect on October 31, 2010. |
| |
AMBAC | — American Municipal Bond Assurance Corporation |
AMT | — Interest on security is subject to federal alternative minimum tax |
FGIC | — Financial Guaranty Insurance Company |
FHA | — Federal Housing Administration |
FHLMC | — Federal Home Loan Mortgage Corporation |
FNMA | — Federal National Mortgage Association |
FSA | — Financial Security Assurance |
GO | — General Obligation |
LOC | — Letter of Credit |
NATL-RE | — Reinsurance provided by the National Public Finance Guarantee Corporation |
plc | — Public Limited Company |
SPA | — Standby Purchase Agreement |
| | |
See notes to financial statements | HSBC INVESTOR FAMILY OF FUNDS | 26 |
|
HSBC INVESTOR U.S. GOVERNMENT MONEY MARKET FUND |
|
Schedule of Portfolio Investments—as of October 31, 2010 |
|
U.S. Government and Government Agency Obligations—49.7% |
|
| | | | | | | |
| | Principal
Amount($) | | Amortized
Cost($) | |
| |
| |
| |
Federal Farm Credit Bank – 4.0% | | | | | | | |
3.75%, 12/6/10 | | | 7,800,000 | | | 7,825,666 | |
0.19%, 12/7/10(a) | | | 50,000,000 | | | 50,000,000 | |
0.15%, 1/21/11(a), Series 1 | | | 100,000,000 | | | 99,997,654 | |
3.00%, 3/3/11 | | | 10,000,000 | | | 10,089,321 | |
0.26%, 4/20/11(a), Series 1 | | | 40,000,000 | | | 40,000,000 | |
0.40%, 6/1/11(a) | | | 150,000,000 | | | 150,000,000 | |
| | | | |
|
| |
| | | | | | 357,912,641 | |
| | | | |
|
| |
Federal Home Loan Bank – 34.4% | | | | | | | |
0.10%, 11/1/10(b) | | | 800,000,000 | | | 800,000,000 | |
0.28%, 11/10/10, Series 1 | | | 100,000,000 | | | 99,999,326 | |
0.50%, 11/24/10 | | | 100,000,000 | | | 100,000,000 | |
0.22%, 12/3/10(a), Series 1 | | | 150,000,000 | | | 149,994,645 | |
0.40%, 1/4/11 | | | 50,000,000 | | | 50,001,228 | |
0.26%, 1/12/11 | | | 150,000,000 | | | 150,000,000 | |
0.19%, 1/14/11(a) | | | 200,000,000 | | | 200,000,000 | |
0.26%, 1/21/11, Series 1 | | | 250,000,000 | | | 249,974,357 | |
0.27%, 1/28/11 | | | 150,000,000 | | | 149,998,150 | |
0.21%, 3/30/11 | | | 200,000,000 | | | 199,965,919 | |
0.24%, 5/6/11(a) | | | 51,000,000 | | | 50,984,149 | |
0.24%, 5/6/11(a), Series 1 | | | 100,000,000 | | | 99,979,616 | |
0.22%, 5/26/11(a), Series 1 | | | 5,000,000 | | | 4,997,690 | |
0.29%, 5/27/11(a), Series 3 | | | 175,000,000 | | | 175,000,000 | |
0.30%, 9/13/11(a) | | | 200,000,000 | | | 200,000,000 | |
0.43%, 9/26/11 | | | 200,000,000 | | | 200,000,000 | |
0.43%, 10/7/11 | | | 100,000,000 | | | 100,000,000 | |
0.28%, 10/20/11(a), Series 1 | | | 100,000,000 | | | 100,000,000 | |
| | | | |
|
| |
| | | | | | 3,080,895,080 | |
| | | | |
|
| |
Federal Home Loan Mortgage Corp. – 2.2% | | | | | | | |
0.27%, 11/16/10(b) | | | 100,000,000 | | | 99,988,750 | |
0.14%, 11/8/11(a), MTN | | | 100,000,000 | | | 100,000,000 | |
| | | | |
|
| |
| | | | | | 199,988,750 | |
| | | | |
|
| |
Federal National Mortgage Association – 9.1% | | | | | | | |
0.20%, 11/1/10(b) | | | 150,000,000 | | | 150,000,000 | |
0.29%, 12/1/10(b) | | | 100,000,000 | | | 99,975,833 | |
0.23%, 12/2/10(b) | | | 150,000,000 | | | 149,970,292 | |
5.50%, 3/15/11 | | | 48,000,000 | | | 48,886,287 | |
5.13%, 4/15/11 | | | 72,000,000 | | | 73,501,379 | |
0.24%, 5/2/11(b) | | | 200,000,000 | | | 199,757,333 | |
3.63%, 8/15/11 | | | 92,762,000 | | | 95,130,355 | |
| | | | |
|
| |
| | | | | | 817,221,479 | |
| | | | |
|
| |
TOTAL U.S. GOVERNMENT AND
GOVERNMENT AGENCY OBLIGATIONS
(COST $4,456,017,950) | | | | | | 4,456,017,950 | |
| | | | |
|
| |
|
U.S. Treasury Obligations—6.4% | | | | | | | |
|
|
|
|
|
|
|
|
U.S. Treasury Bills – 6.4% | | | | | | | |
0.12%, 1/6/11(b) | | | 500,000,000 | | | 499,890,000 | |
0.88%, 4/30/11 | | | 20,000,000 | | | 20,064,130 | |
1.00%, 8/31/11 | | | 50,000,000 | | | 50,274,654 | |
| | | | |
|
| |
| | | | | | 570,228,784 | |
| | | | |
|
| |
TOTAL U.S. TREASURY OBLIGATIONS
(COST $570,228,784) | | | | | | 570,228,784 | |
| | | | |
|
| |
| | | | | | | |
Repurchase Agreements—43.9% | | | | | | | |
|
|
|
|
|
|
|
|
| | | | | | | |
| | Principal
Amount($) | | Amortized
Cost($) | |
| |
| |
| |
Bank of America Corp., purchased
on 10/29/10, 0.23%, due on
11/1/10 with a maturity value of
$400,007,667, collateralized by
various U.S. Government and
Government Agency Obligations,
2.99%-5.43%, 10/1/35-7/1/39,
fair value $408,000,000 | | | 400,000,000 | | | 400,000,000 | |
Barclays Capital Group, purchased on
10/29/10, 0.24%, due on 11/1/10 with
a maturity value of $550,011,000,
collateralized by U.S. Government
and Government Agency Obligations,
0.00%-3.25%, 12/1/10-10/25/13,
fair value $561,000,000 | | | 550,000,000 | | | 550,000,000 | |
BNP Paribas, purchased on 10/29/10,
0.23%, due on 11/1/10 with a maturity
value of $200,003,833, collateralized
by various U.S. Government and
Government Agency Obligations,
0.00%-5.09%, 10/1/38-10/1/40,
fair value $204,000,000 | | | 200,000,000 | | | 200,000,000 | |
Citigroup Global Markets, purchased
on 10/29/10, 0.23%, due on 11/1/10
with a maturity value of
$100,001,917, collateralized by
various U.S. Government and
Government Agency Obligations,
1.91%-6.05%, 7/15/11-6/15/40,
fair value $102,000,000 | | | 100,000,000 | | | 100,000,000 | |
Deutsche Bank, purchased on 10/29/10,
0.23%, due on 11/1/10 with a maturity
value of $300,005,750, collateralized
by various U.S. Government and
Government Agency Obligations,
4.00%-5.50%, 4/1/24-12/1/39,
fair value $306,000,000 | | | 300,000,000 | | | 300,000,000 | |
Goldman Sachs, purchased on 10/29/10,
0.24%, due on 11/1/10 with a maturity
value of $490,009,800, collateralized
by various Corporate Obligations,
0.00%-3.13%, 12/1/10-28/12/12,
fair value $499,800,001 | | | 490,000,000 | | | 490,000,000 | |
Greenwich Capital Markets, Inc.,
purchased on 10/29/10, 0.20%, due
on 11/15/10 with a maturity value
of $250,047,222, collateralized by
various U.S. Government and
Government Agency Obligations,
0.00%-6.05%, 8/1/29-10/1/40,
fair value $255,000,874 | | | 250,000,000 | | | 250,000,000 | |
Greenwich Capital Markets, Inc.,
purchased on 10/29/10, 0.20%, due
on 11/23/10 with a maturity value
of $150,021,667, collateralized by
various U.S. Government and
Government Agency Obligations,
0.00%-5.64%, 5/1/35-10/1/40,
fair value $153,000,175 | | | 150,000,000 | | | 150,000,000 | |
| | |
27 | HSBC INVESTOR FAMILY OF FUNDS | See notes to financial statements |
|
HSBC INVESTOR U.S. GOVERNMENT MONEY MARKET FUND |
|
Schedule of Portfolio Investments—as of October 31, 2010 (continued) |
| | | | | | | |
Repurchase Agreements, continued |
|
|
|
|
|
|
|
|
| | | | | | | |
| | Principal
Amount($) | | Amortized
Cost($) | |
| |
| |
| |
Greenwich Capital Markets, Inc.,
purchased on 10/29/10, 0.23%, due
on 11/1/10 with a maturity value of
$300,005,750, collateralized by
various U.S. Government and
Government Agency Obligations,
4.50%-7.00%, 9/1/13-11/1/40,
fair value $306,000,068 | | | 300,000,000 | | | 300,000,000 | |
Royal Bank of Canada, purchased
on 10/12/10, 0.20%, due on 1/1/11
with a maturity value of
$200,022,222, collateralized by
various U.S. Government and
Government Agency Obligations,
2.67%-6.00%, 11/1/14-10/20/40,
fair value $204,000,000 | | | 200,000,000 | | | 200,000,000 | |
Royal Bank of Canada, purchased on
10/13/10, 0.20%, due on 11/10/10
with a maturity value of
$150,015,833, collateralized by
various U.S. Government and
Government Agency Obligations,
2.52%-6.00%, 3/1/16-10/1/40,
fair value $153,000,000 | | | 150,000,000 | | | 150,000,000 | |
Royal Bank of Canada, purchased on
10/29/10, 0.20%, due on 11/18/10
with a maturity value of
$350,005,833, collateralized by
various U.S. Government and
Government Agency Obligations,
2.13%-16.00%, 11/1/10-3/1/41,
fair value $357,000,000 | | | 350,000,000 | | | 350,000,000 | |
Royal Bank of Canada, purchased on
10/29/10, 0.21%, due on 1/1/11
with a maturity value of
$500,008,750, collateralized by
various Corporate Obligations,
0.00%-7.88%, 3/31/11-8/15/40,
fair value $510,004,544 | | | 500,000,000 | | | 500,000,000 | |
| | | | |
|
| |
TOTAL REPURCHASE AGREEMENTS
(COST $3,940,000,000) | | | | | | 3,940,000,000 | |
| | | | |
|
| |
TOTAL INVESTMENTS
(COST $8,966,246,734)—100.0% | | | | | | 8,966,246,734 | |
| | | | |
|
| |
| | |
|
| Percentages indicated are based on net assets of $8,967,761,121. |
| |
(a) | Variable rate security. The interest rates on these securities are adjusted periodically to reflect then-current short-term interest rates. The rates presented represent the rates in effect on October 31, 2010. The maturity dates presented reflect the final maturity dates. However, some of these securities may contain put or demand features that allow the fund to require the issuer to repurchase the security from the fund within various time periods, including daily, weekly, monthly, or semi-annually. |
| |
(b) | Discount note. Rate presented represents the effective yield at time of purchase. |
MTN — Medium Term Note
| | |
See notes to financial statements | HSBC INVESTOR FAMILY OF FUNDS | 28 |
|
HSBC INVESTOR U.S. TREASURY MONEY MARKET FUND |
|
Schedule of Portfolio Investments—as of October 31, 2010 |
| | | | | | | |
U.S. Treasury Obligations—99.2% |
|
| | | | | | | |
| | Principal
Amount($) | | Amortized
Cost($) | |
| |
| |
| |
U.S. Treasury Bills – 94.1% | | | | | | | |
0.12%, 11/4/10(a) | | | 366,400,000 | | | 366,396,117 | |
0.14%, 11/12/10(a) | | | 100,000,000 | | | 99,995,631 | |
0.14%, 11/18/10(a) | | | 636,900,000 | | | 636,860,388 | |
0.14%, 11/26/10(a) | | | 774,000,000 | | | 773,922,449 | |
0.14%, 12/2/10(a) | | | 192,300,000 | | | 192,276,026 | |
0.14%, 1/6/11(a) | | | 300,000,000 | | | 299,923,002 | |
0.13%, 1/13/11(a) | | | 200,000,000 | | | 199,947,278 | |
0.15%, 1/20/11(a) | | | 325,000,000 | | | 324,894,391 | |
0.18%, 3/10/11(a) | | | 23,000,000 | | | 22,985,577 | |
0.19%, 3/17/11(a) | | | 23,000,000 | | | 22,983,491 | |
0.18%, 4/7/11(a) | | | 50,000,000 | | | 49,961,295 | |
0.88%, 4/30/11 | | | 50,000,000 | | | 50,150,010 | |
1.00%, 8/31/11 | | | 50,000,000 | | | 50,274,442 | |
| | | | |
|
| |
| | | | | | 3,090,570,097 | |
| | | | |
|
| |
U.S. Treasury Notes – 5.1% | | | | | | | |
0.88%, 1/31/11 | | | 50,000,000 | | | 50,088,868 | |
5.00%, 2/15/11 | | | 18,299,000 | | | 18,550,905 | |
1.00%, 7/31/11 | | | 50,000,000 | | | 50,232,158 | |
1.00%, 9/30/11 | | | 50,000,000 | | | 50,324,008 | |
| | | | |
|
| |
| | | | | | 169,195,939 | |
| | | | |
|
| |
Total U.S. Treasury Obligations (COST $3,259,766,036) | | | | | | 3,259,766,036 | |
| | | | |
|
| |
TOTAL INVESTMENTS
(COST $3,259,766,036) — 99.2% | | | | | | 3,259,766,036 | |
| | | | |
|
| |
| | |
|
| Percentages indicated are based on net assets of $3,285,458,390. |
| |
(a) | Discount note. Rate presented represents the effective yield at time of purchase. |
| | |
29 | HSBC INVESTOR FAMILY OF FUNDS | See notes to financial statements |
(This Page Intentionally Left Blank)
|
HSBC INVESTOR FAMILY OF FUNDS |
|
Statements of Assets and Liabilities—as of October 31, 2010 |
| | | | | | | | | | |
| | California
Tax-Free
Money Market
Fund | | New York
Tax-Free
Money Market
Fund | | Prime
Money Market
Fund | |
|
|
|
|
|
|
|
|
Assets: | | | | | | | | | | |
Investments, at amortized cost | | $ | 50,191,787 | | $ | 500,523,958 | | $ | 7,079,132,281 | |
Repurchase agreements, at cost | | | — | | | — | | | 435,000,000 | |
| |
|
| |
|
| |
|
| |
Total Investments | | | 50,191,787 | | | 500,523,958 | | | 7,514,132,281 | |
| |
|
| |
|
| |
|
| |
Interest and dividends receivable | | | 28,415 | | | 310,803 | | | 3,288,569 | |
Receivable for capital shares issued | | | 391 | | | 12,828 | | | 336,568 | |
Receivable from Investment Manager | | | 3,766 | | | — | | | — | |
Prepaid expenses and other assets | | | 27,766 | | | 34,128 | | | 126,111 | |
| |
|
| |
|
| |
|
| |
Total Assets | | | 50,252,125 | | | 500,881,717 | | | 7,517,883,529 | |
| |
|
| |
|
| |
|
| |
Liabilities: | | | | | | | | | | |
Dividends payable | | | 2,062 | | | 16,468 | | | 644,724 | |
Payable for investments purchased | | | 261,695 | | | — | | | — | |
Accrued expenses and other liabilities: | | | | | | | | | | |
Investment Management | | | — | | | 54,935 | | | 848,203 | |
Administration | | | 970 | | | 17,622 | | | 277,025 | |
Distribution | | | — | | | — | | | 1,016 | |
Shareholder Servicing | | | — | | | 1 | | | 26,690 | |
Compliance Service | | | 1 | | | 188 | | | 374 | |
Transfer Agent | | | 5,474 | | | 6,030 | | | 22,832 | |
Trustee | | | 164 | | | 2,055 | | | 40,332 | |
Other | | | 4,694 | | | 28,930 | | | 384,174 | |
| |
|
| |
|
| |
|
| |
Total Liabilities | | | 275,060 | | | 126,229 | | | 2,245,370 | |
| |
|
| |
|
| |
|
| |
Net Assets | | $ | 49,977,065 | | $ | 500,755,488 | | $ | 7,515,638,159 | |
| |
|
| |
|
| |
|
| |
| | | | | | | | | | |
Composition of Net Assets: | | | | | | | | | | |
Capital | | $ | 49,978,648 | | $ | 500,755,486 | | $ | 7,515,834,588 | |
Accumulated net investment income (loss) | | | 1 | | | 2 | | | 3,880 | |
Accumulated net realized gains (losses) from investment transactions | | | (1,584 | ) | | — | | | (200,309 | ) |
| |
|
| |
|
| |
|
| |
Net Assets | | $ | 49,977,065 | | $ | 500,755,488 | | $ | 7,515,638,159 | |
| |
|
| |
|
| |
|
| |
| | | | | | | | | | |
Net Assets: | | | | | | | | | | |
Class A Shares | | $ | — | | $ | 14,564,327 | | $ | 32,943,319 | |
Class B Shares | | | — | | | — | | | 225,903 | |
Class C Shares | | | — | | | — | | | 44,024 | |
Class D Shares | | | 43,706,406 | | | 380,888,340 | | | 1,695,221,813 | |
Class I Shares | | | — | | | — | | | 4,679,632,396 | |
Class Y Shares | | | 6,270,659 | | | 105,302,821 | | | 1,107,570,704 | |
| |
|
| |
|
| |
|
| |
| | $ | 49,977,065 | | $ | 500,755,488 | | $ | 7,515,638,159 | |
| |
|
| |
|
| |
|
| |
| | | | | | | | | | |
Shares Outstanding | | | | | | | | | | |
($0.001 par value, unlimited number of shares authorized): | | | | | | | | | | |
Class A Shares | | | — | | | 14,562,877 | | | 32,943,334 | |
Class B Shares | | | — | | | — | | | 225,913 | |
Class C Shares | | | — | | | — | | | 44,024 | |
Class D Shares | | | 43,701,386 | | | 380,897,510 | | | 1,696,290,095 | |
Class I Share | | | — | | | — | | | 4,678,869,089 | |
Class Y Shares | | | 6,278,885 | | | 105,301,654 | | | 1,107,476,360 | |
Net Asset Value, Offering Price and Redemption Price per share:` | | | | | | | | | | |
Class A Shares | | $ | — | | $ | 1.00 | | $ | 1.00 | |
Class B Shares* | | $ | — | | $ | — | | $ | 1.00 | |
Class C Shares* | | $ | — | | $ | — | | $ | 1.00 | |
Class D Shares | | $ | 1.00 | | $ | 1.00 | | $ | 1.00 | |
Class I Shares | | $ | — | | $ | — | | $ | 1.00 | |
Class Y Shares | | $ | 1.00 | | $ | 1.00 | | $ | 1.00 | |
| |
|
| |
|
| |
|
| |
Total Investments, at amortized cost | | $ | 50,191,787 | | $ | 500,523,958 | | $ | 7,514,132,281 | |
| |
|
| |
|
| |
|
| |
| | |
| |
* | Redemption price per share varies by length of times shares are held. |
| | |
31 | HSBC INVESTOR FAMILY OF FUNDS | See notes to financial statements |
|
HSBC INVESTOR FAMILY OF FUNDS |
|
Statements of Assets and Liabilities—as of October 31, 2010 (continued) |
| | | | | | | | | | |
| | Tax-Free
Money Market
Fund | | U.S.
Government
Money Market
Fund | | U.S. Treasury
Money Market
Fund | |
|
|
|
|
|
|
|
|
Assets: | | | | | | | | | | |
Investments, at amortized cost | | $ | 100,564,722 | | $ | 5,026,246,734 | | $ | 3,259,766,036 | |
Repurchase agreements, at cost | | | — | | | 3,940,000,000 | | | — | |
| |
|
| |
|
| |
|
| |
Total Investments | | | 100,564,722 | | | 8,966,246,734 | | | 3,259,766,036 | |
| |
|
| |
|
| |
|
| |
Cash | | | — | | | 431,822 | | | 250,253 | |
Interest and dividends receivable | | | 154,392 | | | 3,225,668 | | | 967,902 | |
Receivable for capital shares issued | | | 760 | | | 302,116 | | | 17,826 | |
Receivable for investments sold | | | 5,490,000 | | | — | | | 25,000,000 | |
Prepaid expenses and other assets | | | 34,943 | | | 151,102 | | | 59,792 | |
| |
|
| |
|
| |
|
| |
Total Assets | | | 106,244,817 | | | 8,970,357,442 | | | 3,286,061,809 | |
| |
|
| |
|
| |
|
| |
Liabilities: | | | | | | | | | | |
Dividends payable | | | 2,443 | | | 460,695 | | | 29,046 | |
Payable for investments purchased | | | 1,049,280 | | | — | | | — | |
Accrued expenses and other liabilities: | | | | | | | | | | |
Investment Management | | | — | | | 1,160,957 | | | 283,588 | |
Administration | | | 4,123 | | | 341,936 | | | 89,134 | |
Distribution | | | 9 | | | — | | | — | |
Shareholder Servicing | | | 4,388 | | | — | | | — | |
Compliance Service | | | — | | | 856 | | | 269 | |
Transfer Agent | | | 6,155 | | | 23,446 | | | 11,379 | |
Trustee | | | 416 | | | 50,519 | | | 16,803 | |
Other | | | 10,137 | | | 557,912 | | | 173,200 | |
| |
|
| |
|
| |
|
| |
Total Liabilities | | | 1,076,951 | | | 2,596,321 | | | 603,419 | |
| |
|
| |
|
| |
|
| |
Net Assets | | $ | 105,167,866 | | $ | 8,967,761,121 | | $ | 3,285,458,390 | |
| |
|
| |
|
| |
|
| |
| | | | | | | | | | |
Composition of Net Assets: | | | | | | | | | | |
Capital | | $ | 105,166,087 | | $ | 8,967,941,133 | | $ | 3,285,414,807 | |
Accumulated net investment income (loss) | | | — | | | 501 | | | (295 | ) |
Accumulated net realized gains (losses) from investment transactions | | | 1,779 | | | (180,513 | ) | | 43,878 | |
| |
|
| |
|
| |
|
| |
Net Assets | | $ | 105,167,866 | | $ | 8,967,761,121 | | $ | 3,285,458,390 | |
| |
|
| |
|
| |
|
| |
| | | | | | | | | | |
Net Assets: | | | | | | | | | | |
Class A Shares | | $ | 255 | | $ | 25,926,096 | | $ | 32,972,729 | |
Class B Shares | | | — | | | 87,948 | | | 50,288 | |
Class C Shares | | | — | | | 3 | | | 41 | |
Class D Shares | | | 73,988,060 | | | 922,509,732 | | | 726,243,751 | |
Class I Shares | | | — | | | 5,100,890,781 | | | 1,379,041,779 | |
Class Y Shares | | | 31,179,551 | | | 2,918,346,561 | | | 1,147,149,802 | |
| |
|
| |
|
| |
|
| |
| | $ | 105,167,866 | | $ | 8,967,761,121 | | $ | 3,285,458,390 | |
| |
|
| |
|
| |
|
| |
| | | | | | | | | | |
Shares Outstanding | | | | | | | | | | |
($0.001 par value, unlimited number of shares authorized): | | | | | | | | | | |
Class A Shares | | | 255 | | | 25,926,086 | | | 33,002,681 | |
Class B Shares | | | — | | | 87,948 | | | 50,290 | |
Class C Shares | | | — | | | 3 | | | 41 | |
Class D Shares | | | 73,985,506 | | | 922,090,237 | | | 726,224,828 | |
Class I Share | | | — | | | 5,101,684,415 | | | 1,379,017,731 | |
Class Y Shares | | | 31,179,959 | | | 2,918,152,805 | | | 1,147,124,213 | |
Net Asset Value, Offering Price and Redemption Price per share: | | | | | | | | | | |
Class A Shares | | $ | 1.00 | | $ | 1.00 | | $ | 1.00 | |
Class B Shares* | | $ | — | | $ | 1.00 | | $ | 1.00 | |
Class C Shares* | | $ | — | | $ | 1.00 | | $ | 1.00 | |
Class D Shares | | $ | 1.00 | | $ | 1.00 | | $ | 1.00 | |
Class I Shares | | $ | 1.00 | | $ | 1.00 | | $ | 1.00 | |
Class Y Shares | | $ | 1.00 | | $ | 1.00 | | $ | 1.00 | |
| |
|
| |
|
| |
|
| |
Total Investments, at amortized cost | | $ | 100,564,722 | | $ | 8,966,246,734 | | $ | 3,259,766,036 | |
| |
|
| |
|
| |
|
| |
| | |
|
* | Redemption price per share varies by length of times shares are held. |
| | |
See notes to financial statements | HSBC INVESTOR FAMILY OF FUNDS | 32 |
|
HSBC INVESTOR FAMILY OF FUNDS |
|
Statements of Operations—For the year ended October 31, 2010 |
| | | | | | | | | | |
| | California
Tax-Free
Money Market
Fund | | New York
Tax-Free
Money Market
Fund | | Prime
Money Market
Fund | |
|
|
|
|
|
|
|
|
Investment Income: | | | | | | | | | | |
Interest | | $ | 188,485 | | $ | 1,449,083 | | $ | 30,665,921 | |
Dividends | | | 3,680 | | | 19,920 | | | 12,809 | |
Other Income (a) | | | 2,361 | | | 18,341 | | | 142,550 | |
| |
|
| |
|
| |
|
| |
Total Investment Income | | | 194,526 | | | 1,487,344 | | | 30,821,280 | |
| |
|
| |
|
| |
|
| |
| | | | | | | | | | |
Expenses: | | | | | | | | | | |
Investment Management | | | 74,308 | | | 611,985 | | | 9,998,487 | |
Advisory Services: | | | | | | | | | | |
Operational Support—Class A Shares | | | 233 | | | 18,669 | | | 286,069 | |
Operational Support—Class B Shares | | | — | | | 6 | | | 266 | |
Operational Support—Class C Shares | | | 7 | | | — | | | 212,457 | |
Operational Support—Class D Shares | | | 61,012 | | | 202,861 | | | 1,857,377 | |
Operational Support—Class Y Shares | | | 13,056 | | | 84,457 | | | 946,594 | |
Administration: | | | | | | | | | | |
Class A Shares | | | 79 | | | 15,017 | | | 115,543 | |
Class B Shares | | | — | | | 4 | | | 108 | |
Class C Shares | | | — | | | — | | | 85,811 | |
Class D Shares | | | 25,442 | | | 163,113 | | | 750,192 | |
Class I Shares | | | — | | | — | | | 2,704,395 | |
Class Y Shares | | | 4,132 | | | 67,499 | | | 382,328 | |
Distribution: | | | | | | | | | | |
Class B Shares | | | — | | | 84 | | | 1,998 | |
Class C Shares | | | — | | | — | | | 1,593,672 | |
Shareholder Servicing: | | | | | | | | | | |
Class A Shares | | | 788 | | | 149,261 | | | 1,144,574 | |
Class B Shares | | | — | | | 29 | | | 666 | |
Class C Shares | | | — | | | — | | | 531,146 | |
Class D Shares | | | 159,493 | | | 1,014,607 | | | 4,643,495 | |
Accounting | | | 69,776 | | | 76,015 | | | 80,580 | |
Compliance Service | | | 783 | | | 6,125 | | | 99,368 | |
Transfer Agent | | | 32,249 | | | 36,505 | | | 126,573 | |
Trustee | | | 2,394 | | | 21,358 | | | 330,503 | |
Registration fees | | | 46,141 | | | 55,132 | | | 124,107 | |
Other | | | 19,939 | | | 125,036 | | | 1,830,908 | |
| |
|
| |
|
| |
|
| |
Total expenses before fee reductions | | | 509,832 | | | 2,647,763 | | | 27,847,217 | |
Fees contractually reduced by Investment Adviser | | | (52,407 | ) | | — | | | — | |
Fees voluntarily reduced by Investment Adviser | | | (118,003 | ) | | (116,510 | ) | | (227,364 | ) |
Fees voluntarily reduced by Administrator | | | (3,777 | ) | | — | | | — | |
Fees voluntarily reduced by Distributer | | | — | | | (83 | ) | | (1,532,159 | ) |
Fees voluntarily reduced by Shareholder Servicing Agent | | | (153,393 | ) | | (1,157,494 | ) | | (5,664,470 | ) |
| |
|
| |
|
| |
|
| |
Net Expenses | | | 182,252 | | | 1,373,676 | | | 20,423,224 | |
| |
|
| |
|
| |
|
| |
| | | | | | | | | | |
Net Investment Income | | | 12,274 | | | 113,668 | | | 10,398,056 | |
| |
|
| |
|
| |
|
| |
| | | | | | | | | | |
Net realized gains (losses) from investments transactions | | | 1,341 | | | 56 | | | 173,883 | |
| |
|
| |
|
| |
|
| |
Change In Net Assets Resulting From Operations | | $ | 13,615 | | $ | 113,724 | | $ | 10,571,939 | |
| |
|
| |
|
| |
|
| |
| | |
|
(a) | See Note 7 in the Notes to Financial Statements. |
| | |
33 | HSBC INVESTOR FAMILY OF FUNDS | See notes to financial statements |
|
HSBC INVESTOR FAMILY OF FUNDS |
|
Statements of Operations—For the year ended October 31, 2010 (continued) |
| | | | | | | | | | |
| | Tax-Free
Money Market
Fund | | U.S.
Government
Money Market
Fund | | U.S. Treasury
Money Market
Fund | |
|
|
|
|
|
|
|
|
Investment Income: | | | | | | | | | | |
Interest | | $ | 387,719 | | $ | 26,745,165 | | $ | 6,296,260 | |
Dividends | | | 5,971 | | | — | | | — | |
Other Income (a) | | | 106 | | | 74,497 | | | 7,886 | |
| |
|
| |
|
| |
|
| |
Total Investment Income | | | 393,796 | | | 26,819,662 | | | 6,304,146 | |
| |
|
| |
|
| |
|
| |
| | | | | | | | | | |
Expenses: | | | | | | | | | | |
Investment Management | | | 143,787 | | | 11,394,800 | | | 4,352,018 | |
Advisory Services: | | | | | | | | | | |
Operational Support—Class A Shares | | | — | | | 579,460 | | | 291,340 | |
Operational Support—Class B Shares | | | — | | | 97 | | | 55 | |
Operational Support—Class C Shares | | | — | | | 488 | | | 6,202 | |
Operational Support—Class D Shares | | | 84,405 | | | 680,112 | | | 824,884 | |
Operational Support—Class Y Shares | | | 59,146 | | | 3,383,856 | | | 975,434 | |
Operational Support—Class I Shares | | | 235 | | | — | | | — | |
Administration: | | | | | | | | | | |
Class A Shares | | | — | | | 233,959 | | | 116,707 | |
Class B Shares | | | — | | | 39 | | | 22 | |
Class C Shares | | | — | | | 197 | | | 2,484 | |
Class D Shares | | | 33,992 | | | 274,886 | | | 330,761 | |
Class I Shares | | | 95 | | | 2,727,200 | | | 903,552 | |
Class Y Shares | | | 23,820 | | | 1,367,141 | | | 391,265 | |
Distribution: | | | | | | | | | | |
Class B Shares | | | — | | | 725 | | | 414 | |
Class C Shares | | | — | | | 3,660 | | | 46,514 | |
Shareholder Servicing: | | | | | | | | | | |
Class A Shares | | | — | | | 2,317,855 | | | 1,165,373 | |
Class B Shares | | | — | | | 241 | | | 138 | |
Class C Shares | | | — | | | 1,221 | | | 15,505 | |
Class D Shares | | | 209,818 | | | 1,699,870 | | | 2,062,225 | |
Accounting | | | 78,119 | | | 70,941 | | | 66,760 | |
Compliance Service | | | 1,467 | | | 113,719 | | | 50,055 | |
Transfer Agent | | | 35,548 | | | 116,396 | | | 66,129 | |
Trustee | | | 4,685 | | | 400,340 | | | 152,191 | |
Registration fees | | | 64,602 | | | 444,615 | | | 124,749 | |
Other | | | 30,212 | | | 1,876,141 | | | 815,491 | |
| |
|
| |
|
| |
|
| |
Total expenses before fee reductions | | | 769,931 | | | 27,687,959 | | | 12,760,268 | |
Fees contractually reduced by Investment Adviser | | | — | | | — | | | — | |
Fees voluntarily reduced by Investment Adviser | | | (288,207 | ) | | (1,967,036 | ) | | (3,172,813 | ) |
Fees voluntarily reduced by Administrator | | | — | | | (220,960 | ) | | (447,510 | ) |
Fees voluntarily reduced by Distributer | | | — | | | (4,385 | ) | | (46,928 | ) |
Fees voluntarily reduced by Shareholder Servicing Agent | | | (150,045 | ) | | (4,019,187 | ) | | (3,243,241 | ) |
| |
|
| |
|
| |
|
| |
Net Expenses | | | 331,679 | | | 21,476,391 | | | 5,849,776 | |
| |
|
| |
|
| |
|
| |
| | | | | | | | | | |
Net Investment Income | | | 62,117 | | | 5,343,271 | | | 454,370 | |
| |
|
| |
|
| |
|
| |
| | | | | | | | | | |
Net realized gains (losses) from investments transactions | | | 1,779 | | | (180,513 | ) | | 119,371 | |
| |
|
| |
|
| |
|
| |
Change In Net Assets Resulting From Operations | | $ | 63,896 | | $ | 5,162,758 | | $ | 573,741 | |
| |
|
| |
|
| |
|
| |
| | |
|
(a) | See Note 7 in the Notes to Financial Statements. |
| | |
See notes to financial statements | HSBC INVESTOR FAMILY OF FUNDS | 34 |
|
HSBC INVESTOR FAMILY OF FUNDS |
|
Statements of Changes in Net Assets |
All capital share transactions have been processed at a net asset value of $1.00 per share.
| | | | | | | | | | | | | |
| | California Tax-Free
Money Market Fund | | New York Tax-Free
Money Market Fund | |
|
|
|
|
|
|
| | For the
year ended
October 31, 2010 | | For the
year ended
October 31, 2009 | | For the
year ended
October 31, 2010 | | For the
year ended
October 31, 2009 | |
|
|
|
|
|
|
|
|
|
|
Investment Activities: | | | | | | | | | | | | | |
Operations: | | | | | | | | | | | | | |
Net investment income | | $ | 12,274 | | $ | 122,215 | | $ | 113,668 | | $ | 2,953,560 | |
Net realized gains (losses) from investments transactions | | | 1,341 | | | (1 | ) | | 56 | | | — | |
| |
|
| |
|
| |
|
| |
|
| |
Change in net assets resulting from operations | | | 13,615 | | | 122,214 | | | 113,724 | | | 2,953,560 | |
| |
|
| |
|
| |
|
| |
|
| |
| | | | | | | | | | | | | |
Dividends: | | | | | | | | | | | | | |
Net investment income: | | | | | | | | | | | | | |
Class A Shares | | | (25 | ) | | (259 | ) | | (5,363 | ) | | (81,076 | ) |
Class B Shares | | | — | | | — | | | (2 | ) | | (24 | ) |
Class C Shares | | | — | | | (4 | ) | | — | | | — | |
Class D Shares | | | (9,928 | ) | | (84,480 | ) | | (60,651 | ) | | (1,436,276 | ) |
Class Y Shares | | | (2,356 | ) | | (37,436 | ) | | (34,303 | ) | | (1,456,061 | ) |
Net realized gains: | | | | | | | | | | | | | |
Class A Shares | | | — | | | — | | | — | | | (383 | ) |
Class D Shares | | | — | | | — | | | — | | | (4,864 | ) |
Class Y Shares | | | — | | | — | | | — | | | (2,970 | ) |
| |
|
| |
|
| |
|
| |
|
| |
Change in net assets resulting from shareholder dividends | | | (12,309 | ) | | (122,179 | ) | | (100,319 | ) | | (2,981,654 | ) |
| |
|
| |
|
| |
|
| |
|
| |
Change in net assets resulting from capital transactions | | | (86,491,845 | ) | | 26,601,526 | | | (173,745,143 | ) | | (277,897,541 | ) |
| |
|
| |
|
| |
|
| |
|
| |
Change in net assets | | | (86,490,539 | ) | | 26,601,561 | | | (173,731,738 | ) | | (277,925,635 | ) |
| |
|
| |
|
| |
|
| |
|
| |
| | | | | | | | | | | | | |
Net Assets: | | | | | | | | | | | | | |
Beginning of period | | | 136,467,604 | | | 109,866,043 | | | 674,487,226 | | | 952,412,861 | |
| |
|
| |
|
| |
|
| |
|
| |
End of period | | $ | 49,977,065 | | $ | 136,467,604 | | $ | 500,755,488 | | $ | 674,487,226 | |
| |
|
| |
|
| |
|
| |
|
| |
Accumulated net investment income (loss) | | $ | 1 | | $ | 36 | | $ | 2 | | $ | (13,403 | ) |
| |
|
| |
|
| |
|
| |
|
| |
| | |
35 | HSBC INVESTOR FAMILY OF FUNDS | See notes to financial statements |
|
HSBC INVESTOR FAMILY OF FUNDS |
|
Statements of Changes in Net Assets (continued) |
All capital share transactions have been processed at a net asset value of $1.00 per share. |
| | | | | | | | | | | | | |
| | California Tax-Free
Money Market Fund | | New York Tax-Free
Money Market Fund | |
|
|
|
|
|
|
| | For the
year ended
October 31, 2010 | | For the
year ended
October 31, 2009 | | For the
year ended
October 31, 2010 | | For the
year ended
October 31, 2009 | |
|
|
|
|
|
|
|
|
|
|
CAPITAL TRANSACTIONS: | | | | | | | | | | | | | |
Class A Shares: | | | | | | | | | | | | | |
Proceeds from shares issued | | $ | 23,640 | | $ | 335,984 | | $ | 111,048,691 | | $ | 114,978,329 | |
Dividends reinvested | | | 25 | | | 259 | | | 5,240 | | | 80,082 | |
Value of shares redeemed | | | (244,908 | ) | | (557,023 | ) | | (137,188,421 | ) | | (120,149,734 | ) |
| |
|
| |
|
| |
|
| |
|
| |
Class A Shares capital transactions | | | (221,243 | ) | | (220,780 | ) | | (26,134,490 | ) | | (5,091,323 | ) |
| |
|
| |
|
| |
|
| |
|
| |
| | | | | | | | | | | | | |
Class B Shares: | | | | | | | | | | | | | |
Dividends reinvested | | | — | | | — | | | 3 | | | 24 | |
Value of shares redeemed | | | — | | | — | | | (21,410 | ) | | (13,219 | ) |
| |
|
| |
|
| |
|
| |
|
| |
Class B Shares capital transactions | | | — | | | — | | | (21,407 | ) | | (13,195 | ) |
| |
|
| |
|
| |
|
| |
|
| |
| | | | | | | | | | | | | |
Class C Shares: | | | | | | | | | | | | | |
Proceeds from shares issued | | | — | | | 27,562 | | | — | | | (1 | ) |
Dividends reinvested | | | — | | | 4 | | | — | | | — | |
Value of shares redeemed | | | — | | | (27,566 | ) | | — | | | — | |
| |
|
| |
|
| |
|
| |
|
| |
Class C Shares capital transactions | | | — | | | — | | | — | | | (1 | ) |
| |
|
| |
|
| |
|
| |
|
| |
| | | | | | | | | | | | | |
Class D Shares: | | | | | | | | | | | | | |
Proceeds from shares issued | | | 298,554,850 | | | 301,424,257 | | | 1,332,291,987 | | | 1,091,358,577 | |
Dividends reinvested | | | 2,059 | | | 37,909 | | | 42,926 | | | 1,144,944 | |
Value of shares redeemed | | | (370,011,038 | ) | | (269,564,034 | ) | | (1,374,515,160 | ) | | (1,256,216,848 | ) |
| |
|
| |
|
| |
|
| |
|
| |
Class D Shares capital transactions | | | (71,454,129 | ) | | 31,898,132 | | | (42,180,247 | ) | | (163,713,327 | ) |
| |
|
| |
|
| |
|
| |
|
| |
| | | | | | | | | | | | | |
Class Y Shares: | | | | | | | | | | | | | |
Proceeds from shares issued | | | 74,714,245 | | | 169,462,249 | | | 940,911,426 | | | 1,093,831,944 | |
Dividends reinvested | | | 676 | | | 5,257 | | | 26,949 | | | 1,158,964 | |
Value of shares redeemed | | | (89,531,394 | ) | | (174,543,332 | ) | | (1,046,347,374 | ) | | (1,204,070,603 | ) |
| |
|
| |
|
| |
|
| |
|
| |
Class Y Shares capital transactions | | | (14,816,473 | ) | | (5,075,826 | ) | | (105,408,999 | ) | | (109,079,695 | ) |
| |
|
| |
|
| |
|
| |
|
| |
Change in net assets resulting from capital transactions | | $ | (86,491,845 | ) | $ | 26,601,526 | | $ | (173,745,143 | ) | $ | (277,897,541 | ) |
| |
|
| |
|
| |
|
| |
|
| |
| | |
See notes to financial statements | HSBC INVESTOR FAMILY OF FUNDS | 36 |
|
HSBC INVESTOR FAMILY OF FUNDS |
|
Statements of Changes in Net Assets (continued) |
All capital share transactions have been processed at a net asset value of $1.00 per share. |
| | | | | | | | | | | | | |
| | Prime
Money Market Fund | | Tax-Free
Money Market Fund | |
|
|
|
|
|
|
| | For the
year ended
October 31, 2010 | | For the
year ended
October 31, 2009 | | For the
year ended
October 31, 2010 | | For the
year ended
October 31, 2009 | |
|
|
|
|
|
|
|
|
|
|
Investment Activities: | | | | | | | | | | | | | |
Operations: | | | | | | | | | | | | | |
Net investment income | | $ | 10,398,056 | | $ | 57,327,100 | | $ | 62,117 | | $ | 1,035,726 | |
Net realized gains (losses) from investment transactions | | | 173,883 | | | 3,584,834 | | | 1,779 | | | 2 | |
| |
|
| |
|
| |
|
| |
|
| |
Change in net assets resulting from operations | | | 10,571,939 | | | 60,911,934 | | | 63,896 | | | 1,035,728 | |
| |
|
| |
|
| |
|
| |
|
| |
| | | | | | | | | | | | | |
Dividends: | | | | | | | | | | | | | |
Net investment income: | | | | | | | | | | | | | |
Class A Shares | | | (37,692 | ) | | (1,016,162 | ) | | — | | | — | |
Class B Shares | | | (35 | ) | | (503 | ) | | — | | | — | |
Class C Shares | | | (27,814 | ) | | (518,642 | ) | | — | | | — | |
Class D Shares | | | (245,543 | ) | | (10,530,148 | ) | | (9,826 | ) | | (276,495 | ) |
Class I Shares | | | (9,643,060 | ) | | (36,107,949 | ) | | (217 | ) | | — | |
Class Y Shares | | | (404,937 | ) | | (9,188,251 | ) | | (52,124 | ) | | (759,183 | ) |
Net realized gains: | | | | | | | | | | | | | |
Class D Shares | | | — | | | — | | | — | | | (278 | ) |
Class Y Shares | | | — | | | — | | | — | | | (438 | ) |
| |
|
| |
|
| |
|
| |
|
| |
Change in net assets resulting from shareholder dividends | | | (10,359,081 | ) | | (57,361,655 | ) | | (62,167 | ) | | (1,036,394 | ) |
| |
|
| |
|
| |
|
| |
|
| |
|
Change in net assets resulting from capital transactions | | | (3,466,257,144 | ) | | 2,440,883,353 | | | (87,973,151 | ) | | (20,377,067 | ) |
| |
|
| |
|
| |
|
| |
|
| |
Change in net assets | | | (3,466,044,286 | ) | | 2,444,433,632 | | | (87,971,422 | ) | | (20,377,733 | ) |
| |
|
| |
|
| |
|
| |
|
| |
| | | | | | | | | | | | | |
Net Assets: | | | | | | | | | | | | | |
Beginning of period | | | 10,981,682,445 | | | 8,537,248,813 | | | 193,139,288 | | | 213,517,021 | |
| |
|
| |
|
| |
|
| |
|
| |
End of period | | $ | 7,515,638,159 | | $ | 10,981,682,445 | | $ | 105,167,866 | | $ | 193,139,288 | |
| |
|
| |
|
| |
|
| |
|
| |
Accumulated net investment income (loss) | | $ | 3,880 | | $ | (35,094 | ) | $ | — | | $ | 50 | |
| |
|
| |
|
| |
|
| |
|
| |
| | |
37 | HSBC INVESTOR FAMILY OF FUNDS | See notes to financial statements |
|
HSBC INVESTOR FAMILY OF FUNDS |
|
Statements of Changes in Net Assets (continued) |
All capital share transactions have been processed at a net asset value of $1.00 per share. |
| | | | | | | | | | | | | |
| | Prime
Money Market Fund | | Tax-Free
Money Market Fund | |
|
|
|
|
|
|
| | For the
year ended
October 31, 2010 | | For the
year ended
October 31, 2009 | | For the
year ended
October 31, 2010 | | For the
year ended
October 31, 2009 | |
|
|
|
|
|
|
|
|
|
|
CAPITAL TRANSACTIONS: | | | | | | | | | | | | | |
Class A Shares: | | | | | | | | | | | | | |
Proceeds from shares issued | | $ | 704,054,090 | | $ | 809,840,157 | | $ | — | | $ | 255 | |
Dividends reinvested | | | 31,907 | | | 883,282 | | | — | | | — | |
Value of shares redeemed | | | (1,014,520,313 | ) | | (776,080,491 | ) | | — | | | — | |
| |
|
| |
|
| |
|
| |
|
| |
Class A Shares capital transactions | | | (310,434,316 | ) | | 34,642,948 | | | — | | | 255 | |
| |
|
| |
|
| |
|
| |
|
| |
| | | | | | | | | | | | | |
Class B Shares: | | | | | | | | | | | | | |
Proceeds from shares issued | | | — | | | 278,962 | | | — | | | — | |
Dividends reinvested | | | 28 | | | 418 | | | — | | | — | |
Value of shares redeemed | | | (86,464 | ) | | (165,781 | ) | | — | | | — | |
| |
|
| |
|
| |
|
| |
|
| |
Class B Shares capital transactions | | | (86,436 | ) | | 113,599 | | | — | | | — | |
| |
|
| |
|
| |
|
| |
|
| |
| | | | | | | | | | | | | |
Class C Shares: | | | | | | | | | | | | | |
Proceeds from shares issued | | | 620,820,913 | | | 770,195,894 | | | — | | | — | |
Dividends reinvested | | | 27,818 | | | 518,642 | | | — | | | — | |
Value of shares redeemed | | | (880,191,343 | ) | | (828,248,859 | ) | | — | | | — | |
| |
|
| |
|
| |
|
| |
|
| |
Class C Shares capital transactions | | | (259,342,612 | ) | | (57,534,323 | ) | | — | | | — | |
| |
|
| |
|
| |
|
| |
|
| |
| | | | | | | | | | | | | |
Class D Shares: | | | | | | | | | | | | | |
Proceeds from shares issued | | | 8,128,496,115 | | | 7,709,199,164 | | | 180,284,942 | | | 275,263,759 | |
Dividends reinvested | | | 181,847 | | | 7,863,842 | | | 2,620 | | | 76,274 | |
Value of shares redeemed | | | (8,427,865,849 | ) | | (8,444,300,576 | ) | | (201,650,799 | ) | | (249,776,390 | ) |
| |
|
| |
|
| |
|
| |
|
| |
Class D Shares capital transactions | | | (299,187,887 | ) | | (727,237,570 | ) | | (21,363,237 | ) | | 25,563,643 | |
| |
|
| |
|
| |
|
| |
|
| |
| | | | | | | | | | | | | |
Class I Shares: | | | | | | | | | | | | | |
Proceeds from shares issued | | | 50,013,243,325 | | | 58,493,552,982 | | | 2,283,761 | | | — | |
Dividends reinvested | | | 5,017,364 | | | 20,360,616 | | | 213 | | | — | |
Value of shares redeemed | | | (52,528,387,645 | ) | | (54,280,103,881 | ) | | (2,283,974 | ) | | — | |
| |
|
| |
|
| |
|
| |
|
| |
Class I Shares capital transactions | | | (2,510,126,956 | ) | | 4,233,809,717 | | | — | | | — | |
| |
|
| |
|
| |
|
| |
|
| |
| | | | | | | | | | | | | |
Class Y Shares: | | | | | | | | | | | | | |
Proceeds from shares issued | | | 3,338,297,449 | | | 5,861,067,626 | | | 278,127,720 | | | 306,605,386 | |
Dividends reinvested | | | 365,355 | | | 6,952,852 | | | 28,563 | | | 395,490 | |
Value of shares redeemed | | | (3,425,741,741 | ) | | (6,910,931,496 | ) | | (344,766,197 | ) | | (352,941,841 | ) |
| |
|
| |
|
| |
|
| |
|
| |
Class Y Shares capital transactions | | | (87,078,937 | ) | | (1,042,911,018 | ) | | (66,609,914 | ) | | (45,940,965 | ) |
| |
|
| |
|
| |
|
| |
|
| |
Change in net assets resulting from capital transactions | | $ | (3,466,257,144 | ) | $ | 2,440,883,353 | | $ | (87,973,151 | ) | $ | (20,377,067 | ) |
| |
|
| |
|
| |
|
| |
|
| |
| | |
See notes to financial statements | HSBC INVESTOR FAMILY OF FUNDS | 38 |
|
HSBC INVESTOR FAMILY OF FUNDS |
|
Statements of Changes in Net Assets (continued) |
All capital share transactions have been processed at a net asset value of $1.00 per share. |
| | | | | | | | | | | | | |
| | U.S. Government
Money Market Fund | | U.S. Treasury
Money Market Fund | |
|
|
|
|
|
|
| | For the
year ended
October 31, 2010 | | For the
year ended
October 31, 2009 | | For the
year ended
October 31, 2010 | | For the
year ended
October 31, 2009 | |
|
|
|
|
|
|
|
|
|
|
Investment Activities: | | | | | | | | | | | | | |
Operations: | | | | | | | | | | | | | |
Net investment income | | $ | 5,343,271 | | $ | 44,639,755 | | $ | 454,370 | | $ | 7,282,425 | |
Net realized gains (losses) from investments transactions | | | (180,513 | ) | | 1,358,500 | | | 119,371 | | | 240,063 | |
| |
|
| |
|
| |
|
| |
|
| |
Change in net assets resulting from operations | | | 5,162,758 | | | 45,998,255 | | | 573,741 | | | 7,522,488 | |
| |
|
| |
|
| |
|
| |
|
| |
| | | | | | | | | | | | | |
Dividends: | | | | | | | | | | | | | |
Net investment income: | | | | | | | | | | | | | |
Class A Shares | | | (63,587 | ) | | (875,403 | ) | | (29,639 | ) | | (304,735 | ) |
Class B Shares | | | (11 | ) | | (55 | ) | | (5 | ) | | (84 | ) |
Class C Shares | | | (54 | ) | | (131 | ) | | (629 | ) | | (2,223 | ) |
Class D Shares | | | (73,725 | ) | | (2,261,113 | ) | | (84,195 | ) | | (689,245 | ) |
Class I Shares | | | (4,841,080 | ) | | (27,006,162 | ) | | (244,902 | ) | | (5,451,587 | ) |
Class Y Shares | | | (368,370 | ) | | (14,492,834 | ) | | (99,540 | ) | | (829,704 | ) |
Net realized gains: | | | | | | | | | | | | | |
Class A Shares | | | (71,214 | ) | | (43,041 | ) | | — | | | (20,098 | ) |
Class B Shares | | | (11 | ) | | (6 | ) | | — | | | (7 | ) |
Class C Shares | | | (54 | ) | | (13 | ) | | — | | | (173 | ) |
Class D Shares | | | (75,519 | ) | | (70,176 | ) | | — | | | (53,316 | ) |
Class I Shares | | | (799,823 | ) | | (429,417 | ) | | — | | | (166,785 | ) |
Class Y Shares | | | (411,878 | ) | | (307,699 | ) | | — | | | (41,513 | ) |
| |
|
| |
|
| |
|
| |
|
| |
Change in net assets resulting from shareholder dividends | | | (6,705,326 | ) | | (45,486,050 | ) | | (458,910 | ) | | (7,559,470 | ) |
| |
|
| |
|
| |
|
| |
|
| |
| | | | | | | | | | | | | |
Change in net assets resulting from capital transactions | | | (3,920,417,253 | ) | | (909,500,912 | ) | | (2,382,770,496 | ) | | (987,019,574 | ) |
| |
|
| |
|
| |
|
| |
|
| |
Change in net assets | | | (3,921,959,821 | ) | | (908,988,707 | ) | | (2,382,655,665 | ) | | (987,056,556 | ) |
| |
|
| |
|
| |
|
| |
|
| |
| | | | | | | | | | | | | |
Net Assets: | | | | | | | | | | | �� | | |
Beginning of period | | | 12,889,720,942 | | | 13,798,709,649 | | | 5,668,114,055 | | | 6,655,170,611 | |
| |
|
| |
|
| |
|
| |
|
| |
End of period | | $ | 8,967,761,121 | | $ | 12,889,720,942 | | $ | 3,285,458,390 | | $ | 5,668,114,055 | |
| |
|
| |
|
| |
|
| |
|
| |
Accumulated net investment income (loss) | | $ | 501 | | $ | 4,056 | | $ | (295 | ) | $ | 4,245 | |
| |
|
| |
|
| |
|
| |
|
| |
| | |
39 | HSBC INVESTOR FAMILY OF FUNDS | See notes to financial statements |
|
HSBC INVESTOR FAMILY OF FUNDS |
|
Statements of Changes in Net Assets (continued) |
All capital share transactions have been processed at a net asset value of $1.00 per share. |
| | | | | | | | | | | | | |
| | U.S. Government
Money Market Fund | | U.S. Treasury
Money Market Fund | |
|
|
|
|
|
|
| | For the
year ended
October 31, 2010 | | For the
year ended
October 31, 2009 | | For the
year ended
October 31, 2010 | | For the
year ended
October 31, 2009 | |
|
|
|
|
|
|
|
|
|
|
CAPITAL TRANSACTIONS: | | | | | | | | | | | | | |
Class A Shares: | | | | | | | | | | | | | |
Proceeds from shares issued | | $ | 1,992,806,692 | | $ | 2,080,944,837 | | $ | 586,562,316 | | $ | 1,023,071,534 | |
Dividends reinvested | | | 132,537 | | | 913,749 | | | 29,586 | | | 322,146 | |
Value of shares redeemed | | | (2,541,124,265 | ) | | (2,211,025,475 | ) | | (939,620,546 | ) | | (1,217,854,944 | ) |
| |
|
| |
|
| |
|
| |
|
| |
Class A Shares capital transactions | | | (548,185,036 | ) | | (129,166,889 | ) | | (353,028,644 | ) | | (194,461,264 | ) |
| |
|
| |
|
| |
|
| |
|
| |
| | | | | | | | | | | | | |
Class B Shares: | | | | | | | | | | | | | |
Proceeds from shares issued | | | 57,962 | | | 38,074 | | | — | | | 53,702 | |
Dividends reinvested | | | 22 | | | 61 | | | 5 | | | 90 | |
Value of shares redeemed | | | (53,916 | ) | | (8,130 | ) | | (9,405 | ) | | (125,494 | ) |
| |
|
| |
|
| |
|
| |
|
| |
Class B Shares capital transactions | | | 4,068 | | | 30,005 | | | (9,400 | ) | | (71,702 | ) |
| |
|
| |
|
| |
|
| |
|
| |
| | | | | | | | | | | | | |
Class C Shares: | | | | | | | | | | | | | |
Proceeds from shares issued | | | 4,343,429 | | | 5,857,186 | | | 19,052,998 | | | 17,236,521 | |
Dividends reinvested | | | 108 | | | 144 | | | 628 | | | 2,396 | |
Value of shares redeemed | | | (4,572,877 | ) | | (5,728,598 | ) | | (26,191,953 | ) | | (11,203,400 | ) |
| |
|
| |
|
| |
|
| |
|
| |
Class C Shares capital transactions | | | (229,340 | ) | | 128,732 | | | (7,138,327 | ) | | 6,035,517 | |
| |
|
| |
|
| |
|
| |
|
| |
| | | | | | | | | | | | | |
Class D Shares: | | | | | | | | | | | | | |
Proceeds from shares issued | | | 2,372,133,864 | | | 4,052,413,546 | | | 2,661,745,254 | | | 2,696,084,524 | |
Dividends reinvested | | | 81,037 | | | 837,509 | | | 51,719 | | | 450,754 | |
Value of shares redeemed | | | (2,217,260,103 | ) | | (4,724,014,727 | ) | | (2,891,227,047 | ) | | (2,678,774,334 | ) |
| |
|
| |
|
| |
|
| |
|
| |
Class D Shares capital transactions | | | 154,954,798 | | | (670,763,672 | ) | | (229,430,074 | ) | | 17,760,944 | |
| |
|
| |
|
| |
|
| |
|
| |
| | | | | | | | | | | | | |
Class I Shares: | | | | | | | | | | | | | |
Proceeds from shares issued | | | 43,584,385,177 | | | 41,618,275,191 | | | 11,036,153,561 | | | 14,180,222,732 | |
Dividends reinvested | | | 3,450,663 | | | 20,612,947 | | | 126,402 | | | 3,671,466 | |
Value of shares redeemed | | | (46,662,995,313 | ) | | (38,370,813,811 | ) | | (12,980,257,849 | ) | | (14,632,179,986 | ) |
| |
|
| |
|
| |
|
| |
|
| |
Class I Shares capital transactions | | | (3,075,159,473 | ) | | 3,268,074,327 | | | (1,943,977,886 | ) | | (448,285,788 | ) |
| |
|
| |
|
| |
|
| |
|
| |
| | | | | | | | | | | | | |
Class Y Shares: | | | | | | | | | | | | | |
Proceeds from shares issued | | | 30,977,630,926 | | | 29,490,401,988 | | | 3,333,793,931 | | | 4,032,151,030 | |
Dividends reinvested | | | 759,275 | | | 14,679,200 | | | 94,774 | | | 813,514 | |
Value of shares redeemed | | | (31,430,192,471 | ) | | (32,882,884,603 | ) | | (3,183,074,870 | ) | | (4,400,961,825 | ) |
| |
|
| |
|
| |
|
| |
|
| |
Class Y Shares capital transactions | | | (451,802,270 | ) | | (3,377,803,415 | ) | | 150,813,835 | | | (367,997,281 | ) |
| |
|
| |
|
| |
|
| |
|
| |
Change in net assets resulting from capital transactions | | $ | (3,920,417,253 | ) | $ | (909,500,912 | ) | $ | (2,382,770,496 | ) | $ | (987,019,574 | ) |
| |
|
| |
|
| |
|
| |
|
| |
| | |
See notes to financial statements | HSBC INVESTOR FAMILY OF FUNDS | 40 |
|
HSBC INVESTOR CALIFORNIA TAX-FREE MONEY MARKET FUND |
|
Financial Highlights |
Selected data for a share outstanding throughout the periods indicated.
| | | | | | | | | | | | | | | | | | | | | | �� | | | | |
| | | | | Investment Activities | | Dividends | | | | |
| | | | |
| |
| | | | |
| | Net Asset
Value,
Beginning
of Period | | Net
Investment
Income (Loss) | | Net Realized
Gains (Losses)
from
Investment
Transactions | | Total from
Investment
Activities | | Net
Investment
Income | | Total
Dividends | | Net Asset
Value, End
of Period | |
|
|
|
|
|
|
|
|
|
|
|
|
|
|
|
|
CLASS A SHARES | | | | | | | | | | | | | | | | | | | | | | | | | | |
Period Ended October 31, 2007(d) | | | $ | 1.00 | | | — | * | | — | | | — | * | | — | * | | — | * | | | $ | 1.00 | | |
Year Ended October 31, 2008(e) | | | | 1.00 | | | 0.01 | | | — | | | 0.01 | | | (0.01 | ) | | (0.01 | ) | | | | 1.00 | | |
Year Ended October 31, 2009 | | | | 1.00 | | | — | * | | — | * | | — | * | | — | * | | — | * | | | | 1.00 | | |
Year Ended October 31, 2010(g) | | | | 1.00 | | | — | * | | — | * | | — | * | | — | * | | — | * | | | | 1.00 | | |
|
|
|
|
|
|
|
|
|
|
|
|
|
|
|
|
|
|
|
|
|
|
|
|
|
|
|
CLASS C SHARES | | | | | | | | | | | | | | | | | | | | | | | | | | |
Period Ended October 31, 2007(h) | | | $ | 1.00 | | | 0.01 | | | — | | | 0.01 | | | (0.01 | ) | | (0.01 | ) | | | $ | 1.00 | | |
Year Ended October 31, 2008(i) | | | | 1.00 | | | 0.01 | | | — | | | 0.01 | | | (0.01 | ) | | (0.01 | ) | | | | 1.00 | | |
Year Ended October 31, 2009(j) | | | | 1.00 | | | — | * | | — | * | | — | * | | — | * | | — | * | | | | 1.00 | | |
Year Ended October 31, 2010(k) | | | | 1.00 | | | — | | | — | | | — | | | — | | | — | | | | | 1.00 | | |
|
|
|
|
|
|
|
|
|
|
|
|
|
|
|
|
|
|
|
|
|
|
|
|
|
|
|
CLASS D SHARES | | | | | | | | | | | | | | | | | | | | | | | | | | |
Year Ended October 31, 2006 | | | $ | 1.00 | | | 0.03 | | | — | | | 0.03 | | | (0.03 | ) | | (0.03 | ) | | | $ | 1.00 | | |
Year Ended October 31, 2007 | | | | 1.00 | | | 0.03 | | | — | | | 0.03 | | | (0.03 | ) | | (0.03 | ) | | | | 1.00 | | |
Year Ended October 31, 2008 | | | | 1.00 | | | 0.02 | | | — | | | 0.02 | | | (0.02 | ) | | (0.02 | ) | | | | 1.00 | | |
Year Ended October 31, 2009 | | | | 1.00 | | | — | * | | — | * | | — | * | | — | * | | — | * | | | | 1.00 | | |
Year Ended October 31, 2010 | | | | 1.00 | | | — | * | | — | * | | — | * | | — | * | | — | * | | | | 1.00 | | |
|
|
|
|
|
|
|
|
|
|
|
|
|
|
|
|
|
|
|
|
|
|
|
|
|
|
|
CLASS Y SHARES | | | | | | | | | | | | | | | | | | | | | | | | | | |
Year Ended October 31, 2006 | | | $ | 1.00 | | | 0.03 | | | — | | | 0.03 | | | (0.03 | ) | | (0.03 | ) | | | $ | 1.00 | | |
Year Ended October 31, 2007 | | | | 1.00 | | | 0.03 | | | — | | | 0.03 | | | (0.03 | ) | | (0.03 | ) | | | | 1.00 | | |
Year Ended October 31, 2008 | | | | 1.00 | | | 0.02 | | | — | | | 0.02 | | | (0.02 | ) | | (0.02 | ) | | | | 1.00 | | |
Year Ended October 31, 2009 | | | | 1.00 | | | — | * | | — | * | | — | * | | — | * | | — | * | | | | 1.00 | | |
Year Ended October 31, 2010 | | | | 1.00 | | | — | * | | — | * | | — | * | | — | * | | — | * | | | | 1.00 | | |
|
|
|
|
|
|
|
|
|
|
|
|
|
|
|
|
|
|
|
|
|
|
|
|
|
|
|
| | | | | | | | | | | | | | | | | | |
| | | | | Ratios/Supplementary Data | |
| | | | |
| |
| | Total
Return(a) | | Net Assets
at End of
Period
(000’s) | | Ratio of Net
Expenses to
Average Net
Assets(b) | | Ratio of Net
Investment
Income (Loss)
to Average
Net Assets(b) | | Ratio of
Expenses to
Average Net
Assets(b)(c) | |
|
|
|
|
|
|
|
|
|
|
|
|
CLASS A SHARES | | | | | | | | | | | | | | | | | | |
Period Ended October 31, 2007(d) | | 0.00 | % | | | $ | — | | | 0.72 | % | | 2.71 | % | | 0.87 | % | |
Year Ended October 31, 2008(e) | | 1.48 | % | | | | 442 | | | 0.67 | % | | 1.49 | % | | 0.82 | % | |
Year Ended October 31, 2009 | | 0.08 | %(f) | | | | 221 | | | 0.47 | %(f) | | 0.08 | %(f) | | 0.88 | %(f) | |
Year Ended October 31, 2010(g) | | 0.02 | %(m) | | | | — | | | 0.25 | % | | 0.03 | %(m) | | 0.89 | % | |
|
|
|
|
|
|
|
|
|
|
|
|
|
|
|
|
|
|
|
CLASS C SHARES | | | | | | | | | | | | | | | | | | |
Period Ended October 31, 2007(h) | | 1.08 | % | | | $ | 1,018 | | | 1.22 | % | | 2.41 | % | | 1.37 | % | |
Year Ended October 31, 2008(i) | | 0.65 | % | | | | — | | | 1.21 | % | | 1.62 | % | | 1.36 | % | |
Year Ended October 31, 2009(j) | | 0.02 | %(f) | | | | — | | | 0.90 | %(f) | | 0.08 | %(f) | | 1.05 | %(f) | |
Year Ended October 31, 2010(k) | | — | % | | | | — | | | — | % | | — | % | | — | % | |
|
|
|
|
|
|
|
|
|
|
|
|
|
|
|
|
|
|
|
CLASS D SHARES | | | | | | | | | | | | | | | | | | |
Year Ended October 31, 2006 | | 2.73 | % | | | $ | 86,686 | | | 0.57 | % | | 2.66 | % | | 0.72 | % | |
Year Ended October 31, 2007 | | 3.09 | %(l) | | | | 90,843 | | | 0.50 | %(l) | | 3.08 | %(l) | | 0.66 | % | |
Year Ended October 31, 2008 | | 1.90 | % | | | | 83,261 | | | 0.47 | % | | 1.76 | % | | 0.62 | % | |
Year Ended October 31, 2009 | | 0.10 | %(f) | | | | 115,160 | | | 0.42 | %(f) | | 0.10 | %(f) | | 0.70 | %(f) | |
Year Ended October 31, 2010 | | 0.01 | %(m) | | | | 43,706 | | | 0.25 | % | | 0.02 | %(m) | | 0.72 | % | |
|
|
|
|
|
|
|
|
|
|
|
|
|
|
|
|
|
|
|
CLASS Y SHARES | | | | | | | | | | | | | | | | | | |
Year Ended October 31, 2006 | | 2.98 | % | | | $ | 43,114 | | | 0.31 | % | | 2.95 | % | | 0.46 | % | |
Year Ended October 31, 2007 | | 3.35 | %(l) | | | | 32,205 | | | 0.24 | %(l) | | 3.32 | %(l) | | 0.40 | % | |
Year Ended October 31, 2008 | | 2.16 | % | | | | 26,163 | | | 0.20 | % | | 2.03 | % | | 0.35 | % | |
Year Ended October 31, 2009 | | 0.22 | %(f) | | | | 21,087 | | | 0.31 | %(f) | | 0.25 | %(f) | | 0.46 | %(f) | |
Year Ended October 31, 2010 | | 0.02 | %(m) | | | | 6,271 | | | 0.24 | % | | 0.02 | %(m) | | 0.48 | % | |
|
|
|
|
|
|
|
|
|
|
|
|
|
|
|
|
|
|
|
| |
* | Less than $0.005 per share. |
| |
(a) | Not annualized for periods less than one year. Total returns do not include redemption charges. |
| |
(b) | Annualized for periods less than one year. |
| |
(c) | Excludes fee reductions. If such fee reductions had not occurred, the ratio would have been as indicated. |
| |
(d) | Class A Shares commenced operations on March 2, 2007 and were operational during a portion of the period only. Amounts reflect performance for the period of time the class had operations, which was 3 days during the period. The net asset value, end of period, presented is as of the last day the class had shareholders during the period. |
| |
(e) | Class A Shares were operational during a portion of the year only. Amounts reflect performance for the period of time the class had operations, which was 332 days during the period. The net asset value, end of period, presented is as of the last day during the period the class had shareholders. |
| |
(f) | Included in the ratios is the Treasury Guarantee Program fees incurred by the Fund during the period. Without these fees, the gross and net expense ratios would have decreased by 0.05% and the total return and net investment income ratio would have increased by 0.05%. |
| |
(g) | Class A Shares were operational during a portion of the year only. Amounts reflect performance for the period of time the class had operations, which was 334 days during the period. The net asset value, end of period, presented is as of the last day during the period the class had operations. |
| |
(h) | Class C Shares commenced operations on May 7, 2007. |
| |
(i) | Class C Shares were operational during a portion of the year only. Amounts reflect performance for the period of time the class had operations, which was 152 days during the period. The net asset value, end of period, presented is as of the last day during the period the class had shareholders. |
| |
(j) | Class C Shares were operational during a portion of the year only. Amounts reflect performance for the period of time the class had operations, which was 28 days during the period. The net asset value, end of period, presented is as of the last day during the period the class had shareholders. |
| |
(k) | During the year ended, C Shares had no operations. The net asset values reflected represent the last day the class had shareholders. |
| |
(l) | During the year ended October 31, 2007, the Investment Adviser reimbursed amounts to certain Funds related to past marketing arrangements. The corresponding impact to the net expense ratio, net income ratio and the total return were 0.02% and 0.01% for Class D Shares and Class Y Shares, respectively. |
| |
(m) | During the year ended October 31, 2010, certain Funds (including the Fund) received a distribution from a “fair fund” established by the SEC in connection with a consent order against BISYS Fund Services, Inc. (See Note 7 in Notes to Financial Statements). The corresponding impact to the net income ratio and total return was less than 0.005%. |
| | |
41 | HSBC INVESTOR FAMILY OF FUNDS | See notes to financial statements |
|
HSBC INVESTOR NEW YORK TAX-FREE MONEY MARKET FUND |
|
Financial Highlights |
Selected data for a share outstanding throughout the periods indicated.
| | | | | | | | | | | | | | | | | | | | | | | | | | | | | |
| | | | | | | Investment Activities | | Dividends | | | | | | |
| | | | | | |
| |
| | | | | | |
| | Net Asset
Value,
Beginning
of Period | | Net
Investment
Income (Loss) | | Net Realized
and
Unrealized
Gains
(Losses) from | | Total from
Investment
Activities | | Net
Investment
Income | | Net Realized
Gains from
Investments | | Total
Dividends | | Net Asset
Value, End
of Period | |
|
|
|
|
|
|
|
|
|
|
|
|
|
|
|
|
|
|
CLASS A SHARES | | | | | | | | | | | | | | | | | | | | | | | | | | | | | |
Year Ended October 31, 2006 | | | $ | 1.00 | | | 0.03 | | | — | | | 0.03 | | | (0.03 | ) | | — | | | (0.03 | ) | | | $ | 1.00 | | |
Year Ended October 31, 2007 | | | | 1.00 | | | 0.03 | | | — | | | 0.03 | | | (0.03 | ) | | — | | | (0.03 | ) | | | | 1.00 | | |
Year Ended October 31, 2008 | | | | 1.00 | | | 0.02 | | | — | | | 0.02 | | | (0.02 | ) | | — | | | (0.02 | ) | | | | 1.00 | | |
Year Ended October 31, 2009 | | | | 1.00 | | | — | * | | — | | | — | * | | — | * | | — | * | | — | * | | | | 1.00 | | |
Year Ended October 31, 2010 | | | | 1.00 | | | — | * | | — | * | | — | * | | — | * | | — | | | — | * | | | | 1.00 | | |
|
|
|
|
|
|
|
|
|
|
|
|
|
|
|
|
|
|
|
|
|
|
|
|
|
|
|
|
|
|
CLASS B SHARES | | | | | | | | | | | | | | | | | | | | | | | | | | | | | |
Year Ended October 31, 2006 | | | $ | 1.00 | | | 0.02 | | | — | | | 0.02 | | | (0.02 | ) | | — | | | (0.02 | ) | | | $ | 1.00 | | |
Year Ended October 31, 2007 | | | | 1.00 | | | 0.02 | | | — | | | 0.02 | | | (0.02 | ) | | — | | | (0.02 | ) | | | | 1.00 | | |
Year Ended October 31, 2008 | | | | 1.00 | | | 0.01 | | | — | | | 0.01 | | | (0.01 | ) | | — | | | (0.01 | ) | | | | 1.00 | | |
Year Ended October 31, 2009 | | | | 1.00 | | | — | * | | — | | | — | * | | — | * | | — | * | | — | * | | | | 1.00 | | |
Year Ended October 31, 2010(e) | | | | 1.00 | | | — | * | | — | * | | — | * | | — | * | | — | | | — | * | | | | 1.00 | | |
|
|
|
|
|
|
|
|
|
|
|
|
|
|
|
|
|
|
|
|
|
|
|
|
|
|
|
|
|
|
CLASS C SHARES | | | | | | | | | | | | | | | | | | | | | | | | | | | | | |
Year Ended October 31, 2006(f) | | | $ | 1.00 | | | — | | | — | | | — | | | — | | | — | | | — | | | | $ | 1.00 | | |
Year Ended October 31, 2007(f) | | | | 1.00 | | | — | | | — | | | — | | | — | | | — | | | — | | | | | 1.00 | | |
Year Ended October 31, 2008(f) | | | | 1.00 | | | — | | | — | | | — | | | — | | | — | | | — | | | | | 1.00 | | |
Year Ended October 31, 2009(g) | | | | 1.00 | | | — | | | — | | | — | | | — | | | — | | | — | | | | | 1.00 | | |
Year Ended October 31, 2010(g) | | | | 1.00 | | | — | | | — | | | — | | | — | | | — | | | — | | | | | 1.00 | | |
|
|
|
|
|
|
|
|
|
|
|
|
|
|
|
|
|
|
|
|
|
|
|
|
|
|
|
|
|
|
CLASS D SHARES | | | | | | | | | | | | | | | | | | | | | | | | | | | | | |
Year Ended October 31, 2006 | | | $ | 1.00 | | | 0.03 | | | — | | | 0.03 | | | (0.03 | ) | | — | | | (0.03 | ) | | | $ | 1.00 | | |
Year Ended October 31, 2007 | | | | 1.00 | | | 0.03 | | | — | | | 0.03 | | | (0.03 | ) | | — | | | (0.03 | ) | | | | 1.00 | | |
Year Ended October 31, 2008 | | | | 1.00 | | | 0.02 | | | — | | | 0.02 | | | (0.02 | ) | | — | | | (0.02 | ) | | | | 1.00 | | |
Year Ended October 31, 2009 | | | | 1.00 | | | — | * | | — | | | — | * | | — | * | | — | * | | — | * | | | | 1.00 | | |
Year Ended October 31, 2010 | | | | 1.00 | | | — | * | | — | * | | — | * | | — | * | | — | | | — | * | | | | 1.00 | | |
|
|
|
|
|
|
|
|
|
|
|
|
|
|
|
|
|
|
|
|
|
|
|
|
|
|
|
|
|
|
CLASS Y SHARES | | | | | | | | | | | | | | | | | | | | | | | | | | | | | |
Year Ended October 31, 2006 | | | $ | 1.00 | | | 0.03 | | | — | | | 0.03 | | | (0.03 | ) | | — | | | (0.03 | ) | | | $ | 1.00 | | |
Year Ended October 31, 2007 | | | | 1.00 | | | 0.03 | | | — | | | 0.03 | | | (0.03 | ) | | — | | | (0.03 | ) | | | | 1.00 | | |
Year Ended October 31, 2008 | | | | 1.00 | | | 0.02 | | | — | | | 0.02 | | | (0.02 | ) | | — | | | (0.02 | ) | | | | 1.00 | | |
Year Ended October 31, 2009 | | | | 1.00 | | | — | * | | — | | | — | * | | — | * | | — | * | | — | * | | | | 1.00 | | |
Year Ended October 31, 2010 | | | | 1.00 | | | — | * | | — | * | | — | * | | — | * | | — | | | — | * | | | | 1.00 | | |
|
|
|
|
|
|
|
|
|
|
|
|
|
|
|
|
|
|
|
|
|
|
|
|
|
|
|
|
|
|
| | | | | | | | | | | | | | | | | | |
| | | | | Ratios/Supplementary Data | |
| | | | |
| |
| | Total
Return(a) | | Net Assets
at End of
Period
(000’s) | | Ratio of Net
Expenses to
Average Net
Assets | | Ratio of Net
Investment
Income (Loss)
to Average
Net Assets | | Ratio of
Expenses to
Average Net
Assets(b) | |
|
|
|
|
|
|
|
|
|
|
|
|
CLASS A SHARES | | | | | | | | | | | | | | | | | | |
Year Ended October 31, 2006 | | 2.63 | % | | | $ | 153,523 | | | 0.70 | % | | 2.61 | % | | 0.70 | % | |
Year Ended October 31, 2007 | | 3.00 | %(c) | | | | 120,841 | | | 0.65 | %(c) | | 2.98 | %(c) | | 0.67 | % | |
Year Ended October 31, 2008 | | 1.94 | % | | | | 45,791 | | | 0.63 | % | | 2.09 | % | | 0.63 | % | |
Year Ended October 31, 2009 | | 0.18 | %(d) | | | | 40,698 | | | 0.49 | %(d) | | 0.21 | %(d) | | 0.67 | %(d) | |
Year Ended October 31, 2010 | | 0.02 | %(h) | | | | 14,564 | | | 0.23 | % | | 0.02 | %(h) | | 0.64 | % | |
|
|
|
|
|
|
|
|
|
|
|
|
|
|
|
|
|
|
|
CLASS B SHARES | | | | | | | | | | | | | | | | | | |
Year Ended October 31, 2006 | | 2.01 | % | | | $ | 55 | | | 1.30 | % | | 1.88 | % | | 1.30 | % | |
Year Ended October 31, 2007 | | 2.39 | %(c) | | | | 34 | | | 1.25 | %(c) | | 2.38 | %(c) | | 1.27 | % | |
Year Ended October 31, 2008 | | 1.33 | % | | | | 35 | | | 1.23 | % | | 1.30 | % | | 1.23 | % | |
Year Ended October 31, 2009 | | 0.08 | %(d) | | | | 21 | | | 0.65 | %(d) | | 0.08 | %(d) | | 1.27 | %(d) | |
Year Ended October 31, 2010(e) | | 0.01 | %(h) | | | | — | | | 0.22 | % | | 0.02 | %(h) | | 1.24 | % | |
|
|
|
|
|
|
|
|
|
|
|
|
|
|
|
|
|
|
|
CLASS C SHARES | | | | | | | | | | | | | | | | | | |
Year Ended October 31, 2006(f) | | — | % | | | | | ** | | — | % | | — | % | | — | % | |
Year Ended October 31, 2007(f) | | — | % | | | | | ** | | — | % | | — | % | | — | % | |
Year Ended October 31, 2008(f) | | — | % | | | | | ** | | — | % | | — | % | | — | % | |
Year Ended October 31, 2009(g) | | — | % | | | | — | | | — | % | | — | % | | — | % | |
Year Ended October 31, 2010(g) | | — | % | | | | — | | | — | % | | — | % | | — | % | |
|
|
|
|
|
|
|
|
|
|
|
|
|
|
|
|
|
|
|
CLASS D SHARES | | | | | | | | | | | | | | | | | | |
Year Ended October 31, 2006 | | 2.78 | % | | | $ | 352,630 | | | 0.55 | % | | 2.78 | % | | 0.55 | % | |
Year Ended October 31, 2007 | | 3.16 | %(c) | | | | 531,864 | | | 0.50 | %(c) | | 3.14 | %(c) | | 0.52 | % | |
Year Ended October 31, 2008 | | 2.09 | % | | | | 586,791 | | | 0.48 | % | | 1.99 | % | | 0.48 | % | |
Year Ended October 31, 2009 | | 0.25 | %(d) | | | | 423,061 | | | 0.43 | %(d) | | 0.26 | %(d) | | 0.52 | %(d) | |
Year Ended October 31, 2010 | | 0.02 | %(h) | | | | 380,888 | | | 0.23 | % | | 0.02 | %(h) | | 0.49 | % | |
|
|
|
|
|
|
|
|
|
|
|
|
|
|
|
|
|
|
|
CLASS Y SHARES | | | | | | | | | | | | | | | | | | |
Year Ended October 31, 2006 | | 3.04 | % | | | $ | 263,187 | | | 0.30 | % | | 2.99 | % | | 0.30 | % | |
Year Ended October 31, 2007 | | 3.42 | %(c) | | | | 339,665 | | | 0.25 | %(c) | | 3.39 | %(c) | | 0.27 | % | |
Year Ended October 31, 2008 | | 2.35 | % | | | | 319,797 | | | 0.23 | % | | 2.27 | % | | 0.23 | % | |
Year Ended October 31, 2009 | | 0.40 | %(d) | | | | 210,706 | | | 0.26 | %(d) | | 0.39 | %(d) | | 0.27 | %(d) | |
Year Ended October 31, 2010 | | 0.02 | %(h) | | | | 105,303 | | | 0.22 | % | | 0.02 | %(h) | | 0.24 | % | |
|
|
|
|
|
|
|
|
|
|
|
|
|
|
|
|
|
|
|
| |
* | Less than $0.005 per share. |
| |
** | Less than $500. |
| |
(a) | Total returns do not include redemption charges. |
| |
(b) | Excludes fee reductions. If such fee reductions had not occurred, the ratio would have been as indicated. |
| |
(c) | During the year ended October 31, 2007, the Investment Adviser reimbursed amounts to certain Funds related to past marketing arrangements. The corresponding impact to the net expense ratio, net income ratio and the total return were 0.02%, 0.02%, 0.02%, and 0.02% for Class A Shares, Class B Shares, Class D Shares, and Class Y Shares, respectively. |
| |
(d) | Included in the ratios is the Treasury Guarantee Program fees incurred by the Fund during the period. Without these fees, the gross and net expense ratios would have decreased by 0.04% and the total return and net investment income ratio would have increased by 0.04%. |
| |
(e) | Class B Shares were operational during a portion of the year only. Amounts reflect performance for the period of time the class had operations, which was 190 days during the period. The net asset value, end of period, presented is as of the last day during the period the class had operations. |
| |
(f) | During the year ended, Class C Shares had no operations. Net assets at the end of the period represent seed money. The net asset values reflected represent the last day the class had shareholders. |
| |
(g) | During the year ended, Class C Shares had no operations. The net asset values reflected represent the last day the class had shareholders. |
| |
(h) | During the year ended October 31, 2010, certain Funds (including the Fund) received a distribution from a “fair fund” established by the SEC in connection with a consent order against BISYS Fund Services, Inc. (See Note 7 in Notes to Financial Statements). The corresponding impact to the net income ratio and the total return was less than 0.005%. |
| | |
See notes to financial statements | HSBC INVESTOR FAMILY OF FUNDS | 42 |
|
HSBC INVESTOR PRIME MONEY MARKET FUND |
|
Financial Highlights |
Selected data for a share outstanding throughout the periods indicated.
| | | | | | | | | | | | | | | | | | | | | | | | | | |
| | | | Investment Activities | | Dividends | | | |
| | | |
| |
| | | |
| | Net Asset
Value,
Beginning
of Period | | Net
Investment
Income (Loss) | | Net Realized
and Unrealized
Gains (Losses)
from
Investment
Transactions | | Total from
Investment
Activities | | Net
Investment
Income | | Total
Dividends | | Net Asset
Value, End
of Period | |
|
|
|
|
|
|
|
|
|
|
|
|
|
|
|
|
CLASS A SHARES | | | | | | | | | | | | | | | | | | | | | | |
Year Ended October 31, 2006 | | | $ | 1.00 | | | 0.04 | | | — | * | | 0.04 | | | (0.04 | ) | | (0.04 | ) | | | $ | 1.00 | | |
Year Ended October 31, 2007 | | | | 1.00 | | | 0.05 | | | — | * | | 0.05 | | | (0.05 | ) | | (0.05 | ) | | | | 1.00 | | |
Year Ended October 31, 2008 | | | | 1.00 | | | 0.03 | | | — | * | | 0.03 | | | (0.03 | ) | | (0.03 | ) | | | | 1.00 | | |
Year Ended October 31, 2009 | | | | 1.00 | | | — | * | | — | * | | — | * | | — | * | | — | * | | | | 1.00 | | |
Year Ended October 31, 2010 | | | | 1.00 | | | — | *† | | — | * | | — | * | | — | * | | — | * | | | | 1.00 | | |
|
|
|
|
|
|
|
|
|
|
|
|
|
|
|
|
|
|
|
|
|
|
|
|
|
|
|
CLASS B SHARES | | | | | | | | | | | | | | | | | | | | | | | | | | |
Year Ended October 31, 2006 | | | $ | 1.00 | | | 0.04 | | | — | * | | 0.04 | | | (0.04 | ) | | (0.04 | ) | | | $ | 1.00 | | |
Year Ended October 31, 2007 | | | | 1.00 | | | 0.04 | | | — | * | | 0.04 | | | (0.04 | ) | | (0.04 | ) | | | | 1.00 | | |
Year Ended October 31, 2008 | | | | 1.00 | | | 0.02 | | | — | * | | 0.02 | | | (0.02 | ) | | (0.02 | ) | | | | 1.00 | | |
Year Ended October 31, 2009 | | | | 1.00 | | | — | * | | — | * | | — | * | | — | | | — | | | | | 1.00 | | |
Year Ended October 31, 2010 | | | | 1.00 | | | — | *† | | — | * | | — | * | | — | * | | — | * | | | | 1.00 | | |
|
|
|
|
|
|
|
|
|
|
|
|
|
|
|
|
|
|
|
|
|
|
|
|
|
|
|
CLASS C SHARES | | | | | | | | | | | | | | | | | | | | | | | | | | |
Year Ended October 31, 2006 | | | $ | 1.00 | | | 0.04 | | | — | * | | 0.04 | | | (0.04 | ) | | (0.04 | ) | | | $ | 1.00 | | |
Year Ended October 31, 2007 | | | | 1.00 | | | 0.04 | | | — | * | | 0.04 | | | (0.04 | ) | | (0.04 | ) | | | | 1.00 | | |
Year Ended October 31, 2008 | | | | 1.00 | | | 0.02 | | | — | * | | 0.02 | | | (0.02 | ) | | (0.02 | ) | | | | 1.00 | | |
Year Ended October 31, 2009 | | | | 1.00 | | | — | * | | — | * | | — | * | | — | * | | — | * | | | | 1.00 | | |
Year Ended October 31, 2010 | | | | 1.00 | | | — | *† | | — | * | | — | * | | — | * | | — | * | | | | 1.00 | | |
|
|
|
|
|
|
|
|
|
|
|
|
|
|
|
|
|
|
|
|
|
|
|
|
|
|
|
CLASS D SHARES | | | | | | | | | | | | | | | | | | | | | | | | | | |
Year Ended October 31, 2006 | | | $ | 1.00 | | | 0.04 | | | — | * | | 0.04 | | | (0.04 | ) | | (0.04 | ) | | | $ | 1.00 | | |
Year Ended October 31, 2007 | | | | 1.00 | | | 0.05 | | | — | * | | 0.05 | | | (0.05 | ) | | (0.05 | ) | | | | 1.00 | | |
Year Ended October 31, 2008 | | | | 1.00 | | | 0.03 | | | — | * | | 0.03 | | | (0.03 | ) | | (0.03 | ) | | | | 1.00 | | |
Year Ended October 31, 2009 | | | | 1.00 | | | — | * | | — | * | | — | * | | — | * | | — | * | | | | 1.00 | | |
Year Ended October 31, 2010 | | | | 1.00 | | | — | *† | | — | * | | — | * | | — | * | | — | * | | | | 1.00 | | |
|
|
|
|
|
|
|
|
|
|
|
|
|
|
|
|
|
|
|
|
|
|
|
|
|
|
|
CLASS I SHARES | | | | | | | | | | | | | | | | | | | | | | | | | | |
Year Ended October 31, 2006 | | | $ | 1.00 | | | 0.05 | | | — | * | | 0.05 | | | (0.05 | ) | | (0.05 | ) | | | $ | 1.00 | | |
Year Ended October 31, 2007 | | | | 1.00 | | | 0.05 | | | — | * | | 0.05 | | | (0.05 | ) | | (0.05 | ) | | | | 1.00 | | |
Year Ended October 31, 2008 | | | | 1.00 | | | 0.03 | | | — | * | | 0.03 | | | (0.03 | ) | | (0.03 | ) | | | | 1.00 | | |
Year Ended October 31, 2009 | | | | 1.00 | | | 0.01 | | | — | * | | 0.01 | | | (0.01 | ) | | (0.01 | ) | | | | 1.00 | | |
Year Ended October 31, 2010 | | | | 1.00 | | | — | *† | | — | * | | — | * | | — | * | | — | * | | | | 1.00 | | |
|
|
|
|
|
|
|
|
|
|
|
|
|
|
|
|
|
|
|
|
|
|
|
|
|
|
|
CLASS Y SHARES | | | | | | | | | | | | | | | | | | | | | | | | | | |
Year Ended October 31, 2006 | | | $ | 1.00 | | | 0.05 | | | — | * | | 0.05 | | | (0.05 | ) | | (0.05 | ) | | | $ | 1.00 | | |
Year Ended October 31, 2007 | | | | 1.00 | | | 0.05 | | | — | * | | 0.05 | | | (0.05 | ) | | (0.05 | ) | | | | 1.00 | | |
Year Ended October 31, 2008 | | | | 1.00 | | | 0.03 | | | — | * | | 0.03 | | | (0.03 | ) | | (0.03 | ) | | | | 1.00 | | |
Year Ended October 31, 2009 | | | | 1.00 | | | 0.01 | | | — | * | | 0.01 | | | (0.01 | ) | | (0.01 | ) | | | | 1.00 | | |
Year Ended October 31, 2010 | | | | 1.00 | | | — | *† | | — | * | | — | * | | — | * | | — | * | | | | 1.00 | | |
|
|
|
|
|
|
|
|
|
|
|
|
|
|
|
|
|
|
|
|
|
|
|
|
|
|
|
| | | | | | | | | | | | | | | | | | |
| | | | Ratios/Supplementary Data | |
| | | |
|
|
| | Total
Return(a) | | Net Assets
at End of
Period
(000’s) | | Ratio of Net
Expenses to
Average Net
Assets | | Ratio of Net
Investment
Income
to Average
Net Assets | | Ratio of
Expenses to
Average Net
Assets(b) | |
|
|
|
|
|
|
|
|
|
|
|
|
|
|
|
|
|
CLASS A SHARES | | | | | | | | | | | | | | | | | | |
Year Ended October 31, 2006 | | 4.24 | % | | | $ | 415,514 | | | 0.72 | % | | 4.20 | % | | 0.73 | % | |
Year Ended October 31, 2007 | | 4.77 | %(c) | | | | 471,148 | | | 0.67 | %(c) | | 4.68 | %(c) | | 0.70 | % | |
Year Ended October 31, 2008 | | 2.71 | %(d) | | | | 308,499 | | | 0.67 | % | | 2.73 | % | | 0.67 | % | |
Year Ended October 31, 2009 | | 0.32 | %(e) | | | | 343,265 | | | 0.55 | %(e) | | 0.31 | %(e) | | 0.69 | %(e) | |
Year Ended October 31, 2010 | | 0.01 | %(f) | | | | 32,943 | | | 0.29 | % | | 0.01 | %(f) | | 0.67 | % | |
|
|
|
|
|
|
|
|
|
|
|
|
|
|
|
|
|
|
|
CLASS B SHARES | | | | | | | | | | | | | | | | | | |
Year Ended October 31, 2006 | | 3.61 | % | | | $ | 109 | | | 1.32 | % | | 3.60 | % | | 1.33 | % | |
Year Ended October 31, 2007 | | 4.14 | %(c) | | | | 204 | | | 1.27 | %(c) | | 4.07 | %(c) | | 1.30 | % | |
Year Ended October 31, 2008 | | 2.10 | %(d) | | | | 199 | | | 1.27 | % | | 2.08 | % | | 1.27 | % | |
Year Ended October 31, 2009 | | 0.17 | %(e) | | | | 312 | | | 0.68 | %(e) | | 0.13 | %(e) | | 1.30 | %(e) | |
Year Ended October 31, 2010 | | 0.01 | %(f) | | | | 226 | | | 0.29 | % | | 0.01 | %(f) | | 1.27 | % | |
|
|
|
|
|
|
|
|
|
|
|
|
|
|
|
|
|
|
|
CLASS C SHARES | | | | | | | | | | | | | | | | | | |
Year Ended October 31, 2006 | | 3.61 | % | | | $ | 268,071 | | | 1.32 | % | | 3.59 | % | | 1.33 | % | |
Year Ended October 31, 2007 | | 4.14 | %(c) | | | | 317,217 | | | 1.27 | %(c) | | 4.08 | %(c) | | 1.30 | % | |
Year Ended October 31, 2008 | | 2.10 | %(d) | | | | 316,779 | | | 1.27 | % | | 2.04 | % | | 1.27 | % | |
Year Ended October 31, 2009 | | 0.17 | %(e) | | | | 259,364 | | | 0.74 | %(e) | | 0.19 | %(e) | | 1.29 | %(e) | |
Year Ended October 31, 2010 | | 0.01 | %(f) | | | | 44 | | | 0.29 | % | | 0.01 | %(f) | | 1.27 | % | |
|
|
|
|
|
|
|
|
|
|
|
|
|
|
|
|
|
|
|
CLASS D SHARES | | | | | | | | | | | | | | | | | | |
Year Ended October 31, 2006 | | 4.39 | % | | | $ | 2,098,413 | | | 0.57 | % | | 4.38 | % | | 0.58 | % | |
Year Ended October 31, 2007 | | 4.92 | %(c) | | | | 3,710,803 | | | 0.52 | %(c) | | 4.83 | %(c) | | 0.55 | % | |
Year Ended October 31, 2008 | | 2.86 | %(d) | | | | 2,720,592 | | | 0.52 | % | | 2.89 | % | | 0.52 | % | |
Year Ended October 31, 2009 | | 0.40 | %(e) | | | | 1,994,448 | | | 0.49 | %(e) | | 0.42 | %(e) | | 0.54 | %(e) | |
Year Ended October 31, 2010 | | 0.01 | %(f) | | | | 1,695,222 | | | 0.29 | % | | 0.01 | %(f) | | 0.52 | % | |
|
|
|
|
|
|
|
|
|
|
|
|
|
|
|
|
|
|
|
CLASS I SHARES | | | | | | | | | | | | | | | | | | |
Year Ended October 31, 2006 | | 4.79 | % | | | $ | 2,111,147 | | | 0.19 | % | | 4.70 | % | | 0.22 | % | |
Year Ended October 31, 2007 | | 5.33 | %(c) | | | | 1,870,485 | | | 0.14 | %(c) | | 5.21 | %(c) | | 0.21 | % | |
Year Ended October 31, 2008 | | 3.23 | %(d) | | | | 2,954,253 | | | 0.16 | % | | 3.14 | % | | 0.17 | % | |
Year Ended October 31, 2009 | | 0.69 | %(e) | | | | 7,189,613 | | | 0.18 | %(e) | | 0.55 | %(e) | | 0.19 | %(e) | |
Year Ended October 31, 2010 | | 0.14 | %(f) | | | | 4,679,632 | | | 0.17 | % | | 0.14 | %(f) | | 0.17 | % | |
|
|
|
|
|
|
|
|
|
|
|
|
|
|
|
|
|
|
|
CLASS Y SHARES | | | | | | | | | | | | | | | | | | |
Year Ended October 31, 2006 | | 4.65 | % | | | $ | 530,780 | | | 0.32 | % | | 4.59 | % | | 0.33 | % | |
Year Ended October 31, 2007 | | 5.19 | %(c) | | | | 1,036,994 | | | 0.27 | %(c) | | 5.08 | %(c) | | 0.30 | % | |
Year Ended October 31, 2008 | | 3.12 | %(d) | | | | 2,236,927 | | | 0.27 | % | | 2.96 | % | | 0.27 | % | |
Year Ended October 31, 2009 | | 0.58 | %(e) | | | | 1,194,680 | | | 0.29 | %(e) | | 0.68 | %(e) | | 0.29 | %(e) | |
Year Ended October 31, 2010 | | 0.05 | %(f) | | | | 1,107,571 | | | 0.26 | % | | 0.04 | %(f) | | 0.27 | % | |
|
|
|
|
|
|
|
|
|
|
|
|
|
|
|
|
|
|
|
| |
* | Less than $0.005 per share. |
| |
† | Calculated based on average shares outstanding. |
| |
(a) | Total returns do not include redemption charges. |
| |
(b) | Excludes fee reductions. If such fee reductions had not occurred, the ratio would have been as indicated. |
| |
(c) | During the year ended October 31, 2007, the Investment Adviser reimbursed amounts to certain Funds related to past marketing arrangements. The corresponding impact to the net expense ratio, net income ratio and the total return were 0.02%, 0.02%, 0.02%, 0.02%, 0.02% and 0.02% for Class A Shares, Class B Shares, Class C Shares, Class D Shares, Class I Shares and Class Y Shares, respectively. |
| |
(d) | During the year ended October 31, 2008, an affiliate of the Fund’s investment adviser purchased certain defaulted securities at $16,746,382, in excess of their fair value on the purchase date. The corresponding impact of this excess amount to the total returns were 0.20%, 0.20%, 0.20%, 0.20%, 0.20% and 0.20% for Class A Shares, Class B Shares, Class C Shares, Class D Shares, Class I Shares and Class Y Shares, respectively. |
| |
(e) | Included in the ratios is the Treasury Guarantee Program fees incurred by the Fund during the period. Without these fees, the gross and net expense ratios would have been decreased by 0.03% and the total return and net investment income ratio would have increased by 0.03%. |
| |
(f) | During the year ended October 31, 2010, certain Funds (including the Fund) received a distribution from a “fair fund” established by the SEC in connection with a consent order against BISYS Fund Services, Inc. (See Note 7 in Notes to Financial Statements). The corresponding impact to the net income ratio and total return was less than 0.005%. |
| | |
43 | HSBC INVESTOR FAMILY OF FUNDS | See notes to financial statements |
|
HSBC INVESTOR TAX-FREE MONEY MARKET FUND |
|
Financial Highlights |
Selected data for a share outstanding throughout the periods indicated.
| | | | | | | | | | | | | | | | | | | | | | | | | | | | | |
| | | | Investment Activities | | Dividends | | | |
| | | |
| |
| | | |
| | Net Asset
Value,
Beginning
of Period | | Net
Investment
Income | | Net Realized
Gains (Losses)
from
Investment
Transactions | | Total from
Investment
Activities | | Net
Investment
Income | | Net
Realized
Gains
from
Investments | | Total
Dividends | | Net Asset
Value, End
of Period | |
|
|
|
|
|
|
|
|
|
|
|
|
|
|
|
|
|
|
|
|
|
|
|
|
|
|
CLASS A SHARES | | | | | | | | | | | | | | | | | | | | | | | | | |
Year Ended October 31, 2006(d) | | | $ | 1.00 | | | 0.01 | | | — | | | 0.01 | | | (0.01 | ) | | — | | | (0.01 | ) | | | $ | 1.00 | | |
Year Ended October 31, 2007(e) | | | | 1.00 | | | — | * | | — | | | — | * | | — | * | | — | | | — | * | | | | 1.00 | | |
Year Ended October 31, 2008(f) | | | | 1.00 | | | — | | | — | | | — | | | — | | | — | | | — | | | | | 1.00 | | |
Year Ended October 31, 2009(g) | | | | 1.00 | | | — | * | | — | * | | — | * | | — | * | | — | * | | — | * | | | | 1.00 | | |
Year Ended October 31, 2010 | | | | 1.00 | | | — | * | | — | * | | — | * | | — | * | | — | | | — | * | | | | 1.00 | | |
|
|
|
|
|
|
|
|
|
|
|
|
|
|
|
|
|
|
|
|
|
|
|
|
|
|
|
|
|
|
CLASS C SHARES | | | | | | | | | | | | | | | | | | | | | | | | | | | | | |
Period Ended October 31, 2007(i) | | | $ | 1.00 | | | — | * | | — | | | — | * | | — | * | | — | | | — | * | | | $ | 1.00 | | |
Year Ended October 31, 2008(f) | | | | 1.00 | | | — | | | — | | | — | | | — | | | — | | | — | | | | | 1.00 | | |
Year Ended October 31, 2009(f) | | | | 1.00 | | | — | | | — | | | — | | | — | | | — | | | — | | | | | 1.00 | | |
Year Ended October 31, 2009(f) | | | | 1.00 | | | — | | | — | | | — | | | — | | | — | | | — | | | | | 1.00 | | |
Year Ended October 31, 2010(f) | | | | 1.00 | | | — | | | — | | | — | | | — | | | — | | | — | | | | | 1.00 | | |
|
|
|
|
|
|
|
|
|
|
|
|
|
|
|
|
|
|
|
|
|
|
|
|
|
|
|
|
|
|
CLASS D SHARES | | | | | | | | | | | | | | | | | | | | | | | | | | | | | |
Year Ended October 31, 2006 | | | $ | 1.00 | | | 0.03 | | | — | | | 0.03 | | | (0.03 | ) | | — | | | (0.03 | ) | | | $ | 1.00 | | |
Year Ended October 31, 2007 | | | | 1.00 | | | 0.03 | | | — | | | 0.03 | | | (0.03 | ) | | — | | | (0.03 | ) | | | | 1.00 | | |
Year Ended October 31, 2008 | | | | 1.00 | | | 0.02 | | | — | | | 0.02 | | | (0.02 | ) | | — | | | (0.02 | ) | | | | 1.00 | | |
Year Ended October 31, 2009 | | | | 1.00 | | | — | * | | — | * | | — | * | | — | * | | — | * | | — | * | | | | 1.00 | | |
Year Ended October 31, 2010 | | | | 1.00 | | | — | * | | — | * | | — | * | | — | * | | — | | | — | * | | | | 1.00 | | |
|
|
|
|
|
|
|
|
|
|
|
|
|
|
|
|
|
|
|
|
|
|
|
|
|
|
|
|
|
|
CLASS I SHARES | | | | | | | | | | | | | | | | | | | | | | | | | | | | | |
Year Ended October 31, 2006(f) | | | $ | 1.00 | | | — | * | | — | | | — | * | | — | * | | — | | | — | * | | | $ | 1.00 | | |
Year Ended October 31, 2007(f) | | | | 1.00 | | | — | | | — | | | — | | | — | | | — | | | — | | | | | 1.00 | | |
Year Ended October 31, 2008(f) | | | | 1.00 | | | — | | | — | | | — | | | — | | | — | | | — | | | | | 1.00 | | |
Year Ended October 31, 2009(f) | | | | 1.00 | | | — | | | — | | | — | | | — | | | — | | | — | | | | | 1.00 | | |
Year Ended October 31, 2010(k) | | | | 1.00 | | | — | * | | — | | | — | * | | — | * | | — | | | — | * | | | | 1.00 | | |
|
|
|
|
|
|
|
|
|
|
|
|
|
|
|
|
|
|
|
|
|
|
|
|
|
|
|
|
|
|
CLASS Y SHARES | | | | | | | | | | | | | | | | | | | | | | | | | | | | | |
Year Ended October 31, 2006 | | | $ | 1.00 | | | 0.03 | | | — | | | 0.03 | | | (0.03 | ) | | — | | | (0.03 | ) | | | $ | 1.00 | | |
Year Ended October 31, 2007 | | | | 1.00 | | | 0.03 | | | — | | | 0.03 | | | (0.03 | ) | | — | | | (0.03 | ) | | | | 1.00 | | |
Year Ended October 31, 2008 | | | | 1.00 | | | 0.02 | | | — | | | 0.02 | | | (0.02 | ) | | — | | | (0.02 | ) | | | | 1.00 | | |
Year Ended October 31, 2009 | | | | 1.00 | | | 0.01 | | | — | * | | 0.01 | | | (0.01 | ) | | — | * | | (0.01 | ) | | | | 1.00 | | |
Year Ended October 31, 2010 | | | | 1.00 | | | — | * | | — | * | | — | * | | — | * | | — | | | — | * | | | | 1.00 | | |
|
|
|
|
|
|
|
|
|
|
|
|
|
|
|
|
|
|
|
|
|
|
|
|
|
|
|
|
|
|
| | | | | | | | | | | | | | | | | | |
| | | | Ratios/Supplementary Data | |
| | | |
|
|
| | Total
Return(a) | | Net Assets
at End of
Period
(000’s) | | Ratio of Net
Expenses to
Average Net
Assets(b) | | Ratio of Net
Investment
Income
to Average
Net Assets(b) | | Ratio of
Expenses to
Average Net
Assets(b)(c) | |
|
|
|
|
|
|
|
|
|
|
|
|
CLASS A SHARES | | | | | | | | | | | | | | | | |
Year Ended October 31, 2006(d) | | 0.56 | % | | | $ | 1 | | | 1.06 | % | | 3.35 | % | | 1.49 | % | |
Year Ended October 31, 2007(e) | | 0.18 | % | | | | — | | | 0.72 | % | | 2.96 | % | | 0.92 | % | |
Year Ended October 31, 2008(f) | | — | % | | | | — | | | — | % | | — | % | | — | % | |
Year Ended October 31, 2009(g) | | 0.01 | %(h) | | | | ** | | | 0.31 | %(h) | | 0.36 | %(h) | | 0.07 | %(h) | |
Year Ended October 31, 2010 | | — | %(j) | | | | ** | | | 0.15 | % | | 0.12 | %(j) | | 0.28 | % | |
|
|
|
|
|
|
|
|
|
|
|
|
|
|
|
|
|
|
|
CLASS C SHARES | | | | | | | | | | | | | | | | | | |
Period Ended October 31, 2007(i) | | 0.09 | % | | | $ | — | | | 1.34 | % | | 2.24 | % | | 1.54 | % | |
Year Ended October 31, 2008(f) | | — | % | | | | — | | | — | % | | — | % | | — | % | |
Year Ended October 31, 2009(f) | | — | % | | | | — | | | — | % | | — | % | | — | % | |
Year Ended October 31, 2009(f) | | — | % | | | | — | | | — | % | | — | % | | — | % | |
Year Ended October 31, 2010(f) | | — | % | | | | — | | | — | % | | — | % | | — | % | |
|
|
|
|
|
|
|
|
|
|
|
|
|
|
|
|
|
|
|
CLASS D SHARES | | | | | | | | | | | | | | | | | | |
Year Ended October 31, 2006 | | 2.77 | % | | | $ | 48,502 | | | 0.66 | % | | 2.76 | % | | 0.99 | % | |
Year Ended October 31, 2007 | | 3.04 | % | | | | 40,184 | | | 0.63 | % | | 3.04 | % | | 0.83 | % | |
Year Ended October 31, 2008 | | 2.13 | % | | | | 69,787 | | | 0.46 | % | | 2.05 | % | | 0.66 | % | |
Year Ended October 31, 2009 | | 0.31 | %(h) | | | | 95,350 | | | 0.43 | %(h) | | 0.29 | %(h) | | 0.63 | %(h) | |
Year Ended October 31, 2010 | | 0.01 | %(j) | | | | 73,988 | | | 0.26 | % | | 0.01 | %(j) | | 0.64 | % | |
|
|
|
|
|
|
|
|
|
|
|
|
|
|
|
|
|
|
|
CLASS I SHARES | | | | | | | | | | | | | | | | | | |
Year Ended October 31, 2006(f) | | — | % | | | $ | — | | | — | % | | — | % | | — | % | |
Year Ended October 31, 2007(f) | | — | % | | | | — | | | — | % | | — | % | | — | % | |
Year Ended October 31, 2008(f) | | — | % | | | | — | | | — | % | | — | % | | — | % | |
Year Ended October 31, 2009(f) | | — | % | | | | — | | | — | % | | — | % | | — | % | |
Year Ended October 31, 2010(k) | | 0.01 | % | | | | — | | | 0.16 | % | | 0.09 | %(j) | | 0.37 | % | |
|
|
|
|
|
|
|
|
|
|
|
|
|
|
|
|
|
|
|
CLASS Y SHARES | | | | | | | | | | | | | | | | | | |
Year Ended October 31, 2006 | | 3.02 | % | | | $ | 12,424 | | | 0.39 | % | | 2.92 | % | | 0.77 | % | |
Year Ended October 31, 2007 | | 3.30 | % | | | | 18,936 | | | 0.34 | % | | 3.31 | % | | 0.54 | % | |
Year Ended October 31, 2008 | | 2.38 | % | | | | 143,730 | | | 0.20 | % | | 2.31 | % | | 0.40 | % | |
Year Ended October 31, 2009 | | 0.55 | %(h) | | | | 97,789 | | | 0.18 | %(h) | | 0.57 | %(h) | | 0.38 | %(h) | |
Year Ended October 31, 2010 | | 0.08 | %(j) | | | | 31,180 | | | 0.18 | % | | 0.09 | %(j) | | 0.39 | % | |
|
|
|
|
|
|
|
|
|
|
|
|
|
|
|
|
|
|
|
| |
* | Less than $0.005 per share. |
| |
** | Less than $500. |
| |
(a) | Not annualized for periods less than one year. Total returns do not include redemption charges. |
| |
(b) | Annualized for periods less than one year. |
| |
(c) | Excludes fee reductions. If such fee reductions had not occurred, the ratio would have been as indicated. |
| |
(d) | Class A Shares were operational during a portion of the year only. Amounts reflect performance for the period of the time the class had operations, which was 78 days during the period. The net asset value, end of period, presented is as of the last day during the period the class had shareholders. |
| |
(e) | Class A Shares were operational during a portion of the year only. Amounts reflect performance for the period of the time the class had operations, which was 24 days during the period. The net asset value, end of period, presented is as of the last day during the period the class had shareholders. |
| |
(f) | During the period, class had no operations. The net asset values reflected represent the last day the class had shareholders. |
| |
(g) | Class A Shares were operational during a portion of the year only. Amounts reflect performance for the period of time the class had operations, which was 262 days during the period. The net asset value, end of period, presented is as of the last day during the period the class had shareholders. |
| |
(h) | Included in the ratios is the Treasury Guarantee Program fees incurred by the Fund during the period. Without these fees, the gross and net expense ratios would have been decreased by 0.03% and the total return and net investment income ratio would have increased by 0.03%. |
| |
(i) | Class C Shares commenced operations on July 30, 2007 and were operational during a portion of the year only. Amounts reflect performance for the period of time the class had operations, which was 15 days during the period. The net asset value, end of period, presented is as of the last day during the period the class had shareholders. |
| |
(j) | During the year ended October 31, 2010, certain Funds (including the Fund) received a distribution from a “fair fund” established by the SEC in connection with a consent order against BISYS Fund Services, Inc. (See Note 7 in Notes to Financial Statements). The corresponding impact to the net income ratio and the total return was less than 0.005%. |
| |
(k) | Class I Shares were operational during a portion of the year only. Amounts reflect performance for the period of time the class had operations, which was 51 days during the period. The net asset value, end of period, presented is as of the last day during the period the class had shareholders. |
| | |
See notes to financial statements | HSBC INVESTOR FAMILY OF FUNDS | 44 |
|
HSBC INVESTOR U.S. GOVERNMENT MONEY MARKET FUND |
|
Financial Highlights |
Selected data for a share outstanding throughout the periods indicated.
| | | | | | | | | | | | | | | | | | | | | | | | | |
| | | | Investment Activities | | Dividends | | | |
| | | |
| |
| | | |
| | Net Asset
Value,
Beginning
of Period | | Net
Investment
Income (Loss) | | Net Realized
and Unrealized
Gains (Losses)
from
Investment
Transactions | | Total from
Investment
Activities | | Net
Investment
Income | | Net Realized
Gains from
Investments | | Total
Dividends | | Net Asset
Value, End
of Period | |
|
|
|
|
|
|
|
|
|
|
|
|
|
|
|
|
|
|
CLASS A SHARES | | | | | | | | | | | | | | | | | | | | | | | | | |
Year Ended October 31, 2006 | | $ | 1.00 | | | 0.04 | | | — | | | 0.04 | | | (0.04 | ) | | — | | | (0.04 | ) | $ | 1.00 | |
Year Ended October 31, 2007 | | | 1.00 | | | 0.05 | | | — | | | 0.05 | | | (0.05 | ) | | — | | | (0.05 | ) | | 1.00 | |
Year Ended October 31, 2008 | | | 1.00 | | | 0.02 | | | — | | | 0.02 | | | (0.02 | ) | | — | | | (0.02 | ) | | 1.00 | |
Year Ended October 31, 2009 | | | 1.00 | | | — | * | | — | * | | — | * | | — | * | | — | * | | — | * | | 1.00 | |
Year Ended October 31, 2010 | | | 1.00 | | | — | | | — | | | — | | | — | * | | — | * | | — | * | | 1.00 | |
|
|
|
|
|
|
|
|
|
|
|
|
|
|
|
|
|
|
|
|
|
|
|
|
|
|
CLASS B SHARES | | | | | | | | | | | | | | | | | | | | | | | | | |
Year Ended October 31, 2006 | | $ | 1.00 | | | 0.04 | | | — | | | 0.04 | | | (0.04 | ) | | — | | | (0.04 | ) | $ | 1.00 | |
Year Ended October 31, 2007 | | | 1.00 | | | 0.05 | | | — | | | 0.05 | | | (0.05 | ) | | — | | | (0.05 | ) | | 1.00 | |
Year Ended October 31, 2008 | | | 1.00 | | | 0.02 | | | — | | | 0.02 | | | (0.02 | ) | | — | | | (0.02 | ) | | 1.00 | |
Year Ended October 31, 2009 | | | 1.00 | | | — | * | | — | * | | — | * | | — | * | | — | * | | — | * | | 1.00 | |
Year Ended October 31, 2010 | | | 1.00 | | | — | * | | — | * | | — | * | | — | * | | — | * | | — | * | | 1.00 | |
|
|
|
|
|
|
|
|
|
|
|
|
|
|
|
|
|
|
|
|
|
|
|
|
|
|
CLASS C SHARES | | | | | | | | | | | | | | | | | | | | | | | | | |
Period Ended October 31, 2007(f) | | $ | 1.00 | | | 0.04 | | | — | | | 0.04 | | | (0.04 | ) | | — | | | (0.04 | ) | $ | 1.00 | |
Year Ended October 31, 2008 | | | 1.00 | | | 0.02 | | | — | | | 0.02 | | | (0.02 | ) | | — | | | (0.02 | ) | | 1.00 | |
Year Ended October 31, 2009 | | | 1.00 | | | — | * | | — | * | | — | * | | — | * | | — | * | | — | * | | 1.00 | |
Year Ended October 31, 2010(g) | | | 1.00 | | | — | * | | — | * | | — | * | | — | * | | — | * | | — | * | | 1.00 | |
|
|
|
|
|
|
|
|
|
|
|
|
|
|
|
|
|
|
|
|
|
|
|
|
|
|
CLASS D SHARES | | | | | | | | | | | | | | | | | | | | | | | | | |
Year Ended October 31, 2006 | | $ | 1.00 | | | 0.04 | | | — | | | 0.04 | | | (0.04 | ) | | — | | | (0.04 | ) | $ | 1.00 | |
Year Ended October 31, 2007 | | | 1.00 | | | 0.05 | | | — | | | 0.05 | | | (0.05 | ) | | — | | | (0.05 | ) | | 1.00 | |
Year Ended October 31, 2008 | | | 1.00 | | | 0.02 | | | — | | | 0.02 | | | (0.02 | ) | | — | | | (0.02 | ) | | 1.00 | |
Year Ended October 31, 2009 | | | 1.00 | | | — | * | | — | * | | — | * | | — | * | | — | | | — | * | | 1.00 | |
Year Ended October 31, 2010 | | | 1.00 | | | — | * | | — | * | | — | * | | — | * | | — | | | — | * | | 1.00 | |
|
|
|
|
|
|
|
|
|
|
|
|
|
|
|
|
|
|
|
|
|
|
|
|
|
|
CLASS I SHARES | | | | | | | | | | | | | | | | | | | | | | | | | |
Year Ended October 31, 2006(h) | | $ | 1.00 | | | 0.02 | | | — | | | 0.02 | | | (0.02 | ) | | — | | | (0.02 | ) | $ | 1.00 | |
Year Ended October 31, 2007(i) | | | 1.00 | | | 0.05 | | | — | | | 0.05 | | | (0.05 | ) | | — | | | (0.05 | ) | | 1.00 | |
Year Ended October 31, 2008 | | | 1.00 | | | 0.03 | | | — | | | 0.03 | | | (0.03 | ) | | — | | | (0.03 | ) | | 1.00 | |
Year Ended October 31, 2009 | | | 1.00 | | | — | * | | — | * | | — | * | | — | * | | — | * | | — | | | 1.00 | |
Year Ended October 31, 2010 | | | 1.00 | | | — | * | | — | * | | — | * | | — | * | | — | * | | — | | | 1.00 | |
|
|
|
|
|
|
|
|
|
|
|
|
|
|
|
|
|
|
|
|
|
|
|
|
|
|
CLASS Y SHARES | | | | | | | | | | | | | | | | | | | | | | | | | |
Year Ended October 31, 2006 | | $ | 1.00 | | | 0.04 | | | — | | | 0.04 | | | (0.04 | ) | | — | | | (0.04 | ) | $ | 1.00 | |
Year Ended October 31, 2007 | | | 1.00 | | | 0.05 | | | — | | | 0.05 | | | (0.05 | ) | | — | | | (0.05 | ) | | 1.00 | |
Year Ended October 31, 2008 | | | 1.00 | | | 0.03 | | | — | | | 0.03 | | | (0.03 | ) | | — | | | (0.03 | ) | | 1.00 | |
Year Ended October 31, 2009 | | | 1.00 | | | — | * | | — | * | | — | * | | — | * | | — | * | | — | | | 1.00 | |
Year Ended October 31, 2010 | | | 1.00 | | | — | * | | — | * | | — | * | | — | * | | — | * | | — | | | 1.00 | |
|
|
|
|
|
|
|
|
|
|
|
|
|
|
|
|
|
|
|
|
|
|
|
|
|
|
| | | | | | | | | | | | | | | | |
| | | | Ratios/Supplementary Data |
| | | |
|
| | Total
Return(a) | | Net Assets
at End of
Period
(000’s) | | Ratio of Net
Expenses to
Average Net
Assets(b) | | Ratio of Net
Investment
Income
to Average
Net Assets(b) | | Ratio of
Expenses to
Average Net
Assets(b)(c) | |
|
|
|
|
|
|
|
|
|
|
|
|
CLASS A SHARES | | | | | | | | | | | | | | | | |
Year Ended October 31, 2006 | | | 4.16 | % | $ | 1,287,045 | | | 0.72 | % | | 4.13 | % | | 0.73 | % |
Year Ended October 31, 2007 | | | 4.63 | %(d) | | 1,090,807 | | | 0.65 | %(d) | | 4.56 | %(d) | | 0.70 | % |
Year Ended October 31, 2008 | | | 2.20 | % | | 703,712 | | | 0.67 | % | | 2.29 | % | | 0.67 | % |
Year Ended October 31, 2009 | | | 0.14 | %(e) | | 574,577 | | | 0.52 | %(e) | | 0.14 | %(e) | | 0.72 | %(e) |
Year Ended October 31, 2010 | | | 0.02 | %(j) | | 25,926 | | | 0.23 | % | | 0.01 | %(j) | | 0.67 | % |
|
|
|
|
|
|
|
|
|
|
|
|
|
|
|
|
|
CLASS B SHARES | | | | | | | | | | | | | | | | |
Year Ended October 31, 2006 | | | 4.29 | % | $ | 1 | | | 1.31 | % | | 3.95 | % | | 1.32 | % |
Year Ended October 31, 2007 | | | 4.76 | %(d) | | 1 | | | 1.25 | %(d) | | 4.01 | %(d) | | 1.28 | % |
Year Ended October 31, 2008 | | | 1.67 | % | | 54 | | | 1.29 | % | | 1.24 | % | | 1.29 | % |
Year Ended October 31, 2009 | | | 0.08 | %(e) | | 84 | | | 0.54 | %(e) | | 0.08 | %(e) | | 1.30 | %(e) |
Year Ended October 31, 2010 | | | 0.02 | %(j) | | 88 | | | 0.22 | % | | 0.01 | %(j) | | 1.27 | % |
|
|
|
|
|
|
|
|
|
|
|
|
|
|
|
|
|
CLASS C SHARES | | | | | | | | | | | | | | | | |
Period Ended October 31, 2007(f) | | | 3.79 | %(d) | $ | 428 | | | 1.20 | %(d) | | 3.78 | %(d) | | 1.25 | % |
Year Ended October 31, 2008 | | | 1.59 | % | | 101 | | | 1.27 | % | | 1.28 | % | | 1.27 | % |
Year Ended October 31, 2009 | | | 0.08 | %(e) | | 229 | | | 0.50 | %(e) | | 0.04 | %(e) | | 1.32 | %(e) |
Year Ended October 31, 2010(g) | | | 0.02 | %(j) | | | ** | | 0.23 | % | | 0.01 | %(j) | | 1.27 | % |
|
|
|
|
|
|
|
|
|
|
|
|
|
|
|
|
|
CLASS D SHARES | | | | | | | | | | | | | | | | |
Year Ended October 31, 2006 | | | 4.32 | % | $ | 967,456 | | | 0.57 | % | | 4.27 | % | | 0.58 | % |
Year Ended October 31, 2007 | | | 4.79 | %(d) | | 761,155 | | | 0.50 | %(d) | | 4.66 | %(d) | | 0.54 | % |
Year Ended October 31, 2008 | | | 2.36 | % | | 1,438,199 | | | 0.52 | % | | 1.92 | % | | 0.52 | % |
Year Ended October 31, 2009 | | | 0.18 | %(e) | | 767,551 | | | 0.48 | %(e) | | 0.21 | %(e) | | 0.58 | %(e) |
Year Ended October 31, 2010 | | | 0.02 | %(j) | | 922,510 | | | 0.22 | % | | 0.02 | %(j) | | 0.52 | % |
|
|
|
|
|
|
|
|
|
|
|
|
|
|
|
|
|
CLASS I SHARES | | | | | | | | | | | | | | | | |
Year Ended October 31, 2006(h) | | | 1.80 | % | $ | 23,002 | | | 0.17 | % | | 5.08 | % | | 0.23 | % |
Year Ended October 31, 2007(i) | | | 4.99 | %(d) | | 949,095 | | | 0.15 | %(d) | | 4.73 | %(d) | | 0.17 | % |
Year Ended October 31, 2008 | | | 2.72 | % | | 4,908,887 | | | 0.17 | % | | 2.23 | % | | 0.18 | % |
Year Ended October 31, 2009 | | | 0.43 | %(e) | | 8,176,980 | | | 0.22 | %(e) | | 0.38 | %(e) | | 0.22 | %(e) |
Year Ended October 31, 2010 | | | 0.08 | %(j) | | 5,100,891 | | | 0.16 | % | | 0.07 | %(j) | | 0.17 | % |
|
|
|
|
|
|
|
|
|
|
|
|
|
|
|
|
|
CLASS Y SHARES | | | | | | | | | | | | | | | | |
Year Ended October 31, 2006 | | | 4.58 | % | $ | 517,089 | | | 0.32 | % | | 4.49 | % | | 0.33 | % |
Year Ended October 31, 2007 | | | 5.05 | %(d) | | 6,267,594 | | | 0.26 | %(d) | | 4.78 | %(d) | | 0.28 | % |
Year Ended October 31, 2008 | | | 2.61 | % | | 6,747,758 | | | 0.27 | % | | 2.53 | % | | 0.27 | % |
Year Ended October 31, 2009 | | | 0.32 | %(e) | | 3,370,299 | | | 0.33 | %(e) | | 0.38 | %(e) | | 0.33 | %(e) |
Year Ended October 31, 2010 | | | 0.02 | %(j) | | 2,918,347 | | | 0.22 | % | | 0.02 | %(j) | | 0.27 | % |
|
|
|
|
|
|
|
|
|
|
|
|
|
|
|
|
|
| |
* | Less than $0.005 per share. |
| |
** | Less than $500. |
| |
(a) | Not annualized for periods less than one year. Total returns do not include redemption charges. |
| |
(b) | Annualized for periods less than one year. |
| |
(c) | Excludes fee reductions. If such fee reductions had not occurred, the ratio would have been as indicated. |
| |
(d) | During the year ended October 31, 2007, the Investment Adviser reimbursed amounts to certain Funds related to past marketing arrangements. The corresponding impact to the net expense ratio, net income ratio and the total return were 0.03%, 0.03%, 0.02%, 0.02%, 0.00% and 0.01% for Class A Shares, Class B Shares, Class C Shares, Class D Shares, Class I Shares and Class Y Shares, respectively. |
| |
(e) | Included in the ratios is the Treasury Guarantee Program fees incurred by the Fund during the period. Without these fees, the gross and net expense ratios would have been decreased by 0.06% and the total return and net investment income ratio would have increased by 0.06%. |
| |
(f) | Class C Shares commenced operations on November 20, 2006 and were operational during a portion of the year only. Amounts reflect performance for the period of time the class had operations, which was 346 days during the period. |
| |
(g) | Class C Shares were operational during a portion of the year only. Amounts reflect performance for the period of time the class had operations, which was 351 days during the period. |
| |
(h) | Class I Shares were operational during a portion of the year only. Amounts reflect performance for the period of time the class had operations, which was 136 days during the period. |
| |
(i) | Class I Shares were operational during a portion of the year only. Amounts reflect performance for the period of time the class had operations, which was 357 days during the period. |
| |
(j) | During the year ended October 31, 2010, certain Funds (including the Fund) received a distribution from a “fair fund” established by the SEC in connection with a consent order against BISYS Fund Services, Inc. (See Note 7 in Notes to Financial Statements). The corresponding impact to the net income ratio and the total return was less than 0.005%. |
| | |
45 | HSBC INVESTOR FAMILY OF FUNDS | See notes to financial statements |
|
HSBC INVESTOR U.S. TREASURY MONEY MARKET FUND |
|
Financial Highlights |
Selected data for a share outstanding throughout the periods indicated.
| | | | | | | | | | | | | | | | | | | | | | | | | |
| | | | Investment Activities | | Dividends | | | | |
| | | |
| |
|
|
| | | | |
| | Net Asset
Value,
Beginning
of Period | | Net
Investment
Income | | Net
Realized
Gains (Losses)
from
Investment
Transactions | | Total from
Investment
Activities | | Net
Investment
Income | | Net
Realized
Gains from
Investments | | Total
Dividends | | Net Asset
Value, End
of Period | |
|
|
|
|
|
|
|
|
|
|
|
|
|
|
|
|
|
|
CLASS A SHARES | | | | | | | | | | | | | | | | | | | | | | | | | |
Year Ended October 31, 2006 | | $ | 1.00 | | | 0.04 | | | — | | | 0.04 | | | (0.04 | ) | | — | | | (0.04 | ) | $ | 1.00 | |
Year Ended October 31, 2007 | | | 1.00 | | | 0.04 | | | — | | | 0.04 | | | (0.04 | ) | | — | | | (0.04 | ) | | 1.00 | |
Year Ended October 31, 2008 | | | 1.00 | | | 0.01 | | | — | | | 0.01 | | | (0.01 | ) | | — | | | (0.01 | ) | | 1.00 | |
Year Ended October 31, 2009 | | | 1.00 | | | — | * | | — | * | | — | * | | — | * | | — | * | | — | * | | 1.00 | |
Year Ended October 31, 2010 | | | 1.00 | | | — | *† | | — | * | | — | * | | — | * | | — | * | | — | * | | 1.00 | |
|
|
|
|
|
|
|
|
|
|
|
|
|
|
|
|
|
|
|
|
|
|
|
|
|
|
CLASS B SHARES | | | | | | | | | | | | | | | | | | | | | | | | | |
Year Ended October 31, 2006 | | $ | 1.00 | | | 0.03 | | | — | | | 0.03 | | | (0.03 | ) | | — | | | (0.03 | ) | $ | 1.00 | |
Year Ended October 31, 2007 | | | 1.00 | | | 0.04 | | | — | | | 0.04 | | | (0.04 | ) | | — | | | (0.04 | ) | | 1.00 | |
Year Ended October 31, 2008 | | | 1.00 | | | 0.01 | | | — | | | 0.01 | | | (0.01 | ) | | — | | | (0.01 | ) | | 1.00 | |
Year Ended October 31, 2009 | | | 1.00 | | | — | * | | — | * | | — | * | | — | * | | — | * | | — | * | | 1.00 | |
Year Ended October 31, 2010 | | | 1.00 | | | — | *† | | — | * | | — | * | | — | * | | — | * | | — | * | | 1.00 | |
|
|
|
|
|
|
|
|
|
|
|
|
|
|
|
|
|
|
|
|
|
|
|
|
|
|
CLASS C SHARES | | | | | | | | | | | | | | | | | | | | | | | | | |
Year Ended October 31, 2008(e) | | $ | 1.00 | | | — | * | | — | | | — | | | — | | | — | | | — | | $ | 1.00 | |
Year Ended October 31, 2009 | | | 1.00 | | | — | * | | — | * | | — | * | | — | * | | — | * | | — | * | | 1.00 | |
Year Ended October 31, 2010(g) | | | 1.00 | | | — | *† | | — | * | | — | * | | — | * | | — | | | — | * | | 1.00 | |
|
|
|
|
|
|
|
|
|
|
|
|
|
|
|
|
|
|
|
|
|
|
|
|
|
|
CLASS D SHARES | | | | | | | | | | | | | | | | | | | | | | | | | |
Year Ended October 31, 2006 | | $ | 1.00 | | | 0.04 | | | — | | | 0.04 | | | (0.04 | ) | | — | | | (0.04 | ) | $ | 1.00 | |
Year Ended October 31, 2007 | | | 1.00 | | | 0.04 | | | — | | | 0.04 | | | (0.04 | ) | | — | | | (0.04 | ) | | 1.00 | |
Year Ended October 31, 2008 | | | 1.00 | | | 0.02 | | | — | | | 0.02 | | | (0.02 | ) | | — | | | (0.02 | ) | | 1.00 | |
Year Ended October 31, 2009 | | | 1.00 | | | — | * | | — | * | | — | * | | — | * | | — | * | | — | * | | 1.00 | |
Year Ended October 31, 2010 | | | 1.00 | | | — | *† | | — | * | | — | * | | — | * | | — | | | — | * | | 1.00 | |
|
|
|
|
|
|
|
|
|
|
|
|
|
|
|
|
|
|
|
|
|
|
|
|
|
|
CLASS I SHARES | | | | | | | | | | | | | | | | | | | | | | | | | |
Year Ended October 31, 2006 | | $ | 1.00 | | | 0.04 | | | — | | | 0.04 | | | (0.04 | ) | | — | | | (0.04 | ) | $ | 1.00 | |
Year Ended October 31, 2007 | | | 1.00 | | | 0.05 | | | — | | | 0.05 | | | (0.05 | ) | | — | | | (0.05 | ) | | 1.00 | |
Year Ended October 31, 2008 | | | 1.00 | | | 0.02 | | | — | | | 0.02 | | | (0.02 | ) | | — | | | (0.02 | ) | | 1.00 | |
Year Ended October 31, 2009 | | | 1.00 | | | — | * | | — | * | | — | * | | — | * | | — | * | | — | * | | 1.00 | |
Year Ended October 31, 2010 | | | 1.00 | | | — | *† | | — | * | | — | * | | — | * | | — | | | — | * | | 1.00 | |
|
|
|
|
|
|
|
|
|
|
|
|
|
|
|
|
|
|
|
|
|
|
|
|
|
|
CLASS Y SHARES | | | | | | | | | | | | | | | | | | | | | | | | | |
Year Ended October 31, 2006 | | $ | 1.00 | | | 0.04 | | | — | | | 0.04 | | | (0.04 | ) | | — | | | (0.04 | ) | $ | 1.00 | |
Year Ended October 31, 2007 | | | 1.00 | | | 0.05 | | | — | | | 0.05 | | | (0.05 | ) | | — | | | (0.05 | ) | | 1.00 | |
Year Ended October 31, 2008 | | | 1.00 | | | 0.02 | | | — | | | 0.02 | | | (0.02 | ) | | — | | | (0.02 | ) | | 1.00 | |
Year Ended October 31, 2009 | | | 1.00 | | | — | * | | — | * | | — | * | | — | * | | — | * | | — | * | | 1.00 | |
Year Ended October 31, 2010 | | | 1.00 | | | — | *† | | — | * | | — | * | | — | * | | — | | | — | * | | 1.00 | |
|
|
|
|
|
|
|
|
|
|
|
|
|
|
|
|
|
|
|
|
|
|
|
|
|
|
| | | | | | | | | | | | | | | | |
| | | | Ratios/Supplementary Data |
| | | |
|
| | Total
Return(a) | | Net Assets
at End of
Period
(000’s) | | Ratio of Net
Expenses to
Average Net
Assets(b) | | Ratio of Net
Investment
Income
to Average
Net Assets(b) | | Ratio of
Expenses to
Average Net
Assets(b)(c) | |
|
|
|
|
|
|
|
|
|
|
|
|
CLASS A SHARES | | | | | | | | | | | | | | | | |
Year Ended October 31, 2006 | | | 3.74 | % | $ | 67,861 | | | 0.74 | % | | 3.75 | % | | 0.77 | % |
Year Ended October 31, 2007 | | | 4.19 | %(d) | | 84,355 | | | 0.68 | %(d) | | 4.09 | %(d) | | 0.74 | % |
Year Ended October 31, 2008 | | | 1.38 | % | | 580,458 | | | 0.67 | % | | 1.06 | % | | 0.67 | % |
Year Ended October 31, 2009 | | | 0.07 | % | | 385,994 | | | 0.24 | % | | 0.07 | % | | 0.66 | % |
Year Ended October 31, 2010 | | | 0.01 | %(f) | | 32,973 | | | 0.14 | % | | 0.01 | %(f) | | 0.67 | % |
|
|
|
|
|
|
|
|
|
|
|
|
|
|
|
|
|
CLASS B SHARES | | | | | | | | | | | | | | | | |
Year Ended October 31, 2006 | | | 3.12 | % | $ | 40 | | | 1.35 | % | | 3.09 | % | | 1.38 | % |
Year Ended October 31, 2007 | | | 3.57 | %(d) | | 41 | | | 1.28 | %(d) | | 3.51 | %(d) | | 1.35 | % |
Year Ended October 31, 2008 | | | 0.86 | % | | 131 | | | 1.11 | % | | 1.01 | % | | 1.28 | % |
Year Ended October 31, 2009 | | | 0.07 | % | | 60 | | | 0.24 | % | | 0.07 | % | | 1.26 | % |
Year Ended October 31, 2010 | | | 0.01 | %(f) | | 50 | | | 0.14 | % | | 0.01 | %(f) | | 1.27 | % |
|
|
|
|
|
|
|
|
|
|
|
|
|
|
|
|
|
CLASS C SHARES | | | | | | | | | | | | | | | | |
Year Ended October 31, 2008(e) | | | 0.01 | % | $ | 1,103 | | | 0.64 | % | | 0.20 | % | | 1.26 | % |
Year Ended October 31, 2009 | | | 0.07 | % | | 7,138 | | | 0.22 | % | | 0.04 | % | | 1.26 | % |
Year Ended October 31, 2010(g) | | | 0.01 | %(f) | | ** | | | 0.13 | % | | 0.00 | %(f) | | 1.27 | % |
|
|
|
|
|
|
|
|
|
|
|
|
|
|
|
|
|
CLASS D SHARES | | | | | | | | | | | | | | | | |
Year Ended October 31, 2006 | | | 3.90 | % | $ | 302,637 | | | 0.60 | % | | 3.85 | % | | 0.62 | % |
Year Ended October 31, 2007 | | | 4.34 | %(d) | | 297,120 | | | 0.53 | %(d) | | 4.28 | %(d) | | 0.62 | % |
Year Ended October 31, 2008 | | | 1.53 | % | | 937,905 | | | 0.52 | % | | 1.33 | % | | 0.59 | % |
Year Ended October 31, 2009 | | | 0.07 | % | | 955,652 | | | 0.23 | % | | 0.06 | % | | 0.51 | % |
Year Ended October 31, 2010 | | | 0.01 | %(f) | | 726,244 | | | 0.14 | % | | 0.01 | %(f) | | 0.52 | % |
|
|
|
|
|
|
|
|
|
|
|
|
|
|
|
|
|
CLASS I SHARES | | | | | | | | | | | | | | | | |
Year Ended October 31, 2006 | | | 4.37 | % | $ | 6,521 | | | 0.19 | % | | 4.12 | % | | 0.27 | % |
Year Ended October 31, 2007 | | | 4.74 | %(d) | | 73,460 | | | 0.15 | %(d) | | 4.38 | %(d) | | 0.22 | % |
Year Ended October 31, 2008 | | | 1.90 | % | | 3,771,262 | | | 0.16 | % | | 1.26 | % | | 0.16 | % |
Year Ended October 31, 2009 | | | 0.14 | % | | 3,322,962 | | | 0.16 | % | | 0.14 | % | | 0.16 | % |
Year Ended October 31, 2010 | | | 0.01 | %(f) | | 1,379,042 | | | 0.13 | % | | 0.01 | %(f) | | 0.17 | % |
|
|
|
|
|
|
|
|
|
|
|
|
|
|
|
|
|
CLASS Y SHARES | | | | | | | | | | | | | | | | |
Year Ended October 31, 2006 | | | 4.16 | % | $ | 42,934 | | | 0.35 | % | | 4.07 | % | | 0.37 | % |
Year Ended October 31, 2007 | | | 4.60 | %(d) | | 41,256 | | | 0.27 | %(d) | | 4.34 | %(d) | | 0.32 | % |
Year Ended October 31, 2008 | | | 1.78 | % | | 1,364,310 | | | 0.27 | % | | 1.34 | % | | 0.27 | % |
Year Ended October 31, 2009 | | | 0.08 | % | | 996,309 | | | 0.22 | % | | 0.08 | % | | 0.26 | % |
Year Ended October 31, 2010 | | | 0.01 | %(f) | | 1,147,150 | | | 0.14 | % | | 0.01 | %(f) | | 0.27 | % |
|
|
|
|
|
|
|
|
|
|
|
|
|
|
|
|
|
| |
* | Less than $0.005 per share. |
| |
| |
** | Less than $500. |
| |
† | Calculated based on average shares outstanding. |
| |
(a) | Not annualized for periods less than one year. Total returns do not include redemption charges. |
| |
(b) | Annualized for periods less than one year. |
| |
(c) | Excludes fee reductions. If such fee reductions had not occurred, the ratio would have been as indicated. |
| |
(d) | During the year ended October 31, 2007, the Investment Adviser reimbursed amounts to certain Funds related to past marketing arrangements. The corresponding impact to the net expense ratio, net income ratio and the total return were 0.01%, 0.01%, 0.01%, 0.01% and 0.01% for Class A Shares, Class B Shares, Class D Shares, Class I Shares and Class Y Shares, respectively. |
| |
(e) | Class C Shares were operational during a portion of the year only. Amounts reflect performance for the period of time the class had operations, which was 26 days during the period. |
| |
(f) | During the year ended October 31, 2010, certain Funds (including the Fund) received a distribution from a “fair fund” established by the SEC in connection with a consent order against BISYS Fund Services, Inc. (See Note 7 in Notes to Financial Statements). The corresponding impact to the net income ratio and the total return was less than 0.005%. |
| |
(g) | Class C Shares were operational during a portion of the year only. Amounts reflect performance for the period of time the class had operations, which was 351 days during the period. |
| | |
See notes to financial statements | HSBC INVESTOR FAMILY OF FUNDS | 46 |
|
HSBC INVESTOR FAMILY OF FUNDS |
|
Notes to Financial Statements—as of October 31, 2010 |
| |
1. | Organization: |
| |
| HSBC Investor Funds (the “Trust’’), a Massachusetts business trust organized on April 22, 1987, is registered under the Investment Company Act of 1940, as amended (the “Act’’), as an open-end management investment company. As of October 31, 2010, the Trust is comprised of 15 separate operational funds, each a series of the HSBC Investor Family of Funds. The accompanying financial statements are presented for the following 6 funds (individually a “Fund,’’ collectively the “Funds’’): |
| | |
Fund | | Short Name |
| |
|
HSBC Investor California Tax-Free Money Market Fund | | California Tax-Free Money Market Fund |
HSBC Investor New York Tax-Free Money Market Fund | | N.Y. Tax-Free Money Market Fund |
HSBC Investor Prime Money Market Fund | | Prime Money Market Fund |
HSBC Investor Tax-Free Money Market Fund | | Tax-Free Money Market Fund |
HSBC Investor U.S. Government Money Market Fund | | U.S. Government Money Market Fund |
HSBC Investor U.S. Treasury Money Market Fund | | U.S. Treasury Money Market Fund |
| |
| All the Funds are diversified funds. Each Fund is a part of the HSBC Investor Family of Funds. |
| |
| Financial statements for all other Funds of HSBC Investor Family of Funds are published separately. |
| |
| The Funds are authorized to issue an unlimited number of shares of beneficial interest with a par value of $0.001 per share. The Funds are authorized to issue six classes of shares: Class A Shares, Class B Shares, Class C Shares, Class D Shares, Class E Shares and Class Y Shares. In addition, the Prime Money Market Fund, Tax-Free Money Market Fund, U.S. Government Money Market Fund and U.S. Treasury Money Market Fund are authorized to issue Class I Shares. The Class B Shares of the Funds are offered without any front-end sales charge but will be subject to a contingent deferred sales charge (“CDSC’’) ranging from a maximum of 4.00% if redeemed less than one year after purchase to 0.00% if redeemed more than four years after purchase. Class C Shares of the Funds are offered without any front-end sales charge but will be subject to a maximum CDSC of 1.00% if redeemed less than one year after purchase. No sales charges are assessed with respect to Class A, Class D, Class E, Class I or Class Y Shares of the Funds. Each class of shares in each Fund has identical rights and privileges, except with respect to arrangements pertaining to shareholder servicing and/or distribution, class-related expenses, voting rights on matters affecting a single class of shares, and exchange privileges. As of October 31, 2010, Class E Shares were not operational. |
| |
| Under the Trust’s organizational documents, the Funds’ officers and Trustees are indemnified against certain liabilities arising out of the performance of their duties to the Funds. In addition, in the normal course of business, the Trust may enter into contracts with its service providers, which also provide for indemnifications by the Funds. The Funds’ maximum exposure under these arrangements is unknown as this would involve future claims that may be made against the Funds. However, based on experience, the Trust expects that risk of loss to be remote. |
| |
2. | Significant Accounting Policies: |
| |
| The following is a summary of the significant accounting policies followed by the Funds in the preparation of their financial statements. The policies are in conformity with U.S. generally accepted accounting principles (“GAAP’’). The preparation of financial statements requires management to make certain estimates and assumptions that affect the reported amounts of assets and liabilities and disclosure of contingent assets and liabilities at the date of the financial statements and the reported amounts of increases and decreases in net assets from operations during the reporting period. Actual results could differ from those estimates. Management has evaluated events and transactions through the date the financial statements were available to be issued, for purposes of recognition or disclosure in these financial statements and there are no subsequent events to report. |
| |
| Securities Valuation: |
| |
| The Funds record their investments at fair value. Fair value is defined as the price that would be received to sell an asset or paid to transfer a liability in an orderly transaction between market participants at the measurement date. The valuation techniques used to determine fair value are further described below. |
| |
| Investment Transactions and Related Income: |
| |
| Investment transactions are accounted for no later than one business day after trade date. For financial reporting purposes, changes in holdings are accounted for on trade date on the last business day of the reporting period. Investment |
| |
47 | HSBC INVESTOR FAMILY OF FUNDS |
|
HSBC INVESTOR FAMILY OF FUNDS |
|
Notes to Financial Statements—as of October 31, 2010 (continued) |
| |
| gains and losses are calculated on the identified cost basis. Interest income is recognized on the accrual basis and includes, where applicable, the amortization or accretion of premium or discount. Dividend income is recorded on the ex-dividend date. |
| |
| Restricted and Illiquid Securities: |
| |
| A restricted security is a security which has been purchased through a private offering and cannot be resold to the general public without prior registration under the Securities Act of 1933 (the “1933 Act’’) or pursuant to the resale limitations provided by Rule 144 under the 1933 Act, or another exemption from the registration requirements of the 1933 Act. Certain restricted securities may be resold in transactions exempt from registration, normally to qualified institutional buyers, and may be deemed liquid by the Investment Adviser (as defined in Note 4) based on procedures established by the Board of Trustees. Therefore, not all restricted securities are considered illiquid. At October 31, 2010, the Funds did not hold any restricted securities that were deemed illiquid. |
| |
| Repurchase Agreements: |
| |
| The Funds (except U.S. Treasury Money Market Fund) may enter into repurchase agreements with an entity which is a member of the Federal Reserve System or which is a “primary dealer’’ (as designated by the Federal Reserve Bank of New York) in U.S. Government obligations. The U.S. Treasury Money Market Fund may temporarily invest in repurchase agreements collaterized by U.S. Treasury Obligations. The repurchase price generally equals the price paid by a Fund plus interest negotiated on the basis of current short-term rates, which may be more or less than the rate on the underlying portfolio securities. The seller, under a repurchase agreement, is required to maintain the collateral held pursuant to the agreement, with a fair value equal to or greater than the repurchase price (including accrued interest). Collateral subject to repurchase agreements is held by the Funds’ custodian or another qualified custodian or in the Federal Reserve/Treasury book-entry system. In the event of counterparty default, the Fund has the right to use the collateral to offset losses incurred. There is potential for loss to the Fund in the event the Fund is delayed or prevented from exercising its rights to dispose of the collateral securities, including the risk of a possible decline in the fair value of the underlying securities during the period while the Fund seeks to assert its rights. |
| |
| Allocations: |
| |
| Expenses directly attributable to a Fund are charged to that Fund. Expenses not directly attributable to a Fund are allocated proportionately among various or all funds within the HSBC Investor Family of Funds in relation to the net assets of each fund or on another reasonable basis. Class specific expenses are charged directly to the class incurring the expense. In addition, income, expenses (other than class specific expenses), and unrealized/realized gains and losses are allocated to each class based on relative net assets on a daily basis. |
| |
| Dividends to Shareholders: |
| |
| Dividends to shareholders from net investment income are declared daily and paid monthly from each Fund. Dividends from net realized gains, if any, are declared and paid at least annually by the Funds. Additional distributions are also made to the Funds’ shareholders to the extent necessary to avoid the federal excise tax on certain undistributed income and net realized gains of regulated investment companies. |
| |
| The character of net investment income and net realized gains distributed are determined in accordance with federal income tax regulations, which may differ from GAAP. These “book/tax’’ differences are either considered temporary or permanent in nature. To the extent these differences are permanent in nature (e.g., reclassification of market discounts, certain gain/loss, paydowns, and distributions), such amounts are reclassified within the composition of net assets based on their federal tax-basis treatment; temporary differences (e.g., wash losses and post-October loss deferrals) do not require reclassification. To the extent distributions to shareholders from net investment income and net realized gains exceed net investment income and net realized gains for tax purposes, they are reported as distributions of capital. |
| |
| Federal Income Taxes: |
| |
| Each Fund is a separate taxable entity for federal income tax purposes. Each Fund has qualified and intends to continue to qualify each year as a “regulated investment company’’ under Subchapter M of the Internal Revenue Code, as amended and to distribute substantially all of their taxable net investment income and net realized gains, if any, to their shareholders. Accordingly, no provision for federal income or excise tax is required. |
| |
| Management of the Funds has reviewed tax positions taken in tax years that remain subject to examination by all major tax jurisdictions, including federal (i.e., the last four tax year ends and the interim tax period since then, as appli- |
| |
HSBC INVESTOR FAMILY OF FUNDS | 48 |
|
HSBC INVESTOR FAMILY OF FUNDS |
|
Notes to Financial Statements—as of October 31, 2010 (continued) |
| |
| cable). Management believes that there is no tax liability resulting from unrecognized tax benefits related to uncertain tax positions taken. |
| |
3. | Investment Valuation Summary: |
| |
| The valuation techniques employed by the Funds, as described below, maximize the use of observable inputs and minimize the use of unobservable inputs in determining fair value. The inputs used for valuing the Funds’ investments are summarized in the three broad levels listed below: |
| |
| • Level 1: quoted prices in active markets for identical assets |
| |
| • Level 2: other significant observable inputs (including quoted prices for similar securities, interest rates, prepayments speeds, credit risk, etc.) |
| |
| • Level 3: significant unobservable inputs (including a Fund’s own assumptions in determining the fair value of investments) |
| |
| The inputs or methodology used for valuing investments are not necessarily an indication of the risk associated with investing in those investments. |
| |
| Investments of the Money Market Funds are valued using the amortized cost method pursuant to Rule 2a-7 under the Act, which approximates fair value and are typically categorized as Level 2 in the fair value hierarchy. The amortized cost method involves valuing an instrument at its cost initially and thereafter assuming a constant amortization to maturity of any discounts or premium, regardless of the impact of fluctuating interest rates on the market value of the instrument. The amortized cost method may result in periods during which value, as determined by amortized cost, is higher or lower than the price a Fund holding the instrument would receive if it sold the instrument. The fair value of securities in the Funds can be expected to vary with changes in prevailing interest rates. |
| |
| Investments in other money market funds are priced at net asset value as reported by such companies and are typically categorized as Level 1 in the fair value hierarchy. |
| |
| For the year ended October 31, 2010, there were no Level 3 investments for which significant unobservable inputs were used to determine fair value. |
| |
| The following is a summary of the valuation inputs used as of October 31, 2010 in valuing the Funds’ investments based upon the three levels defined above: |
| | | | | | | | | | | | | |
| | LEVEL 1 | | LEVEL 2 | | LEVEL 3 | | Total | |
| |
| |
| |
| |
| |
California Tax-Free Money Market Fund | | | | | | | | | | | | | |
Investment Securities: (a) | | | | | | | | | | | | | |
Commercial Paper and Notes | | $ | — | | $ | 1,000,000 | | $ | — | | $ | 1,000,000 | |
Municipal Bonds | | | — | | | 1,422,747 | | | — | | | 1,422,747 | |
Variable Rate Demand Notes | | | — | | | 42,875,000 | | | — | | | 42,875,000 | |
Investment Companies | | | 4,894,040 | | | — | | | — | | | 4,894,040 | |
| |
|
| |
|
| |
|
| |
|
| |
Total Investment Securities | | $ | 4,894,040 | | $ | 45,297,747 | | $ | — | | $ | 50,191,787 | |
| |
|
| |
|
| |
|
| |
|
| |
New York Tax-Free Money Market Fund | | | | | | | | | | | | | |
Investment Securities: (a) | | | | | | | | | | | | | |
Commercial Paper and Notes | | $ | — | | $ | 10,000,000 | | $ | — | | $ | 10,000,000 | |
Variable Rate Demand Notes | | | — | | | 466,634,000 | | | — | | | 466,634,000 | |
Municipal Bonds | | | — | | | 10,083,061 | | | — | | | 10,083,061 | |
Investment Companies | | | 13,806,897 | | | — | | | — | | | 13,806,897 | |
| |
|
| |
|
| |
|
| |
|
| |
Total Investment Securities | | $ | 13,806,897 | | $ | 486,717,061 | | $ | — | | $ | 500,523,958 | |
| |
|
| |
|
| |
|
| |
|
| |
| |
49 | HSBC INVESTOR FAMILY OF FUNDS |
|
HSBC INVESTOR FAMILY OF FUNDS |
|
Notes to Financial Statements—as of October 31, 2010 (continued) |
| | | | | | | | | | | | | |
| | LEVEL 1 | | LEVEL 2 | | LEVEL 3 | | Total | |
| |
| |
| |
| |
| |
Prime Money Market Fund | | | | | | | | | | | | | |
Investment Securities: (a) | | | | | | | | | | | | | |
Certificates of Deposit | | $ | — | | $ | 2,193,012,308 | | $ | — | | $ | 2,193,012,308 | |
Corporate Obligations | | | — | | | 538,606,649 | | | — | | | 538,606,649 | |
Commercial Paper and Notes | | | — | | | 2,733,584,095 | | | — | | | 2,733,584,095 | |
Municipal Bonds | | | — | | | 169,345,000 | | | — | | | 169,345,000 | |
Repurchase Agreements | | | — | | | 435,000,000 | | | — | | | 435,000,000 | |
Variable Rate Demand Notes | | | — | | | 418,455,000 | | | — | | | 418,455,000 | |
Time Deposits | | | — | | | 424,358,211 | | | — | | | 424,358,211 | |
U.S. Treasury Obligations | | | — | | | 601,771,018 | | | — | | | 601,771,018 | |
| |
|
| |
|
| |
|
| |
|
| |
Total Investment Securities | | $ | — | | $ | 7,514,132,281 | | $ | — | | $ | 7,514,132,281 | |
| |
|
| |
|
| |
|
| |
|
| |
| | | | | | | | | | | | | |
Tax-Free Money Market Fund | | | | | | | | | | | | | |
Investment Securities: (a) | | | | | | | | | | | | | |
Commercial Paper and Notes | | $ | — | | $ | 4,500,000 | | $ | — | | $ | 4,500,000 | |
Municipal Bonds | | | — | | | 12,054,142 | | | — | | | 12,054,142 | |
Variable Rate Demand Notes | | | — | | | 80,370,000 | | | — | | | 80,370,000 | |
Investment Companies | | | 3,640,580 | | | — | | | — | | | 3,640,580 | |
| |
|
| |
|
| |
|
| |
|
| |
Total Investment Securities | | $ | 3,640,580 | | $ | 96,924,142 | | $ | — | | $ | 100,564,722 | |
| |
|
| |
|
| |
|
| |
|
| |
| | | | | | | | | | | | | |
U.S. Government Money Market Fund | | | | | | | | | | | | | |
Investment Securities: (a) | | | | | | | | | | | | | |
U.S. Government and Government Agency Obligations | | $ | — | | $ | 4,456,017,950 | | $ | — | | $ | 4,456,017,950 | |
U.S. Treasury Obligations | | | — | | | 570,228,784 | | | — | | | 570,228,784 | |
Repurchase Agreements | | | — | | | 3,940,000,000 | | | — | | | 3,940,000,000 | |
| |
|
| |
|
| |
|
| |
|
| |
Total Investment Securities | | $ | — | | $ | 8,966,246,734 | | $ | — | | $ | 8,966,246,734 | |
| |
|
| |
|
| |
|
| |
|
| |
| | | | | | | | | | | | | |
U.S. Treasury Money Market Fund | | | | | | | | | | | | | |
Investment Securities: (a) | | | | | | | | | | | | | |
U.S. Treasury Obligations | | $ | — | | $ | 3,259,766,036 | | $ | — | | $ | 3,259,766,036 | |
| |
|
| |
|
| |
|
| |
|
| |
Total Investment Securities | | $ | — | | $ | 3,259,766,036 | | $ | — | | $ | 3,259,766,036 | |
| |
|
| |
|
| |
|
| |
|
| |
| |
|
(a) | For detailed investment categorizations, see the accompanying Schedules of Portfolio Investments. |
| |
| The Trust recognizes significant transfers between fair value hierarchy levels at the reporting period end. There were no significant transfers between Level 1 and 2 as of October 31, 2010. |
| |
4. | Related Party Transactions and Other Agreements and Plans: |
| |
| Investment Management: |
| |
| HSBC Global Asset Management (USA) Inc. (“HSBC’’ or the “Investment Adviser’’), a wholly owned subsidiary of HSBC Bank USA, N.A., a national bank organized under the laws of the United States, acts as Investment Adviser to the Funds. As Investment Adviser, HSBC manages the investments of the Funds and continuously reviews, supervises and administers the Funds’ investments pursuant to an Investment Advisory Agreement. For its services as investment adviser, HSBC receives a fee from each Fund, accrued daily and paid monthly, based on the average daily net assets of each respective Fund, at an annual rate of 0.10%. |
| |
HSBC INVESTOR FAMILY OF FUNDS | 50 |
|
HSBC INVESTOR FAMILY OF FUNDS |
|
Notes to Financial Statements—as of October 31, 2010 (continued) |
| |
| HSBC also provides operational support services to the Funds pursuant to an Operational Support Services Agreement. For its services in this capacity, HSBC receives a fee, accrued daily and paid monthly, based on the average daily net assets of Class A Shares, Class B Shares, Class C Shares, Class D Shares and Class Y Shares, at an annual rate of: |
| | | | |
Fund | | Fee Rate | |
| |
| |
California Tax-Free Money Market Fund | | 0.10 | % | |
N.Y. Tax-Free Money Market Fund | | 0.05 | % | |
Prime Money Market Fund | | 0.10 | % | |
Tax-Free Money Market Fund | | 0.10 | % | |
U.S. Government Money Market Fund | | 0.10 | % | |
U.S. Treasury Money Market Fund | | 0.10 | % | |
| |
| The Bank of New York Mellon (the “Servicer”) provides recordkeeping, reporting and processing services to the Prime Money Market Fund, U.S. Government Money Market Fund and U.S. Treasury Money Market Fund, Class I Shares. The Servicer is paid by the Investment Adviser from its profits and not by the Funds, for these services. |
| |
| Administration: |
| |
| HSBC serves the Funds as Administrator. Under the terms of the Administration Agreement, HSBC received from the Funds (as well as other funds in the HSBC Investor Family of Funds) a fee, accrued daily and paid monthly, at an annual rate of: |
| | | | |
Based on Average Daily Net Assets of | | Fee Rate | |
| |
| |
Up to $10 billion | | 0.0550 | % | |
In excess of $10 billion but not exceeding $20 billion | | 0.0350 | % | |
In excess of $20 billion but not exceeding $50 billion | | 0.0275 | % | |
In excess of $50 billion | | 0.0250 | % | |
| |
| The fee breakpoints are determined on the basis of the aggregate average daily net assets of the HSBC Investor Family of Funds. The fee is allocated to each of the HSBC Investor Family of Funds based upon its pro-rata share of net assets for each class, subject to certain allocations in cases where one fund invests some or all of its assets in another fund. An amount equal to 50% of the administration fees is deemed to be class specific. |
| |
| Pursuant to a Sub-Administration Agreement with HSBC, Citi Fund Services Ohio, Inc. (“Citi Ohio’’), a wholly-owned subsidiary of Citigroup, Inc., serves as Sub-Administrator for the Trusts and the HSBC Investor Family of Funds, subject to the general supervision of the Trusts’ Board of Trustees and HSBC. For these services, Citi Ohio is entitled to a fee, payable by HSBC, at an annual rate equivalent to the fee rates set forth above, minus 0.02% (2 basis points) which is retained by HSBC. During the year ended October 31, 2010 Citi Ohio voluntarily reduced its sub-administration fees by $264,653. During the year ended October 31, 2010, HSBC voluntarily reduced its administration fees by $407,594. |
| |
| Under a Compliance Services Agreement between the Trusts and Citi Ohio (the “CCO Agreement’’), Citi Ohio makes an employee available to serve as the Funds’ Chief Compliance Officer (the “CCO’’). Under the CCO Agreement, Citi Ohio also provides infrastructure and support in implementing the written policies and procedures comprising the Funds’ compliance program, including support services to the CCO. For the services provided under the CCO Agreement, the HSBC Investor Family of Funds paid Citi Ohio $269,869 for the year ended October 31, 2010, plus reimbursement of certain out of pocket expenses. Expenses incurred by each Fund are reflected on the Statements of Operations as “Compliance Services.’’ Citi Ohio pays the salary and other compensation earned by individuals performing these services, as employees of Citi Ohio. |
| |
| Distribution Arrangements: |
| |
| Foreside Distribution Services, L.P. (“Foreside”), a wholly-owned subsidiary of Foreside Financial Group LLC, serves the Trust as Distributor (the “Distributor’’). The Trust has adopted a non-compensatory Distribution Plan and Agreement (the “Distribution Plan’’) pursuant to Rule 12b-1 of the Act. The Distribution Plan provides for reimbursement of expenses incurred by the Distributor related to distribution and marketing, at a rate not to exceed 0.25%, 1.00%, 1.00% and 0.25% of the average daily net assets of Class A Shares (currently not being charged), Class B Shares (currently charging 0.75%), Class C Shares (currently charging 0.75%) and Class D Shares (currently not being charged) of the Funds, respectively. As of the most recent fiscal year end, Foreside, as Distributor, also received $628,328, $459,202 and $43,157 in commissions from sales of HSBC Investor Family of Funds, for Class A Shares, Class B Shares and Class C Shares, |
| |
51 | HSBC INVESTOR FAMILY OF FUNDS |
|
HSBC INVESTOR FAMILY OF FUNDS |
|
Notes to Financial Statements—as of October 31, 2010 (continued) |
| |
| respectively, of which $60, $12 and $— were reallocated to HSBC-affiliated brokers and dealers for Class A Shares, Class B Shares and Class C Shares, respectively. Expenses reduced during the year ended October 31, 2010 are reflected on the Statements of Operations as “Fees voluntarily reduced by Distributor.” |
| |
| Shareholder Servicing: |
| |
| The Trust has adopted a Shareholder Services Plan, which provides for payments to shareholder servicing agents (which primarily consist of HSBC and its affiliates) for providing various shareholder services. For performing these services, the shareholder servicing agents receive a fee that is computed daily and paid monthly up to 0.60%, 0.25%, 0.25% and 0.25% of the average daily net assets of Class A Shares (currently charging 0.40%), Class B Shares, Class C Shares and Class D Shares of the Funds, respectively. The fees paid to the Distributor pursuant to the Distribution Plan and to shareholder servicing agents pursuant to the Shareholder Services Plan may not exceed, in the aggregate, 0.85%, 1.00%, 1.00% and 0.50% annually of each Fund’s average daily net assets of Class A Shares, Class B Shares, Class C Shares and Class D Shares, respectively. Expenses reduced during the year ended October 31, 2010 are reflected on the Statements of Operations as “Fees voluntarily reduced by Shareholder Servicing Agent.” |
| |
| Fund Accounting, Transfer Agent and Trustees: |
| |
| Citi Ohio provides fund accounting and transfer agency services for each fund of the HSBC Investor Family of Funds. As transfer agent, Citi Ohio receives a fee based on the number of funds and shareholder accounts, subject to certain minimums and reimbursement of certain expenses. As fund accountant, Citi Ohio receives an annual fee per fund and share class, subject to certain minimums and reimbursement of certain expenses. Citi Ohio receives additional fees paid by the Trust for blue sky exemption services. |
| |
| Each non-interested Trustee is compensated with a $60,000 annual Board retainer for service as a Trustee of the Trust and the other HSBC Investor Funds, as well as a $3,000 annual retainer for each Committee of the Board of the Trust and other HSBC Investor Funds. Each non-interested Trustee also receives a $5,000 and $3,000 meeting fee for each regular in-person Board meeting and Committee meeting, respectively. Furthermore, each non-interested Trustee receives compensation for attending special meetings and/or functioning as a Committee or Board Chairperson. In addition, the non-interested Trustees are reimbursed for certain expenses incurred in connection with their Board membership. |
| |
| Fee Reductions: |
| |
| The Investment Adviser has agreed to contractually limit through March 1, 2011 the annual total expenses, exclusive of interest, taxes, brokerage commissions, and extraordinary expenses, of the California Tax-Free Money Market Fund, Prime Money Market Fund, U.S. Government Money Market Fund and U.S. Treasury Money Market Fund. Each Fund Class has its own expense limitations based on the average daily net assets for any full fiscal year as follows: |
| | | | | | | |
Fund | | Class | | Contractual
Expense
Limitations | |
| |
| |
| |
California Tax-Free Money Market Fund | | A | | | 0.80 | % | |
California Tax-Free Money Market Fund | | B | | | 1.40 | %* | |
California Tax-Free Money Market Fund | | C | | | 1.40 | % | |
California Tax-Free Money Market Fund | | D | | | 0.65 | % | |
California Tax-Free Money Market Fund | | E | | | 0.35 | %** | |
California Tax-Free Money Market Fund | | Y | | | 0.40 | % | |
Prime Money Market Fund | | E | | | 0.25 | %** | |
Prime Money Market Fund | | I | | | 0.20 | % | |
U.S. Government Money Market Fund | | E | | | 0.25 | %** | |
U.S. Government Money Market Fund | | I | | | 0.20 | % | |
U.S. Treasury Money Market Fund | | E | | | 0.25 | %** | |
U.S. Treasury Money Market Fund | | I | | | 0.20 | % | |
| | |
|
|
| * | The California Tax-Free Money Market Fund Class B Shares have not commenced operations as of October 31, 2010. |
| | |
| ** | As of October 31, 2010, Class E Shares were not operational. |
| |
| Any amounts contractually waived or reimbursed by the Investment Adviser will be subject to repayment by the Fund to the Investment Adviser within three years to the extent that the repayment will not cause the Fund’s operating expenses to exceed the contractual expense limit that was in effect at the time of such waiver or reimbursement. During the year |
| |
HSBC INVESTOR FAMILY OF FUNDS | 52 |
|
HSBC INVESTOR FAMILY OF FUNDS |
|
Notes to Financial Statements—as of October 31, 2010 (continued) |
| |
| ended October 31, 2010, the Investment Adviser did not recapture any of its prior contractual waivers or reimbursements. As of October 31, 2010, the repayments that may potentially be made by the Funds are as follows: |
| | | | | | | | | | |
Fund | | 2013($) | | 2012($) | | 2011($) | |
| |
| |
| |
| |
California Tax-Free Money Market Fund | | $ | 52,407 | | | — | | | — | |
| |
| The Administrator and Citi Ohio may voluntarily waive/reimburse fees to help support the expense limits of the Funds. In addition, the Administrator and Investment Adviser may waive/reimburse additional fees at their discretion. Any voluntary fee waivers/reimbursements are not subject to recoupment in subsequent fiscal periods. Voluntary waivers/reimbursements may be stopped at any time. Amounts waived/reimbursed by the Investment Adviser, Administrator and Citi Ohio are reported separately on the Statements of Operations, as applicable. |
| |
| The Funds have entered into an arrangement with their custodian whereby credits realized as a result of uninvested cash balances are used to reduce a portion of the Funds’ custodian expenses. Expenses reduced during the period ended October 31, 2010 are reflected on the Statements of Operations as “Fees Reduced by Custody Credits.” |
| |
5. | Concentration of Credit Risk: |
| |
| The California Tax-Free Money Market Fund and N.Y. Tax-Free Money Market Fund invest primarily in debt obligations issued by the State of California and the State of New York, respectively, and their respective political subdivisions, agencies and public authorities. The Funds are more susceptible to economic and political factors adversely affecting issuers of California and New York municipal securities than are municipal money market funds that are not concentrated in these issuers to the same extent. |
| |
6. | Federal Income Tax Information: |
| |
| At October 31, 2010, the cost basis of securities for federal income tax purposes, gross unrealized appreciation, gross unrealized depreciation and net unrealized appreciation/depreciation were as follows: |
| | | | | | | | | | | | | |
Fund | | Tax Cost | | Tax
Unrealized
Appreciation | | Tax
Unrealized
Depreciation | | Net Unrealized
Appreciation/
(Depreciation) | |
| |
| |
| |
| |
| |
California Tax-Free Money Market Fund | | $ | 50,191,787 | | $ | — | | $ | — | | $ | — | |
New York Tax-Free Money Market Fund | | | 500,523,958 | | | — | | | — | | | — | |
Prime Money Market Fund | | | 7,514,132,281 | | | — | | | — | | | — | |
Tax-Free Money Market Fund | | | 100,564,722 | | | — | | | — | | | — | |
U.S. Government Money Market Fund | | | 8,966,246,734 | | | — | | | — | | | — | |
U.S Treasury Money Market Fund | | | 3,259,766,036 | | | — | | | — | | | — | |
| |
| The tax character of dividends paid by the Funds for the year ended October 31, 2010 was as follows: |
| | | | | | | | | | | | | | | | |
| | Dividends paid from | |
| |
| |
| | Ordinary
Income | | Net
Long Term
Capital
Gains | | Total
Taxable
Dividends | | Tax
Exempt
Distributions | | Total
Dividends
Paid(1) | |
| |
| |
| |
| |
| |
| |
California Tax-Free Money Market Fund | | $ | 559 | | $ | — | | $ | 559 | | $ | 13,425 | | $ | 13,984 | |
New York Tax-Free Money Market Fund | | | 4,313 | | | 56 | | | 4,369 | | | 92,885 | | | 97,254 | |
Prime Money Market Fund | | | 10,613,089 | | | — | | | 10,613,089 | | | — | | | 10,613,089 | |
Tax-Free Money Market Fund | | | 35 | | | — | | | 35 | | | 78,140 | | | 78,175 | |
U.S. Government Money Market Fund | | | 7,207,291 | | | — | | | 7,207,291 | | | — | | | 7,207,291 | |
U.S Treasury Money Market Fund | | | 533,359 | | | — | | | 533,359 | | | — | | | 533,359 | |
| |
| The tax character of dividends paid by the Funds for the year ended October 31, 2009 was as follows: |
| | | | | | | | | | | | | | | | |
| | Dividends paid from | |
| |
| |
| | Ordinary
Income | | Net
Long Term
Capital
Gains | | Total
Taxable
Dividends | | Tax
Exempt
Distributions | | Total
Dividends
Paid(1) | |
| |
| |
| |
| |
| |
| |
California Tax-Free Money Market Fund | | $ | — | | $ | — | | $ | — | | $ | 314,207 | | $ | 314,207 | |
New York Tax-Free Money Market Fund | | | 14,699 | | | — | | | 14,699 | | | 5,594,422 | | | 5,609,121 | |
Prime Money Market Fund | | | 69,404,711 | | | — | | | 69,404,711 | | | — | | | 69,404,711 | |
Tax-Free Money Market Fund | | | 717 | | | 2 | | | 719 | | | 1,543,185 | | | 1,543,904 | |
U.S. Government Money Market Fund | | | 65,922,133 | | | — | | | 65,922,133 | | | — | | | 65,922,133 | |
U.S Treasury Money Market Fund | | | 10,236,049 | | | — | | | 10,236,049 | | | — | | | 10,236,049 | |
| | |
|
|
| (1) | Total dividends paid may differ from the amount reported in the Statement of Changes in Net Assets because dividends are recognized when actually paid for tax purposes. |
| |
53 | HSBC INVESTOR FAMILY OF FUNDS |
|
HSBC INVESTOR FAMILY OF FUNDS |
|
Notes to Financial Statements—as of October 31, 2010 (continued) |
As of October 31, 2010, the components of accumulated earnings/(deficit) on a tax basis for the Funds were as follows:
| | | | | | | | | | | | | | | | | | | | | | | | | |
| | Undistributed
Ordinary
Income | | Undistributed
Tax Exempt
Income | | Undistributed
Long Term
Capital Gains | | Accumulated
Earnings | | Dividends
Payable | | Accumulated
Capital
and Other
Losses | | Unrealized
Appreciation/
(Depreciation) | | Total
Accumulated
Earnings/
(Deficit) | |
| |
| |
| |
| |
| |
| |
| |
| |
| |
California Tax-Free Money Market Fund | | $ | — | | $ | 2,062 | | $ | — | | $ | 2,062 | | $ | (2,062 | ) | $ | (1,584 | ) | $ | — | | $ | (1,584 | ) |
New York Tax-Free Money Market Fund | | | — | | | 16,470 | | | — | | | 16,470 | | | (16,468 | ) | | — | | | — | | | 2 | |
Prime Money Market Fund | | | 648,604 | | | — | | | — | | | 648,604 | | | (644,724 | ) | | (200,309 | ) | | — | | | (196,429 | ) |
Tax-Free Money Market Fund | | | 1,744 | | | 2,443 | | | 35 | | | 4,222 | | | (2,443 | ) | | — | | | — | | | 1,779 | |
U.S. Government Money Market Fund | | | 461,197 | | | — | | | — | | | 461,197 | | | (460,695 | ) | | (180,513 | ) | | — | | | (180,011 | ) |
U.S Treasury Money Market Fund | | | 72,629 | | | — | | | — | | | 72,629 | | | (29,046 | ) | | — | | | — | | | 43,583 | |
| |
| As of October 31, 2010, the following Funds have net capital loss carryforwards, which are available to offset future realized gains, if any, to the extent provided by the Treasury regulations. To the extent that these carryforwards are used to offset future capital gains, it is probable that the gains that are offset will not be distributed to shareholders. |
| | | | | | | |
Fund | | Amount | | Expires | |
| |
| |
| |
California Tax-Free Money Market Fund | | $ | 1,583 | | | 2016 | |
California Tax-Free Money Market Fund | | | 1 | | | 2017 | |
Prime Money Market Fund | | | 200,309 | | | 2016 | |
U.S. Government Money Market Fund | | | 180,513 | | | 2018 | |
| |
| As of October 31, 2010, the following Funds utilized capital loss carryforwards to offset capital gains realized: |
| | | | |
Fund | | Amount | |
| |
| |
California Tax-Free Money Market Fund | | $ | 1,341 | |
Prime Money Market Fund | | | 173,883 | |
U.S. Treasury Money Market Fund | | | 75,493 | |
| |
7. | Legal and Regulatory Matters: |
| |
| On September 26, 2006 BISYS Fund Services, Inc. (“BISYS’’), an affiliate of BISYS Fund Services Ohio, Inc. which provided various services to the Funds, reached a settlement with the Securities and Exchange Commission (the “SEC’’) regarding the SEC’s investigation related to BISYS’ past payment of certain marketing and other expenses with respect to certain of its mutual fund clients. The related settlement monies were received by the Funds during the year ended October 31, 2010 and are disclosed in the Statements of Operations as “Other Income”. The corresponding impact to the net income ratio and total return for the year ended October 31, 2010 are disclosed in the Funds’ Financial Highlights. |
| |
8. | Subsequent Events (Unaudited): |
| |
| Effective November 1, 2010, each non-interested Trustee is compensated with a $63,000 annual Board retainer for service as a Trustee of the Trust and the other HSBC Investor Funds, as well as a $3,000 annual retainer for each Committee of the Board of the Trust and other HSBC Investor Funds. Each non-interested Trustee also receives a $5,000 and $3,000 meeting fee for each regular in-person Board meeting and Committee meeting, respectively. Furthermore, each non-interested Trustee receives compensation for attending special meetings and/or functioning as a Committee or Board Chairperson. In addition, the noninterested Trustees are reimbursed for certain expenses incurred in connection with their Board membership. |
| |
HSBC INVESTOR FAMILY OF FUNDS | 54 |
REPORT OF INDEPENDENT REGISTERED PUBLIC ACCOUNTING FIRM
To the Shareholders and Board of Trustees of
HSBC Investor Funds:
We have audited the accompanying statements of assets and liabilities of HSBC Investor California Tax-Free Money Market Fund, HSBC Investor New York Tax-Free Money Market Fund, HSBC Investor Prime Money Market Fund, HSBC Investor Tax-Free Money Market Fund, HSBC Investor U.S. Government Money Market Fund and HSBC Investor U.S. Treasury Money Market Fund (the Funds), including the schedules of portfolio investments, as of October 31, 2010, and the related statements of operations for the year then ended, the statements of changes in net assets for each year in the two-year period then ended, and the financial highlights for each year in the five-year period then ended. These financial statements and financial highlights are the responsibility of the Funds’ management. Our responsibility is to express an opinion on these financial statements and financial highlights based on our audits.
We conducted our audits in accordance with the standards of the Public Company Accounting Oversight Board (United States). Those standards require that we plan and perform the audits to obtain reasonable assurance about whether the financial statements and financial highlights are free of material misstatement. An audit includes examining, on a test basis, evidence supporting the amounts and disclosures in the financial statements. Our procedures included confirmation of securities owned as of October 31, 2010, by correspondence with custodians and brokers or by other appropriate auditing procedures. An audit also includes assessing the accounting principles used and significant estimates made by management, as well as evaluating the overall financial statement presentation. We believe that our audits provide a reasonable basis for our opinion.
In our opinion, the financial statements and financial highlights referred to above present fairly, in all material respects, the financial position of the Funds as of October 31, 2010, the results of their operations for the year then ended, the changes in their net assets for each year in the two-year period then ended, and the financial highlights for each year in the five-year period then ended, in conformity with U.S. generally accepted accounting principles.

Columbus, Ohio
December 22, 2010
| |
55 | HSBC INVESTOR FAMILY OF FUNDS |
|
HSBC INVESTOR FAMILY OF FUNDS |
|
Other Federal Income Tax Information (Unaudited): |
| |
| During the year ended October 31, 2010 the following Funds designated income dividends as exempt-interest dividends: |
| | | | |
Fund | | Amount | |
| |
| |
California Tax-Free Money Market Fund | | $ | 13,425 | |
New York Tax-Free Money Market Fund | | | 92,885 | |
Tax-Free Money Market Fund | | | 78,140 | |
| |
| During the year ended October 31, 2010, the following Funds declared net long term capital gain distributions: |
| | | | |
Fund | | Amount | |
| |
| |
New York Tax-Free Money Market Fund | | $ | 56 | |
| |
| During the year ended October 31, 2010, the following Funds declared net short term capital gain distributions: |
| | | | |
Fund | | Amount | |
| |
| |
U.S. Government Money Market Fund | | $ | 1,358,500 | |
| |
| During the year ended October 31, 2010, the following Funds designated the maximum amount allowable as interest-related dividends for certain non-U.S. resident investors: |
| | | | |
Fund | | Qualified
Interest
Income | |
| |
| |
Prime Money Market Fund | | | 100 | % |
U.S. Government Money Market Fund | | | 100 | % |
U.S. Treasury Money Market Fund | | | 100 | % |
| |
HSBC INVESTOR FAMILY OF FUNDS | 56 |
|
HSBC INVESTOR FAMILY OF FUNDS |
|
Table of Shareholder Expenses (Unaudited)—as of October 31, 2010 |
| |
| As a shareholder of the HSBC Investor Funds (“Funds”), you incur two types of costs: (1) transaction costs, shareholder servicing fees; and exchange fees: (2) ongoing costs, including management fees; distribution; and other Fund expenses. These examples are intended to help you understand your ongoing costs (in dollars) of investing in the Funds (“Funds”) and to compare the cost with the ongoing costs of investing in other mutual funds. |
| |
| These examples are based on an investment of $1,000 invested at the beginning of the period and held for the entire period from May 1, 2010 through October 31, 2010. |
| |
| Actual Example |
| |
| The table below provides information about actual account values and actual expenses. You may use the information below, together with the amount you invested, to estimate the expenses that you paid over the period. Simply divide your account value by $1,000 (for example, an $8,600 account value divided by $1,000 = 8.6), then multiply the result by the number in the table under the heading entitled “Expenses Paid During Period” to estimate the expenses you paid on your account during this period. |
| | | | | | | | | | | | | | | | | | | | | | |
| | | | Beginning
Account Value
5/1/10 | | Ending
Account Value
10/31/10 | | Expenses Paid
During Period*
5/1/10 – 10/31/10 | | Annualized
Expense Ratio
During Period
5/1/10 – 10/31/10 | |
| | | |
| |
| |
| |
| |
California Tax-Free Money Market Fund** | | Class A Shares(a) | | | $ | 1,000.00 | | | | $ | 1,000.10 | | | | $ | 1.01 | | | | 0.24 | % | |
| | Class D Shares | | | | 1,000.00 | | | | | 1,000.10 | | | | | 1.21 | | | | 0.24 | % | |
| | Class Y Shares | | | | 1,000.00 | | | | | 1,000.10 | | | | | 1.21 | | | | 0.24 | % | |
New York Tax-Free Money Market Fund** | | Class A Shares | | | | 1,000.00 | | | | | 1,000.10 | | | | | 1.16 | | | | 0.23 | % | |
| | Class B Shares(b) | | | | 1,000.00 | | | | | 1,000.00 | | | | | 1.05 | | | | 0.25 | % | |
| | Class D Shares | | | | 1,000.00 | | | | | 1,000.10 | | | | | 1.16 | | | | 0.23 | % | |
| | Class Y Shares | | | | 1,000.00 | | | | | 1,000.10 | | | | | 1.16 | | | | 0.23 | % | |
Prime Money Market Fund | | Class A Shares | | | | 1,000.00 | | | | | 1,000.10 | | | | | 1.66 | | | | 0.33 | % | |
| | Class B Shares | | | | 1,000.00 | | | | | 1,000.10 | | | | | 1.66 | | | | 0.33 | % | |
| | Class C Shares | | | | 1,000.00 | | | | | 1,000.10 | | | | | 1.71 | | | | 0.34 | % | |
| | Class D Shares | | | | 1,000.00 | | | | | 1,000.10 | | | | | 1.66 | | | | 0.33 | % | |
| | Class I Shares | | | | 1,000.00 | | | | | 1,000.90 | | | | | 0.86 | | | | 0.17 | % | |
| | Class Y Shares | | | | 1,000.00 | | | | | 1,000.40 | | | | | 1.36 | | | | 0.27 | % | |
Tax-Free Money Market Fund** | | Class A Shares | | | | 1,000.00 | | | | | 1,000.00 | | | | | 0.61 | | | | 0.12 | % | |
| | Class D Shares | | | | 1,000.00 | | | | | 1,000.00 | | | | | 1.36 | | | | 0.27 | % | |
| | Class Y Shares | | | | 1,000.00 | | | | | 1,000.40 | | | | | 0.96 | | | | 0.19 | % | |
U.S. Government Money Market Fund | | Class A Shares | | | | 1,000.00 | | | | | 1,000.10 | | | | | 1.26 | | | | 0.25 | % | |
| | Class B Shares | | | | 1,000.00 | | | | | 1,000.10 | | | | | 1.26 | | | | 0.25 | % | |
| | Class C Shares(c) | | | | 1,000.00 | | | | | 1,000.10 | | | | | 1.16 | | | | 0.25 | % | |
| | Class D Shares | | | | 1,000.00 | | | | | 1,000.10 | | | | | 1.26 | | | | 0.25 | % | |
| | Class I Shares | | | | 1,000.00 | | | | | 1,000.50 | | | | | 0.86 | | | | 0.17 | % | |
| | Class Y Shares | | | | 1,000.00 | | | | | 1,000.10 | | | | | 1.26 | | | | 0.25 | % | |
U.S. Treasury Money Market Fund | | Class A Shares | | | | 1,000.00 | | | | | 1,000.10 | | | | | 0.81 | | | | 0.16 | % | |
| | Class B Shares | | | | 1,000.00 | | | | | 1,000.10 | | | | | 0.81 | | | | 0.16 | % | |
| | Class C Shares(d) | | | | 1,000.00 | | | | | 1,000.00 | | | | | 0.75 | | | | 0.16 | % | |
| | Class D Shares | | | | 1,000.00 | | | | | 1,000.10 | | | | | 0.81 | | | | 0.16 | % | |
| | Class I Shares | | | | 1,000.00 | | | | | 1,000.10 | | | | | 0.81 | | | | 0.16 | % | |
| | Class Y Shares | | | | 1,000.00 | | | | | 1,000.10 | | | | | 0.81 | | | | 0.16 | % | |
| | |
|
* | Expenses are equal to the average account value over the period multiplied by the Fund’s annualized expense ratio, multiplied by the number of days in the most recent fiscal half-year divided by the number of days in the fiscal year (to reflect the one half year period). |
|
** | California Tax-Free Money Market Fund Class C Shares, New York Tax-Free Money Market Fund Class C Shares, Tax-Free Money Market Fund Class C Shares and Tax-Free Money Market Fund Class I Shares were operational during the fiscal year ended October 31, 2010, but were not operational during the most recent fiscal half-year. |
|
(a) | Expenses are equal to the California Tax-Free Money Market Fund Class A Shares annualized expense ratio multiplied by the average account value over the period, multiplied by the number of days in the period operational from May 1, 2010 to October 31, 2010 divided by the number of days in the fiscal year. |
|
(b) | Expenses are equal to the New York Money Market Fund Class B Shares annualized expense ratio multiplied by the average account value over the period, multiplied by the number of days in the period operational from May 1, 2010 to October 31, 2010 divided by the number of days in the fiscal year. |
|
(c) | Expenses are equal to the U.S. Government Money Market Fund Class C Shares annualized expense ratio multiplied by the average account value over the period, multiplied by the number of days in the period operational from May 1, 2010 to October 31, 2010 divided by the number of days in the fiscal year. |
|
(d) | Expenses are equal to the U.S. Treasury Money Market Fund Class C Shares annualized expense ratio multiplied by the average account value over the period, multiplied by the number of days in the period operational from May 1, 2010 to October 31, 2010 divided by the number of days in the fiscal year. |
| |
57 | HSBC INVESTOR FAMILY OF FUNDS |
|
HSBC INVESTOR FAMILY OF FUNDS |
|
Table of Shareholder Expenses (Unaudited)—as of October 31, 2010 (continued) |
| |
| Hypothetical Example for Comparison Purposes |
| |
| The table below provides information about hypothetical account values and hypothetical expenses based on each Fund’s actual expense ratio and an assumed rate of return of 5% per year before expenses, which is not the Fund’s actual return. The hypothetical account values and expenses may not be used to estimate the actual ending account balance or expenses you paid for the period. You may use this information to compare this 5% hypothetical example with the 5% hypothetical examples that appear in the shareholder reports of other funds. |
| |
| Please note that the expenses shown in the table are meant to highlight your ongoing costs only and do not reflect any transactional costs, such as sales charges (loads), redemption fees, or exchange fees. Therefore, the table is useful in comparing ongoing costs only, and will not help you determine the relative total costs of owning different funds. In addition, if these transactional costs were included, your costs would have been higher. |
| | | | | | | | | | | | | | | | | | | | | | |
| | | | Beginning
Account Value
5/1/10 | | Ending
Account Value
10/31/10 | | Expenses Paid
During Period*
5/1/10 – 10/31/10 | | Annualized
Expense Ratio
During Period
5/1/10 – 10/31/10 | |
| | | |
| |
| |
| |
| |
California Tax-Free Money Market Fund** | | Class A Shares(a) | | | $ | 1,000.00 | | | | $ | 1,024.00 | | | | $ | 1.22 | | | | 0.24 | % | |
| | Class D Shares | | | | 1,000.00 | | | | | 1,024.00 | | | | | 1.22 | | | | 0.24 | % | |
| | Class Y Shares | | | | 1,000.00 | | | | | 1,024.00 | | | | | 1.22 | | | | 0.24 | % | |
New York Tax-Free Money Market Fund** | | Class A Shares | | | | 1,000.00 | | | | | 1,024.05 | | | | | 1.17 | | | | 0.23 | % | |
| | Class B Shares(b) | | | | 1,000.00 | | | | | 1,023.95 | | | | | 1.28 | | | | 0.25 | % | |
| | Class D Shares | | | | 1,000.00 | | | | | 1,024.05 | | | | | 1.17 | | | | 0.23 | % | |
| | Class Y Shares | | | | 1,000.00 | | | | | 1,024.05 | | | | | 1.17 | | | | 0.23 | % | |
Prime Money Market Fund | | Class A Shares | | | | 1,000.00 | | | | | 1,023.54 | | | | | 1.68 | | | | 0.33 | % | |
| | Class B Shares | | | | 1,000.00 | | | | | 1,023.54 | | | | | 1.68 | | | | 0.33 | % | |
| | Class C Shares | | | | 1,000.00 | | | | | 1,023.49 | | | | | 1.73 | | | | 0.34 | % | |
| | Class D Shares | | | | 1,000.00 | | | | | 1,023.54 | | | | | 1.68 | | | | 0.33 | % | |
| | Class I Shares | | | | 1,000.00 | | | | | 1,024.35 | | | | | 0.87 | | | | 0.17 | % | |
| | Class Y Shares | | | | 1,000.00 | | | | | 1,023.84 | | | | | 1.38 | | | | 0.27 | % | |
Tax-Free Money Market Fund** | | Class A Shares | | | | 1,000.00 | | | | | 1,024.60 | | | | | 0.61 | | | | 0.12 | % | |
| | Class D Shares | | | | 1,000.00 | | | | | 1,023.84 | | | | | 1.38 | | | | 0.27 | % | |
| | Class Y Shares | | | | 1,000.00 | | | | | 1,024.25 | | | | | 0.97 | | | | 0.19 | % | |
U.S. Government Money Market Fund | | Class A Shares | | | | 1,000.00 | | | | | 1,023.95 | | | | | 1.28 | | | | 0.25 | % | |
| | Class B Shares | | | | 1,000.00 | | | | | 1,023.95 | | | | | 1.28 | | | | 0.25 | % | |
| | Class C Shares(c) | | | | 1,000.00 | | | | | 1,023.95 | | | | | 1.28 | | | | 0.25 | % | |
| | Class D Shares | | | | 1,000.00 | | | | | 1,023.95 | | | | | 1.28 | | | | 0.25 | % | |
| | Class I Shares | | | | 1,000.00 | | | | | 1,024.35 | | | | | 0.87 | | | | 0.17 | % | |
| | Class Y Shares | | | | 1,000.00 | | | | | 1,023.95 | | | | | 1.28 | | | | 0.25 | % | |
U.S. Treasury Money Market Fund | | Class A Shares | | | | 1,000.00 | | | | | 1,024.40 | | | | | 0.82 | | | | 0.16 | % | |
| | Class B Shares | | | | 1,000.00 | | | | | 1,024.40 | | | | | 0.82 | | | | 0.16 | % | |
| | Class C Shares(d) | | | | 1,000.00 | | | | | 1,024.40 | | | | | 0.82 | | | | 0.16 | % | |
| | Class D Shares | | | | 1,000.00 | | | | | 1,024.40 | | | | | 0.82 | | | | 0.16 | % | |
| | Class I Shares | | | | 1,000.00 | | | | | 1,024.40 | | | | | 0.82 | | | | 0.16 | % | |
| | Class Y Shares | | | | 1,000.00 | | | | | 1,024.40 | | | | | 0.82 | | | | 0.16 | % | |
| | |
|
* | Expenses are equal to the average account value over the period multiplied by the Fund’s annualized expense ratio, multiplied by the number of days in the most recent fiscal half-year divided by the number of days in the fiscal year (to reflect the one half year period). |
|
** | California Tax-Free Money Market Fund Class C Shares, New York Tax-Free Money Market Fund Class C Shares, Tax-Free Money Market Fund Class C Shares and Tax-Free Money Market Fund Class I Shares were operational during the fiscal year ended October 31, 2010, but were not operational during the most recent fiscal half-year. |
|
(a) | Expenses are equal to the California Tax-Free Money Market Fund Class A Shares annualized expense ratio multiplied by the average account value over the period, multiplied by the number of days in the most recent fiscal half-year, divided by the number of days in the fiscal year, (to reflect the one half year period). Information shown reflects values using the expense ratios for the 153 days of operation during the period, and has been annualized to reflect values for the period May 1, 2010 to October 31, 2010. |
|
(b) | Expenses are equal to the New York Money Market Fund Class B Shares annualized expense ratio multiplied by the average account value over the period, multiplied by the number of days in the most recent fiscal half-year, divided by the number of days in the fiscal year, (to reflect the one half year period). Information shown reflects values using the expense ratios for the 9 days of operation during the period, and has been annualized to reflect values for the period May 1, 2010 to October 31, 2010. |
|
(c) | Expenses are equal to the U.S. Government Money Market Fund Class C Shares annualized expense ratio multiplied by the average account value over the period, multiplied by the number of days in the most recent fiscal half-year, divided by the number of days in the fiscal year, (to reflect the one half year period). Information shown reflects values using the expense ratios for the 170 days of operation during the period, and has been annualized to reflect values for the period May 1, 2010 to October 31, 2010. |
|
(d) | Expenses are equal to the U.S. Treasury Money Market Fund Class C Shares annualized expense ratio multiplied by the average account value over the period, multiplied by the number of days in the most recent fiscal half-year, divided by the number of days in the fiscal year, (to reflect the one half year period). Information shown reflects values using the expense ratios for the 170 days of operation during the period, and has been annualized to reflect values for the period May 1, 2010 to October 31, 2010. |
| |
HSBC INVESTOR FAMILY OF FUNDS | 58 |
MANAGEMENT OF THE TRUST
The following table contains information regarding the HSBC Investor Family of Funds Board of Trustees (“Trustees”). Asterisks indicate those Trustees who are “interested persons,” as defined in the Investment Company Act of 1940, as amended, of the HSBC Investor Family of Funds. The HSBC Investor Family of Funds’ Statement of Additional Information includes additional information about the Trustees and is available by calling (888) 525-5757.
| | | | | | | | | | |
Name, Address
and Age | | Position(s)
Held with
the HSBC
Investor Family
of Funds | | Term of Office and
Length of Time Served
with the HSBC Investor
Family of Funds | | Principal Occupation(s)
During Past 5 Years | | Number of
Portfolios in Fund
Complex Overseen
By Trustee* | | Other Directorships
Held by Trustee |
|
|
|
|
|
|
|
|
|
|
|
| | | | | | | | | | |
NON-INTERESTED |
TRUSTEES |
| | | | | | | | | | |
Marcia L. Beck
P.O. Box 182845
Columbus, OH 43218-3035
Age: 55 | | Trustee | | Indefinite; June 2008
to present | | Private Investor (June 1999 – present); Executive Vice President, Prudential Investments (1997 – 1999); President and Trustee, The Goldman Sachs Mutual Funds (1992 – 1996) | | 32 | | None |
|
|
|
|
|
|
|
|
|
|
|
Susan S. Huang
P.O. Box 182845
Columbus, OH 43218-3035
Age: 56 | | Trustee | | Indefinite; June 2008
to present | | Private Investor (2000 – present); Senior Vice President, Schroder Investment Management (2001 – 2004); Managing Director, Chase Asset Management (1995 – 2000) | | 32 | | None |
|
|
|
|
|
|
|
|
|
|
|
Alan S. Parsow
P.O. Box 182845
Columbus, OH 43218-3035
Age: 60 | | Trustee | | Indefinite; 1987
to present | | General Partner, Elkhorn Partners, L.P. (a private investment partnership) (1989 – present) | | 32 | | Penn Treaty American Corporation (insurance) |
|
|
|
|
|
|
|
|
|
|
|
Thomas F. Robards
P.O. Box 182845
Columbus, OH 43218-3035
Age: 64 | | Trustee | | Indefinite; 2005
to present | | Partner, Robards & Co. LLC (investment and advisory services) (2005 – present); Chief Financial Officer, American Museum of Natural History (2003 – 2004) Chief Financial Officer, Datek Online Holdings (2000 – 2003); Previously EVP and CFO Republic New York Corporation | | 32 | | Overseas Shipholding Group (NYSE listed energy transportation); Ellington Financial LLC (NYSE listed financial services); Financial Federal Corporation (NYSE listed specialty finance) |
|
|
|
|
|
|
|
|
|
|
|
Michael Seely
P.O. Box 182845
Columbus, OH 43218-3035
Age: 65 | | Chairman
and Trustee | | Indefinite; 1987
to present | | Private Investor (2003 – present); General Partner, Global Multi Manager Partners (1999 – 2003); President of Investor Access Corporation (1981 – 2003) | | 32 | | None |
|
|
|
|
|
|
|
|
|
|
|
| | | | | | | | | | |
EMERITUS TRUSTEE |
| | | | | | | | | | |
Larry M. Robbins
P.O. Box 182845
Columbus, OH 43218-3035
Age: 71 | | Emeritus
Trustee | | Until December 31, 2011;
Trustee from 1987
to December 31, 2010 | | Private Investor (2007 – present); Director, Center for Teaching and Learning, University of Pennsylvania (1999 – 2007) | | 32 | | None |
|
|
|
|
|
|
|
|
|
|
|
| |
* | Includes both the Fund and the underlying fund for Funds with a master/feeder structure. |
| |
59 | HSBC INVESTOR FAMILY OF FUNDS |
|
HSBC INVESTOR FAMILY OF FUNDS |
|
Board of Trustees and Officers (Unaudited) (continued) |
The names of the officers, their addresses, ages, position(s) held with the Trust, and principal occupation(s) during the past five years are described in the table below.
| | | | | | |
Name, Address
and Age | | Position(s)
Held with
the HSBC
Investor Family
of Funds | | Term of Office and
Length of Time Served
with the HSBC Investor
Family of Funds | | Principal Occupation(s)
During Past 5 Years |
|
|
|
|
|
|
|
| | | | | | |
OFFICERS | | | | | | |
| | | | | | |
Richard A. Fabietti
452 Fifth Avenue
New York, NY 10018
Age: 52 | | President | | One year; 2004
to present | | Senior Vice President, Head of Product Management, HSBC Global Asset Management (USA) Inc. (1998 – present) |
|
|
|
|
|
|
|
Stephen Sivillo
452 Fifth Avenue
New York, NY 10018
Age: 39 | | Vice President | | One year; 2010
to present | | Vice President of Product Administration, HSBC Global Asset Management (USA) Inc. (2010 – present); Chief Compliance Officer, Managers Funds (2009 – 2010); Director, Mutual Fund Compliance, AllianceBernstein (2007 – 2009); Assistant Vice President, Compliance, AllianceBernstein (2005 – 2007) |
|
|
|
|
|
|
|
Ty Edwards*
3435 Stelzer Road
Columbus, OH 43219-3035
Age: 44 | | Treasurer | | One year; 2010
to present | | Senior Vice President, Citi Fund Services (2010 – present); Director, Product Management, Columbia Management (2007 – 2009); Deputy Treasurer, Columbia Funds, (2006 – 2007); Director, Fund Administration, Columbia Management (2004 – 2007) |
|
|
|
|
|
|
|
Jennifer A. English*
100 Summer Street
Suite 1500
Boston, MA 02110
Age: 38 | | Secretary | | One year; 2008
to present | | Senior Vice President, Regulatory Administration, Citi (2005 – present) |
|
|
|
|
|
|
|
F. Martin Fox
100 Summer Street
Suite 1500
Boston, MA 02110
Age: 47 | | Assistant Secretary | | One year; 2008
to present | | Assistant Vice President, Regulatory Administration, Citi (May 2008 – present); Contract Attorney, Update Legal LLC (2002 – 2008) |
|
|
|
|
|
|
|
Frederick J. Schmidt*
1 Rexcorp Plaza
Uniondale, NY 11556
Age: 51 | | Chief
Compliance Officer | | One year; 2004
to present | | Senior Vice President and Chief Compliance Officer, CCO Services, Citi (2004 – present) |
|
|
|
|
|
|
|
| |
* | Mr. Edwards, Mr. Schmidt and Ms. English also are officers of certain other investment companies of which Citi (or an affiliate) is the administrator or sub-administrator. |
| |
HSBC INVESTOR FAMILY OF FUNDS | 60 |
Other Information:
Information regarding how the Funds voted proxies relating to portfolio securities during the most recent 12-month period ended June 30th is available (i) without charge, upon request, by calling 1-800-525-5757 for HSBC Bank USA and HSBC Brokerage (USA) Inc. clients and 1-800-782-8183 for all other shareholders; (ii) on the Funds’ website at www.investorfunds.us.hsbc.com; and (iii) on the Security and Exchange Commission’s (“Commission”) website at http://www.sec.gov.
(i) The Funds file their complete schedules of portfolio holdings with the Commission for the first and third quarters of each fiscal year on Form N-Q; (ii) the Funds’ Forms N-Q are available on the Commission’s website at http://www.sec.gov; (iii) the Funds’ Forms N-Q may be reviewed and copied at the Commission’s Public Reference Room in Washington, DC and information on the operation of the Public Reference Room may be obtained by calling 1-800-SEC-0330; and (iv) the Funds’ Schedules of Investments will be available no later than 60 days after each period end, without charge, on the Funds’ website at www.investorfunds.us.hsbc.com.
An investment in a Fund is not a deposit of HSBC Bank USA, National Association, and is not insured or guaranteed by the Federal Deposit Insurance Corporation or any other government agency.
| |
61 | HSBC INVESTOR FAMILY OF FUNDS |
| | |
HSBC INVESTOR FAMILY OF FUNDS: | | CUSTODIAN |
| | The Northern Trust Company |
INVESTMENT ADVISER AND ADMINISTRATOR | | 50 South LaSalle Street |
HSBC Global Asset Management (USA) Inc. | | Chicago, IL 60603 |
452 Fifth Avenue | | |
New York, NY 10018 | | INDEPENDENT REGISTERED PUBLIC |
| | ACCOUNTING FIRM |
SHAREHOLDER SERVICING AGENTS | | KPMG LLP |
For HSBC Bank USA, N.A. and | | 191 West Nationwide Blvd., Suite 500 |
HSBC Securities (USA) Inc. Clients: | | Columbus, OH 43215 |
HSBC Bank USA, N.A. | | |
452 Fifth Avenue | | LEGAL COUNSEL |
New York, NY 10018 | | Dechert LLP |
1-888-525-5757 | | 1775 I Street, N.W. |
| | Washington, D.C. 20006 |
For All Other Shareholders: | | |
HSBC Investor Funds | | |
P.O. Box 182845 | | |
Columbus, OH 43218-2845 | | |
1-800-782-8183 | | |
| | |
TRANSFER AGENT | | |
Citi Fund Services | | |
3435 Stelzer Road | | |
Columbus, OH 43219 | | |
| | |
DISTRIBUTOR | | |
Foreside Distribution Services, L.P. | | |
690 Taylor Road, Suite 150 | | |
Gahanna, Ohio 43230-3202 | | |


The HSBC Investor Family of Funds are distributed by Foreside Distribution Services, L.P. This document must be preceded or accompanied by a current prospectus for the HSBC Investor Funds, which you should read carefully before you invest or send money.
| | | |
| — NOT FDIC INSURED | — NO BANK GUARANTEE | — MAY LOSE VALUE |
| | | |
HSB-0009 | | | 12/10 |

HSBC Global Asset Management (USA) Inc.
October 31, 2010
HSBC World Selection Funds
Annual Report
Aggressive Strategy Fund
Balanced Strategy Fund
Moderate Strategy Fund
Conservative Strategy Fund
HSBC World Selection Funds
Annual Report - October 31, 2010
(This Page Intentionally Left Blank)
Barclays Capital U.S. Aggregate Bond Index is an unmanaged index generally representative of investment-grade fixed-rate debt issues, including government, corporate, asset-backed, and mortgage-backed securities, with maturities of at least one year.
Barclays Capital U.S. Corporate Bond Index is an unmanaged index includes publicly issued U.S. corporate and specified foreign debentures and secured notes that meet the specified maturity, liquidity, and quality requirements. To qualify, bonds must be SEC-registered.
Barclays Capital U.S. Corporate High-Yield Bond Index is an unmanaged index that covers the USD-denominated, non-investment grade, fixed-rate, taxable corporate bond market. Securities are classified as high-yield if the middle rating of Moody’s, Fitch, and S&P is Ba1/BB+/BB+ or below. The index excludes emerging markets debt.
Citigroup U.S. Domestic 3-Month U.S. Treasury Bill Index is an unmanaged index of three-month Treasury bills.
Merrill Lynch U.S. High Yield Master II Index is an unmanaged index which measures the performance of the broad high yield market.
MSCI EAFE Index (Europe, Australasia, Far East) is an unmanaged free float-adjusted market capitalization index that is designed to measure the equity market performance of developed markets, excluding the U.S. & Canada. The MSCI EAFE Index currently consists of the following 22 developed market country indices: Australia, Austria, Belgium, Denmark, Finland, France, Germany, Greece, Hong Kong, Ireland, Israel, Italy, Japan, the Netherlands, New Zealand, Norway, Portugal, Singapore, Spain, Sweden, Switzerland and the United Kingdom.
Russell Midcap® Index measures the performance of the mid-cap segment of the U.S. equity universe. The Russell Midcap® Index is a subset of the Russell 1000® Index. It includes approximately 800 of the smallest securities based on a combination of their market cap and current index membership. The Russell Midcap® Index represents approximately 31% of the total market capitalization of the Russell 1000 companies.
Russell 1000® Growth Index is an unmanaged index that measures the performance of the large-cap growth segment of the U.S. equity universe. It includes those Russell 1000 companies with higher price-to-book ratios and higher forecasted growth values.
Russell 1000® Value Index is an unmanaged index that measures the performance of the large-cap value segment of the U.S. equity universe. It includes those Russell 1000 companies with lower price-to-book ratios and lower expected growth values.
Russell 2000® Index is an unmanaged index which measures the performance of the small-cap segment of the U.S. equity universe. The Russell 2000 Index is a subset of the Russell 3000® Index representing approximately 8% of the total market capitalization of that index. It includes approximately 2000 of the smallest securities based on a combination of their market cap and current index membership.
Russell 2500™ Growth Index is an unmanaged index that measures the performance of the small- to mid-cap growth segment of the U.S. equity universe. It includes those Russell 2500 companies with higher price-to-book ratios and higher forecasted growth values.
Standard & Poor’s 500 Index (“S&P 500”) is an unmanaged index that is widely regarded as a gauge of the U.S. equities market, this index includes 500 leading companies in leading industries of the U.S. economy. The S&P 500 focuses on the large cap segment of the market, with approximately 75% coverage of U.S. equities.
Securities indices assume reinvestment of all distributions and interest payments and do not take in account brokerage fees or expenses. Securities in the Funds do not match those in the indices and performance of the Funds will differ. Investors cannot invest directly in an index.
December 16, 2010
To Our Shareholders:
For the 12-month period ended October 31, 2010, equity and debt markets performed well, with returns of 16.52% for the S&P 500 Index1, 8.82% for the MSCI EAFE Index1, 26.58% for the Russell 2000 Index1 and 8.01% for the Barclays Capital U.S. Aggregate Bond Index1.
The period began with several encouraging economic indicators, which helped buoy investor sentiment. However, concerns about a “double-dip” recession in the U.S. increased, as did questions about the financial strength of certain countries in the European Union, such as Greece, whose debt was downgraded by credit rating agencies. The market declines associated with these concerns and events proved short-lived, though, and the markets strengthened late in the period. We are pleased that our funds also performed well during the 12 months under review. In the case of our money market funds, by far the largest asset class in our fund family, this performance comes despite the conservatism of our investment discipline—a discipline the investment adviser adopted ahead of Securities and Exchange Commission (“SEC”) mandated guidelines. These guidelines include, but are not limited to, daily and weekly portfolio liquidity requirements of 10% and 30%, respectively; portfolio quality limitations on second-tier securities; and a reduction in the overall weighted average maturity of money market funds.
These funds’ yields have been supported by significant fee waivers by the investment adviser and our other service providers, as shown in the chart below:
| | | | |
Fund | | Fees Waived | |
California Tax-Free Money Market Fund | | $ | 327,580 | |
New York Tax-Free Money Market Fund | | | 1,274,087 | |
Prime Money Market Fund | | | 7,423,993 | |
Tax-Free Money Market Fund | | | 438,252 | |
U.S. Government Money Market Fund | | | 6,211,568 | |
U.S. Treasury Money Market Fund | | | 6,910,492 | |
Such waivers have become common in the money market fund industry. A more detailed discussion of these fee waivers can be found in the footnotes that accompany the financial statements of the money market funds.
Overall, we are pleased with the performance of the equity funds. The HSBC Investor International Equity Fund has, however, lagged its benchmark for 1-, 3- and 5- year periods. In December 2010, the Board approved a change in sub-advisor for this fund; Lord Abbett & Co. was hired as the new sub-adviser to the fund, effective January 2010. Shareholders of this fund will receive more information about this change in the future.
The Board and the investment adviser continue to pursue appropriate expansion and positioning of the fund family. HSBC has a long history of operating and investing in emerging markets, and the possibility of offering U.S. investors funds that capitalize on that experience and expertise is intriguing. While it is increasingly difficult to find asset classes that provide real diversification (investment professionals describe this as “narrowing correlation coefficients”), at this time emerging markets appear to offer such diversification. Emerging markets are widely favored by the pundits at this time. They cite valuations that are attractive by historic measures, rising capital inflows (though they remain below prior highs) and “QEII”—the Fed’s second round of monetary easing, which some observers feel is likely to further boost such investment inflows, thereby increasing these valuations. Some concern remains about these markets’ abilities to absorb these inflows. We look forward to providing you with more information on this topic at the appropriate time in the future.
QEII, the Federal Reserve’s $600 billion program to buy long-term Treasuries over the next three quarters, is both controversial and problematic when banks are highly liquid and lending is trivial. At best, I believe that the program might stimulate U.S. Gross Domestic Product (“GDP”)1 growth by 0.5%—a paltry increment that comes at high cost given the twin deficits. So, we think it best to view this effort as effectively another effort to lift the value of risk assets and to recapitalize the banks, which may borrow from the Fed at 0.25% and buy Treasuries yielding 3% or more.
| |
1 | HSBC INVESTOR FAMILY OF FUNDS |
|
Chairman’s Message (continued) |
|
At year end, the Board accepted with great regret the resignation of long-time independent chair Dr. Larry Robbins, a founding trustee of the predecessor fund family almost 25 years ago. We are delighted that Larry agreed to serve as trustee emeritus for a year, so his warmth and insight will still be available to us.
Finally, we note that Andrew Donohue stepped down as Director of the Division of Investment Management of the Securities and Exchange Commission effective November 19, 2010. “Buddy”, as he’s better known to his many friends in the fund industry, was a superb regulator—tough-minded but fair, creative, and single-minded in serving the needs of American investors. We all recall fondly his visit to a Board dinner—an outreach practice he followed throughout his SEC tenure and one that other government figures would do well to emulate.
This is my second letter as chairman to our shareholders. In drafting both reports, I’ve thought of how Charles Dickens began his novel about the French Revolution, A Tale of Two Cities: “It was the best of times, it was the worst of times...” So, too, might any money manager opine of any moment. Today, there are deep global economic imbalances—between east and west, north and south. And within our most advanced economies a growing gap prevails between governments’ promises and their ability to honor those promises. This challenge comes at a time of discouraging demographics in the OECD countries. We believe this challenge confers a special responsibility to provide the best possible risk-adjusted performance to those investors who entrust us with their capital.
I can assure you that my colleagues and I, as well as the investment adviser and other service providers, take this duty very seriously and pledge our very best effort to that good end.
Cordially,

Michael Seely
Chairman, HSBC Investor Funds
| |
1 | For additional information, please refer to the Glossary of Terms. |
| |
HSBC INVESTOR FAMILY OF FUNDS | 2 |
Dear Shareholder,
Welcome to the HSBC Investor Funds annual report, covering the period between November 1, 2009 and October 31, 2010. This report offers detailed information about your Funds’ results. We encourage you to review it carefully.
Inside these pages you will find a letter from the Funds’ Chairman, Michael Seely, in which he comments on recent market developments. As always, the report includes the financial statements covering the fiscal year for each of the funds. The report also includes commentary from the Funds’ portfolio managers in which they discuss the investment markets during the period and their respective Fund’s performance. Each commentary is accompanied by the Fund’s return for the period, listed alongside the returns of its benchmark index and peer group average for comparative purposes.
The near-zero short-term rate environment has persisted throughout the Funds’ fiscal year and is likely to continue for some time. In response, HSBC has continued to waive a portion of its advisory and shareholder servicing fees from the various money market funds in order to maintain a positive yield for the Funds’ shareholders.
Our Multimanager team continues to review and monitor the subadvisors that manage the Equity Funds. The team also reviews and monitors the third party funds in which the World Selection Funds invest. We believe that this level of review and oversight helps to provide the Funds’ shareholders with significant benefits, including competitive performance.
In closing, we would like to thank you for investing through the HSBC Investor Funds. We appreciate the trust you place in us, and will continue working to earn it. Please contact us at any time with questions or concerns.
Sincerely,

Richard A. Fabietti
President
| |
3 | HSBC INVESTOR FAMILY OF FUNDS |
|
Commentary From the Investment Manager |
|
HSBC Global Asset Management (USA) Inc. |
U.S. Economic Review
The 12-month period between November 1, 2009 and October 31, 2010 began with continued global macroeconomic improvements. Central banks around the developed world fueled the recovery by maintaining interest rates at record lows, and governments provided stimulus programs to spark growth. In the U.S., the Federal Reserve positioned the federal funds rate—a key factor in lending rates—at a historically low target range between 0.00% to 0.25%, and maintained its quantitative easing program throughout the 12-month period.
Early in the period, several encouraging U.S. economic indicators, including positive manufacturing data and improving consumer spending levels, suggested the rebound was gaining strength. However, as the year progressed, signs emerged that the U.S. economic recovery was losing momentum. For example, the index of leading indicators in April 2010 was worse than expected, falling for the first time since March 2009. Although this period of moderation continued, several economic indicators appeared to stabilize as the period wore on, reducing fears of a “double-dip” recession. Nevertheless, there are still some areas of concern—including high U.S. unemployment figures—and forecasts now point towards a slower recovery than was anticipated at the beginning of the period.
Meanwhile, the year was regularly punctuated by periods of volatility due to sovereign debt issues in the Eurozone. This was most apparent in April when credit rating downgrades of Greece and other peripheral Eurozone countries caused bond yields in those countries to rocket upwards. In response to the deterioration of the debt situation, the International Monetary Fund (IMF) and the European Central Bank (ECB) stepped in. They agreed to a $1 trillion package, providing loan guarantees and credits, not just to Greece but to all Eurozone states in financial difficulty, restoring a measure of comfort to investors. More recently, however, debt concerns have resurfaced and the fiscal situation of countries throughout the developed world, including the U.S., continue to cause concern.
Market Review
The financial markets rallied during the first half of the period driven by positive earnings surprises, attractive valuations and ample liquidity. Investors in this environment were more comfortable with higher-risk areas of the markets, helping emerging markets and small-cap stocks produce strong gains during the six months through April.
The fiscal troubles in the Eurozone largely halted the rally in international stocks. Investors became more risk averse in this environment, which in turn pushed down equity markets around the world. In May 2010, developed markets declined by an average of 9%, while emerging markets fell by roughly 8%. However, thanks to a financial support facility from the ECB and IMF, these declines generally were short-lived. Emerging markets stocks staged a particularly strong rebound, driven by strong macroeconomic data and performed well for the period as a whole. Developed market international stocks did not perform as well for the fiscal year, in large part because of the impact of the Eurozone’s sovereign debt issues. The MSCI EAFE Index1 (Europe, Australasia and Far East) of international stocks returned 8.82%, in U.S. Dollar terms, for the 12-month period.
Domestic stocks experienced much stronger returns than their counterparts in developed foreign markets. The S&P 500 Index1 of large-company stocks returned 16.52% for the 12 months through October 2010. Small-cap and mid-cap stocks were among the period’s strongest performers: The Russell 2000® Index1 of small-company stocks returned 26.58%, and the Russell Midcap® Index1 returned 27.71%. The small- and mid-cap categories especially benefited early in the period, due to the early strength and breadth of the U.S. economic recovery and strong corporate earnings results.
Within fixed income, the performance of U.S. Treasuries was mixed over the period. Initially, the pursuit of higher yielding assets led to lower demand for government bonds. As the period progressed, investors responded to increased market volatility by returning to the relative safety of U.S. government bonds, improving their performance. Still, Treasuries lagged the rest of the fixed-income market for the 12 months as a whole. Investment grade corporate bonds and high-yield bonds benefited from attractive valuation levels and a strong improvement in corporate earnings and microeconomic conditions.
The Barclays Capital U.S. Corporate Bond Index1, which tracks the broad investment-grade fixed-income market, returned 11.61% for the 12 months through October, while the Barclays Capital U.S. Corporate High-Yield Bond Index1 returned 19.35%.
| |
1 | For additional information, please refer to the Glossary of Terms. |
| |
HSBC INVESTOR FAMILY OF FUNDS | 4 |
|
Portfolio Reviews |
|
Aggressive Strategy Fund |
Balanced Strategy Fund |
Moderate Strategy Fund |
Conservative Strategy Fund |
Investment Concerns
Allocation Risk: The risks that the Adviser’s target asset and sector allocations and changes in target asset and sector allocations cause a Fund to underperform other similar funds or cause you to lose money, and that a Fund may not achieve its target asset and sector allocations.
Underlying Fund Selection Risk: The risk that a Fund may invest in Underlying Funds that underperform other similar funds or the markets more generally, due to poor investment decisions by the investment adviser(s) for the Underlying Funds or otherwise. Underlying funds also have their own expenses, which the Funds bear in addition to their own expenses.
Equity Securities Risk: A portion of the assets of a Fund is allocated to Underlying Funds investing primarily in equity securities. Therefore, the value of the Fund may increase or decrease as a result of its indirect interest in equity securities.
Fixed Income Securities Risk: A portion of the assets of a Fund is allocated to Underlying Funds investing primarily in fixed-income securities. Therefore, the value of the Fund may increase or decrease as a result of its indirect interest in fixed-income securities.
Foreign Securities/Emerging Markets Risk: Foreign securities, including those of emerging market issuers, are subject to additional risks including international trade, currency, political, and regulatory risks. Securities of emerging market issuers generally have more risk than securities issued by issuers in more developed foreign markets.
Market Commentary
The HSBC Investor World Selection Funds (“Funds”) generated the following returns during the 12-month period between November 1, 2009 and October 31, 2010:
Aggressive Strategy Fund: 12.01%
Balanced Strategy Fund: 11.95%
Moderate Strategy Fund: 10.69%
Conservative Strategy Fund: 8.14%
The Funds’ benchmark/reference indices posted the following performance:
S&P 500 Index1: 16.52%
MSCI EAFE Index1: 8.82%
Barclays Capital U.S. Aggregate Bond Index1: 8.01%
Citigroup U.S. Domestic 3-Month T-Bill Index1: 0.12%
The structure of the Funds changed during the period under review. We broadened their asset mix significantly: At the beginning of the period, the four Funds, formerly known as the Lifeline Funds, offered exposure to a limited set of asset classes, including large- and small-cap U.S. stocks, international stocks, fixed-income and short-term assets. As of January 19, 2010, we expanded the categories of asset classes used in each Fund to include enhancements such as emerging markets equity and debt, commodities and private equity. Our goal was to augment diversification and thereby improve the potential return each Fund offers at a given level of expected volatility.*
The Funds were aided by from a strong environment in the financial markets during the 12 months through October 31, 2010. The S&P 500 Index of large-company stocks rose 16.52% as equity prices responded to an improving economic environment and a strong recovery in corporate earnings. The Funds gained from their exposure to the fixed-income markets, which performed well during the period. In particular, the strong performance of high-yield bonds benefited the Funds during the period.*
The Funds’ benefited from overweight positions relative to their neutral weightings in small- and mid-cap U.S. equities and Latin American stocks. The Balanced Strategy and Aggressive Strategy Funds, which have sizable allocations to U.S. equities, especially benefited from those tactics.
Turning to the underlying manager selections within specific asset classes, strong selections in the small- and mid-cap U.S. equity market boosted the performance of the Funds’ core equity positions, as did manager selections within the Latin American equity market.*
The fixed-income portions of the Funds benefited from strong manager selection among emerging markets debt securities. However, selection among U.S. high-yield bonds dragged on relative performance during the period.*
| |
1 | For additional information, please refer to the Glossary of Terms. |
| |
* | Portfolio composition is subject to change. |
| |
5 | HSBC INVESTOR FAMILY OF FUNDS |
|
Portfolio Reviews |
|
Aggressive Strategy Fund |
Value of a $10,000 Investment |
|
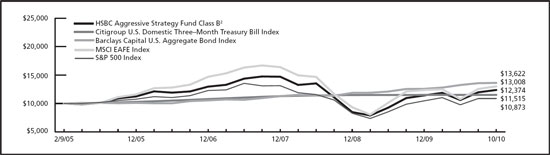
The chart above represents a comparison of a hypothetical $10,000 investment in the indicated Fund versus a similar investment in the Fund’s benchmarks and represents the reinvestment of dividends and capital gains in the Fund.
| | | | | | | | | | | | | |
Fund Performance | | | | Average Annual
Total Return (%) | | Expense
Ratio (%)4 | |
|
|
|
|
|
|
|
|
As of October 31, 2010 | | Inception
Date | | 1
Year | | 5
Year | | Since
Inception | | Gross | | Net | |
|
|
|
|
|
|
|
|
|
|
|
|
|
|
Aggressive Strategy Fund Class A1 | | 2/14/05 | | 12.01 | | 2.91 | | 3.60 | | 2.16 | | 1.50 | |
|
|
|
|
|
|
|
|
|
|
|
|
|
|
Aggressive Strategy Fund Class B2 | | 2/9/05 | | 13.04 | | 3.20 | | 3.79 | | 2.91 | | 2.25 | |
|
|
|
|
|
|
|
|
|
|
|
|
|
|
Aggressive Strategy Fund Class C3 | | 6/10/05 | | 16.06 | | 3.22 | | 4.01 | | 2.91 | | 2.25 | |
|
|
|
|
|
|
|
|
|
|
|
|
|
|
S&P 500 Index6 | | — | | 16.52 | | 1.73 | | 2.14 | 7 | N/A | | N/A | |
|
|
|
|
|
|
|
|
|
|
|
|
|
|
MSCI EAFE Index6 | | — | | 8.82 | | 3.79 | | 4.72 | 7 | N/A | | N/A | |
|
|
|
|
|
|
|
|
|
|
|
|
|
|
Barclays Capital U.S. Aggregate Bond Index6 | | — | | 8.01 | | 6.45 | | 5.59 | 7 | N/A | | N/A | |
|
|
|
|
|
|
|
|
|
|
|
|
|
|
Citigroup U.S. Domestic 3-Month Treasury Bill Index6 | | — | | 0.12 | | 2.42 | | 2.49 | 7 | N/A | | N/A | |
|
|
|
|
|
|
|
|
|
|
|
|
|
|
Past performance does not guarantee future results. The performance data quoted represents past performance and current returns may be lower or higher. Total return figures include change in share price, reinvestment of dividends and capital gains and do not reflect the taxes that a shareholder would pay on Fund distributions or on the redemption of Fund shares. The investment return and principal value will fluctuate so that an investor’s shares, when redeemed may be worth more or less than the original cost. To obtain performance information current to the most recent month end, please call 1-800-782-8183.
The performance above reflects any fee waivers that have been in effect during the applicable periods, as well as any expense reimbursements that have periodically been made. Absent such waivers and reimbursements, returns would have been lower. Currently, contractual fee waivers are in effect from March 1, 2010 through March 1, 2011.
During the periods ended October 31, 2008, 2009 and 2010, one or more Underlying Funds in which the Fund invests in, received monies related to certain nonrecurring litigation settlements. Without the receipt of these payments, the returns for the applicable periods would be lower.
| |
1 | Reflects the maximum sales charge of 5.00%. |
| |
2 | Reflects the applicable contingent deferred sales charge, maximum of 4.00%. |
| |
3 | Reflects the applicable contingent deferred sales charge, maximum of 1.00%. |
| |
4 | Reflects the expense ratio as reported in the prospectus dated March 31, 2010. |
| |
5 | For additional information, please refer to the Glossary of Terms. |
| |
6 | Effective January 19, 2010 the Fund no longer compares its performance to that of the LifeLine Aggressive Growth Blended Portfolio Index due to a change to the Fund’s investment strategy. The Fund’s performance is now compared to broader-based market indices. The LifeLine Aggressive Growth Blended Portfolio Index consisted of a blend by a percentage of the following indices: Citigroup U.S. Domestic 3-Month Treasury Bill Index5 (1%); Russell 1000® Growth Index5 (21%); Russell 1000® Value Index5 (21%); Russell 2500TM Growth Index5 (34%) and the MSCI EAFE Index5 (23%). These indices are unmanaged and do not reflect the fees and expenses associated with a mutual fund, and investors cannot directly invest in an index. |
| |
7 | Return for the period 2/9/05 to 10/31/10. |
| | |
| HSBC INVESTOR FAMILY OF FUNDS | 6 |
|
Portfolio Reviews |
|
Balanced Strategy Fund |
|
Value of a $10,000 Investment |
|
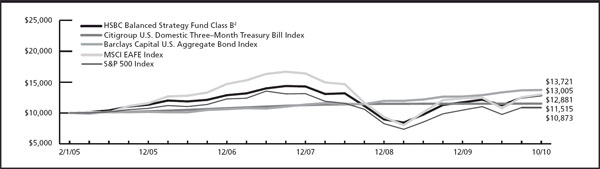
The chart above represents a comparison of a hypothetical $10,000 investment in the indicated Fund versus a similar investment in the Fund’s benchmarks and represents the reinvestment of dividends and capital gains in the Fund.
| | | | | | | | | | | | | |
Fund Performance | | | | Average Annual
Total Return (%) | | Expense
Ratio (%)4 | |
|
|
|
|
|
|
|
|
As of October 31, 2010 | | Inception
Date | | 1
Year | | 5
Year | | Since
Inception | | Gross | | Net | |
|
|
|
|
|
|
|
|
|
|
|
|
|
|
Balanced Strategy Fund Class A1 | | 2/8/05 | | 11.95 | | 3.34 | | 4.16 | | 1.60 | | 1.60 | |
|
|
|
|
|
|
|
|
|
|
|
|
|
|
Balanced Strategy Fund Class B2 | | 2/1/05 | | 13.01 | | 3.63 | | 4.51 | | 2.35 | | 2.35 | |
|
|
|
|
|
|
|
|
|
|
|
|
|
|
Balanced Strategy Fund Class C3 | | 4/27/05 | | 15.96 | | 3.64 | | 4.78 | | 2.35 | | 2.35 | |
|
|
|
|
|
|
|
|
|
|
|
|
|
|
S&P 500 Index6 | | — | | 16.52 | | 1.73 | | 2.13 | 7 | N/A | | N/A | |
|
|
|
|
|
|
|
|
|
|
|
|
|
|
MSCI EAFE Index6 | | — | | 8.82 | | 3.79 | | 4.68 | 7 | N/A | | N/A | |
|
|
|
|
|
|
|
|
|
|
|
|
|
|
Barclays Capital U.S. Aggregate Bond Index6 | | — | | 8.01 | | 6.45 | | 5.66 | 7 | N/A | | N/A | |
|
|
|
|
|
|
|
|
|
|
|
|
|
|
Citigroup U.S. Domestic 3-Month Treasury Bill Index6 | | — | | 0.12 | | 2.42 | | 2.49 | 7 | N/A | | N/A | |
|
|
|
|
|
|
|
|
|
|
|
|
|
|
Past performance does not guarantee future results. The performance data quoted represents past performance and current returns may be lower or higher. Total return figures include change in share price, reinvestment of dividends and capital gains and do not reflect the taxes that a shareholder would pay on Fund distributions or on the redemption of Fund shares. The investment return and principal value will fluctuate so that an investor’s shares, when redeemed may be worth more or less than the original cost. To obtain performance information current to the most recent month end, please call 1-800-782-8183.
The performance above reflects any fee waivers that have been in effect during the applicable periods, as well as any expense reimbursements that have periodically been made. Absent such waivers and reimbursements, returns would have been lower.
During the periods ended October 31, 2007, 2008, 2009 and 2010, one or more Underlying Funds in which the Fund invests in, received monies related to certain nonrecurring litigation settlements. Without the receipt of these payments, the returns for the applicable periods would be lower.
| |
1 | Reflects the maximum sales charge of 5.00%. |
| |
2 | Reflects the applicable contingent deferred sales charge, maximum of 4.00%. |
| |
3 | Reflects the applicable contingent deferred sales charge, maximum of 1.00%. |
| |
4 | Reflects the expense ratio as reported in the prospectus dated March 31, 2010. |
| |
5 | For additional information, please refer to the Glossary of Terms. |
| |
6 | Effective January 19, 2010 the Fund no longer compares its performance to that of the LifeLine Growth Blended Portfolio Index due to a change to the Fund’s investment strategy. The Fund’s performance is now compared to broader-based market indices. The LifeLine Growth Blended Portfolio Index consisted of a blend by a percentage of the following indices: Citigroup U.S. Domestic 3-Month Treasury Bill Index5 (1%); Citigroup U.S. High Yield Market Capped Index5 (2%); Barclays Capital U.S. Aggregate Bond Index5 (15%); Russell 1000® Growth Index5 (21%); Russell 1000® Value Index5 (21%); Russell 2500TM Growth Index5 (20%), and the MSCI EAFE Index5 (20%). These indices are unmanaged and do not reflect the fees and expenses associated with a mutual fund, and investors cannot directly invest in an index. |
| |
7 | Return for the period 2/1/05 to 10/31/10. |
| |
7 | HSBC INVESTOR FAMILY OF FUNDS |
|
Portfolio Reviews |
|
Moderate Strategy Fund |
|
Value of a $10,000 Investment |
|
|
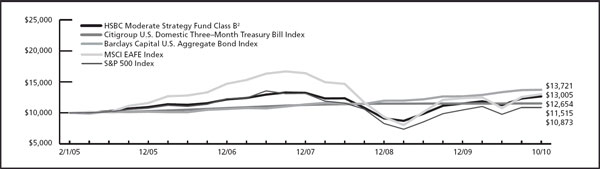
The chart above represents a comparison of a hypothetical $10,000 investment in the indicated Fund versus a similar investment in the Fund’s benchmarks and represents the reinvestment of dividends and capital gains in the Fund.
| | | | | | | | | | | | | |
Fund Performance | | | | Average Annual
Total Return (%) | | Expense
Ratio (%)4 | |
|
|
|
|
|
|
|
|
As of October 31, 2010 | | Inception
Date | | 1
Year | | 5
Year | | Since
Inception | | Gross | | Net | |
|
|
|
|
|
|
|
|
|
|
|
|
|
|
Moderate Strategy Fund Class A1 | | 2/3/05 | | 10.69 | | 3.53 | | 3.93 | | 1.58 | | 1.58 | |
|
|
|
|
|
|
|
|
|
|
|
|
|
|
Moderate Strategy Fund Class B2 | | 2/1/05 | | 11.61 | | 3.80 | | 4.18 | | 2.33 | | 2.33 | |
|
|
|
|
|
|
|
|
|
|
|
|
|
|
Moderate Strategy Fund Class C3 | | 6/10/05 | | 14.55 | | 3.80 | | 4.05 | | 2.33 | | 2.33 | |
|
|
|
|
|
|
|
|
|
|
|
|
|
|
S&P 500 Index6 | | — | | 16.52 | | 1.73 | | 2.13 | 7 | N/A | | N/A | |
|
|
|
|
|
|
|
|
|
|
|
|
|
|
MSCI EAFE Index6 | | — | | 8.82 | | 3.79 | | 4.68 | 7 | N/A | | N/A | |
|
|
|
|
|
|
|
|
|
|
|
|
|
|
Barclays Capital U.S. Aggregate Bond Index6 | | — | | 8.01 | | 6.45 | | 5.66 | 7 | N/A | | N/A | |
|
|
|
|
|
|
|
|
|
|
|
|
|
|
Citigroup U.S. Domestic 3-Month Treasury Bill Index6 | | — | | 0.12 | | 2.42 | | 2.49 | 7 | N/A | | N/A | |
|
|
|
|
|
|
|
|
|
|
|
|
|
|
Past performance does not guarantee future results. The performance data quoted represents past performance and current returns may be lower or higher. Total return figures include change in share price, reinvestment of dividends and capital gains and do not reflect the taxes that a shareholder would pay on Fund distributions or on the redemption of Fund shares. The investment return and principal value will fluctuate so that an investor’s shares, when redeemed may be worth more or less than the original cost. To obtain performance information current to the most recent month end, please call 1-800-782-8183.
The performance above reflects any fee waivers that have been in effect during the applicable periods, as well as any expense reimbursements that have periodically been made. Absent such waivers and reimbursements, returns would have been lower.
During the periods ended October 31, 2007, 2008, 2009 and 2010, one or more Underlying Funds in which the Fund invests in, received monies related to certain nonrecurring litigation settlements. Without the receipt of these payments, the returns for the applicable periods would be lower.
| |
1 | Reflects the maximum sales charge of 5.00%. |
| |
2 | Reflects the applicable contingent deferred sales charge, maximum of 4.00%. |
| |
3 | Reflects the applicable contingent deferred sales charge, maximum of 1.00%. |
| |
4 | Reflects the expense ratio as reported in the prospectus dated March 31, 2010. |
| |
5 | For additional information, please refer to Glossary of Terms. |
| |
6 | Effective January 19, 2010 the Fund no longer compares its performance to that of the LifeLine Moderate Growth Blended Portfolio Index due to a change to the Fund’s investment strategy. The Fund’s performance is now compared to broader-based market indices. The LifeLine Moderate Growth Blended Portfolio Index consisted of a blend by a percentage of the following indices: Citigroup U.S. Domestic 3-Month Treasury Bill Index5 (6%); Barclays Capital U.S. Aggregate Bond Index5 (26%); Citigroup U.S. High Yield Market Capped Index5 (5%); Russell 1000® Growth Index5 (19%); Russell 1000® Value Index5 (18%); Russell 2500TM Growth Index5 (11%) and the MSCI EAFE Index5 (15%). |
| |
7 | Return for the period 2/1/05 to 10/31/10. |
| | |
| HSBC INVESTOR FAMILY OF FUNDS | 8 |
|
Portfolio Reviews |
|
Conservative Strategy Fund |
|
Value of a $10,000 Investment |
|
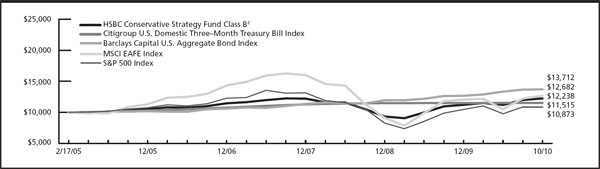
The chart above represents a comparison of a hypothetical $10,000 investment in the indicated Fund versus a similar investment in the Fund’s benchmarks and represents the reinvestment of dividends and capital gains in the Fund.
| | | | | | | | | | | | | |
Fund Performance | | | | Average Annual
Total Return (%) | | Expense
Ratio (%)4 | |
|
|
|
|
|
|
|
|
As of October 31, 2010 | | Inception
Date | | 1
Year | | 5
Year | | Since
Inception | | Gross | | Net | |
|
|
|
|
|
|
|
|
|
|
|
|
|
|
Conservative Strategy Fund Class A1 | | 2/23/05 | | 8.14 | | 3.43 | | 3.53 | | 1.79 | | 1.79 | |
|
|
|
|
|
|
|
|
|
|
|
|
|
|
Conservative Strategy Fund Class B2 | | 2/17/05 | | 8.94 | | 3.73 | | 3.61 | | 2.54 | | 2.54 | |
|
|
|
|
|
|
|
|
|
|
|
|
|
|
Conservative Strategy Fund Class C3 | | 4/19/05 | | 12.07 | | 3.83 | | 4.21 | | 2.54 | | 2.54 | |
|
|
|
|
|
|
|
|
|
|
|
|
|
|
S&P 500 Index6 | | — | | 16.52 | | 1.73 | | 2.15 | 7 | N/A | | N/A | |
|
|
|
|
|
|
|
|
|
|
|
|
|
|
MSCI EAFE Index6 | | — | | 8.82 | | 3.79 | | 4.26 | 7 | N/A | | N/A | |
|
|
|
|
|
|
|
|
|
|
|
|
|
|
Barclays Capital U.S. Aggregate Bond Index6 | | — | | 8.01 | | 6.45 | | 5.69 | 7 | N/A | | N/A | |
|
|
|
|
|
|
|
|
|
|
|
|
|
|
Citigroup U.S. Domestic 3-Month Treasury Bill Index6 | | — | | 0.12 | | 2.42 | | 2.51 | 7 | N/A | | N/A | |
|
|
|
|
|
|
|
|
|
|
|
|
|
|
Past performance does not guarantee future results. The performance data quoted represents past performance and current returns may be lower or higher. Total return figures include change in share price, reinvestment of dividends and capital gains and do not reflect the taxes that a shareholder would pay on Fund distributions or on the redemption of Fund shares. The investment return and principal value will fluctuate so that an investor’s shares, when redeemed may be worth more or less than the original cost. To obtain performance information current to the most recent month end, please call 1-800-782-8183.
The performance above reflects any fee waivers that have been in effect during the applicable periods, as well as any expense reimbursements that have periodically been made. Absent such waivers and reimbursements, returns would have been lower.
During the periods ended October 31, 2007, 2008, 2009 and 2010, one or more Underlying Funds in which the Fund invests in, received monies related to certain nonrecurring litigation settlements. Without the receipt of these payments, the returns for the applicable periods would be lower.
| |
1 | Reflects the maximum sales charge of 5.00%. |
| |
2 | Reflects the applicable contingent deferred sales charge, maximum of 4.00%. |
| |
3 | Reflects the applicable contingent deferred sales charge, maximum of 1.00%. |
| |
4 | Reflects the expense ratio as reported in the prospectus dated March 31, 2010. |
| |
5 | For additional information, please refer to the Glossary of Terms. |
| |
6 | Effective January 19, 2010 the Fund no longer compares its performance to that of the LifeLine Conservative Growth Blended Portfolio Index due to a change to the Fund’s investment strategy. The Fund’s performance is now compared to broader-based market indices. The LifeLine Conservative Growth Blended Portfolio Index consisted of a blend by a percentage of the following indices: Citigroup U.S. Domestic 3-Month Treasury Bill Index5 (21%); Citigroup U.S. High Yield Market Capped Index5 (8%); Barclays Capital U.S. Aggregate Bond Index5 (25%); Barclays Capital Intermediate U.S. Aggregate Bond Index5 (3%); Russell 1000® Growth Index5 (15%); Russell 1000® Value Index5 (14%); Russell 2500TM Growth Index5 (4%) and the MSCI EAFE Index5 (10%). |
| |
7 | Return for the period 2/17/05 to 10/31/10. |
| | |
9 | HSBC INVESTOR FAMILY OF FUNDS | |
|
Portfolio Reviews |
|
Portfolio Composition* |
October 31, 2010 |
(Unaudited) |
| | | | |
HSBC Aggressive Strategy Portfolio | | | | |
|
|
|
|
|
| | | |
Investment Allocation | | Percentage of Investments at Value | |
|
|
|
|
Affiliated Investment Companies | | 59.5 | % | |
|
|
|
|
|
Unaffiliated Investment Companies | | 24.7 | % | |
|
|
|
|
|
Exchange Traded Funds | | 9.0 | % | |
|
|
|
|
|
Affiliated Portfolios | | 6.8 | % | |
|
|
|
|
|
Total | | 100.0 | % | |
|
|
|
|
|
| | | | |
HSBC Balance Strategy Portfolio | | | | |
|
|
|
|
|
| | | | |
Investment Allocation | | Percentage of Investments at Value | |
|
|
|
|
Affiliated Investment Companies | | 41.7 | % | |
|
|
|
|
|
Unaffiliated Investment Companies | | 40.3 | % | |
|
|
|
|
|
Exchange Traded Funds | | 12.8 | % | |
|
|
|
|
|
Affiliated Portfolios | | 5.2 | % | |
|
|
|
|
|
Total | | 100.0 | % | |
|
|
|
|
|
| | | | |
HSBC Moderate Strategy Portfolio | | | | |
|
|
|
|
|
| | | | |
Investment Allocation | | Percentage of Investments at Value | |
|
|
|
|
Unaffiliated Investment Companies | | 46.9 | % | |
|
|
|
|
|
Affiliated Investment Companies | | 29.9 | % | |
|
|
|
|
|
Exchange Traded Funds | | 19.2 | % | |
|
|
|
|
|
Affiliated Portfolios | | 3.9 | % | |
|
|
|
|
|
Total | | 100.0 | % | |
|
|
|
|
|
| | | | |
HSBC Conservation Strategy Portfolio | | | | |
|
|
|
|
|
| | | |
Investment Allocation | | Percentage of Investments at Value | |
|
|
|
|
Unaffiliated Investment Companies | | 48.4 | % | |
|
|
|
|
|
Exchange Traded Funds | | 27.7 | % | |
|
|
|
|
|
Affiliated Investment Companies | | 20.8 | % | |
|
|
|
|
|
Affiliated Portfolios | | 3.1 | % | |
|
|
|
|
|
Total | | 100.0 | % | |
|
|
|
|
|
| | | | |
HSBC Investor Growth Portfolio | | | | |
|
|
|
|
|
| | | | |
Investment Allocation | | Percentage of Investments at Value | |
|
|
|
|
Computers & Peripherals | | 8.6 | % | |
|
|
|
|
|
Software | | 7.1 | % | |
|
|
|
|
|
IT Services | | 6.9 | % | |
|
|
|
|
|
Internet & Catalog Retail | | 6.5 | % | |
|
|
|
|
|
Machinery | | 6.0 | % | |
|
|
|
|
|
Communications Equipment | | 5.8 | % | |
|
|
|
|
|
Capital Markets | | 5.4 | % | |
|
|
|
|
|
Internet Software & Services | | 4.8 | % | |
|
|
|
|
|
Energy Equipment & Services | | 4.2 | % | |
|
|
|
|
|
Diversified Financial Services | | 3.5 | % | |
|
|
|
|
|
Road & Rail | | 3.1 | % | |
|
|
|
|
|
Aerospace & Defense | | 2.9 | % | |
|
|
|
|
|
Pharmaceuticals | | 2.9 | % | |
|
|
|
|
|
Metals & Mining | | 2.8 | % | |
|
|
|
|
|
Health Care Providers & Services | | 2.8 | % | |
|
|
|
|
|
Specialty Retail | | 2.3 | % | |
|
|
|
|
|
Hotels, Restaurants & Leisure | | 2.2 | % | |
|
|
|
|
|
Oil, Gas & Consumable Fuels | | 2.0 | % | |
|
|
|
|
|
Electronic Equipment, Instruments & Components | | 2.0 | % | |
|
|
|
|
|
Wireless Telecommunication Services | | 1.8 | % | |
|
|
|
|
|
Multiline Retail | | 1.5 | % | |
|
|
|
|
|
Construction & Engineering | | 1.4 | % | |
|
|
|
|
|
Investment Companies | | 1.3 | % | |
|
|
|
|
|
Air Freight & Logistics | | 1.2 | % | |
|
|
|
|
|
Semiconductors & Semiconductor Equipment | | 1.1 | % | |
|
|
|
|
|
Health Care Technology | | 1.1 | % | |
|
|
|
|
|
Personal Products | | 1.1 | % | |
|
|
|
|
|
Biotechnology | | 1.1 | % | |
|
|
|
|
|
Beverages | | 1.0 | % | |
|
|
|
|
|
Food & Staples Retailing | | 1.0 | % | |
|
|
|
|
|
Textiles, Apparel & Luxury Goods | | 1.0 | % | |
|
|
|
|
|
Chemicals | | 0.9 | % | |
|
|
|
|
|
Food Products | | 0.9 | % | |
|
|
|
|
|
Health Care Equipment & Supplies | | 0.8 | % | |
|
|
|
|
|
Auto Components | | 0.5 | % | |
|
|
|
|
|
Media | | 0.5 | % | |
|
|
|
|
|
Total | | 100.0 | % | |
|
|
|
|
|
| | | | |
HSBC International Equity Portfolio | | | | |
|
|
|
|
|
| | | | |
Investment Allocation | | Percentage of Investments at Value | |
|
|
|
|
Europe | | 61.2 | % | |
|
|
|
|
|
Japan | | 23.6 | % | |
|
|
|
|
|
Australia & Far East | | 8.0 | % | |
|
|
|
|
|
Canada | | 4.9 | % | |
|
|
|
|
|
Other | | 1.3 | % | |
|
|
|
|
|
Cash | | 1.0 | % | |
|
|
|
|
|
Total | | 100.0 | % | |
|
|
|
|
|
| |
HSBC INVESTOR FAMILY OF FUNDS | 10 |
|
Portfolio Reviews |
|
Portfolio Composition* |
October 31, 2010 |
(Unaudited) |
| | | | |
HSBC Investor Opportunity Portfolio | | | | |
|
|
|
|
|
| | | | |
Investment Allocation | | Percentage of Investments at Value | |
|
|
|
|
Oil, Gas & Consumable Fuels | | 9.2 | % | |
|
|
|
|
|
Semiconductors & Semiconductor Equipment | | 6.7 | % | |
|
|
|
|
|
Software | | 6.0 | % | |
|
|
|
|
|
Machinery | | 5.1 | % | |
|
|
|
|
|
Hotels, Restaurants & Leisure | | 4.7 | % | |
|
|
|
|
|
Life Sciences Tools & Services | | 4.5 | % | |
|
|
|
|
|
Health Care Equipment & Supplies | | 3.7 | % | |
|
|
|
|
|
Auto Components | | 3.4 | % | |
|
|
|
|
|
Specialty Retail | | 3.3 | % | |
|
|
|
|
|
Health Care Providers & Services | | 3.2 | % | |
|
|
|
|
|
Food Products | | 3.1 | % | |
|
|
|
|
|
Commercial Services & Supplies | | 3.0 | % | |
|
|
|
|
|
Biotechnology | | 2.9 | % | |
|
|
|
|
|
Investment Companies | | 2.9 | % | |
|
|
|
|
|
Pharmaceuticals | | 2.5 | % | |
|
|
|
|
|
Media | | 2.5 | % | |
|
|
|
|
|
Containers & Packaging | | 2.3 | % | |
|
|
|
|
|
Chemicals | | 2.3 | % | |
|
|
|
|
|
Aerospace & Defense | | 2.2 | % | |
|
|
|
|
|
Internet Software & Services | | 2.1 | % | |
|
|
|
|
|
Wireless Telecommunication Services | | 2.1 | % | |
|
|
|
|
|
Textiles, Apparel & Luxury Goods | | 2.1 | % | |
|
|
|
|
|
Electrical Equipment | | 2.1 | % | |
|
|
|
|
|
Metals & Mining | | 2.0 | % | |
|
|
|
|
|
Communications Equipment | | 2.0 | % | |
|
|
|
|
|
Real Estate Investment Trusts (REITs) | | 1.8 | % | |
|
|
|
|
|
Capital Markets | | 1.8 | % | |
|
|
|
|
|
Road & Rail | | 1.7 | % | |
|
|
|
|
|
IT Services | | 1.6 | % | |
|
|
|
|
|
Diversified Financial Services | | 1.6 | % | |
|
|
|
|
|
Household Products | | 1.5 | % | |
|
|
|
|
|
Trading Companies & Distributors | | 1.4 | % | |
|
|
|
|
|
Energy Equipment & Services | | 1.3 | % | |
|
|
|
|
|
Commercial Banks | | 1.0 | % | |
|
|
|
|
|
Diversified Consumer Services | | 0.4 | % | |
|
|
|
|
|
Total | | 100.0 | % | |
|
|
|
|
|
| | | | |
HSBC Investor Value Portfolio | | | | |
|
|
|
|
|
| | | | |
Electrical Equipment | | Percentage of Investments at Value | |
|
|
|
|
Insurance | | 16.7 | % | |
|
|
|
|
|
Oil, Gas & Consumable Fuels | | 13.0 | % | |
|
|
|
|
|
Pharmaceuticals | | 8.5 | % | |
|
|
|
|
|
Metals & Mining | | 8.1 | % | |
|
|
|
|
|
Software | | 7.1 | % | |
|
|
|
|
|
Investment Companies | | 6.5 | % | |
|
|
|
|
|
Media | | 6.1 | % | |
|
|
|
|
|
Communications Equipment | | 4.7 | % | |
|
|
|
|
|
Biotechnology | | 4.3 | % | |
|
|
|
|
|
Diversified Financial Services | | 3.8 | % | |
|
|
|
|
|
Aerospace & Defense | | 3.7 | % | |
|
|
|
|
|
Commercial Banks | | 2.1 | % | |
|
|
|
|
|
Food & Staples Retailing | | 2.1 | % | |
|
|
|
|
|
Tobacco | | 2.0 | % | |
|
|
|
|
|
Machinery | | 1.8 | % | |
|
|
|
|
|
Road & Rail | | 1.7 | % | |
|
|
|
|
|
Commercial Services & Supplies | | 1.7 | % | |
|
|
|
|
|
Household Products | | 1.3 | % | |
|
|
|
|
|
Energy Equipment & Services | | 1.3 | % | |
|
|
|
|
|
Independent Power Producers & Energy Traders | | 1.3 | % | |
|
|
|
|
|
Health Care Providers & Services | | 1.2 | % | |
|
|
|
|
|
Capital Markets | | 1.0 | % | |
|
|
|
|
|
Total | | 100.0 | % | |
|
|
|
|
|
| |
* | Portfolio composition is subject to change. |
| |
11 | HSBC INVESTOR FAMILY OF FUNDS |
|
AGGRESSIVE STRATEGY FUND |
|
Schedule of Portfolio Investments—as of October 31, 2010 |
| | | | | | | |
Affiliated Investment Companies—6.8% |
|
| | | | | |
| | Shares | | Value($) | |
| |
| |
| |
HSBC Investor Mid-Cap Fund,
Class I Shares | | | 106,123 | | | 775,762 | |
HSBC Investor Prime Money Market
Fund, Class I Shares, 0.05% (a) | | | 179,698 | | | 179,698 | |
| | | | |
|
| |
TOTAL AFFILIATED
INVESTMENT COMPANIES
(COST $881,535) | | | | | | 955,460 | |
| | | | |
|
| |
|
Affiliated Portfolios—59.2% | | | | | | | |
|
|
|
|
|
|
|
|
HSBC Investor Growth Portfolio | | | 2,248,339 | | | 3,189,999 | |
HSBC Investor International Equity
Portfolio | | | 524,932 | | | 1,252,112 | |
HSBC Investor Opportunity Portfolio | | | 215,784 | | | 788,085 | |
HSBC Investor Value Portfolio | | | 2,314,315 | | | 3,124,626 | |
| | | | |
|
| |
TOTAL AFFILIATED
PORTFOLIOS | | | | | | 8,354,822 | |
| | | | |
|
| |
|
Unaffiliated Investment Companies—26.4% | | | | | | | |
|
|
|
|
|
|
|
|
BlackRock Latin America Fund, Inc.,
Institutional Shares | | | 2,291 | | | 172,654 | |
Cohen & Steers Institutional Global
Realty Shares, Inc. | | | 876 | | | 18,487 | |
Delaware Emerging Markets Fund,
Class I Shares | | | 43,150 | | | 663,222 | |
EII Global Property Fund,
Institutional Shares | | | 1,255 | | | 18,527 | |
Goldman Sachs Emerging Markets
Debt Fund, Class I Shares | | | 6,066 | | | 79,287 | |
Goldman Sachs High Yield Fund,
Institutional Shares | | | 88,883 | | | 649,721 | |
JPMorgan High Yield Fund,
Select Shares | | | 79,809 | | | 655,235 | |
Lord Abbett Core Fixed Income Fund,
Institutional Shares | | | 10,861 | | | 124,895 | |
Metropolitan West Total Return
Bond Fund, Institutional Shares | | | 12,079 | | | 129,764 | |
PIMCO Commodity RealReturn
Strategy Fund, Institutional Shares | | | 7,403 | | | 64,998 | |
PIMCO Total Return Fund,
Institutional Shares | | | 14,286 | | | 166,984 | |
Transamerica WMC Emerging
Markets Fund, Class I Shares | | | 68,949 | | | 984,592 | |
| | | | |
|
| |
TOTAL UNAFFILIATED
INVESTMENT COMPANIES
(COST $3,493,409) | | | | | | 3,728,366 | |
| | | | |
|
| |
|
Exchange Traded Funds—7.2% | | | | | | | |
|
|
|
|
|
|
|
|
Consumer Staples Select Sector
SPDR Fund | | | 1,816 | | | 52,246 | |
Health Care Select Sector SPDR Fund | | | 2,136 | | | 66,494 | |
iShares iBoxx $ Investment Grade
Corporate Bond Fund | | | 1,171 | | | 131,574 | |
PowerShares Global Listed Private
Equity Portfolio ETF | | | 59,001 | | | 623,051 | |
SPDR S&P International Consumer
Staples Sector ETF | | | 1,728 | | | 52,773 | |
SPDR S&P International Health Care
Sector ETF | | | 1,440 | | | 43,502 | |
| | | | | | | |
Exchange Traded Funds, continued | | | | | | | |
|
|
|
|
|
|
|
|
| | | | | | | |
| | Shares | | Value($) | |
| |
| |
| |
SPDR S&P International
Telecommunications Sector ETF | | | 1,040 | | | 26,998 | |
Vanguard Telecommunication
Services ETF | | | 237 | | | 15,042 | |
| | | | |
|
| |
TOTAL EXCHANGE TRADED
FUNDS (COST $947,734) | | | | | | 1,011,680 | |
| | | | |
|
| |
TOTAL INVESTMENTS—99.6% | | | | | | 14,050,328 | |
| | | | |
|
| |
| |
|
| Percentages indicated are based on net assets of $14,102,990. |
| |
(a) | The rate represents the annualized one-day yield that was in effect on October 31, 2010. |
| |
ETF | — Exchange Traded Fund |
SPDR | — Standard & Poor’s Depositary Receipt |
| | |
See notes to financial statements | HSBC INVESTOR FAMILY OF FUNDS | 12 |
|
BALANCED STRATEGY FUND |
|
Schedule of Portfolio Investments—as of October 31, 2010 |
| | | | | | | |
Affiliated Investment Companies—5.2% |
|
| | | | | | | |
| | Shares | | Value($) | |
| |
| |
| |
HSBC Investor Mid-Cap Fund,
Class I Shares | | | 218,347 | | | 1,596,114 | |
HSBC Investor Prime Money Market
Fund, Class I Shares, 0.05% (a) | | | 530,482 | | | 530,482 | |
| | | | |
|
| |
TOTAL AFFILIATED
INVESTMENT COMPANIES
(COST $1,971,690) | | | | | | 2,126,596 | |
| | | | |
|
| |
|
Affiliated Portfolios—41.7% | | | | | | | |
|
|
|
|
|
|
|
|
HSBC Investor Growth Portfolio | | | 4,669,472 | | | 6,625,163 | |
HSBC Investor International Equity Portfolio | | | 936,665 | | | 2,234,213 | |
HSBC Investor Opportunity Portfolio | | | 461,079 | | | 1,683,953 | |
HSBC Investor Value Portfolio | | | 4,774,420 | | | 6,446,088 | |
| | | | |
|
| |
TOTAL AFFILIATED
PORTFOLIOS | | | | | | 16,989,417 | |
| | | | |
|
| |
|
Unaffiliated Investment Companies—46.4% | | | | | | | |
|
|
|
|
|
|
|
|
BlackRock Latin America Fund, Inc.,
Institutional Shares | | | 3,572 | | | 269,213 | |
Cohen & Steers Institutional Global
Realty Shares, Inc. | | | 14,469 | | | 305,442 | |
Delaware Emerging Markets Fund,
Class I Shares | | | 64,740 | | | 995,061 | |
EII Global Property Fund,
Institutional Shares | | | 21,392 | | | 315,744 | |
Goldman Sachs Emerging Markets
Debt Fund, Class I Shares | | | 215,901 | | | 2,821,890 | |
Goldman Sachs High Yield Fund,
Institutional Shares | | | 388,938 | | | 2,845,273 | |
Highbridge Statistical Market Neutral
Fund, Select Shares | | | 11,773 | | | 180,717 | |
JPMorgan High Yield Fund,
Select Shares | | | 341,349 | | | 2,802,472 | |
Lord Abbett Core Fixed Income Fund,
Institutional Shares | | | 107,700 | | | 1,238,423 | |
Metropolitan West Total Return
Bond Fund, Institutional Shares | | | 115,159 | | | 1,237,093 | |
Northern Institutional Diversified
Assets Portfolio, Institutional
Shares, 0.04% (a) | | | 40,343 | | | 40,343 | |
PIMCO Commodity RealReturn Strategy
Fund, Institutional Shares | | | 299,014 | | | 2,625,340 | |
PIMCO Total Return Fund,
Institutional Shares | | | 141,510 | | | 1,654,103 | |
Transamerica WMC Emerging Markets
Fund, Class I Shares | | | 107,764 | | | 1,538,865 | |
| | | | |
|
| |
TOTAL UNAFFILIATED
INVESTMENT COMPANIES
(COST $17,724,569) | | | | | | 18,869,979 | |
| | | | |
|
| |
|
Exchange Traded Funds—6.7% | | | | | | | |
|
|
|
|
|
|
|
|
Consumer Staples Select Sector SPDR Fund | | | 5,377 | | | 154,696 | |
Health Care Select Sector SPDR Fund | | | 5,298 | | | 164,927 | |
iShares iBoxx $Investment Grade Corporate Bond Fund | | | 6,871 | | | 772,025 | |
PowerShares Global Listed Private Equity Portfolio ETF | | | 120,644 | | | 1,274,001 | |
| | | | | | | |
Exchange Traded Funds, continued | | | | | | | |
|
|
|
|
|
|
|
|
| | | | | | | |
| | Shares | | Value($) | |
| |
| |
| |
SPDR S&P International Consumer
Staples Sector ETF | | | 4,476 | | | 136,697 | |
SPDR S&P International Health Care
Sector ETF | | | 3,403 | | | 102,805 | |
SPDR S&P International
Telecommunications Sector ETF | | | 3,079 | | | 79,931 | |
Vanguard Telecommunication
Services ETF | | | 696 | | | 44,175 | |
| | | | |
|
| |
TOTAL EXCHANGE TRADED
FUNDS (COST $2,595,956) | | | | | | 2,729,257 | |
| | | | |
|
| |
TOTAL INVESTMENTS—100.0% | | | | | | 40,715,249 | |
| | | | |
|
| |
| |
|
| Percentages indicated are based on net assets of $40,732,596. |
| |
(a) | The rate represents the annualized one-day yield that was in effect on October 31, 2010. |
| |
ETF | — Exchange Traded Fund |
SPDR | — Standard & Poor’s Depositary Receipt |
| | |
13 | HSBC INVESTOR FAMILY OF FUNDS | See notes to financial statements |
|
MODERATE STRATEGY FUND |
|
Schedule of Portfolio Investments—as of October 31, 2010 |
| | | | | | | |
Affiliated Investment Companies—3.9% |
|
| | | | | | | |
| | Shares | | Value($) | |
| |
| |
| |
HSBC Investor Mid-Cap Fund,
Class I Shares | | | 150,549 | | | 1,100,514 | |
HSBC Investor Prime Money Market
Fund, Class I Shares, 0.05% (a) | | | 470,360 | | | 470,360 | |
| | | | |
|
| |
TOTAL AFFILIATED
INVESTMENT COMPANIES
(COST $1,458,441) | | | | | | 1,570,874 | |
| | | | |
|
| |
|
Affiliated Portfolios—29.9% | | | | | | | |
|
|
|
|
|
|
|
|
HSBC Investor Growth Portfolio | | | 3,070,904 | | | 4,357,075 | |
HSBC Investor International Equity
Portfolio | | | 916,353 | | | 2,185,765 | |
HSBC Investor Opportunity Portfolio | | | 297,827 | | | 1,087,724 | |
HSBC Investor Value Portfolio | | | 3,162,111 | | | 4,269,260 | |
| | | | |
|
| |
TOTAL AFFILIATED
PORTFOLIOS | | | | | | 11,899,824 | |
| | | | |
|
| |
|
Unaffiliated Investment Companies—61.1% | | | | | | | |
|
|
|
|
|
|
|
|
BlackRock Latin America Fund, Inc.,
Institutional Shares | | | 2,633 | | | 198,457 | |
Cohen & Steers Institutional Global
Realty Shares, Inc. | | | 11,904 | | | 251,285 | |
Delaware Emerging Markets Fund,
Class I Shares | | | 47,604 | | | 731,666 | |
EII Global Property Fund,
Institutional Shares | | | 20,810 | | | 307,151 | |
Goldman Sachs Emerging Markets
Debt Fund, Class I Shares | | | 239,105 | | | 3,125,169 | |
Goldman Sachs High Yield Fund,
Institutional Shares | | | 381,238 | | | 2,786,786 | |
Highbridge Statistical Market Neutral
Fund, Select Shares | | | 34,670 | | | 532,179 | |
JPMorgan High Yield Fund,
Select Shares | | | 335,620 | | | 2,755,437 | |
Lord Abbett Core Fixed Income Fund,
Institutional Shares | | | 246,529 | | | 2,834,804 | |
Metropolitan West Total Return
Bond Fund, Institutional Shares | | | 263,600 | | | 2,831,707 | |
Northern Institutional Diversified
Assets Portfolio, Institutional
Shares, 0.04% (a) | | | 32,556 | | | 32,556 | |
PIMCO Commodity RealReturn Strategy
Fund, Institutional Shares | | | 345,990 | | | 3,037,793 | |
PIMCO Total Return Fund,
Institutional Shares | | | 322,260 | | | 3,766,833 | |
Transamerica WMC Emerging Markets
Fund, Class I Shares | | | 79,636 | | | 1,137,204 | |
| | | | |
|
| |
TOTAL UNAFFILIATED
INVESTMENT COMPANIES
(COST $22,876,579) | | | | | | 24,329,027 | |
| | | | |
|
| |
|
Exchange Traded Funds—5.0% | | | | | | | |
|
|
|
|
|
|
|
|
Consumer Staples Select Sector
SPDR Fund | | | 4,092 | | | 117,727 | |
Health Care Select Sector SPDR Fund | | | 3,948 | | | 122,901 | |
iShares iBoxx $ Investment Grade
Corporate Bond Fund | | | 6,766 | | | 760,228 | |
PowerShares Global Listed Private
Equity Portfolio ETF | | | 65,775 | | | 694,584 | |
| | | | | | | |
Exchange Traded Funds, continued | | | | | | | |
|
|
|
|
|
|
|
|
| | | | | | | |
| | Shares | | Value($) | |
| |
| |
| |
SPDR S&P International Consumer
Staples Sector ETF | | | 3,400 | | | 103,836 | |
SPDR S&P International Health Care
Sector ETF | | | 2,640 | | | 79,754 | |
SPDR S&P International
Telecommunications Sector ETF | | | 2,445 | | | 63,473 | |
Vanguard Telecommunication
Services ETF | | | 569 | | | 36,114 | |
| | | | |
|
| |
TOTAL EXCHANGE TRADED
FUNDS (COST $1,897,692) | | | | | | 1,978,617 | |
| | | | |
|
| |
TOTAL INVESTMENTS—99.9% | | | | | | 39,778,342 | |
| | | | |
|
| |
| |
|
| Percentages indicated are based on net assets of $39,827,610. |
| |
(a) | The rate represents the annualized one-day yield that was in effect on October 31, 2010. |
| |
ETF | — Exchange Traded Fund |
SPDR | — Standard & Poor’s Depositary Receipt |
| | |
See notes to financial statements | HSBC INVESTOR FAMILY OF FUNDS | 14 |
|
CONSERVATIVE STRATEGY FUND |
|
Schedule of Portfolio Investments—as of October 31, 2010 |
| | | | | | | |
Affiliated Investment Companies—3.1% |
|
| | | | | | | |
| | Shares | | Value($) | |
| |
| |
| |
HSBC Investor Mid-Cap Fund,
Class I Shares | | | 34,397 | | | 251,441 | |
HSBC Investor Prime Money Market
Fund, Class I Shares, 0.05% (a) | | | 239,347 | | | 239,347 | |
| | | | |
|
| |
TOTAL AFFILIATED
INVESTMENT COMPANIES
(COST $466,457) | | | | | | 490,788 | |
| | | | |
|
| |
|
Affiliated Portfolios—20.9% | | | | | | | |
|
|
|
|
|
|
|
|
HSBC Investor Growth Portfolio | | | 760,370 | | | 1,078,832 | |
HSBC Investor International Equity
Portfolio | | | 372,404 | | | 888,289 | |
HSBC Investor Opportunity Portfolio | | | 73,386 | | | 268,019 | |
HSBC Investor Value Portfolio | | | 797,449 | | | 1,076,660 | |
| | | | |
|
| |
TOTAL AFFILIATED
PORTFOLIOS | | | | | | 3,311,800 | |
| | | | |
|
| |
|
Unaffiliated Investment Companies—73.2% | | | | | | | |
|
|
|
|
|
|
|
|
Cohen & Steers Institutional Global
Realty Shares, Inc. | | | 956 | | | 20,179 | |
Delaware Emerging Markets Fund,
Class I Shares | | | 3,488 | | | 53,607 | |
EII Global Property Fund,
Institutional Shares | | | 1,370 | | | 20,225 | |
Goldman Sachs Emerging Markets Debt
Fund, Class I Shares | | | 91,615 | | | 1,197,436 | |
Goldman Sachs High Yield Fund,
Institutional Shares | | | 144,535 | | | 1,056,535 | |
Highbridge Statistical Market Neutral
Fund, Select Shares | | | 27,772 | | | 426,295 | |
JPMorgan High Yield Fund,
Select Shares | | | 129,754 | | | 1,065,284 | |
Lord Abbett Core Fixed Income Fund,
Institutional Shares | | | 171,409 | | | 1,971,001 | |
Metropolitan West Total Return
Bond Fund, Institutional Shares | | | 183,281 | | | 1,968,888 | |
Northern Institutional Diversified
Assets Portfolio, Institutional
Shares, 0.04% (a) | | | 41,910 | | | 41,910 | |
PIMCO Commodity RealReturn Strategy
Fund, Institutional Shares | | | 123,963 | | | 1,088,394 | |
PIMCO Total Return Fund,
Institutional Shares | | | 224,550 | | | 2,624,725 | |
Transamerica WMC Emerging Markets
Fund, Class I Shares | | | 5,765 | | | 82,324 | |
| | | | |
|
| |
TOTAL UNAFFILIATED
INVESTMENT COMPANIES
(COST $11,089,823) | | | | | | 11,616,803 | |
| | | | |
|
| |
|
Exchange Traded Funds—2.9% | | | | | | | |
|
|
|
|
|
|
|
|
Consumer Staples Select Sector
SPDR Fund | | | 906 | | | 26,066 | |
Health Care Select Sector SPDR Fund | | | 876 | | | 27,270 | |
iShares iBoxx $ Investment Grade
Corporate Bond Fund | | | 2,699 | | | 303,260 | |
PowerShares Global Listed Private
Equity Portfolio ETF | | | 3,961 | | | 41,828 | |
SPDR S&P International Consumer
Staples Sector ETF | | | 739 | | | 22,569 | |
| | | | | | | |
Exchange Traded Funds, continued |
|
| | | | | | | |
| | Shares | | Value($) | |
| |
| |
| |
SPDR S&P International Health Care
Sector ETF | | | 580 | | | 17,522 | |
SPDR S&P International
Telecommunications Sector ETF | | | 542 | | | 14,070 | |
Vanguard Telecommunication
Services ETF | | | 124 | | | 7,870 | |
| | | | |
|
| |
TOTAL EXCHANGE TRADED
FUNDS (COST $450,654) | | | | | | 460,455 | |
| | | | |
|
| |
TOTAL INVESTMENTS—100.1% | | | | | | 15,879,846 | |
| | | | |
|
| |
| |
|
| Percentages indicated are based on net assets of $15,872,522. |
| |
(a) | The rate represents the annualized one-day yield that was in effect on October 31, 2010. |
| |
ETF | — Exchange Traded Fund |
SPDR | — Standard & Poor’s Depositary Receipt |
| | |
15 | HSBC INVESTOR FAMILY OF FUNDS | See notes to financial statements |
(This Page Intentionally Left Blank)
|
HSBC INVESTOR WORLD SELECTION FUNDS |
|
Statements of Assets and Liabilities—as of October 31, 2010 |
| | | | | | | | | | | | | |
| | Aggressive
Strategy
Fund | | Balanced
Strategy
Fund | | Moderate
Strategy
Fund | | Conservative
Strategy
Fund | |
|
|
|
|
|
|
|
|
|
|
Assets: | | | | | | | | | | | | | |
Investments in Affiliated Portfolios | | $ | 8,354,822 | | $ | 16,989,417 | | $ | 11,899,824 | | $ | 3,311,800 | |
Investments in Affiliated Funds, at value (a) | | | 955,460 | | | 2,126,596 | | | 1,570,874 | | | 490,788 | |
Investments in non-affiliates, at value | | | 4,740,046 | | | 21,599,236 | | | 26,307,644 | | | 12,077,258 | |
| |
|
| |
|
| |
|
| |
|
| |
Total Investments | | | 14,050,328 | | | 40,715,249 | | | 39,778,342 | | | 15,879,846 | |
| |
|
| |
|
| |
|
| |
|
| |
Receivable for capital shares issued | | | 57,590 | | | 135,162 | | | 148,216 | | | 63,982 | |
Receivable for investments sold | | | 1,226 | | | — | | | — | | | — | |
Income and dividends receivable | | | 326 | | | 3,254 | | | 7,564 | | | 5,266 | |
Reclaims receivable | | | 6,536 | | | 15,453 | | | 13,265 | | | 3,050 | |
Receivable from Custodian | | | 445 | | | 1,153 | | | 992 | | | 231 | |
Receivable from Investment Adviser | | | 6,382 | | | 1,690 | | | 1,667 | | | 660 | |
Prepaid expenses and other assets | | | 9,127 | | | 10,185 | | | 10,691 | | | 7,510 | |
| |
|
| |
|
| |
|
| |
|
| |
Total Assets | | | 14,131,960 | | | 40,882,146 | | | 39,960,737 | | | 15,960,545 | |
| |
|
| |
|
| |
|
| |
|
| |
Liabilities: | | | | | | | | | | | | | |
Cash overdraft | | | 1,247 | | | 59 | | | 55 | | | 28 | |
Payable for capital shares redeemed | | | — | | | 49,195 | | | 39,612 | | | 19,377 | |
Payable for investments purchased | | | — | | | 40,167 | | | 32,365 | | | 41,738 | |
Accrued expenses and other liabilities: | | | | | | | | | | | | | |
Investment Management | | | 586 | | | 1,690 | | | 1,667 | | | 660 | |
Administration | | | 246 | | | 709 | | | 699 | | | 278 | |
Distribution | | | 3,860 | | | 11,700 | | | 13,083 | | | 5,378 | |
Shareholder Servicing | | | 2,919 | | | 8,423 | | | 8,327 | | | 3,292 | |
Compliance Services | | | 1 | | | 1 | | | 1 | | | — | |
Transfer Agent | | | 8,518 | | | 13,450 | | | 13,850 | | | 6,820 | |
Trustee | | | 26 | | | 71 | | | 69 | | | 28 | |
Other | | | 11,567 | | | 24,085 | | | 23,399 | | | 10,424 | |
| |
|
| |
|
| |
|
| |
|
| |
Total Liabilities | | | 28,970 | | | 149,550 | | | 133,127 | | | 88,023 | |
| |
|
| |
|
| |
|
| |
|
| |
Net Assets | | $ | 14,102,990 | | $ | 40,732,596 | | $ | 39,827,610 | | $ | 15,872,522 | |
| |
|
| |
|
| |
|
| |
|
| |
| | | | | | | | | | | | | |
Composition of Net Assets: | | | | | | | | | | | | | |
Capital | | | 14,106,624 | | | 40,100,764 | | | 39,429,019 | | | 15,503,420 | |
Accumulated net investment income (loss) | | | 16,716 | | | 489,748 | | | 102,701 | | | 44,293 | |
Accumulated net realized gains (losses) from investment and foreign currency transactions | | | (1,222,999 | ) | | (3,130,645 | ) | | (2,825,032 | ) | | (620,866 | ) |
Unrealized appreciation/depreciation from investments and foreign currencies | | | 1,202,649 | | | 3,272,729 | | | 3,120,922 | | | 945,675 | |
| |
|
| |
|
| |
|
| |
|
| |
Net Assets | | $ | 14,102,990 | | $ | 40,732,596 | | $ | 39,827,610 | | $ | 15,872,522 | |
| |
|
| |
|
| |
|
| |
|
| |
| | | | | | | | | | | | | |
Net Assets: | | | | | | | | | | | | | |
Class A Shares | | $ | 7,885,834 | | $ | 21,642,278 | | $ | 18,921,081 | | $ | 7,138,641 | |
Class B Shares | | | 5,519,142 | | | 15,593,267 | | | 18,362,456 | | | 7,411,018 | |
Class C Shares | | | 698,014 | | | 3,497,051 | | | 2,544,073 | | | 1,322,863 | |
| |
|
| |
|
| |
|
| |
|
| |
| | $ | 14,102,990 | | $ | 40,732,596 | | $ | 39,827,610 | | $ | 15,872,522 | |
| |
|
| |
|
| |
|
| |
|
| |
| | | | | | | | | | | | | |
Shares Outstanding | | | | | | | | | | | | | |
($0.001 par value, unlimited number of shares authorized): | | | | | | | | | | | | | |
Class A Shares | | | 655,558 | | | 1,789,497 | | | 1,648,799 | | | 640,476 | |
Class B Shares | | | 478,455 | | | 1,293,989 | | | 1,601,635 | | | 672,240 | |
Class C Shares | | | 60,535 | | | 289,188 | | | 227,602 | | | 116,803 | |
Net Asset Value, Offering Price and Redemption Price per share: | | | | | | | | | | | | | |
Class A Shares | | $ | 12.03 | | $ | 12.09 | | $ | 11.48 | | $ | 11.15 | |
Class B Shares (b) | | $ | 11.54 | | $ | 12.05 | | $ | 11.46 | | $ | 11.02 | |
Class C Shares (b) | | $ | 11.53 | | $ | 12.09 | | $ | 11.18 | | $ | 11.33 | |
Maximum Sales Charge—Class A Shares | | | 5.00 | % | | 5.00 | % | | 5.00 | % | | 5.00 | % |
| |
|
| |
|
| |
|
| |
|
| |
Maximum Offering Price per share (Net Asset Value/(100%-maximum sales charge))—Class A Shares | | $ | 12.66 | | $ | 12.73 | | $ | 12.08 | | $ | 11.74 | |
| |
|
| |
|
| |
|
| |
|
| |
Investments in Affiliated Funds, at cost (a) | | $ | 881,535 | | $ | 1,971,690 | | $ | 1,458,441 | | $ | 466,457 | |
Investments in non-affiliates, at cost | | | 4,441,143 | | | 20,320,525 | | | 24,774,271 | | | 11,540,477 | |
| |
|
| |
|
| |
|
| |
|
| |
| | |
| |
(a) | The investment in the affiliated funds is the HSBC Investor Prime Money Market Fund, Class I Shares and HSBC Investor Mid Cap Fund, Class I Shares (See Note 1). |
|
(b) | Redemption Price per share varies by length of time shares are held. |
| | |
17 | HSBC INVESTOR WORLD SELECTION FUNDS | See notes to financial statements |
|
HSBC INVESTOR WORLD SELECTION FUNDS |
|
Statements of Operations—For the year ended October 31, 2010 |
| | | | | | | | | | | | | |
| | Aggressive
Strategy
Fund | | Balanced
Strategy
Fund | | Moderate
Strategy
Fund | | Conservative
Strategy
Fund | |
|
|
|
|
|
|
|
|
|
|
Investment Income: | | | | | | | | | | | | | |
Investment income from non-affiliates | | $ | 102,265 | | $ | 786,708 | | $ | 1,051,487 | | $ | 427,183 | |
Investment Income from Affiliated Portfolios (a) | | | 98,247 | | | 206,371 | | | 178,963 | | | 45,700 | |
Investment income from Affiliated Funds | | | 200 | | | 651 | | | 1,132 | | | 858 | |
Tax reclaims from Affiliated Portfolios (a) | | | 3,444 | | | 2,372 | | | 3,144 | | | 3,322 | |
Foreign tax withholding from Affiliated Portfolios (a) | | | (4,952 | ) | | (9,148 | ) | | (9,410 | ) | | (2,806 | ) |
Expenses from Affiliated Portfolios (a) | | | (57,769 | ) | | (121,632 | ) | | (97,874 | ) | | (23,480 | ) |
| |
|
| |
|
| |
|
| |
|
| |
Total Investment Income (Loss) | | | 141,435 | | | 865,322 | | | 1,127,442 | | | 450,777 | |
| |
|
| |
|
| |
|
| |
|
| |
| | | | | | | | | | | | | |
Expenses: | | | | | | | | | | | | | |
Investment Management | | | 5,709 | | | 16,545 | | | 17,625 | | | 6,207 | |
Administration: | | | | | | | | | | | | | |
Class A Shares | | | 1,322 | | | 3,620 | | | 3,538 | | | 1,157 | |
Class B Shares | | | 905 | | | 2,579 | | | 3,237 | | | 1,201 | |
Class C Shares | | | 95 | | | 482 | | | 377 | | | 166 | |
Distribution: | | | | | | | | | | | | | |
Class B Shares | | | 33,424 | | | 95,941 | | | 119,635 | | | 44,375 | |
Class C Shares | | | 3,485 | | | 17,817 | | | 13,940 | | | 6,124 | |
Shareholder Servicing: | | | | | | | | | | | | | |
Class A Shares | | | 16,268 | | | 44,883 | | | 43,641 | | | 14,231 | |
Class B Shares | | | 11,144 | | | 31,978 | | | 39,887 | | | 14,791 | |
Class C Shares | | | 1,161 | | | 5,938 | | | 4,646 | | | 2,038 | |
Accounting | | | 19,187 | | | 19,189 | | | 19,189 | | | 19,176 | |
Compliance Services | | | 50 | | | 147 | | | 156 | | | 54 | |
Custodian | | | 24,968 | | | 29,001 | | | 28,465 | | | 23,249 | |
Printing | | | 21,455 | | | 49,577 | | | 54,988 | | | 19,801 | |
Transfer Agent | | | 49,561 | | | 78,953 | | | 77,439 | | | 39,663 | |
Trustee | | | 172 | | | 499 | | | 535 | | | 187 | |
Registration fees | | | 11,603 | | | 12,589 | | | 13,975 | | | 7,168 | |
Other | | | 6,975 | | | 13,231 | | | 13,664 | | | 6,063 | |
| |
|
| |
|
| |
|
| |
|
| |
Total expenses before fee reductions | | | 207,484 | | | 422,969 | | | 454,937 | | | 205,651 | |
Fees contractually reduced by Investment Adviser | | | (56,869 | ) | | — | | | — | | | — | |
Fees voluntarily reduced by Investment Adviser | | | — | | | (16,545 | ) | | (17,625 | ) | | (6,207 | ) |
| |
|
| |
|
| |
|
| |
|
| |
Net Expenses | | | 150,615 | | | 406,424 | | | 437,312 | | | 199,444 | |
| |
|
| |
|
| |
|
| |
|
| |
| | | | | | | | | | | | | |
Net Investment Income (Loss) | | | (9,180 | ) | | 458,898 | | | 690,130 | | | 251,333 | |
| |
|
| |
|
| |
|
| |
|
| |
|
Net Realized/Unrealized Gains (Losses) from Investments: | | | | | | | | | | | | | |
Net realized gains(losses) from affiliated investments and foreign currency transactions (a) | | | 597,399 | | | 1,440,050 | | | 1,202,953 | | | 264,527 | |
Net realized gains(losses) from investments and foreign currency transactions | | | 10,267 | | | 421,472 | | | 827,311 | | | 461,923 | |
Change in unrealized appreciation/depreciation from affiliated investments and foreign currencies (a) | | | 938,942 | | | 2,064,187 | | | 1,586,517 | | | 392,873 | |
Change in unrealized appreciation/depreciation from investments and foreign currencies | | | 298,903 | | | 1,017,291 | | | 913,830 | | | 258,786 | |
| |
|
| |
|
| |
|
| |
|
| |
Net realized/unrealized gains from investments and foreign currency transactions | | | 1,845,511 | | | 4,943,000 | | | 4,530,611 | | | 1,378,109 | |
| |
|
| |
|
| |
|
| |
|
| |
Change In Net Assets Resulting From Operations | | $ | 1,836,331 | | $ | 5,401,898 | | $ | 5,220,741 | | $ | 1,629,442 | |
| |
|
| |
|
| |
|
| |
|
| |
| | |
| |
(a) | Represents amounts allocated from the respective Affiliated Portfolios. |
| | |
See notes to financial statements | HSBC INVESTOR WORLD SELECTION FUNDS | 18 |
|
HSBC INVESTOR WORLD SELECTION FUNDS |
|
Statements of Changes in Net Assets |
| | | | | | | | | | | | | |
| | Aggressive Strategy Fund | | Balanced Strategy Fund | |
|
|
|
|
|
|
| | For the
year ended
October 31, 2010 | | For the
year ended
October 31, 2009 | | For the
year ended
October 31, 2010 | | For the
year ended
October 31, 2009 | |
|
|
|
|
|
|
|
|
|
|
Investment Activities: | | | | | | | | | | | | | |
Operations: | | | | | | | | | | | | | |
Net investment income (loss) | | $ | (9,180 | ) | $ | (19,050 | ) | $ | 458,898 | | $ | 121,934 | |
Net realized gains (losses) from investments transactions | | | 607,666 | | | (1,143,628 | ) | | 1,861,522 | | | (3,219,284 | ) |
Change in unrealized appreciation/depreciation from investments and foreign currencies | | | 1,237,845 | | | 2,619,167 | | | 3,081,478 | | | 7,340,545 | |
| |
|
| |
|
| |
|
| |
|
| |
Change in net assets resulting from operations | | | 1,836,331 | | | 1,456,489 | | | 5,401,898 | | | 4,243,195 | |
| |
|
| |
|
| |
|
| |
|
| |
| | | | | | | | | | | | | |
Dividends: | | | | | | | | | | | | | |
Net investment income: | | | | | | | | | | | | | |
Class A Shares | | | — | | | — | | | (120,819 | ) | | (139,550 | ) |
Class B Shares | | | — | | | — | | | (13,178 | ) | | (7,901 | ) |
Class C Shares | | | — | | | — | | | (2,104 | ) | | (1,544 | ) |
| |
|
| |
|
| |
|
| |
|
| |
Change in net assets resulting from shareholder dividends | | | — | | | — | | | (136,101 | ) | | (148,995 | ) |
| |
|
| |
|
| |
|
| |
|
| |
Change in net assets resulting from capital transactions | | | 2,784,370 | | | (31,438 | ) | | 7,459,473 | | | (447,939 | ) |
| |
|
| |
|
| |
|
| |
|
| |
Change in net assets | | | 4,620,701 | | | 1,425,051 | | | 12,725,270 | | | 3,646,261 | |
| |
|
| |
|
| |
|
| |
|
| |
| | | | | | | | | | | | | |
Net Assets: | | | | | | | | | | | | | |
Beginning of period | | | 9,482,289 | | | 8,057,238 | | | 28,007,326 | | | 24,361,065 | |
| |
|
| |
|
| |
|
| |
|
| |
End of period | | $ | 14,102,990 | | $ | 9,482,289 | | $ | 40,732,596 | | $ | 28,007,326 | |
| |
|
| |
|
| |
|
| |
|
| |
Accumulated net investment income (loss) | | $ | 16,716 | | $ | — | | $ | 489,748 | | $ | 122,678 | |
| |
|
| |
|
| |
|
| |
|
| |
| | |
19 | HSBC INVESTOR WORLD SELECTION FUNDS | See notes to financial statements |
|
HSBC INVESTOR WORLD SELECTION FUNDS |
|
Statements of Changes in Net Assets (continued) |
| | | | | | | | | | | | | |
| | Aggressive Strategy Fund | | Balanced Strategy Fund | |
|
|
|
|
|
|
| | For the
year ended
October 31, 2010 | | For the
year ended
October 31, 2009 | | For the
year ended
October 31, 2010 | | For the
year ended
October 31, 2009 | |
|
|
|
|
|
|
|
|
|
|
CAPITAL TRANSACTIONS: | | | | | | | | | | | | | |
Class A Shares: | | | | | | | | | | | | | |
Proceeds from shares issued | | $ | 2,263,565 | | $ | 919,824 | | $ | 5,390,506 | | $ | 1,604,683 | |
Dividends reinvested | | | — | | | — | | | 118,661 | | | 138,893 | |
Value of shares redeemed | | | (860,729 | ) | | (913,945 | ) | | (2,048,014 | ) | | (2,526,023 | ) |
| |
|
| |
|
| |
|
| |
|
| |
Class A Shares capital transactions | | | 1,402,836 | | | 5,879 | | | 3,461,153 | | | (782,447 | ) |
| |
|
| |
|
| |
|
| |
|
| |
| | | | | | | | | | | | | |
Class B Shares: | | | | | | | | | | | | | |
Proceeds from shares issued | | | 1,549,215 | | | 424,668 | | | 4,043,666 | | | 935,667 | |
Dividends reinvested | | | — | | | — | | | 13,153 | | | 7,888 | |
Value of shares redeemed | | | (509,274 | ) | | (383,617 | ) | | (1,683,420 | ) | | (915,409 | ) |
| |
|
| |
|
| |
|
| |
|
| |
Class B Shares capital transactions | | | 1,039,941 | | | 41,051 | | | 2,373,399 | | | 28,146 | |
| |
|
| |
|
| |
|
| |
|
| |
| | | | | | | | | | | | | |
Class C Shares: | | | | | | | | | | | | | |
Proceeds from shares issued | | | 470,488 | | | 16,971 | | | 1,889,455 | | | 496,755 | |
Dividends reinvested | | | — | | | — | | | 2,040 | | | 1,544 | |
Value of shares redeemed | | | (128,895 | ) | | (95,339 | ) | | (266,574 | ) | | (191,937 | ) |
| |
|
| |
|
| |
|
| |
|
| |
Class C Shares capital transactions | | | 341,593 | | | (78,368 | ) | | 1,624,921 | | | 306,362 | |
| |
|
| |
|
| |
|
| |
|
| |
Change in net assets resulting from capital transactions | | $ | 2,784,370 | | $ | (31,438 | ) | $ | 7,459,473 | | $ | (447,939 | ) |
| |
|
| |
|
| |
|
| |
|
| |
| | | | | | | | | | | | | |
SHARE TRANSACTIONS: | | | | | | | | | | | | | |
Class A Shares: | | | | | | | | | | | | | |
Issued | | | 200,993 | | | 108,502 | | | 480,315 | | | 177,228 | |
Reinvested | | | — | | | — | | | 10,886 | | | 17,211 | |
Redeemed | | | (77,306 | ) | | (107,013 | ) | | (182,412 | ) | | (293,206 | ) |
| |
|
| |
|
| |
|
| |
|
| |
Change in Class A Shares | | | 123,687 | | | 1,489 | | | 308,789 | | | (98,767 | ) |
| |
|
| |
|
| |
|
| |
|
| |
| | | | | | | | | | | | | |
Class B Shares: | | | | | | | | | | | | | |
Issued | | | 144,296 | | | 50,718 | | | 358,138 | | | 104,902 | |
Reinvested | | | — | | | — | | | 1,203 | | | 973 | |
Redeemed | | | (48,010 | ) | | (45,783 | ) | | (151,283 | ) | | (105,971 | ) |
| |
|
| |
|
| |
|
| |
|
| |
Change in Class B Shares | | | 96,286 | | | 4,935 | | | 208,058 | | | (96 | ) |
| |
|
| |
|
| |
|
| |
|
| |
| | | | | | | | | | | | | |
Class C Shares: | | | | | | | | | | | | | |
Issued | | | 43,232 | | | 2,243 | | | 167,676 | | | 58,266 | |
Reinvested | | | — | | | — | | | 186 | | | 190 | |
Redeemed | | | (12,008 | ) | | (11,023 | ) | | (24,287 | ) | | (19,296 | ) |
| |
|
| |
|
| |
|
| |
|
| |
Change in Class C Shares | | | 31,224 | | | (8,780 | ) | | 143,575 | | | 39,160 | |
| |
|
| |
|
| |
|
| |
|
| |
| | |
See notes to financial statements | HSBC INVESTOR WORLD SELECTION FUNDS | 20 |
|
HSBC INVESTOR WORLD SELECTION FUNDS |
|
Statements of Changes in Net Assets (continued) |
| | | | | | | | | | | | | |
| | Moderate Strategy Fund | | Conservative Strategy Fund | |
|
|
|
|
|
|
| | For the
year ended
October 31, 2010 | | For the
year ended
October 31, 2009 | | For the
year ended
October 31, 2010 | | For the
year ended
October 31, 2009 | |
|
|
|
|
|
|
|
|
|
|
Investment Activities: | | | | | | | | | | | | | |
Operations: | | | | | | | | | | | | | |
Net investment income (loss) | | $ | 690,130 | | $ | 304,905 | | $ | 251,333 | | $ | 110,589 | |
Net realized gains (losses) from investments transactions | | | 2,030,264 | | | (3,357,874 | ) | | 726,450 | | | (973,853 | ) |
Change in unrealized appreciation/depreciation from investments and foreign currencies | | | 2,500,347 | | | 7,600,975 | | | 651,659 | | | 2,220,121 | |
| |
|
| |
|
| |
|
| |
|
| |
Change in net assets resulting from operations | | | 5,220,741 | | | 4,548,006 | | | 1,629,442 | | | 1,356,857 | |
| |
|
| |
|
| |
|
| |
|
| |
| | | | | | | | | | | | | |
Dividends: | | | | | | | | | | | | | |
Net investment income: | | | | | | | | | | | | | |
Class A Shares | | | (395,383 | ) | | (193,616 | ) | | (127,525 | ) | | (71,561 | ) |
Class B Shares | | | (254,802 | ) | | (84,484 | ) | | (93,624 | ) | | (34,422 | ) |
Class C Shares | | | (32,803 | ) | | (9,513 | ) | | (14,198 | ) | | (3,180 | ) |
| |
|
| |
|
| |
|
| |
|
| |
Change in net assets resulting from shareholder dividends | | | (682,988 | ) | | (287,613 | ) | | (235,347 | ) | | (109,163 | ) |
| |
|
| |
|
| |
|
| |
|
| |
Change in net assets resulting from capital transactions | | | 3,662,397 | | | (620,407 | ) | | 4,028,105 | | | (322,434 | ) |
| |
|
| |
|
| |
|
| |
|
| |
Change in net assets | | | 8,200,150 | | | 3,639,986 | | | 5,422,200 | | | 925,260 | |
| |
|
| |
|
| |
|
| |
|
| |
| | | | | | | | | | | | | |
Net Assets: | | | | | | | | | | | | | |
Beginning of period | | | 31,627,460 | | | 27,987,474 | | | 10,450,322 | | | 9,525,062 | |
| |
|
| |
|
| |
|
| |
|
| |
End of period | | $ | 39,827,610 | | $ | 31,627,460 | | $ | 15,872,522 | | $ | 10,450,322 | |
| |
|
| |
|
| |
|
| |
|
| |
Accumulated net investment income (loss) | | $ | 102,701 | | $ | 46,429 | | $ | 44,293 | | $ | 11,295 | |
| |
|
| |
|
| |
|
| |
|
| |
| | |
21 | HSBC INVESTOR WORLD SELECTION FUNDS | See notes to financial statements |
|
HSBC INVESTOR WORLD SELECTION FUNDS |
|
Statements of Changes in Net Assets (continued) |
| | | | | | | | | | | | | |
| | Moderate Strategy Fund | | Conservative Strategy Fund | |
|
|
|
|
|
|
| | For the
year ended
October 31, 2010 | | For the
year ended
October 31, 2009 | | For the
year ended
October 31, 2010 | | For the
year ended
October 31, 2009 | |
|
|
|
|
|
|
|
|
|
|
CAPITAL TRANSACTIONS: | | | | | | | | | | | | | |
Class A Shares: | | | | | | | | | | | | | |
Proceeds from shares issued | | $ | 3,956,868 | | $ | 1,737,577 | | $ | 2,330,836 | | $ | 845,986 | |
Dividends reinvested | | | 392,648 | | | 193,104 | | | 121,984 | | | 69,473 | |
Value of shares redeemed | | | (3,557,464 | ) | | (2,409,781 | ) | | (1,021,219 | ) | | (1,218,686 | ) |
| |
|
| |
|
| |
|
| |
|
| |
Class A Shares capital transactions | | | 792,052 | | | (479,100 | ) | | 1,431,601 | | | (303,227 | ) |
| |
|
| |
|
| |
|
| |
|
| |
| | | | | | | | | | | | | |
Class B Shares: | | | | | | | | | | | | | |
Proceeds from shares issued | | | 3,696,441 | | | 1,513,370 | | | 2,543,077 | | | 770,085 | |
Dividends reinvested | | | 252,936 | | | 84,267 | | | 92,314 | | | 33,341 | |
Value of shares redeemed | | | (1,889,818 | ) | | (1,629,024 | ) | | (777,671 | ) | | (820,164 | ) |
| |
|
| |
|
| |
|
| |
|
| |
Class B Shares capital transactions | | | 2,059,559 | | | (31,387 | ) | | 1,857,720 | | | (16,738 | ) |
| |
|
| |
|
| |
|
| |
|
| |
| | | | | | | | | | | | | |
Class C Shares: | | | | | | | | | | | | | |
Proceeds from shares issued | | | 1,048,351 | | | 297,893 | | | 973,280 | | | 79,844 | |
Dividends reinvested | | | 32,527 | | | 9,424 | | | 13,686 | | | 3,101 | |
Value of shares redeemed | | | (270,092 | ) | | (417,237 | ) | | (248,182 | ) | | (85,414 | ) |
| |
|
| |
|
| |
|
| |
|
| |
Class C Shares capital transactions | | | 810,786 | | | (109,920 | ) | | 738,784 | | | (2,469 | ) |
| |
|
| |
|
| |
|
| |
|
| |
Change in net assets resulting from capital transactions | | $ | 3,662,397 | | $ | (620,407 | ) | $ | 4,028,105 | | $ | (322,434 | ) |
| |
|
| |
|
| |
|
| |
|
| |
| | | | | | | | | | | | | |
SHARE TRANSACTIONS: | | | | | | | | | | | | | |
Class A Shares: | | | | | | | | | | | | | |
Issued | | | 367,550 | | | 194,386 | | | 220,441 | | | 94,440 | |
Reinvested | | | 36,767 | | | 22,198 | | | 11,600 | | | 7,802 | |
Redeemed | | | (332,930 | ) | | (275,784 | ) | | (97,162 | ) | | (133,563 | ) |
| |
|
| |
|
| |
|
| |
|
| |
Change in Class A Shares | | | 71,387 | | | (59,200 | ) | | 134,879 | | | (31,321 | ) |
| |
|
| |
|
| |
|
| |
|
| |
| | | | | | | | | | | | | |
Class B Shares: | | | | | | | | | | | | | |
Issued | | | 343,065 | | | 172,132 | | | 242,687 | | | 87,053 | |
Reinvested | | | 23,691 | | | 9,836 | | | 8,875 | | | 3,828 | |
Redeemed | | | (176,487 | ) | | (191,599 | ) | | (74,600 | ) | | (91,989 | ) |
| |
|
| |
|
| |
|
| |
|
| |
Change in Class B Shares | | | 190,269 | | | (9,631 | ) | | 176,962 | | | (1,108 | ) |
| |
|
| |
|
| |
|
| |
|
| |
| | | | | | | | | | | | | |
Class B Shares: | | | | | | | | | | | | | |
Issued | | | 99,026 | | | 33,657 | | | 90,908 | | | 8,443 | |
Reinvested | | | 3,116 | | | 1,125 | | | 1,280 | | | 348 | |
Redeemed | | | (25,776 | ) | | (49,433 | ) | | (23,022 | ) | | (8,952 | ) |
| |
|
| |
|
| |
|
| |
|
| |
Change in Class C Shares | | | 76,366 | | | (14,651 | ) | | 69,166 | | | (161 | ) |
| |
|
| |
|
| |
|
| |
|
| |
| | |
See notes to financial statements | HSBC INVESTOR WORLD SELECTION FUNDS | 22 |
|
|
AGGRESSIVE STRATEGY FUND |
|
Financial Highlights |
Selected data for a share outstanding throughout the periods indicated. (a)
| | | | | | | | | | | | | | | | | | | | | | | | | | |
| | | | Investment Activities | | Dividends | | | |
| | | |
| |
| | | |
| | Net Asset
Value,
Beginning
of Period | | Net
Investment
Income
(Loss) | | Net Realized
and Unrealized
Gains
(Losses) from
Investment
Transactions | | Total from
Investment
Activities | | Net
Realized
Gains from
Investment
Transactions | | Total
Dividends | | Net Asset
Value, End
of Period | |
|
|
|
|
|
|
|
|
|
|
|
|
|
|
|
|
|
|
|
|
|
|
|
CLASS A SHARES | | | | | | | | | | | | | | | | | | | | | | |
Year Ended October 31, 2006 | | | $ | 10.60 | | | 0.01 | | | 2.01 | | | 2.02 | | | (0.05 | ) | | (0.05 | ) | | | $ | 12.57 | | |
Year Ended October 31, 2007 | | | | 12.57 | | | — | *(e) | | 2.98 | | | 2.98 | | | — | | | — | | | | | 15.55 | | |
Year Ended October 31, 2008 | | | | 15.55 | | | 0.02 | * | | (6.05 | ) | | (6.03 | ) | | (0.90 | ) | | (0.90 | ) | | | | 8.62 | | |
Year Ended October 31, 2009 | | | | 8.62 | | | 0.01 | * | | 1.57 | | | 1.58 | | | — | | | — | | | | | 10.20 | | |
Year Ended October 31, 2010 | | | | 10.20 | | | 0.03 | * | | 1.80 | | | 1.83 | | | — | | | — | | | | | 12.03 | | |
|
|
|
|
|
|
|
|
|
|
|
|
|
|
|
|
|
|
|
|
|
|
|
|
|
|
|
CLASS B SHARES | | | | | | | | | | | | | | | | | | | | | | | | | | |
Year Ended October 31, 2006 | | | $ | 10.57 | | | (0.05 | ) | | 1.97 | | | 1.92 | | | (0.05 | ) | | (0.05 | ) | | | $ | 12.44 | | |
Year Ended October 31, 2007 | | | | 12.44 | | | (0.11 | )* | | 2.94 | | | 2.83 | | | — | | | — | | | | | 15.27 | | |
Year Ended October 31, 2008 | | | | 15.27 | | | (0.08 | )* | | (5.90 | ) | | (5.98 | ) | | (0.90 | ) | | (0.90 | ) | | | | 8.39 | | |
Year Ended October 31, 2009 | | | | 8.39 | | | (0.06 | )* | | 1.53 | | | 1.47 | | | — | | | — | | | | | 9.86 | | |
Year Ended October 31, 2010 | | | | 9.86 | | | (0.05 | )* | | 1.73 | | | 1.68 | | | — | | | — | | | | | 11.54 | | |
|
|
|
|
|
|
|
|
|
|
|
|
|
|
|
|
|
|
|
|
|
|
|
|
|
|
|
CLASS C SHARES | | | | | | | | | | | | | | | | | | | | | | | | | | |
Year Ended October 31, 2006 | | | $ | 10.55 | | | (0.04 | ) | | 1.95 | | | 1.91 | | | (0.05 | ) | | (0.05 | ) | | | $ | 12.41 | | |
Year Ended October 31, 2007 | | | | 12.41 | | | (0.11 | )* | | 2.96 | | | 2.85 | | | — | | | — | | | | | 15.26 | | |
Year Ended October 31, 2008 | | | | 15.26 | | | (0.08 | )* | | (5.89 | ) | | (5.97 | ) | | (0.90 | ) | | (0.90 | ) | | | | 8.39 | | |
Year Ended October 31, 2009 | | | | 8.39 | | | (0.05 | )* | | 1.51 | | | 1.46 | | | — | | | — | | | | | 9.85 | | |
Year Ended October 31, 2010 | | | | 9.85 | | | (0.05 | )* | | 1.73 | | | 1.68 | | | — | | | — | | | | | 11.53 | | |
|
|
|
|
|
|
|
|
|
|
|
|
|
|
|
|
|
|
|
|
|
|
|
|
|
|
|
| | | | | | | | | | | | | | | | | | | | | |
| | | | Ratios/Supplementary Data | |
| | | |
|
|
| | Total
Return | | Net Assets
at End of
Period
(000’s) | | Ratio of Net
Expenses to
Average Net
Assets | | Ratio of Net
Investment
Income
(Loss) to
Average
Net Assets | | Ratio of
Expenses to
Average Net
Assets(b) | | Portfolio
Turnover(c) | |
|
|
|
|
|
|
|
|
|
|
|
|
|
|
|
|
|
|
|
|
CLASS A SHARES | | | | | | | | | | | | | | | | | | | |
Year Ended October 31, 2006 | | 19.15 | % | | | $ | 4,116 | | | 1.50 | % | | 0.05 | % | | 3.52 | % | | 48.46 | % | |
Year Ended October 31, 2007 | | 23.71 | % | | | | 7,046 | | | 1.50 | % | | (0.03 | )% | | 2.27 | % | | 45.50 | % | |
Year Ended October 31, 2008 | | (40.92 | )%(d) | | | | 4,572 | | | 1.50 | % | | 0.13 | % | | 1.98 | % | | 72.33 | % | |
Year Ended October 31, 2009 | | 18.33 | %(f) | | | | 5,426 | | | 1.50 | % | | 0.09 | % | | 2.16 | % | | 53.42 | % | |
Year Ended October 31, 2010 | | 17.94 | %(g) | | | | 7,886 | | | 1.50 | % | | 0.24 | % | | 2.00 | % | | 50.21 | % | |
|
|
|
|
|
|
|
|
|
|
|
|
|
|
|
|
|
|
|
|
|
|
CLASS B SHARES | | | | | | | | | | | | | | | | | | | | | |
Year Ended October 31, 2006 | | 18.25 | % | | | $ | 2,998 | | | 2.25 | % | | (0.70 | )% | | 4.33 | % | | 48.46 | % | |
Year Ended October 31, 2007 | | 22.75 | % | | | | 4,942 | | | 2.25 | % | | (0.77 | )% | | 3.02 | % | | 45.50 | % | |
Year Ended October 31, 2008 | | (41.36 | )%(d) | | | | 3,166 | | | 2.25 | % | | (0.62 | )% | | 2.73 | % | | 72.33 | % | |
Year Ended October 31, 2009 | | 17.52 | %(f) | | | | 3,767 | | | 2.25 | % | | (0.66 | )% | | 2.91 | % | | 53.42 | % | |
Year Ended October 31, 2010 | | 17.04 | %(g) | | | | 5,519 | | | 2.25 | % | | (0.51 | )% | | 2.75 | % | | 50.21 | % | |
|
|
|
|
|
|
|
|
|
|
|
|
|
|
|
|
|
|
|
|
|
|
CLASS C SHARES | | | | | | | | | | | | | | | | | | | | | |
Year Ended October 31, 2006 | | 18.19 | % | | | $ | 229 | | | 2.25 | % | | (0.69 | )% | | 4.20 | % | | 48.46 | % | |
Year Ended October 31, 2007 | | 22.97 | % | | | | 528 | | | 2.25 | % | | (0.79 | )% | | 2.99 | % | | 45.50 | % | |
Year Ended October 31, 2008 | | (41.32 | )%(d) | | | | 319 | | | 2.25 | % | | (0.64 | )% | | 2.73 | % | | 72.33 | % | |
Year Ended October 31, 2009 | | 17.40 | %(f) | | | | 289 | | | 2.25 | % | | (0.59 | )% | | 2.93 | % | | 53.42 | % | |
Year Ended October 31, 2010 | | 17.06 | %(g) | | | | 698 | | | 2.25 | % | | (0.47 | )% | | 2.76 | % | | 50.21 | % | |
|
|
|
|
|
|
|
|
|
|
|
|
|
|
|
|
|
|
|
|
|
|
| |
* | Calculated based on average shares outstanding. |
| |
(a) | The per share amounts and percentages reflect income and expenses assuming inclusion of the Fund’s proportionate share of the income and expenses of the applicable HSBC Investor Portfolios. The Fund does not include expenses of the affiliated and unaffiliated investment companies in which the Fund invests. |
| |
(b) | Excludes fee reductions. If such fee reductions had not occurred, the ratio would have been as indicated. |
| |
(c) | Portfolio turnover rate is calculated by aggregating the results of multiplying the Fund’s investment percentage in the respective Portfolios, affiliated and unaffiliated investments companies by their corresponding portfolio turnover rates. Portfolio turnover rate is calculated on the basis of the Fund as a whole without distinguishing between classes of shares issued. |
| |
(d) | During the year ended October 31, 2008, certain HSBC Investor Portfolios in which the Fund invests received monies related to certain nonrecurring litigation settlements. The corresponding impact to the total return was 0.11%, 0.11% and 0.11% for Class A Shares, Class B Shares and Class C Shares, respectively. |
| |
(e) | Rounds to less than $0.01 or $(0.01). |
| |
(f) | During the year ended October 31, 2009, certain HSBC Investor Portfolios in which the Fund invests received monies related to certain nonrecurring litigation settlements. The corresponding impact to the total return was 0.11%, 0.11% and 0.11% for Class A Shares, Class B Shares and Class C Shares, respectively. |
| |
(g) | During the year ended October 31, 2010, certain HSBC Investor Portfolios in which the Fund invests received monies related to certain nonrecurring litigation settlements. The corresponding impact to the total return was 0.09%, 0.09% and 0.09% for Class A Shares, Class B Shares and Class C Shares, respectively. |
| | |
23 | HSBC INVESTOR WORLD SELECTION FUNDS | See notes to financial statements |
|
BALANCED STRATEGY FUND |
|
Financial Highlights |
Selected data for a share outstanding throughout the periods indicated. (a)
| | | | | | | | | | | | | | | | | | | | | | | | | | | | | |
| | | | Investment Activities | | Dividends | | | |
| | | |
| |
| | | |
| | Net Asset
Value,
Beginning
of Period | | Net
Investment
Income
(Loss) | | Net Realized
and Unrealized
Gains
(Losses) from
Investment
Transactions | | Total from
Investment
Activities | | Net
Investment
Income | | Net Realized
Gains
from
Investment
Transactions | | Total
Dividends | | Net Asset
Value, End
of Period | |
|
|
|
|
|
|
|
|
|
|
|
|
|
|
|
|
|
|
CLASS A SHARES | | | | | | | | | | | | | | | | | | | | | | | | | |
Year Ended October 31, 2006 | | | $ | 10.72 | | | 0.07 | | | 1.69 | | | 1.76 | | | — | | | (0.03 | ) | | (0.03 | ) | | | $ | 12.45 | | |
Year Ended October 31, 2007 | | | | 12.45 | | | 0.11 | * | | 2.34 | | | 2.45 | | | (0.08 | ) | | (0.09 | ) | | (0.17 | ) | | | | 14.73 | | |
Year Ended October 31, 2008 | | | | 14.73 | | | 0.12 | * | | (5.21 | ) | | (5.09 | ) | | (0.09 | ) | | (0.74 | ) | | (0.83 | ) | | | | 8.81 | | |
Year Ended October 31, 2009 | | | | 8.81 | | | 0.07 | * | | 1.55 | | | 1.62 | | | (0.09 | ) | | — | | | (0.09 | ) | | | | 10.34 | | |
Year Ended October 31, 2010 | | | | 10.34 | | | 0.19 | * | | 1.64 | | | 1.83 | | | (0.08 | ) | | — | | | (0.08 | ) | | | | 12.09 | | |
|
|
|
|
|
|
|
|
|
|
|
|
|
|
|
|
|
|
|
|
|
|
|
|
|
|
|
|
|
|
CLASS B SHARES | | | | | | | | | | | | | | | | | | | | | | | | | | | | | |
Year Ended October 31, 2006 | | | $ | 10.78 | | | 0.02 | | | 1.66 | | | 1.68 | | | — | | | (0.03 | ) | | (0.03 | ) | | | $ | 12.43 | | |
Year Ended October 31, 2007 | | | | 12.43 | | | 0.01 | * | | 2.34 | | | 2.35 | | | (0.02 | ) | | (0.09 | ) | | (0.11 | ) | | | | 14.67 | | |
Year Ended October 31, 2008 | | | | 14.67 | | | 0.03 | * | | (5.20 | ) | | (5.17 | ) | | — | (g) | | (0.74 | ) | | (0.74 | ) | | | | 8.76 | | |
Year Ended October 31, 2009 | | | | 8.76 | | | 0.01 | * | | 1.55 | | | 1.56 | | | (0.01 | ) | | — | | | (0.01 | ) | | | | 10.31 | | |
Year Ended October 31, 2010 | | | | 10.31 | | | 0.11 | * | | 1.64 | | | 1.75 | | | (0.01 | ) | | — | | | (0.01 | ) | | | | 12.05 | | |
|
|
|
|
|
|
|
|
|
|
|
|
|
|
|
|
|
|
|
|
|
|
|
|
|
|
|
|
|
|
CLASS C SHARES | | | | | | | | | | | | | | | | | | | | | | | | | | | | | |
Year Ended October 31, 2006 | | | $ | 10.82 | | | 0.02 | | | 1.67 | | | 1.69 | | | — | | | (0.03 | ) | | (0.03 | ) | | | $ | 12.48 | | |
Year Ended October 31, 2007 | | | | 12.48 | | | 0.01 | * | | 2.35 | | | 2.36 | | | (0.01 | ) | | (0.09 | ) | | (0.10 | ) | | | | 14.74 | | |
Year Ended October 31, 2008 | | | | 14.74 | | | 0.03 | * | | (5.22 | ) | | (5.19 | ) | | (0.01 | ) | | (0.74 | ) | | (0.75 | ) | | | | 8.80 | | |
Year Ended October 31, 2009 | | | | 8.80 | | | 0.01 | * | | 1.55 | | | 1.56 | | | (0.01 | ) | | — | | | (0.01 | ) | | | | 10.35 | | |
Year Ended October 31, 2010 | | | | 10.35 | | | 0.12 | * | | 1.63 | | | 1.75 | | | (0.01 | ) | | — | | | (0.01 | ) | | | | 12.09 | | |
|
|
|
|
|
|
|
|
|
|
|
|
|
|
|
|
|
|
|
|
|
|
|
|
|
|
|
|
|
|
| | | | | | | | | | | | | | | | | | | | | |
| | | | Ratios/Supplementary Data | |
| | | |
|
|
| | Total
Return | | Net Assets
at End of
Period
(000’s) | | Ratio of Net
Expenses to
Average Net
Assets | | Ratio of Net
Investment
Income to
Average
Net Assets | | Ratio of
Expenses to
Average Net
Assets(b) | | Portfolio
Turnover(c) | |
|
|
|
|
|
|
|
|
|
|
|
|
|
|
|
|
|
|
|
|
CLASS A SHARES | | | | | | | | | | | | | | | | | | | |
Year Ended October 31, 2006 | | 16.41 | % | | | $ | 12,562 | | | 1.50 | % | | 0.87 | % | | 2.19 | % | | 80.30 | % | |
Year Ended October 31, 2007 | | 19.92 | %(d) | | | | 21,352 | | | 1.50 | % | | 0.84 | % | | 1.65 | % | | 73.45 | % | |
Year Ended October 31, 2008 | | (36.43 | )%(e) | | | | 13,908 | | | 1.50 | % | | 0.98 | % | | 1.53 | % | | 78.59 | % | |
Year Ended October 31, 2009 | | 18.66 | %(f) | | | | 15,304 | | | 1.50 | % | | 0.84 | % | | 1.57 | % | | 47.74 | % | |
Year Ended October 31, 2010 | | 17.79 | %(h) | | | | 21,642 | | | 1.25 | % | | 1.72 | % | | 1.30 | % | | 52.81 | % | |
|
|
|
|
|
|
|
|
|
|
|
|
|
|
|
|
|
|
|
|
|
|
CLASS B SHARES | | | | | | | | | | | | | | | | | | | | | |
Year Ended October 31, 2006 | | 15.57 | % | | | $ | 8,702 | | | 2.25 | % | | 0.11 | % | | 2.94 | % | | 80.30 | % | |
Year Ended October 31, 2007 | | 18.98 | %(d) | | | | 13,905 | | | 2.25 | % | | 0.09 | % | | 2.40 | % | | 73.45 | % | |
Year Ended October 31, 2008 | | (36.95 | )%(e) | | | | 9,516 | | | 2.25 | % | | 0.24 | % | | 2.28 | % | | 78.59 | % | |
Year Ended October 31, 2009 | | 17.80 | %(f) | | | | 11,196 | | | 2.25 | % | | 0.07 | % | | 2.31 | % | | 47.74 | % | |
Year Ended October 31, 2010 | | 17.01 | %(h) | | | | 15,593 | | | 2.00 | % | | 0.97 | % | | 2.05 | % | | 52.81 | % | |
|
|
|
|
|
|
|
|
|
|
|
|
|
|
|
|
|
|
|
|
|
|
CLASS C SHARES | | | | | | | | | | | | | | | | | | | | | |
Year Ended October 31, 2006 | | 15.61 | % | | | $ | 585 | | | 2.25 | % | | 0.14 | % | | 2.90 | % | | 80.30 | % | |
Year Ended October 31, 2007 | | 19.04 | %(d) | | | | 1,273 | | | 2.25 | % | | 0.07 | % | | 2.39 | % | | 73.45 | % | |
Year Ended October 31, 2008 | | (36.94 | )%(e) | | | | 937 | | | 2.25 | % | | 0.25 | % | | 2.29 | % | | 78.59 | % | |
Year Ended October 31, 2009 | | 17.81 | %(f) | | | | 1,507 | | | 2.25 | % | | 0.06 | % | | 2.30 | % | | 47.74 | % | |
Year Ended October 31, 2010 | | 16.96 | %(h) | | | | 3,497 | | | 2.01 | % | | 1.04 | % | | 2.06 | % | | 52.81 | % | |
|
|
|
|
|
|
|
|
|
|
|
|
|
|
|
|
|
|
|
|
|
|
| |
* | Calculated based on average shares outstanding. |
| |
(a) | The per share amounts and percentages reflect income and expenses assuming inclusion of the Fund’s proportionate share of the income and expenses of the applicable HSBC Investor Portfolios. The Fund does not include expenses of the affiliated and unaffiliated investment companies in which the Fund invests. |
| |
(b) | Excludes fee reductions. If such fee reductions had not occurred, the ratio would have been as indicated. |
| |
(c) | Portfolio turnover rate is calculated by aggregating the results of multiplying the Fund’s investment percentage in the respective Portfolios, affiliated and unaffiliated investments companies by their corresponding portfolio turnover rates. Portfolio turnover rate is calculated on the basis of the Fund as a whole without distinguishing between classes of shares issued. |
| |
(d) | During the year ended October 31, 2007, certain HSBC Investor Portfolios in which the Fund invests received monies related to certain nonrecurring litigation settlements. The corresponding impact to the total return was 0.23%, 0.24% and 0.23% for Class A Shares, Class B Shares and Class C Shares, respectively. |
| |
(e) | During the year ended October 31, 2008, certain HSBC Investor Portfolios in which the Fund invests received monies related to certain nonrecurring litigation settlements. The corresponding impact to the total return was 0.15%, 0.15% and 0.15% for Class A Shares, Class B Shares and Class C Shares, respectively. |
| |
(f) | During the year ended October 31, 2009, certain HSBC Investor Portfolios in which the Fund invests received monies related to certain nonrecurring litigation settlements. The corresponding impact to the total return was 0.11%, 0.11% and 0.11% for Class A Shares, Class B Shares and Class C Shares, respectively. |
| |
(g) | Rounds to less than $0.01 or $(0.01). |
| |
(h) | During the year ended October 31, 2010, certain HSBC Investor Portfolios in which the Fund invests received monies related to certain nonrecurring litigation settlements. The corresponding impact to the total return was 0.07%, 0.07% and 0.07% for Class A Shares, Class B Shares and Class C Shares, respectively. |
| | |
See notes to financial statements | HSBC INVESTOR WORLD SELECTION FUNDS | 24 |
|
MODERATE STRATEGY FUND |
|
Financial Highlights |
Selected data for a share outstanding throughout the periods indicated. (a)
| | | | | | | | | | | | | | | | | | | | | | | | | | | | | |
| | | | | Investment Activities | | Dividends | | | | |
| | | | |
| |
| | | | |
| | Net Asset
Value,
Beginning
of Period | | Net
Investment
Income
(Loss) | | Net Realized
and Unrealized
Gains
(Losses) from
Investment
Transactions | | Total from
Investment
Activities | | Net
Investment
Income | | Net
Realized
Gains from
Investment
Transactions | | Total
Dividends | | Net Asset
Value, End
of Period | |
|
|
|
|
|
|
|
|
|
|
|
|
|
|
|
|
|
|
CLASS A SHARES | | | | | | | | | | | | | | | | | | | | | | | | | | | | | |
Year Ended October 31, 2006 | | | $ | 10.49 | | | 0.17 | | | 1.23 | | | 1.40 | | | (0.17 | ) | | (0.01 | ) | | (0.18 | ) | | | $ | 11.71 | | |
Year Ended October 31, 2007 | | | | 11.71 | | | 0.21 | * | | 1.65 | | | 1.86 | | | (0.20 | ) | | (0.10 | ) | | (0.30 | ) | | | | 13.27 | | |
Year Ended October 31, 2008 | | | | 13.27 | | | 0.20 | * | | (4.08 | ) | | (3.88 | ) | | (0.19 | ) | | (0.50 | ) | | (0.70 | ) | | | | 8.69 | | |
Year Ended October 31, 2009 | | | | 8.69 | | | 0.13 | * | | 1.39 | | | 1.52 | | | (0.12 | ) | | — | | | (0.12 | ) | | | | 10.09 | | |
Year Ended October 31, 2010 | | | | 10.09 | | | 0.25 | * | | 1.38 | | | 1.63 | | | (0.24 | ) | | — | | | (0.24 | ) | | | | 11.48 | | |
|
|
|
|
|
|
|
|
|
|
|
|
|
|
|
|
|
|
|
|
|
|
|
|
|
|
|
|
|
|
CLASS B SHARES | | | | | | | | | | | | | | | | | | | | | | | | | | | | | |
Year Ended October 31, 2006 | | | $ | 10.50 | | | 0.09 | | | 1.22 | | | 1.31 | | | (0.08 | ) | | (0.01 | ) | | (0.09 | ) | | | $ | 11.72 | | |
Year Ended October 31, 2007 | | | | 11.72 | | | 0.12 | * | | 1.65 | | | 1.77 | | | (0.12 | ) | | (0.10 | ) | | (0.22 | ) | | | | 13.27 | | |
Year Ended October 31, 2008 | | | | 13.27 | | | 0.11 | * | | (4.08 | ) | | (3.97 | ) | | (0.10 | ) | | (0.50 | ) | | (0.61 | ) | | | | 8.69 | | |
Year Ended October 31, 2009 | | | | 8.69 | | | 0.06 | * | | 1.39 | | | 1.45 | | | (0.06 | ) | | — | | | (0.06 | ) | | | | 10.08 | | |
Year Ended October 31, 2010 | | | | 10.08 | | | 0.17 | * | | 1.38 | | | 1.55 | | | (0.17 | ) | | — | | | (0.17 | ) | | | | 11.46 | | |
|
|
|
|
|
|
|
|
|
|
|
|
|
|
|
|
|
|
|
|
|
|
|
|
|
|
|
|
|
|
CLASS C SHARES | | | | | | | | | | | | | | | | | | | | | | | | | | | | | |
Year Ended October 31, 2006 | | | $ | 10.28 | | | 0.09 | | | 1.19 | | | 1.28 | | | (0.08 | ) | | (0.01 | ) | | (0.09 | ) | | | $ | 11.47 | | |
Year Ended October 31, 2007 | | | | 11.47 | | | 0.12 | * | | 1.60 | | | 1.72 | | | (0.12 | ) | | (0.10 | ) | | (0.22 | ) | | | | 12.97 | | |
Year Ended October 31, 2008 | | | | 12.97 | | | 0.11 | * | | (3.97 | ) | | (3.86 | ) | | 0.11 | | | (0.50 | ) | | (0.62 | ) | | | | 8.49 | | |
Year Ended October 31, 2009 | | | | 8.49 | | | 0.06 | * | | 1.35 | | | 1.41 | | | (0.06 | ) | | — | | | (0.06 | ) | | | | 9.84 | | |
Year Ended October 31, 2010 | | | | 9.84 | | | 0.17 | * | | 1.35 | | | 1.52 | | | (0.18 | ) | | — | | | (0.18 | ) | | | | 11.18 | | |
|
|
|
|
|
|
|
|
|
|
|
|
|
|
|
|
|
|
|
|
|
|
|
|
|
|
|
|
|
|
| | | | | | | | | | | | | | | | | | | | | |
| | | | | Ratios/Supplementary Data | |
| | | | |
|
|
| | Total
Return | | Net Assets
at End of
Period
(000’s) | | Ratio of Net
Expenses to
Average Net
Assets | | Ratio of Net
Investment
Income to
Average
Net Assets | | Ratio of
Expenses to
Average Net
Assets(b) | | Portfolio
Turnover(c) | |
|
|
|
|
|
|
|
|
|
|
|
|
|
|
CLASS A SHARES | | | | | | | | | | | | | | | | | | | | | |
Year Ended October 31, 2006 | | 13.40 | % | | | $ | 11,973 | | | 1.50 | % | | 1.65 | % | | 2.12 | % | | 101.57 | % | |
Year Ended October 31, 2007 | | 16.12 | %(d) | | | | 20,140 | | | 1.50 | % | | 1.70 | % | | 1.60 | % | | 92.87 | % | |
Year Ended October 31, 2008 | | (30.65 | )%(e) | | | | 14,226 | | | 1.48 | % | | 1.75 | % | | 1.48 | % | | 79.86 | % | |
Year Ended October 31, 2009 | | 17.75 | %(f) | | | | 15,909 | | | 1.44 | % | | 1.47 | % | | 1.49 | % | | 41.29 | % | |
Year Ended October 31, 2010 | | 16.39 | %(g) | | | | 18,921 | | | 1.14 | % | | 2.33 | % | | 1.19 | % | | 66.98 | % | |
|
|
|
|
|
|
|
|
|
|
|
|
|
|
|
|
|
|
|
|
|
|
CLASS B SHARES | | | | | | | | | | | | | | | | | | | | | |
Year Ended October 31, 2006 | | 12.45 | % | | | $ | 10,731 | | | 2.25 | % | | 0.91 | % | | 2.87 | % | | 101.57 | % | |
Year Ended October 31, 2007 | | 15.25 | %(d) | | | | 16,513 | | | 2.25 | % | | 0.95 | % | | 2.35 | % | | 92.87 | % | |
Year Ended October 31, 2008 | | (31.17 | )%(e) | | | | 12,354 | | | 2.23 | % | | 1.00 | % | | 2.23 | % | | 79.86 | % | |
Year Ended October 31, 2009 | | 16.82 | %(f) | | | | 14,230 | | | 2.19 | % | | 0.71 | % | | 2.24 | % | | 41.29 | % | |
Year Ended October 31, 2010 | | 15.61 | %(g) | | | | 18,362 | | | 1.89 | % | | 1.59 | % | | 1.94 | % | | 66.98 | % | |
|
|
|
|
|
|
|
|
|
|
|
|
|
|
|
|
|
|
|
|
|
|
CLASS C SHARES | | | | | | | | | | | | | | | | | | | | | |
Year Ended October 31, 2006 | | 12.53 | % | | | $ | 763 | | | 2.25 | % | | 0.87 | % | | 2.83 | % | | 101.57 | % | |
Year Ended October 31, 2007 | | 15.20 | %(d) | | | | 1,766 | | | 2.25 | % | | 0.95 | % | | 2.33 | % | | 92.87 | % | |
Year Ended October 31, 2008 | | (31.09 | )%(e) | | | | 1,408 | | | 2.23 | % | | 1.00 | % | | 2.23 | % | | 79.86 | % | |
Year Ended October 31, 2009 | | 16.75 | %(f) | | | | 1,488 | | | 2.19 | % | | 0.72 | % | | 2.24 | % | | 41.29 | % | |
Year Ended October 31, 2010 | | 15.55 | %(g) | | | | 2,544 | | | 1.90 | % | | 1.59 | % | | 1.95 | % | | 66.98 | % | |
|
|
|
|
|
|
|
|
|
|
|
|
|
|
|
|
|
|
|
|
|
|
| |
* | Calculated based on average shares outstanding. |
| |
(a) | The per share amounts and percentages reflect income and expenses assuming inclusion of the Fund’s proportionate share of the income and expenses of the applicable HSBC Investor Portfolios. The Fund does not include expenses of the affiliated and unaffiliated investment companies in which the Fund invests. |
| |
(b) | Excludes fee reductions. If such fee reductions had not occurred, the ratio would have been as indicated. |
| |
(c) | Portfolio turnover rate is calculated by aggregating the results of multiplying the Fund’s investment percentage in the respective Portfolios, affiliated and unaffiliated investment companies by their corresponding portfolio turnover rates. Portfolio turnover rate is calculated on the basis of the Fund as a whole without distinguishing between classes of shares issued. |
| |
(d) | During the year ended October 31, 2007, certain HSBC Investor Portfolios in which the Fund invests received monies related to certain nonrecurring litigation settlements. The corresponding impact to the total return was 0.41%, 0.41% and 0.33% for Class A Shares, Class B Shares and Class C Shares, respectively. |
| |
(e) | During the year ended October 31, 2008, certain HSBC Investor Portfolios in which the Fund invests received monies related to certain nonrecurring litigation settlements. The corresponding impact to the total return was 0.19%, 0.19% and 0.19% for Class A Shares, Class B Shares and Class C Shares, respectively. |
| |
(f) | During the year ended October 31, 2009, certain HSBC Investor Portfolios in which the Fund invests received monies related to certain nonrecurring litigation settlements. The corresponding impact to the total return was 0.09%, 0.09% and 0.09% for Class A Shares, Class B Shares and Class C Shares, respectively. |
| |
(g) | During the year ended October 31, 2010, certain HSBC Investor Portfolios in which the Fund invests received monies related to certain nonrecurring litigation settlements. The corresponding impact to the total return was 0.06%, 0.06% and 0.06% for Class A Shares, Class B Shares and Class C Shares, respectively. |
| | |
25 | HSBC INVESTOR WORLD SELECTION FUNDS | See notes to financial statements |
|
CONSERVATIVE STRATEGY FUND |
|
Financial Highlights |
Selected data for a share outstanding throughout the periods indicated. (a)
| | | | | | | | | | | | | | | | | | | | | | | | | | | | | |
| | | | | | | Investment Activities | | Dividends | | | | | | |
| | | | | | |
| |
| | | | | | |
| | Net Asset
Value,
Beginning
of Period | | Net
Investment
Income
(Loss) | | Net Realized
and Unrealized
Gains
(Losses) from
Investment
Transactions | | Total from
Investment
Activities | | Net
Investment
Income | | Net
Realized
Gains from
Investment
Transactions | | Total
Dividends | | Net Asset
Value, End
of Period | |
|
|
|
|
|
|
|
|
|
|
|
|
|
|
|
|
|
|
CLASS A SHARES | | | | | | | | | | | | | | | | | | | | | | | | | | | | | |
Year Ended October 31, 2006 | | | $ | 10.29 | | | 0.22 | | | 0.85 | | | 1.07 | | | (0.25 | ) | | — | | | (0.25 | ) | | | $ | 11.11 | | |
Year Ended October 31, 2007 | | | | 11.11 | | | 0.29 | * | | 1.03 | | | 1.32 | | | (0.27 | ) | | (0.12 | ) | | (0.39 | ) | | | | 12.04 | | |
Year Ended October 31, 2008 | | | | 12.04 | | | 0.24 | * | | (2.93 | ) | | (2.69 | ) | | (0.25 | ) | | (0.26 | ) | | (0.51 | ) | | | | 8.84 | | |
Year Ended October 31, 2009 | | | | 8.84 | | | 0.14 | * | | 1.16 | | | 1.30 | | | (0.13 | ) | | — | | | (0.13 | ) | | | | 10.01 | | |
Year Ended October 31, 2010 | | | | 10.01 | | | 0.26 | * | | 1.11 | | | 1.37 | | | (0.23 | ) | | — | | | (0.23 | ) | | | | 11.15 | | |
|
|
|
|
|
|
|
|
|
|
|
|
|
|
|
|
|
|
|
|
|
|
|
|
|
|
|
|
|
|
CLASS B SHARES | | | | | | | | | | | | | | | | | | | | | | | | | | | | | |
Year Ended October 31, 2006 | | | $ | 10.19 | | | 0.15 | | | 0.83 | | | 0.98 | | | (0.16 | ) | | — | | | (0.16 | ) | | | $ | 11.01 | | |
Year Ended October 31, 2007 | | | | 11.01 | | | 0.20 | * | | 1.05 | | | 1.25 | | | (0.20 | ) | | (0.12 | ) | | (0.32 | ) | | | | 11.94 | | |
Year Ended October 31, 2008 | | | | 11.94 | | | 0.16 | * | | (2.91 | ) | | (2.75 | ) | | (0.17 | ) | | (0.26 | ) | | (0.43 | ) | | | | 8.76 | | |
Year Ended October 31, 2009 | | | | 8.76 | | | 0.07 | * | | 1.15 | | | 1.22 | | | (0.07 | ) | | — | | | (0.07 | ) | | | | 9.91 | | |
Year Ended October 31, 2010 | | | | 9.91 | | | 0.17 | * | | 1.10 | | | 1.27 | | | (0.16 | ) | | — | | | (0.16 | ) | | | | 11.02 | | |
|
|
|
|
|
|
|
|
|
|
|
|
|
|
|
|
|
|
|
|
|
|
|
|
|
|
|
|
|
|
CLASS C SHARES | | | | | | | | | | | | | | | | | | | | | | | | | | | | | |
Year Ended October 31, 2006 | | | $ | 10.41 | | | 0.15 | | | 0.85 | | | 1.00 | | | (0.17 | ) | | — | | | (0.17 | ) | | | $ | 11.24 | | |
Year Ended October 31, 2007 | | | | 11.24 | | | 0.21 | * | | 1.11 | | | 1.32 | | | (0.19 | ) | | (0.12 | ) | | (0.31 | ) | | | | 12.25 | | |
Year Ended October 31, 2008 | | | | 12.25 | | | 0.16 | * | | (2.98 | ) | | (2.82 | ) | | (0.17 | ) | | (0.26 | ) | | (0.43 | ) | | | | 9.00 | | |
Year Ended October 31, 2009 | | | | 9.00 | | | 0.07 | * | | 1.18 | | | 1.25 | | | (0.07 | ) | | — | | | (0.07 | ) | | | | 10.18 | | |
Year Ended October 31, 2010 | | | | 10.18 | | | 0.18 | * | | 1.14 | | | 1.32 | | | (0.17 | ) | | — | | | (0.17 | ) | | | | 11.33 | | |
|
|
|
|
|
|
|
|
|
|
|
|
|
|
|
|
|
|
|
|
|
|
|
|
|
|
|
|
|
|
| | | | | | | | | | | | | | | | | | | | | |
| | | | | Ratios/Supplementary Data | |
| | | | |
|
|
| | Total
Return | | Net Assets
at End of
Period
(000’s) | | Ratio of Net
Expenses to
Average Net
Assets | | Ratio of Net
Investment
Income to
Average
Net Assets | | Ratio of
Expenses to
Average Net
Assets(b) | | Portfolio
Turnover(c) | |
|
|
|
|
|
|
|
|
|
|
|
|
|
|
CLASS A SHARES | | | | | | | | | | | | | | | | | | | | | |
Year Ended October 31, 2006 | | 10.48 | % | | | $ | 3,069 | | | 1.50 | % | | 2.33 | % | | 3.22 | % | | 96.58 | % | |
Year Ended October 31, 2007 | | 12.13 | %(d) | | | | 6,669 | | | 1.50 | % | | 2.52 | % | | 2.06 | % | | 88.67 | % | |
Year Ended October 31, 2008 | | (23.17 | )%(e) | | | | 4,747 | | | 1.50 | % | | 2.24 | % | | 1.72 | % | | 68.74 | % | |
Year Ended October 31, 2009 | | 14.95 | %(f) | | | | 5,059 | | | 1.50 | % | | 1.53 | % | | 1.62 | % | | 34.40 | % | |
Year Ended October 31, 2010 | | 13.86 | %(g) | | | | 7,139 | | | 1.38 | % | | 2.42 | % | | 1.43 | % | | 78.48 | % | |
|
|
|
|
|
|
|
|
|
|
|
|
|
|
|
|
|
|
|
|
|
|
CLASS B SHARES | | | | | | | | | | | | | | | | | | | | | |
Year Ended October 31, 2006 | | 9.65 | % | | | $ | 2,567 | | | 2.25 | % | | 1.54 | % | | 3.98 | % | | 96.58 | % | |
Year Ended October 31, 2007 | | 11.51 | %(d) | | | | 4,928 | | | 2.25 | % | | 1.77 | % | | 2.82 | % | | 88.67 | % | |
Year Ended October 31, 2008 | | (23.76 | )%(e) | | | | 4,348 | | | 2.25 | % | | 1.48 | % | | 2.48 | % | | 68.74 | % | |
Year Ended October 31, 2009 | | 14.05 | %(f) | | | | 4,907 | | | 2.25 | % | | 0.77 | % | | 2.38 | % | | 34.40 | % | |
Year Ended October 31, 2010 | | 12.94 | %(g) | | | | 7,411 | | | 2.14 | % | | 1.68 | % | | 2.19 | % | | 78.48 | % | |
|
|
|
|
|
|
|
|
|
|
|
|
|
|
|
|
|
|
|
|
|
|
CLASS C SHARES | | | | | | | | | | | | | | | | | | | | | |
Year Ended October 31, 2006 | | 9.66 | % | | | $ | 320 | | | 2.25 | % | | 1.56 | % | | 3.92 | % | | 96.58 | % | |
Year Ended October 31, 2007 | | 11.97 | %(d) | | | | 437 | | | 2.25 | % | | 1.78 | % | | 2.85 | % | | 88.67 | % | |
Year Ended October 31, 2008 | | (23.73 | )%(e) | | | | 430 | | | 2.25 | % | | 1.46 | % | | 2.48 | % | | 68.74 | % | |
Year Ended October 31, 2009 | | 13.97 | %(f) | | | | 485 | | | 2.25 | % | | 0.78 | % | | 2.37 | % | | 34.40 | % | |
Year Ended October 31, 2010 | | 13.07 | %(g) | | | | 1,323 | | | 2.16 | % | | 1.71 | % | | 2.21 | % | | 78.48 | % | |
|
|
|
|
|
|
|
|
|
|
|
|
|
|
|
|
|
|
|
|
|
|
| |
* | Calculated based on average shares outstanding. |
| |
(a) | The per share amounts and percentages reflect income and expenses assuming inclusion of the Fund’s proportionate share of the income and expenses of the applicable HSBC Investor Portfolios. The Fund does not include expenses of the affiliated and unaffiliated investment companies in which the Fund invests. |
| |
(b) | Excludes fee reductions. If such fee reductions had not occurred, the ratio would have been as indicated. |
| |
(c) | Portfolio turnover rate is calculated by aggregating the results of multiplying the Fund’s investment percentage in the respective Portfolios affiliated and unaffiliated investment companies by their corresponding portfolio turnover rates. Portfolio turnover rate is calculated on the basis of the Fund as a whole without distinguishing between classes of shares issued. |
| |
(d) | During the year ended October 31, 2007, certain HSBC Investor Portfolios in which the Fund invests received monies related to certain nonrecurring litigation settlements. The corresponding impact to the total return was 0.44%, 0.47% and 0.48% for Class A Shares, Class B Shares and Class C Shares, respectively. |
| |
(e) | During the year ended October 31, 2008, certain HSBC Investor Portfolios in which the Fund invests received monies related to certain nonrecurring litigation settlements. The corresponding impact to the total return was 0.19%, 0.19% and 0.19% for Class A Shares, Class B Shares and Class C Shares, respectively. |
| |
(f) | During the year ended October 31, 2009, certain HSBC Investor Portfolios in which the Fund invests received monies related to certain nonrecurring litigation settlements. The corresponding impact to the total return was 0.08%, 0.08% and 0.08% for Class A Shares, Class B Shares and Class C Shares, respectively. |
| |
(g) | During the year ended October 31, 2010, certain HSBC Investor Portfolios in which the Fund invests received monies related to certain nonrecurring litigation settlements. The corresponding impact to the total return was 0.05%, 0.05% and 0.05% for Class A Shares, Class B Shares and Class C Shares, respectively. |
| | |
See notes to financial statements | HSBC INVESTOR WORLD SELECTION FUNDS | 26 |
|
HSBC INVESTOR WORLD SELECTION FUNDS |
|
Notes to Financial Statements—as of October 31, 2010 |
| |
1. | Organization: |
| |
| The HSBC Investor Funds (the “Trust’’), a Massachusetts business trust organized on April 22, 1987, is registered under the Investment Company Act of 1940, as amended (the “Act’’), as an open-end management investment company. As of October 31, 2010, the Trust is comprised of 15 separate operational funds, each a series of the HSBC Investor Family of Funds. The accompanying financial statements are presented for the following 4 funds (individually a “Fund’’, collectively the “World Selection Funds’’): |
| | |
| Fund | Short Name |
|
|
|
| HSBC Aggressive Strategy Fund | Aggressive Strategy Fund |
| HSBC Balanced Strategy Fund | Balanced Strategy Fund |
| HSBC Moderate Strategy Fund | Moderate Strategy Fund |
| HSBC Conservative Strategy Fund | Conservative Strategy Fund |
| |
| The World Selection Funds are diversified series of the Trust and part of the HSBC Investor Family of Funds. Financial statements for all other funds of the HSBC Investor Family of Funds are published separately. |
| |
| Each of the World Selection Funds is a “fund of funds,” meaning that it seeks to achieve its investment objective by investing primarily in a combination of mutual funds managed by HSBC Global Asset Management (USA) Inc. (“HSBC” or the “Investment Adviser”) (the “Affiliated Underlying Funds”), as well as mutual funds managed by other investment advisers and exchange-traded funds (“Unaffiliated Underlying Funds” and, together with the Affiliated Underlying Funds, the “Underlying Funds”). Each Fund may also purchase and hold exchange-traded notes (“ETNs”). The Underlying Funds may include private equity funds and real estate funds that are organized as mutual funds or Exchange Traded Funds (“ETFs”). Each World Selection Fund invests according to the investment objectives and strategies described in its Prospectus. |
|
The World Selection Funds currently invest in the HSBC Investor Growth Portfolio, HSBC Investor International Equity Portfolio, HSBC Investor Opportunity Portfolio and the HSBC Investor Value Portfolio (individually a “Portfolio,” collectively the “Portfolios”), each of which is a diversified series of the HSBC Investor Portfolios (the “Portfolio Trust”). The Portfolios operate as master funds in master-feeder arrangements in addition to receiving investments from the World Selection Funds.
|
| |
| The financial statements of the Portfolios, including the Schedules of Portfolio Investments, are included elsewhere in this report. The financial statements of the Portfolios should be read in conjunction with the financial statements of the World Selection Funds. |
| |
| The World Selection Funds are authorized to issue an unlimited number of shares of beneficial interest with a par value of $0.001 per share. Each Fund offers three classes of shares: Class A Shares, Class B Shares and Class C Shares. Class A Shares of the World Selection Funds have a maximum sales charge of 5.00% as a percentage of the original purchase price. The Class B Shares of the World Selection Funds are offered without any front-end sales charge, but will be subject to a contingent deferred sales charge (“CDSC”) ranging from a maximum of 4.00% if redeemed less than one year after purchase to 0.00% if redeemed more than four years after purchase. Class C Shares of the World Selection Funds are offered without any front-end sales charge, but will be subject to a maximum CDSC of 1.00% if redeemed less than one year after purchase. Each class of shares in the World Selection Funds has identical rights and privileges except with respect to arrangements pertaining to shareholder servicing or distribution, class-related expenses, voting rights on matters affecting a single class of shares, and the exchange privileges of each class of shares. |
| |
| Under the Trust’s organizational documents, the World Selection Funds’ Officers and Trustees are indemnified against certain liabilities arising out of the performance of their duties to the World Selection Funds. In addition, in the normal course of business, the Trust enters into contracts with its service providers, which also provide for indemnifications by the World Selection Funds. The World Selection Funds’ maximum exposure under these arrangements is unknown as this would involve any future claims that may be made against the World Selection Funds. However, based on experience, the Trust expects the risk of loss to be remote. |
| |
27 | HSBC INVESTOR WORLD SELECTION FUNDS |
|
HSBC INVESTOR WORLD SELECTION FUNDS |
|
Notes to Financial Statements—as of October 31, 2010 (continued) |
| |
2. | Significant Accounting Policies: |
| |
| |
| The following is a summary of the significant accounting policies followed by the World Selection Funds in the preparation of their financial statements. The policies are in conformity with U.S. generally accepted accounting principles (“GAAP’’). The preparation of financial statements requires management to make certain estimates and assumptions that affect the reported amounts of assets and liabilities and disclosure of contingent assets and liabilities at the date of the financial statements and the reported amounts of increases and decreases in net assets from operations during the reporting period. Actual results could differ from those estimates. Management has evaluated events and transactions through the date the financial statements were available to be issued, for purposes of recognition or disclosure in these financial statements and there are no subsequent events to report. |
| |
| Securities Valuation: |
| |
| The World Selection Funds record their investments in the Underlying Funds at the net asset value reported by those funds. The World Selection Funds record their investments in the Portfolios at fair value. The underlying securities of the Portfolios are recorded at fair value, as more fully discussed in the notes to those financial statements. Fair value is defined as the price that would be received to sell an asset or paid to transfer a liability in an orderly transaction between market participants at the measurement date. The valuation techniques used to determine fair value in funds in which the World Selection Funds are invested are described in their respective notes to financial statements. |
| |
| Investment Transactions and Related Income: |
| |
| The World Selection Funds record daily their pro-rata income, expenses and unrealized/realized gains and losses derived from their respective Portfolios. Dividend income is recorded on the ex-dividend date for the Underlying Funds. Changes in holdings of the Underlying Funds for each World Selection Fund are reflected no later than the first business day following trade date. However, for financial reporting purposes, changes in holdings of the Underlying Funds are reflected as of trade date. In addition, the World Selection Funds accrue their own expenses daily as incurred. |
| |
| Allocations: |
| |
| Expenses directly attributable to a Fund are charged to that Fund. Expenses not directly attributable to a Fund are allocated proportionately among various or all funds within the HSBC Investor Family of Funds in relation to the net assets of each fund or on another reasonable basis. Class specific expenses are charged directly to the class incurring the expense. In addition, income, expenses (other than class specific expenses), and unrealized/realized gains and losses are allocated to each class based on relative net assets on a daily basis. |
| |
| Dividends to Shareholders: |
| |
| Dividends to shareholders from net investment income, if any, are declared and distributed quarterly in the case of the Moderate Strategy Fund and Conservative Strategy Fund, and annually in the case of the Aggressive Strategy Fund and Balanced Strategy Fund. |
| |
| The World Selection Funds’ net realized gains, if any, are distributed to shareholders at least annually. Additional distributions are also made to the World Selection Funds’ shareholders to the extent necessary to avoid the federal excise tax on certain undistributed income and net capital gains of regulated investment companies. |
| |
| The amount and character of net investment income and net realized gains distributions are determined in accordance with federal income tax regulations which may differ from GAAP. These “book/tax’’ differences are either considered temporary or permanent in nature. To the extent these differences are permanent in nature (e.g., reclassification of market discounts, certain gain/loss, paydowns, and certain distributions), such amounts are reclassified within the composition of net assets; temporary differences (e.g., wash losses and post-October loss deferrals) do not require reclassification. The World Selection Funds may utilize equalization accounting for tax purposes and designate earnings and profits, including net realized gains distributed to shareholders on redemption of shares, as a part of the dividends paid deduction for income tax purposes. To the extent distributions to shareholders from net investment income and net realized gains exceed net investment income and net realized gains for tax purposes, they are reported as distributions of capital. |
| |
HSBC INVESTOR WORLD SELECTION FUNDS | 28 |
|
HSBC INVESTOR WORLD SELECTION FUNDS |
|
Notes to Financial Statements—as of October 31, 2010 (continued) |
| |
| Redemption Fee: |
| |
| Prior to February 28, 2010 a redemption fee of 2.00% was charged and recorded as paid-in-capital for any shares redeemed or exchanged after being held for less than 30 days. This fee did not apply to shares purchased through reinvested dividends or capital gains or shares held in certain omnibus accounts or retirement plans that could not implement the fee. The Trustees have approved the removal of such redemption fee effective February 28, 2010. For the fiscal years ended October 31, 2009 and October 31, 2010, respectively, the following World Selection Funds collected redemption fees as follows: |
| | | | | | | | | | | |
Fund | | Fees Collected
2009 | | Fees Collected
2010 | |
| |
| |
| |
Aggressive Strategy Fund | | $ | | 47 | | $ | | 3 | |
Balanced Strategy Fund | | | | 431 | | | | 11 | |
Moderate Strategy Fund | | | | 259 | | | | 10 | |
Conservative Strategy Fund | | | | 63 | | | | 1 | |
| | |
| Federal Income Taxes: |
| |
| Each Fund is a separate taxable entity for federal income tax purposes. Each Fund has qualified and intends to continue to qualify each year as a “regulated investment company’’ under Subchapter M of the Internal Revenue Code, as amended and to distribute substantially all of their taxable net investment income and net realized gains, if any, to their shareholders. Accordingly, no provision for federal income or excise tax is required. |
| |
| Management of the Funds has reviewed tax positions taken in tax years that remain subject to examination by all major tax jurisdictions, including federal (i.e., the last four tax year ends and the interim tax period since then, as applicable). Management believes that there is no tax liability resulting from unrecognized tax benefits related to uncertain tax positions taken. |
| |
3. | Investment Valuation Summary: |
| |
| The valuation techniques employed by the World Selection Funds maximize the use of observable inputs and minimize the use of unobservable inputs in determining fair value. The inputs used for valuing the World Selection Funds’ investments are summarized in the three broad levels listed below: |
| | |
| • Level 1: | quoted prices in active markets for identical assets |
| | |
| • Level 2: | other significant observable inputs (including quoted prices for similar securities, interest rates, prepayments speeds, credit risk, etc.) |
| | |
| • Level 3: | significant unobservable inputs (including the Fund’s own assumptions in determining the fair value of investments) |
| | |
| The inputs or methodology used for valuing investments are not necessarily an indication of the risk associated with investing in those investments. |
| |
| The World Selection Funds record their investments in the Underlying Funds at the net asset value reported by those funds and are typically categorized as Level 1 in the fair value hierarchy. The World Selection Funds record their investments in their respective Portfolios at fair value and are typically categorized as a Level 2 in the fair value hierarchy. The underlying securities of the Portfolios are recorded at fair value, respectively, as more fully discussed below. |
| |
| For the year ended October 31, 2010, there were no Level 3 investments for which significant unobservable inputs were used to determine fair value. |
| |
| The following is a summary of the valuation inputs used as of October 31, 2010 in valuing the World Selection Funds’ investments based upon the three levels defined above: |
| |
29 | HSBC INVESTOR WORLD SELECTION FUNDS |
|
HSBC INVESTOR WORLD SELECTION FUNDS |
|
Notes to Financial Statements—as of October 31, 2010 (continued) |
| | | | | | | | | | | | | |
| | LEVEL 1 | | LEVEL 2 | | LEVEL 3 | | Total | |
| |
| |
| |
| |
| |
Aggressive Strategy Fund | | | | | | | | | | | | | |
Investment Companies: | | | | | | | | | | | | | |
Affiliated Investment Companies | | $ | 955,460 | | $ | — | | $ | — | | $ | 955,460 | |
Affiliated Portfolios (a) | | | — | | | 8,354,822 | | | — | | | 8,354,822 | |
Unaffiliated Investment Companies | | | 3,728,366 | | | — | | | — | | | 3,728,366 | |
Exchange Traded Funds | | | 1,011,680 | | | — | | | — | | | 1,011,680 | |
| |
|
| |
|
| |
|
| |
|
| |
Total Investment Companies | | $ | 5,695,506 | | $ | 8,354,822 | | $ | — | | $ | 14,050,328 | |
| |
|
| |
|
| |
|
| |
|
| |
| | | | | | | | | | | | | |
Balanced Strategy Fund | | | | | | | | | | | | | |
Investment Companies: | | | | | | | | | | | | | |
Affiliated Investment Companies | | $ | 2,126,596 | | $ | — | | $ | — | | $ | 2,126,596 | |
Affiliated Portfolios (a) | | | — | | | 16,989,416 | | | — | | | 16,989,417 | |
Unaffiliated Investment Companies | | | 18,869,979 | | | — | | | — | | | 18,869,979 | |
Exchange Traded Funds | | | 2,729,257 | | | — | | | — | | | 2,729,257 | |
| |
|
| |
|
| |
|
| |
|
| |
Total Investment Companies | | $ | 23,725,832 | | $ | 16,989,416 | | $ | — | | $ | 40,715,249 | |
| |
|
| |
|
| |
|
| |
|
| |
| | | | | | | | | | | | | |
Moderate Strategy Fund | | | | | | | | | | | | | |
Investment Companies: | | | | | | | | | | | | | |
Affiliated Investment Companies | | $ | 1,570,874 | | $ | — | | $ | — | | $ | 1,570,874 | |
Affiliated Portfolios (a) | | | — | | | 11,899,824 | | | — | | | 11,899,824 | |
Unaffiliated Investment Companies | | | 24,329,027 | | | — | | | — | | | 24,329,027 | |
Exchange Traded Funds | | | 1,978,617 | | | — | | | — | | | 1,978,617 | |
| |
|
| |
|
| |
|
| |
|
| |
Total Investment Companies | | $ | 27,878,518 | | $ | 11,899,824 | | $ | — | | $ | 39,778,342 | |
| |
|
| |
|
| |
|
| |
|
| |
| | | | | | | | | | | | | |
Conservative Strategy Fund | | | | | | | | | | | | | |
Investment Companies: | | | | | | | | | | | | | |
Affiliated Investment Companies | | $ | 490,788 | | $ | — | | $ | — | | $ | 490,788 | |
Affiliated Portfolios (a) | | | — | | | 3,311,800 | | | — | | | 3,311,800 | |
Unaffiliated Investment Companies | | | 11,616,803 | | | — | | | — | | | 11,616,803 | |
Exchange Traded Funds | | | 460,455 | | | — | | | — | | | 460,455 | |
| |
|
| |
|
| |
|
| |
|
| |
Total Investment Companies | | $ | 12,568,046 | | $ | 3,311,800 | | $ | — | | $ | 15,879,846 | |
| |
|
| |
|
| |
|
| |
|
| |
| | | |
| |
|
| | (a) | Investments in Affiliated Portfolios represent ownership interests in the Portfolios. Due to the Funds’ master-feeder structure, the inputs used for valuing these investments are categorized as Level 2. |
| | | |
| The Trust recognizes significant transfers between fair value hierarchy levels at the reporting period end. There were no significant transfers between Level 1 and 2 as of October 31, 2010. |
| |
4. | Related Party Transactions: |
| |
| Investment Management: |
| |
| The Investment Adviser, a wholly owned subsidiary of HSBC Bank USA, N.A., a national bank organized under the laws of the United States, acts as Investment Adviser to the World Selection Funds. As Investment Adviser, HSBC manages the investments of the World Selection Funds and continuously reviews, supervises and administers the World Selection Funds’ investments. For its services as Investment Adviser, HSBC is entitled to receive a fee, computed daily and paid monthly, based on average daily net assets, at an annual rate of 0.05% for each Fund. The Investment Adviser is voluntarily waiving all of the fee for each of the World Selection Funds. Any voluntary fee waivers/reimbursements are not subject to recoupment in subsequent fiscal periods. Voluntary waivers/ reimbursements may be stopped at any time. |
| |
HSBC INVESTOR WORLD SELECTION FUNDS | 30 |
|
HSBC INVESTOR WORLD SELECTION FUNDS |
|
Notes to Financial Statements—as of October 31, 2010 (continued) |
| |
| Administration: |
| |
| HSBC serves the World Selection Funds as Administrator. Under the terms of the Administration Agreement, HSBC received from the World Selection Funds (as well as the other funds in the HSBC Investor Family of Funds) a fee, accrued daily and paid monthly, at an annual rate of: |
| | | | |
Based on Average Daily Net Assets of | | | Fee Rate | |
| | |
| |
Up to $10 billion | | | 0.0550% | |
In excess of $10 billion but not exceeding $20 billion | | | 0.0350% | |
In excess of $20 billion but not exceeding $50 billion | | | 0.0275% | |
In excess of $50 billion | | | 0.0250% | |
| |
| The fee breakpoints are determined on the basis of the aggregate average daily net assets of the HSBC Investor Family of Funds. The fee is allocated to each series of the HSBC Investor Family of Funds based upon its pro-rata share of net assets. For assets invested in underlying Portfolios by World Selection Funds, the Portfolios pay half of the administration fee and the World Selection Funds pay half, for a combination of the total fee rate above. Certain administration fees of the Portfolios also may be reduced by treating them as apportioned in part to other funds making investments in the Portfolios in master-feeder structures. An amount equal to 50% of the administration fees is deemed to be class-specific. |
| |
| Pursuant to a Sub-Administration Agreement with HSBC, Citi Fund Services Ohio, Inc. (“Citi Ohio’’), a wholly-owned subsidiary of Citigroup, Inc., serves as the Sub-Administrator for the Trust and the HSBC Investor Family of Funds (collectively, the “Trusts”) subject to the general supervision of the Trusts’ Board of Trustees and HSBC. For these services, Citi Ohio is entitled to a fee, payable by HSBC, at an annual rate equivalent to the fee rates set forth above, minus 0.02% (2 basis points) which is retained by HSBC. |
| |
| Under a Compliance Services Agreement between the Trusts and Citi Ohio (the “CCO Agreement’’), Citi Ohio makes an employee available to serve as the Trusts’ Chief Compliance Officer (the “CCO’’). Under the CCO Agreement, Citi Ohio also provides infrastructure and support in implementing the written policies and procedures comprising the Trusts’ compliance program, including support services to the CCO. For the services provided under the CCO Agreement, the HSBC Investor Family of Funds paid Citi Ohio $269,869 for the year ended October 31, 2010, plus reimbursement of certain out of pocket expenses. Expenses incurred by each Fund are reflected on the Statements of Operations as “Compliance Services.’’ Citi Ohio pays the salary and other compensation earned by individuals performing these services, as employees of Citi Ohio. |
| |
| Distribution Arrangements: |
| |
| Foreside Distribution Services, L.P. (“Foreside”), a wholly-owned subsidiary of Foreside Financial Group LLC, serves the Trust as Distributor (the “Distributor’’). The Trust has adopted a non-compensatory Distribution Plan and Agreement (the “Distribution Plan’’) pursuant to Rule 12b-1 of the Act. The Distribution Plan provides for reimbursement of expenses incurred by the Distributor related to distribution and marketing, at a rate not to exceed 0.25%, 1.00%, and 1.00% of the average daily net assets of Class A Shares (currently not being charged), Class B Shares (currently charging 0.75%), and Class C Shares (currently charging 0.75%) of the World Selection Funds, respectively. As of the most recent fiscal year end, Foreside, as Distributor, also received $628,328, $459,202, and $43,157 in commissions from sales of HSBC Investor Family of Funds, for Class A Shares, Class B Shares, and Class C Shares, respectively of which $60, $12, and $— were reallocated to HSBC-affiliated brokers and dealers, for Class A Shares, Class B Shares, and Class C Shares, respectively. |
| |
| Shareholder Servicing: |
| |
| The Trust has adopted a Shareholder Services Plan which provides for payments to shareholder servicing agents (which currently consist of HSBC and its affiliates) for providing various shareholder services. For performing these services, the shareholder servicing agents receive a fee that is computed daily and paid monthly up to 0.25%, 0.25% and 0.25% of the average daily net assets of Class A Shares, Class B Shares and Class C Shares of the World Selection Funds, respectively. The fees paid to the Distributor pursuant to the Distribution Plan and to shareholder servicing agents pursuant to the Shareholder Services Plan currently are not intended to exceed, in the aggregate, 0.25% of the average daily net assets of Class A Shares and 1.00% of the average daily net assets of Class B Shares and Class C Shares. |
| |
31 | HSBC INVESTOR WORLD SELECTION FUNDS |
|
HSBC INVESTOR WORLD SELECTION FUNDS |
|
Notes to Financial Statements—as of October 31, 2010 (continued) |
| |
| Fund Accounting, Transfer Agency and Trustees: |
| |
| Citi Ohio provides fund accounting and transfer agency services for the Trusts. As transfer agent, Citi Ohio receives a fee based on the number of funds and shareholder accounts, subject to certain minimums and reimbursement of certain expenses. As fund accountant, Citi Ohio receives an annual fee per fund and share class, subject to minimums and reimbursement of certain expenses. Citi Ohio receives additional fees paid by the Trust for blue sky exemption services. |
| |
| Each non-interested Trustee is compensated with a $60,000 annual Board retainer for service as a Trustee of the Trusts and Portfolio Trust, as well as a $3,000 annual retainer for each Committee of the Board of the Trusts and Portfolio Trust. Each non-interested Trustee also receives a $5,000 and $3,000 meeting fee for each regular in-person Board meeting and Committee meeting, respectively. Furthermore, each non-interested Trustee receives compensation for attending special meetings and/or functioning as a Committee or Board Chairperson. In addition, the non-interested Trustees are reimbursed for certain expenses incurred in connection with their Board membership. |
| |
| Fee Reductions: |
| |
| The Investment Adviser has agreed to contractually limit through March 1, 2011 the total expenses, exclusive of interest, taxes, brokerage commissions, and extraordinary expenses of the World Selection Funds. Each Fund Class has its own expense limitations based on the average daily net assets for any full fiscal year as follows: Class A Shares 1.50%, Class B Shares 2.25%, Class C Shares 2.25%. |
| |
| Any amounts contractually waived or reimbursed by the Investment Adviser will be subject to repayment by the Fund to the Investment Adviser within three years to the extent that the repayment will not cause the Fund’s operating expenses to exceed the contractual expense limit that was in effect at the time of such waiver or reimbursement. During the year ended October 31, 2010, the Investment Adviser did not recapture any of its prior contractual waivers or reimbursements. As of October 31, 2010, the repayments that may potentially be made by the Funds are as follows: |
| | | | | | | | | | |
Fund | | 2013* | | 2012* | | 2011* | |
| |
| |
| |
| |
Aggressive Strategy Fund | | $ | 56,869 | | $ | 49,257 | | $ | 51,467 | |
Balanced Strategy Fund | | | — | | | 3,289 | | | — | |
Moderate Strategy Fund | | | — | | | — | | | — | |
Conservative Strategy Fund | | | — | | | 6,592 | | | 20,961 | |
| | | |
| |
|
| | * | The year listed above the amounts is the fiscal year ending in which the amounts will no longer be recoupable. |
| |
| The Administrator and Citi Ohio may voluntarily waive/reimburse fees to help support the expense limits of each Fund. In addition, the Investment Adviser may waive/reimburse additional fees at their discretion. Any voluntary fee waivers/reimbursements are not subject to recoupment in subsequent fiscal periods. Voluntary waivers/reimbursements may be stopped at any time. Amounts waived/reimbursed by the Investment Adviser, Administrator, and Citi Ohio are reported separately on the Statements of Operations, as applicable. |
| |
5. | Investment Transactions: |
| |
| Cost of purchases and proceeds from sales of securities (excluding securities maturing less than one year from acquisition) for the year ended October 31, 2010 were as follows: |
| | | | | | | |
Fund | | Purchases | | Sales | |
| |
| |
| |
Aggressive Strategy Fund | | $ | 6,444,706 | | $ | 1,327,317 | |
Balanced Strategy Fund | | | 24,558,228 | | | 7,826,585 | |
Moderate Strategy Fund | | | 30,566,290 | | | 14,902,100 | |
Conservative Strategy Fund | | | 14,854,961 | | | 7,164,128 | |
| | | | | | | |
Contributions and withdrawals of the respective Portfolios for the year ended October 31, 2010 totaled: |
| | | | | | | |
| | Contributions | | Withdrawals | |
| |
| |
| |
Aggressive Strategy Fund | | $ | 3,013,258 | | $ | 5,630,504 | |
Balanced Strategy Fund | | | 4,314,061 | | | 13,805,588 | |
Moderate Strategy Fund | | | 3,336,809 | | | 14,085,639 | |
Conservative Strategy Fund | | | 1,344,522 | | | 3,161,396 | |
| |
HSBC INVESTOR WORLD SELECTION FUNDS | 32 |
|
HSBC INVESTOR WORLD SELECTION FUNDS |
|
Notes to Financial Statements—as of October 31, 2010 (continued) |
| |
6. | Federal Tax Information: |
| |
| At October 31, 2010, the cost basis of securities (which excludes investments in the Affiliated Portfolios) for federal income tax purposes, gross unrealized appreciation, gross unrealized depreciation and net unrealized appreciation/depreciation were as follows: |
| | | | | | | | | | | | | |
Fund | | Tax Cost | | Tax Unrealized
Appreciation | | Tax Unrealized
Depreciation | | Net Unrealized
Appreciation/
(Depreciation) | |
| |
| |
| |
| |
| |
Aggressive Strategy Fund | | $ | 5,322,678 | | $ | 375,361 | | $ | (2,533 | ) | $ | 372,828 | |
Balanced Strategy Fund | | | 22,292,215 | | | 1,449,181 | | | (15,564 | ) | | 1,433,617 | |
Moderate Strategy Fund | | | 26,232,712 | | | 1,670,346 | | | (24,541 | ) | | 1,645,805 | |
Conservative Strategy Fund | | | 12,006,934 | | | 573,666 | | | (12,555 | ) | | 561,111 | |
| |
| The tax character of dividends paid by the World Selection Funds for the year ended October 31, 2010 was as follows: |
| | | | | | | | | | | | | |
| | Dividends paid from | |
| |
| |
| | Ordinary
Income | | Net Long Term
Capital Gains | | Total Taxable
Dividends | | Total Dividends
Paid(1) | |
| |
| |
| |
| |
| |
Aggressive Strategy Fund | | $ | — | | $ | — | | $ | — | | $ | — | |
Balanced Strategy Fund | | | 136,101 | | | — | | | 136,101 | | | 136,101 | |
Moderate Strategy Fund | | | 682,988 | | | — | | | 682,988 | | | 682,988 | |
Conservative Strategy Fund | | | 235,347 | | | — | | | 235,347 | | | 235,347 | |
| | | | | | | | | | | | | |
The tax character of dividends paid by the World Selection Funds for the year ended October 31, 2009 was as follows: |
| | | |
| | Dividends paid from | |
| |
| |
| | Ordinary
Income | | Net Long Term
Capital Gains | | Total Taxable
Dividends | | Total Dividends
Paid(1) | |
| |
| |
| |
| |
| |
Aggressive Strategy Fund | | $ | — | | $ | — | | $ | — | | $ | — | |
Balanced Strategy Fund | | | 148,995 | | | — | | | 148,995 | | | 148,995 | |
Moderate Strategy Fund | | | 287,613 | | | — | | | 287,613 | | | 287,613 | |
Conservative Strategy Fund | | | 109,163 | | | — | | | 109,163 | | | 109,163 | |
| | | |
| |
|
| | (1) | Total dividends paid may differ from the amount reported in the Statement of Changes in Net Assets because dividends are recognized when actually paid for tax purposes. |
| |
| As of October 31, 2010, the components of accumulated earnings/(deficit) on a tax basis for the World Selection Funds were as follows: |
| | | | | | | | | | | | | | | | | | | |
| | Undistributed
Ordinary
Income | | Undistributed
Long Term
Capital Gains | | Accumulated
Earnings | | Accumulated
Capital and
Other Losses | | Unrealized
Appreciation/
(Depreciation) (1) | | Total
Accumulated
Earnings/(Deficit) | |
| |
| |
| |
| |
| |
| |
| |
Aggressive Strategy Fund | | $ | 20,370 | | $ | — | | $ | 20,370 | | $ | (1,154,845 | ) | $ | 1,130,841 | | $ | (3,634 | ) |
Balanced Strategy Fund | | | 496,268 | | | — | | | 496,268 | | | (2,994,043 | ) | | 3,129,607 | | | 631,832 | |
Moderate Strategy Fund | | | 109,080 | | | — | | | 109,080 | | | (2,722,436 | ) | | 3,011,947 | | | 398,591 | |
Conservative Strategy Fund | | | 46,886 | | | — | | | 46,886 | | | (600,432 | ) | | 922,648 | | | 369,102 | |
| | | |
| |
|
| | (1) | The difference between book-basis and tax-basis unrealized appreciation/depreciation are attributable primarily to: tax deferral of losses on wash sales, the realization for tax purposes of unrealized gains/losses on certain derivative instruments, the difference between book and tax amortization methods for premium and market discount, the realization for tax purposes of unrealized gains/losses on investments in passive foreign investment companies, and the return of capital investments from real estate investment trusts. |
| | | |
| As of October 31, 2010, the following World Selection Funds have net capital loss carryforwards, which are available to offset future realized gains, if any, to the extent provided by the Treasury regulations. |
| | | | | | | |
Fund | | Amount | | Expires | |
| |
| |
| |
Aggressive Strategy Fund | | $ | 26,859 | | | 2016 | |
Aggressive Strategy Fund | | | 1,127,986 | | | 2017 | |
Balanced Strategy Fund | | | 2,994,043 | | | 2017 | |
Moderate Strategy Fund | | | 2,722,436 | | | 2017 | |
Conservative Strategy Fund | | | 600,432 | | | 2017 | |
| |
33 | HSBC INVESTOR WORLD SELECTION FUNDS |
|
HSBC INVESTOR WORLD SELECTION FUNDS |
|
Notes to Financial Statements—as of October 31, 2010 (continued) |
| |
| During the year ended October 31, 2010, the following Funds utilized capital loss carryforwards to offset capital gains realized: |
| | | | |
Fund | | Amount | |
| |
| |
Aggressive Strategy Fund | | $ | 884,978 | |
Balanced Strategy Fund | | | 2,306,769 | |
Moderate Strategy Fund | | | 2,545,342 | |
Conservative Strategy Fund | | | 901,943 | |
| |
7. | Legal and Regulatory Matters: |
| |
| On September 26, 2006 BISYS Fund Services, Inc. (“BISYS’’), an affiliate of BISYS Fund Services Ohio, Inc. which provided various services to the Funds, reached a settlement with the Securities and Exchange Commission (“the SEC’’) regarding the SEC’s investigation related to BISYS’ past payment of certain marketing and other expenses with respect to certain of its mutual fund clients. There was no impact on the Funds’ financial statements as the funds did not receive any settlement monies. |
| |
8. | Subsequent Events (Unaudited): |
| |
| Effective November 1, 2010, each non-interested Trustee is compensated with a $63,000 annual Board retainer for service as a Trustee of the Trust and the other HSBC Investor Funds, as well as a $3,000 annual retainer for each Committee of the Board of the Trust and other HSBC Investor Funds. Each non-interested Trustee also receives a $5,000 and $3,000 meeting fee for each regular in-person Board meeting and Committee meeting, respectively. Furthermore, each non-interested Trustee receives compensation for attending special meetings and/or functioning as a Committee or Board Chairperson. In addition, the noninterested Trustees are reimbursed for certain expenses incurred in connection with their Board membership. |
| |
HSBC INVESTOR WORLD SELECTION FUNDS | 34 |
REPORT OF INDEPENDENT REGISTERED PUBLIC ACCOUNTING FIRM
To the Shareholders and Board of Trustees of
HSBC World Selection Funds:
We have audited the accompanying statements of assets and liabilities of HSBC World Selection Funds – HSBC World Selection Aggressive Strategy Fund, HSBC World Selection Balanced Strategy Fund, HSBC World Selection Moderate Strategy Fund and HSBC World Selection Conservative Strategy Fund (the Funds), including the schedules of portfolio investments, as of October 31, 2010, and the related statements of operations for the year then ended, the statements of changes in net assets for each year in the two-year period then ended and the financial highlights for each year in the five-year period then ended. These financial statements and financial highlights are the responsibility of the Funds’ management. Our responsibility is to express an opinion on these financial statements and financial highlights based on our audits.
We conducted our audits in accordance with the standards of the Public Company Accounting Oversight Board (United States). Those standards require that we plan and perform the audits to obtain reasonable assurance about whether the financial statements and financial highlights are free of material misstatement. An audit includes examining, on a test basis, evidence supporting the amounts and disclosures in the financial statements. Our procedures included confirmation of securities owned as of October 31, 2010, by correspondence with the respective custodian or broker. An audit also includes assessing the accounting principles used and significant estimates made by management, as well as evaluating the overall financial statement presentation. We believe that our audits provide a reasonable basis for our opinion.
In our opinion, the financial statements and financial highlights referred to above present fairly, in all material respects, the financial position of the Funds as of October 31, 2010, the results of their operations for the year then ended, the changes in their net assets for each year in the two-year period then ended, and the financial highlights for each year in the five-year period then ended, in conformity with U.S. generally accepted accounting principles.

Columbus, Ohio
December 22, 2010
| |
35 | HSBC INVESTOR WORLD SELECTION FUNDS |
|
HSBC INVESTOR FAMILY OF FUNDS |
|
Other Federal Income Tax Information (Unaudited)—as of October 31, 2010 |
| |
| For the year ended October 31, 2010, the following percentages of the total ordinary income dividends paid by the Funds qualify for the corporate dividends received deduction available to corporate shareholders: |
| | | | |
Fund | | | Dividends
Received Deduction |
| | |
|
Balanced Strategy Fund | | 96.99 | % |
Moderate Strategy Fund | | 26.02 | % |
Conservative Strategy Fund | | 26.86 | % |
| |
| For the year ended October 31, 2010, dividends paid by the Funds may be subject to a maximum tax rate of 15%, as provided for by the Jobs and Growth Tax Relief Reconciliation Act of 2003. The Funds intend to designate the maximum amount allowable as taxed at a maximum rate of 15%. Complete information will be reported in conjunction with your 2009 Form 1099-DIV: |
| | | | |
Fund | | | Qualified
Dividend Income |
| | |
|
Balanced Strategy Fund | | 97.48 | % |
Moderate Strategy Fund | | 44.87 | % |
Conservative Strategy Fund | | 83.09 | % |
| |
HSBC INVESTOR WORLD SELECTION FUNDS | 36 |
|
HSBC INVESTOR FAMILY OF FUNDS |
|
Table of Shareholder Expenses (Unaudited)—as of October 31, 2010 |
| |
| As a shareholder of the HSBC Investor World Selection Funds (“Funds”), you incur two types of costs: (1) transaction costs, including sales charges (loads) on purchases, redemption fees; and exchange fees; (2) ongoing costs, including management fees; distribution and/or shareholder servicing fees; and other Fund expenses. These examples are intended to help you understand your ongoing costs (in dollars) of investing in the Funds and to compare these costs with the ongoing costs of investing in other mutual funds. |
| |
| These examples are based on an investment of $1,000 invested at the beginning of the period and held for the entire period from May 1, 2010 through October 31, 2010. |
| |
| Actual Example |
| |
| The table below provides information about actual account values and actual expenses. You may use the information below, together with the amount you invested, to estimate the expenses that you paid over the period. Simply divide your account value by $1,000 (for example, an $8,600 account value divided by $1,000 = 8.6), then multiply the result by the number in the table under the heading entitled “Expenses Paid During Period” to estimate the expenses you paid on your account during this period. |
| | | | | | | | | | | | | | | | |
| | | | Beginning
Account Value
5/1/10 | | Ending
Account Value
10/31/10 | | Expenses Paid
During Period*
5/1/10 – 10/31/10 | | Annualized
Expense Ratio
During Period
5/1/10 – 10/31/10 |
| | | |
| |
| |
| |
|
Aggressive Strategy Fund | | Class A Shares | | $ | 1,000.00 | | $ | 1,039.80 | | | $ | 7.61 | | | 1.48 | % |
| | Class B Shares | | | 1,000.00 | | | 1,036.80 | | | | 11.45 | | | 2.23 | % |
| | Class C Shares | | | 1,000.00 | | | 1,035.90 | | | | 11.44 | | | 2.23 | % |
Balanced Strategy Fund | | Class A Shares | | | 1,000.00 | | | 1,053.10 | | | | 6.73 | | | 1.30 | % |
| | Class B Shares | | | 1,000.00 | | | 1,049.70 | | | | 10.59 | | | 2.05 | % |
| | Class C Shares | | | 1,000.00 | | | 1,049.50 | | | | 10.59 | | | 2.05 | % |
Moderate Strategy Fund | | Class A Shares | | | 1,000.00 | | | 1,059.50 | | | | 6.28 | | | 1.21 | % |
| | Class B Shares | | | 1,000.00 | | | 1,054.90 | | | | 10.15 | | | 1.96 | % |
| | Class C Shares | | | 1,000.00 | | | 1,054.90 | | | | 10.20 | | | 1.97 | % |
Conservative Strategy Fund | | Class A Shares | | | 1,000.00 | | | 1,058.00 | | | | 7.83 | | | 1.51 | % |
| | Class B Shares | | | 1,000.00 | | | 1,054.10 | | | | 11.70 | | | 2.26 | % |
| | Class C Shares | | | 1,000.00 | | | 1,054.90 | | | | 11.71 | | | 2.26 | % |
| | |
|
|
| * | Expenses are equal to the average account value over the period multiplied by the Funds’ annualized expense ratio, multiplied by the number of days in the most recent fiscal half-year divided by the number of days in the fiscal year (to reflect the one half year period). |
| |
37 | HSBC INVESTOR WORLD SELECTION FUNDS |
|
HSBC INVESTOR FAMILY OF FUNDS |
|
Table of Shareholder Expenses (Unaudited)—as of October 31, 2010 (continued) |
| |
| Hypothetical Example for Comparison Purposes |
| |
| The table below provides information about hypothetical account values and hypothetical expenses based on the Fund’s actual expense ratio and an assumed rate of return of 5% per year before expenses, which is not the Fund’s actual return. The hypothetical account values and expenses may not be used to estimate the actual ending account balance or expenses you paid for the period. You may use this information to compare this 5% hypothetical example with the 5% hypothetical examples that appear in the shareholder reports of other funds. |
| |
| Please note that the expenses shown in the table are meant to highlight your ongoing costs only and do not reflect any transactional costs, such as sales charges (loads), redemption fees, or exchange fees. Therefore, the table is useful in comparing ongoing costs only, and will not help you determine the relative total costs of owning different funds. In addition, if these transactional costs were included, your costs would have been higher. |
| | | | | | | | | | | | | | | | |
| | | | Beginning
Account Value
5/1/10 | | Ending
Account Value
10/31/10 | | Expenses Paid
During Period*
5/1/10 – 10/31/10 | | Annualized
Expense Ratio
During Period
5/1/10 – 10/31/10 |
| | | |
| |
| |
| |
|
Aggressive Strategy Fund | | Class A Shares | | $ | 1,000.00 | | $ | 1,017.74 | | | $ | 7.53 | | | 1.48 | % |
| | Class B Shares | | | 1,000.00 | | | 1,013.96 | | | | 11.32 | | | 2.23 | % |
| | Class C Shares | | | 1,000.00 | | | 1,013.96 | | | | 11.32 | | | 2.23 | % |
Balanced Strategy Fund | | Class A Shares | | | 1,000.00 | | | 1,018.65 | | | | 6.61 | | | 1.30 | % |
| | Class B Shares | | | 1,000.00 | | | 1,014.87 | | | | 10.41 | | | 2.05 | % |
| | Class C Shares | | | 1,000.00 | | | 1,014.87 | | | | 10.41 | | | 2.05 | % |
Moderate Strategy Fund | | Class A Shares | | | 1,000.00 | | | 1,019.11 | | | | 6.16 | | | 1.21 | % |
| | Class B Shares | | | 1,000.00 | | | 1,015.32 | | | | 9.96 | | | 1.96 | % |
| | Class C Shares | | | 1,000.00 | | | 1,015.27 | | | | 10.01 | | | 1.97 | % |
Conservative Strategy Fund | | Class A Shares | | | 1,000.00 | | | 1,017.59 | | | | 7.68 | | | 1.51 | % |
| | Class B Shares | | | 1,000.00 | | | 1,013.81 | | | | 11.47 | | | 2.26 | % |
| | Class C Shares | | | 1,000.00 | | | 1,013.81 | | | | 11.47 | | | 2.26 | % |
| | |
|
|
| * | Expenses are equal to the average account value over the period multiplied by the Funds’ annualized expense ratio, multiplied by the number of days in the most recent fiscal half-year divided by the number of days in the fiscal year (to reflect the one half year period). |
| |
HSBC INVESTOR WORLD SELECTION FUNDS | 38 |
(This Page Intentionally Left Blank)
|
HSBC INVESTOR GROWTH PORTFOLIO |
|
Schedule of Portfolio Investments—as of October 31, 2010 |
| | | | | | | |
Common Stocks—98.1% |
|
| | | | | | | |
| | Shares | | Value($) | |
| |
| |
| |
Aerospace & Defense – 2.9% | | | | | | | |
Goodrich Corp. | | | 11,800 | | | 968,426 | |
United Technologies Corp. | | | 25,200 | | | 1,884,204 | |
| | | | |
|
| |
| | | | | | 2,852,630 | |
| | | | |
|
| |
Air Freight & Logistics – 1.1% | | | | | | | |
C.H. Robinson Worldwide, Inc. | | | 16,100 | | | 1,134,728 | |
| | | | |
|
| |
Auto Components – 0.5% | | | | | | | |
BorgWarner, Inc. (a) | | | 9,700 | | | 544,267 | |
| | | | |
|
| |
Beverages – 1.0% | | | | | | | |
PepsiCo, Inc. | | | 14,800 | | | 966,440 | |
| | | | |
|
| |
Biotechnology – 1.0% | | | | | | | |
Celgene Corp. (a) | | | 16,700 | | | 1,036,569 | |
| | | | |
|
| |
Capital Markets – 5.4% | | | | | | | |
Franklin Resources, Inc. | | | 13,200 | | | 1,514,040 | |
Goldman Sachs Group, Inc. | | | 18,100 | | | 2,913,195 | |
TD AMERITRADE Holding Corp. (a) | | | 52,000 | | | 888,680 | |
| | | | |
|
| |
| | | | | | 5,315,915 | |
| | | | |
|
| |
Chemicals – 0.9% | | | | | | | |
Ecolab, Inc. | | | 17,900 | | | 882,828 | |
| | | | |
|
| |
Communications Equipment – 5.8% | | | | | | | |
Cisco Systems, Inc. (a) | | | 91,600 | | | 2,091,228 | |
Juniper Networks, Inc. (a) | | | 21,700 | | | 702,863 | |
QUALCOMM, Inc. | | | 64,100 | | | 2,892,833 | |
| | | | |
|
| |
| | | | | | 5,686,924 | |
| | | | |
|
| |
Computers & Peripherals – 8.6% | | | | | | | |
Apple, Inc. (a) | | | 16,480 | | | 4,958,338 | |
EMC Corp. (a) | | | 109,200 | | | 2,294,292 | |
NetApp, Inc. (a) | | | 22,700 | | | 1,208,775 | |
| | | | |
|
| |
| | | | | | 8,461,405 | |
| | | | |
|
| |
Construction & Engineering – 1.4% | | | | | | | |
Fluor Corp. | | | 28,600 | | | 1,378,234 | |
| | | | |
|
| |
Diversified Financial Services – 3.5% | | | | | | | |
CME Group, Inc. | | | 3,700 | | | 1,071,705 | |
IntercontinentalExchange, Inc. (a) | | | 7,700 | | | 884,499 | |
JP Morgan Chase & Co. | | | 40,100 | | | 1,508,963 | |
| | | | |
|
| |
| | | | | | 3,465,167 | |
| | | | |
|
| |
Electronic Equipment, Instruments & Components – 2.0% | | | | | | | |
Agilent Technologies, Inc. (a) | | | 27,200 | | | 946,560 | |
Amphenol Corp., Class A | | | 20,100 | | | 1,007,613 | |
| | | | |
|
| |
| | | | | | 1,954,173 | |
| | | | |
|
| |
Energy Equipment & Services – 4.2% | | | | | | | |
FMC Technologies, Inc. (a) | | | 25,700 | | | 1,852,970 | |
Schlumberger Ltd. | | | 33,200 | | | 2,320,348 | |
| | | | |
|
| |
| | | | | | 4,173,318 | |
| | | | |
|
| |
Financial Services – 2.8% | | | | | | | |
Visa, Inc., Class A | | | 35,800 | | | 2,798,486 | |
| | | | |
|
| |
Food & Staples Retailing – 1.0% | | | | | | | |
Costco Wholesale Corp. | | | 15,100 | | | 947,827 | |
| | | | |
|
| |
| | | | | | | |
Common Stocks, continued | | | | | | | |
|
| | | | | | | |
| | Shares | | Value($) | |
| |
| |
| |
Food Products – 0.9% | | | | | | | |
Green Mountain Coffee Roasters, Inc. (a) | | | 25,600 | | | 844,544 | |
| | | | |
|
| |
Health Care Equipment & Supplies – 0.8% | | | | | | | |
Varian Medical Systems, Inc. (a) | | | 13,000 | | | 821,860 | |
| | | | |
|
| |
Health Care Providers & Services – 2.8% | | | | | | | |
Express Scripts, Inc. (a) | | | 56,300 | | | 2,731,676 | |
| | | | |
|
| |
Health Care Technology – 1.1% | | | | | | | |
Cerner Corp. (a) | | | 11,900 | | | 1,045,177 | |
| | | | |
|
| |
Hotels, Restaurants & Leisure – 2.2% | | | | | | | |
Ctrip.com International Ltd. ADR (a) | | | 20,400 | | | 1,062,228 | |
Yum! Brands, Inc. | | | 22,900 | | | 1,134,924 | |
| | | | |
|
| |
| | | | | | 2,197,152 | |
| | | | |
|
| |
Internet & Catalog Retail – 6.5% | | | | | | | |
Amazon.com, Inc. (a) | | | 14,500 | | | 2,394,530 | |
Netflix, Inc. (a) | | | 3,400 | | | 589,900 | |
Priceline.com, Inc. (a) | | | 9,000 | | | 3,391,290 | |
| | | | |
|
| |
| | | | | | 6,375,720 | |
| | | | |
|
| |
Internet Software & Services – 4.7% | | | | | | | |
Baidu, Inc. ADR (a) | | | 15,650 | | | 1,721,657 | |
Google, Inc., Class A (a) | | | 4,850 | | | 2,973,001 | |
| | | | |
|
| |
| | | | | | 4,694,658 | |
| | | | |
|
| |
IT Services – 4.1% | | | | | | | |
Cognizant Technology Solutions Corp. (a) | | | 61,600 | | | 4,015,704 | |
| | | | |
|
| |
Machinery – 6.0% | | | | | | | |
Danaher Corp. | | | 58,800 | | | 2,549,568 | |
Deere & Co. | | | 22,600 | | | 1,735,680 | |
Illinois Tool Works, Inc. | | | 35,500 | | | 1,622,350 | |
| | | | |
|
| |
| | | | | | 5,907,598 | |
| | | | |
|
| |
Media – 0.5% | | | | | | | |
Scripps Networks Interactive, Class A | | | 9,900 | | | 503,811 | |
| | | | |
|
| |
Metals & Mining – 2.8% | | | | | | | |
Cliffs Natural Resources, Inc. | | | 26,900 | | | 1,753,880 | |
Walter Energy, Inc. | | | 11,700 | | | 1,029,132 | |
| | | | |
|
| |
| | | | | | 2,783,012 | |
| | | | |
|
| |
Multiline Retail – 1.5% | | | | | | | |
Kohl’s Corp. (a) | | | 29,400 | | | 1,505,280 | |
| | | | |
|
| |
Oil, Gas & Consumable Fuels – 2.0% | | | | | | | |
Peabody Energy Corp. | | | 19,000 | | | 1,005,100 | |
Petroleo Brasileiro SA ADR | | | 31,200 | | | 973,128 | |
| | | | |
|
| |
| | | | | | 1,978,228 | |
| | | | |
|
| |
Personal Products – 1.0% | | | | | | | |
The Estee Lauder Cos., Inc., Class A | | | 14,600 | | | 1,039,082 | |
| | | | |
|
| |
Pharmaceuticals – 2.9% | | | | | | | |
Shire plc ADR | | | 20,900 | | | 1,465,090 | |
Teva Pharmaceutical Industries Ltd. ADR | | | 26,400 | | | 1,370,160 | |
| | | | |
|
| |
| | | | | | 2,835,250 | |
| | | | |
|
| |
Road & Rail – 3.0% | | | | | | | |
Union Pacific Corp. | | | 34,200 | | | 2,998,656 | |
| | | | |
|
| |
| | |
See notes to financial statements. | HSBC INVESTOR PORTFOLIOS | 40 |
|
HSBC INVESTOR GROWTH PORTFOLIO |
|
Schedule of Portfolio Investments—as of October 31, 2010 (continued) |
| | | | | | | |
Common Stocks, continued |
|
| | | | | | | |
| | Shares | | Value($) | |
| |
| |
| |
Semiconductors & Semiconductor Equipment – 1.1% | | | | | | | |
Texas Instruments, Inc. | | | 38,300 | | | 1,132,531 | |
| | | | |
|
| |
Software – 7.0% | | | | | | | |
Autodesk, Inc. (a) | | | 39,700 | | | 1,436,346 | |
Citrix Systems, Inc. (a) | | | 27,100 | | | 1,736,297 | |
Intuit, Inc. (a) | | | 13,200 | | | 633,600 | |
Oracle Corp. | | | 106,200 | | | 3,122,280 | |
| | | | |
|
| |
| | | | | | 6,928,523 | |
| | | | |
|
| |
Specialty Retail – 2.3% | | | | | | | |
Dick’s Sporting Goods, Inc. (a) | | | 17,500 | | | 504,350 | |
O’Reilly Automotive, Inc. (a) | | | 22,300 | | | 1,304,550 | |
Urban Outfitters, Inc. (a) | | | 13,600 | | | 418,472 | |
| | | | |
|
| |
| | | | | | 2,227,372 | |
| | | | |
|
| |
Textiles, Apparel & Luxury Goods – 1.0% | | | | | | | |
Nike, Inc., Class B | | | 11,600 | | | 944,704 | |
| | | | |
|
| |
Wireless Telecommunication Services – 1.8% | | | | | | | |
American Tower Corp., Class A (a) | | | 33,600 | | | 1,734,096 | |
| | | | |
|
| |
TOTAL COMMON STOCKS
(COST $77,391,455) | | | | | | 96,843,545 | |
| | | | |
|
| |
|
Investment Company—1.3% | | | | | | | |
|
|
|
|
|
|
|
|
Northern Institutional Diversified Assets
Portfolio, Institutional Shares, 0.04% (b) | | | 1,314,150 | | | 1,314,150 | |
| | | | |
|
| |
TOTAL INVESTMENT COMPANY
(COST $1,314,150) | | | | | | 1,314,150 | |
| | | | |
|
| |
TOTAL INVESTMENTS
(COST $78,705,605) — 99.4% | | | | | | 98,157,695 | |
| | | | |
|
| |
| | |
| |
| Percentages indicated are based on net assets of $98,750,801. |
|
ADR —American Depositary Receipt |
plc —Public Limited Company |
| | |
(a) | Represents non-income producing security. |
| | |
(b) | The rate represents the annualized one-day yield that was in effect on October 31, 2010. |
| | |
41 | HSBC INVESTOR PORTFOLIOS | See notes to financial statements. |
|
HSBC INVESTOR INTERNATIONAL EQUITY PORTFOLIO |
|
Schedule of Portfolio Investments—as of October 31, 2010 |
| | | | | | | |
Common Stocks—96.8% |
|
|
| | Shares | | Value($) | |
| |
| |
| |
Australia – 3.9% | | | | | | | |
Australia & New Zealand Banking Group Ltd. | | | 9,000 | | | 218,667 | |
Boral Ltd. | | | 51,520 | | | 221,491 | |
Incitec Pivot Ltd. | | | 46,600 | | | 169,763 | |
National Australia Bank Ltd. | | | 33,165 | | | 826,900 | |
Telstra Corp. Ltd. (a) | | | 70,200 | | | 183,554 | |
| | | | |
|
| |
| | | | | | 1,620,375 | |
| | | | |
|
| |
Austria – 0.8% | | | | | | | |
OMV AG | | | 8,600 | | | 321,273 | |
| | | | |
|
| |
Belgium – 1.3% | | | | | | | |
Delhaize Group SA | | | 5,634 | | | 393,502 | |
KBC Groep NV (b) | | | 3,300 | | | 143,531 | |
| | | | |
|
| |
| | | | | | 537,033 | |
| | | | |
|
| |
Brazil – 1.3% | | | | | | | |
Banco Do Brasil SA | | | 11,100 | | | 214,948 | |
Vale SA, Preferred ADR | | | 10,900 | | | 313,157 | |
| | | | |
|
| |
| | | | | | 528,105 | |
| | | | |
|
| |
Canada – 4.8% | | | | | | | |
Agrium, Inc. | | | 1,900 | | | 168,123 | |
Lundin Mining Corp. (b) | | | 45,600 | | | 288,913 | |
National Bank of Canada | | | 5,900 | | | 388,453 | |
Nexen, Inc. | | | 17,727 | | | 377,281 | |
Penn West Energy Trust | | | 20,523 | | | 467,585 | |
Suncor Energy, Inc. | | | 10,428 | | | 334,236 | |
| | | | |
|
| |
| | | | | | 2,024,591 | |
| | | | |
|
| |
China – 0.4% | | | | | | | |
China Petroleum & Chemical Corp. | | | 170,000 | | | 160,328 | |
| | | | |
|
| |
Denmark – 1.2% | | | | | | | |
Danske Bank A/S (b) | | | 18,800 | | | 500,075 | |
| | | | |
|
| |
France – 14.7% | | | | | | | |
Arkema | | | 4,200 | | | 271,369 | |
BNP Paribas SA | | | 8,986 | | | 657,131 | |
Bouygues SA | | | 12,600 | | | 555,217 | |
Cap Gemini SA | | | 7,900 | | | 402,970 | |
Compagnie Generale de Geophysique-
Veritas (b) | | | 7,000 | | | 163,165 | |
Electricite de France | | | 9,500 | | | 435,274 | |
France Telecom SA | | | 25,200 | | | 605,452 | |
Lagardere S.C.A. | | | 10,300 | | | 439,248 | |
PPR | | | 1,300 | | | 213,109 | |
Renault SA (b) | | | 6,300 | | | 350,024 | |
Sanofi-Aventis | | | 9,400 | | | 656,404 | |
Societe Generale | | | 8,581 | | | 513,773 | |
Vallourec SA | | | 2,234 | | | 231,825 | |
Vivendi | | | 22,220 | | | 633,731 | |
| | | | |
|
| |
| | | | | | 6,128,692 | |
| | | | |
|
| |
Germany – 8.0% | | | | | | | |
Allianz SE | | | 5,800 | | | 726,816 | |
Bayer AG | | | 10,200 | | | 765,071 | |
Deutsche Bank AG | | | 6,800 | | | 393,843 | |
E.ON AG | | | 20,200 | | | 633,604 | |
| | | | | | | |
Common Stocks, continued | | | | | | | |
|
| | | | | | | |
| | Shares | | Value($) | |
| |
| |
| |
Germany, continued | | | | | | | |
Muenchener Rueckversicherungs-
Gesellschaft AG | | | 2,100 | | | 328,034 | |
Thyssenkrupp AG | | | 13,700 | | | 503,598 | |
| | | | |
|
| |
| | | | | | 3,350,966 | |
| | | | |
|
| |
Hong Kong – 1.5% | | | | | | | |
Esprit Holdings Ltd. | | | 57,577 | | | 310,133 | |
New World Development Co. Ltd. | | | 160,009 | | | 315,848 | |
| | | | |
|
| |
| | | | | | 625,981 | |
| | | | |
|
| |
Italy – 4.5% | | | | | | | |
ENI SpA | | | 25,200 | | | 567,754 | |
Telecom Italia RSP | | | 204,200 | | | 250,064 | |
Telecom Italia SpA | | | 286,200 | | | 438,899 | |
UniCredit SpA | | | 232,800 | | | 606,783 | |
| | | | |
|
| |
| | | | | | 1,863,500 | |
| | | | |
|
| |
Japan – 23.0% | | | | | | | |
AEON Co. Ltd. | | | 18,100 | | | 213,285 | |
Air Water, Inc. | | | 5,800 | | | 67,697 | |
Asahi Breweries Ltd. | | | 16,200 | | | 327,222 | |
Asahi Glass Co. Ltd. | | | 9,000 | | | 86,476 | |
DIC Corp. | | | 59,000 | | | 110,006 | |
Dowa Holdings Co. Ltd. | | | 19,800 | | | 120,351 | |
East Japan Railway Co. | | | 2,600 | | | 160,783 | |
ITOCHU Corp. | | | 39,700 | | | 348,393 | |
Japan Tobacco, Inc. | | | 179 | | | 556,914 | |
JFE Holdings, Inc. | | | 9,700 | | | 302,876 | |
JX Holdings, Inc. | | | 41,500 | | | 243,996 | |
KDDI Corp. | | | 62 | | | 334,083 | |
KONAMI Corp. | | | 6,300 | | | 111,043 | |
Konica Minolta Holdings, Inc. | | | 10,700 | | | 103,742 | |
Mitsubishi Corp. | | | 24,600 | | | 591,684 | |
Mitsubishi Materials Corp. (b) | | | 54,400 | | | 170,402 | |
Mitsui & Co. Ltd. | | | 33,000 | | | 518,894 | |
Mitsui Fudosan Co. Ltd. | | | 31,600 | | | 597,434 | |
NAMCO BANDAI Holdings, Inc. | | | 20,600 | | | 189,996 | |
NGK Spark Plug Co. Ltd. | | | 14,600 | | | 203,620 | |
Nippon Express Co. Ltd. | | | 33,000 | | | 131,262 | |
Nippon Telegraph & Telephone Corp. | | | 14,000 | | | 636,047 | |
Nissan Motor Co. Ltd. | | | 53,900 | | | 475,687 | |
Sharp Corp. | | | 39,800 | | | 393,300 | |
Sony Corp. | | | 16,910 | | | 565,418 | |
Sumitomo Electric Industries Ltd. | | | 21,500 | | | 274,462 | |
Sumitomo Mitsui Financial Group, Inc. | | | 15,500 | | | 464,711 | |
Sumitomo Realty & Development Co. Ltd. | | | 6,000 | | | 130,814 | |
Sumitomo Rubber Industries Ltd. | | | 6,200 | | | 66,817 | |
The Tokyo Electric Power Co., Inc. | | | 19,600 | | | 468,987 | |
Tokyo Gas Co. Ltd. | | | 49,000 | | | 230,839 | |
Toshiba Corp. | | | 86,900 | | | 435,310 | |
| | | | |
|
| |
| | | | | | 9,632,551 | |
| | | | |
|
| |
Kazakhstan – 0.3% | | | | | | | |
KazMunaiGas Exploration Production GDR | | | 7,050 | | | 121,260 | |
| | | | |
|
| |
| | |
See notes to financial statements. | HSBC INVESTOR PORTFOLIOS | 42 |
|
HSBC INVESTOR INTERNATIONAL EQUITY PORTFOLIO |
|
Schedule of Portfolio Investments—as of October 31, 2010 (continued) |
| | | | | | | |
Common Stocks, continued | | | | | | | |
|
| | | | | |
| | Shares | | Value($) | |
| |
| |
| |
Netherlands – 1.3% | | | | | | | |
Koninklijke Ahold NV | | | 10,800 | | | 149,240 | |
Randstad Holding NV (b) | | | 8,593 | | | 408,963 | |
| | | | |
|
| |
| | | | | | 558,203 | |
| | | | |
|
| |
Norway – 0.4% | | | | | | | |
Petroleum Geo-Services ASA (b) | | | 12,150 | | | 151,940 | |
| | | | |
|
| |
Russian Federation – 0.3% | | | | | | | |
Gazprom OAO ADR | | | 5,600 | | | 122,752 | |
| | | | |
|
| |
South Korea – 1.4% | | | | | | | |
Hana Financial Group, Inc. | | | 4,400 | | | 124,949 | |
KB Financial Group, Inc. ADR | | | 3,679 | | | 165,187 | |
Samsung Electronics Co. Ltd., Preferred | | | 600 | | | 294,907 | |
| | | | |
|
| |
| | | | | | 585,043 | |
| | | | |
|
| |
Spain – 1.0% | | | | | | | |
Telefonica SA | | | 16,200 | | | 437,350 | |
| | | | |
|
| |
Switzerland – 2.3% | | | | | | | |
Novartis AG | | | 14,240 | | | 825,770 | |
UBS AG (b) | | | 8,783 | | | 148,734 | |
| | | | |
|
| |
| | | | | | 974,504 | |
| | | | |
|
| |
Taiwan – 0.6% | | | | | | | |
AU Optronics Corp. (b) | | | 210,030 | | | 209,598 | |
United Microelectronics Corp. | | | 118,000 | | | 56,084 | |
| | | | |
|
| |
| | | | | | 265,682 | |
| | | | |
|
| |
Turkey – 0.8% | | | | | | | |
Turkiye Garanti Bankasi AS | | | 30,900 | | | 189,623 | |
Turkiye Is Bankasi AS, Class C | | | 32,000 | | | 143,933 | |
| | | | |
|
| |
| | | | | | 333,556 | |
| | | | |
|
| |
United Kingdom – 23.0% | | | | | | | |
AstraZeneca plc | | | 17,300 | | | 867,384 | |
Aviva plc | | | 64,400 | | | 410,741 | |
BAE Systems plc | | | 82,300 | | | 454,497 | |
Barclays plc | | | 122,900 | | | 540,683 | |
BP plc | | | 101,900 | | | 695,136 | |
British American Tobacco plc | | | 5,400 | | | 205,902 | |
FirstGroup plc | | | 29,600 | | | 193,435 | |
Imperial Tobacco Group plc | | | 18,000 | | | 576,468 | |
Inchcape plc (b) | | | 27,440 | | | 153,294 | |
Informa plc | | | 20,900 | | | 145,990 | |
Marks & Spencer Group plc | | | 82,200 | | | 562,855 | |
Old Mutual plc | | | 257,800 | | | 536,516 | |
Rentokil Initial plc (b) | | | 60,700 | | | 96,372 | |
Rio Tinto plc | | | 14,000 | | | 905,252 | |
Royal Dutch Shell plc, A Shares | | | 44,687 | | | 1,449,249 | |
Thomas Cook Group plc | | | 39,000 | | | 113,030 | |
Tui Travel plc | | | 46,300 | | | 156,588 | |
Vodafone Group plc | | | 351,058 | | | 955,289 | |
Xstrata plc | | | 30,940 | | | 599,538 | |
| | | | |
|
| |
| | | | | | 9,618,219 | |
| | | | |
|
| |
TOTAL COMMON STOCKS
(COST $38,839,094) | | | | | | 40,461,979 | |
| | | | |
|
| |
| | | | | | | |
Investment Company—0.9% | | | | | | | |
|
| | | | | | | |
| | | Shares | | | Value($) | |
| | |
| | |
| |
Northern Institutional Diversified Assets
Portfolio, Institutional Shares, 0.04% (c) | | | 391,214 | | | 391,214 | |
| | | | |
|
| |
TOTAL INVESTMENT COMPANY
(COST $391,214) | | | | | | 391,214 | |
| | | | |
|
| |
TOTAL INVESTMENTS
(COST $39,230,308) — 97.7% | | | | | | 40,853,193 | |
| | | | |
|
| |
| | |
| |
| Percentages indicated are based on net assets of $41,817,594. |
| |
ADR —American Depositary Receipt |
GDR —Global Depositary Receipt |
plc —Public Limited Company |
| | |
(a) | Rule 144A security or other security which is restricted as to resale to institutional investors. This security has been deemed liquid by the Investment Adviser based on procedures approved by the Board of Trustees. |
| |
(b) | Represents non-income producing security. |
| |
(c) | The rate represents the annualized one-day yield that was in effect on October 31, 2010. |
|
Schedule of Portfolio Investments—October 31, 2010 |
|
The Portfolio invested, as a percentage of net assets, in the following industries, as of October 31, 2010:
| | | | |
Industry | | Percent of Net Assets | |
| |
| |
Commercial Banks | | 13.4 | % | |
Oil, Gas & Consumable Fuels | | 11.8 | % | |
Metals & Mining | | 8.8 | % | |
Pharmaceuticals | | 7.6 | % | |
Diversified Telecommunication Services | | 6.3 | % | |
Insurance | | 3.9 | % | |
Electric Utilities | | 3.7 | % | |
Trading Companies & Distributors | | 3.5 | % | |
Tobacco | | 3.3 | % | |
Media | | 3.1 | % | |
Wireless Telecommunication Services | | 3.1 | % | |
Real Estate Management & Development | | 2.6 | % | |
Household Durables | | 2.4 | % | |
Automobiles | | 2.1 | % | |
Food & Staples Retailing | | 1.9 | % | |
Multiline Retail | | 1.9 | % | |
Chemicals | | 1.6 | % | |
Capital Markets | | 1.4 | % | |
Construction & Engineering | | 1.4 | % | |
Air Freight & Logistics | | 1.4 | % | |
Computers & Peripherals | | 1.1 | % | |
Investment Companies | | 1.0 | % | |
IT Services | | 1.0 | % | |
Professional Services | | 1.0 | % | |
Road & Rail | | 0.9 | % | |
Beverages | | 0.8 | % | |
Energy Equipment & Services | | 0.8 | % | |
Semiconductors & Semiconductor Equipment | | 0.8 | % | |
Auto Components | | 0.7 | % | |
Electrical Equipment | | 0.7 | % | |
Hotels, Restaurants & Leisure | | 0.7 | % | |
Specialty Retail | | 0.7 | % | |
Machinery | | 0.6 | % | |
Commercial Services & Supplies | | 0.5 | % | |
Construction Materials | | 0.5 | % | |
Electronic Equipment, Instruments & Components | | 0.5 | % | |
Gas Utilities | | 0.5 | % | |
Leisure Equipment & Products | | 0.5 | % | |
Distributors | | 0.4 | % | |
Diversified Financial Services | | 0.4 | % | |
Software | | 0.3 | % | |
Building Products | | 0.2 | % | |
Office Electronics | | 0.2 | % | |
| |
|
| |
Total Investments | | 100.0 | % | |
| |
|
| |
| | |
43 | HSBC INVESTOR PORTFOLIOS | See notes to financial statements. |
|
HSBC INVESTOR OPPORTUNITY PORTFOLIO |
|
Schedule of Portfolio Investments—as of October 31, 2010 |
| | | | | | | |
Common Stocks—97.1% | | | | | | | |
|
|
| | Shares | | Value($) | |
| |
| |
| |
Aerospace & Defense – 2.2% | | | | | | | |
BE Aerospace, Inc. (a) | | | 84,600 | | | 3,109,896 | |
| | | | |
|
| |
Auto Components – 3.3% | | | | | | | |
Gentex Corp. | | | 125,800 | | | 2,513,484 | |
The Goodyear Tire & Rubber Co. (a) | | | 210,800 | | | 2,154,376 | |
| | | | |
|
| |
| | | | | | 4,667,860 | |
| | | | |
|
| |
Biotechnology – 2.9% | | | | | | | |
Alexion Pharmaceuticals, Inc. (a) | | | 59,800 | | | 4,084,340 | |
| | | | |
|
| |
Capital Markets – 1.8% | | | | | | | |
Waddell & Reed Financial, Inc., Class A | | | 87,900 | | | 2,555,253 | |
| | | | |
|
| |
Chemicals – 2.3% | | | | | | | |
Celanese Corp., Series A | | | 89,600 | | | 3,194,240 | |
| | | | |
|
| |
Commercial Banks – 1.0% | | | | | | | |
First Horizon National Corp. (a) | | | 1 | | | 10 | |
Huntington Bancshares, Inc. | | | 247,500 | | | 1,403,325 | |
| | | | |
|
| |
| | | | | | 1,403,335 | |
| | | | |
|
| |
Commercial Services & Supplies – 3.0% | | | | | | | |
Hertz Global Holdings, Inc. (a) | | | 178,900 | | | 2,025,148 | |
Waste Connections, Inc. | | | 52,450 | | | 2,136,813 | |
| | | | |
|
| |
| | | | | | 4,161,961 | |
| | | | |
|
| |
Communications Equipment – 2.0% | | | | | | | |
Brocade Communications Systems, Inc. (a) | | | 430,000 | | | 2,717,600 | |
| | | | |
|
| |
Containers & Packaging – 2.3% | | | | | | | |
Crown Holdings, Inc. (a) | | | 100,800 | | | 3,244,752 | |
| | | | |
|
| |
Diversified Consumer Services – 0.4% | | | | | | | |
New Oriental Education & Technology Group, Inc. ADR (a) | | | 5,200 | | | 558,324 | |
| | | | |
|
| |
Diversified Financial Services – 1.6% | | | | | | | |
MSCI, Inc., Class A (a) | | | 60,800 | | | 2,179,680 | |
| | | | |
|
| |
Electrical Equipment – 2.1% | | | | | | | |
AMETEK, Inc. | | | 53,100 | | | 2,870,055 | |
| | | | |
|
| |
Energy Equipment & Services – 1.3% | | | | | | | |
Exterran Holdings, Inc. (a) | | | 70,000 | | | 1,761,900 | |
| | | | |
|
| |
Food Products – 3.1% | | | | | | | |
Green Mountain Coffee Roasters, Inc. (a) | | | 45,100 | | | 1,487,849 | |
Ralcorp Holdings, Inc. (a) | | | 45,450 | | | 2,820,627 | |
| | | | |
|
| |
| | | | | | 4,308,476 | |
| | | | |
|
| |
Health Care Equipment & Supplies – 3.7% | | | | | | | |
Hill-Rom Holdings, Inc. | | | 84,150 | | | 3,260,812 | |
IDEXX Laboratories, Inc. (a) | | | 31,050 | | | 1,861,758 | |
| | | | |
|
| |
| | | | | | 5,122,570 | |
| | | | |
|
| |
Health Care Providers & Services – 3.2% | | | | | | | |
Community Health Systems, Inc. (a) | | | 60,450 | | | 1,818,336 | |
Coventry Health Care, Inc. (a) | | | 89,200 | | | 2,089,064 | |
Skilled Healthcare Group, Inc., Class A (a) | | | 146,700 | | | 550,125 | |
| | | | |
|
| |
| | | | | | 4,457,525 | |
| | | | |
|
| |
| | | | | | | |
Common Stocks, continued | | | | | | | |
|
|
| | Shares | | Value($) | |
| |
| |
| |
Hotels, Restaurants & Leisure – 4.7% | | | | | | | |
Ctrip.com International Ltd. ADR (a) | | | 59,600 | | | 3,103,372 | |
Scientific Games Corp., Class A (a) | | | 176,700 | | | 1,395,930 | |
WMS Industries, Inc. (a) | | | 48,350 | | | 2,109,510 | |
| | | | |
|
| |
| | | | | | 6,608,812 | |
| | | | |
|
| |
Household Products – 1.5% | | | | | | | |
Church & Dwight Co., Inc. | | | 32,300 | | | 2,126,955 | |
| | | | |
|
| |
Internet Software & Services – 2.2% | | | | | | | |
VeriSign, Inc. (a) | | | 86,200 | | | 2,995,450 | |
| | | | |
|
| |
IT Services – 1.6% | | | | | | | |
Alliance Data Systems Corp. (a) | | | 37,600 | | | 2,283,072 | |
| | | | |
|
| |
Life Sciences Tools & Services – 4.5% | | | | | | | |
Illumina, Inc. (a) | | | 31,250 | | | 1,697,188 | |
Life Technologies Corp. (a) | | | 49,600 | | | 2,488,928 | |
Mettler-Toledo International, Inc. (a) | | | 15,570 | | | 2,032,819 | |
| | | | |
|
| |
| | | | | | 6,218,935 | |
| | | | |
|
| |
Machinery – 5.1% | | | | | | | |
Crane Co. | | | 60,000 | | | 2,295,600 | |
IDEX Corp. | | | 72,100 | | | 2,601,368 | |
Snap-on, Inc. | | | 42,050 | | | 2,144,550 | |
| | | | |
|
| |
| | | | | | 7,041,518 | |
| | | | |
|
| |
Media – 2.5% | | | | | | | |
DreamWorks Animation SKG, Inc. (a) | | | 57,900 | | | 2,043,870 | |
Lamar Advertising Co. (a) | | | 40,400 | | | 1,373,196 | |
| | | | |
|
| |
| | | | | | 3,417,066 | |
| | | | |
|
| |
Metals & Mining – 2.0% | | | | | | | |
Compass Minerals International, Inc. | | | 35,630 | | | 2,810,138 | |
| | | | |
|
| |
Oil, Gas & Consumable Fuels – 9.2% | | | | | | | |
Consol Energy, Inc. | | | 83,880 | | | 3,083,429 | |
Denbury Resources, Inc. (a) | | | 148,700 | | | 2,530,874 | |
Ensco International plc ADR | | | 79,600 | | | 3,688,664 | |
Massey Energy Co. | | | 85,000 | | | 3,575,950 | |
| | | | |
|
| |
| | | | | | 12,878,917 | |
| | | | |
|
| |
Pharmaceuticals – 2.5% | | | | | | | |
Elan Corp. plc ADR (a) | | | 261,700 | | | 1,426,265 | |
Santarus, Inc. (a) | | | 179,200 | | | 560,896 | |
ViroPharma, Inc. (a) | | | 88,800 | | | 1,452,768 | |
| | | | |
|
| |
| | | | | | 3,439,929 | |
| | | | |
|
| |
Real Estate Investment Trusts (REITs) – 1.8% | | | | | | | |
Hospitality Properties Trust | | | 112,900 | | | 2,575,249 | |
| | | | |
|
| |
Road & Rail – 1.7% | | | | | | | |
Landstar System, Inc. | | | 61,650 | | | 2,319,273 | |
| | | | |
|
| |
Semiconductors & Semiconductor Equipment – 6.7% | | | | | | | |
Lam Research Corp. (a) | | | 32,900 | | | 1,506,491 | |
LSI Corp. (a) | | | 418,300 | | | 2,191,892 | |
NXP Semiconductors N.V. (a) | | | 107,500 | | | 1,417,925 | |
ON Semiconductor Corp. (a) | | | 353,300 | | | 2,709,811 | |
Skyworks Solutions, Inc. (a) | | | 67,100 | | | 1,537,261 | |
| | | | |
|
| |
| | | | | | 9,363,380 | |
| | | | |
|
| |
| | |
See notes to financial statements. | HSBC INVESTOR PORTFOLIOS | 44 |
|
HSBC INVESTOR OPPORTUNITY PORTFOLIO |
|
|
Schedule of Portfolio Investments—as of October 31, 2010 (continued) |
| | | | | | | |
Common Stocks, continued |
|
| | | | | | | |
| | Shares | | Value($) | |
| |
| |
| |
Software – 6.0% | | | | | | | |
BMC Software, Inc. (a) | | | 46,550 | | | 2,116,163 | |
Check Point Software Technologies Ltd. (a) | | | 74,750 | | | 3,195,562 | |
Nuance Communications, Inc. (a) | | | 192,950 | | | 3,031,245 | |
| | | | |
|
| |
| | | | | | 8,342,970 | |
| | | | |
|
| |
Specialty Retail – 3.3% | | | | | | | |
Hibbett Sports, Inc. (a) | | | 77,950 | | | 2,100,753 | |
O’Reilly Automotive, Inc. (a) | | | 42,750 | | | 2,500,875 | |
| | | | |
|
| |
| | | | | | 4,601,628 | |
| | | | |
|
| |
Textiles, Apparel & Luxury Goods – 2.1% | | | | | | | |
Fossil, Inc. (a) | | | 50,000 | | | 2,949,500 | |
| | | | |
|
| |
Trading Companies & Distributors – 1.4% | | | | | | | |
WESCO International, Inc. (a) | | | 45,850 | | | 1,963,297 | |
| | | | |
|
| |
Wireless Telecommunication Services – 2.1% | | | | | | | |
NII Holdings, Inc. (a) | | | 71,500 | | | 2,989,415 | |
| | | | |
|
| |
TOTAL COMMON STOCKS
(COST $117,123,678) | | | | | | 135,323,271 | |
| | | | |
|
| |
| | | | | | | |
Investment Company—2.8% | | | | | | | |
|
|
|
|
|
|
|
|
Northern Institutional Government Select
Portfolio, Shares Class, 0.02% (b) | | | 3,971,916 | | | 3,971,916 | |
| | | | |
|
| |
TOTAL INVESTMENT COMPANY
(COST $3,971,916) | | | | | | 3,971,916 | |
| | | | |
|
| |
TOTAL INVESTMENTS
(COST $121,095,594) — 99.9% | | | | | | 139,295,187 | |
| | | | |
|
| |
| | |
|
| |
| Percentages indicated are based on net assets of $139,401,552. |
|
ADR — American Depositary Receipt |
plc — Public Limited Company |
| | |
(a) | Represents non-income producing security. |
| | |
(b) | The rate represents the annualized one-day yield that was in effect on October 31, 2010. |
| | |
45 | HSBC INVESTOR PORTFOLIOS | See notes to financial statements. |
|
HSBC INVESTOR VALUE PORTFOLIO |
|
|
Schedule of Portfolio Investments—as of October 31, 2010 |
| | | | | | | |
Common Stocks—94.2% |
|
| | | | | | | |
| | Shares | | Value($) | |
| |
| |
| |
Aerospace & Defense – 3.7% | | | | | | | |
Lockheed Martin Corp. | | | 18,400 | | | 1,311,736 | |
Raytheon Co. | | | 13,400 | | | 617,472 | |
| | | | |
|
| |
| | | | | | 1,929,208 | |
| | | | |
|
| |
Biotechnology – 4.3% | | | | | | | |
Amgen, Inc. (a) | | | 39,000 | | | 2,230,410 | |
| | | | |
|
| |
Capital Markets – 1.0% | | | | | | | |
Goldman Sachs Group, Inc. | | | 3,200 | | | 515,040 | |
| | | | |
|
| |
Commercial Banks – 2.2% | | | | | | | |
Wells Fargo & Co. | | | 42,700 | | | 1,113,616 | |
| | | | |
|
| |
Commercial Services & Supplies – 1.7% | | | | | | | |
Pitney Bowes, Inc. | | | 39,500 | | | 866,630 | |
| | | | |
|
| |
Communications Equipment – 4.7% | | | | | | | |
Motorola, Inc. (a) | | | 297,700 | | | 2,426,255 | |
| | | | |
|
| |
Diversified Financial Services – 3.8% | | | | | | | |
Citigroup, Inc. (a) | | | 277,000 | | | 1,155,090 | |
JP Morgan Chase & Co. | | | 22,150 | | | 833,505 | |
| | | | |
|
| |
| | | | | | 1,988,595 | |
| | | | |
|
| |
Energy Equipment & Services – 1.3% | | | | | | | |
Halliburton Co. | | | 21,500 | | | 684,990 | |
| | | | |
|
| |
Food & Staples Retailing – 2.1% | | | | | | | |
CVS Caremark Corp. | | | 14,800 | | | 445,776 | |
Kroger Co. (The) | | | 28,200 | | | 620,400 | |
| | | | |
|
| |
| | | | | | 1,066,176 | |
| | | | |
|
| |
Health Care Providers & Services – 1.2% | | | | | | | |
Aetna, Inc. | | | 20,800 | | | 621,088 | |
| | | | |
|
| |
Household Products – 1.3% | | | | | | | |
Kimberly-Clark Corp. | | | 11,000 | | | 696,740 | |
| | | | |
|
| |
Independent Power Producers &
Energy Traders – 1.3% | | | | | | | |
NRG Energy, Inc. (a) | | | 33,800 | | | 672,958 | |
| | | | |
|
| |
Insurance – 16.9% | | | | | | | |
Aon Corp. | | | 38,500 | | | 1,530,375 | |
Genworth Financial, Inc., Class A (a) | | | 81,300 | | | 921,942 | |
Lincoln National Corp. | | | 25,900 | | | 634,032 | |
Loews Corp. | | | 41,240 | | | 1,628,155 | |
MetLife, Inc. | | | 42,000 | | | 1,693,860 | |
The Hartford Financial Services Group, Inc. | | | 43,900 | | | 1,052,722 | |
Unum Group | | | 56,100 | | | 1,257,762 | |
| | | | |
|
| |
| | | | | | 8,718,848 | |
| | | | |
|
| |
Machinery – 1.8% | | | | | | | |
Ingersoll-Rand plc | | | 23,900 | | | 939,509 | |
| | | | |
|
| |
Media – 6.2% | | | | | | | |
CBS Corp., Class B | | | 11,950 | | | 202,313 | |
Time Warner, Inc. | | | 24,900 | | | 809,499 | |
Viacom, Inc., Class B | | | 56,500 | | | 2,180,335 | |
| | | | |
|
| |
| | | | | | 3,192,147 | |
| | | | |
|
| |
| | | | | | | |
Common Stocks, continued |
|
| | | | | |
| | Shares | | Value($) | |
| |
| |
| |
Metals & Mining – 8.2% | | | | | | | |
AngloGold Ashanti Ltd. ADR | | | 40,727 | | | 1,918,649 | |
Barrick Gold Corp. | | | 48,000 | | | 2,308,320 | |
| | | | |
|
| |
| | | | | | 4,226,969 | |
| | | | |
|
| |
Oil, Gas & Consumable Fuels – 13.1% | | | | | | | |
Apache Corp. | | | 19,400 | | | 1,959,788 | |
Canadian Natural Resources Ltd. | | | 32,000 | | | 1,167,040 | |
Hess Corp. | | | 12,100 | | | 762,663 | |
Noble Energy, Inc. | | | 13,310 | | | 1,084,499 | |
Occidental Petroleum Corp. | | | 12,000 | | | 943,560 | |
Talisman Energy, Inc. | | | 46,600 | | | 845,324 | |
| | | | |
|
| |
| | | | | | 6,762,874 | |
| | | | |
|
| |
Pharmaceuticals – 8.5% | | | | | | | |
Merck & Co., Inc. | | | 37,600 | | | 1,364,128 | |
Pfizer, Inc. | | | 92,000 | | | 1,600,800 | |
Sanofi-Aventis ADR | | | 41,500 | | | 1,457,065 | |
| | | | |
|
| |
| | | | | | 4,421,993 | |
| | | | |
|
| |
Road & Rail – 1.7% | | | | | | | |
Union Pacific Corp. | | | 10,000 | | | 876,800 | |
| | | | |
|
| |
Software – 7.2% | | | | | | | |
CA, Inc. | | | 112,800 | | | 2,618,088 | |
Microsoft Corp. | | | 40,900 | | | 1,089,576 | |
| | | | |
|
| |
| | | | | | 3,707,664 | |
| | | | |
|
| |
Tobacco – 2.0% | | | | | | | |
Philip Morris International, Inc. | | | 18,100 | | | 1,058,850 | |
| | | | |
|
| |
TOTAL COMMON STOCKS
(COST $47,273,100) | | | | | | 48,717,360 | |
| | | | |
|
| |
| | | | | | | |
Investment Company—6.5% | | | | | | | |
|
|
|
|
|
|
|
|
Northern Institutional Government Select
Portfolio, Shares Class, 0.02% (b) | | | 3,379,613 | | | 3,379,613 | |
| | | | |
|
| |
TOTAL INVESTMENT COMPANY
(COST $3,379,613) | | | | | | 3,379,613 | |
| | | | |
|
| |
TOTAL INVESTMENTS
(COST $50,652,713) — 100.7% | | | | | | 52,096,973 | |
| | | | |
|
| |
| | |
| |
| Percentages indicated are based on net assets of $51,742,652. |
|
ADR — American Depositary Receipt |
plc — Public Limited Company |
| | |
(a) | Represents non-income producing security. |
| | |
(b) | The rate represents the annualized one-day yield that was in effect on October 31, 2010. |
| | |
See notes to financial statements. | HSBC INVESTOR PORTFOLIOS | 46 |
|
HSBC INVESTOR PORTFOLIOS |
Statements of Assets and Liabilities—as of October 31, 2010 |
| | | | | | | | | | | | | |
| | Growth
Portfolio | | International
Equity
Portfolio | | Opportunity
Portfolio | | Value
Portfolio | |
|
|
|
|
|
|
|
|
|
|
Assets: | | | | | | | | | | | | | |
Investments in non-affiliates, at value | | $ | 98,157,695 | | $ | 40,853,193 | | $ | 139,295,187 | | $ | 52,096,973 | |
Foreign currency, at value | | | — | | | 369,458 | | | — | | | — | |
Dividends receivable | | | 25,966 | | | 127,818 | | | 79,334 | | | 20,518 | |
Receivable for investments sold | | | 1,751,496 | | | 587,832 | | | 682,522 | | | — | |
Prepaid expenses and other assets | | | 103 | | | 354 | | | 153 | | | 60 | |
| |
|
| |
|
| |
|
| |
|
| |
Total Assets | | | 99,935,260 | | | 41,938,655 | | | 140,057,196 | | | 52,117,551 | |
| |
|
| |
|
| |
|
| |
|
| |
|
Liabilities: | | | | | | | | | | | | | |
Cash overdraft | | | — | | | 1,159 | | | — | | | — | |
Payable for investments purchased | | | 1,119,622 | | | 66,237 | | | 539,264 | | | 340,035 | |
Accrued expenses and other liabilities: | | | | | | | | | | | | | |
Investment Management | | | 47,529 | | | 31,785 | | | 92,434 | | | 22,878 | |
Administration | | | 1,938 | | | 821 | | | 2,718 | | | 1,025 | |
Compliance Services | | | 2 | | | 1 | | | 3 | | | 1 | |
Accounting | | | 24 | | | 285 | | | 4 | | | 31 | |
Custodian | | | — | | | 15,958 | | | — | | | — | |
Trustee | | | 167 | | | — | | | 240 | | | 91 | |
Other | | | 15,177 | | | 4,815 | | | 20,981 | | | 10,838 | |
| |
|
| |
|
| |
|
| |
|
| |
Total Liabilities | | | 1,184,459 | | | 121,061 | | | 655,644 | | | 374,899 | |
| |
|
| |
|
| |
|
| |
|
| |
|
Applicable to investors’ beneficial interest | | $ | 98,750,801 | | $ | 41,817,594 | | $ | 139,401,552 | | $ | 51,742,652 | |
| |
|
| |
|
| |
|
| |
|
| |
Total Investments, at cost | | $ | 78,705,605 | | $ | 39,230,308 | | $ | 121,095,594 | | $ | 50,652,713 | |
| |
|
| |
|
| |
|
| |
|
| |
Foreign currency, at cost | | $ | — | | $ | 366,489 | | $ | — | | $ | — | |
| |
|
| |
|
| |
|
| |
|
| |
| | |
47 | HSBC INVESTOR PORTFOLIOS | See notes to financial statements. |
|
HSBC INVESTOR PORTFOLIOS |
Statements of Operations—For the year ended October 31, 2010 |
| | | | | | | | | | | | | |
| | Growth
Portfolio | | International
Equity
Portfolio | | Opportunity
Portfolio | | Value
Portfolio | |
|
|
|
|
|
|
|
|
|
|
Investment Income: | | | | | | | | | | | | | |
Dividends | | $ | 580,486 | | $ | 5,293,058 | | $ | 713,126 | | $ | 764,593 | |
Foreign tax withholding | | | — | | | (726,788 | ) | | — | | | (5,363 | ) |
| |
|
| |
|
| |
|
| |
|
| |
Total Investment Income | | | 580,486 | | | 4,566,270 | | | 713,126 | | | 759,230 | |
| |
|
| |
|
| |
|
| |
|
| |
|
Expenses: | | | | | | | | | | | | | |
Investment Management | | | 520,858 | | | 1,111,069 | | | 1,058,022 | | | 258,230 | |
Administration | | | 19,646 | | | 33,110 | | | 28,676 | | | 10,664 | |
Accounting | | | 44,999 | | | 84,614 | | | 45,232 | | | 44,550 | |
Compliance Services | | | 403 | | | 392 | | | 588 | | | 218 | |
Custodian | | | 8,588 | | | 111,754 | | | 15,459 | | | 3,865 | |
Printing | | | 5,755 | | | 7,077 | | | 7,901 | | | 3,108 | |
Professional | | | 5,846 | | | 3,491 | | | 8,318 | | | 4,615 | |
Trustee | | | 1,370 | | | 2,406 | | | 2,009 | | | 748 | |
Other | | | 7,024 | | | (7,604 | ) | | 8,707 | | | 3,310 | |
| |
|
| |
|
| |
|
| |
|
| |
Total Expenses | | | 614,489 | | | 1,346,309 | | | 1,174,912 | | | 329,308 | |
| |
|
| |
|
| |
|
| |
|
| |
|
Net Investment Income (Loss) | | | (34,003 | ) | | 3,219,961 | | | (461,786 | ) | | 429,922 | |
| |
|
| |
|
| |
|
| |
|
| |
|
Net Realized/Unrealized Gains (Losses) from Investments: | | | | | | | | | | | | | |
Net realized gains (losses) from investments and foreign currency transactions | | | 4,569,747 | | | (24,730,645 | ) | | 17,836,311 | | | 1,033,776 | |
Change in unrealized appreciation/depreciation from investments and foreign currencies | | | 12,751,375 | | | 13,409,621 | | | 17,016,734 | | | 5,043,263 | |
| |
|
| |
|
| |
|
| |
|
| |
|
Net realized/unrealized gains from investments and foreign currency transactions | | | 17,321,122 | | | (11,321,024 | ) | | 34,853,045 | | | 6,077,039 | |
| |
|
| |
|
| |
|
| |
|
| |
Change In Net Assets Resulting From Operations | | $ | 17,287,119 | | $ | (8,101,063 | ) | $ | 34,391,259 | | $ | 6,506,961 | |
| |
|
| |
|
| |
|
| |
|
| |
| | |
See notes to financial statements. | HSBC INVESTOR PORTFOLIOS | 48 |
|
HSBC INVESTOR PORTFOLIOS |
|
Statements of Changes in Net Assets |
| | | | | | | | | | | | | |
| | Growth
Portfolio | | International Equity
Portfolio | |
|
|
|
|
|
|
| | For the
year ended
October 31, 2010 | | For the
year ended
October 31, 2009 | | For the
year ended
October 31, 2010 | | For the
year ended
October 31, 2009 | |
|
|
|
|
|
|
|
|
|
|
|
|
|
|
Investment Activities: | | | | | | | | | | | | | |
Operations: | | | | | | | | | | | | | |
Net investment income (loss) | | $ | (34,003 | ) | $ | 136,286 | | $ | 3,219,961 | | $ | 4,063,044 | |
Net realized gains (losses) from investments transactions | | | 4,569,747 | | | (12,681,042 | ) | | (24,730,645 | ) | | (72,712,532 | ) |
Change in unrealized appreciation/depreciation from investments and foreign currencies | | | 12,751,375 | | | 26,751,782 | | | 13,409,621 | | | 109,291,830 | |
| |
|
| |
|
| |
|
| |
|
| |
Change in net assets resulting from operations | | | 17,287,119 | | | 14,207,026 | | | (8,101,063 | ) | | 40,642,342 | |
| |
|
| |
|
| |
|
| |
|
| |
Proceeds from contributions | | | 10,138,077 | | | 8,763,453 | | | 15,234,642 | | | 23,984,676 | |
Value of withdrawals | | | (16,837,279 | ) | | (16,749,107 | ) | | (182,464,190 | ) | | (46,787,723 | ) |
| |
|
| |
|
| |
|
| |
|
| |
Change in net assets resulting from transactions in investors’ beneficial interest | | | (6,699,202 | ) | | (7,985,654 | ) | | (167,229,548 | ) | | (22,803,047 | ) |
| |
|
| |
|
| |
|
| |
|
| |
Change in net assets | | | 10,587,917 | | | 6,221,372 | | | (175,330,611 | ) | | 17,839,295 | |
| | | | | | | | | | | | | |
|
Net Assets: | | | | | | | | | | | | | |
Beginning of period | | | 88,162,884 | | | 81,941,512 | | | 217,148,205 | | | 199,308,910 | |
| |
|
| |
|
| |
|
| |
|
| |
End of period | | $ | 98,750,801 | | $ | 88,162,884 | | $ | 41,817,594 | | $ | 217,148,205 | |
| |
|
| |
|
| |
|
| |
|
| |
| | |
49 | HSBC INVESTOR PORTFOLIOS | See notes to financial statements. |
|
HSBC INVESTOR PORTFOLIOS |
|
Statements of Changes in Net Assets (continued) |
| | | | | | | | | | | | | |
| | Opportunity
Portfolio | | Value
Portfolio | |
|
|
|
|
|
|
| | For the
year ended
October 31, 2010 | | For the
year ended
October 31, 2009 | | For the
year ended
October 31, 2010 | | For the
year ended
October 31, 2009 | |
|
|
|
|
|
|
|
|
|
|
|
|
|
|
Investment Activities: | | | | | | | | | | | | | |
Operations: | | | | | | | | | | | | | |
Net investment income (loss) | | $ | (461,786 | ) | $ | (424,078 | ) | $ | 429,922 | | $ | 644,544 | |
Net realized gains (losses) from investments transactions | | | 17,836,311 | | | (15,580,861 | ) | | 1,033,776 | | | (1,577,886 | ) |
Change in unrealized appreciation/depreciation from investments and foreign currencies | | | 17,016,734 | | | 31,798,950 | | | 5,043,263 | | | 9,018,297 | |
| |
|
| |
|
| |
|
| |
|
| |
Change in net assets resulting from operations | | | 34,391,259 | | | 15,794,011 | | | 6,506,961 | | | 8,084,955 | |
| |
|
| |
|
| |
|
| |
|
| |
Proceeds from contributions | | | 10,306,391 | | | 8,367,302 | | | 6,794,273 | | | 4,852,585 | |
Value of withdrawals | | | (35,044,419 | ) | | (22,382,631 | ) | | (11,244,738 | ) | | (12,914,556 | ) |
| |
|
| |
|
| |
|
| |
|
| |
Change in net assets resulting from transactions in investors’ beneficial interest | | | (24,738,028 | ) | | (14,015,329 | ) | | (4,450,465 | ) | | (8,061,971 | ) |
| |
|
| |
|
| |
|
| |
|
| |
Change in net assets | | | 9,653,231 | | | 1,778,682 | | | 2,056,496 | | | 22,984 | |
| | | | | | | | | | | | | |
Net Assets: | | | | | | | | | | | | | |
Beginning of period | | | 129,748,321 | | | 127,969,639 | | | 49,686,156 | | | 49,663,172 | |
| |
|
| |
|
| |
|
| |
|
| |
End of period | | $ | 139,401,552 | | $ | 129,748,321 | | $ | 51,742,652 | | $ | 49,686,156 | |
| |
|
| |
|
| |
|
| |
|
| |
| | |
See notes to financial statements. | HSBC INVESTOR PORTFOLIOS | 50 |
|
HSBC INVESTOR PORTFOLIOS |
|
Financial Highlights |
| | | | | | | | | | | | | | | | | | | | | |
| | | | | Ratio/Supplementary Data | |
| | | | |
|
|
| | Total
Return | | Net Assets
at End of
Period
(000’s) | | Ratio of Net
Expenses
to Average
Net Assets | | Ratio of Net
Investment
Income (Loss)
to Average
Net Assets | | Ratio of
Expenses
to Average
Net Assets(a) | | Portfolio
Turnover | |
|
|
|
|
|
|
|
|
|
|
|
|
|
|
GROWTH PORTFOLIO | | | | | | | | | | | | | | | | | | | | | |
Year Ended October 31, 2006 | | 7.53 | % | | | $ | 59,828 | | | 0.69 | % | | 0.38 | % | | 0.69 | % | | 75.06 | % | |
Year Ended October 31, 2007 | | 31.11 | % | | | | 89,686 | | | 0.62 | % | | 0.45 | % | | 0.62 | % | | 57.04 | % | |
Year Ended October 31, 2008 | | (37.75 | )%(b) | | | | 81,942 | | | 0.62 | % | | 0.19 | % | | 0.62 | % | | 157.87 | % | |
Year Ended October 31, 2009 | | 19.31 | % | | | | 88,163 | | | 0.69 | % | | 0.17 | % | | 0.69 | % | | 65.67 | % | |
Year Ended October 31, 2010 | | 20.34 | % | | | | 98,751 | | | 0.68 | % | | (0.04 | )% | | 0.68 | % | | 89.14 | % | |
|
|
|
|
|
|
|
|
|
|
|
|
|
|
|
|
|
|
|
|
|
|
INTERNATIONAL EQUITY PORTFOLIO | | | | | | | | | | | | | | |
Year Ended October 31, 2006 | | 32.79 | % | | | | 333,755 | | | 0.86 | % | | 2.03 | % | | 0.86 | % | | 33.39 | % | |
Year Ended October 31, 2007 | | 25.17 | % | | | | 455,062 | | | 0.79 | % | | 2.16 | % | | 0.79 | % | | 26.08 | % | |
Year Ended October 31, 2008 | | (51.79 | )% | | | | 199,309 | | | 0.76 | % | | 2.65 | % | | 0.76 | % | | 28.98 | % | |
Year Ended October 31, 2009 | | 24.16 | % | | | | 217,148 | | | 0.88 | % | | 2.23 | % | | 0.88 | % | | 58.31 | % | |
Year Ended October 31, 2010 | | 6.15 | % | | | | 41,818 | | | 0.87 | % | | 2.07 | % | | 0.87 | % | | 63.35 | % | |
|
|
|
|
|
|
|
|
|
|
|
|
|
|
|
|
|
|
|
|
|
|
OPPORTUNITY PORTFOLIO | | | | | | | | | | | | | | | | | |
Year Ended October 31, 2006 | | 19.54 | % | | | | 241,495 | | | 0.91 | % | | (0.40 | )% | | 0.91 | % | | 60.83 | % | |
Year Ended October 31, 2007 | | 30.54 | % | | | | 224,268 | | | 0.91 | % | | (0.55 | )% | | 0.91 | % | | 69.41 | % | |
Year Ended October 31, 2008 | | (35.30 | )% | | | | 127,970 | | | 0.87 | % | | (0.46 | )% | | 0.87 | % | | 80.42 | % | |
Year Ended October 31, 2009 | | 15.41 | % | | | | 129,748 | | | 0.90 | % | | (0.37 | )% | | 0.90 | % | | 64.91 | % | |
Year Ended October 31, 2010 | | 28.74 | % | | | | 139,402 | | | 0.89 | % | | (0.35 | )% | | 0.89 | % | | 67.62 | % | |
|
|
|
|
|
|
|
|
|
|
|
|
|
|
|
|
|
|
|
|
|
|
VALUE PORTFOLIO | | | | | | | | | | | | | | | | | | | | | |
Year Ended October 31, 2006 | | 22.21 | % | | | | 67,432 | | | 0.71 | % | | 1.23 | % | | 0.71 | % | | 20.63 | % | |
Year Ended October 31, 2007 | | 10.28 | % | | | | 82,658 | | | 0.66 | % | | 1.29 | % | | 0.66 | % | | 18.67 | % | |
Year Ended October 31, 2008 | | (39.91 | )% | | | | 49,663 | | | 0.64 | % | | 1.54 | % | | 0.64 | % | | 24.61 | % | |
Year Ended October 31, 2009 | | 20.05 | % | | | | 49,686 | | | 0.68 | % | | 1.41 | % | | 0.68 | % | | 19.77 | % | |
Year Ended October 31, 2010 | | 13.56 | % | | | | 51,743 | | | 0.67 | % | | 0.87 | % | | 0.67 | % | | 26.36 | % | |
|
|
|
|
|
|
|
|
|
|
|
|
|
|
|
|
|
|
|
|
|
|
| |
(a) | Excludes fee reductions. If such fee reductions had not occurred, the ratio would have been as indicated. |
| |
(b) | During the year ended October 31, 2008, Winslow Capital Management, Inc. reimbursed $64,658 to the Growth Portfolio related to violations of certain investment policies and limitations. The corresponding impact to the total return was 0.08%. |
| | |
51 | HSBC INVESTOR PORTFOLIOS | See notes to financial statements. |
|
HSBC INVESTOR PORTFOLIOS |
|
Notes to Financial Statements—as of October 31, 2010 |
| |
1. | Organization: |
| |
| The HSBC Investor Portfolios (the “Portfolio Trust’’), is an open-end management investment company organized as a New York trust under the laws of the State of New York on November 1, 1994. The Portfolio Trust contains the following master funds (individually a “Portfolio,’’ collectively the “Portfolios’’): |
| | | | |
| Portfolio | | Short Name | |
|
| |
| |
| HSBC Investor Growth Portfolio | Growth Portfolio |
| HSBC Investor International Equity Portfolio | International Equity Portfolio |
| HSBC Investor Opportunity Portfolio | Opportunity Portfolio |
| HSBC Investor Value Portfolio | Value Portfolio |
| |
| The Portfolios operate as master funds in master-feeder arrangements, in which other funds invest all or part of their investable assets in the Portfolios. The Portfolios also receive investments from funds of funds. The Declaration of Trust permits the Board of Trustees to issue an unlimited number of beneficial interests in the Portfolios. |
| |
| The Portfolios are diversified series of the Portfolio Trust and are part of the HSBC Investor Family of Funds. Financial statements for all other funds of the HSBC Investor Family of Funds are published separately. |
| |
| Under the Portfolio Trust’s organizational documents, the Portfolio Trust’s Officers and Trustees are indemnified against certain liabilities arising out of the performance of their duties to the Portfolios. In addition, in the normal course of business, the Portfolio Trust may enter into contracts with its service providers, which also provide for indemnifications by the Portfolios. The Portfolios’ maximum exposure under these arrangements is unknown as this would involve any future claims that may be made against the Portfolios. However, based on experience, the Portfolio Trust expects that risk of loss to be remote. |
| |
2. | Significant Accounting Policies: |
| |
| The following is a summary of the significant accounting policies followed by the Portfolios in the preparation of their financial statements. The policies are in conformity with U.S. generally accepted accounting principles (“GAAP’’). The preparation of financial statements requires management to make certain estimates and assumptions that affect the reported amounts of assets and liabilities and disclosure of contingent assets and liabilities at the date of the financial statements and the reported amounts of increases and decreases in net assets from operations during the reporting period. Actual results could differ from those estimates. Management has evaluated events and transactions through the date the financial statements were available to be issued, for purposes of recognition or disclosure in these financial statements. |
| |
| Securities Valuation: |
| |
| The Portfolios record their investments at fair value. Fair value is defined as the price that would be received to sell an asset or paid to transfer a liability in an orderly transaction between market participants at the measurement date. The valuation techniques used to determine fair value are further described in Note 3 below. |
| |
| Investment Transactions and Related Income: |
| |
| Investment transactions are accounted for no later than one business day after trade date. For financial reporting purposes, changes in holdings are accounted for on trade date on the last business day of the reporting period. Investment gains and losses are calculated on the identified cost basis. Interest income is recognized on the accrual basis and includes, where applicable, the amortization or accretion of premium or discount. Dividend income is recorded on the ex-dividend date. |
| |
| Foreign Currency Translation: |
| |
| The accounting records of the Portfolios are maintained in U.S. dollars. Foreign currency amounts are translated into U.S. dollars at the current rate of exchange to determine the value of investments, assets and liabilities. Purchases and sales of securities, and income and expenses are translated at the prevailing rate of exchange on the respective dates of such transactions. The Portfolios do not isolate the portion of the results of operations resulting from changes in foreign exchange rates on investments from fluctuations arising from changes in market prices of securities held. Such fluctuations are included with the net realized and unrealized gain or loss from investments and foreign currencies. |
| | |
| HSBC INVESTOR PORTFOLIOS | 52 |
|
HSBC INVESTOR PORTFOLIOS |
|
Notes to Financial Statements—as of October 31, 2010 |
| |
| Expense Allocations: |
| |
| Expenses directly attributable to a Portfolio are charged to that Portfolio. Expenses not directly attributable to a Portfolio are allocated proportionally among various or all funds within the HSBC Investor Family of Funds in relation to net assets or on another reasonable basis. |
| |
| Federal Income Taxes: |
| |
| Each Portfolio will be treated as a partnership for U.S. Federal income tax purposes. Accordingly, each Portfolio passes through all of its net investment income and gains and losses to its feeder funds, and is therefore not subject to U.S. Federal income tax. As such, investors in the Portfolios will be taxed on their respective share of the Portfolios’ ordinary income and realized gains. It is intended that the Portfolios will be managed in such a way that an investor will be able to satisfy the requirements of the Internal Revenue Code applicable to regulated investment companies. |
| |
| Management of the Portfolios has reviewed tax positions taken in tax years that remain subject to examination by all major tax jurisdictions, including federal (i.e., the last four tax year ends and the interim tax period since then, as applicable). Management believes that there is no tax liability resulting from unrecognized tax benefits related to uncertain tax positions taken. |
| |
| Derivative Instruments |
| |
| All open derivative positions at year end are reflected on the Portfolio’s Schedule of Portfolio Investments. The following is a description of the derivative instruments utilized by the Fund, including the primary underlying risk exposures related to each instrument type. |
| |
| Foreign Currency Exchange Contracts: |
| |
| Each Portfolio may enter into foreign currency exchange contracts. The Portfolios enter into foreign currency exchange contracts in connection with planned purchases or sales of securities or to hedge the U.S. dollar value of securities denominated in a particular currency. In addition to the foreign currency risk related to the use of these contracts, the Portfolios could be exposed to risks if the counterparties to the contracts are unable to meet the terms of their contracts and from unanticipated movements in the value of a foreign currency relative to the U.S. dollar. The foreign currency exchange contracts are adjusted by the daily exchange rate of the underlying currency and any gains or losses are recorded for financial statement purposes as unrealized gains or losses until the contract settlement date. For the year ended October 31, 2010, the International Equity Portfolio entered into foreign currency exchange contracts to hedge the U.S. dollar value of securities denominated in a particular currency. As of October 31, 2010, the Portfolios did not hold any foreign currency exchange contracts. For the year ended October 31, 2010, the monthly average contract amount of foreign exchange contracts held by the International Equity Portfolio was $6.24 million. |
| |
| Futures Contracts: |
| |
| Each Portfolio may invest in futures contracts. The Portfolios use futures contracts for the purpose of hedging their existing portfolio securities or securities they intend to purchase against fluctuations in fair value caused by changes in prevailing market interest rates. Upon entering into a futures contract, the Portfolio is required to pledge to the broker an amount of cash and/or other assets equal to a certain percentage of the contract amount (initial margin deposit). Subsequent payments, known as “variation margin,’’ are made or received by the Portfolio each day, depending on the daily fluctuations in the fair value of the underlying security. The Portfolio recognizes a gain or loss equal to the daily variation margin. Should market conditions move unexpectedly, the Portfolio may not achieve the anticipated benefits of the futures contracts and may realize a loss. Futures contracts involve, to varying degrees, elements of market risk (generally equity price risk related to stock futures, interest rate risk related to bond futures, and foreign currency risk related to currency futures) and exposure to loss in excess of the variation margin. The primary risks associated with the use of futures contracts are the imperfect correlation between the change in market value of the securities held by the Portfolios and the prices of futures contracts, the possibility of an illiquid market, and the inability of the counterparty to meet the terms of the contract. For the year ended October 31, 2010, the Portfolios did not hold any futures contracts. |
| |
53 | HSBC INVESTOR PORTFOLIOS |
|
HSBC INVESTOR PORTFOLIOS |
|
Notes to Financial Statements—as of October 31, 2010 (continued) |
| |
| Summary of Derivative Instruments: |
| |
| The following is a summary of the fair value of derivative instruments for the International Equity Portfolio as of October 31, 2010: |
| | | | | | | | | |
| | Asset Derivatives | | Liability Derivatives | |
| |
| |
| |
Primary Risk Exposure | | Statements of Assets
and Liabilities
Location | | Total Fair
Value* | | Statements of Assets
and Liabilities
Location | | Total Fair
Value* | |
| |
| |
| |
| |
| |
Foreign Currency Exchange Contracts | | Unrealized appreciation on foreign currency exchange contracts | | $— | | Unrealized depreciation on foreign currency exchange contracts | | $— | |
| | |
|
|
| * | Total Fair Value is presented by Primary Risk Exposure. For foreign currency exchange contracts, such amounts represent the unrealized gain/appreciation (for asset derivatives) or loss/depreciation (for liability derivatives). |
| |
| The derivative instruments had the following impact on the Statements of Operations for the International Equity Portfolio for the period ended October 31, 2010: |
| | | | | | | |
Primary Risk Exposure | | Location of
Gain (Loss)
on Derivatives
Recognized in Income | | Realized
Gain (Loss)
on Derivatives
Recognized in Income | | Change in Unrealized
Appreciation/Depreciation
on Derivatives
Recognized in Income | |
| |
| |
| |
| |
Foreign Currency Exchange Contracts | | Net realized gains (losses) from investments and foreign currency transactions/change in unrealized appreciation/depreciation on investments and foreign currencies | | $563,265 | | $5,279 | |
| |
3. | Investment Valuation Summary: |
|
| The valuation techniques employed by the Portfolios, as described below, maximize the use of observable inputs and minimize the use of unobservable inputs in determining fair value. The inputs used for valuing the Portfolios’ investments are summarized in the three broad levels listed below: |
| | |
| • | Level 1: quoted prices in active markets for identical assets |
| | |
| • | Level 2: other significant observable inputs (including quoted prices for similar securities, interest rates, prepayments speeds, credit risk, etc.) |
| | |
| • | Level 3: significant unobservable inputs (including the Portfolio’s own assumptions in determining the fair value of investments) |
| |
| The inputs or methodology used for valuing investments are not necessarily an indication of the risk associated with investing in those investments. |
| |
| Exchange traded, domestic equity securities are valued at the last sales price on a national securities exchange, or in the absence of recorded sales, at the readily available closing bid price on such exchanges, or at the quoted bid price in the over-the-counter market and are typically categorized as Level 1 in the fair value hierarchy. |
| |
| Exchange traded, foreign equity securities are valued in the appropriate currency on the last quoted sale price and are typically categorized as Level 1 in the fair value hierarchy. Foreign equity securities that are not exchanged traded are valued in the appropriate currency at the average of the quoted bid and asked prices in the over-the-counter market and are typically categorized as Level 2 in the fair value hierarchy. |
| |
| Shares of exchange traded and closed-end registered investment companies are valued in the same manner as other equity securities and are typically categorized as Level 1 in the fair value hierarchy. Mutual funds are valued at their net asset values, as reported by such companies and are typically categorized as Level 1 in the fair value hierarchy. |
| |
HSBC INVESTOR PORTFOLIOS | 54 |
|
HSBC INVESTOR PORTFOLIOS |
|
Notes to Financial Statements—as of October 31, 2010 (continued) |
| |
| Exchange traded futures contracts are valued at their settlement price on the exchange on which they are traded and are typically categorized as Level 1 in the fair value hierarchy. Forward foreign currency contracts are generally valued at the foreign currency exchange rate as of the close of the New York Stock Exchange and are typically categorized as Level 2 in the fair value hierarchy. Repurchase agreements are valued at original cost and are typically categorized as Level 2 in the fair value hierarchy. |
| |
| Securities or other assets for which market quotations are not readily available, or are deemed unreliable due to a significant event or otherwise, are valued pursuant to procedures adopted by the Portfolio Trust’s Board of Trustees. Depending on the source and relative significance of valuation inputs, these instruments may be classified as Level 2 or Level 3 in the fair value hierarchy. Examples of potentially significant events that could affect the value of an individual security and thus require pricing under the procedures include corporate actions by the issuer, announcements by the issuer relating to its earnings or products, regulatory news, natural disasters, and litigation. Examples of potentially significant events that could affect multiple securities held by a Portfolio include governmental actions, natural disasters, and armed conflicts. In addition, if events materially affecting the value of foreign securities occur between the time when the exchange on which they are traded closes and the time when the Portfolios’ net assets are calculated, such securities may be valued using fair value pricing in accordance with procedures adopted by the Board of Trustees. Management identifies possible fluctuations in foreign securities by monitoring the rise or fall in the value of a designated benchmark index. In the event of a rise or fall greater than predetermined levels, the International Equity Portfolio may use a systematic valuation model provided by an independent third party to value its foreign securities, rather than local market closing prices. When the International Equity Portfolio uses such a valuation model, the value assigned to the International Equity Portfolio’s foreign securities may not be the quoted or published prices of the investment on their primary markets or exchanges and are typically categorized as Level 2 in the fair value hierarchy. The valuation of these securities may represent a transfer between Levels 1 and 2. The number of days on which fair value prices will be used will depend on market activity and it is possible that fair value prices will be used by the International Equity Portfolio to a significant extent. |
| |
55 | HSBC INVESTOR PORTFOLIOS |
|
HSBC INVESTOR PORTFOLIOS |
|
Notes to Financial Statements—as of October 31, 2010 (continued) |
| |
| For the year ended October 31, 2010, there were no Level 3 investments for which significant unobservable inputs were used to determine fair value. |
| |
| The following is a summary of the valuation inputs used as of October 31, 2010 in valuing the Portfolios’ investments based upon three levels defined above: |
| | | | | | | | | | | | | |
| | LEVEL 1 | | LEVEL 2 | | LEVEL 3 | | Total | |
| |
| |
| |
| |
| |
Growth Portfolio | | | | | | | | | | | | | |
Investment Securities: | | | | | | | | | | | | | |
Common Stocks (a) | | $ | 96,843,545 | | $ | — | | $ | — | | $ | 96,843,545 | |
Investment Companies | | | 1,314,150 | | | — | | | — | | | 1,314,150 | |
| |
|
| |
|
| |
|
| |
|
| |
Total Investment Securities | | $ | 98,157,695 | | $ | — | | $ | — | | $ | 98,157,695 | |
| |
|
| |
|
| |
|
| |
|
| |
| | | | | | | | | | | | | |
International Equity Portfolio | | | | | | | | | | | | | |
Investment Securities: | | | | | | | | | | | | | |
Common Stocks: (+) | | | | | | | | | | | | | |
Brazil | | $ | 528,105 | | $ | — | | $ | — | | $ | 528,105 | |
Canada | | | 2,024,591 | | | — | | | — | | | 2,024,591 | |
Kazakhstan | | | 121,260 | | | — | | | — | | | 121,260 | |
Russian Federation | | | 122,752 | | | — | | | — | | | 122,752 | |
South Korea | | | 165,187 | | | 419,856 | | | — | | | 585,043 | |
All other Common Stocks (b) | | | — | | | 37,080,228 | | | — | | | 37,080,228 | |
Investment Companies | | | 391,214 | | | — | | | — | | | 391,214 | |
| |
|
| |
|
| |
|
| |
|
| |
Total Investment Securities | | $ | 3,353,109 | | $ | 37,500,084 | | $ | — | | $ | 40,853,193 | |
| |
|
| |
|
| |
|
| |
|
| |
| | | | | | | | | | | | | |
Opportunity Portfolio | | | | | | | | | | | | | |
Investment Securities: | | | | | | | | | | | | | |
Common Stocks (a) | | $ | 135,323,271 | | $ | — | | $ | — | | $ | 135,323,271 | |
Investment Companies | | | 3,971,916 | | | — | | | — | | | 3,971,916 | |
| |
|
| |
|
| |
|
| |
|
| |
Total Investment Securities | | $ | 139,295,187 | | $ | — | | $ | — | | $ | 139,295,187 | |
| |
|
| |
|
| |
|
| |
|
| |
| | | | | | | | | | | | | |
Value Portfolio | | | | | | | | | | | | | |
Investment Securities: | | | | | | | | | | | | | |
Common Stocks (a) | | $ | 48,717,360 | | $ | — | | $ | — | | $ | 48,717,360 | |
Investment Companies | | | 3,379,613 | | | — | | | — | | | 3,379,613 | |
| |
|
| |
|
| |
|
| |
|
| |
Total Investment Securities | | $ | 52,096,973 | | $ | — | | $ | — | | $ | 52,096,973 | |
| |
|
| |
|
| |
|
| |
|
| |
| | | |
| |
|
| | (a) | For detailed industry descriptions, see the accompanying Schedules of Portfolio Investments. |
| | | |
| | (b) | For detailed country descriptions, see the accompanying Schedules of Portfolio Investments. |
| | | |
| | (+) | Based on the domicile of the security issuer. |
| | | |
| The Trust recognizes significant transfers between fair value hierarchy levels at the reporting period end. The only significant transfers between Levels 1 and 2 as of October 31, 2010 are related to the use of the systematic valuation model to value foreign securities in the International Equity Portfolio. |
| | | |
4. | Related Party Transactions: |
| | | |
| Investment Management: |
| | | |
| HSBC Global Asset Management (USA) Inc. (“HSBC’’ or the “Investment Adviser’’), a wholly owned subsidiary of HSBC Bank USA, N.A., a national bank organized under the laws of the United States, acts as the Investment Adviser to the Portfolios pursuant to an investment management contract with the Portfolio Trust. As Investment Adviser, HSBC manages the investments of the Portfolios and continuously reviews, supervises, and administers the Portfolios’ investments, except that Winslow Capital Management, Inc., AllianceBernstein L.P., Westfield Capital Management Company, L.P. and NWQ Investment Management Company, LLC serve as Sub-Investment Advisers for the Growth Portfolio, International |
| |
HSBC INVESTOR PORTFOLIOS | 56 |
|
HSBC INVESTOR PORTFOLIOS |
|
Notes to Financial Statements—as of October 31, 2010 (continued) |
| |
| Equity Portfolio, Opportunity Portfolio, and the Value Portfolio, respectively, and are paid for their services directly by the respective Portfolios. |
| |
| For their services, the Investment Adviser and Winslow Capital Management, Inc. (“Winslow”) receive in aggregate, from the Growth Portfolio, a fee, accrued daily and paid monthly, at an annual rate of: |
| | | | |
Based on Average Daily Net Assets of all Sub-Adviser serviced funds and separate accounts affiliated with HSBC: | | Fee Rate* | |
| |
| |
Up to $250 million | | 0.575 | % | |
In excess of $250 million but not exceeding $500 million | | 0.525 | % | |
In excess of $500 million but not exceeding $750 million | | 0.475 | % | |
In excess of $750 million but not exceeding $1 billion | | 0.425 | % | |
In excess of $1 billion | | 0.375 | % | |
| | |
|
|
| * | The Growth Portfolio may pay the Investment Adviser and Winslow an aggregate maximum fee of up to 0.68%. Currently, the Investment Adviser’s contractual fee is 0.175% and Winslow’s maximum contractual fee is 0.40%. Accordingly, the current aggregate maximum fee rate is 0.575%. |
| |
| For their services, the Investment Adviser and AllianceBernstein L.P. receive in aggregate, from the International Equity Portfolio, a fee, accrued daily and paid monthly, at an annual rate of: |
| | | | |
Based on Average Daily Net Assets of: | | Fee Rate | |
| |
| |
Up to $10 million | | 1.015 | % | |
In excess of $10 million but not exceeding $25 million | | 0.925 | % | |
In excess of $25 million but not exceeding $50 million | | 0.79 | % | |
In excess of $50 million but not exceeding $100 million | | 0.70 | % | |
In excess of $100 million | | 0.61 | % | |
| |
| For their services, the Investment Adviser and Westfield Capital Management Company, L.P. receive in aggregate, a fee, accrued daily and paid monthly, at an annual rate of 0.80% of the Opportunity Portfolio’s average daily net assets. |
| |
| For their services, the Investment Adviser and NWQ Investment Management Company, LLC receive in aggregate, from the Value Portfolio, a fee, accrued daily and paid monthly, at an annual rate of: |
| | | | |
Based on Average Daily Net Assets of | | Fee Rate | |
| |
| |
Up to $500 million | | 0.525 | % | |
In excess of $500 million but not exceeding $1 billion | | 0.475 | % | |
In excess of $1 billion | | 0.425 | % | |
| |
| Any voluntary fee waivers/reimbursements are not subject to recoupment in subsequent fiscal periods. Voluntary waiver/reimbursements may be stopped at any time. |
| |
| Administration: |
| |
| HSBC serves the Portfolios as Administrator. Under the terms of the Administration Agreement, HSBC receives from the Portfolios (as well as the other funds in the HSBC Investor Family of Funds) a fee, accrued daily and paid monthly at annual rate of: |
| | | | |
Based on Average Daily Net Assets of | | Fee Rate | |
| |
| |
Up to $10 billion | | 0.0550 | % | |
In excess of $10 billion but not exceeding $20 billion | | 0.0350 | % | |
In excess of $20 billion but not exceeding $50 billion | | 0.0275 | % | |
In excess of $50 billion | | 0.0250 | % | |
| |
| The fee rates and breakpoints are determined on the basis of the aggregate average daily net assets of the HSBC Investor Family of Funds, however, the assets of the Portfolios and HSBC Investor Funds that invest in the Portfolios are not double-counted. The total administration fee paid to HSBC is allocated to each series in the HSBC Investor Family of Funds based upon its proportionate share of the aggregate net assets of the Family of Funds. For assets invested in the Portfolios by the HSBC Investor Funds, the Portfolios pay half of the administration fee and the other funds pay half of the administration fee, for a combination of the total fee rate set forth above. Certain administrative fees of the Portfolios also may be received by treating them as apportioned in part to other funds makes investments in the Portfolios a master-feeder structure. |
| |
57 | HSBC INVESTOR PORTFOLIOS |
|
HSBC INVESTOR PORTFOLIOS |
|
Notes to Financial Statements—as of October 31, 2010 (continued) |
| |
| Pursuant to a Sub-Administration Agreement with HSBC, Citi Fund Services Ohio, Inc. (“Citi Ohio’’), a wholly-owned subsidiary of Citigroup, Inc., serves as the Portfolio Trust’s Sub-Administrator subject to the general supervision of the Portfolio Trust’s Board of Trustees and HSBC. For these services, Citi Ohio is entitled to a fee, payable by HSBC, at an annual rate equivalent to the fee rates set forth above, minus 0.02% (2 basis points) which is retained by HSBC. |
| |
| Under a Compliance Services Agreement between the Portfolio Trust and the other HSBC Investor Funds (the “Trusts”) and Citi Ohio (the “CCO Agreement’’), Citi Ohio makes an employee available to serve as the Trusts’ Chief Compliance Officer (the “CCO’’). Under the CCO Agreement, Citi Ohio also provides infrastructure and support in implementing the written policies and procedures comprising the Portfolios’ compliance program, including support services to the CCO. For the services provided under the CCO Agreement, the HSBC Investor Family of Funds paid Citi Ohio $269,869 for the year ended October 31, 2010, plus reimbursement of certain expenses. Expenses incurred by each Portfolio are reflected on the Statements of Operations as “Compliance Services.’’ Citi Ohio pays the salary and other compensation earned by individuals as employees of Citi Ohio. |
| |
| Fund Accounting and Trustees: |
| |
| Citi Ohio provides fund accounting services for the Portfolio Trust. For its services to the Portfolios, Citi Ohio receives an annual fee per portfolio, including reimbursement of certain expenses, that is accrued daily and paid monthly. |
| |
| Each non-interested Trustee is compensated with a $60,000 annual Board retainer for services as a Trustee of the HSBC Investor Family of Funds (or the “Trusts”), as well as a $3,000 annual retainer for each Committee of the Board of the Trusts. Each non-interested Trustee also receives a $5,000 and $3,000 meeting fee for each regular in-person Board meeting and Committee meeting, respectively. Furthermore, each non-interested Trustee receives compensation for attending special meetings and/or functioning as a Committee or Board Chairperson. In addition, the non-interested Trustees are reimbursed for certain expenses incurred in connection with their Board membership. |
| |
5. | Investment Transactions: |
| |
| Cost of purchases and proceeds from sales of securities (excluding securities maturing less than one year from acquisition) for the year ended October 31, 2010 were as follows: |
| | | | | | | |
Portfolio Name | | Purchases
(excluding U.S.
Government) | | Sales
(excluding U.S.
Government) | |
| |
| |
| |
Growth Portfolio | | $ | 78,285,103 | | $ | 82,782,432 | |
International Equity Portfolio | | | 94,911,257 | | | 123,210,909 | |
Opportunity Portfolio | | | 86,072,250 | | | 105,288,751 | |
Value Portfolio | | | 12,420,582 | | | 17,955,334 | |
| |
| For the year ended October 31, 2010, there were no long-term U.S. Government securities held by the Portfolio Trust. |
| |
6. | Federal Income Tax Information: |
| |
| At October 31, 2010, the cost basis of securities for federal income tax purposes, gross unrealized appreciation, gross unrealized depreciation and net unrealized appreciation/depreciation were as follows: |
| | | | | | | | | | | | | |
Fund | | Tax Cost | | Tax Unrealized
Appreciation | | Tax Unrealized
Depreciation | | Net Unrealized
Appreciation
(Depreciation)* | |
| |
| |
| |
| |
| |
Growth Portfolio | | $ | 79,283,771 | | $ | 18,873,924 | | $ | — | | $ | 18,873,924 | |
International Equity Portfolio | | | 39,386,379 | | | 3,376,252 | | | (1,909,438 | ) | | 1,466,814 | |
Opportunity Portfolio | | | 124,125,662 | | | 23,999,412 | | | (8,829,887 | ) | | 15,169,525 | |
Value Portfolio | | | 50,811,505 | | | 6,302,313 | | | (5,016,845 | ) | | 1,285,468 | |
| | |
|
|
| * | The difference between book-basis unrealized appreciation (depreciation) is attributable primarily to tax deferral of losses on wash sales. |
| |
HSBC INVESTOR PORTFOLIOS | 58 |
|
HSBC INVESTOR PORTFOLIOS |
|
Notes to Financial Statements—as of October 31, 2010 (continued) |
| |
7. | Legal and Regulatory Matters: |
| |
| On September 26, 2006 BISYS Fund Services, Inc. (“BISYS’’), an affiliate of BISYS Fund Services Ohio, Inc. which provided various services to the Portfolios, reached a settlement with the Securities and Exchange Commission (the “SEC’’) regarding the SEC’s investigation related to BISYS’ past payment of certain marketing and other expenses with respect to certain of its mutual fund clients. There was no impact on the Portfolios’ financial statements as the Portfolios did not receive any settlement monies. |
| |
8. | Subsequent Events (Unaudited): |
| |
| Effective November 1, 2010, each non-interested Trustee is compensated with a $63,000 annual Board retainer for service as a Trustee of the Trust and the other HSBC Investor Funds, as well as a $3,000 annual retainer for each Committee of the Board of the Trust and other HSBC Investor Funds. Each non-interested Trustee also receives a $5,000 and $3,000 meeting fee for each regular in-person Board meeting and Committee meeting, respectively. Furthermore, each non-interested Trustee receives compensation for attending special meetings and/or functioning as a Committee or Board Chairperson. In addition, the noninterested Trustees are reimbursed for certain expenses incurred in connection with their Board membership. |
| |
| Effective at the close of business on January 12, 2011, Lord, Abbett & Co. LLC will replace AllianceBernstein L.P. as Sub-Investment Adviser to the International Equity Portfolio. |
| |
59 | HSBC INVESTOR PORTFOLIOS |
REPORT OF INDEPENDENT REGISTERED PUBLIC ACCOUNTING FIRM
To the Shareholders and Board of Trustees
of HSBC Investor Portfolios:
We have audited the accompanying statements of assets and liabilities of HSBC Investor Portfolios – HSBC Investor Growth Portfolio, HSBC Investor International Equity Portfolio, HSBC Investor Opportunity Portfolio and HSBC Investor Value Portfolio (the Funds), including the schedules of portfolio investments, as of October 31, 2010, and the related statements of operations for the year then ended, the changes in net assets for each year in the two-year period then ended, and the financial highlights for each year in the five-year period then ended. These financial statements and financial highlights are the responsibility of the Funds’ management. Our responsibility is to express an opinion on these financial statements and financial highlights based on our audits.
We conducted our audits in accordance with the standards of the Public Company Accounting Oversight Board (United States). Those standards require that we plan and perform the audits to obtain reasonable assurance about whether the financial statements and financial highlights are free of material misstatement. An audit includes examining, on a test basis, evidence supporting the amounts and disclosures in the financial statements. Our procedures included confirmation of securities owned as of October 31, 2010, by correspondence with custodians and brokers or by other appropriate auditing procedures. An audit also includes assessing the accounting principles used and significant estimates made by management, as well as evaluating the overall financial statement presentation. We believe that our audits provide a reasonable basis for our opinion.
In our opinion, the financial statements and financial highlights referred to above present fairly, in all material respects, the financial position of the Funds as of October 31, 2010, the results of their operations for the year then ended, the changes in their net assets for each year in the two-year period then ended, and the financial highlights for each year in the five-year period then ended, in conformity with U.S. generally accepted accounting principles.

Columbus, Ohio
December 22, 2010
| |
HSBC INVESTOR PORTFOLIOS | 60 |
|
HSBC INVESTOR PORTFOLIOS |
|
Table of Shareholder Expenses (Unaudited)—as of October 31, 2010 |
| |
| As a shareholder of the HSBC Investor Portfolios (“Portfolios”), you incur ongoing costs, including management fees and other Fund expenses. |
| |
| These examples are intended to help you understand your ongoing costs (in dollars) of investing in the Portfolios and to compare these costs with the ongoing costs of investing in other mutual funds. |
| |
| These examples are based on an investment of $1,000 invested at the beginning of the period and held for the entire period from May 1, 2010 through October 31, 2010. |
| |
| Actual Example |
| |
| The table below provides information about actual account values and actual expenses. You may use the information below, together with the amount you invested, to estimate the expenses that you paid over the period. Simply divide your account value by $1,000 (for example, an $8,600 account value divided by $1,000 = 8.6), then multiply the result by the number in the table under the heading entitled “Expenses Paid During Period” to estimate the expenses you paid on your account during this period. |
| | | | | | | | | | | | | | | | | | | |
| | Beginning
Account Value
5/1/10 | | Ending
Account Value
10/31/10 | | Expenses Paid
During Period*
5/1/10 – 10/31/10 | | Annualized
Expense Ratio
During Period
5/1/10 – 10/31/10 | |
| |
| |
| |
| |
| |
Growth Portfolio | | | $ | 1,000.00 | | | | $ | 1,045.40 | | | | $ | 3.56 | | | 0.69 | % | |
International Equity Portfolio | | | | 1,000.00 | | | | | 1,044.60 | | | | | 4.59 | | | 0.89 | % | |
Opportunity Portfolio | | | | 1,000.00 | | | | | 1,035.30 | | | | | 4.62 | | | 0.90 | % | |
Value Portfolio | | | | 1,000.00 | | | | | 996.50 | | | | | 3.42 | | | 0.68 | % | |
| |
|
* | Expenses are equal to the average account value over the period multiplied by the Portfolio’s annualized expense ratio, multiplied by the number of days in the most recent fiscal half-year divided by the number of days in the fiscal year (to reflect the one half year period). |
| |
| Hypothetical Example for Comparison Purposes |
| |
| The table below provides information about hypothetical account values and hypothetical expenses based on each Portfolio’s actual expense ratio and an assumed rate of return of 5% per year before expenses, which is not the Portfolio’s actual return. The hypothetical account values and expenses may not be used to estimate the actual ending account balance or expenses you paid for the period. You may use this information to compare this 5% hypothetical example with the 5% hypothetical examples that appear in the shareholder reports of other funds. |
| |
| Please note that the expenses shown in the table are meant to highlight your ongoing costs only and do not reflect any transactional costs, such as sales charges (loads), redemption fees, or exchange fees. Therefore, the table is useful in comparing ongoing costs only, and will not help you determine the relative total costs of owning different funds. In addition, if these transactional costs were included, your costs would have been higher. |
| | | | | | | | | | | | | | | | | | | |
| | Beginning
Account Value
5/1/10 | | Ending
Account Value
10/31/10 | | Expenses Paid
During Period*
5/1/10 – 10/31/10 | | Annualized
Expense Ratio
During Period
5/1/10 – 10/31/10 | |
| |
| |
| |
| |
| |
Growth Portfolio | | | $ | 1,000.00 | | | | $ | 1,021.73 | | | | $ | 3.52 | | | 0.69 | % | |
International Equity Portfolio | | | | 1,000.00 | | | | | 1,020.72 | | | | | 4.53 | | | 0.89 | % | |
Opportunity Portfolio | | | | 1,000.00 | | | | | 1,020.67 | | | | | 4.58 | | | 0.90 | % | |
Value Portfolio | | | | 1,000.00 | | | | | 1,021.78 | | | | | 3.47 | | | 0.68 | % | |
| |
|
* | Expenses are equal to the average account value over the period multiplied by the Portfolio’s annualized expense ratio, multiplied by the number of days in the most recent fiscal half-year divided by the number of days in the fiscal year (to reflect the one half year period). |
| |
61 | HSBC INVESTOR PORTFOLIOS |
|
|
HSBC INVESTOR FAMILY OF FUNDS |
|
Board of Trustees and Officers (Unaudited) |
MANAGEMENT OF THE TRUST
The following table contains information regarding the HSBC Investor Family of Funds Board of Trustees (“Trustees”). Asterisks indicate those Trustees who are “interested persons,” as defined in the Investment Company Act of 1940, as amended, of the HSBC Investor Family of Funds. The HSBC Investor Family of Funds’ Statement of Additional Information includes additional information about the Trustees and is available by calling (888) 525-5757.
| | | | | | | | | | |
Name, Address
and Age | | Position(s)
Held with
the HSBC
Investor Family
of Funds | | Term of Office and
Length of Time Served
with the HSBC Investor
Family of Funds | | Principal Occupation(s)
During Past 5 Years | | Number of
Portfolios in Fund
Complex Overseen
By Trustee* | | Other Directorships
Held by Trustee |
|
|
|
|
|
|
|
|
|
|
|
| | | | | | | | | | |
NON-INTERESTED
TRUSTEES | | | | | | | | | | |
| | | | | | | | | | |
Marcia L. Beck
P.O. Box 182845
Columbus, OH 43218-3035
Age: 55 | | Trustee | | Indefinite; June 2008
to present | | Private Investor (June 1999 – present); Executive Vice President, Prudential Investments (1997 – 1999); President and Trustee, The Goldman Sachs Mutual Funds (1992 – 1996) | | 32 | | None |
|
|
|
|
|
|
|
|
|
|
|
Susan S. Huang
P.O. Box 182845
Columbus, OH 43218-3035
Age: 56 | | Trustee | | Indefinite; June 2008
to present | | Private Investor (2000 – present); Senior Vice President, Schroder Investment Management (2001 – 2004); Managing Director, Chase Asset Management (1995 – 2000) | | 32 | | None |
|
|
|
|
|
|
|
|
|
|
|
Alan S. Parsow
P.O. Box 182845
Columbus, OH 43218-3035
Age: 60 | | Trustee | | Indefinite; 1987
to present | | General Partner, Elkhorn Partners, L.P. (a private investment partnership) (1989 – present) | | 32 | | Penn Treaty American Corporation (insurance) |
|
|
|
|
|
|
|
|
|
|
|
Thomas F. Robards
P.O. Box 182845
Columbus, OH 43218-3035
Age: 64 | | Trustee | | Indefinite; 2005
to present | | Partner, Robards & Co. LLC (investment and advisory services) (2005 – present); Chief Financial Officer, American Museum of Natural History (2003 – 2004) Chief Financial Officer, Datek Online Holdings (2000 – 2003); Previously EVP and CFO Republic New York Corporation | | 32 | | Overseas Shipholding Group (NYSE listed energy transportation); Ellington Financial LLC (NYSE listed financial services); Financial Federal Corporation (NYSE listed specialty finance) |
|
|
|
|
|
|
|
|
|
|
|
Michael Seely
P.O. Box 182845
Columbus, OH 43218-3035
Age: 65 | | Chairman
and Trustee | | Indefinite; 1987
to present | | Private Investor (2003 – present); General Partner, Global Multi Manager Partners (1999 – 2003); President of Investor Access Corporation (1981 – 2003) | | 32 | | None |
|
|
|
|
|
|
|
|
|
|
|
| | | | | | | | | |
EMERITUS TRUSTEE | | | | | | | | | |
| | | | | | | | | |
Larry M. Robbins
P.O. Box 182845
Columbus, OH 43218-3035
Age: 71 | | Emeritus
Trustee | | Until December 31, 2011;
Trustee from 1987
to December 31, 2010 | | Private Investor (2007 – present); Director, Center for Teaching and Learning, University of Pennsylvania (1999 – 2007) | | 32 | | None |
|
|
|
|
|
|
|
|
|
|
|
| |
* | Includes both the Fund and the underlying fund for Funds with a master/feeder structure. |
| |
HSBC INVESTOR PORTFOLIOS | 62 |
|
HSBC INVESTOR FAMILY OF FUNDS |
|
Board of Trustees and Officers (Unaudited) (continued) |
The names of the officers, their addresses, ages, position(s) held with the Trust, and principal occupation(s) during the past five years are described in the table below.
| | | | | | |
Name, Address
and Age | | Position(s)
Held with
the HSBC
Investor Family
of Funds | | Term of Office and
Length of Time Served
with the HSBC Investor
Family of Funds | | Principal Occupation(s)
During Past 5 Years |
|
|
|
|
|
|
|
| | | | | | |
Richard A. Fabietti
452 Fifth Avenue
New York, NY 10018
Age: 52 | | President | | One year; 2004
to present | | Senior Vice President, Head of Product Management, HSBC Global Asset Management (USA) Inc. (1998 – present) |
|
|
|
|
|
|
|
Stephen Sivillo
452 Fifth Avenue
New York, NY 10018
Age: 39 | | Vice President | | One year; 2010
to present | | Vice President of Product Administration, HSBC Global Asset Management (USA) Inc. (2010 – present); Chief Compliance Officer, Managers Funds (2009 – 2010); Director, Mutual Fund Compliance, AllianceBernstein (2007 – 2009); Assistant Vice President, Compliance, AllianceBernstein (2005 – 2007) |
|
|
|
|
|
|
|
Ty Edwards*
3435 Stelzer Road
Columbus, OH 43219-3035
Age: 44 | | Treasurer | | One year; 2010
to present | | Senior Vice President, Citi Fund Services (2010 – present); Director, Product Management, Columbia Management (2007 – 2009); Deputy Treasurer, Columbia Funds, (2006 – 2007); Director, Fund Administration, Columbia Management (2004 – 2007) |
|
|
|
|
|
|
|
Jennifer A. English*
100 Summer Street
Suite 1500
Boston, MA 02110
Age: 38 | | Secretary | | One year; 2008
to present | | Senior Vice President, Regulatory Administration, Citi (2005 – present) |
|
|
|
|
|
|
|
F. Martin Fox
100 Summer Street
Suite 1500
Boston, MA 02110
Age: 47 | | Assistant Secretary | | One year; 2008
to present | | Assistant Vice President, Regulatory Administration, Citi (May 2008 – present); Contract Attorney, Update Legal LLC (2002 – 2008) |
|
|
|
|
|
|
|
Frederick J. Schmidt*
1 Rexcorp Plaza
Uniondale, NY 11556
Age: 51 | | Chief
Compliance Officer | | One year; 2004
to present | | Senior Vice President and Chief Compliance Officer, CCO Services, Citi (2004 – present) |
|
|
|
|
|
|
|
| |
* | Mr. Edwards, Mr. Schmidt and Ms. English also are officers of certain other investment companies of which Citi (or an affiliate) is the administrator or sub-administrator. |
| |
63 | HSBC INVESTOR PORTFOLIOS |
Other Information:
Information regarding how the Portfolios voted proxies relating to portfolio securities during the most recent 12-month period ended June 30th is available (i) without charge, upon request, by calling 1-800-525-5757 for HSBC Bank USA and HSBC Brokerage (USA) Inc. clients and 1-800-782-8183 for all other shareholders; (ii) on the HSBC Investor Family of Funds’ web-site at www.investorfunds.us.hsbc.com; and (iii) on the Security and Exchange Commission’s (“Commission”) website at http://www.sec.gov.
(i) The Portfolios file their complete schedules of portfolio holdings with the Commission for the first and third quarters of each fiscal year on Form N-Q; (ii) the Portfolios’ Form N-Q are available on the Commission’s website at http://www.sec.gov; (iii) the Portfolios’ Forms N-Q may be reviewed and copied at the Commission’s Public Reference Room in Washington, DC and information on the operation of the Public Reference Room may be obtained by calling 1-800-SEC-0330; and (iv) the Portfolios’ Schedules of Investments will be available no later than 60 days after each period end, without charge, on the HSBC Investor Family of Funds’ website at www.investorfunds.us.hsbc.com.
An investment in a Portfolio is not a deposit of HSBC Bank USA, National Association, and is not insured or guaranteed by the Federal Deposit Insurance Corporation or any other government agency.
| |
HSBC INVESTOR PORTFOLIOS | 64 |
(This Page Intentionally Left Blank)
| |
HSBC INVESTOR FAMILY OF FUNDS: | SHAREHOLDER SERVICING AGENTS |
| For HSBC Bank USA, N.A. and |
INVESTMENT ADVISER AND ADMINISTRATOR | HSBC Securities (USA) Inc. Clients |
HSBC Global Asset Management (USA) Inc. | HSBC Bank USA, N.A. |
452 Fifth Avenue | 452 Fifth Avenue |
New York, NY 10018 | New York, NY 10018 |
| 1-888-525-5757 |
SUB-ADVISERS | |
HSBC Investor Growth Portfolio | For All Other Shareholders |
Winslow Capital Management, Inc. | HSBC Investor Funds |
4720 IDS Tower | P.O. Box 182845 |
80th South Eighth Street | Columbus, OH 43218-2845 |
Minneapolis, MN 55402 | 1-800-782-8183 |
| |
HSBC Investor International Equity Portfolio | TRANSFER AGENT |
AllianceBernstein L.P. | Citi Fund Services |
1345 Avenue of the Americas, 39th Floor | 3435 Stelzer Road |
New York, NY 10105 | Columbus, OH 43219 |
| |
HSBC Investor Opportunity Portfolio | DISTRIBUTOR |
Westfield Capital Management Company, L.P. | Foreside Distribution Services, L.P. |
One Financial Center | 690 Taylor Road, Suite 150 |
Boston, MA 02111 | Gahanna, OH 43230-3202 |
| |
HSBC Investor Value Portfolio | CUSTODIAN |
NWQ Investment Management Company, LLC | The Northern Trust Company |
2049 Century Park East, 16th Floor | 50 South LaSalle Street |
Los Angeles, CA 90067 | Chicago, IL 60603 |
| |
| INDEPENDENT REGISTERED PUBLIC |
| ACCOUNTING FIRM |
| KPMG LLP |
| 191 West Nationwide Blvd., Suite 500 |
| Columbus, OH 43215 |
| |
| LEGAL COUNSEL |
| Dechert LLP |
| 1775 I Street, N.W. |
| Washington, D.C. 20006 |


The HSBC Investor Family of Funds are distributed by Foreside Distribution Services, L.P. This document must be preceded or accompanied by a current prospectus for the HSBC Investor Funds, which you should read carefully before you invest or send money.
| | | |
| — NOT FDIC INSURED | — NO BANK GUARANTEE | — MAY LOSE VALUE |
Item 2. Code of Ethics.
(a) The registrant has adopted a code of ethics that applies to the registrant’s principal executive officer, principal financial officer, principal accounting officer or controller, or persons performing similar functions. This code of ethics is included as an Exhibit.
(b) During the period covered by the report, with respect to the registrant’s code of ethics that applies to its principal executive officer, principal financial officer, principal accounting officer or controller, or persons performing similar functions; there have been no amendments to, nor any waivers granted from, a provision that relates to any element of the code of ethics definition enumerated in paragraph (b) of this Item 2.
Item 3. Audit Committee Financial Expert.
3(a)(1) The registrant’s board of directors has determined that the registrant has at least one audit committee financial expert serving on its audit committee.
3(a)(2) The audit committee financial expert is Thomas Robards, who is “independent” for purposes of this Item 3 of Form N-CSR.
Item 4. Principal Accountant Fees and Services.
| | |
| (a) Audit Fees, |
| 2009 | $228,000 |
| 2010 | $228,000 |
|
| (b) Audit-Related Fees, |
| 2009 | $10,700 |
| 2010 | $6,200 |
| | |
| 2009 – Fees of $10,700 relate to the consent of N-1A filing and the consent of the N-14 filing for the HSBC Investor Core Plus Fixed Income Fund (Advisor), HSBC Investor Core Plus Fixed Income Fund and HSBC Investor Intermediate Duration Fixed Income Fund. |
| |
| 2010 – Fees of $6,200 relate to the consent of N-1A filing. |
| | |
| (c) Tax Fees, |
| 2009 | $160,805 |
| 2010 | $138,625 |
| | |
| Fees for both 2009 and 2010 relate to the preparation of federal income and excise tax returns and the review of excise tax distributions. |
| | |
| (d) All Other Fees, |
| 2009 | $0 |
| 2010 | $0 |
| | |
(e)(1) Disclose the audit committee’s pre-approval policies and procedures described in paragraph (c)(7) of Rule 2-01 of Regulation S-X. |
| | |
(2) Disclose the percentage of services described in each of paragraphs (b) through (d) of this Item that were approved by the audit committee pursuant to paragraph (c)(7)(i)(C) of Rule 2-01 of Regulation S-X. |
| | |
None of the services summarized in (b) – (d), above, were approved by the audit Committee pursuant to Rule 2-01(c)(7)(i)(C) of Regulation S-X. |
| | |
| (f) Not applicable. |
| | |
| (g) Non-Audit Fees. |
| 2009 | $171,505 |
| 2010 | $144,825 |
| | |
(h) The audit committee considered the nonaudit services rendered to the registrant’s investment adviser and any entity controlling, controlled by, or under common control with the investment adviser, and believes the services are compatible with the principal accountant’s independence. |
Item 5. Audit Committee of Listed Registrants.
Not applicable.
Item 6. Investments.
(a) Included as a part of the report to shareholders filed under Item 1.
(b) Not applicable.
Item 7. Disclosure of Proxy Voting Policies and Procedures for Closed-End Management Investment Companies.
Not applicable.
Item 8. Portfolio Managers of Closed-End Management Investment Companies.
Not applicable.
Item 9. Purchases of Equity Securities by Closed-End Management Investment Company and Affiliated Purchasers.
Not applicable.
Item 10. Submission of Matters to a Vote of Security Holders.
Not applicable.
Item 11. Controls and Procedures.
(a) The registrant’s principal executive officer and principal financial officer have concluded, based on their evaluation of the registrant’s disclosure controls and procedures as conducted within 90 days of the filing date of this report, that these disclosure controls and procedures are adequately designed and are operating effectively to ensure that information required to be disclosed by the registrant on Form N-CSR is recorded, processed, summarized and reported within the time periods specified in the Securities and Exchange Commission’s rules and forms.
(b) There were no changes in the registrant’s internal control over financial reporting (as defined in Rule 30a-3(d) under the Act (17 CFR 270.30a-3(d)) that occurred during the second fiscal quarter of the period covered by this report that have materially affected or are reasonably likely to materially affect, the registrant’s internal control over financial reporting.
Item 12. Exhibits.
(a)(1) The code of ethics that is the subject of the disclosure required by Item 2 is attached hereto.
(a)(2) Certifications pursuant to Rule 30a-2(a) are attached hereto.
(a)(3) Not applicable.
(b) Certifications pursuant to Rule 30a-2(b) are furnished herewith.
SIGNATURES
Pursuant to the requirements of the Securities Exchange Act of 1934 and the Investment Company Act of 1940, the registrant has duly caused this report to be signed on its behalf by the undersigned, thereunto duly authorized.
| | |
(Registrant) | HSBC INVESTOR FUNDS | |
| | |
| | |
By (Signature and Title)* | /s/ Richard A. Fabietti | |
| | |
| Richard A. Fabietti | |
| President | |
Pursuant to the requirements of the Securities Exchange Act of 1934 and the Investment Company Act of 1940, this report has been signed below by the following persons on behalf of the registrant and in the capacities and on the dates indicated.
| | |
By (Signature and Title)* | /s/ Richard A. Fabietti | |
| | |
| Richard A. Fabietti | |
| President | |
| | |
By (Signature and Title)* | /s/ Ty Edwards | |
| | |
| Ty Edwards | |
| Treasurer | |
* Print the name and title of each signing officer under his or her signature.