UNITED STATES
SECURITIES AND EXCHANGE COMMISSION
Washington, D.C. 20549
FORM N-CSR
CERTIFIED SHAREHOLDER REPORT OF REGISTERED
MANAGEMENT INVESTMENT COMPANIES
Investment Company Act file number: 811-04782
HSBC FUNDS
(Exact name of registrant as specified in charter)
452 FIFTH AVENUE
NEW YORK, NY 10018
(Address of principal executive offices) (Zip code)
CITI FUND SERVICES
4400 EASTON COMMONS, SUITE 200
COLUMBUS, OH 43219
(Name and address of agent for service)
Registrant’s telephone number, including area code: 1-800-782-8183
Date of fiscal year end: October 31 Date of reporting period: October 31, 2019 |
Item 1. Reports to Stockholders.
HSBC Funds
Annual Report
October 31, 2019
| | | | | | | | | | | | | | Intermediary | | |
| | | | | | | | | | | | Intermediary | | Service | | |
| MONEY MARKET FUNDS | | Class A | | Class C | | Class D | | Class E | | Class I | | Class | | Class | | Class Y |
HSBC U.S. Government
Money Market Fund | | FTRXX | | HUMXX | | HGDXX | | HGEXX | | HGIXX | | HGGXX | | HGFXX | | RGYXX |
HSBC U.S. Treasury
Money Market Fund | | HWAXX | | HUCXX | | HTDXX | | HTEXX | | HBIXX | | HTGXX | | HTFXX | | HTYXX |

| Table of Contents |
| HSBC Family of Funds |
| Annual Report - October 31, 2019 |
| Glossary of Terms | | 2 |
| Commentary From the Investment Manager | | 3 |
| Portfolio Reviews | | 4 |
| Portfolio Composition | | 6 |
| | | |
| Schedules of Portfolio Investments | | |
| | | |
| HSBC U.S. Government Money Market Fund | | 7 |
| HSBC U.S. Treasury Money Market Fund | | 10 |
| Statements of Assets and Liabilities | | 11 |
| Statements of Operations | | 12 |
| Statements of Changes in Net Assets | | 13 |
| Financial Highlights | | 15 |
| Notes to Financial Statements | | 19 |
| Report of Independent Registered Public Accounting Firm | | 29 |
| Other Federal Income Tax Information | | 31 |
| Table of Shareholder Expenses | | 32 |
| Board of Trustees and Officers | | 34 |
| Other Information | | 36 |
Bloomberg Barclays Global Aggregate Indexis an index that is the measure of the global investment-grade debt from 24 local currency markets, which include treasury, government-related, corporate, and securitized fixed-rate bonds from both developed and emerging markets issuers.
Bloomberg Barclays U.S. Aggregate Bond Indexis a broad-based benchmark that measures the investment-grade, U.S. dollar-denominated, fixed-rate taxable bond market. This includes Treasuries, government-related and corporate securities, mortgage-backed securities, asset-backed securities and collateralized mortgage-backed securities.
Gross Domestic Product (“GDP”)is the value of goods and services produced in a given country in a given year.
MSCI Europe Australasia and Far East (“MSCI EAFE”) Indexis an equity index which captures the large- and mid-cap representation across 21 developed markets countries, excluding the U.S. and Canada.
MSCI Emerging Markets Indexis a float-adjusted market capitalization index that is designed to measure equity market performance in global emerging markets.
Purchasing Managers’ Index (“PMI”)is an indicator of the economic health of the manufacturing sector. The PMI is based on five major indicators: new orders, inventory levels, production, supplier deliveries, and the employment environment.
Russell 1000®Indexmeasures the performance of the large-cap segment of the U.S. equity universe. It is a subset of the Russell 3000®Index and includes approximately 1000 of the largest securities based on a combination of their market cap and current index membership. The Russell 1000 represents approximately 92% of the U.S. market.
Russell 2000®Indexmeasures the performance of the small-cap segment of the U.S. equity universe. The Russell 2000®Index is a subset of the Russell 3000®Index representing approximately 8% of the total market capitalization of that index. It includes approximately 2000 of the smallest securities based on a combination of their market cap and current index membership.
Securities indices are unmanaged and assume reinvestment of all distributions and interest payments and do not take in account brokerage fees or expenses. Securities in the Funds do not match those in the indices and performance of the Funds will differ. Investors cannot invest directly in an index.
| Commentary From the Investment Manager(Unaudited) |
| HSBC Global Asset Management (USA) Inc. |
Global Economic Review
The global economy softened during the 12-month period from November 1, 2018 through October 31, 2019. The U.S. Federal Reserve Board (the Fed) moved to protect the U.S. economy from global economic weakness by shifting monetary policy from tightening to easing. Uncertainty stemming from U.S.-China trade conflicts, weakness in the eurozone and a downturn in the manufacturing sector, especially in China, exerted downward pressure on economic growth around the world.
Late in 2018, fears of recession drove steep declines in equity markets. Optimism returned in early 2019 as central banks in China, the U.S. and Europe signaled looser monetary policies. Yet worries about the trade conflict between the U.S. and China and signs of further global economic weakness began to weigh on global equities and investor confidence as the year progressed. In the end, some resilience in the U.S. economy and cautious optimism about the potential for improved international trade relations helped buoy equity markets.
The U.S. economy grew throughout the period, though generally at a slowing rate. Annual GDP1growth peaked at 3.1% in the first quarter of 2019, rebounding from 2.2% in the fourth quarter of 2018. GDP growth dropped to 1.9% in the second quarter of 2019, and early estimates suggest a similar growth rate in the third quarter. The U.S. unemployment rate fell from an already-low level, ending the period at 3.6%. The solid labor market, low interest rates and strong consumer confidence helped support the U.S. economy. Meanwhile, underlying inflation remained subdued. These positive factors generally outweighed a weak picture for U.S. investments and exports amid slower global growth, trade concerns and elevated political uncertainty.
The U.S. yield curve inverted in August as yields on certain short-term Treasury securities fell below yields on longer-term bonds. An inverted yield curve is widely considered a leading indicator of an economic recession. In reaction to signs that global economic weakness was weighing on U.S. growth, the Fed reduced interest rates three times between July and October, for a total reduction of 75 basis points (0.75%).
Weakening manufacturing data weighed on the eurozone throughout the period. Germany narrowly avoided a technical recession in 2019 due to the manufacturing sector’s extended slump, according to data from the PMI1. A robust labor market continued to support the region’s service sector, however, helping to sustain overall eurozone economic activity throughout the period.
Britain’s attenuated negotiations over Brexit continue to constrain economic performance in the United Kingdom. Businesses have had to contend with a challenging operating environment amid shifting deadlines for an agreement governing the United Kingdom’s exit from the European Union. For example, companies have tended to stockpile goods prior to each proposed deadline, and then subsequently sell down their stockpiles each time the government receives a newextension. The possibility for a wide variety of outcomes, including “no-deal,” “deal” or “no Brexit” scenarios, created (and continues to create) intense uncertainty for businesses and investors. A strong labor market provided a bright spot amid the country’s economic uncertainty.
In Japan, cyclical indicators early in the period fell to their lowest levels since early 2016. Growth remained sluggish through 2019 amid a slowdown in business investment. Meanwhile, softness in global trade—particularly trade with China, a large consumer of many Japanese exports— weighed on the country’s economy.
Emerging market economies remained relatively strong despite heightened geopolitical risks, including lingering trade tensions. Rate cuts from the Fed and looser monetary policy from emerging markets central banks supported these economies. While recent geopolitical instability in Latin America reduced economic growth in that region, the structural characteristics of many other emerging market economies remain strong.
China’s manufacturing exports, domestic orders and industrial profits declined early in the period, as the trade dispute with the U.S. exacerbated the country’s economic downturn. Manufacturing activity picked up briefly in June, but the country’s economic data generally continued to weaken from July through October.
Market review
Global equity markets suffered steep declines late in 2018. Stocks rebounded in early 2019 due in part to easing monetary policy in the U.S. and China, but fell again in May as U.S.-China trade relations deteriorated. Markets continued to rise and fall through the remainder of the period in response to fluctuating trade tensions, mixed economic data and Fed rate cuts. Despite this month-to-month volatility, global equity markets generally delivered positive results for the period.
U.S. stocks ended the period with uneven gains. The Russell 1000®Index1of large-capitalization U.S. stocks returned 14.15%, while the Russell 2000®Index1of small-cap stocks produced a 4.91% return.
International equities generally trailed the U.S. stock market. The MSCI EAFE Index1of developed-market international stocks gained 11.63% (gross of withholding taxes), and the MSCI Emerging Markets Index1returned 12.29% (gross of withholding taxes).
Global fixed-income markets rallied as looser central bank policies pushed interest rates down and bond prices up. Late in the period, sentiment on U.S.-China trade relations turned cautiously optimistic, easing investor concerns about the global economic outlook and curtailing bond returns. The Bloomberg Barclays Global Aggregate Bond Index1, which tracks the broader global investment-grade fixed income market, posted a 9.54% return for the 12-month period. Meanwhile the Bloomberg Barclays U.S. Aggregate Bond Index1, which tracks similar bonds in the U.S. market, posted an 11.51% return for the 12-month period.
| 1 | For additional information, please refer to the Glossary of Terms. |
| Portfolio Reviews(Unaudited) |
| HSBC U.S. Government Money Market Fund |
| (Class A Shares, Class C Shares, Class D Shares, Class E Shares, Class I Shares, |
| Intermediary Class, Intermediary Service Class and Class Y Shares) |
| by John Chiodi |
| Senior Portfolio Manager |
Moody’s and Standard & Poor’s
have assigned an “Aaa-mf” and
“AAAm” rating to the
HSBC U.S. Government
Money Market Fund.1 |
Investment Concerns
You could lose money by investing in the Fund. Although the Fund seeks to preserve the value of your investment at $1.00 per share, it cannot guarantee it will do so. An investment in the Fund is not a deposit of HSBC Bank USA, N.A. and is not insured or guaranteed by the Federal Deposit Insurance Corporation or any other government agency. The Fund’s sponsor has no legal obligation to provide financial support to the Fund, and you should not expect that the sponsor will provide financial support to the Fund at any time.
For a complete description of these and other risks associated with investment in a mutual fund, please refer to the Fund’s prospectus.
Portfolio Performance
Yields on U.S. government money market securities fell significantly during the 12-month period ended October 31, 2019. The Federal Reserve Board (the Fed) raised short-term interest rates once, in December 2018, before reversing course and cutting rates in July, September, and October for a net decline of 50 basis points (0.50%) for the period. This decline in interest rates drove yields down.
The Fed’s shift in interest rate strategy was largely a response to economic developments. Uncertainty over the impact of U.S. trade policy on the manufacturing sector led to a more cautious approach to interest rates,as did concern over persistently below-target inflation rates. These developments fueled rate cuts totaling 75 basis points (0.75%) between July 31 and October 30. At its October 30, 2019, meeting, the Fed signaled its intention to wait and see the cumulative effect of its rate cuts before taking further action. In general, rate actions take six months to demonstrate their full impact on the economy.
As the Fed’s bias shifted during the period, the Fund repositioned itself in preparation for lower rates by extending its duration and maintaining a longer weighted average maturity. As a result, the Fund’s composition became more barbell-shaped, taking on more repurchase agreements (repos) and floating-rate debt. That positioning supported the Fund’s absolute performance.†
The Fund benefited from its higher repo levels through mid-September, when a combination of an increase in repo supply from the Treasury and money being drained out of the system to cover corporate tax payments led to unusually high repo prices. The Fed used its daily open market operations to raise liquidity in the repo markets, bringing rates back to normal levels. This intervention is expected to continue into 2020. This news led the Fund to begin reducing its repo positions and adding to fixed-rate and floating-rate securities that would perform well under lower-than-expected repo levels.†
| † | Portfolio composition is subject to change. |
| | | | | | | | Average Annual | | | | | | | | Expense |
| Fund Performance | | | | | | | | Total Return (%) | | | | | | Yield (%)2 | | Ratio (%)3 |
| | Inception | | 1 | | 5 | | 10 | | Since | | 7-Day | | | | | | |
| As of October 31, 2019 | | Date | | Year | | Year | | Year | | Inception | | Average | | Gross | | Net |
| Class A | | | 5/3/90 | | | 1.71 | | 0.60 | | 0.31 | | | 2.44 | | | 1.25 | | | 0.66 | | | 0.66 |
| Class C4 | | | 11/20/06 | | | — | | — | | — | | | 1.39 | | | — | | | 1.26 | | | 1.26 |
| Class D | | | 4/1/99 | | | 1.87 | | 0.69 | | 0.35 | | | 1.56 | | | 1.40 | | | 0.51 | | | 0.51 |
| Class E5 | | | 7/12/16 | | | — | | — | | — | | | 0.34 | | | — | | | 0.26 | | | 0.25 |
| Class I6 | | | 12/24/03 | | | 2.23 | | 0.94 | | 0.49 | | | 1.11 | | | 1.76 | | | 0.16 | | | 0.14 |
| Intermediary Class | | | 7/12/16 | | | 2.20 | | — | | — | | | 1.35 | | | 1.73 | | | 0.31 | | | 0.18 |
| Intermediary Service Class | | | 7/12/16 | | | 2.17 | | — | | — | | | 1.32 | | | 1.70 | | | 0.36 | | | 0.20 |
| Class Y | | | 7/1/96 | | | 2.12 | | 0.86 | | 0.43 | | | 2.12 | | | 1.65 | | | 0.26 | | | 0.26 |
Past performance does not guarantee future results. The performance data quoted represents past performance and current returns may be lower or higher. Total return figures include change in share price, reinvestment of dividends and capital gains and do not reflect taxes that a shareholder would pay on Fund distributions or on the redemption of Fund shares. Investment return and principal value will fluctuate so that an investor’s shares, when redeemed may be worth more or less than the original cost. To obtain performance information current to the most recent month end, please call 1-800-782-8183.
The performance above reflects any fee waivers that have been in effect during the applicable periods, as well as any expense reimbursements that have periodically been made. Absent such waivers and reimbursements, returns would have been lower. Currently, contractual fee waivers and/or expense reimbursements are in effect for the Fund through March 1, 2020 for the Class E Shares, Class I Shares, Intermediary Class Shares and Intermediary Service Class Shares.
| 1 | The “Aaa-mf ” and “AAAm” money market fund rating is historical and reflects Moody’s and Standard & Poor’s opinion as to the quality of the Fund’s investments, liquidity management, and operations and trading support. Periodic reviews are conducted to ensure a secure operations environment. Moody’s and Standard & Poor’s ratings represent an opinion only, not a recommendation to buy or sell. Obligations rated A-1+, A-1 or P-1 are rated in the highest short-term rating category by Standard & Poor’s (A-1+ or A-1) or Moody’s Investor Service (P-1). The obligor’s capacity to meet its financial commitments on these obligations is regarded to be “extremely strong” (A-1+), “strong” (A-1) or “superior” (P-1). |
| 2 | The seven-day yield quotation more closely reflects the current earnings of the money market fund than the total return quotation. The seven-day yield reflects voluntary fee waivers/expense reimbursements. Without the voluntary fee waivers/expense reimbursements, the yields would have been 1.75%, 1.60%, and 1.55% for Class I Shares, Intermediary Class, and Intermediary Service Class, respectively. |
| 3 | Reflects the expense ratio as reported in the prospectus dated February 28, 2019, as restated May 29, 2019 and supplemented to date. HSBC Global Asset Management (USA) Inc., the Adviser, has entered into a contractual expense limitation agreement with the Fund under which it will limit total expenses of the Fund (excluding interest, taxes, brokerage commissions, extraordinary expenses and estimated indirect expenses attributable to the Fund’s investments in investment companies) to an annual rate of 0.25%, 0.14%, 0.18%, and 0.20% for Class E Shares, Class I Shares, Intermediary Class Shares, and Intermediary Service Class Shares, respectively. The expense limitation shall be in effect until March 1, 2020. Additional information pertaining to the October 31, 2019 expense ratios can be found in the financial highlights. |
| 4 | Reflects the applicable contingent deferred sales charge, maximum of 1.00%, for returns presented. Class C Shares were operational during a portion of the periods presented. Amounts reflect performance for the period of time the Class had operations, which was 346, 362 and 351 days during the years ended October 31, 2006, 2009 and 2010, respectively. The Class was not operational during the entire fiscal years ended October 31, 2007, 2008, 2011, 2012, 2013, 2014, 2015, 2016, 2017, 2018 and 2019. No returns are presented for the one-year, five-year and 10-year periods with non-continuous operations. |
| 5 | Class E Shares were operational during a portion of the periods presented. Amounts reflect performance for the period of time the Class had operations, which was 112 and 283 days during the years ended October 31, 2016 and 2017, respectively. The Class was not operational during the entire fiscal years ended October 31, 2018 and 2019. No return is presented for the one-year period with non-continuous operations. |
| 6 | Class I Shares were operational during a portion of the periods presented. Amounts reflect performance for the period of time the Class had operations, which was 10, 89, 136 and 357 days during the years ended October 31, 2004, 2005, 2006 and 2007, respectively. The Class was operational during the entire fiscal years ended October 31, 2008 through 2019. |
| Portfolio Reviews(Unaudited) |
| HSBC U.S. Treasury Money Market Fund |
| (Class A Shares, Class C Shares, Class D Shares, Class E Shares, Class I Shares, Intermediary Class, |
| Intermediary Service Class and Class Y Shares) |
| by John Chiodi |
| Senior Portfolio Manager |
Moody’s and Standard & Poor’s
have assigned an “Aaa-mf” and
“AAAm” rating to the
HSBC U.S. Treasury
Money Market Fund.1 |
Investment Concerns
You could lose money by investing in the Fund. Although the Fund seeks to preserve the value of your investment at $1.00 per share, it cannot guarantee it will do so. An investment in the Fund is not a deposit of HSBC Bank USA, N.A. and is not insured or guaranteed by the Federal Deposit Insurance Corporation or any other government agency. The Fund’s sponsor has no legal obligation to provide financial support to the Fund, and you should not expect that the sponsor will provide financial support to the Fund at any time.
For a complete description of these and other risks associated with investment in a mutual fund, please refer to the Fund’s prospectus.
Portfolio Performance
The Federal Reserve Board (the Fed) raised the federal funds rate, a short-term interest rate that influences Treasury bill yields, once during the period in December 2018, before reversing course and cutting rates in July, September, and October, for a net decline of 50 basis points (0.50%) for the 12-month period ended October 31, 2019. As a result, yields on Treasury bills declined significantly during the reporting period.
The Fed’s shift in interest rate strategy was largely a response to economic developments. Uncertainty over the impact of U.S. trade policy on the manufacturing sector led to a more cautious approach to interest rates, as did concern over persistently below-target inflation rates. These developments fueled rate cuts totaling 75 basis points (0.75%) between July 31 and October 30. At its October 30, 2019, meeting, the Fed signaled its intention to wait and see the cumulative effect of its rate cuts before taking further action. In general, rate actions take six months to demonstrate their full impact on the economy.
During the period, the Fed also committed to purchasing $60 billion worth of Treasury bills on a monthly basis through at least the second quarter of 2020. In response to this news and in anticipation of expected rate cuts, the Fund increased its duration to between 40 and 50 days. Because the Fund can only invest in Treasury securities, floating rate debt continued to offer the most attractive yields available to it in the falling rate environment that dominated the second half of the period under review. As a result, the Fund maintained a weighted average maturity of 100 days or more through the end of the period.†
† Portfolio composition is subject to change.
| | | | | | | | | | | Average Annual | | | | | | | | | | | | Expense |
| Fund Performance | | | | | | | | | | | Total Return (%) | | | | | | | Yield (%)2 | | | Ratio (%)3 |
| | Inception | | 1 | | 5 | | 10 | | Since | | 7-Day | | | | | | |
| As of October 31, 2019 | | Date | | Year | | Year | | Year | | Inception | | Average | | Gross | | Net |
| Class A4 | | | 5/24/01 | | | | — | | | | — | | | | — | | | | 1.08 | | | | — | | | | 0.68 | | | 0.68 |
| Class C5 | | | 12/24/03 | | | | — | | | | — | | | | — | | | | 0.04 | | | | — | | | | 1.28 | | | 1.28 |
| Class D | | | 5/14/01 | | | | 1.79 | | | | 0.65 | | | | 0.33 | | | | 1.00 | | | | 1.33 | | | | 0.53 | | | 0.53 |
| Class E6 | | | 7/12/16 | | | | — | | | | — | | | | — | | | | 0.37 | | | | — | | | | 0.28 | | | 0.25 |
| Class I7 | | | 12/30/03 | | | | 2.16 | | | | 0.89 | | | | 0.45 | | | | 1.18 | | | | 1.69 | | | | 0.18 | | | 0.14 |
| Intermediary Class | | | 7/12/16 | | | | 2.14 | | | | — | | | | — | | | | 1.26 | | | | 1.67 | | | | 0.33 | | | 0.18 |
| Intermediary Service Class | | | 7/12/16 | | | | 2.12 | | | | — | | | | — | | | | 1.29 | | | | 1.65 | | | | 0.38 | | | 0.20 |
| Class Y | | | 5/11/01 | | | | 2.05 | | | | 0.80 | | | | 0.40 | | | | 1.15 | | | | 1.58 | | | | 0.28 | | | 0.28 |
Past performance does not guarantee future results. The performance data quoted represents past performance and current returns may be lower or higher. Total return figures include change in share price, reinvestment of dividends and capital gains and do not reflect taxes that a shareholder would pay on Fund distributions or on the redemption of Fund shares. Investment return and principal value will fluctuate so that an investor’s shares, when redeemed may be worth more or less than the original cost. To obtain performance information current to the most recent month end, please call 1-800-782-8183.
The performance above reflects any fee waivers that have been in effect during the applicable periods, as well as any expense reimbursements that have periodically been made. Absent such waivers and reimbursements, returns would have been lower. Currently, contractual fee waivers and/or expense reimbursements are in effect for the Fund through March 1, 2020 for the Class E Shares, Class I Shares, Intermediary Class Shares and Intermediary Service Class Shares.
| 1 | The “Aaa-mf ” and “AAAm” money market fund rating is historical and reflects Moody’s and Standard & Poor’s opinion as to the quality of the Fund’s investments, liquidity management, and operations and trading support. Periodic reviews are conducted to ensure a secure operations environment. Moody’s and Standard & Poor’s ratings represent an opinion only, not a recommendation to buy or sell. Obligations rated A-1+, A-1 or P-1 are rated in the highest short-term rating category by Standard & Poor’s (A-1+ or A-1) or Moody’s Investor Service (P-1). The obligor’s capacity to meet its financial commitments on these obligations is regarded to be “extremely strong” (A-1+), “strong” (A-1) or “superior” (P-1). |
| 2 | The seven-day yield quotation more closely reflects the current earnings of the money market fund than the total return quotation. Without the voluntary fee waivers/expense reimbursements, the yields would have been 1.68, 1.53%, and 1.48% for Class I Shares, Intermediary Class, and Intermediary Service Class, respectively. |
| 3 | Reflects the expense ratio as reported in the prospectus dated February 28, 2019, as restated May 29, 2019 and supplemented to date. HSBC Global Asset Management (USA) Inc., the Adviser, has entered into a contractual expense limitation agreement with the Fund under which it will limit total expenses of the Fund (excluding interest, taxes, brokerage commissions, extraordinary expenses and estimated indirect expenses attributable to the Fund’s investments in investment companies) to an annual rate of 0.25%, 0.14%, 0.18%, and 0.20% for Class E Shares, Class I Shares, Intermediary Class Shares, and Intermediary Service Class Shares, respectively. The expense limitation shall be in effect until March 1, 2020. Additional information pertaining to the October 31, 2019 expense ratios can be found in the financial highlights. |
| 4 | Class A Shares were operational during a portion of the periods presented. Amounts reflect performance for the period of time the Class had operations, which was 201 days during the year ended October 31, 2014 and the entire fiscal years ended October 31, 2001 through 2013. The Class was not operational during the entire fiscal years ended October 31, 2015 through 2019. No returns are presented for the one-year, five-year and 10-year periods with non-continuous operations. |
| 5 | Reflects the applicable contingent deferred sales charge, maximum of 1.00%, for returns presented. Class C Shares were operational during a portion of the periods presented. Amounts reflect performance for the period of time the Class had operations, which was 26 and 351 days during the years ended October 31, 2008 and 2010, respectively. The Class was operational during the entire fiscal years ended October 31, 2005, 2006, 2007 and 2009. The Class was not operational during the entire fiscal year ended October 31, 2011 through 2019. No returns are presented for the one-year, five-year and 10-year periods with non-continuous operations. |
| 6 | Class E Shares were operational during a portion of the periods presented. Amounts reflect performance for the period of time the Class had operations, which was 112 and 283 days during the fiscal years ended October 31, 2016 and 2017, respectively. The Class was not operational during the entire fiscal years ended October 31, 2018 and 2019. No return is presented for the one-year period with non-continuous operations. |
| 7 | Class I Shares were operational during a portion of the periods presented. Amounts reflect performance for the period of time the Class had operations, which was 13 and 280 days during the fiscal years ended October 31, 2004 and 2005, respectively. The Class was operational during the entire fiscal years ended October 31, 2006 through 2019. |
| Portfolio Reviews |
Portfolio Composition*
October 31, 2019 (Unaudited) |
| HSBC U.S. Government Money Market Fund | |
| Investment Allocation | | Percentage of Investments at Value (%) |
| U.S. Government and | | | | |
| Government Agency | | | | |
| Obligations | | | 54.5 | |
| Repurchase Agreements | | | 36.0 | |
| U.S. Treasury Obligations | | | 6.3 | |
| Investment Companies | | | 3.2 | |
| Total | | | 100.0 | |
| | |
| HSBC U.S. Treasury Money Market Fund | |
| Investment Allocation | | Percentage of Investments at Value (%) |
| U.S. Treasury Obligations | | | 100.0 | |
| Total | | | 100.0 | |
____________________
| * | | Portfolio composition is subject to change. |
| HSBC U.S. GOVERNMENT MONEY MARKET FUND |
| Schedule of Portfolio Investments—as of October 31, 2019 |
| U.S. Government and Government Agency | | | | |
| Obligations — 54.6% | | | | |
| | | | | |
| | Principal | | |
| | Amount ($) | | Value ($) |
| Federal Farm Credit Bank — 12.3% | | | | |
| 1.79% (US0001M - 2 bps), | | | | |
| 05/28/2020(a) | | 100,000,000 | | 100,000,000 |
| 1.84% (US0001M - 1 bps), | | | | |
| 07/20/2020(a) | | 75,000,000 | | 75,000,000 |
| 1.84% (FEDL01 + 2 bps), | | | | |
| 06/17/2020(a) | | 80,000,000 | | 79,991,896 |
| 1.85% (FEDL01 + 3 bps), | | | | |
| 02/05/2020(a) | | 15,000,000 | | 14,998,403 |
| 1.88% (US0001M + 4 bps), | | | | |
| 01/19/2021(a) | | 40,000,000 | | 40,000,000 |
| 1.88% (US0001M + 8 bps), | | | | |
| 07/26/2021(a) | | 100,000,000 | | 100,000,000 |
| 1.89% (US0001M - 4 bps), | | | | |
| 03/11/2020(a) | | 150,000,000 | | 149,994,550 |
| 1.94% (FEDL01 + 12 bps), | | | | |
| 02/09/2021(a) | | 115,000,000 | | 115,000,000 |
| 1.94% (FEDL01 + 12 bps), | | | | |
| 02/22/2021(a) | | 110,000,000 | | 110,000,000 |
| 1.95% (FCPR DLY - 305 bps), | | | | |
| 08/13/2021(a) | | 250,000,000 | | 249,651,623 |
| 1.95% (US0001M - 8 bps), | | | | |
| 06/01/2020(a) | | 73,000,000 | | 72,995,683 |
| 1.97% (FCPR DLY - 303 bps), | | | | |
| 09/03/2021(a) | | 180,000,000 | | 179,882,899 |
| 1.99% (FCPR DLY - 301 bps), | | | | |
| 06/25/2020(a) | | 50,000,000 | | 50,000,000 |
| 1.99% (FEDL01 + 17 bps), | | | | |
| 01/25/2021(a) | | 75,000,000 | | 74,990,768 |
| 1.99% (FCPR DLY - 301 bps), | | | | |
| 06/07/2021(a) | | 25,000,000 | | 25,000,000 |
| 2.00% (US0001M + 12 bps), | | | | |
| 10/18/2021(a) | | 50,000,000 | | 50,000,000 |
| 2.00% (FCPR DLY - 300 bps), | | | | |
| 03/18/2021(a) | | 175,000,000 | | 174,975,145 |
| 2.00% (FCPR DLY - 300 bps), | | | | |
| 03/22/2021(a) | | 150,000,000 | | 149,978,932 |
| 2.02% (FEDL01 + 20 bps), | | | | |
| 04/22/2021(a) | | 50,000,000 | | 50,000,000 |
| 2.03% (FCPR DLY - 298 bps), | | | | |
| 05/10/2021(a) | | 225,000,000 | | 224,947,739 |
| 2.04% (FEDL01 + 22 bps), | | | | |
| 10/12/2021(a) | | 5,000,000 | | 4,999,494 |
| 2.05% (US0001M + 4 bps), | | | | |
| 06/03/2021(a) | | 50,000,000 | | 50,000,000 |
| 2.07% (US0001M + 13 bps), | | | | |
| 10/08/2021(a) | | 18,000,000 | | 18,000,000 |
| 2.09% (FCPR DLY - 292 bps), | | | | |
| 12/17/2020(a) | | 50,000,000 | | 49,997,182 |
| 2.17% (US0001M + 16 bps), | | | | |
| 10/04/2021(a) | | 65,000,000 | | 65,000,000 |
| | | | 2,275,404,314 |
| Federal Home Loan Bank — 36.0% | | | | |
| 1.62%, 04/22/2020(b) | | 47,720,000 | | 47,348,958 |
| 1.62%, 04/24/2020(b) | | 93,000,000 | | 92,268,529 |
| 1.64%, 11/26/2019(b) | | 30,880,000 | | 30,843,544 |
| 1.64%, 12/26/2019(b) | | 567,673,000 | | 566,227,431 |
| 1.66%, 11/06/2019(b) | | 100,000,000 | | 99,972,292 |
| 1.66%, 04/03/2020(b) | | 9,800,000 | | 9,730,409 |
| 1.68%, 01/08/2020(b) | | 250,000,000 | | 249,195,806 |
| 1.72%, 04/15/2020 | | 100,000,000 | | 99,996,182 |
| 1.72% (US0003M - 22 bps), | | | | |
| 01/24/2020(a) | | 150,000,000 | | 150,000,000 |
| 1.74%, 11/27/2019(b) | | 414,500,000 | | 413,961,124 |
| 1.75% (US0003M - 19 bps), | | | | |
| 04/28/2020(a) | | 150,000,000 | | 150,000,000 |
| 1.76% (US0001M - 9 bps), | | | | |
| 11/21/2019(a) | | 65,000,000 | | 65,000,000 |
| 1.79% (US0001M - 6 bps), | | | | |
| 02/20/2020(a) | | 150,000,000 | | 150,000,000 |
| 1.82%, 11/20/2019(b) | | 240,807,000 | | 240,564,123 |
| 1.82% (US0001M - 3 bps), | | | | |
| 04/20/2020(a) | | 100,000,000 | | 100,000,000 |
| 1.83% (SOFR + 1 bps), | | | | |
| 11/13/2019(a) | | 95,000,000 | | 95,000,000 |
| 1.83%, 02/13/2020(b) | | 125,000,000 | | 124,335,556 |
| 1.83% (US0003M - 14 bps), | | | | |
| 01/21/2020(a) | | 400,000,000 | | 400,000,000 |
| 1.84% (US0001M - 5 bps), | | | | |
| 01/17/2020(a) | | 100,000,000 | | 100,000,000 |
| 1.84%, 12/06/2019(b) | | 575,000,000 | | 573,943,681 |
| 1.86% (US0003M - 13 bps), | | | | |
| 01/14/2020(a) | | 300,000,000 | | 300,000,000 |
| 1.87% (US0001M - 6 bps), | | | | |
| 03/12/2020(a) | | 50,000,000 | | 50,000,000 |
| 1.87% (SOFR + 5 bps), | | | | |
| 01/17/2020(a) | | 20,000,000 | | 20,000,000 |
| 1.87%, 11/22/2019(b) | | 384,000,000 | | 383,560,960 |
| 1.88% (SOFR + 6.50 bps), | | | | |
| 11/15/2019(a) | | 45,000,000 | | 45,000,000 |
| 1.88% (US0003M - 20 bps), | | | | |
| 01/02/2020(a) | | 100,000,000 | | 100,000,000 |
| 1.90%, 11/29/2019(b) | | 225,000,000 | | 224,655,425 |
| 1.90% (US0001M - 9 bps), | | | | |
| 02/07/2020(a) | | 50,000,000 | | 50,000,000 |
| 1.90% (US0003M - 23 bps), | | | | |
| 12/03/2019(a) | | 155,000,000 | | 154,989,218 |
| 1.91%, 12/04/2019(b) | | 198,000,000 | | 197,643,710 |
| 1.91% (US0001M - 1 bps), | | | | |
| 02/12/2020(a) | | 200,000,000 | | 200,000,000 |
| 1.92% (US0001M - 7 bps), | | | | |
| 02/07/2020(a) | | 125,000,000 | | 125,000,000 |
| 1.92% (US0003M - 20 bps), | | | | |
| 02/18/2020(a) | | 150,000,000 | | 150,000,000 |
| 1.94% (US0003M - 22 bps), | | | | |
| 12/23/2019(a) | | 200,000,000 | | 200,000,000 |
| 1.94% (US0003M - 22 bps), | | | | |
| 12/19/2019(a) | | 200,000,000 | | 200,000,000 |
| 1.97% (US0001M - 3 bps), | | | | |
| 08/04/2020(a) | | 150,000,000 | | 150,000,000 |
| 1.97%, 12/20/2019(b) | | 200,000,000 | | 199,455,556 |
| 1.97% (US0001M - 6 bps), | | | | |
| 11/01/2019(a) | | 100,000,000 | | 100,000,000 |
| | | | 6,608,692,504 |
| See notes to financial statements. | HSBC FAMILY OF FUNDS | 7 |
| HSBC U.S. GOVERNMENT MONEY MARKET FUND |
| Schedule of Portfolio Investments—as of October 31, 2019 (continued) |
| U.S. Government and Government Agency | | | | |
| Obligations, continued | | | | |
| | | | | |
| | Principal | | |
| | Amount ($) | | Value ($) |
| Federal Home Loan Mortgage Corporation — 6.3% | | | | |
| 1.65%, 03/18/2020(b) | | 100,000,000 | | 99,367,500 |
| 1.81%, 01/02/2020(b) | | 50,000,000 | | 49,841,986 |
| 1.82%, 01/22/2020(b) | | 100,000,000 | | 99,583,167 |
| 1.82% (SOFR + 1 bps), | | | | |
| 08/07/2020(a) | | 100,000,000 | | 100,000,000 |
| 1.83% (SOFR + 2 bps), | | | | |
| 11/05/2020(a) | | 125,000,000 | | 125,000,000 |
| 1.84% (SOFR + 2 bps), | | | | |
| 06/05/2020(a) | | 175,000,000 | | 175,000,000 |
| 1.84% (SOFR + 2 bps), | | | | |
| 07/08/2020(a) | | 100,000,000 | | 100,000,000 |
| 1.85% (SOFR + 3 bps), | | | | |
| 06/04/2020(a) | | 100,000,000 | | 100,000,000 |
| 1.85% (SOFR + 3 bps), | | | | |
| 01/22/2021(a) | | 100,000,000 | | 100,000,000 |
| 1.85% (SOFR + 3 bps), | | | | |
| 02/05/2021(a) | | 250,000,000 | | 250,000,000 |
| | | | 1,198,792,653 |
| TOTAL U.S. GOVERNMENT | | | | |
| AND GOVERNMENT | | | | |
| AGENCY OBLIGATIONS | | | | |
| (Cost $10,082,889,471) | | | | 10,082,889,471 |
| | | | | |
| U.S. Treasury Obligations — 6.3% | | | | |
| | | | | |
| U.S. Treasury Bills — 1.5% | | | | |
| 1.74%, 11/19/2019(b) | | 200,000,000 | | 199,805,000 |
| 1.82%, 01/02/2020(b) | | 75,000,000 | | 74,762,269 |
| | | | 274,567,269 |
| U.S. Treasury Notes — 4.8% | | | | |
| 1.75% (USBMMY3M + 12 bps), | | | | |
| 01/31/2021(a) | | 120,000,000 | | 119,959,770 |
| 1.78% (USBMMY3M + 14 bps), | | | | |
| 04/30/2021(a) | | 60,000,000 | | 59,943,755 |
| 2.25%, 03/31/2020 | | 415,000,000 | | 415,569,443 |
| 2.50%, 05/31/2020 | | 160,000,000 | | 160,773,416 |
| 2.63%, 08/31/2020 | | 130,000,000 | | 131,045,607 |
| | | | 887,291,991 |
| TOTAL U.S. TREASURY | | | | |
| OBLIGATIONS | | | | |
| (Cost $1,161,859,260) | | | | 1,161,859,260 |
| | | | | |
| Investment Companies — 3.2% | | | | |
| | | | | |
| | Shares | | Value ($) |
| BlackRock Liquidity Funds | | | | |
| FedFund Portfolio, | | | | |
| Institutional Shares, | | | | |
| 1.71%(c) | | 185,667,200 | | 185,667,200 |
| Dreyfus Government Cash | | | | |
| Management, Institutional | | | | |
| Shares, 1.73%(c) | | 213,208,914 | | 213,208,914 |
| Federated Government | | | | |
| Obligations Fund, Institutional | | | | |
| Shares, 1.70%(c) | | 200,186,608 | | 200,186,608 |
| TOTAL INVESTMENT | | | | |
| COMPANIES | | | | |
| (Cost $599,062,722) | | | | 599,062,722 |
| | | | | |
| Repurchase Agreements — 36.0% | | | | |
| | | | | |
| | Principal | | |
| | Amount ($) | | Value ($) |
| Fixed Income Clearing | | | | |
| Corporation (Bank of | | | | |
| New York), 1.73%, 11/1/19, | | | | |
| Purchased on 10/31/19, | | | | |
| with maturity value of | | | | |
| $1,200,057,667, collateralized | | | | |
| by U.S. Treasury Obligations, | | | | |
| 0.13%, 4/15/20, fair value | | | | |
| $1,224,000,093 | | 1,200,000,000 | | 1,200,000,000 |
| Citigroup Global Markets, | | | | |
| 1.74%, 11/1/19, Purchased | | | | |
| on 10/31/19, with maturity | | | | |
| value of $300,014,500, | | | | |
| collateralized by various U.S. | | | | |
| Government and Government | | | | |
| Agency Obligations, 0.00%- | | | | |
| 9%, 11/15/19-9/20/69, fair | | | | |
| value $306,000,000 | | 300,000,000 | | 300,000,000 |
| Canadian Imperial Bank, | | | | |
| 1.74%, 11/1/19, Purchased | | | | |
| on 10/31/19, with maturity | | | | |
| value of $100,004,833, | | | | |
| collateralized by various U.S. | | | | |
| Government and Government | | | | |
| Agency Obligations, 4.00%- | | | | |
| 4.50%, 6/1/44-3/1/49, fair | | | | |
| value $102,000,000 | | 100,000,000 | | 100,000,000 |
| Canadian Imperial Bank, | | | | |
| 1.72%, 11/1/19, Purchased | | | | |
| on 10/31/19, with maturity | | | | |
| value of $100,004,778, | | | | |
| collateralized by U.S. Treasury | | | | |
| Obligations, 0.38%-4.75%, | | | | |
| 12/15/20-5/15/48, fair value | | | | |
| $102,000,063 | | 100,000,000 | | 100,000,000 |
| Credit Agricole CIB NY, | | | | |
| 1.75%, 11/1/19, Purchased | | | | |
| on 10/31/19, with maturity | | | | |
| value of $110,005,347, | | | | |
| collateralized by U.S. | | | | |
| Government and Government | | | | |
| Agency Obligation, 3.50%- | | | | |
| 4.00%, 10/1/48-4/1/49, fair | | | | |
| value $112,200,000 | | 110,000,000 | | 110,000,000 |
| Deutsche Bank Securities, Inc., | | | | |
| 1.75%, 11/1/19, Purchased | | | | |
| on 10/31/19, with maturity | | | | |
| value of $500,024,306, | | | | |
| collateralized by U.S. | | | | |
| Government and Government | | | | |
| Agency Obligations, 0.00%- | | | | |
| 7.50%, 3/13/20-9/15/65, fair | | | | |
| value $510,000,092 | | 500,000,000 | | 500,000,000 |
| Merrill Lynch Pierce Fenner & | | | | |
| Smith, Inc., 1.73%, 11/1/19, | | | | |
| Purchased on 10/31/19, | | | | |
| with maturity value of | | | | |
| $100,004,806, collateralized | | | | |
| by various U.S. Treasury | | | | |
| Obligations, 0.00%-1.50%, | | | | |
| 1/23/20-8/15/26, fair value | | | | |
| $102,000,040 | | 100,000,000 | | 100,000,000 |
| 8 | HSBC FAMILY OF FUNDS | See notes to financial statements. |
| HSBC U.S. GOVERNMENT MONEY MARKET FUND |
| Schedule of Portfolio Investments—as of October 31, 2019 (continued) |
| Repurchase Agreements, continued | | | | | | |
| | | | | | | |
| | Principal | | | | |
| | Amount ($) | | Value ($) |
| Natwest Markets PLC, | | | | | | |
| 1.73%, 11/1/19, Purchased | | | | | | |
| on 10/31/19, with maturity | | | | | | |
| value of $500,024,028, | | | | | | |
| collateralized by U.S. Treasury | | | | | | |
| Obligations, 0.50%-6.63%, | | | | | | |
| 4/15/24-2/15/27, fair | | | | | | |
| value $510,000,005 | | 500,000,000 | | | 500,000,000 | |
| Royal Bank of Canada, 1.73%, | | | | | | |
| 11/1/19, Purchased on | | | | | | |
| 10/31/19, with maturity | | | | | | |
| value of $300,014,417, | | | | | | |
| collateralized by U.S. | | | | | | |
| Government and Government | | | | | | |
| Agency Obligations, 0.00%- | | | | | | |
| 6.00%, 8/1/33-10/1/49, fair | | | | | | |
| value $306,000,000 | | 300,000,000 | | | 300,000,000 | |
| Societe' Generale, 1.75%, | | | | | | |
| 11/1/19, Purchased on | | | | | | |
| 10/31/19, with maturity | | | | | | |
| value of $900,043,750, | | | | | | |
| collateralized by various U.S. | | | | | | |
| Government and Government | | | | | | |
| Agency Obligations, 2.50%- | | | | | | |
| 3.50%, 6/1/49-10/1/49, fair | | | | | | |
| value $918,000,001 | | 900,000,000 | | | 900,000,000 | |
| Societe' Generale, 1.85%, | | | | | | |
| 11/12/19, Purchased on | | | | | | |
| 10/08/19, with maturity | | | | | | |
| value of $400,719,444, | | | | | | |
| collateralized by U.S. | | | | | | |
| Government and Government | | | | | | |
| Agency Obligations, | | | | | | |
| 4.00%, 2/1/48, fair value | | | | | | |
| $408,000,001 | | 400,000,000 | | | 400,000,000 | |
| Societe' Generale, 1.85%, | | | | | | |
| 11/25/19, Purchased on | | | | | | |
| 10/17/19, with maturity | | | | | | |
| value of $200,400,833, | | | | | | |
| collateralized by various U.S. | | | | | | |
| Treasury Obligations, 0.00%- | | | | | | |
| 8.13%, 11/30/19-5/15/46, fair | | | | | | |
| value $204,000,001 | | 200,000,000 | | | 200,000,000 | |
| Societe' Generale, 1.76%, | | | | | | |
| 11/22/19, Purchased on | | | | | | |
| 10/23/19, with maturity | | | | | | |
| value of $100,146,667, | | | | | | |
| collateralized by various U.S. | | | | | | |
| Treasury Obligations, 0.00%- | | | | | | |
| 2.75%, 12/5/19-8/15/42, fair | | | | | | |
| value $102,000,038 | | 100,000,000 | | | 100,000,000 | |
| Fixed Income Clearing | | | | | | |
| Corporation (State Street | | | | | | |
| Bank), 1.73%, 11/1/19, | | | | | | |
| Purchased on 10/31/19, | | | | | | |
| with maturity value of | | | | | | |
| $1,100,052,861, collateralized | | | | | | |
| by U.S. Treasury Obligations, | | | | | | |
| 0.00%, 8/15/25-5/15/43, fair | | | | | | |
| value $1,122,003,274 | | 1,100,000,000 | | | 1,100,000,000 | |
| Standard Chartered Bank, | | | | | | |
| 1.73%, 11/1/19, Purchased | | | | | | |
| on 10/31/19, with maturity | | | | | | |
| value of $300,014,417, | | | | | | |
| collateralized by various U.S. | | | | | | |
| Government and Government | | | | | | |
| Agency Obligations, 0.00%- | | | | | | |
| 6.00%, 12/5/19-3/20/67, fair | | | | | | |
| value $306,000,000 | | 300,000,000 | | | 300,000,000 | |
| Toronto Dominion Bank NY, | | | | | | |
| 1.75%, 11/1/19, Purchased | | | | | | |
| on 10/31/19, with maturity | | | | | | |
| value of $250,012,153, | | | | | | |
| collateralized by U.S. Treasury | | | | | | |
| Obligations, 2.63%-2.88%, | | | | | | |
| 1/31/26-8/15/28, fair value | | | | | | |
| $255,000,079 | | 250,000,000 | | | 250,000,000 | |
| Toronto Dominion Bank NY, | | | | | | |
| 1.72%, 11/6/19, Purchased | | | | | | |
| on 10/30/19, with maturity | | | | | | |
| value of $200,066,889, | | | | | | |
| collateralized by U.S. Treasury | | | | | | |
| Obligations, 2.38%-3.63%, | | | | | | |
| 2/15/21-8/15/24, fair value | | | | | | |
| $204,000,040 | | 200,000,000 | | | 200,000,000 | |
| TOTAL REPURCHASE | | | | | | |
| AGREEMENTS | | | | | | |
| (Cost $6,660,000,000) | | | | | 6,660,000,000 | |
| TOTAL INVESTMENTS | | | | | | |
| IN SECURITIES | | | | | | |
| (Cost $18,503,811,453) — | | | | | | |
| 100.1% | | | | | 18,503,811,453 | |
| Other Assets | | | | | | |
| (Liabilities) - (0.1)% | | | | | (12,407,757 | ) |
| NET ASSETS - 100% | | | | $ | 18,491,403,696 | |
____________________
| (a) | | Floating or variable rate security linked to the referenced benchmark. The rate presented represents the rate in effect on October 31, 2019. These securities are deemed to have a maturity remaining until the next adjustment of the interest rate or the longer of the demand period of time to the next readjustment. |
| (b) | | Discount note. Rate presented represents the effective yield at time of purchase. |
| (c) | | The rate represents the annualized one day yield that was in effect on October 31, 2019. |
bps - Basis Points
FCPR DLY - Federal Reserve Bank Prime Rate Loan US
FEDL01 - Effective Federal Funds Rate
SOFR - Secured Overnight Financing Rate
USBMMY3M - 3 Month Treasury Bill Rate
US0001M - 1 Month US Dollar LIBOR
US0003M - 3 Month US Dollar LIBOR
| See notes to financial statements. | HSBC FAMILY OF FUNDS | 9 |
| HSBC U.S. TREASURY MONEY MARKET FUND |
| Schedule of Portfolio Investments—as of October 31, 2019 |
| U.S. Treasury Obligations — 104.2% |
| | Principal | | | | |
| | Amount ($) | | Value ($) |
| U.S. Treasury Bills — 84.0% | | | | | | |
| 1.33%, 11/05/2019(a) | | 202,000,000 | | | 201,962,777 | |
| 1.47%, 12/31/2019(a) | | 85,000,000 | | | 84,788,211 | |
| 1.63%, 12/17/2019(a) | | 90,000,000 | | | 89,808,781 | |
| 1.64%, 12/24/2019(a) | | 220,000,000 | | | 219,460,846 | |
| 1.66%, 12/03/2019(a) | | 100,000,000 | | | 99,848,023 | |
| 1.66%, 12/10/2019(a) | | 90,000,000 | | | 89,834,684 | |
| 1.67%, 01/09/2020(a) | | 125,000,000 | | | 124,594,242 | |
| 1.68%, 04/09/2020(a) | | 50,000,000 | | | 49,626,667 | |
| 1.74%, 11/19/2019(a) | | 101,100,000 | | | 101,007,461 | |
| 1.80%, 11/26/2019(a) | | 150,000,000 | | | 149,805,208 | |
| 1.82%, 11/14/2019(a) | | 85,000,000 | | | 84,939,993 | |
| 1.82%, 01/02/2020(a) | | 50,000,000 | | | 49,841,513 | |
| 1.84%, 11/12/2019(a) | | 66,000,000 | | | 65,959,465 | |
| 1.85%, 01/16/2020(a) | | 55,000,000 | | | 54,782,731 | |
| 1.87%, 12/05/2019(a) | | 35,000,000 | | | 34,936,500 | |
| 1.87%, 12/12/2019(a) | | 100,000,000 | | | 99,781,846 | |
| 1.87%, 12/26/2019(a) | | 50,000,000 | | | 49,854,632 | |
| 1.89%, 11/29/2019(a) | | 50,000,000 | | | 49,924,144 | |
| | | | | | 1,700,757,724 | |
| U.S. Treasury Notes — 20.2% | | | | | | |
| 1.38%, 03/31/2020 | | 25,000,000 | | | 24,944,929 | |
| 1.67% (USBMMY3M + 3 bps), 04/30/2020(b) | | 10,000,000 | | | 10,001,331 | |
| 1.68% (USBMMY3M + 4 bps), 07/31/2020(b) | | 50,000,000 | | | 50,000,000 | |
| 1.68% (USBMMY3M + 5 bps), 10/31/2020(b) | | 25,000,000 | | | 24,973,739 | |
| 1.75% (USBMMY3M + 12 bps), 01/31/2021(b) | | 150,000,000 | | | 149,934,929 | |
| 1.78% (USBMMY3M + 14 bps), 04/30/2021(b) | | 25,000,000 | | | 24,999,450 | |
| 2.13%, 08/31/2020 | | 20,000,000 | | | 20,079,665 | |
| 2.25%, 03/31/2020 | | 50,000,000 | | | 50,068,628 | |
| 2.50%, 05/31/2020 | | 20,000,000 | | | 20,096,733 | |
| 2.50%, 06/30/2020 | | 25,000,000 | | | 25,095,083 | |
| 2.63%, 08/31/2020 | | 10,000,000 | | | 10,080,432 | |
| | | | | | 410,274,919 | |
| TOTAL U.S. TREASURY OBLIGATIONS (Cost $2,111,032,643) | | | | | 2,111,032,643 | |
| TOTAL INVESTMENTS IN SECURITIES (Cost $2,111,032,643) — 104.2% | | | | | 2,111,032,643 | |
| Other Assets (Liabilities) - (4.2)% | | | | | (84,632,019 | ) |
| NET ASSETS - 100% | | | | $ | 2,026,400,624 | |
____________________
| (a) | Discount note. Rate presented represents the effective yield at time of purchase. |
| (b) | Floating or variable rate security linked to the referenced benchmark. The rate presented represents the rate in effect on October 31, 2019. These securities are deemed to have a maturity remaining until the next adjustment of the interest rate or the longer of the demand period of time to the next readjustment. |
bps - Basis Points
USBMMY3M - 3 Month Treasury Bill Rate
| 10 | HSBC FAMILY OF FUNDS | See notes to financial statements. |
HSBC FAMILY OF FUNDS
Statements of Assets and Liabilities—as of October 31, 2019
| | HSBC U.S. | | HSBC |
| | Government | | U.S. Treasury |
| | Money Market | | Money Market |
| | Fund | | Fund |
| Assets: | | | | | | | | | | |
| Investments in securities, at value | | | $ | 11,843,811,453 | | | | $ | 2,111,032,643 | |
| Repurchase agreements, at value | | | | 6,660,000,000 | | | | | — | |
| Cash | | | | 949,317 | | | | | 778,864 | |
| Interest receivable | | | | 19,441,474 | | | | | 679,210 | |
| Prepaid expenses and other assets | | | | 257,813 | | | | | 63,483 | |
| Total Assets | | | | 18,524,460,057 | | | | | 2,112,554,200 | |
| | | | | | | | | | | |
| Liabilities: | | | | | | | | | | |
| Distributions payable | | | | 9,877,591 | | | | | 887,907 | |
| Payable for investments purchased | | | | 19,997,897 | | | | | 84,788,211 | |
| Accrued expenses and other liabilities: | | | | | | | | | | |
| Investment Management | | | | 1,669,000 | | | | | 247,823 | |
| Administration | | | | 469,858 | | | | | 62,201 | |
| Shareholder Servicing | | | | 416,311 | | | | | 29,965 | |
| Accounting | | | | 5,500 | | | | | 5,791 | |
| Custodian fees | | | | 89,224 | | | | | 1,669 | |
| Transfer Agent | | | | 37,900 | | | | | 14,655 | |
| Trustee | | | | 1,501 | | | | | 1,498 | |
| Other | | | | 491,579 | | | | | 113,856 | |
| Total Liabilities | | | | 33,056,361 | | | | | 86,153,576 | |
| Net Assets | | | $ | 18,491,403,696 | | | | $ | 2,026,400,624 | |
| | | | | | | | | | | |
| Composition of Net Assets: | | | | | | | | | | |
| Paid in capital | | | | 18,491,403,209 | | | | | 2,026,372,767 | |
| Total distributable earnings/loss | | | | 487 | | | | | 27,857 | |
| Net Assets | | | $ | 18,491,403,696 | | | | $ | 2,026,400,624 | |
| | | | | | | | | | | |
| Net Assets: | | | | | | | | | | |
| Class A Shares | | | $ | 2,923,163 | | | | $ | — | |
| Class D Shares | | | | 1,910,114,807 | | | | | 143,505,703 | |
| Class I Shares | | | | 13,988,739,047 | | | | | 879,395,842 | |
| Intermediary Class Shares | | | | 504,329,041 | | | | | 165,841,814 | |
| Intermediary Service Class Shares | | | | 146,441,364 | | | | | 86,073,380 | |
| Class Y Shares | | | | 1,938,856,274 | | | | | 751,583,885 | |
| | | $ | 18,491,403,696 | | | | $ | 2,026,400,624 | |
| | | | | | | | | | | |
| Shares Outstanding: | | | | | | | | | | |
| ($0.001 par value, unlimited number of shares authorized): | | | | | | | | | | |
| Class A Shares | | | | 2,923,125 | | | | | — | |
| Class D Shares | | | | 1,909,922,759 | | | | | 143,535,558 | |
| Class I Shares | | | | 13,988,889,898 | | | | | 879,389,393 | |
| Intermediary Class Shares | | | | 504,330,086 | | | | | 165,837,895 | |
| Intermediary Service Class Shares | | | | 146,444,879 | | | | | 86,072,339 | |
| Class Y Shares | | | | 1,938,908,809 | | | | | 751,542,549 | |
| | | | | | | | | | | |
| Net Asset Value, Offering Price and Redemption Price per share: | | | | | | | | | | |
| Class A Shares | | | $ | 1.00 | | | | $ | — | |
| Class D Shares | | | $ | 1.00 | | | | $ | 1.00 | |
| Class I Shares | | | $ | 1.00 | | | | $ | 1.00 | |
| Intermediary Class Shares | | | $ | 1.00 | | | | $ | 1.00 | |
| Intermediary Service Class Shares | | | $ | 1.00 | | | | $ | 1.00 | |
| Class Y Shares | | | $ | 1.00 | | | | $ | 1.00 | |
| Investment in securities, at cost | | | $ | 11,843,811,453 | | | | $ | 2,111,032,643 | |
| Repurchase agreements, at cost | | | $ | 6,660,000,000 | | | | $ | — | |
____________________
Amounts designated as “—” are $0.00 or have been rounded to $0.00.
| See notes to financial statements. | HSBC FAMILY OF FUNDS | 11 |
HSBC FAMILY OF FUNDS
Statements of Operations—For the year ended October 31, 2019
| | HSBC U.S. | | HSBC U.S. |
| | Government | | Treasury |
| | Money Market | | Money Market |
| | Fund | | Fund |
| Investment Income: | | | | | | | | | | | | |
| Interest | | | $ | 308,875,861 | | | | | $ | 41,476,700 | | |
| Dividends | | | | 12,651,116 | | | | | | — | | |
| Total Investment Income | | | | 321,526,977 | | | | | | 41,476,700 | | |
| | | | | | | | | | | | | |
| Expenses: | | | | | | | | | | | | |
| Investment Management | | | | 13,884,140 | | | | | | 1,821,502 | | |
| Operational Support: | | | | | | | | | | | | |
| Class A Shares | | | | 2,997 | | | | | | — | | |
| Class D Shares | | | | 1,703,912 | | | | | | 189,216 | | |
| Intermediary Class Shares | | | | 250,790 | | | | | | 178,450 | | |
| Intermediary Service Class Shares | | | | 154,080 | | | | | | 68,851 | | |
| Class Y Shares | | | | 1,915,742 | | | | | | 756,533 | | |
| Administration: | | | | | | | | | | | | |
| Class A Shares | | | | 1,149 | | | | | | — | | |
| Class D Shares | | | | 653,001 | | | | | | 72,739 | | |
| Class I Shares | | | | 3,773,063 | | | | | | 241,039 | | |
| Intermediary Class Shares | | | | 95,687 | | | | | | 68,372 | | |
| Intermediary Service Class Shares | | | | 59,082 | | | | | | 26,366 | | |
| Class Y Shares | | | | 734,623 | | | | | | 290,035 | | |
| Shareholder Servicing: | | | | | | | | | | | | |
| Class A Shares | | | | 11,229 | | | | | | — | | |
| Class D Shares | | | | 4,259,811 | | | | | | 473,044 | | |
| Intermediary Class Shares | | | | 125,399 | | | | | | 89,228 | | |
| Intermediary Service Class Shares | | | | 154,080 | | | | | | 68,851 | | |
| Accounting | | | | 67,107 | | | | | | 57,887 | | |
| Compliance Services | | | | 31,392 | | | | | | 31,392 | | |
| Custodian | | | | 853,693 | | | | | | 104,175 | | |
| Printing | | | | 274,821 | | | | | | 22,734 | | |
| Professional | | | | 161,342 | | | | | | 150,625 | | |
| Transfer Agent | | | | 371,309 | | | | | | 147,335 | | |
| Trustee | | | | 81,000 | | | | | | 80,997 | | |
| Registration fees | | | | 145,348 | | | | | | 85,551 | | |
| Other | | | | 535,816 | | | | | | 119,853 | | |
| Total expenses before fee and expense reductions | | | | 30,300,613 | | | | | | 5,144,775 | | |
| Fees voluntarily reduced/reimbursed by Investment Adviser | | | | (2,005,548 | ) | | | | | (282,702 | ) | |
| Fees contractually reduced/reimbursed by Investment Adviser | | | | (1,734,355 | ) | | | | | (482,618 | ) | |
| Fees voluntarily reduced by Administrator | | | | (985,671 | ) | | | | | (56,780 | ) | |
| Fees voluntarily reduced by Shareholder Servicing Agent | | | | (279,479 | ) | | | | | (158,079 | ) | |
| Custody earnings credit | | | | (197,630 | ) | | | | | (37,859 | ) | |
| Net Expenses | | | | 25,097,930 | | | | | | 4,126,737 | | |
| | | | | | | | | | | | | |
| Net Investment Income | | | | 296,429,047 | | | | | | 37,349,963 | | |
| | | | | | | | | | | | | |
| Realized/Unrealized Gains/(Losses) from Investments: | | | | | | | | | | | | |
| Net realized gains/(losses) from investments in securities | | | | 83,830 | | | | | | 58,815 | | |
| Net realized/unrealized gains/(losses) on investments | | | | 83,830 | | | | | | 58,815 | | |
| Change in Net Assets Resulting from Operations | | | $ | 296,512,877 | | | | | $ | 37,408,778 | | |
____________________
Amounts designated as “—” are $0.00 or have been rounded to $0.00.
| 12 | HSBC FAMILY OF FUNDS | See notes to financial statements. |
HSBC FAMILY OF FUNDS
Statements of Changes in Net Assets
| HSBC U.S. Government | | HSBC U.S. Treasury |
| Money Market Fund | | Money Market Fund |
| Year Ended | Year Ended | | Year Ended | Year Ended |
| October 31, 2019 | October 31, 2018 | | October 31, 2019 | October 31, 2018 |
| Investment Activities: | | | | | | | | | | | | | | | | | | | | | |
| Operations: | | | | | | | | | | | | | | | | | | | | | |
| Net investment income | | $ | 296,429,047 | | | | $ | 152,355,965 | | | | | $ | 37,349,963 | | | | $ | 27,424,968 | | |
| Net realized gains/(losses) from investments | | | 83,830 | | | | | (101,139 | ) | | | | | 58,815 | | | | | (28,378 | ) | |
| Change in net assets resulting from operations | | | 296,512,877 | | | | | 152,254,826 | | | | | | 37,408,778 | | | | | 27,396,590 | | |
| | | | | | | | | | | | | | | | | | | | | | |
| | | | | | | | | | | | | | | | | | | | | |
| Distributions to shareholders: | | | | | | | | | | | | | | | | | | | | | |
| Class A Shares | | | (51,060 | ) | | | | (24,470 | ) | | | | | — | | | | | — | | |
| Class D Shares | | | (31,405,727 | ) | | | | (19,666,401 | ) | | | | | (3,391,661 | ) | | | | (2,460,655 | ) | |
| Class I Shares | | | (216,281,079 | ) | | | | (103,412,452 | ) | | | | | (13,380,971 | ) | | | | (9,224,480 | ) | |
| Intermediary Class Shares | | | (5,229,295 | ) | | | | (2,755,565 | ) | | | | | (3,755,736 | ) | | | | (1,806,276 | ) | |
| Intermediary Service Class Shares | | | (3,317,464 | ) | | | | (1,548,121 | ) | | | | | (1,442,852 | ) | | | | (662,873 | ) | |
| Class Y Shares | | | (40,147,528 | ) | | | | (24,958,653 | ) | | | | | (15,378,362 | ) | | | | (13,271,641 | ) | |
| Change in net assets resulting from | | | | | | | | | | | | | | | | | | | | | |
| distributions to shareholders | | | (296,432,153 | ) | | | | (152,365,662 | ) | | | | | (37,349,582 | ) | | | | (27,425,925 | ) | |
| | | | | | | | | | | | | | | | | | | | | | |
| Change in net assets resulting from | | | | | | | | | | | | | | | | | | | | | |
| capital transactions | | | 8,332,739,867 | | | | | (1,821,073,641 | ) | | | | | 91,383,031 | | | | | (307,254,231 | ) | |
| Change in net assets | | | 8,332,820,591 | | | | | (1,821,184,477 | ) | | | | | 91,442,227 | | | | | (307,283,566 | ) | |
| | | | | | | | | | | | | | | | | | | | | | |
| Net Assets: | | | | | | | | | | | | | | | | | | | | | |
| Beginning of period | | | 10,158,583,105 | | | | | 11,979,767,582 | | | | | | 1,934,958,397 | | | | | 2,242,241,963 | | |
| End of period | | $ | 18,491,403,696 | | | | $ | 10,158,583,105 | | | | | $ | 2,026,400,624 | | | | $ | 1,934,958,397 | | |
____________________
Amounts designated as “—” are $0.00 or have been rounded to $0.00.
| See notes to financial statements. | HSBC FAMILY OF FUNDS | 13 |
| HSBC FAMILY OF FUNDS |
| Statements of Changes in Net Assets (continued) |
| | HSBC U.S. Government | | HSBC U.S. Treasury |
| | Money Market Fund | | Money Market Fund |
| | Year Ended | Year Ended | | Year Ended | Year Ended |
| | October 31, 2019 | October 31, 2018 | | October 31, 2019 | October 31, 2018 |
| CAPITAL TRANSACTIONS*: | | | | | | | | | | | | | | | | | | | | | | | |
| Class A Shares | | | | | | | | | | | | | | | | | | | | | | | |
| Proceeds from shares issued | | | $ | 1,176,657 | | | | $ | 1,420,071 | | | | | $ | — | | | | | $ | — | | |
| Dividends reinvested | | | | 50,977 | | | | | 24,437 | | | | | | — | | | | | | — | | |
| Value of shares redeemed | | | | (1,032,739 | ) | | | | (714,565 | ) | | | | | — | | | | | | — | | |
| Class A Shares capital transactions | | | | 194,895 | | | | | 729,943 | | | | | | — | | | | | | — | | |
| | | | | | | | | | | | | | | | | | | | | | | | |
| Class D Shares | | | | | | | | | | | | | | | | | | | | | | | |
| Proceeds from shares issued | | | | 3,440,581,846 | | | | | 3,738,220,266 | | | | | | 1,825,704,785 | | | | | 1,080,459,039 | | |
| Dividends reinvested | | | | 23,409,695 | | | | | 13,844,262 | | | | | | 2,995,672 | | | | | 1,712,324 | | |
| Value of shares redeemed | | | | (3,202,111,905 | ) | | | | (3,749,041,777 | ) | | | | | (1,993,338,012 | ) | | | | (1,031,094,573 | ) | |
| Class D Shares capital transactions | | | | 261,879,636 | | | | | 3,022,751 | | | | | | (164,637,555 | ) | | | | 51,076,790 | | |
| | | | | | | | | | | | | | | | | | | | | | | |
| Class I Shares | | | | | | | | | | | | | | | | | | | | | | | |
| Proceeds from shares issued | | | | 181,917,798,082 | | | | | 108,881,275,893 | | | | | | 7,209,747,161 | | | | | 7,277,473,790 | | |
| Dividends reinvested | | | | 99,117,524 | | | | | 45,087,744 | | | | | | 6,168,168 | | | | | 4,029,375 | | |
| Value of shares redeemed | | | | (174,428,939,474 | ) | | | | (110,379,050,672 | ) | | | | | (7,044,341,005 | ) | | | | (7,435,633,995 | ) | |
| Class I Shares capital transactions | | | | 7,587,976,132 | | | | | (1,452,687,035 | ) | | | | | 171,574,324 | | | | | (154,130,830 | ) | |
| | | | | | | | | | | | | | | | | | | | | | | |
| Intermediary Class Shares | | | | | | | | | | | | | | | | | | | | | | | |
| Proceeds from shares issued | | | | 2,825,542,009 | | | | | 1,294,482,655 | | | | | | 508,577,385 | | | | | 312,385,011 | | |
| Dividends reinvested | | | | 1,288,731 | | | | | 274,502 | | | | | | 567 | | | | | | 15 | | |
| Value of shares redeemed | | | | (2,486,584,081 | ) | | | | (1,150,368,774 | ) | | | | | (512,568,687 | ) | | | | (142,557,401 | ) | |
| Intermediary Class Shares | | | | | | | | | | | | | | | | | | | | | | | |
| capital transactions | | | | 340,246,659 | | | | | 144,388,383 | | | | | | (3,990,735 | ) | | | | 169,827,625 | | |
| | | | | | | | | | | | | | | | | | | | | | | |
| Intermediary Service Class Shares | | | | | | | | | | | | | | | | | | | | | | | |
| Proceeds from shares issued | | | | 1,651,640,014 | | | | | 1,719,925,638 | | | | | | 76,944,812 | | | | | 65,384,844 | | |
| Dividends reinvested | | | | 2,093,834 | | | | | 522,793 | | | | | | 833,884 | | | | | | 326,427 | | |
| Value of shares redeemed | | | | (1,692,214,442 | ) | | | | (1,592,568,189 | ) | | | | | (42,927,715 | ) | | | | (36,505,552 | ) | |
| Intermediary Service Class | | | | | | | | | | | | | | | | | | | | | | | |
| Shares capital transactions | | | | (38,480,594 | ) | | | | 127,880,242 | | | | | | 34,850,981 | | | | | 29,205,719 | | |
| | | | | | | | | | | | | | | | | | | | | | | |
| Class Y Shares | | | | | | | | | | | | | | | | | | | | | | | |
| Proceeds from shares issued | | | | 11,450,392,586 | | | | | 9,462,774,658 | | | | | | 1,858,420,901 | | | | | 1,764,679,669 | | |
| Dividends reinvested | | | | 38,694,301 | | | | | 23,299,512 | | | | | | 14,980,595 | | | | | 12,937,171 | | |
| Value of shares redeemed | | | | (11,308,163,748 | ) | | | | (10,130,482,095 | ) | | | | | (1,819,815,480 | ) | | | | (2,180,850,375 | ) | |
| Class Y Shares capital transactions | | | | 180,923,139 | | | | | (644,407,925 | ) | | | | | 53,586,016 | | | | | (403,233,535 | ) | |
| Change in net assets resulting from capital | | | | | | | | | | | | | | | | | | | | | | | |
| transactions | | | $ | 8,332,739,867 | | | | $ | (1,821,073,641 | ) | | | | $ | 91,383,031 | | | | $ | (307,254,231 | ) | |
____________________
Amounts designated as “—“ are $0.00 or have been rounded to $0.00.
* Share transactions are at net asset value of $1.00 per share.
| 14 | HSBC FAMILY OF FUNDS | See notes to financial statements. |
| HSBC U.S. GOVERNMENT MONEY MARKET FUND |
| Financial Highlights |
Selecteddata for a shareoutstanding throughouttheperiods indicated.
| | | | Investment Activities | | Distributions | | | | | | Ratios/SupplementaryData |
| | Net Asset
Value,
Beginning
ofPeriod | | Net
Investment
Income | | Net
Realizedand
Unrealized
Gains
(Losses)from
Investments | | Total from
Investment
Activities | | Net
Investment
Income | | NetRealized
Gains from
Investment
Transactions | | Total
Distributions | | Net
Asset
Value,
End of
Period | | Total
Return(a) | | NetAssets
at End of
Period
(000’s) | | Ratio of Net
Expensesto
AverageNet
Assets(b) | | Ratio of Net
Investment
Incometo
AverageNet
Assets(b) | | Ratio of
Expenses
toAverage
NetAssets
(ExcludingFee
Reductions)(b) |
| CLASS A SHARES | | | | | | | | | | | | | | | | | | | | | | | | | | | | | | | | | | | | | | | | | | | | | | | | | | | | |
| Year Ended October 31, 2019 | | $ | 1.00 | | | $ | 0.02 | | | $ | — | | | $ | 0.02 | | | $ | (0.02 | ) | | $ | — | | | $ | (0.02 | ) | | $ | 1.00 | | | | 1.71 | % | | $ | 2,923 | | | | 0.63 | % | | | 1.70 | % | | | 0.63 | % |
| Year Ended October 31, 2018 | | | 1.00 | | | | 0.01 | | | | — | | | | 0.01 | | | | (0.01 | ) | | | — | | | | (0.01 | ) | | | 1.00 | | | | 1.05 | % | | | 2,728 | | | | 0.63 | % | | | 1.08 | % | | | 0.65 | % |
| Year Ended October 31, 2017 | | | 1.00 | | | | — | | | | — | | | | — | | | | — | | | | — | | | | — | | | | 1.00 | | | | 0.22 | % | | | 1,998 | | | | 0.59 | % | | | 0.23 | % | | | 0.68 | % |
| Year Ended October 31, 2016 | | | 1.00 | | | | — | | | | — | | | | — | | | | — | | | | — | | | | — | | | | 1.00 | | | | 0.02 | % | | | 1,720 | | | | 0.34 | % | | | 0.02 | % | | | 0.69 | % |
| Year Ended October 31, 2015 | | | 1.00 | | | | — | | | | — | | | | — | | | | — | | | | — | | | | — | | | | 1.00 | | | | 0.03 | % | | | 929 | | | | 0.08 | % | | | 0.03 | % | | | 0.69 | % |
| CLASS D SHARES | | | | | | | | | | | | | | | | | | | | | | | | | | | | | | | | | | | | | | | | | | | | | | | | | | | | |
| Year Ended October 31, 2019 | | $ | 1.00 | | | $ | 0.02 | | | | — | | | $ | 0.02 | | | $ | (0.02 | ) | | | — | | | $ | (0.02 | ) | | $ | 1.00 | | | | 1.87 | % | | $ | 1,910,115 | | | | 0.48 | % | | | 1.84 | % | | | 0.51 | % |
| Year Ended October 31, 2018 | | | 1.00 | | | | 0.01 | | | | — | | | | 0.01 | | | | (0.01 | ) | | | — | | | | (0.01 | ) | | | 1.00 | | | | 1.20 | % | | | 1,648,226 | | | | 0.48 | % | | | 1.19 | % | | | 0.51 | % |
| Year Ended October 31, 2017 | | | 1.00 | | | | — | | | | — | | | | — | | | | — | | | | — | | | | — | | | | 1.00 | | | | 0.34 | % | | | 1,645,222 | | | | 0.47 | % | | | 0.32 | % | | | 0.54 | % |
| Year Ended October 31, 2016 | | | 1.00 | | | | — | | | | — | | | | — | | | | — | | | | — | | | | — | | | | 1.00 | | | | 0.02 | % | | | 1,949,225 | | | | 0.34 | % | | | 0.02 | % | | | 0.54 | % |
| Year Ended October 31, 2015 | | | 1.00 | | | | — | | | | — | | | | — | | | | — | | | | — | | | | — | | | | 1.00 | | | | 0.03 | % | | | 888,084 | | | | 0.07 | % | | | 0.03 | % | | | 0.53 | % |
| CLASS E SHARES | | | | | | | | | | | | | | | | | | | | | | | | | | | | | | | | | | | | | | | | | | | | | | | | | | | | |
| October 31, 2016 through | | | | | | | | | | | | | | | | | | | | | | | | | | | | | | | | | | | | | | | | | | | | | | | | | | | | |
| August 10, 2017(c) | | $ | 1.00 | | | | — | | | | — | | | | — | | | | — | | | | — | | | | — | | | $ | 1.00 | | | | 0.26 | % | | $ | — | | | | 0.23 | % | | | 0.33 | % | | | 0.29 | % |
| July 12, 2016(d) through | | | | | | | | | | | | | | | | | | | | | | | | | | | | | | | | | | | | | | | | | | | | | | | | | | | | |
| October 31, 2016 | | | 1.00 | | | | — | | | | — | | | | — | | | | — | | | | — | | | | — | | | | 1.00 | | | | 0.11 | % | | | 2 | | | | 0.06 | % | | | 0.32 | % | | | 0.31 | % |
| CLASS I SHARES | | | | | | | | | | | | | | | | | | | | | | | | | | | | | | | | | | | | | | | | | | | | | | | | | | | | |
| Year Ended October 31, 2019 | | $ | 1.00 | | | $ | 0.02 | | | | — | | | $ | 0.02 | | | $ | (0.02 | ) | | | — | | | $ | (0.02 | ) | | $ | 1.00 | | | | 2.23 | % | | $ | 13,988,739 | | | | 0.12 | % | | | 2.19 | % | | | 0.16 | % |
| Year Ended October 31, 2018 | | | 1.00 | | | | 0.02 | | | | — | | | | 0.02 | | | | (0.02 | ) | | | — | | | | (0.02 | ) | | | 1.00 | | | | 1.57 | % | | | 6,400,700 | | | | 0.12 | % | | | 1.52 | % | | | 0.16 | % |
| Year Ended October 31, 2017 | | | 1.00 | | | | 0.01 | | | | — | | | | 0.01 | | | | (0.01 | ) | | | — | | | | (0.01 | ) | | | 1.00 | | | | 0.69 | % | | | 7,853,457 | | | | 0.12 | % | | | 0.71 | % | | | 0.18 | % |
| Year Ended October 31, 2016 | | | 1.00 | | | | — | | | | — | | | | — | | | | — | | | | — | | | | — | | | | 1.00 | | | | 0.21 | % | | | 4,687,197 | | | | 0.14 | % | | | 0.23 | % | | | 0.19 | % |
| Year Ended October 31, 2015 | | | 1.00 | | | | — | | | | — | | | | — | | | | — | | | | — | | | | — | | | | 1.00 | | | | 0.03 | % | | | 1,589,264 | | | | 0.07 | % | | | 0.03 | % | | | 0.18 | % |
| INTERMEDIARY CLASS SHARES | | | | | | | | | | | | | | | | | | | | | | | | | | | | | | | | | | | | | | | | | | | | | | | | | | | | |
| Year Ended October 31, 2019 | | $ | 1.00 | | | $ | 0.02 | | | | — | | | $ | 0.02 | | | $ | (0.02 | ) | | | — | | | $ | (0.02 | ) | | $ | 1.00 | | | | 2.20 | % | | $ | 504,329 | | | | 0.15 | % | | | 2.09 | % | | | 0.30 | % |
| Year Ended October 31, 2018 | | | 1.00 | | | | 0.02 | | | | — | | | | 0.02 | | | | (0.02 | ) | | | — | | | | (0.02 | ) | | | 1.00 | | | | 1.52 | % | | | 164,082 | | | | 0.16 | % | | | 1.57 | % | | | 0.31 | % |
| Year Ended October 31, 2017 | | | 1.00 | | | | 0.01 | | | | — | | | | 0.01 | | | | (0.01 | ) | | | — | | | | (0.01 | ) | | | 1.00 | | | | 0.63 | % | | | 19,694 | | | | 0.18 | % | | | 0.65 | % | | | 0.33 | % |
| July 12, 2016(d) through | | | | | | | | | | | | | | | | | | | | | | | | | | | | | | | | | | | | | | | | | | | | | | | | | | | | |
| October 31, 2016 | | | 1.00 | | | | — | | | | — | | | | — | | | | — | | | | — | | | | — | | | | 1.00 | | | | 0.11 | % | | | 10,121 | | | | 0.18 | % | | | 0.26 | % | | | 0.37 | % |
| See notes to financial statements. | HSBC FAMILY OF FUNDS | 15 |
| HSBC U.S. GOVERNMENT MONEY MARKET FUND |
| Financial Highlights (continued) |
| | | | Investment Activities | | Distributions | | | | | | Ratios/SupplementaryData |
| | Net Asset
Value,
Beginning
ofPeriod | | Net
Investment
Income | | Net
Realizedand
Unrealized
Gains
(Losses)from
Investments | | Total from
Investment
Activities | | Net
Investment
Income | | NetRealized
Gains from
Investment
Transactions | | Total
Distributions | | Net
Asset
Value,
End of
Period | | Total
Return(a) | | Net Assets
at End of
Period
(000’s) | | Ratio of Net
Expensesto
AverageNet
Assets(b) | | Ratio of Net
Investment
Incometo
AverageNet
Assets(b) | | Ratio of
Expenses
toAverage
NetAssets
(ExcludingFee
Reductions)(b) |
| INTERMEDIARY SERVICE | | | | | | | | | | | | | | | | | | | | | | | | | | | | | | | | | | | | | | | | | | | | | | | | | | | | |
| CLASS SHARES | | | | | | | | | | | | | | | | | | | | | | | | | | | | | | | | | | | | | | | | | | | | | | | | | | | | |
| Year Ended October 31, 2019 | | $ | 1.00 | | | $ | 0.02 | | | $ | — | | | $ | 0.02 | | | $ | (0.02 | ) | | $ | — | | | $ | (0.02 | ) | | $ | 1.00 | | | | 2.17 | % | | $ | 146,441 | | | | 0.18 | % | | | 2.15 | % | | | 0.36 | % |
| Year Ended October 31, 2018 | | | 1.00 | | | | 0.01 | | | | — | | | | 0.01 | | | | (0.01 | ) | | | — | | | | (0.01 | ) | | | 1.00 | | | | 1.50 | % | | | 184,921 | | | | 0.18 | % | | | 1.70 | % | | | 0.36 | % |
| Year Ended October 31, 2017 | | | 1.00 | | | | 0.01 | | | | — | | | | 0.01 | | | | (0.01 | ) | | | — | | | | (0.01 | ) | | | 1.00 | | | | 0.61 | % | | | 57,042 | | | | 0.20 | % | | | 0.63 | % | | | 0.39 | % |
| July 12, 2016(d) through | | | | | | | | | | | | | | | | | | | | | | | | | | | | | | | | | | | | | | | | | | | | | | | | | | | | |
| October 31, 2016 | | | 1.00 | | | | — | | | | — | | | | — | | | | — | | | | — | | | | — | | | | 1.00 | | | | 0.10 | % | | | 5,003 | | | | 0.18 | % | | | 0.22 | % | | | 0.42 | % |
| CLASS Y SHARES | | | | | | | | | | | | | | | | | | | | | | | | | | | | | | | | | | | | | | | | | | | | | | | | | | | | |
| Year Ended October 31, 2019 | | $ | 1.00 | | | $ | 0.02 | | | | — | | | $ | 0.02 | | | $ | (0.02 | ) | | | — | | | $ | (0.02 | ) | | $ | 1.00 | | | | 2.12 | % | | $ | 1,938,856 | | | | 0.23 | % | | | 2.10 | % | | | 0.26 | % |
| Year Ended October 31, 2018 | | | 1.00 | | | | 0.01 | | | | — | | | | 0.01 | | | | (0.01 | ) | | | — | | | | (0.01 | ) | | | 1.00 | | | | 1.45 | % | | | 1,757,925 | | | | 0.23 | % | | | 1.43 | % | | | 0.26 | % |
| Year Ended October 31, 2017 | | | 1.00 | | | | 0.01 | | | | — | | | | 0.01 | | | | (0.01 | ) | | | — | | | | (0.01 | ) | | | 1.00 | | | | 0.58 | % | | | 2,402,354 | | | | 0.23 | % | | | 0.53 | % | | | 0.29 | % |
| Year Ended October 31, 2016 | | | 1.00 | | | | — | | | | — | | | | — | | | | — | | | | — | | | | — | | | | 1.00 | | | | 0.12 | % | | | 3,891,299 | | | | 0.23 | % | | | 0.11 | % | | | 0.28 | % |
| Year Ended October 31, 2015 | | | 1.00 | | | | — | | | | — | | | | — | | | | — | | | | — | | | | — | | | | 1.00 | | | | 0.03 | % | | | 3,779,595 | | | | 0.07 | % | | | 0.03 | % | | | 0.28 | % |
| (a) | Not annualized for periods less than one year. Total return calculations do not include any sales or redemption charges. |
| (b) | Annualized for periods less than one year. |
| (c) | Closed operations on August 10, 2017. |
| (d) | Commencement of operations on July 12, 2016. |
| Amounts designated as “—” are $0.00 or have been rounded to $0.00. |
| 16 | HSBC FAMILY OF FUNDS | See notes to financial statements. |
| HSBC U.S. TREASURY MONEY MARKET FUND |
| Financial Highlights |
Selecteddata for a shareoutstanding throughouttheperiods indicated.
| | | | Investment Activities | | Distributions | | | | | | Ratios/SupplementaryData |
| | Net Asset
Value,
Beginning
ofPeriod | | Net
Investment
Income | | Net
Realizedand
Unrealized
Gains
(Losses)from
Investments | | Total from
Investment
Activities | | Net
Investment
Income | | NetRealized
Gains from
Investment
Transactions | | Total
Distributions | | Net
Asset
Value,
End of
Period | | Total
Return(a) | | Net Assets
at End of
Period
(000’s) | | Ratio of Net
Expensesto
AverageNet
Assets(b) | | Ratio of Net
Investment
Incometo
AverageNet
Assets(b) | | Ratio of
Expenses
toAverage
NetAssets
(ExcludingFee
Reductions)(b) |
| CLASS D SHARES | | | | | | | | | | | | | | | | | | | | | | | | | | | | | | | | | | | | | | | | | | | | | | | | | | | | |
| Year Ended October 31, 2019 | | $ | 1.00 | | | $ | 0.02 | | | $ | — | | | $ | 0.02 | | | $ | (0.02 | ) | | $ | — | | | $ | (0.02 | ) | | $ | 1.00 | | | | 1.79 | % | | $ | 143,506 | | | | 0.50 | % | | | 1.79 | % | | | 0.53 | % |
| Year Ended October 31, 2018 | | | 1.00 | | | | 0.01 | | | | — | | | | 0.01 | | | | (0.01 | ) | | | — | | | | (0.01 | ) | | | 1.00 | | | | 1.17 | % | | | 308,136 | | | | 0.50 | % | | | 1.12 | % | | | 0.53 | % |
| Year Ended October 31, 2017 | | | 1.00 | | | | — | | | | — | | | | — | | | | — | | | | — | | | | — | | | | 1.00 | | | | 0.29 | % | | | 257,062 | | | | 0.49 | % | | | 0.28 | % | | | 0.55 | % |
| Year Ended October 31, 2016 | | | 1.00 | | | | — | | | | — | | | | — | | | | — | | | | — | | | | — | | | | 1.00 | | | | — | % | | | 214,041 | | | | 0.28 | % | | | — | % | | | 0.55 | % |
| Year Ended October 31, 2015 | | | 1.00 | | | | — | | | | — | | | | — | | | | — | | | | — | | | | — | | | | 1.00 | | | | — | % | | | 280,032 | | | | 0.06 | % | | | — | % | | | 0.54 | % |
| CLASS E SHARES | | | | | | | | | | | | | | | | | | | | | | | | | | | | | | | | | | | | | | | | | | | | | | | | | | | | |
| October 31, 2016 through | | | | | | | | | | | | | | | | | | | | | | | | | | | | | | | | | | | | | | | | | | | | | | | | | | | | |
| August 10, 2017(c) | | $ | 1.00 | | | | — | | | | — | | | | — | | | | — | | | | — | | | | — | | | $ | 1.00 | | | | 0.29 | % | | $ | — | | | | 0.25 | % | | | 0.37 | % | | | 0.29 | % |
| July 12, 2016(d) through | | | | | | | | | | | | | | | | | | | | | | | | | | | | | | | | | | | | | | | | | | | | | | | | | | | | |
| October 31, 2016 | | | 1.00 | | | | — | | | | — | | | | — | | | | — | | | | — | | | | — | | | | 1.00 | | | | 0.11 | % | | | 1 | | | | — | % | | | 0.37 | % | | | 0.33 | % |
| CLASS I SHARES | | | | | | | | | | | | | | | | | | | | | | | | | | | | | | | | | | | | | | | | | | | | | | | | | | | | |
| Year Ended October 31, 2019 | | $ | 1.00 | | | $ | 0.02 | | | | — | | | $ | 0.02 | | | $ | (0.02 | ) | | | — | | | $ | (0.02 | ) | | $ | 1.00 | | | | 2.16 | % | | $ | 879,396 | | | | 0.14 | % | | | 2.13 | % | | | 0.18 | % |
| Year Ended October 31, 2018 | | | 1.00 | | | | 0.02 | | | | — | | | | 0.02 | | | | (0.02 | ) | | | — | | | | (0.02 | ) | | | 1.00 | | | | 1.54 | % | | | 707,804 | | | | 0.14 | % | | | 1.53 | % | | | 0.18 | % |
| Year Ended October 31, 2017 | | | 1.00 | | | | 0.01 | | | | — | | | | 0.01 | | | | (0.01 | ) | | | — | | | | (0.01 | ) | | | 1.00 | | | | 0.64 | % | | | 861,944 | | | | 0.14 | % | | | 0.65 | % | | | 0.19 | % |
| Year Ended October 31, 2016 | | | 1.00 | | | | — | | | | — | | | | — | | | | — | | | | — | | | | — | | | | 1.00 | | | | 0.13 | % | | | 346,399 | | | | 0.16 | % | | | 0.13 | % | | | 0.20 | % |
| Year Ended October 31, 2015 | | | 1.00 | | | | — | | | | — | | | | — | | | | — | | | | — | | | | — | | | | 1.00 | | | | — | % | | | 384,363 | | | | 0.05 | % | | | — | % | | | 0.19 | % |
| INTERMEDIARY CLASS SHARES | | | | | | | | | | | | | | | | | | | | | | | | | | | | | | | | | | | | | | | | | | | | | | | | | | | | |
| Year Ended October 31, 2019 | | $ | 1.00 | | | $ | 0.02 | | | | — | | | $ | 0.02 | | | $ | (0.02 | ) | | | — | | | $ | (0.02 | ) | | $ | 1.00 | | | | 2.14 | % | | $ | 165,842 | | | | 0.16 | % | | | 2.10 | % | | | 0.33 | % |
| Year Ended October 31, 2018 | | | 1.00 | | | | 0.01 | | | | — | | | | 0.01 | | | | (0.01 | ) | | | — | | | | (0.01 | ) | | | 1.00 | | | | 1.49 | % | | | 169,827 | | | | 0.16 | % | | | 1.54 | % | | | 0.33 | % |
| Year Ended October 31, 2017 | | | 1.00 | | | | — | | | | — | | | | — | | | | — | | | | — | | | | — | | | | 1.00 | | | | 0.44 | % | | | 1 | | | | 0.18 | % | | | 0.44 | % | | | 0.34 | % |
| July 12, 2016(d) through | | | | | | | | | | | | | | | | | | | | | | | | | | | | | | | | | | | | | | | | | | | | | | | | | | | | |
| October 31, 2016 | | | 1.00 | | | | — | | | | — | | | | — | | | | — | | | | — | | | | — | | | | 1.00 | | | | 0.11 | % | | | 1 | | | | — | % | | | 0.37 | % | | | 0.38 | % |
| INTERMEDIARY SERVICE | | | | | | | | | | | | | | | | | | | | | | | | | | | | | | | | | | | | | | | | | | | | | | | | | | | | |
| CLASS SHARES | | | | | | | | | | | | | | | | | | | | | | | | | | | | | | | | | | | | | | | | | | | | | | | | | | | | |
| Year Ended October 31, 2019 | | $ | 1.00 | | | $ | 0.02 | | | | — | | | $ | 0.02 | | | $ | (0.02 | ) | | | — | | | $ | (0.02 | ) | | $ | 1.00 | | | | 2.12 | % | | $ | 86,073 | | | | 0.18 | % | | | 2.10 | % | | | 0.38 | % |
| Year Ended October 31, 2018 | | | 1.00 | | | | 0.01 | | | | — | | | | 0.01 | | | | (0.01 | ) | | | — | | | | (0.01 | ) | | | 1.00 | | | | 1.49 | % | | | 51,220 | | | | 0.18 | % | | | 1.54 | % | | | 0.38 | % |
| Year Ended October 31, 2017 | | | 1.00 | | | | 0.01 | | | | — | | | | 0.01 | | | | (0.01 | ) | | | — | | | | (0.01 | ) | | | 1.00 | | | | 0.58 | % | | | 22,016 | | | | 0.20 | % | | | 0.58 | % | | | 0.40 | % |
| July 12, 2016(d) through | | | | | | | | | | | | | | | | | | | | | | | | | | | | | | | | | | | | | | | | | | | | | | | | | | | | |
| October 31, 2016 | | | 1.00 | | | | — | | | | — | | | | — | | | | — | | | | — | | | | — | | | | 1.00 | | | | 0.10 | % | | | 18,108 | | | | 0.20 | % | | | 0.14 | % | | | 0.48 | % |
| See notes to financial statements. | HSBC FAMILY OF FUNDS | 17 |
| HSBC U.S. TREASURY MONEY MARKET FUND |
| Financial Highlights (continued) |
| | | | Investment Activities | | Distributions | | | | | | Ratios/SupplementaryData |
| | Net Asset
Value,
Beginning
ofPeriod | | Net
Investment
Income | | Net
Realizedand
Unrealized
Gains
(Losses)from
Investments | | Total from
Investment
Activities | | Net
Investment
Income | | NetRealized
Gains from
Investment
Transactions | | Total
Distributions | | Net
Asset
Value,
End of
Period | | Total
Return(a) | | Net Assets
at End of
Period
(000’s) | | Ratio of Net
Expensesto
AverageNet
Assets(b) | | Ratio of Net
Investment
Incometo
AverageNet
Assets(b) | | Ratio of
Expenses
toAverage
NetAssets
(ExcludingFee
Reductions)(b) |
| CLASS Y SHARES | | | | | | | | | | | | | | | | | | | | | | | | | | | | | | | | | | | | | | | | | | | | | | | | | | | | |
| Year Ended October 31, 2019 | | $ | 1.00 | | | $ | 0.02 | | | $ | — | | | $ | 0.02 | | | $ | (0.02 | ) | | $ | — | | | $ | (0.02 | ) | | $ | 1.00 | | | | 2.05 | % | | $ | 751,584 | | | | 0.25 | % | | | 2.03 | % | | | 0.28 | % |
| Year Ended October 31, 2018 | | | 1.00 | | | | 0.01 | | | | — | | | | 0.01 | | | | (0.01 | ) | | | — | | | | (0.01 | ) | | | 1.00 | | | | 1.43 | % | | | 697,972 | | | | 0.25 | % | | | 1.37 | % | | | 0.28 | % |
| Year Ended October 31, 2017 | | | 1.00 | | | | 0.01 | | | | — | | | | 0.01 | | | | (0.01 | ) | | | — | | | | (0.01 | ) | | | 1.00 | | | | 0.53 | % | | | 1,101,219 | | | | 0.25 | % | | | 0.56 | % | | | 0.29 | % |
| Year Ended October 31, 2016 | | | 1.00 | | | | — | | | | — | | | | — | | | | — | | | | — | | | | — | | | | 1.00 | | | | 0.04 | % | | | 697,866 | | | | 0.25 | % | | | 0.04 | % | | | 0.30 | % |
| Year Ended October 31, 2015 | | | 1.00 | | | | — | | | | — | | | | — | | | | — | | | | — | | | | — | | | | 1.00 | | | | — | % | | | 763,473 | | | | 0.06 | % | | | — | % | | | 0.29 | % |
| (a) | Not annualized for periods less than one year. Total return calculations do not include any sales or redemption charges. |
| (b) | Annualized for periods less than one year. |
| (c) | Closed operations on August 10, 2017. |
| (d) | Commencement of operations on July 12, 2016. |
| Amounts designated as “—” are $0.00 or have been rounded to $0.00. |
| 18 | HSBC FAMILY OF FUNDS | See notes to financial statements. |
| HSBC FAMILY OF FUNDS |
| Notes to Financial Statements—as of October 31, 2019 |
1. Organization:
The HSBC Funds (the “Trust”), a Delaware statutory trust organized on March 2, 2016, is registered under the Investment Company Act of 1940, as amended (the “Act”), as an open-end management investment company. As of October 31, 2019, the Trust is composed of 8 separate operational funds, each a series of the HSBC Family of Funds. The accompanying financial statements are presented for the following two diversified funds (individually a “Fund”, collectively the “Funds”) of the Trust:
| Fund | | Short Name |
| HSBC U.S. Government Money Market Fund | | U.S. Government Money Market Fund |
| | |
| HSBC U.S. Treasury Money Market Fund | | U.S. Treasury Money Market Fund |
Financial statements for all other funds of the Trust are published separately.
Both of the Funds are government money market funds (as defined in Rule 2a-7) and seek to maintain a stable net asset value (“NAV”) of $1.00 per share, although it is possible to lose money by investing in the Funds. The Funds are authorized to issue an unlimited number of shares of beneficial interest with a par value of $0.001 per share. Each of the Funds has eight classes of shares: Class A Shares, Class C Shares, Class D Shares, Class E Shares, Class I Shares, Intermediary Class Shares, Intermediary Service Class Shares and Class Y Shares. Class C Shares of the Funds are offered without any front-end sales charge but will be subject to a maximum CDSC of 1.00% if redeemed less than one year after purchase. Class C Shares are not offered for sale, but are offered as an exchange option for Class C shareholders of the Trust’s other funds. No sales charges are assessed with respect to Class A, Class D, Class E, Class I, Intermediary Class, Intermediary Service Class or Class Y Shares of the Funds. Each class of shares in each Fund has identical rights and privileges, except with respect to arrangements pertaining to shareholder servicing and/or distribution, class-related expenses, voting rights on matters affecting a single class of shares, and exchange privileges.
Under the Trust’s organizational documents, the Trust’s officers and Trustees are indemnified against certain liabilities arising out of the performance of their duties to the Funds. In addition, in the normal course of business, the Trust may enter into contracts with its service providers, which also provide for indemnifications by the Funds. The Funds’ maximum exposure under these arrangements is unknown as this would involve future claims that may be made against the Funds. However, based on experience, the Trust believes the risk of loss to be remote.
The Funds are investment companies and follow accounting and reporting guidance under Financial Accounting Standards Board Accounting Standards Codification Topic 946, “Financial Services-Investment Companies.”
2. Significant Accounting Policies:
The following is a summary of the significant accounting policies followed by the Funds in the preparation of their financial statements. The policies are in conformity with generally accepted accounting principles in the United States of America (“GAAP”). The preparation of financial statements requires management to make certain estimates and assumptions that affect the reported amounts of assets and liabilities and disclosure of contingent assets and liabilities at the date of the financial statements and the reported amounts of increases and decreases in net assets from operations during the reporting period. Actual results could differ from those estimates.
Securities Valuation:
Investments of the Funds, other than investments in other money market funds, are valued using the amortized cost method pursuant to Rule 2a-7 under the Act, provided that certain conditions are met. Generally, amortized cost approximates fair value. Investments in other money market funds are priced at NAV as reported by such investment companies. Repurchase agreements are valued at original cost. Fair value is defined as the price that would be received to sell an asset or paid to transfer a liability in an orderly transaction between market participants at the measurement date. The valuation techniques used to determine fair value are further described in Note 3 below.
| HSBC FAMILY OF FUNDS |
| Notes to Financial Statements—as of October 31, 2019 (continued) |
Investment Transactions and Related Income:
Investment transactions are accounted for no later than one business day after trade date. However, for financial reporting purposes, investment transactions are accounted for on trade date. Investment gains and losses are calculated on the identified cost basis. Interest income is determined on the basis of coupon interest accrued using the effective interest method which adjusts for amortization of premiums and accretion of discounts. Dividend income is recorded on the ex-dividend date.
Restricted Securities:
The Funds may invest in restricted securities. A restricted security is a security which has been purchased through a private offering and cannot be resold to the general public without prior registration under the Securities Act of 1933 (the “1933 Act”) or pursuant to the resale limitations provided by Rule 144 under the 1933 Act, or another exemption from the registration requirements of the 1933 Act. Certain restricted securities may be resold in transactions exempt from registration, normally to qualified institutional buyers, and may be deemed liquid by the Investment Adviser (as defined in Note 4) based on procedures established by the Board of Trustees (the “Board”). Therefore, not all restricted securities are considered illiquid. To the extent that a Fund purchases securities that are restricted as to resale or for which current market quotations are not available, such securities will be valued based upon all relevant factors as outlined in Securities and Exchange Commission Financial Reporting Release No. 1. Disposal of restricted securities may involve time consuming negotiations and expense. Prompt sale at the current valuation may be difficult and could adversely affect the net assets of the Funds. At October 31, 2019, there were no restricted securities held by the Funds.
Repurchase Agreements:
The U.S. Government Money Market Fund may enter into repurchase agreements with an entity which is a member of the Federal Reserve System or which is a “primary dealer” (as designated by the Federal Reserve Bank of New York) in U.S. government obligations. The U.S. Government Money Market Fund may also enter into a repurchase agreement with the Federal Reserve Bank of New York, the Fixed Income Clearing Corporation, or certain counterparties approved by the Investment Adviser (as defined in Note 4). The U.S. Treasury Money Market Fund may temporarily invest in repurchase agreements collateralized by U.S. Treasury Obligations under adverse market conditions. The repurchase price generally equals the price paid by a Fund plus interest negotiated on the basis of current short-term rates, which may be more or less than the rate on the underlying portfolio securities. The seller, under a repurchase agreement, is required to maintain the collateral held pursuant to the agreement, with a fair value equal to or greater than the repurchase price (including accrued interest). Securities subject to repurchase agreements are held by the Funds’ custodian or another qualified custodian or in the Federal Reserve/ Treasury book-entry system. Master Repurchase Agreements (“MRA”) permit the Fund, under certain circumstances, including an event of default (such as bankruptcy or insolvency), to offset receivables under the MRA with collateral posted by the counterparty and create one net payment due to or from the Fund. However, bankruptcy or insolvency laws of a particular jurisdiction may impose restrictions on or prohibitions against such a right of offset in the event of the MRA counterparty’s bankruptcy or insolvency. Pursuant to terms of the MRA, the Fund receives securities as collateral with a market value in excess of the repurchase price to be received by the Fund upon the maturity of the transaction. Upon bankruptcy or insolvency of the MRA counterparty, the Fund would recognize a liability with respect to such excess collateral to reflect the Fund’s obligation under bankruptcy law to return the excess to the counterparty. There is potential for loss to a Fund in the event the Fund is delayed or prevented from exercising its rights to dispose of the collateral securities, including the risk of a possible decline in the fair value of the underlying securities during the period while the Fund seeks to assert its rights.
Cash:
Cash is held in deposit accounts at the Funds’ custodian bank, The Northern Trust Company (“Custodian”), and is a significant portion of the net assets, which may exceed the amount insured by the Federal Deposit Insurance Corporation (“FDIC”). To the extent that such balances exceed FDIC insurance limits, the Funds are subject to the creditworthiness of the Custodian.
| HSBC FAMILY OF FUNDS |
| Notes to Financial Statements—as of October 31, 2019 (continued) |
Allocations:
Expenses directly attributable to a Fund are charged to that Fund. Expenses not directly attributable to a Fund are allocated among the applicable series within the Trust equally to each fund, in relation to its net assets, or another appropriate basis. Class specific expenses are charged directly to the class incurring the expense. In addition, income, expenses (other than class specific expenses), and unrealized and realized gains and losses are allocated to each class based on relative net assets on a daily basis.
Distributions to Shareholders:
Dividends distributed to shareholders of the Funds from net investment income, if any, are declared daily and distributed monthly from each Fund. Distributions from net realized gains, if any, are declared and paid at least annually by the Funds. Additional distributions are also made to the Funds’ shareholders to the extent necessary to avoid the federal excise tax on certain undistributed income and net realized gains of regulated investment companies.
Federal Income Taxes:
Each Fund is a separate taxable entity for federal income tax purposes. Each Fund has qualified and intends to continue to qualify each year as a “regulated investment company’’ under Subchapter M of the Internal Revenue Code, as amended, and to distribute substantially all of its taxable net investment income and net realized gains, if any, to its shareholders. Accordingly, no provision for federal income or excise tax is required for the Funds, although shareholders may be taxed on distributions they receive.
Management of the Funds has reviewed tax positions taken in tax years that remain subject to examination by all major tax jurisdictions, including federal (i.e., the last four tax year ends and the interim tax period since then, as applicable). Management believes that there is no tax liability resulting from unrecognized tax benefits related to uncertain tax positions taken. Management’s conclusions may be subject to future review based on changes in, or interpretation of, accounting standards or tax laws and regulations.
3. Investment Valuation Summary
The valuation techniques employed by the Funds, as described below, maximize the use of observable inputs and minimize the use of unobservable inputs in determining fair value. The Funds’ investments are classified within the fair value hierarchy based on the lowest level of input that is significant to the fair value measurement. The inputs used for valuing the Funds’ investments are summarized in the three broad levels listed below:
| ● | Level 1—quoted prices in active markets for identical assets
|
| ● | Level 2—other significant observable inputs (including quoted prices for similar securities, interest rates, prepayments speeds, credit risk, etc.)
|
| ● | Level 3—significant unobservable inputs (including the Fund’s own assumptions in determining the fair value of investments) |
Changes in valuation techniques may result in transfers in or out of an assigned level within the fair value hierarchy. The inputs or methodology used for valuing investments are not necessarily an indication of the risk associated with investing in those investments.
Investments of the Funds, other than investments in other money market funds, are valued using the amortized cost method pursuant to Rule 2a-7 under the Act, and are typically categorized as Level 2 in the fair value hierarchy. The amortized cost method involves valuing an instrument at its cost initially and thereafter assuming a constant amortization to maturity of any discounts or premium, regardless of the impact of fluctuating interest rates on the market value of the instrument. The amortized cost method may result in periods during which value, as determined by amortized cost, is higher or lower than the price a Fund holding the instrument would receive if it sold the instrument. The fair value of securities in the Funds can be expected to vary with changes in prevailing interest rates.
| HSBC FAMILY OF FUNDS |
| Notes to Financial Statements—as of October 31, 2019 (continued) |
Investments in other money market funds are priced at NAV as reported by such money market funds and are typically categorized as Level 1 in the fair value hierarchy.
The following is a summary of the valuation inputs used as of October 31, 2019 in valuing the Funds’ investments based upon the three levels defined above. The breakdown of investment categorization is disclosed in the Schedule of Portfolio Investments for each Fund.
| U.S. Government Money Market Fund | | | | | | | | |
| | | | | | | | | |
| Investment Securities: | | LEVEL 1 ($) | | LEVEL 2 ($) | | LEVEL 3 ($) | | Total ($) |
| U.S. Government and Government | | | | | | | | |
| Agency Obligations | | — | | 10,082,889,471 | | — | | 10,082,889,471 |
| U.S. Treasury Obligations | | — | | 1,161,859,260 | | — | | 1,161,859,260 |
| Investment Companies | | 599,062,722 | | — | | — | | 599,062,722 |
| Repurchase Agreements | | — | | 6,660,000,000 | | — | | 6,660,000,000 |
| Total Investment Securities | | 599,062,722 | | 17,904,748,731 | | — | | 18,503,811,453 |
| | | | | | | | | |
| U.S. Treasury Money Market Fund | | | | | | | | |
| | | | | | | | | |
| Investment Securities: | | | | | | | | |
| U.S. Treasury Obligations | | — | | 2,111,032,643 | | — | | 2,111,032,643 |
| Total Investment Securities | | — | | 2,111,032,643 | | — | | 2,111,032,643 |
4. Related Party Transactions and Other Agreements and Plans:
Investment Management:
HSBC Global Asset Management (USA) Inc. (“HSBC” or the “Investment Adviser”), a wholly owned subsidiary of HSBC Bank USA, N.A., a national bank organized under the laws of the United States, acts as Investment Adviser to the Funds. As Investment Adviser, HSBC manages the investments of the Funds and continuously reviews, supervises and administers the Funds’ investments pursuant to an Investment Advisory Contract. For its services in this capacity, HSBC receives a fee from each Fund, accrued daily and paid monthly, based on the average daily net assets of each respective Fund, at an annual rate of 0.10%.
HSBC also provides operational support services to the Funds pursuant to an Operational Support Services Agreement in connection with the operation of certain classes of shares of the Funds. For its services in this capacity, HSBC is entitled to receive a fee, accrued daily and paid monthly, based on the average daily net assets of Class A Shares, Class C Shares, Class D Shares, Intermediary Class Shares, Intermediary Service Class Shares and Class Y Shares, at an annual rate of 0.10%.
HSBC has entered into agreements with certain financial intermediaries (the “Servicers”) to provide recordkeeping, reporting and processing services to the Funds. The Servicers are paid by the Investment Adviser, and not by the Funds, for these services. Since these fees are paid for by the Investment Adviser, they do not represent an additional charge to the Funds or their shareholders and are not reflected in the Funds’ expenses.
| HSBC FAMILY OF FUNDS |
| Notes to Financial Statements—as of October 31, 2019 (continued) |
Administration, Fund Accounting and Other Services:
HSBC also serves the Funds as Administrator. Under the terms of the Administration Services Agreement, HSBC receives from the Funds (as well as other funds in the Trust combined) a fee, accrued daily and paid monthly, at an annual rate of:
| Based on Average Daily Net Assets of | | Fee Rate(%) |
| Up to $10 billion | | 0.0400 |
| In excess of $10 billion but not exceeding $20 billion | | 0.0350 |
| In excess of $20 billion but not exceeding $50 billion | | 0.0265 |
| In excess of $50 billion | | 0.0245 |
The fee rates and breakpoints are determined on the basis of the aggregate average daily net assets of the Trust. For the year ended October 31, 2019, the effective annualized rate was 0.038%, prior to any fee waivers or expense reimbursements, based on the average daily net assets of the Trust. The total administration fee paid to HSBC is allocated to each series based upon its proportionate share of the aggregate net assets of the Trust, subject to certain allocations in cases where one fund invests some or all of its assets in another fund.
Pursuant to a Sub-Administration Services Agreement with HSBC, Citi Fund Services Ohio, Inc. (“Citi”), a wholly-owned subsidiary of Citigroup, Inc., serves as the Trust’s Sub-Administrator. For these services, Citi is entitled to a fee, payable by HSBC, at an annual rate equivalent to the fee rates set forth below:
| Based on Average Daily Net Assets of | | Fee Rate(%) |
| Up to $10 billion | | 0.0200 |
| In excess of $10 billion but not exceeding $20 billion | | 0.0150 |
| In excess of $20 billion but not exceeding $50 billion | | 0.0065 |
| In excess of $50 billion | | 0.0045 |
Under a Services Agreement between the Trust and Citi (the “Services Agreement”), Citi makes an individual available to serve as the Trust’s Chief Compliance Officer (the “CCO”). Citi also provides infrastructure and support in implementing the written policies and procedures comprising the Trust’s compliance program, including support services to the CCO. For the services provided under the Services Agreement, the Trust paid Citi $313,915 for the year ended October 31, 2019, plus reimbursement of certain out-of-pocket expenses. Expenses incurred by each Fund are reflected on the Statements of Operations as “Compliance Services.” Citi pays the salary and other compensation earned by individuals performing these services, as employees of Citi.
In addition, Citi provides fund accounting services for each Fund under the Services Agreement. As fund accountant, Citi receives an annual fee per Fund and share class, subject to certain minimums and reimbursements of certain expenses. Citi receives additional fees paid by the Trust for regulatory administration services and money market fund reporting services.
Distribution Arrangements:
Foreside Distribution Services, L.P. (“Foreside”) serves the Trust as Distributor (the “Distributor”). The Trust has adopted a non-compensatory Distribution Plan and Agreement (the “Distribution Plan”) pursuant to Rule 12b-1 of the Act. The Distribution Plan provides for reimbursement of expenses incurred by the Distributor related to distribution and marketing, at a rate not to exceed 0.25%, 1.00% and 0.25% of the average daily net assets of Class A Shares (currently not being charged), Class C Shares (currently charging 0.75%) and Class D Shares (currently not being charged) of the Funds, respectively. For the year ended October 31, 2019, Foreside, as Distributor, received $859 in commissions from sales of the Trust.
Expenses reduced during the year ended October 31, 2019 are reflected on the Statements of Operations as “Fees voluntarily reduced by Distributor”, as applicable.
| HSBC FAMILY OF FUNDS |
| Notes to Financial Statements—as of October 31, 2019 (continued) |
Shareholder Servicing:
The Trust has adopted a Shareholder Services Plan, which provides for payments to shareholder servicing agents (which includes HSBC and its affiliates) for providing various shareholder services. As disclosed in the Statements of Operations, for the current fiscal period certain amounts of the Shareholder Servicing Fees have been waived by those shareholder servicing agents, including HSBC and its affiliates. Expenses reduced during the year ended October 31, 2019 are reflected on the Statements of Operations as “Fees voluntarily reduced by Shareholder Servicing Agent.” For performing these services, the shareholder servicing agents are entitled to receive a fee that is computed daily and paid monthly up to the following:
| Share Class | | Fee Rate(%) |
| Class A Shares | | 0.60 | %* |
| Class C Shares | | 0.25 | % |
| Class D Shares | | 0.25 | % |
| Class E Shares | | 0.10 | % |
| Intermediary Class Shares | | 0.05 | % |
| Intermediary Service Class Shares | | 0.10 | % |
____________________
| * | Currently charging 0.40% |
The aggregate fees paid to the Distributor pursuant to the Distribution Plan and to shareholder servicing agents pursuant to the Shareholder Services Plan may not exceed, in the aggregate, the following:
| Share Class | | Fee Rate(%) |
| Class A Shares | | 0.60 | % |
| Class C Shares | | 1.00 | % |
| Class D Shares | | 0.25 | % |
| Class E Shares | | 0.10 | % |
| Intermediary Class Shares | | 0.05 | % |
| Intermediary Service Class Shares | | 0.10 | % |
The Trust has entered into shareholder services contracts with affiliated and unaffiliated financial intermediaries who provide shareholder services and other related services to their clients or customers who invest in the Funds under which the Funds will pay all or a portion of such fees earned to financial intermediaries for performing such services.
Transfer Agency:
DST Asset Manager Solutions, Inc. (“DST”) provides transfer agency services for each Fund. As transfer agent, DST receives a fee based on the number of funds and shareholder accounts, subject to certain minimums, and reimbursement of certain expenses.
Independent Trustees:
The Trust pays an annual retainer to each Independent Trustee, plus additional annual retainers to each Committee Chair and the Chairman of the Board. The Independent Trustees also receive a fee for each regular, special in-person, and telephonic meeting of the Board attended. The aggregate amount of the fees and expenses of the Independent Trustees are allocated amongst all the funds in the Trust and are presented in the Statements of Operations.
| HSBC FAMILY OF FUNDS |
| Notes to Financial Statements—as of October 31, 2019 (continued) |
Fee Reductions:
The Investment Adviser has agreed to contractually limit through March 1, 2020 the total annual expenses of certain classes of the Funds, exclusive of interest, taxes, brokerage commissions, extraordinary expenses and estimated indirect expenses attributable to each Fund’s investments in investment companies, as applicable. The applicable classes of each Fund have their own expense limitations based on the average daily net assets for any full fiscal year as follows:
| | | | Contractual |
| | | | Expense |
| Fund | | Class | | Limitations(%) |
| U.S. Government Money Market Fund | | E | | 0.25 | |
| U.S. Government Money Market Fund | | I | | 0.14 | * |
| U.S. Government Money Market Fund | | Intermediary Shares | | 0.18 | |
| U.S. Government Money Market Fund | | Intermediary Service | | | |
| | Class Shares | | 0.20 | |
| U.S. Treasury Money Market Fund | | E | | 0.25 | |
| U.S. Treasury Money Market Fund | | I | | 0.14 | * |
| U.S. Treasury Money Market Fund | | Intermediary Shares | | 0.18 | |
| U.S. Treasury Money Market Fund | | Intermediary Service | | | |
| | Class Shares | | 0.20 | |
____________________
| * | Effective February 28, 2019. Prior to February 28, 2019, the contractual expense limitation was 0.20%. |
Any amounts contractually waived or reimbursed by the Investment Adviser will be subject to repayment by the respective Fund to the Investment Adviser within three years calculated monthly from when the waiver or reimbursement is recorded to the extent that the repayment will not cause the Fund’s operating expenses to exceed the contractual expense limit that was in effect at the time of such waiver or reimbursement. As of October 31, 2019, the repayments that may potentially be made by the Funds are as follows:
| | Amount Eligible Through: |
| Fund | | 2022($) | | 2021($) | | Total ($) |
| U.S. Government Money Market Fund | | 1,734,355 | | 195,009 | | 1,929,364 |
| U.S. Treasury Money Market Fund | | 482,618 | | 147,166 | | 629,784 |
Citi may voluntarily waive/reimburse fees to help support the expense limits of the Funds. In addition, HSBC, in its role as Investment Adviser and Administrator, may waive/reimburse additional fees at its discretion. Any voluntary fee waivers/reimbursements are not subject to recoupment in subsequent fiscal periods. Voluntary waivers/reimbursements may be eliminated or changed at any time. Amounts waived/ reimbursed by the Investment Adviser, Administrator and Citi as Sub-Administrator are reported separately on the Statements of Operations, as applicable.
During the year ended October 31, 2019, the following amounts of expenses were voluntarily and contractually waived:
| | | | | | | | | | | | | | | | Intermediary | | |
| | Class A | | Class C | | Class D | | Class E | | Class I | | Class Y | | Intermediary | | Service | | |
| Fund | | ($) | | ($) | | ($) | | ($) | | ($) | | ($) | | Class ($) | | Class ($) | | Total ($) |
| U.S. Government Money | | | | | | | | | | | | | | | | | | |
| Market Fund | | 11 | | — | | 434,369 | | — | | 3,436,234 | | 492,043 | | 371,522 | | 270,874 | | 5,005,053 |
| U.S. Treasury Money | | | | | | | | | | | | | | | | | | |
| Market Fund | | — | | — | | 57,518 | | — | | 248,686 | | 232,434 | | 304,024 | | 137,517 | | 980,179 |
The Funds have entered into an arrangement with their Custodian whereby credits realized as a result of uninvested cash balances are used to reduce the Custodian’s expenses. Expenses reduced during the year ended October 31, 2019 are reflected on the Statements of Operations as “Custody earnings credits,” as applicable.
| HSBC FAMILY OF FUNDS |
| Notes to Financial Statements—as of October 31, 2019 (continued) |
Overdraft Facility:
The Funds have entered into an arrangement with the Custodian whereby an uncommitted, secured overdraft facility is made available to meet unanticipated end-of-day liquidity needs of the Funds which cannot be fulfilled by trading activities. The interest rate on overdraft amounts is calculated at an annual rate of 0.50% plus the Federal Funds Rate. The overdraft facility is limited to $750,000,000 and $50,000,000 for the U.S. Government Money Market Fund and the U.S. Treasury Money Market Fund, respectively. As of October 31, 2019, the Funds did not have any overdrafts outstanding. Fees incurred during the year ended October 31, 2019 by the Funds on overdrafts are reflected on the Statements of Operations within the “Custodian” expenses, and were as follows:
| U.S. Government Money Market Fund | | $ | 104,396 |
| U.S. Treasury Money Market Fund | | $ | 3,197 |
5. Federal Income Tax Information:
At October 31, 2019, the cost basis of investments for federal income tax purposes, gross unrealized appreciation, gross unrealized depreciation and net unrealized appreciation/depreciation were as follows:
| | | | | | | | Net Unrealized |
| | | | Tax Unrealized | | Tax Unrealized | | Appreciation |
| | Tax Cost ($) | | Appreciation ($) | | Depreciation ($) | | (Depreciation) ($)* |
| U.S. Government Money Market Fund | | 18,503,811,453 | | — | | | — | | | | — | |
| U.S. Treasury Money Market Fund | | 2,111,046,641 | | — | | | (13,998 | ) | | | (13,998 | ) |
____________________
| * | | The difference between book-basis unrealized appreciation (depreciation) is attributable primarily to tax deferral of losses on wash sales. |
The tax character of distributions paid by the Funds for the tax year ended October 31, 2019, was as follows:
| | Distributions paid from |
| | | | Total | | |
| | | | Taxable | | Total |
| | Ordinary | | Distributions | | Distributions |
| | Income ($) | | ($) | | Paid ($)(1) |
| U.S. Government Money Market Fund | | 292,511,316 | | 292,511,316 | | 292,511,316 |
| U.S. Treasury Money Market Fund | | 37,277,107 | | 37,277,107 | | 37,277,107 |
____________________
| (1) | | Total distributions paid may differ from the amount reported in the Statements of Changes in Net Assets because distributions are recognized when actually paid for tax purposes. |
The tax character of distributions paid by the Funds for the tax year ended October 31, 2018, was as follows:
| | Distributions paid from |
| | | | Net | | | | |
| | | | Long | | Total | | |
| | | | Term | | Taxable | | Total |
| | Ordinary | | Capital | | Distributions | | Distributions |
| | Income ($) | | Gains ($) | | ($) | | Paid ($)(1) |
| U.S. Government Money Market Fund | | 150,216,854 | | 12,281 | | 150,229,135 | | 150,229,135 |
| U.S. Treasury Money Market Fund | | 26,994,417 | | — | | 26,994,417 | | 26,994,417 |
____________________
| (1) | | Total distributions paid may differ from the amount reported in the Statements of Changes in Net Assets because distributions are recognized when actually paid for tax purposes. |
| HSBC FAMILY OF FUNDS |
| Notes to Financial Statements—as of October 31, 2019 (continued) |
As of the tax year ended October 31, 2019, the components of accumulated earnings/(deficit) on a tax basis for the Funds were as follows:
| | | | | | | | | | | | | | Accumulated | | | | |
| | | | | | | | | | | | | | Capital and | | Unrealized | | Total |
| | Undistributed | | | | | | | | | | Other | | Appreciation | | Accumulated |
| | Ordinary | | Accumulated | | Distributions | | Losses | | (Depreciation) | | Earnings |
| | Income ($) | | Earnings ($) | | Payable ($) | | ($) | | ($)(1) | | (Deficit) ($) |
| U.S. Government Money | | | | | | | | | | | | | | | | | | | | | | | | |
| Market Fund | | | 9,895,387 | | | | 9,895,387 | | | | (9,877,591 | ) | | | (17,309 | ) | | | — | | | | 487 | |
| U.S. Treasury Money | | | | | | | | | | | | | | | | | | | | | | | | |
| Market Fund | | | 929,762 | | | | 929,762 | | | | (887,907 | ) | | | — | | | | (13,998 | ) | | | 27,857 | |
____________________
| (1) | | The difference between book-basis and tax-basis unrealized appreciation/depreciation are attributable primarily to: tax deferral of losses on wash sales. |
As of the tax year ended October 31, 2019, the Funds have net capital loss carryforwards (“CLCFs”) not subject to expiration as summarized in the table below. The Board does not intend to authorize a distribution of any realized gain for the Funds until any applicable CLCF has been offset or expires.
| | Short Term |
| | Amount ($) |
| U.S. Government Money Market Fund | | 17,309 |
| During the year ended October 31, 2019, the Funds utilized CLCFs as follows: | | |
| | | Total ($) |
| U.S. Government Money Market Fund | | 83,830 |
| U.S. Treasury Money Market Fund | | 34,897 |
Under current law, capital losses and specified ordinary losses realized after October 31 and non-specified ordinary losses incurred after December 31 (ordinary losses collectively known as “late year ordinary loss”) may be deferred and treated as occurring on the first business day of the following fiscal year. As of the tax year ended October 31, 2019, the Funds had no deferred losses.
The amount and character of net investment income and net realized gains distributed are determined in accordance with federal income tax regulations, which may differ from GAAP. These “book/tax” differences are either considered temporary or permanent in nature. To the extent these differences are permanent in nature (e.g., reclassification of market discounts, certain gain/loss, and certain distributions), such amounts are reclassified within the composition of net assets based on their federal tax-basis treatment; temporary differences (e.g., wash losses and post-October loss deferrals) do not require reclassification. To the extent distributions to shareholders from net investment income and net realized gains exceed net investment income and net realized gains for tax purposes, they are reported as distributions of capital.
| HSBC FAMILY OF FUNDS |
| Notes to Financial Statements—as of October 31, 2019 (continued) |
6. Significant Shareholders:
Shareholders, including other funds, individuals, and accounts, as well as each Fund’s investment manager(s) and/or investment personnel, may from time to time own (beneficially or of record) a significant percentage of the Fund’s Shares and can be considered to “control” the Fund when that ownership exceeds 25% of the Fund’s assets (and which may differ from control as determined in accordance with GAAP).
The following list includes the Funds which had individual shareholder accounts with ownership of voting securities greater than 10% of the total outstanding voting securities but less than 25% and/or accounts with ownership of voting securities greater than 25% of the total outstanding voting securities. Significant transactions by these shareholder accounts may negatively impact the Funds’ performance.
| | Number of shareholders | | | | Number of | | |
| | with ownership of | | | | shareholders with | | |
| | voting securities of the | | | | ownership of voting | | |
| | Portfolio greater than | | | | securities of the | | % owned in |
| | 10% and less than 25% | | % owned in | | Portfolio greater | | aggregate |
| | of the total Portfolio’s | | aggregate | | than 25% of the total | | by greater |
| | outstanding voting | | by 10% - 25% | | Portfolio’s outstanding | | than 25% |
| Fund | | | securities | | shareholders | | voting securities | | shareholders |
| U.S. Government Money Market Fund | | 3 | | 37%(a) | | — | | — |
| U.S. Treasury Money Market Fund | | — | | — | | 1 | | 54%(b) |
____________________
| (a) | | 12% owned by the Investment Adviser or an affiliate |
| (b) | | Owned by the Investment Adviser or an affiliate |
7. Subsequent Events:
Management has evaluated subsequent events through the date these financial statements were issued. Based on the evaluation, no adjustments or additional disclosures were required to the financial statements as of October 31, 2019.
Report of Independent Registered Public Accounting Firm
To the Board of Trustees of HSBC Funds and Shareholders of HSBC U.S. Government
Money Market Fund and HSBC U.S. Treasury Money Market Fund
Opinions on the Financial Statements
We have audited the accompanying statements of assets and liabilities, including the schedules of portfolio investments, of HSBC U.S. Government Money Market Fund and HSBC U.S. Treasury Money Market Fund (two of the funds constituting HSBC Funds, hereafter collectively referred to as the “Funds”) as of October 31, 2019, the related statements of operations for the year ended October 31, 2019, the statements of changes in net assets for each of the two years in the period ended October 31, 2019, including the related notes, and the financial highlights for each of the periods indicated therein (collectively referred to as the “financial statements”). In our opinion, the financial statements present fairly, in all material respects, the financial position of each of the Funds as of October 31, 2019, the results of each of their operations for the year then ended, the changes in each of their net assets for each of the two years in the period ended October 31, 2019 and each of the financial highlights for each of the periods indicated therein in conformity with accounting principles generally accepted in the United States of America.
Basis for Opinions
These financial statements are the responsibility of the Funds’ management. Our responsibility is to express an opinion on the Funds’ financial statements based on our audits. We are a public accounting firm registered with the Public Company Accounting Oversight Board (United States) (“PCAOB”) and are required to be independent with respect to the Funds in accordance with the U.S. federal securities laws and the applicable rules and regulations of the Securities and Exchange Commission and the PCAOB.
We conducted our audits of these financial statements in accordance with the standards of the PCAOB. Those standards require that we plan and perform the audit to obtain reasonable assurance about whether the financial statements are free of material misstatement, whether due to error or fraud.
Report of Independent Registered Public Accounting Firm (continued)
Our audits included performing procedures to assess the risks of material misstatement of the financial statements, whether due to error or fraud, and performing procedures that respond to those risks. Such procedures included examining, on a test basis, evidence regarding the amounts and disclosures in the financial statements. Our audits also included evaluating the accounting principles used and significant estimates made by management, as well as evaluating the overall presentation of the financial statements. Our procedures included confirmation of securities owned as of October 31, 2019 by correspondence with the custodian, transfer agents and brokers; when replies were not received from brokers, we performed other auditing procedures. We believe that our audits provide a reasonable basis for our opinions.
/s/ PricewaterhouseCoopers LLP
New York, New York
December 20, 2019
We have served as the auditor of one or more investment companies in the HSBCFunds since 2015.
| HSBC FAMILY OF FUNDS |
| Other Federal Income Tax Information—as of October 31, 2019 (Unaudited) |
During the year ended October 31, 2019, the following Funds designated the maximum amount allowable as interest-related dividends for certain non-U.S. resident investors:
| | Qualified |
| | Interest |
| | Income % |
| U.S. Government Money Market Fund | | | 100.00% | |
| U.S. Treasury Money Market Fund | | | 100.00% | |
| HSBC FAMILY OF FUNDS |
| Table of Shareholder Expenses - as of October 31, 2019 (Unaudited) |
As a shareholder of the Funds, you incur two types of costs: (1) transaction costs, including sales charges (loads) on purchases, redemption fees and exchange fees; and (2) ongoing costs, including management fees, distribution fees and other Fund expenses. These examples are intended to help you understand your ongoing costs (in dollars) of investing in the Funds and to compare the cost with the ongoing costs of investing in other mutual funds.
Actual Expenses
The actual examples are based on an investment of $1,000 invested at the beginning of a six-month period beginning May 1, 2019 and held through the period ended October 31, 2019.
The columns below under the heading entitled “Actual” provide information about actual account values and actual expenses. You may use this information, together with the amount you invested, to estimate the expenses that you paid over the period. Simply divide your account value by $1,000 (for example, an $8,600 account value divided by $1,000 = 8.6), then multiply the result by the number in the table under the heading entitled “Actual Expenses Paid During the Period” to estimate the expenses you paid on your account during this period.
Hypothetical Expenses for Comparison Purposes
The hypothetical expense examples are based on an investment of $1,000 invested at the beginning of a six-month period and held throughout the period ended October 31, 2019.
The columns below under the heading entitled “Hypothetical” provide information about hypothetical account values and hypothetical expenses based on each Fund’s actual expense ratio and an assumed rate of return of 5% per year before expenses, which is not each Fund’s actual return. The hypothetical account values and expenses may not be used to estimate the actual ending account balance or expenses you paid for the period. You may use this information to compare this 5% hypothetical example with the 5% hypothetical examples that appear in the shareholder reports of other funds.
Please note that the expenses shown in the table are meant to highlight your ongoing costs only and do not reflect any transactional costs, such as sales charges (loads), redemption fees, or exchange fees. Therefore, the columns under the heading entitled “Hypothetical” are useful in comparing ongoing costs only, and will not help you determine the relative total costs of owning different funds. In addition, if these transitional costs were included, your costs would have been higher.
| HSBC FAMILY OF FUNDS |
| Table of Shareholder Expenses - as of October 31, 2019 (Unaudited) (continued) |
| | | | | | | | | | | | Hypothetical |
| | | | | | | | | | | | (5% return |
| | | | | | | | Actual | | before expenses) |
| | Annualized | | Beginning | | Ending | | Expenses | | Ending | | Expenses |
| | Expense Ratio | | Account Value | | Account Value | | Paid During | | Account Value | | Paid During |
| | During Period | | 5/1/19 | | 10/31/19 | | Period* | | 10/31/19 | | Period* |
| U.S. Government Money Market | | | | | | | | | | | | | | |
| Fund - Class A | | 0.63% | | | $1,000.00 | | | 1,008.20 | | 3.19 | | 1,022.03 | | 3.21 |
| |
| U.S. Government Money Market | | | | | | | | | | | | | | |
| Fund - Class D | | 0.48% | | | 1,000.00 | | | 1,009.00 | | 2.43 | | 1,022.79 | | 2.45 |
| |
| U.S. Government Money Market | | | | | | | | | | | | | | |
| Fund - Class I | | 0.12% | | | 1,000.00 | | | 1,010.80 | | 0.61 | | 1,024.60 | | 0.61 |
| |
| U.S. Government Money Market | | | | | | | | | | | | | | |
| Fund - Intermediary Class | | 0.15% | | | 1,000.00 | | | 1,010.60 | | 0.76 | | 1,024.45 | | 0.77 |
| |
| U.S. Government Money | | | | | | | | | | | | | | |
| Market Fund - Intermediary | | | | | | | | | | | | | | |
| Service Class | | 0.18% | | | 1,000.00 | | | 1,010.50 | | 0.91 | | 1,024.30 | | 0.92 |
| |
| U.S. Government Money Market | | | | | | | | | | | | | | |
| Fund - Class Y | | 0.23% | | | 1,000.00 | | | 1,010.30 | | 1.17 | | 1,024.05 | | 1.17 |
| |
| U.S. Treasury Money Market | | | | | | | | | | | | | | |
| Fund - Class D | | 0.50% | | | 1,000.00 | | | 1,008.50 | | 2.53 | | 1,022.68 | | 2.55 |
| |
| U.S. Treasury Money Market | | | | | | | | | | | | | | |
| Fund - Class I | | 0.14% | | | 1,000.00 | | | 1,010.30 | | 0.71 | | 1,024.50 | | 0.71 |
| |
| U.S. Treasury Money Market | | | | | | | | | | | | | | |
| Fund - Intermediary Class | | 0.16% | | | 1,000.00 | | | 1,010.20 | | 0.81 | | 1,024.40 | | 0.82 |
| |
| U.S. Treasury Money Market | | | | | | | | | | | | | | |
| Fund - Intermediary | | | | | | | | | | | | | | |
| Service Class | | 0.18% | | | 1,000.00 | | | 1,010.10 | | 0.91 | | 1,024.30 | | 0.92 |
| |
| U.S. Treasury Money Market | | | | | | | | | | | | | | |
| Fund - Class Y | | 0.25% | | | 1,000.00 | | | 1,009.80 | | 1.27 | | 1,023.95 | | 1.28 |
____________________
| * | Expenses are equal to the average account value over the period multiplied by the Fund’s annualized expense ratio, multiplied by 184/365 (the number of days in the most recent fiscal half-year divided by the number of days in the fiscal year. |
| HSBC FAMILY OF FUNDS |
| Board of Trustees and Officers (Unaudited) |
MANAGEMENT OF THE TRUST
The following table contains information regarding the HSBC Family of Funds’ Board of Trustees (“Trustees”). The HSBC Family of Funds’ Statement of Additional Information includes additional information about the Trustees and is available, without charge, upon request by calling (888) 525-5757.
| | | | | | | | Portfolios in | | |
| | Position(s) | | Term of Office | | | | Fund Complex | | Other Directorships |
| | Held | | and Length of | | Principal Occupation(s) | | Overseen | | Held by Trustee |
| Name, Address, Age | | with Funds | | Time Served | | During Past 5 Years | | By Trustee* | | During Past 5 Years** |
NON-INTERESTED
TRUSTEES |
| |
MARCIA L. BECK
P.O. Box 182845
Columbus, OH
43218-3035
Age: 64 | | Trustee | | Indefinite;
2008 to present | | Private Investor (1999 – present) | | 8 | | None |
| |
SUSAN C. GAUSE
P.O. Box 182845
Columbus, OH
43218-3035
Age: 67 | | Trustee | | Indefinite;
2013 to present | | Private Investor (2003 - present) | | 8 | | Metropolitan Series Fund
(2012 – present); and
Met Investors Series
Trust (2008 – present) |
| |
SUSAN S. HUANG
P.O. Box 182845
Columbus, OH
43218-3035
Age: 65 | | Trustee | | Indefinite;
2008 to present | | Private Investor (2000 - present) | | 8 | | None |
| |
THOMAS F. ROBARDS
P.O. Box 182845
Columbus, OH
43218-3035
Age: 73 | | Chairman
and Trustee | | Indefinite;
2005 to present | | Private Investor (2003 - present) | | 8 | | Ellington Residential
Mortgage REIT (NYSE
listed real estate
investment trust)
(2013 – present);
Ellington Financial Inc.
(NYSE listed financial
services company)
(2007 – present);
and Overseas
Shipholding Group
(OSG) (NYSE listed
company) (2005-2014) |
| |
| INTERESTED TRUSTEE | | | | | | | | | | |
| |
DEBORAH A. HAZELL***
452 Fifth Avenue
New York
NY 10018
Age: 56 | | Trustee | | Indefinite;
2011 to present | | Director and Chief Executive Officer, HSBC Global Asset Management (USA) Inc. (2011 - present) | | 8 | | None |
____________________
| * | Includes all series of the HSBC Funds. |
| ** | This column includes only directorships of companies required to report to the SEC under the Securities Exchange Act of 1934 (i.e., “public companies”) or other investment companies registered under the 1940 Act. |
| *** | Ms. Hazell is considered to be an “Interested Trustee” because she holds positions with HSBC Global Asset Management (USA) Inc. |
| HSBC FAMILY OF FUNDS |
| Board of Trustees and Officers (Unaudited) (continued) |
| | Position(s) | | Term of Office and | | Principal Occupation(s) |
| Name, Address, Age | | Held Funds | | Length of Time Served | | During Past 5 Years |
| OFFICERS | | | | | | |
| |
RICHARD A. FABIETTI
452 Fifth Avenue
New York, NY 10018
Age: 61 | | President | | One year;
2004 to present | | Senior Vice President, HSBC Global Asset Management (USA) Inc. (1998 - present) |
| |
JAMES D. LEVY
452 Fifth Avenue
New York, NY 10018
Age: 56 | | Vice President | | One year;
2014 to present | | Vice President, Product Management, HSBC Global Asset Management (USA) Inc. (2014 – present); Vice President, Mutual Funds Product Development, GE Asset Management Inc. (2007 – 2014) |
| |
LAUREN STUNTEBECK
4400 Easton Commons, Suite 200
Columbus, OH 43219-3035
Age: 32 | | Treasurer | | One year;
2019 to present | | Vice President, Financial Administration, Citi Fund Services (2019 - present); Senior Manager, Audit, KPMG LLP (2016-2019); Manager, Audit, KPMG LLP (2014-2016) |
| |
IOANNIS TZOUGANATOS*
Prudential Center
800 Boylston Street, 24thFloor
Boston, MA 02199
Age: 43 | | Secretary | | One year;
2015 to present | | Vice President, Regulatory Administration, Citi Fund Services (2008 - present) |
| |
CHARLES BOOTH*
4400 Easton Commons, Suite 200
Columbus, OH 43219-3035
Age: 59 | | Chief Compliance
Officer | | One year;
2015 to present | | Director and Compliance Officer, CCO Services, Citi Fund Services (1988 - present) |
| |
JAMES M. CURTIS
452 Fifth Avenue
New York, NY 10018
Age: 51 | | Chief Legal Officer | | One year;
2018 to present | | Associate General Counsel, HSBC Securities (USA) Inc. (2005-2017); Associate General Counsel, HSBC Technology & Services (USA) Inc. (2018-present) |
____________________
| * | Mr. Tzouganatos and Mr. Booth also are officers of other investment companies of which Citi (or an affiliate) is the administrator or sub-administrator. |
| HSBC FAMILY OF FUNDS |
| Other Information (Unaudited) |
Information regarding how the Funds voted proxies relating to portfolio securities during the most recent 12-month period ended June 30th is available (i) without charge, upon request, by calling 1-800-525-5757 for HSBC Bank USA and HSBC Brokerage (USA) Inc. clients and 1-800-782-8183 for all other shareholders; (ii) on the Funds’ website at www.investorfunds.us.hsbc.com; and (iii) on the Security and Exchange Commission’s (“SEC”) website at http://www.sec.gov.
The Funds disclose on the Investment Adviser’s website within five business days after the end of each month a complete schedule of portfolio holdings and certain other information, including the dollar-weighted average portfolio maturity and dollar-weighted average portfolio life. In addition, each Fund will file with the SEC on Form N-MFP, within five business days after the end of each month, more detailed portfolio holdings information. The Funds’ Form N-MFP filings will be available on the SEC’s website, and the Investment Adviser’s website will contain a link to such filings.
An investment in a Fund is not a deposit of HSBC Bank USA, National Association, and is not insured or guaranteed by the Federal Deposit Insurance Corporation or any other government agency.
HSBC FAMILY OF FUNDS: INVESTMENT ADVISER AND ADMINISTRATOR HSBC Global Asset Management (USA) Inc.
452 Fifth Avenue
New York, NY 10018 SHAREHOLDER SERVICING AGENTS For HSBC Bank USA, N.A. and
HSBC Securities (USA) Inc. Clients:
HSBC Bank USA, N.A.
452 Fifth Avenue
New York, NY 10018
1-888-525-5757 For All Other Shareholders: HSBC Funds
P.O. Box 8106
Boston, MA 02266-8106
1-800-782-8183 TRANSFER AGENT DST Asset Manager Solutions, Inc.
2000 Crown Colony Drive
Quincy, MA 02169 DISTRIBUTOR Foreside Distribution Services, L.P.
Three Canal Plaza, Suite 100
Portland, ME 04101 | | CUSTODIAN The Northern Trust Company
50 South LaSalle Street
Chicago, IL 60603 INDEPENDENT REGISTERED PUBLIC ACCOUNTING FIRM PricewaterhouseCoopers LLP
300 Madison Avenue
New York, NY 10017 LEGAL COUNSEL Dechert LLP
1900 K Street, N.W.
Washington, D.C. 20006 |

| Investment products: |
ARE NOT A
BANK DEPOSIT
OR OBLIGATION
OF THE BANK
OR ANY OF ITS
AFFILIATES | ARE NOT
FDIC
INSURED | ARE NOT
INSURED BY
ANY FEDERAL
GOVERNMENT
AGENCY |
ARE NOT GUARANTEED BY
THE BANK OR ANY OF ITS
AFFILIATES | MAY LOSE
VALUE |
Investment products are offered by HSBC Securities (USA) Inc. (HSI), member NYSE/FINRA/SIPC. HSI is an affiliate of HSBC Bank USA, N.A. Investment products: Are not a deposit or other obligation of the bank or any of its affiliates; Not FDIC insured or insured by any federal government agency of the United States; Not guaranteed by the bank or any of its affiliates; and are subject to investment risk, including possible loss of principal invested.
Investors should consider the investment objectives, risks, charges, and expenses of the investment company carefully before investing. The prospectus contains this and other important information about the investment company. For clients of HSBC Securities (USA) Inc., please call 1-888-525-5757 for more information. For other investors and prospective investors, please call the Funds directly at 1-800-782-8183 or visit our website at www.investorfunds.us.hsbc.com. Investors should read the prospectus carefully before investing or sending money.
HSBC Funds
Annual Report
October 31, 2019
| EQUITY FUNDS | | Class A | | Class C | | Class I |
| HSBC Opportunity Fund | | HSOAX | | HOPCX | | RESCX |
| HSBC Frontier Markets Fund | | HSFAX | | — | | HSFIX |

| Table of Contents |
| HSBC Family of Funds |
| Annual Report - October 31, 2019 |
| Glossary of Terms | | 2 |
| Commentary From the Investment Manager | | 3 |
| Portfolio Reviews | | 4 |
| Portfolio Composition | | 8 |
| | | |
| Schedule of Portfolio Investments | | |
| | | |
| HSBC Frontier Markets Fund | | 9 |
| Statements of Assets and Liabilities | | 11 |
| Statements of Operations | | 12 |
| Statements of Changes in Net Assets | | 13 |
| Financial Highlights | | 17 |
| Notes to Financial Statements | | 20 |
| Report of Independent Registered Public Accounting Firm | | 32 |
| Other Federal Income Tax Information | | 34 |
| Table of Shareholder Expenses | | 35 |
| | | |
| HSBC Opportunity Portfolio | | |
| | | |
| Portfolio Composition | | 36 |
| | | |
| Schedule of Portfolio Investments | | |
| | | |
| HSBC Opportunity Portfolio | | 37 |
| Statement of Assets and Liabilities | | 39 |
| Statement of Operations | | 40 |
| Statement of Changes in Net Assets | | 41 |
| Financial Highlights | | 42 |
| Notes to Financial Statements | | 43 |
| Report of Independent Registered Public Accounting Firm | | 48 |
| Table of Shareholder Expenses | | 50 |
| Board of Trustees and Officers | | 51 |
| Other Information | | 53 |
Bloomberg Barclays Global Aggregate Indexis an index that is the measure of the global investment-grade debt from 24 local currency markets, which include treasury, government-related, corporate, and securitized fixed-rate bonds from both developed and emerging markets issuers.
Bloomberg Barclays U.S. Aggregate Bond Indexis a broad-based benchmark that measures the investment-grade, U.S. dollar-denominated, fixed-rate taxable bond market. This includes Treasuries, government-related and corporate securities, mortgage-backed securities, asset-backed securities and collateralized mortgage-backed securities.
Gross Domestic Product (“GDP”)is the value of goods and services produced in a given country in a given year.
MSCI Europe Australasia and Far East (“MSCI EAFE”) Indexis an equity index which captures the large- and mid-cap representation across 21 developed markets countries, excluding the U.S. and Canada.
MSCI Emerging Markets Indexis a float-adjusted market capitalization index that is designed to measure equity market performance in global emerging markets.
MSCI Frontier Markets Indexis an equity index that captures large- and mid- cap representation across 28 Frontier Markets countries. The index includes 116 constituents, as of October 31, 2019, covering about 85% of the free float-adjusted market capitalization in each country.
MSCI Select Frontier and Emerging Markets Capped Indexhas been developed by MSCI for the Adviser and, in terms of geography constituents, includes the 28 geographies that are part of the MSCI Frontier Markets Index classification as well as seven small emerging market “crossover” geographies (namely Colombia, Egypt, Pakistan, Philippines, Peru, Qatar, and United Arab Emirates) that are also included within the MSCI Emerging Markets Index. The Index is a free float-adjusted market capitalization index designed to measure equity market performance in the aforementioned geographies.
Purchasing Managers’ Index (“PMI”)is an indicator of the economic health of the manufacturing sector. The PMI is based on five major indicators: new orders, inventory levels, production, supplier deliveries, and the employment environment.
Russell 1000®Indexmeasures the performance of the large-cap segment of the U.S. equity universe. It is a subset of the Russell 3000®Index and includes approximately 1000 of the largest securities based on a combination of their market cap and current index membership. The Russell 1000 represents approximately 92% of the U.S. market.
Russell 2000®Indexmeasures the performance of the small-cap segment of the U.S. equity universe. The Russell 2000®Index is a subset of the Russell 3000®Index representing approximately 8% of the total market capitalization of that index. It includes approximately 2000 of the smallest securities based on a combination of their market cap and current index membership.
Russell 2500TMGrowth Indexis an index that measures the performance of the small- to mid-cap growth segment of the U.S. equity universe. It includes those Russell 2500 companies with higher price-to-book ratios and higher forecasted growth values.
Securities indices are unmanaged and assume reinvestment of all distributions and interest payments and do not take in account brokerage fees or expenses. Securities in the Funds do not match those in the indices and performance of the Funds will differ. Investors cannot invest directly in an index.
| Commentary From the Investment Manager(Unaudited) |
| HSBC Global Asset Management (USA) Inc. |
Global Economic Review
The global economy softened during the 12-month period from November 1, 2018 through October 31, 2019. The U.S. Federal Reserve Board (the Fed) moved to protect the U.S. economy from global economic weakness by shifting monetary policy from tightening to easing. Uncertainty stemming from U.S.-China trade conflicts, weakness in the eurozone and a downturn in the manufacturing sector, especially in China, exerted downward pressure on economic growth around the world.
Late in 2018, fears of recession drove steep declines in equity markets. Optimism returned in early 2019 as central banks in China, the U.S. and Europe signaled looser monetary policies. Yet worries about the trade conflict between the U.S. and China and signs of further global economic weakness began to weigh on global equities and investor confidence as the year progressed. In the end, some resilience in the U.S. economy and cautious optimism about the potential for improved international trade relations helped buoy equity markets.
The U.S. economy grew throughout the period, though generally at a slowing rate. Annual GDP1growth peaked at 3.1% in the first quarter of 2019, rebounding from 2.2% in the fourth quarter of 2018. GDP growth dropped to 1.9% in the second quarter of 2019, and early estimates suggest a similar growth rate in the third quarter. The U.S. unemployment rate fell from an already-low level, ending the period at 3.6%. The solid labor market, low interest rates and strong consumer confidence helped support the U.S. economy. Meanwhile, underlying inflation remained subdued. These positive factors generally outweighed a weak picture for U.S. investments and exports amid slower global growth, trade concerns and elevated political uncertainty.
The U.S. yield curve inverted in August as yields on certain short-term Treasury securities fell below yields on longer-term bonds. An inverted yield curve is widely considered a leading indicator of an economic recession. In reaction to signs that global economic weakness was weighing on U.S. growth, the Fed reduced interest rates three times between July and October, for a total reduction of 75 basis points (0.75%).
Weakening manufacturing data weighed on the eurozone throughout the period. Germany narrowly avoided a technical recession in 2019 due to the manufacturing sector’s extended slump, according to data from the PMI1. A robust labor market continued to support the region’s service sector, however, helping to sustain overall eurozone economic activity throughout the period.
Britain’s attenuated negotiations over Brexit continue to constrain economic performance in the United Kingdom. Businesses have had to contend with a challenging operating environment amid shifting deadlines for an agreement governing the United Kingdom’s exit from the European Union. For example, companies have tended to stockpile goods prior to each proposed deadline, and then subsequently sell down their stockpiles each time the government receives a new extension. The possibility for a wide variety of outcomes, including“no-deal,” “deal” or “no Brexit” scenarios, created (and continues to create) intense uncertainty for businesses and investors. A strong labor market provided a bright spot amid the country’s economic uncertainty.
In Japan, cyclical indicators early in the period fell to their lowest levels since early 2016. Growth remained sluggish through 2019 amid a slowdown in business investment. Meanwhile, softness in global trade—particularly trade with China, a large consumer of many Japanese exports— weighed on the country’s economy.
Emerging market economies remained relatively strong despite heightened geopolitical risks, including lingering trade tensions. Rate cuts from the Fed and looser monetary policy from emerging markets central banks supported these economies. While recent geopolitical instability in Latin America reduced economic growth in that region, the structural characteristics of many other emerging market economies remain strong.
China’s manufacturing exports, domestic orders and industrial profits declined early in the period, as the trade dispute with the U.S. exacerbated the country’s economic downturn. Manufacturing activity picked up briefly in June, but the country’s economic data generally continued to weaken from July through October.
Market review
Global equity markets suffered steep declines late in 2018. Stocks rebounded in early 2019 due in part to easing monetary policy in the U.S. and China, but fell again in May as U.S.-China trade relations deteriorated. Markets continued to rise and fall through the remainder of the period in response to fluctuating trade tensions, mixed economic data and Fed rate cuts. Despite this month-to-month volatility, global equity markets generally delivered positive results for the period.
U.S. stocks ended the period with uneven gains. The Russell 1000®Index1of large-capitalization U.S. stocks returned 14.15%, while the Russell 2000®Index1of small-cap stocks produced a 4.91% return.
International equities generally trailed the U.S. stock market. The MSCI EAFE Index1of developed-market international stocks gained 11.63% (gross of withholding taxes), and the MSCI Emerging Markets Index1returned 12.29% (gross of withholding taxes).
Global fixed-income markets rallied as looser central bank policies pushed interest rates down and bond prices up. Late in the period, sentiment on U.S.-China trade relations turned cautiously optimistic, easing investor concerns about the global economic outlook and curtailing bond returns. The Bloomberg Barclays Global Aggregate Bond Index1, which tracks the broader global investment-grade fixed income market, posted a 9.54% return for the 12-month period. Meanwhile the Bloomberg Barclays U.S. Aggregate Bond Index1, which tracks similar bonds in the U.S. market, posted an 11.51% return for the 12-month period.
| 1 | For additional information, please refer to the Glossary of Terms. |
| Portfolio Reviews(Unaudited) |
HSBC Opportunity Fund
(Class A Shares, Class C Shares and Class I Shares) |
by William A. Muggia, Committee Lead/Portfolio Manager
Richard D. Lee, CFA, Portfolio Manager
Ethan J. Myers, CFA, Portfolio Manager
John M. Montgomery, Portfolio Manager
Westfield Capital Management Company, L.P.
The HSBC Opportunity Fund (the “Fund”) seeks long-term growth of capital by investing, under normal circumstances, primarily in equity securities of small- and mid-cap companies. Small- and mid-cap companies generally are defined as those that have market capitalizations within the range of market capitalizations represented in the Russell 2500TMGrowth Index1. The Fund may also invest in equity securities of larger, more established companies and may invest up to 20% of its assets in securities of foreign companies. The Fund employs a two-tier structure, commonly referred to as a “master-feeder” structure, in which the Fund invests all of its investable assets in the HSBC Opportunity Portfolio (the “Portfolio”). The Portfolio employs Westfield Capital Management Company, L.P. as its subadviser.
Investment Concerns
There is no assurance that a portfolio will achieve its investment objective or will work under all market conditions. The value of investments may go down as well as up and you may not get back the amount originally invested. Portfolios may be subject to certain additional risks, which should be considered carefully along with their investment objectives and fees.Equityinvestments fluctuate in value based on changes to an individual company’s financial condition and overall market conditions. Investments inforeign marketsentail special risks such as currency, political, economic, and market risks. Fluctuations in exchange rates between the U.S. dollar and foreign currencies, or between various foreign currencies, may negatively affect the Fund’s performance. Investing insmaller companiesis more risky and volatile than investing in large companies.Growth investmentstyle may fall out of favor in the marketplace and result in significant declines in the value of the Portfolio’s securities. Securities of companies considered growth investments may have rapid price swings in the event of earnings disappointments or during periods of market, political, regulatory, and economic uncertainty.
For a complete description of these and other risks associated with investment in a mutual fund, please refer to the Fund’s prospectus.
Market Commentary
For the year ended October 31, 2019, the Class I Shares of the HSBC Opportunity Fund produced a 9.25% total return, and the Class A Shares of the Fund produced a 8.77% total return (without sales charge). The Russell 2500™ Growth Index1, the Fund’s primary performance benchmark returned 11.77%.
Portfolio Performance
The 12-month period ended October 31, 2019 was marked by extremes. It began with the fourth quarter of 2018 posting the greatest quarterly decline of the Russell Growth Indices in the past decade. Equities then rebounded to the largest quarterly gain since the Financial Crisis of 2008. Investors were concerned about ongoing trade tensions between the U.S. and China and slowing global growth. Meanwhile, weakness in U.S. manufacturing gave way to a recession in that sector. The Fund delivered positive absolute performance results across seven economic sectors, with real estate, industrials and financials delivering the Fund’s largest positive returns on an absolute basis. Energy, consumer discretionary and communications services weighed on absolute returns.†
Despite positive absolute returns, the Fund underperformed its primary benchmark. Stock selection within the information technology sector was one of the main detractors, most notably a company that provides turnkey customer relationship management software and a cloud-based software analytics company. The Fund exited this position in the latter company in August due to worse-than-expected quarterly results driven by weak sales and organizational changes. Consumer discretionary also dragged on relative results, primarily due to a mountain resort company, which underperformed after announcing lower-than-expected destination business during the pre-holiday season. Holdings of a company that provides home service plans also weighed on relative returns. An overweight allocation to energy as well as stock selection in that sector also hurt the Fund’s relative performance, in particular an oil and natural gas company that fell along with the industry.†
The Fund’s holdings in the industrials sector, particularly aerospace and defense stocks, added the most to relative performance.The Fund’s holding of a company that provides electronic and communication products for wireless and satellite systems and a data service provider that focuses on commercial real estate were notable contributors. Stock selection within the real estate sector also boosted relative performance, in particular a real estate management service provider. Selection in the financial sector also helped, most notably a provider of mortgage insurance, reinsurance and risk management products as well as holdings in the payments subsector.†
| † | Portfolio composition is subject to change. |
| 1 | For additional information, please refer to the Glossary of Terms. |
Past performance does not guarantee future results. The performance data quoted represents past performance and current returns may be lower or higher. Total return figures include change in share price, reinvestment of dividends and capital gains and do not reflect taxes that a shareholder would pay on Fund distributions or on the redemption of Fund shares. Investment return and principal value will fluctuate so that an investor’s shares, when redeemed may be worth more or less than the original cost. To obtain performance information current to the most recent month end, please call 1-800-782-8183.
| Portfolio Reviews(Unaudited) |
| HSBC Opportunity Fund |

The charts above represent a historical 10-year performance comparison of a hypothetical investment in the indicated share class versus a similar investment in the Fund’s benchmark and represents the reinvestment of dividends and capital gains in the Fund.
| | | | Average Annual | | Expense |
| Fund Performance | | | | Total Return (%) | | Ratio (%)4 |
| | Inception | | | | | | | | | | |
| As of October 31, 2019 | | Date | | 1 Year | | 5 Year | | 10 Year | | Gross | | Net |
| HSBC Opportunity Fund Class A1 | | 9/23/96 | | 3.36 | | 5.93 | | 12.30 | | 5.37 | | 1.65 |
| HSBC Opportunity Fund Class C2 | | 11/4/98 | | 7.32 | | 6.25 | | 12.47 | | 6.12 | | 2.40 |
| HSBC Opportunity Fund Class I† | | 9/3/96 | | 9.25 | | 7.55 | | 13.45 | | 1.39 | | 1.10 |
| Russell 2500TMGrowth Index3 | | — | | 11.77 | | 9.83 | | 14.42 | | N/A | | N/A |
Past performance does not guarantee future results. The performance data quoted represents past performance and current returns may be lower or higher. Total return figures include change in share price, reinvestment of dividends and capital gains and do not reflect the taxes that a shareholder would pay on Fund distributions or on the redemption of Fund shares. Investment return and principal value will fluctuate so that an investor’s shares, when redeemed may be worth more or less than the original cost. To obtain performance information current to the most recent month end, please call 1-800-782-8183.
The performance above reflects any fee waivers that have been in effect during the applicable periods, as well as any expense reimbursements that have periodically been made. Absent such waivers and reimbursements, returns would have been lower. Currently, contractual fee waivers and/or expense reimbursements are in effect for the Fund through March 1, 2020.
Certain returns shown include monies received by the Portfolio, in which the Fund invests, in respect of one-time class action settlements and monies received by the Fund from a one-time reimbursement from HSBC Global Asset Management (USA) Inc. (the “Adviser”) related to past marketing arrangements. As a result, the Fund’s total returns for those periods were higher than they would have been had the Portfolio and the Fund not received the payments.
| † | The Class I Shares are issued by a separate series of the HSBC Funds. |
| 1 | Reflects the maximum sales charge of 5.00%. |
| 2 | Reflects the applicable contingent deferred sales charge, maximum of 1.00%. |
| 3 | For additional information, please refer to the Glossary of Terms. |
| 4 | Reflects the expense ratio as reported in the prospectus dated February 28, 2019, as restated May 29, 2019 and supplemented to date. HSBC Global Asset Management (USA) Inc., the Adviser, has entered into a contractual expense limitation agreement with the Fund under which it will limit total expenses of the Fund (excluding interest, taxes, brokerage commissions, extraordinary expenses and estimated indirect expenses attributable to the Fund’s investments in investment companies other than the Portfolio) to an annual rate of 1.65%, 2.40% and 1.10% for Class A Shares, Class C and Class I Shares, respectively. The expense limitations shall be in effect until March 1, 2020. Additional information pertaining to the October 31, 2019 expense ratios can be found in the financial highlights. |
The Fund’s performance is measured against the Russell 2500TMGrowth Index, an unmanaged index that measures the performance of the small- to mid-cap growth segment of the U.S. equity universe. It includes those Russell 2500 companies with higher price-to-book ratios and higher forecasted growth values. The performance for the index does not reflect the deduction of expenses associated with a mutual fund, such as investment management and fund accounting fees. The Fund’s performance reflects the deduction of fees for these value-added services. Investors cannot invest directly in an index.
| Portfolio Reviews(Unaudited) |
HSBC Frontier Markets Fund
(Class A Shares and Class I Shares) |
by Ramzi Sidani, Senior Portfolio Manager
Jennifer Passmoor, Portfolio Manager
The HSBC Frontier Markets Fund (the “Fund”) seeks long-term capital appreciation. Under normal circumstances, the Fund invests at least 80% of its net assets, plus any borrowings for investment purposes, in issuers located in frontier market countries. The term “frontier market countries” encompasses those countries that are at an earlier stage of economic, political, or financial development, even by emerging markets standards.
Investment Concerns
There is no assurance that a portfolio will achieve its investment objective or will work under all market conditions. The value of investments may go down as well as up and you may not get back the amount originally invested. Portfolios may be subject to certain additional risks, which should be considered carefully along with their investment objectives and fees.Equityinvestments fluctuate in value based on changes to an individual company’s financial condition and overall market conditions. Investments inforeign marketsentail special risks such as currency, political, economic, and market risks. The risks of investing inemerging markets countriesare greater than the risks generally associated with foreign investments. Investing insmaller companiesis more risky and volatile than investing in larger companies.Frontier markets countriesgenerally have smaller economies and even less developed capital markets or legal and political systems than traditional emerging market countries. As a result, the risks of investing in emerging market countries are magnified in frontier market countries. The Fund will invest more than 25% of its total assets in securities issued by companies in thefinancial services groupof industries. Accordingly, the Fund will be more susceptible to developments that affect such industries than other funds that do not concentrate their investments.Exposure to commodities markets, including investments in companies in commodity-related industries, may subject the Fund to greater volatility than investments in traditional securities. Overall market movements and factors specific to a particular industry or commodity may affect the value of commodity-related investments.Concentrating Fund investmentsin a limited number of issuers conducting business in the same industry will subject the Fund to a greater risk of loss as a result of adverse economic, business, political, environmental, regulatory or other developments affecting that industry than if its investments were diversified across different industries.Derivativesmay be riskier than other types of investments and could result in losses that significantly exceed the Funds’ original investment.
For a complete description of these and other risks associated with investment in a mutual fund, please refer to the Fund’s prospectus.
Market Commentary
For the year ended October 31, 2019, the Fund returned 10.44% (without sales charge) for the Class A Shares and 10.92% for the Class I Shares. That compared to a 10.96% and 9.81% total return for the Fund’s benchmarks, the MSCI Frontier Markets Index1and the MSCI Select Frontier and Emerging Markets Capped Index1, respectively, for the same period.
Portfolio Performance
Select frontier and emerging markets posted gains for the 12-month period ended October 31, 2019. Since the start of 2019, buoyant market sentiment helped drive the broad gains among equities, due in large part to a dovish shift in U.S. monetary policy. Meanwhile, looser Chinese monetary and fiscal policy appears to have translated into a pickup in economic activity. Egypt was one of the strongest performing markets within the universe, which helped boost the Fund’s performance on an absolute basis.
In this environment, the Fund outperformed its reference index for the period, although it underperformed its industry benchmark. The Fund benefitted from its overweight exposure to Egypt, as that nation’s macroeconomic backdrop improved after its central bank decided to cut interest rates in tandem with the country’s ongoing fiscal reforms. The Fund’s underweight exposure to Qatar also added to relative performance, particularly a below-benchmark exposure to the Qatar National Bank, which struggled during the period.†
Stock selection was also positive, particularly holdings in the Philippines and Hong Kong SAR. The Fund’s exposure to a Philippines terminal container company added to relative results when shares of the company rallied after it reported strong growth in revenues and net income. The Fund’s exposure to a Hong Kong SAR- based hotel and gaming company also helped relative performance after the company reported strong earnings data on a favorable client mix and increased visitation from mainland China.†
However, an overweight exposure to Georgia weighed on relative results, particularly an allocation to shares of a Georgian bank, which declined on news that the bank’s chairman and deputy chairman were involved in transactions that breached the country’s conflict of interest laws. Stock selection within the United Arab Emirates also dragged on results. The Fund’s investment in a UAE-based healthcare company detracted from performance, as did its investment in a UAE-based global supply chain company, which declined on broader concerns that U.S.-China trade tensions would further slow global economic growth.†
| † | Portfolio composition is subject to change. |
| 1 | For additional information, please refer to the Glossary of Terms. |
Past performance does not guarantee future results. The performance data quoted represents past performance and current returns may be lower or higher. Total return figures include change in share price, reinvestment of dividends and capital gains and do not reflect taxes that a shareholder would pay on Fund distributions or on the redemption of Fund shares. Investment return and principal value will fluctuate so that an investor’s shares, when redeemed may be worth more or less than the original cost. To obtain performance information current to the most recent month end, please call 1-800-782-8183.
| Portfolio Reviews(Unaudited) |
| HSBC Frontier Markets Fund |
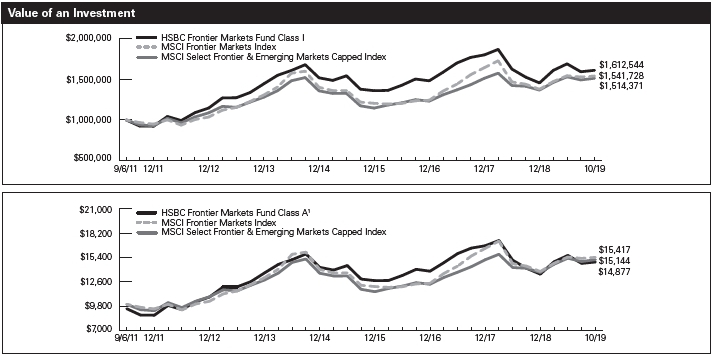
The charts above represent a historical since inception performance comparison of a hypothetical investment in the indicated share class versus a similar investment in the Fund’s benchmark and represents the reinvestment of dividends and capital gains in the Fund.
| | | | Average Annual | | Expense |
| Fund Performance | | | | Total Return (%) | | Ratio (%)2 |
| | Inception | | | | | | Since | | | | |
| As of October 31, 2019 | | Date | | 1 Year | | 5 Year | | Inception | | Gross | | Net |
| HSBC Frontier Markets Fund Class A1 | | 9/6/11 | | 4.89 | | -1.49 | | 4.99 | | 5.16 | | 1.85 |
| HSBC Frontier Markets Fund Class I | | 9/6/11 | | 10.92 | | -0.12 | | 6.04 | | 4.81 | | 1.50 |
| MSCI Frontier Markets Index3 | | — | | 10.96 | | 0.14 | | 5.45 | | N/A | | N/A |
| MSCI Select Frontier and Emerging Markets Capped Index3 | | — | | 9.81 | | 0.61 | | 5.22 | | N/A | | N/A |
Past performance does not guarantee future results. The performance data quoted represents past performance and current returns may be lower or higher. Total return figures include change in share price, reinvestment of dividends and capital gains and do not reflect the taxes that a shareholder would pay on Fund distributions or on the redemption of Fund shares. Investment return and principal value will fluctuate so that an investor’s shares, when redeemed may be worth more or less than the original cost. To obtain performance information current to the most recent month end, please call 1-800-782-8183.
The performance above reflects any fee waivers that have been in effect during the applicable periods, as well as any expense reimbursements that have periodically been made. Absent such waivers and reimbursements, returns would have been lower. Currently, contractual fee waivers and/or expense reimbursements are in effect for the Fund through March 1, 2020.
| 1 | Reflects the maximum sales charge of 5.00%. |
| 2 | Reflects the expense ratio as reported in the prospectus dated February 28, 2019, as restated May 29, 2019 and supplemented to date. HSBC Global Asset Management (USA) Inc., the Adviser, has entered into a contractual expense limitation agreement with the Fund under which it will limit total expenses of the Fund (excluding interest, taxes, brokerage commissions, extraordinary expenses and estimated indirect expenses attributable to the Fund’s investments in investment companies) to an annual rate of 1.85% and 1.50% for Class A Shares and Class I Shares, respectively. The expense limitation shall be in effect until March 1, 2020. Additional information pertaining to the October 31, 2019 expense ratios can be found in the financial highlights. |
| 3 | For additional information, please refer to the Glossary of Terms. |
The performance of the Fund is measured by the MSCI Frontier Markets Index, which is an equity index that captures large- and mid- cap representation across 28 Frontier Markets countries. The index includes 116 constituents, as of October 31, 2019, covering about 85% of the free float-adjusted market capitalization in each country. The MSCI Select Frontier and Emerging Markets Capped Index has been developed by MSCI for the Adviser and, in terms of geography constituents, includes the 28 geographies that are part of the MSCI Frontier Markets Index classification as well as seven small emerging market “crossover” geographies (namely Colombia, Egypt, Pakistan, Philippines, Peru, Qatar, and United Arab Emirates) that are also included within the MSCI Emerging Markets Index. The MSCI Select Frontier and Emerging Markets Capped Index is a free float-adjusted market capitalization index designed to measure equity market performance in the aforementioned geographies. The indexes are unmanaged and their performance does not reflect the deduction of expenses associated with a mutual fund, such as investment management and fund accounting fees. The Fund’s performance reflects the deduction of fees for these value-added services. Investors cannot invest directly in an index.
| Portfolio Reviews(Unaudited) |
Portfolio Composition*
October 31, 2019 (Unaudited) |
| HSBC Frontier Markets Fund | | | | |
| | Percentage of |
| Geographic Region | | Investments at Value (%)† |
| Kuwait | | | 14.1 | |
| Egypt | | | 13.3 | |
| United Arab Emirates | | | 12.2 | |
| Philippines | | | 11.0 | |
| Vietnam | | | 6.9 | |
| Kenya | | | 6.0 | |
| Bahrain | | | 5.3 | |
| Georgia | | | 4.8 | |
| Kazakhstan | | | 4.6 | |
| Romania | | | 4.6 | |
| Colombia | | | 4.0 | |
| Peru | | | 3.3 | |
| Mauritius | | | 2.1 | |
| Nigeria | | | 2.0 | |
| Morocco | | | 1.8 | |
| Bangladesh | | | 1.3 | |
| Argentina | | | 1.1 | |
| Croatia | | | 0.8 | |
| Qatar | | | 0.7 | |
| Cambodia | | | 0.1 | |
| | | 100.0 | |
____________________
| * | Portfolio composition is subject to change. |
| † | Excludes any instruments used for cash management. |
| HSBC FRONTIER MARKETS FUND |
| Schedule of Portfolio Investments—as of October 31, 2019 |
| Common Stocks — 99.7% | | | | | |
| | | Shares | | Value ($) |
| Argentina — 1.1% | | | | | |
| Globant SA(a) | | 390 | | | 36,371 |
| YPF Sociedad Anonima, ADR | | 5,213 | | | 48,794 |
| | | | | 85,165 |
| Bahrain — 5.4% | | | | | |
| Ahli United Bank BSC | | 454,344 | | | 401,995 |
| Bangladesh — 1.3% | | | | | |
| BRAC Bank, Ltd.(a) | | 54,692 | | | 32,750 |
| Square Pharmaceuticals, Ltd. | | 22,341 | | | 62,159 |
| | | | | 94,909 |
| Cambodia — 0.1% | | | | | |
| NagaCorp, Ltd. | | 4,000 | | | 7,290 |
| Colombia — 4.1% | | | | | |
| Banco Davivienda SA | | 23,958 | | | 306,481 |
| Croatia — 0.8% | | | | | |
| Addiko Bank AG(a) | | 3,318 | | | 58,094 |
| Ledo d.d.(a)(b) | | 311 | | | — |
| | | | | 58,094 |
| Egypt — 13.6% | | | | | |
| Cairo Investment & Real Estate | | | | | |
| Development Co. SAE | | 28,911 | | | 22,460 |
| Cleopatra Hospital(a) | | 129,470 | | | 49,648 |
| Commercial International Bank, | | | | | |
| Registered, GDR | | 39,928 | | | 197,243 |
| Credit Agricole Egypt | | 57,587 | | | 157,121 |
| Juhayna Food Industries | | 338,620 | | | 178,886 |
| MM Group For Industry & International | | | | | |
| Trade SAE(a) | | 219,824 | | | 142,223 |
| Talaat Moustafa Group | | 427,015 | | | 264,065 |
| | | | | 1,011,646 |
| Georgia — 4.9% | | | | | |
| Bank of Georgia Group PLC | | 5,728 | | | 96,364 |
| Georgia Capital PLC(a) | | 5,926 | | | 74,676 |
| TBC Bank Group PLC | | 11,572 | | | 191,832 |
| | | | | 362,872 |
| Kazakhstan — 4.6% | | | | | |
| Halyk Savings Bank of Kazakhstan JSC, | | | | | |
| Registered, GDR | | 20,908 | | | 279,122 |
| Kaz Minerals PLC | | 11,021 | | | 66,999 |
| | | | | 346,121 |
| Kenya — 6.0% | | | | | |
| Equity Group Holdings PLC | | 96,800 | | | 43,658 |
| KCB Group, Ltd. | | 244,400 | | | 122,555 |
| Safaricom, Ltd. | | 987,200 | | | 284,585 |
| | | | | 450,798 |
| Kuwait — 14.4% | | | | | |
| Agility Public Warehousing Co. KSC | | 113,163 | | | 280,199 |
| Human Soft Holding Co. KSC | | 30,306 | | | 309,163 |
| Kuwait Finance House KSCP | | 52,500 | | | 118,554 |
| National Bank of Kuwait SAK | | 116,033 | | | 360,472 |
| | | | | 1,068,388 |
| Mauritius — 2.1% | | | | | |
| MCB Group, Ltd. | | 18,900 | | | 158,066 |
| Morocco — 1.8% | | | | | |
| Attijariwafa Bank | | 2,791 | | | 136,718 |
| Nigeria — 2.0% | | | | | |
| Dangote Cement PLC | | 114,773 | | | 47,368 |
| Guaranty Trust Bank PLC | | 1,479,678 | | | 101,779 |
| | | | | 149,147 |
| Peru — 3.4% | | | | | |
| Alicorp SAA | | 31,697 | | | 86,967 |
| Credicorp, Ltd. | | 775 | | | 165,881 |
| | | | | 252,848 |
| Philippines — 11.1% | | | | | |
| Ayala Land, Inc. | | 124,100 | | | 118,767 |
| International Container Terminal | | | | | |
| Services, Inc. | | 66,420 | | | 155,412 |
| Megaworld Corp. | | 962,700 | | | 91,659 |
| Puregold Price Club, Inc. | | 254,839 | | | 205,207 |
| Robinsons Retail Holdings, Inc. | | 111,410 | | | 166,577 |
| SSI Group, Inc. | | 1,816,000 | | | 92,357 |
| | | | | 829,979 |
| Qatar — 0.7% | | | | | |
| Qatar National Bank | | 10,579 | | | 55,801 |
| Romania — 4.6% | | | | | |
| Banca Transilvania SA | | 412,054 | | | 230,235 |
| BRD-Groupe Societe Generale | | 32,274 | | | 107,593 |
| Sphera Franchise Group SA | | 1,712 | | | 8,039 |
| | | | | 345,867 |
| United Arab Emirates — 10.7% | | | | | |
| Abu Dhabi National Oil Co. For | | | | | |
| Distribution PJSC | | 140,400 | | | 100,160 |
| Aramex PJSC | | 49,429 | | | 52,759 |
| DP World, Ltd. | | 17,263 | | | 229,425 |
| Emaar Development PJSC | | 12,438 | | | 13,716 |
| Emaar Properties PJSC | | 79,438 | | | 92,360 |
| Emirates NBD PJSC | | 39,350 | | | 128,574 |
| NMC Health PLC | | 6,279 | | | 177,520 |
| | | | | 794,514 |
| Vietnam — 7.0% | | | | | |
| Masan Group Corp.(a) | | 22,650 | | | 72,435 |
| Vietnam Dairy Products JSC | | 30,010 | | | 168,144 |
| Vietnam Technological & Commercial | | | | | |
| Joint Stock Bank(a) | | 150,150 | | | 153,373 |
| Vincom Retail JSC | | 91,399 | | | 130,784 |
| | | | | 524,736 |
| TOTAL COMMON STOCKS | | | | | |
| (COST $8,076,052) | | | | | 7,441,435 |
| | | | | | |
| Participatory Notes — 1.6% | | | | | |
| | | | | | |
| United Arab Emirates — 1.6% | | | | | |
| Aramex PJSC, 3/15/20, (Merrill Lynch | | | | | |
| International & Co.)(a) | | 114,571 | | | 122,289 |
| TOTAL Participatory Note | | | | | |
| (COST $133,293) | | | | | 122,289 |
| | | | | | |
| Right — 0.1% | | | | | |
| | | | | | |
| United Arab Emirates — 0.1% | | | | | |
| Emirates NBD PJSC, 11/21/19 | | 4,918 | | | 4,687 |
| TOTAL RIGHT (COST $–) | | | | | 4,687 |
| TOTAL INVESTMENTS | | | | | |
| IN SECURITIES | | | | | |
| (COST $8,209,345) — 101.4% | | | | | 7,568,411 |
| Other Assets (Liabilities) - (1.4)% | | | | | (107,184) |
| NET ASSETS — 100% | | | | $ | 7,461,227 |
____________________
| (a) | Represents non-income producing security. |
| (b) | Security was valued using significant unobservable inputs as of October 31, 2019. |
| ADR - American Depositary Receipt |
| GDR - Global Depository Receipt |
| See notes to financial statements. | HSBC FAMILY OF FUNDS 9 |
| HSBC FRONTIER MARKETS FUND |
| Schedule of Portfolio Investments—as of October 31, 2019 (continued) |
The Fund invested, as a percentage of net assets at value, in the following industries, as of October 31, 2019:
| | Percentage of |
| Industry | | Net Assets at Value (%)* |
| Banks | | | 48.4 | |
| Real Estate Management | | | | |
| & Development | | | 9.8 | |
| Food Products | | | 6.8 | |
| Air Freight & Logistics | | | 6.1 | |
| Transportation Infrastructure | | | 5.2 | |
| Food & Staples Retailing | | | 5.0 | |
| Diversified Consumer Services | | | 4.1 | |
| Wireless Telecommunication Services | | | 3.8 | |
| Health Care Providers & Services | | | 3.0 | |
| Specialty Retail | | | 2.6 | |
| Distributors | | | 1.9 | |
| Capital Markets | | | 1.0 | |
| Metals & Mining | | | 0.9 | |
| Pharmaceuticals | | | 0.8 | |
| Oil, Gas & Consumable Fuels | | | 0.7 | |
| Construction Materials | | | 0.6 | |
| Software | | | 0.5 | |
| Hotels, Restaurants & Leisure | | | 0.2 | |
| Total | | | 101.4 | |
____________________
| * | The percentage shown for each investment category reflects the value of investments in that category as a percentage of net assets. Figures in the above table may not sum to 100% due to the exclusion of other assets and liabilities. The above table depicts the Fund’s investments but may not represent the Fund’s market exposure due to the exclusion of certain derivatives, if any, as listed in the Schedule of Portfolio Investments. |
| 10 | HSBC FAMILY OF FUNDS | See notes to financial statements. |
HSBC FAMILY OF FUNDS
Statements of Assets and Liabilities—as of October 31, 2019
| | | | | | | HSBC | | HSBC |
| | HSBC | | Opportunity | | Frontier |
| | Opportunity | | Fund | | Markets |
| | Fund | | (Class I) | | Fund |
| Assets: | | | | | | | | | | | | | | | | | |
| Investments in Affiliated Portfolio | | | $ | 8,567,015 | | | | $ | 115,965,555 | | | | | $ | — | | |
| Investment in securities, at value | | | | — | | | | | — | | | | | | 7,568,411 | | |
| Foreign currency, at value | | | | — | | | | | — | | | | | | 23,414 | | |
| Interest and dividends receivable | | | | — | | | | | — | | | | | | 3,845 | | |
| Receivable for capital shares issued | | | | 219 | | | | | 14,325 | | | | | | — | | |
| Receivable for investments sold | | | | — | | | | | — | | | | | | 44,131 | | |
| Reclaims receivable | | | | — | | | | | — | | | | | | 30,786 | | |
| Receivable from Investment Adviser | | | | 6,904 | | | | | 7,868 | | | | | | 2,613 | | |
| Prepaid expenses and other assets | | | | 6,086 | | | | | 13,675 | | | | | | 14,575 | | |
| Total Assets | | | | 8,580,224 | | | | | 116,001,423 | | | | | | 7,687,775 | | |
| | | | | | | | | | | | | | | | | | |
| Liabilities: | | | | | | | | | | | | | | | | | |
| Cash overdraft | | | | — | | | | | — | | | | | | 8,298 | | |
| Payable for investments purchased | | | | — | | | | | — | | | | | | 63,101 | | |
| Payable for capital shares redeemed | | | | 94 | | | | | 9,871 | | | | | | 29,978 | | |
| Accrued expenses and other payables: | | | | | | | | | | | | | | | | | |
| Administration | | | | 139 | | | | | 1,889 | | | | | | 249 | | |
| Distribution fees | | | | 51 | | | | | — | | | | | | — | | |
| Shareholder Servicing | | | | 1,601 | | | | | — | | | | | | 348 | | |
| Accounting | | | | 2,834 | | | | | 1,582 | | | | | | 7,439 | | |
| Custodian | | | | — | | | | | — | | | | | | 10,778 | | |
| Printing | | | | 2,059 | | | | | 12,055 | | | | | | 10,405 | | |
| Professional | | | | 26,894 | | | | | 29,450 | | | | | | 64,426 | | |
| Transfer Agent | | | | 10,460 | | | | | 13,638 | | | | | | 15,557 | | |
| Trustee | | | | 1,499 | | | | | 1,499 | | | | | | 1,500 | | |
| Board Services | | | | 3,970 | | | | | 3,970 | | | | | | 3,970 | | |
| Other | | | | 3,943 | | | | | 3,164 | | | | | | 10,499 | | |
| Total Liabilities | | | | 53,544 | | | | | 77,118 | | | | | | 226,548 | | |
| Net Assets | | | $ | 8,526,680 | | | | $ | 115,924,305 | | | | | $ | 7,461,227 | | |
| | | | | | | | | | | | | | | | | | |
| Composition of Net Assets: | | | | | | | | | | | | | | | | | |
| Paid in capital | | | $ | 7,168,789 | | | | $ | 96,554,607 | | | | | $ | 34,622,228 | | |
| Total distributable earnings/(loss) | | | | 1,357,891 | | | | | 19,369,698 | | | | | | (27,161,001 | ) | |
| Net Assets | | | $ | 8,526,680 | | | | $ | 115,924,305 | | | | | $ | 7,461,227 | | |
| | | | | | | | | | | | | | | | | | |
| Net Assets: | | | | | | | | | | | | | | | | | |
| Class A Shares | | | $ | 8,449,439 | | | | $ | — | | | | | $ | 1,390,547 | | |
| Class C Shares | | | | 77,241 | | | | | — | | | | | | — | | |
| Class I Shares | | | | — | | | | | 115,924,305 | | | | | | 6,070,680 | | |
| Total | | | $ | 8,526,680 | | | | $ | 115,924,305 | | | | | $ | 7,461,227 | | |
| | | | | | | | | | | | | | | | | | |
| Shares Outstanding: | | | | | | | | | | | | | | | | | |
| ($0.001 par value, unlimited number of shares authorized): | | | | | | | | | | | | | | | | | |
| Class A Shares | | | | 896,659 | | | | | — | | | | | | 112,577 | | |
| Class C Shares | | | | 15,918 | | | | | — | | | | | | — | | |
| Class I Shares | | | | — | | | | | 9,062,324 | | | | | | 490,141 | | |
| | | | | | | | | | | | | | | | | | |
| Net Asset Value, Offering Price and Redemption Price per share: | | | | | | | | | | | | | | | | | |
| Class A Shares | | | $ | 9.42 | | | | $ | — | | | | | $ | 12.35 | | |
| Class C Shares (a) | | | $ | 4.85 | | | | $ | — | | | | | $ | — | | |
| Class I Shares | | | $ | — | | | | $ | 12.79 | | | | | $ | 12.39 | | |
| Maximum Sales Charge: | | | | | | | | | | | | | | | | | |
| Class A Shares | | | | 5.00 | % | | | | — | % | | | | | 5.00 | % | |
| Maximum Offering Price per share (Net Asset Value / (100%-maximum sales charge)) | | | | | | | | | | | | | | | | | |
| Class A Shares | | | $ | 9.92 | | | | $ | — | | | | | $ | 13.00 | | |
| Investments in Affiliated Portfolio, at cost | | | $ | 7,683,963 | | | | $ | 103,700,089 | | | | | $ | — | | |
| Investments in securities, at cost | | | $ | — | | | | $ | — | | | | | $ | 8,209,345 | | |
| Foreign currency, at cost | | | $ | — | | | | $ | — | | | | | $ | 23,416 | | |
____________________
Amounts designated as ”—” are $0.00 or have been rounded to $0.00.
| (a) | Redemption price per share varies by length of time shares are held. |
| See notes to financial statements. | HSBC FAMILY OF FUNDS | 11 |
HSBC FAMILY OF FUNDS
Statements of Operations—For the year ended October 31, 2019
| | | | | | | | | | | | | | HSBC |
| | HSBC | | HSBC | | Frontier |
| | Opportunity | | Opportunity | | Markets |
| | Fund | | Fund (Class I) | | Fund |
| Investment Income: | | | | | | | | | | | | | | | | | | |
| Investment Income from Affiliated Portfolio | | | | 69,644 | | | | | | 973,251 | | | | | | — | | |
| Dividends | | | | — | | | | | | — | | | | | | 363,413 | | |
| Foreign tax withholding | | | | — | | | | | | — | | | | | | (17,042 | ) | |
| Expenses from Affiliated Portfolio | | | | (98,579 | ) | | | | | (1,374,686 | ) | | | | | — | | |
| Total Investment Income/(Loss) | | | | (28,935 | ) | | | | | (401,435 | ) | | | | | 346,371 | | |
| | | | | | | | | | | | | | | | | | | |
| Expenses: | | | | | | | | | | | | | | | | | | |
| Investment Management | | | | — | | | | | | — | | | | | | 125,920 | | |
| Operational Support: | | | | | | | | | | | | | | | | | | |
| Class A Shares | | | | — | | | | | | — | | | | | | 2,840 | | |
| Administration: | | | | | | | | | | | | | | | | | | |
| Class A Shares | | | | 1,738 | | | | | | — | | | | | | 1,091 | | |
| Class B Shares* | | | | 2 | | | | | | — | | | | | | — | | |
| Class C Shares | | | | 20 | | | | | | — | | | | | | — | | |
| Class I Shares | | | | — | | | | | | 24,649 | | | | | | 2,780 | | |
| Distribution: | | | | | | | | | | | | | | | | | | |
| Class B Shares* | | | | 57 | | | | | | — | | | | | | — | | |
| Class C Shares | | | | 804 | | | | | | — | | | | | | — | | |
| Shareholder Servicing: | | | | | | | | | | | | | | | | | | |
| Class A Shares | | | | 20,850 | | | | | | — | | | | | | 7,073 | | |
| Class B Shares* | | | | 19 | | | | | | — | | | | | | — | | |
| Class C Shares | | | | 248 | | | | | | — | | | | | | — | | |
| Accounting | | | | 24,000 | | | | | | 13,999 | | | | | | 54,786 | | |
| Administrative Services | | | | 5,667 | | | | | | 1,905 | | | | | | 690 | | |
| Compliance Services | | | | 31,392 | | | | | | 31,392 | | | | | | 31,392 | | |
| Custodian | | | | — | | | | | | — | | | | | | 116,395 | | |
| Printing | | | | 1,520 | | | | | | 16,034 | | | | | | 8,368 | | |
| Professional | | | | 104,189 | | | | | | 107,517 | | | | | | 145,148 | | |
| Transfer Agent | | | | 107,901 | | | | | | 138,673 | | | | | | 152,483 | | |
| Trustee | | | | 80,999 | | | | | | 80,999 | | | | | | 80,999 | | |
| Registration fees | | | | 24,203 | | | | | | 23,255 | | | | | | 29,922 | | |
| Other | | | | 28,761 | | | | | | 33,277 | | | | | | 22,764 | | |
| Total expenses before fee and expense reductions | | | | 432,370 | | | | | | 471,700 | | | | | | 782,651 | | |
| Fees contractually reduced/reimbursed by Investment Adviser | | | | (378,659 | ) | | | | | (432,989 | ) | | | | | (621,906 | ) | |
| Fees voluntarily reduced/reimbursed by Investment Adviser | | | | (9,180 | ) | | | | | — | | | | | | — | | |
| Net Expenses | | | | 44,531 | | | | | | 38,711 | | | | | | 160,745 | | |
| | | | | | | | | | | | | | | | | | | |
| Net Investment Income/(Loss) | | | | (73,466 | ) | | | | | (440,146 | ) | | | | | 185,626 | | |
| | | | | | | | | | | | | | | | | | | |
| Realized/Unrealized Gains/(Losses) from Investments: | | | | | | | | | | | | | | | | | | |
| Net realized gains/(losses) from investments in securities and foreign currency translations (a) | | | | — | | | | | | — | | | | | | (912,055 | ) | |
| Net realized gains/(losses) from Affiliated Portfolio | | | | 606,415 | | | | | | 7,603,036 | | | | | | — | | |
| Change in unrealized appreciation/depreciation on investments from Affiliated Portfolio | | | | 221,317 | | | | | | 3,890,823 | | | | | | — | | |
| Change in unrealized appreciation/depreciation on investments in securities and foreign currency | | | | | | | | | | | | | | | | | | |
| translations (b) | | | | — | | | | | | — | | | | | | 1,848,918 | | |
| | | | | | | | | | | | | | | | | | | |
| Net realized/unrealized gains/(losses) on investments and on investments from | | | | | | | | | | | | | | | | | | |
| Affiliated Portfolio | | | | 827,732 | | | | | | 11,493,859 | | | | | | 936,863 | | |
| Change in Net Assets Resulting from Operations | | | $ | 754,266 | | | | | $ | 11,053,713 | | | | | $ | 1,122,489 | | |
____________________
Amounts designated as "—" are $0.00 or have been rounded to $0.00.
| * | Class B Shares were liquidated on August 2, 2019. |
| (a) | For Frontier Markets Fund, net of foreign capital gains taxes of $1,160. |
| (b) | For Frontier Markets Fund, net of change in foreign capital gains taxes of $(570). |
| 12 | HSBC FAMILY OF FUNDS | See notes to financial statements. |
HSBCFAMILY OF FUNDS
Statements of Changes in Net Assets
| | HSBC Opportunity Fund | | HSBC Opportunity Fund (Class I) |
| | For the | For the | | For the | For the |
| | year ended | year ended | | year ended | year ended |
| | October 31, 2019 | October 31, 2018 | | October 31, 2019 | October 31, 2018 |
| Investment Activities: | | | | | | | | | | | | | | | | | | | | | | |
| Operations: | | | | | | | | | | | | | | | | | | | | | | |
| Net investment income/(loss) | | | $ | (73,466 | ) | | | $ | (90,660 | ) | | | | $ | (440,146 | ) | | | $ | (574,665 | ) | |
| Net realized gains/(losses) from investments | | | | 606,415 | | | | | 1,711,715 | | | | | | 7,603,036 | | | | | 22,339,913 | | |
| Change in unrealized appreciation/depreciation on investments | | | | 221,317 | | | | | (934,014 | ) | | | | | 3,890,823 | | | | | (12,911,260 | ) | |
| Change in net assets resulting from operations | | | | 754,266 | | | | | 687,041 | | | | | | 11,053,713 | | | | | 8,853,988 | | |
| | | | | | | | | | | | | | | | | | | | | | | |
| Distributions to shareholders: | | | | | | | | | | | | | | | | | | | | | | |
| Class A Shares | | | | (1,543,839 | ) | | | | (1,047,996 | ) | | | | | — | | | | | — | | |
| Class B Shares* | | | | (4,577 | ) | | | | (7,279 | ) | | | | | — | | | | | — | | |
| Class C Shares | | | | (31,533 | ) | | | | (71,416 | ) | | | | | — | | | | | — | | |
| Class I Shares | | | | — | | | | | — | | | | | | (21,193,931 | ) | | | | (17,639,612 | ) | |
| Change in net assets resulting from distributions to | | | | | | | | | | | | | | | | | | | | | | |
| shareholders | | | | (1,579,949 | ) | | | | (1,126,691 | ) | | | | | (21,193,931 | ) | | | | (17,639,612 | ) | |
| Change in net assets resulting from capital transactions | | | | (132,002 | ) | | | | 4,054 | | | | | | (10,575,246 | ) | | | | 17,564,892 | | |
| Change in net assets | | | | (957,685 | ) | | | | (435,596 | ) | | | | | (20,715,464 | ) | | | | 8,779,268 | | |
| | | | | | | | | | | | | | | | | | | | | | | |
| Net Assets: | | | | | | | | | | | | | | | | | | | | | | |
| Beginning of period | | | | 9,484,365 | | | | | 9,919,961 | | | | | | 136,639,769 | | | | | 127,860,501 | | |
| End of period | | | $ | 8,526,680 | | | | $ | 9,484,365 | | | | | $ | 115,924,305 | | | | $ | 136,639,769 | | |
| | | | | | | | | | | | | | | | | | | | | | | |
____________________
Amounts designated as “—” are $0.00 or have been rounded to $0.00.
| * | Class B Shares were liquidated August 2, 2019. |
| See notes to financial statements. | HSBC FAMILY OF FUNDS | 13 |
HSBC FAMILY OF FUNDS
Statements of Changes in Net Assets (continued)
| | HSBC Opportunity Fund | | HSBC Opportunity Fund (Class I) |
| | For the | For the | | For the | For the |
| | year ended | year ended | | year ended | year ended |
| | October 31, 2019 | October 31, 2018 | | October 31, 2019 | October 31, 2018 |
| CAPITAL TRANSACTIONS: | | | | | | | | | | | | | | | | | | | | | | |
| Class A Shares: | | | | | | | | | | | | | | | | | | | | | | |
| Proceeds from shares issued | | | $ | 510,575 | | | | $ | 582,737 | | | | | $ | — | | | | $ | — | | |
| Dividends reinvested | | | | 1,500,978 | | | | | 1,020,798 | | | | | | — | | | | | — | | |
| Value of shares redeemed | | | | (2,113,928 | ) | | | | (1,265,078 | ) | | | | | — | | | | | — | | |
| Class A Shares capital transactions | | | | (102,375 | ) | | | | 338,457 | | | | | | — | | | | | — | | |
| | | | | | | | | | | | | | | | | | | | | | | |
| Class B Shares:* | | | | | | | | | | | | | | | | | | | | | | |
| Dividends reinvested | | | | 4,580 | | | | | 7,279 | | | | | | — | | | | | — | | |
| Value of shares redeemed | | | | (18,154 | ) | | | | (31,516 | ) | | | | | — | | | | | — | | |
| Class B Shares capital transactions | | | | (13,574 | ) | | | | (24,237 | ) | | | | | — | | | | | — | | |
| | | | | | | | | | | | | | | | | | | | | | | |
| Class C Shares: | | | | | | | | | | | | | | | | | | | | | | |
| Proceeds from shares issued | | | | 9,188 | | | | | 6,582 | | | | | | — | | | | | — | | |
| Dividends reinvested | | | | 31,533 | | | | | 71,416 | | | | | | — | | | | | — | | |
| Value of shares redeemed | | | | (56,774 | ) | | | | (388,164 | ) | | | | | — | | | | | — | | |
| Class C Shares capital transactions | | | | (16,053 | ) | | | | (310,166 | ) | | | | | — | | | | | — | | |
| | | | | | | | | | | | | | | | | | | | | | | |
| Class I Shares: | | | | | | | | | | | | | | | | | | | | | | |
| Proceeds from shares issued | | | | — | | | | | — | | | | | | 12,369,332 | | | | | 18,679,912 | | |
| Dividends reinvested | | | | — | | | | | — | | | | | | 20,911,758 | | | | | 17,448,749 | | |
| Value of shares redeemed | | | | — | | | | | — | | | | | | (43,856,336 | ) | | | | (18,563,769 | ) | |
| Class I Shares capital transactions | | | | — | | | | | — | | | | | | (10,575,246 | ) | | | | 17,564,892 | | |
| Change in net assets resulting from capital transactions | | | $ | (132,002 | ) | | | $ | 4,054 | | | | | $ | (10,575,246 | ) | | | $ | 17,564,892 | | |
| | | | | | | | | | | | | | | | | | | | | | | |
| SHARE TRANSACTIONS: | | | | | | | | | | | | | | | | | | | | | | |
| Class A Shares: | | | | | | | | | | | | | | | | | | | | | | |
| Issued | | | | 55,467 | | | | | 50,934 | | | | | | — | | | | | — | | |
| Reinvested | | | | 196,721 | | | | | 95,491 | | | | | | — | | | | | — | | |
| Redeemed | | | | (229,568 | ) | | | | (110,424 | ) | | | | | — | | | | | — | | |
| Change in Class A Shares | | | | 22,620 | | | | | 36,001 | | | | | | — | | | | | — | | |
| | | | | | | | | | | | | | | | | | | | | | | |
| Class B Shares:* | | | | | | | | | | | | | | | | | | | | | | |
| Reinvested | | | | 1,261 | | | | | 1,174 | | | | | | — | | | | | — | | |
| Redeemed | | | | (4,023 | ) | | | | (4,677 | ) | | | | | — | | | | | — | | |
| Change in Class B Shares | | | | (2,762 | ) | | | | (3,503 | ) | | | | | — | | | | | — | | |
| | | | | | | | | | | | | | | | | | | | | | | |
| Class C Shares: | | | | | | | | | | | | | | | | | | | | | | |
| Issued | | | | 1,980 | | | | | 998 | | | | | | — | | | | | — | | |
| Reinvested | | | | 7,983 | | | | | 10,870 | | | | | | — | | | | | — | | |
| Redeemed | | | | (11,740 | ) | | | | (55,691 | ) | | | | | — | | | | | — | | |
| Change in Class C Shares | | | | (1,777 | ) | | | | (43,823 | ) | | | | | — | | | | | — | | |
| | | | | | | | | | | | | | | | | | | | | | | |
| Class I Shares: | | | | | | | | | | | | | | | | | | | | | | |
| Issued | | | | — | | | | | — | | | | | | 998,920 | | | | | 1,176,332 | | |
| Reinvested | | | | — | | | | | — | | | | | | 2,026,333 | | | | | 1,219,340 | | |
| Redeemed | | | | — | | | | | — | | | | | | (3,463,981 | ) | | | | (1,195,712 | ) | |
| Change in Class I Shares | | | | — | | | | | — | | | | | | (438,728 | ) | | | | 1,199,960 | | |
____________________
Amounts designated as "—" are $0.00 or have been rounded to $0.00.
| * | Class B Shares were liquidated August 2, 2019. |
| 14 | HSBC FAMILY OF FUNDS | See notes to financial statements. |
HSBC FAMILY OF FUNDS
Statements of Changes in Net Assets (continued)
| | HSBC Frontier Markets Fund |
| | For the | For the |
| | year ended | year ended |
| | October 31, 2019 | October 31, 2018 |
| Investment Activities: | | | | | | | | | | | |
| Operations: | | | | | | | | | | | |
| Net investment income/(loss) | | | $ | 185,626 | | | | $ | 353,213 | | |
| Net realized gains/(losses) from investments | | | | (912,055 | ) | | | | 5,130,673 | | |
| Change in unrealized appreciation/depreciation on investments | | | | 1,848,918 | | | | | (8,540,176 | ) | |
| Change in net assets resulting from operations | | | | 1,122,489 | | | | | (3,056,290 | ) | |
| | | | | | | | | | | | |
| Distributions to shareholders: | | | | | | | | | | | |
| Class A Shares | | | | (53,378 | ) | | | | (54,857 | ) | |
| Class I Shares | | | | (163,151 | ) | | | | (335,337 | ) | |
| Change in net assets resulting from distributions to shareholders | | | | (216,529 | ) | | | | (390,194 | ) | |
| Change in net assets resulting from payments from affiliate | | | | 23,046 | | | | | — | | |
| Change in net assets resulting from capital transactions | | | | (7,636,721 | ) | | | | (28,944,038 | ) | |
| Change in net assets | | | | (6,707,715 | ) | | | | (32,390,522 | ) | |
| | | | | | | | | | | | |
| Net Assets: | | | | | | | | | | | |
| Beginning of period | | | | 14,168,942 | | | | | 46,559,464 | | |
| End of period | | | $ | 7,461,227 | | | | $ | 14,168,942 | | |
| | | | | | | | | | | | |
| See notes to financial statements. | HSBC FAMILY OF FUNDS | 15 |
HSBC FAMILY OF FUNDS
Statements of Changes in Net Assets (continued)
| | HSBC Frontier Markets Fund |
| | For the | For the |
| | year ended | year ended |
| | October 31, 2019 | October 31, 2018 |
| CAPITAL TRANSACTIONS: | | | | | | | | | | | |
| Class A Shares: | | | | | | | | | | | |
| Proceeds from shares issued | | | $ | 1,358,930 | | | | $ | 1,874,481 | | |
| Dividends reinvested | | | | 51,409 | | | | | 44,239 | | |
| Value of shares redeemed | | | | (4,724,240 | ) | | | | (4,902,875 | ) | |
| Class A Shares capital transactions | | | | (3,313,901 | ) | | | | (2,984,155 | ) | |
| | | | | | | | | | | | |
| Class I Shares: | | | | | | | | | | | |
| Proceeds from shares issued | | | | 2,111,750 | | | | | 6,391,802 | | |
| Dividends reinvested | | | | 148,439 | | | | | 154,122 | | |
| Value of shares redeemed | | | | (6,583,009 | ) | | | | (32,505,807 | ) | |
| Class I Shares capital transactions | | | | (4,322,820 | ) | | | | (25,959,883 | ) | |
| Change in net assets resulting from capital transactions | | | $ | (7,636,721 | ) | | | $ | (28,944,038 | ) | |
| | | | | | | | | | | | |
| SHARE TRANSACTIONS: | | | | | | | | | | | |
| Class A Shares: | | | | | | | | | | | |
| Issued | | | | 116,274 | | | | | 146,955 | | |
| Reinvested | | | | 4,640 | | | | | 3,167 | | |
| Redeemed | | | | (390,508 | ) | | | | (383,470 | ) | |
| Change in Class A Shares | | | | (269,594 | ) | | | | (233,348 | ) | |
| | | | | | | | | | | | |
| Class I Shares: | | | | | | | | | | | |
| Issued | | | | 179,241 | | | | | 450,786 | | |
| Reinvested | | | | 13,397 | | | | | 10,993 | | |
| Redeemed | | | | (561,522 | ) | | | | (2,274,757 | ) | |
| Change in Class I Shares | | | | (368,884 | ) | | | | (1,812,978 | ) | |
| 16 | HSBC FAMILY OF FUNDS | See notes to financial statements. |
| HSBC OPPORTUNITY FUND |
| Financial Highlights |
Selected data for a share outstanding throughout the periods indicated.*
| | | | | | Investment Activities | | Distributions | | | | | | | | | | Ratios/Supplementary Data |
| | Net Asset
Value,
Beginning
of Period | | Net
Investment
Income/
(Loss)(a) | | Net Realized
and Unrealized
Gains/
(Losses) from
Investments | | Total from
Investment
Activities | | Net
Investment
Income | | Net Realized
Gains from
Investment
Transactions | | Total
Distributions | | Net
Asset
Value,
End of
Period | | Total
Return(b) | | Net
Assets at
End
of Period
(000’s) | | Ratio
of Net
Expenses
to Average
Net Assets | | Ratio
of Net
Investment
Income/
(Loss) to
Average
Net Assets | | Ratio of
Expenses
to Average
Net Assets
(Excluding Fee
Reductions) | | Portfolio
Turnover(c) |
| Class A Shares | | | | | | | | | | | | | | | | | | | | | | | | | | | | | | | | | | | | | | | | | | | | | | | | | | | | | | | | | | | | | | | | | | | | | | | | | | | |
| Year Ended October 31, 2019 | | | $ | 10.70 | | | | $ | (0.07 | ) | | | | $ | 0.59 | | | | | $ | 0.52 | | | | | $ | — | | | | $ | (1.80 | ) | | | | $ | (1.80 | ) | | | | $ | 9.42 | | | | 8.77 | % | | | | $ | 8,449 | | | | 1.55 | % | | | | (0.79 | )% | | | | 5.77 | % | | | | 81 | % | |
| Year Ended October 31, 2018 | | | | 11.24 | | | | | (0.10 | ) | | | | | 0.82 | | | | | | 0.72 | | | | | | — | | | | | (1.26 | ) | | | | | (1.26 | ) | | | | | 10.70 | | | | 6.46 | % | | | | | 9,352 | | | | 1.55 | % | | | | (0.84 | )% | | | | 5.37 | % | | | | 77 | % | |
| Year Ended October 31, 2017 | | | | 9.94 | | | | | (0.08 | ) | | | | | 2.68 | | | | | | 2.60 | | | | | | — | | | | | (1.30 | ) | | | | | (1.30 | ) | | | | | 11.24 | | | | 29.00 | % | | | | | 9,422 | | | | 1.55 | % | | | | (0.79 | )% | | | | 2.98 | % | | | | 80 | % | |
| Year Ended October 31, 2016 | | | | 10.34 | | | | | (0.07 | ) | | | | | (0.33 | ) | | | | | (0.40 | ) | | | | | — | | | | | — | | | | | | — | | | | | | 9.94 | | | | (3.87 | )% | | | | | 9,276 | | | | 1.55 | % | | | | (0.66 | )% | | | | 2.11 | % | | | | 96 | % | |
| Year Ended October 31, 2015 | | | | 12.83 | | | | | (0.10 | ) | | | | | (0.07 | ) | | | | | (0.17 | ) | | | | | — | | | | | (2.32 | ) | | | | | (2.32 | ) | | | | | 10.34 | | | | (2.21 | )% | | | | | 16,593 | | | | 1.55 | % | | | | (0.86 | )% | | | | 1.84 | % | | | | 63 | % | |
| Class C Shares | | | | | | | | | | | | | | | | | | | | | | | | | | | | | | | | | | | | | | | | | | | | | | | | | | | | | | | | | | | | | | | | | | | | | | | | | | | |
| Year Ended October 31, 2019 | | | | 6.53 | | | | | (0.08 | ) | | | | | 0.20 | | | | | | 0.12 | | | | | | — | | | | | (1.80 | ) | | | | | (1.80 | ) | | | | | 4.85 | | | | 8.07 | % | | | | | 77 | | | | 2.30 | % | | | | (1.54 | )% | | | | 6.60 | % | | | | 81 | % | |
| Year Ended October 31, 2018 | | | | 7.38 | | | | | (0.11 | ) | | | | | 0.52 | | | | | | 0.41 | | | | | | — | | | | | (1.26 | ) | | | | | (1.26 | ) | | | | | 6.53 | | | | 5.52 | % | | | | | 116 | | | | 2.30 | % | | | | (1.60 | )% | | | | 6.08 | % | | | | 77 | % | |
| Year Ended October 31, 2017 | | | | 6.99 | | | | | (0.11 | ) | | | | | 1.80 | | | | | | 1.69 | | | | | | — | | | | | (1.30 | ) | | | | | (1.30 | ) | | | | | 7.38 | | | | 28.11 | % | | | | | 454 | | | | 2.30 | % | | | | (1.54 | )% | | | | 3.71 | % | | | | 80 | % | |
| Year Ended October 31, 2016 | | | | 7.32 | | | | | (0.10 | ) | | | | | (0.23 | ) | | | | | (0.33 | ) | | | | | — | | | | | — | | | | | | — | | | | | | 6.99 | | | | (4.51 | )% | | | | | 475 | | | | 2.30 | % | | | | (1.41 | )% | | | | 2.88 | % | | | | 96 | % | |
| Year Ended October 31, 2015 | | | | 9.80 | | | | | (0.13 | ) | | | | | (0.03 | ) | | | | | (0.16 | ) | | | | | — | | | | | (2.32 | ) | | | | | (2.32 | ) | | | | | 7.32 | | | | (2.93 | )% | | | | | 825 | | | | 2.30 | % | | | | (1.61 | )% | | | | 2.62 | % | | | | 63 | % | |
| * | The per shareamountsandpercentagesreflectincomeandexpenses assuming inclusionof the Fund’sproportionateshare of theincomeandexpensesof the HSBCOpportunity Portfolio. |
| (a) | Calculatedbased onaveragesharesoutstanding. |
| (b) | Total returncalculationsdo notincludeany sales orredemption charges. |
| (c) | Portfolio turnoverrate iscalculatedon the basis of therespective Portfolioin which the Fundinvestsall of itsinvestable assets. Portfolio turnoveriscalculatedon the basis of the Fund as a wholewithout distinguishing betweentheclassesof sharesissued. |
| Amounts designatedas “—“ are $0.00 or have beenroundedto $0.00. |
| See notes to financial statements. | HSBC FAMILY OF FUNDS | 17 |
| HSBC OPPORTUNITY FUND (CLASS I) |
| Financial Highlights |
Selected data for a share outstanding throughout the periods indicated.*
| | | | | | Investment Activities | | Distributions | | | | | | | | | | Ratios/Supplementary Data |
| | Net Asset
Value,
Beginning
of Period | | Net
Investment
Income/
(Loss)(a) | | Net Realized
and Unrealized
Gains/
(Losses) from
Investments | | Total from
Investment
Activities | | Net
Investment
Income | | Net Realized
Gains from
Investment
Transactions | | Total
Distributions | | Net
Asset
Value,
End of
Period | | Total
Return(b) | | Net
Assets at
End
of Period
(000’s) | | Ratio
of Net
Expenses
to Average
Net Assets | | Ratio
of Net
Investment
Income/
(Loss) to
Average
Net Assets | | Ratio of
Expenses
to Average
Net Assets
(Excluding Fee
Reductions) | | Portfolio
Turnover(c) |
| Class I Shares | | | | | | | | | | | | | | | | | | | | | | | | | | | | | | | | | | | | | | | | | | | | | | | | | | | | | | | | | | | | | | | | | | | | | | | | | | | |
| Year Ended October 31, 2019 | | | $ | 14.38 | | | | $ | (0.04 | ) | | | | $ | 0.81 | | | | | $ | 0.77 | | | | | $ | — | | | | $ | (2.36 | ) | | | | $ | (2.36 | ) | | | | $ | 12.79 | | | | 9.25 | % | | | | $ | 115,924 | | | | 1.10 | % | | | | (0.34 | )% | | | | 1.44 | % | | | | 81 | % | |
| Year Ended October 31, 2018 | | | | 15.40 | | | | | (0.06 | ) | | | | | 1.12 | | | | | | 1.06 | | | | | | — | | | | | (2.08 | ) | | | | | (2.08 | ) | | | | | 14.38 | | | | 6.96 | % | | | | | 136,640 | | | | 1.10 | % | | | | (0.40 | )% | | | | 1.39 | % | | | | 77 | % | |
| Year Ended October 31, 2017 | | | | 13.27 | | | | | (0.05 | ) | | | | | 3.65 | | | | | | 3.60 | | | | | | — | | | | | (1.47 | ) | | | | | (1.47 | ) | | | | | 15.40 | | | | 29.53 | % | | | | | 127,861 | | | | 1.10 | % | | | | (0.34 | )% | | | | 1.12 | % | | | | 80 | % | |
| Year Ended October 31, 2016 | | | | 13.72 | | | | | (0.02 | ) | | | | | (0.43 | ) | | | | | (0.45 | ) | | | | | — | | | | | — | | | | | | — | | | | | | 13.27 | | | | (3.28 | )% | | | | | 141,061 | | | | 1.03 | % | | | | (0.15 | )% | | | | 1.03 | % | | | | 96 | % | |
| Year Ended October 31, 2015 | | | | 17.47 | | | | | (0.05 | ) | | | | | (0.08 | ) | | | | | (0.13 | ) | | | | | — | | | | | (3.62 | ) | | | | | (3.62 | ) | | | | | 13.72 | | | | (1.69 | )% | | | | | 219,846 | | | | 0.99 | % | | | | (0.30 | )% | | | | 0.99 | % | | | | 63 | % | |
| * | The per shareamountsandpercentagesreflectincomeandexpenses assuming inclusionof the Fund’sproportionateshare of theincomeandexpensesof the HSBCOpportunity Portfolio. |
| (a) | Calculatedbased onaveragesharesoutstanding. |
| (b) | Total returncalculationsdo notincludeany sales orredemption charges. |
| (c) | Portfolio turnoverrate iscalculatedon the basis of therespective Portfolioin which the Fundinvestsall of itsinvestable assets. Portfolio turnoveriscalculatedon the basis of the Fund as a wholewithout distinguishing betweentheclassesof sharesissued. |
| Amounts designatedas ‘—‘ are $0.00 or have beenroundedto $0.00. |
| 18 | HSBC FAMILY OF FUNDS | See notes to financial statements. |
| HSBC FRONTIER MARKETS FUND |
| Financial Highlights |
Selected data for a share outstanding throughout the periods indicated.
| | | | | | Investment Activities | | Distributions | | | | | | | | | | | Ratios/Supplementary Data |
| | Net Asset
Value,
Beginning
of Period | | Net
Investment
Income/
(Loss)(a) | | Net Realized
and
Unrealized
Gains/
(Losses) from
Investments | | Total from
Investment
Activities | | Net
Investment
Income | | Net Realized
Gains from
Investment
Transactions | | Total
Distributions | | Net
Asset
Value,
End of
Period | | Total
Return(b) | | Net
Assets at
End
of Period
(000’s) | | Ratio
of Net
Expenses
to Average
Net Assets | | Ratio
of Net
Investment
Income/
(Loss) to
Average
Net Assets | | Ratio of
Expenses
to Average
Net Assets
(Excluding Fee
Reductions) | | Portfolio
Turnover(c) |
| Class A Shares | | | | | | | | | | | | | | | | | | | | | | | | | | | | | | | | | | | | | | | | | | | | | | | | | | | | | | | | | | | | | | | | | | | | | | | | | | | | |
| Year Ended October 31, 2019 | | | $ | 11.36 | | | | $ | 0.24 | | | | $ | 0.92 | | | | | $ | 1.16 | | | | | $ | (0.17 | ) | | | | $ | — | | | | | $ | (0.17 | ) | | | | $ | 12.35 | | | | | 10.34 | %(d) | | | | $ | 1,391 | | | | 1.85 | % | | | | 1.98 | % | | | | 8.34 | % | | | | 55 | % | |
| Year Ended October 31, 2018 | | | | 14.10 | | | | | 0.17 | | | | | (2.82 | ) | | | | | (2.65 | ) | | | | | (0.09 | ) | | | | | — | | | | | | (0.09 | ) | | | | | 11.36(e) | | | | | (18.89 | )% | | | | | 4,342 | | | | 2.00 | % | | | | 1.26 | % | | | | 5.54 | % | | | | 62 | % | |
| Year Ended October 31, 2017 | | | | 11.94 | | | | | 0.16 | | | | | 2.23 | | | | | | 2.39 | | | | | | (0.23 | ) | | | | | — | | | | | | (0.23 | ) | | | | | 14.10 | (e) | | | | 20.41 | % | | | | | 8,676 | | | | 2.20 | % | | | | 1.20 | % | | | | 3.28 | % | | | | 44 | % | |
| Year Ended October 31, 2016 | | | | 12.11 | | | | | 0.13 | | | | | 0.14 | | | | | | 0.27 | | | | | | (0.44 | ) | | | | | — | | | | | | (0.44 | ) | | | | | 11.94 | | | | | 2.59 | % | | | | | 7,069 | | | | 2.18 | % | | | | 1.17 | % | | | | 2.55 | % | | | | 8 | % | |
| Year Ended October 31, 2015 | | | | 14.95 | | | | | 0.12 | | | | | (1.81 | ) | | | | | (1.69 | ) | | | | | (0.09 | ) | | | | | (1.06 | ) | | | | | (1.15 | ) | | | | | 12.11 | | | | | (11.67 | )% | | | | | 21,756 | | | | 2.20 | % | | | | 0.96 | % | | | | 2.20 | % | | | | 66 | % | |
| Class I Shares | | | | | | | | | | | | | | | | | | | | | | | | | | | | | | | | | | | | | | | | | | | | | | | | | | | | | | | | | | | | | | | | | | | | | | | | | | | | |
| Year Ended October 31, 2019 | | | | 11.44 | | | | | 0.22 | | | | | 0.98 | | | | | | 1.20 | | | | | | (0.25 | ) | | | | | — | | | | | | (0.25 | ) | | | | | 12.39 | | | | | 10.72 | %(d) | | | | | 6,071 | | | | 1.50 | % | | | | 1.79 | % | | | | 7.57 | % | | | | 55 | % | |
| Year Ended October 31, 2018 | | | | 14.18 | | | | | 0.19 | | | | | (2.79 | ) | | | | | (2.60 | ) | | | | | (0.14 | ) | | | | | — | | | | | | (0.14 | ) | | | | | 11.44 | (e) | | | | (18.52 | )% | | | | | 9,827 | | | | 1.70 | % | | | | 1.30 | % | | | | 4.81 | % | | | | 62 | % | |
| Year Ended October 31, 2017 | | | | 12.02 | | | | | 0.19 | | | | | 2.25 | | | | | | 2.44 | | | | | | (0.28 | ) | | | | | — | | | | | | (0.28 | ) | | | | | 14.18 | (e) | | | | 20.78 | % | | | | | 37,883 | | | | 1.85 | % | | | | 1.49 | % | | | | 2.90 | % | | | | 44 | % | |
| Year Ended October 31, 2016 | | | | 12.19 | | | | | 0.22 | | | | | 0.09 | | | | | | 0.31 | | | | | | (0.48 | ) | | | | | — | | | | | | (0.48 | ) | | | | | 12.02 | | | | | 2.99 | % | | | | | 42,207 | | | | 1.82 | % | | | | 1.93 | % | | | | 2.20 | % | | | | 8 | % | |
| Year Ended October 31, 2015 | | | | 15.08 | | | | | 0.19 | | | | | (1.85 | ) | | | | | (1.66 | ) | | | | | (0.17 | ) | | | | | (1.06 | ) | | | | | (1.23 | ) | | | | | 12.19 | | | | | (11.42 | )% | | | | | 120,010 | | | | 1.85 | % | | | | 1.44 | % | | | | 1.86 | % | | | | 66 | % | |
| (a) | Calculated based on average shares outstanding. |
| (b) | Total return calculations do not include any sales or redemption charges. |
| (c) | Portfolio turnover is calculated on the basis of the Fund as a whole without distinguishing between the classes of shares issued. |
| (d) | During the year ended October 31, 2019, the Fund received a payment from an affiliate. The corresponding impact to the total return was 0.27%. |
| (e) | The net asset value per share (“NAV”) for financial reporting purposes differs from the NAV reported due to adjustments made in accordance with accounting principles generally accepted in the United States of America. |
| Amounts designated as ‘—‘ are $0.00 or have been rounded to $0.00. |
| See notes to financial statements. | HSBC FAMILY OF FUNDS | 19 |
| HSBC FAMILY OF FUNDS |
| Notes to Financial Statements—as of October 31, 2019 |
1. Organization:
The HSBC Funds (the “Trust”), a Delaware statutory trust organized on March 2, 2016, is registered under the Investment Company Act of 1940, as amended (the “Act”), as an open-end management investment company. As of October 31, 2019, the Trust is composed of 8 separate operational funds, each a series of the HSBC Family of Funds. The accompanying financial statements are presented for the following three diversified funds (individually a “Fund”, collectively the “Funds”) of the Trust:
| Fund | | Short Name |
| HSBC Opportunity Fund | | Opportunity Fund |
| HSBC Opportunity Fund (Class I) | | Opportunity Fund (Class I) |
| HSBC Frontier Markets Fund | | Frontier Markets Fund |
Financial statements for all other funds of the Trust are published separately.
The HSBC Opportunity Fund and HSBC Opportunity Fund (Class I) (collectively the “Feeder Funds”) are feeder funds in a master-feeder fund structure and each feeder fund seeks to achieve its investment objectives by investing all of its investable assets in the HSBC Opportunity Portfolio (the “Portfolio”), which is a diversified series of the Trust. The Portfolio operates as the master fund in a master-feeder arrangement in which the feeder funds invest all or part of their investable assets in the Portfolio. The Feeder Funds’ proportionate ownership of the Portfolio as of October 31, 2019 was as follows:
| | Proportionate |
| | Ownership |
| | Interest on |
| Fund | | October 31, 2019 (%) |
| Opportunity Fund | | | 6.9 | |
| Opportunity Fund (Class I) | | | 93.1 | |
The financial statements of the Portfolio, including the Schedule of Portfolio Investments, are included elsewhere in this report. The financial statements of the Portfolio should be read in conjunction with the financial statements of the Feeder Funds.
The Funds are authorized to issue an unlimited number of shares of beneficial interest with a par value of $0.001 per share. The Opportunity Fund offers two classes of shares: Class A Shares and Class C Shares. The Opportunity Fund (Class I) offers one class of shares: Class I Shares. The Frontier Markets Fund offers two classes of shares: Class A and Class I. Class A Shares of the Opportunity Fund and Frontier Markets Fund have a maximum sales charge of 5.00% as a percentage of the offering price. Class C Shares of the Opportunity Fund are offered without any front-end sales charge but will be subject to a maximum CDSC of 1.00% if redeemed less than one year after purchase. No sales charges are assessed with respect to Class I Shares of the Opportunity Fund (Class I) and Frontier Markets Fund. Each class of shares in the Funds has identical rights and privileges except with respect to arrangements pertaining to shareholder servicing and/or distribution, class-related expenses, voting rights on matters affecting a single class of shares, and exchange privileges of each class of shares. Class B Shares of the Opportunity Fund were operational during the year but were liquidated and are no longer offered as of October 31, 2019.
Under the Trust’s organizational documents, the Trust’s officers and Trustees are indemnified against certain liabilities arising out of the performance of their duties to the Funds. In addition, in the normal course of business, the Trust enters into contracts with its service providers, which also provide for indemnifications by the Funds. The Funds’ maximum exposure under these arrangements is unknown, as this would involve future claims that may be made against the Funds. However, based on experience, the Trust believes the risk of loss to be remote.
The Funds are investment companies and follow accounting and reporting guidance under Financial Accounting Standards Board Accounting Standards Codification Topic 946, “Financial Services-Investment Companies.”
| HSBC FAMILY OF FUNDS |
| Notes to Financial Statements—as of October 31, 2019 (continued) |
2. Significant Accounting Policies:
The following is a summary of the significant accounting policies followed by the Funds in the preparation of their financial statements. The policies are in conformity with generally accepted accounting principles in the United States of America (“GAAP”). The preparation of financial statements requires management to make certain estimates and assumptions that affect the reported amounts of assets and liabilities and disclosure of contingent assets and liabilities at the date of the financial statements and the reported amounts of increases and decreases in net assets from operations during the reporting period. Actual results could differ from those estimates.
Securities Valuation:
The Funds record their investments at fair value. Fair value is defined as the price that would be received to sell an asset or paid to transfer a liability in an orderly transaction between market participants at the measurement date. The valuation techniques used to determine fair value are further described in Note 3 below.
Investment Transactions and Related Income:
The Feeder Funds record investments to the Portfolio on a trade date basis. The Feeder Funds record daily their proportionate share of income, expenses, changes in unrealized appreciation and depreciation and realized gains and losses derived from the Portfolio. In addition, the Feeder Funds accrue their own expenses daily as incurred.
Investment transactions for the Frontier Markets Fund are accounted for no later than one business day after trade date. However, for financial reporting purposes, investment transactions are accounted for on trade date. Investment gains and losses are calculated on the identified cost basis. Interest income is determined on the basis of coupon interest accrued using the effective interest method which adjusts for amortization of premiums and accretion of discounts. Dividend income is recorded on the ex-dividend date except in the case of certain foreign securities, in which case dividends are recorded as soon as such information becomes available. Pay-in-kind interest income and non-cash dividend income received in the form of securities in-lieu of cash, if any, are recorded at the fair value of the securities received.
Foreign Currency Translation:
The accounting records of the Funds are maintained in U.S. dollars. Foreign currency amounts are translated into U.S. dollars at the current rate of exchange to determine the value of investments, assets and liabilities at the close of each business day. Purchases and sales of securities, and income and expenses are translated at the prevailing rate of exchange on the respective dates of such transactions. The Funds do not isolate the portion of the results of operations resulting from changes in foreign exchange rates on investments from fluctuations arising from changes in market prices of securities held. Such fluctuations are included with the net realized and unrealized gain or loss from investments in securities and foreign currency translations.
Foreign Taxes:
Income received by the Frontier Markets Fund from sources within foreign countries may be subject to withholding and other income or similar taxes imposed by such countries. The Frontier Markets Fund may be subject to foreign taxes on gains on investments or currency repatriation. The Frontier Markets Fund accrues foreign capital gains taxes, as applicable, based on its current interpretation of tax rules in the foreign markets in which it invests. Such tax accrual is based in part on actual and estimated realized gains. Estimated realized gains are subject to change and such change could be material. However, management’s conclusions may be subject to future review and change based on changes in, or the interpretation of, the accounting standards or tax laws and regulations.
Restricted Securities and Illiquid Investments:
The Frontier Markets Fund may invest in restricted securities. A restricted security is a security which has been purchased through a private offering and cannot be resold to the general public without prior registration under the Securities Act of 1933 (the “1933 Act”) or pursuant to the resale limitations provided by Rule 144 under the 1933 Act, or another exemption from the registration requirements of the 1933 Act. Certain
| HSBC FAMILY OF FUNDS |
| Notes to Financial Statements—as of October 31, 2019 (continued) |
restricted securities may be resold in transactions exempt from registration, normally to qualified institutional buyers, and may be classified as liquid by the Investment Adviser (as defined in Note 4) under the Funds’ liquidity risk management program, as approved by the Board of Trustees (the “Board”). Therefore, not all restricted securities are considered illiquid. To the extent that a Fund purchases securities that are restricted as to resale or for which current market quotations are not available, such securities will be valued based upon all relevant factors as outlined in Securities and Exchange Commission Financial Reporting Release No. 1. Disposal of restricted securities may involve time consuming negotiations and expense. Prompt sale at the current valuation may be difficult and could adversely affect the net assets of the Frontier Markets Fund.
Participation Notes and Participatory Notes:
The Frontier Markets Fund may invest in participation notes or participatory notes (“P-notes”). P-notes are participation interest notes that are issued by banks or broker-dealers and are designed to offer a return linked to a particular underlying equity, debt, currency or market. If the P-note were held to maturity, the issuer would pay to, or receive from, the purchaser the difference between the nominal value of the underlying instruments at the time of purchase and that instrument’s value at maturity. The holder of a P-note that is linked to a particular underlying security or instrument may be entitled to receive any dividends paid in connection with that underlying security or instrument, but typically does not receive voting rights as it would if it directly owned the underlying security or instrument. P-notes involve transaction costs. Investments in P-notes involve the same risks associated with a direct investment in the underlying securities, instruments or markets that they seek to replicate. In addition, there can be no assurance that there will be a trading market for a P-note or that the trading price of a P-note will equal the underlying value of the security, instrument or market that it seeks to replicate. Due to liquidity and transfer restrictions, the secondary markets on which a P-note is traded may be less liquid than the market for other securities, or may be completely illiquid, which may also affect the ability of the Frontier Markets Fund to accurately value a P-note. P-notes typically constitute general unsecured contractual obligations of the banks or broker-dealers that issue them, which subjects the Frontier Markets Fund to counterparty risk (and this risk may be amplified if the Frontier Markets Fund purchases P-notes from only a small number of issuers).
Allocations:
Expenses directly attributable to a Fund are charged to that Fund. Expenses not directly attributable to a Fund are allocated among the applicable series within the Trust equally to each fund, in relation to its net assets, or another appropriate basis. Class specific expenses are charged directly to the class incurring the expense. In addition, income, expenses (other than class specific expenses), and unrealized and realized gains and losses are allocated to each class based on relative net assets on a daily basis.
Distributions to Shareholders:
Dividends distributed to shareholders of the Funds from net investment income, if any, are declared and distributed semiannually for the Feeder Funds and annually for the Frontier Markets Fund.
Distributions from net realized gains, if any, are declared and paid at least annually by the Funds. Additional distributions are also made to the Funds’ shareholders to the extent necessary to avoid the federal excise tax on certain undistributed income and net realized gains of regulated investment companies.
Federal Income Taxes:
Each Fund is a separate taxable entity for federal income tax purposes. Each Fund has qualified and intends to continue to qualify each year as a “regulated investment company” under Subchapter M of the Internal Revenue Code, as amended, and to distribute substantially all of its taxable net investment income and net realized gains, if any, to its shareholders. Accordingly, no provision for federal income or excise tax is required for the Funds, although shareholders may be taxed on distributions they receive.
Management of the Funds has reviewed tax positions taken in tax years that remain subject to examination by all major tax jurisdictions, including federal (i.e., the last four tax year ends and the interim tax period since then, as applicable). Management believes that there is no tax liability resulting from unrecognized tax benefits related to uncertain tax positions taken. Management’s conclusions may be subject to future review based on changes in, or interpretation of, accounting standards or tax laws and regulations.
| HSBC FAMILY OF FUNDS |
| Notes to Financial Statements—as of October 31, 2019 (continued) |
3. Investment Valuation Summary
The valuation techniques employed by the Funds, as described below, maximize the use of observable inputs and minimize the use of unobservable inputs in determining fair value. The Funds’ investments are classified within the fair value hierarchy based on the lowest level of input that is significant to the fair value measurement. The inputs used for valuing the Funds’ investments are summarized in the three broad levels listed below:
| ● | Level 1—quoted prices in active markets for identical assets
|
| ● | Level 2—other significant observable inputs (including quoted prices for similar securities, interest rates, prepayments speeds, credit risk, etc.)
|
| ● | Level 3—significant unobservable inputs (including the Fund’s own assumptions in determining the fair value of investments) |
Exchange traded, domestic equity securities are valued at the last sale price on a national securities exchange (except the NASDAQ Stock Market), or in the absence of recorded sales, at the readily available closing bid price on such exchanges. Securities traded on the NASDAQ Stock Market are valued at the NASDAQ Official Closing Price on the date of valuation. Domestic equity securities that are not traded on an exchange are valued at the quoted bid price in the over-the-counter market. These securities are typically categorized as Level 1 in the fair value hierarchy.
Exchange traded, foreign equity securities are valued in the appropriate currency on the last quoted sale price, or in the absence of recorded sales, at the readily available closing bid price on such exchange. If no sale is available because the country is on holiday the previous day’s last quoted sales price would be utilized. These securities are typically categorized as Level 1 in the fair value hierarchy. Foreign equity securities that are not exchange traded are valued in the appropriate currency at the average of the quoted bid and asked prices in the over-the-counter market and are typically categorized as Level 2 in the fair value hierarchy.
Rights and warrants are valued at the last sales price on a national securities exchange. If these instruments are not scheduled to trade for a certain period they are generally valued intrinsically based on the terms of the issuance and the price of the underlying security. The time value of the warrants may also be considered by the Investment Adviser, as defined below. These instruments are typically categorized as Level 1 in the fair value hierarchy unless intrinsic value is used then would be categorized as Level 2 in the fair value hierarchy.
P-notes are valued by taking the last sales price of the underlying security on its primary exchange. In the absence of a recorded sale on the underlying security the readily available closing bid price on such exchange will be used. If no sale is available because the country is on holiday the previous day’s last quoted sales price would be utilized. All local prices will be converted to U.S. dollars using the foreign currency exchange rate as of the close of regular trading on the New York Stock Exchange. These instruments are typically categorized as Level 2 in the fair value hierarchy.
Investments in other mutual funds are valued at their NAVs, as reported by such mutual funds and are typically categorized as Level 1 in the fair value hierarchy.
Securities or other assets for which market quotations or an independent pricing service evaluation are not readily available, or are deemed unreliable due to a significant event or otherwise, are valued pursuant to procedures adopted by the Board (“Procedures”). Depending on the source and relative significance of valuation inputs, these instruments may be classified as Level 2 or Level 3 in the fair value hierarchy. Examples of potentially significant events that could affect the value of an individual security and thus require pricing under the Procedures include corporate actions by the issuer, announcements by the issuer relating to its earnings or products, regulatory news, natural disasters, and litigation. Examples of potentially significant events that could affect multiple securities held by a Fund include governmental actions, natural disasters, and armed conflicts. Fair value pricing may require subjective determinations about the value of a security. While the Trust’s policy is intended to result in a calculation of a Fund’s NAV that fairly reflects security values as of the time of pricing, the Trust cannot ensure that fair values determined would accurately reflect the price that a Fund could obtain for a security if it were to dispose of that security as of the time of pricing. The prices used by a Fund may differ from the value that would be realized if the securities were sold and the differences could be material to the financial statements.
| HSBC FAMILY OF FUNDS |
| Notes to Financial Statements—as of October 31, 2019 (continued) |
In addition, if events materially affecting the value of foreign securities occur between the time when the exchange on which they are traded closes and the time when the Funds’ NAV is calculated, such securities may be valued using fair value pricing in accordance with procedures adopted by the Board. Management identifies possible fluctuations in foreign securities by monitoring the rise or fall in the value of a designated benchmark index. In the event of a rise or fall greater than predetermined levels, the Funds may use a systematic valuation model provided by an independent third party to value its foreign securities, rather than local market closing prices. When a Fund uses such a valuation model, the value assigned to the Fund’s foreign securities may not be the quoted or published prices of the investment on their primary markets or exchanges and are typically categorized as Level 2 in the fair value hierarchy. The number of days on which fair value prices will be used will depend on market activity and it is possible that fair value prices will be used by the Funds to a significant extent.
Changes in valuation techniques may result in transfers in or out of an assigned level within the fair value hierarchy. The inputs or methodology used for valuing investments are not necessarily an indication of the risk associated with investing in those investments.
The Feeder Funds record their investments in the Portfolio at fair value, which represents their proportionate ownership of the value of the Portfolios’ net assets. These investments are typically categorized as Level 2 in the fair value hierarchy. The underlying securities of the Portfolio are recorded at fair value, as discussed more fully in the Notes to Financial Statements of the Portfolio included elsewhere in this report.
The following is a summary of the valuation inputs used as of October 31, 2019 in valuing the Funds’ investments based upon the three levels defined above. The breakdown of country descriptions is disclosed in the Schedule of Portfolio Investments for each Fund:
| | LEVEL 1 ($) | | LEVEL 2 ($) | | LEVEL 3 ($) | | | Total ($) |
| HSBC Opportunity Fund | | | | | | | | | |
| Investment Securities: | | | | | | | | | |
| Affiliated Portfolio (a) | | — | | 8,567,015 | | — | | | 8,567,015 |
| Total Investment Securities | | — | | 8,567,015 | | — | | | 8,567,015 |
| | | | | | | | | | |
| HSBC Opportunity Fund (Class I) | | | | | | | | | |
| Investment Securities: | | | | | | | | | |
| Affiliated Portfolio (a) | | — | | 115,965,555 | | — | | | 115,965,555 |
| Total Investment Securities | | — | | 115,965,555 | | — | | | 115,965,555 |
| | | | | | | | | | |
| HSBC Frontier Markets Fund | | | | | | | | | |
| Investment Securities: | | | | | | | | | |
| Common Stocks | | | | | | | | | |
| Food Products | | 506,432 | | — | | — | (b) | | 506,432 |
| Other Common Stocks | | 6,935,003 | | — | | — | | | 6,935,003 |
| Participatory Notes | | — | | 122,289 | | — | | | 122,289 |
| Right | | — | | 4,687 | | — | | | 4,687 |
| Total Investment Securities | | 7,441,435 | | 126,976 | | — | | | 7,568,411 |
____________________
| (a) | Investments in the Affiliated Portfolio represent ownership interests in the Portfolio. Due to the Funds’ master-feeder structure, the inputs used to value these instruments are categorized as Level 2. |
| | |
| (b) | Security valued at $0 and categorized as Level 3. |
The Frontiers Markets Fund holds a level 3 investment at period end which had halted trading since February 21, 2018. Management valued at $0 at period end to reflect the lack of marketability and negative company guidance. Significant changes in any unobservable inputs may significantly impact the fair value measurement. The impact is based on the relationship between each unobservable input and the fair value measurement.
| HSBC FAMILY OF FUNDS |
| Notes to Financial Statements—as of October 31, 2019 (continued) |
4. Related Party Transactions and Other Agreements and Plans:
Investment Management:
HSBC Global Asset Management (USA) Inc. (“HSBC” or the “Investment Adviser”), a wholly-owned subsidiary of HSBC Bank USA, N.A., a national bank organized under the laws of the United States, acts as Investment Adviser to the Frontier Markets Fund and the Portfolio pursuant to an Investment Advisory Contract. As Investment Adviser, HSBC manages the investments of the Frontier Markets Fund and the Portfolio and continuously reviews, supervises, and administers the Frontier Markets Fund and the Portfolios’ investments. The Opportunity Fund and Opportunity Fund (Class I) are not directly charged any investment management fees. For its services in this capacity, HSBC receives a fee from the Frontier Markets Fund accrued daily and paid monthly, based on the average daily net assets of the Frontier Markets Fund, at an annual rate of 1.25%.
HSBC Global Asset Management (UK) Limited (“AMEU”) acts as sub-adviser to the Frontier Markets Fund. AMEU receives a fee, accrued daily and paid monthly, based on average daily net assets of the Frontier Markets Fund at an annual rate of 0.625% from the fees paid to the Investment Adviser.
During the year ended October 31, 2019, AMEU voluntarily made a payment of $23,046 to the Frontier Markets Fund relating to a trade operations event as reflected on the Statements of Changes in Net Assets as “Change in net assets resulting from payments from affiliate”.
HSBC also provides support services to the Frontier Markets Fund pursuant to a Support Services Agreement in connection with the operation of certain classes of shares of the Frontier Markets Fund. For its services in this capacity, HSBC is entitled to a fee, accrued daily and paid monthly, based on the average daily net assets of Class A Shares of the Frontier Markets Fund at an annual rate of 0.10%. HSBC is not entitled to a support services fee for Class I Shares.
Administration, Fund Accounting and Other Services:
HSBC also serves the Funds as Administrator. Under the terms of the Administration Services Agreement, HSBC receives from the Funds (as well as other funds in the Trust combined) a fee, accrued daily and paid monthly, at an annual rate of:
| Based on Average Daily Net Assets of | | Fee Rate (%) |
| Up to $10 billion | | 0.0400 |
| In excess of $10 billion but not exceeding $20 billion | | 0.0350 |
| In excess of $20 billion but not exceeding $50 billion | | 0.0265 |
| In excess of $50 billion | | 0.0245 |
The fee rates and breakpoints are determined on the basis of the aggregate average daily net assets of the Trust. For the year ended October 31, 2019, the effective annualized rate was 0.038%, prior to any fee waivers or expense reimbursements, based on the average daily net assets of the Trust. The total administration fee paid to HSBC is allocated to each series based upon its proportionate share of the aggregate net assets of the Trust subject to certain allocations in cases where one fund invests some or all of its assets in another fund. For assets invested in the Portfolio by the Feeder Funds, the Portfolio pays half of the administration fee and the Feeder Funds pay half, for a combination of the total fee rate set forth above.
Pursuant to a Sub-Administration Services Agreement with HSBC, Citi Fund Services Ohio, Inc. (“Citi”), a wholly-owned subsidiary of Citigroup, Inc., serves as the Trust’s Sub-Administrator. For these services, Citi is entitled to a fee, payable by HSBC, at an annual rate equivalent to the fee rates set forth below:
| Based on Average Daily Net Assets of | | Fee Rate (%) |
| Up to $10 billion | | 0.0200 |
| In excess of $10 billion but not exceeding $20 billion | | 0.0150 |
| In excess of $20 billion but not exceeding $50 billion | | 0.0065 |
| In excess of $50 billion | | 0.0045 |
| HSBC FAMILY OF FUNDS |
| Notes to Financial Statements—as of October 31, 2019 (continued) |
Under a Services Agreement between the Trust and Citi (the “Services Agreement”), Citi makes an individual available to serve as the Trust’s Chief Compliance Officer (the “CCO”). Citi also provides infrastructure and support in implementing the written policies and procedures comprising the Trust’s compliance program, including support services to the CCO. For the services provided under the Services Agreement, the Trust paid Citi $313,915 for the year ended October 31, 2019, plus reimbursement of certain out-of-pocket expenses. Expenses incurred by each Fund are reflected on the Statements of Operations as “Compliance Services.” Citi pays the salary and other compensation earned by individuals performing these services, as employees of Citi.
In addition, Citi provides fund accounting services for each Fund under the Services Agreement. As fund accountant, Citi receives an annual fee per Fund and share class, subject to certain minimums and reimbursements of certain expenses. Citi receives additional fees paid by the Trust for regulatory administration services.
Distribution Arrangements:
Foreside Distribution Services, L.P. (“Foreside”) serves the Trust as Distributor (the “Distributor”). The Trust, on behalf of the Feeder Funds and Frontier Markets Fund has adopted a non-compensatory Distribution Plan and Agreement (the “Distribution Plan”) pursuant to Rule 12b-1 of the Act. The Distribution Plan provides for reimbursement of expenses incurred by the Distributor related to distribution and marketing, at a rate not to exceed 0.25% and 1.00% of the average daily net assets of Class A Shares (currently not being charged) and Class C Shares (currently charging 0.75%) of the applicable funds, respectively. For the year ended October 31, 2019, Foreside, as Distributor, received $859 in commissions from sales of the Trust.
Shareholder Servicing:
The Trust has adopted a Shareholder Services Plan, which provides for payments to shareholder servicing agents for providing various shareholder services. For performing these services, the shareholder servicing agents receive a fee that is computed daily and paid monthly up to 0.25% of the average daily net assets of Class A Shares and Class C Shares of the applicable funds. The fees paid to the Distributor pursuant to the Distribution Plan and to shareholder servicing agents pursuant to the Shareholder Services Plan may not exceed in the aggregate 0.50% annually of the average daily net assets of Class A Shares, and 1.00% of the average daily net assets of Class C Shares.
The Trust has entered into shareholder services contracts with affiliated and unaffiliated financial intermediaries who provide shareholder services and other related services to their clients or customers who invest in the Funds under which the Funds will pay all or a portion of such fees earned to financial intermediaries for performing such services.
Transfer Agency:
DST Asset Manager Solutions, Inc. (“DST”) provides transfer agency services for each Fund. As transfer agent, DST receives a fee based on the number of funds and shareholder accounts, subject to certain minimums, and reimbursement of certain expenses.
Independent Trustees:
The Trust pays an annual retainer to each Independent Trustee, plus additional annual retainers to each Committee Chair and the Chairman of the Board. The Independent Trustees also receive a fee for each regular, special in-person, and telephonic meeting of the Board attended. The aggregate amount of the fees and expenses of the Independent Trustees are allocated amongst all the funds in the Trust and are presented in the Statements of Operations.
Other:
The Funds pay fees to certain intermediaries or financial institutions for record keeping, sub-accounting services, transfer agency and other administrative services as reflected on the Statements of Operations as “Administrative Services.”
The Funds may use related party broker-dealers. For the year ended October 31, 2019, there were no brokerage commissions paid to broker-dealers affiliated with the Adviser.
| HSBC FAMILY OF FUNDS |
| Notes to Financial Statements—as of October 31, 2019 (continued) |
The Adviser and its affiliates may have lending, banking, brokerage, underwriting, or other business relationships with the issuers of the securities in which the Funds invest.
Fee Reductions:
The Investment Adviser has agreed to contractually limit through March 1, 2020 the total annual expenses of the Funds, exclusive of interest, taxes, brokerage commissions, extraordinary expenses, and estimated indirect expenses attributable to the Funds’ investments in investment companies. Each Fund Class has its own expense limitations based on the average daily net assets for any full fiscal year as follows:
| | | | Contractual Expense |
| Fund | | Class | | Limitations (%) |
| Opportunity Fund | | A | | 1.65 |
| Opportunity Fund | | C | | 2.40 |
| Opportunity Fund (Class I) | | I | | 1.10 |
| Frontier Markets Fund | | A | | 1.85 |
| Frontier Markets Fund | | I | | 1.50 |
Any amounts contractually waived or reimbursed by the Investment Adviser will be subject to repayment by the respective Fund to the Investment Adviser within three years calculated monthly from when the waiver or reimbursement is recorded to the extent that the repayment will not cause the Fund’s operating expenses to exceed the contractual expense limit that was in effect at the time of such waiver or reimbursement. During the year ended October 31, 2019, the Investment Adviser did not recapture any of its prior contractual waivers or reimbursements.
As of October 31, 2019, the repayments that may potentially be made by the Funds are as follows:
| | Amount Eligible Through |
| Fund | | 2022 ($) | | 2021 ($) | | 2020 ($) | | Total ($) |
| Opportunity Fund | | 378,659 | | 390,697 | | 131,244 | | 900,600 |
| Opportunity Fund (Class I) | | 432,989 | | 414,357 | | 28,269 | | 875,615 |
| Frontier Markets Fund | | 621,906 | | 878,299 | | 449,360 | | 1,949,565 |
Citi may voluntarily waive/reimburse fees to help support the expense limits of the Funds. In addition, HSBC, in its role as Investment Adviser and Administrator, may waive/reimburse additional fees at its discretion. Any voluntary fee waivers/reimbursements are not subject to recoupment in subsequent fiscal periods. Voluntary waivers/reimbursements may be eliminated or changed at any time. Amounts waived/ reimbursed by the Investment Adviser, Administrator and Citi as Sub-Administrator are reported separately on the Statements of Operations, as applicable.
5. Investment Transactions:
Cost of purchases and proceeds from sales of securities (excluding securities maturing less than one year from acquisition) for the year ended October 31, 2019 were as follows:
| | Purchases ($) | | Sales ($) |
| Opportunity Fund | | — | | — |
| Opportunity Fund (Class I) | | — | | — |
| Frontier Markets Fund | | 5,428,204 | | 12,359,805 |
| HSBC FAMILY OF FUNDS |
| Notes to Financial Statements—as of October 31, 2019 (continued) |
6. Affiliated Investment Transactions:
A summary of each Fund’s investment in the affiliated funds for the year ended October 31, 2019 is as follows:
| | | | | | | | | Net | | Change in | | | | | |
| | | | | | | | | Realized | | Unrealized | | | | Net |
| | Value | | | | | | | Gains/ | | Appreciation/ | | Value | | Income/ |
| | 10/31/2018 | | Contributions | | Withdrawals | | (Losses) | | Depreciation | | 10/31/2019 | | (Loss) |
| | ($) | | ($) | | ($) | | ($) | | ($) | | ($) | | ($) |
| Opportunity Fund | | | | | | | | | | | | | | | | |
| Opportunity Portfolio | | 9,507,807 | | 759,529 | | (2,499,118 | ) | | 606,415 | | 221,317 | | 8,567,015 | | (28,935 | ) |
| Total | | 9,507,807 | | 759,529 | | (2,499,118 | ) | | 606,415 | | 221,317 | | 8,567,015 | | (28,935 | ) |
| |
| Opportunity Fund (Class I) | | | | | | | | | | | | | | | | |
| Opportunity Portfolio | | 136,677,586 | | 8,152,868 | | (39,957,323 | ) | | 7,603,036 | | 3,890,823 | | 115,965,555 | | (401,435 | ) |
| Total | | 136,677,586 | | 8,152,868 | | (39,957,323 | ) | | 7,603,036 | | 3,890,823 | | 115,965,555 | | (401,435 | ) |
7. Investment Risks:
Currency Risk: Fluctuations in exchange rates between the U.S. dollar and foreign currencies, or between various foreign currencies, may negatively affect a Fund’s performance. A Fund may seek to reduce currency risk by hedging part or all of its exposure to various foreign currencies; however, even if such hedging techniques are employed, there is no assurance that they will be successful.
Emerging Markets Risk: The prices of securities in emerging markets can fluctuate more significantly than the prices of companies in more developed countries. Securities of emerging market issuers generally have more risk than securities issued by issuers in more developed markets. The less developed the country, the greater effect the risks may have in an investment, and as a result, an investment may exhibit a higher degree of volatility than either the general domestic securities market or the securities markets of developed foreign countries.
Equity Securities Risk: The prices of equity securities fluctuate from time to time based on changes in a company’s financial condition or overall market and economic conditions. As a result, the value of equity securities may fluctuate drastically from day to day.
Foreign Securities Risk: Investments in foreign securities are generally considered riskier than investments in U.S. securities. Foreign securities, including those of emerging and frontier market issuers, are subject to additional risks, including international trade, political and regulatory risks.
Frontier Market Countries Risk: Frontier market countries generally have smaller economies and even less developed capital markets or legal and political systems than traditional emerging market countries. As a result, the risks of investing in emerging market countries are magnified in frontier market countries. The magnification of risks are the result of: the potential for extreme price volatility and illiquidity in frontier markets; government ownership or control of parts of private sector and of certain companies; trade barriers, exchange controls, managed adjustments in relative currency values and other protectionist measures imposed or negotiated by the countries with which frontier market countries trade and the relatively new and unsettled securities laws in many frontier market countries.
Market Risk: The value of a Fund’s investments may decline due to changing economic, political, social, regulatory or market conditions. Market risk may affect a single issuer, industry or sector of the economy or it may affect the economy as a whole. Moreover, the conditions in one country or geographic region could adversely affect the Fund’s investments in a different country or geographic region.
| HSBC FAMILY OF FUNDS |
| Notes to Financial Statements—as of October 31, 2019 (continued) |
8. Federal Income Tax Information:
At October 31, 2019, the cost basis of investments for federal income tax purposes, gross unrealized appreciation, gross unrealized depreciation and net unrealized appreciation/depreciation were as follows:
| | | | | | | | | Net Unrealized |
| | | | Tax Unrealized | | Tax Unrealized | | Appreciation |
| | Tax Cost ($) | | Appreciation ($) | | Depreciation ($) | | (Depreciation) ($)* |
| Opportunity Fund | | 7,788,949 | | 778,066 | | — | | | 778,066 | |
| Opportunity Fund (Class I) | | 104,362,148 | | 11,603,407 | | — | | | 11,603,407 | |
| Frontier Markets Fund | | 8,510,485 | | 559,116 | | (1,501,190 | ) | | (942,074 | ) |
____________________
| * | | The difference between book-basis and tax-basis unrealized appreciation (depreciation) is attributable primarily to tax deferral of losses on wash sales. |
The tax character of distributions paid by the Funds for the tax year ended October 31, 2019, was as follows:
| | Distributions paid from |
| | | | | | | | Total |
| | Ordinary | | Net Long-Term | | Total Taxable | | Distributions |
| | Income ($) | | Capital Gains ($) | | Distributions ($) | | Paid ($)(1) |
| Opportunity Fund | | 214,462 | | 1,365,487 | | 1,579,949 | | 1,579,949 |
| Opportunity Fund (Class I) | | 3,258,352 | | 17,935,578 | | 21,193,930 | | 21,193,930 |
| Frontier Markets Fund | | 216,529 | | — | | 216,529 | | 216,529 |
____________________
| (1) | | Total distributions paid may differ from the amount reported in the Statements of Changes in Net Assets because distributions are recognized when actually paid for tax purposes. |
The tax character of distributions paid by the Funds for the tax year ended October 31, 2018, was as follows:
| | Distributions paid from |
| | | | | | | | Total |
| | Ordinary | | Net Long Term | | Total Taxable | | Distributions |
| | Income ($) | | Capital Gains ($) | | Distributions ($) | | Paid ($)(1) |
| Opportunity Fund | | 468,858 | | 657,833 | | 1,126,691 | | 1,126,691 |
| Opportunity Fund (Class I) | | 8,359,597 | | 9,280,015 | | 17,639,612 | | 17,639,612 |
| Frontier Markets Fund | | 390,194 | | — | | 390,194 | | 390,194 |
____________________
| (1) | | Total distributions paid may differ from the amount reported in the Statements of Changes in Net Assets because distributions are recognized when actually paid for tax purposes. |
As of the tax year ended October 31, 2019, the components of accumulated earnings/(deficit) on a tax basis for the Funds were as follows:
| | | | Undistributed | | | | Accumulated | | Unrealized | | Total |
| | Undistributed | | Long-Term | | | | Capital | | Appreciation/ | | Accumulated |
| | Ordinary | | Capital | | Accumulated | | and Other | | (Depreciation) | | Earnings/ |
| | Income ($) | | Gains ($) | | Earnings ($) | | Losses ($) | | ($)(1) | | (Deficit) ($) |
| Opportunity Fund | | — | | 649,267 | | 649,267 | | (69,442 | ) | | 778,066 | | | 1,357,891 | |
| Opportunity Fund (Class I) | | — | | 8,206,437 | | 8,206,437 | | (440,146 | ) | | 11,603,407 | | | 19,369,698 | |
| Frontier Markets Fund | | 168,492 | | — | | 168,492 | | (26,387,222 | ) | | (942,271 | ) | | (27,161,001 | ) |
____________________
| (1) | | The differences between book-basis and tax-basis unrealized appreciation/depreciation are attributable primarily to: tax deferral of losses on wash sales and the return of capital adjustments from real estate investment trusts. |
| HSBC FAMILY OF FUNDS |
| Notes to Financial Statements—as of October 31, 2019 (continued) |
As of the tax year ended October 31, 2019, the Frontier Markets Fund has net capital loss carryforwards (CLCFs”) not subject to expiration as summarized in the table below. The Board does not intend to authorize a distribution of any realized gain for the Funds until any applicable CLCF has been offset or expires.
| | Short Term | | Long Term | | |
| | Amount ($) | | Amount ($) | | Total ($) |
| Frontier Markets Fund | | 8,391,064 | | 17,996,158 | | 26,387,222 |
Under current law, capital losses and specified ordinary losses realized after October 31 and non-specified ordinary losses incurred after December 31 (ordinary losses collectively known as “late year ordinary loss”) may be deferred and treated as occurring on the first business day of the following fiscal year. As of the tax year ended October 31, 2019, the Funds deferred losses as follows:
| | Late Year |
| | Ordinary |
| | Losses ($) |
| Opportunity Fund | | 69,442 |
| Opportunity Fund (Class I) | | 440,146 |
The amount and character of net investment income and net realized gains distributed are determined in accordance with federal income tax regulations, which may differ from GAAP. These “book/tax” differences are either considered temporary or permanent in nature. To the extent these differences are permanent in nature (e.g., certain gain/loss and certain distributions), such amounts are reclassified within the composition of net assets based on their federal tax-basis treatment; temporary differences (e.g., wash losses and the realization for tax purposes of unrealized gains/losses on investments in passive foreign investment companies) do not require reclassification. The Funds may utilize equalization accounting for tax purposes and designate earnings and profits, including net realized gains distributed to shareholders on redemption of shares, as part of the dividends paid deduction for income tax purposes. To the extent distributions to shareholders from net investment income and net realized gains exceed net investment income and net realized gains for tax purposes, they are reported as distributions of capital.
On the Statements of Assets and Liabilities, as a result of permanent book-to-tax differences, reclassification adjustments were made as follows:
| | Accumulated Net | | | | | | | | | | |
| | Investment Income/ | | | | | | | | | | |
| | (Distributions | | | | | | | | | | |
| | in Excess of Net | | Accumulated | | Paid-In |
| | Investment Income) | | Net Realized | | Capital |
| | ($)* | | Gains/(Losses) ($)* | | ($) |
| Opportunity Fund | | | 4,024 | | | | | — | | | | | (4,024 | ) | |
| Opportunity Fund (Class I) | | | — | | | | | (1 | ) | | | | 1 | | |
| Frontier Markets Fund | | | (16,101 | ) | | | | 16,100 | | | | | 1 | | |
____________________
| * | These components of capital are presented together as “Total distributable earnings/(loss)” on the Statements of Assets and Liabilities. |
The reclassifications for the Funds relate primarily to net operating losses and treatment of gains and losses relating to foreign currency transactions.
| HSBC FAMILY OF FUNDS |
| Notes to Financial Statements—as of October 31, 2019 (continued) |
9. Significant Shareholders:
Shareholders, including other funds, individuals, and accounts, as well as each Fund’s investment manager(s) and/or investment personnel, may from time to time own (beneficially or of record) a significant percentage of the Fund’s Shares and can be considered to “control” the Fund when that ownership exceeds 25% of the Fund’s assets (and which may differ from control as determined in accordance with GAAP).
The following list includes the Funds which had individual shareholder accounts with ownership of voting securities greater than 10% of the total outstanding voting securities but less than 25% and/or accounts with ownership of voting securities greater than 25% of the total outstanding voting securities. Significant transactions by these shareholder accounts may negatively impact the Funds’ performance.
| | Number of shareholders | | | | | | | | | | | | | | |
| | with ownership of | | | | | | | Number of shareholders | | | | | |
| | voting securities of the | | | | | | | with ownership of | | | | | |
| | Portfolio greater than | | | | | | | voting securities of the | | % owned in |
| | 10% and less than 25% | | % owned in | | Portfolio greater than 25% | | aggregate by |
| | of the total Portfolio’s | | aggregate | | of the total Portfolio’s | | greater than |
| | outstanding voting | | by 10% - 25% | | outstanding voting | | 25% |
| Fund | | securities | | shareholders | | securities | | shareholders |
| Opportunity Fund | | | — | | | | — | | | | | 1 | | | | 68 | % | |
| Opportunity Fund (Class I) | | | 4 | | | | 76 | % | | | | — | | | | — | | |
| Frontier Markets Fund | | | — | | | | — | | | | | 1 | | | | 70 | % | |
10. Subsequent Events:
Management has evaluated subsequent events through the date these financial statements were issued. Based on the evaluation, no adjustments or additional disclosures were required to the financial statements as of October 31, 2019.
Report of Independent Registered Public Accounting Firm
To the Board of Trustees of HSBC Funds and Shareholders of HSBC Frontier Markets Fund, HSBC Opportunity Fund and HSBC Opportunity Fund (Class I)
Opinions on the Financial Statements
We have audited the accompanying statements of assets and liabilities, including the schedules of portfolio investments, of HSBC Frontier Markets Fund, HSBC Opportunity Fund and HSBC Opportunity Fund (Class I) (three of the funds constituting HSBC Funds, hereafter collectively referred to as the “Funds”) as of October 31, 2019, the related statements of operations for the year ended October 31, 2019, the statements of changes in net assets for each of the two years in the period ended October 31, 2019, including the related notes, and the financial highlights for each of the five years in the period ended October 31, 2019 (collectively referred to as the “financial statements”). In our opinion, the financial statements present fairly, in all material respects, the financial position of each of the Funds as of October 31, 2019, the results of each of their operations for the year then ended, the changes in each of their net assets for each of the two years in the period ended October 31, 2019 and each of the financial highlights for each of the five years in the period ended October 31, 2019 in conformity with accounting principles generally accepted in the United States of America.
Basis for Opinions
These financial statements are the responsibility of the Funds’ management. Our responsibility is to express an opinion on the Funds’ financial statements based on our audits. We are a public accounting firm registered with the Public Company Accounting Oversight Board (United States) (“PCAOB”) and are required to be independent with respect to the Funds in accordance with the U.S. federal securities laws and the applicable rules and regulations of the Securities and Exchange Commission and the PCAOB.
We conducted our audits of these financial statements in accordance with the standards of the PCAOB. Those standards require that we plan and perform the audit to obtain reasonable assurance about whether the financial statements are free of material misstatement, whether due to error or fraud.
Report of Independent Registered Public Accounting Firm (continued)
Our audits included performing procedures to assess the risks of material misstatement of the financial statements, whether due to error or fraud, and performing procedures that respond to those risks. Such procedures included examining, on a test basis, evidence regarding the amounts and disclosures in the financial statements. Our audits also included evaluating the accounting principles used and significant estimates made by management, as well as evaluating the overall presentation of the financial statements. Our procedures included confirmation of securities owned as of October 31, 2019 by correspondence with the custodian and brokers; when replies were not received from brokers, we performed other auditing procedures. We believe that our audits provide a reasonable basis for our opinions.
/s/ PricewaterhouseCoopers LLP
New York, New York
December 20, 2019
We have served as the auditor of one or more investment companies in the HSBCFunds since 2015.
| HSBC FAMILY OF FUNDS |
| Other Federal Income Tax Information—as of October 31, 2019 (Unaudited) |
During the year ended October 31, 2019, the following Funds declared capital gain distributions:
| | Short Term | | Long Term |
| | Capital Gain | | Capital Gain |
| | Distributions ($) | | Distributions ($) |
| Opportunity Fund | | | 214,462 | | | | 1,365,487 | |
| Opportunity Fund (Class I) | | | 3,258,352 | | | | 17,935,578 | |
For the year ended October 31, 2019, the following percentages of the total ordinary income dividends paid by the Funds qualify for the corporate dividends received deduction available to corporate shareholders:
| | Dividends |
| | Received |
| | Deduction (%) |
| Opportunity Fund | | 26.77% |
| Opportunity Fund (Class I) | | 24.08% |
For the year ended October 31, 2019, dividends paid by the Funds may be subject to a maximum tax rate of 15%, as provided for by the Jobs and Growth Tax Relief Reconciliation Act of 2003. The Funds intend to designate the maximum amount allowable as taxed at a maximum rate of 15%. Complete information will be reported in conjunction with your 2019 Form 1099-DIV:
| | Qualified |
| | Dividend |
| | Income % |
| Opportunity Fund | | 30.19% |
| Opportunity Fund (Class I) | | 27.16% |
| Frontier Markets Fund | | 98.96% |
The following Fund intends to elect to pass through to shareholders the income tax credit for taxes paid to foreign countries. Foreign source income and foreign tax expense per outstanding share on October 31, 2019 are as follows:
| | Foreign | | Foreign Tax |
| | Source Income | | Expense Per |
| | Per Share ($) | | Share ($) |
| Frontier Markets Fund | | 0.63 | | 0.03 |
The pass-through of this foreign tax credit will only affect those persons who are shareholders on the dividend record date in December 2019. These shareholders will receive more detailed information along with their 2019 Form 1099-DIV.
| HSBC FAMILY OF FUNDS |
| Table of Shareholder Expenses—as of October 31, 2019 (Unaudited) |
As a shareholder of the Funds, you incur two types of costs: (1) transaction costs, including sales charges (loads) on purchases, redemption fees and exchange fees; and (2) ongoing costs, including management fees, distribution fees and other Fund expenses. These examples are intended to help you understand your ongoing costs (in dollars) of investing in the Funds and to compare the cost with the ongoing costs of investing in other mutual funds.
Actual Expenses
The actual examples are based on an investment of $1,000 invested at the beginning of a six-month period beginning May 1, 2019 and held through the period ended October 31, 2019.
The columns below under the heading entitled “Actual” provide information about actual account values and actual expenses. You may use this information, together with the amount you invested, to estimate the expenses that you paid over the period. Simply divide your account value by $1,000 (for example, an $8,600 account value divided by $1,000 = 8.6), then multiply the result by the number in the table under the heading entitled “Actual Expenses Paid During the Period” to estimate the expenses you paid on your account during this period.
Hypothetical Expenses for Comparison Purposes
The hypothetical expense examples are based on an investment of $1,000 invested at the beginning of a six-month period and held throughout the period ended October 31, 2019.
The columns below under the heading entitled “Hypothetical” provide information about hypothetical account values and hypothetical expenses based on each Fund’s actual expense ratio and an assumed rate of return of 5% per year before expenses, which is not each Fund’s actual return. The hypothetical account values and expenses may not be used to estimate the actual ending account balance or expenses you paid for the period. You may use this information to compare this 5% hypothetical example with the 5% hypothetical examples that appear in the shareholder reports of other funds.
Please note that the expenses shown in the table are meant to highlight your ongoing costs only and do not reflect any transactional costs, such as sales charges (loads), redemption fees, or exchange fees. Therefore, the columns under the heading entitled “Hypothetical” are useful in comparing ongoing costs only, and will not help you determine the relative total costs of owning different funds. In addition, if these transactional costs were included, your costs would have been higher.
| | | | | | | | | | | | | | | | | | | | | | Hypothetical |
| | | | | | | | | | | | Actual | | (5% return before expenses) |
| | Annualized | | Beginning | | Ending | | Expenses | | Ending | | Expenses |
| | Expense Ratio | | Account Value | | Account Value | | Paid During | | Account Value | | Paid During |
| | During Period | | 5/1/19 | | 10/31/19 | | Period* | | 10/31/19 | | Period* |
| Opportunity Fund - Class A | | | 1.55 | % | | | | $ | 1,000.00 | | | | $ | 985.40 | | | | $ | 7.76 | | | | $ | 1,017.39 | | | | $ | 7.88 | |
| Opportunity Fund - Class C | | | 2.30 | % | | | | | 1,000.00 | | | | | 981.80 | | | | | 11.49 | | | | | 1,013.61 | | | | | 11.67 | |
| Opportunity Fund - Class I | | | 1.10 | % | | | | | 1,000.00 | | | | | 987.60 | | | | | 5.51 | | | | | 1,019.66 | | | | | 5.60 | |
| Frontier Markets | | | | | | | | | | | | | | | | | | | | | | | | | | | | | | |
| Fund - Class A | | | 1.85 | % | | | | | 1,000.00 | | | | | 970.10 | | | | | 9.19 | | | | | 1,015.88 | | | | | 9.40 | |
| Frontier Markets | | | | | | | | | | | | | | | | | | | | | | | | | | | | | | |
| Fund - Class I | | | 1.50 | % | | | | | 1,000.00 | | | | | 972.50 | | | | | 7.46 | | | | | 1,017.64 | | | | | 7.63 | |
____________________
| * | Expenses are equal to the average account value over the period multiplied by the Fund’s annualized expense ratio, multiplied by 184/365 (the number of days in the most recent fiscal half-year divided by the number of days in the fiscal year. |
| Portfolio Reviews |
| Portfolio Composition* |
| October 31, 2019 (Unaudited) |
| HSBC Opportunity Portfolio |
| | Percentage of |
| Investment Allocation | | Investments at Value (%) |
| Software | | | 13.9 | |
| Biotechnology | | | 7.1 | |
| Machinery | | | 6.0 | |
| Equity Real Estate Investment Trusts | | | 5.7 | |
| IT Services | | | 5.1 | |
| Life Sciences Tools & Services | | | 5.0 | |
| Health Care Equipment & Supplies | | | 4.8 | |
| Chemicals | | | 3.9 | |
| Pharmaceuticals | | | 3.8 | |
| Oil, Gas & Consumable Fuels | | | 3.6 | |
| Insurance | | | 3.3 | |
| Semiconductors & Semiconductor Equipment | | | 3.0 | |
| Specialty Retail | | | 3.0 | |
| Road & Rail | | | 3.0 | |
| Household Durables | | | 2.9 | |
| Hotels, Restaurants & Leisure | | | 2.8 | |
| Aerospace & Defense | | | 2.6 | |
| Professional Services | | | 2.6 | |
| Capital Markets | | | 2.6 | |
| Building Products | | | 2.0 | |
| Entertainment | | | 2.0 | |
| Health Care Providers & Services | | | 1.9 | |
| Thrifts & Mortgage Finance | | | 1.8 | |
| Food & Staples Retailing | | | 1.3 | |
| Technology Hardware, Storage & Peripherals | | | 1.3 | |
| Communications Equipment | | | 1.2 | |
| Investment Companies | | | 1.1 | |
| Construction Materials | | | 1.1 | |
| Banks | | | 1.0 | |
| Diversified Consumer Services | | | 0.6 | |
| Total | | | 100.0 | |
____________________
| * | Portfolio composition is subject to change. |
| HSBC OPPORTUNITY PORTFOLIO |
| Schedule of Portfolio Investments—as of October 31, 2019 |
| Common Stocks — 98.9% |
| | | | | |
| | Shares | | Value ($) |
| Aerospace & Defense — 2.6% | | | | |
| Teledyne Technologies, Inc.(a) | | 9,790 | | 3,226,784 |
| Banks — 1.0% | | | | |
| KeyCorp | | 68,220 | | 1,225,913 |
| Biotechnology — 7.1% | | | | |
| Acceleron Pharma, Inc.(a) | | 39,890 | | 1,789,864 |
| Alnylam Pharmaceuticals, Inc.(a) | | 20,590 | | 1,785,977 |
| Blueprint Medicines Corp.(a) | | 26,563 | | 1,828,597 |
| Rocket Pharmaceuticals, Inc.(a) | | 51,560 | | 749,682 |
| Sage Therapeutics, Inc.(a) | | 8,770 | | 1,189,651 |
| Sarepta Therapeutics, Inc.(a) | | 18,870 | | 1,567,342 |
| | | | 8,911,113 |
| Building Products — 2.0% | | | | |
| Trex Co., Inc.(a) | | 28,410 | | 2,496,955 |
| Capital Markets — 2.6% | | | | |
| Apollo Global Management, Inc. | | 30,970 | | 1,274,725 |
| LPL Financial Holdings, Inc. | | 23,640 | | 1,911,058 |
| | | | 3,185,783 |
| Chemicals — 4.0% | | | | |
| FMC Corp. | | 21,090 | | 1,929,735 |
| Orion Engineered Carbons SA | | 74,370 | | 1,231,567 |
| W.R. Grace & Co. | | 26,515 | | 1,761,922 |
| | | | 4,923,224 |
| Communications Equipment — 1.2% | | | | |
| Lumentum Holdings, Inc.(a) | | 23,240 | | 1,456,218 |
| Construction Materials — 1.1% | | | | |
| Summit Materials, Inc., Class A(a) | | 58,851 | | 1,349,453 |
| Diversified Consumer Services — 0.6% | | | | |
| Grand Canyon Education, Inc.(a) | | 8,590 | | 789,936 |
| Entertainment — 2.0% | | | | |
Madison Square Garden Co.,
Class A(a) | | 6,483 | | 1,730,442 |
World Wrestling
Entertainment, Inc. | | 13,340 | | 747,574 |
| | | | 2,478,016 |
| Equity Real Estate Investment Trusts — 5.7% | | | | |
| Brixmor Property Group, Inc. | | 88,690 | | 1,952,954 |
| QTS Realty Trust, Inc. | | 50,210 | | 2,690,753 |
| Sun Communities, Inc. | | 14,810 | | 2,408,847 |
| | | | 7,052,554 |
| Food & Staples Retailing — 1.4% | | | | |
| Performance Food Group Co.(a) | | 39,460 | | 1,681,391 |
| Health Care Equipment & Supplies — 4.7% | | | | |
| DexCom, Inc.(a) | | 14,840 | | 2,288,922 |
| Haemonetics Corp.(a) | | 16,470 | | 1,988,423 |
| STERIS plc | | 12,005 | | 1,699,548 |
| | | | 5,976,893 |
| Health Care Providers & Services — 1.9% | | | | |
| Quest Diagnostics, Inc. | | 23,270 | | 2,356,088 |
| Hotels, Restaurants & Leisure — 2.8% | | | | |
| Eldorado Resorts, Inc.(a) | | 41,000 | | 1,835,570 |
| Papa John's International Inc. | | 27,700 | | 1,621,835 |
| | | | 3,457,405 |
| Household Durables — 2.9% | | | | |
| KB Home | | 33,950 | | 1,211,676 |
| TopBuild Corp.(a) | | 22,660 | | 2,355,053 |
| | | | 3,566,729 |
| Insurance — 3.3% | | | | |
| Arthur J. Gallagher & Co. | | 30,740 | | 2,804,103 |
| Fidelity National Financial, Inc. | | 27,850 | | 1,276,644 |
| | | | 4,080,747 |
| IT Services — 5.1% | | | | |
| Black Knight, Inc.(a) | | 45,250 | | 2,905,051 |
| Twilio, Inc.(a) | | 11,940 | | 1,152,926 |
| WEX, Inc.(a) | | 8,895 | | 1,682,756 |
| WNS Holdings, Ltd., ADR(a) | | 9,130 | | 564,599 |
| | | | 6,305,332 |
| Life Sciences Tools & Services — 5.0% | | | | |
BIO-RAD Laboratories, Inc.,
Class A(a) | | 8,960 | | 2,971,315 |
Charles River Laboratories
International, Inc.(a) | | 13,110 | | 1,704,038 |
| Mettler-Toledo International, Inc.(a) | | 2,213 | | 1,560,032 |
| | | | 6,235,385 |
| Machinery — 5.9% | | | | |
| Flowserve Corp. | | 33,380 | | 1,630,279 |
| Lincoln Electric Holdings, Inc. | | 21,580 | | 1,932,921 |
| Meritor, Inc.(a) | | 72,120 | | 1,588,804 |
| Woodward, Inc. | | 21,580 | | 2,301,722 |
| | | | 7,453,726 |
| Oil, Gas & Consumable Fuels — 3.6% | | | | |
| Diamondback Energy, Inc. | | 21,360 | | 1,831,834 |
| PBF Energy, Inc. | | 56,890 | | 1,836,409 |
| WPX Energy, Inc.(a) | | 84,250 | | 840,815 |
| | | | 4,509,058 |
| Pharmaceuticals — 3.8% | | | | |
| The Medicines Co.(a) | | 89,460 | | 4,695,755 |
| Professional Services — 2.6% | | | | |
| CoStar Group, Inc.(a) | | 2,468 | | 1,356,215 |
| Transunion | | 22,560 | | 1,863,908 |
| | | | 3,220,123 |
| Road & Rail — 3.0% | | | | |
J. B. Hunt Transportation
Services, Inc. | | 21,535 | | 2,531,654 |
| Old Dominion Freight Line, Inc. | | 6,660 | | 1,212,653 |
| | | | 3,744,307 |
| Semiconductors & Semiconductor Equipment — 3.0% | | | | |
| Entegris, Inc. | | 34,320 | | 1,647,360 |
| On Semiconductor Corp.(a) | | 103,950 | | 2,120,580 |
| | | | 3,767,940 |
| Software — 13.9% | | | | |
| 8x8, Inc.(a) | | 86,350 | | 1,668,282 |
| Ceridian HCM Holding, Inc.(a) | | 31,640 | | 1,526,630 |
| Envestnet, Inc.(a) | | 13,940 | | 871,111 |
| See notes to financial statements. | HSBC FAMILY OF FUNDS 37 |
| HSBC OPPORTUNITY PORTFOLIO |
| Schedule of Portfolio Investments—as of October 31, 2019 (continued) |
| Common Stocks, continued |
| | | | | |
| | Shares | | Value ($) |
| Software, continued | | | | | |
| Fair Isaac Corp.(a) | | 6,185 | | | 1,880,487 |
| Fortinet, Inc.(a) | | 25,670 | | | 2,093,645 |
| Guidewire Software, Inc.(a) | | 24,290 | | | 2,738,455 |
| HubSpot, Inc.(a) | | 13,818 | | | 2,143,172 |
| RealPage, Inc.(a) | | 42,200 | | | 2,555,210 |
| Splunk, Inc.(a) | | 16,715 | | | 2,005,131 |
| | | | | 17,482,123 |
| Specialty Retail — 3.0% | | | | | |
| Burlington Stores, Inc.(a) | | 9,230 | | | 1,773,729 |
| Five Below, Inc.(a) | | 15,760 | | | 1,971,734 |
| | | | | 3,745,463 |
| Technology Hardware, Storage & Peripherals — 1.3% |
| Pure Storage, Inc., Class A(a) | | 84,070 | | | 1,636,002 |
| Thrifts & Mortgage Finance — 1.8% | | | | | |
| Essent Group, Ltd. | | 43,040 | | | 2,241,954 |
| TOTAL COMMON STOCKS | | | | | |
| (COST $110,099,123) | | | | | 123,252,370 |
| |
| Investment Company — 1.2% |
| | | | | | |
| Northern Institutional Government | | | | | |
| Select Portfolio, Institutional Shares, | | | | | |
| 2.28%(b) | | 1,433,546 | | | 1,433,546 |
| TOTAL INVESTMENT COMPANY | | | | | |
| (Cost $1,433,546) | | | | | 1,433,546 |
| TOTAL INVESTMENTS | | | | | |
| IN SECURITIES | | | | | |
| (Cost $111,532,669) — 100.1% | | | | | 124,685,916 |
| Other Assets (Liabilities) - (0.1)% | | | | | (153,346) |
| NET ASSETS — 100% | | | | $ | 124,532,570 |
____________________
| (a) | Represents non-income producing security. |
| (b) | The rate represents the annualized one day yield that was in effect on October 31, 2019. |
ADR - American Depositary Receipt |
| 38 HSBC FAMILY OF FUNDS | See notes to financial statements. |
HSBC FAMILY OF FUNDS
Statement of Assets and Liabilities—as of October 31, 2019
| | HSBC |
| | Opportunity |
| | Portfolio |
| Assets: | | | | | |
| Investment in securities, at value | | | $ | 124,685,916 | |
| Dividends receivable | | | | 6,057 | |
| Receivable for investments sold | | | | 622,349 | |
| Prepaid expenses | | | | 771 | |
| Total Assets | | | | 125,315,093 | |
| | | | | | |
| Liabilities: | | | | | |
| Payable for investments purchased | | | | 634,960 | |
| Accrued expenses and other liabilities: | | | | | |
| Investment Management | | | | 26,175 | |
| Sub-Advisory | | | | 57,582 | |
| Administration | | | | 2,029 | |
| Accounting | | | | 5,799 | |
| Custodian | | | | 5,244 | |
| Printing | | | | 2,264 | |
| Professional | | | | 39,742 | |
| Trustee | | | | 1,502 | |
| Other | | | | 7,226 | |
| Total Liabilities | | | | 782,523 | |
| | | | | | |
| Net Assets Applicable to investors’ beneficial interest | | | $ | 124,532,570 | |
| Investments in securities, at cost | | | $ | 111,532,669 | |
| See notes to financial statements. | HSBC FAMILY OF FUNDS 39 |
HSBC FAMILY OF FUNDS
Statement of Operations—For the year ended October 31, 2019
| | HSBC |
| | Opportunity |
| | Portfolio |
| Investment Income: | | | | | | |
| Dividends | | | $ | 1,050,847 | | |
| Foreign tax withholding | | | | (7,952 | ) | |
| Total Investment Income | | | | 1,042,895 | | |
| | | | | | | |
| Expenses: | | | | | | |
| Investment Management Fees | | | | 344,638 | | |
| Sub-Advisory Fees | | | | 758,205 | | |
| Administration | | | | 26,423 | | |
| Accounting | | | | 55,350 | | |
| Compliance Services | | | | 31,392 | | |
| Custodian | | | | 32,094 | | |
| Printing | | | | 1,322 | | |
| Professional | | | | 116,930 | | |
| Trustee | | | | 81,002 | | |
| Other | | | | 25,909 | | |
| Total Expenses | | | | 1,473,265 | | |
| | | | | | | |
| Net Investment Income/(Loss) | | | $ | (430,370 | ) | |
| | | | | | | |
| Net Realized/Unrealized Gains/(Losses) from Investments: | | | | | | |
| Net realized gains/(losses) from investment securities | | | | 8,207,363 | | |
| Change in unrealized appreciation/depreciation on investment securities | | | | 4,114,230 | | |
| | | | | | | |
| Net realized/unrealized gains/(losses) on investments | | | | 12,321,593 | | |
| Change in Net Assets Resulting from Operations | | | $ | 11,891,223 | | |
| 40 HSBC FAMILY OF FUNDS | See notes to financial statements. |
HSBC FAMILY OF FUNDS
Statements of Changes in Net Assets
| | HSBC Opportunity Portfolio |
| | For the | For the |
| | year ended | year ended |
| | October 31, 2019 | October 31, 2018 |
| Investment Activities: | | | | | | | | | | | |
| Operations: | | | | | | | | | | | |
| Net investment income/(loss) | | | $ | (430,370 | ) | | | $ | (527,575 | ) | |
| Net realized gains/(losses) from investments | | | | 8,207,363 | | | | | 24,051,438 | | |
| Change in unrealized appreciation/depreciation on investments | | | | 4,114,230 | | | | | (13,845,082 | ) | |
| Change in net assets resulting from operations | | | | 11,891,223 | | | | | 9,678,781 | | |
| Proceeds from contributions | | | | 8,912,396 | | | | | 19,843,046 | | |
| Value of withdrawals | | | | (42,456,442 | ) | | | | (21,193,603 | ) | |
| Change in net assets resulting from transactions in investors’ beneficial interest | | | | (33,544,046 | ) | | | | (1,350,557 | ) | |
| Change in net assets | | | | (21,652,823 | ) | | | | 8,328,224 | | |
| | | | | | | | | | | | |
| Net Assets: | | | | | | | | | | | |
| Beginning of period | | | | 146,185,393 | | | | | 137,857,169 | | |
| End of period | | | $ | 124,532,570 | | | | $ | 146,185,393 | | |
| See notes to financial statements. | HSBC FAMILY OF FUNDS | 41 |
| HSBC OPPORTUNITY PORTFOLIO |
| Financial Highlights |
| | | | | | | Ratios/Supplementary Data |
| | | | | | | | | | | | | | Ratio of Net | | |
| | | | | | | | | | | | | | Investment | | |
| | | | | | | | | | | | Ratio of Net | | Income/ | | |
| | | | | | | Net Assets at | | Expenses to | | (Loss) to | | |
| | Total | | End of Period | | Average Net | | Average Net | | Portfolio |
| | Return | | (000’s) | | Assets | | Assets | | Turnover |
| HSBC OPPORTUNITY PORTFOLIO | | | | | | | | | | | | | | | | |
| Year Ended October 31, 2019 | | | 9.31 | % | | | | $ | 124,533 | | | 1.07% | | (0.31)% | | 81% |
| Year Ended October 31, 2018 | | | 6.99 | % | | | | | 146,185 | | | 1.04% | | (0.34)% | | 77% |
| Year Ended October 31, 2017 | | | 29.79 | % | | | | | 137,857 | | | 0.91% | | (0.15)% | | 80% |
| Year Ended October 31, 2016 | | | (3.14 | )% | | | | | 151,228 | | | 0.89% | | (0.01)% | | 96% |
| Year Ended October 31, 2015 | | | (1.57 | )% | | | | | 237,595 | | | 0.88% | | (0.19)% | | 63% |
| 42 HSBC FAMILY OF FUNDS | See notes to financial statements. |
| HSBC FAMILY OF FUNDS |
| Notes to Financial Statements—as of October 31, 2019 |
1. Organization:
The HSBC Funds (the “Trust”), a Delaware statutory trust organized on March 2, 2016, is registered under the Investment Company Act of 1940, as amended (the “Act”), as an open-end management investment company. As of October 31, 2019, the Trust is composed of 8 separate operational funds, each a series of the HSBC Family of Funds. The accompanying financial statements are presented for the HSBC Opportunity Portfolio (the “Portfolio”):
The Portfolio operates as a master fund in a master-feeder arrangement, in which the two feeder funds invest all or part of their investable assets in the Portfolio. The Agreement and Declaration of Trust permits the Board of Trustees (the “Board”) to issue an unlimited number of beneficial interests in the Portfolio.
The Portfolio is a diversified series of the Trust. Financial statements for all other funds of the Trust are published separately.
The following represents each feeder fund’s proportionate ownership interest in the Portfolio:
| | Proportionate |
| | Ownership |
| | Interest on |
| Feeder Fund | | October 31, 2019 (%) |
| Opportunity Fund | | | 6.9 | |
| Opportunity Fund (Class I) | | | 93.1 | |
Under the Trust’s organizational documents, the Trust’s officers and Trustees are indemnified against certain liabilities arising out of the performance of their duties to the Portfolio. In addition, in the normal course of business, the Trust may enter into contracts with its service providers, which also provide for indemnifications by the Portfolio. The Portfolio’s maximum exposure under these arrangements is unknown as this would involve future claims that may be made against the Portfolio. However, based on experience, the Trust believes the risk of loss to be remote.
The Portfolio is an investment company and follows accounting and reporting guidance under Financial Accounting Standards Board Accounting Standards Codification Topic 946, “Financial Services-Investment Companies.”
2. Significant Accounting Policies:
The following is a summary of the significant accounting policies followed by the Portfolio in the preparation of its financial statements. The policies are in conformity with generally accepted accounting principles in the United States of America. The preparation of financial statements requires management to make certain estimates and assumptions that affect the reported amounts of assets and liabilities and disclosure of contingent assets and liabilities at the date of the financial statements and the reported amounts of increases and decreases in net assets from operations during the reporting period. Actual results could differ from those estimates.
Securities Valuation:
The Portfolio records its investments at fair value. Fair value is defined as the price that would be received to sell an asset or paid to transfer a liability in an orderly transaction between market participants at the measurement date. The valuation techniques used to determine fair value are further described in Note 3 below.
Investment Transactions and Related Income:
Investment transactions are accounted for no later than one business day after trade date. However, for financial reporting purposes, investment transactions are accounted for on trade date. Investment gains and losses are calculated on the identified cost basis. Interest income is determined on the basis of coupon interest accrued using the effective interest method which adjusts for amortization of premiums and accretion of discounts. Dividend income is recorded on the ex-dividend date. Pay-in-kind interest income and non-cash dividend income received in the form of securities in-lieu of cash, if any, are recorded at the fair value of the securities received.
| HSBC FAMILY OF FUNDS |
| Notes to Financial Statements—as of October 31, 2019 (continued) |
The Portfolio makes an allocation of its investment income, expenses and realized gains and losses from securities transactions to its investors in proportion to their investment in the Portfolio on the date of such accrual or gain/loss.
Restricted Securities and Illiquid Investments:
The Portfolio may invest in restricted securities. A restricted security is a security which has been purchased through a private offering and cannot be resold to the general public without prior registration under the Securities Act of 1933 (the “1933 Act”) or pursuant to the resale limitations provided by Rule 144 under the 1933 Act, or another exemption from the registration requirements of the 1933 Act. Certain restricted securities may be resold in transactions exempt from registration, normally to qualified institutional buyers, and may be classified as liquid by the Investment Adviser (as defined in Note 4) under the Portfolio’s liquidity risk management program, as approved by the Board. Therefore, not all restricted securities are considered illiquid. To the extent that the Portfolio purchases securities that are restricted as to resale or for which current market quotations are not available, such securities will be valued based upon all relevant factors as outlined in SEC Financial Reporting Release No. 1. Disposal of restricted securities may involve time consuming negotiations and expense. Prompt sale at the current valuation may be difficult and could adversely affect the net assets of the Portfolio. As of October 31, 2019, there were no restricted securities held by the Portfolio.
Allocations:
Expenses directly attributable to the Portfolio are charged to the Portfolio. Expenses not directly attributable to the Portfolio are allocated among the applicable series within the Trust equally to each fund, in relation to its net assets, or another appropriate basis.
Federal Income Taxes:
The Portfolio is treated as a partnership for U.S. federal income tax purposes. Accordingly, the Portfolio passes through all of its net investment income and gains and losses to its feeder funds, and is therefore not subject to U.S. federal income tax. As such, feeder funds are allocated for tax purposes their respective share of the Portfolio’s ordinary income and realized gains or losses. It is intended that the Portfolio will continue to be managed in such a way that its feeder funds will be able to satisfy the requirements of the Internal Revenue Code, as amended, applicable to regulated investment companies.
Management of the Portfolio has reviewed tax positions taken in tax years that remain subject to examination by all major tax jurisdictions, including federal (i.e., the last four tax year ends and the interim tax period since then, as applicable). Management believes that there is no tax liability resulting from unrecognized tax benefits related to uncertain tax positions taken. Management’s conclusions may be subject to future review based on changes in, or interpretation of, accounting standards or tax laws and regulations.
3. Investment Valuation Summary
The valuation techniques employed by the Portfolio, as described below, maximize the use of observable inputs and minimize the use of unobservable inputs in determining fair value. The Portfolio’s investments are classified within the fair value hierarchy based on the lowest level of input that is significant to the fair value measurement. The inputs used for valuing the Portfolio’s investments are summarized in the three broad levels listed below:
| ● | Level 1—quoted prices in active markets for identical assets |
| | |
| ● | Level 2—other significant observable inputs (including quoted prices for similar securities, interest rates, prepayments speeds, credit risk, etc.) |
| | |
| ● | Level 3—significant unobservable inputs (including the Fund’s own assumptions in determining the fair value of investments) |
Changes in valuation techniques may result in transfers in or out of an assigned level within the fair value hierarchy. The inputs or methodology used for valuing investments are not necessarily an indication of the risk associated with investing in those investments.
| HSBC FAMILY OF FUNDS |
| Notes to Financial Statements—as of October 31, 2019 (continued) |
Exchange traded domestic equity securities are valued at the last sale price on a national securities exchange (except the NASDAQ Stock Market), or in the absence of recorded sales, at the readily available closing bid price on such exchanges. Securities traded on the NASDAQ Stock Market are valued at the NASDAQ Official Closing Price on the date of valuation. Domestic equity securities that are not traded on an exchange are valued at the quoted bid price in the over-the-counter market. These securities are typically categorized as Level 1 in the fair value hierarchy.
Shares of exchange traded and closed-end registered investment companies are valued in the same manner as other equity securities and are typically categorized as Level 1 in the fair value hierarchy. Investments in other mutual funds are valued at their net asset values (“NAVs”), as reported by such mutual funds and are typically categorized as Level 1 in the fair value hierarchy.
Securities or other assets for which market quotations or an independent pricing service evaluation are not readily available, or are deemed unreliable due to a significant event or otherwise, are valued pursuant to procedures adopted by the Board (“Procedures”). Depending on the source and relative significance of valuation inputs, these instruments may be classified as Level 2 or Level 3 in the fair value hierarchy. Examples of potentially significant events that could affect the value of an individual security and thus require pricing under the Procedures include corporate actions by the issuer, announcements by the issuer relating to its earnings or products, regulatory news, natural disasters, and litigation. Examples of potentially significant events that could affect multiple securities held by the Portfolio include governmental actions, natural disasters, and armed conflicts. Fair value pricing may require subjective determinations about the value of a security. While the Trust’s policy is intended to result in a calculation of the Portfolio’s NAV that fairly reflects security values as of the time of pricing, the Trust cannot ensure that fair values determined would accurately reflect the price that the Portfolio could obtain for a security if it were to dispose of that security as of the time of pricing. The prices used by the Portfolio may differ from the value that would be realized if the securities were sold and the differences could be material to the financial statements.
As of October 31, 2019, all investments were categorized as Level 1 in the fair value hierarchy. The breakdown of investment categorization is disclosed in the Schedule of Portfolio Investments.
4. Related Party Transactions and Other Agreements and Plans:
Investment Management:
HSBC Global Asset Management (USA) Inc. (“HSBC” or the “Investment Adviser”), a wholly owned subsidiary of HSBC Bank USA, N.A., a national bank organized under the laws of the United States, acts as Investment Adviser to the Portfolio. As Investment Adviser, HSBC manages the investments of the Portfolio and continuously reviews, supervises, and administers the Portfolio’s investments pursuant to an Investment Advisory Contract. Westfield Capital Management Company, L.P. (“Westfield”) serves as subadviser for the Portfolio and is paid for its services directly by the Portfolio.
For their services, the Investment Adviser and Westfield receive in aggregate, a fee, accrued daily and paid monthly, at an annual rate of 0.80% of the Portfolio’s average daily net assets. Currently, the Investment Adviser’s contractual fee is 0.25% and Westfield’s contractual fee is 0.55%.
Administration, Fund Accounting and Other Services:
HSBC also serves the Portfolio as Administrator. Under the terms of the Administration Services Agreement, HSBC receives from the Portfolio (as well as other funds in the Trust combined) a fee, accrued daily and paid monthly, at an annual rate of:
| Based on Average Daily Net Assets of | | | Fee Rate (%) |
| Up to $10 billion | | | 0.0400 | |
| In excess of $10 billion but not exceeding $20 billion | | | 0.0350 | |
| In excess of $20 billion but not exceeding $50 billion | | | 0.0265 | |
| In excess of $50 billion | | | 0.0245 | |
| HSBC FAMILY OF FUNDS |
| Notes to Financial Statements—as of October 31, 2019 (continued) |
The fee rates and breakpoints are determined on the basis of the aggregate average daily net assets of the Trust, however, the assets of the funds of the HSBC Funds that invest in the Portfolio are not double-counted. For the year ended October 31, 2019, the effective annualized rate was 0.038%, prior to any fee waivers or expense reimbursements, based on the average daily net assets of the Trust. The total administration fee paid to HSBC is allocated to each series based upon its proportionate share of the aggregate net assets of the Trust. For assets invested in the Portfolio by the HSBC Funds, the Portfolio pays half of the administration fee and the feeder funds pay half of the administration fee, for a combination of the total fee rate set forth above.
Pursuant to a Sub-Administration Services Agreement with HSBC, Citi Fund Services Ohio, Inc. (“Citi”), a wholly-owned subsidiary of Citigroup, Inc., serves as the Trust’s Sub-Administrator. For these services, Citi is entitled to a fee, payable by HSBC, at an annual rate equivalent to the fee rates set forth below:
| Based on Average Daily Net Assets of | | | Fee Rate (%) |
| Up to $10 billion | | | 0.0200 | |
| In excess of $10 billion but not exceeding $20 billion | | | 0.0150 | |
| In excess of $20 billion but not exceeding $50 billion | | | 0.0065 | |
| In excess of $50 billion | | | 0.0045 | |
Under a Services Agreement between the Trust and Citi (the “Services Agreement”), Citi makes an individual available to serve as the Trust’s Chief Compliance Officer (the “CCO”). Citi also provides infrastructure and support in implementing the written policies and procedures comprising the Trust’s compliance program, including support services to the CCO. For the services provided under the Services Agreement, the Trust paid Citi $313,915 for the year ended October 31, 2019, plus reimbursement of certain out-of-pocket expenses. Expenses incurred by the Portfolio are reflected on the Statement of Operations as “Compliance Services.” Citi pays the salary and other compensation earned by individuals performing these services, as employees of Citi.
In addition, Citi provides fund accounting services for the Portfolio under the Services Agreement. For its services to the Portfolio, Citi receives an annual fee per portfolio, subject to certain minimums and reimbursement of certain expenses. Citi receives additional fees paid by the Trust for regulatory administration services.
Independent Trustees:
The Trust pays an annual retainer to each Independent Trustee, plus additional annual retainers to each Committee Chair and the Chairman of the Board. The Independent Trustees also receive a fee for each regular, special in-person, and telephonic meeting of the Board attended. The aggregate amount of the fees and expenses of the Independent Trustees are allocated amongst all the funds in the Trust and are presented in the Statement of Operations.
Other:
The Portfolio may purchase securities from an underwriting syndicate in which the principal underwriter or members of the syndicate are affiliated with the Adviser. For the year ended October 31, 2019, the Portfolio did not purchase any such securities.
The Adviser and its affiliates may have lending, banking, brokerage, underwriting, or other business relationships with the issuers of the securities in which the Portfolio invest.
5. Investment Transactions:
Cost of purchases and proceeds from sales of securities (excluding securities maturing less than one year from acquisition) for the year ended October 31, 2019 were as follows:
| | Purchases ($) | | Sales ($) |
| Opportunity Portfolio | | 109,887,876 | | 141,731,667 |
| HSBC FAMILY OF FUNDS |
| Notes to Financial Statements—as of October 31, 2019 (continued) |
6. Investment Risks:
Currency Risk:Fluctuations in exchange rates between the U.S. dollar and foreign currencies, or between various foreign currencies, may negatively affect the Portfolio’s performance. The Portfolio may seek to reduce currency risk by hedging part or all of its exposure to various foreign currencies; however, even if such hedging techniques are employed, there is no assurance that they will be successful.
Equity Securities Risk:The prices of equity securities fluctuate from time to time based on changes in a company’s financial condition or overall market and economic conditions. As a result, the value of equity securities may fluctuate drastically from day to day.
Foreign Securities Risk:Investments in foreign securities are generally considered riskier than investments in U.S. securities. Foreign securities, including those of emerging and frontier market issuers, are subject to additional risks, including international trade, political and regulatory risks.
Market Risk:The value of the Portfolio’s investments may decline due to changing economic, political, social, regulatory or market conditions. Market risk may affect a single issuer, industry or sector of the economy or it may affect the economy as a whole. Moreover, the conditions in one country or geographic region could adversely affect the Portfolio’s investments in a different country or geographic region.
7. Federal Income Tax Information:
At October 31, 2019, the cost basis of investments for federal income tax purposes, gross unrealized appreciation, gross unrealized depreciation and net unrealized appreciation/depreciation were as follows:
| | | | | | | | Net Unrealized |
| | | | Tax Unrealized | | Tax Unrealized | | Appreciation/ |
| | Tax Cost ($) | | Appreciation ($) | | Depreciation ($) | | (Depreciation) ($)* |
| Opportunity Portfolio | | 112,578,611 | | 19,473,578 | | (7,366,273) | | 12,107,305 |
____________________
| * | The difference between book-basis unrealized appreciation (depreciation) is attributable primarily to tax deferral of losses on wash sales. |
8. Subsequent Events:
Management has evaluated subsequent events through the date these financial statements were issued. Based on the evaluation, no adjustments or additional disclosures were required to the financial statements as of October 31, 2019.
Report of Independent Registered Public Accounting Firm
To the Board of Trustees of HSBC Funds and Shareholders of
HSBC Opportunity Portfolio
Opinion on the Financial Statements
We have audited the accompanying statement of assets and liabilities, including the schedule of portfolio investments, of HSBC Opportunity Portfolio (one of the funds constituting HSBC Funds, hereafter referred to as the “Fund”) as of October 31, 2019, the related statement of operations for the year ended October 31, 2019, the statement of changes in net assets for each of the two years in the period ended October 31, 2019, including the related notes, and the financial highlights for each of the five years in the period ended October 31, 2019 (collectively referred to as the “financial statements”). In our opinion, the financial statements present fairly, in all material respects, the financial position of the Fund as of October 31, 2019, the results of its operations for the year then ended, the changes in its net assets for each of the two years in the period ended October 31, 2019 and the financial highlights for each of the five years in the period ended October 31, 2019 in conformity with accounting principles generally accepted in the United States of America.
Basis for Opinion
These financial statements are the responsibility of the Fund’s management. Our responsibility is to express an opinion on the Fund’s financial statements based on our audits. We are a public accounting firm registered with the Public Company Accounting Oversight Board (United States) (“PCAOB”) and are required to be independent with respect to the Fund in accordance with the U.S. federal securities laws and the applicable rules and regulations of the Securities and Exchange Commission and the PCAOB.
We conducted our audits of these financial statements in accordance with the standards of the PCAOB. Those standards require that we plan and perform the audit to obtain reasonable assurance about whether the financial statements are free of material misstatement, whether due to error or fraud.
Report of Independent Registered Public Accounting Firm (continued)
Our audits included performing procedures to assess the risks of material misstatement of the financial statements, whether due to error or fraud, and performing procedures that respond to those risks. Such procedures included examining, on a test basis, evidence regarding the amounts and disclosures in the financial statements. Our audits also included evaluating the accounting principles used and significant estimates made by management, as well as evaluating the overall presentation of the financial statements. Our procedures included confirmation of securities owned as of October 31, 2019 by correspondence with the custodian and brokers; when replies were not received from brokers, we performed other auditing procedures. We believe that our audits provide a reasonable basis for our opinion.
/s/ PricewaterhouseCoopers LLP
New York, New York
December 20, 2019
We have served as the auditor of one or more investment companies in the HSBCFunds since 2015.
| HSBC FAMILY OF FUNDS |
| Table of Shareholder Expenses—as of October 31, 2019 (Unaudited) |
As a shareholder of the Portfolio, you incur ongoing costs, including management fees and other Fund expenses.
These examples are intended to help you understand your ongoing costs (in dollars) of investing in the Portfolio and to compare these costs with the ongoing costs of investing in other mutual funds.
Actual Expenses
The actual examples are based on an investment of $1,000 invested at the beginning of a six-month period beginning May 1, 2019 and held through the period ended October 31, 2019.
The columns below under the heading entitled “Actual” provide information about actual account values and actual expenses. You may use this information, together with the amount you invested, to estimate the expenses that you paid over the period. Simply divide your account value by $1,000 (for example, an $8,600 account value divided by $1,000 = 8.6), then multiply the result by the number in the table under the heading entitled “Actual Expenses Paid During the Period” to estimate the expenses you paid on your account during this period.
Hypothetical Expenses for Comparison Purposes
The hypothetical expense examples are based on an investment of $1,000 invested at the beginning of a six-month period and held throughout the period ended October 31, 2019.
The columns below under the heading entitled “Hypothetical” provide information about hypothetical account values and hypothetical expenses based on the Portfolio’s actual expense ratio and an assumed rate of return of 5% per year before expenses, which is not the Portfolio’s actual return. The hypothetical account values and expenses may not be used to estimate the actual ending account balance or expenses you paid for the period. You may use this information to compare this 5% hypothetical example with the 5% hypothetical examples that appear in the shareholder reports of other funds.
Please note that the expenses shown in the table are meant to highlight your ongoing costs only and do not reflect any transactional costs, such as sales charges (loads), redemption fees, or exchange fees. Therefore, the columns under the heading entitled “Hypothetical” are useful in comparing ongoing costs only, and will not help you determine the relative total costs of owning different funds. In addition, if these transactional costs were included, your costs would have been higher.
| | | | | | | | | | Hypothetical |
| | | | | | Actual | | (5% return before expenses) |
| | Annualized | | Beginning | | Ending | | Expenses | | Ending | | Expenses |
| | Expense Ratio | | Account Value | | Account Value | | Paid During | | Account Value | | Paid During |
| | During Period | | 5/1/19 | | 10/31/19 | | Period* | | 10/31/19 | | Period* |
| Opportunity Portfolio | | 1.03% | | $1,000.00 | | 988.50 | | 5.16 | | $1,020.01 | | $5.24 |
____________________
| * | Expenses are equal to the average account value over the period multiplied by the Portfolio’s annualized expense ratio, multiplied by 184/365 (the number of days in the most recent fiscal half-year divided by the number of days in the fiscal year. |
| HSBC FAMILY OF FUNDS |
| Board of Trustees and Officers (Unaudited) |
MANAGEMENT OF THE TRUST
The following table contains information regarding the HSBC Family of Funds’ Board of Trustees (“Trustees”). The HSBC Family of Funds’ Statement of Additional Information includes additional information about the Trustees and is available, without charge, upon request by calling (888) 525-5757.
| | | | | | | | Portfolios in | | Other |
| | Position(s) | | Term of Office | | | | Fund Complex | | Directorships |
| Name, | | Held | | and Length of | | Principal Occupation(s) | | Overseen | | Held by Trustee |
| Address, Age | | with Funds | | Time Served | | During Past 5 Years | | By Trustee* | | During Past 5 Years** |
| NON-INTERESTED | | | | | | | | | | |
| TRUSTEES | | | | | | | | | | |
| | | | | | | | | | | |
MARCIA L. BECK
P.O. Box 182845
Columbus, OH
43218-3035
Age: 64 | | Trustee | | Indefinite;
2008 to
present | | Private Investor (1999 – present) | | 8 | | None |
| | | | | | | | | | | |
SUSAN C. GAUSE
P.O. Box 182845
Columbus, OH
43218-3035
Age: 67 | | Trustee | | Indefinite;
2013 to
present | | Private Investor (2003 - present) | | 8 | | Metropolitan Series Fund
(2012 – present); and
Met Investors Series
Trust (2008 – present) |
| | | | | | | | | | | |
SUSAN S. HUANG
P.O. Box 182845
Columbus, OH
43218-3035
Age: 65 | | Trustee | | Indefinite;
2008 to
present | | Private Investor (2000 - present) | | 8 | | None |
| | | | | | | | | | | |
THOMAS F. ROBARDS
P.O. Box 182845
Columbus, OH
43218-3035
Age: 73 | | Chairman
and Trustee | | Indefinite;
2005 to
present | | Private Investor (2003 - present) | | 8 | | Ellington Residential
Mortgage REIT (NYSE
listed real estate
investment trust)
(2013 – present);
Ellington Financial Inc.
(NYSE listed financial
services company)
(2007 – present);
and Overseas
Shipholding Group
(OSG) (NYSE listed
company) (2005-2014) |
| | | | | | | | | | | |
| INTERESTED TRUSTEE | | | | | | | | | | |
| | | | | | | | | | | |
DEBORAH A. HAZELL***
452 Fifth Avenue
New York
NY 10018
Age: 56 | | Trustee | | Indefinite;
2011 to
present | | Director and Chief Executive Officer, HSBC Global Asset Management (USA) Inc. (2011 - present) | | 8 | | None |
____________________
| * | Includes all series of the HSBC Funds. |
| ** | This column includes only directorships of companies required to report to the SEC under the Securities Exchange Act of 1934 (i.e., “public companies”) or other investment companies registered under the 1940 Act. |
| *** | Ms. Hazell is considered to be an “Interested Trustee” because she holds positions with HSBC Global Asset Management (USA) Inc. |
| HSBC FAMILY OF FUNDS |
| Board of Trustees and Officers (Unaudited) (continued) |
| | Position(s) | | Term of Office and | | Principal Occupation(s) |
| Name, Address, Age | | Held Funds | | Length of Time Served | | During Past 5 Years |
| OFFICERS | | | | | | |
| | | | | | | |
RICHARD A. FABIETTI
452 Fifth Avenue
New York,
NY 10018
Age: 61 | | President | | One year;
2004 to present | | Senior Vice President, HSBC Global Asset Management (USA) Inc. (1998 - present) |
| | | | | | | |
JAMES D. LEVY
452 Fifth Avenue
New York, NY 10018
Age: 56 | | Vice President | | One year;
2014 to present | | Vice President, Product Management, HSBC Global Asset Management (USA) Inc. (2014 – present); Vice President, Mutual Funds Product Development, GE Asset Management Inc. (2007 – 2014) |
| | | | | | | |
LAUREN STUNTEBECK
4400 Easton Commons,
Suite 200 Columbus,
OH 43219-3035
Age: 32 | | Treasurer | | One year;
2019 to present | | Vice President, Financial Administration, Citi Fund Services (2019 - present); Senior Manager, Audit, KPMG LLP (2016-2019); Manager, Audit, KPMG LLP (2014-2016) |
| | | | | | | |
IOANNIS TZOUGANATOS*
Prudential Center
800 Boylston Street, 24th Floor
Boston, MA 02199
Age: 43 | | Secretary | | One year;
2015 to present | | Vice President, Regulatory Administration, Citi Fund Services (2008 - present) |
| | | | | | | |
CHARLES BOOTH*
4400 Easton Commons,
Suite 200
Columbus,
OH 43219-3035
Age: 59 | | Chief Compliance
Officer | | One year;
2015 to present | | Director and Compliance Officer, CCO Services, Citi Fund Services (1988 - present) |
| | | | | | | |
JAMES M. CURTIS
452 Fifth Avenue
New York,
NY 10018
Age: 51 | | Chief Legal Officer | | One year;
2018 to present | | Associate General Counsel, HSBC Securities (USA) Inc. (2005-2017); Associate General Counsel, HSBC Technology & Services (USA) Inc. (2018-present) |
____________________
| * | Mr. Tzouganatos and Mr. Booth also are officers of other investment companies of which Citi (or an affiliate) is the administrator or sub-administrator. |
| HSBC FAMILY OF FUNDS |
| Other Information (Unaudited) |
Information regarding how the Funds voted proxies relating to portfolio securities during the most recent 12-month period ended June 30th is available (i) without charge, upon request, by calling 1-800-525-5757 for HSBC Bank USA and HSBC Brokerage (USA) Inc. clients and 1-800-782-8183 for all other shareholders; (ii) on the Funds’ website at www.investorfunds.us.hsbc.com; and (iii) on the Security and Exchange Commission’s (“SEC”) website at http://www.sec.gov.
The Funds file their portfolio holdings information for each month in a fiscal quarter within 60 days after the end of the relevant fiscal quarter with the SEC on Form N-PORT. Portfolio holdings information for the third month of each fiscal quarter is available on the SEC’s website at http://www.sec.gov. The Funds’ Schedules of Investments will be available no later than 60 days after each period end, without charge, on the Funds’ website at www.investorfunds.us.hsbc.com.
An investment in a Fund is not a deposit of HSBC Bank USA, National Association, and is not insured or guaranteed by the Federal Deposit Insurance Corporation or any other government agency.
HSBC FAMILY OF FUNDS: INVESTMENT ADVISER AND ADMINISTRATOR HSBC Global Asset Management (USA) Inc.
452 Fifth Avenue
New York, NY 10018 SUB-ADVISER HSBC Opportunity Portfolio
Westfield Capital Management Company, L.P.
One Financial Center
Boston, MA 02111 HSBC Frontier Markets Fund
HSBC Global Asset Management (UK) Limited 78 St. James
Street London, United Kingdom, SW1A 1EJ | SHAREHOLDER SERVICING AGENTS For HSBC Bank USA, N.A. and
HSBC Securities (USA) Inc. Clients HSBC Bank USA, N.A.
452 Fifth Avenue
New York, NY 10018
1-888-525-5757 For All Other Shareholders HSBC Funds
P.O. Box 8106
Boston, MA 02266-8106
1-800-782-8183 TRANSFER AGENT DST Asset Manager Solutions, Inc.
2000 Crown Colony Drive
Quincy, MA 02169 DISTRIBUTOR Foreside Distribution Services, L.P.
Three Canal Plaza, Suite 100
Portland, ME 04101 CUSTODIAN The Northern Trust Company
50 South LaSalle Street
Chicago, IL 60603 INDEPENDENT REGISTERED PUBLIC ACCOUNTING FIRM PricewaterhouseCoopers LLP
300 Madison Avenue
New York, NY 10017 LEGAL COUNSEL Dechert LLP
1900 K Street, N.W.
Washington, D.C. 20006 |

| Investment products: |
ARE NOT A
BANK DEPOSIT
OR OBLIGATION
OF THE BANK
OR ANY OF ITS
AFFILIATES | ARE NOT
FDIC
INSURED | ARE NOT
INSURED BY
ANY FEDERAL
GOVERNMENT
AGENCY |
ARE NOT GUARANTEED BY
THE BANK OR ANY OF ITS
AFFILIATES | MAY LOSE
VALUE |
Investment products are offered by HSBC Securities (USA) Inc. (HSI), member NYSE/FINRA/SIPC. HSI is an affiliate of HSBC Bank USA, N.A. Investment products: Are not a deposit or other obligation of the bank or any of its affiliates; Not FDIC insured or insured by any federal government agency of the United States; Not guaranteed by the bank or any of its affiliates; and are subject to investment risk, including possible loss of principal invested.
Investors should consider the investment objectives, risks, charges, and expenses of the investment company carefully before investing. The prospectus contains this and other important information about the investment company. For clients of HSBC Securities (USA) Inc., please call 1-888-525-5757 for more information. For other investors and prospective investors, please call the Funds directly at 1-800-782-8183 or visit our website at www.investorfunds.us.hsbc.com. Investors should read the prospectus carefully before investing or sending money.
HSBC Funds
Annual Report
October 31, 2019
| FIXED INCOME FUNDS | | Class A | | Class I |
HSBC High Yield Fund
(formerly the HSBC Global High Yield Bond Fund) | | HBYAX | | HBYIX |
HSBC Strategic Income Fund
(formerly the HSBC Global High Income Bond Fund) | | HBIAX | | HBIIX |
| Table of Contents |
| HSBC Family of Funds |
| Annual Report - October 31, 2019 |
| Glossary of Terms | | 2 |
| Commentary From the Investment Manager | | 3 |
| Portfolio Reviews | | 4 |
| Portfolio Composition | | 8 |
| | | |
| Schedules of Portfolio Investments | | |
| | | |
| HSBC High Yield Fund | | 9 |
| HSBC Strategic Income Fund | | 17 |
| Statements of Assets and Liabilities | | 26 |
| Statements of Operations | | 28 |
| Statements of Changes in Net Assets | | 29 |
| Financial Highlights | | 31 |
| Notes to Financial Statements | | 33 |
| Report of Independent Registered Public Accounting Firm | | 51 |
| Other Federal Income Tax Information | | 53 |
| Table of Shareholder Expenses | | 54 |
| Board of Trustees and Officers | | 55 |
| Other Information | | 57 |
Bloomberg Barclays Global Aggregate Indexis an index that is the measure of the global investment-grade debt from 24 local currency markets, which include treasury, government-related, corporate, and securitized fixed-rate bonds from both developed and emerging markets issuers.
Bloomberg Barclays High Income Bond Composite Indexis a customized index that is close to equally weighted across U.S., Euro and EM markets. The Index is comprised of the following indices: Bloomberg Barclays USD Unhedged Emerging Markets Aggregate Index (35%), Bloomberg Barclays U.S. High Yield Ba Index (15%), Bloomberg Barclays U.S. Credit Baa Index (20%), Bloomberg Barclays EuroAgg Corporate Baa USD Hedged Index (15%), and Bloomberg Barclays Pan Euro HY (Euro) BB Rating Only USD Hedged Index (15%).
Bloomberg Barclays U.S. Aggregate Bond Indexis a broad-based benchmark that measures the investment-grade, U.S. dollar-denominated, fixed-rate taxable bond market. This includes Treasuries, government-related and corporate securities, mortgage-backed securities, asset-backed securities and collateralized mortgage-backed securities.
Gross Domestic Product (“GDP”)is the value of goods and services produced in a given country in a given year.
ICE BofA Merrill Lynch BB-B Global High Yield Constrained Index (USD Hedged)is an index that tracks the performance of the United States Dollar, Canadian Dollar, British Pound, and Euro denominated below investment-grade corporate debt publicly issued in the major domestic or Eurobond markets.
ICE BofA Merrill Lynch U.S. High Yield Constrained Indexis an index that contains all of the securities in the ICE BofA Merrill Lynch U.S. High Yield Index, but caps issuer exposure at 2%. The ICE BofA Merrill Lynch U.S. High Yield Index tracks the performance of U.S. dollar-denominated below investment-grade corporate debt publicly issued in the U.S. domestic market.
MSCI Europe Australasia and Far East (“MSCI EAFE”) Indexis an equity index which captures the large- and mid-cap representation across 21 developed markets countries, excluding the U.S. and Canada.
MSCI Emerging Markets Indexis a float-adjusted market capitalization index that is designed to measure equity market performance in global emerging markets.
Purchasing Managers’ Index (“PMI”)is an indicator of the economic health of the manufacturing sector. The PMI is based on five major indicators: new orders, inventory levels, production, supplier deliveries, and the employment environment.
Russell 1000®Indexmeasures the performance of the large-cap segment of the U.S. equity universe. It is a subset of the Russell 3000®Index and includes approximately 1000 of the largest securities based on a combination of their market cap and current index membership. The Russell 1000 represents approximately 92% of the U.S. market.
Russell 2000®Indexmeasures the performance of the small-cap segment of the U.S. equity universe. The Russell 2000®Index is a subset of the Russell 3000®Index representing approximately 8% of the total market capitalization of that index. It includes approximately 2000 of the smallest securities based on a combination of their market cap and current index membership.
Securities indices are unmanaged and assume reinvestment of all distributions and interest payments and do not take in account brokerage fees or expenses. Securities in the Funds do not match those in the indices and performance of the Funds will differ. Investors cannot invest directly in an index.
| Commentary From the Investment Manager(Unaudited) |
| HSBC Global Asset Management (USA) Inc. |
Global Economic Review
The global economy softened during the 12-month period from November 1, 2018 through October 31, 2019. The U.S. Federal Reserve Board (the Fed) moved to protect the U.S. economy from global economic weakness by shifting monetary policy from tightening to easing. Uncertainty stemming from U.S.-China trade conflicts, weakness in the eurozone and a downturn in the manufacturing sector, especially in China, exerted downward pressure on economic growth around the world.
Late in 2018, fears of recession drove steep declines in equity markets. Optimism returned in early 2019 as central banks in China, the U.S. and Europe signaled looser monetary policies. Yet worries about the trade conflict between the U.S. and China and signs of further global economic weakness began to weigh on global equities and investor confidence as the year progressed. In the end, some resilience in the U.S. economy and cautious optimism about the potential for improved international trade relations helped buoy equity markets.
The U.S. economy grew throughout the period, though generally at a slowing rate. Annual GDP1growth peaked at 3.1% in the first quarter of 2019, rebounding from 2.2% in the fourth quarter of 2018. GDP growth dropped to 1.9% in the second quarter of 2019, and early estimates suggest a similar growth rate in the third quarter. The U.S. unemployment rate fell from an already-low level, ending the period at 3.6%. The solid labor market, low interest rates and strong consumer confidence helped support the U.S. economy. Meanwhile, underlying inflation remained subdued. These positive factors generally outweighed a weak picture for U.S. investments and exports amid slower global growth, trade concerns and elevated political uncertainty.
The U.S. yield curve inverted in August as yields on certain short-term Treasury securities fell below yields on longer-term bonds. An inverted yield curve is widely considered a leading indicator of an economic recession. In reaction to signs that global economic weakness was weighing on U.S. growth, the Fed reduced interest rates three times between July and October, for a total reduction of 75 basis points (0.75%).
Weakening manufacturing data weighed on the eurozone throughout the period. Germany narrowly avoided a technical recession in 2019 due to the manufacturing sector’s extended slump, according to data from the PMI1. A robust labor market continued to support the region’s service sector, however, helping to sustain overall eurozone economic activity throughout the period.
Britain’s attenuated negotiations over Brexit continue to constrain economic performance in the United Kingdom. Businesses have had to contend with a challenging operating environment amid shifting deadlines for an agreement governing the United Kingdom’s exit from the European Union. For example, companies have tended to stockpile goods prior to each proposed deadline, and then subsequently sell down their stockpiles each time the government receives a new extension. The possibility for a wide variety of outcomes, including “no-deal,” “deal” or “no Brexit” scenarios, created (and continues to create) intense uncertainty for businesses and investors. A strong labor market provided a bright spot amid the country’s economic uncertainty.
In Japan, cyclical indicators early in the period fell to their lowest levels since early 2016. Growth remained sluggish through 2019 amid a slowdown in business investment. Meanwhile, softness in global trade—particularly trade with China, a large consumer of many Japanese exports— weighed on the country’s economy.
Emerging market economies remained relatively strong despite heightened geopolitical risks, including lingering trade tensions. Rate cuts from the Fed and looser monetary policy from emerging markets central banks supported these economies. While recent geopolitical instability in Latin America reduced economic growth in that region, the structural characteristics of many other emerging market economies remain strong.
China’s manufacturing exports, domestic orders and industrial profits declined early in the period, as the trade dispute with the U.S. exacerbated the country’s economic downturn. Manufacturing activity picked up briefly in June, but the country’s economic data generally continued to weaken from July through October.
Market review
Global equity markets suffered steep declines late in 2018. Stocks rebounded in early 2019 due in part to easing monetary policy in the U.S. and China, but fell again in May as U.S.-China trade relations deteriorated. Markets continued to rise and fall through the remainder of the period in response to fluctuating trade tensions, mixed economic data and Fed rate cuts. Despite this month-to-month volatility, global equity markets generally delivered positive results for the period.
U.S. stocks ended the period with uneven gains. The Russell 1000®Index1of large-capitalization U.S. stocks returned 14.15%, while the Russell 2000®Index1of small-cap stocks produced a 4.91% return.
International equities generally trailed the U.S. stock market. The MSCI EAFE Index1of developed-market international stocks gained 11.63% (gross of withholding taxes), and the MSCI Emerging Markets Index1returned 12.29% (gross of withholding taxes).
Global fixed-income markets rallied as looser central bank policies pushed interest rates down and bond prices up. Late in the period, sentiment on U.S.-China trade relations turned cautiously optimistic, easing investor concerns about the global economic outlook and curtailing bond returns. The Bloomberg Barclays Global Aggregate Bond Index1, which tracks the broader global investment-grade fixed income market, posted a 9.54% return for the 12-month period. Meanwhile the Bloomberg Barclays U.S. Aggregate Bond Index1, which tracks similar bonds in the U.S. market, posted an 11.51% return for the 12-month period.
| 1 | For additional information, please refer to the Glossary of Terms. |
| Portfolio Reviews(Unaudited) |
HSBC High Yield Fund(formerly the HSBC Global High Yield Bond Fund)
(Class A Shares and Class I Shares) |
by Mary Bowers, Senior Portfolio Manager
Rick Liu, CFA, Senior Portfolio Manager
The HSBC High Yield Fund (the “Fund”) seeks to maximize total return (comprised of capital appreciation and income). Under normal circumstances, the Fund invests at least 80% of its net assets, plus any borrowings for investment purposes, in a diversified portfolio of high-yield securities.
Investment Concerns
There is no assurance that a portfolio will achieve its investment objective or will work under all market conditions. The value of investments may go down as well as up and you may not get back the amount originally invested. Portfolios may be subject to certain additional risks, which should be considered carefully along with their investment objectives and fees.Fixed income securitiesare subject to credit and interest rate risk.Credit riskrefers to the ability of an issuer to make timely payments of interest and principal.Interest rate riskrefers to fluctuations in the value of a fixed income security resulting from changes in the general level of interest rates. In a declining interest rate environment, the portfolio may generate less income. In a rising interest rate environment, bond prices may fall. Investments inhigh-yield securities(commonly referred to as “junk bonds”) are often considered speculative investments and have significantly higher credit risk than investment-grade securities. The prices of high-yield securities, which may be less liquid than higher rated securities, may be more vulnerable to adverse market, economic or political conditions.Convertible securitiesentail risks associated with equity securities (whose value can fluctuate based on changes in a company’s financial condition or overall market conditions); investments in convertible securities are also subject to the risks associated with fixed-income securities. Investments inforeign marketsentail special risks such as currency, political, economic, and market risks. The risks of investing inemerging marketscountries are greater than the risks generally associated with foreign investments.Derivativesmay be riskier than other types of investments and could result in losses that significantly exceed the Fund’s original investment.Loan-related investmentsare subject to various risks, including credit risk, the risk that the receipt of proceeds may be delayed, and the risk that the investment is or may become illiquid or that the collateral securing the loan may decline in value.
For a complete description of these and other risks associated with investment in a mutual fund, please refer to the Fund’s prospectus.
Market Commentary
For the year ended October 31, 2019, the Fund returned 7.59% (without sales charge) for the Class A Shares and 8.03% for the Class I Shares. That compared to a 8.32% total return for the Fund’s benchmark, the ICE BofA Merrill Lynch U.S. High Yield Constrained Index1, for the same period.
Portfolio Performance
On April 1, 2019, the Fund changed its name, benchmark and investment strategy. The Fund’s new benchmark, the ICE BofA Merrill Lynch US High Yield Constrained Index1, reflects a shift in focus from a global high-yield bond portfolio to a U.S.-focused high-yield bond portfolio targeting consistent monthly income. The Fund retains the ability to invest internationally with the option to tactically allocate up to 30% of its total assets in non-US bonds. It can also invest in loans and asset-backed securities.†
Investor sentiment was negative in the final months of 2018 amid falling oil prices, renewed concerns over trade issues and slowing growth. Market volatility increased, as did fears of a recession, causing investors to sell their riskier assets for safer ones globally. Then, at the beginning of 2019, markets rallied when the Federal Reserve Board indicated a more patient stance toward interest rate hikes causing fears of a recession to fade. As a result, credit markets had a strong start to the year, and spreads for both high-yield and investment-grade bonds tightened over the first quarter. In May and again in early August, however, concerns over the U.S. trade dispute with China resurfaced, causing additional sell-offs of riskier assets, but not enough to erase the strong gains in credit markets from the first quarter.
During the 12-month period ended October 31, 2019, U.S. Treasury yields fell across the curve, which drove up prices and added to the Fund’s absolute returns. The 10-year Treasury ended the period at 1.69%, falling from a high of 3.23% on November 8, 2018. U.S. high-yield credit spreads widened 34 basis points (0.34%), ending at 415 basis points (4.15%), which weighed on the Fund’s returns as prices fell.
The Fund underperformed its previous benchmark (the ICE BofA Merrill Lynch BB-B Global High Yield Constrained Index (USD, Hedged)) between October 31, 2018 and March 31, 2019 mainly due to an underweight allocation to duration as 10-year U.S. Treasury rates fell. Regional allocation also detracted from performance, as the Fund was underweight emerging markets, which was the best performing segment.†
For the period between April 1, 2019 and October 31, 2019, the Class A Shares (without sales charge) produced a 4.05% total return, which outperformed the 2.63% total return of the Fund’s new index, driven by underweight allocations to the underperforming retail and energy sectors, as well as an underweight allocation to CCC rated bonds, the worst performing segment over the period.†
The Fund maintained some exposure to derivatives during the 12-month period under review, namely U.S. Treasury futures for duration management, credit default swaps for credit exposure management, and currency forwards to hedge non-USD exposure. The derivative exposure was for hedging and efficient portfolio management purposes and did not materially impact performance.†
| † | Portfolio composition is subject to change. |
| 1 | For additional information, please refer to the Glossary of Terms. |
Past performance does not guarantee future results. The performance data quoted represents past performance and current returns may be lower or higher. Total return figures include change in share price, reinvestment of dividends and capital gains and do not reflect taxes that a shareholder would pay on Fund distributions or on the redemption of Fund shares. Investment return and principal value will fluctuate so that an investor’s shares, when redeemed may be worth more or less than the original cost. To obtain performance information current to the most recent month end, please call 1-800-782-8183.
| Portfolio Reviews(Unaudited) |
| HSBC High Yield Fund | |
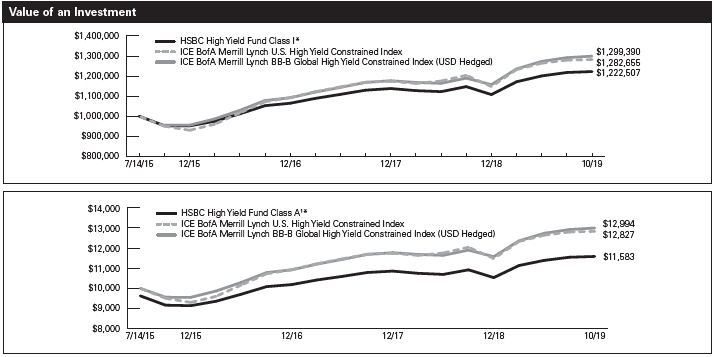
The charts above represent a historical since inception performance comparison of a hypothetical investment in the indicated share class versus a similar investment in the Fund’s benchmark and represents the reinvestment of dividends and capital gains in the Fund.
| | | | Average Annual | | Expense |
| Fund Performance | | | | Total Return (%) | | Ratio (%)2 |
| | Inception | | 1 | | Since | | | | |
| As of October 31, 2019* | | Date | | Year | | Inception | | Gross | | Net |
| HSBC High Yield Fund Class A1 | | 7/14/15 | | 3.53 | | 3.48 | | 2.60 | | 0.93 |
| HSBC High Yield Fund Class I | | 7/14/15 | | 8.03 | | 4.78 | | 2.25 | | 0.58 |
| ICE BofA Merrill Lynch U.S. High Yield Constrained Index3 | | — | | 8.32 | | 5.96 | | N/A | | N/A |
| ICE BofA Merrill Lynch BB-B Global High Yield Constrained | | | | | | | | | | |
| Index (USD Hedged)3 | | — | | 10.44 | | 6.28 | | N/A | | N/A |
Past performance does not guarantee future results. The performance data quoted represents past performance and current returns may be lower or higher. Total return figures include change in share price, reinvestment of dividends and capital gains and do not reflect the taxes that a shareholder would pay on Fund distributions or on the redemption of Fund shares. Investment return and principal value will fluctuate so that an investor’s shares, when redeemed may be worth more or less than the original cost. To obtain performance information current to the most recent month end, please call 1-800-782-8183.
The performance above reflects any fee waivers that have been in effect during the applicable periods, as well as any expense reimbursements that have periodically been made. Absent such waivers and reimbursements, returns would have been lower. Currently, contractual fee waivers and/or expense reimbursements are in effect for the Fund through March 1, 2021.
| * | Prior to April 1, 2019, the Fund primarily invested in a globally diversified portfolio of high-yield securities. Performance prior to this date is based on the Fund’s former strategy, and future performance will vary. |
| 1 | Reflects the maximum sales charge of 3.75%. |
| 2 | Reflects the expense ratio as reported in the prospectus dated January 31, 2019, as restated April 2, 2019 and supplemented to date. HSBC Global Asset Management (USA) Inc., the Adviser, has entered into a contractual expense limitation agreement with the Fund under which it will limit total expenses of the Fund (excluding interest, taxes, brokerage commissions, extraordinary expenses and estimated indirect expenses attributable to the Fund’s investments in investment companies) to an annual rate of 0.90% and 0.55% for Class A Shares and Class I Shares, respectively. The expense limitation shall be in effect until March 1, 2021. The expense ratios reflected include acquired fund fees and expenses. Additional information pertaining to the October 31, 2019 expense ratios can be found in the financial highlights. |
| 3 | For additional information, please refer to the Glossary of Terms. |
As of April 1, 2019, the Fund amended its investment strategy to reflect the shift in focus from a global high-yield bond portfolio to a U.S.-focused high-yield bond portfolio. As a result, beginning April 1, 2019, the performance of the Fund is measured against the ICE BofA Merrill Lynch U.S. High Yield Constrained Index. The ICE BofA Merrill Lynch U.S. High Yield Constrained Index contains all of the securities in the ICE BofA Merrill Lynch U.S. High Yield Index, but caps issuer exposure at 2%. The ICE BofA Merrill Lynch U.S. High Yield Index tracks the performance of U.S. dollar-denominated below investment-grade corporate debt publicly issued in the U.S. domestic market. Prior to April 1, 2019, the performance of the Fund was measured against the ICE BofA Merrill Lynch BB-B Global High Yield Constrained Index (USD Hedged), which tracks the performance of United States Dollar, Canadian Dollar, British Pound and Euro denominated below investment-grade corporate debt publicly issued in the major domestic or Eurobond markets. The performance of the indexes does not reflect the deduction of expenses associated with a mutual fund, such as investment management and fund accounting fees. The Fund’s performance reflects the deduction of fees for these value-added services. Investors cannot invest directly in an index.
| Portfolio Reviews(Unaudited) |
HSBC Strategic Income Fund(formerly the HSBC Global High Income Bond Fund)
(Class A Shares and Class I Shares) |
by Jerry Samet, Senior Portfolio Manager
Rick Liu, CFA/Senior Portfolio Manager
The HSBC Strategic Income Fund (the “Fund”) seeks to provide a high level of current income. Under normal circumstances, the Fund invests primarily in a diversified portfolio of higher-yielding securities.
Investment Concerns
There is no assurance that a portfolio will achieve its investment objective or will work under all market conditions. The value of investments may go down as well as up and you may not get back the amount originally invested. Portfolios may be subject to certain additional risks, which should be considered carefully along with their investment objectives and fees.Fixed income securitiesare subject to credit and interest rate risk.Credit riskrefers to the ability of an issuer to make timely payments of interest and principal.Interest rate riskrefers to fluctuations in the value of a fixed income security resulting from changes in the general level of interest rates. In a declining interest rate environment, the portfolio may generate less income. In a rising interest rate environment, bond prices may fall. Investments inhigh-yield securitiesare often considered speculative investments and have significantly higher credit risk than investment-grade securities. The prices of high-yield securities, which may be less liquid than higher rated securities, may be more vulnerable to adverse market, economic or political conditions.Convertible securitiesentail risks associated with equity securities (value can fluctuate based on changes in a company’s financial condition or overall market conditions); investments in convertible securities are also subject to the risks associated with fixed income securities. Investments inforeign marketsentail special risks such as currency, political, economic, and market risks. The risks of investing inemerging marketscountries are greater than the risks generally associated with foreign investments.Derivativesmay be riskier than other types of investments and could result in losses that significantly exceed the Fund’s original investment.Loan-related investmentsare subject to various risks, including credit risk, the risk that the receipt of proceeds may be delayed, and the risk that the investment is or may become illiquid or that the collateral securing the loan may decline in value.
For a complete description of these and other risks associated with investment in a mutual fund, please refer to the Fund’s prospectus.
Market Commentary
For the year ended October 31, 2019, the Fund returned 9.83% (without sales charge) for the Class A Shares and 10.24% for the Class I Shares. That compared to a 11.51% total return for the Fund’s benchmark, the Bloomberg Barclays U.S. Aggregate Bond Index1, for the same period.
Portfolio Performance
On April 1, 2019, the Fund changed its name, benchmark and investment strategy. The Fund’s new reference benchmark, the Bloomberg Barclays U.S. Aggregate Bond Index, reflects a shift in investment focus from a global corporate bond portfolio to a more opportunistic U.S.-focused multi-sector bond portfolio targeting high current income with a more flexible investment approach. The Fund retains the option to invest globally, allowing for up to 30% exposure to non-US bonds. It can also invest in loans and asset-backed securities.†
Investor sentiment was negative in the final months of 2018 amid falling oil prices, renewed concerns over trade issues and slowing growth. Market volatility increased, as did fears of a recession, causing investors to sell their riskier assets for safer ones globally. Then, at the beginning of 2019, markets rallied when the Federal Reserve Board indicated a more patient stance toward interest rate hikes causing fears of a recession to fade. As a result, credit markets had a strong start to the year, and spreads for both high-yield and investment-grade bonds tightened over the first quarter. In May and again in early August, however, concerns over the U.S. trade dispute with China resurfaced, causing additional sell-offs of riskier assets, but not enough to erase the strong gains in credit markets from the first quarter.
During the 12-month period ended October 31, 2019, U.S. Treasury yields fell across the curve, which drove up prices and added to the Fund’s absolute returns. The 10-year Treasury ended the period at 1.69%, falling from a high of 3.23% on November 8, 2018. U.S. investment-grade credit spreads tightened 8 basis points (bps) (0.08%) over the period as investors embraced more risk, finishing at 117 bps (1.17%). This added to the Fund’s returns. However, U.S. high-yield credit spreads widened 34 bps (0.34%), ending at 415 bps (4.15%), which detracted, offsetting those gains.
The Fund underperformed its previous benchmark (the Bloomberg Barclays High Income Composite Index) between October 31, 2018 and March 31, 2019. While the Fund benefited from positive regional and sector allocations, duration positioning and issuer selection detracted from performance. The underweight to duration weighed on performance as 10-year U.S. Treasury rates fell over the period.†
For the period April 1, 2019 to October 31, 2019, the Fund’s Class A Shares (without sales charge) returned 4.70% and the Class I Shares produced a 4.82% total return, and the Fund’s index produced a 5.71% total return. From a yield perspective, the portfolio delivered a 12-month dividend yield of 5.34% for the Class A shares (without sales charge) and 5.55% for the Class I Shares, due to its revised investment objective to provide high levels of monthly income by actively allocating to what it considers the most attractive fixed income segments.†
The Fund maintained some exposure to derivatives during the 12-month period under review, namely U.S. Treasury futures for duration management, credit default swaps for credit exposure management, and currency forwards to hedge non-USD exposure. The derivative exposure was for hedging and efficient portfolio management purposes and did not materially impact performance.†
| † | Portfolio composition is subject to change. |
| 1 | For additional information, please refer to the Glossary of Terms. |
Past performance does not guarantee future results. The performance data quoted represents past performance and current returns may be lower or higher. Total return figures include change in share price, reinvestment of dividends and capital gains and do not reflect taxes that a shareholder would pay on Fund distributions or on the redemption of Fund shares. Investment return and principal value will fluctuate so that an investor’s shares, when redeemed may be worth more or less than the original cost. To obtain performance information current to the most recent month end, please call 1-800-782-8183.
| Portfolio Reviews(Unaudited) |
| HSBC Strategic Income Fund | |
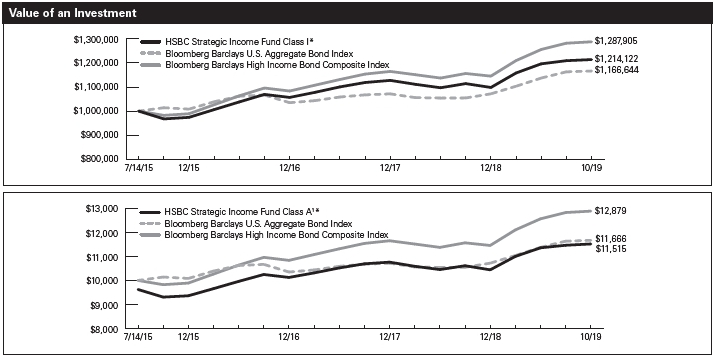
The charts above represent a historical since inception performance comparison of a hypothetical investment in the indicated share class versus a similar investment in the Fund’s benchmark and represents the reinvestment of dividends and capital gains in the Fund.
| | | | Average Annual | | Expense |
| Fund Performance | | | | Total Return (%) | | Ratio (%)2 |
| | Inception | | 1 | | Since | | | | |
| As of October 31, 2019* | | Date | | Year | | Inception | | Gross | | Net |
| HSBC Strategic Income Fund Class A1 | | 7/14/15 | | 5.76 | | 3.34 | | 2.79 | | 1.05 |
| HSBC Strategic Income Fund Class I | | 7/14/15 | | 10.24 | | 4.62 | | 2.44 | | 0.70 |
| Bloomberg Barclays U.S. Aggregate Bond Index3 | | | | 11.51 | | 3.65 | | N/A | | N/A |
| Bloomberg Barclays High Income Bond Composite Index3 | | — | | 12.68 | | 6.06 | | N/A | | N/A |
Past performance does not guarantee future results. The performance data quoted represents past performance and current returns may be lower or higher. Total return figures include change in share price, reinvestment of dividends and capital gains and do not reflect the taxes that a shareholder would pay on Fund distributions or on the redemption of Fund shares. Investment return and principal value will fluctuate so that an investor’s shares, when redeemed may be worth more or less than the original cost. To obtain performance information current to the most recent month end, please call 1-800-782-8183.
The performance above reflects any fee waivers that have been in effect during the applicable periods, as well as any expense reimbursements that have periodically been made. Absent such waivers and reimbursements, returns would have been lower. Currently, contractual fee waivers and/or expense reimbursements are in effect for the Fund through March 1, 2021.
| * | Prior to April 1, 2019, the Fund primarily invested in a globally diversified portfolio of higher yielding securities. Performance prior to this date is based on the Fund’s former strategy, and future performance will vary. |
| 1 | Reflects the maximum sales charge of 3.75%. |
| 2 | Reflects the expense ratio as reported in the prospectus dated January 31, 2019, as restated April 2, 2019 and supplemented to date. HSBC Global Asset Management (USA) Inc., the Adviser, has entered into a contractual expense limitation agreement with the Fund under which it will limit total expenses of the Fund (excluding interest, taxes, brokerage commissions, extraordinary expenses and estimated indirect expenses attributable to the Fund’s investments in investment companies) to an annual rate of 1.05% and 0.70% for Class A Shares and Class I Shares, respectively. The expense limitation shall be in effect until March 1, 2021. The expense ratios reflected include acquired fund fees and expenses. Additional information pertaining to the October 31, 2019 expense ratios can be found in the financial highlights. |
| 3 | For additional information, please refer to the Glossary of Terms. |
As of April 1, 2019, the Fund amended its investment strategy to reflect the shift in investment focus from a global corporate bond portfolio to a more opportunistic U.S.-focused multi-sector bond portfolio. As a result, beginning April 1, 2019, the performance of the Fund is measured against the Bloomberg Barclays U.S. Aggregate Bond Index. The Bloomberg Barclays U.S. Aggregate Bond Index is a broad-based benchmark that measures the investment-grade, U.S. dollar-denominated, fixed-rate taxable bond market. This includes Treasuries, government-related and corporate securities, mortgage-backed securities, asset-backed securities and collateralized mortgage-backed securities. Prior to April 1, 2019, the performance of the Fund was measured against the Bloomberg Barclays High Income Bond Composite Index, which is a customized index that is close to equally weighted across U.S., Euro and EM markets. The Index is comprised of the following indices: Bloomberg Barclays USD Unhedged Emerging Markets Aggregate Index (35%), Bloomberg Barclays U.S. High Yield Ba Index (15%), Bloomberg Barclays U.S. Credit Baa Index (20%), Bloomberg Barclays EuroAgg Corporate Baa USD Hedged Index (15%), and Bloomberg Barclays Pan Euro HY (Euro) BB Rating Only USD Hedged Index (15%). The performance of the indexes does not reflect the deduction of expenses associated with a mutual fund, such as investment management and fund accounting fees. The Fund’s performance reflects the deduction of fees for these value-added services. Investors cannot invest directly in an index.
Portfolio Reviews |
| Portfolio Composition* |
| October 31, 2019 (Unaudited) |
| HSBC High Yield Fund | | | | |
| | Percentage of Investments at |
| Geographic Region | | Value (%)† |
| United States | | | 75.8 | |
| Luxembourg | | | 5.4 | |
| Canada | | | 4.1 | |
| United Kingdom | | | 2.9 | |
| Ireland | | | 2.3 | |
| Australia | | | 1.0 | |
| Bahamas | | | 0.9 | |
| Bermuda | | | 0.8 | |
| Turkey | | | 0.8 | |
| France | | | 0.8 | |
| Switzerland | | | 0.8 | |
| Brazil | | | 0.7 | |
| Cayman Islands | | | 0.7 | |
| Spain | | | 0.7 | |
| Argentina | | | 0.5 | |
| Netherlands | | | 0.4 | |
| Russian Federation | | | 0.4 | |
| Sri Lanka | | | 0.3 | |
| South Africa | | | 0.3 | |
| Nigeria | | | 0.2 | |
| El Salvador | | | 0.1 | |
| Israel | | | 0.1 | |
| Venezuela | | | 0.0 | |
| | | 100.0 | |
| | |
| HSBC Strategic Income Fund | |
| | Percentage of Investments at |
| Geographic Region | | Value (%)† |
| United States | | | 73.4 | |
| United Kingdom | | | 5.0 | |
| Ireland | | | 3.1 | |
| Canada | | | 2.9 | |
| Turkey | | | 1.4 | |
| Mexico | | | 1.4 | |
| Oman | | | 1.4 | |
| Luxembourg | | | 1.3 | |
| France | | | 1.3 | |
| Netherlands | | | 1.2 | |
| Bermuda | | | 1.1 | |
| Cayman Islands | | | 1.0 | |
| Argentina | | | 0.8 | |
| Saudi Arabia | | | 0.7 | |
| Indonesia | | | 0.7 | |
| India | | | 0.7 | |
| Hong Kong SAR | | | 0.7 | |
| Russian Federation | | | 0.5 | |
| Germany | | | 0.4 | |
| Australia | | | 0.4 | |
| Sri Lanka | | | 0.3 | |
| Bahamas | | | 0.2 | |
| Brazil | | | 0.1 | |
| Venezuela | | | 0.0 | |
| | | 100.0 | |
____________________
| * | Portfolio composition is subject to change. |
| † | Excludes any instruments used for cash management. |
| 8 | HSBC FAMILY OF FUNDS | See notes to financial statements. |
HSBC HIGH YIELD FUND |
Schedule of Portfolio Investments—as of October 31, 2019 |
| Foreign Bonds — 1.6% | | | | |
| | | | | |
| | | Principal | | |
| | Amount † | | Value ($) |
| France — 0.4% | | | | |
| Electricite de France SA, Series E, | | | | |
| 5.38% (EUSA12 + 379 bps), | | | | |
| Callable 1/29/25 @ 100 (a)(b)(c) | | 100,000 | | 127,840 |
| Ireland — 0.3% | | | | |
| Ardagh Packaging Finance PLC/ | | | | |
| Ardagh Holdings USA Inc., 2.13%, | | | | |
| 8/15/26, Callable 8/15/22 | | | | |
| @ 101.06 (a)(d) | | 100,000 | | 112,747 |
| Luxembourg — 0.5% | | | | |
| Ineos Group Holdings SA, Registered, | | | | |
| 5.38%, 8/1/24, Callable 11/15/19 | | | | |
| @ 102.69 (a) | | 100,000 | | 113,959 |
| Kleopatra Holdings 1 SCA, 8.50%, | | | | |
| 6/30/23, Callable 12/5/19 | | | | |
| @ 102 (a)(d) | | 109,464 | | 60,793 |
| | | | 174,752 |
| Netherlands — 0.4% | | | | |
| Trivium Packaging Finance, 3.75%, | | | | |
| 8/15/26, Callable 8/15/22 | | | | |
| @ 101.88 (a)(d) | | 100,000 | | 115,825 |
| TOTAL FOREIGN BONDS | | | | |
| (COST $ 577,457) | | | | 531,164 |
| |
| Yankee Dollars — 20.2% | | | | |
| | | | | |
| | | Principal | | |
| | Amount ($) | | |
| Argentina — 0.5% | | | | |
| IRSA Propiedades Comerciales | | | | |
| SA, Registered, 8.75%, 3/23/23, | | | | |
| Callable 3/23/20 @ 104.38 (a) | | 23,000 | | 18,515 |
| Provincia de Buenos Aires, | | | | |
| Registered, 6.50%, 2/15/23 | | 50,000 | | 16,751 |
| Republic of Argentina, | | | | |
| 5.63%, 1/26/22 | | 60,000 | | 25,440 |
| Republic of Argentina, | | | | |
| 4.63%, 1/11/23 | | 20,000 | | 8,020 |
| Republic of Argentina, | | | | |
| 6.88%, 1/26/27 | | 53,000 | | 20,803 |
| YPF Sociedad Anonima, Registered, | | | | |
| 8.50%, 3/23/21 | | 77,000 | | 70,263 |
| | | | 159,792 |
| |
| Australia — 0.9% | | | | |
| FMG Resources August 2006 pty, | | | | |
| Ltd., 4.50%, 9/15/27, Callable | | | | |
| 6/15/27 @ 100 (a)(d) | | 228,000 | | 225,008 |
| Mineral Resources, Ltd., 8.13%, | | | | |
| 5/1/27, Callable 5/1/22 | | | | |
| @ 106.09 (a)(d) | | 80,000 | | 84,200 |
| | | | 309,208 |
| Bahamas — 0.8% | | | | |
| Silversea Cruise Finance, 7.25%, | | | | |
| 2/1/25, Callable 2/1/20 | | | | |
| @ 105.44 (a)(d) | | 241,000 | | 256,212 |
| Bermuda — 0.7% | | | | |
| Viking Cruises, Ltd., 5.88%, 9/15/27, | | | | |
| Callable 9/15/22 @ 102.94 (a)(d) | | 219,000 | | 232,688 |
| VOC Escro, Ltd., 5.00%, 2/15/28, | | | | |
| Callable 2/15/23 @ 102.5 (a)(d) | | 11,000 | | 11,440 |
| | | | 244,128 |
| Brazil — 0.6% | | | | |
| Itau Unibanco Holding SA/KY, | | | | |
| Registered, 5.75%, 1/22/21 | | 200,000 | | 206,602 |
| Canada — 3.8% | | | | |
| Cascades, Inc., 5.50%, 7/15/22, | | | | |
| Callable 12/6/19 @ 101.38 (a)(d) | | 250,000 | | 253,750 |
| GFL Environmental, Inc., 5.63%, | | | | |
| 5/1/22, Callable 12/6/19 | | | | |
| @ 102.81 (a)(d) | | 79,000 | | 80,975 |
| Hudbay Minerals, Inc., 7.25%, | | | | |
| 1/15/23, Callable 11/14/19 | | | | |
| @ 103.63 (a)(d) | | 2,000 | | 2,067 |
| Hudbay Minerals, Inc., 7.63%, | | | | |
| 1/15/25, Callable 1/15/20 | | | | |
| @ 105.72 (a)(d) | | 61,000 | | 62,106 |
| Iamgold Corp., 7.00%, 4/15/25, | | | | |
| Callable 4/15/20 @ 105.25 (a)(d) | | 147,000 | | 151,778 |
| Mountain Province Diamonds, Inc., | | | | |
| 8.00%, 12/15/22, Callable 12/15/19 | | | | |
| @ 104 (a)(d) | | 10,000 | | 9,700 |
| New Gold, Inc., 6.25%, 11/15/22, | | | | |
| Callable 11/14/19 @ 102.08 (a)(d) | | 198,000 | | 197,999 |
| Northwest Acquisitions ULC, 7.13%, | | | | |
| 11/1/22, Callable 11/18/19 | | | | |
| @ 103.56 (a)(d) | | 18,000 | | 9,000 |
| Nova Chemicals Corp., 4.88%, | | | | |
| 6/1/24, Callable 3/3/24 | | | | |
| @ 100 (a)(d) | | 150,000 | | 152,250 |
| Nova Chemicals Corp., 5.00%, | | | | |
| 5/1/25, Callable 1/31/25 | | | | |
| @ 100 (a)(d) | | 34,000 | | 34,170 |
| Nova Chemicals Corp., 5.25%, 6/1/27, | | | | |
| Callable 3/3/27 @ 100 (a)(d) | | 253,000 | | 259,958 |
| | | | 1,213,753 |
| Cayman Islands — 0.6% | | | | |
| Global Aircraft Leasing Co., Ltd., | | | | |
| 6.50%, 9/15/24, Callable 9/15/21 | | | | |
| @ 103.25 (a)(d) | | 200,000 | | 204,690 |
| El Salvador — 0.1% | | | | |
| Republic of El Salvador, Registered, | | | | |
| 7.75%, 1/24/23 | | 35,000 | | 38,238 |
| France — 0.3% | | | | |
| Electricite de France SA, Registered, | | | | |
| 5.25% (USSW10 + 371 bps), | | | | |
| Callable 1/29/23 @ 100 (a)(b)(c) | | 100,000 | | 103,250 |
| See notes to financial statements. | HSBC FAMILY OF FUNDS 9 |
| HSBC HIGH YIELD FUND |
| Schedule of Portfolio Investments—as of October 31, 2019 (continued) |
| Yankee Dollars, continued | | | | |
| |
| | Principal | | |
| | Amount ($) | | Value ($) |
| Ireland — 1.7% | | | | |
| AerCap Holdings NV, 5.88% (H15T5Y | | | | |
| + 454 bps), 10/10/79, Callable | | | | |
| 10/10/24 @ 100 (a)(c) | | 150,000 | | 156,375 |
| Avolon Holdings Funding, Ltd., | | | | |
| 5.13%, 10/1/23, Callable 9/1/23 | | | | |
| @ 100 (a)(d) | | 85,000 | | 91,715 |
| LCPR Senior Secured Financing DAC, | | | | |
| 6.75%, 10/15/27, Callable 10/15/22 | | | | |
| @ 103.38 (a)(d) | | 200,000 | | 204,750 |
| Park Aerospace Holdings, 5.25%, | | | | |
| 8/15/22, Callable 7/15/22 | | | | |
| @ 100 (a)(d) | | 93,000 | | 99,040 |
| | | | 551,880 |
| Israel — 0.1% | | | | |
| Teva Pharmaceuticals, 3.15%, | | | | |
| 10/1/26 | | 50,000 | | 37,625 |
| Luxembourg — 4.4% | | | | |
| Altice Luxembourg SA, 10.50%, | | | | |
| 5/15/27, Callable 5/15/22 | | | | |
| @ 105.25 (a)(d) | | 400,000 | | 452,500 |
| Altice SA, 7.63%, 2/15/25, Callable | | | | |
| 2/15/20 @ 103.81 (a)(d) | | 200,000 | | 206,250 |
| ARD Finance SA, 7.13%, 9/15/23, | | | | |
| Callable 11/18/19 @ 103.56 (a) | | 200,000 | | 207,750 |
| Intelsat Jackson Holdings SA, 8.50%, | | | | |
| 10/15/24, Callable 10/15/20 | | | | |
| @ 106.38 (a)(d) | | 326,000 | | 328,343 |
| Telenet Finance Luxembourg Notes | | | | |
| Sarl, 5.50%, 3/1/28, Callable | | | | |
| 12/1/22 @ 102.75 (a)(d) | | 200,000 | | 212,700 |
| | | | 1,407,543 |
| Nigeria — 0.1% | | | | |
| Nigeria Government International | | | | |
| Bond, 5.63%, 6/27/22 | | 45,000 | | 46,404 |
| Russian Federation — 0.3% | | | | |
| LUKOIL International Finance BV, | | | | |
| Registered, 6.66%, 6/7/22 | | 100,000 | | 110,139 |
| South Africa — 0.3% | | | | |
| Republic of South Africa, | | | | |
| 5.50%, 3/9/20 | | 100,000 | | 100,950 |
| Spain — 0.6% | | | | |
| Banco BIL Vizcaya Arg, 6.12% | | | | |
| (USSW5 + 387 bps), Callable | | | | |
| 11/16/27 @ 100 (a)(b)(c) | | 200,000 | | 196,750 |
| Sri Lanka — 0.3% | | | | |
| Republic of Sri Lanka, Registered, | | | | |
| 6.25%, 10/4/20 | | 100,000 | | 101,500 |
| Switzerland — 0.7% | | | | |
| UBS Group AG, 7.00% (USSW5 + | | | | |
| 487 bps), Callable 2/19/25 | | | | |
| @ 100 (a)(b)(c) | | 200,000 | | 223,000 |
| Turkey — 0.7% | | | | |
| Republic of Turkey, 7.00%, 6/5/20 | | 173,000 | | 176,470 |
| Republic of Turkey, 7.38%, 2/5/25 | | 62,000 | | 66,495 |
| | | | 242,965 |
| United Kingdom — 2.7% | | | | |
| Barclays PLC, 7.88% (USSW5 + | | | | |
| 677 bps), Callable 3/15/22 @ | | | | |
| 100 (a)(b)(c) | | 200,000 | | 213,266 |
| eG Global Finance PLC, 8.50%, | | | | |
| 10/30/25, Callable 10/30/21 | | | | |
| @ 104.25 (a)(d) | | 200,000 | | 210,000 |
| Royal Bank of Scotland Group PLC, | | | | |
| 8.63% (USSW5 + 760 bps), | | | | |
| Callable 8/15/21 @ 100 (a)(b)(c) | | 200,000 | | 215,500 |
| Virgin Media Finance PLC, 6.00%, | | | | |
| 10/15/24, Callable 11/18/19 | | | | |
| @ 103 (a)(d) | | 200,000 | | 206,250 |
| | | | | 845,016 |
| Venezuela — 0.0%NM | | | | |
| Petroleos de Venezuela SA, | | | | |
| Registered, 9.00%, 11/17/21 (e) | | 35,000 | | 2,100 |
| Petroleos de Venezuela SA, | | | | |
| Registered, 12.75%, 2/17/22 (e) | | 9,000 | | 540 |
| | | | 2,640 |
| TOTAL YANKEE DOLLARS | | | | |
| (COST $6,566,357) | | | | 6,602,285 |
| | | | | |
| Corporate Bonds — 68.5% | | | | |
| | | | | |
| United States — 68.5% | | | | |
| Acadia Healthcare Co., Inc., | | | | |
| 5.63%, 2/15/23, Callable 12/6/19 | | | | |
| @ 102.81(a) | | 65,000 | | 65,975 |
| Acadia Healthcare Co., Inc., | | | | |
| 6.50%, 3/1/24, Callable 12/6/19 | | | | |
| @ 104.88(a) | | 150,000 | | 155,250 |
| Adient US LLC, 7.00%, 5/15/26, | | | | |
| Callable 5/15/22 @ 103.50(a)(d) | | 157,000 | | 165,243 |
| AK Steel Corp., 7.50%, 7/15/23, | | | | |
| Callable 12/6/19 @ 103.75(a) | | 328,000 | | 328,820 |
| Ally Financial, Inc., 4.13%, 3/30/20 | | 135,000 | | 135,945 |
| Ally Financial, Inc., 7.50%, 9/15/20 | | 87,000 | | 90,698 |
| Ally Financial, Inc., 8.00%, 3/15/20 | | 87,000 | | 88,594 |
| American Express Co., 5.20% | | | | |
| (US0003M + 343 bps), Callable | | | | |
| 2/15/20 @ 100.00(a)(b)(c) | | 65,000 | | 65,325 |
| Antero Resources Corp., 5.00%, | | | | |
| 3/1/25, Callable 3/1/20 | | | | |
| @ 103.75(a) | | 300,000 | | 196,500 |
| Antero Resources Finance, | | | | |
| 5.38%, 11/1/21, Callable 12/6/19 | | | | |
| @ 100.00(a) | | 161,000 | | 143,693 |
| 10 HSBC FAMILY OF FUNDS | See notes to financial statements. |
| HSBC HIGH YIELD FUND |
| Schedule of Portfolio Investments—as of October 31, 2019 (continued) |
| Corporate Bonds, continued | | | | |
| |
| | Principal | | |
| | Amount ($) | | Value ($) |
| United States, continued | | | | |
| Archrock Partners LP/Archrock | | | | |
| Partners Finance Corp., | | | | |
| 6.88%, 4/1/27, Callable 4/1/22 | | | | |
| @ 105.16(a)(d) | | 231,000 | | 238,484 |
| Arconic, Inc., 5.90%, 2/1/27 | | 76,000 | | 84,505 |
| Ascent Resources Utica Holdings | | | | |
| LLC/ARU Finance Corp., 7.00%, | | | | |
| 11/1/26, Callable 11/1/21 | | | | |
| @ 103.50(a)(d) | | 42,000 | | 32,130 |
| Banff Merger Sub, Inc., 9.75%, | | | | |
| 9/1/26, Callable 9/1/21 | | | | |
| @ 104.88(a)(d) | | 76,000 | | 70,775 |
| Basuch Health Americas, Inc., | | | | |
| 8.50%, 1/31/27, Callable 7/31/22 | | | | |
| @ 104.25(a)(d) | | 45,000 | | 50,625 |
| Blue Cube Spinco, Inc., 9.75%, | | | | |
| 10/15/23, Callable 10/15/20 | | | | |
| @ 102.44(a) | | 88,000 | | 95,920 |
| Blue Cube Spinco, Inc., 10.00%, | | | | |
| 10/15/25, Callable 10/15/20 | | | | |
| @ 105.00(a) | | 28,000 | | 31,290 |
| Blue Racer Midstream LLC, 6.13%, | | | | |
| 11/15/22, Callable 12/6/19 | | | | |
| @ 101.53(a)(d) | | 273,000 | | 268,223 |
| Boyd Gaming Corp., 6.88%, 5/15/23, | | | | |
| Callable 11/21/19 @ 103.44(a) | | 115,000 | | 119,313 |
| Boyne USA, Inc., 7.25%, 5/1/25, | | | | |
| Callable 5/1/21 @ 103.63(a)(d) | | 60,000 | | 65,550 |
| Cablevision Systems Corp., | | | | |
| 5.88%, 9/15/22 | | 174,000 | | 187,703 |
| Calpine Corp., 5.75%, 1/15/25, | | | | |
| Callable 12/6/19 @ 102.88(a) | | 110,000 | | 112,750 |
| Calpine Corp., 6.00%, 1/15/22, | | | | |
| Callable 12/6/19 @ 100.00(a)(d) | | 75,000 | | 75,105 |
| Camelot Finance SA, 4.50%, 11/1/26, | | | | |
| Callable 11/1/22 @ 102.25(a)(d) | | 20,000 | | 20,208 |
| Capital One Financial Corp., 5.55% | | | | |
| (US0003M + 380 bps), Callable | | | | |
| 6/1/20 @ 100.00(a)(b)(c) | | 120,000 | | 122,198 |
| Carlson Travel, Inc., 6.75%, 12/15/23, | | | | |
| Callable 12/15/19 @ 103.38(a)(d) | | 300,000 | | 307,593 |
| CCO Holdings LLC, 5.00%, 2/1/28, | | | | |
| Callable 8/1/22 @ 102.50(a)(d) | | 134,000 | | 140,198 |
| CCO Holdings LLC, 5.13%, 5/1/23, | | | | |
| Callable 12/6/19 @ 102.56(a)(d) | | 164,000 | | 167,895 |
| CCO Holdings LLC, 5.75%, 1/15/24, | | | | |
| Callable 12/6/19 @ 101.92(a) | | 14,000 | | 14,346 |
| Centene Corp., 4.75%, 5/15/22, | | | | |
| Callable 12/6/19 @ 102.38(a) | | 14,000 | | 14,298 |
| Centene Corp., 6.13%, 2/15/24, | | | | |
| Callable 12/6/19 @ 104.59(a) | | 73,000 | | 75,897 |
| Centene Escrow I Corp., 5.38%, | | | | |
| 6/1/26, Callable 6/1/21 | | | | |
| @ 104.03(a)(d) | | 85,000 | | 89,973 |
| Charles River Laboratories | | | | |
| International, Inc., 4.25%, 5/1/28, | | | | |
| Callable 5/1/23 @ 102.13(a)(d) | | 40,000 | | 40,754 |
| Citigroup, Inc., 5.88% (US0003M | | | | |
| + 406 bps), Callable 3/27/20 | | | | |
| @ 100.00(a)(b)(c) | | 70,000 | | 70,963 |
| Clearwater Paper Corp., | | | | |
| 5.38%, 2/1/25(d) | | 363,000 | | 355,740 |
| Cleveland-Cliffs, Inc., 5.88%, 6/1/27, | | | | |
| Callable 6/1/22 @ 102.94(a)(d) | | 217,000 | | 206,964 |
| CommScope Finance LLC, 6.00%, | | | | |
| 6/15/25, Callable 6/15/20 | | | | |
| @ 103.00(a)(d) | | 147,000 | | 131,786 |
| CommScope Finance LLC, | | | | |
| 6.00%, 3/1/26, Callable 3/1/22 | | | | |
| @ 103.00(a)(d) | | 97,000 | | 99,668 |
| CommScope Finance LLC, | | | | |
| 8.25%, 3/1/27, Callable 3/1/22 | | | | |
| @ 104.13(a)(d) | | 146,000 | | 138,295 |
| Crestwood Midstream Partners LP/ | | | | |
| Crestwood Midstream Finance | | | | |
| Corp., 5.63%, 5/1/27, Callable | | | | |
| 5/1/22 @ 102.81(a)(d) | | 42,000 | | 42,263 |
| CSC Holdings LLC, 5.25%, 6/1/24 | | 200,000 | | 215,500 |
| CSC Holdings LLC, 5.38%, 2/1/28, | | | | |
| Callable 2/1/23 @ 102.69(a)(d) | | 200,000 | | 211,500 |
| CSC Holdings LLC, 5.75%, 1/15/30, | | | | |
| Callable 1/15/25 @ 102.88(a)(d) | | 200,000 | | 210,500 |
| CSC Holdings LLC, 10.88%, | | | | |
| 10/15/25, Callable 10/15/20 | | | | |
| @ 105.44(a)(d) | | 200,000 | | 225,691 |
| DCP Midstream LLC, 8.13%, 8/16/30 | | 77,000 | | 94,518 |
| Dell, Inc., 7.10%, 4/15/28 | | 109,000 | | 126,168 |
| Diamond 1 Finance/Diamond 2, | | | | |
| 5.88%, 6/15/21, Callable 11/21/19 | | | | |
| @ 101.47(a)(d) | | 13,000 | | 13,204 |
| Diamond 1 Finance/Diamond 2, | | | | |
| 7.13%, 6/15/24, Callable 11/21/19 | | | | |
| @ 105.34(a)(d) | | 174,000 | | 184,483 |
| Diamond Sports Group LLC/ | | | | |
| Diamond Sports Finance Co., | | | | |
| 5.38%, 8/15/26, Callable 8/15/22 | | | | |
| @ 102.69(a)(d) | | 200,000 | | 208,750 |
| Diamond Sports Group LLC/Diamond | | | | |
| Sports Finance Co., 6.63%, 8/15/27, | | | | |
| Callable 8/15/22 @ 103.31(a)(d) | | 200,000 | | 206,000 |
| Dish DBS Corp., 5.00%, 3/15/23 | | 76,000 | | 76,570 |
| DISH DBS Corp., 5.88%, 7/15/22 | | 60,000 | | 62,749 |
| Eagle Holding Co. II LLC, 7.63%, | | | | |
| 5/15/22, Callable 12/6/19 | | | | |
| @ 101.00(a)(d) | | 293,000 | | 295,564 |
| Eldorado Resorts, Inc., 6.00%, | | | | |
| 9/15/26, Callable 9/15/21 | | | | |
| @ 104.50(a) | | 403,000 | | 441,788 |
| Eldorado Resorts, Inc., 7.00%, 8/1/23, | | | | |
| Callable 12/6/19 @ 103.50(a) | | 135,000 | | 140,906 |
| Embarq Corp., 8.00%, 6/1/36 | | 197,000 | | 195,030 |
| Energy Transfer Partners LP, 6.25% | | | | |
| (US0003M + 418 bps), Callable | | | | |
| 2/15/23 @ 100.00(a)(b)(c) | | 83,000 | | 77,190 |
| See notes to financial statements. | HSBC FAMILY OF FUNDS 11 |
| HSBC HIGH YIELD FUND |
| Schedule of Portfolio Investments—as of October 31, 2019 (continued) |
| Corporate Bonds, continued | | | | |
| |
| | Principal | | |
| | Amount ($) | | Value ($) |
| United States, continued | | | | |
| EnLink Midstream Partners LP, 6.00% | | | | |
| (US0003M + 411 bps), Callable | | | | |
| 12/15/22 @ 100.00(a)(b)(c) | | 197,000 | | 135,300 |
| Foxtrot Escrow Issuer LLC/Foxtrot | | | | |
| Escrow Corp., 12.25%, 11/15/26, | | | | |
| Callable 11/15/22 @ 106.13(a)(d) | | 69,000 | | 69,345 |
| Freeport-McMoRan, Inc., 3.88%, | | | | |
| 3/15/23, Callable 12/15/22 | | | | |
| @ 100.00(a) | | 44,000 | | 44,660 |
| Freeport-McMoRan, Inc., 5.00%, | | | | |
| 9/1/27, Callable 9/1/22 | | | | |
| @ 102.50(a) | | 269,000 | | 274,716 |
| Genesis Energy LP, 5.63%, 6/15/24, | | | | |
| Callable 12/6/19 @ 102.81(a) | | 40,000 | | 37,300 |
| Genesis Energy LP, 6.00%, 5/15/23, | | | | |
| Callable 12/6/19 @ 103.00(a) | | 100,000 | | 97,000 |
| Genesis Energy LP, 6.75%, 8/1/22, | | | | |
| Callable 12/6/19 @ 101.69(a) | | 76,000 | | 76,380 |
| Go Daddy Operating Co. LLC/GD | | | | |
| Finance Co., Inc., 5.25%, 12/1/27, | | | | |
| Callable 6/1/22 @ 102.63(a)(d) | | 237,000 | | 251,220 |
| Golden Nugget, Inc., 6.75%, | | | | |
| 10/15/24, Callable 12/6/19 | | | | |
| @ 103.38(a)(d) | | 150,000 | | 154,515 |
| Golden Nugget, Inc., 8.75%, 10/1/25, | | | | |
| Callable 10/1/20 @ 104.38(a)(d) | | 133,000 | | 139,983 |
| Gray Television, Inc., 7.00%, 5/15/27, | | | | |
| Callable 5/15/22 @ 105.25(a)(d) | | 82,000 | | 89,730 |
| Greif, Inc., 6.50%, 3/1/27, Callable | | | | |
| 3/1/22 @ 103.25(a)(d) | | 95,000 | | 102,125 |
| Gulfport Energy Corp., 6.38%, | | | | |
| 5/15/25, Callable 5/15/20 | | | | |
| @ 104.78(a) | | 77,000 | | 46,585 |
| Gulfport Energy Corp., 6.00%, | | | | |
| 10/15/24, Callable 12/6/19 | | | | |
| @ 104.50(a) | | 196,000 | | 125,930 |
| HCA Healthcare, Inc., 5.88%, | | | | |
| 2/15/26, Callable 8/15/25 | | | | |
| @ 100.00(a) | | 200,000 | | 225,000 |
| HCA, Inc., 4.13%, 6/15/29, Callable | | | | |
| 3/15/29 @ 100.00(a) | | 75,000 | | 79,496 |
| HCA, Inc., 7.50%, 2/15/22 | | 64,000 | | 71,008 |
| Herc Holdings, Inc., 5.50%, 7/15/27, | | | | |
| Callable 7/15/22 @ 102.75(a)(d) | | 200,000 | | 207,250 |
| Infor, Inc., 6.50%, 5/15/22, Callable | | | | |
| 11/21/19 @ 101.63(a) | | 125,000 | | 126,719 |
| IQVIA, Inc., 2.25%, 1/15/28, Callable | | | | |
| 7/15/22 @ 101.13(a)(d) | | EUR 100,000 | | 113,918 |
| Iron Mountain, Inc., 4.88%, 9/15/29, | | | | |
| Callable 9/15/24 @ 102.44(a)(d) | | 60,000 | | 61,424 |
| Jacobs Entertainment, Inc., | | | | |
| 7.88%, 2/1/24, Callable 2/1/20 | | | | |
| @ 105.91(a)(d) | | 264,000 | | 280,500 |
| Jaguar Holding Co. II, 6.38%, 8/1/23, | | | | |
| Callable 12/6/19 @ 103.19(a)(d) | | 69,000 | | 71,415 |
| JBS USA LLC/JBS USA Finance LLC, | | | | |
| 5.50%, 1/15/30, Callable 1/15/25 | | | | |
| @ 102.75(a)(d) | | 60,000 | | 64,650 |
| JBS USA LLC/JBS USA Finance LLC, | | | | |
| 5.88%, 7/15/24, Callable 12/5/19 | | | | |
| @ 102.94(a) | | 50,000 | | 51,563 |
| JBS USA LLC/JBS USA Finance LLC, | | | | |
| 6.50%, 4/15/29, Callable 4/15/24 | | | | |
| @ 103.25(a)(d) | | 233,000 | | 259,219 |
| JPMorgan Chase & Co., 5.00% | | | | |
| (SOFR + 338 bps), Callable 8/1/24 | | | | |
| @ 100.00(a)(b)(c) | | 125,000 | | 129,797 |
| Kinetic Concepts, Inc. / KCI USA, Inc., | | | | |
| 12.50%, 11/1/21, Callable 12/6/19 | | | | |
| @ 109.38(a)(d) | | 189,000 | | 198,204 |
| LABL Escrow Issuer LLC, 6.75%, | | | | |
| 7/15/26, Callable 7/15/22 | | | | |
| @ 103.38(a)(d) | | 143,000 | | 148,005 |
| Level 3 Communications, 5.75%, | | | | |
| 12/1/22, Callable 12/1/19 | | | | |
| @ 100.00(a) | | 96,000 | | 96,240 |
| Level 3 Financing, Inc., 4.63%, | | | | |
| 9/15/27, Callable 9/15/22 | | | | |
| @ 102.31(a)(d) | | 202,000 | | 205,283 |
| Level 3 Financing, Inc., 5.13%, 5/1/23, | | | | |
| Callable 12/6/19 @ 101.28(a) | | 90,000 | | 91,125 |
| Level 3 Financing, Inc., 5.38%, | | | | |
| 1/15/24, Callable 12/6/19 | | | | |
| @ 102.69(a) | | 24,000 | | 24,450 |
| Level 3 Financing, Inc., 5.38%, | | | | |
| 5/1/25, Callable 5/1/20 | | | | |
| @ 102.69(a) | | 139,000 | | 143,691 |
| Manitowoc Co., Inc., 9.00%, 4/1/26, | | | | |
| Callable 4/1/22 @ 104.50(a)(d) | | 122,000 | | 117,273 |
| Match Group, Inc., 5.63%, 2/15/29, | | | | |
| Callable 2/15/24 @ 102.81(a)(d) | | 165,000 | | 176,756 |
| MGM Growth/MGM Finance, 5.63%, | | | | |
| 5/1/24, Callable 2/1/24 | | | | |
| @ 100.00(a) | | 38,000 | | 41,848 |
| MGM Growth/MGM Finance, | | | | |
| 5.75%, 2/1/27, Callable 11/1/26 | | | | |
| @ 100.00(a)(d) | | 41,000 | | 46,330 |
| MPH Acquisition Holdings LLC, | | | | |
| 7.13%, 6/1/24, Callable 12/6/19 | | | | |
| @ 105.34(a)(d) | | 141,000 | | 131,483 |
| MPT Operating Partnership LP, | | | | |
| 4.63%, 8/1/29, Callable 8/1/24 | | | | |
| @ 102.31(a) | | 56,000 | | 58,416 |
| MTS Systems Corp., 5.75%, 8/15/27, | | | | |
| Callable 8/15/22 @ 102.88(a)(d) | | 44,000 | | 46,090 |
| Navient Corp., 6.13%, | | | | |
| 3/25/24, MTN | | 38,000 | | 39,721 |
| Navient Corp., 6.50%, | | | | |
| 6/15/22 | | 100,000 | | 107,000 |
| Navient Corp., 6.75%, | | | | |
| 6/15/26, MTN | | 198,000 | | 206,910 |
| Navient Corp., 7.25%, | | | | |
| 1/25/22, MTN | | 150,000 | | 162,705 |
| Navistar International Corp., | | | | |
| 6.63%, 11/1/25, Callable 11/1/20 | | | | |
| @ 103.31(a)(d) | | 85,000 | | 86,700 |
| 12 HSBC FAMILY OF FUNDS | See notes to financial statements. |
| HSBC HIGH YIELD FUND |
| Schedule of Portfolio Investments—as of October 31, 2019 (continued) |
| Corporate Bonds, continued | | | | |
| |
| | Principal | | |
| | Amount ($) | | Value ($) |
| United States, continued | | | | |
| NRG Energy, Inc., 5.25%, 6/15/29, | | | | |
| Callable 6/15/24 @ 102.63(a)(d) | | 100,000 | | 107,250 |
| NRG Energy, Inc., 7.25%, 5/15/26, | | | | |
| Callable 5/15/21 @ 103.63(a) | | 54,000 | | 59,132 |
| Oasis Petroleum, Inc., 6.25%, 5/1/26, | | | | |
| Callable 5/1/21 @ 103.13(a)(d) | | 51,000 | | 34,706 |
| Olin Corp., 5.63%, 8/1/29, Callable | | | | |
| 8/1/24 @ 102.81(a) | | 148,000 | | 153,664 |
| Owens-Brockway Packaging, Inc., | | | | |
| 6.38%, 8/15/25(d) | | 100,000 | | 105,250 |
| Panther BF Aggregator 2 LP, | | | | |
| 6.25%, 5/15/26, Callable 5/15/22 | | | | |
| @ 103.13(a)(d) | | 190,000 | | 200,867 |
| Panther BF Aggregator 2 LP, | | | | |
| 8.50%, 5/15/27, Callable 5/15/22 | | | | |
| @ 104.25(a)(d) | | 81,000 | | 81,405 |
| Parsley Energy LLC, 5.25%, 8/15/25, | | | | |
| Callable 8/15/20 @ 103.94(a)(d) | | 69,000 | | 70,726 |
| Party City Holdings, Inc., | | | | |
| 6.63%, 8/1/26, Callable 8/1/21 | | | | |
| @ 103.31(a)(d) | | 140,000 | | 135,450 |
| PBF Holding Co. LLC, 7.00%, | | | | |
| 11/15/23, Callable 12/6/19 | | | | |
| @ 103.50(a) | | 303,000 | | 312,089 |
| PBF Logistics LP, 6.88%, 5/15/23, | | | | |
| Callable 12/6/19 @ 103.44(a) | | 322,000 | | 330,049 |
| Performance Food Group, Inc., | | | | |
| 5.50%, 10/15/27, Callable 10/15/22 | | | | |
| @ 102.75(a)(d) | | 39,000 | | 41,243 |
| PetSmart, Inc., 5.88%, 6/1/25, | | | | |
| Callable 6/1/20 @ 102.94(a)(d) | | 231,000 | | 227,535 |
| Plains All American Pipeline LP, 6.12% | | | | |
| (US0003M + 411 bps), Callable | | | | |
| 11/15/22 @ 100.00(a)(b)(c) | | 110,000 | | 102,575 |
| Plastipak Holdings, Inc., 6.25%, | | | | |
| 10/15/25, Callable 10/15/20 | | | | |
| @ 103.13(a)(d) | | 227,000 | | 187,275 |
| Polaris Intermediate Corp., 8.50%, | | | | |
| 12/1/22, Callable 11/18/19 | | | | |
| @ 104.00(a)(d) | | 248,000 | | 208,320 |
| Prime Security Services Borrower | | | | |
| LLC/Prime Finance, Inc., | | | | |
| 5.25%, 4/15/24(d) | | 214,000 | | 219,083 |
| Refinitiv US Holdings, Inc., 4.50%, | | | | |
| 5/15/26, Callable 11/15/21 | | | | |
| @ 102.25(a)(d) | | EUR 200,000 | | 241,497 |
| Refinitiv US Holdings, Inc., 6.25%, | | | | |
| 5/15/26, Callable 11/15/21 | | | | |
| @ 103.13(a)(d) | | 166,000 | | 180,318 |
| Refinitiv US Holdings, Inc., 8.25%, | | | | |
| 11/15/26, Callable 11/15/21 | | | | |
| @ 104.13(a)(d) | | 305,000 | | 342,362 |
| Regionalcare/LifePoint, 9.75%, | | | | |
| 12/1/26, Callable 12/1/21 | | | | |
| @ 104.88(a)(d) | | 355,000 | | 389,612 |
| Reynolds Group Issuer, Inc., | | | | |
| 5.13%, 7/15/23, Callable 12/6/19 | | | | |
| @ 102.56(a)(d) | | 72,000 | | 73,868 |
| Reynolds Group Issuer, Inc., 5.75%, | | | | |
| 10/15/20, Callable 12/6/19 | | | | |
| @ 100.00(a) | | 214,173 | | 214,912 |
| Scientific Games International, Inc., | | | | |
| 5.00%, 10/15/25, Callable 10/15/20 | | | | |
| @ 103.75(a)(d) | | 150,000 | | 154,500 |
| Scientific Games International, Inc., | | | | |
| 8.25%, 3/15/26, Callable 3/15/22 | | | | |
| @ 104.13(a)(d) | | 258,000 | | 272,835 |
| Scientific Games International, Inc., | | | | |
| 10.00%, 12/1/22, Callable 12/6/19 | | | | |
| @ 102.50(a) | | 147,000 | | 151,226 |
| Select Medical Corp., 6.25%, | | | | |
| 8/15/26, Callable 8/15/22 | | | | |
| @ 103.13(a)(d) | | 252,000 | | 268,379 |
| Service Corp. International, 5.13%, | | | | |
| 6/1/29, Callable 6/1/24 | | | | |
| @ 102.56(a) | | 60,000 | | 63,900 |
| Sirius XM Radio, Inc., 5.50%, 7/1/29, | | | | |
| Callable 7/1/24 @ 102.75(a)(d) | | 200,000 | | 216,124 |
| Sprint Communications, Inc., | | | | |
| 6.00%, 11/15/22 | | 125,000 | | 132,188 |
| Sprint Corp., 7.13%, 6/15/24 | | 30,000 | | 32,550 |
| Sprint Corp., 7.25%, 9/15/21 | | 144,000 | | 153,657 |
| Sprint Corp., 7.63%, 3/1/26, Callable | | | | |
| 11/1/25 @ 100.00(a) | | 18,000 | | 19,913 |
| Sprint Corp., 7.88%, 9/15/23 | | 328,000 | | 362,029 |
| Sunoco LP/Sunoco Finance Corp., | | | | |
| 6.00%, 4/15/27, Callable 4/15/22 | | | | |
| @ 103.00(a) | | 121,000 | | 127,050 |
| Talen Energy Supply LLC, 6.63%, | | | | |
| 1/15/28, Callable 1/15/23 | | | | |
| @ 103.31(a)(d) | | 60,000 | | 57,900 |
| Targa Resources Partners LP, | | | | |
| 5.00%, 1/15/28, Callable 1/15/23 | | | | |
| @ 102.50(a) | | 64,000 | | 63,520 |
| Targa Resources Partners LP, | | | | |
| 6.75%, 3/15/24, Callable 12/6/19 | | | | |
| @ 103.38(a) | | 31,000 | | 32,151 |
| Taylor Morrison Communities, Inc., | | | | |
| 5.88%, 6/15/27, Callable 3/15/27 | | | | |
| @ 100.00(a)(d) | | 100,000 | | 111,670 |
| Tegna, Inc., 5.00%, 9/15/29, Callable | | | | |
| 9/15/24 @ 102.50(a)(d) | | 137,000 | | 138,884 |
| Tempo Acquisition LLC, 6.75%, | | | | |
| 6/1/25, Callable 6/1/20 | | | | |
| @ 103.38(a)(d) | | 167,000 | | 171,801 |
| See notes to financial statements. | HSBC FAMILY OF FUNDS 13 |
| HSBC HIGH YIELD FUND |
| Schedule of Portfolio Investments—as of October 31, 2019 (continued) |
| Corporate Bonds, continued | | | | | |
| |
| | Principal | | | |
| | Amount ($) | | Value ($) |
| United States, continued | | | | | |
| Tenet Healthcare Corp., 5.13%, | | | | | |
| 11/1/27, Callable 11/1/22 | | | | | |
| @ 102.56(a)(d) | | 101,000 | | | 105,290 |
| Tenet Healthcare Corp., 6.25%, | | | | | |
| 2/1/27, Callable 2/1/22 | | | | | |
| @ 103.13(a)(d) | | 127,000 | | | 134,144 |
| Tenet Healthcare Corp., 8.13%, | | | | | |
| 4/1/22 | | 245,000 | | | 265,212 |
| The Chemours Co., 5.38%, 5/15/27, | | | | | |
| Callable 2/15/27 @ 100.00(a) | | 65,000 | | | 57,758 |
| The Chemours Co., 6.63%, 5/15/23, | | | | | |
| Callable 12/6/19 @ 103.31(a) | | 39,000 | | | 38,793 |
| The Chemours Co., 7.00%, 5/15/25, | | | | | |
| Callable 5/15/20 @ 103.50(a) | | 146,000 | | | 140,890 |
| T-Mobile US, Inc., 6.00%, 4/15/24, | | | | | |
| Callable 11/18/19 @ 104.50(a) | | 5,000 | | | 5,188 |
| T-Mobile US, Inc., 6.50%, 1/15/24, | | | | | |
| Callable 11/18/19 @ 103.25(a) | | 150,000 | | | 155,812 |
| Truck Hero, Inc., 8.50%, 4/21/24, | | | | | |
| Callable 4/30/21 @ 104.25(a)(d) | | 157,000 | | | 155,823 |
| Valeant Pharmaceuticals International, | | | | | |
| Inc., 5.50%, 11/1/25, Callable | | | | | |
| 11/1/20 @ 102.75(a)(d) | | 200,000 | | | 209,002 |
| Viper Energy Partners LP, 5.38%, | | | | | |
| 11/1/27, Callable 11/1/22 | | | | | |
| @ 102.69(a)(d) | | 30,000 | | | 30,525 |
| Vistra Operations Co. LLC, 5.00%, | | | | | |
| 7/31/27, Callable 7/31/22 | | | | | |
| @ 102.50(a)(d) | | 243,000 | | | 251,505 |
| Wand Merger Corp., 8.13%, 7/15/23, | | | | | |
| Callable 7/15/20 @ 104.06(a)(d) | | 76,000 | | | 80,560 |
| Warrior Met Coal, Inc., 8.00%, | | | | | |
| 11/1/24, Callable 11/1/20 | | | | | |
| @ 104.00(a)(d) | | 139,000 | | | 141,780 |
| Wyndham Worldwide Corp., | | | | | |
| 6.35%, 10/1/25, Callable 7/1/25 | | | | | |
| @ 100.00(a)(c) | | 161,000 | | | 178,308 |
| XPO Logistics, Inc., 6.75%, 8/15/24, | | | | | |
| Callable 8/15/21 @ 103.38(a)(d) | | 217,000 | | | 234,360 |
| Yum! Brands, Inc., 4.75%, 1/15/30, | | | | | |
| Callable 10/15/29 @ 100.00(a)(d) | | 80,000 | | | 83,900 |
| Zayo Group LLC/Zayo Capital LLC, | | | | | |
| 6.00%, 4/1/23, Callable 12/6/19 | | | | | |
| @ 103.00(a) | | 147,000 | | | 151,191 |
| | | | | | 22,378,050 |
| TOTAL CORPORATE BONDS | | | | | |
| (COST $22,143,761) | | | | | 22,378,050 |
| | | | | | |
| Exchange Traded Funds — 4.8% | | | | | |
| |
| | | Shares | | Value ($) |
| iShares JPMorgan USD Emerging | | | | | |
| Markets Bond ETF | | 10,019 | | | 1,138,158 |
| iShares iBoxx High Yield Corporate | | | | | |
| Bond ETF | | 5,000 | | | 434,050 |
| TOTAL EXCHANGE TRADED FUNDS | | | | | |
| (COST $1,497,772) | | | | | 1,572,208 |
| |
| Investment Companies — 3.6% | | | | | |
| | | | | | |
| Northern Institutional Government | | | | | |
| Assets Portfolio, Institutional | | | | | |
| Shares, 2.26%(f) | | 1,189,851 | | | 1,189,851 |
| TOTAL INVESTMENT COMPANIES | | | | | |
| (COST $1,189,851) | | | | | 1,189,851 |
| TOTAL INVESTMENTS IN SECURITIES | | | | | |
| (COST $31,975,198) — 98.7% | | | | | 32,273,558 |
| Other Assets (Liabilities) - 1.3% | | | | | 423,163 |
| NET ASSETS - 100% | | | | $ | 32,696,721 |
____________________
| † | The principal amount is disclosed in local currency and the value is disclosed in U.S. Dollars. |
| (a) | Represents next call date. Additional subsequent call dates and amounts may apply to this security. |
| (b) | Securities are perpetual and, thus, do not have a predetermined maturity date. |
| (c) | Floating or variable rate security linked to the referenced benchmark. The rate presented represents the rate in effect on October 31, 2019. These securities are deemed to have a maturity remaining until the next adjustment of the interest rate or the longer of the demand period or time to the next readjustment. |
| (d) | Rule 144A security or other security which is restricted as to resale to institutional investors. This security has been deemed liquid by the Investment Adviser based on procedures approved by the Board of Trustees. |
| (e) | Defaulted security. |
| (f) | The rate represents the annualized one day yield that was in effect on October 31, 2019. |
| NM | Not meaningful, amount is less than 0.05%. |
bps - Basis Points
ETF - Exchange-Traded Fund
EUR - Euro
EUSA12 - Euro 12 Year Swap Rate
H15T5Y - 5 Year Treasury Constant Maturity Rate
MTN - Medium Term Note
SOFR - Secured Overnight Financing Rate
ULC - Unlimited Liability Co.
US0003M - 3 Month US Dollar LIBOR
USSW5 - USD 5 Year Swap Rate
USSW10 - USD 10 Year Swap Rate
| 14 | HSBC FAMILY OF FUNDS | See notes to financial statements. |
| HSBC HIGH YIELD FUND |
| Schedule of Portfolio Investments—as of October 31, 2019 (continued) |
The Fund invested, as a percentage of net assets at value, in the following industries, as of October 31, 2019:
| Percentage of |
| Industry | Net Assets at Value (%)* |
| Hotels, Restaurants & Leisure | | 9.7 | |
| Oil, Gas & Consumable Fuels | | 8.1 | |
| Diversified Financial Services | | 7.6 | |
| Media | | 7.1 | |
| Health Care Providers & Services | | 7.0 | |
| Metals & Mining | | 5.2 | |
| Exchange Traded Fund | | 4.8 | |
| Containers & Packaging | | 4.4 | |
| Consumer Finance | | 4.0 | |
| Investment Companies | | 3.6 | |
| Wireless Telecommunication Services | | 3.4 | |
| Banks | | 3.2 | |
| IT Services | | 3.2 | |
| Chemicals | | 2.9 | |
| Electric Utilities | | 2.1 | |
| Sovereign Bond | | 1.8 | |
| Auto Components | | 1.8 | |
| Diversified Telecommunication Services | | 1.7 | |
| Commercial Services & Supplies | | 1.4 | |
| Paper & Forest Products | | 1.2 | |
| Food Products | | 1.2 | |
| Communications Equipment | | 1.1 | |
| Trading Companies & Distributors | | 1.1 | |
| Specialty Retail | | 1.1 | |
| Technology Hardware, Storage | | | |
| & Peripherals | | 1.0 | |
| Independent Power and Renewable | | | |
| Electricity Producers | | 0.9 | |
| Pharmaceuticals | | 0.9 | |
| Energy Equipment & Services | | 0.7 | |
| Capital Markets | | 0.7 | |
| Air Freight & Logistics | | 0.7 | |
| Machinery | | 0.7 | |
| Health Care Equipment & Supplies | | 0.6 | |
| Aerospace & Defense | | 0.6 | |
| Equity Real Estate Investment Trusts | | 0.6 | |
| Interactive Media & Services | | 0.5 | |
| Software | | 0.4 | |
| Life Sciences Tools & Services | | 0.4 | |
| Independent Power and Renewable | | 0.3 | |
| Household Durables | | 0.3 | |
| Diversified Consumer Services | | 0.2 | |
| Thrifts & Mortgage Finance | | 0.2 | |
| Food & Staples Retailing | | 0.1 | |
| Electronic Equipment, Instruments | | | |
| & Components | | 0.1 | |
| Real Estate Management | | | |
| & Development | | 0.1 | |
| Total | | 98.7 | |
____________________
| * | The percentage shown for each investment category reflects the value of investments in that category as a percentage of net assets. Figures in the above table may not sum to 100% due to the exclusion of other assets and liabilities. The above table depicts the Fund’s investments but may not represent the Fund’s market exposure due to the exclusion of certain derivatives, if any, as listed in the Schedule of Portfolio Investments. |
| See notes to financial statements. | HSBC FAMILY OF FUNDS | 15 |
| HSBC HIGH YIELD FUND |
| Schedule of Portfolio Investments—as of October 31, 2019 (continued) |
Forward Foreign Currency Exchange Contracts - Short Contracts
| | | | | | | | | | | | Net Unrealized |
| | | | | | | | | | | | Appreciation/ |
| Description and amount of | | Description and amount | | | | Settlement | | (Depreciation) |
| currency to be purchased | | of currency to be sold | | Counterparty | | Date | | ($) |
| U.S. Dollar | | 874,829 | | European Euro | | 800,000 | | Goldman Sachs | | 11/4/19 | | | | (17,561 | ) | |
| U.S. Dollar | | 894,005 | | European Euro | | 800,000 | | Goldman Sachs | | 12/3/19 | | | | (113 | ) | |
| | | | | | | | | | | | | | (17,674 | ) | |
| | | | | | Total unrealized appreciation | | | | | $ | — | | |
| | | | | | Total unrealized depreciation | | | | | | (17,674 | ) | |
| | | | | | Total net unrealized appreciation/(depreciation) | | | $ | (17,674 | ) | |
| 16 | HSBC FAMILY OF FUNDS | See notes to financial statements. |
| HSBC STRATEGIC INCOME FUND |
| Schedule of Portfolio Investments—as of October 31, 2019 |
| Foreign Bonds — 3.7% | | | | |
| |
| | Principal | | |
| | Amount † | | Value ($) |
| France — 1.3% | | | | |
| BNP Paribas Cardif SA, 4.03% | | | | |
| (EUR003M + 393 bps), Callable | | | | |
| 11/25/25 @ 100 (a)(b)(c) | | 200,000 | | 248,968 |
| Electricite de France SA, Series | | | | |
| E, 5.38% (EUSA12 + 379 bps), | | | | |
| Callable 1/29/25 @ 100 (a)(b)(c) | | 100,000 | | 127,840 |
| | | | 376,808 |
| Germany — 0.4% | | | | |
| Commerzbank AG, Series E, | | | | |
| 4.00%, 3/30/27 | | 100,000 | | 128,479 |
| Ireland — 0.4% | | | | |
| Ardagh Packaging Finance PLC/ | | | | |
| Ardagh Holdings USA Inc., 2.13%, | | | | |
| 8/15/26, Callable 8/15/22 | | | | |
| @ 101.06 (a)(d) | | 100,000 | | 112,747 |
| Luxembourg — 1.2% | | | | |
| ARD Finance SA, 6.63%, 9/15/23, | | | | |
| Callable 11/15/19 @ 103.31 (a) | | 200,000 | | 230,858 |
| Kleopatra Holdings 1 SCA, | | | | |
| Registered, 9.25%, 6/30/23, | | | | |
| Callable 12/5/19 | | | | |
| @ 102 (a) | | 273,660 | | 151,982 |
| | | | 382,840 |
| Netherlands — 0.4% | | | | |
| Trivium Packaging Finance, 3.75%, | | | | |
| 8/15/26, Callable 8/15/22 | | | | |
| @ 101.88 (a)(d) | | 100,000 | | 115,825 |
| TOTAL FOREIGN BONDS | | | | |
| (COST $1,166,313) | | | | 1,116,699 |
| |
| Yankee Dollars — 22.4% | | | | |
| |
| | Principal | | |
| | Amount ($) | | |
| Argentina — 0.7% | | | | |
| Provincia de Buenos Aires, | | | | |
| Registered, 6.50%, 2/15/23 | | 174,000 | | 58,292 |
| Republic of Argentina, 5.63%, | | | | |
| 1/26/22 | | 110,000 | | 46,641 |
| Republic of Argentina, 5.88%, | | | | |
| 1/11/28 | | 83,000 | | 31,541 |
| Republic of Argentina, 6.88%, | | | | |
| 1/11/48 | | 170,000 | | 65,876 |
| YPF Sociedad Anonima, Registered, | | | | |
| 8.50%, 3/23/21 | | 22,000 | | 20,075 |
| | | | 222,425 |
| Australia — 0.4% | | | | |
| Mineral Resources, Ltd., 8.13%, | | | | |
| 5/1/27, Callable 5/1/22 | | | | |
| @ 106.09 (a)(d) | | 74,000 | | 77,885 |
| Westpac Banking Corp., 5.00% | | | | |
| (USISDA05 + 289 bps), Callable | | | | |
| 9/21/27 @ 100 (a)(b)(c) | | 35,000 | | 35,649 |
| | | | 113,534 |
| Bahamas — 0.2% | | | | |
| Silversea Cruise Finance, 7.25%, | | | | |
| 2/1/25, Callable 2/1/20 | | | | |
| @ 105.44 (a)(d) | | 48,000 | | 51,030 |
| Bermuda — 1.1% | | | | |
| Aircastle, Ltd., 5.50%, 2/15/22 | | 100,000 | | 106,222 |
| VOC Escro, Ltd., 5.00%, 2/15/28, | | | | |
| Callable 2/15/23 @ 102.5 (a)(d) | | 203,000 | | 211,120 |
| | | | 317,342 |
| Brazil — 0.1% | | | | |
| Yamana Gold, Inc., 4.63%, 12/15/27, | | | | |
| Callable 9/15/27 @ 100 (a) | | 18,000 | | 19,035 |
| Canada — 2.9% | | | | |
| Bausch Health Cos., Inc., 5.75%, | | | | |
| 8/15/27, Callable 8/15/22 | | | | |
| @ 102.88 (a)(d) | | 157,000 | | 170,492 |
| Enbridge, Inc., 5.50% (US0003M + | | | | |
| 342 bps), 7/15/77, Callable 7/15/27 | | | | |
| @ 100 (a)(c) | | 55,000 | | 56,100 |
| Enbridge, Inc., 6.25% (US0003M + | | | | |
| 364 bps), 3/1/78, Callable 3/1/28 | | | | |
| @ 100 (a)(c) | | 15,000 | | 16,132 |
| Iamgold Corp., 7.00%, 4/15/25, | | | | |
| Callable 4/15/20 @ 105.25 (a)(d) | | 39,000 | | 40,268 |
| Kinross Gold Corp., 4.50%, 7/15/27, | | | | |
| Callable 4/15/27 @ 100 (a) | | 50,000 | | 52,990 |
| Mountain Province Diamonds, Inc., | | | | |
| 8.00%, 12/15/22, Callable 12/15/19 | | | | |
| @ 104 (a)(d) | | 2,000 | | 1,940 |
| New Gold, Inc., 6.25%, 11/15/22, | | | | |
| Callable 11/14/19 @ 102.08 (a)(d) | | 153,000 | | 152,999 |
| New Gold, Inc., 6.38%, 5/15/25, | | | | |
| Callable 5/15/20 @ 104.78 (a)(d) | | 18,000 | | 17,102 |
| Northwest Acquisitions ULC, 7.13%, | | | | |
| 11/1/22, Callable 11/18/19 | | | | |
| @ 103.56 (a)(d) | | 162,000 | | 80,999 |
| Nova Chemicals Corp., 4.88%, | | | | |
| 6/1/24, Callable 3/3/24 | | | | |
| @ 100 (a)(d) | | 10,000 | | 10,150 |
| Nova Chemicals Corp., 5.00%, | | | | |
| 5/1/25, Callable 1/31/25 | | | | |
| @ 100 (a)(d) | | 17,000 | | 17,085 |
| Nova Chemicals Corp., 5.25%, 6/1/27, | | | | |
| Callable 3/3/27 @ 100 (a)(d) | | 237,000 | | 243,518 |
| | | | 859,775 |
| Cayman Islands — 1.0% | | | | |
| Global Aircraft Leasing Co., Ltd., | | | | |
| 6.50%, 9/15/24, Callable 9/15/21 | | | | |
| @ 103.25 (a)(d) | | 300,000 | | 307,035 |
| Hong Kong SAR — 0.7% | | | | |
| CK Hutchison Capital Securities 17, Ltd., | | | | |
| 4.00% (H15T5Y + 207 bps), Callable | | | | |
| 5/12/22 @ 100 (a)(b)(c)(d) | | 200,000 | | 200,797 |
| India — 0.7% | | | | |
| ONGC Videsh, Ltd., 3.75%, 5/7/23 | | 200,000 | | 205,949 |
| See notes to financial statements. | HSBC FAMILY OF FUNDS | 17 |
| HSBC STRATEGIC INCOME FUND |
| Schedule of Portfolio Investments—as of October 31, 2019 (continued) |
| Yankee Dollars, continued | | | | |
| |
| | Principal | | |
| | Amount ($) | | Value ($) |
| Indonesia — 0.7% | | | | |
| Perusahaan Listrik Negara PT, | | | | |
| Registered, 4.13%, 5/15/27, MTN | | 200,000 | | 209,082 |
| Ireland — 2.6% | | | | |
| AerCap Ireland Capital/Global, 3.50%, | | | | |
| 1/15/25, Callable 11/15/24 | | | | |
| @ 100 (a) | | 150,000 | | 154,953 |
| Avolon Holdings Funding, Ltd., | | | | |
| 4.38%, 5/1/26, Callable 3/1/26 | | | | |
| @ 100 (a)(d) | | 400,000 | | 423,176 |
| LCPR Senior Secured Financing DAC, | | | | |
| 6.75%, 10/15/27, Callable 10/15/22 | | | | |
| @ 103.38 (a)(d) | | 200,000 | | 204,750 |
| | | | 782,879 |
| Mexico — 1.4% | | | | |
| BBVA Bancomer SA Institucion de | | | | |
| Banca, Registered, 6.50%, | | | | |
| 3/10/21 | | 150,000 | | 157,502 |
| Petroleos Mexicanos, 4.88%, | | | | |
| 1/24/22 | | 110,000 | | 114,235 |
| Petroleos Mexicanos, 6.50%, | | | | |
| 3/13/27 | | 97,000 | | 102,820 |
| Petroleos Mexicanos, 5.35%, | | | | |
| 2/12/28 | | 46,000 | | 45,425 |
| | | | 419,982 |
| Netherlands — 0.8% | | | | |
| LYB International Finance II BV, | | | | |
| 3.50%, 3/2/27, Callable 12/2/26 | | | | |
| @ 100 (a) | | 200,000 | | 208,391 |
| LyondellBasell Industries NV, 4.63%, | | | | |
| 2/26/55, Callable 8/26/54 | | | | |
| @ 100 (a) | | 25,000 | | 25,822 |
| | | | 234,213 |
| Oman — 1.3% | | | | |
| Oman Government International Bond, | | | | |
| Registered, 5.38%, 3/8/27 | | 400,000 | | 396,000 |
| Russian Federation — 0.5% | | | | |
| Gazprom OAO, Registered, | | | | |
| 7.29%, 8/16/37 | | 100,000 | | 135,010 |
| Saudi Arabia — 0.7% | | | | |
| Saudi Arabian Oil Co., 4.38%, | | | | |
| 4/16/49 (d) | | 200,000 | | 216,947 |
| Sri Lanka — 0.3% | | | | |
| Republic of Sri Lanka, Registered, | | | | |
| 6.25%, 10/4/20 | | 100,000 | | 101,500 |
| Turkey — 1.4% | | | | |
| Republic of Turkey, 6.88%, 3/17/36 | | 68,000 | | 66,991 |
| Republic of Turkey, 4.88%, 4/16/43 | | 200,000 | | 158,963 |
| Turkiye Is Bankasi AS, 6.13%, | | | | |
| 4/25/24, MTN | | 200,000 | | 194,620 |
| | | | 420,574 |
| United Kingdom — 4.9% | | | | |
| Barclays PLC, 4.38%, 1/12/26 | | 200,000 | | 214,914 |
| eG Global Finance PLC, 8.50%, | | | | |
| 10/30/25, Callable 10/30/21 | | | | |
| @ 104.25 (a)(d) | | 200,000 | | 210,000 |
| Lloyds Banking Group PLC, | | | | |
| 4.65%, 3/24/26 | | 200,000 | | 216,198 |
| Nationwide Building Society, 3.62% | | | | |
| (US0003M + 118 bps), 4/26/23, | | | | |
| Callable 4/26/22 @ 100 (a)(c)(d) | | 200,000 | | 205,598 |
| Nationwide Building Society, 4.36% | | | | |
| (US0003M + 139 bps), 8/1/24, | | | | |
| Callable 8/1/23 @ 100 (a)(c)(d) | | 200,000 | | 212,188 |
| Royal Bank of Scotland Group PLC, | | | | |
| 3.75% (H15T5Y + 210 bps), | | | | |
| 11/1/29, Callable 11/1/24 | | | | |
| @ 100 (a)(c) | | 200,000 | | 201,750 |
| Santander UK Group Holdings, 3.82% | | | | |
| (US0003M + 140 bps), 11/3/28, | | | | |
| Callable 11/3/27 @ 100 (a)(c) | | 200,000 | | 211,144 |
| | | | | 1,471,792 |
| Venezuela — 0.0%NM | | | | |
| Republic of Venezuela, 11.95%, | | | | |
| 8/5/31 (e) | | 30,000 | | 3,113 |
| TOTAL YANKEE DOLLARS | | | | |
| (COST $6,706,134) | | | | 6,688,014 |
| |
| Corporate Bonds — 67.4% | | | | |
| |
| United States — 67.4% | | | | |
| Adient US LLC, 7.00%, 5/15/26, | | | | |
| Callable 5/15/22 @ 103.50(a)(d) | | 144,000 | | 151,560 |
| AK Steel Corp., 7.50%, 7/15/23, | | | | |
| Callable 12/6/19 @ 103.75(a) | | 224,000 | | 224,560 |
| Alexandria Real Estate Equities, Inc., | | | | |
| 4.00%, 1/15/24, Callable 12/15/23 | | | | |
| @ 100.00(a) | | 55,000 | | 58,899 |
| Ally Financial, Inc., 4.13%, 3/30/20 | | 50,000 | | 50,350 |
| Ally Financial, Inc., 5.75%, 11/20/25, | | | | |
| Callable 10/21/25 @ 100.00(a) | | 63,000 | | 70,166 |
| American Express Co., 4.90% | | | | |
| (US0003M + 329 bps), Callable | | | | |
| 3/15/20 @ 100.00(a)(b)(c) | | 400,000 | | 404,033 |
| American Express Co., 5.20% | | | | |
| (US0003M + 343 bps), Callable | | | | |
| 2/15/20 @ 100.00(a)(b)(c) | | 48,000 | | 48,240 |
| Antero Resources Corp., 5.00%, | | | | |
| 3/1/25, Callable 3/1/20 | | | | |
| @ 103.75(a) | | 65,000 | | 42,575 |
| Antero Resources Corp., 5.13%, | | | | |
| 12/1/22, Callable 12/6/19 | | | | |
| @ 101.28(a) | | 225,000 | | 168,468 |
| Archrock Partners LP/Archrock | | | | |
| Partners Finance Corp., | | | | |
| 6.88%, 4/1/27, Callable 4/1/22 | | | | |
| @ 105.16(a)(d) | | 30,000 | | 30,972 |
| 18 | HSBC FAMILY OF FUNDS | See notes to financial statements. |
| HSBC STRATEGIC INCOME FUND |
| Schedule of Portfolio Investments—as of October 31, 2019 (continued) |
| Corporate Bonds, continued |
| | | | | |
| | Principal | | |
| | Amount ($) | | Value ($) |
| United States, continued | | | | |
| Arconic, Inc., 5.90%, 2/1/27 | | 34,000 | | 37,805 |
| AT&T, Inc., 3.31% (US0003M + 118 | | | | |
| bps), 6/12/24(c) | | 40,000 | | 40,695 |
| AT&T, Inc., 4.80%, 6/15/44, Callable | | | | |
| 12/15/43 @ 100.00(a) | | 25,000 | | 27,818 |
| AT&T, Inc., 5.25%, 3/1/37, Callable | | | | |
| 9/1/36 @ 100.00(a) | | 85,000 | | 100,043 |
| AT&T, Inc., 5.65%, 2/15/47, Callable | | | | |
| 8/15/46 @ 100.00(a) | | 75,000 | | 92,761 |
| Bank of America Corp., 6.50% | | | | |
| (US0003M + 417 bps), Callable | | | | |
| 10/23/24 @ 100.00(a)(b)(c) | | 35,000 | | 39,685 |
| Blue Racer Midstream LLC, 6.13%, | | | | |
| 11/15/22, Callable 12/6/19 | | | | |
| @ 101.53(a)(d) | | 164,000 | | 161,129 |
| Boardwalk Pipelines LP, 4.80%, | | | | |
| 5/3/29, Callable 2/3/29 | | | | |
| @ 100.00(a) | | 115,000 | | 122,248 |
| Boardwalk Pipelines LP, 5.95%, | | | | |
| 6/1/26, Callable 3/1/26 | | | | |
| @ 100.00(a) | | 89,000 | | 99,775 |
| Brandywine Operating Partnership LP, | | | | |
| 3.95%, 11/15/27, Callable 8/15/27 | | | | |
| @ 100.00(a) | | 35,000 | | 36,882 |
| Buckeye Partners LP, 6.38% | | | | |
| (US0003M + 402 bps), 1/22/78, | | | | |
| Callable 1/22/23 @ 100.00(a)(c) | | 55,000 | | 40,150 |
| Building Materials Corp., 6.00%, | | | | |
| 10/15/25, Callable 10/15/20 | | | | |
| @ 103.00(a)(d) | | 50,000 | | 52,500 |
| Camelot Finance SA, 4.50%, 11/1/26, | | | | |
| Callable 11/1/22 @ 102.25(a)(d) | | 20,000 | | 20,208 |
| Capital One Financial Corp., 3.75%, | | | | |
| 7/28/26, Callable 6/28/26 | | | | |
| @ 100.00(a) | | 65,000 | | 68,650 |
| Capital One Financial Corp., 4.20%, | | | | |
| 10/29/25, Callable 9/29/25 | | | | |
| @ 100.00(a) | | 35,000 | | 37,798 |
| Capital One Financial Corp., 5.55% | | | | |
| (US0003M + 380 bps), Callable | | | | |
| 6/1/20 @ 100.00(a)(b)(c) | | 50,000 | | 50,916 |
| Care Capital Properties, Inc., | | | | |
| 5.13%, 8/15/26, Callable 5/15/26 | | | | |
| @ 100.00(a) | | 145,000 | | 157,076 |
| CCO Holdings LLC, 5.75%, 2/15/26, | | | | |
| Callable 2/15/21 @ 102.88(a)(d) | | 150,000 | | 158,400 |
| Celgene Corp., 5.00%, 8/15/45, | | | | |
| Callable 2/15/45 @ 100.00(a) | | 60,000 | | 76,339 |
| Centene Corp., 6.13%, 2/15/24, | | | | |
| Callable 12/6/19 @ 104.59(a) | | 29,000 | | 30,151 |
| Centene Escrow I Corp., 5.38%, | | | | |
| 6/1/26, Callable 6/1/21 | | | | |
| @ 104.03(a)(d) | | 35,000 | | 37,048 |
| Central Garden & Pet Co., 6.13%, | | | | |
| 11/15/23, Callable 12/6/19 | | | | |
| @ 103.06(a) | | 31,000 | | 32,046 |
| Charles River Laboratories | | | | |
| International, Inc., 4.25%, 5/1/28, | | | | |
| Callable 5/1/23 @ 102.13(a)(d) | | 36,000 | | 36,679 |
| Charter Communications Operating | | | | |
| LLC/Capital, 5.75%, 4/1/48, | | | | |
| Callable 10/1/47 @ 100.00(a) | | 200,000 | | 229,690 |
| Citigroup, Inc., 4.13%, 7/25/28 | | 70,000 | | 75,823 |
| Citigroup, Inc., 4.60%, 3/9/26 | | 40,000 | | 43,995 |
| Citigroup, Inc., 5.80% (US0003M | | | | |
| + 409 bps), Callable 11/15/19 | | | | |
| @ 100.00(a)(b)(c) | | 50,000 | | 50,025 |
| Clearwater Paper Corp., 4.50%, | | | | |
| 2/1/23, Callable 12/6/19 | | | | |
| @ 101.50(a) | | 19,000 | | 19,071 |
| Clearwater Paper Corp., | | | | |
| 5.38%, 2/1/25(d) | | 190,000 | | 186,200 |
| Cleveland-Cliffs, Inc., 5.88%, 6/1/27, | | | | |
| Callable 6/1/22 @ 102.94(a)(d) | | 175,000 | | 166,906 |
| CommScope Finance LLC, | | | | |
| 6.00%, 3/1/26, Callable 3/1/22 | | | | |
| @ 103.00(a)(d) | | 124,000 | | 127,410 |
| CommScope Finance LLC, | | | | |
| 8.25%, 3/1/27, Callable 3/1/22 | | | | |
| @ 104.13(a)(d) | | 75,000 | | 71,042 |
| Continental Resources, 4.90%, | | | | |
| 6/1/44, Callable 12/1/43 | | | | |
| @ 100.00(a) | | 110,000 | | 108,901 |
| Crestwood Midstream Partners LP/ | | | | |
| Crestwood Midstream Finance | | | | |
| Corp., 5.63%, 5/1/27, Callable | | | | |
| 5/1/22 @ 102.81(a)(d) | | 39,000 | | 39,245 |
| CSC Holdings LLC, 5.25%, 6/1/24 | | 55,000 | | 59,263 |
| CSC Holdings LLC, 5.38%, 2/1/28, | | | | |
| Callable 2/1/23 @ 102.69(a)(d) | | 200,000 | | 211,500 |
| CSX Corp., 2.60%, 11/1/26, Callable | | | | |
| 8/1/26 @ 100.00(a) | | 100,000 | | 101,869 |
| CSX Corp., 4.30%, 3/1/48, Callable | | | | |
| 9/1/47 @ 100.00(a) | | 40,000 | | 45,078 |
| CSX Corp., 4.75%, 11/15/48, Callable | | | | |
| 5/15/48 @ 100.00(a) | | 25,000 | | 30,393 |
| CyrusOne LP/CyrusOne Finance | | | | |
| Corp., 5.38%, 3/15/27, Callable | | | | |
| 3/15/22 @ 102.69(a) | | 20,000 | | 21,375 |
| DCP Midstream LLC, 8.13%, | | | | |
| 8/16/30 | | 55,000 | | 67,513 |
| DCP Midstream Partners, 7.37% | | | | |
| (US0003M + 515 bps), Callable | | | | |
| 12/15/22 @ 100.00(a)(b)(c) | | 40,000 | | 38,500 |
| Dell International LLC/EMC Corp., | | | | |
| 4.90%, 10/1/26, Callable 8/1/26 | | | | |
| @ 100.00(a)(d) | | 200,000 | | 216,984 |
| Dell, Inc., 7.10%, 4/15/28 | | 28,000 | | 32,410 |
| Diamond 1 Finance/Diamond 2, | | | | |
| 5.88%, 6/15/21, Callable 11/21/19 | | | | |
| @ 101.47(a)(d) | | 4,000 | | 4,063 |
| Diamond 1 Finance/Diamond 2, | | | | |
| 6.02%, 6/15/26, Callable 3/15/26 | | | | |
| @ 100.00(a)(d) | | 50,000 | | 57,062 |
| Diamond Sports Group LLC/ | | | | |
| Diamond Sports Finance Co., | | | | |
| 5.38%, 8/15/26, Callable 8/15/22 | | | | |
| @ 102.69(a)(d) | | 185,000 | | 193,093 |
| See notes to financial statements. | HSBC FAMILY OF FUNDS 19 |
| HSBC STRATEGIC INCOME FUND |
| Schedule of Portfolio Investments—as of October 31, 2019 (continued) |
| Corporate Bonds, continued |
| | | | | |
| | Principal | | |
| | Amount ($) | | Value ($) |
| United States, continued | | | | |
| Diamond Sports Group LLC/ | | | | |
| Diamond Sports Finance Co., | | | | |
| 6.63%, 8/15/27, Callable 8/15/22 | | | | |
| @ 103.31(a)(d) | | 185,000 | | 190,550 |
| Diamondback Energy, Inc., 4.75%, | | | | |
| 11/1/24, Callable 12/6/19 | | | | |
| @ 103.56(a) | | 12,000 | | 12,405 |
| Diamondback Energy, Inc., 5.38%, | | | | |
| 5/31/25, Callable 5/31/20 | | | | |
| @ 104.03(a) | | 27,000 | | 28,215 |
| Discover Bank, 3.45%, 7/27/26, | | | | |
| Callable 4/27/26 @ 100.00(a) | | 250,000 | | 259,444 |
| Discover Financial Services, | | | | |
| 3.95%, 11/6/24, Callable 8/6/24 | | | | |
| @ 100.00(a) | | 100,000 | | 106,510 |
| Eagle Holding Co. II LLC, 7.75%, | | | | |
| 5/15/22, Callable 12/6/19 | | | | |
| @ 101.00(a)(d) | | 100,000 | | 101,500 |
| Embarq Corp., 8.00%, 6/1/36 | | 150,000 | | 148,499 |
| Enable Midstream Partners LP, | | | | |
| 4.95%, 5/15/28, Callable 2/15/28 | | | | |
| @ 100.00(a) | | 245,000 | | 250,936 |
| Energy Transfer Partners LP, 3.60%, | | | | |
| 2/1/23, Callable 11/1/22 | | | | |
| @ 100.00(a) | | 100,000 | | 102,839 |
| Energy Transfer Partners LP, | | | | |
| 5.30%, 4/15/47, Callable 10/15/46 | | | | |
| @ 100.00(a) | | 25,000 | | 26,454 |
| Energy Transfer Partners LP, 6.00%, | | | | |
| 6/15/48, Callable 12/15/47 | | | | |
| @ 100.00(a) | | 25,000 | | 28,924 |
| Energy Transfer Partners LP, 6.25% | | | | |
| (US0003M + 418 bps), Callable | | | | |
| 2/15/23 @ 100.00(a)(b)(c) | | 50,000 | | 46,500 |
| EnLink Midstream Partners LP, | | | | |
| 5.45%, 6/1/47, Callable 12/1/46 | | | | |
| @ 100.00(a) | | 80,000 | | 61,200 |
| EnLink Midstream Partners LP, 6.00% | | | | |
| (US0003M + 411 bps), Callable | | | | |
| 12/15/22 @ 100.00(a)(b)(c) | | 51,000 | | 35,027 |
| Enterprise Products Operating | | | | |
| LLC, 5.25% (US0003M + 303 | | | | |
| bps), 8/16/77, Callable 8/16/27 | | | | |
| @ 100.00(a)(c) | | 35,000 | | 35,954 |
| Enterprise Products Operating | | | | |
| LLC, 5.38% (US0003M + 257 | | | | |
| bps), 2/15/78, Callable 2/15/28 | | | | |
| @ 100.00(a)(c) | | 30,000 | | 29,475 |
| EPR Properties, 4.50%, 6/1/27, | | | | |
| Callable 3/1/27 @ 100.00(a) | | 35,000 | | 37,485 |
| EPR Properties, 4.75%, 12/15/26, | | | | |
| Callable 9/15/26 @ 100.00(a) | | 100,000 | | 108,946 |
| EPR Properties, 4.95%, 4/15/28, | | | | |
| Callable 1/15/28 @ 100.00(a) | | 35,000 | | 38,430 |
| Equinix, Inc., 5.88%, 1/15/26, Callable | | | | |
| 1/15/21 @ 102.94(a) | | 200,000 | | 212,440 |
| Fifth Third Bancorp, 5.23% | | | | |
| (US0003M + 313 bps), Callable | | | | |
| 12/6/19 @ 100.00(a)(b)(c) | | 50,000 | | 50,063 |
| Ford Motor Credit Co. LLC, 5.11%, | | | | |
| 5/3/29, Callable 2/3/29 | | | | |
| @ 100.00(a) | | 500,000 | | 506,296 |
| Fortune Brands Home & Security, | | | | |
| Inc., 4.00%, 9/21/23, Callable | | | | |
| 8/21/23 @ 100.00(a) | | 35,000 | | 37,061 |
| Fox Corp., 4.71%, 1/25/29, Callable | | | | |
| 10/25/28 @ 100.00(a)(d) | | 225,000 | | 256,120 |
| Freeport-McMoRan, Inc., 5.00%, | | | | |
| 9/1/27, Callable 9/1/22 | | | | |
| @ 102.50(a) | | 246,000 | | 251,228 |
| General Motors Acceptance Corp., | | | | |
| 8.00%, 11/1/31 | | 200,000 | | 279,500 |
| General Motors Financial Co., Inc., | | | | |
| 3.34% (US0003M + | | | | |
| 110 bps), 11/6/21(c) | | 40,000 | | 40,090 |
| General Motors Financial Co., Inc., | | | | |
| 3.55%, 7/8/22 | | 300,000 | | 307,764 |
| General Motors Financial Co., Inc., | | | | |
| 4.35%, 1/17/27, Callable 10/17/26 | | | | |
| @ 100.00(a) | | 80,000 | | 82,506 |
| Genesis Energy LP, 5.63%, 6/15/24, | | | | |
| Callable 12/6/19 @ 102.81(a) | | 30,000 | | 27,975 |
| Genesis Energy LP, 6.75%, 8/1/22, | | | | |
| Callable 12/6/19 @ 101.69(a) | | 23,000 | | 23,115 |
| Go Daddy Operating Co. LLC/GD | | | | |
| Finance Co., Inc., 5.25%, 12/1/27, | | | | |
| Callable 6/1/22 @ 102.63(a)(d) | | 100,000 | | 106,000 |
| Goldman Sachs Group, Inc., 4.22% | | | | |
| (US0003M + 130 bps), 5/1/29, | | | | |
| Callable 5/1/28 @ 100.00(a)(c) | | 40,000 | | 43,766 |
| Gray Television, Inc., 7.00%, 5/15/27, | | | | |
| Callable 5/15/22 @ 105.25(a)(d) | | 21,000 | | 22,980 |
| Greif, Inc., 6.50%, 3/1/27, Callable | | | | |
| 3/1/22 @ 103.25(a)(d) | | 374,000 | | 402,050 |
| Gulfport Energy Corp., 6.38%, | | | | |
| 5/15/25, Callable 5/15/20 | | | | |
| @ 104.78(a) | | 136,000 | | 82,280 |
| Gulfport Energy Corp., 6.00%, | | | | |
| 10/15/24, Callable 12/6/19 | | | | |
| @ 104.50(a) | | 25,000 | | 16,063 |
| HCA, Inc., 4.13%, 6/15/29, Callable | | | | |
| 3/15/29 @ 100.00(a) | | 65,000 | | 68,896 |
| HCA, Inc., 4.50%, 2/15/27, Callable | | | | |
| 8/15/26 @ 100.00(a) | | 50,000 | | 53,991 |
| HCA, Inc., 5.50%, 6/15/47, Callable | | | | |
| 12/15/46 @ 100.00(a) | | 35,000 | | 39,845 |
| HCP, Inc., 3.25%, 7/15/26, Callable | | | | |
| 5/15/26 @ 100.00(a) | | 60,000 | | 62,557 |
| HealthSouth Corp., 5.75%, 11/1/24, | | | | |
| Callable 12/6/19 @ 100.96(a) | | 30,000 | | 30,338 |
| Herc Holdings, Inc., 5.50%, 7/15/27, | | | | |
| Callable 7/15/22 @ 102.75(a)(d) | | 180,000 | | 186,525 |
| Hillenbrand., Inc., 4.50%, 9/15/26, | | | | |
| Callable 7/15/26 @ 100.00(a) | | 300,000 | | 309,512 |
| Host Hotels & Resorts LP, 4.50%, | | | | |
| 2/1/26, Callable 11/1/25 | | | | |
| @ 100.00(a) | | 50,000 | | 54,367 |
| 20 HSBC FAMILY OF FUNDS | See notes to financial statements. |
| HSBC STRATEGIC INCOME FUND |
| Schedule of Portfolio Investments—as of October 31, 2019 (continued) |
| Corporate Bonds, continued |
| |
| | Principal | | |
| | Amount ($) | | Value ($) |
| United States, continued | | | | | |
| IQVIA, Inc., 2.25%, 1/15/28, Callable | | | | | |
| 7/15/22 @ 101.13(a)(d) | | EUR | 100,000 | | 113,917 |
| Iron Mountain, Inc., 4.88%, 9/15/29, | | | | | |
| Callable 9/15/24 @ 102.44(a)(d) | | | 55,000 | | 56,306 |
| Jabil, Inc., 3.95%, 1/12/28, Callable | | | | | |
| 10/12/27 @ 100.00(a) | | | 183,000 | | 187,530 |
| Jacobs Entertainment, Inc., | | | | | |
| 7.88%, 2/1/24, Callable 2/1/20 | | | | | |
| @ 105.91(a)(d) | | | 150,000 | | 159,375 |
| JBS USA LLC/JBS USA Finance LLC, | | | | | |
| 5.50%, 1/15/30, Callable 1/15/25 | | | | | |
| @ 102.75(a)(d) | | | 55,000 | | 59,263 |
| JBS USA LLC/JBS USA Finance LLC, | | | | | |
| 6.50%, 4/15/29, Callable 4/15/24 | | | | | |
| @ 103.25(a)(d) | | | 180,000 | | 200,255 |
| JPMorgan Chage & Co., 6.10% | | | | | |
| (US0003M + 333 bps), Callable | | | | | |
| 10/1/24 @ 100.00(a)(b)(c) | | | 40,000 | | 43,913 |
| Kennametal, Inc., 4.63%, 6/15/28, | | | | | |
| Callable 3/15/28 @ 100.00(a) | | | 335,000 | | 356,626 |
| Kinder Morgan, Inc., 3.05%, | | | | | |
| 12/1/19 | | | 150,000 | | 150,102 |
| KLA- Tencor Corp., 5.00%, 3/15/49, | | | | | |
| Callable 9/15/48 @ 100.00(a) | | | 55,000 | | 65,961 |
| LABL Escrow Issuer LLC, 6.75%, | | | | | |
| 7/15/26, Callable 7/15/22 | | | | | |
| @ 103.38(a)(d) | | | 269,000 | | 278,414 |
| Lam Research Corp., 3.75%, 3/15/26, | | | | | |
| Callable 1/15/26 @ 100.00(a) | | | 250,000 | | 269,945 |
| Las Vegas Sands Corp., 3.50%, | | | | | |
| 8/18/26, Callable 6/18/26 | | | | | |
| @ 100.00(a) | | | 100,000 | | 101,930 |
| Lennar Corp., 4.88%, 12/15/23, | | | | | |
| Callable 9/15/23 @ 100.00(a) | | | 20,000 | | 21,400 |
| Level 3 Financing, Inc., 4.63%, | | | | | |
| 9/15/27, Callable 9/15/22 | | | | | |
| @ 102.31(a)(d) | | | 183,000 | | 185,974 |
| Level 3 Financing, Inc., 5.38%, | | | | | |
| 5/1/25, Callable 5/1/20 | | | | | |
| @ 102.69(a) | | | 150,000 | | 155,063 |
| Lowe’s Cos., Inc., 3.65%, 4/5/29, | | | | | |
| Callable 1/5/29 @ 100.00(a) | | | 300,000 | | 322,804 |
| Manitowoc Co., Inc., 9.00%, 4/1/26, | | | | | |
| Callable 4/1/22 @ 104.50(a)(d) | | | 34,000 | | 32,683 |
| Match Group, Inc., 5.63%, 2/15/29, | | | | | |
| Callable 2/15/24 @ 102.81(a)(d) | | | 166,000 | | 177,828 |
| MGM Growth/MGM Finance, 4.50%, | | | | | |
| 9/1/26, Callable 6/1/26 | | | | | |
| @ 100.00(a) | | | 25,000 | | 26,563 |
| Morgan Stanley, 4.35%, | | | | | |
| 9/8/26, MTN | | | 250,000 | | 272,410 |
| MPT Operating Partnership LP, | | | | | |
| 4.63%, 8/1/29, Callable 8/1/24 | | | | | |
| @ 102.31(a) | | | 103,000 | | 107,443 |
| MPT Operating Partnership LP, | | | | | |
| 5.00%, 10/15/27, Callable 10/15/22 | | | | | |
| @ 102.50(a) | | | 53,000 | | 55,915 |
| MTS Systems Corp., 5.75%, 8/15/27, | | | | | |
| Callable 8/15/22 @ 102.88(a)(d) | | | 41,000 | | 42,948 |
| Navient Corp., 5.88%, 10/25/24 | | | 250,000 | | 255,625 |
| Navient Corp., 6.50%, 6/15/22 | | | 150,000 | | 160,500 |
| NRG Energy, Inc., 4.45%, 6/15/29, | | | | | |
| Callable 3/15/29 @ 100.00(a)(d) | | | 70,000 | | 74,243 |
| NRG Energy, Inc., 5.25%, 6/15/29, | | | | | |
| Callable 6/15/24 @ 102.63(a)(d) | | | 90,000 | | 96,525 |
| Olin Corp., 5.00%, 2/1/30, Callable | | | | | |
| 2/1/24 @ 102.50(a) | | | 250,000 | | 246,249 |
| Olin Corp., 5.63%, 8/1/29, Callable | | | | | |
| 8/1/24 @ 102.81(a) | | | 136,000 | | 141,205 |
| Omega Healthcare Investors, Inc., | | | | | |
| 4.38%, 8/1/23, Callable 6/1/23 | | | | | |
| @ 100.00(a) | | | 25,000 | | 26,549 |
| Owens-Brockway Packaging, Inc., | | | | | |
| 5.00%, 1/15/22(d) | | | 50,000 | | 51,625 |
| Owens-Brockway Packaging, Inc., | | | | | |
| 6.38%, 8/15/25(d) | | | 226,000 | | 237,865 |
| Panther BF Aggregator 2 LP, | | | | | |
| 6.25%, 5/15/26, Callable 5/15/22 | | | | | |
| @ 103.13(a)(d) | | | 244,000 | | 257,956 |
| PBF Holding Co. LLC, 7.00%, | | | | | |
| 11/15/23, Callable 12/6/19 | | | | | |
| @ 103.50(a) | | | 25,000 | | 25,750 |
| PBF Holding Co. LLC, 7.25%, | | | | | |
| 6/15/25, Callable 6/15/20 | | | | | |
| @ 105.44(a) | | | 38,000 | | 39,710 |
| Performance Food Group, Inc., | | | | | |
| 5.50%, 10/15/27, Callable 10/15/22 | | | | | |
| @ 102.75(a)(d) | | | 36,000 | | 38,070 |
| PetSmart, Inc., 5.88%, 6/1/25, | | | | | |
| Callable 6/1/20 @ 102.94(a)(d) | | | 150,000 | | 147,750 |
| Plains All American Pipeline LP, 6.12% | | | | | |
| (US0003M + 411 bps), Callable | | | | | |
| 11/15/22 @ 100.00(a)(b)(c) | | | 13,000 | | 12,123 |
| Plastipak Holdings, Inc., 6.25%, | | | | | |
| 10/15/25, Callable 10/15/20 | | | | | |
| @ 103.13(a)(d) | | | 159,000 | | 131,175 |
| PPL Capital Funding, Inc., 4.00%, | | | | | |
| 9/15/47, Callable 3/15/47 | | | | | |
| @ 100.00(a) | | | 50,000 | | 51,960 |
| Prime Security Services Borrower | | | | | |
| LLC/Prime Finance, Inc., | | | | | |
| 5.25%, 4/15/24(d) | | | 157,000 | | 160,729 |
| Prudential Financial, Inc., 5.38% | | | | | |
| (US0003M + 303 bps), 5/15/45, | | | | | |
| Callable 5/15/25 @ 100.00(a)(c) | | | 300,000 | | 326,911 |
| PulteGroup, Inc., 5.50%, 3/1/26, | | | | | |
| Callable 12/1/25 @ 100.00(a) | | | 166,000 | | 185,962 |
| Rayonier AM Products, Inc., | | | | | |
| 5.50%, 6/1/24, Callable 12/6/19 | | | | | |
| @ 102.75(a)(d) | | | 124,000 | | 85,870 |
| Refinitiv US Holdings, Inc., 6.25%, | | | | | |
| 5/15/26, Callable 11/15/21 | | | | | |
| @ 103.13(a)(d) | | | 136,000 | | 147,730 |
| Refinitiv US Holdings, Inc., 8.25%, | | | | | |
| 11/15/26, Callable 11/15/21 | | | | | |
| @ 104.13(a)(d) | | | 204,000 | | 228,990 |
| Rockies Express Pipeline LLC, | | | | | |
| 4.95%, 7/15/29, Callable 4/15/29 | | | | | |
| @ 100.00(a)(d) | | | 70,000 | | 69,754 |
| See notes to financial statements. | HSBC FAMILY OF FUNDS 21 |
| HSBC STRATEGIC INCOME FUND |
| Schedule of Portfolio Investments—as of October 31, 2019 (continued) |
| Corporate Bonds, continued |
| |
| | Principal | | |
| | Amount ($) | | Value ($) |
| United States, continued | | | | | |
| Sabine Pass Liquefaction LLC, | | | | | |
| 5.63%, 3/1/25, Callable 12/1/24 | | | | | |
| @ 100.00(a) | | | 35,000 | | 39,156 |
| Sabra Health Care LP/Sabra Capital | | | | | |
| Corp., 4.80%, 6/1/24, Callable | | | | | |
| 5/1/24 @ 100.00(a) | | | 50,000 | | 52,665 |
| Sabre Global, Inc., 5.25%, 11/15/23, | | | | | |
| Callable 12/6/19 @ 102.63(a)(d) | | | 32,000 | | 32,800 |
| Santander Holdings USA, Inc., 3.50%, | | | | | |
| 6/7/24, Callable 5/7/24 | | | | | |
| @ 100.00(a) | | | 225,000 | | 231,798 |
| SBA Communications Corp., | | | | | |
| 4.88%, 9/1/24, Callable 12/6/19 | | | | | |
| @ 103.66(a) | | | 20,000 | | 20,775 |
| Scientific Games International, Inc., | | | | | |
| 5.00%, 10/15/25, Callable 10/15/20 | | | | | |
| @ 103.75(a)(d) | | | 150,000 | | 154,500 |
| Senior Housing Properties Trust, | | | | | |
| 4.75%, 2/15/28, Callable 8/15/27 | | | | | |
| @ 100.00(a) | | | 230,000 | | 237,102 |
| Service Corp. International, 4.63%, | | | | | |
| 12/15/27, Callable 12/15/22 | | | | | |
| @ 102.31(a) | | | 65,000 | | 67,925 |
| Service Corp. International, 5.13%, | | | | | |
| 6/1/29, Callable 6/1/24 | | | | | |
| @ 102.56(a) | | | 55,000 | | 58,575 |
| Sirius XM Radio, Inc., 5.50%, 7/1/29, | | | | | |
| Callable 7/1/24 @ 102.75(a)(d) | | | 183,000 | | 197,754 |
| Spectra Energy Partners, 4.50%, | | | | | |
| 3/15/45, Callable 9/15/44 | | | | | |
| @ 100.00(a) | | | 15,000 | | 16,430 |
| Sprint Corp., 7.63%, 3/1/26, Callable | | | | | |
| 11/1/25 @ 100.00(a) | | | 75,000 | | 82,969 |
| Sprint Corp., 7.88%, 9/15/23 | | | 90,000 | | 99,338 |
| Sprint Spectrum/Spec I, | | | | | |
| 4.74%, 3/20/25(d) | | | 300,000 | | 319,877 |
| Sunoco Logistics Partners Operations | | | | | |
| LP, 5.40%, 10/1/47, Callable 4/1/47 | | | | | |
| @ 100.00(a) | | | 40,000 | | 42,948 |
| Sunoco LP/Sunoco Finance Corp., | | | | | |
| 6.00%, 4/15/27, Callable 4/15/22 | | | | | |
| @ 103.00(a) | | | 17,000 | | 17,850 |
| Synchrony Financial, 3.70%, 8/4/26, | | | | | |
| Callable 5/4/26 @ 100.00(a) | | | 30,000 | | 30,932 |
| Synovus Financial Corp., 3.13%, | | | | | |
| 11/1/22, Callable 10/1/22 | | | | | |
| @ 100.00(a) | | | 20,000 | | 20,308 |
| Talen Energy Supply LLC, 6.63%, | | | | | |
| 1/15/28, Callable 1/15/23 | | | | | |
| @ 103.31(a)(d) | | | 55,000 | | 53,075 |
| Targa Resources Partners LP, | | | | | |
| 5.00%, 1/15/28, Callable 1/15/23 | | | | | |
| @ 102.50(a) | | | 15,000 | | 14,888 |
| Targa Resources Partners LP, | | | | | |
| 5.25%, 5/1/23, Callable 12/6/19 | | | | | |
| @ 100.88(a) | | | 30,000 | | 30,113 |
| Tegna, Inc., 5.00%, 9/15/29, Callable | | | | | |
| 9/15/24 @ 102.50(a)(d) | | | 125,000 | | 126,719 |
| Tenet Healthcare Corp., 5.13%, | | | | | |
| 11/1/27, Callable 11/1/22 | | | | | |
| @ 102.56(a)(d) | | | 94,000 | | 97,992 |
| Tenneco, Inc., 5.00%, 7/15/26, | | | | | |
| Callable 7/15/21 @ 102.50(a) | | | 3,000 | | 2,385 |
| The Chemours Co., 5.38%, 5/15/27, | | | | | |
| Callable 2/15/27 @ 100.00(a) | | | 25,000 | | 22,215 |
| The Chemours Co., 7.00%, 5/15/25, | | | | | |
| Callable 5/15/20 @ 103.50(a) | | | 134,000 | | 129,310 |
| The Goldman Sachs Group, Inc., | | | | | |
| 4.75%, 10/12/21 | | EUR | 100,000 | | 121,275 |
| Time Warner Cable, Inc., 4.50%, | | | | | |
| 9/15/42, Callable 3/15/42 | | | | | |
| @ 100.00(a) | | | 100,000 | | 99,662 |
| Truck Hero, Inc., 8.50%, 4/21/24, | | | | | |
| Callable 4/30/21 @ 104.25(a)(d) | | | 143,000 | | 141,928 |
| United Rentals, Inc., 6.50%, 12/15/26, | | | | | |
| Callable 12/15/21 @ 103.25(a) | | | 127,000 | | 137,478 |
| Vistra Operations Co. LLC, 5.00%, | | | | | |
| 7/31/27, Callable 7/31/22 | | | | | |
| @ 102.50(a)(d) | | | 105,000 | | 108,675 |
| Warrior Met Coal, Inc., 8.00%, | | | | | |
| 11/1/24, Callable 11/1/20 | | | | | |
| @ 104.00(a)(d) | | | 16,000 | | 16,320 |
| WellCare Health Plans, Inc., | | | | | |
| 5.38%, 8/15/26, Callable 8/15/21 | | | | | |
| @ 104.03(a)(d) | | | 50,000 | | 53,188 |
| Wells Fargo & Co., 5.89% (US0003M | | | | | |
| + 377 bps), Callable 12/15/19 | | | | | |
| @ 100.00(a)(b)(c) | | | 27,000 | | 27,338 |
| Welltower, Inc., 4.13%, 3/15/29, | | | | | |
| Callable 12/15/28 @ 100.00(a) | | | 30,000 | | 32,863 |
| Welltower, Inc., 4.95%, 9/1/48, | | | | | |
| Callable 3/1/48 @ 100.00(a) | | | 35,000 | | 42,737 |
| WRKCo, Inc., 3.90%, 6/1/28, Callable | | | | | |
| 3/1/28 @ 100.00(a) | | | 70,000 | | 75,032 |
| WRKCo, Inc., 4.65%, 3/15/26, | | | | | |
| Callable 1/15/26 @ 100.00(a) | | | 50,000 | | 55,260 |
| Yum! Brands, Inc., 4.75%, 1/15/30, | | | | | |
| Callable 10/15/29 @ 100.00(a)(d) | | | 73,000 | | 76,559 |
| Zayo Group LLC/Zayo Capital LLC, | | | | | |
| 6.00%, 4/1/23, Callable 12/6/19 | | | | | |
| @ 103.00(a) | | | 50,000 | | 51,426 |
| | | | | 20,092,191 |
| TOTAL CORPORATE BONDS | | | | | |
| (COST $19,436,977) | | | | | 20,092,191 |
| | | | | | |
| U.S. Treasury Obligations — 4.5% | | | | | |
| | | | | | |
| U.S. Treasury Bills — 1.1% | | | | | |
| 1.53%, 3/26/20(f) | | | 325,000 | | 322,982 |
| U.S. Treasury Bonds — 0.5% | | | | | |
| 2.88%, 5/15/49 | | | 26,000 | | 29,926 |
| 3.38%, 11/15/48 | | | 86,000 | | 108,216 |
| | | | | 138,142 |
| 22 HSBC FAMILY OF FUNDS | See notes to financial statements. |
| HSBC STRATEGIC INCOME FUND |
| Schedule of Portfolio Investments—as of October 31, 2019 (continued) |
| U.S. Treasury Obligations, continued |
| |
| | Principal | | | |
| | Amount ($) | | Value ($) |
| U.S. Treasury Notes — 2.9% | | | | | |
| 1.25%, 8/31/24 | | 16,000 | | | 15,804 |
| 1.63%, 8/15/29 | | 29,000 | | | 28,827 |
| 2.38%, 5/15/29 | | 492,000 | | | 521,693 |
| 2.50%, 2/28/21 | | 100,000 | | | 101,176 |
| 2.63%, 2/15/29 | | 186,000 | | | 201,083 |
| | | | | 868,583 |
| TOTAL U. S. TREASURY OBLIGATIONS | | | | | |
| (COST $1,290,314) | | | | | 1,329,707 |
| |
| Investment Companies — 0.3% |
| |
| | Shares | | | |
| Northern Institutional Government | | | | | |
| Assets Portfolio, Institutional | | | | | |
| Shares, 2.26%(g) | | 84,585 | | | 84,585 |
| TOTAL INVESTMENT COMPANIES | | | | | |
| (COST $84,585) | | | | | 84,585 |
| TOTAL INVESTMENTS | | | | | |
| IN SECURITIES | | | | | |
| (COST $28,684,323) — 98.3% | | | | | 29,311,196 |
| Other Assets (Liabilities) - 1.7% | | | | | 521,994 |
| NET ASSETS - 100% | | | | $ | 29,833,190 |
| † | The principal amount is disclosed in local currency and the value is disclosed in U.S. Dollars. |
| (a) | Represents next call date. Additional subsequent call dates and amounts may apply to this security. |
| (b) | Securities are perpetual and, thus, do not have a predetermined maturity date. |
| (c) | Floating or variable rate security linked to the referenced benchmark. The rate presented represents the rate in effect on October 31, 2019. These securities are deemed to have a maturity remaining until the next adjustment of the interest rate or the longer of the demand period or time to the next readjustment. |
| (d) | Rule 144A security or other security which is restricted as to resale to institutional investors. This security has been deemed liquid by the Investment Adviser based on procedures approved by the Board of Trustees. |
| (e) | Defaulted security. |
| (f) | Rate presented represents the effective yield at time of purchase. |
| (g) | The rate represents the annualized one day yield that was in effect on October 31, 2019. |
NM Not meaningful, amount is less than 0.05%. |
bps - Basis Points
EUR - Euro
EUR003M - 3 Month EUR LIBOR
EUSA12 - Euro 12 Year Swap Rate
H15T5Y - 5 Year Treasury Constant Maturity Rate
MTN - Medium Term Note
ULC - Unlimited Liability Co.
USISDA05 - 5 Year ICE Swap Rate
US0003M - 3 Month US Dollar LIBOR
| See notes to financial statements. | HSBC FAMILY OF FUNDS 23 |
| HSBC STRATEGIC INCOME FUND |
| Schedule of Portfolio Investments—as of October 31, 2019 (continued) |
The Fund invested, as a percentage of net assets at value, in the following industries, as of October 31, 2019:
| | Percentage of |
| Industry | | Net Assets at Value (%)* |
| Oil, Gas & Consumable Fuels | | | 10.8 | |
| Consumer Finance | | | 10.4 | |
| Banks | | | 7.3 | |
| Containers & Packaging | | | 5.2 | |
| Equity Real Estate Investment Trusts | | | 4.8 | |
| Media | | | 4.5 | |
| U.S. Treasury Obligation | | | 4.5 | |
| Chemicals | | | 3.8 | |
| Metals & Mining | | | 3.7 | |
| Hotels, Restaurants & Leisure | | | 3.6 | |
| Sovereign Bond | | | 3.1 | |
| Diversified Financial Services | | | 2.8 | |
| Wireless Telecommunication Services | | | 2.4 | |
| Machinery | | | 2.3 | |
| Trading Companies & Distributors | | | 2.0 | |
| Auto Components | | | 1.9 | |
| Electric Utilities | | | 1.7 | |
| IT Services | | | 1.6 | |
| Specialty Retail | | | 1.6 | |
| Diversified Telecommunication Services | | | 1.5 | |
| Aerospace & Defense | | | 1.5 | |
| Capital Markets | | | 1.5 | |
| Thrifts & Mortgage Finance | | | 1.4 | |
| Health Care Providers & Services | | | 1.4 | |
| Semiconductors & | | | | |
| Semiconductor Equipment | | | 1.1 | |
| Insurance | | | 1.1 | |
| Technology Hardware, Storage | | | | |
| & Peripherals | | | 1.0 | |
| Food Products | | | 0.9 | |
| Electronic Equipment, Instruments | | | | |
| & Components | | | 0.8 | |
| Household Durables | | | 0.7 | |
| Paper & Forest Products | | | 0.7 | |
| Industrial Conglomerates | | | 0.7 | |
| Communications Equipment | | | 0.7 | |
| Interactive Media & Services | | | 0.6 | |
| Road & Rail | | | 0.6 | |
| Independent Power and Renewable | | | 0.6 | |
| Pharmaceuticals | | | 0.6 | |
| Commercial Services & Supplies | | | 0.5 | |
| Life Sciences Tools & Services | | | 0.5 | |
| Diversified Consumer Services | | | 0.4 | |
| Building Products | | | 0.3 | |
| Investment Companies | | | 0.3 | |
| Biotechnology | | | 0.3 | |
| Independent Power and Renewable | | | | |
| Electricity Producers | | | 0.2 | |
| Food & Staples Retailing | | | 0.1 | |
| Software | | | 0.1 | |
| Household Products | | | 0.1 | |
| Energy Equipment & Services | | | 0.1 | |
| Total | | | 98.3 | |
____________________
| * | The percentage shown for each investment category reflects the value of investments in that category as a percentage of net assets. Figures in the above table may not sum to 100% due to the exclusion of other assets and liabilities. The above table depicts the Fund’s investments but may not represent the Fund’s market exposure due to the exclusion of certain derivatives, if any, as listed in the Schedule of Portfolio Investments. |
| 24 | HSBC FAMILY OF FUNDS | See notes to financial statements. |
| HSBC STRATEGIC INCOME FUND |
| Schedule of Portfolio Investments—as of October 31, 2019 (continued) |
Centrally Cleared Credit Default Swap Agreements - Buy Protection(a)
| | | | | | Implied | | | | | | | | | Upfront | | | | | |
| | | | | | Credit | | | | | | | | | Premiums | | Unrealized |
| | | | | | Spread at | | | | Notional | | | | | Paid/ | | Appreciation/ |
| | Pay Fixed | | Payment | | October 31, | | Expiration | | Amount | | Value | | (Received) | | (Depreciation) |
| Underlying Instrument | | Rate (%) | | Frequency | | 2019 (%)(b) | | Date | | ($)(c) | | ($) | | ($) | | ($) |
| CDX N.A. High Yield Index, | | | | | | | | | | | | | | | | | | | | | | | |
| Series 33 | | 5.00 | | Quarterly | | 3.40 | | 12/20/24 | | 1,050,000 | | (74,288 | ) | | | (62,459 | ) | | | | (11,829 | ) | |
| CDX N.A. Investment Grade Index, | | | | | | | | | | | | | | | | | | | | | | | |
| Series 33 | | 1.00 | | Quarterly | | 0.55 | | 12/20/24 | | 12,500,000 | | (271,414 | ) | | | (255,474 | ) | | | | (15,940 | ) | |
| | | | | | | | | | | | (345,702 | ) | | | (317,933 | ) | | | | (27,769 | ) | |
| (a) | When a credit event occurs as defined under the terms of the swap agreement, the Fund as a seller of credit protection will either (i) pay to the buyer of protection an amount equal to the par value of the defaulted reference entity and take delivery of the reference entity or (ii) pay a net amount equal to the par value of the defaulted reference entity less its recovery value. Alternatively, the Fund as a buyer of credit protection will either (i) receive from the seller of protection an amount equal to the par value of the defaulted reference entity and deliver the reference entity to the seller or (ii) receive a net amount equal to the par value of the defaulted reference entity less its recovery value. |
| (b) | Implied credit spread, represented in absolute terms, utilized in determining the fair value of the credit default swap agreements as of period end serve as an indicator of the current status of the payment/performance risk and represents the likelihood or risk of default for the credit derivative. The implied credit spread of a referenced entity reflects the cost of buying/selling protection and may include upfront or daily payments required to be made to enter into the agreement. Generally, wider credit spreads represent a perceived deterioration of the referenced entity’s credit soundness and a greater likelihood or risk of default or other credit event occurring as defined under the terms of the swap agreement. |
| (c) | The notional amount represents the maximum potential amount of future payments that the Fund may receive as a buyer of credit protection if a credit event occurs, as defined under the terms of the swap agreement. Alternatively, the notional amount represents the maximum potential amount of payment the Fund could be required to make as a seller of credit protection if a credit event occurs, as defined under the terms of the swap agreement. |
Forward Foreign Currency Exchange Contracts - Short Contracts
| | | | | | | | | | Net Unrealized |
| | | | | | | | | | Appreciation/ |
| Description and amount of | | Description and amount | | | | Settlement | | (Depreciation) |
| currency to be purchased | | of currency to be sold | | Counterparty | | Date | | ($) |
| U.S. Dollar | 1,580,089 | | European Euro | 1,445,000 | | UBS AG | | 11/4/19 | | | | (31,791 | ) | |
| U.S. Dollar | 80,485 | | European Euro | 72,020 | | Goldman Sachs | | 12/3/19 | | | | (8 | ) | |
| | | | | | | | | | | | (31,799 | ) | |
| | | | | | | | | | | | | | | |
Forward Foreign Currency Exchange Contracts - Long Contracts |
| | | | | | | | | | | Net Unrealized |
| | | | | | | | | | Appreciation/ |
| Description and amount of | | Description and amount | | | | Settlement | | (Depreciation) |
| currency to be purchased | | of currency to be sold | | Counterparty | | Date | | ($) |
| European Euro | 45,000 | | U.S. Dollar | 50,184 | | UBS AG | | 11/4/19 | | | | 13 | | |
| | | | | | | | | | | | 13 | | |
| | |
| | | Total unrealized appreciation | | $ | 13 | | |
| | | | Total unrealized depreciation | | | (31,799 | ) | |
| | | | Total net unrealized appreciation/(depreciation) | | $ | (31,786 | ) | |
| See notes to financial statements. | HSBC FAMILY OF FUNDS | 25 |
HSBC FAMILY OF FUNDS
Statements of Assets and Liabilities – as of October 31, 2019
| | HSBC | | HSBC |
| | High Yield | | Strategic Income |
| | Fund | | Fund |
| Assets: | | | | | | | | | | |
| Investment in securities, at value | | | $ | 32,273,558 | | | | $ | 29,311,196 | |
| Foreign currency, at value | | | | 50,029 | | | | | 20,136 | |
| Cash held as collateral at brokers for centrally cleared swaps | | | | — | | | | | 154,076 | |
| Unrealized appreciation on forward foreign currency exchange contracts | | | | — | | | | | 13 | |
| Interest and dividends receivable | | | | 519,137 | | | | | 417,723 | |
| Receivable for investments sold | | | | 57,641 | | | | | 405,592 | |
| Receivable from Investment Adviser | | | | 19,275 | | | | | 12,246 | |
| Variation margin on centrally cleared swap agreements | | | | — | | | | | 8,890 | |
| Prepaid expenses and other assets | | | | 10,858 | | | | | 10,754 | |
| Total Assets | | | | 32,930,498 | | | | | 30,340,626 | |
| Liabilities: | | | | | | | | | | |
| Distributions payable | | | | 20,038 | | | | | 17,008 | |
| Unrealized depreciation on forward foreign currency exchange contracts | | | | 17,674 | | | | | 31,799 | |
| Payable for investments purchased | | | | 87,812 | | | | | 350,567 | |
| Payable for capital shares redeemed | | | | 261 | | | | | 558 | |
| Accrued expenses and other payables: | | | | | | | | | | |
| Administration | | | | 1,073 | | | | | 979 | |
| Shareholder Servicing | | | | 662 | | | | | 194 | |
| Accounting | | | | 8,249 | | | | | 8,967 | |
| Custodian | | | | 2,016 | | | | | 757 | |
| Printing | | | | 7,831 | | | | | 6,622 | |
| Professional | | | | 79,333 | | | | | 79,332 | |
| Transfer Agent | | | | 1,521 | | | | | 1,317 | |
| Trustee | | | | 1,499 | | | | | 1,499 | |
| Other | | | | 5,808 | | | | | 7,837 | |
| Total Liabilities | | | | 233,777 | | | | | 507,436 | |
| Net Assets | | | $ | 32,696,721 | | | | $ | 29,833,190 | |
____________________
Amounts designated as ”—” are $0.00 or have been rounded to $0.00.
| 26 | HSBC FAMILY OF FUNDS | See notes to financial statements. |
HSBC FAMILY OF FUNDS
Statements of Assets and Liabilities – as of October 31, 2019 (continued)
| | HSBC | | HSBC |
| | High Yield | | Strategic Income |
| | Fund | | Fund |
| Composition of Net Assets: | | | | | | | | | | | |
| Paid in capital | | | $ | 33,083,595 | | | | | $ | 28,989,591 | |
| Total distributable earnings/(loss) | | | | (386,874 | ) | | | | | 843,599 | |
| Net Assets | | | $ | 32,696,721 | | | | | $ | 29,833,190 | |
| | | | | | | | | | | | |
| Net Assets: | | | | | | | | | | | |
| Class A Shares | | | $ | 3,252,826 | | | | | $ | 284,838 | |
| Class I Shares | | | | 29,443,895 | | | | | | 29,548,352 | |
| Total | | | $ | 32,696,721 | | | | | $ | 29,833,190 | |
| Shares Outstanding: | | | | | | | | | | | |
| ($ 0.001 par value, unlimited number of shares authorized): | | | | | | | | | | | |
| Class A Shares | | | | 332,919 | | | | | | 27,883 | |
| Class I Shares | | | | 3,002,611 | | | | | | 2,873,969 | |
| Net Asset Value, Offering Price and Redemption Price per share: | | | | | | | | | | | |
| Class A Shares | | | $ | 9.77 | | | | | $ | 10.22 | |
| Class I Shares | | | $ | 9.81 | | | | | $ | 10.28 | |
| Maximum Sales Charge: | | | | | | | | | | | |
| Class A Shares | | | | 3.75% | | | | | | 3.75% | |
| Maximum Offering Price per share | | | | | | | | | | | |
| (Net Asset Value / (100%-maximum sales charge)) | | | | | | | | | | | |
| Class A Shares | | | $ | 10.15 | | | | | $ | 10.62 | |
| Investments in securities, at cost | | | $ | 31,975,198 | | | | | $ | 28,684,323 | |
| Foreign currency, at cost | | | $ | 49,169 | | | | | $ | 19,825 | |
| See notes to financial statements. | HSBC FAMILY OF FUNDS | 27 |
HSBC FAMILY OF FUNDS
Statements of Operations – For the year ended October 31, 2019
| | | | | | | | HSBC |
| | HSBC | | Strategic |
| | High Yield | | Income |
| | Fund | | Fund |
| Investment Income: | | | | | | | | | | | | |
| Interest | | | $ | 1,661,036 | | | | | $ | 1,368,136 | | |
| Dividends | | | | 138,241 | | | | | | 25,633 | | |
| Foreign tax withholding | | | | (582 | ) | | | | | (5,240 | ) | |
| Total Investment Income | | | | 1,798,695 | | | | | | 1,388,529 | | |
| Expenses: | | | | | | | | | | | | |
| Investment Management | | | | 203,128 | | | | | | 185,377 | | |
| Operational Support: | | | | | | | | | | | | |
| Class A Shares | | | | 2,736 | | | | | | 146 | | |
| Administration: | | | | | | | | | | | | |
| Class A Shares | | | | 1,049 | | | | | | 55 | | |
| Class I Shares | | | | 10,929 | | | | | | 10,876 | | |
| Shareholder Servicing: | | | | | | | | | | | | |
| Class A Shares | | | | 6,566 | | | | | | 219 | | |
| Accounting | | | | 82,980 | | | | | | 94,153 | | |
| Compliance Services | | | | 31,392 | | | | | | 31,392 | | |
| Custodian | | | | 10,641 | | | | | | 12,681 | | |
| Printing | | | | 15,778 | | | | | | 12,335 | | |
| Professional | | | | 179,584 | | | | | | 181,771 | | |
| Transfer Agent | | | | 15,047 | | | | | | 13,292 | | |
| Trustee | | | | 80,999 | | | | | | 80,999 | | |
| Registration fees | | | | 31,324 | | | | | | 31,224 | | |
| Other | | | | 30,685 | | | | | | 32,775 | | |
| Total expenses before fee and expense reductions | | | | 702,838 | | | | | | 687,295 | | |
| Fees contractually reduced/reimbursed by Investment Adviser | | | | (450,112 | ) | | | | | (461,092 | ) | |
| Net Expenses | | | | 252,726 | | | | | | 226,203 | | |
| | | | | | | | | | | | | |
| Net Investment Income | | | | 1,545,969 | | | | | | 1,162,326 | | |
| | | | | | | | | | | | | |
| Realized/Unrealized Gains/(Losses) from Investments: | | | | | | | | | | | | |
| Net realized gains/(losses) from investments in securities and foreign | | | | | | | | | | | | |
| currency translations | | | | (460,632 | ) | | | | | 356,698 | | |
| Net realized gains/(losses) from futures contracts | | | | 7,147 | | | | | | 1,305 | | |
| Net realized gains/(losses) from forward foreign currency exchange contracts | | | | 192,505 | | | | | | 260,551 | | |
| Net realized gains/(losses) from swap agreements | | | | 24,384 | | | | | | (25,468 | ) | |
| Change in unrealized appreciation/depreciation on investments in | | | | | | | | | | | | |
| securities and foreign currency translations | | | | 1,224,119 | | | | | | 1,253,995 | | |
| Change in unrealized appreciation/depreciation on futures contracts | | | | 5,726 | | | | | | (1,088 | ) | |
| Change in unrealized appreciation/depreciation on forward foreign currency contracts | | | | (124,879 | ) | | | | | (171,537 | ) | |
| Change in unrealized appreciation/depreciation on swap agreements | | | | (21,488 | ) | | | | | (65,851 | ) | |
| Net realized/unrealized gains/(losses) on investments | | | | 846,882 | | | | | | 1,608,605 | | |
| Change in Net Assets Resulting from Operations | | | $ | 2,392,851 | | | | | $ | 2,770,931 | | |
| 28 | HSBC FAMILY OF FUNDS | See notes to financial statements. |
HSBC FAMILY OF FUNDS
Statements of Changes in Net Assets
| HSBC High | | HSBC Strategic |
| Yield Fund | | Income Fund |
| For the | | For the | | For the | | For the |
| year ended | | year ended | | year ended | | year ended |
| October 31, | | October 31, | | October 31, | | October 31, |
| 2019 | | 2018 | | 2019 | | 2018 |
| Investment Activities: | | | | | | | | | | | | | | | | | | | | | | | |
| Operations: | | | | | | | | | | | | | | | | | | | | | | | |
| Net investment income/(loss) | | $ | 1,545,969 | | | | | $ | 1,377,783 | | | | | $ | 1,162,326 | | | | | $ | 919,439 | | |
| Net realized gains/(losses) from investments | | | (236,596 | ) | | | | | 585,419 | | | | | | 593,086 | | | | | | 405,561 | | |
| Change in unrealized appreciation/depreciation on investments | | | 1,083,478 | | | | | | (2,107,032 | ) | | | | | 1,015,519 | | | | | | (1,922,987 | ) | |
| Change in net assets resulting from operations | | | 2,392,851 | | | | | | (143,830 | ) | | | | | 2,770,931 | | | | | | (597,987 | ) | |
| | | | | | | | | | | | | | | | | | | | | | | | |
| Distributions to shareholders: | | | | | | | | | | | | | | | | | | | | | | | |
| Class A Shares | | | (167,218 | ) | | | | | (107,796 | ) | | | | | (8,530 | ) | | | | | (6,841 | ) | |
| Class I Shares | | | (1,836,512 | ) | | | | | (1,389,290 | ) | | | | | (1,733,815 | ) | | | | | (943,491 | ) | |
| Tax return of capital: | | | | | | | | | | | | | | | | | | | | | | | |
| Class A Shares | | | (7,784 | ) | | | | | — | | | | | | — | | | | | | — | | |
| Class I Shares | | | (85,484 | ) | | | | | — | | | | | | — | | | | | | — | | |
| Change in net assets resulting from distributions to shareholders | | | (2,096,998 | ) | | | | | (1,497,086 | ) | | | | | (1,742,345 | ) | | | | | (950,332 | ) | |
| Change in net assets resulting from capital transactions | | | 2,284,750 | | | | | | 1,667,615 | | | | | | 1,546,304 | | | | | | 638,556 | | |
| Change in net assets | | | 2,580,603 | | | | | | 26,699 | | | | | | 2,574,890 | | | | | | (909,763 | ) | |
| | | | | | | | | | | | | | | | | | | | | | | | |
| Net Assets: | | | | | | | | | | | | | | | | | | | | | | | |
| Beginning of period | | | 30,116,118 | | | | | | 30,089,419 | | | | | | 27,258,300 | | | | | | 28,168,063 | | |
| End of period | | $ | 32,696,721 | | | | | $ | 30,116,118 | | | | | $ | 29,833,190 | | | | | $ | 27,258,300 | | |
____________________
Amounts designated as ”—” are $0.00 or have been rounded to $0.00.
| See notes to financial statements. | HSBC FAMILY OF FUNDS | 29 |
HSBC FAMILY OF FUNDS
Statements of Changes in Net Assets (continued)
| HSBC High | | HSBC Strategic |
| Yield Fund | | Income Fund |
| For the | | For the | | For the | | For the |
| year ended | | year ended | | year ended | | year ended |
| October 31, | | October 31, | | October 31, | | October 31, |
| 2019 | | 2018 | | 2019 | | 2018 |
| CAPITAL TRANSACTIONS: | | | | | | | | | | | | | | | | | | | | | | | |
| Class A Shares: | | | | | | | | | | | | | | | | | | | | | | | |
| Proceeds from shares issued | | $ | 841,156 | | | | | $ | 503,745 | | | | | $ | 157,133 | | | | | $ | 1,210 | | |
| Dividends reinvested | | | 171,883 | | | | | | 105,282 | | | | | | 6,970 | | | | | | 6,334 | | |
| Value of shares redeemed | | | (186,338 | ) | | | | | (129,960 | ) | | | | | (1,350 | ) | | | | | (167,569 | ) | |
| Class A Shares capital transactions | | | 826,701 | | | | | | 479,067 | | | | | | 162,753 | | | | | | (160,025 | ) | |
| | | | | | | | | | | | | | | | | | | | | | | | |
| Class I Shares: | | | | | | | | | | | | | | | | | | | | | | | |
| Proceeds from shares issued | | | — | | | | | | — | | | | | | 56,120 | | | | | | — | | |
| Dividends reinvested | | | 1,458,049 | | | | | | 1,188,548 | | | | | | 1,327,431 | | | | | | 806,095 | | |
| Value of shares redeemed | | | — | | | | | | — | | | | | | — | | | | | | (7,514 | ) | |
| Class I Shares capital transactions | | | 1,458,049 | | | | | | 1,188,548 | | | | | | 1,383,551 | | | | | | 798,581 | | |
| Change in net assets resulting from capital transactions | | $ | 2,284,750 | | | | | $ | 1,667,615 | | | | | $ | 1,546,304 | | | | | $ | 638,556 | | |
| | | | | | | | | | | | | | | | | | | | | | | | |
| SHARE TRANSACTIONS: | | | | | | | | | | | | | | | | | | | | | | | |
| Class A Shares: | | | | | | | | | | | | | | | | | | | | | | | |
| Issued | | | 86,335 | | | | | | 50,036 | | | | | | 15,353 | | | | | | 119 | | |
| Reinvested | | | 17,866 | | | | | | 10,601 | | | | | | 699 | | | | | | 622 | | |
| Redeemed | | | (19,146 | ) | | | | | (12,981 | ) | | | | | (133 | ) | | | | | (16,730 | ) | |
| Change in Class A Shares | | | 85,055 | | | | | | 47,656 | | | | | | 15,919 | | | | | | (15,989 | ) | |
| | | | | | | | | | | | | | | | | | | | | | | | |
| Class I Shares: | | | | | | | | | | | | | | | | | | | | | | | |
| Issued | | | — | | | | | | — | | | | | | 5,450 | | | | | | — | | |
| Reinvested | | | 151,401 | | | | | | 119,271 | | | | | | 133,096 | | | | | | 79,251 | | |
| Redeemed | | | — | | | | | | — | | | | | | — | | | | | | (717 | ) | |
| Change in Class I Shares | | | 151,401 | | | | | | 119,271 | | | | | | 138,546 | | | | | | 78,534 | | |
____________________
Amounts designated as “—“ are $0.00 or have been rounded to $0.00.
| 30 | HSBC FAMILY OF FUNDS | See notes to financial statements. |
| HSBC HIGH YIELD FUND |
| Financial Highlights |
Selecteddata for a share outstanding throughout the periods indicated.
| | | | | | Investment Activities | | Distributions | | | | | | | | | | | | | Ratios/Supplementary Data |
| | | | | | | | | | | Net Realized | | | | | | | | | | | | | | | | | | | | | | | | | | | | | | | | | | | | | | | | | | | | | | | | | | | | Ratio of Net | | Ratio of | | | | | |
| | | | | | | | | | | and | | | | | | | | | | | | | | | | | | | | | | | | | | | | | | | | | | | | | | | | | | Net | | | | | | | Investment | | Expenses | | | | | |
| Net Asset | | Net | | Unrealized | | | | | | | | | | | | | | Net Realized | | | | | | | | | | | | | | | | | | | | | | | | | Assets | | Ratio of Net | | Income/ | | to Average | | | | | |
| Value, | | Investment | | Gains/ | | Total from | | Net | | Gains from | | | | | | | | | | | | | | Net Asset | | | | | | | at End of | | Expenses to | | (Loss) to | | Net Assets | | Portfolio |
| Beginning | | Income/ | | (Losses) from | | Investment | | Investment | | Investment | | Return of | | Total | | Value, End | | Total | | Period | | Average Net | | Average Net | | (Excluding Fee | | Turnover |
| of Period | | (Loss)(a) | | Investments | | Activities | | Income | | Transactions | | Capital | | Distributions | | of Period | | Return(b) | | (000’s) | | Assets(c) | | Assets(c) | | Reductions)(c) | | (b)(d) |
| CLASS A SHARES | | | | | | | | | | | | | | | | | | | | | | | | | | | | | | | | | | | | | | | | | | | | | | | | | | | | | | | | | | | | | | | | | | | | | | | | | | | | | | | | |
| Year Ended October 31, 2019 | | $ | 9.69 | | | | $ | 0.45 | | | | $ | 0.26 | | | | | $ | 0.71 | | | | | $ | (0.60 | ) | | | | $ | — | | | | $ | (0.03 | ) | | | | $ | (0.63 | ) | | | | $ | 9.77 | | | | | 7.59 | % | | | | $ | 3,253 | | | | 1.12 | % | | | | 4.63 | % | | | | 2.55 | % | | | | 76 | %(e) | |
| Year Ended October 31, 2018 | | | 10.24 | | | | | 0.42 | | | | | (0.50 | ) | | | | | (0.08 | ) | | | | | (0.47 | ) | | | | | — | | | | | — | | | | | | (0.47 | ) | | | | | 9.69 | | | | | (0.84 | )% | | | | | 2,402 | | | | 1.15 | % | | | | 4.24 | % | | | | 2.57 | % | | | | 50 | % | |
| Year Ended October 31, 2017 | | | 9.97 | | | | | 0.42 | | | | | 0.30 | | | | | | 0.72 | | | | | | (0.45 | ) | | | | | — | | | | | — | | | | | | (0.45 | ) | | | | | 10.24 | | | | | 7.45 | % | | | | | 2,049 | | | | 1.15 | % | | | | 4.15 | % | | | | 1.81 | % | | | | 42 | % | |
| Year Ended October 31, 2016 | | | 9.67 | | | | | 0.41 | | | | | 0.28 | | | | | | 0.69 | | | | | | (0.39 | ) | | | | | — | | | | | — | | | | | | (0.39 | ) | | | | | 9.97 | | | | | 7.37 | % | | | | | 558 | | | | 1.15 | % | | | | 4.27 | % | | | | 1.72 | % | | | | 50 | % | |
| Period Ended October 31, 2015(f) | | | 10.00 | | | | | 0.12 | | | | | (0.34 | ) | | | | | (0.22 | ) | | | | | (0.11 | ) | | | | | — | | | | | — | | | | | | (0.11 | ) | | | | | 9.67 | | | | | (2.23 | )% | | | | | 140 | | | | 1.15 | % | | | | 4.13 | % | | | | 1.93 | % | | | | 31 | % | |
| CLASS I SHARES | | | | | | | | | | | | | | | | | | | | | | | | | | | | | | | | | | | | | | | | | | | | | | | | | | | | | | | | | | | | | | | | | | | | | | | | | | | | | | | | |
| Year Ended October 31, 2019 | | | 9.72 | | | | | 0.48 | | | | | 0.27 | | | | | | 0.75 | | | | | | (0.63 | ) | | | | | — | | | | | (0.03 | ) | | | | | (0.66 | ) | | | | | 9.81 | | | | | 8.03 | % | | | | | 29,444 | | | | 0.78 | % | | | | 4.98 | % | | | | 2.22 | % | | | | 76 | %(e) | |
| Year Ended October 31, 2018 | | | 10.26 | | | | | 0.46 | | | | | (0.50 | ) | | | | | (0.04 | ) | | | | | (0.50 | ) | | | | | — | | | | | — | | | | | | (0.50 | ) | | | | | 9.72 | | | | | (0.41 | )% | | | | | 27,714 | | | | 0.80 | % | | | | 4.59 | % | | | | 2.22 | % | | | | 50 | % | |
| Year Ended October 31, 2017 | | | 9.98 | | | | | 0.45 | | | | | 0.31 | | | | | | 0.76 | | | | | | (0.48 | ) | | | | | — | | | | | — | | | | | | (0.48 | ) | | | | | 10.26 | | | | | 7.84 | % | | | | | 28,040 | | | | 0.80 | % | | | | 4.50 | % | | | | 1.48 | % | | | | 42 | % | |
| Year Ended October 31, 2016 | | | 9.68 | | | | | 0.45 | | | | | 0.26 | | | | | | 0.71 | | | | | | (0.41 | ) | | | | | — | | | | | — | | | | | | (0.41 | ) | | | | | 9.98 | (g) | | | | 7.68 | % | | | | | 26,168 | | | | 0.80 | % | | | | 4.64 | % | | | | 1.59 | % | | | | 50 | % | |
| Period Ended October 31, 2015(f) | | | 10.00 | | | | | 0.13 | | | | | (0.34 | ) | | | | | (0.21 | ) | | | | | (0.11 | ) | | | | | — | | | | | — | | | | | | (0.11 | ) | | | | | 9.68 | | | | | (2.15 | )% | | | | | 24,378 | | | | 0.80 | % | | | | 4.45 | % | | | | 1.64 | % | | | | 31 | % | |
| (a) | Calculated based on average shares outstanding. |
| (b) | Not annualized for periods less than one year. Total return calculations do not include any sales or redemption charges. |
| (c) | Annualized for periods less than one year. |
| (d) | Portfolio turnover is calculated on the basis of the Fund as a whole without distinguishing between the classes of shares issued. |
| (e) | Portfolio turnover increased significantly during the year due to change in investment strategy of the Fund. |
| (f) | Commencement of operations on July 14, 2015. |
| (g) | The net asset value per share (“NAV”) for financial reporting purposes differs from the NAV reported due to adjustments made in accordance with accounting principles generally accepted in the United States of America. |
Amounts designated as “—“ are $ 0.00 or have been rounded to $ 0.00.
| See notes to financial statements. | HSBC FAMILY OF FUNDS | 31 |
| HSBC STRATEGIC INCOME FUND |
| Financial Highlights |
Selected data for a share outstanding throughout the periods indicated.
| | | | | | | Investment Activities | | Distributions | | | | | | | | | | | | Ratios/Supplementary Data |
| | | | | | | | | | | | Net Realized | | | | | | | | | | | | | | | | | | | | | | | | | | | | | | | | | | | | | | | | | | | | | Ratio of Net | | Ratio of | | | | | |
| | | | | | | | | | | | and | | | | | | | | | | | | | | | | | | | | | | | | | | | | | | | | | | | Net | | | | | | | Investment | | Expenses | | | | | |
| | Net Asset | | Net | | Unrealized | | | | | | | | | | | | | | Net Realized | | | | | | | | | | | | | | | | | | Assets | | Ratio of Net | | Income/ | | to Average | | | | | |
| | Value, | | Investment | | Gains/ | | Total from | | Net | | Gains from | | | | | | | | Net Asset | | | | | | | at End of | | Expenses to | | (Loss) to | | Net Assets | | Portfolio |
| | Beginning | | Income/ | | (Losses) from | | Investment | | Investment | | Investment | | Total | | Value, End | | Total | | Period | | Average Net | | Average Net | | (Excluding Fee | | Turnover |
| | of Period | | (Loss)(a) | | Investments | | Activities | | Income | | Transactions | | Distributions | | of Period | | Return(b) | | (000’s) | | Assets(c) | | Assets(c) | | Reductions)(c) | | (b)(d) |
| CLASS A SHARES | | | | | | | | | | | | | | | | | | | | | | | | | | | | | | | | | | | | | | | | | | | | | | | | | | | | | | | | | | | | | | | | | | | | | | | | | | |
| Year Ended October 31, 2019 | | | $ | 9.88 | | | | $ | 0.37 | | | | $ | 0.57 | | | | | $ | 0.94 | | | | | $ | (0.60 | ) | | | | $ | — | | | | $ | (0.60 | ) | | | | $ | 10.22 | | | | 9.83 | % | | | | | $285 | | | | 1.13 | % | | | | 3.72 | % | | | | 2.58 | % | | | | 104 | %(e) | |
| Year Ended October 31, 2018 | | | | 10.45 | | | | | 0.30 | | | | | (0.55 | ) | | | | | (0.25 | ) | | | | | (0.32 | ) | | | | | — | | | | | (0.32 | ) | | | | | 9.88 | | | | (2.39 | )% | | | | | 118 | | | | 1.15 | % | | | | 2.94 | % | | | | 2.61 | % | | | | 51 | % | |
| Year Ended October 31, 2017 | | | | 10.24 | | | | | 0.29 | | | | | 0.23 | | | | | | 0.52 | | | | | | (0.31 | ) | | | | | — | | | | | (0.31 | ) | | | | | 10.45 | | | | 5.24 | % | | | | | 292 | | | | 1.15 | % | | | | 2.86 | % | | | | 1.81 | % | | | | 44 | % | |
| Year Ended October 31, 2016 | | | | 9.83 | | | | | 0.30 | | | | | 0.38 | | | | | | 0.68 | | | | | | (0.27 | ) | | | | | — | | | | | (0.27 | ) | | | | | 10.24 | | | | 7.04 | % | | | | | 107 | | | | 1.15 | % | | | | 2.99 | % | | | | 1.71 | % | | | | 47 | % | |
| Period Ended October 31, 2015(f) | | | | 10.00 | | | | | 0.09 | | | | | (0.18 | ) | | | | | (0.09 | ) | | | | | (0.08 | ) | | | | | — | | | | | (0.08 | ) | | | | | 9.83 | | | | (0.93 | )% | | | | | 99 | | | | 1.15 | % | | | | 2.89 | % | | | | 1.89 | % | | | | 24 | % | |
| CLASS I SHARES | | | | | | | | | | | | | | | | | | | | | | | | | | | | | | | | | | | | | | | | | | | | | | | | | | | | | | | | | | | | | | | | | | | | | | | | | | |
| Year Ended October 31, 2019 | | | | 9.92 | | | | | 0.41 | | | | | 0.57 | | | | | | 0.98 | | | | | | (0.62 | ) | | | | | — | | | | | (0.62 | ) | | | | | 10.28 | | | | 10.24 | % | | | | | 29,548 | | | | 0.79 | % | | | | 4.08 | % | | | | 2.41 | % | | | | 104 | %(e) | |
| Year Ended October 31, 2018 | | | | 10.49 | | | | | 0.34 | | | | | (0.56 | ) | | | | | (0.22 | ) | | | | | (0.35 | ) | | | | | — | | | | | (0.35 | ) | | | | | 9.92 | | | | (2.12 | )% | | | | | 27,140 | | | | 0.80 | % | | | | 3.32 | % | | | | 2.44 | % | | | | 51 | % | |
| Year Ended October 31, 2017 | | | | 10.26 | | | | | 0.33 | | | | | 0.23 | | | | | | 0.56 | | | | | | (0.33 | ) | | | | | — | | | | | (0.33 | ) | | | | | 10.49 | | | | 5.62 | % | | | | | 27,876 | | | | 0.80 | % | | | | 3.21 | % | | | | 1.58 | % | | | | 44 | % | |
| Year Ended October 31, 2016 | | | | 9.83 | | | | | 0.33 | | | | | 0.39 | | | | | | 0.72 | | | | | | (0.29 | ) | | | | | — | | | | | (0.29 | ) | | | | | 10.26 | | | | 7.43 | % | | | | | 26,505 | | | | 0.80 | % | | | | 3.34 | % | | | | 1.61 | % | | | | 47 | % | |
| Period Ended October 31, 2015(f) | | | | 10.00 | | | | | 0.10 | | | | | (0.18 | ) | | | | | (0.08 | ) | | | | | (0.09 | ) | | | | | — | | | | | (0.09 | ) | | | | | 9.83 | | | | (0.84 | )% | | | | | 24,696 | | | | 0.80 | % | | | | 3.24 | % | | | | 1.61 | % | | | | 24 | % | |
| (a) | Calculated based on average shares outstanding. |
| (b) | Not annualized for periods less than one year. Total return calculations do not include any sales or redemption charges. |
| (c) | Annualized for periods less than one year. |
| (d) | Portfolio turnover is calculated on the basis of the Fund as a whole without distinguishing between the classes of shares issued. |
| (e) | Portfolio turnover increased significantly during the year due to change in investment strategy of the Fund. |
| (f) | Commencement of operations on July 14, 2015. |
Amounts designated as “—“ are $ 0.00 or have been rounded to $ 0.00.
| 32 | HSBC FAMILY OF FUNDS | See notes to financial statements. |
| HSBC FAMILY OF FUNDS |
| Notes to Financial Statements—as of October 31, 2019 |
1. Organization:
The HSBC Funds (the “Trust”), a Delaware statutory trust organized on March 2, 2016, is registered under the Investment Company Act of 1940, as amended (the “Act”), as an open-end management investment company. As of October 31, 2019, the Trust is composed of 8 separate operational funds, each a series of the HSBC Family of Funds. The accompanying financial statements are presented for the following two diversified funds (individually a “Fund”, collectively the “Funds”) of the Trust:
| Fund | | Short Name |
| HSBC High Yield Fund | | |
| (formerly HSBC Global High Yield Bond Fund)* | | High Yield Fund |
| | | |
| HSBC Strategic Income Fund | | |
| (formerly HSBC Global High Income Bond Fund)* | | Strategic Income Fund |
____________________
| * | The Fund changed its name and principal investment strategy effective April 1, 2019. |
Financial statements for all other funds of the Trust are published separately. The Funds are authorized to issue an unlimited number of shares of beneficial interest with a par value of $0.001 per share. The share classes offered by each Fund and the maximum sales charge for Class A Shares are summarized in the following table.
| | Share | | Class A Shares |
| Fund | | Classes Offered | | Maximum Sales Charge |
| High Yield Fund | | A, I | | 3.75*% |
| Strategic Income Fund | | A, I | | 3.75*% |
| * | Effective October 1, 2019. Prior to October 1, 2019, the maximum sales charge was 4.75%. |
Each class of shares in each Fund has identical rights and privileges, except with respect to arrangements pertaining to shareholder servicing and/or distribution, class-related expenses, voting rights on matters affecting a single class of shares, and exchange privileges of each class of shares.
Under the Trust’s organizational documents, the Trust’s officers and Trustees are indemnified against certain liabilities arising out of the performance of their duties to the Funds. In addition, in the normal course of business, the Trust enters into contracts with its service providers, which also provide for indemnifications by the Funds. The Funds’ maximum exposure under these arrangements is unknown as this would involve future claims that may be made against the Funds. However, based on experience, the Trust believes the risk of loss to be remote.
The Funds are investment companies and follow accounting and reporting guidance under Financial Accounting Standards Board (“FASB”) Accounting Standards Codification Topic 946, “Financial Services-Investment Companies.”
2. Significant Accounting Policies:
The following is a summary of the significant accounting policies followed by the Funds in the preparation of their financial statements. The policies are in conformity with generally accepted accounting principles in the United States of America (“GAAP”). The preparation of financial statements requires management to make certain estimates and assumptions that affect the reported amounts of assets and liabilities and disclosure of contingent assets and liabilities at the date of the financial statements and the reported amounts of increases and decreases in net assets from operations during the reporting period. Actual results could differ from those estimates.
| HSBC FAMILY OF FUNDS |
| Notes to Financial Statements—as of October 31, 2019 (continued) |
Securities Valuation:
The Funds record their investments at fair value. Fair value is defined as the price that would be received to sell an asset or paid to transfer a liability in an orderly transaction between market participants at the measurement date. The valuation techniques used to determine fair value are further described in Note 3 below.
Investment Transactions and Related Income:
Investment transactions are accounted for no later than one business day after trade date. However, for financial reporting purposes, investment transactions are accounted for on trade date. Investment gains and losses are calculated on the identified cost basis. Interest income is determined on the basis of coupon interest accrued using the effective interest method which adjusts for amortization of premiums and accretion of discounts. Dividend income is recorded on the ex-dividend date except in the case of certain foreign securities, in which case dividends are recorded as soon as such information becomes available. Pay-in-kind interest income and non-cash dividend income received in the form of securities in-lieu of cash, if any, are recorded at the fair value of the securities received. For derivative contracts, realized gains and losses are recorded upon settlement of the contract.
Foreign Currency Translation:
The accounting records of the Funds are maintained in U.S. dollars. Foreign currency amounts are translated into U.S. dollars at the current rate of exchange to determine the value of investments, assets and liabilities at the close of each business day. Purchases and sales of securities, and income and expenses are translated at the prevailing rate of exchange on the respective dates of such transactions. The Funds do not isolate the portion of the results of operations resulting from changes in foreign exchange rates on investments from fluctuations arising from changes in market prices of securities held. Such fluctuations are included with the net realized and unrealized gain or loss from investments in securities and foreign currency translations.
Foreign Taxes:
Income received by the Funds from sources within foreign countries may be subject to withholding and other income or similar taxes imposed by such countries. The Funds may be subject to foreign taxes on gains in investments or currency repatriation. The Funds accrue foreign capital gains taxes, as applicable, based on their current interpretation of tax rules in the foreign markets in which they invest. Such tax accrual is based in part on actual and estimated realized gains. Estimated realized gains are subject to change and such change could be material. However, management’s conclusions may be subject to future review and change based on changes in, or the interpretation of, the accounting standards or tax laws and regulations.
Restricted Securities and Illiquid Investments:
The Funds may invest in restricted securities. A restricted security is a security which has been purchased through a private offering and cannot be resold to the general public without prior registration under the Securities Act of 1933 (the “1933 Act”) or pursuant to the resale limitations provided by Rule 144 under the 1933 Act, or another exemption from the registration requirements of the 1933 Act. Certain restricted securities may be resold in transactions exempt from registration, normally to qualified institutional buyers, and may be classified as liquid by the Investment Adviser (as defined in Note 4) under the Funds’ liquidity risk management program, as approved by the Board of Trustees (the “Board”). Therefore, not all restricted securities are considered illiquid. To the extent that a Fund purchases securities that are restricted as to resale or for which current market quotations are not available, such securities will be valued based upon all relevant factors as outlined in Securities and Exchange Commission Financial Reporting Release No. 1. Disposal of restricted securities may involve time consuming negotiations and expense. Prompt sale at the current valuation may be difficult and could adversely affect the net assets of the Funds.
| HSBC FAMILY OF FUNDS |
| Notes to Financial Statements—as of October 31, 2019 (continued) |
Participation Notes and Participatory Notes:
The Funds may invest in participation notes or participatory notes (“P-notes”). P-notes are participation interest notes that are issued by banks or broker-dealers and are designed to offer a return linked to a particular underlying equity, debt, currency or market. If the P-note were held to maturity, the issuer would pay to, or receive from, the purchaser the difference between the nominal value of the underlying instruments at the time of purchase and that instrument’s value at maturity. The holder of a P-note that is linked to a particular underlying security or instrument may be entitled to receive any dividends paid in connection with that underlying security or instrument, but typically does not receive voting rights as it would if it directly owned the underlying security or instrument. P-notes involve transaction costs. Investments in P-notes involve the same risks associated with a direct investment in the underlying securities, instruments or markets that they seek to replicate. In addition, there can be no assurance that there will be a trading market for a P-note or that the trading price of a P-note will equal the underlying value of the security, instrument or market that it seeks to replicate. Due to liquidity and transfer restrictions, the secondary markets on which a P-note is traded may be less liquid than the market for other securities, or may be completely illiquid, which may also affect the ability of a Fund to accurately value a P-note. P-notes typically constitute general unsecured contractual obligations of the banks or broker-dealers that issue them, which subjects a Fund that holds them to counterparty risk (and this risk may be amplified if the Fund purchases P-notes from only a small number of issuers).
Derivative Instruments:
All open derivative positions at period end are reflected on each Fund’s Schedule of Portfolio Investments. The following is a description of the derivative instruments utilized by the Funds, including the primary underlying risk exposure related to each instrument type.
Forward Foreign Currency Exchange Contracts:
Each Fund may enter into forward foreign currency exchange contracts. The Funds may enter into forward foreign currency exchange contracts in connection with planned purchases or sales of securities, to hedge the U.S. dollar value of securities denominated in a particular currency or to enhance return. The forward foreign currency exchange contracts are adjusted by the daily exchange rate of the underlying currency and any gains or losses are recorded for financial statement purposes as unrealized gains or losses until the contract settlement date.
The Funds could be exposed to risks if the counterparties to the contracts are unable to meet the terms of their contracts and from unanticipated movements in the value of a foreign currency relative to the U.S. dollar.
The Funds remain subject to credit risk with respect to the amount they expect to receive from counterparties. However, the Funds have sought to mitigate these risks by generally requiring the posting of collateral to a Fund at prearranged exposure levels to cover a Fund’s exposure to the counterparty. Generally, the amount of collateral due from or to a counterparty must exceed a minimum transfer amount threshold before a transfer is required to be made. Forward foreign currency exchange contracts may involve credit or market risk in excess of the amounts reflected on the Statements of Assets and Liabilities.
During the year ended October 31, 2019, the Funds entered into forward foreign currency exchange contracts to gain exposure to certain markets and for hedging purposes. The notional amount of forward foreign currency exchange contracts outstanding as of October 31, 2019 and the monthly average notional amount for these contracts during the year ended October 31, 2019 were as follows:
| | Outstanding | | Monthly Average |
| | Notional Amount ($) | | Notional Amount ($) |
| | Long | | Short | | Long | | Short |
| Forward Foreign Currency Exchange Contracts: | | | | | | | | | | | |
| High Yield Fund | | — | | (1,768,834 | ) | | — | | | (3,428,385 | ) |
| Strategic Income Fund | | 50,184 | | (1,660,574 | ) | | 46,111 | (a) | | (4,588,621 | ) |
____________________
| (a) | For the period December 1, 2018 to February 28, 2019 and October 1, 2019 to October 31, 2019. |
| HSBC FAMILY OF FUNDS |
| Notes to Financial Statements—as of October 31, 2019 (continued) |
Futures Contracts:
The Funds may enter into futures contracts for the purpose of hedging existing portfolio securities or securities they intend to purchase against fluctuations in fair value caused by changes in prevailing market interest conditions. Upon entering into futures contracts, the Funds are required to pledge to the broker an amount of cash and/or other assets equal to a certain percentage of the contract amount (initial margin deposit). Subsequent payments, known as “variation margin”, are made or received each day, depending on the daily fluctuations in the fair value of the underlying security. The Funds recognize an unrealized gain or loss equal to the daily variation margin. Should market conditions move unexpectedly, the Funds may not achieve the anticipated benefits of the futures contracts and may realize a loss. Futures contracts involve, to varying degrees, elements of market risk (generally equity price risk related to stock futures, interest rate risk related to bond futures, and foreign currency risk related to currency futures) and exposure to loss in excess of the amounts reflected on the Statements of Assets and Liabilities as variation margin. The primary risks associated with the use of futures contracts are the imperfect correlation between the change in market value of the securities held by the Funds and the prices of futures contracts, the possibility of an illiquid market, and the inability of the counterparty to meet the terms of the contract. During the year ended October 31, 2019, the Funds invested in futures contracts to gain exposure to certain markets and for hedging purposes. As of October 31, 2019, the funds did not hold any futures contracts. The monthly average notional amount for these contracts for the year ended October 31, 2019 were as follows:
| | Monthly Average |
| | Notional Amount ($) |
| | Long | | Short |
| Futures Contracts: | | | | | | |
| High Yield Fund | | 359,677 | (a) | | — | |
| Strategic Income Fund | | 402,916 | (a) | | (360,109 | )(a) |
____________________
| (a) | For the period November 1, 2018 to February 28, 2019. |
Swap Agreements:
The Funds may enter into swap contracts in accordance with their investment objectives and policies. A swap is an agreement to exchange the return generated by one instrument for the return generated by another instrument. Swap agreements are privately negotiated in the over-the-counter (“OTC”) market and may be entered into as a bilateral contract (“OTC swaps”) or cleared through a third party, known as a clearing organization (“centrally cleared swaps”). The payment streams are calculated by reference to a specified index and agreed upon notional amount. The term ‘specified’ index includes currencies, fixed interest rates, prices and total return on interest rate indices, fixed income indices, stock indices and commodity indices.
The Funds will usually enter into swaps on a net basis, which means that the two return streams are netted out in a cash settlement on the payment date or dates specified in the instrument with a Fund receiving or paying only the net amount of the two returns. Upfront receipts and payments are recorded as a liability or asset, respectively. These upfront receipts and payments are amortized or accreted to gains or losses over the life of the swap agreement. Swaps are marked to market daily based upon valuations as determined from the underlying contract or in accordance with the requirements of the clearing organization. Changes in market value, if any, are reflected as a component of net change in “unrealized appreciation or depreciation on swap agreements”. Daily changes in valuation of centrally cleared swaps, if any, are recorded as “variation margin on swap agreements”. Net periodic payments received or paid by the Funds are recorded as “realized gains or losses on swap agreements”. A Fund’s obligations under a swap agreement will be accrued daily (offset against any amounts owing to the Fund) and any accrued but unpaid net amounts owed to a swap counterparty are generally collateralized by the maintenance of a segregated account consisting of cash, U.S. government securities, or other liquid securities or by pledging such securities as collateral.
Credit default swap agreements involve one party making a stream of payments (referred to as the buyer of protection) to another party (the seller of protection) in exchange for the right to receive a specified return in the event of a default or other credit event for the referenced entity, obligation or index and are subject to credit risk exposure. The maximum potential amount of future payments that a Fund as a seller of protection
| HSBC FAMILY OF FUNDS |
| Notes to Financial Statements—as of October 31, 2019 (continued) |
could be required to make under a credit default swap agreement would be an amount equal to the notional amount of the agreement. Notional amounts of each individual credit default swap agreement outstanding for which a Fund is the seller of protection are disclosed in the Schedules of Portfolio Investments. These potential amounts would be partially offset by any recovery values of the respective referenced obligations, upfront payments received upon entering into the agreement, or net amounts received from the settlement of buy protection credit default swap agreements entered into by a Fund for the same referenced entity or entities.
The Funds remain subject to credit risk with respect to the amount they expect to receive from counterparties. However, the Funds have sought to mitigate these risks by generally requiring the posting of collateral to a Fund at prearranged exposure levels to cover a Fund’s exposure to the counterparty. Generally, the amount of collateral due from or to a counterparty must exceed a minimum transfer amount threshold before a transfer is required to be made. The counterparty risk for centrally cleared swap agreements is generally lower than for OTC swap agreements because generally a clearing organization becomes substituted for each counterparty to a centrally cleared swap agreement and, in effect, guarantees the parties’ performance under the contract as each party to a trade looks only to a clearing house for performance of financial obligations. However, there can be no assurance that the clearing house, or its members will satisfy its obligations to a Fund. Swap agreements may involve credit or market risk in excess of the amounts reflected on the Statements of Assets and Liabilities.
The use of swaps is a highly specialized activity that involves investment techniques and risks different from those associated with ordinary portfolio securities transactions. If the Investment Adviser is incorrect in its forecasts of market values, interest rates and currency exchange rates, the investment performance of a Fund would be less favorable than it would have been if this investment technique were not used.
During the year ended October 31, 2019, the Funds entered into credit default swap agreements primarily to manage and/or gain exposure to credit risk. The notional amount of swap agreements outstanding as of October 31, 2019 and the monthly average notional amount for these agreements during the year ended October 31, 2019 were as follows:
| | Outstanding | | Monthly Average |
| | Notional Amount ($) | | Notional Amount ($) |
| | Buy | | Sell | | Buy | | Sell |
| | Protection | | Protection | | Protection | | Protection |
| Credit Default Swap Agreements: | | | | | | | | | | |
| High Yield Fund | | — | | — | | — | | | (416,350 | )(a) |
| Strategic Income Fund | | 13,550,000 | | — | | 6,081,214 | (b) | | (627,000 | )(a) |
____________________
| (a) | For the period November 1, 2018 to February 28, 2019. |
| (b) | For the period April 1, 2019 to October 31, 2019. |
| HSBC FAMILY OF FUNDS |
| Notes to Financial Statements—as of October 31, 2019 (continued) |
Summary of Derivative Instruments:
The following is a summary of the fair values of derivative instruments on the Statements of Assets and Liabilities, categorized by risk exposure, as of October 31, 2019:
| | Assets | | Liabilities |
| | Unrealized | | | | | | Unrealized | | | | |
| | Appreciation | | | | | | Depreciation | | | | |
| | on Forward | | | | | | on Forward | | | | |
| | Foreign | | | | | | Foreign | | | | |
| | Currency | | Swap | | Currency | | Swap |
| | Exchange | | Agreements | | Exchange | | Agreements |
| Fund | | Contracts ($) | | at Value ($)* | | Contracts ($) | | at Value ($)* |
| Foreign Exchange Rate Risk Exposure: | | | | | | | | | | | | | | | | |
| High Yield Fund | | | — | | | | — | | | | 17,674 | | | | — | |
| Strategic Income Fund | | | 13 | | | | — | | | | 31,799 | | | | — | |
| | | | | | | | | | | | | | | | | |
| Credit Contracts Risk Exposure: | | | | | | | | | | | | | | | | |
| Strategic Income Fund | | | — | | | | — | | | | — | | | | 345,702 | |
____________________
| * | Total fair value is presented by Primary Risk Exposure. For forward foreign currency contracts, such amounts represent the appreciation (for asset derivatives) or depreciation (for liability derivatives). Centrally cleared swaps are reported at value, which includes movements of variation margin. The Statements of Assets and Liabilities only reflect the current day variation margin. |
The following is a summary of the effect of derivative instruments on the Statements of Operations, categorized by risk exposure, for the year ended October 31, 2019:
| | Realized Gain (Loss) on Derivatives |
| | Recognized as a Result from Operations |
| | Net Realized | | | | | | | | | |
| | Gains (Losses) | | Net Realized | | Net Realized |
| | from Forward | | Gains (Losses) | | Gains (Losses) |
| | Foreign Currency | | from Futures | | from Swap |
| Fund | | Exchange Contracts ($) | | Contracts ($) | | Agreements ($) |
| Foreign Exchange Rate Risk Exposure: | | | | | | | | | | | | | |
| High Yield Fund | | | 192,505 | | | | — | | | | — | | |
| Strategic Income Fund | | | 260,551 | | | | — | | | | — | | |
| | | | | | | | | | | | | | |
| Credit Contracts Risk Exposure: | | | | | | | | | | | | | |
| High Yield Fund | | | — | | | | — | | | | 24,384 | | |
| Strategic Income Fund | | | — | | | | — | | | | (25,468 | ) | |
| | | | | | | | | | | | | | |
| Interest Rate Risk Exposure: | | | | | | | | | | | | | |
| High Yield Fund | | | — | | | | 7,147 | | | | — | | |
| Strategic Income Fund | | | — | | | | 1,305 | | | | — | | |
| HSBC FAMILY OF FUNDS |
| Notes to Financial Statements—as of October 31, 2019 (continued) |
| | Net Change in Unrealized Appreciation/Depreciation |
| | on Derivatives Recognized as a Result from Operations |
| | Change in Unrealized | | Change in | | Change in |
| | Appreciation/ | | Unrealized | | Unrealized |
| | Depreciation | | Appreciation/ | | Appreciation/ |
| | on Forward | | Depreciation | | Depreciation |
| | Foreign Currency | | on Futures | | on Swap |
| Fund | | Exchange Contracts ($) | | Contracts ($) | | Agreements ($) |
| Foreign Exchange Rate Risk Exposure: | | | | | | | | | | | | |
| High Yield Fund | | | (124,879 | ) | | | — | | | | — | |
| Strategic Income Fund | | | (171,537 | ) | | | — | | | | — | |
| |
| Credit Contracts Risk Exposure: | | | | | | | | | | | | |
| High Yield Fund | | | — | | | | — | | | | (21,488 | ) |
| Strategic Income Fund | | | — | | | | — | | | | (65,851 | ) |
| |
| Interest Rate Risk Exposure: | | | | | | | | | | | | |
| High Yield Fund | | | — | | | | 5,726 | | | | — | |
| Strategic Income Fund | | | — | | | | (1,088 | ) | | | — | |
The Funds are generally subject to master netting arrangements that allow for amounts owed between each Fund and the counterparty to be netted. The party that has the larger payable pays the excess of the larger amount over the smaller amount to the other party. The master netting arrangements do not apply to amounts owed to/from different counterparties. For financial reporting purposes, the Funds do not offset derivative assets and derivative liabilities that are subject to legally enforceable master netting arrangements in the Statements of Assets and Liabilities. The tables below present the gross and net amounts of the assets and liabilities with any offsets to reflect the Funds’ ability to reflect the master netting arrangements at October 31, 2019 in the Statements of Assets and Liabilities.
As of October 31, 2019, each Fund’s derivative assets and liabilities by type are as follows:
| | | High | | Strategic |
| | Yield Fund | | Income Fund |
| | Assets | | Liabilities | | Assets | | Liabilities |
| Derivative Financial Instruments: | | | | | | | | | | | | | | | | | | | | | |
| Forward foreign currency contracts | | | $ | — | | | | $ | 17,674 | | | | $ | 13 | | | | | $ | 31,799 | |
| Swap agreements | | | | — | | | | | — | | | | | 8,890 | | | | | | — | |
| Total derivative assets and liabilities in the Statement of | | | | | | | | | | | | | | | | | | | | | |
| Assets and Liabilities | | | | — | | | | | 17,674 | | | | | 8,903 | | | | | | 31,799 | |
| Derivative asset and liabilities not subject to a master netting agreement | | | | | | | | | | | | | | | | | | | | | |
| or similar agreement (“MNA”) | | | | — | | | | | — | | | | | (8,890 | ) | | | | | — | |
| Total assets and liabilities subject to a MNA | | | $ | — | | | | $ | 17,674 | | | | $ | 13 | | | | | $ | 31,799 | |
| HSBC FAMILY OF FUNDS |
| Notes to Financial Statements—as of October 31, 2019 (continued) |
The following table represents each Fund’s derivative assets by counterparty net of amounts available for offset under a master netting arrangement and net of the related collateral received by each Fund as of October 31, 2019:
| | Derivative Assets | | Derivatives | | Non-cash | | Cash | | Net Amount |
| | Subject to a MNA | | Available for | | Collateral | | Collateral | | of Derivative |
| Counterparty | | by Counterparty | | Offset | | Received (a) | | Received (a) | | Assets |
| Strategic Income Fund: | | | | | | | | | | | | | | | | | | | | | | | | | | |
| UBS AG | | | $ | 13 | | | | $ | (13 | ) | | | | $ | — | | | | $ | — | | | | $ | — | |
| Total | | | $ | 13 | | | | $ | (13 | ) | | | | $ | — | | | | $ | — | | | | $ | — | |
____________________
| (a) | The actual collateral received may be in excess of the amounts shown in the table. The table only reflects collateral amounts up to the amount of the financial instrument disclosed on the Statements of Assets and Liabilities. |
The following table represents each Fund’s derivative liabilities by counterparty net of amounts available for offset under a master netting arrangement and net of the related collateral pledged by each Fund as of October 31, 2019:
| | Derivative | | | | | | | | | | | | | | | | | | | | | |
| | Liabilities | | Derivatives | | Non-cash | | | | | | | Net Amount of |
| | Subject to a MNA | | Available | | Collateral | | Cash Collateral | | Derivative |
| Counterparty | | by Counterparty | | for Offset | | Pledged (a) | | Pledged (a) | | Liabilities |
| High Yield Fund: | | | | | | | | | | | | | | | | | | | | | | | | | | |
| Goldman Sachs | | | $ | 17,674 | | | | $ | — | | | | | $ | — | | | | $ | — | | | | $ | 17,674 | |
| Total | | | $ | 17,674 | | | | $ | — | | | | | $ | — | | | | $ | — | | | | $ | 17,674 | |
| Strategic Income Fund: | | | | | | | | | | | | | | | | | | | | | | | | | | |
| Goldman Sachs | | | $ | 8 | | | | $ | — | | | | | $ | — | | | | $ | — | | | | $ | 8 | |
| UBS AG | | | | 31,791 | | | | | (13 | ) | | | | | — | | | | | — | | | | | 31,778 | |
| Total | | | $ | 31,799 | | | | $ | (13 | ) | | | | $ | — | | | | $ | — | | | | $ | 31,786 | |
____________________
| (a) | The actual collateral received may be in excess of the amounts shown in the table. The table only reflects collateral amounts up to the amount of the financial instrument disclosed on the Statements of Assets and Liabilities. |
Pursuant to each Fund’s ISDA Master Agreement for trading over-the-counter derivatives (“ISDA”), each Fund must notify counterparties if its net asset value (“NAV”) declines below a predetermined level over specified periods. In the event a Fund’s NAV declines below one of the predetermined levels, the decline may trigger an Additional Termination Event under the ISDA (“NAV Decline Trigger Event”) whereby each counterparty would have the right to declare an Early Termination Date, terminate the ISDA, and close-out all outstanding derivatives positions according to the close-out procedures of the ISDA. Pursuant to the terms of the ISDA, following a NAV Decline Trigger Event, counterparties may agree to waive their right to declare an Early Termination Date and thereby waive their right to terminate the ISDA and close-out any outstanding derivatives positions.
In addition to the provisions relating to Additional Termination Events, under the terms of the Credit Support Annex to the ISDA, parties to an ISDA are required to post collateral to the other party if any of their derivatives positions are in a position of net liability. If either party fails to post required collateral and such failure is not remedied following subsequent notice, the failure to post collateral may be an Additional Termination Event and the other party may declare an Early Termination Event, terminate the ISDA, and close out any outstanding derivatives position. As of October 31, 2019, for derivatives positions where the Funds were in a position of net liability, the balance of any collateral posted is included in the Statements of Assets and Liabilities.
| HSBC FAMILY OF FUNDS |
| Notes to Financial Statements—as of October 31, 2019 (continued) |
Allocations:
Expenses directly attributable to a Fund are charged to that Fund. Expenses not directly attributable to a Fund are allocated among the applicable series within the Trust equally to each fund, in relation to its net assets, or another appropriate basis. Class specific expenses are charged directly to the class incurring the expense. In addition, income, expenses (other than class specific expenses), and unrealized and realized gains and losses are allocated to each class based on relative net assets on a daily basis.
Distributions to Shareholders:
Dividends distributed to shareholders of the Funds from net investment income, if any, are declared and distributed monthly from each Fund. Distributions from net realized gains, if any, are declared and paid at least annually by the Funds. Additional distributions are also made to the Funds’ shareholders to the extent necessary to avoid the federal excise tax on certain undistributed income and net realized gains of regulated investment companies.
Federal Income Taxes:
Each Fund is a separate taxable entity for federal income tax purposes. Each Fund has qualified and intends to continue to qualify each year as a “regulated investment company” under Subchapter M of the Internal Revenue Code, as amended, and to distribute substantially all of its taxable net investment income and net realized gains, if any, to its shareholders. Accordingly, no provision for federal income or excise tax is required for the Funds, although shareholders may be taxed on distributions they receive.
Management of the Funds has reviewed tax positions taken in tax years that remain subject to examination by all major tax jurisdictions, including federal (i.e., the last four tax year ends and the interim tax period since then, as applicable). Management believes that there is no tax liability resulting from unrecognized tax benefits related to uncertain tax positions taken. Management’s conclusions may be subject to future review based on changes in, or interpretation of, accounting standards or tax laws and regulations.
3. Investment Valuation Summary
The valuation techniques employed by the Funds, as described below, maximize the use of observable inputs and minimize the use of unobservable inputs in determining fair value. The Funds’ investments are classified within the fair value hierarchy based on the lowest level of input that is significant to the fair value measurement. The inputs used for valuing the Funds’ investments are summarized in the three broad levels listed below:
| ● | Level 1—quoted prices in active markets for identical assets
|
| ● | Level 2—other significant observable inputs (including quoted prices for similar securities, interest rates, prepayments speeds, credit risk, etc.)
|
| ● | Level 3—significant unobservable inputs (including the Fund’s own assumptions in determining the fair value of investments) |
Bonds and other fixed income securities (other than short-term obligations) are valued at the evaluated bid price, as of the time NAV is determined, supplied by an approved independent pricing service, based upon market transactions for normal, institutional-size trading units of similar securities, as well as yield, quality, coupon rate, maturity, callability or prepayment option, type and size of issue, trading characteristics and other market data (“matrix valuations”), without exclusive reliance on quoted prices on an exchange or over-the-counter prices. Because quoted prices on exchanges or over-the-counter prices are believed to reflect more accurately the fair value of such securities, matrix valuations are typically categorized as Level 2 in the fair value hierarchy.
| HSBC FAMILY OF FUNDS |
| Notes to Financial Statements—as of October 31, 2019 (continued) |
Investments in other mutual funds are valued at their NAVs, as reported by such mutual funds and are typically categorized as Level 1 in the fair value hierarchy.
Exchange traded futures contracts are valued at their settlement price on the exchange on which they are traded and are typically categorized as Level 1 in the fair value hierarchy. Exchange traded option contracts are valued at the closing price or last sale price on the primary instrument for that option as recorded by an approved pricing service and are typically categorized as Level 1 in the fair value hierarchy.
Forward foreign currency exchange contracts are valued at the current day’s interpolated foreign exchange rate, as calculated using the current day’s spot rate, and the prevailing forward rates and converted to U.S. dollars at the exchange rate of such currencies against the U.S. dollar, as of the close of regular trading on the New York Stock Exchange, as provided by an approved pricing service, and are typically categorized as Level 2 in the fair value hierarchy. Non-exchange traded derivatives, such as swaps and certain options, are generally valued by using a valuation provided by an approved independent pricing service and are typically categorized as Level 2 in the fair value hierarchy.
Securities or other assets for which market quotations or an independent pricing service evaluation are not readily available, or are deemed unreliable due to a significant event or otherwise, are valued pursuant to procedures adopted by the Board (“Procedures”). Depending on the source and relative significance of valuation inputs, these instruments may be classified as Level 2 or Level 3 in the fair value hierarchy. Examples of potentially significant events that could affect the value of an individual security and thus require pricing under the Procedures include corporate actions by the issuer, announcements by the issuer relating to its earnings or products, regulatory news, natural disasters, and litigation. Examples of potentially significant events that could affect multiple securities held by a Fund include governmental actions, natural disasters, and armed conflicts. Fair value pricing may require subjective determinations about the value of a security. While the Trust’s policy is intended to result in a calculation of a Fund’s NAV that fairly reflects security values as of the time of pricing, the Trust cannot ensure that fair values determined would accurately reflect the price that a Fund could obtain for a security if it were to dispose of that security as of the time of pricing. The prices used by a Fund may differ from the value that would be realized if the securities were sold and the differences could be material to the financial statements.
In addition, if events materially affecting the value of foreign securities occur between the time when the exchange on which they are traded closes and the time when the Funds’ NAV is calculated, such securities may be valued using fair value pricing in accordance with procedures adopted by the Board. Management identifies possible fluctuations in foreign securities by monitoring the rise or fall in the value of a designated benchmark index. In the event of a rise or fall greater than predetermined levels, the Funds may use a systematic valuation model provided by an independent third party to value its foreign securities, rather than local market closing prices. When a Fund uses such a valuation model, the value assigned to the Fund’s foreign securities may not be the quoted or published prices of the investment on their primary markets or exchanges and are typically categorized as Level 2 in the fair value hierarchy. The number of days on which fair value prices will be used will depend on market activity and it is possible that fair value prices will be used by the Funds to a significant extent.
Changes in valuation techniques may result in transfers in or out of an assigned level within the fair value hierarchy. The inputs or methodology used for valuing investments are not necessarily an indication of the risk associated with investing in those investments.
| HSBC FAMILY OF FUNDS |
| Notes to Financial Statements—as of October 31, 2019 (continued) |
The following is a summary of the valuation inputs used as of October 31, 2019 in valuing the Funds’ investments based upon the three levels defined above. The breakdown of country descriptions is disclosed in the Schedule of Portfolio Investments for each Fund:
| | | LEVEL 1 ($) | | LEVEL 2 ($) | | LEVEL 3 ($) | | Total ($) |
| High Yield Fund | | | | | | | | | | |
| Investment Securities: | | | | | | | | | | |
| Foreign Bonds | | — | | 531,164 | | | — | | 531,164 | |
| Yankee Dollars | | — | | 6,602,285 | | | — | | 6,602,285 | |
| Corporate Bonds | | — | | 22,378,050 | | | — | | 22,378,050 | |
| Exchange Traded Funds | | 1,572,208 | | — | | | — | | 1,572,208 | |
| Investment Company | | 1,189,851 | | — | | | — | | 1,189,851 | |
| Total Investment Securities | | 2,762,059 | | 29,511,499 | | | — | | 32,273,558 | |
| Other Financial Instruments: (a) | | | | | | | | | | |
| Forward Foreign Currency Contracts | | — | | (17,674 | ) | | — | | (17,674 | ) |
| Total Investments | | 2,762,059 | | 29,493,825 | | | — | | 32,255,884 | |
| |
| Strategic Income Fund | | | | | | | | | | |
| Investment Securities: | | | | | | | | | | |
| Foreign Bonds | | — | | 1,116,699 | | | — | | 1,116,699 | |
| Yankee Dollars | | — | | 6,688,014 | | | — | | 6,688,014 | |
| Corporate Bonds | | — | | 20,092,191 | | | — | | 20,092,191 | |
| U.S. Treasury Obligations | | — | | 1,329,707 | | | — | | 1,329,707 | |
| Investment Company | | 84,585 | | — | | | — | | 84,585 | |
| Total Investment Securities | | 84,585 | | 29,226,611 | | | — | | 29,311,196 | |
| Other Financial Instruments: (a) | | | | | | | | | | |
| Centrally Cleared Credit Default Swaps | | — | | (345,702 | ) | | — | | (345,702 | ) |
| Forward Foreign Currency Contracts | | — | | (31,786 | ) | | — | | (31,786 | ) |
| Total Investments | | 84,585 | | 28,849,123 | | | — | | 28,933,708 | |
____________________
| (a) | Other financial instruments would include derivative instruments, such as futures and forward foreign currency contracts, which are valued at the unrealized appreciation/(depreciation) on the instrument and swap agreements, which are valued at fair value. |
| HSBC FAMILY OF FUNDS |
| Notes to Financial Statements—as of October 31, 2019 (continued) |
4. Related Party Transactions and Other Agreements and Plans:
Investment Management:
HSBC Global Asset Management (USA) Inc. (“HSBC’’ or the “Investment Adviser’’), a wholly owned subsidiary of HSBC Bank USA, N.A., a national bank organized under the laws of the United States, acts as Investment Adviser to the Funds. As Investment Adviser, HSBC manages the investments of the Funds and continuously reviews, supervises and administers the Funds’ investments pursuant to an Investment Advisory Contract. For its services in this capacity, HSBC receives a fee from each Fund, accrued daily and paid monthly, based on the average daily net assets of each respective Fund, at annual rate of:
| Fund | | Fee Rate (%) |
| High Yield Fund | | 0.65 |
| Strategic Income Fund | | 0.65 |
HSBC also provides support services to the Funds pursuant to a Support Services Agreement in connection with the operation of certain classes of shares of the Funds. For its services in this capacity, HSBC is entitled to a fee, accrued daily and paid monthly, based on the average daily net assets of Class A Shares of each of the Funds, at an annual rate of 0.10%. HSBC is not entitled to a support services fee for Class I Shares.
Administration, Fund Accounting and Other Services:
HSBC also serves the Funds as Administrator. Under the terms of the Administration Services Agreement, HSBC receives from the Funds (as well as other funds in the Trust combined) a fee, accrued daily and paid monthly, at an annual rate of:
| Based on Average Daily Net Assets of | | Fee Rate (%) |
| Up to $10 billion | | 0.0400 |
| In excess of $10 billion but not exceeding $20 billion | | 0.0350 |
| In excess of $20 billion but not exceeding $ 50 billion | | 0.0265 |
| In excess of $ 50 billion | | 0.0245 |
The fee rates and breakpoints are determined on the basis of the aggregate average daily net assets of the Trust. For the year ended October 31, 2019, the effective annualized rate was 0.038%, prior to any fee waivers or expense reimbursements, based on the average daily net assets of the Trust. The total administration fee paid to HSBC is allocated to each series based upon its proportionate share of the aggregate net assets of the Trust, subject to certain allocations in cases where one fund invests some or all of its assets in another fund.
Pursuant to a Sub-Administration Services Agreement with HSBC, Citi Fund Services Ohio, Inc. (“Citi”), a wholly-owned subsidiary of Citigroup, Inc., serves as the Trust’s Sub-Administrator. For these services, Citi is entitled to a fee, payable by HSBC, at an annual rate equivalent to the fee rates set forth below:
| Based on Average Daily Net Assets of | | Fee Rate (%) |
| Up to $10 billion | | 0.0200 |
| In excess of $10 billion but not exceeding $20 billion | | 0.0150 |
| In excess of $20 billion but not exceeding $ 50 billion | | 0.0065 |
| In excess of $ 50 billion | | 0.0045 |
Under a Services Agreement between the Trust and Citi (the “Services Agreement”), Citi makes an individual available to serve as the Trust’s Chief Compliance Officer (the “CCO”). Citi also provides infrastructure and support in implementing the written policies and procedures comprising the Trust’s compliance program, including support services to the CCO. For the services provided under the Services Agreement, the Trust paid Citi $313,915 for the year ended October 31, 2019, plus reimbursement of certain out-of-pocket expenses. Expenses incurred by each Fund are reflected on the Statements of Operations as “Compliance Services.” Citi pays the salary and other compensation earned by individuals performing these services, as employees of Citi.
| HSBC FAMILY OF FUNDS |
| Notes to Financial Statements—as of October 31, 2019 (continued) |
In addition, Citi provides fund accounting services for each Fund under the Services Agreement. As fund accountant, Citi receives an annual fee per Fund and share class, subject to certain minimums and reimbursements of certain expenses. Citi receives additional fees paid by the Trust for regulatory administration services.
Distribution Arrangements:
Foreside Distribution Services, L.P. (“Foreside”), serves the Trust as Distributor (the “Distributor”). For the year ended October 31, 2019, Foreside, as Distributor, received $859 in commissions from sales of the Trust.
Shareholder Servicing:
The Trust has adopted a Shareholder Services Plan, which provides for payments to shareholder servicing agents for providing various shareholder services. For performing these services, the shareholder servicing agents receive a fee that is computed daily and paid monthly up to 0.25% of the average daily net assets of Class A Shares of the Funds.
The Trust has entered into shareholder services contracts with affiliated and unaffiliated financial intermediaries who provide shareholder services and other related services to their clients or customers who invest in the Funds under which the Funds will pay all or a portion of such fees earned to financial intermediaries for performing such services.
Transfer Agency:
DST Asset Manager Solutions, Inc. (“DST”) provides transfer agency services for each Fund. As transfer agent, DST receives a fee based on the number of funds and shareholder accounts, subject to certain minimums, and reimbursement of certain expenses.
Independent Trustees:
The Trust pays an annual retainer to each Independent Trustee, plus additional annual retainers to each Committee Chair and the Chairman of the Board. The Independent Trustees also receive a fee for each regular, special in-person, and telephonic meeting of the Board attended. The aggregate amount of the fees and expenses of the Independent Trustees are allocated amongst all the funds in the Trust and are presented in the Statements of Operations.
Fee Reductions:
The Investment Adviser has agreed to contractually limit through March 1, 2021, the total annual expenses of the Funds, exclusive of interest, taxes, brokerage commissions, extraordinary expenses, and estimated indirect expenses attributable to the Funds’ investments in investment companies, as applicable. The applicable classes of each Fund have their own expense limitations based on the average daily net assets for any full fiscal year as follows:
| | | | Contractual |
| | | | Expense |
| Fund | | Class | | Limitations(%) |
| High Yield Fund | | A | | | 0.90 | * | |
| High Yield Fund | | I | | | 0.55 | * | |
| Strategic Income Fund | | A | | | 1.05 | * | |
| Strategic Income Fund | | I | | | 0.70 | * | |
____________________
| * | Effective October 1, 2019. Prior to October 1, 2019, the contractual expense limitations for Class A and Class I Shares of each of High Yield Fund and Strategic Income Fund were 1.15% and 0.80%, respectively. |
| HSBC FAMILY OF FUNDS |
| Notes to Financial Statements—as of October 31, 2019 (continued) |
Any amounts contractually waived or reimbursed by the Investment Adviser will be subject to repayment by the respective Fund to the Investment Adviser within three years calculated monthly from when the waiver or reimbursement is recorded to the extent that the repayment will not cause the Fund’s operating expenses to exceed the contractual expense limit that was in effect at the time of such waiver or reimbursement. During the year ended October 31, 2019, the Investment Adviser did not recapture any of its prior contractual waivers or reimbursements. As of October 31, 2019, the repayments that may potentially be made by the Funds are as follows:
| | Amount Eligible Through |
| | 2022 ($) | | 2021 ($) | | 2020 ($) | | Total ($) |
| High Yield Fund | | 450,112 | | 428,942 | | 192,107 | | 1,071,161 |
| Strategic Income Fund | | 461,092 | | 454,308 | | 207,463 | | 1,122,863 |
Citi may voluntarily waive/reimburse fees to help support the expense limits of the Funds. In addition, HSBC, in its role as Investment Adviser and Administrator, may waive/reimburse additional fees at its discretion. Any voluntary fee waivers/reimbursements are not subject to recoupment in subsequent fiscal periods. Voluntary waivers/reimbursements may be eliminated or changed at any time. Amounts waived/reimbursed by the Investment Adviser, Administrator and Citi as Sub-Administrator are reported separately on the Statements of Operations, as applicable.
Other:
The Funds may purchase securities from an underwriting syndicate in which the principal underwriter or members of the syndicate are affiliated with the Adviser. For the year ended October 31, 2019, the Funds purchased the following amounts of such securities:
| | Purchases ($) |
| High Yield Fund | | 1,372,000 |
| Strategic Income Fund | | 1,644,000 |
The Funds may use related party broker-dealers. For the year ended October 31, 2019, there were no brokerage commissions paid to broker-dealers affiliated with the Adviser.
The Adviser and its affiliates may have lending, banking, brokerage, underwriting, or other business relationships with the issuers of the securities in which the Funds invest.
5. Investment Transactions:
Cost of purchases and proceeds from sales of securities (excluding securities maturing less than one year from acquisition) for the year ended October 31, 2019 were as follows:
| | Purchases ($) | | Sales ($) |
| High Yield Fund | | 25,013,450 | | 21,927,083 |
| Strategic Income Fund | | 26,368,345 | | 25,706,495 |
For the year ended October 31, 2019, purchases and sales of long-term U.S. government securities were as follows:
| | Purchases ($) | | Sales ($) |
| Strategic Income Fund | | 3,182,269 | | 2,515,750 |
| HSBC FAMILY OF FUNDS |
| Notes to Financial Statements—as of October 31, 2019 (continued) |
6. Investment Risks:
Derivatives Risk: The term “derivatives” covers a broad range of investments, including swaps, futures, options and currency forwards. In general, a derivative refers to any financial instrument whose value is derived, at least in part, from the price of another security or a specified index, asset or rate. The use of derivatives presents risks different from, and possibly greater than, the risks associated with investing directly in traditional securities. The use of derivatives can lead to losses because of adverse movements in the price or value of the underlying asset, index or rate, which may be magnified by certain features of the derivatives. These risks are heightened when derivatives are used to enhance a Fund’s return or as a substitute for a position or security, rather than solely to hedge (or offset) the risk of a position or security held by a Fund. The success of a Fund’s derivatives strategies will also be affected by its ability to assess and predict the impact of market or economic developments on the underlying asset, index or rate and the derivative itself, without the benefit of observing the performance of the derivative under all possible market conditions. Derivatives involve the risk of mispricing or improper valuation and the risk that changes in the value of the derivative may not correlate perfectly with the underlying asset, index or rate. Certain derivative positions may be difficult to close out when a Fund’s portfolio manager may believe it would be appropriate to do so. Also, suitable derivative transactions may not be available in all circumstances and there can be no assurance that a Fund will engage in these transactions to reduce exposure to other risks when that would be beneficial.
Emerging Markets Risk: The prices of securities in emerging markets can fluctuate more significantly than the prices of companies in more developed countries. Securities of emerging market issuers generally have more risk than securities issued by issuers in more developed markets. The less developed the country, the greater effect the risks may have in an investment, and as a result, an investment may exhibit a higher degree of volatility than either the general domestic securities market or the securities markets of developed foreign countries.
Foreign Securities Risk: Investments in foreign securities are generally considered riskier than investments in U.S. securities. Foreign securities, including those of emerging and frontier market issuers, are subject to additional risks, including international trade, political and regulatory risks.
High-Yield Securities Risk: Investments in high-yield securities (commonly referred to as “junk bonds”) are considered speculative investments and have significantly higher credit risk than investment-grade securities and tend to be less liquid than higher rated securities. The prices of high-yield securities, which may be more volatile than higher rated securities of similar maturity, may be more vulnerable to adverse market, economic, social or political conditions.
Interest Rate Risk: Fluctuations in interest rates may affect the yield, volatility, liquidity and value of investments in income producing or debt instruments. Generally, if interest rates rise, the value of such investments will fall. The risks associated with changing interest rates may have unpredictable effects on the markets and the Fund’s investments.
Loan-Related Investments Risk: Loan-related investments, such as loan participations and assignments, are subject to numerous risks. Although a loan obligation may be fully collateralized at the time of acquisition, the collateral may decline in value, be or become illiquid or less liquid, or lose all or substantially all of its value subsequent to investment. Many loan investments are subject to legal or contractual restrictions on resale and may be or become illiquid or less liquid and difficult to value. Increases in interest rates may cause an increase in loan obligation defaults. With respect to loan participations, the Fund may not always have direct recourse against a borrower if the borrower fails to pay scheduled principal and/or interest; may be subject to greater delays, expenses and risks than if the Fund had purchased a direct obligation of the borrower; and may be regarded as the creditor of the agent lender (rather than the borrower), subjecting the Fund to the creditworthiness of that lender as well. Transactions in many loans are subject to extended trade settlement periods, which could delay the Fund’s receipt of proceeds from the sale of a loan.
| HSBC FAMILY OF FUNDS |
| Notes to Financial Statements—as of October 31, 2019 (continued) |
Swap Risk: The use of swap agreements, which are agreements to exchange the return generated by one instrument for the return generated by another instrument (or index), and similar instruments involves risks that are different from those associated with ordinary portfolio securities transactions. For example, a Fund bears the risk of loss of the amount expected to be received under a swap agreement in the event of the default or bankruptcy of a swap agreement counterparty. Swap agreements may also subject a Fund to the risk that the counterparty to the transaction may not meet its obligations, causing the Fund’s value to decrease. Swap agreements may also be considered illiquid.
7. Federal Income Tax Information:
At October 31, 2019, the cost basis of investments for federal income tax purposes, gross unrealized appreciation, gross unrealized depreciation and net unrealized appreciation/depreciation were as follows:
| | | | | | | | | | Net Unrealized |
| | | | Tax Unrealized | | Tax Unrealized | | Appreciation/ |
| | Tax Cost ($) | | Appreciation ($) | | Depreciation ($) | | (Depreciation) ($)* |
| High Yield Fund | | 31,978,826 | | | 994,860 | | | (700,128) | | 294,732 |
| Strategic Income Fund | | 28,366,390 | | | 1,315,017 | | | (715,913) | | 599,104 |
____________________
| * | The difference between book-basis unrealized appreciation (depreciation) is attributable primarily to tax deferral of losses on wash sales and the realization for tax purposes of unrealized gains/losses on derivatives. |
The tax cost of investments generally includes the cost of securities and any upfront premiums paid or received on derivatives, as applicable. The tax unrealized appreciation/(depreciation) includes securities and derivatives that are not considered realized for tax purposes, as applicable.
The tax character of distributions paid by the Funds for the tax year ended October 31, 2019, was as follows:
| | Distributions paid from |
| | | | | | | | | | Total |
| | Ordinary | | Total Taxable | | Return of | | Distributions |
| | Income ($) | | Distributions ($) | | Capital ($) | | Paid ($)(1) |
| High Yield Fund | | 2,002,019 | | 2,002,019 | | | 93,268 | | | 2,095,287 |
| Strategic Income Fund | | 1,738,789 | | 1,738,789 | | | — | | | 1,738,789 |
____________________
| (1) | Total distributions paid may differ from the amount reported in the Statements of Changes in Net Assets because distributions are recognized when actually paid for tax purposes. |
The tax character of distributions paid by the Funds for the tax year ended October 31, 2018, was as follows:
| | Distributions paid from |
| | | | | | | | Total |
| | Ordinary | | Total Taxable | | Distributions |
| | Income ($) | | Distributions ($) | | Paid ($)(1) |
| High Yield Fund | | 1,490,708 | | | 1,490,708 | | | | 1,490,708 | |
| Strategic Income Fund | | 940,577 | | | 940,577 | | | | 940,577 | |
____________________
| (1) | Total distributions paid may differ from the amount reported in the Statements of Changes in Net Assets because distributions are recognized when actually paid for tax purposes. |
| HSBC FAMILY OF FUNDS |
| Notes to Financial Statements—as of October 31, 2019 (continued) |
As of the tax year ended October 31, 2019, the components of accumulated earnings/(deficit) on a tax basis for the Funds were as follows:
| | | | | | Undistributed | | | | | | | | | | | Accumulated | | Unrealized | | Total |
| | Undistributed | | Long-Term | | | | | | | | | | | Capital and | | Appreciation/ | | Accumulated |
| | Ordinary | | Capital | | Accumulated | | Distributions | | Other | | (Depreciation) | | Earnings/ |
| | Income ($) | | Gains ($) | | Earnings ($) | | Payable ($)* | | Losses ($) | | ($)(1) | | (Deficit) ($) |
| High Yield Fund | | | — | | | | — | | | | — | | | | (20,038 | ) | | | | (662,561 | ) | | | | 295,725 | | | | (386,874 | ) | |
| Strategic Income | | | | | | | | | | | | | | | | | | | | | | | | | | | | | | | |
| Fund | | | 100,681 | | | | 166,643 | | | | 267,324 | | | | (17,008 | ) | | | | — | | | | | 593,283 | | | | 843,599 | | |
____________________
| * | Distributions payable may differ from the amounts reported in the Statements of Assets and Liabilities because distributions payable on a tax basis include those dividends that will be reinvested. |
| (1) | The difference between book-basis and tax-basis unrealized appreciation/depreciation are attributable primarily to: tax deferral of losses on wash sales and the realization for tax purposes of unrealized gains/losses on derivatives. |
As of the tax year ended October 31, 2019, the High Yield Fund has net capital loss carryforwards (“CLCFs”) not subject to expiration as summarized in the table below. The Board does not intend to authorize a distribution of any realized gain for the Funds until any applicable CLCF has been offset or expires.
| | Short Term | | Long Term | | |
| | Amount ($) | | Amount ($) | | Total ($) |
| High Yield Fund | | 443,272 | | 219,289 | | 662,561 |
During the year ended October 31, 2019, the Strategic Income Fund utilized CLCFs as follows:
| | | | | | Total ($) |
| Strategic Income Fund | | 46,013 |
Under current law, capital losses and specified ordinary losses realized after October 31 and non-specified ordinary losses incurred after December 31 (ordinary losses collectively known as “late year ordinary loss”) may be deferred and treated as occurring on the first business day of the following fiscal year. As of the tax year ended October 31, 2019, the Funds had no deferred losses.
The amount and character of net investment income and net realized gains distributed are determined in accordance with federal income tax regulations, which may differ from GAAP. These “book/tax” differences are either considered temporary or permanent in nature. To the extent these differences are permanent in nature (e.g., certain gain/loss, differing treatment on certain swap agreements, and certain distributions), such amounts are reclassified within the composition of net assets based on their federal tax-basis treatment; temporary differences (e.g., wash losses and the realization for tax purposes of unrealized gains/losses on derivatives) do not require reclassification. The Funds may utilize equalization accounting for tax purposes and designate earnings and profits, including net realized gains distributed to shareholders on redemption of shares, as part of the dividends paid deduction for income tax purposes. To the extent distributions to shareholders from net investment income and net realized gains exceed net investment income and net realized gains for tax purposes, they are reported as distributions of capital.
On the Statements of Assets and Liabilities, as a result of permanent book-to-tax differences, reclassification adjustments were made as follows:
| | Accumulated Net Investment | | | | | | | | | |
| | Income/(Distributions | | Accumulated Net | | Paid-In |
| | in Excess of Net | | Realized | | Capital |
| | Investment Income) ($)* | | Gains/(Losses) ($)* | | ($) |
| High Yield Fund | | | 181,983 | | | | (181,983 | ) | | | | — | |
| Strategic Income Fund | | | 327,353 | | | | (327,352 | ) | | | | (1 | ) |
____________________
| * | These components of capital are presented together as “Total distributable earnings/(loss)” on the Statements of Assets and Liabilities. |
| HSBC FAMILY OF FUNDS |
| Notes to Financial Statements—as of October 31, 2019 (continued) |
The reclassifications for the Funds relate primarily to foreign currency gains or losses, and the differing treatment of investments in swap agreements.
8. Significant Shareholders:
Shareholders, including other funds, individuals, and accounts, as well as each Fund’s investment manager(s) and/or investment personnel, may from time to time own (beneficially or of record) a significant percentage of the Fund’s Shares and can be considered to “control” the Fund when that ownership exceeds 25% of the Fund’s assets (and which may differ from control as determined in accordance with GAAP).
The following list includes the Funds which had individual shareholder accounts with ownership of voting securities greater than 10% of the total outstanding voting securities but less than 25% and/or accounts with ownership of voting securities greater than 25% of the total outstanding voting securities. Significant transactions by these shareholder accounts may negatively impact the Funds’ performance.
| | Number of | | | | | | |
| | shareholders with | | | | Number of | | |
| | ownership of voting | | | | shareholders with | | |
| | securities of the | | | | ownership of voting | | |
| | Portfolio greater | | | | securities of the | | |
| | than 10% and less | | % owned in | | Portfolio greater | | % owned in |
| | than 25% of the total | | aggregate by | | than 25% of the total | | aggregate by |
| | Portfolio’s outstanding | | 10%-25% | | Portfolio’s outstanding | | greater than 25% |
| Fund | | voting securities | | shareholders | | voting securities | | shareholders |
| High Yield Fund | | — | | — | | 1 | | 90%* |
| Strategic Income Fund | | — | | — | | 1 | | 99%* |
____________________
| * | Owned by the Investment Adviser or an affiliate. |
9. Recent Accounting Pronouncements:
In March 2017, the FASB issued Accounting Standards Update No. 2017-08 “Premium Amortization on Purchased Callable Debt Securities” (“ASU 2017-08”), which shortens the premium amortization period for purchased non-contingently callable debt securities. ASU 2017-08 specifies that the premium amortization period ends at the earliest call date, for purchased non-contingently callable debt securities. The Funds will adopt and apply ASU 2017-08 on a modified retrospective basis through a cumulative-effect adjustment as of November 1, 2019. As a result of the adoption of ASU 2017-08, as of November 1, 2019, the amortized cost basis of investments will be reduced and unrealized appreciation of investments will be increased, but there will be no impact on net assets or overall results from operations.
10. Subsequent Events:
Management has evaluated subsequent events through the date these financial statements were issued. Based on the evaluation, no adjustments or additional disclosures were required to the financial statements as of October 31, 2019.
Report of Independent Registered Public Accounting Firm
To the Board of Trustees of HSBC Funds and Shareholders of HSBC High Yield Fund and HSBC Strategic Income Fund
Opinions on the Financial Statements
We have audited the accompanying statements of assets and liabilities, including the schedules of portfolio investments, of HSBC High Yield Fund and HSBC Strategic Income Fund (two of the funds constituting HSBC Funds, hereafter collectively referred to as the “Funds”) as of October 31, 2019, the related statements of operations for the year ended October 31, 2019, the statements of changes in net assets for each of the two years in the period ended October 31, 2019, including the related notes, and the financial highlights for each of the periods indicated therein (collectively referred to as the “financial statements”). In our opinion, the financial statements present fairly, in all material respects, the financial position of each of the Funds as of October 31, 2019, the results of each of their operations for the year then ended, the changes in each of their net assets for each of the two years in the period ended October 31, 2019 and each of the financial highlights for each of the periods indicated therein in conformity with accounting principles generally accepted in the United States of America.
Basis for Opinions
These financial statements are the responsibility of the Funds’ management. Our responsibility is to express an opinion on the Funds’ financial statements based on our audits. We are a public accounting firm registered with the Public Company Accounting Oversight Board (United States) (“PCAOB”) and are required to be independent with respect to the Funds in accordance with the U.S. federal securities laws and the applicable rules and regulations of the Securities and Exchange Commission and the PCAOB.
We conducted our audits of these financial statements in accordance with the standards of the PCAOB. Those standards require that we plan and perform the audit to obtain reasonable assurance about whether the financial statements are free of material misstatement, whether due to error or fraud.
Report of Independent Registered Public Accounting Firm (continued)
Our audits included performing procedures to assess the risks of material misstatement of the financial statements, whether due to error or fraud, and performing procedures that respond to those risks. Such procedures included examining, on a test basis, evidence regarding the amounts and disclosures in the financial statements. Our audits also included evaluating the accounting principles used and significant estimates made by management, as well as evaluating the overall presentation of the financial statements. Our procedures included confirmation of securities owned as of October 31, 2019 by correspondence with the custodian and brokers; when replies were not received from brokers, we performed other auditing procedures. We believe that our audits provide a reasonable basis for our opinions.
/s/ PricewaterhouseCoopers LLP
New York, New York
December 20, 2019
We have served as the auditor of one or more investment companies in the HSBCFunds since 2015.
| HSBC FAMILY OF FUNDS |
| Other Federal Income Tax Information—as of October 31, 2019 (Unaudited) |
During the year ended October 31, 2019, the following Funds designated the maximum amount allowable as interest-related dividends for certain non-U.S. resident investors:
| | Qualified Interest |
| | Income % |
| High Yield Fund | | | 73.60 | % | |
| Strategic Income Fund | | | 53.76 | % | |
| HSBC FAMILY OF FUNDS |
| Table of Shareholder Expenses - as of October 31, 2019 (Unaudited) |
As a shareholder of the Funds, you incur two types of costs: (1) transaction costs, including sales charges (loads) on purchases, redemption fees and exchange fees; and (2) ongoing costs, including management fees, distribution fees and other Fund expenses. These examples are intended to help you understand your ongoing costs (in dollars) of investing in the Funds and to compare the cost with the ongoing costs of investing in other mutual funds.
Actual Expenses
The actual examples are based on an investment of $1,000 invested at the beginning of a six-month period beginning May 1, 2019 and held through the period ended October 31, 2019.
The columns below under the heading entitled “Actual” provide information about actual account values and actual expenses. You may use this information, together with the amount you invested, to estimate the expenses that you paid over the period. Simply divide your account value by $1,000 (for example, an $8,600 account value divided by $1,000 = 8.6), then multiply the result by the number in the table under the heading entitled “Actual Expenses Paid During the Period” to estimate the expenses you paid on your account during this period.
Hypothetical Expenses for Comparison Purposes
The hypothetical expense examples are based on an investment of $1,000 invested at the beginning of a six-month period and held throughout the period ended October 31, 2019.
The columns below under the heading entitled “Hypothetical” provide information about hypothetical account values and hypothetical expenses based on each Fund’s actual expense ratio and an assumed rate of return of 5% per year before expenses, which is not each Fund’s actual return. The hypothetical account values and expenses may not be used to estimate the actual ending account balance or expenses you paid for the period. You may use this information to compare this 5% hypothetical example with the 5% hypothetical examples that appear in the shareholder reports of other funds.
Please note that the expenses shown in the table are meant to highlight your ongoing costs only and do not reflect any transactional costs, such as sales charges (loads), redemption fees, or exchange fees. Therefore, the columns under the heading entitled “Hypothetical” are useful in comparing ongoing costs only, and will not help you determine the relative total costs of owning different funds. In addition, if these transactional costs were included, your costs would have been higher.
| | | | | | | | | | | | | | | | | | | | | | Hypothetical |
| | | | | | | | | | | | Actual | | (5% return before expenses) |
| | Annualized | | Beginning | | Ending | | Expenses | | Ending | | Expenses |
| | Expense Ratio | | Account Value | | Account Value | | Paid During | | Account Value | | Paid During |
| | During Period | | 5/1/19 | | 10/31/19 | | Period* | | 10/31/19 | | Period* |
| High Yield Fund - Class A | | | 1.10 | % | | | | $ | 1,000.00 | | | | $ | 1,029.50 | | | | $ | 5.63 | | | | $ | 1,019.66 | | | | $ | 5.60 | |
| High Yield Fund - Class I | | | 0.76 | % | | | | | 1,000.00 | | | | | 1,032.20 | | | | | 3.89 | | | | | 1,021.37 | | | | | 3.87 | |
| Strategic Income Fund - Class A | | | 1.12 | % | | | | | 1,000.00 | | | | | 1,039.00 | | | | | 5.76 | | | | | 1,019.56 | | | | | 5.70 | |
| Strategic Income Fund - Class I | | | 0.78 | % | | | | | 1,000.00 | | | | | 1,040.00 | | | | | 4.01 | | | | | 1,021.27 | | | | | 3.97 | |
____________________
| * | Expenses are equal to the average account value over the period multiplied by the Fund’s annualized expense ratio, multiplied by 184/365 (the number of days in the most recent fiscal half-year divided by the number of days in the fiscal year. |
| HSBC FAMILY OF FUNDS |
| Board of Trustees and Officers (Unaudited) |
MANAGEMENT OF THE TRUST
The following table contains information regarding the HSBC Family of Funds’ Board of Trustees (“Trustees”). The HSBC Family of Funds’ Statement of Additional Information includes additional information about the Trustees and is available, without charge, upon request by calling (888) 525-5757.
| | | | | | | | Portfolios in | | |
| | Position(s) | | Term of Office | | | | Fund Complex | | Other Directorships |
| | Held with | | and Length of | | Principal Occupation(s) | | Overseen By | | Held by Trustee |
| Name, Address, Age | | Funds | | Time Served | | During Past 5 Years | | Trustee* | | During Past 5 Years** |
| NON-INTERESTED | | | | | | | | | | |
| TRUSTEES | | | | | | | | | | |
| | | | | | | | | | | |
| MARCIA L. BECK | | Trustee | | Indefinite; | | Private Investor (1999 – present) | | 8 | | None |
| P.O. Box 182845 | | | | 2008 to | | | | | | |
| Columbus, OH | | | | present | | | | | | |
| 43218-3035 | | | | | | | | | | |
| Age: 64 | | | | | | | | | | |
| | | | | | | | | | | |
| SUSAN C. GAUSE | | Trustee | | Indefinite; | | Private Investor (2003 - present) | | 8 | | Metropolitan Series Fund |
| P.O. Box 182845 | | | | 2013 to | | | | | | (2012 – present); and |
| Columbus, OH | | | | present | | | | | | Met Investors Series |
| 43218-3035 | | | | | | | | | | Trust (2008 – present) |
| Age: 67 | | | | | | | | | | |
| | | | | | | | | | | |
| SUSAN S. HUANG | | Trustee | | Indefinite; | | Private Investor (2000 - present) | | 8 | | None |
| P.O. Box 182845 | | | | 2008 to | | | | | | |
| Columbus, OH | | | | present | | | | | | |
| 43218-3035 | | | | | | | | | | |
| Age: 65 | | | | | | | | | | |
| | | | | | | | | | | |
| THOMAS F. ROBARDS | | Chairman and | | Indefinite; | | Private Investor (2003 - present) | | 8 | | Ellington Residential |
| P.O. Box 182845 | | Trustee | | 2005 to | | | | | | Mortgage REIT (NYSE |
| Columbus, OH | | | | present | | | | | | listed real estate |
| 43218-3035 | | | | | | | | | | investment trust) (2013 |
| Age: 73 | | | | | | | | | | – present); Ellington |
| | | | | | | | | | Financial Inc. (NYSE |
| | | | | | | | | | listed financial services |
| | | | | | | | | | company) (2007 – |
| | | | | | | | | | present); and Overseas |
| | | | | | | | | | Shipholding Group (OSG) |
| | | | | | | | | | (NYSE listed company) |
| | | | | | | | | | (2005-2014) |
| | | | | | | | | | |
| | | | | | | | | | | |
| INTERESTED TRUSTEE | | | | | | | | | | |
| | | | | | | | | | | |
| DEBORAH A. HAZELL*** | | Trustee | | Indefinite; | | Director and Chief Executive Officer, | | 8 | | None |
| 452 Fifth Avenue | | | | 2011 to | | HSBC Global Asset Management (USA) | | | | |
| New York | | | | present | | Inc. (2011 - present) | | | | |
| NY 10018 | | | | | | | | | | |
| Age: 56 | | | | | | | | | | |
____________________
| * | Includes all series of the HSBC Funds. |
| ** | This column includes only directorships of companies required to report to the SEC under the Securities Exchange Act of 1934 (i.e., “public companies”) or other investment companies registered under the 1940 Act. |
| *** | Ms. Hazell is considered to be an “Interested Trustee” because she holds positions with HSBC Global Asset Management (USA) Inc. |
| HSBC FAMILY OF FUNDS |
| Board of Trustees and Officers (Unaudited) (continued) |
| | Position(s) Held | | Term of Office and | | Principal Occupation(s) |
| Name, Address, Age | | Funds | | Length of Time Served | | During Past 5 Years |
| OFFICERS | | | | | | |
| | | | | | | |
| RICHARD A. FABIETTI | | President | | One year; | | Senior Vice President, HSBC Global Asset Management (USA) |
| 452 Fifth Avenue | | | | 2004 to present | | Inc. (1998 - present) |
| New York, NY 10018 | | | | | | |
| Age: 61 | | | | | | |
| | | | | | | |
| JAMES D. LEVY | | Vice President | | One year; | | Vice President, Product Management, HSBC Global Asset |
| 452 Fifth Avenue | | | | 2014 to present | | Management (USA) Inc. (2014 – present); Vice President, |
| New York, NY 10018 | | | | | | Mutual Funds Product Development, GE Asset Management Inc. |
| Age: 56 | | | | | | (2007 – 2014) |
| | | | | | | |
| LAUREN STUNTEBECK | | Treasurer | | One year; | | Vice President, Financial Administration, Citi Fund Services |
| 4400 Easton Commons, | | | | 2019 to present | | (2019 - present); Senior Manager, Audit, KPMG LLP (2016-2019); |
| Suite 200 | | | | | | Manager, Audit, KPMG LLP (2014-2016) |
| Columbus, OH 43219-3035 | | | | | | |
| Age: 32 | | | | | | |
| | | | | | | |
| IOANNIS TZOUGANATOS* | | Secretary | | One year; | | Vice President, Regulatory Administration, Citi Fund Services |
| Prudential Center | | | | 2015 to present | | (2008 - present) |
| 800 Boylston Street, 24thFloor | | | | | | |
| Boston, MA 02199 | | | | | | |
| Age: 43 | | | | | | |
| | | | | | | |
| CHARLES BOOTH* | | Chief Compliance | | One year; | | Director and Compliance Officer, CCO Services, |
| 4400 Easton Commons, | | Officer | | 2015 to present | | Citi Fund Services (1988 - present) |
| Suite 200 | | | | | | |
| Columbus, | | | | | | |
| OH 43219-3035 | | | | | | |
| Age: 59 | | | | | | |
| | | | | | | |
| JAMES M. CURTIS | | Chief Legal Officer | | One year; | | Associate General Counsel, HSBC Securities (USA) Inc. (2005- |
| 452 Fifth Avenue | | | | 2018 to present | | 2017); Associate General Counsel, HSBC Technology & Services |
| New York, NY 10018 | | | | | | (USA) Inc. (2018-present) |
| Age: 51 | | | | | | |
____________________
| * | Mr. Tzouganatos and Mr. Booth also are officers of other investment companies of which Citi (or an affiliate) is the administrator or sub-administrator. |
| HSBC FAMILY OF FUNDS |
| Other Information (Unaudited) |
Information regarding how the Funds voted proxies relating to portfolio securities during the most recent 12-month period ended June 30th is available (i) without charge, upon request, by calling 1-800-525-5757 for HSBC Bank USA and HSBC Brokerage (USA) Inc. clients and 1-800-782-8183 for all other shareholders; (ii) on the Funds’ website at www.investorfunds.us.hsbc.com; and (iii) on the Security and Exchange Commission’s (“SEC”) website at http://www.sec.gov.
The Funds file their portfolio holdings information for each month in a fiscal quarter within 60 days after the end of the relevant fiscal quarter with the SEC on Form N-PORT. Portfolio holdings information for the third month of each fiscal quarter is available on the SEC’s website at http://www.sec.gov. The Funds’ Schedules of Investments will be available no later than 60 days after each period end, without charge, on the Funds’ website at www.investorfunds.us.hsbc.com.
An investment in a Fund is not a deposit of HSBC Bank USA, National Association, and is not insured or guaranteed by the Federal Deposit Insurance Corporation or any other government agency.
HSBC FAMILY OF FUNDS:
INVESTMENT ADVISER AND ADMINISTRATOR
HSBC Global Asset Management (USA) Inc.
452 Fifth Avenue
New York, NY 10018
SHAREHOLDER SERVICING AGENTS
For HSBC Bank USA, N.A. and
HSBC Securities (USA) Inc. Clients:
HSBC Bank USA, N.A.
452 Fifth Avenue
New York, NY 10018
1-888-525-5757
SUB-ADVISERS
HSBC Strategic Income Fund
HSBC Global Asset Management (UK) Limited
78 St. James Street
London, United Kingdom, SW1A 1EJ
For All Other Shareholders:
HSBC Funds
P.O. Box 8106
Boston, MA 02266-8106
1-800-782-8183
TRANSFER AGENT
DST Asset Manager Solutions, Inc.
2000 Crown Colony Drive
Quincy, MA 02169
DISTRIBUTOR
Foreside Distribution Services, L.P.
Three Canal Plaza, Suite 100
Portland, ME 04101
CUSTODIAN
The Northern Trust Company
50 South LaSalle Street
Chicago, IL 60603
INDEPENDENT REGISTERED PUBLIC ACCOUNTING FIRM
PricewaterhouseCoopers LLP
300 Madison Avenue
New York, NY 10017
LEGAL COUNSEL
Dechert LLP
1900 K Street, N.W.
Washington, D.C. 20006

| Investment products: |
ARE NOT A
BANK DEPOSIT
OR OBLIGATION
OF THE BANK
OR ANY OF ITS
AFFILIATES | ARE NOT
FDIC
INSURED | ARE NOT
INSURED BY
ANY FEDERAL
GOVERNMENT
AGENCY |
ARE NOT GUARANTEED BY
THE BANK OR ANY OF ITS
AFFILIATES | MAY LOSE
VALUE |
Investment products are offered by HSBC Securities (USA) Inc. (HSI), member NYSE/FINRA/SIPC. HSI is an affiliate of HSBC Bank USA, N.A. Investment products: Are not a deposit or other obligation of the bank or any of its affiliates; Not FDIC insured or insured by any federal government agency of the United States; Not guaranteed by the bank or any of its affiliates; and are subject to investment risk, including possible loss of principal invested.
Investors should consider the investment objectives, risks, charges, and expenses of the investment company carefully before investing. The prospectus contains this and other important information about the investment company. For clients of HSBC Securities (USA) Inc., please call 1-888-525-5757 for more information. For other investors and prospective investors, please call the Funds directly at 1-800-782-8183 or visit our website at www.emfunds.us.hsbc.com. Investors should read the prospectus carefully before investing or sending money.
Item 2. Code of Ethics.
(a) The registrant has adopted a code of ethics that applies to the registrant’s principal executive officer, principal financial officer, principal accounting officer or controller, or persons performing similar functions. This code of ethics is included as an Exhibit.
(b) During the period covered by the report, with respect to the registrant's code of ethics that applies to its principal executive officer, principal financial officer, principal accounting officer or controller, or persons performing similar functions; there have been no amendments to, nor any waivers granted from, a provision that relates to any element of the code of ethics definition enumerated in paragraph (b) of this Item 2.
Item 3. Audit Committee Financial Expert.
3(a)(1) The registrant’s board of directors has determined that the registrant has at least one audit committee financial expert serving on its audit committee.
3(a)(2) The audit committee financial experts are Tom Robards and Marcia Beck, who are “independent” for purposes of this Item 3 of Form N-CSR.
Item 4. Principal Accountant Fees and Services.
| (a)Audit Fees, |
| | 2019 | | $242,630 |
| 2018 | | $283,225 |
| (b)Audit-Related Fees, |
| | 2019 | | $0 |
| 2018 | | $0 |
| | |
| (c)Tax Fees, |
| 2019 | | $115,700 |
| 2018 | | $115,700 |
| |
| Fees for both 2018 and 2019 relate primarily to the preparation of federal and state income and excise tax returns and the review of excise tax distributions. |
| | |
| (d)All Other Fees, |
| 2019 | | $0 |
| 2018 | | $0 |
(e)(1) The audit committee is required to pre-approve all audit and permitted non-audit services performed by the registrant’s independent auditors in accordance with the audit committee charter and the Investment Company Act of 1940.
| (e)(2) |
| | 2019 | | 0% |
| 2018 | | 0% |
| | |
| (f) Not applicable. |
| |
| (g)Non-Audit Fees, |
| 2019 | | $3,407,000 |
| 2018 | | $2,279,700 |
Fees for 2018 and 2019 represent PricewaterhouseCoopers LLP services provided to the Funds and to HSBC Bank and affiliates related to general corporate, state and local tax assistance, accounting matters and various advisory projects.
(h) The audit committee considered the nonaudit services rendered to the registrant’s investment adviser and any entity controlling, controlled by, or under common control with the investment adviser, and believes the services are compatible with the principal accountant’s independence.
Item 5. Audit Committee of Listed Registrants.
Not applicable.
Item 6. Investments.
(a) Included as a part of the report to shareholders filed under Item 1.
(b) Not applicable.
Item 7. Disclosure of Proxy Voting Policies and Procedures for Closed-End Management Investment Companies.
Not applicable.
Item 8. Portfolio Managers of Closed-End Management Investment Companies.
Not applicable.
Item 9. Purchases of Equity Securities by Closed-End Management Investment Company and Affiliated Purchasers.
Not applicable.
Item 10. Submission of Matters to a Vote of Security Holders.
Not applicable.
Item 11. Controls and Procedures.
(a)The registrant’s principal executive officer and principal financial officer have concluded, based on their evaluation of the registrant's disclosure controls and procedures as conducted within 90 days of the filing date of this report, that these disclosure controls and procedures are adequately designed and are operating effectively to ensure that information required to be disclosed by the registrant on Form N-CSR is recorded, processed, summarized and reported within the time periods specified in the Securities and Exchange Commission's rules and forms.
(b)There were no changes in the registrant’s internal control over financial reporting (as defined in Rule 30a-3(d) under the Act (17 CFR 270.30a-3(d)) that occurred during the period covered by this report that have materially affected or are reasonably likely to materially affect, the registrant’s internal control over financial reporting.
Item 12. Disclosure of Securities Lending Activities for Closed-End Management Investment Companies.
Not applicable.
Item 13. Exhibits.
(a)(1) The code of ethics that is the subject of the disclosure required by Item 2 is attached hereto.
(a)(2) Certifications pursuant to Rule 30a-2(a) are attached hereto.
(a)(3) Not applicable.
(b) Certifications pursuant to Rule 30a-2(b) are furnished herewith.
SIGNATURES
Pursuant to the requirements of the Securities Exchange Act of 1934 and the Investment Company Act of 1940, the registrant has duly caused this report to be signed on its behalf by the undersigned, thereunto duly authorized.
| By (Signature and Title) | /s/ Richard A. Fabietti |
| Richard A. Fabietti |
| President |
Pursuant to the requirements of the Securities Exchange Act of 1934 and the Investment Company Act of 1940, this report has been signed below by the following persons on behalf of the registrant and in the capacities and on the dates indicated.
| By (Signature and Title) | /s/ Richard A. Fabietti |
| Richard A. Fabietti |
| President |
| By (Signature and Title) | /s/ Lauren Stuntebeck |
| Lauren Stuntebeck |
| Treasurer |