As filed with the Securities and Exchange Commission on May 14, 2020
UNITED STATES
SECURITIES AND EXCHANGE COMMISSION
Washington, D.C. 20549
FORMN-CSR
CERTIFIED SHAREHOLDER REPORT OF REGISTERED
MANAGEMENT INVESTMENT COMPANIES
Investment Company Act File Number811-4786
Ariel Investment Trust
(Exact name of registrant as specified in charter)
200 East Randolph Street
Suite 2900
Chicago, Illinois, 60601
(Address of principal executive offices) (Zip code)
Mareilé B. Cusack, Esq.
200 East Randolph Street
Suite 2900
Chicago, Illinois 60601
(Name and address of agent for service)
with a copy to:
Arthur Don, Esq.
Greenberg Traurig, LLP
77 West Wacker Drive
Suite 3100
Chicago, IL 60601
Registrant’s telephone number, including area code: (312)726-0140
Date of fiscal year end:September 30
Date of reporting period:March 31, 2020
Item 1. Reports to Stockholders.
(a) The following is a copy of the report transmitted to shareholders pursuant to Rule30e-1 under the Investment Company Act of 1940 (the “Act”) (17 CFR270.30e-1):


The patient investor
SEMI-ANNUAL REPORT: 03/31/20
Ariel Fund
Ariel Appreciation Fund
Ariel Focus Fund
Ariel International Fund
Ariel Global Fund
|
Beginning March 31, 2021, we will be saving more trees by offering our quarterly reports electronically rather than printed and delivered via U.S. mail. Turn the page for more information and how to best receive The Patient Investor. |
IMPORTANT INFORMATION ON HOW TO RECEIVE YOUR SHAREHOLDER REPORTS IN THE FUTURE
Beginning on March 31, 2021, as permitted by regulations adopted by the Securities and Exchange Commission, the Funds will no longer send paper copies of shareholder reports by mail, unless you specifically request paper copies from the Funds or from your financial intermediary, such as your broker-dealer or bank. The reports will be available on our website atarielinvestments.com/prospectus-and-reports and may also be available on the website hosted by your financial intermediary. You will receive a notification in the mail each time a report is posted, which will include a website address to access the report.
You may choose to receive all future reports in paper free of charge. If you already elected to receive shareholder reports electronically, you will not be affected by this change and you need not take any action. You may choose to receive shareholder reports and other communications electronically from the Fund or your financial intermediary. Our direct shareholders simply need to follow three easy steps described on our website atarielinvestments.com/e-delivery.
Alternatively, you can inform the Funds or your financial intermediary that you wish to continue receiving paper copies of your shareholder reports by calling us at 800.292.7435 or, if applicable, by contacting your financial intermediary. Your election to receive reports in paper will apply to all Funds held within the Ariel Investment Trust fund complex or held through your financial intermediary.
Ariel Investment Trust
c/o U.S. Bank Global Fund Services
P.O. Box 701
Milwaukee, WI 53201-0701
800.292.7435
• arielinvestments.com
• linkedin.com/company/ariel-investments
• instagram.com/arielinvestments
• twitter.com/arielinvests
Table of contents

| | |
 | |  |
| |
| John W. Rogers, Jr. | | Mellody Hobson |
Chairman and Co-CEO | | Co-CEO and President |
Average annual total returnsas of 03/31/20
| | | | | | | | | | | | |
| | | 1Q20 | | 1-year | | 3-year | | 5-year | | 10-year | | Since
inception* |
| | | | | | |
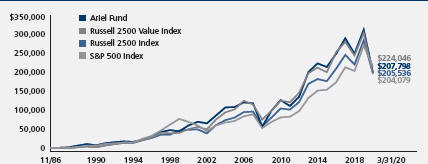
Ariel Fund | | – 35.14% | | – 31.23% | | – 8.78% | | – 3.42% | | 5.90% | | 9.51% |
| | | | | | |
Russell 2500TMValue Index | | – 34.64 | | – 28.60 | | – 8.40 | | – 2.14 | | 5.65 | | 9.45 |
| | | | | | |
Russell 2500TMIndex | | – 29.72 | | – 22.47 | | – 3.10 | | 0.49 | | 7.73 | | 9.47 |
| | | | | | |
S&P 500®Index | | – 19.60 | | – 6.98 | | 5.10 | | 6.73 | | 10.53 | | 9.76 |
* The inception date for Ariel Fund is 11/06/86.
Average annual total returnsas of 03/31/20
| | | | | | | | | | | | |
| | | 1Q20 | | 1-year | | 3-year | | 5-year | | 10-year | | Since
inception* |
| | | | | | |
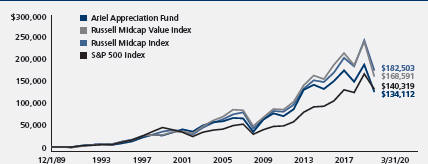
Ariel Appreciation Fund | | – 31.43% | | – 26.09% | | – 7.64% | | – 3.05% | | 5.72% | | 8.94% |
| | | | | | |
Russell Midcap®Value Index | | – 31.71 | | – 24.13 | | – 5.97 | | – 0.76 | | 7.22 | | 9.76 |
| | | | | | |
Russell Midcap®Index | | – 27.07 | | – 18.31 | | – 0.81 | | 1.85 | | 8.77 | | 10.05 |
| | | | | | |
| S&P 500®Index | | – 19.60 | | – 6.98 | | 5.10 | | 6.73 | | 10.53 | | 9.10 |
* The inception date for Ariel Appreciation Fund is 12/01/89.
Performance data quoted represents past performance. Past performance does not guarantee future results. All performance assumes the reinvestment of dividends and capital gains and represents returns of the Investor Class shares. The investment return and principal value of an investment will fluctuate so that an investor’s shares, when redeemed, may be worth more or less than their original cost. Current performance may be lower or higher than the performance data quoted. Performance data current to the most recentmonth-end for Ariel Fund and Ariel Appreciation Fund may be obtained by visiting our website, arielinvestments.com.
ARIELINVESTMENTS.COM 3
DEAR FELLOW SHAREHOLDER:
As our world confronts the most daunting challenge of this century, we want to start by expressing our deepest condolences to those who have lost family, friends and colleagues as a result of theCOVID-19 pandemic. We also want to offer our sincerest and heartfelt thanks to those on the frontlines who are risking their own health and well-being for our common good. No words can adequately convey our appreciation.
There is a surreal quality to life these days. Just a few weeks ago, the U.S. economy was literally humming: unemployment was at a50-year low; investors continued to benefit from the longest bull market in history; and with Chinese trade war tensions subsiding, the 2020 outlook was promising. All of this changed suddenly. AsBarron’s noted,“COVID-19 is a health crisis, an economic crisis, and a financial crisis rolled into one…”1 With the majority of our citizens sheltered in place andnon-essential businesses forcibly shut down, records were smashed when nearly 10 million people filed for unemployment insurance in the second half of March and the stock marketsee-sawed frombull-to-bear status in just 20 days—“the fastest 20% drop in history.”2
While there were degrees of bloodletting, nothing was spared. Large stocks lost less thanmid-sized issues, which did better than the small fries. Once again, growthier names continued to outperform their value counterparts. Here it is worth noting, theeye-popping performance gap between large cap growth and small cap value that has persisted in recent years was blown out even further. Although we hate to lose money, we take solace in the fact that we mostly kept up with our primary benchmarks. For the three months ending March 31, 2020, Ariel Fund fell-35.14% versus-34.64% for the Russell 2500 Value Index. The Russell 2500 Index dropped-29.72%. The slightly larger stocks in Ariel Appreciation Fund declined-31.43% compared to-31.71% for the Russell Midcap Value Index and-27.07% for the Russell Midcap Index. Under the circumstances, we were not surprised our Consumer Discretionary issues in both portfolios languished during
the period. By contrast, our stock picking in the Financial Services sector positively contributed to our results.
UNPRECEDENTED 4.0
One might think there are few times in life when the extraordinary plays out. Famed economist Nassim Taleb labeled such events “black swans” after birds that are real but exceedingly rare. We have been pondering this notion of late and in so doing, realize that we have lived through quite a few “unprecedented” moments in our firm’s37-year history. In hindsight, each circumstance appears to have added to our muscle memory and strengthened our collective ability to manage in a crisis.
“While a worldwide pandemic may be in a category all its own, we believe everything we have experienced up to this moment has helped prepare us for this new unknown.”
Early on, there was the Crash of 1987 when the Dow Jones Industrials plummeted-22%—the biggest one day drop in its history. Ariel was four years old as a firm and, like any small child, just learning our way in the world. When confronted with the falling wreckage on that fateful Monday, we did not run for cover. Instead, we called our clients to ask for more money to take advantage of what we thought to be “once in a lifetime bargains.” This contrarian lens served us well and drove our outperformance as the market recovered all losses by September 1989.
We all remember where we were on the morning of Tuesday, September 11, 2001 when New York’s Twin Towers fell in a terrorist attack. It was a senseless and unfathomable event that not only took thousands of precious lives, but initiated a new level of security protocol
| 1 | Levisohn, Ben. “Crisis Playbook.”Barron’s.March 16, 2020. Cover. |
| 2 | Winck, Ben. “The Dow plunged into a bear market in just 20 days—the fastest 20% drop in history.”BusinessInsider.March 12, 2020. |
4 SLOW AND STEADY WINS THE RACE
into our everyday existence. We waited out the following six days of a stock market shutdown by planning our “buys” in what many feared would be a very bad open. There was no way of knowing how big the losses would be, but our long-term, patient approach told us that the pain would not last forever. (While those six days seemed like an eternity, they pale in comparison to the4-month stock market closure that occurred at the start of World War I). Again, going against the grain paid off. “The market dropped 5% on reopen and sold off 12% at its lowest point shortly after September 11, which is less than many had feared just days before…One month after the attacks, the S&P 500 was back at its level from September 10.”3
Hands down, the19-month long Global Financial Crisis that started in 2008 represents the most challenging time in our firm’s history. We underperformed our benchmarks which led to significant client attrition. The period tested our mettle and led to a great deal of soul searching. Were-examined every aspect of our philosophy and processes. As a result, we implemented our own proprietary moat and debt ratings as well as formalized the role of the devil’s advocate. There is little question that we came away from this period with a profoundly heightened awareness of liquidity and risk of financial distress broadly. Realizing that contrarian buying in the face of weakened balance sheets ends in tears, we significantly improved our balance sheet work and added several more layers of rigor to our analysis. We also leaned on behavioral finance concepts to help us grow as effective and evolved contrarians. In the end, our strong returns coming out of the crisis underscored the merits of our learning culture and furthered our convictions.
CRISIS PLAYBOOK
While a worldwide pandemic may be in a category all its own, we believe everything we have experienced up to this moment has helped prepare us for this new unknown. We agree with JP Morgan Chase (JPM) CEO, Jamie Dimon, who recently wrote in his own annual letter, “Entering into a crisis is not the time to figure out what you want to be. You must
already be a well-functioning organization prepared to rapidly mobilize your resources, take your losses and survive another day for the good of all of your stakeholders.”4
We are battle-tested and battle-ready. Although sheltered in place, our investment team is formally meeting and in constant contact every day as if we were all only an office away. When there is indiscriminate selling—like we have seen recently—we must prioritize the opportunities at hand with a clear eye on avoiding any permanent loss of capital. The goal is to be quick, but not in a hurry. As Warren Buffett has said, “Widespread fear is your friend as an investor because it serves up bargain purchases.”5 To that end, we start byre-assessing every name in our existing portfolio. Here, we can act with speed because of our deep knowledge of the companies. Since we are in no way beholden to what we already own, were-examine our portfolios from a fresh perspective. The question becomes one of upside versus downside. To that point, there are instances when stocks that have held up relatively well are sold in favor ofwashed-out issues with higher return potential.
Next, we focus on our “watch list” which is comprised of names that we want to own but only at the right price. This list includes some past holdings that we would like to purchase again. In calmer times, we do a lot of work opportunistically evaluating companies since we know business quality changes at a much slower rate than market price. With this forward-thinking preparation, we can move fast when needed. Now, as we scrutinize these potential holdings, we mustre-price each company against the backdrop of a new environment. If valuations look compelling, we may initiate positions.
Lastly, we consider the brand new ideas. Here the goal is precision. How precisely can we assess the fallout and possible opportunity in the context of our existing knowledge and expertise? With new ideas in abundance, there is no need to stretch. Working within our “circle of competence” augments our conviction while also helping us avoid the proverbial “swings and misses.” Balance sheet
| 3 | Mackintosh, Phil. “Closing Markets is Not the Answer.” Nasdaq.com. March 26, 2020. |
| 4 | JP Morgan Chase & Co. (2020). 2019 annual report. Retrieved from https://www.jpmorganchase.com/corporate/investor-relations/document/ annualreport-2019.pdf |
| 5 | Constable, Simon. “Buy the Panic.”The Wall Street Journal.April 6, 2020, pg. R6. |
ARIELINVESTMENTS.COM 5
analysis dominates all of our discussions. Accordingly, we stress test a variety of extreme liquidity scenarios to first prove any potential new idea can survive this pandemic.
This crisis will end. The question is not “if,” but “when.” Although we consider “best-case” and “worst-case” outcomes, the “base case” serves as the foundation of our analysis.6 Currently, our base case scenarios assume a “U” shaped recovery marked by six months of severe economic pressure with underlying stresses equivalent to the worst of 2008-2009. With low expectations for the rest of this year, we believe 2021 will look more like the fundamentals we saw in 2019. If our view proves correct, today’s buys will be very profitable. If the recovery plays out over a longer period, picking up shares now still makes sense, albeit with less upside in the intermediate term. The good news is that given our long term approach, we can be wrong and still be right.
PORTFOLIO COMINGS AND GOINGS
As noted earlier, it has been a busy shopping period. In Ariel Fund, we initiated a position inEnvista Holdings Corporation (NVST), a dominant global dental supplier that was recently spun out of global science and technology conglomerate, Danaher Corporation (DHR); andVail Resorts Inc. (MTN), America’s largest ski resort operator. Meanwhile, we soldWestern Union Company (WU) when it began to approach our estimate of full value. We also eliminatedMTS Systems Corporation(MTSC)—a manufacturer of testing systems and sensor technologies—to pursue more compelling opportunities.
In addition to including Envista Holdings and Vail Resorts in Ariel Appreciation Fund, we added financial services powerhouse,Charles Schwab Corporation (SCHW), as well asThe Goldman Sachs Group (GS)—whose #1 position in the merger and acquisition space over the past five years produces one of the highest returns on equity in the business. We also bought shares ofbar-code manufacturer,Zebra Technologies Corporation(ZBRA)—a name that we have owned and know well. On the flip side, we eliminated famed jewelry retailer,
Tiffany & Co (TIF), after its successful acquisition by Moët Hennessy Louis Vuitton SE (LVMH).
As always, we appreciate the opportunity to serve you and welcome any questions or comments you might have. We also want to thank everyone at Ariel for making adjustments that allow us to continue operating at the highest level to serve you while staying safe.
Sincerely,
| | |
 | |  |
| John W.Rogers, Jr. | | Mellody Hobson |
| Chairman andCo-CEO | | Co-CEO and President |
| 6 | Base case models assumptions deemed most likely to occur. The financial results for the base case sit between those of the best (upside) case and worst (downside) case. |
6 SLOW AND STEADY WINS THE RACE
| | |
| |
Ariel Fund performance summary | | INCEPTION: 11/06/86 |
|
| | | | |
 | |  | |  |
| | |
| John W. Rogers, Jr. | | John P. Miller, CFA | | Kenneth E. Kuhrt, CPA |
| Lead portfolio | | Portfolio | | Portfolio |
| manager | | manager | | manager |
Composition of equity holdings(%)
| | | | | | | | |
| | | Ariel
Fund | | Russell
2500
Value
Index | | Russell
2500
Index | | S&P
500
Index |
| | | | |
Consumer discretionary | | 32.51 | | 11.30 | | 12.48 | | 14.31 |
| | | | |
Financial services | | 27.96 | | 37.95 | | 25.68 | | 17.85 |
| | | | |
Producer durables | | 18.14 | | 12.59 | | 13.44 | | 8.68 |
| | | | |
Health care | | 8.54 | | 7.42 | | 16.68 | | 14.79 |
| | | | |
Consumer staples | | 5.61 | | 3.72 | | 3.02 | | 6.82 |
| | | | |
Materials & processing | | 5.08 | | 8.15 | | 7.02 | | 2.60 |
| | | | |
Technology | | 1.01 | | 8.79 | | 15.44 | | 26.55 |
| | | | |
Energy | | 0.00 | | 2.44 | | 1.51 | | 2.65 |
| | | | |
Utilities | | 0.00 | | 7.58 | | 4.68 | | 5.77 |
Sector weightings for the Fund are calculated based on equity holdings as a percentage of total net assets.
Average annual total returns(%) as of 03/31/20
| | | | | | | | | | | | | | | | | | | | | | | | | | | | |
| | | Quarter | | | 1-year | | | 3-year | | | 5-year | | | 10-year | | | 20-year | | | Since
inception | |
| | | | | | | |
Ariel Fund–Investor Class | | | -35.14 | | | | -31.23 | | | | -8.78 | | | | -3.42 | | | | 5.90 | | | | 7.27 | | | | 9.51 | |
| | | | | | | |
Ariel Fund–Institutional Class+ | | | -35.10 | | | | -31.02 | | | | -8.50 | | | | -3.13 | | | | 6.17 | | | | 7.41 | | | | 9.59 | |
| | | | | | | |
Russell 2500TMValue Index | | | -34.64 | | | | -28.60 | | | | -8.40 | | | | -2.14 | | | | 5.65 | | | | 7.15 | | | | 9.45 | |
| | | | | | | |
Russell 2500TMIndex | | | -29.72 | | | | -22.47 | | | | -3.10 | | | | 0.49 | | | | 7.73 | | | | 6.27 | | | | 9.47 | |
| | | | | | | |
S&P 500®Index | | | -19.60 | | | | -6.98 | | | | 5.10 | | | | 6.73 | | | | 10.53 | | | | 4.79 | | | | 9.76 | |
Performance data quoted represents past performance and does not guarantee future results. All performance assumes the reinvestment of dividends and capital gains. The investment return and principal value of an investment will fluctuate so that an investor’s shares, when redeemed, may be worth more or less than their original cost. Current performance may be lower or higher than the performance data quoted. To access performance data current to the most recentmonth-end, visit arielinvestments.com. The minimum initial investment for Investor Class shares is $1,000; the minimum for Institutional Class shares is $1,000,000.
Growth of a $10,000 investment since inception (Investor Class)
The graph and performance table do not reflect the deduction of taxes that a shareholder would pay on fund distributions or the redemption of fund shares. Total return does not reflect a maximum 4.75% sales load charged prior to 7/15/94.
| | | | | | | | |
| Expense ratio(as of 9/30/19) | | | | | | |
Investor Class | | | 1.02 | % | | | | |
Institutional Class | | | 0.70 | % | | | | |
| | | | | | | | | | | | |
| Top ten equity holdings(% of net assets) |
| | | | | | |
| 1. | | KKR & Co., Inc. | | 5.2 | | | | 6. | | Stericycle, Inc. | | 4.1 |
| 2. | | Northern Trust Corp. | | 4.6 | | | | 7. | | Interpublic Group of Cos., Inc. | | 3.8 |
| 3. | | Mattel, Inc. | | 4.5 | | | | 8. | | Adtalem Global Education, Inc. | | 3.8 |
| 4. | | Zebra Technologies Corp. | | 4.4 | | | | 9. | | JLL | | 3.8 |
| 5. | | Lazard Ltd., Class A | | 4.1 | | | | 10. | | J.M. Smucker Co. | | 3.6 |
| + | The inception date for the Institutional Class shares is December 30, 2011. Performance information for the Institutional Class prior to that date reflects the actual performance of the Fund’s Investor Class (and uses the actual expenses of the Fund’s Investor Class, for such period of time), without any adjustments. For any such period of time, the performance of the Fund’s Institutional Class would have been substantially similar to, yet higher than, the performance of the Fund’s Investor Class, because the shares of both classes are invested in the same portfolio of securities, but the classes bear different expenses, which are primarily differences in distribution and service fees. |
ARIELINVESTMENTS.COM 7
| | |
| |
Ariel Appreciation Fund performance summary | | INCEPTION: 12/01/89 |
|
| | |
| | | | |
 | |  | | |
| |
| John W. Rogers, Jr. | | Timothy R. Fidler,CFA |
| Co-portfolio | | Co-portfolio | | |
| manager | | manager | | |
Composition of equity holdings(%)
| | | | | | | | |
| | | Ariel
Apprec-
iation
Fund | | Russell
Midcap
Value
Index | | Russell
Midcap
Index | | S&P
500
Index |
| | | | |
Financial services | | 34.36 | | 31.48 | | 24.32 | | 17.85 |
| | | | |
Consumer discretionary | | 25.84 | | 10.66 | | 13.28 | | 14.31 |
| | | | |
Producer durables | | 19.27 | | 9.98 | | 12.09 | | 8.68 |
| | | | |
Health care | | 11.14 | | 7.64 | | 11.13 | | 14.79 |
| | | | |
Consumer staples | | 5.37 | | 6.69 | | 5.38 | | 6.82 |
| | | | |
Technology | | 1.82 | | 8.36 | | 17.24 | | 26.55 |
| | | | |
Energy | | 1.21 | | 3.28 | | 2.16 | | 2.65 |
| | | | |
Materials & processing | | 0.32 | | 7.70 | | 6.39 | | 2.60 |
| | | | |
Utilities | | 0.00 | | 14.19 | | 7.99 | | 5.77 |
Sector weightings for the Fund are calculated based on equity holdings as a percentage of total net assets.
Average annual total returns(%) as of 03/31/20
| | | | | | | | | | | | | | | | | | | | | | | | | | | | |
| | | Quarter | | | 1-year | | | 3-year | | | 5-year | | | 10-year | | | 20-year | | | Since
inception | |
| | | | | | | |
Ariel Appreciation Fund–Investor Class | | | -31.43 | | | | -26.09 | | | | -7.64 | | | | -3.05 | | | | 5.72 | | | | 7.00 | | | | 8.94 | |
| | | | | | | |
Ariel Appreciation Fund–Institutional Class+ | | | -31.37 | | | | -25.85 | | | | -7.35 | | | | -2.74 | | | | 5.99 | | | | 7.14 | | | | 9.03 | |
| | | | | | | |
Russell Midcap®Value Index | | | -31.71 | | | | -24.13 | | | | -5.97 | | | | -0.76 | | | | 7.22 | | | | 7.84 | | | | 9.76 | |
| | | | | | | |
Russell Midcap®Index | | | -27.07 | | | | -18.31 | | | | -0.81 | | | | 1.85 | | | | 8.77 | | | | 6.79 | | | | 10.05 | |
| | | | | | | |
S&P 500®Index | | | -19.60 | | | | -6.98 | | | | 5.10 | | | | 6.73 | | | | 10.53 | | | | 4.79 | | | | 9.10 | |
Performance data quoted represents past performance and does not guarantee future results. All performance assumes the reinvestment of dividends and capital gains. The investment return and principal value of an investment will fluctuate so that an investor’s shares, when redeemed, may be worth more or less than their original cost. Current performance may be lower or higher than the performance data quoted. To access performance data current to the most recentmonth-end, visit arielinvestments.com. The minimum initial investment for Investor Class shares is $1,000; the minimum for Institutional Class shares is $1,000,000.
Growth of a $10,000 investment since inception (Investor Class)
The graph and performance table do not reflect the deduction of taxes that a shareholder would pay on fund distributions or the redemption of fund shares. Total return does not reflect a maximum 4.75% sales load charged prior to 7/15/94.
| | | | | | | | |
| Expense ratio(as of 9/30/19) | | | | | | |
Investor Class | | | 1.14 | % | | | | |
Institutional Class | | | 0.82 | % | | | | |
| | | | | | | | | | | | |
| Top ten equity holdings(% of net assets) |
| | | | | | |
| 1. | | Northern Trust Corp. | | 5.2 | | | | 6. | | J.M. Smucker Co. | | 3.9 |
| 2. | | Interpublic Group of Cos., Inc. | | 4.7 | | | | 7. | | Laboratory Corp. of America Holdings | | 3.7 |
| 3. | | Progressive Corp. | | 4.3 | | | | 8. | | Stanley Black & Decker, Inc. | | 3.7 |
| 4. | | Mattel, Inc. | | 4.0 | | | | 9. | | Stericycle, Inc. | | 3.5 |
| 5. | | Aflac, Inc. | | 3.9 | | | | 10. | | BorgWarner, Inc. | | 3.4 |
| + | The inception date for the Institutional Class shares is December 30, 2011. Performance information for the Institutional Class prior to that date reflects the actual performance of the Fund’s Investor Class (and uses the actual expenses of the Fund’s Investor Class, for such period of time), without any adjustments. For any such period of time, the performance of the Fund’s Institutional Class would have been substantially similar to, yet higher than, the performance of the Fund’s Investor Class, because the shares of both classes are invested in the same portfolio of securities, but the classes bear different expenses, which are primarily differences in distribution and service fees. |
8 SLOW AND STEADY WINS THE RACE


Charles K. Bobrinskoy
Vice Chairman
Portfolio Manager
Average annual total returnsas of 03/31/20
| | | | | | | | | | | | | | | | | | | | | | | | |
| | | | | | |
| | | 1Q20 | | | 1-year | | | 3-year | | | 5-year | | | 10-year | | | Since
inception* | |
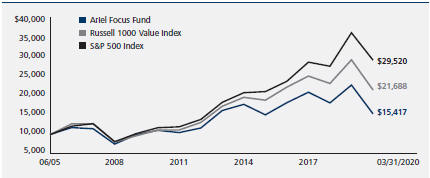
Ariel Focus Fund | | | – 32.90 | % | | | – 25.74 | % | | | – 7.73 | % | | | – 2.51 | % | | | 3.92 | % | | | 2.98 | % |
Russell 1000®Value Index | | | – 26.73 | | | | – 17.17 | | | | – 2.18 | | | | 1.90 | | | | 7.67 | | | | 5.39 | |
S&P 500®Index | | | – 19.60 | | | | – 6.98 | | | | 5.10 | | | | 6.73 | | | | 10.53 | | | | 7.61 | |
* The inception date for Ariel Focus Fund is 06/30/05.
DEAR FELLOW SHAREHOLDER:
The first quarter of 2020 was one of the most difficult we have experienced in over thirty five years in the capital markets. We believe the U.S. economy will eventually rebound strongly from the impact ofCOVID-19 and many of our portfolio companies will produce excellent returns from current distressed levels. But equity markets are currently not focused on long-term prospects, instead discounting shares for the dramatic downturn that is likely to occur in the U.S. and global economy in the 2nd and 3rd quarters. We are seeking to position Ariel Focus Fund to take advantage of an economic recovery, a process we
believe will begin in the fourth quarter of this year.
Ariel Focus Fund underperformed its primary benchmark and the broad market in the first quarter of 2020 declining-32.90% versus a loss of-26.73% for the Russell 1000 Value Index and-19.60% for the S&P 500 Index. We entered 2020 believing the market was excessively concerned about a recession coming from a trade war with China, the negative impact of Brexit, or the election of a president unfriendly to business; concerns that seem almost trivial in hindsight. Our analysis suggested “safety stocks” (those companies such as consumer staples considered less sensitive to broad economic factors) were
Performance data quoted represents past performance. Past performance does not guarantee future results. All performance assumes the reinvestment of dividends and capital gains and represents returns of the Investor Class shares. The investment return and principal value of an investment will fluctuate so that an investor’s shares, when redeemed, may be worth more or less than their original cost. Current performance may be lower or higher than the performance data quoted. Performance data current to the most recentmonth-end for Ariel Focus Fund may be obtained by visiting our website, arielinvestments.com.
ARIELINVESTMENTS.COM 9
overpriced. Likewise, extremely low interest rates had pushed investors to stretch for yield bidding up the price of bond substitute stocks such as high dividend paying utilities. Our analysis also suggested that technology companies including theso-called “FAANG” stocks were trading at excessive values. In the recent rapid downturn, all three of these groups have outperformed. Investors have increased their preference for consumer staples, bond substitutes and technology issues. Our lack of exposure to these sectors had a significant negative impact on performance in the quarter.
As we consider our portfolio today, we place companies into five categories. The first group consists of companies whose business we believe will actually improve in the short run because of the Coronavirus:J.M. SmuckerCompany (SJM), Progressive Corp. (PGR) andJohnson and Johnson (JNJ).SJM has seen sales of staples such as Jif peanut butter and Folgers coffee grow double digits as consumers stock up on basic food items. JNJ has benefitted from a dramatic increase in sales ofover-the-counter medicines such as Tylenol and has announced encouraging prospects for aCOVID-19 vaccine. A significant decrease in driving will reduce accident rates thereby reducing claim losses for PGR, at least in the short term. The market shares our positive assessment of the outlook for these companies and has rewarded their shares accordingly. Therefore, we are not finding attractive opportunities in this category, but are glad to own these names.
The second group are those companies whose business is generally unaffected either positively or negatively by the pandemic.Mosaic Co. (MOS), an agricultural fertilizer company andAdtalem Global Education (ATGE), a provider of health care educational services, fall into this group. Demand for grains and other farm products might actually grow in the current environment, offset perhaps by slower fertilizer sales to Asia and Europe, at least in the short term. The relative lack of population density in farming communities has reduced the spread of the virus among Mosaic’s customers. We believe we could actually see an increase in acres planted after last year’s Midwest
flood conditions. The market, however, has grouped MOS with other natural resource companies (particularly oil and gas) who have seen demand decline with the global slowdown.
DISSECTING OUR PORTFOLIO
Mosaic’s shares declined-49.85% in the first quarter and we have been adding to our position. Adtalem’s nursing and medical schools will continue to operate with an emphasis in online learning, a historic strength of the company. Demand for doctors and particularly nurses will increase in the short term, although it will take time for this to translate to increased enrollments. Its shares fell-26.60% in the quarter.
“Today our portfolio trades at a large discount to private market value and at low multiples of normalized earnings. Once we reach the other side of this pandemic crisis, we believe these issues will recover.”
The third group are those companies who we anticipate will experience a short-term decline in their business but, in our view, will enjoy pent up demand once we reach the other side of this crisis. Our favorite companies in this category areZimmer Biomet Holdings, Inc. (ZBH), Hanger, Inc. (HNGR) andKKR & Co. Inc. (KKR). ZBH makes orthopedic products such as replacement hips and knees. There is no doubtnon-emergency procedures such as hip replacements will decline as hospitals concentrate onCOVID-19 treatments. But, in our judgement, the total number of orthopedic procedures performed through 2022 will not be reduced, only consolidated into the later part of this year and next. Likewise, we believe demand for Hanger’s prosthetic products will come back sharply after
10 SLOW AND STEADY WINS THE RACE
orthotic clinics are reopened, a development we expect in the second quarter. There is no doubt KKR’s current investment portfolio will be negatively impacted by the downturn in capital markets and the global economy. But, the downturn will also provide KKR with exciting investment opportunities for the billions they have raised in committed capital. Likewise, institutional investors will appreciate the relative lack of volatility in KKR’s private funds, which are not marked to market on a daily basis.
The fourth category are companies which will suffer a permanent reduction in value from the current crisis, but may in some cases, see their stock prices decline by more than the loss in intrinsic value. Companies in the energy industry fall into this category. The total number of barrels of oil consumed worldwide through 2022 will be lower than previously estimated. The world’s proven reserves have not declined, resulting in a negative shift in supply demand curves. In January of this year,Apache Corporation (APA) announced a major oil discovery off the coast of Suriname in South America. French oil giant, Total S.A. agreed to provide much of the development capital for new wells sending APA shares up +79.50% on January 14, 2020 from their price on December 4, 2019. But since then, the price of West Texas Intermediate crude oil has collapsed from over $60 to $20 in late March. Despite continued positive developments on APA’s Suriname discovery, its stock price declined from $33 in January to $4 at quarter end, a painful-83.54% decline. APA was rated investment grade by both rating agencies before March when S&P downgraded the company to BB+, still the highest below investment grade rating. The credit default markets are more pessimistic, however pricing insurance against default at over 900 basis points per year as we go to print in early April. We believe APA will survive and its stock is trading well below its intrinsic value today. However, we acknowledge APA’s fate is dependent on factors outside of its control such as the global price of oil. We have added modestly to our position as a good risk reward opportunity but with our eyes wide open to the potential downside.
The fifth category contains companies who we believe have a high risk of not surviving the current crisis or suffering levels of equity dilution making shares uninvestable. Some of these companies are in industries we found unattractive before the pandemic. Others carried too much debt and will not generate sufficient free cash flow to service fixed income obligations. Unfortunately we would place many companies in the airline industry in this category. Other companies in this category include some restaurants, some ride sharing companies and perhaps even Airbnb, none of which we own.
We began this letter by noting the current environment is the most difficult we have experienced in our career. We entered this year believing investors were excessively pessimistic about risks such as Brexit and a trade war and were overvaluing safe stocks and growth stocks. Our analysis found good companies with some exposure to the economy were selling at attractive prices relative to our calculation of their intrinsic value. This positioning, both in terms of what we owned and what we did not, hurt our absolute and relative performance in the quarter. But today our portfolio trades at a large discount to private market value and at low multiples of normalized earnings. Once we reach the other side of this pandemic crisis, we believe these issues will recover. And, we WILL reach the other side.
As always, we appreciate the opportunity to serve you and welcome any questions or comments you might have.
Sincerely,

Charles K. Bobrinskoy
Vice Chairman and Portfolio Manager
ARIELINVESTMENTS.COM 11
| | |
| |
Ariel Focus Fund performance summary | | INCEPTION: 06/30/05 |
|
| | |
Charles K. Bobrinskoy
Portfolio manager
Composition of equity holdings(%)
| | | | | | |
| | | Ariel
Focus
Fund | | Russell
1000
Value
Index | | S&P
500
Index |
| | | |
Financial services | | 32.75 | | 26.87 | | 17.85 |
| | | |
Producer durables | | 17.89 | | 8.61 | | 8.68 |
| | | |
Health care | | 16.24 | | 14.59 | | 14.79 |
| | | |
Consumer discretionary | | 14.50 | | 10.56 | | 14.31 |
| | | |
Technology | | 5.98 | | 7.09 | | 26.55 |
| | | |
Energy | | 3.75 | | 5.50 | | 2.65 |
| | | |
Consumer staples | | 3.31 | | 10.15 | | 6.82 |
| | | |
Materials & processing | | 3.10 | | 4.37 | | 2.60 |
| | | |
Utilities | | 0.00 | | 12.25 | | 5.77 |
Sector weightings for the Fund are calculated based on equity holdings as a percentage of total net assets.
Average annual total returns(%) as of 03/31/20
| | | | | | | | | | | | |
| | | Quarter | | 1-year | | 3-year | | 5-year | | 10-year | | Since
inception |
| | | | | | |
Ariel Focus Fund–Investor Class | | -32.90 | | -25.74 | | -7.73 | | -2.51 | | 3.92 | | 2.98 |
| | | | | | |
Ariel Focus Fund–Institutional Class+ | | -32.87 | | -25.59 | | -7.51 | | -2.28 | | 4.13 | | 3.12 |
| | | | | | |
Russell 1000®Value Index | | -26.73 | | -17.17 | | -2.18 | | 1.90 | | 7.67 | | 5.39 |
| | | | | | |
S&P 500®Index | | -19.60 | | -6.98 | | 5.10 | | 6.73 | | 10.53 | | 7.61 |
Performance data quoted represents past performance and does not guarantee future results. All performance assumes the reinvestment of dividends and capital gains. The investment return and principal value of an investment will fluctuate so that an investor’s shares, when redeemed, may be worth more or less than their original cost. Current performance may be lower or higher than the performance data quoted. To access performance data current to the most recentmonth-end, visit arielinvestments.com. The minimum initial investment for Investor Class shares is $1,000; the minimum for Institutional Class shares is $1,000,000.
Growth of a $10,000 investment since inception (Investor Class)
The graph and performance table do not reflect the deduction of taxes that a shareholder would pay on fund distributions or the redemption of fund shares.
| | | | | | | | | | | | |
| Expense ratio(as of 9/30/19) | | Net | | | Gross | | | | |
Investor Class | | | 1.00 | % | | | 1.23% | | | | | |
Institutional Class | | | 0.75 | % | | | 0.89% | | | | | |
The net expense ratio reflects a contractual advisory fee waiver agreement effective through September 30, 2021. Prior to February 1, 2014, the fee waiver was 1.25% for the Investor Class and 1.00% for the Institutional Class.
| | | | | | | | | | | | |
| Top ten equity holdings(% of net assets) |
| | | | | | |
| 1. | | Oracle Corp. | | 6.0 | | | | 6. | | Zimmer Biomet Holdings, Inc. | | 5.1 |
| 2. | | Lockheed Martin Corp. | | 5.5 | | | | 7. | | Johnson & Johnson | | 4.4 |
| 3. | | KKR & Co., Inc. | | 5.5 | | | | 8. | | Lazard Ltd., Class A | | 4.4 |
| 4. | | Snap-on, Inc. | | 5.1 | | | | 9. | | Goldman Sachs Group, Inc. | | 4.3 |
| 5. | | Western Union Co. | | 5.1 | | | | 10. | | Zebra Technologies Corp. | | 4.2 |
| | | | | | | | | | | | |
| + | The inception date for the Institutional Class shares is December 30, 2011. Performance information for the Institutional Class prior to that date reflects the actual performance of the Fund’s Investor Class (and uses the actual expenses of the Fund’s Investor Class, for such period of time), without any adjustments. For any such period of time, the performance of the Fund’s Institutional Class would have been substantially similar to, yet higher than, the performance of the Fund’s Investor Class, because the shares of both classes are invested in the same portfolio of securities, but the classes bear different expenses, which are primarily differences in distribution and service fees. |
12 SLOW AND STEADY WINS THE RACE


Rupal J. Bhansali
Chief Investment Officer
International and Global Equities
Average annual total returnsas of 03/31/20
| | | | | | | | | | | | | | | | | | | | | | | | | | | | | | | | | | | | | | | | |
| | | | | | | | | |
| | | 1Q20 | | | | | | 1-year | | | | | | 3-year | | | | | | 5-year | | | | | | Since inception* | |
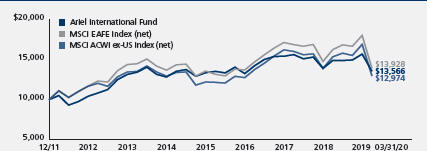
Ariel International Fund | | | – 13.64 | % | | | | | | | – 9.04 | % | | | | | | | – 1.61 | % | | | | | | | 0.02 | % | | | | | | | 3.76 | % | | | | |
MSCI EAFE Net Index | | | – 22.83 | | | | | | | | – 14.38 | | | | | | | | – 1.82 | | | | | | | | – 0.62 | | | | | | | | 4.10 | | | | | |
MSCI ACWIex-US Net Index | | | – 23.36 | | | | | | | | – 15.57 | | | | | | | | – 1.96 | | | | | | | | – 0.64 | | | | | | | | 3.21 | | | | | |
* The inception date for Ariel International Fund is 12/30/11.
Average annual total returnsas of 03/31/20
| | | | | | | | | | | | | | | | | | | | | | | | | | | | | | | | | | | | | | | | |
| | | | | | | | | |
| | | 1Q20 | | | | | | 1-year | | | | | | 3-year | | | | | | 5-year | | | | | | Since inception* | |
Ariel Global Fund | | | – 13.28 | % | | | | | | | – 7.79 | % | | | | | | | 1.09 | % | | | | | | | 2.33 | % | | | | | | | 6.17 | % | | | | |
MSCI ACWI Net Index | | | – 21.37 | | | | | | | | –11.26 | | | | | | | | 1.50 | | | | | | | | 2.85 | | | | | | | | 7.01 | | | | | |
* The inception date for the Ariel Global Fund is 12/30/11.
DEAR FELLOW SHAREHOLDER:
Markets worldwide began 2020 on a high note, underscored by broad optimism around an improving global economic outlook and a phase 1 trade deal between the U.S. and China. However, in a swift and sudden
reversal, the coronavirus pandemic unleashed massive economic shocks as governments across the globe enacted strict containment policies, which shuttered businesses, halted commerce and imposed “social-distancing” measures confining regional populations to their homes. Uncertainty over the duration of the virus threat and
Performance data quoted represents past performance. Past performance does not guarantee future results. All performance assumes the reinvestment of dividends and capital gains and represents returns of the Investor Class shares. The investment return and principal value of an investment will fluctuate so that an investor’s shares, when redeemed, may be worth more or less than their original cost. Current performance may be lower or higher than the performance data quoted. Performance data current to the most recentmonth-end for Ariel International Fund and Ariel Global Fund may be obtained by visiting our website, arielinvestments.com.
ARIELINVESTMENTS.COM 13
magnitude of its impact prompted policymakers and central banks in the world’s largest economies to deliver fiscal stimulus and monetary relief packages in hopes of easing the damage on Wall Street and Main Street. Amidst this extreme volatility, it is not surprising that our “risk-aware,” global and international portfolios outperformed on a relative basis as attention to fundamental factors such as quality, risk and valuation was rewarded.
IF WE SEE UNCHARTERED TERRITORY, IT IS ONLY BECAUSE WE DON’T YET RECOGNIZE THE PATTERN
Having covered 50 countries over several market cycles, the financial impact of this contagion seems akin to Japan’s Fukushima Daiichi nuclear disaster, which followed the magnitude 9.0 Great East Japan Earthquake and Tsunami in March 2011. While theCOVID-19 health crisis is global and far more intense in terms of its economic impact, we believe the playbook may prove similar. Japan lost considerable physical and human capital. The economy contracted-10% in the quarter following the nuclear accident but recovered by a similar amount in Q3 2011.1 The Bank of Japan provided market liquidity to ensure the stability of financial markets, and the central government and local policymakers in the region “launched a series of post-disaster economic and social rehabilitation projects.”2 “Most of the affected businesses, economic sectors and communities”3 recovered.
Flash forward 9 years—the unpredictability surrounding the human and economic toll ofCOVID-19 drove stocks to bear market territory, triggering unprecedented stimulus. Although markets have since recovered from their lows, we believe the trough of this new cycle remains on the horizon. The shock of the sudden freeze in the economy on corporate earnings and supply chains, as well as the second order effects on various countries, consumers and companies are not yet clear. And while the operating and financial environment will spare no one from adversity, we expect cyclicals to be harder hit than defensives and
companies with high fixed costs to suffer more than those with flexible cost structures. We also anticipate that companies carrying an excessive amount of financial leverage will experience larger challenges than those with cash rich balance sheets.
Furthermore, the “coronavirus extends liquidity and capital problems, [such as labor participation and productivity growth] to the real economy—and does so at unprecedented scale…while there is a policy playbook for dealing with financial crises, no such thing exists for a large-scale real economy freeze.”4 In our opinion, the 2020 recession and new economic cycle will be ‘mitigated but not fully offset’ by extensive monetary and fiscal stimulus. We expect the economic shock driven by social distancing will eventually recede as lockdowns are lifted and business, as well as consumer activity resumes. Although it will likely have a sobering impact on GDP through the third quarter, similar to Japan, our central scenario is that the world economy will begin its recovery process thereafter.
“While it may get worse before it gets better, decades of stock market history suggest it will eventually get better.”
OPPORTUNITY MEETS PREPARATION
While a worldwide pandemic is certainly unique to our lifetime, our performance record as patient, long-term intrinsic value investors during a bear market has proven its mettle. Stock volatility is likely to persist across all asset classes, but value in general has been particularly hard hit. On a technical basis, value is the worst performing factoryear-to-date, providing fertile opportunity for investment bargains. History highlights that value is the phoenix of asset classes rising out of a recession. As such, we are laser-focused on methodically and thoughtfully curating and availing of any opportunities to judiciously reposition the portfolio for years of future returns.
| 1 | 2020 Bloomberg Finance L.P. Accessed 19 March 2020. |
| 2 | Zhang, Hui, Chris Dolan, Si Meng Jing, Justine Uyimleshi and Peter Dodd. “Bounce Forward: Economic Recovery in Post-Disaster Fukushima.” MDPI. 27 November 2019, page 1, 2. www.mdpi.com/journal/sustainability |
| 3 | Zhang, Hui, Chris Dolan, Si Meng Jing, Justine Uyimleshi and Peter Dodd. “Bounce Forward: Economic Recovery in Post-Disaster Fukushima.” MDPI. 27 November 2019, page 1, 2. www.mdpi.com/journal/sustainability |
| 4 | Carlsson-Szlezak, Philipp, Martin Reeves and Paul Schwartz. “Understanding the Economic Shock of Coronavirus.” Harvard Business Review. 27 March 2020. |
14 SLOW AND STEADY WINS THE RACE
As you are aware, our investment philosophy is biased toward owning undervalued,out-of-favor, franchise-quality companies that are misunderstood and therefore mispriced by the market. We pay particular attention to the growth and return prospects of the companies, as well as the sustainability of the business modeland resilience of the balance sheet. Rest assured, this time is no different.
Given the economic backdrop, we are on the lookout for companies whose distinct fundamentals lends themselves to an inevitable recovery—wheredemand is delayed, not denied. Think consumer discretionary names, whose robust balance sheets and free cash flow allow operational flexibility in market downturns. Health Care is another area, where secular inventive franchises with strong research and development, as well as solid balance sheets offer defensive characteristics and have limited reliance on the cycle.
Our investment discipline is driven bybottom-up stock picking. We pay attention to risk management in addition to return management. This balanced approach has driven us to take profits in some of our more defensive holdings, such as telecoms where ournon-consensus thesis around the stability of these operators through a recession benefitted our portfolios in the quarter. We have also redeployed capital in existing names—where we have high conviction—that in our view, have unnecessarily underperformed in this environment. And although we are selectively accumulating cyclical and consumer discretionary issues, we are keeping a substantial amount of powder dry in anticipation of better opportunities emerging in the upcoming earnings season.
Lastly, while we expect a solid recovery for equities and earnings, we remain concerned with balance sheet risk. In response, we are paying close attention to debt multiples and leverage ratios, along with earnings metrics.
HISTORY REPEATS ITSELF
While it may get worse before it gets better, decades of stock market history suggest it will eventually get better.
Since 1928—through 14 recessions and 21 bear markets—U.S. equity markets have never failed to regain a prior peak. In addition, since 1972—through 4 worldwide recessions and 10 bear markets—Global equity markets have never failed to regain a prior peak. We strongly believe the patient investor that stays the course and consistently owns advantaged business models with resilient balance sheets whose stocks are mispriced and undervalued, are well-positioned to deliver superior risk-adjusted returns over thelong-run.
As always, we appreciate the opportunity to serve you and welcome any questions or comments you might have.
Sincerely,

Rupal J. Bhansali
Chief Investment Officer
International and Global Equities
ARIELINVESTMENTS.COM 15
| | |
| |
Ariel International Fund performance summary | | INCEPTION: 12/30/11 |
|
| | |
Rupal J. Bhansali
Portfolio manager
Composition of equity holdings(%)
| | | | | | |
| | | | | | | MSCI |
| | | Ariel | | MSCI | | ACWI |
| | | International | | EAFE | | ex-US |
| | | Fund | | Index | | Index |
Communication services | | 27.70 | | 5.52 | | 7.50 |
Health care | | 15.53 | | 14.33 | | 10.52 |
Consumer staples | | 14.38 | | 12.64 | | 10.50 |
Consumer discretionary | | 9.97 | | 11.08 | | 11.82 |
Financials | | 9.49 | | 16.45 | | 19.23 |
Utilities | | 6.81 | | 4.20 | | 3.73 |
Industrials | | 2.85 | | 14.23 | | 11.43 |
Information technology | | 2.43 | | 7.61 | | 10.05 |
Energy | | 2.00 | | 3.96 | | 5.21 |
Real estate | | 1.05 | | 3.30 | | 3.03 |
Materials | | 0.00 | | 6.69 | | 6.97 |
Sector weightings for the Fund are calculated based on equity holdings as a percentage of total net assets. The sectors above are the Global Industry Classification Standard (“GICS”) sector classifications.
Average annual total returns(%) as of 03/31/20
| | | | | | | | | | | | | | | | | | | | |
| | | Quarter | | | 1-year | | | 3-year | | | 5-year | | | Since
inception | |
| | | | | |
Ariel International Fund–Investor Class | | | -13.64 | | | | -9.04 | | | | -1.61 | | | | 0.02 | | | | 3.76 | |
| | | | | |
Ariel International Fund–Institutional Class | | | -13.65 | | | | -8.87 | | | | -1.36 | | | | 0.26 | | | | 4.01 | |
MSCI EAFE Index (net) | | | -22.83 | | | | -14.38 | | | | -1.82 | | | | -0.62 | | | | 4.10 | |
MSCI ACWIex-US Index (net) | | | -23.36 | | | | -15.57 | | | | -1.96 | | | | -0.64 | | | | 3.21 | |
Performance data quoted represents past performance and does not guarantee future results. All performance assumes the reinvestment of dividends and capital gains. The investment return and principal value of an investment will fluctuate so that an investor’s shares, when redeemed, may be worth more or less than their original cost. Current performance may be lower or higher than the performance data quoted. To access performance data current to the most recent month-end, visit arielinvestments.com. The minimum initial investment for Investor Class shares is $1,000; the minimum for Institutional Class shares is $1,000,000.
Growth of a $10,000 investment since inception (Investor Class)
The graph and performance table do not reflect the deduction of taxes that a shareholder would pay on fund distributions or the redemption of fund shares.
| | | | | | | | | | | | | | | | |
Expense ratio(as of 9/30/19) | | | Net | | | | | | | | Gross | | | | | |
Investor Class | | | 1.13 | % | | | | | | | 1.32% | | | | | |
Institutional Class | | | 0.88 | % | | | | | | | 0.93% | | | | | |
The net expense ratio reflects a contractual advisory fee waiver agreement effective through September 30, 2021. Prior to November 29, 2016, the fee waiver was 1.25% of net assets for the Investor Class and 1.00% for the Institutional Class, and, prior to February 1, 2014, the fee waiver was 1.40% for the Investor Class and 1.15% for the Institutional Class.
| | | | | | | | | | | | | | | | | | |
| Top ten companies(% of net assets) | | | | | | |
| 1. | | Roche Holding AG | | | 8.8 | | | | 6. | | | Philip Morris Intl, Inc. | | | 5.5 | | | |
| 2. | | Deutsche Boerse AG | | | 8.5 | | | | 7. | | | Koninklijke Ahold Delhaize N.V. | | | 5.0 | | | |
| 3. | | Nintendo Co., Ltd. | | | 7.4 | | | | 8. | | | Michelin (CGDE) | | | 4.0 | | | |
| 4. | | GlaxoSmithKline plc | | | 6.3 | | | | 9. | | | Nippon Telegraph & Telephone Corp. | | | 3.9 | | | |
| 5. | | China Mobile Ltd. | | | 5.8 | | | | 10. | | | Snam SpA | | | 3.1 | | | |
For the purposes of determining the Fund’s top ten, securities of the same issuer are aggregated.
| | | | | | | | | | |
Top ten country weightings(% of net assets) | | | | |
| | | |
Japan | | | 24.25 | | | United States | | | 6.01 | |
| | | |
Germany | | | 11.69 | | | France | | | 5.55 | |
| | | |
Switzerland | | | 11.36 | | | Netherlands | | | 5.02 | |
| | | |
China | | | 8.22 | | | Italy | | | 3.37 | |
| | | |
United Kingdom | | | 8.17 | | | Spain | | | 3.25 | |
16 SLOW AND STEADY WINS THE RACE
| | |
| |
Ariel Global Fund performance summary | | INCEPTION: 12/30/11 |
|
| | |
Rupal J. Bhansali
Portfolio manager
Composition of equity holdings(%)
| | | | |
| | | Ariel | | MSCI |
| | | Global | | ACWI |
| | | Fund | | Index |
Health care | | 26.46 | | 13.26 |
Communication services | | 20.73 | | 9.32 |
Information technology | | 14.16 | | 18.79 |
Consumer staples | | 9.17 | | 8.82 |
Financials | | 9.14 | | 14.45 |
Consumer discretionary | | 7.59 | | 10.84 |
Energy | | 2.16 | | 3.71 |
Utilities | | 1.39 | | 3.61 |
Industrials | | 1.11 | | 9.63 |
Real estate | | 0.87 | | 3.15 |
Materials | | 0.00 | | 4.40 |
Sector weightings for the Fund are calculated based on equity holdings as a percentage of total net assets. The sectors above are the Global Industry Classification Standard (“GICS”) sector classifications.
Average annual total returns(%) as of 03/31/20
| | | | | | | | | | | | | | | | | | | | |
| | | Quarter | | | 1-year | | | 3-year | | | 5-year | | | Since
inception | |
| | | | | |
Ariel Global Fund–Investor Class | | | -13.28 | | | | -7.79 | | | | 1.09 | | | | 2.33 | | | | 6.17 | |
| | | | | |
Ariel Global Fund–Institutional Class | | | -13.22 | | | | -7.56 | | | | 1.32 | | | | 2.57 | | | | 6.44 | |
MSCI ACWI Index (net) | | | -21.37 | | | | -11.26 | | | | 1.50 | | | | 2.85 | | | | 7.01 | |
Performance data quoted represents past performance and does not guarantee future results. All performance assumes the reinvestment of dividends and capital gains. The investment return and principal value of an investment will fluctuate so that an investor’s shares, when redeemed, may be worth more or less than their original cost. Current performance may be lower or higher than the performance data quoted. To access performance data current to the most recent month-end, visit arielinvestments.com. The minimum initial investment for Investor Class shares is $1,000; the minimum for Institutional Class shares is $1,000,000.
Growth of a $10,000 investment since inception (Investor Class)
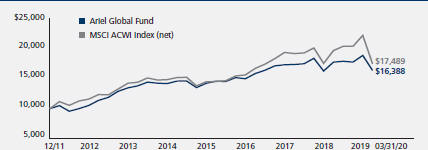
The graph and performance table do not reflect the deduction of taxes that a shareholder would pay on fund distributions or the redemption of fund shares.
| | | | | | | | | | | | | | | | |
Expense ratio(as of 9/30/19) | | | Net | | | | | | | | Gross | | | | | |
Investor Class | | | 1.13 | % | | | | | | | 1.44% | | | | | |
Institutional Class | | | 0.88 | % | | | | | | | 0.99% | | | | | |
The net expense ratio reflects a contractual advisory fee waiver agreement effective through September 30, 2021. Prior to November 29, 2016, the fee waiver was 1.25% of net assets for the Investor Class and 1.00% for the Institutional Class, and, prior to February 1, 2014, the fee waiver was 1.40% for the Investor Class and 1.15% for the Institutional Class.
| | | | | | | | | | | | | | | | | | |
| Top ten companies(% of net assets) | | | | | | |
| 1. | | Microsoft Corp. | | | 9.8 | | | | 6. | | | China Mobile Ltd. | | | 5.6 | | | |
| 2. | | Roche Holding AG | | | 8.2 | | | | 7. | | | Nintendo Co., Ltd. | | | 3.9 | | | |
| 3. | | Gilead Sciences, Inc. | | | 7.0 | | | | 8. | | | Johnson & Johnson | | | 3.7 | | | |
| 4. | | GlaxoSmithKline plc | | | 5.8 | | | | 9. | | | Baidu, Inc. | | | 3.7 | | | |
| 5. | | Philip Morris Intl, Inc. | | | 5.6 | | | | 10. | | | Berkshire Hathaway, Inc., Class B | | | 3.5 | | | |
For the purposes of determining the Fund’s top ten, securities of the same issuer are aggregated.
| | | | | | | | | | |
Top ten country weightings(% of net assets) | | | | |
| | | |
United States | | | 42.15 | | | Germany | | | 4.01 | |
| | | |
Japan | | | 12.76 | | | France | | | 3.51 | |
| | | |
China | | | 9.33 | | | Finland | | | 1.73 | |
| | | |
Switzerland | | | 8.56 | | | South Korea | | | 1.08 | |
| | | |
United Kingdom | | | 6.10 | | | Thailand | | | 0.98 | |
ARIELINVESTMENTS.COM 17

| | | | |

| | 
| | Aaron Diaz Bianco,JD/CFA® Research Analyst |
Kennametal, Inc. (KMT) is one of the world’s leading manufacturers of durable cutting tools. Customers rely on its products in general engineering, transportation, aerospace, agriculture, road construction, mining, and energy. Founded in 1938, Kennametal has helped customers improve manufacturing productivity for over 80 years. With so much attention given toCOVID-19, the marketplace appears to be overlooking that Kennametal is more profitable than it was a few years ago. Since the last downturn in 2015-2016, Kennametal has simplified and modernized its production. We expect the company’s improved cost structure will help lead to profitability for many years to come.
HIGH VALUE PROPOSITION FOR CUSTOMERS
The strong value proposition of Kennametal’s cutting tools and the high barriers to entry help preserve pricing power over economic cycles. The importance of avoiding malfunctions in heavy equipment such as commercial aircraft greatly outweighs the costs of these highly specialized cutting tools, such that customers are willing to spend what is necessary. Given this dynamic, one would expect many companies will rush to meet the demand. However, new entrants are not expected to flood the marketplace because of the substantial investment required. Serving cutting tools customers requires extensive materials science, engineering, sourcing, manufacturing and atechnically-proficient sales force.
RESILIENCE THROUGH CYCLES
Many of Kennametal’s end markets, most notably automotive and energy, were already experiencing production downturns in late 2019. Now with theCOVID-19 outbreak, end markets that were doing well, namely aerospace, are being affected. WhileCOVID-19 is unprecedented, in our view, investors should always, as a matter of discipline, look to the normalized earnings power of any business when calculating intrinsic
value. On this count, we believe Kennametal is being priced as if the extreme downward pressure on its end markets will persist indefinitely. However, this franchise will endure because it adds substantial value for its customers. Those customers will likely be ramping up production as soon as the pandemic subsides, and Kennametal will be well positioned to serve given its essential role in the production process.
LOOKING THROUGH THE WINDSHIELD VS. REAR VIEW MIRROR
In addition to maintaining our disciplined focus on the long term, which we think is being neglected by many market participants at this time, we also believe many are not fully appreciating Kennametal’s improved cost structure. In the past, Kennametal allocated resources to serving many small andmedium-sized clients, keeping the company’s cost base higher than it needed to be while also diverting resources from improvements that larger competitors made years before. Today, Kennametal has efficiently and strategically deemphasized smaller accounts where appropriate, resulting in decreased fixed costs. Accordingly, the company has used the excess capital to automate and modernize its factories.
A PATIENT APPROACH
Even during Kennametal’s period of elevated fixed costs, the company never sacrificed its scientific expertise and materials acumen. Improving its economies of scale by removing redundancies and automating production should enable it to remain the strongest player in the Western Hemisphere. Due to the deterioration of Kennametal’s end markets in the face of theCOVID-19 shock, the benefits of management’s actions may not immediately translate to profits. However, once we return to a normalized operating environment, Kennametal’s improvements will shine through for patient investors.
18 SLOW AND STEADY WINS THE RACE

| | | | |

| | 
| | Sabrina Carollo,CFA® Senior Vice President Director of Research Operations |
Established as aspin-off of Danaher Corporation in September 2019,Envista Holdings Corp.(NVST) is a leading global dental manufacturing company. Under its Specialty Products & Technologies Division (49% of revenue), Envista offers dental implants, orthodontic traditional bracket and wire systems, dental lab products, and more innovative aligners. Additionally, the company offers digital imaging systems, impression materials, bonding agents, and infection prevention products under its Equipment and Consumables Division (51% of revenue).
SOLID COMPETITIVE ADVANTAGES
Though the global dental industry is highly fragmented, Envista’s reach includes more than 1 million dentists in over 150 countries. Furthermore, the company offers a broad product portfolio, covering approximately 90% of clinical needs for dental treatment. This strength and product breadth allow the company to boast a high-recurring revenue stream with approximately 70% derived from consumables, services and spare parts. A continued focus on innovation further enhances the company’s competitiveness, utilizing approximately 6% of revenue for research and development. Finally, Envista’s tenured management team of operating executives and leaders have a long history in the dental industry.
FAVORABLE GROWTH DRIVERS
Envista is positioned to capitalize on dental market trends to accelerate growth. First, the industry continues to experience favorable demographic shifts. The aging population is significant since older individuals have a higher dental expenditure per capita. Second, new studies continue to link dental health to overall health, which could help drive dental care to become part of a larger focus on preventative healthcare over time. Third, development outside the United States boasts higher growth dynamics, with the company generating 24% of revenue from
emerging markets in 2019. Fourth, cosmetic dentistry continues to experience increased demand and is particularly attractive since it focuses on more profitable product offerings. Finally, after a pause taken to focus on internal operations, Envista will completetuck-in acquisitions, thereby enhancing its growth trajectory.
SIGNIFICANT MARGIN UPSIDE POTENTIAL
Company operations are based on the Danaher operating culture, Envista Business System (EBS). Since 2015, Envista has invested heavily and rationalized product/brand lines, reducing manufacturing sites by 25% and other locations by 40%. Furthermore, imaging/treatment brands were rationalized from 11 to 6, and the company consolidatedback-office functions. We believe management is focused on further cost savings such as additional manufacturing site reduction and product streamlining. In our view, the company will rapidly expand margins at a higher rate versus Wall Street expectations.
ONCE-IN-A-LIFETIME OPPORTUNITY
While it may be a recently acquired portfolio company, Envista is certainly not a new name to Ariel. In 2006, Danaher Corporation acquired Sybron Dental, an Ariel portfolio company at that time. A large portion of the Envista product portfolio is represented by the former Sybron Dental. In this current, uncharteredCOVID-19 environment, the American Dental Association, along with other global regulatory bodies, have informed the dental community to see patients on an emergency-basis only. However, we know people will once again visit dentists for theirbi-annual dental cleanings and necessaryfollow-up procedures—the only uncertainty is when. As long-term investors, this temporary slowdown has provided us with aonce-in-a-lifetime opportunity to invest in a high-quality company trading at a significant discount to its private market valuation of $35.71.
ARIELINVESTMENTS.COM 19

| | | | |
| | 
| | Jamil Soriano Vice President, Research |
Founded in 1937 and based in Mayfield, OH,Progressive Corp.(PGR) is one of the largest property and casualty automobile insurers in the U.S. With specialization in the personal auto segment, Progressive also maintains a solid position in the commercial auto market. As background, Progressive distributes its policies primarily through its digitaldirect-to-consumer (DTC) channel and network of over 30,000 independent agents. The company entered the homeowners’ insurance space in 2014 through the acquisition of American Strategic Insurance Corp., which strengthened its competitive positioning by facilitating a home/auto bundled solution. Additionally, it is gradually expanding beyond autos to other small commercial lines which it views as a long-term growth driver.
COMPETITIVE ADVANTAGE DRIVEN BY DATA, MARKETING AND INNOVATION
Brand strength, scale, and underwriting prowess differentiate the company from its peers in a highly competitive and relatively commoditized industry. Progressive maintains a sizeable marketing budget—illustrated by the public’s familiarity with “Flo” from its television commercials. This type of brand support gives the company an advantage, especially in the DTC channel and makes it difficult for smaller players to keep pace. Underwriting is supported by superior data analytics and innovation. Now an industry norm, telematics—the integrated use of communications and information technology to transmit, store and receive information—was first developed and employed by Progressive in an effort to inform pricing decisions. Progressive’s data superiority allows the company to better assess risk factors when determining competitive policy rates, which leaves the riskier driver pool and higher payouts for its competitors. This creates a virtuous cycle. Specifically,
industry participants increase rates in response to greater underwriting losses, which in turn promotes further Progressive market share gains. The company’s advantages are substantiated bybest-in-class loss ratios and return on equity.
A SHIFT IN THE GLOBAL OPERATING ENVIRONMENT
Prior to the pandemic, Progressive investors had been focused on the possibility of accelerated underwriting margin degradation as a result of increased competition and an uptick in accident frequency and severity. We believed loss trends would normalize at a more gradual pace given Progressive’s competitive positioning and pricing acumen. However, the emergence ofCOVID-19 dramatically altered the global operating environment and understandably shifted the focus to the public health and economic implications of the virus.
A PROMISING OUTLOOK IN THE FACE OF UNCERTAINTY
While the company’s shares have not been fully immune to market volatility, it has outperformed its peer set. Auto insurance is anon-discretionary expense and drivers need it regardless of how much they drive. Shelter in place designations across the country will likely translate into fewer miles driven and should lead to lower claims rates. While the low interest rate environment will remain a headwind for Progressive, it is important to remember the vast majority of its revenues are derived from earned premiums. Collectively, we like the company’s positioning regardless of the macroeconomic backdrop and expect its brand and data-driven culture to fuel growth and share gains in the long term.
20 SLOW AND STEADY WINS THE RACE
| | |
Schedules of investments | | 03/31/20 (UNAUDITED) |
|
| | |
Ariel Fund | | |
| | | | | | | | |
| Number of shares | | | | Common stocks—98.85% | | Value | |
| | | |
| | | | Consumer discretionary & services—32.51% | | | | |
| | | |
6,867,689 | | | | Mattel, Inc.(a) | | | $60,504,340 | |
| | | |
3,173,966 | | | | Interpublic Group of Cos., Inc. | | | 51,386,509 | |
| | | |
1,905,599 | | | | Adtalem Global Education, Inc.(a) | | | 51,050,997 | |
| | | |
4,376,984 | | | | MSG Networks, Inc.(a)(b) | | | 44,645,237 | |
| | | |
3,125,765 | | | | ViacomCBS, Inc. | | | 43,791,968 | |
| | | |
563,604 | | | | Mohawk Industries, Inc.(a) | | | 42,969,169 | |
| | | |
2,852,435 | | | | Nielsen Holdings plc | | | 35,769,535 | |
| | | |
3,205,077 | | | | TEGNA, Inc. | | | 34,807,136 | |
| | | |
2,220,256 | | | | Meredith Corp.(b) | | | 27,131,528 | |
| | | |
806,040 | | | | Royal Caribbean Cruises Ltd. | | | 25,930,307 | |
| | | |
130,969 | | | | Vail Resorts, Inc. | | | 19,345,431 | |
| | | | | | | | |
| | | | | | | 437,332,157 | |
| | | | | | | | |
| | | |
| | | | Consumer staples—5.61% | | | | |
| | | |
438,245 | | | | J.M. Smucker Co. | | | 48,645,195 | |
| | | |
688,000 | | | | Molson Coors Brewing Co. | | | 26,838,880 | |
| | | | | | | | |
| | | | | | | 75,484,075 | |
| | | | | | | | |
| | | |
| | | | Financial services—27.96% | | | | |
| | | |
2,975,439 | | | | KKR & Co., Inc. | | | 69,833,553 | |
| | | |
823,800 | | | | Northern Trust Corp. | | | 62,163,948 | |
| | | |
2,342,903 | | | | Lazard Ltd., Class A | | | 55,198,795 | |
| | | |
500,299 | | | | JLL | | | 50,520,193 | |
| | | |
1,195,953 | | | | CBRE Group, Inc., Class A(a) | | | 45,099,388 | |
| | | |
1,041,788 | | | | First American Financial Corp. | | | 44,182,229 | |
| | | |
528,600 | | | | Affiliated Managers Group, Inc. | | | 31,261,404 | |
| | | |
1,159,249 | | | | Janus Henderson Group plc | | | 17,759,695 | |
| | | | | | | | |
| | | | | | | 376,019,205 | |
| | | | | | | | |
| | | |
| | | | Health care—8.54% | | | | |
| | | |
323,100 | | | | Laboratory Corp. of America Holdings(a) | | | 40,836,609 | |
| | | |
1,919,315 | | | | Envista Holdings Corp.(a) | | | 28,674,566 | |
| | | |
186,506 | | | | Charles River Laboratories Intl, Inc.(a) | | | 23,538,922 | |
| | | |
62,281 | | | | Bio-Rad Laboratories, Inc.(a) | | | 21,833,227 | |
| | | | | | | | |
| | | | | | | 114,883,324 | |
| | | | | | | | |
| | | |
| | | | Materials & processing—5.08% | | | | |
| | | |
978,400 | | | | Masco Corp. | | | 33,823,288 | |
| | | |
398,197 | | | | Simpson Manufacturing Co., Inc. | | | 24,680,250 | |
| | | |
5,477,884 | | | | U.S. Silica Holdings, Inc.(b) | | | 9,860,191 | |
| | | | | | | | |
| | | | | | | 68,363,729 | |
| | | | | | | | |
| | | |
| | | | Producer durables—18.14% | | | | |
| | | |
325,100 | | | | Zebra Technologies Corp.(a) | | | 59,688,360 | |
| | | |
1,123,000 | | | | Stericycle, Inc.(a) | | | 54,555,340 | |
| | | |
543,585 | | | | Keysight Technologies, Inc.(a) | | | 45,487,193 | |
| | | |
2,266,141 | | | | Kennametal, Inc. | | | 42,195,545 | |
| | | |
387,163 | | | | Snap-on, Inc. | | | 42,131,078 | |
| | | | | | | | |
| | | | | | | 244,057,516 | |
| | | | | | | | |
| | | |
| | | | Technology—1.01% | | | | |
| | | |
1,012,665 | | | | Knowles Corp.(a) | | | 13,549,458 | |
| | | | | | | | |
| | | | Total common stocks (Cost $1,339,921,371) | | | 1,329,689,464 | |
| | | | | | | | |
The accompanying notes are an integral part of the financial statements.
ARIELINVESTMENTS.COM 21
| | |
Schedules of investments | | 03/31/20 (UNAUDITED) |
|
| | |
Ariel Fund(continued) | | |
| | | | | | | | |
| Number of shares | | | | Short-term investments—1.08% | | Value | |
| | | |
14,498,226 | | | | Northern Institutional Treasury Portfolio, 0.40%(c) | | | $14,498,226 | |
| | | | | | | | |
| | | | Total short-term investments (Cost $14,498,226) | | | 14,498,226 | |
| | | | | | | | |
| | | |
| | | | Total Investments—99.93% (Cost $1,354,419,597) | | | 1,344,187,690 | |
| | | |
| | | | Other Assets less Liabilities—0.07% | | | 955,143 | |
| | | | | | | | |
| | | |
| | | | Net Assets—100.00% | | | $1,345,142,833 | |
| | | | | | | | |
The accompanying notes are an integral part of the financial statements.
22 SLOW AND STEADY WINS THE RACE
| | |
Schedules of investments | | 03/31/20 (UNAUDITED) |
|
| | |
Ariel Appreciation Fund | | |
| | | | | | | | |
| Number of shares | | | | Common stocks—99.33% | | Value | |
| | | |
| | | | Consumer discretionary & services—25.84% | | | | |
| | | |
2,481,230 | | | | Interpublic Group of Cos., Inc. | | | $40,171,114 | |
| | | |
3,829,300 | | | | Mattel, Inc.(a) | | | 33,736,133 | |
| | | |
1,195,600 | | | | BorgWarner, Inc. | | | 29,136,772 | |
| | | |
336,900 | | | | Omnicom Group, Inc. | | | 18,495,810 | |
| | | |
1,314,898 | | | | ViacomCBS, Inc. | | | 18,421,721 | |
| | | |
333,000 | | | | CarMax, Inc.(a) | | | 17,925,390 | |
| | | |
1,745,437 | | | | MSG Networks, Inc.(a) | | | 17,803,457 | |
| | | |
1,265,624 | | | | Nielsen Holdings plc | | | 15,870,925 | |
| | | |
58,300 | | | | Vail Resorts, Inc. | | | 8,611,493 | |
| | | |
627,400 | | | | Carnival Corp. | | | 8,262,858 | |
| | | |
31,600 | | | | The Madison Square Garden Co., Class A(a) | | | 6,680,556 | |
| | | |
315,600 | | | | Nordstrom, Inc. | | | 4,841,304 | |
| | | | | | | | |
| | | | | | | 219,957,533 | |
| | | | | | | | |
| | | |
| | | | Consumer staples—5.37% | | | | |
| | | |
297,275 | | | | J.M. Smucker Co. | | | 32,997,525 | |
| | | |
325,400 | | | | Molson Coors Brewing Co. | | | 12,693,854 | |
| | | | | | | | |
| | | | | | | 45,691,379 | |
| | | | | | | | |
| | | |
| | | | Energy—1.21% | | | | |
| | | |
1,043,300 | | | | National Oilwell Varco | | | 10,255,639 | |
| | | | | | | | |
| | | |
| | | | Financial services—34.36% | | | | |
| | | |
585,800 | | | | Northern Trust Corp. | | | 44,204,468 | |
| | | |
500,100 | | | | Progressive Corp. | | | 36,927,384 | |
| | | |
973,200 | | | | Aflac, Inc. | | | 33,322,368 | |
| | | |
649,900 | | | | First American Financial Corp. | | | 27,562,259 | |
| | | |
585,189 | | | | BOK Financial Corp. | | | 24,905,644 | |
| | | |
1,041,720 | | | | Lazard Ltd., Class A | | | 24,542,923 | |
| | | |
420,789 | | | | Houlihan Lokey, Inc. | | | 21,931,523 | |
| | | |
119,454 | | | | Willis Towers Watson plc | | | 20,289,262 | |
| | | |
716,568 | | | | KKR & Co., Inc. | | | 16,817,851 | |
| | | |
451,700 | | | | The Charles Schwab Corp. | | | 15,186,154 | |
| | | |
224,450 | | | | CBRE Group, Inc., Class A(a) | | | 8,464,010 | |
| | | |
53,000 | | | | Goldman Sachs Group, Inc. | | | 8,193,270 | |
| | | |
146,950 | | | | Blackstone Group, Inc. | | | 6,696,511 | |
| | | |
33,980 | | | | JLL | | | 3,431,300 | |
| | | | | | | | |
| | | | | | | 292,474,927 | |
| | | | | | | | |
| | | |
| | | | Health care—11.14% | | | | |
| | | |
249,600 | | | | Laboratory Corp. of America Holdings(a) | | | 31,546,944 | |
| | | |
236,400 | | | | Zimmer Biomet Holdings, Inc. | | | 23,895,312 | |
| | | |
437,415 | | | | Cardinal Health, Inc. | | | 20,969,675 | |
| | | |
100,880 | | | | Charles River Laboratories Intl, Inc.(a) | | | 12,732,065 | |
| | | |
381,122 | | | | Envista Holdings Corp.(a) | | | 5,693,963 | |
| | | | | | | | |
| | | | | | | 94,837,959 | |
| | | | | | | | |
| | | |
| | | | Materials & processing—0.32% | | | | |
| | | |
1,509,080 | | | | U.S. Silica Holdings, Inc. | | | 2,716,344 | |
| | | | | | | | |
| | | |
| | | | Producer durables—19.27% | | | | |
| | | |
314,299 | | | | Stanley Black & Decker, Inc. | | | 31,429,900 | |
| | | |
620,000 | | | | Stericycle, Inc.(a) | | | 30,119,600 | |
| | | |
1,468,500 | | | | Kennametal, Inc. | | | 27,343,470 | |
| | | |
321,315 | | | | Keysight Technologies, Inc.(a) | | | 26,887,639 | |
| | | |
166,200 | | | | Snap-on, Inc. | | | 18,085,884 | |
| | | |
101,600 | | | | Littelfuse, Inc. | | | 13,555,472 | |
| | | |
50,800 | | | | Zebra Technologies Corp.(a) | | | 9,326,880 | |
| | | |
50,950 | | | | Illinois Tool Works, Inc. | | | 7,241,014 | |
| | | | | | | | |
| | | | | | | 163,989,859 | |
| | | | | | | | |
| | | |
| | | | Technology—1.82% | | | | |
| | | |
1,160,100 | | | | Knowles Corp.(a) | | | 15,522,138 | |
| | | | | | | | |
| | | | Total common stocks (Cost $827,403,296) | | | 845,445,778 | |
| | | | | | | | |
| | | | | | | | |
| Number of shares | | | | Short-term investments—0.54% | | Value | |
| | | |
4,571,488 | | | | Northern Institutional Treasury Portfolio, 0.40%(c) | | | $4,571,488 | |
| | | | | | | | |
| | | | Total short-term investments (Cost $4,571,488) | | | 4,571,488 | |
| | | | | | | | |
| | | |
| | | | Total Investments—99.87% (Cost $831,974,784) | | | 850,017,266 | |
| | | |
| | | | Other Assets less Liabilities—0.13% | | | 1,109,686 | |
| | | | | | | | |
| | | |
| | | | Net Assets—100.00% | | | $851,126,952 | |
| | | | | | | | |
The accompanying notes are an integral part of the financial statements.
ARIELINVESTMENTS.COM 23
| | |
Schedules of investments | | 03/31/20 (UNAUDITED) |
|
| | |
Ariel Focus Fund | | |
| | | | | | | | |
| Number of shares | | | | Common stocks—97.52% | | Value | |
| | | |
| | | | Consumer discretionary & services—14.50% | | | | |
| | | |
62,200 | | | | BorgWarner, Inc. | | | $1,515,814 | |
| | | |
100,572 | | | | ViacomCBS, Inc. | | | 1,409,014 | |
| | | |
102,100 | | | | Nielsen Holdings plc | | | 1,280,334 | |
| | | |
34,300 | | | | Adtalem Global Education, Inc.(a) | | | 918,897 | |
| | | |
10,700 | | | | Mohawk Industries, Inc.(a) | | | 815,768 | |
| | | | | | | | |
| | | | | | | 5,939,827 | |
| | | | | | | | |
| | | |
| | | | Consumer staples—3.31% | | | | |
| | | |
12,200 | | | | J.M. Smucker Co. | | | 1,354,200 | |
| | | | | | | | |
| | | |
| | | | Energy—3.75% | | | | |
| | | |
21,600 | | | | Exxon Mobil Corp. | | | 820,152 | |
| | | |
43,300 | | | | National Oilwell Varco | | | 425,639 | |
| | | |
69,700 | | | | Apache Corp. | | | 291,346 | |
| | | | | | | | |
| | | | | | | 1,537,137 | |
| | | | | | | | |
| | | |
| | | | Financial services—32.75% | | | | |
| | | |
95,200 | | | | KKR & Co., Inc. | | | $2,234,344 | |
| | | |
114,500 | | | | Western Union Co. | | | 2,075,885 | |
| | | |
76,600 | | | | Lazard Ltd., Class A | | | 1,804,696 | |
| | | |
11,500 | | | | Goldman Sachs Group, Inc. | | | 1,777,785 | |
| | | |
22,000 | | | | Progressive Corp. | | | 1,624,480 | |
| | | |
29,600 | | | | First American Financial Corp. | | | 1,255,336 | |
| | | |
23,800 | | | | BOK Financial Corp. | | | 1,012,928 | |
| | | |
29,200 | | | | Bank of New York Mellon Corp. | | | 983,456 | |
| | | |
9,200 | | | | Blackstone Group, Inc. | | | 419,244 | |
| | | |
3,000 | | | | Northern Trust Corp. | | | 226,380 | |
| | | | | | | | |
| | | | | | | 13,414,534 | |
| | | | | | | | |
| | | |
| | | | Health care—16.24% | | | | |
| | | |
20,500 | | | | Zimmer Biomet Holdings, Inc. | | | 2,072,140 | |
| | | |
13,900 | | | | Johnson & Johnson | | | 1,822,707 | |
| | | |
90,900 | | | | Hanger, Inc.(a) | | | 1,416,222 | |
| | | |
10,600 | | | | Laboratory Corp. of America Holdings(a) | | | 1,339,734 | |
| | | | | | | | |
| | | | | | | 6,650,803 | |
| | | | | | | | |
| | | |
| | | | Materials & processing—3.10% | | | | |
| | | |
117,300 | | | | Mosaic Co. | | | 1,269,186 | |
| | | | | | | | |
| | | |
| | | | Producer durables—17.89% | | | | |
| | | |
6,656 | | | | Lockheed Martin Corp. | | | 2,256,051 | |
| | | |
19,300 | | | | Snap-on, Inc. | | | 2,100,226 | |
| | | |
9,400 | | | | Zebra Technologies Corp.(a) | | | 1,725,840 | |
| | | |
8,100 | | | | Stanley Black & Decker, Inc. | | | 810,000 | |
| | | |
67,200 | | | | Team, Inc.(a) | | | 436,800 | |
| | | | | | | | |
| | | | | | | 7,328,917 | |
| | | | | | | | |
| | | |
| | | | Technology—5.98% | | | | |
| | | |
50,700 | | | | Oracle Corp. | | | 2,450,331 | |
| | | | | | | | |
| | | | Total common stocks (Cost $48,097,588) | | | 39,944,935 | |
| | | | | | | | |
| | | | | | | | |
| Number of shares | | | | Short-term investments—2.50% | | Value | |
| | | |
1,024,160 | | | | Northern Institutional Treasury Portfolio, 0.40%(c) | | | $1,024,160 | |
| | | | | | | | |
| | | | Total short-term investments (Cost $1,024,160) | | | 1,024,160 | |
| | | | | | | | |
| | | |
| | | | Total Investments—100.02% (Cost $49,121,748) | | | 40,969,095 | |
| | | |
| | | | Other Assets less Liabilities—(0.02)% | | | (9,072 | ) |
| | | | | | | | |
| | | |
| | | | Net Assets—100.00% | | | $40,960,023 | |
| | | | | | | | |
The accompanying notes are an integral part of the financial statements.
24 SLOW AND STEADY WINS THE RACE
| | |
Schedules of investments | | 03/31/20 (UNAUDITED) |
|
| | |
Ariel International Fund | | |
| | | | | | | | |
| Number of shares | | | | Common stocks—92.21% | | Value | |
| | | |
| | | | Belgium—0.04% | | | | |
| | | |
5,678 | | | | KBC Group NV | | | $257,640 | |
| | | | | | | | |
| | | |
| | | | Canada—0.51% | | | | |
| | | |
77,667 | | | | IGM Financial, Inc. | | | 1,288,655 | |
| | | |
67,137 | | | | Suncor Energy, Inc. | | | 1,071,482 | |
| | | |
2,271 | | | | Fairfax Financial Holdings Ltd. | | | 696,211 | |
| | | | | | | | |
| | | | | | | 3,056,348 | |
| | | | | | | | |
| | | |
| | | | China—8.22% | | | | |
| | | |
4,052,500 | | | | China Mobile Ltd. | | | $30,370,575 | |
| | | |
144,481 | | | | Baidu, Inc. ADR(a) | | | 14,562,240 | |
| | | |
105,552 | | | | China Mobile Ltd. ADR | | | 3,976,144 | |
| | | | | | | | |
| | | | | | | 48,908,959 | |
| | | | | | | | |
| | | |
| | | | Finland—2.61% | | | | |
| | | |
3,378,870 | | | | Nokia Corp. ADR | | | 10,474,497 | |
| | | |
1,105,610 | | | | Nokia Corp. | | | 3,405,124 | |
| | | |
68,128 | | | | Nokian Renkaat Corp. | | | 1,626,766 | |
| | | | | | | | |
| | | | | | | 15,506,387 | |
| | | | | | | | |
| | | |
| | | | France—5.55% | | | | |
| | | |
270,726 | | | | Michelin (CGDE) | | | 23,711,505 | |
| | | |
56,081 | | | | Safran SA | | | 4,968,617 | |
| | | |
28,036 | | | | Thales SA | | | 2,321,825 | |
| | | |
23,905 | | | | Total SA | | | 900,712 | |
| | | |
41,236 | | | | Vivendi SA | | | 871,869 | |
| | | |
3,621 | | | | Airbus SE | | | 233,489 | |
| | | | | | | | |
| | | | | | | 33,008,017 | |
| | | | | | | | |
| | | |
| | | | Germany—11.69% | | | | |
| | | |
369,339 | | | | Deutsche Boerse AG | | | 50,741,303 | |
| | | |
6,388,210 | | | | Telefonica Deutschland Holding | | | 15,683,737 | |
| | | |
140,413 | | | | Rocket Internet SE(a) | | | 2,800,480 | |
| | | |
7,578 | | | | Brenntag AG | | | 275,325 | |
| | | | | | | | |
| | | | | | | 69,500,845 | |
| | | | | | | | |
| | | |
| | | | Hong Kong—0.89% | | | | |
| | | |
424,000 | | | | CLP Holdings Ltd. | | | 3,883,843 | |
| | | |
11,017,302 | | | | Li & Fung Ltd. | | | 1,433,003 | |
| | | | | | | | |
| | | | | | | 5,316,846 | |
| | | | | | | | |
| | | |
| | | | Italy—3.37% | | | | |
| | | |
4,030,882 | | | | Snam SpA | | | 18,422,348 | |
| | | |
296,514 | | | | Italgas SpA | | | 1,622,339 | |
| | | | | | | | |
| | | | | | | 20,044,687 | |
| | | | | | | | |
| | | |
| | | | Japan—24.25% | | | | |
| | | |
112,900 | | | | Nintendo Co., Ltd. | | | 43,878,993 | |
| | | |
957,500 | | | | Nippon Telegraph & Telephone Corp. | | | 22,900,162 | |
| | | |
846,300 | | | | Subaru Corp. | | | 16,177,094 | |
| | | |
494,400 | | | | NTT DOCOMO, Inc. | | | 15,461,423 | |
| | | |
811,100 | | | | Japan Tobacco, Inc. | | | 15,002,663 | |
| | | |
429,400 | | | | Bridgestone Corp. | | | 13,144,198 | |
| | | |
80,800 | | | | Secom Co., Ltd. | | | 6,682,826 | |
| | | |
67,400 | | | | Daito Trust Construction Co., Ltd. | | | 6,258,999 | |
| | | |
72,200 | | | | Mabuchi Motor Co., Ltd. | | | 2,142,163 | |
| | | |
73,400 | | | | Ono Pharmaceutical Co., Ltd. | | | 1,686,764 | |
| | | |
87,000 | | | | Shizuoka Bank Ltd. | | | 528,238 | |
| | | |
12,900 | | | | Calbee, Inc. | | | 348,131 | |
| | | | | | | | |
| | | | | | | 144,211,654 | |
| | | | | | | | |
| | | |
| | | | Luxembourg—0.78% | | | | |
| | | |
95,142 | | | | RTL Group | | | 3,186,112 | |
| | | |
120,158 | | | | Tenaris ADR | | | 1,447,904 | |
| | | | | | | | |
| | | | | | | 4,634,016 | |
| | | | | | | | |
| | | |
| | | | Netherlands—5.02% | | | | |
| | | |
1,281,663 | | | | Koninklijke Ahold Delhaize N.V. | | | 29,858,350 | |
| | | | | | | | |
The accompanying notes are an integral part of the financial statements.
ARIELINVESTMENTS.COM 25
| | |
Schedules of investments | | 03/31/20 (UNAUDITED) |
|
| | |
Ariel International Fund(continued) | | |
| | | | | | |
| | |
| Number of shares | | Common stocks—92.21% | | Value |
| | |
| | Singapore—0.39% | | | | |
| | |
356,200 | | Singapore Exchange Ltd. | | | $2,294,089 | |
| | | | | | |
| | |
| | Spain—3.25% | | | | |
| | |
630,582 | | Endesa SA | | | 13,343,367 | |
| | |
474,355 | | Tecnicas Reunidas SA(a) | | | 6,008,519 | |
| | | | | | |
| | | | | 19,351,886 | |
| | | | | | |
| | |
| | Switzerland—11.36% | | | | |
| | |
162,998 | | Roche Holding AG | | | 52,443,306 | |
| | |
25,384 | | Swisscom AG | | | 13,592,647 | |
| | |
7,508 | | Novartis AG ADR | | | 619,035 | |
| | |
4,147 | | Nestle SA | | | 424,519 | |
| | |
2,337 | | Kuehne & Nagel Intl, AG | | | 318,348 | |
| | |
1,943 | | Novartis AG | | | 160,295 | |
| | | | | | |
| | | | | 67,558,150 | |
| | | | | | |
| | |
| | United Arab Emirates—0.10% | | | | |
| | |
4,048,694 | | Dubai Financial Market(a) | | | 606,550 | |
| | | | | | |
| | |
| | United Kingdom—8.17% | | | | |
| | |
1,997,250 | | GlaxoSmithKline plc | | | 37,476,734 | |
| | |
94,880 | | Reckitt Benckiser Group plc | | | 7,227,541 | |
| | |
275,639 | | National Grid plc | | | 3,220,643 | |
| | |
222,498 | | Kingfisher plc | | | 390,820 | |
| | |
188,637 | | Vodafone Group plc | | | 260,969 | |
| | | | | | |
| | | | | 48,576,707 | |
| | | | | | |
| | |
| | United States—6.01% | | | | |
| | |
447,710 | | Philip Morris Intl, Inc. | | | 32,664,922 | |
| | |
68,377 | | EOG Resources, Inc. | | | 2,456,102 | |
| | |
5,964 | | Check Point Software Technologies Ltd.(a) | | | 599,621 | |
| | | | | | |
| | | | | 35,720,645 | |
| | | | | | |
| | Total common stocks (Cost $578,399,673) | | | 548,411,776 | |
| | | | | | |
| | |
| | | | | | |
| | |
| Number of shares | | Short-term investments—3.50% | | Value |
| | |
20,791,447 | | Northern Institutional Treasury Portfolio, 0.40%(c) | | | $20,791,447 | |
| | | | | | |
| | Total short-term investments (Cost $20,791,447) | | | 20,791,447 | |
| | | | | | |
| | |
| | Total Investments—95.71% (Cost $599,191,120) | | | 569,203,223 | |
| | |
| | Cash, Foreign Currency, Other Assets less Liabilities—4.29% | | | 25,540,894 | |
| | | | | | |
| | |
| | Net Assets—100.00% | | | $594,744,117 | |
| | | | | | |
The accompanying notes are an integral part of the financial statements.
26 SLOW AND STEADY WINS THE RACE
| | |
Schedules of investments | | 03/31/20 (UNAUDITED) |
|
| | |
Ariel International Fund(continued) | | |
Open foreign currency contracts as of March 31, 2020
| | | | | | | | | | | | | | | | | | | | | | | | |
| | | | | | |
Contract settlement date | | Counterparty | | | Currency to be received | | | Amount to be received | | | Currency to
be delivered | | | Amount to be delivered | | | Unrealized
appreciation
(depreciation) | |
Open forward currency contracts with unrealized appreciation | | | | | | | | | | | | | |
| | | | | | |
05/13/2020 | | | UBS | | | | JPY | | | | 1,047,307,474 | | | | CNH | | | | 66,915,731 | | | | $330,007 | |
| | | | | | |
05/13/2020 | | | UBS | | | | USD | | | | 28,659,667 | | | | CNH | | | | 200,290,946 | | | | 433,023 | |
| | | | | | |
05/13/2020 | | | UBS | | | | JPY | | | | 565,427,122 | | | | USD | | | | 5,171,558 | | | | 97,907 | |
| | | | | | | | | | | | | | | | | | | | | | | | |
| | | | | | |
Subtotal UBS AG | | | | | | | | | | | | | | | | | | | | | | | 860,937 | |
| | | | | | | | | | | | | | | | | | | | | | | | |
| | | | | | |
05/13/2020 | | | Northern Trust | | | | USD | | | | 3,040,137 | | | | CAD | | | | 4,039,888 | | | | 168,150 | |
| | | | | | |
05/13/2020 | | | Northern Trust | | | | USD | | | | 7,222,246 | | | | CNH | | | | 50,460,746 | | | | 110,903 | |
| | | | | | |
05/13/2020 | | | Northern Trust | | | | CAD | | | | 4,039,888 | | | | USD | | | | 2,808,536 | | | | 63,450 | |
| | | | | | | | | | | | | | | | | | | | | | | | |
| | | | | | |
Subtotal Northern Trust | | | | | | | | | | | | | | | | | | | | | | | 342,503 | |
| | | | | | | | | | | | | | | | | | | | | | | | |
| | | | | | |
05/13/2020 | | | JPMorgan Chase | | | | CAD | | | | 2,906,000 | | | | AUD | | | | 3,223,392 | | | | 82,820 | |
| | | | | | |
05/13/2020 | | | JPMorgan Chase | | | | GBP | | | | 867,600 | | | | CAD | | | | 1,496,703 | | | | 14,594 | |
| | | | | | |
05/13/2020 | | | JPMorgan Chase | | | | USD | | | | 7,508,527 | | | | CAD | | | | 9,975,165 | | | | 417,109 | |
| | | | | | |
05/13/2020 | | | JPMorgan Chase | | | | JPY | | | | 809,509,224 | | | | EUR | | | | 6,742,348 | | | | 95,246 | |
| | | | | | | | | | | | | | | | | | | | | | | | |
| | | | | | |
Subtotal JPMorgan Chase | | | | | | | | | | | | | | | | | | | | | | | 609,769 | |
| | | | | | | | | | | | | | | | | | | | | | | | |
| | |
Subtotal - Open forward currency contracts with unrealized appreciation | | | | | | | | $1,813,209 | |
| | | | | | | | | | | | | | | | | | | | | | | | |
| | | |
Open forward currency contracts with unrealized depreciation | | | | | | | | | | | | | |
| | | | | | |
05/13/2020 | | | UBS | | | | NOK | | | | 10,371,451 | | | | EUR | | | | 1,021,694 | | | | $(130,935) | |
| | | | | | |
05/13/2020 | | | UBS | | | | SEK | | | | 23,346,356 | | | | EUR | | | | 2,217,036 | | | | (87,026) | |
| | | | | | |
05/13/2020 | | | UBS | | | | USD | | | | 5,171,558 | | | | JPY | | | | 574,299,447 | | | | (180,592) | |
| | | | | | |
05/13/2020 | | | UBS | | | | AUD | | | | 51,562,324 | | | | USD | | | | 34,681,386 | | | | (2,959,505) | |
| | | | | | |
05/13/2020 | | | UBS | | | | GBP | | | | 31,493,965 | | | | USD | | | | 40,869,309 | | | | (1,715,611) | |
| | | | | | |
05/13/2020 | | | UBS | | | | NOK | | | | 27,930,421 | | | | USD | | | | 3,019,205 | | | | (332,039) | |
| | | | | | |
05/13/2020 | | | UBS | | | | SEK | | | | 111,154,572 | | | | USD | | | | 11,586,224 | | | | (338,819) | |
| | | | | | | | | | | | | | | | | | | | | | | | |
| | | | | | |
Subtotal UBS AG | | | | | | | | | | | | | | | | | | | | | | | (5,744,527) | |
| | | | | | | | | | | | | | | | | | | | | | | | |
| | | | | | |
05/13/2020 | | | Northern Trust | | | | SEK | | | | 34,936,342 | | | | USD | | | | 3,641,687 | | | | (106,581) | |
| | | | | | |
05/13/2020 | | | Northern Trust | | | | SGD | | | | 7,757,068 | | | | USD | | | | 5,599,518 | | | | (138,135) | |
| | | | | | | | | | | | | | | | | | | | | | | | |
| | | | | | |
Subtotal Northern Trust | | | | | | | | | | | | | | | | | | | | | | | (244,716) | |
| | | | | | | | | | | | | | | | | | | | | | | | |
| | | | | | |
05/13/2020 | | | JPMorgan Chase | | | | CAD | | | | 2,906,106 | | | | AUD | | | | 3,495,889 | | | | (84,749) | |
| | | | | | |
05/13/2020 | | | JPMorgan Chase | | | | AUD | | | | 6,495,817 | | | | CAD | | | | 5,812,106 | | | | (135,549) | |
| | | | | | |
05/13/2020 | | | JPMorgan Chase | | | | AUD | | | | 1,990,849 | | | | CHF | | | | 1,301,000 | | | | (129,899) | |
| | | | | | |
05/13/2020 | | | JPMorgan Chase | | | | AUD | | | | 5,918,919 | | | | EUR | | | | 3,629,600 | | | | (368,569) | |
| | | | | | |
05/13/2020 | | | JPMorgan Chase | | | | CAD | | | | 1,496,703 | | | | GBP | | | | 898,723 | | | | (53,286) | |
| | | | | | |
05/13/2020 | | | JPMorgan Chase | | | | AUD | | | | 4,241,021 | | | | USD | | | | 2,855,857 | | | | (246,720) | |
| | | | | | |
05/13/2020 | | | JPMorgan Chase | | | | CAD | | | | 1,366,777 | | | | USD | | | | 1,025,382 | | | | (53,730) | |
| | | | | | | | | | | | | | | | | | | | | | | | |
| | | | | | |
Subtotal JPMorgan Chase | | | | | | | | | | | | | | | | | | | | | | | (1,072,502) | |
| | | | | | | | | | | | | | | | | | | | | | | | |
| | |
Subtotal - Open forward currency contracts with unrealized depreciation | | | | | | | | $(7,061,745) | |
| | | | | | | | | | | | | | | | | | | | | | | | |
| | | |
Net unrealized appreciation (depreciation) on forward currency contracts | | | | | | | | | | | | $(5,248,536) | |
| | | | | | | | | | | | | | | | | | | | | | | | |
The accompanying notes are an integral part of the financial statements.
ARIELINVESTMENTS.COM 27
| | |
Schedules of investments | | 03/31/20 (UNAUDITED) |
|
| | |
Ariel Global Fund | | |
| | | | | | |
Number of shares | | Common stocks—92.78% | | Value |
| | |
| | Canada—0.18% | | | | |
| | |
10,003 | | IGM Financial, Inc. | | | $165,970 | |
| | | | | | |
| | |
| | Chile—0.05% | | | | |
| | |
2,946 | | Banco Santander-Chile ADR | | | 44,573 | |
| | | | | | |
| | |
| | China—9.33% | | | | |
| | |
674,500 | | China Mobile Ltd. | | | 5,054,893 | |
| | |
33,452 | | Baidu, Inc. ADR(a) | | | 3,371,627 | |
| | | | | | |
| | | | | 8,426,520 | |
| | | | | | |
| | |
| | Finland—1.73% | | | | |
| | |
280,515 | | Nokia Corp. ADR | | | 869,597 | |
| | |
225,709 | | Nokia Corp. | | | 695,152 | |
| | | | | | |
| | | | | 1,564,749 | |
| | | | | | |
| | |
| | France—3.51% | | | | |
| | |
29,492 | | Michelin (CGDE) | | | 2,583,053 | |
| | |
4,618 | | Safran SA | | | 409,142 | |
| | |
1,056 | | Thales SA | | | 87,454 | |
| | |
2,315 | | Vivendi SA | | | 48,947 | |
| | |
554 | | Airbus SE | | | 35,723 | |
| | | | | | |
| | | | | 3,164,319 | |
| | | | | | |
| | |
| | Germany—4.01% | | | | |
| | |
22,548 | | Deutsche Boerse AG | | | 3,097,737 | |
| | |
213,244 | | Telefonica Deutschland Holding | | | 523,537 | |
| | | | | | |
| | | | | 3,621,274 | |
| | | | | | |
| | |
| | Hong Kong—0.23% | | | | |
| | |
19,000 | | CLP Holdings Ltd. | | | 174,040 | |
| | |
278,000 | | Li & Fung Ltd. | | | 36,159 | |
| | | | | | |
| | | | | 210,199 | |
| | | | | | |
| | |
| | Italy—0.23% | | | | |
| | |
45,488 | | Snam SpA | | | 207,894 | |
| | | | | | |
| | |
| | Japan—12.76% | | | | |
| | |
8,950 | | Nintendo Co., Ltd. | | | 3,478,450 | |
| | |
87,400 | | Nippon Telegraph & Telephone Corp. | | | 2,090,312 | |
| | |
88,100 | | Subaru Corp. | | | 1,684,039 | |
| | |
45,500 | | NTT DOCOMO, Inc. | | | 1,422,926 | |
| | |
65,600 | | Japan Tobacco, Inc. | | | 1,213,383 | |
| | |
36,700 | | Bridgestone Corp. | | | 1,123,410 | |
| | |
3,000 | | Daito Trust Construction Co., Ltd. | | | 278,590 | |
| | |
2,800 | | Secom Co., Ltd. | | | 231,583 | |
| | | | | | |
| | | | | 11,522,693 | |
| | | | | | |
| | |
| | Mexico—0.29% | | | | |
| | |
111,675 | | Wal-Mart de Mexico SAB de CV | | | 262,446 | |
| | | | | | |
| | |
| | Netherlands—0.69% | | | | |
| | |
26,661 | | Koninklijke Ahold Delhaize N.V. | | | 621,110 | |
| | | | | | |
| | |
| | South Korea—1.08% | | | | |
| | |
15,967 | | KT&G Corp. | | | 977,616 | |
| | | | | | |
The accompanying notes are an integral part of the financial statements.
28 SLOW AND STEADY WINS THE RACE
| | |
Schedules of investments | | 03/31/20 (UNAUDITED) |
|
| | |
Ariel Global Fund(continued) | | |
| | | | | | |
Number of shares | | Common stocks—92.78% | | Value |
| | |
| | Spain—0.71% | | | | |
| | |
30,246 | | Endesa SA | | | $640,017 | |
| | | | | | |
| | |
| | Switzerland—8.56% | | | | |
| | |
23,013 | | Roche Holding AG | | | 7,404,249 | |
| | |
522 | | Swisscom AG | | | 279,521 | |
| | |
340 | | Kuehne & Nagel Intl, AG | | | 46,315 | |
| | | | | | |
| | |
| | | | | 7,730,085 | |
| | | | | | |
| | |
| | Taiwan—0.19% | | | | |
| | |
26,000 | | Catcher Technology Co., Ltd. | | | 166,318 | |
| | | | | | |
| | |
| | Thailand—0.98% | | | | |
| | |
319,000 | | Kasikornbank PCL | | | 886,257 | |
| | | | | | |
| | |
| | United Kingdom—6.10% | | | | |
| | |
278,964 | | GlaxoSmithKline plc | | | 5,234,527 | |
| | |
20,327 | | National Grid plc | | | 237,506 | |
| | |
27,721 | | Vodafone Group plc | | | 38,350 | |
| | | | | | |
| | |
| | | | | 5,510,383 | |
| | | | | | |
| | |
| | United States—42.15% | | | | |
| | |
56,372 | | Microsoft Corp. | | | 8,890,428 | |
| | |
83,997 | | Gilead Sciences, Inc. | | | 6,279,616 | |
| | |
69,799 | | Philip Morris Intl, Inc. | | | 5,092,535 | |
| | |
25,780 | | Johnson & Johnson | | | 3,380,531 | |
| | |
17,372 | | Berkshire Hathaway, Inc., Class B(a) | | | 3,176,123 | |
| | |
44,808 | | Verizon Communications, Inc. | | | 2,407,534 | |
| | |
29,182 | | Amdocs Ltd. | | | 1,604,135 | |
| | |
16,769 | | Quest Diagnostics, Inc. | | | 1,346,551 | |
| | |
33,709 | | EOG Resources, Inc. | | | 1,210,827 | |
| | |
55,045 | | Schlumberger Ltd. | | | 742,557 | |
| | |
32,011 | | Foot Locker, Inc. | | | 705,843 | |
| | |
51,818 | | Tapestry, Inc. | | | 671,043 | |
| | |
15,969 | | Equity Commonwealth | | | 506,377 | |
| | |
8,806 | | Discover Financial Services | | | 314,110 | |
| | |
8,902 | | U.S. Bancorp | | | 306,674 | |
| | |
4,358 | | Bristol-Myers Squibb Co. | | | 242,915 | |
| | |
3,198 | | Acacia Communications, Inc.(a) | | | 214,842 | |
| | |
84,927 | | Acacia Research Corp.(a) | | | 188,538 | |
| | |
2,701 | | QUALCOMM, Inc. | | | 182,723 | |
| | |
2,104 | | Intercontinental Exchange, Inc. | | | 169,898 | |
| | |
411 | | Costco Wholesale Corp. | | | 117,188 | |
| | |
2,542 | | Cisco Systems, Inc. | | | 99,926 | |
| | |
2,112 | | SEI Investments Co. | | | 97,870 | |
| | |
35 | | Booking Holdings, Inc.(a) | | | 47,086 | |
| | |
948 | | InterDigital, Inc. | | | 42,309 | |
| | |
168 | | Check Point Software Technologies Ltd.(a) | | | 16,891 | |
| | | | | | |
| | | | | 38,055,070 | |
| | | | | | |
| | Total common stocks (Cost $79,182,123) | | | 83,777,493 | |
| | | | | | |
The accompanying notes are an integral part of the financial statements.
ARIELINVESTMENTS.COM 29
| | |
Schedules of investments | | 03/31/20 (UNAUDITED) |
|
| | |
Ariel Global Fund(continued) | | |
| | | | | | |
Number of shares | | Short-term investments—3.18% | | Value |
| | |
2,866,109 | | Northern Institutional Treasury Portfolio, 0.40%(c) | | | $2,866,109 | |
| | | | | | |
| | Total short-term investments (Cost $2,866,109) | | | 2,866,109 | |
| | | | | | |
| | |
| | Total Investments—95.96% (Cost $82,048,232) | | | 86,643,602 | |
| | |
| | Cash, Foreign Currency, Other Assets less Liabilities—4.04% | | | 3,650,346 | |
| | | | | | |
| | |
| | Net Assets—100.00% | | | $90,293,948 | |
| | | | | | |
Open foreign currency contracts as of March 31, 2020
| | | | | | | | | | | | | | | | | | | | | | | | |
| | | | | | |
Contract settlement date | | Counterparty | | | Currency to
be received | | | Amount to
be received | | | Currency to
be delivered | | | Amount to
be delivered | | | Unrealized
appreciation
(depreciation) |
Open forward currency contracts with unrealized appreciation | | | | | | | | | | | | | |
| | | | | | |
05/13/2020 | | | UBS AG | | | | JPY | | | | 46,694,021 | | | | CNH | | | | 2,984,063 | | | | $14,623 | |
| | | | | | |
05/13/2020 | | | UBS AG | | | | USD | | | | 4,536,372 | | | | CNH | | | | 31,702,888 | | | | 68,541 | |
| | | | | | |
05/13/2020 | | | UBS AG | | | | USD | | | | 669,543 | | | | GBP | | | | 516,024 | | | | 28,016 | |
| | | | | | |
05/13/2020 | | | UBS AG | | | | CNH | | | | 6,453,169 | | | | USD | | | | 906,242 | | | | 3,191 | |
| | | | | | | | | | | | | | | | | | | | | | | | |
| | | | | | |
Subtotal UBS AG | | | | | | | | | | | | | | | | | | | | | | | 114,371 | |
| | | | | | | | | | | | | | | | | | | | | | | | |
| | | | | | |
05/13/2020 | | | Northern Trust | | | | SEK | | | | 2,302,516 | | | | GBP | | | | 185,007 | | | | 2,982 | |
| | | | | | |
05/13/2020 | | | Northern Trust | | | | USD | | | | 416,978 | | | | GBP | | | | 321,420 | | | | 17,385 | |
| | | | | | | | | | | | | | | | | | | | | | | | |
| | | | | | |
Subtotal Northern Trust | | | | | | | | | | | | | | | | | | | | | | | 20,367 | |
| | | | | | | | | | | | | | | | | | | | | | | | |
| | |
Subtotal - Open forward currency contracts with unrealized appreciation | | | | | | | | $134,738 | |
| | | | | | | | | | | | | | | | | | | | | | | | |
| | |
Open forward currency contracts with unrealized depreciation | | | | | | | | | |
| | | | | | |
05/13/2020 | | | UBS AG | | | | CAD | | | | 1,110,846 | | | | EUR | | | | 761,334 | | | | $(51,412) | |
| | | | | | |
05/13/2020 | | | UBS AG | | | | NOK | | | | 1,883,896 | | | | EUR | | | | 185,583 | | | | (23,783) | |
| | | | | | |
05/13/2020 | | | UBS AG | | | | SEK | | | | 3,462,334 | | | | EUR | | | | 328,793 | | | | (12,906) | |
| | | | | | |
05/13/2020 | | | UBS AG | | | | CNH | | | | 2,984,063 | | | | JPY | | | | 46,315,641 | | | | (11,097) | |
| | | | | | |
05/13/2020 | | | UBS AG | | | | CAD | | | | 505,922 | | | | USD | | | | 380,597 | | | | (20,934) | |
| | | | | | | | | | | | | | | | | | | | | | | | |
| | | | | | |
Subtotal UBS AG | | | | | | | | | | | | | | | | | | | | | | | (120,132) | |
| | | | | | | | | | | | | | | | | | | | | | | | |
| | | | | | |
05/13/2020 | | | Northern Trust | | | | AUD | | | | 366,189 | | | | GBP | | | | 190,026 | | | | (10,958) | |
| | | | | | |
05/13/2020 | | | Northern Trust | | | | SGD | | | | 755,494 | | | | USD | | | | 545,361 | | | | (13,454) | |
| | | | | | | | | | | | | | | | | | | | | | | | |
| | | | | | |
Subtotal Northern Trust | | | | | | | | | | | | | | | | | | | | | | | (24,412) | |
| | | | | | | | | | | | | | | | | | | | | | | | |
| | | | | | |
05/13/2020 | | | JPMorgan Chase | | | | AUD | | | | 524,874 | | | | CHF | | | | 343,000 | | | | (34,247) | |
| | | | | | |
05/13/2020 | | | JPMorgan Chase | | | | CAD | | | | 558,174 | | | | CHF | | | | 407,753 | | | | (27,772) | |
| | | | | | |
05/13/2020 | | | JPMorgan Chase | | | | AUD | | | | 1,702,073 | | | | EUR | | | | 1,043,745 | | | | (105,987) | |
| | | | | | |
05/13/2020 | | | JPMorgan Chase | | | | USD | | | | 513,441 | | | | EUR | | | | 467,703 | | | | (3,276) | |
| | | | | | |
05/13/2020 | | | JPMorgan Chase | | | | USD | | | | 1,071,140 | | | | JPY | | | | 117,119,139 | | | | (20,345) | |
| | | | | | | | | | | | | | | | | | | | | | | | |
| | | | | | |
Subtotal JPMorgan Chase | | | | | | | | | | | | | | | | | | | | | | | (191,627) | |
| | | | | | | | | | | | | | | | | | | | | | | | |
| | |
Subtotal - Open forward currency contracts with unrealized depreciation | | | | | | | | $(336,171) | |
| | | | | | | | | | | | | | | | | | | | | | | | |
| | |
Net unrealized appreciation (depreciation) on forward currency contracts | | | | | | | | $(201,433) | |
| | | | | | | | | | | | | | | | | | | | | | | | |
(a)Non-income producing.
(b)Affiliated company (See Note Seven, Transactions with Affiliated Companies).
(c)The rate presented is the7-day current yield as of March 31, 2020.
ADR American Depositary Receipt
A category may contain multiple industries as defined by the Global Industry Classification Standards.
The accompanying notes are an integral part of the financial statements.
30 SLOW AND STEADY WINS THE RACE
| | |
Statements of assets & liabilities | | 03/31/20 (UNAUDITED) |
|
| | | | | | | | | | | | |
| | | |
| | | Ariel Fund | | | Ariel Appreciation Fund | | Ariel Focus Fund |
Assets: | | | | | | | | | | | | |
| | | |
Investments in unaffiliated issuers, at value
(cost $1,130,601,432, $827,403,296 and $48,097,588, respectively) | | | $1,248,052,508 | | | | $845,445,778 | | | | $39,944,935 | |
| | | |
Investments in affiliated issuers, at value (cost $209,319,939) | | | 81,636,956(a) | | | | — | | | | — | |
| | | |
Short-term investments, at value (cost $14,498,226, $4,571,488 and $1,024,160, respectively) | | | 14,498,226 | | | | 4,571,488 | | | | 1,024,160 | |
| | | |
Dividends and interest receivable | | | 2,418,834 | | | | 1,392,765 | | | | 27,783 | |
| | | |
Receivable for dividend reclaims | | | — | | | | 16,246 | | | | — | |
| | | |
Receivable for fund shares sold | | | 1,895,608 | | | | 363,209 | | | | 29,524 | |
| | | |
Prepaid and other assets | | | 98,576 | | | | 66,981 | | | | 19,658 | |
| | | | | | | | | | | | |
Total assets | | | 1,348,600,708 | | | | 851,856,467 | | | | 41,046,060 | |
| | | | | | | | | | | | |
| | | |
Liabilities: | | | | | | | | | | | | |
| | | |
Payable for securities purchased | | | 1,745,601 | | | | — | | | | — | |
| | | |
Payable for fund shares redeemed | | | 1,136,975 | | | | 303,588 | | | | 54,451 | |
| | | |
Other liabilities | | | 575,299 | | | | 425,927 | | | | 31,586 | |
| | | | | | | | | | | | |
| | | |
Total liabilities | | | 3,457,875 | | | | 729,515 | | | | 86,037 | |
| | | | | | | | | | | | |
Net assets | | | $1,345,142,833 | | | | $851,126,952 | | | | $40,960,023 | |
| | | | | | | | | | | | |
| | | |
Net assets consist of: | | | | | | | | | | | | |
| | | |
Paid-in capital | | | $1,354,784,810 | | | | $730,699,763 | | | | $48,587,303 | |
| | | |
Distributable earnings | | | (9,641,977) | | | | 120,427,189 | | | | (7,627,280) | |
| | | | | | | | | | | | |
Net assets | | | $1,345,142,833 | | | | $851,126,952 | | | | $40,960,023 | |
| | | | | | | | | | | | |
| | | |
Investor class shares: | | | | | | | | | | | | |
| | | |
Net assets | | | $840,997,573 | | | | $678,176,661 | | | | $30,706,910 | |
| | | |
Shares outstanding (no par value, unlimited authorized) | | | 19,935,865 | | | | 22,166,620 | | | | 3,317,783 | |
| | | |
Net asset value, offering and redemption price per share | | | $42.19 | | | | $30.59 | | | | $9.26 | |
| | | |
Institutional class shares: | | | | | | | | | | | | |
| | | |
Net assets | | | $504,145,260 | | | | $172,950,291 | | | | $10,253,113 | |
| | | |
Shares outstanding (no par value, unlimited authorized) | | | 11,941,361 | | | | 5,645,929 | | | | 1,108,325 | |
| | | |
Net asset value, offering and redemption price per share | | | $42.22 | | | | $30.63 | | | | $9.25 | |
(a)See Note Seven, Transactions with Affiliated Companies, for information on affiliated issuers.
The accompanying notes are an integral part of the financial statements.
ARIELINVESTMENTS.COM 31
| | |
Statements of assets & liabilities | | 03/31/20 (UNAUDITED) |
|
| | | | | | | | | | | | |
| | | |
| | | Ariel International Fund | | | | Ariel Global Fund |
Assets: | | | | | | | | | | | | |
| | | |
Investments in unaffiliated issuers, at value (cost $578,399,673 and $79,182,123, respectively) | | | $548,411,776 | | | | | | | | $83,777,493 | |
| | | |
Short-term investments, at value (cost $20,791,447 and $2,866,109, respectively) | | | 20,791,447 | | | | | | | | 2,866,109 | |
| | | |
Foreign currencies (cost $21,667,419 and $2,787,141, respectively) | | | 21,287,142 | | | | | | | | 2,806,876 | |
| | | |
Dividends and interest receivable | | | 3,003,389 | | | | | | | | 395,033 | |
| | | |
Receivable for dividend reclaims | | | 2,967,545 | | | | | | | | 432,844 | |
| | | |
Receivable for fund shares sold | | | 167,213 | | | | | | | | 3,287 | |
| | | |
Receivable for securities and foreign currencies sold | | | 4,728,575 | | | | | | | | 805,843 | |
| | | |
Unrealized appreciation on forward currency contracts | | | 1,813,209 | | | | | | | | 134,738 | |
| | | |
Prepaid and other assets | | | 51,243 | | | | | | | | 22,376 | |
| | | | | | | | | | | | |
Total assets | | | 603,221,539 | | | | | | | | 91,244,599 | |
| | | | | | | | | | | | |
| | | |
Liabilities: | | | | | | | | | | | | |
| | | |
Payable for securities and foreign currencies purchased | | | 1,313,226 | | | | | | | | 577,585 | |
| | | |
Payable for fund shares redeemed | | | 5,930 | | | | | | | | — | |
| | | |
Unrealized depreciation on forward currency contracts | | | 7,061,745 | | | | | | | | 336,171 | |
| | | |
Other liabilities | | | 96,521 | | | | | | | | 36,895 | |
| | | | | | | | | | | | |
| | | |
Total liabilities | | | 8,477,422 | | | | | | | | 950,651 | |
| | | | | | | | | | | | |
Net assets | | | $594,744,117 | | | | | | | | $90,293,948 | |
| | | | | | | | | | | | |
| | | |
Net assets consist of: | | | | | | | | | | | | |
| | | |
Paid-in capital | | | $665,605,160 | | | | | | | | $88,778,579 | |
| | | |
Distributable earnings | | | (70,861,043) | | | | | | | | 1,515,369 | |
| | | | | | | | | | | | |
Net assets | | | $594,744,117 | | | | | | | | $90,293,948 | |
| | | | | | | | | | | | |
| | | |
Investor class shares: | | | | | | | | | | | | |
| | | |
Net assets | | | $18,621,040 | | | | | | | | $10,008,619 | |
| | | |
Shares outstanding (no par value, unlimited authorized) | | | 1,555,706 | | | | | | | | 736,982 | |
| | | |
Net asset value, offering and redemption price per share | | | $11.97 | | | | | | | | $13.58 | |
| | | |
Institutional class shares: | | | | | | | | | | | | |
| | | |
Net assets | | | $576,123,077 | | | | | | | | $80,285,329 | |
| | | |
Shares outstanding (no par value, unlimited authorized) | | | 49,222,125 | | | | | | | | 6,112,879 | |
| | | |
Net asset value, offering and redemption price per share | | | $11.70 | | | | | | | | $13.13 | |
The accompanying notes are an integral part of the financial statements.
32 SLOW AND STEADY WINS THE RACE
| | |
Statements of operations | | SIX MONTHS ENDED 03/31/20 (UNAUDITED) |
|
| | | | | | | | | | | | |
| | | |
| | | Ariel Fund | | | Ariel Appreciation Fund | | | Ariel Focus Fund | |
Investment income: | | | | | | | | | | | | |
Dividends | | | | | | | | | | | | |
Unaffiliated issuers | | $ | 14,584,731 | | | | $13,576,696 | | | | $636,045 | |
Affiliated issuers | | | 4,131,781(a) | | | | — | | | | — | |
Interest | | | 192,608 | | | | 119,722 | | | | 9,311 | |
| | | | | | | | | | | | |
Total investment income | | | 18,909,120 | | | | 13,696,418 | | | | 645,356 | |
| | | | | | | | | | | | |
| | | |
Expenses: | | | | | | | | | | | | |
Management fees | | | 5,897,052 | | | | 4,393,118 | | | | 185,660 | |
Distribution fees (Investor Class) | | | 1,587,590 | | | | 1,217,606 | | | | 52,773 | |
Shareholder service fees | | | | | | | | | | | | |
Investor Class | | | 597,603 | | | | 410,273 | | | | 13,078 | |
Institutional Class | | | 217,837 | | | | 64,689 | | | | 1,389 | |
Transfer agent fees and expenses | | | | | | | | | | | | |
Investor Class | | | 135,330 | | | | 109,385 | | | | 9,494 | |
Institutional Class | | | 46,056 | | | | 17,558 | | | | 1,532 | |
Printing and postage expenses | | | | | | | | | | | | |
Investor Class | | | 219,073 | | | | 162,375 | | | | 5,162 | |
Institutional Class | | | 33,695 | | | | 16,738 | | | | 284 | |
Trustees’ fees and expenses | | | 219,940 | | | | 138,014 | | | | 6,105 | |
Professional fees | | | 79,093 | | | | 54,019 | | | | 13,691 | |
Custody fees and expenses | | | 16,281 | | | | 9,906 | | | | 2,216 | |
Federal and state registration fees | | | 28,516 | | | | 21,763 | | | | 18,010 | |
Interest expense | | | 206 | | | | 98 | | | | — | |
Miscellaneous expenses | | | 114,039 | | | | 73,321 | | | | 6,635 | |
| | | | | | | | | | | | |
Total expenses before reimbursements | | | 9,192,311 | | | | 6,688,863 | | | | 316,029 | |
Expense reimbursements | | | — | | | | — | | | | (49,033) | |
| | | | | | | | | | | | |
Net expenses | | | 9,192,311 | | | | 6,688,863 | | | | 266,996 | |
| | | | | | | | | | | | |
Net investment income | | | 9,716,809 | | | | 7,007,555 | | | | 378,360 | |
| | | | | | | | | | | | |
| | | |
Realized and unrealized gain (loss): | | | | | | | | | | | | |
Net realized gain (loss) on investments | | | | | | | | | | | | |
Unaffiliated issuers | | | 45,975,530 | | | | 110,816,656 | | | | 1,008,379 | |
Change in net unrealized appreciation (depreciation) on investments | | | | | | | | | | | | |
Unaffiliated issuers | | | (503,232,240) | | | | (412,089,523) | | | | (16,970,553) | |
Affiliated issuers | | | (113,437,991)(a) | | | | — | | | | — | |
| | | | | | | | | | | | |
Net gain (loss) on investments | | | (570,694,701) | | | | (301,272,867) | | | | (15,962,174) | |
| | | | | | | | | | | | |
Net increase (decrease) in net assets resulting from operations | | $ | (560,977,892) | | | | $(294,265,312) | | | | $(15,583,814) | |
| | | | | | | | | | | | |
(a)See Note Seven, Transactions with Affiliated Companies, for information on affiliated issuers.
The accompanying notes are an integral part of the financial statements.
ARIELINVESTMENTS.COM 33
| | | | |
Statements of operations | | | SIX MONTHS ENDED 03/31/20 | (UNAUDITED) |
| |
| | | | | | | | |
| | |
| | | Ariel International Fund | | | Ariel Global Fund | |
Investment income: | | | | | | | | |
Dividends | | | | | | | | |
Unaffiliated issuers | | | $7,502,766(a) | | | | $1,235,681(a) | |
Interest | | | 119,294 | | | | 58,086 | |
| | | | | | | | |
Total investment income | | | 7,622,060 | | | | 1,293,767 | |
| | | | | | | | |
| | |
Expenses: | | | | | | | | |
Management fees | | | 2,838,271 | | | | 398,566 | |
Distribution fees (Investor Class) | | | 28,829 | | | | 15,159 | |
Shareholder service fees | | | | | | | | |
Investor Class | | | 7,678 | | | | 4,849 | |
Institutional Class | | | 65,471 | | | | 5,378 | |
Transfer agent fees and expenses | | | | | | | | |
Investor Class | | | 1,327 | | | | 2,037 | |
Institutional Class | | | 30,290 | | | | 3,473 | |
Printing and postage expenses | | | | | | | | |
Investor Class | | | 2,797 | | | | 2,060 | |
Institutional Class | | | 1,383 | | | | 694 | |
Trustees’ fees and expenses | | | 76,626 | | | | 10,104 | |
Professional fees | | | 37,972 | | | | 17,463 | |
Custody fees and expenses | | | 172,970 | | | | 7,916 | |
Administration fees | | | 26,236 | | | | 6,582 | |
Fund accounting fees | | | 17,577 | | | | 4,943 | |
Federal and state registration fees | | | 23,013 | | | | 19,261 | |
Miscellaneous expenses | | | 41,983 | | | | 8,691 | |
| | | | | | | | |
Total expenses before reimbursements | | | 3,372,423 | | | | 507,176 | |
Expense reimbursements | | | (221,494) | | | | (53,593) | |
| | | | | | | | |
Net expenses | | | 3,150,929 | | | | 453,583 | |
| | | | | | | | |
Net investment income | | | 4,471,131 | | | | 840,184 | |
| | | | | | | | |
| | |
Realized and unrealized gain (loss): | | | | | | | | |
Net realized gain (loss) on: | | | | | | | | |
Investments | | | (24,480,054) | | | | (1,195,068) | |
Translation of assets and liabilities in foreign currencies | | | (1,170,912) | | | | (33,056) | |
Forward currency contracts | | | (507,393) | | | | (182,853) | |
| | | | | | | | |
Total | | | (26,158,359) | | | | (1,410,977) | |
| | | | | | | | |
Change in net unrealized appreciation (depreciation) on: | | | | | | | | |
Investments | | | (39,476,831) | | | | (7,151,176) | |
Translation of assets and liabilities in foreign currencies | | | (42,107) | | | | 27,302 | |
Forward currency contracts | | | (3,946,729) | | | | (203,835) | |
| | | | | | | | |
Total | | | (43,465,667) | | | | (7,327,709) | |
| | | | | | | | |
Net gain (loss) on investments | | | (69,624,026) | | | | (8,738,686) | |
| | | | | | | | |
Net increase (decrease) in net assets resulting from operations | | | $(65,152,895) | | | | $(7,898,502) | |
| | | | | | | | |
(a)Net of $814,661 and $72,651 in foreign taxes withheld, respectively.
The accompanying notes are an integral part of the financial statements.
34 SLOW AND STEADY WINS THE RACE
| | | | |
Statements of changes in net assets | | | | |
| |
| | | | | | | | | | | | | | | | | | |
| | | Ariel Fund | | | | | Ariel Appreciation Fund | |
| | | Six Months Ended
March 31, 2020
(Unaudited) | | | Year Ended
September 30, 2019 | | | | | Six Months Ended
March 31, 2020
(Unaudited) | | | Year Ended
September 30, 2019 | |
Operations: | | | | | | | | | | | | | | | | | | |
Net investment income (loss) | | | $9,716,809 | | | | $22,948,503 | | | | | | $7,007,555 | | | | $15,267,901 | |
Net realized gain (loss) on investments | | | 45,975,530 | | | | 118,279,091 | | | | | | 110,816,656 | | | | 92,593,741 | |
Change in net unrealized appreciation (depreciation) on investments | | | (616,670,231) | | | | (303,261,071) | | | | | | (412,089,523) | | | | (184,014,159) | |
| | | | | | | | | | | | | | | | | | |
Net increase (decrease) in net assets from operations | | | (560,977,892) | | | | (162,033,477) | | | | | | (294,265,312) | | | | (76,152,517) | |
| | | | | | | | | | | | | | | | | | |
| | | | | |
Distributions to shareholders: | | | | | | | | | | | | | | | | | | |
Investor Class | | | (76,888,411) | | | | (121,436,612) | | | | | | (75,047,808) | | | | (74,863,766) | |
Institutional Class | | | (46,679,751) | | | | (55,975,419) | | | | | | (22,869,083) | | | | (15,836,105) | |
| | | | | | | | | | | | | | | | | | |
Total distributions | | | (123,568,162) | | | | (177,412,031) | | | | | | (97,916,891) | | | | (90,699,871) | |
| | | | | | | | | | | | | | | | | | |
| | | | | |
Share transactions: | | | | | | | | | | | | | | | | | | |
Value of shares issued | | | | | | | | | | | | | | | | | | |
Investor Class | | | 50,587,119 | | | | 116,556,382(a) | | | | | | 31,008,569 | | | | 51,028,975 | |
Institutional Class | | | 48,258,107 | | | | 323,922,186(a) | | | | | | 14,951,059 | | | | 109,586,371 | |
Value of shares issued in reinvestment of dividends and distributions | | | | | | | | | | | | | | | | | | |
Investor Class | | | 74,932,867 | | | | 119,065,017 | | | | | | 73,132,225 | | | | 73,152,298 | |
Institutional Class | | | 45,595,738 | | | | 55,435,521 | | | | | | 21,956,038 | | | | 15,069,678 | |
Value of shares redeemed | | | | | | | | | | | | | | | | | | |
Investor Class | | | (156,606,757) | | | | (282,090,577) | | | | | | (111,486,805) | | | | (308,080,536) | |
Institutional Class | | | (78,686,755) | | | | (209,043,725) | | | | | | (81,260,353) | | | | (68,570,363) | |
| | | | | | | | | | | | | | | | | | |
Net increase (decrease) in net assets from share transactions | | | (15,919,681) | | | | 123,844,804 | | | | | | (51,699,267) | | | | (127,813,577) | |
| | | | | | | | | | | | | | | | | | |
Total increase (decrease) in net assets | | | (700,465,735) | | | | (215,600,704) | | | | | | (443,881,470) | | | | (294,665,965) | |
| | | | | |
Net assets: | | | | | | | | | | | | | | | | | | |
Beginning of period | | | 2,045,608,568 | | | | 2,261,209,272 | | | | | | 1,295,008,422 | | | | 1,589,674,387 | |
| | | | | | | | | | | | | | | | | | |
End of period | | | $1,345,142,833 | | | | $2,045,608,568 | | | | | | $851,126,952 | | | | $1,295,008,422 | |
| | | | | | | | | | | | | | | | | | |
| | | | | |
Capital share transactions: | | | | | | | | | | | | | | | | | | |
Investor shares | | | | | | | | | | | | | | | | | | |
Shares sold | | | 843,358 | | | | 1,813,506(a) | | | | | | 733,530 | | | | 1,170,467 | |
Shares issued to holders in reinvestment of dividends | | | 1,185,100 | | | | 1,897,547 | | | | | | 1,681,654 | | | | 1,696,245 | |
Shares redeemed | | | (2,639,313) | | | | (4,455,367) | | | | | | (2,683,637) | | | | (7,148,786) | |
| | | | | | | | | | | | | | | | | | |
Net increase (decrease) | | | (610,855) | | | | (744,314) | | | | | | (268,453) | | | | (4,282,074) | |
| | | | | | | | | | | | | | | | | | |
| | | | | |
Institutional shares | | | | | | | | | | | | | | | | | | |
Shares sold | | | 853,404 | | | | 5,078,350(a) | | | | | | 362,043 | | | | 2,492,412 | |
Shares issued to holders in reinvestment of dividends | | | 718,813 | | | | 886,283 | | | | | | 503,224 | | | | 351,123 | |
Shares redeemed | | | (1,320,842) | | | | (3,277,965) | | | | | | (1,912,892) | | | | (1,545,478) | |
| | | | | | | | | | | | | | | | | | |
Net increase (decrease) | | | 251,375 | | | | 2,686,668 | | | | | | (1,047,625) | | | | 1,298,057 | |
| | | | | | | | | | | | | | | | | | |
| (a) | These amounts include the value of shares issued through the reorganization of Ariel Discovery Fund into Ariel Fund of $4,965,629 and $14,356,814 and shares issued from the reorganization of 75,749 and 218,695 for Investor Class and Institutional Class, respectively. Refer to Note Nine, Reorganization, in the Funds’ audited financial statements as of September 30, 2019, for more detail on this reorganization. |
The accompanying notes are an integral part of the financial statements.
ARIELINVESTMENTS.COM 35
| | | | |
Statements of changes in net assets | | | | |
| |
| | | | | | | | |
| | | Ariel Focus Fund | |
| | | Six Months Ended
March 31, 2020
(Unaudited) | | | Year Ended
September 30, 2019 | |
Operations: | | | | | | | | |
Net investment income (loss) | | | $378,360 | | | | $770,096 | |
Net realized gain (loss) on investments | | | 1,008,379 | | | | (134,698) | |
Change in net unrealized appreciation (depreciation) on investments | | | (16,970,553) | | | | (5,793,427) | |
| | | | | | | | |
Net increase (decrease) in net assets from operations | | | (15,583,814) | | | | (5,158,029) | |
| | | | | | | | |
| | |
Distributions to shareholders: | | | | | | | | |
Investor Class | | | (449,140) | | | | (2,567,313) | |
Institutional Class | | | (190,860) | | | | (1,252,679) | |
| | | | | | | | |
Total distributions | | | (640,000) | | | | (3,819,992) | |
| | | | | | | | |
| | |
Share transactions: | | | | | | | | |
Value of shares issued | | | | | | | | |
Investor Class | | | 6,819,976 | | | | 7,999,737 | |
Institutional Class | | | 157,264 | | | | 1,724,291 | |
Value of shares issued in reinvestment of dividends and distributions | | | | | | | | |
Investor Class | | | 391,077 | | | | 2,250,259 | |
Institutional Class | | | 182,515 | | | | 1,186,707 | |
Value of shares redeemed | | | | | | | | |
Investor Class | | | (5,032,036) | | | | (8,764,504) | |
Institutional Class | | | (1,656,751) | | | | (4,989,722) | |
| | | | | | | | |
Net increase (decrease) in net assets from share transactions | | | 862,045 | | | | (593,232) | |
| | | | | | | | |
Total increase (decrease) in net assets | | | (15,361,769) | | | | (9,571,253) | |
| | |
Net assets: | | | | | | | | |
Beginning of period | | | 56,321,792 | | | | 65,893,045 | |
| | | | | | | | |
End of period | | | $40,960,023 | | | | $56,321,792 | |
| | | | | | | | |
| | |
Capital share transactions: | | | | | | | | |
Investor shares | | | | | | | | |
Shares sold | | | 540,811 | | | | 635,992 | |
Shares issued to holders in reinvestment of dividends | | | 28,587 | | | | 179,404 | |
Shares redeemed | | | (414,551) | | | | (695,801) | |
| | | | | | | | |
Net increase (decrease) | | | 154,847 | | | | 119,595 | |
| | | | | | | | |
| | |
Institutional shares | | | | | | | | |
Shares sold | | | 13,190 | | | | 136,137 | |
Shares issued to holders in reinvestment of dividends | | | 13,361 | | | | 94,584 | |
Shares redeemed | | | (124,899) | | | | (440,749) | |
| | | | | | | | |
Net increase (decrease) | | | (98,348) | | | | (210,028) | |
| | | | | | | | |
The accompanying notes are an integral part of the financial statements.
36 SLOW AND STEADY WINS THE RACE
| | | | |
Statements of changes in net assets | | | | |
| |
| | | | | | | | | | | | | | | | | | |
| | | Ariel International Fund | | | | | Ariel Global Fund | |
| | | Six Months Ended
March 31, 2020
(Unaudited) | | | Year Ended
September 30, 2019 | | | | | Six Months Ended
March 31, 2020
(Unaudited) | | | Year Ended
September 30, 2019 | |
Operations: | | | | | | | | | | | | | | | | | | |
Net investment income (loss) | | | $4,471,131 | | | | $17,661,678 | | | | | | $840,184 | | | | $2,261,856 | |
Net realized gain (loss) on investments, foreign currency translations and forward currency contracts | | | (26,158,359) | | | | (16,028,175) | | | | | | (1,410,977) | | | | 1,154,087 | |
Change in net unrealized appreciation (depreciation) on investments, foreign currency translations and forward currency contracts | | | (43,465,667) | | | | (14,904,463) | | | | | | (7,327,709) | | | | (7,624,720) | |
| | | | | | | | | | | | | | | | | | |
Net increase (decrease) in net assets from operations | | | (65,152,895) | | | | (13,270,960) | | | | | | (7,898,502) | | | | (4,208,777) | |
| | | | | | | | | | | | | | | | | | |
| | | | | |
Distributions to shareholders: | | | | | | | | | | | | | | | | | | |
Investor Class | | | (386,371) | | | | (493,805) | | | | | | (534,437) | | | | (427,827) | |
Institutional Class | | | (14,313,629) | | | | (9,261,318) | | | | | | (4,196,383) | | | | (3,493,124) | |
| | | | | | | | | | | | | | | | | | |
Total distributions | | | (14,700,000) | | | | (9,755,123) | | | | | | (4,730,820) | | | | (3,920,951) | |
| | | | | | | | | | | | | | | | | | |
| | | | | |
Share transactions: | | | | | | | | | | | | | | | | | | |
Value of shares issued | | | | | | | | | | | | | | | | | | |
Investor Class | | | 1,794,113 | | | | 4,453,870 | | | | | | 812,160 | | | | 2,595,157 | |
Institutional Class | | | 34,490,858 | | | | 227,428,221 | | | | | | 14,670,674 | | | | 22,429,052 | |
Value of shares issued in reinvestment of dividends and distributions | | | | | | | | | | | | | | | | | | |
Investor Class | | | 355,381 | | | | 471,981 | | | | | | 461,660 | | | | 372,292 | |
Institutional Class | | | 13,880,644 | | | | 8,975,997 | | | | | | 4,177,327 | | | | 3,433,255 | |
Value of shares redeemed | | | | | | | | | | | | | | | | | | |
Investor Class | | | (6,084,350) | | | | (31,784,545) | | | | | | (1,896,498) | | | | (4,645,873) | |
Institutional Class | | | (117,305,324) | | | | (113,239,539) | | | | | | (1,185,283) | | | | (64,577,573) | |
| | | | | | | | | | | | | | | | | | |
Net increase (decrease) in net assets from share transactions | | | (72,868,678) | | | | 96,305,985 | | | | | | 17,040,040 | | | | (40,393,690) | |
| | | | | | | | | | | | | | | | | | |
Total increase (decrease) in net assets | | | (152,721,573) | | | | 73,279,902 | | | | | | 4,410,718 | | | | (48,523,418) | |
| | | | | |
Net assets: | | | | | | | | | | | | | | | | | | |
Beginning of period | | | 747,465,690 | | | | 674,185,788 | | | | | | 85,883,230 | | | | 134,406,648 | |
| | | | | | | | | | | | | | | | | | |
End of period | | | $594,744,117 | | | | $747,465,690 | | | | | | $90,293,948 | | | | $85,883,230 | |
| | | | | | | | | | | | | | | | | | |
| | | | | |
Capital share transactions: | | | | | | | | | | | | | | | | | | |
Investor shares | | | | | | | | | | | | | | | | | | |
Shares sold | | | 134,402 | | | | 337,981 | | | | | | 53,663 | | | | 169,063 | |
Shares issued to holders in reinvestment of dividends | | | 25,787 | | | | 37,752 | | | | | | 29,826 | | | | 25,726 | |
Shares redeemed | | | (455,455) | | | | (2,418,338) | | | | | | (136,313) | | | | (302,833) | |
| | | | | | | | | | | | | | | | | | |
Net increase (decrease) | | | (295,266) | | | | (2,042,605) | | | | | | (52,824) | | | | (108,044) | |
| | | | | | | | | | | | | | | | | | |
| | | | | |
Institutional shares | | | | | | | | | | | | | | | | | | |
Shares sold | | | 2,626,100 | | | | 17,554,342 | | | | | | 975,908 | | | | 1,521,524 | |
Shares issued to holders in reinvestment of dividends | | | 1,033,555 | | | | 735,258 | | | | | | 279,454 | | | | 245,457 | |
Shares redeemed | | | (9,272,891) | | | | (8,785,066) | | | | | | (84,154) | | | | (4,309,256) | |
| | | | | | | | | | | | | | | | | | |
Net increase (decrease) | | | (5,613,236) | | | | 9,504,534 | | | | | | 1,171,208 | | | | (2,542,275) | |
| | | | | | | | | | | | | | | | | | |
The accompanying notes are an integral part of the financial statements.
ARIELINVESTMENTS.COM 37
| | |
Financial highlightsFor a share outstanding throughout each period | | |
|
| | | | | | | | | | | | | | | | | | | | | | | | | | |
| | | | | | | Year ended September 30 |
Ariel Fund (Investor Class) | | Six months ended
March 31, 2020
(Unaudited) | | | | 2019 | | 2018 | | 2017 | | 2016 | | 2015 |
Net asset value, beginning of period | | | $63.40 | | | | | | $74.58 | | | | $69.11 | | | | $63.74 | | | | $63.93 | | | | $75.33 | |
Income from investment operations: | | | | | | | | | | | | | | | | | | | | | | | | | | |
Net investment income (loss) | | | 0.28 | | | | | | 0.65 | | | | 0.57 | | | | 0.52 | | | | 0.62 | | | | 0.50 | |
Net realized and unrealized gain (loss) on investments | | | (17.71 | ) | | | | | (6.10 | ) | | | 9.31 | | | | 9.07 | | | | 8.86 | | | | (2.07 | ) |
| | | | | | | | | | | | | | | | | | | | | | | | | | |
Total from investment operations | | | (17.43 | ) | | | | | (5.45 | ) | | | 9.88 | | | | 9.59 | | | | 9.48 | | | | (1.57 | ) |
| | | | | | | |
Distributions to shareholders: | | | | | | | | | | | | | | | | | | | | | | | | | | |
Dividends from net investment income | | | (0.55 | ) | | | | | (0.59 | ) | | | (0.48 | ) | | | (0.18 | ) | | | (0.41 | ) | | | (0.40 | ) |
Distributions from capital gains | | | (3.23 | ) | | | | | (5.14 | ) | | | (3.93 | ) | | | (4.04 | ) | | | (9.26 | ) | | | (9.43 | ) |
| | | | | | | | | | | | | | | | | | | | | | | | | | |
Total distributions | | | (3.78 | ) | | | | | (5.73 | ) | | | (4.41 | ) | | | (4.22 | ) | | | (9.67 | ) | | | (9.83 | ) |
| | | | | | | | | | | | | | | | | | | | | | | | | | |
Net asset value, end of period | | | $42.19 | | | | | | $63.40 | | | | $74.58 | | | | $69.11 | | | | $63.74 | | | | $63.93 | |
| | | | | | | | | | | | | | | | | | | | | | | | | | |
Total return | | | (29.45)% | (a) | | | | | (7.17)% | | | | 14.98% | | | | 15.76% | | | | 15.55% | | | | (3.40)% | |
| | | | | | | |
Supplemental data and ratios: | | | | | | | | | | | | | | | | | | | | | | | | | | |
Net assets, end of period, in thousands | | | $840,998 | | | | | | $1,302,745 | | | | $1,587,936 | | | | $1,542,730 | | | | $1,467,270 | | | | $1,494,724 | |
Ratio of expenses to average net assets | | | 1.03% | (b) | | | | | 1.02% | | | | 1.01% | | | | 1.01% | | | | 1.02% | | | | 1.02% | |
Ratio of net investment income to average net assets | | | 0.85% | (b) | | | | | 0.97% | | | | 0.74% | | | | 0.72% | | | | 1.02% | | | | 0.67% | |
Portfolio turnover rate | | | 13% | (a) | | | | | 22% | | | | 19% | | | | 14% | | | | 20% | | | | 25% | |
| | | | | | | | | | | | | | | | | | | | | | | | | | |
| | | | | | | Year ended September 30 |
Ariel Fund (Institutional Class) | | Six months ended
March 31, 2020
(Unaudited) | | | | 2019 | | 2018 | | 2017 | | 2016 | | 2015 |
Net asset value, beginning of period | | | $63.55 | | | | | | $74.78 | | | | $69.28 | | | | $63.87 | | | | $64.08 | | | | $75.49 | |
Income from investment operations: | | | | | | | | | | | | | | | | | | | | | | | | | | |
Net investment income (loss) | | | 0.33 | | | | | | 0.74 | | | | 0.73 | | | | 0.63 | | | | 0.77 | | | | 0.57 | |
Net realized and unrealized gain (loss) on investments | | | (17.68 | ) | | | | | (6.03 | ) | | | 9.38 | | | | 9.19 | | | | 8.91 | | | | (1.93 | ) |
| | | | | | | | | | | | | | | | | | | | | | | | | | |
Total from investment operations | | | (17.35 | ) | | | | | (5.29 | ) | | | 10.11 | | | | 9.82 | | | | 9.68 | | | | (1.36 | ) |
| | | | | | | |
Distributions to shareholders: | | | | | | | | | | | | | | | | | | | | | | | | | | |
Dividends from net investment income | | | (0.75 | ) | | | | | (0.80 | ) | | | (0.68 | ) | | | (0.37 | ) | | | (0.63 | ) | | | (0.62 | ) |
Distributions from capital gains | | | (3.23 | ) | | | | | (5.14 | ) | | | (3.93 | ) | | | (4.04 | ) | | | (9.26 | ) | | | (9.43 | ) |
| | | | | | | | | | | | | | | | | | | | | | | | | | |
Total distributions | | | (3.98 | ) | | | | | (5.94 | ) | | | (4.61 | ) | | | (4.41 | ) | | | (9.89 | ) | | | (10.05 | ) |
| | | | | | | | | | | | | | | | | | | | | | | | | | |
Net asset value, end of period | | | $42.22 | | | | | | $63.55 | | | | $74.78 | | | | $69.28 | | | | $63.87 | | | | $64.08 | |
| | | | | | | | | | | | | | | | | | | | | | | | | | |
Total return | | | (29.34)% | (a) | | | | | (6.86)% | | | | 15.30% | | | | 16.11% | | | | 15.87% | | | | (3.11)% | |
| | | | | | | |
Supplemental data and ratios: | | | | | | | | | | | | | | | | | | | | | | | | | | |
Net assets, end of period, in thousands | | | $504,145 | | | | | | $742,864 | | | | $673,273 | | | | $593,887 | | | | $521,595 | | | | $516,743 | |
Ratio of expenses to average net assets | | | 0.71% | (b) | | | | | 0.70% | | | | 0.72% | | | | 0.71% | | | | 0.72% | | | | 0.72% | |
Ratio of net investment income to average net assets | | | 1.17% | (b) | | | | | 1.31% | | | | 1.03% | | | | 1.01% | | | | 1.31% | | | | 0.97% | |
Portfolio turnover rate | | | 13% | (a) | | | | | 22% | | | | 19% | | | | 14% | | | | 20% | | | | 25% | |
The accompanying notes are an integral part of the financial statements.
38 SLOW AND STEADY WINS THE RACE
| | |
Financial highlightsFor a share outstanding throughout each period | | |
|
| | | | | | | | | | | | | | | | | | | | | | | | | | |
| | | | | | | Year ended September 30 |
Ariel Appreciation Fund (Investor Class) | | Six months ended
March 31, 2020
(Unaudited) | | | | 2019 | | 2018 | | 2017 | | 2016 | | 2015 |
Net asset value, beginning of period | | | $44.43 | | | | | | $49.48 | | | | $50.91 | | | | $48.90 | | | | $48.01 | | | | $56.12 | |
Income from investment operations: | | | | | | | | | | | | | | | | | | | | | | | | | | |
Net investment income (loss) | | | 0.23 | | | | | | 0.62 | | | | 0.40 | | | | 0.51 | | | | 0.70 | | | | 0.50 | |
Net realized and unrealized gain (loss) on investments | | | (10.69 | ) | | | | | (2.83 | ) | | | 4.17 | | | | 5.21 | | | | 5.62 | | | | (2.08 | ) |
| | | | | | | | | | | | | | | | | | | | | | | | | | |
Total from investment operations | | | (10.46 | ) | | | | | (2.21 | ) | | | 4.57 | | | | 5.72 | | | | 6.32 | | | | (1.58 | ) |
| | | | | | | |
Distributions to shareholders: | | | | | | | | | | | | | | | | | | | | | | | | | | |
Dividends from net investment income | | | (0.42 | ) | | | | | (0.42 | ) | | | (0.39 | ) | | | (0.30 | ) | | | (0.50 | ) | | | (0.37 | ) |
Distributions from capital gains | | | (2.96 | ) | | | | | (2.42 | ) | | | (5.61 | ) | | | (3.41 | ) | | | (4.93 | ) | | | (6.16 | ) |
| | | | | | | | | | | | | | | | | | | | | | | | | | |
Total distributions | | | (3.38 | ) | | | | | (2.84 | ) | | | (6.00 | ) | | | (3.71 | ) | | | (5.43 | ) | | | (6.53 | ) |
| | | | | | | | | | | | | | | | | | | | | | | | | | |
Net asset value, end of period | | | $30.59 | | | | | | $44.43 | | | | $49.48 | | | | $50.91 | | | | $48.90 | | | | $48.01 | |
| | | | | | | | | | | | | | | | | | | | | | | | | | |
Total return | | | (25.76)% | (a) | | | | | (4.23)% | | | | 9.90% | | | | 12.41% | | | | 13.66% | | | | (3.89)% | |
| | | | | | | |
Supplemental data and ratios: | | | | | | | | | | | | | | | | | | | | | | | | | | |
Net assets, end of period, in thousands | | | $678,177 | | | | | | $996,797 | | | | $1,321,843 | | | | $1,450,735 | | | | $1,483,144 | | | | $1,557,796 | |
Ratio of expenses to average net assets | | | 1.15% | (b) | | | | | 1.14% | | | | 1.13% | | | | 1.12% | | | | 1.12% | | | | 1.12% | |
Ratio of net investment income to average net assets | | | 1.08% | (b) | | | | | 1.05% | | | | 0.72% | | | | 0.94% | | | | 1.43% | | | | 0.95% | |
Portfolio turnover rate | | | 13% | (a) | | | | | 18% | | | | 11% | | | | 20% | | | | 14% | | | | 22% | |
| | | | | | | | | | | | | | | | | | | | | | | | | | |
| | | | | | | Year ended September 30 |
Ariel Appreciation Fund (Institutional Class) | | Six months ended
March 31, 2020
(Unaudited) | | | | 2019 | | 2018 | | 2017 | | 2016 | | 2015 |
Net asset value, beginning of period | | | $44.55 | | | | | | $49.64 | | | | $51.07 | | | | $49.03 | | | | $48.17 | | | | $56.28 | |
Income from investment operations: | | | | | | | | | | | | | | | | | | | | | | | | | | |
Net investment income (loss) | | | 0.36 | | | | | | 0.59 | | | | 0.48 | | | | 0.59 | | | | 0.72 | | | | 0.65 | |
Net realized and unrealized gain (loss) on investments | | | (10.76 | ) | | | | | (2.68 | ) | | | 4.25 | | | | 5.30 | | | | 5.76 | | | | (2.04 | ) |
| | | | | | | | | | | | | | | | | | | | | | | | | | |
Total from investment operations | | | (10.40 | ) | | | | | (2.09 | ) | | | 4.73 | | | | 5.89 | | | | 6.48 | | | | (1.39 | ) |
| | | | | | | |
Distributions to shareholders: | | | | | | | | | | | | | | | | | | | | | | | | | | |
Dividends from net investment income | | | (0.56 | ) | | | | | (0.58 | ) | | | (0.55 | ) | | | (0.44 | ) | | | (0.69 | ) | | | (0.56 | ) |
Distributions from capital gains | | | (2.96 | ) | | | | | (2.42 | ) | | | (5.61 | ) | | | (3.41 | ) | | | (4.93 | ) | | | (6.16 | ) |
| | | | | | | | | | | | | | | | | | | | | | | | | | |
Total distributions | | | (3.52 | ) | | | | | (3.00 | ) | | | (6.16 | ) | | | (3.85 | ) | | | (5.62 | ) | | | (6.72 | ) |
| | | | | | | | | | | | | | | | | | | | | | | | | | |
Net asset value, end of period | | | $30.63 | | | | | | $44.55 | | | | $49.64 | | | | $51.07 | | | | $49.03 | | | | $48.17 | |
| | | | | | | | | | | | | | | | | | | | | | | | | | |
Total return | | | (25.63)% | (a) | | | | | (3.91)% | | | | 10.21% | | | | 12.78% | | | | 14.01% | | | | (3.55)% | |
| | | | | | | |
Supplemental data and ratios: | | | | | | | | | | | | | | | | | | | | | | | | | | |
Net assets, end of period, in thousands | | | $172,950 | | | | | | $298,211 | | | | $267,831 | | | | $247,526 | | | | $219,206 | | | | $193,561 | |
Ratio of expenses to average net assets | | | 0.83% | (b) | | | | | 0.82% | | | | 0.82% | | | | 0.81% | | | | 0.82% | | | | 0.79% | |
Ratio of net investment income to average net assets | | | 1.35% | (b) | | | | | 1.39% | | | | 1.03% | | | | 1.25% | | | | 1.73% | | | | 1.31% | |
Portfolio turnover rate | | | 13% | (a) | | | | | 18% | | | | 11% | | | | 20% | | | | 14% | | | | 22% | |
The accompanying notes are an integral part of the financial statements.
ARIELINVESTMENTS.COM 39
| | | | |
Financial highlightsFor a share outstanding throughout each period | | | | |
| |
| | | | | | | | | | | | | | | | | | | | | | | | | | |
| | | | | | | Year ended September 30 |
Ariel Focus Fund (Investor Class) | | Six months ended March 31, 2020 (Unaudited) | | | | 2019 | | 2018 | | 2017 | | 2016 | | 2015 |
Net asset value, beginning of period | | | $12.89 | | | | | | $14.77 | | | | $13.71 | | | | $11.83 | | | | $11.70 | | | | $15.12 | |
Income from investment operations: | | | | | | | | | | | | | | | | | | | | | | | | | | |
Net investment income (loss) | | | 0.08 | | | | | | 0.16 | | | | 0.13 | | | | 0.13 | | | | 0.13 | | | | 0.14 | |
Net realized and unrealized gain (loss) on investments | | | (3.57 | ) | | | | | (1.20 | ) | | | 1.71 | | | | 1.88 | | | | 1.46 | | | | (1.99 | ) |
| | | | | | | | | | | | | | | | | | | | | | | | | | |
Total from investment operations | | | (3.49 | ) | | | | | (1.04 | ) | | | 1.84 | | | | 2.01 | | | | 1.59 | | | | (1.85 | ) |
| | | | | | | |
Distributions to shareholders: | | | | | | | | | | | | | | | | | | | | | | | | | | |
Dividends from net investment income | | | (0.14 | ) | | | | | (0.13 | ) | | | (0.11 | ) | | | (0.13 | ) | | | (0.13 | ) | | | (0.11 | ) |
Distributions from capital gains | | | — | | | | | | (0.71 | ) | | | (0.67 | ) | | | — | | | | (1.33 | ) | | | (1.46 | ) |
| | | | | | | | | | | | | | | | | | | | | | | | | | |
Total distributions | | | (0.14 | ) | | | | | (0.84 | ) | | | (0.78 | ) | | | (0.13 | ) | | | (1.46 | ) | | | (1.57 | ) |
| | | | | | | | | | | | | | | | | | | | | | | | | | |
Net asset value, end of period | | | $9.26 | | | | | | $12.89 | | | | $14.77 | | | | $13.71 | | | | $11.83 | | | | $11.70 | |
| | | | | | | | | | | | | | | | | | | | | | | | | | |
Total return | | | (27.41)% | (a) | | | | | (6.86)% | | | | 14.26% | | | | 17.09% | | | | 14.59% | | | | (13.98)% | |
| | | | | | | |
Supplemental data and ratios: | | | | | | | | | | | | | | | | | | | | | | | | | | |
Net assets, end of period, in thousands | | | $30,707 | | | | | | $40,770 | | | | $44,964 | | | | $40,607 | | | | $36,173 | | | | $33,553 | |
Ratio of expenses to average net assets, including waivers | | | 1.00% | (b) | | | | | 1.00% | | | | 1.00% | | | | 1.00% | | | | 1.00% | | | | 1.00% | |
Ratio of expenses to average net assets, excluding waivers | | | 1.20% | (b) | | | | | 1.23% | | | | 1.20% | | | | 1.19% | | | | 1.35% | | | | 1.37% | |
Ratio of net investment income to average net assets, including waivers | | | 1.27% | (b) | | | | | 1.30% | | | | 0.98% | | | | 0.93% | | | | 1.23% | | | | 0.89% | |
Ratio of net investment income to average net assets, excluding waivers | | | 1.07% | (b) | | | | | 1.07% | | | | 0.78% | | | | 0.74% | | | | 0.88% | | | | 0.52% | |
Portfolio turnover rate | | | 11% | (a) | | | | | 18% | | | | 27% | | | | 35% | | | | 20% | | | | 16% | |
| | | | | | | | | | | | | | | | | | | | | | | | | | |
| | | | | | | Year ended September 30 |
Ariel Focus Fund (Institutional Class) | | Six months ended
March 31, 2020
(Unaudited) | | | | 2019 | | 2018 | | 2017 | | 2016 | | 2015 |
Net asset value, beginning of period | | | $12.89 | | | | | | $14.77 | | | | $13.69 | | | | $11.81 | | | | $11.71 | | | | $15.14 | |
Income from investment operations: | | | | | | | | | | | | | | | | | | | | | | | | | | |
Net investment income (loss) | | | 0.10 | | | | | | 0.19 | | | | 0.17 | | | | 0.15 | | | | 0.15 | | | | 0.15 | |
Net realized and unrealized gain (loss) on investments | | | (3.58 | ) | | | | | (1.20 | ) | | | 1.71 | | | | 1.89 | | | | 1.46 | | | | (1.97 | ) |
| | | | | | | | | | | | | | | | | | | | | | | | | | |
Total from investment operations | | | (3.48 | ) | | | | | (1.01 | ) | | | 1.88 | | | | 2.04 | | | | 1.61 | | | | (1.82 | ) |
| | | | | | | |
Distributions to shareholders: | | | | | | | | | | | | | | | | | | | | | | | | | | |
Dividends from net investment income | | | (0.16 | ) | | | | | (0.16 | ) | | | (0.13 | ) | | | (0.16 | ) | | | (0.18 | ) | | | (0.15 | ) |
Distributions from capital gains | | | — | | | | | | (0.71 | ) | | | (0.67 | ) | | | — | | | | (1.33 | ) | | | (1.46 | ) |
| | | | | | | | | | | | | | | | | | | | | | | | | | |
Total distributions | | | (0.16 | ) | | | | | (0.87 | ) | | | (0.80 | ) | | | (0.16 | ) | | | (1.51 | ) | | | (1.61 | ) |
| | | | | | | | | | | | | | | | | | | | | | | | | | |
Net asset value, end of period | | | $9.25 | | | | | | $12.89 | | | | $14.77 | | | | $13.69 | | | | $11.81 | | | | $11.71 | |
| | | | | | | | | | | | | | | | | | | | | | | | | | |
Total return | | | (27.38)% | (a) | | | | | (6.56)% | | | | 14.54% | | | | 17.40% | | | | 14.83% | | | | (13.77)% | |
| | | | | | | |
Supplemental data and ratios: | | | | | | | | | | | | | | | | | | | | | | | | | | |
Net assets, end of period, in thousands | | | $10,253 | | | | | | $15,552 | | | | $20,929 | | | | $14,378 | | | | $11,618 | | | | $10,332 | |
Ratio of expenses to average net assets, including waivers | | | 0.75% | (b) | | | | | 0.75% | | | | 0.75% | | | | 0.75% | | | | 0.75% | | | | 0.75% | |
Ratio of expenses to average net assets, excluding waivers | | | 0.86% | (b) | | | | | 0.89% | | | | 0.86% | | | | 0.90% | | | | 1.08% | | | | 1.07% | |
Ratio of net investment income to average net assets, including waivers | | | 1.50% | (b) | | | | | 1.54% | | | | 1.24% | | | | 1.18% | | | | 1.48% | | | | 1.15% | |
Ratio of net investment income to average net assets, excluding waivers | | | 1.39% | (b) | | | | | 1.40% | | | | 1.13% | | | | 1.03% | | | | 1.15% | | | | 0.84% | |
Portfolio turnover rate | | | 11% | (a) | | | | | 18% | | | | 27% | | | | 35% | | | | 20% | | | | 16% | |
The accompanying notes are an integral part of the financial statements.
40 SLOW AND STEADY WINS THE RACE
| | | | |
Financial highlights For a share outstanding throughout each period | | | | |
| |
| | | | | | | | | | | | | | | | | | | | | | | | | | |
| | | | | | | Year ended September 30 |
Ariel International Fund (Investor Class) | | Six months ended March 31, 2020 (Unaudited) | | | | 2019 | | 2018 | | 2017 | | 2016 | | 2015 |
Net asset value, beginning of period | | | $13.42 | | | | | | $13.91 | | | | $14.23 | | | | $13.21 | | | | $12.17 | | | | $12.85 | |
Income from investment operations: | | | | | | | | | | | | | | | | | | | | | | | | | | |
Net investment income (loss) | | | 0.28 | | | | | | 0.79 | | | | 0.37 | | | | 0.26 | | | | 0.14 | | | | 0.01 | |
Net realized and unrealized gain (loss) on investments | | | (1.51 | ) | | | | | (1.13 | ) | | | (0.44 | ) | | | 0.96 | | | | 0.93 | | | | (0.23 | ) |
| | | | | | | | | | | | | | | | | | | | | | | | | | |
Total from investment operations | | | (1.23 | ) | | | | | (0.34 | ) | | | (0.07 | ) | | | 1.22 | | | | 1.07 | | | | (0.22 | ) |
| | | | | | | |
Distributions to shareholders: | | | | | | | | | | | | | | | | | | | | | | | | | | |
Dividends from net investment income | | | (0.22 | ) | | | | | (0.12 | ) | | | (0.10 | ) | | | (0.17 | ) | | | (0.02 | ) | | | (0.13 | ) |
Distributions from capital gains | | | — | | | | | | (0.03 | ) | | | (0.15 | ) | | | (0.03 | ) | | | (0.01 | ) | | | (0.33 | ) |
| | | | | | | | | | | | | | | | | | | | | | | | | | |
Total distributions | | | (0.22 | ) | | | | | (0.15 | ) | | | (0.25 | ) | | | (0.20 | ) | | | (0.03 | ) | | | (0.46 | ) |
| | | | | | | | | | | | | | | | | | | | | | | | | | |
Net asset value, end of period | | | $11.97 | | | | | | $13.42 | | | | $13.91 | | | | $14.23 | | | | $13.21 | | | | $12.17 | |
| | | | | | | | | | | | | | | | | | | | | | | | | | |
Total return | | | (9.38)% | (a) | | | | | (2.39)% | | | | (0.49)% | | | | 9.55% | | | | 8.76% | | | | (1.79)% | |
| | | | | | | |
Supplemental data and ratios: | | | | | | | | | | | | | | | | | | | | | | | | | | |
Net assets, end of period, in thousands | | | $18,621 | | | | | | $24,849 | | | | $54,169 | | | | $70,616 | | | | $72,200 | | | | $11,290 | |
Ratio of expenses to average net assets, including waivers | | | 1.13% | (b) | | | | | 1.13% | | | | 1.13% | | | | 1.15% | (c) | | | 1.25% | | | | 1.26% | (d) |
Ratio of expenses to average net assets, excluding waivers | | | 1.26% | (b) | | | | | 1.32% | | | | 1.31% | | | | 1.32% | | | | 1.52% | | | | 3.49% | |
Ratio of net investment income to average net assets, including waivers | | | 0.99% | (b) | | | | | 1.94% | | | | 1.80% | | | | 1.79% | | | | 1.94% | | | | 1.39% | |
Ratio of net investment income (loss) to average net assets, excluding waivers | | | 0.86% | (b) | | | | | 1.75% | | | | 1.62% | | | | 1.62% | | | | 1.67% | | | | (0.84)% | |
Portfolio turnover rate | | | 10% | (a) | | | | | 20% | | | | 8% | | | | 23% | | | | 27% | | | | 34% | |
| | | | | | | | | | | | | | | | | | | | | | | | | | |
| | | | | | | Year ended September 30 |
Ariel International Fund (Institutional Class) | | Six months ended March 31,
2020 (Unaudited) | | | | 2019 | | 2018 | | 2017 | | 2016 | | 2015 |
Net asset value, beginning of period | | | $13.18 | | | | | | $13.68 | | | | $13.99 | | | | $13.00 | | | | $11.96 | | | | $12.71 | |
Income from investment operations: | | | | | | | | | | | | | | | | | | | | | | | | | | |
Net investment income (loss) | | | 0.11 | | | | | | 0.29 | | | | 0.23 | | | | 0.18 | | | | 0.20 | | | | 0.18 | |
Net realized and unrealized gain (loss) on investments | | | (1.31 | ) | | | | | (0.60 | ) | | | (0.26 | ) | | | 1.05 | | | | 0.87 | | | | (0.37 | ) |
| | | | | | | | | | | | | | | | | | | | | | | | | | |
Total from investment operations | | | (1.20 | ) | | | | | (0.31 | ) | | | (0.03 | ) | | | 1.23 | | | | 1.07 | | | | (0.19 | ) |
| | | | | | | |
Distributions to shareholders: | | | | | | | | | | | | | | | | | | | | | | | | | | |
Dividends from net investment income | | | (0.28 | ) | | | | | (0.16 | ) | | | (0.13 | ) | | | (0.21 | ) | | | (0.02 | ) | | | (0.23 | ) |
Distributions from capital gains | | | — | | | | | | (0.03 | ) | | | (0.15 | ) | | | (0.03 | ) | | | (0.01 | ) | | | (0.33 | ) |
| | | | | | | | | | | | | | | | | | | | | | | | | | |
Total distributions | | | (0.28 | ) | | | | | (0.19 | ) | | | (0.28 | ) | | | (0.24 | ) | | | (0.03 | ) | | | (0.56 | ) |
| | | | | | | | | | | | | | | | | | | | | | | | | | |
Net asset value, end of period | | | $11.70 | | | | | | $13.18 | | | | $13.68 | | | | $13.99 | | | | $13.00 | | | | $11.96 | |
| | | | | | | | | | | | | | | | | | | | | | | | | | |
Total return | | | (9.36)% | (a) | | | | | (2.13)% | | | | (0.17)% | | | | 9.80% | | | | 8.98% | | | | (1.48)% | |
| | | | | | | |
Supplemental data and ratios: | | | | | | | | | | | | | | | | | | | | | | | | | | |
Net assets, end of period, in thousands | | | $576,123 | | | | | | $722,616 | | | | $620,017 | | | | $431,341 | | | | $120,904 | | | | $9,587 | |
Ratio of expenses to average net assets, including waivers | | | 0.88% | (b) | | | | | 0.88% | | | | 0.88% | | | | 0.89% | (c) | | | 1.00% | | | | 1.01% | (d) |
Ratio of expenses to average net assets, excluding waivers | | | 0.94% | (b) | | | | | 0.93% | | | | 0.93% | | | | 0.95% | | | | 1.10% | | | | 2.68% | |
Ratio of net investment income to average net assets, including waivers | | | 1.27% | (b) | | | | | 2.49% | | | | 2.23% | | | | 2.52% | | | | 2.41% | | | | 1.69% | |
Ratio of net investment income to average net assets, excluding waivers | | | 1.21% | (b) | | | | | 2.44% | | | | 2.18% | | | | 2.46% | | | | 2.31% | | | | 0.02% | |
Portfolio turnover rate | | | 10% | (a) | | | | | 20% | | | | 8% | | | | 23% | | | | 27% | | | | 34% | |
| (c) | Effective November 29, 2016, the Adviser has contractually agreed to waive fees and reimburse expenses in order to limit the Fund’s total annual operating expenses to 1.13% for the Investor Class and 0.88% for the Institutional Class through the end of the fiscal year ending September 30, 2019. |
| (d) | These ratios round to 1.26% for the Investor Class and 1.01% for the Institutional Class due to interest expense which is excluded from the expense waiver. |
The accompanying notes are an integral part of the financial statements.
ARIELINVESTMENTS.COM 41
| | |
Financial highlightsFor a share outstanding throughout each period | | |
|
| | | | | | | | | | | | | | | | | | | | | | | | | | |
| | | | | | | Year ended September 30 |
Ariel Global Fund (Investor Class) | | Six months ended
March 31, 2020
(Unaudited) | | | | 2019 | | 2018 | | 2017 | | 2016 | | 2015 |
Net asset value, beginning of period | | | $15.40 | | | | | | $16.48 | | | | $16.05 | | | | $14.60 | | | | $13.11 | | | | $13.96 | |
Income from investment operations: | | | | | | | | | | | | | | | | | | | | | | | | | | |
Net investment income (loss) | | | 0.12 | | | | | | 0.32 | | | | 0.19 | | | | 0.22 | | | | 0.12 | | | | (0.07 | ) |
Net realized and unrealized gain (loss) on investments | | | (1.25 | ) | | | | | (0.92 | ) | | | 0.94 | | | | 1.60 | | | | 1.48 | | | | (0.64 | ) |
| | | | | | | | | | | | | | | | | | | | | | | | | | |
Total from investment operations | | | (1.13 | ) | | | | | (0.60 | ) | | | 1.13 | | | | 1.82 | | | | 1.60 | | | | (0.71 | ) |
| | | | | | | |
Distributions to shareholders: | | | | | | | | | | | | | | | | | | | | | | | | | | |
Dividends from net investment income | | | (0.31 | ) | | | | | (0.32 | ) | | | (0.16 | ) | | | (0.21 | ) | | | (0.11 | ) | | | — | |
Distributions from capital gains | | | (0.38 | ) | | | | | (0.16 | ) | | | (0.54 | ) | | | (0.16 | ) | | | — | | | | (0.14 | ) |
| | | | | | | | | | | | | | | | | | | | | | | | | | |
Total distributions | | | (0.69 | ) | | | | | (0.48 | ) | | | (0.70 | ) | | | (0.37 | ) | | | (0.11 | ) | | | (0.14 | ) |
| | | | | | | | | | | | | | | | | | | | | | | | | | |
Net asset value, end of period | | | $13.58 | | | | | | $15.40 | | | | $16.48 | | | | $16.05 | | | | $14.60 | | | | $13.11 | |
| | | | | | | | | | | | | | | | | | | | | | | | | | |
Total return | | | (7.85)% | (a) | | | | | (3.41)% | | | | 7.38% | | | | 12.87% | | | | 12.26% | | | | (5.15)% | |
| | | | | | | |
Supplemental data and ratios: | | | | | | | | | | | | | | | | | | | | | | | | | | |
Net assets, end of period, in thousands | | | $10,009 | | | | | | $12,159 | | | | $14,798 | | | | $11,459 | | | | $9,275 | | | | $6,095 | |
Ratio of expenses to average net assets, including waivers | | | 1.13% | (b) | | | | | 1.13% | | | | 1.13% | | | | 1.15% | (c) | | | 1.25% | | | | 1.25% | |
Ratio of expenses to average net assets, excluding waivers | | | 1.35% | (b) | | | | | 1.44% | | | | 1.46% | | | | 1.42% | | | | 1.70% | | | | 2.71% | |
Ratio of net investment income to average net assets, including waivers | | | 1.39% | (b) | | | | | 1.85% | | | | 1.60% | | | | 1.66% | | | | 1.34% | | | | 1.30% | |
Ratio of net investment income (loss) to average net assets, excluding waivers | | | 1.17% | (b) | | | | | 1.54% | | | | 1.27% | | | | 1.39% | | | | 0.90% | | | | (0.16)% | |
Portfolio turnover rate | | | 9% | (a) | | | | | 29% | | | | 11% | | | | 24% | | | | 31% | | | | 35% | |
| | | | | | | | | | | | | | | | | | | | | | | | | | |
| | | | | | | Year ended September 30 |
Ariel Global Fund (Institutional Class) | | Six months ended
March 31, 2020
(Unaudited) | | | | 2019 | | 2018 | | 2017 | | 2016 | | 2015 |
Net asset value, beginning of period | | | $14.92 | | | | | | $15.98 | | | | $15.57 | | | | $14.21 | | | | $12.81 | | | | $13.79 | |
Income from investment operations: | | | | | | | | | | | | | | | | | | | | | | | | | | |
Net investment income (loss) | | | 0.06 | | | | | | 0.39 | | | | 0.24 | | | | 0.25 | | | | 0.20 | | | | 0.18 | |
Net realized and unrealized gain (loss) on investments | | | (1.14 | ) | | | | | (0.93 | ) | | | 0.89 | | | | 1.55 | | | | 1.40 | | | | (0.84 | ) |
| | | | | | | | | | | | | | | | | | | | | | | | | | |
Total from investment operations | | | (1.08 | ) | | | | | (0.54 | ) | | | 1.13 | | | | 1.80 | | | | 1.60 | | | | (0.66 | ) |
| | | | | | | |
Distributions to shareholders: | | | | | | | | | | | | | | | | | | | | | | | | | | |
Dividends from net investment income | | | (0.33 | ) | | | | | (0.36 | ) | | | (0.18 | ) | | | (0.28 | ) | | | (0.20 | ) | | | (0.18 | ) |
Distributions from capital gains | | | (0.38 | ) | | | | | (0.16 | ) | | | (0.54 | ) | | | (0.16 | ) | | | — | | | | (0.14 | ) |
| | | | | | | | | | | | | | | | | | | | | | | | | | |
Total distributions | | | (0.71 | ) | | | | | (0.52 | ) | | | (0.72 | ) | | | (0.44 | ) | | | (0.20 | ) | | | (0.32 | ) |
| | | | | | | | | | | | | | | | | | | | | | | | | | |
Net asset value, end of period | | | $13.13 | | | | | | $14.92 | | | | $15.98 | | | | $15.57 | | | | $14.21 | | | | $12.81 | |
| | | | | | | | | | | | | | | | | | | | | | | | | | |
Total return | | | (7.75)% | (a) | | | | | (3.18)% | | | | 7.63% | | | | 13.10% | | | | 12.56% | | | | (4.88)% | |
| | | | | | | |
Supplemental data and ratios: | | | | | | | | | | | | | | | | | | | | | | | | | | |
Net assets, end of period, in thousands | | | $80,285 | | | | | | $73,724 | | | | $119,609 | | | | $89,898 | | | | $73,166 | | | | $52,002 | |
Ratio of expenses to average net assets, including waivers | | | 0.88% | (b) | | | | | 0.88% | | | | 0.88% | | | | 0.90% | (c) | | | 1.00% | | | | 1.00% | |
Ratio of expenses to average net assets, excluding waivers | | | 0.97% | (b) | | | | | 0.99% | | | | 0.98% | | | | 1.01% | | | | 1.14% | | | | 1.30% | |
Ratio of net investment income to average net assets, including waivers | | | 1.73% | (b) | | | | | 2.07% | | | | 1.88% | | | | 1.91% | | | | 1.60% | | | | 1.40% | |
Ratio of net investment income to average net assets, excluding waivers | | | 1.64% | (b) | | | | | 1.96% | | | | 1.78% | | | | 1.80% | | | | 1.47% | | | | 1.10% | |
Portfolio turnover rate | | | 9% | (a) | | | | | 29% | | | | 11% | | | | 24% | | | | 31% | | | | 35% | |
| (c) | Effective November 29, 2016, the Adviser has contractually agreed to waive fees and reimburse expenses in order to limit the Fund’s total annual operating expenses to 1.13% for the Investor Class and 0.88% for the Institutional Class through the end of the fiscal year ending September 30, 2019. |
The accompanying notes are an integral part of the financial statements.
42 SLOW AND STEADY WINS THE RACE
| | |
Notes to the financial statements | | 03/31/20 (UNAUDITED) |
|
NOTE ONE | ORGANIZATION
Ariel Investment Trust (the “Trust”) is a Massachusetts business trust registered under the Investment Company Act of 1940, as amended (the “1940 Act”), as anopen-end management investment company. Ariel Fund, Ariel Appreciation Fund, Ariel Focus Fund, Ariel International Fund and Ariel Global Fund (each, a “Fund” and collectively, the “Funds”) are series of the Trust. Ariel Focus Fund is anon-diversified Fund, all other Funds are diversified. The Funds issue two classes of shares: an Investor Class and an Institutional Class.
The Northern Trust Company (“Northern Trust”) provides fund administration and tax reporting services for the Funds in its role assub-fund administrator engaged by the Adviser for Ariel Fund, Ariel Appreciation Fund and Ariel Focus Fund and as fund administrator engaged by the Trust for Ariel International Fund and Ariel Global Fund. Northern Trust also acts as the Funds’ accounting agent and custodian. U.S. Bank Global Fund Services serves as the Funds’ transfer agent.
NOTE TWO | SIGNIFICANT ACCOUNTING POLICIES
The following is a summary of significant accounting policies consistently followed by the Funds in the preparation of their financial statements. The Funds are investment companies and follow accounting and reporting guidance in the Financial Accounting Standards Board (FASB) Accounting Standards CodificationTM Topic 946 (ASC 946). The accompanying financial statements were prepared in accordance with accounting principles generally accepted in the United States of America (GAAP), including but not limited to ASC 946. GAAP requires management to make certain estimates and assumptions at the date of the financial statements. Actual results may differ from such estimates.
Securities valuation—Securities for which market quotations are readily available are valued at the last sale price on the national securities exchange on which such securities are primarily traded and, in the case of securities reported on the Nasdaq system, are valued based on the Nasdaq Official Closing Price. If a last sale price or a closing price is not reported, a security shall be valued using i) the closing price on another exchange on which the security traded (if such price is made available by the pricing vendor) or ii) the mean between the bid and ask prices for securities for which reliable bid and ask quotations are available.
Certain common stocks that trade on foreign exchanges are subject to valuation adjustments to account for the market movement between the close of a foreign market in which the security is traded and the close of the New York Stock Exchange. In the event the Funds become aware of a significant event that may materially affect the value of a security, a fair value of such security will be determined in accordance with procedures established by the Board of Trustees.
Investments in money market funds are valued at their closing net asset value each business day.
Debt securities having a maturity over 60 days are valued using evaluated prices or matrix pricing methods determined by a pricing service which take into consideration factors such as yield, maturity, ratings, and traded prices in identical or similar securities. Short-term debt obligations having a maturity of 60 days or less are valued at amortized cost, so long as it approximates fair value.
Securities and assets for which market quotations are not readily available are valued at fair value as determined in good faith by or under the direction of the Board of Trustees.
Securities transactions and investment income—Securities transactions are accounted for on a trade date basis. Realized gains and losses from securities transactions are recorded on the identified cost basis. Dividend income is recorded on theex-dividend date and interest income is recognized on an accrual basis. Dividends from foreign securities are recorded on theex-dividend date, or as soon as the information is available.
Subsequent events—In preparing these financial statements, the Trust has evaluated subsequent events after March 31, 2020 and there were no such events that would require adjustment to or additional disclosure in these financial statements except as disclosed in Note Nine – Subsequent Events.
Fair value measurements—Accounting Standards CodificationTM Topic820-10 (ASC820-10) establishes a three-tier framework for measuring fair value based on a hierarchy of inputs. The hierarchy distinguishes between market data obtained from independent sources (observable inputs) and the Funds’ own market assumptions (unobservable inputs). These inputs are used in determining the value of the Funds’ investments and are summarized below:
Level 1 – quoted prices in active markets for identical securities
Level 2 – other significant observable inputs (including quoted prices for similar securities, “quoted” prices in inactive markets, dealer indications, and inputs corroborated by observable market data)
Level 3 – significant unobservable inputs (including the Funds’ own assumptions in determining the fair value of investments)
The inputs or methodology used for valuing securities are not necessarily an indication of the risk associated with investing in those securities.
ARIELINVESTMENTS.COM 43
| | |
Notes to the financial statements | | 03/31/20 (UNAUDITED) |
|
The following tables summarize the inputs used as of March 31, 2020 in valuing the Funds’ investments carried at fair value:
| | | | | | | | | | | | |
| | | Ariel Fund | | | Ariel Appreciation Fund | | | Ariel Focus Fund | |
Level 1 | | | $1,344,187,690 | | | | $850,017,266 | | | | $40,969,095 | |
Level 2 | | | — | | | | — | | | | — | |
Level 3 | | | — | | | | — | | | | — | |
| | | | | | | | | | | | |
Total Investments | | | $1,344,187,690 | | | | $850,017,266 | | | | $40,969,095 | |
| | | | | | | | | | | | |
Industry classifications for Ariel Fund, Ariel Appreciation Fund, and Ariel Focus Fund are included in the Schedules of Investments for the respective Fund.
| | | | | | | | | | | | | | | | |
Ariel International Fund | | Level 1 | | | Level 2 * | | | Level 3 | | | Total | |
Common stocks | | | | | | | | | | | | | | | | |
Communication services | | | $18,538,384 | | | | $146,206,487 | | | | $— | | | | $164,744,871 | |
Consumer discretionary | | | — | | | | 59,283,866 | | | | — | | | | 59,283,866 | |
Consumer staples | | | 32,664,922 | | | | 52,861,204 | | | | — | | | | 85,526,126 | |
Energy | | | 4,975,488 | | | | 6,909,231 | | | | — | | | | 11,884,719 | |
Financial services | | | 1,984,866 | | | | 54,427,820 | | | | — | | | | 56,412,686 | |
Health care | | | 619,035 | | | | 91,767,099 | | | | — | | | | 92,386,134 | |
Industrials | | | — | | | | 16,942,593 | | | | — | | | | 16,942,593 | |
Information technology | | | 11,074,118 | | | | 3,405,124 | | | | — | | | | 14,479,242 | |
Real estate | | | — | | | | 6,258,999 | | | | — | | | | 6,258,999 | |
Utilities | | | — | | | | 40,492,540 | | | | — | | | | 40,492,540 | |
| | | | | | | | | | | | | | | | |
Total common stocks | | | $69,856,813 | | | | $478,554,963 | | | | $— | | | | $548,411,776 | |
Short-term investments | | | 20,791,447 | | | | — | | | | — | | | | 20,791,447 | |
| | | | | | | | | | | | | | | | |
Total investments | | | $90,648,260 | | | | $478,554,963 | | | | $— | | | | $569,203,223 | |
| | | | | | | | | | | | | | | | |
Other financial instruments | | | | | | | | | | | | | | | | |
Forward currency contracts ^ | | | $— | | | | $(5,248,536) | | | | $— | | | | $(5,248,536) | |
Ariel Global Fund | | Level 1 | | | Level 2 * | | | Level 3 | | | Total | |
Common stocks | | | | | | | | | | | | | | | | |
Communication services | | | $5,779,161 | | | | $12,936,936 | | | | $— | | | | $18,716,097 | |
Consumer discretionary & services | | | 1,423,972 | | | | 5,426,661 | | | | — | | | | 6,850,633 | |
Consumer staples | | | 5,472,169 | | | | 2,812,109 | | | | — | | | | 8,284,278 | |
Energy | | | 1,953,384 | | | | — | | | | — | | | | 1,953,384 | |
Financial services | | | 4,275,218 | | | | 3,983,994 | | | | — | | | | 8,259,212 | |
Health care | | | 11,249,613 | | | | 12,638,776 | | | | — | | | | 23,888,389 | |
Industrials | | | 188,538 | | | | 810,217 | | | | — | | | | 998,755 | |
Information technology | | | 11,920,851 | | | | 861,470 | | | | — | | | | 12,782,321 | |
Real estate | | | 506,377 | | | | 278,590 | | | | — | | | | 784,967 | |
Utilities | | | — | | | | 1,259,457 | | | | — | | | | 1,259,457 | |
| | | | | | | | | | | | | | | | |
Total common stocks | | | $42,769,283 | | | | $41,008,210 | | | | $— | | | | $83,777,493 | |
Short-term investments | | | 2,866,109 | | | | — | | | | — | | | | 2,866,109 | |
| | | | | | | | | | | | | | | | |
Total investments | | | $45,635,392 | | | | $41,008,210 | | | | $— | | | | $86,643,602 | |
| | | | | | | | | | | | | | | | |
Other financial instruments | | | | | | | | | | | | | | | | |
Forward currency contracts ^ | | | $— | | | | $(201,433) | | | | $— | | | | $(201,433) | |
| * | As of March 31, 2020, the Level 2 investments held were securities subject to fair valuation adjustments and forward currency contracts. See Schedules of Investments. |
| ^ | Forward currency contracts derive their value from underlying exchange rates. These instruments are normally valued by pricing vendors using pricing models. The pricing models typically use inputs that are observed from trading in active forward foreign currency markets. As such, forward currency contracts are categorized as Level 2. The value of forward currency contracts that is disclosed in this table is equal to the difference between Open forward currency contracts with unrealized appreciation and Open forward currency contracts with unrealized depreciation shown in the Schedules of Investments. |
44 SLOW AND STEADY WINS THE RACE
| | |
Notes to the financial statements | | 03/31/20 (UNAUDITED) |
|
Offsetting assets and liabilities—The Funds are subject to various master netting agreements (“Master Netting Agreements”), which govern the terms of certain transactions with select counterparties. Master Netting Agreements seek to reduce the counterparty risk associated with relevant transactions by allowing the Funds to close out and net their total exposure to a counterparty in the event of a default by the other party or a termination event. Termination events include, but are not limited to, a failure to pay or deliver or a breach of the terms of the agreement with respect to transactions governed under a single agreement with that counterparty. The Master Netting Agreements may also specify collateral posting arrangements atpre-arranged exposure levels. The Funds are not currently collateralizing their exposures related to foreign exchange trades. For financial reporting purposes, the Funds do not offset financial assets and liabilities that are subject to the Master Netting Agreements in the Statements of Assets and Liabilities. Gross exposure relating to open forward currency contracts by counterparty is disclosed in the Schedules of Investments as Open forward currency contracts with unrealized appreciation (assets) and Open forward currency contracts with unrealized depreciation (liabilities) and in total by Fund on the Statements of Assets and Liabilities as Unrealized appreciation on forward currency contracts (assets) and Unrealized depreciation on forward currency contracts (liabilities). The net recognized asset (appreciation) or liability (depreciation) is shown in the Schedules of Investments as Net unrealized appreciation (depreciation) on forward currency contracts.
Foreign currency—Securities and other assets and liabilities denominated in foreign currencies are translated into U.S. dollars on a daily basis using exchange rates obtained from an independent third party. Net realized gain (loss) and Net unrealized appreciation (depreciation) on investments include the effects of changes in exchange rates on the underlying investments. Fluctuations in the value of other assets and liabilities resulting from changes in exchange rates are included as Distributable earnings on the Statements of Assets and Liabilities until the underlying assets or liabilities are settled in cash, at which time they are recorded as Net realized gain (loss) on translation of assets and liabilities in foreign currencies on the Statements of Operations.
Forward currency contracts—Ariel International Fund and Ariel Global Fund enter into forward currency contracts to provide the appropriate currency exposure related to protecting the value of securities and related receivables and payables against changes in foreign exchange rates. The primary risk associated with a Fund’s use of these contracts is that a counterparty will fail to fulfill its obligation to pay gains due to the Fund under the contracts. This counterparty risk is mitigated by entering into forward currency contracts only with highly rated counterparties. Forward currency contracts are“marked-to-market” daily, and as noted above, any resulting unrealized gain (loss) is recorded as Net unrealized appreciation (depreciation) on forward currency contracts as disclosed in the Schedules of Investments and in the Statements of Assets and Liabilities as a component of Distributable earnings. The Funds record realized gain (loss) at the time a forward currency contract is settled or closed and disclose such realized gain (loss) on the Statements of Operations as Net realized gain (loss) on forward currency contracts.
Class and expense allocations—Each class of shares of the Funds has equal rights as to assets and earnings, except that shareholders of each class bear certain class-specific expenses related to marketing and distribution and shareholder servicing and communication. Income, othernon-class-specific expense, and realized and unrealized gains and losses on investments are allocated to each class of shares based on its relative net assets. Expenses that are not directly attributable to one or more Funds are allocated among applicable Funds on an equitable and consistent basis considering such things as the nature and type of expense and the relative net assets of the Funds.
Ariel Fund, Ariel Appreciation Fund and Ariel Focus Fund pay all operating expenses not expressly assumed by the Adviser, including custodial and transfer agency fees, federal and state securities registration fees, legal and audit fees, and brokerage commissions and other costs associated with the purchase and sale of portfolio securities. Ariel International Fund and Ariel Global Fund pay all operating expenses not expressly assumed by the Adviser, including custodial and transfer agency fees, fund administration, fund accounting, federal and state securities registration fees, legal and audit fees, and brokerage commissions and other costs associated with the purchase and sale of portfolio securities.
Distributions to shareholders—Dividends from net investment income and net realized capital gains, if any, are declared and paid to shareholders at least annually and are recorded onex-dividend date.
NOTE THREE | INVESTMENT TRANSACTIONS
Purchases and sales—Cost of purchases and proceeds from sales of securities, excluding short-term investments, for the six months ended March 31, 2020 were as follows:
| | | | | | | | | | |
| | | | | |
| | | Ariel Fund | | Ariel Appreciation
Fund | | Ariel Focus Fund | | Ariel International
Fund | | Ariel Global Fund |
| | | | | |
Purchases | | $257,482,879 | | $151,076,891 | | $6,773,393 | | $63,891,921 | | $20,752,783 |
| | | | | |
Sales | | 362,802,661 | | 284,836,405 | | 6,078,564 | | 139,782,277 | | 7,792,330 |
ARIELINVESTMENTS.COM 45
| | |
Notes to the financial statements | | 03/31/20 (UNAUDITED) |
|
NOTE FOUR | INCOME TAX MATTERS AND DISTRIBUTIONS TO SHAREHOLDERS
Income Tax Matters—It is the Funds’ policy to comply with the requirements of the Internal Revenue Code applicable to regulated investment companies and to distribute substantially all taxable income to shareholders. The Funds file U.S. federal income tax returns in addition to state and local tax returns that may be required. Management has analyzed the Funds’ tax positions taken for all open federal income tax years (September 30, 2016 – 2019), and has concluded that no provision for federal income tax is required in the financial statements.
The cost and unrealized appreciation and depreciation of investments (including derivative instruments) on a federal income tax basis at March 31, 2020 were as follows:
| | | | | | | | | | | | | | | | | | | | |
| | | | | |
| | | Ariel Fund | | Ariel Appreciation
Fund | | Ariel Focus Fund | | Ariel International
Fund | | Ariel Global Fund | |
| | | | | |
Cost of investments | | | $1,406,484,352 | | | | $839,260,148 | | | | $49,601,512 | | | | $606,885,136 | | | | $84,073,767 | |
| | | | | | | | | | | | | | | | | | | | |
| | | | | |
Gross unrealized appreciation | | | 360,085,518 | | | | 253,889,404 | | | | 8,356,520 | | | | 59,753,960 | | | | 14,073,231 | |
| | | | | |
Gross unrealized depreciation | | | (422,382,180) | | | | (243,132,286) | | | | (16,988,937) | | | | (97,435,873) | | | | (11,503,396) | |
| | | | | | | | | | | | | | | | | | | | |
| | | | | |
Net unrealized appreciation (depreciation) | | | $(62,296,662) | | | | $10,757,118 | | | | $(8,632,417) | | | | $(37,681,913) | | | | $2,569,835 | |
| | | | | | | | | | | | | | | | | | | | |
The difference between book basis and tax basis unrealized appreciation and depreciation is attributable primarily to the deferral of losses due to wash sales and partnership adjustments.
Tax adjustments are calculated annually. For interim periods, the Funds determine an estimate of tax cost adjustments based on a review of accounting reports for the interim period to identify changes from the adjustments calculated at the fiscal year end. For the previous fiscal year’s federal income tax information, please refer to the Notes to Financial Statements section in the Fund’s most recent annual report.
Distributions to shareholders—Reclassifications between net asset accounts are made at the end of the fiscal year for such differences that are permanent in nature. These differences are primarily due to distribution reclassifications, net operating loss, or foreign currency.
Distributions —The tax character of distributions paid during the periods ended March 31, 2020 and September 30, 2019 was as follows:
| | | | | | | | | | | | | | | | | | | | | | | | |
| | | Ariel Fund | | | Ariel Appreciation Fund | | | Ariel Focus Fund | |
| | | 03/31/20 | | | 09/30/19 | | | 03/31/20 | | | 09/30/19 | | | 03/31/20 | | | 09/30/19 | |
Distributions from: | | | | | | | | | | | | | | | | | | | | | | | | |
Ordinary income | | | $24,668,121 | | | | $23,085,014 | | | | $14,116,870 | | | | $20,849,905 | | | | $640,000 | | | | $645,000 | |
Long-term capital gains | | | 98,900,041 | | | | 154,327,017 | | | | 83,800,021 | | | | 69,849,966 | | | | — | | | | 3,174,992 | |
| | | | | | | | | | | | | | | | | | | | | | | | |
Total distributions | | | $123,568,162 | | | | $177,412,031 | | | | $97,916,891 | | | | $90,699,871 | | | | $640,000 | | | | $3,819,992 | |
| | | | | | | | | | | | | | | | | | | | | | | | |
| | | | | | | | | | | | | | | | | | | | | | | | |
| | | Ariel International Fund | | | Ariel Global Fund | | | | |
| | | 03/31/20 | | | 09/30/19 | | | 03/31/20 | | | 09/30/19 | | | | | | | |
Distributions from: | | | | | | | | | | | | | | | | | | | | | | | | |
Ordinary income | | | $14,700,000 | | | | $8,300,000 | | | | $2,250,000 | | | | $3,045,985 | | | | | | | | | |
Long-term capital gains | | | — | | | | 1,455,123 | | | | 2,480,820 | | | | 874,966 | | | | | | | | | |
| | | | | | | | | | | | | | | | | | | | | | | | |
Total distributions | | | $14,700,000 | | | | $9,755,123 | | | | $4,730,820 | | | | $3,920,951 | | | | | | | | | |
| | | | | | | | | | | | | | | | | | | | | | | | |
46 SLOW AND STEADY WINS THE RACE
| | |
Notes to the financial statements | | 03/31/20 (UNAUDITED) |
NOTE FIVE | INVESTMENT ADVISORY AND OTHER TRANSACTIONS WITH RELATED PARTIES
Management fees—Ariel Investments, LLC (the “Adviser”) provides investment advisory and administrative services to Ariel Fund, Ariel Appreciation Fund and Ariel Focus Fund under a Management Agreement. The Adviser provides investment advisory services to Ariel International Fund and Ariel Global Fund under an Advisory Agreement (collectively, the “Agreements”). Pursuant to the Agreements, the Adviser is paid a monthly fee on average daily net assets at the annual rates shown below:
| | | | | | | | | | | | | | | | | | | | |
Management fees | | Ariel Fund | | | Ariel Appreciation
Fund | | | Ariel Focus Fund | | | Ariel International
Fund | | | Ariel Global Fund | |
Average daily net assets: | | | | | | | | | | | | | | | | | |
First $500 million | | | 0.65% | | | | 0.75% | | | | 0.65% | | | | 0.80% | | | | 0.80% | |
Next $500 million | | | 0.60% | | | | 0.70% | | | | 0.60% | | | | 0.80% | | | | 0.80% | |
Over $1 billion | | | 0.55% | | | | 0.65% | | | | 0.55% | | | | 0.75% | | | | 0.75% | |
The Adviser has contractually agreed to reimburse the Funds to the extent their respective total annual operating expenses (excluding brokerage, interest, taxes, distribution plan expenses and extraordinary items) exceed certain limits as shown below:
| | | | | | | | | | | | | | | | |
| | | | | | | | | Ariel Focus Fund | |
| | | Ariel Fund Investor Class | | | Ariel Appreciation Fund Investor Class | | | Investor Class | | | Institutional Class | |
First $30 million | | | 1.50% | | | | 1.50% | | | | — | | | | — | |
Over $30 million | | | 1.00% | | | | 1.00% | | | | — | | | | — | |
On average daily net assets* | | | — | | | | — | | | | 1.00% | | | | 0.75% | |
Expiration of waivers* | | | — | | | | — | | | | 2021 | | | | 2021 | |
| | | | | | | | | | | | | | | | |
| | | Ariel International Fund | | | Ariel Global Fund | |
| | | | |
| | | Investor Class | | | Institutional Class | | | Investor Class | | | Institutional Class | |
On average daily net assets* | | | 1.13% | | | | 0.88% | | | | 1.13% | | | | 0.88% | |
Expiration of waivers* | | | 2021 | | | | 2021 | | | | 2021 | | | | 2021 | |
| * | Through September 30 of the respective year. After this date, there is no assurance that such expenses will be limited. The Adviser has no right to recapture previously-waived fees. |
Distribution fees—Ariel Distributors, LLC is the Funds’ distributor and principal underwriter (“the Distributor”). The Trust has adopted a plan of distribution under Rule12b-1 of the 1940 Act for the Investor Class of the Funds. Under the plan, the Investor Class of each Fund pays12b-1 distribution fees calculated at an annual rate of 0.25% of average daily net assets on a weekly basis to the Distributor for its services. For the six months ended March 31, 2020 distribution fee expenses were as follows:
| | | | | | | | | | | | | | | | | | | | |
| | | | | |
| | | Ariel Fund | | | Ariel Appreciation
Fund | | | Ariel Focus Fund | | | Ariel International
Fund | | | Ariel Global Fund | |
Paid to Distributor | | $ | 1,587,590 | | | $ | 1,217,606 | | | $ | 52,773 | | | $ | 28,829 | | | $ | 15,159 | |
Paid to broker/dealers | | | 1,228,001 | | | | 912,500 | | | | 29,673 | | | | 23,913 | | | | 9,884 | |
The remaining amounts were used by the Distributor to offset the costs of marketing, advertising, and other distribution expenses.
Trustees’ fees—Trustees’ fees and expenses represent only those expenses of disinterested (independent) trustees of the Funds.
ARIELINVESTMENTS.COM 47
| | |
Notes to the financial statements | | 03/31/20 (UNAUDITED) |
NOTE SIX | FORWARD CURRENCY CONTRACTS
Net realized gain (loss) and the Change in net unrealized appreciation (depreciation) on forward currency contracts as reflected in the Statement of Operations as well as the volume of forward currency contracts measured by the number of trades during the year, and the average notional value of the forward currency contracts for the six months ended March 31, 2020 were:
| | | | | | | | |
| | |
| | | Ariel International Fund | | | Ariel Global Fund | |
Net realized gain (loss) on forward currency contracts | | | $(507,393) | | | | $(182,853) | |
Change in net unrealized appreciation (depreciation) on forward currency contracts | | | $(3,946,729) | | | | $(203,835) | |
Volume of forward currency contracts | | | 77 | | | | 49 | |
Average notional value of forward currency contracts | | | $7,551,153 | | | | $754,115 | |
A complete list of open forward currency contracts is found in the Schedules of Investments for the respective Fund.
NOTE SEVEN | TRANSACTIONS WITH AFFILIATED COMPANIES
If a Fund’s holding represents ownership of 5% or more of the voting securities of a company, the company is deemed to be an affiliate as defined in the 1940 Act. The following transactions were made during the six months ended March 31, 2020, with securities that are or were affiliated companies:
| | | | | | | | | | | | | | | | | | | | | | | | | | | | | | | | | | | | |
| | | Share activity | | | Six months ended March 31, 2020 | |
Security name | | Balance
September 30,
2019 | | | Purchases/Merger | | | Sales | | | Balance
March 31,
2020 | | | Value | | | Dividends
credited to
income | | | Amount of gain
(loss) realized on
sale of shares | | | Amount of
change in
unrealized gain
(loss) on shares | | | Percent
of net
assets | |
Ariel Fund | | | | | | | | | | | | | | | | | | | | | | | | | | | | | | | | | | | | |
Meredith Corp. (Consumer discretionary & services) | | | 1,010,281 | | | | 1,209,975 | | | | — | | | | 2,220,256 | | | | $27,131,528 | | | | $2,952,619 | | | | $— | | | | $(45,649,497) | | | | 2.0% | |
MSG Networks, Inc. (Consumer discretionary & services) | | | 3,692,684 | | | | 684,300 | | | | — | | | | 4,376,984 | | | | 44,645,237 | | | | — | | | | — | | | | (25,886,340) | | | | 3.3 | |
U.S. Silica Holdings, Inc. (Materials & processing) | | | 5,143,389 | | | | 334,495 | | | | — | | | | 5,477,884 | | | | 9,860,191 | | | | 1,179,162 | | | | — | | | | (41,902,154) | | | | 0.7 | |
| | | | | | | | | | | | | | | | | | | | | | | | | | | | | | | | | | | | |
| | | | | | | | | | | | | | | | | | | $81,636,956 | | | | $4,131,781 | | | | $— | | | | $(113,437,991) | | | | 6.0% | |
| | | | | | | | | | | | | | | | | | | | | | | | | | | | | | | | | | | | |
NOTE EIGHT | LINE OF CREDIT
The Funds have a $125,000,000 Line of Credit (the “Line”), which is uncommitted, with Northern Trust. The Line is for temporary or emergency purposes such as to provide liquidity for shareholder redemptions. The Funds incur interest expense to the extent of amounts drawn (borrowed) under the Line. Interest is based on the sum of 1.00% and the Federal Funds Effective Rate.
For the six months ended March 31, 2020, the details of the borrowings were as follows:
| | | | | | | | | | | | |
Fund | | Average daily borrowings | | | Number of days outstanding | | | Weighted average annualized interest rate | |
Ariel Fund | | | $1,169,457 | | | | 3 | | | | 2.11 | % |
Ariel Appreciation Fund | | | 368,455 | | | | 4 | | | | 2.40 | % |
NOTE NINE | SUBSEQUENT EVENTS
Recently, the outbreak of the novel coronavirus has adversely impacted global commercial activity and contributed to significant volatility in financial markets. The coronavirus pandemic and government responses are creating near-term disruption in global supply chains and adversely affecting many industries. The outbreak could have a continued material adverse impact on economic and market conditions and trigger a period of global economic slowdown. The rapid development and fluidity of this situation precludes any prediction as to the ultimate material adverse impact of the novel coronavirus. Nevertheless, the novel coronavirus presents material uncertainty and risk with respect to the Fund, its performance, and its financial results. We believe keeping a long-term perspective is the best way to reach long-term goals and achieve outperformance.
48 SLOW AND STEADY WINS THE RACE
| | |
Important supplemental information | | 03/31/20 (UNAUDITED) |
|
PROXY VOTING POLICIES, PROCEDURES, AND RECORD
Both a description of the policies and procedures that the Funds’ investment adviser uses to determine how to vote proxies relating to portfolio securities and information regarding how the Funds voted proxies relating to portfolio securities during the most recent12-month period ended June 30 are available upon request by calling800-292-7435. Such information for the Funds is also available on the Securities and Exchange Commission’s (“SEC”) web site at www.sec.gov.
SHAREHOLDER STATEMENTS AND REPORTS
The Funds attempt to reduce the volume of mail sent to shareholders by sending one copy of financial reports, prospectuses and other regulatory materials to two or more account holders who share the same address. We will send you a notice at least 60 days before sending only one copy of these documents if we have not received written consent from you previously. Should you wish to receive individual copies of materials, please contact us at800-292-7435. Once we have received your instructions, we will begin sending individual copies for each account within 30 days.
AVAILABILITY OF QUARTERLY PORTFOLIO SCHEDULES
The Funds file complete schedules of investments with the SEC for the quarters ended December 31 and June 30 of each fiscal year as an exhibit to its reports on FormN-PORT. Previously, the Funds filed complete schedules of investments with the SEC for the quarters ended December 31 and June 30 of each fiscal year on FormN-Q. The Fund’s FormsN-PORT andN-Q are available on the SEC’s website at www.sec.gov.
All of the Funds’ quarterly reports contain a complete schedule of portfolio holdings. All quarterly reports are made available to shareholders on the Funds’ web site at www.arielinvestments.com. Shareholders also may obtain copies of shareholder reports upon request by calling800-292-7435 or by writing to Ariel Investment Trust, c/o U.S. Bank Global Fund Services, P.O. Box 701, Milwaukee, Wisconsin, 53201-0701.
LIQUIDITY NARRATIVE FOR SHAREHOLDERS
Consistent with Rule22e-4 under the Investment Company Act of 1940, as amended, the Funds have established a liquidity risk management program to govern their approach to managing liquidity risk (“Program”). The Program is overseen by the Liquidity Risk Management Committee (“LRMC”), a committee comprised of representatives of the Funds’ investment adviser, Ariel Investments, LLC. The Funds’ Board of Trustees (“Board”) has approved the designation of the LRMC to oversee the Program.
The Program’s principal objectives include supporting each Fund’s compliance with limits on investments in illiquid assets and mitigating the risk that a Fund will be unable to meet its redemption obligations timely. The Program also includes a number of elements that support the management and assessment of liquidity risk, including an annual assessment of factors that influence a Fund’s liquidity and the periodic classification andre-classification of a Fund’s investments into groupings that reflect the LRMC’s assessment of their relative liquidity under current market conditions.
During the period covered by the report, there were no liquidity events that impacted the Funds or their respective ability to timely meet redemptions without dilution to existing shareholders. The LRMC has determined, and reported to the Board, that the Program has operated adequately and effectively to manage the Funds’ liquidity risk since implementation.
There can be no assurance that the Program will achieve its objectives in the future. Please refer to your Fund’s prospectus for more information regarding the Fund’s exposure to liquidity risk and other principal risks to which an investment in the Fund may be subject.
APPROVAL OF THE MANAGEMENT AGREEMENTS
Each year the Board of Trustees of the Trust (the “Board”), including a majority of the Trustees who are not “interested persons” of the Adviser or the Funds (“Independent Trustees”), is required by the 1940 Act to determine whether to continue each Fund’s management and advisory agreements with the Adviser (together the “Agreements”). At a meeting held in November 2019, the Board, including all of the Independent Trustees, upon recommendation of the Board’s Management Contracts Committee (the “Committee”), determined that the continuation of the Agreements was in the best interest of each Fund and its shareholders, and approved the continuation of each Agreement.
The Committee, which is comprised entirely of Independent Trustees and includes all Independent Trustees, led the Board in its consideration of the Agreements. In evaluating the Agreements with respect to each Fund, both the Committee and the Board held meetings in November 2019 to review and evaluate materials provided by the Adviser in response to questions submitted by the Independent Trustees and counsel that is independent of the Adviser (“Independent Counsel”). At its meetings, the Committee received presentations from members of management of the Adviser and from the portfolio manager(s) of each Fund. In addition, the Committee members received a memorandum from Independent Counsel describing the factors they should consider in performing their review, a supplemental report (the “Broadridge Report”) prepared by Broadridge, an independent provider of investment company data, and additional written material and presentations from the Adviser. During the meetings, the Committee was advised by, and met in executive session with, Independent Counsel. In connection with its deliberations, the Committee also considered a broad range of information
ARIELINVESTMENTS.COM 49
| | |
Important supplemental information | | 03/31/20 (UNAUDITED) |
|
relevant to the Board’s annual review of the Agreements that is provided to the Board and its various standing committees at meetings throughout the year, including investment performance reports and related portfolio information for each Fund, as well as periodic reports on, among other matters, pricing and valuation; brokerage and execution; compliance; and shareholder and other services provided by the Adviser, its affiliates, and the Funds’ other service providers.
Nature, Extent and Quality of Services.The Committee considered the Adviser’s specific responsibilities in theday-to-day management of the Funds, also taking into account information received at quarterly Board meetings related to the services rendered by the Adviser and the Independent Trustees’ knowledge of the Adviser’s operations. In addition, the Committee considered the Adviser’s historical approach in managing the Funds; the consistency of the Adviser’s investment approach; the background, education and experience of the Adviser’s investment personnel; the nature and quality of the Adviser’s services, including, among other things, compliance matters such as the Funds’ Liquidity Risk Management Program, trading practices, broker approval and selection, shareholder communications, Fund marketing and distribution strategies, information technology, and cybersecurity protections; and the Adviser’s commitment to diversity and civic affairs. The Committee also considered whether each Fund had operated within its investment objectives and each Fund’s record of compliance with its investment restrictions and other regulatory requirements. The Committee also considered information regarding the structure of the Adviser’s compensation program for portfolio managers and certain other employees, including with respect to the Adviser’s ability to attract and retain quality personnel. The Committee also considered the personal investments made by the Adviser’s personnel in the Funds, which aligns the interests of the Adviser and its personnel with those of the Funds’ shareholders.
Investment Performance. The Committee considered the investment performance of both the Investor and Institutional Classes of each Fund over time, including information provided in the Broadridge Report, comparing each Fund’s performance with that of comparable funds selected by Broadridge (the “Peer Group” or “Broadridge Peer Group”) as well as an analysis of Fund performance as compared to the performance of its benchmark over specific historical periods. For each period, the Broadridge report ranks each fund with the highest investment performance at the top, the fund with the lowest investment performance at the bottom and separates the Peer Group into five levels that each contain 20% of the universe (“quintiles”), with the top 20% being the first quintile and the bottom 20% being the fifth quintile. Where applicable, the Committee considered theone-,two-, three-, four-, five-, andten-year periods for the fiscal year ended September 30, 2019. The Committee noted that there was not yetten-year performance for the Institutional Class shares of all Funds or for the Investor Class shares of Ariel International Fund and Ariel Global Fund. In the case of those Funds that underperformed their Broadridge Peer Group in one or more periods, the Board discussed with the Adviser factors that caused such underperformance; considered the Adviser’s long-term investment process; and noted that the long-term track records supported the investment philosophy that, over time, consistent implementation of the investment approach should result in positive performance, but also would involve periods of underperformance.
Fees and Expenses.The Committee considered comparative fee and expense information for each Fund’s Expense Group, as selected and analyzed in the Broadridge Report, which ranks funds with the lowest fee at the top, the funds with the highest fee at the bottom and separates the Expense Group into five levels that each contain 20% of the universe (“quintiles”), with the top being the first quintile and the bottom being the fifth quintile. The Committee also considered the historical expenses with respect to economies of scale realized by the Adviser and whether such benefits were being passed on to shareholders, such as through the use of breakpoints in the Adviser’s management fees. The Committee considered the impact of the Rule12b-1 distribution services(“12b-1”) fees on the total expense ratio of the Investor Class of shares for all Funds and the resulting negative impact on the Funds’ Investor Class total expense ratio when compared to funds in their respective Broadridge Expense Groups that do not impose12b-1 fees. The Committee observed that the Peer Group comparisons for the Funds’ Institutional Class shares were more illustrative since the Institutional Class does not charge12b-1 fees. The Committee considered the fees charged and services provided by Ariel to other types of clients and the rationale for any differences between those fees. The Committee also considered the revenue sharing payments made by the Adviser.
The Committee considered the following with respect to the investment performance and fees and expenses of each Fund for the fiscal year ended September 31, 2019:
Ariel Fund. Ariel Fund’s Investor Class performance ranked in the fourth quintile for theone-year period, and the second quintile for the five-year andten-year periods, as compared to its Broadridge Peer Group. The Fund’s Institutional Class performance ranked in the fourth quintile for theone-year period and the second quintile for the five-year period as compared to its Broadridge Peer Group.
The actual management fees for Ariel Fund’s Investor Class ranked in the second quintile and the Fund’s Institutional Class ranked in the top quintile as compared to its Broadridge Expense Group. The total expenses for the Ariel Fund’s Investor Class ranked in the second quintile, and the Fund’s Institutional Class ranked in the top quintile as compared to its Broadridge Expense Group.
Ariel Appreciation Fund. Ariel Appreciation Fund’s Investor Class performance ranked in the fourth quintile for theone-year and five-year periods and the third quintile for theten-year period as compared to its Broadridge Peer Group. The Fund’s Institutional Class performance ranked in the fourth quintile for theone-year period and the third quintile for the five-year period as compared to its Broadridge Peer Group.
50 SLOW AND STEADY WINS THE RACE
| | |
Important supplemental information | | 03/31/20 (UNAUDITED) |
|
The actual management fees for Ariel Appreciation Fund’s Investor Class ranked in the top quintile and the Fund’s Institutional Class ranked in the second quintile as compared to its Broadridge Expense Group. The total expenses for the Ariel Appreciation Fund’s Investor Class ranked in the third quintile and the Fund’s Institutional Class ranked in the second quintile as compared to its Broadridge Expense Group.
Ariel Focus Fund. Ariel Focus Fund’s Investor Class performance ranked in the bottom quintile for theone-year, five-year, andten-year periods as compared to its Broadridge Peer Group. The Fund’s Institutional Class performance for theone-year and five-year periods ranked in the bottom quintile as compared to its Broadridge Peer Group.
The Fund had fee reimbursements and expense limitations in place which resulted in reduced fees and/or expenses. The actual management fees for Ariel Focus Fund (both classes) ranked in the third quintile as compared to its Broadridge Expense Group. The total expenses for the Ariel Focus Fund (both classes) ranked in the second quintile as compared to its Broadridge Expense Group.
Ariel International Fund. Ariel International Fund’s Investor Class performance ranked in the third quintile for theone-year and five-year periods as compared to its Broadridge Peer Group. The Fund’s Institutional Class performance ranked in the third quintile for theone-year and five-year periods as compared to its Broadridge Peer Group.
The Fund had fee reimbursements and expense limitations in place which resulted in reduced fees and/or expenses. The actual management fees for Ariel International Fund’s Investor Class ranked in the second quintile and the Fund’s Institutional Class ranked in the third quintile as compared to its Broadridge Expense Group. The total expenses for the Ariel International Fund’s Investor Class ranked in the fourth quintile and the Fund’s Institutional Class ranked in the third quintile as compared to its Broadridge Expense Group.
Ariel Global Fund. Ariel Global Fund’s Investor Class performance ranked in the bottom quintile for theone-year period and in the third quintile for the five-year period as compared to its Broadridge Peer Group. The Fund’s Institutional Class performance ranked in the bottom quintile for theone-year period and in the third quintile for the five-year period as compared to its Broadridge Peer Group.
The Fund had fee reimbursements and expense limitations in place, which resulted in reduced fees and/or expenses. The actual management fees for Ariel Global Fund’s Investor Class ranked in the second quintile and the Fund’s Institutional Class ranked in the fourth quintile as compared to its Broadridge Expense Group. The total expenses for the Ariel Global Fund (both classes) ranked in the third quintile as compared to its Broadridge Expense Group.
Profitability and Economies of Scale. The Committee considered the profitability to the Adviser from its relationship with each Fund, including the methodology by which that profitability analysis was calculated. The Committee also considered the fee reimbursements and expense limitations in place for Ariel Focus Fund, Ariel International Fund, and Ariel Global Fund. The Committee considered the extent to which economies of scale may be realized as Funds increase in size and that the management fee schedule for each Fund contains breakpoints at different levels. The Committee considered the effective advisory fee rates for the Funds and whether the advisory fee schedules provide an appropriate sharing between the Funds and the Adviser of such economies of scale as may exist under the Agreements. The Committee considered information about the Funds’ soft dollar arrangements that benefit the Adviser, as well as the Adviser’s brokerage and trading practices. The Committee also considered ancillary benefits, including whether the Funds benefited from Mr. Rogers’ and Ms. Hobson’s high media profiles.
Approval. After full consideration of the above factors, as well as other factors that were instructive in evaluating the Agreements, the Board, including all of the Independent Trustees, concluded that continuation of each Fund’s Agreement was in the best interests of each Fund and its respective shareholders, and the Board approved the continuation of each Agreement. In reaching this determination, the Board considered that the nature, extent and quality of the services provided by the Adviser to each Fund were appropriate and consistent with the Fund’s Agreement; the Adviser’s commitment to its stated investment strategy and identified circle of competency, and its calm, reasoned and long-term approach to investing; that the management fees paid by each Fund were reasonable in light of the services provided; that the breakpoints in the fee schedule for each Fund have the potential to allow shareholders to benefit from economies of scale; that the profitability associated with the Adviser’s relationship with the Trust was within a reasonable range and was neither excessive nor so low that the Adviser could not be expected to continue to service the Funds effectively; and that the benefits accruing to the Adviser by virtue of its relationship with the Funds were reasonable in light of the costs of providing the investment management services and the benefits accruing to each Fund. The Board’s determinations were based upon a comprehensive consideration of all information provided to it, including both quantitative measures and qualitative factors, and were not the result of any single factor.
ARIELINVESTMENTS.COM 51
| | |
Fund expense example | | 03/31/20 (UNAUDITED) |
|
EXAMPLE
As a shareholder of the Funds, you incur ongoing costs, including management fees, distribution and service(12b-1) fees and other Fund expenses. The Funds currently do not charge any transaction costs, such as sales charges (loads) on subscriptions, reinvested dividends or other distributions, redemption fees or exchange fees. The following example is intended to help you understand your ongoing costs (in dollars) of investing in each of the Funds and to compare these costs with the ongoing costs of investing in other mutual funds. Please note that IRA, 403(b) and Coverdell ESA account holders are charged an annual $15 recordkeeping fee or aone-time, lifetime $60 fee. If these fees were included in either the Actual Expense or Hypothetical Example below, your costs would be higher.
The example is based on an investment of $1,000 invested at the beginning of the period and held for the entire period of October 1, 2019 - March 31, 2020.
ACTUAL EXPENSES
The first line of the table below for each Fund provides information about actual account values and actual expenses for that particular Fund. You may use the information in each of these lines, together with the amount you invested, to estimate the expenses that you paid over the period in each Fund. Simply divide your account value by $1,000 (for example, an $8,600 account value divided by $1,000=8.6), then multiply the result by the number in the first line under the heading, entitled “Expenses Paid During Period”, to estimate the expenses you paid on your account during this period in each Fund.
HYPOTHETICAL EXAMPLE FOR COMPARISON PURPOSES
The right portion of the table below for each Fund provides information about hypothetical account values and hypothetical expenses based on each Fund’s actual expense ratio and an assumed rate of return of 5% per year before expenses, which is not the actual return. The hypothetical account values and expenses may not be used to estimate the actual ending account balance or expenses you paid for the period. You may use this information to compare the ongoing costs of investing in each of the Funds to other funds. To do so, compare this 5% hypothetical example with the 5% hypothetical examples that appear in the shareholder reports of other funds.
Please note that the expenses shown in the table are meant to highlight only your ongoing costs in each of the Funds. Therefore, the right portion of the table for each Fund is useful in comparing ongoing costs only, and will not help you determine the relative total costs of owning different funds.
| | | | | | | | | | | | | | | | | | | | | | | | |
| | | | | | Actual* | | | Hypothetical (5% return before expenses) | | | | |
| Fund and return | | Beginning
account value
10/01/19 | | | Ending
account value 03/31/20 | | | Expenses
paid during
period* | | | Ending
account value
03/31/20 | | | Expenses
paid during
period* | | | Annualized
expense
ratio* | |
| | | | | | |
Ariel Fund | | | | | | | | | | | | | | | | | | | | | | | | |
Investor Class | | | $1,000.00 | | | | $705.50 | | | | $4.39 | | | | $1,019.85 | | | | $5.20 | | | | 1.03% | |
Institutional Class | | | 1,000.00 | | | | 706.60 | | | | 3.03 | | | | 1,021.45 | | | | 3.59 | | | | 0.71% | |
| | | | | | |
Ariel Appreciation Fund | | | | | | | | | | | | | | | | | | | | | | | | |
Investor Class | | | $1,000.00 | | | | $742.40 | | | | $5.01 | | | | $1,019.25 | | | | $5.81 | | | | 1.15% | |
Institutional Class | | | 1,000.00 | | | | 743.70 | | | | 3.62 | | | | 1,020.85 | | | | 4.19 | | | | 0.83% | |
| | | | | | |
Ariel Focus Fund | | | | | | | | | | | | | | | | | | | | | | | | |
Investor Class | | | $1,000.00 | | | | $725.90 | | | | $4.31 | | | | $1,020.00 | | | | $5.05 | | | | 1.00% | |
Institutional Class | | | 1,000.00 | | | | 726.20 | | | | 3.24 | | | | 1,021.25 | | | | 3.79 | | | | 0.75% | |
| | | | | | |
Ariel International Fund | | | | | | | | | | | | | | | | | | | | | | | | |
Investor Class | | | $1,000.00 | | | | $906.20 | | | | $5.39 | | | | $1,019.35 | | | | $5.70 | | | | 1.13% | |
Institutional Class | | | 1,000.00 | | | | 906.40 | | | | 4.19 | | | | 1,020.60 | | | | 4.45 | | | | 0.88% | |
| | | | | | |
Ariel Global Fund | | | | | | | | | | | | | | | | | | | | | | | | |
Investor Class | | | $1,000.00 | | | | $921.50 | | | | $5.43 | | | | $1,019.35 | | | | $5.70 | | | | 1.13% | |
Institutional Class | | | 1,000.00 | | | | 922.50 | | | | 4.23 | | | | 1,020.60 | | | | 4.45 | | | | 0.88% | |
* Expenses are calculated using each Portfolio’s annualized expense ratio (as disclosed in the table), multiplied by the average account value for the period, multiplied by the number of days in the most recent half fiscal year (183), and divided by the number of days in the current year (366).
52 SLOW AND STEADY WINS THE RACE
| | | | | | | | |
| Name and age | | Position(s) held with Fund | | Term of office and length of time served | | Principal occupation(s)
during past 5 years | | Other directorships |
INDEPENDENT TRUSTEES: | | | | | | |
William C. Dietrich Age: 70 | | Lead Independent Trustee, Chair of Executive Committee, Member of Management Contracts and Audit Committees | | Indefinite, until successor elected Trustee since 1986; Member of Management Contracts Committee and Audit Committee since 1986; Lead Independent Trustee and Executive Committee Chair since 2014 | | Retired Executive Director, Shalem Institute for Spiritual Formation, Inc., 2006 to 2009 | | |
Eric H. Holder, Jr. Age: 69 | | Trustee, Member of Management Contracts Committee | | Indefinite, until successor elected Trustee since 2019; Member of Management Contracts Committee since 2019 | | Partner, Covington & Burling since 2015; U.S. Attorney General, 2009 to 2015 | | |
Christopher G. Kennedy Age: 56 | | Trustee, Chair of Audit Committee, Member of Management Contracts, Governance and Executive Committees | | Indefinite, until successor elected Trustee since 1995; Member of Management Contracts Committee since 1995; Audit Committee Chair since 2014 (member since 1995); Member of Executive Committee since 2015 | | Chair, Joseph P. Kennedy Enterprises, Inc. since 2012; Founder and Chair, Top Box Foods since 2012 | | Interface Inc.; Knoll, Inc. |
Kim Y. Lew Age: 53 | | Trustee, Member of Management Contracts and Audit Committees | | Indefinite, until successor elected Trustee since 2014; Member of Management Contracts Committee and Audit Committee since 2014 | | Vice President and Chief Investment Officer, Carnegie Corporation of New York since 2016; Vice President andCo-Chief Investment Officer, Carnegie Corporation of New York, 2011 to 2016 | | |
William M. Lewis, Jr. Age: 63 | | Trustee, Chair of Governance Committee, Member of Management Contracts Committee | | Indefinite, until successor elected Trustee since 2007; Member of Management Contracts Committee since 2007; Governance Committee Chair since 2019 (member since 2018) | | Managing Director andCo-Chair of Investment Banking, Lazard Ltd. since 2004 | | |
Stephen C. Mills Age: 60 | | Trustee, Member of Management Contracts and Audit Committees | | Indefinite, until successor elected Trustee since 2015; Management Contracts Committee since 2015; Audit Committee since 2019 | | President, New York Knicks, 2017 to 2020; NBA Alternate Governor, New York Knicks since 2013, General Manager, 7; General Manager & New York Knicks, 2013 to 2017 | | Madison Square Garden Sports Corp. |
James M. Williams Age: 72 | | Trustee, Chair of Management Contracts Committee, Member of Governance Committee | | Indefinite, until successor elected Trustee since 2006; Management Contracts Committee Chair since 2007; Member of Governance Committee since 2013 | | Vice President and Chief Investment Officer, J. Paul Getty Trust since 2002 | | SEI Mutual Funds (Mr. Williams oversees a total of 98 SEI Mutual Fund portfolios) |
INTERESTED TRUSTEES: | | | | | | |
Mellody L. Hobson Age: 50 | | Chair of the Board of Trustees and President, Member of Executive Committee | | Indefinite, until successor elected Trustee since 1993; President since 2002; Chair since 2006 | | Co-CEO since 2019 and President since 2000, Ariel Investments, LLC | | Starbucks Corporation; JPMorgan Chase & Co. |
John W. Rogers, Jr. Age: 62 | | Trustee | | Indefinite, until successor elected Trustee since 2000 and from 1986 to 1993 | | Founder, Chair, Chief Investment Officer since 1983, andCo-CEO since 2019 (formerly CEO, 1983-2019) Ariel Investments, LLC; Lead Portfolio Manager, Ariel Fund since 1986 andCo-Portfolio Manager, Ariel Appreciation Fund since 2002 | | McDonald’s Corporation; Nike, Inc.; The New York Times Company |
Note: Number of portfolios in complex overseen by all Trustees is five. Address for all Trustees is 200 East Randolph Street, Suite 2900, Chicago, IL 60601-6505.
ARIELINVESTMENTS.COM 53
| | | | | | | | |
| Name and age | | Position(s) held with Fund | | Term of office and length of time served | | Principal occupation(s)
during past 5 years | | Other directorships |
Mareilé B. Cusack Age: 61 | | Vice President, Anti-Money Laundering Officer and Secretary | | Indefinite, until successor elected Vice President since 2008; Anti-Money Laundering Officer since 2010; Secretary since 2014; Assistant Secretary, 2008 to 2014 | | Chief Privacy Officer, Ariel Investments, LLC since 2019; Senior Vice President, Ariel Investments, LLC since 2012; Anti-Money Laundering Officer, Ariel Investments, LLC since 2010; General Counsel, Ariel Investments, LLC since 2008 | | |
Wendy D. Fox Age: 57 | | Chief Compliance Officer and Vice President | | Indefinite, until successor elected Chief Compliance Officer and Vice President since 2014 | | Senior Vice President, Ariel Investments, LLC, since 2017; Chief Compliance Officer, Ariel Investments, LLC since 2004; Vice President, Ariel Investments, LLC, 2004 to 2017 | | |
James R. Rooney Age: 61 | | Chief Financial Officer, Vice President and Treasurer | | Indefinite, until successor elected Chief Financial Officer, Vice President and Treasurer since 2015 | | Senior Vice President, Fund Administration, Ariel Investments, LLC since December 2017; Vice President, Fund Administration, Ariel Investments, LLC, 2015 to 2017; Vice President, Shareholder Reporting, Fidelity Pricing & Cash Management Services, Fidelity Management, 2007 to 2015 | | |
The Statement of Additional Information (SAI) for Ariel Investment Trust includes additional information about the Funds’ Trustees and Officers. The SAI is available without charge by calling 800.292.7435 or logging on to our website, arielinvestments.com. Note: Number of portfolios in complex overseen by all Officers is five. Address for all offïcers is 200 East Randolph Street, Suite 2900, Chicago, IL 60601-6505.
54 SLOW AND STEADY WINS THE RACE
IMPORTANT DISCLOSURES
Risks of investing in the Funds
Equity investments are affected by market conditions. The intrinsic value of the stocks in which the Funds invest may never be recognized by the broader market. Ariel Fund, Ariel Appreciation Fund and Ariel Focus Fund invest in small and/ormid-cap companies, which is riskier and more volatile than investing in large cap stocks. Ariel Fund and Ariel Appreciation Fund are often concentrated in fewer sectors than their benchmarks, and their performance may suffer if these sectors underperform the overall stock market. Ariel Focus Fund is anon-diversified fund and therefore may be more volatile than a more diversified investment. Ariel International Fund and Ariel Global Fund invest in foreign securities and may use currency derivatives and ETFs. Investments in foreign securities may underperform and may be more volatile than comparable U.S. stocks because of the risks involving foreign economies and markets, foreign political systems, foreign regulatory standards, foreign currencies and taxes. The International and Global Funds’ use of currency derivatives and ETFs may increase investment losses and expenses and create more volatility. The International and Global Funds’ investments in emerging markets present additional risks, such as difficulties selling on a timely basis and at an acceptable price.
Specific stocks held by the Funds
In this report, we candidly discuss specific stocks held by the Funds. Our opinions are current as of the date they were written but are subject to change. We want to remind investors that the information in this report is not sufficient on which to base an investment decision and should not be considered a recommendation to purchase or sell any particular security.
Please read the Funds’ prospectuses
Investors should consider carefully the investment objectives, risks, and charges and expenses before investing. For a current summary prospectus or full prospectus which contains this and other information about the Funds offered by Ariel Investment Trust, call us at 800.292.7435 or visit our website, arielinvestments.com. Please read the summary prospectus or full prospectus carefully before investing. Distributed by Ariel Distributors, LLC, a wholly owned subsidiary of Ariel Investments, LLC. Ariel Distributors, LLC is a member of the Securities Investor Protection Corporation.
ARIELINVESTMENTS.COM 55
INFORMATION ABOUT THE FUNDS’ INDEXES AND THE GICS SECTOR CLASSIFICATION STANDARDS
The Russell 2500™ Value Index measures the performance of the small tomid-cap value segment of the U.S. equity universe. It includes those Russell 2500 companies with lowerprice-to-book ratios and lower forecasted growth values. This index pertains to Ariel Fund.
The Russell 2500™ Index measures the performance of the small tomid-cap segment of the U.S. equity universe, commonly referred to as “smid” cap. The Russell 2500 Index is a subset of the Russell 3000® Index. It includes approximately 2,500 of the smallest securities based on a combination of their market cap and current index membership. This index pertains to Ariel Fund. The Russell Midcap® Index measures the performance of themid-cap segment of the U.S. equity universe. The Russell Midcap Index is a subset of the Russell 1000® Index. It includes approximately 800 of the smallest securities based on a combination of their market cap and current index membership. This index pertains to Ariel Appreciation Fund.
The Russell Midcap® Value Index measures the performance of themid-cap value segment of the U.S. equity universe. It includes those Russell Midcap Index companies with lowerprice-to-book ratios and lower forecasted growth values. This index pertains to Ariel Appreciation Fund.
The Russell 1000® Value Index measures the performance of thelarge-cap value segment of the U.S. equity universe. It includes those Russell 1000 companies with lowerprice-to-book ratios and lower expected growth values. This index pertains to Ariel Focus Fund.
The S&P 500® Index is the most widely accepted barometer of large cap U.S. equities. It includes 500 leading companies. This index pertains to Ariel Fund, Ariel Appreciation Fund and Ariel Focus Fund.
MSCI EAFE Index is an unmanaged, market-weighted index of companies in developed markets, excluding the U.S. and Canada. The MSCI EAFE Index net returns reflect the reinvestment of income and other earnings, including the dividends net of the maximum withholding tax applicable tonon-resident institutional investors that do not benefit from double taxation treaties. MSCI uses the maximum tax rate applicable to institutional investors, as determined by the companies’ country of incorporation. This index pertains to Ariel International Fund.
The MSCI ACWI (All Country World Index)ex-US Index is an unmanaged, market-weighted index of global developed and emerging markets, excluding the United States. The MSCI ACWIex-US Index net returns reflect the reinvestment of income and other earnings, including the dividends net of the maximum withholding tax applicable tonon-resident institutional investors that do not benefit from double taxation treaties. MSCI uses the maximum tax rate applicable to institutional investors, as determined by the companies’ country of incorporation. This index pertains to Ariel International Fund.
MSCI ACWI (All Country World Index) Index is an unmanaged, market weighted index of global developed and emerging markets. The MSCI ACWI Index net returns reflect the reinvestment of income and other earnings, including the dividends net of the maximum withholding tax applicable tonon-resident institutional investors that do not benefit from double taxation treaties. MSCI uses the maximum tax rate applicable to institutional investors, as determined by the companies’ country of incorporation. This index pertains to Ariel Global Fund.
Indexes are unmanaged. An investor cannot invest directly in an index.
Frank Russell Company (“Russell”) is the source and owner of the trademarks, service marks and copyrights related to the Russell Indexes. Russell® is a trademark of Frank Russell Company. Neither Russell nor its licensors accept any liability for any errors or omissions in the Russell Indexes or underlying data and no party may rely on any Russell Indexes and/or underlying data contained in this communication. No further distribution of Russell data is permitted without Russell’s express written consent. Russell does not promote, sponsor or endorse the content of this communication.
MSCI makes no express or implied warranties or representations and shall have no liability whatsoever with respect to any MSCI data contained herein. The MSCI data may not be further redistributed or used to create indices or financial products. This report is not approved or produced by MSCI. Source: MSCI.
GICS was developed by and is the exclusive property and a service mark of MSCI Inc. (“MSCI”) and Standard & Poor’s, a division of The McGraw-Hill Companies, Inc. (“S&P”) and is licensed for use by Ariel Investments, LLC. Neither MSCI, S&P nor any third party involved in making or compiling the GICS or any GICS classifications makes any express or implied warranties or representations with respect to such standard or classification (or the results to be obtained by the use thereof), and all such parties hereby expressly disclaim all warranties of originality, accuracy, completeness, merchantability and fitness for a particular purpose with respect to any of such standard or classification. Without limiting any of the foregoing, in no event shall MSCI, S&P, any of their affiliates or any third party involved in making or compiling the GICS or any GICS classifications have any liability for any direct, indirect, special, punitive, consequential or any other damages (including lost profits) even if notified of the possibility of such damages.
56 SLOW AND STEADY WINS THE RACE
Ariel Investment Trust
c/o U.S. Bank Global Fund Services
P.O. Box 701
Milwaukee, WI 53201-0701
800.292.7435
• arielinvestments.com
• linkedin.com/company/ariel-investments
• instagram.com/arielinvestments
• twitter.com/arielinvests
What’s inside
| • | | Crisis Playbook Putting our plan into action from battle-tested and battle readyCo-CEOs, John W. Rogers, Jr. and Mellody Hobson. |
| • | | In Focus Learn how Vice Chairman, Charlie Bobrinskoy is positioning Ariel Focus Fund to take advantage of an economic recovery. |
| • | | Global Markets Rupal Bhansali, Chief Investment Officer, International & Global Equities, discusses how Opportunity Meets Preparation during the worldwide pandemic. |
| • | | Company Spotlights Read about Kennametal, Inc., Envista Holdings Corp., and Progressive Corp. to understand Ariel’s investment theses and long-term value propositions. |
| | | | |
 | | Slow and steady wins the race. | | The materials used to produce this report were sourced responsibly. The paper used along with the packaging are all recyclable. TPI (74,061) ©05/20 AI–01 |
(b) Not applicable.
Item 2. Code of Ethics.
Not applicable for the reporting period.
Item 3. Audit Committee Financial Expert.
Not applicable for the reporting period.
Item 4. Principal Accountant Fees and Services.
Not applicable for the reporting period.
Item 5. Audit Committee of Listed Registrants.
Not applicable.
Item 6. Investments.
(a) Included as part of the report to shareholders filed under Item 1(a) of this Form.
(b) Not applicable.
Item 7. Disclosure of Proxy Voting Policies and Procedures forClosed-End Management Investment Companies.
Not applicable.
Item 8. Portfolio Managers ofClosed-End Management Investment Companies.
Not applicable.
Item 9. Purchases of Equity Securities byClosed-End Management Investment Company and Affiliated Purchasers.
Not applicable.
Item 10. Submission of Matters to a Vote of Security Holders.
There have been no changes to the procedures by which shareholders may recommend nominees to the registrant’s Board of Trustees.
Item 11. Controls and Procedures.
(a) The registrant’s certifying officers have reasonably designed such disclosure controls and procedures to ensure material information relating to the registrant is made known to them by others, particularly during the period in which this report is being prepared. The registrant’s certifying officers have determined that the registrant’s disclosure controls and procedures are effective based on their evaluation of these controls and procedures as of a date within 90 days prior to the filing date of this report.
(b) There were no significant changes in the registrant’s internal controls over financial reporting, or in other factors that could significantly affect these controls, that occurred during the period covered by this report, including any corrective actions with regard to significant deficiencies and material weaknesses.
Item 12. Disclosure of Securities Lending Activities forClosed-End Management Investment Companies.
Not applicable.
Item 13. Exhibits.
(a)(1) Code of Ethics – Not applicable for the reporting period.
(a)(2) Certification for each principal executive and principal financial officer of the registrant as required by Rule30a-2 under the Act (17 CFR270.30a-2(a)) – Filed as an attachment to this filing.
(a)(3) Written solicitation to purchase securities under Rule23c-1 – Not applicable.
(a) (4) There has been no change to the registrant’s independent public accountant.
(b) Certifications required by Rule30a-2(b) under the Act (17 CFR270.30a-2(b)), Rule13a-14(b) or Rule15d-14(b) under the Exchange Act (17 CFR240.13a-14(b) or240.15d-14(b)), and Section 1350 of Chapter 63 of Title 18 of the United States Code (18 U.S.C. 1350). A certification furnished pursuant to this paragraph will not be deemed “filed” for purposes of Section 18 of the Securities Exchange Act of 1934, as amended, or otherwise subject to the liability of that section. Such certification will not be deemed to be incorporated by reference into any filing under the Securities Act of 1933 or the Exchange Act, except to the extent that the registrant specifically incorporates it by reference – Filed as an attachment to this filing.
SIGNATURES
Pursuant to the requirements of the Securities Exchange Act of 1934 and the Investment Company Act of 1940, the registrant has duly caused this report to be signed on its behalf by the undersigned, thereunto duly authorized.
Ariel Investment Trust
| | |
| By: | | /s/ Mellody L. Hobson |
| | Mellody L. Hobson |
| | President |
| | (Principal Executive Officer) |
|
| Date: May 14, 2020 |
Pursuant to the requirements of the Securities Exchange Act of 1934 and the Investment Company Act of 1940, this report has been signed below by the following persons on behalf of the registrant and in the capacities and on the dates indicated.
| | |
| By: | | /s/ Mellody L. Hobson |
| | Mellody L. Hobson |
| | President |
| | (Principal Executive Officer) |
|
| Date: May 14, 2020 |
| |
| By: | | /s/ James R. Rooney |
| | James R. Rooney |
| | Vice President, Chief Financial Officer and Treasurer |
| | (Principal Financial Officer) |
|
| Date: May 14, 2020 |