As filed with the Securities and Exchange Commission on May 24, 2022
UNITED STATES
SECURITIES AND EXCHANGE COMMISSION
Washington, D.C. 20549
FORM N-CSR
CERTIFIED SHAREHOLDER REPORT OF REGISTERED
MANAGEMENT INVESTMENT COMPANIES
Investment Company Act File Number 811-4786
Ariel Investment Trust
(Exact name of registrant as specified in charter)
200 East Randolph Street
Suite 2900
Chicago, Illinois, 60601
(Address of principal executive offices) (Zip code)
Mareilé B. Cusack, Esq.
200 East Randolph Street
Suite 2900
Chicago, Illinois 60601
(Name and address of agent for service)
with a copy to:
Arthur Don, Esq.
Greenberg Traurig, LLP
77 West Wacker Drive
Suite 3100
Chicago, IL 60601
Registrant’s telephone number, including area code: (312) 726-0140
Date of fiscal year end: September 30
Date of reporting period: March 31, 2022
Item 1. Reports to Stockholders.
(a) The following is a copy of the report transmitted to shareholders pursuant to Rule 30e-1 under the Investment Company Act of 1940 (the “Act”) (17 CFR 270.30e-1):

The patient investor
SEMI-ANNUAL REPORT: 03/31/22
Ariel Fund
Ariel Appreciation Fund
Ariel Focus Fund
Ariel International Fund
Ariel Global Fund

Slow and steady wins the race.
Ariel Investment Trust
c/o U.S. Bank Global Fund Services
P.O. Box 701
Milwaukee, WI 53201-0701
800.292.7435
• arielinvestments.com
• linkedin.com/company/ariel-investments
• instagram.com/arielinvestments
• twitter.com/arielinvests
Table of contents

| | |
 | |  |
| |
| John W. Rogers, Jr. | | Mellody Hobson |
| Chairman and | | Co-CEO and |
| Co-CEO | | President |
Average annual total returns as of 03/31/22
| | | | | | | | | | | | |
| | | 1Q22 | | 1-year | | 3-year | | 5-year | | 10-year | | Since
inception* |
| | | | | | |
Ariel Fund | | -5.11% | | 3.51% | | 13.00% | | 9.76% | | 12.23% | | 11.25% |
| | | | | | |
Russell 2500TM Value Index | | -1.50 | | 7.73 | | 12.97 | | 9.19 | | 11.04 | | 11.08 |
| | | | | | |
Russell 2500TM Index | | -5.82 | | 0.34 | | 13.79 | | 11.57 | | 12.09 | | 10.91 |
| | | | | | |
S&P 500® Index | | -4.60 | | 15.65 | | 18.92 | | 15.99 | | 14.64 | | 11.02 |
* The inception date for Ariel Fund is 11/06/86.
Average annual total returns as of 03/31/22
| | | | | | | | | | | | |
| | | 1Q22 | | 1-year | | 3-year | | 5-year | | 10-year | | Since
inception* |
| | | | | | |
| Ariel Appreciation Fund | | -4.57% | | 3.86% | | 11.60% | | 8.18% | | 10.56% | | 10.50% |
| | | | | | |
| Russell Midcap® Value Index | | -1.82 | | 11.45 | | 13.68 | | 10.00 | | 12.02 | | 11.39 |
| | | | | | |
| Russell Midcap® Index | | -5.68 | | 6.92 | | 14.89 | | 12.62 | | 12.86 | | 11.51 |
| | | | | | |
| S&P 500® Index | | -4.60 | | 15.65 | | 18.92 | | 15.99 | | 14.64 | | 10.52 |
* The inception date for Ariel Appreciation Fund is 12/01/89.
Performance data quoted represents past performance. Past performance does not guarantee future results. All performance assumes the reinvestment of dividends and capital gains and represents returns of the Investor Class shares. The investment return and principal value of an investment will fluctuate so that an investor’s shares, when redeemed, may be worth more or less than their original cost. Current performance may be lower or higher than the performance data quoted. Any extraordinary performance shown for short-term periods may not be sustainable and is not representative of the performance over longer periods. Performance data current to the most recent month-end for Ariel Fund and Ariel Appreciation Fund may be obtained by visiting our website, arielinvestments.com.
ARIELINVESTMENTS.COM 3
DEAR FELLOW SHAREHOLDER:
After posting barnburner gains last year, the stock market has retreated in 2022—with negative index returns masking intensifying volatility. For the quarter, strength amongst our consumer names was not enough to overcome poorer performing economically and interest rate sensitive areas. Although Ariel Fund and Ariel Appreciation Fund trailed their primary value indices during the three-month period, both Funds managed to outpace their core benchmarks. Ariel Fund fell short of the S&P 500 during the quarter—as the lagging Financial and Industrial sectors took a bigger bite out of returns. Meanwhile, Ariel Appreciation Fund outperformed the broad market.
This year’s trading feels somewhat reminiscent of 2008, when the intra-day swings stunned and often defied logic. There are days when a plummeting market completely reverses itself before the close. Other times, an uneventful day goes bad at the bell. Since we are disciplined, patient investors (not day traders), we do not sit glued to a screen tracking minute-by-minute stock prices. And yet, we cannot help but acknowledge that these days, a few minutes at the “water cooler” can mean the difference between portfolio-wide gains or losses.
Against this jumpy backdrop, we seek to use the volatility to our advantage. Yes, there is no denying that the world is unstable as the pandemic lingers, inflation swells, war in Ukraine rages and China’s lockdown expands. The supply chain bottleneck that was expected to resolve itself remains entangled. US consumers are buying, but their confidence is falling. Many expect their willingness to absorb escalating prices to wane as well. With these challenging and well-telegraphed conditions increasingly priced in, our job is to focus on mining value from the uncertainty by looking past the near-term drama and instead, taking a long-term view.
FOR THE RECORD
As 2022 takes shape, we are clear-eyed and unemotional. Our views on some of the big issues of the day—including inflation and the future of growth stocks, as well as some of our highest conviction names, are playing out as we anticipated.
“With these challenging and well-telegraphed conditions increasingly priced in, our job is to focus on mining value from the uncertainty by looking past the near-term drama and instead, taking a long-term view.”
On inflation—Given the amount of stimulus that poured into global economies, inflation was to be expected. The looming questions were: “how much” and “how long?” As The New York Times noted, “While central bankers were hesitant to react to rapid inflation last year, hoping it would prove ‘transitory’ and fade quickly, those expectations have been dashed.”1 In our third quarter 2021 letter we wrote, “…some see growing inflation as ‘transitory,’ we do not completely agree. While we expect supply chain disruptions and shortages will soon pass, once large numbers of people receive wages to induce them to return to work, there is no cutting pay. We expect wage inflation to stick.”2
Now a “hawkish” Fed has declared its intentions to attempt to slow escalating inflation with a heavier hand. By rapidly raising interest rates and suspending its bond buying program, “Fed officials are making money more expensive to borrow and spend in a bid to slow shopping and business
| 1 | Smialek, Jeanna. “’Many’ at the Fed Supported Big Increase in Rates.” The New York Times. April 28, 2022. Pg. B1. |
| 2 | Ariel Fund and Ariel Appreciation Fund Portfolio Manager Letter. September 30, 2021. |
4 SLOW AND STEADY WINS THE RACE
investment, hoping that weaker demand will help tame prices, which are now climbing at the fastest pace in four decades.”3
While there is much market handwringing over the Fed’s intensifying policy efforts, we too remain skeptical that inflation can be so easily tamed. As we wrote in our December 31, 2021 letter, “…we are observant students of history and do not believe rising inflation is easily subdued with quick fixes. Nor do we think the Fed has practiced many ‘perfect landings’ when it comes to managing money supply. If the Fed sets rates too low, inflation can continue to run away. If rates are too high, it could trigger a recession. Like Goldilocks, ‘just right’ can be a temperamental temperature.” To this point, one economist recently quipped, “It’s like trying to land during an earthquake.”4 This difficulty has led a growing number of market watchers to begin considering recession scenarios.
While we are not ones to speculate on economic outcomes, we do recognize today’s US executives have little-to-no experience with 40-year inflation. And managing inflation is not a one quarter company fix. Much of the price escalations are completely out of a CEO’s control (i.e. chip shortages, COVID-induced labor shortages, product availability). Inflation can cause margin slippage as prices react slower than changing costs. Although we seek to dampen negative inflationary effects by investing in companies whose strong brands and franchises command pricing power, simply matching price to cost increases is exceedingly difficult in the short run. This is true of even the best run franchises with superior pricing power in the long run. Share price reactions have been brutal despite the widespread awareness of the challenge at hand. This unique environment requires sturdy patience.
On growth stocks—In that same year-end letter, we reminded our investors that, “…there are consequences to
Fed actions.”5 We doubled down on our view that, “When it comes to stocks—particularly growth stocks selling at high multiples—inflation acts as gravity. As interest rates are likely hiked to dampen inflation, a dollar earned today becomes more valuable than a dollar earned in the future. This is the exact opposite of the most recent low interest rate, growth stock heyday where the value of a dollar is not different than one earned in the future.”6 Our expectations of growth’s comeuppance and value’s resurrection are playing out in real-time. Look no further than the tech-laden Nasdaq—which is having its worst start to any year in its 51-year history.
We hold no ill will against growth stocks. In fact, our view has been that “some of today’s growth stocks are great businesses—but they are priced for near-perfection and an assumption that the current environment will last forever.”7 As the great Artist Formerly Known as Prince once sang, “Forever is a mighty long time.” All of a sudden, the road is becoming littered with wreckage. When the stock formerly known as Facebook and now called Meta Platforms, Inc. (FB) plummeted -26% in a single day in February, its market capitalization fell $251 billion in what has been called the “biggest wipeout in history.”8 Other high-flyers like PayPal Holdings Inc. (PYPL) nosedived -25% after announcing disappointing earnings—losing $50 billion in market value in hours. Then debt-laden Netflix Inc. (NFLX) fell -35% in one session and is now pondering the advertising-based business model it once shunned. Inevitably, stocks trade on fundamentals. The math is the math.
On orphaned value stocks—While losing money is never pleasant and we try to avoid it as best we can, we also know our weakest holdings and/or sectors are often the source of future gains. Last year, as large cap growth stocks continued to trounce value shares, we underscored our core belief that, “pessimism yields value and optimism
| 3 | Smialek, Jeanna. “’Many’ at the Fed Supported Big Increase in Rates.” The New York Times. April 7, 2022. Pg. B1. |
| 4 | Casselman, Ben. “Economy is Booming, but Some Worry a Bust is Coming.” The New York Times. April 7, 2022. Pg. B7. |
| 5 | Ariel Fund and Ariel Appreciation Fund Portfolio Manager Letter. December 31, 2021. |
| 6 | Ariel Fund and Ariel Appreciation Fund Portfolio Manager Letter. September 30, 2021. |
| 7 | Ariel Fund and Ariel Appreciation Fund Portfolio Manager Letter. December 31, 2021. |
| 8 | Adinarayan, Thyagaraju and Barnert, Jan-Patrick. “Meta Erases $251 Billion in Value, Biggest Wipeout in History.” Bloomberg Radio. February 3, 2022. |
ARIELINVESTMENTS.COM 5
is pricey.”9 Throughout the long run of recent growth stock domination, we have consistently spotlighted misunderstood values that we felt held great promise. Much like the recent pandemic shock, our sharpened focus on balance sheet strength following the 2008 financial crisis has largely taken financial stability and leverage concerns off the table—allowing us to focus on fundamental company developments without the added stress and volatility of weak balance sheets.
In September, we highlighted Nielsen Holdings plc (NLSN) after the stock shed -22% during the quarter. We laid out our investment thesis for the business and explained why “unrealized upside embedded in our portfolios was boosted as the stock was oversold.”10 While acknowledging the company’s checkered past, we stayed focused on the uniqueness of its franchise as the “only independent provider of unbiased comprehensive [television] viewership data.”11 We also expressed our enthusiasm for the new management team’s plan to “create the only true cross platform media measurement solution.”12 Jumping to the present, the stock was a top performer during the quarter as its shares climbed +40% on news of its takeover by a private equity consortium in an all-cash transaction valued at approximately $16 billion including debt—effectively demonstrating that value can be realized in public as well as private markets. As we write, another portfolio favorite, Mattel, Inc. (MAT), is making headlines as a potential private equity target. Last quarter, broadcast, digital media and marketing services company, TEGNA, Inc. (TGNA), was purchased by a strategic buyer. In all instances, we are pleased and not surprised.
On memes—Despite the fact that the high-flying meme stocks continue to defy gravity, we remain skeptical of their long-term prospects. Our view has been that “meme stocks are akin to a market virus—infectious, contagious and dangerous…lacking in fundamentals and inflated by whims.”13 Thus far, these issues continue to attract retail interest—crowdfunded by a pile-on effect that is likely to crumble under its own weight. Even as these names charge on, we continue to believe a day of reckoning will come.
PORTFOLIO COMINGS AND GOINGS
We did not add any new holdings to Ariel Fund during the quarter and successfully exited broadcast, digital media and marketing services company TEGNA, Inc. upon the announcement of its acquisition by Standard General.
We did not initiate or exit any holdings in Ariel Appreciation Fund during the period.
As always, we appreciate the opportunity to serve you and welcome any questions or comments you might have.
Sincerely,
| | |
 | |  |
| John W. Rogers, Jr. | | Mellody Hobson |
| Chairman and Co-CEO | | Co-CEO and President |
| 9 | Ariel Fund and Ariel Appreciation Fund Portfolio Manager Letter. June 30, 2021. |
| 10 | Ariel Fund and Ariel Appreciation Fund Portfolio Manager Letter. September 30, 2021. |
| 11 | Ariel Fund and Ariel Appreciation Fund Portfolio Manager Letter. September 30, 2021. |
| 12 | Ariel Fund and Ariel Appreciation Fund Portfolio Manager Letter. September 30, 2021. |
| 13 | Ariel Fund and Ariel Appreciation Fund Portfolio Manager Letter. December 31, 2021. |
6 SLOW AND STEADY WINS THE RACE
| | |
| |
Ariel Fund performance summary | | INCEPTION: 11/06/86 |
|
| | |
| | | | |
| |  | |  |
| | |
| John W. Rogers, Jr. | | John P. Miller, CFA | | Kenneth E. Kuhrt, CPA |
| Lead portfolio | | Portfolio | | Portfolio |
| manager | | manager | | manager |
Composition of equity holdings (%)
| | | | | | | | |
| | | | |
| | | Ariel
Fund | | Russell
2500
Value
Index | | Russell
2500
Index | | S&P
500
Index |
| | | | |
Consumer Discretionary | | 35.78 | | 13.09 | | 14.20 | | 15.40 |
| | | | |
Industrials | | 20.72 | | 17.80 | | 18.27 | | 12.13 |
| | | | |
Financials | | 19.36 | | 20.11 | | 14.74 | | 10.66 |
| | | | |
Health Care | | 6.58 | | 7.45 | | 12.42 | | 12.95 |
| | | | |
Real Estate | | 5.28 | | 12.47 | | 8.90 | | 2.72 |
| | | | |
Consumer Staples | | 2.91 | | 3.12 | | 2.88 | | 5.33 |
| | | | |
Energy | | 2.91 | | 7.71 | | 6.64 | | 3.99 |
| | | | |
Utilities | | 2.80 | | 4.52 | | 3.15 | | 2.97 |
| | | | |
Technology | | 0.00 | | 6.33 | | 12.57 | | 29.12 |
| | | | |
Basic Materials | | 0.00 | | 6.05 | | 4.85 | | 1.91 |
| | | | |
Telecommunications | | 0.00 | | 1.34 | | 1.38 | | 2.80 |
Sector weightings for the Fund are calculated based on equity holdings as a percentage of total net assets.
Average annual total returns (%) as of 3/31/2022
| | | | | | | | | | | | | | | | | | | | | | | | | | | | |
| | | Quarter | | | 1-year | | | 3-year | | | 5-year | | | 10-year | | | 20-year | | | Since
inception | |
| | | | | | | |
Ariel Fund–Investor Class | | | -5.11 | | | | 3.51 | | | | 13.00 | | | | 9.76 | | | | 12.23 | | | | 8.56 | | | | 11.25 | |
| | | | | | | |
Ariel Fund–Institutional Class+ | | | -5.04 | | | | 3.83 | | | | 13.36 | | | | 10.09 | | | | 12.58 | | | | 8.73 | | | | 11.35 | |
| | | | | | | |
Russell 2500TM Value Index | | | -1.50 | | | | 7.73 | | | | 12.97 | | | | 9.19 | | | | 11.04 | | | | 9.23 | | | | 11.08 | |
| | | | | | | |
Russell 2500TM Index | | | -5.82 | | | | 0.34 | | | | 13.79 | | | | 11.57 | | | | 12.09 | | | | 9.76 | | | | 10.91 | |
| | | | | | | |
S&P 500® Index | | | -4.60 | | | | 15.65 | | | | 18.92 | | | | 15.99 | | | | 14.64 | | | | 9.25 | | | | 11.02 | |
Performance data quoted represents past performance and does not guarantee future results. All performance assumes the reinvestment of dividends and capital gains. The investment return and principal value of an investment will fluctuate so that an investor’s shares, when redeemed, may be worth more or less than their original cost. Current performance may be lower or higher than the performance data quoted. Any extraordinary performance shown for short-term periods may not be sustainable and is not representative of the performance over longer periods. To access performance data current to the most recent month-end, visit arielinvestments.com.
Growth of a $10,000 investment since inception (Investor Class)
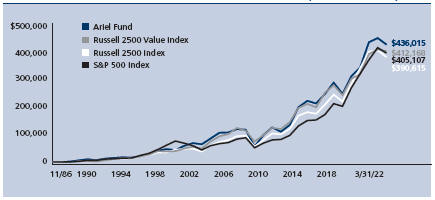
The graph and performance table do not reflect the deduction of taxes that a shareholder would pay on fund distributions or the redemption of fund shares. Total return does not reflect a maximum 4.75% sales load charged prior to 7/15/94.
| | | | | | | | |
| Expense ratio (as of 9/30/21) | | | | | | |
Investor Class | | | 1.00 | % | | | | |
Institutional Class | | | 0.69 | % | | | | |
| | | | | | | | | | | | |
| Top ten equity holdings (% of net assets) |
| | | | | | |
| 1. | | Madison Square Garden Ent. Corp. | | 6.1 | | | | 6. | | JLL | | 3.4 |
| 2. | | Paramount Global | | 4.7 | | | | 7. | | Northern Trust Corp. | | 3.3 |
| 3. | | Lazard Ltd., Class A | | 3.8 | | | | 8. | | Mohawk Industries, Inc. | | 3.3 |
| 4. | | Adtalem Global Education, Inc. | | 3.8 | | | | 9. | | Gentex Corp. | | 3.0 |
| 5. | | Mattel, Inc. | | 3.7 | | | | 10. | | Envista Holdings Corp. | | 2.9 |
| + | The inception date for the Institutional Class shares is December 30, 2011. Performance information for the Institutional Class prior to that date reflects the actual performance of the Fund’s Investor Class (and uses the actual expenses of the Fund’s Investor Class, for such period of time), without any adjustments. For any such period of time, the performance of the Fund’s Institutional Class would have been substantially similar to, yet higher than, the performance of the Fund’s Investor Class, because the shares of both classes are invested in the same portfolio of securities, but the classes bear different expenses, which are primarily differences in distribution and service fees. |
ARIELINVESTMENTS.COM 7
| | |
| |
Ariel Appreciation Fund performance summary | | INCEPTION: 12/01/89 |
|
| | |
| | | | |
 | |  | | |
| |
| John W. Rogers, Jr. | | Timothy R. Fidler,CFA |
| Co-portfolio | | Co-portfolio | | |
| manager | | manager | | |
Composition of equity holdings (%)
| | | | | | | | |
| | | | |
| | | Ariel
Apprec-
iation
Fund | | Russell
Midcap
Value
Index | | Russell
Midcap
Index | | S&P
500
Index |
| | | | |
Financials | | 28.68 | | 16.25 | | 12.72 | | 10.66 |
| | | | |
Consumer Discretionary | | 27.10 | | 12.79 | | 14.85 | | 15.40 |
| | | | |
Industrials | | 15.46 | | 16.14 | | 16.94 | | 12.13 |
| | | | |
Health Care | | 11.05 | | 6.81 | | 9.67 | | 12.95 |
| | | | |
Consumer Staples | | 6.70 | | 6.14 | | 4.82 | | 5.33 |
| | | | |
Energy | | 2.83 | | 7.46 | | 6.21 | | ��3.99 |
| | | | |
Utilities | | 2.75 | | 8.37 | | 5.64 | | 2.97 |
| | | | |
Real Estate | | 1.78 | | 11.60 | | 8.74 | | 2.72 |
| | | | |
Technology | | 0.00 | | 7.73 | | 14.84 | | 29.12 |
| | | | |
Basic Materials | | 0.00 | | 5.03 | | 3.94 | | 1.91 |
| | | | |
Telecommunications | | 0.00 | | 1.69 | | 1.63 | | 2.80 |
Sector weightings for the Fund are calculated based on equity holdings as a percentage of total net assets.
Average annual total returns (%) as of 3/31/2022
| | | | | | | | | | | | | | | | | | | | | | | | | | | | |
| | | Quarter | | | 1-year | | | 3-year | | | 5-year | | | 10-year | | | 20-year | | | Since
inception | |
| | | | | | | |
Ariel Appreciation Fund–Investor Class | | | -4.57 | | | | 3.86 | | | | 11.60 | | | | 8.18 | | | | 10.56 | | | | 8.02 | | | | 10.50 | |
| | | | | | | |
Ariel Appreciation Fund–Institutional Class+ | | | -4.50 | | | | 4.18 | | | | 11.95 | | | | 8.52 | | | | 10.90 | | | | 8.19 | | | | 10.61 | |
| | | | | | | |
Russell Midcap® Value Index | | | -1.82 | | | | 11.45 | | | | 13.68 | | | | 10.00 | | | | 12.02 | | | | 10.00 | | | | 11.39 | |
| | | | | | | |
Russell Midcap® Index | | | -5.68 | | | | 6.92 | | | | 14.89 | | | | 12.62 | | | | 12.86 | | | | 10.33 | | | | 11.51 | |
| | | | | | | |
S&P 500® Index | | | -4.60 | | | | 15.65 | | | | 18.92 | | | | 15.99 | | | | 14.64 | | | | 9.25 | | | | 10.52 | |
Performance data quoted represents past performance and does not guarantee future results. All performance assumes the reinvestment of dividends and capital gains. The investment return and principal value of an investment will fluctuate so that an investor’s shares, when redeemed, may be worth more or less than their original cost. Current performance may be lower or higher than the performance data quoted. Any extraordinary performance shown for short-term periods may not be sustainable and is not representative of the performance over longer periods. To access performance data current to the most recent month-end, visit arielinvestments.com.
Growth of a $10,000 investment since inception (Investor Class)
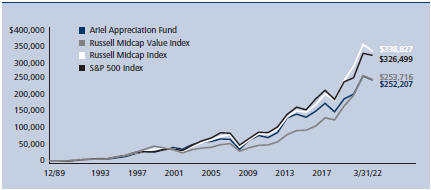
The graph and performance table do not reflect the deduction of taxes that a shareholder would pay on fund distributions or the redemption of fund shares. Total return does not reflect a maximum 4.75% sales load charged prior to 7/15/94.
| | | | | | | | |
| Expense ratio (as of 9/30/21) | | | | | | |
Investor Class | | | 1.12 | % | | | | |
Institutional Class | | | 0.81 | % | | | | |
| | | | | | | | | | | | |
| Top ten equity holdings (% of net assets) |
| | | | | | |
| 1. | | Madison Square Garden Ent. Corp. | | 4.6 | | | | 6. | | Goldman Sachs Group, Inc. | | 3.6 |
| 2. | | BOK Financial Corp. | | 4.2 | | | | 7. | | The Charles Schwab Corp. | | 3.3 |
| 3. | | Northern Trust Corp. | | 4.1 | | | | 8. | | Laboratory Corp. of America Holdings | | 3.2 |
| 4. | | Mattel, Inc. | | 4.0 | | | | 9. | | Walgreens Boots Alliance, Inc. | | 3.1 |
| 5. | | Aflac, Inc. | | 3.8 | | | | 10. | | Lazard Ltd., Class A | | 2.9 |
| + | The inception date for the Institutional Class shares is December 30, 2011. Performance information for the Institutional Class prior to that date reflects the actual performance of the Fund’s Investor Class (and uses the actual expenses of the Fund’s Investor Class, for such period of time), without any adjustments. For any such period of time, the performance of the Fund’s Institutional Class would have been substantially similar to, yet higher than, the performance of the Fund’s Investor Class, because the shares of both classes are invested in the same portfolio of securities, but the classes bear different expenses, which are primarily differences in distribution and service fees. |
8 SLOW AND STEADY WINS THE RACE


Charles K. Bobrinskoy
Vice Chairman
Portfolio Manager
Average annual total returns as of 03/31/22
| | | | | | | | | | | | | | | | | | | | | | | | |
| | | | | | |
| | | 1Q22 | | | 1-year | | | 3-year | | | 5-year | | | 10-year | | | Since
inception* | |
Ariel Focus Fund | | | 3.97 | % | | | 8.14 | % | | | 14.22 | % | | | 9.53 | % | | | 9.95 | % | | | 6.97 | % |
Russell 1000® Value Index | | | -0.74 | | | | 11.67 | | | | 13.02 | | | | 10.29 | | | | 11.70 | | | | 8.26 | |
S&P 500® Index | | | -4.60 | | | | 15.65 | | | | 18.92 | | | | 15.99 | | | | 14.64 | | | | 10.52 | |
* The inception date for Ariel Focus Fund is 06/30/05.
DEAR FELLOW SHAREHOLDER:
Despite a tough environment, Ariel Focus Fund enjoyed strong first quarter 2022 performance gaining +3.97% compared to a loss of -0.74% for the Russell 1000 Value Index and a loss of -4.60% for the S&P 500. Last quarter, we outlined four themes for this year’s economy and equity markets that are playing out with positive implications for many of our largest holdings.
As a reminder, we believe equity markets will be dominated by 1) high and persistent inflation, 2) rising interest rates, 3) a strong reopening economy and 4) outperformance of value
over growth stocks. These factors are related and reinforcing. A strong economy will augment inflation. Higher inflation should drive higher interest rates. Higher rates should be relatively good for value versus growth.
INFLATION
Of all these themes, we have been the loudest and most consistent in forecasting higher inflation. Manufacturing supply-chain disruptions, dramatic increases in the money supply, trillion-dollar deficit spending (from both political parties), an accommodative Federal Reserve (still), and a historically tight labor market all push up prices.
Performance data quoted represents past performance. Past performance does not guarantee future results. All performance assumes the reinvestment of dividends and capital gains and represents returns of the Investor Class shares. The investment return and principal value of an investment will fluctuate so that an investor’s shares, when redeemed, may be worth more or less than their original cost. Current performance may be lower or higher than the performance data quoted. Any extraordinary performance shown for short-term periods may not be sustainable and is not representative of the performance over longer periods. Performance data current to the most recent month-end for Ariel Focus Fund may be obtained by visiting our website, arielinvestments.com.
ARIELINVESTMENTS.COM 9
Economists from different “schools” of economic theory often disagree. Today, all can point to their own favorite cause to explain rising inflation. Monetarists (whom we currently find particularly persuasive) believe inflation comes from excessive increases in the money supply and point to a 40% increase in M2 (a measure of the money supply that includes cash, bank deposits and certain money market accounts). Meanwhile, Keynesian economists have taught generations of students that fiscal policy in the form of deficit spending will drive inflation as labor markets approach full employment. With trillion-dollar federal deficits and a 3.6% unemployment rate, they believe higher inflation is inevitable. Finally, Supply Side economists say constraints in manufacturing capacity from supply-chain disruptions overseas and labor shortages at home have “too much money chasing too few goods.” Remarkably, different schools of economic thought have come to the same conclusion today: prices are going up.
“Of all these themes, we have been the loudest and most consistent in forecasting higher inflation.”
INTEREST RATES
Higher inflation should lead to higher interest rates. Presumably, lenders will insist loans carry interest rates high enough to offset the loss of purchasing power. Normally fixed income markets would add a “time value of money” premium to the expected inflation rate to produce higher nominal rates. We say “should” because until recently, higher rates had not materialized. Interest rates remained stubbornly and surprisingly low, with the 10-Year Treasury ending 2021 at 1.52%, well below historical averages and below visible inflation. Lately, there has been a marked reversal as rates have moved substantively higher. As we go to print, the 10-year Treasury sits at 2.83%, which has driven the Barclays Fixed Income Aggregate Index down -7.88% this year. At long last, the Federal Reserve has acknowledged high and non-transitory inflation. While the increases in the federal funds rate are getting most of the attention, we would emphasize the end of its bond-buying program of $120 billion a month, which ballooned its balance sheet to $9 trillion. Ever since the Great Financial Crisis, bond
investors have been able to buy long-term bonds at surprisingly low interest rates, confident the Fed would keep prices high (and yields low) through aggressive open market purchases. “Don’t fight the Fed” meant don’t be a seller of bonds when the Fed was a buyer. Now the situation has flipped with bond investors seeking to exit through the same narrow door ahead of $9 trillion of “Quantitative Tightening.” In February, Barron’s ran an article with the subtitle: “Why Warren Buffett Hates Bonds.” We agree with Warren.
VALUE OVER GROWTH
Higher inflation and interest rates are directly impacting stock valuations. Until this year, low interest rates have fueled the outperformance of growth stocks over the value stocks we prefer. Our holdings earn a higher percentage of their current stock price in nearer term cash flows. Growth stocks, by definition, are priced to value earnings and cash flow often in the distant future. The weighted average years into the future of a company’s cash flows is called its expected “duration.” Just as rising interest rates hit long-term bonds harder than short-term bonds, increases in discount rates hit long-duration growth stocks harder than short-duration value stocks. Currently, our two largest holdings are APA Corporation (APA) and The Mosaic Company (MOS) trading at forward p/e multiples of 6.3x and 7.6x, respectively. In simple terms, both have the potential to earn more than half their current valuation in the next four years if earnings stay flat. As a result, increases in interest rates and discount rates should have comparatively little impact on their valuations, just as an increase in rates has little impact on a short-term bond.
By contrast, many growth stocks are popular technology companies trading at 30 to 45 times next year’s earnings. They are being valued on cash flows projected in the distant future. The Nasdaq Composite is trading at 27 times forward earnings. Rising interest rates disproportionately impact these companies whose earnings are far away, just as an increase in rates hits the price of long-term bonds harder than short-term bonds.
Now that rates are moving up, value is outperforming. The growth stock heavy Nasdaq Composite has fallen -9.10% this year. While the Russell 1000 Value is down -0.74%, the
10 SLOW AND STEADY WINS THE RACE
Russell 1000 Growth Index has dropped -9.04%. With our portfolio trading at only ten times forward earnings at the end of the first quarter, Ariel Focus Fund could be well positioned for a period of value outperformance.
CONSUMER DEMAND
Although we are increasingly confident higher inflation and higher rates will drive outperformance, recent events have made us more cautious around the final theme, a strong economy based on pent-up consumer demand. While predicting future recessions is notoriously difficult, we cannot deny a change in certain inputs that are likely to reduce growth. Dramatically higher energy and food prices negatively impact consumer confidence. Higher interest rates push mortgage rates up and tend to reduce demand for housing. Europe represents approximately 20% of the global economy and will feel the impact of the Russian invasion of Ukraine through higher energy prices. Renewed COVID lockdowns in parts of China will delay supply chain normalization, keeping US manufacturing levels below what we would otherwise have expected. Perhaps most important, US consumers have previously expressed confidence based on strong personal balance sheets, a robust job market and federal stimulus checks. With inflation outpacing wage increases, spending could slow. Although we remain optimistic about the long-term outlook for the US economy and are investing accordingly, the next 18 months could be bumpy.
CONTRIBUTORS AND DETRACTORS
It is a rare but happy occurrence when our largest holdings contribute most to positive performance. Such was the case in the first quarter. Our second largest position, Mosaic, surged +69.61% during the period. The company owns and operates fertilizer mines in Florida and Saskatchewan, Canada with obvious advantages in supplying the wheat fields of Kansas and the cornfields of Iowa. This geographic proximity was less important during the past decade as record low shipping rates (coming at least in part from record low energy costs) brought competition from Moroccan phosphates and Belarus potash. Since fertilizer increases crop yields on a cost-efficient basis, it is a critical farming ingredient in the long term as improved diets around
the world drive demand for food from finite arable land. We did not expect the dramatic acceleration in our thesis as the war simultaneously cut off major exports of grain from Russia and Ukraine while sanctions suppressed fertilizer shipments from Belarus. Mosaic was performing extremely well before the war. We expect concerns around reliance on Russian suppliers to accelerate growth trends for the foreseeable future.
APA Corporation, the parent company of Apache Inc., was our largest position at the start of the year and was the second biggest performance contributor, jumping +54.32% in the quarter. Like Mosaic, APA had already benefited from the rising commodity prices prior to the Ukraine invasion. Those inflationary pressures were exacerbated with the sanctions against Russian oil. Poor performance of oil and gas exploration and production companies over the last decade have simultaneously reduced capital expenditures in the industry as well as caused significant selling of US energy stocks. We believe an insufficient amount of capital has been invested to meet the global energy demand for petroleum products for at least the next five years. In our view, the current share price of APA represents less than the value of the company’s proven reserves with only an option value assigned to its exploratory wells off the coast of Suriname. If these Suriname properties prove productive, our investment in APA will be worth significantly more than today.
Meanwhile, our largest detractor was flooring manufacturer Mohawk Industries, Inc. (MHK) which declined -31.83% in the quarter. Mohawk faced the triple headwinds of higher petroleum input cost, concerns about declining housing activity and modest Russian operations. Additionally, Lazard Ltd. (LAZ) fell -19.97% during the period on expectations of lower M&A activity.
As always, we appreciate the opportunity to serve you and welcome any questions or comments you might have.
Sincerely,

Charles K. Bobrinskoy
Vice Chairman and Portfolio Manager
ARIELINVESTMENTS.COM 11
| | |
| |
Ariel Focus Fund performance summary | | INCEPTION: 06/30/05 |
|
| | |
|
|
|
| Charles K. Bobrinskoy |
| Portfolio manager |
Composition of equity holdings (%)
| | | | | | | | |
| | | |
| | | Ariel
Focus
Fund | | Russell
1000
Value
Index | | S&P
500
Index | |
| | | |
Financials | | 21.66 | | 20.23 | | | 10.66 | |
| | | |
Industrials | | 20.01 | | 12.75 | | | 12.13 | |
| | | |
Consumer Discretionary | | 15.83 | | 8.96 | | | 15.40 | |
| | | |
Health Care | | 14.37 | | 16.95 | | | 12.95 | |
| | | |
Basic Materials | | 10.82 | | 2.81 | | | 1.91 | |
| | | |
Energy | | 7.56 | | 7.18 | | | 3.99 | |
| | | |
Technology | | 3.50 | | 7.88 | | | 29.12 | |
| | | |
Consumer Staples | | 2.51 | | 7.43 | | | 5.33 | |
| | | |
Utilities | | 0.00 | | 5.90 | | | 2.97 | |
| | | |
Telecommunications | | 0.00 | | 4.96 | | | 2.80 | |
| | | |
Real Estate | | 0.00 | | 4.95 | | | 2.72 | |
Sector weightings for the Fund are calculated based on equity holdings as a percentage of total net assets.
Average annual total returns (%) as of 3/31/2022
| | | | | | | | | | | | | | | | | | | | | | | | |
| | | Quarter | | | 1-year | | | 3-year | | | 5-year | | | 10-year | | | Since
inception | |
| | | | | | |
Ariel Focus Fund–Investor Class | | | 3.97 | | | | 8.14 | | | | 14.22 | | | | 9.53 | | | | 9.95 | | | | 6.97 | |
| | | | | | |
Ariel Focus Fund–Institutional Class+ | | | 4.03 | | | | 8.40 | | | | 14.51 | | | | 9.81 | | | | 10.22 | | | | 7.14 | |
| | | | | | |
Russell 1000® Value Index | | | -0.74 | | | | 11.67 | | | | 13.02 | | | | 10.29 | | | | 11.70 | | | | 8.26 | |
| | | | | | |
S&P 500® Index | | | -4.60 | | | | 15.65 | | | | 18.92 | | | | 15.99 | | | | 14.64 | | | | 10.52 | |
Performance data quoted represents past performance and does not guarantee future results. All performance assumes the reinvestment of dividends and capital gains. The investment return and principal value of an investment will fluctuate so that an investor’s shares, when redeemed, may be worth more or less than their original cost. Current performance may be lower or higher than the performance data quoted. Any extraordinary performance shown for short-term periods may not be sustainable and is not representative of the performance over longer periods. To access performance data current to the most recent month-end, visit arielinvestments.com.
Growth of a $10,000 investment since inception (Investor Class)
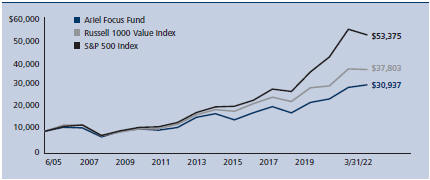
The graph and performance table do not reflect the deduction of taxes that a shareholder would pay on fund distributions or the redemption of fund shares.
| | | | | | | | |
Expense ratio (as of 9/30/21) | | Net | | | Gross | |
Investor Class | | | 1.00 | % | | | 1.20% | |
Institutional Class | | | 0.75 | % | | | 0.86% | |
Currently, expense ratio caps of 1.00% for the Investor Class and 0.75% for the Institutional Class are in place to waive fees and reimburse certain expenses that exceed these caps. Ariel Investments, LLC (the Adviser) is contractually obligated to maintain these expense ratio caps through 9/30/23.
| | | | | | | | | | | | | | |
Top ten equity holdings (% of net assets) |
| | | | | | | |
| 1. | | APA Corp. | | 7.6 | | | | | 6. | | | Goldman Sachs Group, Inc. | | 4.2 |
| 2. | | Mosaic Co. | | 6.9 | | | | | 7. | | | Madison Square Garden Ent. Corp. | | 4.2 |
| 3. | | BorgWarner, Inc. | | 4.8 | | | | | 8. | | | Barrick Gold Corp. | | 4.0 |
| 4. | | BOK Financial Corp. | | 4.3 | | | | | 9. | | | Snap-on, Inc. | | 3.9 |
| 5. | | Lockheed Martin Corp. | | 4.2 | | | | | 10. | | | Resideo Technologies, Inc. | | 3.7 |
| + | The inception date for the Institutional Class shares is December 30, 2011. Performance information for the Institutional Class prior to that date reflects the actual performance of the Fund’s Investor Class (and uses the actual expenses of the Fund’s Investor Class, for such period of time), without any adjustments. For any such period of time, the performance of the Fund’s Institutional Class would have been substantially similar to, yet higher than, the performance of the Fund’s Investor Class, because the shares of both classes are invested in the same portfolio of securities, but the classes bear different expenses, which are primarily differences in distribution and service fees. |
12 SLOW AND STEADY WINS THE RACE


Rupal J. Bhansali
Chief Investment Officer
International and Global Equities
Average annual total returns as of 03/31/22
| | | | | | | | | | | | | | | | | | | | | | | | |
| | | | | | |
| | | 1Q22 | | | 1-year | | | 3-year | | | 5-year | | | 10-year | | | Since
inception* | |
Ariel International Fund | | | -2.02 | % | | | 2.01 | % | | | 4.76 | % | | | 3.78 | % | | | 5.01 | % | | | 5.40 | % |
MSCI EAFE Index | | | -5.91 | | | | 1.16 | | | | 7.78 | | | | 6.72 | | | | 6.27 | | | | 7.19 | |
MSCI ACWI ex-US Index | | | -5.44 | | | | -1.48 | | | | 7.51 | | | | 6.76 | | | | 5.55 | | | | 6.51 | |
MSCI EAFE Value Index | | | 0.33 | | | | 3.55 | | | | 5.23 | | | | 4.18 | | | | 4.87 | | | | 5.70 | |
MSCI ACWI ex-US Value Index | | | 0.13 | | | | 3.31 | | | | 5.44 | | | | 4.67 | | | | 4.24 | | | | 5.17 | |
* The inception date for Ariel International Fund is 12/30/11.
Average annual total returns as of 03/31/22
| | | | | | | | | | | | | | | | | | | | | | | | |
| | | | | | |
| | | 1Q22 | | | 1-year | | | 3-year | | | 5-year | | | 10-year | | | Since
inception* | |
Ariel Global Fund | | | 0.11 | % | | | 7.87 | % | | | 8.53 | % | | | 7.45 | % | | | 8.00 | % | | | 8.33 | % |
MSCI ACWI Index | | | -5.36 | | | | 7.28 | | | | 13.75 | | | | 11.64 | | | | 10.00 | | | | 10.95 | |
MSCI ACWI Value Index | | | -0.95 | | | | 8.83 | | | | 9.02 | | | | 7.46 | | | | 7.64 | | | | 8.50 | |
* The inception date for the Ariel Global Fund is 12/30/11.
Performance data quoted represents past performance. Past performance does not guarantee future results. All performance assumes the reinvestment of dividends and capital gains and represents returns of the Investor Class shares. The investment return and principal value of an investment will fluctuate so that an investor’s shares, when redeemed, may be worth more or less than their original cost. Current performance may be lower or higher than the performance data quoted. Any extraordinary performance shown for short-term periods may not be sustainable and is not representative of the performance over longer periods. Performance data current to the most recent month-end for Ariel International Fund and Ariel Global Fund may be obtained by visiting our website, arielinvestments.com.
ARIELINVESTMENTS.COM 13
DEAR FELLOW SHAREHOLDER:
The MSCI ACWI Index started 2022 in the red delivering its worst quarter of performance in two years. As the global economy seeks to place the pandemic in its rear-view mirror, Russia’s invasion of Ukraine introduced new shocks as markets were digesting the impacts of soaring inflation, a hawkish pivot by the Fed and concerns over the outlook for China. Ripple effects from higher energy prices have extended to other goods and services, increasing cost pressures and further disrupting already rattled supply chains. However, as conditions deteriorated, our Funds began to outperform their primary benchmarks. Although we lagged the dramatic rally in cyclicals that began in late 2020 and persisted throughout 2021, our risk-aware portfolio positioning better protected capital during the recent downturn. While our low portfolio turnover illustrates the merits of our patient approach, we credit our relative outperformance to our avoidance of the 4Ls: Lofty Valuations, Loss Making Companies, Leveraged Balance Sheets and Liquidity Risk.
LOFTY VALUATIONS
As we discussed in prior quarterly letters, the global economy’s rebound from the March 2020 low through last December was undeniable. With unprecedented fiscal support and interest rates at all-time lows, the MSCI ACWI and S&P 500 indexes surged to new highs in record time and corporate profits shined, propelling equity valuations past historic peaks. We discussed the high relative valuations of cyclicals versus defensives, the outperformance of growth relative to value, as well as how US stock returns versus the rest of the world have continued to widen over the last decade. By contrast, since our investment approach focuses on seeking a margin of safety1 as evaluated by discount to intrinsic worth, our global portfolios are currently overweight defensive sectors, such as Health Care and Communications relative to cyclicals, with greater international exposure. Our research also revealed favorable entry points within developing economies, where deeply discounted valuations in certain sectors, such as financials, continue to present compelling investment opportunities when weighing the risk and reward.
LOSS MAKING COMPANIES
At the core of every stock thesis is our differentiated process that considers the upside and downside potential for a name. As we scour the globe for high-quality companies with sustainable business models with stable or improving returns on invested capital, we discovered a growing percentage of unprofitable companies, particularly within the technology sector and amongst new issues (IPOs). Interestingly, money-losing tech stocks have been a positive contributor to overall returns across the Growth and Tech indices until this quarter.2 Meanwhile, in recent years roughly 80% of IPOs lacked profitability, a level not seen since the peak of the Dot Com Bubble two decades ago.3 Our concentrated portfolios avoid the risks associated with such businesses and instead are comprised of diversified holdings across profitable, well-established franchises with strong competitive positions and durable cost advantages.
LEVERAGED BALANCE SHEETS
Central banks in the world’s largest economies helped mitigate the economic fallout of both the coronavirus pandemic and the 2008 Financial Crisis through fiscal stimulus and monetary relief packages. The unconventional expansion in money supply, which began as quantitative easing, resulted in record low interest rates. These actions drove investment in riskier assets with higher yields, including stocks, junk bonds, real estate and commodities, as easy money policies distorted the hurdle rate companies and investors use to determine whether an investment is worth the risk/return. Lower capital costs also provided an incentive for corporations to access debt markets to fund acquisitions and/or repurchase shares already selling at inflated prices. Meanwhile, investment grade (IG) markets quadrupled in size since 2007, with approximately 50% of the Bloomberg US Corporate Bond Index consisting of BBB rated debt—the last rung of high-grade issues.4 Taking this one step further, today, the BBB segment of the corporate bond market stands at 5x the size of the BB tranche.5 This raises questions about the junk bond market’s ability to absorb additional supply without a collapse in pricing if there are large scale downgrades from BBB into high yield.
| 1 | Attempting to purchase with a margin of safety on price cannot protect investors from the volatility associated with stocks, incorrect assumptions or estimations on our part, declining fundamentals or external forces.” |
| 2 | “Tech stocks: Challenged, but not all created equal.” Principal Global. 14 Jan 2022. https://www.principalglobal.com/knowledge/insights/tech-stocks- challenged-not-all-created-equal |
| 3 | BofA Research Investment Committee [@Isabelnet_SA]. “More and more unprofitable companies are going public.” Twitter, 11 February 2021, 6:15 AM, https://twitter.com/isabelnet_sa/status/1359868723327344643?lang=es. |
14 SLOW AND STEADY WINS THE RACE
With inflation rising at its fastest pace in 40 years, corporate earnings growth has begun to face headwinds as pricing pressures climb across supply side factors, including production costs and operating expenditures. To prevent the economy from overheating, policymakers have begun to raise rates. This upward movement will further impact corporate profits, as greater debt servicing costs weigh on the bottom-line. Taken together, we believe these factors are an increasing source of vulnerability for market multiples within the context of various valuation methods. Consequently, our bottom-up fundamental research is laser-focused on the growth and return prospect of a business, as well as the fortitude and resilience of its balance sheet.
LIQUIDITY RISK
While analyzing whether a company has cash flow to fund its liabilities is one way we assess liquidity, evaluating how easily shares can be bought or sold in the market is another area we closely consider. Index funds have experienced massive inflows in recent years, highlighting a shift towards a growing number of price agnostic market participants. Passive strategies buy stocks in the same proportion as the indexes they track with no regard for stock price or fundamental security analysis. Research has shown “as bull markets run, cap weighted indexes tend to become more concentrated in a handful of sectors and stocks. These same sectors and stocks tend to account for a disproportionate amount of the markets gains.”6
However, during bear markets, flows tend to reverse, at least cyclically for risk assets. We saw a version of this play out in March 2020 when the stock market see-sawed from bull-to-bear status in just 20 days—“the fastest 20% drop in history.”7 Volatility reigned and liquidity for many of the large capitalization companies within the index dried up as markets went risk-off. Stock prices fell fast to bridge the large bid/ask spread between active fundamental investors on the buy-side and passive ones on the sell-side. As the correction unfolded, many passive strategies realized larger losses due to their greater concentration of equities held within the indexes.
This phenomenon could play out again, particularly since growth and cyclical valuations are trading at or near historic peaks. We believe the high active share of our portfolios helps side-step large bid/ask liquidity risk.
ACTIVELY AWARE
While markets may change from one period to the next, our investment process remains the same. Risk management is embedded in every step—regardless of the market backdrop. Although uncertainty is high and volatility is likely to remain elevated, we believe our global portfolios will drive strong longer-term performance, as they are heavily weighted towards undervalued, higher dividend yielding and better quality defensive holdings.
“While markets may change from one period to the next, our investment process remains the same.”
As Ben Graham once said, “in the short run, the market is a voting machine but in the long run, it is a weighing machine.”
As always, we appreciate the opportunity to serve you and welcome any questions or comments you might have.
Sincerely,

Rupal J. Bhansali
Chief Investment Officer
International and Global Equities
| 4 | 2022 Morgan Stanley Credit Strategy Chartbook. Morgan Stanley. 1 April 2022. |
| 5 | 2022 Deutsche Bank U.S. Credit Strategy. Deutsche Bank Research. 8 April 2022. |
| 6 | Johnson, Ben. “Is market-cap indexing a form of momentum investing.” TEBI. 24 February 2020. https://www.evidenceinvestor.com/is-market-cap-indexing-a-form-of-momentum-investing/ |
| 7 | Winck, Ben. “The Dow plunged into a bear market in just 20 days – the fastest 20% drop in history.” BusinessInsider. March 12, 2020. |
ARIELINVESTMENTS.COM 15
| | |
| |
Ariel International Fund performance summary | | INCEPTION: 12/30/11 |
|
| | |
Rupal J. Bhansali
Portfolio manager
Composition of equity holdings (%)
| | | | | | |
| | | | | | | MSCI |
| | | Ariel | | MSCI | | ACWI |
| | | International | | EAFE | | ex-US |
| | | Fund | | Index | | Index |
Health Care | | 17.82 | | 13.05 | | 9.37 |
Financials | | 17.51 | | 17.71 | | 20.56 |
Communication Services | | 15.15 | | 4.85 | | 6.16 |
Consumer Staples | | 12.36 | | 10.19 | | 8.43 |
Consumer Discretionary | | 11.99 | | 11.54 | | 11.08 |
Utilities | | 10.63 | | 3.39 | | 3.18 |
Information
Technology | | 3.40 | | 8.60 | | 12.21 |
Industrials | | 2.86 | | 15.40 | | 12.23 |
Energy | | 0.51 | | 4.14 | | 5.39 |
Real Estate | | 0.09 | | 2.89 | | 2.47 |
Materials | | 0.00 | | 8.23 | | 8.92 |
Sector weightings for the Fund are calculated based on equity holdings as a percentage of total net assets. The sectors above are the Global Industry Classification Standard (“GICS”) sector classifications.
Average annual total returns (%) as of 3/31/2022
| | | | | | | | | | | | | | | | | | | | | | | | |
| | | Quarter | | | 1-year | | | 3-year | | | 5-year | | | 10-year | | | Since
inception | |
| | | | | | |
Ariel International Fund–Investor Class | | | -2.02 | | | | 2.01 | | | | 4.76 | | | | 3.78 | | | | 5.01 | | | | 5.40 | |
| | | | | | |
Ariel International Fund–Institutional Class | | | -2.00 | | | | 2.24 | | | | 5.00 | | | | 4.05 | | | | 5.27 | | | | 5.65 | |
MSCI EAFE Index (net) | | | -5.91 | | | | 1.16 | | | | 7.78 | | | | 6.72 | | | | 6.27 | | | | 7.19 | |
MSCI ACWI ex-US Index (net) | | | -5.44 | | | | -1.48 | | | | 7.51 | | | | 6.76 | | | | 5.55 | | | | 6.51 | |
MSCI EAFE Value Index (net) | | | 0.33 | | | | 3.55 | | | | 5.23 | | | | 4.18 | | | | 4.87 | | | | 5.70 | |
MSCI ACWI ex-US Value Index (net) | | | 0.13 | | | | 3.31 | | | | 5.44 | | | | 4.67 | | | | 4.24 | | | | 5.17 | |
Performance data quoted represents past performance and does not guarantee future results. All performance assumes the reinvestment of dividends and capital gains. The investment return and principal value of an investment will fluctuate so that an investor’s shares, when redeemed, may be worth more or less than their original cost. Current performance may be lower or higher than the performance data quoted. Any extraordinary performance shown for short-term periods may not be sustainable and is not representative of the performance over longer periods. To access performance data current to the most recent month-end, visit arielinvestments.com.
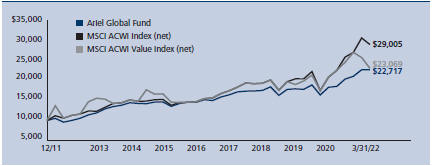
Growth of a $10,000 investment since inception (Investor Class)
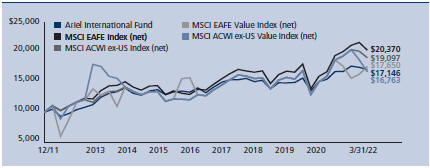
The graph and performance table do not reflect the deduction of taxes that a shareholder would pay on fund distributions or the redemption of fund shares.
| | | | | | | | | | | | | | | | |
Expense ratio (as of 9/30/21) | | | Net | | | | | | | | Gross | | | | | |
Investor Class | | | 1.13 | % | | | | | | | 1.30% | | | | | |
Institutional Class | | | 0.88 | % | | | | | | | 0.93% | | | | | |
The net expense ratio reflects a contractual advisory fee waiver agreement effective through September 30, 2023. Prior to November 29, 2016, the fee waiver was 1.25% of net assets for the Investor Class and 1.00% for the Institutional Class, and, prior to February 1, 2014, the fee waiver was 1.40% for the Investor Class and 1.15% for the Institutional Class.
Top ten companies (% of net assets)
| | | | | | | | | | | | | | | | |
| 1. | | Deutsche Boerse AG | | 8.1 | | | 6. | | | Nintendo Co., Ltd. | | 5.3 | | | | |
| 2. | | Roche Holding AG | | 8.1 | | | 7. | | | Michelin (CGDE) | | 4.6 | | | | |
| 3. | | GlaxoSmithKline plc | | 6.2 | | | 8. | | | Endesa SA | | 4.4 | | | | |
| 4. | | Philip Morris Intl, Inc. | | 5.9 | | | 9. | | | Snam SpA | | 4.3 | | | | |
| 5. | | Koninklijke Ahold Delhaize NV | | 5.4 | | | 10. | | | Baidu, Inc. | | 3.7 | | | | |
For the purposes of determining the Fund’s top ten, securities of the same issuer are aggregated and, if held as depositary receipts, it is not so specified. This list excludes ETFs if held.
Top ten country weightings (% of net assets)
| | | | | | | | | | |
| | | |
Japan | | | 14.82 | | | United States | | | 6.80 | |
| | | |
Germany | | | 12.85 | | | Netherlands | | | 5.37 | |
| | | |
United Kingdom | | | 10.52 | | | Italy | | | 4.95 | |
| | | |
Switzerland | | | 9.44 | | | Spain | | | 4.93 | |
| | | |
France | | | 8.25 | | | China | | | 4.14 | |
16 SLOW AND STEADY WINS THE RACE
| | |
| |
Ariel Global Fund performance summary | | INCEPTION: 12/30/11 |
|
| | |
Rupal J. Bhansali
Portfolio manager
Composition of equity holdings (%)
| | | | |
| | | Ariel Global Fund | | MSCI
ACWI
Index |
Health Care | | 25.86 | | 11.86 |
Information Technology | | 17.04 | | 22.37 |
Financials | | 13.65 | | 14.59 |
Communication Services | | 12.46 | | 8.13 |
Consumer Staples | | 9.96 | | 6.89 |
Consumer Discretionary | | 8.18 | | 11.68 |
Utilities | | 4.89 | | 2.87 |
Real Estate | | 2.51 | | 2.72 |
Industrials | | 1.16 | | 9.52 |
Materials | | 0.00 | | �� 5.04 |
Energy | | 0.00 | | 4.33 |
Sector weightings for the Fund are calculated based on equity holdings as a percentage of total net assets. The sectors above are the Global Industry Classification Standard (“GICS”) sector classifications.
Average annual total returns (%) as of 3/31/2022
| | | | | | | | | | | | | | | | | | | | | | | | |
| | | Quarter | | | 1-year | | | 3-year | | | 5-year | | | 10-year | | | Since
inception | |
| | | | | | |
Ariel Global Fund–Investor Class | | | 0.11 | | | | 7.87 | | | | 8.53 | | | | 7.45 | | | | 8.00 | | | | 8.33 | |
| | | | | | |
Ariel Global Fund–Institutional Class | | | 0.11 | | | | 8.07 | | | | 8.79 | | | | 7.70 | | | | 8.27 | | | | 8.60 | |
MSCI ACWI Index (net) | | | -5.36 | | | | 7.28 | | | | 13.75 | | | | 11.64 | | | | 10.00 | | | | 10.95 | |
MSCI ACWI Value Index (net) | | | -0.95 | | | | 8.83 | | | | 9.02 | | | | 7.46 | | | | 7.64 | | | | 8.50 | |
Performance data quoted represents past performance and does not guarantee future results. All performance assumes the reinvestment of dividends and capital gains. The investment return and principal value of an investment will fluctuate so that an investor’s shares, when redeemed, may be worth more or less than their original cost. Current performance may be lower or higher than the performance data quoted. Any extraordinary performance shown for short-term periods may not be sustainable and is not representative of the performance over longer periods. To access performance data current to the most recent month-end, visit arielinvestments.com.
Growth of a $10,000 investment since inception (Investor Class)
The graph and performance table do not reflect the deduction of taxes that a shareholder would pay on fund distributions or the redemption of fund shares.
| | | | | | | | | | | | |
| Expense ratio (as of 9/30/21) | | Net | | | Gross | | | | |
Investor Class | | | 1.13 | % | | | 1.36% | | | | | |
Institutional Class | | | 0.88 | % | | | 0.95% | | | | | |
The net expense ratio reflects a contractual advisory fee waiver agreement effective through September 30, 2023. Prior to November 29, 2016, the fee waiver was 1.25% of net assets for the Investor Class and 1.00% for the Institutional Class, and, prior to February 1, 2014, the fee waiver was 1.40% for the Investor Class and 1.15% for the Institutional Class.
| | | | | | | | | | | | |
| Top ten companies (% of net assets) |
| | | | | | |
| 1. | | Microsoft Corp. | | 10.2 | | | | 6. | | Gilead Sciences, Inc. | | 5.0 |
| 2. | | Roche Holding AG | | 7.3 | | | | 7. | | Credicorp Ltd. | | 4.4 |
| 3. | | GlaxoSmithKline plc | | 6.1 | | | | 8. | | Johnson & Johnson | | 3.9 |
| 4. | | Philip Morris Intl, Inc. | | 5.6 | | | | 9. | | Endesa SA | | 3.3 |
| 5. | | Baidu, Inc. | | 5.3 | | | | 10. | | Deutsche Boerse AG | | 3.2 |
For the purposes of determining the Fund’s top ten, securities of the same issuer are aggregated and, if held as depositary receipts, it is not so specified. This list excludes ETFs if held.
| | | | | | | | | | |
Top ten country weightings (% of net assets) | | | | |
| | | |
United States | | | 36.29 | | | France | | | 5.12 | |
| | | |
Switzerland | | | 8.26 | | | Brazil | | | 4.51 | |
| | | |
United Kingdom | | | 7.94 | | | Peru | | | 4.35 | |
| | | |
China | | | 6.91 | | | Germany | | | 4.02 | |
| | | |
Japan | | | 6.73 | | | Spain | | | 3.33 | |
ARIELINVESTMENTS.COM 17

| | | | |
 | |  | | John P. Miller, CFA® Senior Vice President Portfolio Manager |
One of the largest casino entertainment companies in the country, Boyd Gaming (NYSE: BYD) has served customers since 1975. Boyd owns and operates 28 gaming properties in 10 states across the U.S. In Nevada, the company is a market leader outside of the Las Vegas Strip, with 11 properties serving residents in the broader metropolitan area. Boyd prides itself on its proprietary approach to exceptional customer service and guest experience, which the company has coined: “Boyd Style.”
Ariel initiated a position in Boyd Gaming in December 2021. We believe the company is a solid operator with attractive fundamentals in a growing industry. It is rebounding from the pandemic with momentum, posting record operating results that have exceeded estimates. Additionally, Boyd’s successful expense-reduction initiatives have led to high margins, strong free cash flow and efficient debt reduction.
STRATEGIC FOOTPRINT
We view the Las Vegas Valley region as one of the most attractive global entertainment markets for investors. Boyd’s targeted marketing campaigns reach tourists from Hawaii, who account for more than half of the company’s reservations. Additionally, its Midwest and South properties include 17 land-based and dockside riverboat casinos across nine states. Despite high competition and regulatory uncertainty, these geographies continue to drive impressive results for Boyd.
ATTRACTIVE BALANCE SHEET
Ariel applauds the Boyd management team for its enhanced focus on: improving operating profitability; creating strong recurring cash flow; and implementing effective cost-reduction programs. The company’s financial leverage has declined significantly from pre-pandemic levels, following an effective effort to strengthen its balance sheet and capital structure. While its net debt surged during the
pandemic to 7.3x operating cash flow in 2020, Boyd ended 2021 with leverage at less than 2.2x. The company’s debt was recently upgraded by one of the major rating agencies. Boyd’s enhanced profit outlook, solid free cash flow and improved financial leverage metrics have enabled its leadership to aggressively repurchase shares under a new program and to reinstate its quarterly dividend to an amount more than double its pre-pandemic level.
SEASONED MANAGEMENT TEAM
The company’s leaders bring extensive industry experience and a long history of collaboration. Bill Boyd, Co-Executive Chair of the Board, co-founded Boyd Gaming with his father, the legendary casino developer, Sam Boyd. The Boyd family owns 26% of the company. Keith Smith, President and Chief Executive Officer, and Steve Thompson, Executive Vice President of Operations for the Nevada region, joined the business over three decades ago. Ted Bogich, Executive Vice President of Operations, will be celebrating his 30th anniversary in two years. Ariel’s investment team has built a relationship with Boyd’s Chief Financial Officer, Josh Hirsberg, since his previous role as Treasurer of Caesars Entertainment over 15 years ago. Hirsberg and his colleagues exhibit a passion for the business, and are transparent and aligned with Boyd shareholders.
At its current price, we see Boyd as a compelling investment. Gaming—especially from slot play at casinos—is a more consistent source of long-term profitability, compared to food, beverage and hotel rooms. We believe the gaming segment will continue to be a significant portion of Boyd’s future revenues. Additionally, we believe that Boyd’s strategic partnerships (e.g., a 5% equity ownership in sports betting and online casino company, FanDuel Group) will provide more upside to the company’s valuation.
As of March 31, 2022, shares traded at $65.78, a 24% discount to our private market value of $87.
18 SLOW AND STEADY WINS THE RACE
| | | | |
 | |  | | Aaron Diaz Bianco, JD/CFA® Research Analyst |
Masco Corporation (NYSE: MAS) is a leading global designer, manufacturer and distributor of home improvement and building products. For nearly a century, Masco has offered a robust family of brands from its Livonia, Michigan headquarters. Despite rising interest rates and fears of a housing slowdown, Masco is well-positioned to leverage several tailwinds for long-term growth. These include: the company’s recent divestitures; strong brand recognition; and demographic trends driving increased consumer interest.
MARKET LEADERSHIP ACROSS MULTIPLE SALES CHANNELS
Masco’s portfolio of brands includes: Behr®, Delta®, Hansgrohe®, AXOR® and KILZ®. The company’s scale and product mix across design, manufacturing, and distribution make it the ideal provider for two segments. Masco’s global presence and variety of services meet the needs of large retailers. Its luxury brands serve customers in the specialty channel. This unique combination has fostered strong organic growth. For example, Masco’s strategic partnership with Home Depot has created significant income from the professional painter audience—starting with immaterial revenues in 2010 to over $700 million in 2021.
REFINED BRAND PORTFOLIO IS A COMPETITIVE ADVANTAGE
Rising interest rates have recently battered Masco’s shares, and the long shadow of the 2008-2009 financial crisis still challenges many companies with exposure to the housing market. However, Masco has made strategic changes to its portfolio, making it more resilient.
Masco recently sold its business lines that suffered most during the downturn. This enabled the company to focus on the brands that outperformed during the crisis. Its recently divested businesses—high-priced cabinetry, windows and specialty product lines—experienced a 68% peak-to-trough decline in sales in 2008-2009. This caused the businesses’ total operating margins to drop from the
mid-teens to -35%. Comparatively, Masco’s plumbing and decorative product brands—which comprise the current portfolio post-divestiture—saw a peak-to-trough revenue decline of -15% during the recession. While operating margins briefly fell from the low-teens to the high single-digits, they remained positive for these segments during this time period.
DEMOGRAPHIC SHIFTS FUEL GROWTH OPPORTUNITY
The pivotal demographic transition impending in the U.S. is a key growth driver. The Baby Boomer generation (born 1946-1964) can be expected to increase home improvement spending—whether they age-in-place, downsize or relocate. Generation X (born 1965-1980) are expected to upgrade their homes as their families grow. The “millennial” generation (born 1981-1996) is as large as the Baby Boomer population and can be expected to drive demand for new homes. On their heels is the largest cohort in U.S. history: Generation Z (born 1997-2012).
These shifts are occurring while housing is experiencing substantial wear-and-tear due to under-building during the 2010s. In the last decade, single-family home construction per million U.S. inhabitants slowed to half the rate of the prior five decades. This presents revenue opportunity for Masco’s brands.
Investor fears of a housing slowdown and under-appreciation for Masco’s recent business transformation have created a discount to our estimate of the company’s intrinsic value. In our view, shareholders who understand the company’s refined product portfolio will ultimately benefit from a category leader with scale, pricing power, relatively low capital requirements and a prudent capital allocation strategy. Masco should experience modest margin improvements through cost productivity and volume leverage. We believe Masco’s management team should have ample free cash flow to allocate in the future.
As of March 31, 2022, shares traded at $51.00, a 30% discount to our private market value of $72.87.
ARIELINVESTMENTS.COM 19
| | | | |
 | |  | | Jamil Soriano Vice President, Research |
Founded in 1937 and based in Mayfield, Ohio, Progressive Corporation (NYSE: PGR) is one of the largest property and casualty automobile insurers in the United States. While Progressive is best known as a leader in personal car and truck coverage, the company also holds a strong position in the commercial auto market. Recently, Progressive acquired American Strategic Insurance Corporation, marking its first expansion into homeowners’ insurance. The company now offers a bundled home and automobile solution, distributing policies through digital direct-to-consumer channels and a vast network of over 30,000 independent agents. This updated model is difficult to replicate and strengthens Progressive’s competitive position.
BRAND MATTERS
Progressive stands out against peers due to its size, brand recognition, scale and underwriting expertise. Its sizable marketing budget keeps the company ahead of smaller players in a crowded direct-to-consumer market. Avid television watchers are likely familiar with “Flo,” Progressive’s comedic fictional saleswoman and advertising fixture for over a decade. The company also leverages superior data analytics to fuel sales and marketing innovation. For example, Progressive was the first insurer to use telematics – a method of monitoring automobiles using GPS technology to more accurately price policies and target customers. Since then, the company has developed industry-leading capabilities in collecting and analyzing this data. Progressive’s peers that lag in this area are more likely to experience underwriting losses. The company’s approach to data, combined with its strong brand identity provide distinct competitive advantages. For Progressive, these factors have yielded best-in-class results – both in losses to premiums earned and in return on equity.
POLICY RATE CHANGES TO OFFSET HEADWINDS
The company performed well in the early months of the COVID-19 pandemic. During widespread lockdowns, there were fewer drivers on the road. This meant less car accidents and insurance claims. These trends drove solid profitability and share price performance for Progressive. In the past year, drivers have returned to the roads, resulting in more accidents and claims. Strained global supply chains and inflation have made it more expensive to repair damaged vehicles, increasing payouts to customers. Progressive and other insurers have applied to state regulators for an increase to their policy rates to combat these margin headwinds. Although pricing changes may take time to materialize, the proposed increases should offset inflationary pressures on the industry and the company’s profitability should rebound in the long-term.
PRICING POWER REMAINS
Despite recent challenges, Ariel’s positive outlook on Progressive remains unchanged. The market agrees and the stock has outperformed, which is attributable to the company’s proactive pricing changes in a rising policy rate environment. Progressive’s larger scale and superior customer acquisition resources enable quicker pricing actions and ultimately faster shareholder returns than its peers. The company’s margins have already begun to stabilize over the last several months, indicating that its new rate strategy has succeeded. Progressive is prepared to navigate the moment. Insurance is a non-discretionary purchase for all vehicle and home owners, no matter what challenges the market may bring.
As of March 31, 2022, shares trade at $114, which is closing in on our estimated private market value of $116.23.
20 SLOW AND STEADY WINS THE RACE
| | |
Schedules of investments | | 03/31/22 (UNAUDITED) |
|
| | |
Ariel Fund | | |
| | | | | | | | |
| Number of Shares | | | | Common Stocks—96.34% | | Value |
| | | |
| | | | Consumer Discretionary—35.78% | | | | |
| | | |
2,311,606 | | | | Madison Square Garden Entertainment Corp.(a) | | | $192,579,896 | |
| | | |
3,952,668 | | | | Paramount Global | | | 149,450,377 | |
| | | |
4,063,521 | | | | Adtalem Global Education, Inc.(a)(b) | | | 120,727,209 | |
| | | |
5,233,168 | | | | Mattel, Inc.(a) | | | 116,228,661 | |
| | | |
3,309,681 | | | | Gentex Corp. | | | 96,543,395 | |
| | | |
511,197 | | | | Madison Square Garden Sports Corp.(a) | | | 91,688,294 | |
| | | |
1,385,115 | | | | Boyd Gaming Corp. | | | 91,112,865 | |
| | | |
2,519,813 | | | | Interpublic Group of Cos., Inc. | | | 89,327,371 | |
| | | |
5,839,506 | | | | Manchester United plc | | | 84,497,652 | |
| | | |
699,919 | | | | Royal Caribbean Cruises Ltd.(a) | | | 58,639,214 | |
| | | |
1,775,040 | | | | Nielsen Holdings plc | | | 48,352,090 | |
| | | | | | | | |
| | | | | | | 1,139,147,024 | |
| | | | | | | | |
| | | |
| | | | Consumer Staples—2.91% | | | | |
| | | |
684,955 | | | | J.M. Smucker Co. | | | 92,749,756 | |
| | | | | | | | |
| | | |
| | | | Energy—2.91% | | | | |
| | | |
2,926,476 | | | | Core Laboratories NV(b) | | | 92,564,436 | |
| | | | | | | | |
| | | |
| | | | Financials—19.36% | | | | |
| | | |
3,541,554 | | | | Lazard Ltd., Class A | | | 122,183,613 | |
| | | |
901,127 | | | | Northern Trust Corp. | | | 104,936,239 | |
| | | |
918,854 | | | | BOK Financial Corp. | | | 86,326,333 | |
| | | |
1,239,905 | | | | First American Financial Corp. | | | 80,370,642 | |
| | | |
568,624 | | | | Affiliated Managers Group, Inc. | | | 80,147,553 | |
| | | |
1,299,885 | | | | KKR & Co., Inc. | | | 76,004,276 | |
| | | |
1,903,797 | | | | Janus Henderson Group plc | | | 66,670,971 | |
| | | | | | | | |
| | | | | | | 616,639,627 | |
| | | | | | | | |
| | | |
| | | | Health Care—6.58% | | | | |
| | | |
1,910,485 | | | | Envista Holdings Corp.(a) | | | 93,059,724 | |
| | | |
285,500 | | | | Laboratory Corp. of America Holdings(a) | | | 75,274,930 | |
| | | |
75,945 | | | | Charles River Laboratories Intl, Inc.(a) | | | 21,566,102 | |
| | | |
34,781 | | | | Bio-Rad Laboratories, Inc.(a) | | | 19,589,703 | |
| | | | | | | | |
| | | | | | | 209,490,459 | |
| | | | | | | | |
| | | |
| | | | Industrials—20.72% | | | | |
| | | |
835,901 | | | | Mohawk Industries, Inc.(a) | | | 103,818,904 | |
| | | |
3,799,809 | | | | Resideo Technologies, Inc.(a) | | | 90,549,448 | |
| | | |
3,431,959 | | | | Axalta Coating Systems, Ltd.(a) | | | 84,357,552 | |
| | | |
10,325,388 | | | | ADT, Inc. | | | 78,369,695 | |
| | | |
2,738,532 | | | | Kennametal, Inc. | | | 78,349,400 | |
| | | |
365,463 | | | | Snap-on, Inc. | | | 75,095,337 | |
| | | |
1,322,197 | | | | Masco Corp. | | | 67,432,047 | |
| | | |
175,675 | | | | Keysight Technologies, Inc.(a) | | | 27,751,380 | |
| | | |
252,747 | | | | Simpson Manufacturing Co., Inc. | | | 27,559,533 | |
| | | |
63,674 | | | | Zebra Technologies Corp.(a) | | | 26,341,934 | |
| | | | | | | | |
| | | | | | | 659,625,230 | |
| | | | | | | | |
| | | |
| | | | Real Estate—5.28% | | | | |
| | | |
446,702 | | | | JLL(a) | | | 106,967,261 | |
| | | |
668,303 | | | | CBRE Group, Inc., Class A(a) | | | 61,163,091 | |
| | | | | | | | |
| | | | | | | 168,130,352 | |
| | | | | | | | |
| | | |
| | | | Utilities—2.80% | | | | |
| | | |
1,516,457 | | | | Stericycle, Inc.(a) | | | 89,349,646 | |
| | | | | | | | |
| | | | Total Common Stocks (Cost $2,147,018,608) | | | 3,067,696,530 | |
| | | | | | | | |
The accompanying notes are an integral part of the financial statements.
ARIELINVESTMENTS.COM 21
| | |
Schedules of investments | | 03/31/22 (UNAUDITED) |
|
Ariel Fund (continued) | | |
| | | | | | | | |
| Number of Shares | | | | Short-Term Investments—3.93% | | Value |
| | | |
124,988,177 | | | | Northern Institutional Treasury Portfolio, 0.12%(c) | | | $124,988,177 | |
| | | | | | | | |
| | | | Total Short-Term Investments (Cost $124,988,177) | | | 124,988,177 | |
| | | | | | | | |
| | | |
| | | | Total Investments—100.27% (Cost $2,272,006,785) | | | 3,192,684,707 | |
| | | |
| | | | Other Assets less Liabilities—(0.27)% | | | (8,616,922 | ) |
| | | | | | | | |
| | | |
| | | | Net Assets—100.00% | | | $3,184,067,785 | |
| | | | | | | | |
| | | | | | | | |
Ariel Appreciation Fund | | | | |
| | | | |
| Number of Shares | | | | Common Stocks—96.35% | | Value |
| | | |
| | | | Consumer Discretionary—27.10% | | | | |
| | | |
715,155 | | | | Madison Square Garden Entertainment Corp.(a) | | | $59,579,563 | |
| | | |
2,315,037 | | | | Mattel, Inc.(a) | | | 51,416,972 | |
| | | |
906,814 | | | | BorgWarner, Inc. | | | 35,275,065 | |
| | | |
343,584 | | | | Omnicom Group, Inc. | | | 29,163,410 | |
| | | |
743,024 | | | | Interpublic Group of Cos., Inc. | | | 26,340,201 | |
| | | |
1,811,883 | | | | Manchester United plc | | | 26,217,947 | |
| | | |
256,257 | | | | CarMax, Inc.(a) | | | 24,723,675 | |
| | | |
132,057 | | | | Madison Square Garden Sports Corp.(a) | | | 23,685,744 | |
| | | |
804,883 | | | | Gentex Corp. | | | 23,478,437 | |
| | | |
947,465 | | | | Knowles Corp.(a) | | | 20,398,921 | |
| | | |
727,902 | | | | Nielsen Holdings plc | | | 19,828,050 | |
| | | |
49,044 | | | | Vail Resorts, Inc. | | | 12,764,682 | |
| | | | | | | | |
| | | | | | | 352,872,667 | |
| | | | | | | | |
| | | |
| | | | Consumer Staples—6.70% | | | | |
| | | |
887,361 | | | | Walgreens Boots Alliance, Inc. | | | 39,727,152 | |
| | | |
477,400 | | | | Molson Coors Brewing Co. | | | 25,483,612 | |
| | | |
162,594 | | | | J.M. Smucker Co. | | | 22,016,854 | |
| | | | | | | | |
| | | | | | | 87,227,618 | |
| | | | | | | | |
| | | |
| | | | Energy—2.83% | | | | |
| | | |
962,354 | | | | Core Laboratories NV | | | 30,439,257 | |
| | | |
328,310 | | | | NOV, Inc. | | | 6,438,159 | |
| | | | | | | | |
| | | | | | | 36,877,416 | |
| | | | | | | | |
| | | |
| | | | Financials—28.68% | | | | |
| | | |
575,538 | | | | BOK Financial Corp. | | | 54,071,795 | |
| | | |
456,897 | | | | Northern Trust Corp. | | | 53,205,656 | |
| | | |
760,273 | | | | Aflac, Inc. | | | 48,953,978 | |
| | | |
140,566 | | | | Goldman Sachs Group, Inc. | | | 46,400,837 | |
| | | |
507,925 | | | | The Charles Schwab Corp. | | | 42,823,157 | |
| | | |
1,080,836 | | | | Lazard Ltd., Class A | | | 37,288,842 | |
| | | |
537,273 | | | | KKR & Co., Inc. | | | 31,414,352 | |
| | | |
430,811 | | | | First American Financial Corp. | | | 27,925,169 | |
| | | |
222,055 | | | | Progressive Corp. | | | 25,312,049 | |
| | | |
67,724 | | | | Houlihan Lokey, Inc. | | | 5,946,167 | |
| | | | | | | | |
| | | | | | | 373,342,002 | |
| | | | | | | | |
The accompanying notes are an integral part of the financial statements.
22 SLOW AND STEADY WINS THE RACE
| | |
Schedules of investments | | 03/31/22 (UNAUDITED) |
|
| | |
Ariel Appreciation Fund (continued) | | |
| | | | | | | | |
| Number of Shares | | | | Common Stocks—96.35% | | Value |
| | | |
| | | | Health Care—11.05% | | | | |
| | | |
156,257 | | | | Laboratory Corp. of America Holdings(a) | | | $41,198,721 | |
| | | |
587,431 | | | | Cardinal Health, Inc. | | | 33,307,338 | |
| | | |
222,872 | | | | Zimmer Biomet Holdings, Inc. | | | 28,505,329 | |
| | | |
523,957 | | | | Envista Holdings Corp.(a) | | | 25,521,945 | |
| | | |
54,016 | | | | Charles River Laboratories Intl, Inc.(a) | | | 15,338,923 | |
| | | | | | | | |
| | | | | | | 143,872,256 | |
| | | | | | | | |
| | | |
| | | | Industrials—15.46% | | | | |
| | | |
1,272,700 | | | | Kennametal, Inc. | | | 36,411,947 | |
| | | |
246,540 | | | | Stanley Black & Decker, Inc. | | | 34,463,827 | |
| | | |
1,386,131 | | | | Axalta Coating Systems, Ltd.(a) | | | 34,071,100 | |
| | | |
826,130 | | | | nVent Electric plc | | | 28,732,801 | |
| | | |
114,822 | | | | Snap-on, Inc. | | | 23,593,625 | |
| | | |
77,882 | | | | Littelfuse, Inc. | | | 19,424,550 | |
| | | |
93,631 | | | | Keysight Technologies, Inc.(a) | | | 14,790,889 | |
| | | |
1,286,119 | | | | ADT, Inc. | | | 9,761,643 | |
| | | | | | | | |
| | | | | | | 201,250,382 | |
| | | | | | | | |
| | | |
| | | | Real Estate—1.78% | | | | |
| | | |
252,645 | | | | CBRE Group, Inc., Class A(a) | | | 23,122,070 | |
| | | | | | | | |
| | | |
| | | | Utilities—2.75% | | | | |
| | | |
608,600 | | | | Stericycle, Inc.(a) | | | 35,858,712 | |
| | | | | | | | |
| | | | Total Common Stocks (Cost $802,152,303) | | | 1,254,423,123 | |
| | | | | | | | |
| | | | | | | | |
| Number of Shares | | | | Short-Term Investments—2.92% | | Value |
| | | |
38,030,532 | | | | Northern Institutional Treasury Portfolio, 0.12%(c) | | | $38,030,532 | |
| | | | | | | | |
| | | | Total Short-Term Investments (Cost $38,030,532) | | | 38,030,532 | |
| | | | | | | | |
| | | |
| | | | Total Investments—99.27% (Cost $840,182,835) | | | 1,292,453,655 | |
| | | |
| | | | Other Assets less Liabilities—0.73% | | | 9,558,414 | |
| | | | | | | | |
| | | |
| | | | Net Assets—100.00% | | | $1,302,012,069 | |
| | | | | | | | |
| | | | |
Ariel Focus Fund | | | | |
| | | | | | | | |
| Number of Shares | | | | Common Stocks—96.26% | | Value |
| | | |
| | | | Basic Materials—10.82% | | | | |
| | | |
76,126 | | | | Mosaic Co. | | | $5,062,379 | |
| | | |
119,404 | | | | Barrick Gold Corp. | | | 2,928,980 | |
| | | | | | | | |
| | | | | | | 7,991,359 | |
| | | | | | | | |
| | | |
| | | | Consumer Discretionary—15.83% | | | | |
| | | |
90,177 | | | | BorgWarner, Inc. | | | 3,507,885 | |
| | | |
37,109 | | | | Madison Square Garden Entertainment Corp.(a) | | | 3,091,551 | |
| | | |
54,473 | | | | Nielsen Holdings plc | | | 1,483,844 | |
| | | |
7,216 | | | | Madison Square Garden Sports Corp.(a) | | | 1,294,262 | |
| | | |
18,565 | | | | Boyd Gaming Corp. | | | 1,221,206 | |
| | | |
28,762 | | | | Paramount Global | | | 1,087,491 | |
| | | | | | | | |
| | | | | | | 11,686,239 | |
| | | | | | | | |
| | | |
| | | | Consumer Staples—2.51% | | | | |
| | | |
13,686 | | | | J.M. Smucker Co. | | | 1,853,221 | |
| | | | | | | | |
The accompanying notes are an integral part of the financial statements.
ARIELINVESTMENTS.COM 23
| | |
Schedules of investments | | 03/31/22 (UNAUDITED) |
|
| | |
Ariel Focus Fund (continued) | | |
| | | | | | | | |
| Number of Shares | | | | Common Stocks—96.26% | | Value |
| | | |
| | | | Energy—7.56% | | | | |
| | | |
135,092 | | | | APA Corp. | | | $5,583,352 | |
| | | | | | | | |
| | | |
| | | | Financials—21.66% | | | | |
| | | |
34,004 | | | | BOK Financial Corp. | | | 3,194,676 | |
| | | |
9,376 | | | | Goldman Sachs Group, Inc. | | | 3,095,018 | |
| | | |
22,332 | | | | Northern Trust Corp. | | | 2,600,561 | |
| | | |
63,960 | | | | Lazard Ltd., Class A | | | 2,206,620 | |
| | | |
40,643 | | | | Bank of New York Mellon Corp. | | | 2,017,112 | |
| | | |
26,654 | | | | First American Financial Corp. | | | 1,727,712 | |
| | | |
19,732 | | | | KKR & Co., Inc. | | | 1,153,730 | |
| | | | | | | | |
| | | | | | | 15,995,429 | |
| | | | | | | | |
| | | |
| | | | Health Care—14.37% | | | | |
| | | |
10,111 | | | | Laboratory Corp. of America Holdings(a) | | | 2,665,866 | |
| | | |
13,891 | | | | Johnson & Johnson | | | 2,461,902 | |
| | | |
83,249 | | | | Zimvie, Inc.(a) | | | 1,901,407 | |
| | | |
14,154 | | | | Zimmer Biomet Holdings, Inc. | | | 1,810,297 | |
| | | |
96,625 | | | | Hanger, Inc.(a) | | | 1,771,136 | |
| | | | | | | | |
| | | | | | | 10,610,608 | |
| | | | | | | | |
| | | |
| | | | Industrials—20.01% | | | | |
| | | |
7,019 | | | | Lockheed Martin Corp. | | | 3,098,187 | |
| | | |
13,891 | | | | Snap-on, Inc. | | | 2,854,323 | |
| | | |
113,198 | | | | Resideo Technologies, Inc.(a) | | | 2,697,508 | |
| | | |
140,431 | | | | Western Union Co. | | | 2,631,677 | |
| | | |
18,758 | | | | Mohawk Industries, Inc.(a) | | | 2,329,744 | |
| | | |
8,344 | | | | Stanley Black & Decker, Inc. | | | 1,166,408 | |
| | | | | | | | |
| | | | | | | 14,777,847 | |
| | | | | | | | |
| | | |
| | | | Technology—3.50% | | | | |
| | | |
31,219 | | | | Oracle Corp. | | | 2,582,748 | |
| | | | | | | | |
| | | | Total Common Stocks (Cost $49,376,535) | | | 71,080,803 | |
| | | | | | | | |
| | | | | | | | |
| Number of Shares | | | | Short-Term Investments—4.76% | | Value |
| | | |
3,515,389 | | | | Northern Institutional Treasury Portfolio, 0.12%(c) | | | $3,515,389 | |
| | | | | | | | |
| | | | Total Short-Term Investments (Cost $3,515,389) | | | 3,515,389 | |
| | | | | | | | |
| | | |
| | | | Total Investments—101.02% (Cost $52,891,924) | | | 74,596,192 | |
| | | |
| | | | Other Assets less Liabilities—(1.02)% | | | (751,374 | ) |
| | | | | | | | |
| | | |
| | | | Net Assets—100.00% | | | $73,844,818 | |
| | | | | | | | |
| | | | | | | | |
Ariel International Fund | | | | |
| | | | |
| Number of Shares | | | | Common Stocks—92.32% | | Value |
| | | |
| | | | Belgium—0.36% | | | | |
| | | |
37,429 | | | | KBC Group NV | | | $2,685,502 | |
| | | | | | | | |
| | | |
| | | | Brazil—2.18% | | | | |
| | | |
780,942 | | | | Telefonica Brasil SA ADR | | | 8,785,598 | |
| | | |
836,511 | | | | BB Seguridade Participacoes SA ADR | | | 4,458,604 | |
| | | |
215,005 | | | | TIM SA of Brazil ADR | | | 3,117,572 | |
| | | | | | | | |
| | | | | | | 16,361,774 | |
| | | | | | | | |
The accompanying notes are an integral part of the financial statements.
24 SLOW AND STEADY WINS THE RACE
| | |
Schedules of investments | | 03/31/22 (UNAUDITED) |
|
| | |
Ariel International Fund (continued) | | |
| | | | | | | | |
| Number of Shares | | | | Common Stocks—92.32% | | Value |
| | | |
| | | | Canada—0.34% | | | | |
| | | |
265,126 | | | | Element Fleet Management Corp. | | | $2,566,112 | |
| | | | | | | | |
| | | |
| | | | China—4.14% | | | | |
| | | |
209,095 | | | | Baidu, Inc. ADR(a) | | | 27,663,269 | |
| | | |
75,862 | | | | Trip.com Group Ltd. ADR(a) | | | 1,753,929 | |
| | | |
1,130,353 | | | | TravelSky Technology Ltd. | | | 1,621,541 | |
| | | | | | | | |
| | | | | | | 31,038,739 | |
| | | | | | | | |
| | | |
| | | | Denmark—0.94% | | | | |
| | | |
274,285 | | | | H Lundbeck A/S | | | 6,319,810 | |
| | | |
6,785 | | | | Novo Nordisk A/S | | | 752,566 | |
| | | | | | | | |
| | | | | | | 7,072,376 | |
| | | | | | | | |
| | | |
| | | | Finland—2.24% | | | | |
| | | |
2,530,165 | | | | Nokia Corp.(a) | | | 13,933,674 | |
| | | |
516,740 | | | | Nokia Corp. ADR(a) | | | 2,821,400 | |
| | | | | | | | |
| | | | | | | 16,755,074 | |
| | | | | | | | |
| | | |
| | | | France—8.25% | | | | |
| | | |
256,046 | | | | Michelin (CGDE) | | | 34,698,224 | |
| | | |
167,221 | | | | BNP Paribas SA | | | 9,555,789 | |
| | | |
79,450 | | | | Sanofi | | | 8,122,940 | |
| | | |
54,318 | | | | Thales SA | | | 6,802,549 | |
| | | |
14,569 | | | | Safran SA | | | 1,715,289 | |
| | | |
18,525 | | | | Societe BIC SA | | | 935,941 | |
| | | | | | | | |
| | | | | | | 61,830,732 | |
| | | | | | | | |
| | | |
| | | | Germany—12.85% | | | | |
| | | |
337,667 | | | | Deutsche Boerse AG | | | 60,783,732 | |
| | | |
9,940,659 | | | | Telefonica Deutschland Holding | | | 27,036,565 | |
| | | |
25,335 | | | | Muenchener Rueckversicherungs-Gesellschaft AG | | | 6,773,052 | |
| | | |
24,921 | | | | Fresenius Medical Care AG & Co. KGaA | | | 1,669,977 | |
| | | | | | | | |
| | | | | | | 96,263,326 | |
| | | | | | | | |
| | | |
| | | | Hong Kong—1.26% | | | | |
| | | |
969,000 | | | | CLP Holdings Ltd. | | | 9,428,270 | |
| | | | | | | | |
| | | |
| | | | Italy—4.95% | | | | |
| | | |
5,552,969 | | | | Snam SpA | | | 32,021,484 | |
| | | |
785,424 | | | | Italgas SpA | | | 5,038,859 | |
| | | | | | | | |
| | | | | | | 37,060,343 | |
| | | | | | | | |
| | | |
| | | | Japan—14.82% | | | | |
| | | |
78,800 | | | | Nintendo Co., Ltd. | | | 39,775,250 | |
| | | |
664,500 | | | | Bridgestone Corp. | | | 25,793,088 | |
| | | |
1,559,400 | | | | Subaru Corp. | | | 24,767,939 | |
| | | |
148,000 | | | | Secom Co., Ltd. | | | 10,706,604 | |
| | | |
204,700 | | | | Japan Tobacco, Inc. | | | 3,495,781 | |
| | | |
102,100 | | | | Sankyo Co., Ltd. | | | 2,831,452 | |
| | | |
69,100 | | | | Ono Pharmaceutical Co., Ltd. | | | 1,732,019 | |
| | | |
39,900 | | | | Mabuchi Motor Co., Ltd. | | | 1,242,086 | |
| | | |
6,700 | | | | Daito Trust Construction Co., Ltd. | | | 711,168 | |
| | | | | | | | |
| | | | | | | 111,055,387 | |
| | | | | | | | |
| | | |
| | | | Luxembourg—0.34% | | | | |
| | | |
45,195 | | | | RTL Group | | | 2,505,769 | |
| | | | | | | | |
| | | |
| | | | Netherlands—5.37% | | | | |
| | | |
1,250,306 | | | | Koninklijke Ahold Delhaize NV | | | 40,216,737 | |
| | | | | | | | |
The accompanying notes are an integral part of the financial statements.
ARIELINVESTMENTS.COM 25
| | |
Schedules of investments | | 03/31/22 (UNAUDITED) |
|
| | |
Ariel International Fund (continued) | | |
| | | | | | | | |
| Number of Shares | | | | Common Stocks—92.32% | | Value |
| | | |
| | | | Peru—2.34% | | | | |
| | | |
102,037 | | | | Credicorp Ltd. | | | $17,537,099 | |
| | | | | | | | |
| | | |
| | | | Portugal—0.11% | | | | |
| | | |
33,192 | | | | Jeronimo Martins SGPS SA | | | 796,274 | |
| | | | | | | | |
| | | |
| | | | Singapore—0.14% | | | | |
| | | |
141,300 | | | | Singapore Exchange Ltd. | | | 1,035,510 | |
| | | | | | | | |
| | | |
| | | | Spain—4.93% | | | | |
| | | |
1,520,891 | | | | Endesa SA | | | 33,160,957 | |
| | | |
446,708 | | | | Tecnicas Reunidas SA(a) | | | 3,805,447 | |
| | | | | | | | |
| | | | | | | 36,966,404 | |
| | | | | | | | |
| | | |
| | | | Switzerland—9.44% | | | | |
| | | |
152,792 | | | | Roche Holding AG | | | 60,453,967 | |
| | | |
82,054 | | | | Novartis AG | | | 7,203,648 | |
| | | |
23,346 | | | | Nestle SA | | | 3,035,416 | |
| | | |
517 | | | | Novartis AG ADR | | | 45,367 | |
| | | | | | | | |
| | | | | | | 70,738,398 | |
| | | | | | | | |
| | | |
| | | | United Kingdom—10.52% | | | | |
| | | |
2,157,793 | | | | GlaxoSmithKline plc | | | 46,688,072 | |
| | | |
6,287,185 | | | | Direct Line Insurance Group plc | | | 22,655,073 | |
| | | |
2,837,917 | | | | Vodafone Group plc | | | 4,653,577 | |
| | | |
155,403 | | | | Close Brothers Group plc | | | 2,419,002 | |
| | | |
15,386 | | | | Reckitt Benckiser Group plc | | | 1,173,736 | |
| | | |
37,042 | | | | St. James’s Place plc | | | 698,368 | |
| | | |
7,815 | | | | AstraZeneca plc ADR | | | 518,447 | |
| | | | | | | | |
| | | | | | | 78,806,275 | |
| | | | | | | | |
| | | |
| | | | United States—6.80% | | | | |
| | | |
466,874 | | | | Philip Morris Intl, Inc. | | | 43,858,144 | |
| | | |
51,474 | | | | Check Point Software Technologies Ltd.(a) | | | 7,116,795 | |
| | | | | | | | |
| | | | | | | 50,974,939 | |
| | | | | | | | |
| | | | Total Common Stocks (Cost $580,286,475) | | | 691,695,040 | |
| | | | | | | | |
| | | | | | | | |
| Number of Shares | | | | Short-Term Investments—3.65% | | Value |
| | | |
27,352,573 | | | | Northern Institutional Treasury Portfolio, 0.12%(c) | | | $27,352,573 | |
| | | | | | | | |
| | | | Total Short-Term Investments (Cost $27,352,573) | | | 27,352,573 | |
| | | | | | | | |
| | | |
| | | | Total Investments—95.97% (Cost $607,639,048) | | | 719,047,613 | |
| | | |
| | | | Cash, Foreign Currency, Other Assets less Liabilities—4.03% | | | 30,212,506 | |
| | | | | | | | |
| | | |
| | | | Net Assets—100.00% | | | $749,260,119 | |
| | | | | | | | |
The accompanying notes are an integral part of the financial statements.
26 SLOW AND STEADY WINS THE RACE
| | |
Schedules of investments | | 03/31/22 (UNAUDITED) |
|
| | |
Ariel International Fund (continued) | | |
Open Forward Currency Contracts as of March 31, 2022
| | | | | | | | | | | | | | | | | | | | | | | | |
| | | | | | |
Contract Settlement Date | | Counterparty | | | Currency to
be Received | | | Amount to be
Received | | | Currency to
be Delivered | | | Amount to
be Delivered | | | Unrealized
Appreciation
(Depreciation) |
Open Forward Currency Contracts with Unrealized Appreciation | | | | | | | | | | | | | |
| | | | | | |
10/06/2022 | | | UBS AG | | | | USD | | | | 19,620,450 | | | | CNY | | | | 124,926,346 | | | | $44,851 | |
| | | | | | |
10/06/2022 | | | UBS AG | | | | AUD | | | | 12,324,336 | | | | EUR | | | | 8,291,143 | | | | 36,151 | |
| | | | | | |
10/06/2022 | | | UBS AG | | | | NOK | | | | 10,057,756 | | | | EUR | | | | 1,021,694 | | | | 8,485 | |
| | | | | | |
10/06/2022 | | | UBS AG | | | | SEK | | | | 23,912,392 | | | | EUR | | | | 2,217,036 | | | | 88,490 | |
| | | | | | |
10/06/2022 | | | UBS AG | | | | AUD | | | | 49,833,157 | | | | USD | | | | 36,717,070 | | | | 619,421 | |
| | | | | | |
10/06/2022 | | | UBS AG | | | | NOK | | | | 27,142,161 | | | | USD | | | | 3,019,205 | | | | 62,307 | |
| | | | | | |
10/06/2022 | | | UBS AG | | | | SEK | | | | 114,116,891 | | | | USD | | | | 11,586,224 | | | | 573,160 | |
| | | | | | |
10/06/2022 | | | UBS AG | | | | SGD | | | | 2,741,186 | | | | USD | | | | 2,015,000 | | | | 7,456 | |
| | | | | | | | | | | | | | | | | | | | | | | | |
| | | | | | |
Subtotal UBS AG | | | | | | | | | | | | | | | | | | | | | | | 1,440,321 | |
| | | | | | | | | | | | | | | | | | | | | | | | |
| | | | | | |
10/06/2022 | | | Northern Trust | | | | SEK | | | | 50,558,768 | | | | USD | | | | 5,140,437 | | | | 246,701 | |
| | | | | | |
10/06/2022 | | | Northern Trust | | | | SGD | | | | 7,619,488 | | | | USD | | | | 5,599,518 | | | | 22,165 | |
| | | | | | | | | | | | | | | | | | | | | | | | |
| | | | | | |
Subtotal Northern Trust | | | | | | | | | | | | | | | | | | | | | | | 268,866 | |
| | | | | | | | | | | | | | | | | | | | | | | | |
| | | | | | |
10/06/2022 | | | JPMorgan Chase | | | | USD | | | | 1,036,951 | | | | CNY | | | | 6,604,063 | | | | 2,114 | |
| | | | | | | | | | | | | | | | | | | | | | | | |
| | | | | | |
Subtotal JPMorgan Chase | | | | | | | | | | | | | | | | | | | | | | | 2,114 | |
| | | | | | | | | | | | | | | | | | | | | | | | |
| | |
Subtotal - Open Forward Currency Contracts with Unrealized Appreciation | | | | | | | | $1,711,301 | |
| | | | | | | | | | | | | | | | | | | | | | | | |
| | | |
Open Forward Currency Contracts with Unrealized Depreciation | | | | | | | | | | | | | |
| | | | | | |
10/06/2022 | | | UBS AG | | | | GBP | | | | 22,391,858 | | | | USD | | | | 29,585,309 | | | | (178,730) | |
| | | | | | | | | | | | | | | | | | | | | | | | |
| | | | | | |
Subtotal UBS AG | | | | | | | | | | | | | | | | | | | | | | | (178,730) | |
| | | | | | | | | | | | | | | | | | | | | | | | |
| | | | | | |
10/06/2022 | | | JPMorgan Chase | | | | USD | | | | 1,451,820 | | | | CAD | | | | 1,853,592 | | | | (30,607) | |
| | | | | | |
10/06/2022 | | | JPMorgan Chase | | | | JPY | | | | 1,203,274,659 | | | | CNY | | | | 66,915,731 | | | | (582,611) | |
| | | | | | |
10/06/2022 | | | JPMorgan Chase | | | | SGD | | | | 1,618,866 | | | | EUR | | | | 1,085,288 | | | | (9,538) | |
| | | | | | |
10/06/2022 | | | JPMorgan Chase | | | | USD | | | | 24,346,586 | | | | EUR | | | | 22,223,386 | | | | (306,474) | |
| | | | | | |
10/06/2022 | | | JPMorgan Chase | | | | GBP | | | | 1,666,251 | | | | USD | | | | 2,202,560 | | | | (14,321) | |
| | | | | | |
10/06/2022 | | | JPMorgan Chase | | | | JPY | | | | 3,616,093,901 | | | | USD | | | | 31,576,973 | | | | (1,816,698) | |
| | | | | | | | | | | | | | | | | | | | | | | | |
| | | | | | |
Subtotal JPMorgan Chase | | | | | | | | | | | | | | | | | | | | | | | (2,760,249) | |
| | | | | | | | | | | | | | | | | | | | | | | | |
| | |
Subtotal - Open Forward Currency Contracts with Unrealized Depreciation | | | | | | | | $(2,938,979) | |
| | | | | | | | | | | | | | | | | | | | | | | | |
| | | |
Net Unrealized Appreciation (Depreciation) on Forward Currency Contracts | | | | | | | | | | | | $(1,227,678) | |
| | | | | | | | | | | | | | | | | | | | | | | | |
The accompanying notes are an integral part of the financial statements.
ARIELINVESTMENTS.COM 27
| | |
Schedules of investments | | 03/31/22 (UNAUDITED) |
|
| | |
Ariel Global Fund | | |
| | | | | | |
Number of Shares | | Common Stocks—95.71% | | Value |
| | |
| | Belgium—0.09% | | | | |
| | |
2,323 | | KBC Group NV | | | $166,674 | |
| | | | | | |
| | |
| | Brazil—4.51% | | | | |
| | |
730,288 | | BB Seguridade Participacoes SA | | | 3,920,598 | |
| | |
201,362 | | Telefonica Brasil SA | | | 2,270,744 | |
| | |
628,090 | | TIM SA of Brazil | | | 1,819,212 | |
| | | | | | |
| | | | | 8,010,554 | |
| | | | | | |
| | |
| | Canada—0.05% | | | | |
| | |
9,038 | | Element Fleet Management Corp. | | | 87,477 | |
| | | | | | |
| | |
| | Chile—0.27% | | | | |
| | |
20,915 | | Banco Santander-Chile ADR | | | 472,470 | |
| | | | | | |
| | |
| | China—6.91% | | | | |
| | |
70,794 | | Baidu, Inc. ADR(a) | | | 9,366,046 | |
| | |
86,008 | | Trip.com Group Ltd. ADR(a) | | | 1,988,505 | |
| | |
630,831 | | TravelSky Technology Ltd. | | | 904,955 | |
| | | | | | |
| | | | | 12,259,506 | |
| | | | | | |
| | |
| | Denmark—0.25% | | | | |
| | |
19,542 | | H Lundbeck A/S | | | 450,268 | |
| | | | | | |
| | |
| | Finland—1.65% | | | | |
| | |
531,188 | | Nokia Corp.(a) | | | 2,925,264 | |
| | | | | | |
| | |
| | France—5.12% | | | | |
| | |
41,901 | | Michelin (CGDE) | | | 5,678,239 | |
| | |
13,846 | | Sanofi | | | 1,415,610 | |
| | |
23,883 | | BNP Paribas SA | | | 1,364,786 | |
| | |
3,191 | | Safran SA | | | 375,694 | |
| | |
1,986 | | Thales SA | | | 248,718 | |
| | | | | | |
| | | | | 9,083,047 | |
| | | | | | |
| | |
| | Germany—4.02% | | | | |
| | |
31,720 | | Deutsche Boerse AG | | | 5,709,945 | |
| | |
306,912 | | Telefonica Deutschland Holding | | | 834,738 | |
| | |
2,211 | | Muenchener Rueckversicherungs-Gesellschaft AG | | | 591,088 | |
| | | | | | |
| | | | | 7,135,771 | |
| | | | | | |
| | |
| | Hong Kong—0.51% | | | | |
93,000 | | CLP Holdings Ltd. | | | 904,880 | |
| | | | | | |
| | |
| | Italy—1.05% | | | | |
| | |
323,326 | | Snam SpA | | | 1,864,476 | |
| | | | | | |
| | |
| | Japan—6.73% | | | | |
| | |
8,550 | | Nintendo Co., Ltd. | | | 4,315,716 | |
| | |
78,400 | | Bridgestone Corp. | | | 3,043,157 | |
| | |
183,100 | | Subaru Corp. | | | 2,908,176 | |
| | |
19,700 | | Secom Co., Ltd. | | | 1,425,136 | |
| | |
14,500 | | Japan Tobacco, Inc. | | | 247,625 | |
| | | | | | |
| | | | | 11,939,810 | |
| | | | | | |
| | |
| | Mexico—0.37% | | | | |
| | |
160,350 | | Wal-Mart de Mexico SAB de CV | | | 660,426 | |
| | | | | | |
| | |
| | Netherlands—0.58% | | | | |
| | |
31,853 | | Koninklijke Ahold Delhaize NV | | | 1,024,568 | |
| | | | | | |
| | |
| | Peru—4.35% | | | | |
| | |
44,920 | | Credicorp Ltd. | | | 7,720,400 | |
| | | | | | |
The accompanying notes are an integral part of the financial statements.
28 SLOW AND STEADY WINS THE RACE
| | |
Schedules of investments | | 03/31/22 (UNAUDITED) |
|
| | |
Ariel Global Fund (continued) | | |
| | | | | | |
| Number of Shares | | Common Stocks—95.71% | | Value |
| | |
| | South Africa—0.47% | | | | |
170,421 | | Sanlam Ltd. | | | $838,988 | |
| | | | | | |
| | |
| | South Korea—2.52% | | | | |
| | |
67,130 | | KT&G Corp. | | | 4,466,163 | |
| | | | | | |
| | |
| | Spain—3.33% | | | | |
| | |
271,342 | | Endesa SA | | | 5,916,243 | |
| | | | | | |
| | |
| | Switzerland—8.26% | | | | |
| | |
32,606 | | Roche Holding AG | | | 12,900,951 | |
| | |
8,119 | | Nestle SA | | | 1,055,622 | |
| | |
7,997 | | Novartis AG | | | 702,069 | |
| | | | | | |
| | | | | 14,658,642 | |
| | | | | | |
| | |
| | Taiwan—0.44% | | | | |
| | |
157,000 | | Catcher Technology Co., Ltd. | | | 787,644 | |
| | | | | | |
| | |
| | United Kingdom—7.94% | | | | |
| | |
501,078 | | GlaxoSmithKline plc | | | 10,841,803 | |
| | |
534,478 | | Direct Line Insurance Group plc | | | 1,925,924 | |
| | |
313,480 | | Vodafone Group plc | | | 514,040 | |
| | |
20,970 | | Vodafone Group plc ADR | | | 348,521 | |
| | |
3,714 | | Reckitt Benckiser Group plc | | | 283,326 | |
| | |
11,068 | | Close Brothers Group plc | | | 172,284 | |
| | | | | | |
| | |
| | | | | 14,085,898 | |
| | | | | | |
| | |
| | United States—36.29% | | | | |
| | |
58,732 | | Microsoft Corp. | | | 18,107,663 | |
| | |
105,760 | | Philip Morris Intl, Inc. | | | 9,935,094 | |
| | |
150,305 | | Gilead Sciences, Inc. | | | 8,935,632 | |
| | |
39,252 | | Johnson & Johnson | | | 6,956,632 | |
| | |
157,792 | | Equity Commonwealth(a) | | | 4,451,312 | |
| | |
48,956 | | Amdocs Ltd. | | | 4,024,673 | |
| | |
50,498 | | Bristol-Myers Squibb Co. | | | 3,687,869 | |
| | |
51,897 | | Verizon Communications, Inc. | | | 2,643,633 | |
| | |
28,059 | | NetApp, Inc. | | | 2,328,897 | |
| | |
8,405 | | Check Point Software Technologies Ltd.(a) | | | 1,162,075 | |
| | |
24,350 | | Tapestry, Inc. | | | 904,603 | |
| | |
12,702 | | U.S. Bancorp | | | 675,111 | |
| | |
1,646 | | Berkshire Hathaway, Inc., Class B(a) | | | 580,890 | |
| | | | | | |
| | |
| | | | | 64,394,084 | |
| | | | | | |
| | |
| | Total Common Stocks (Cost $132,919,637) | | | 169,853,253 | |
| | | | | | |
| | | | | | |
| Number of Shares | | Short-Term Investments—1.10% | | Value |
| | |
1,959,290 | | Northern Institutional Treasury Portfolio, 0.12%(c) | | | $1,959,290 | |
| | | | | | |
| | |
| | Total Short-Term Investments (Cost $1,959,290) | | | 1,959,290 | |
| | | | | | |
| | |
| | Total Investments—96.81% (Cost $134,878,927) | | | 171,812,543 | |
| | |
| | Cash, Foreign Currency, Other Assets less Liabilities—3.19% | | | 5,656,485 | |
| | | | | | |
| | |
| | Net Assets—100.00% | | | $177,469,028 | |
| | | | | | |
The accompanying notes are an integral part of the financial statements.
ARIELINVESTMENTS.COM 29
| | |
Schedules of investments | | 03/31/22 (UNAUDITED) |
|
| | |
Ariel Global Fund (continued) | | |
Open Forward Currency Contracts as of March 31, 2022
| | | | | | | | | | | | | | | | | | | | | | | | |
| | | | | | |
Contract Settlement Date | | Counterparty | | | Currency to
be Received | | | Amount to
be Received | | | Currency to
be Delivered | | | Amount to
be Delivered | | | Unrealized
Appreciation
(Depreciation) |
Open Forward Currency Contracts with Unrealized Appreciation | | | | | | | | | | | | | |
| | | | | | |
06/10/2022 | | | UBS | | | | USD | | | | 542,067 | | | | CHF | | | | 495,720 | | | | $3,931 | |
| | | | | | |
06/10/2022 | | | UBS | | | | AUD | | | | 1,553,569 | | | | EUR | | | | 1,043,745 | | | | 6,123 | |
| | | | | | |
06/10/2022 | | | UBS | | | | CAD | | | | 1,064,165 | | | | EUR | | | | 761,334 | | | | 6,505 | |
| | | | | | |
06/10/2022 | | | UBS | | | | NOK | | | | 1,826,915 | | | | EUR | | | | 185,583 | | | | 1,541 | |
| | | | | | |
06/10/2022 | | | UBS | | | | USD | | | | 681,798 | | | | GBP | | | | 516,024 | | | | 4,119 | |
| | | | | | |
06/10/2022 | | | UBS | | | | USD | | | | 424,583 | | | | GBP | | | | 321,420 | | | | 2,471 | |
| | | | | | |
06/10/2022 | | | UBS | | | | SGD | | | | 742,095 | | | | USD | | | | 545,361 | | | | 2,159 | |
| | | | | | | | | | | | | | | | | | | | | | | | |
| | | | | | |
Subtotal UBS | | | | | | | | | | | | | | | | | | | | | | | 26,849 | |
| | | | | | | | | | | | | | | | | | | | | | | | |
| | | | | | |
06/10/2022 | | | Northern Trust | | | | USD | | | | 1,315,334 | | | | CHF | | | | 1,203,156 | | | | 9,230 | |
| | | | | | |
06/10/2022 | | | Northern Trust | | | | USD | | | | 3,283,723 | | | | CNH | | | | 20,907,956 | | | | 7,506 | |
| | | | | | |
06/10/2022 | | | Northern Trust | | | | SEK | | | | 2,403,675 | | | | GBP | | | | 185,007 | | | | 13,152 | |
| | | | | | |
06/10/2022 | | | Northern Trust | | | | CAD | | | | 485,764 | | | | USD | | | | 380,597 | | | | 7,897 | |
| | | | | | | | | | | | | | | | | | | | | | | | |
| | | | | | |
Subtotal Northern Trust | | | | | | | | | | | | | | | | | | | | | | | 37,785 | |
| | | | | | | | | | | | | | | | | | | | | | | | |
| | | | | | |
06/10/2022 | | | JPMorgan Chase | | | | AUD | | | | 1,159,567 | | | | CHF | | | | 780,754 | | | | 21,223 | |
| | | | | | |
06/10/2022 | | | JPMorgan Chase | | | | AUD | | | | 869,851 | | | | CHF | | | | 586,082 | | | | 15,488 | |
| | | | | | |
06/10/2022 | | | JPMorgan Chase | | | | CAD | | | | 4,237,739 | | | | CHF | | | | 3,037,408 | | | | 91,865 | |
| | | | | | |
06/10/2022 | | | JPMorgan Chase | | | | USD | | | | 4,472,530 | | | | CHF | | | | 4,094,113 | | | | 28,102 | |
| | | | | | |
06/10/2022 | | | JPMorgan Chase | | | | USD | | | | 6,663,447 | | | | GBP | | | | 5,040,940 | | | | 43,326 | |
| | | | | | |
06/10/2022 | | | JPMorgan Chase | | | | USD | | | | 3,401,690 | | | | JPY | | | | 389,550,694 | | | | 195,707 | |
| | | | | | | | | | | | | | | | | | | | | | | | |
| | | | | | |
Subtotal JPMorgan Chase | | | | | | | | | | | | | | | | | | | | | | | 395,711 | |
| | | | | | | | | | | | | | | | | | | | | | | | |
| | |
Subtotal - Open Forward Currency Contracts with Unrealized Appreciation | | | | | | | | $460,345 | |
| | | | | | | | | | | | | | | | | | | | | | | | |
| | | |
Open Forward Currency Contracts with Unrealized Depreciation | | | | | | | | | | | | | |
| | | | | | |
06/10/2022 | | | JPMorgan Chase | | | | USD | | | | 13,102,142 | | | | EUR | | | | 11,959,540 | | | | (164,929) | |
| | | | | | | | | | | | | | | | | | | | | | | | |
| | | | | | |
Subtotal JPMorgan Chase | | | | | | | | | | | | | | | | | | | | | | | (164,929) | |
| | | | | | | | | | | | | | | | | | | | | | | | |
| | |
Subtotal - Open Forward Currency Contracts with Unrealized Depreciation | | | | | | | | $(164,929) | |
| | | | | | | | | | | | | | | | | | | | | | | | |
| | | |
Net Unrealized Appreciation (Depreciation) on Forward Currency Contracts | | | | | | | | | | | | $295,416 | |
| | | | | | | | | | | | | | | | | | | | | | | | |
(a)Non-income producing.
(b)Affiliated company (See Note Seven, Transactions with Affiliated Companies).
(c)The rate presented is the 7-day current yield as of March 31, 2022.
ADR American Depositary Receipt
A category may contain multiple industries as defined by the Global Industry Classification Standards.
The accompanying notes are an integral part of the financial statements.
30 SLOW AND STEADY WINS THE RACE
| | | | |
Statements of assets & liabilities | | | 03/31/22 | (UNAUDITED) |
| |
| | | | | | | | | | | | |
| | | Ariel Fund | | Ariel Appreciation Fund | | Ariel Focus Fund |
Assets | | | | | | | | | | | | |
| | | |
Investments in Unaffiliated Issuers, at Value
(cost $1,964,306,490, $802,152,303 and $49,376,535, respectively) | | | $2,854,404,885 | | | | $1,254,423,123 | | | | $71,080,803 | |
| | | |
Investments in Affiliated Issuers, at Value (cost $182,712,118) | | | 213,291,645 | (a) | | | — | | | | — | |
| | | |
Short-Term Investments, at Value (cost $124,988,177, $38,030,532 and $3,515,389, respectively) | | | 124,988,177 | | | | 38,030,532 | | | | 3,515,389 | |
| | | |
Dividends and Interest Receivable | | | 2,468,054 | | | | 1,041,495 | | | | 22,740 | |
| | | |
Receivable for Fund Shares Sold | | | 5,038,568 | | | | 290,792 | | | | 9,412 | |
| | | |
Receivable for Securities Sold | | | — | | | | 8,908,880 | | | | — | |
| | | |
Prepaid and Other Assets | | | 55,693 | | | | 29,566 | | | | 17,922 | |
| | | | | | | | | | | | |
Total Assets | | | 3,200,247,022 | | | | 1,302,724,388 | | | | 74,646,266 | |
| | | | | | | | | | | | |
| | | |
Liabilities | | | | | | | | | | | | |
| | | |
Payable for Securities Purchased | | | 13,506,002 | | | | — | | | | 752,987 | |
| | | |
Payable for Fund Shares Redeemed | | | 1,923,346 | | | | 255,936 | | | | 7,012 | |
| | | |
Other Liabilities | | | 749,889 | | | | 456,383 | | | | 41,449 | |
| | | | | | | | | | | | |
| | | |
Total Liabilities | | | 16,179,237 | | | | 712,319 | | | | 801,448 | |
| | | | | | | | | | | | |
Net Assets | | | $3,184,067,785 | | | | $1,302,012,069 | | | | $73,844,818 | |
| | | | | | | | | | | | |
| | | |
Net Assets Consist of | | | | | | | | | | | | |
| | | |
Paid-in Capital | | | $2,117,795,954 | | | | $783,310,335 | | | | $50,907,976 | |
| | | |
Distributable Earnings | | | 1,066,271,831 | | | | 518,701,734 | | | | 22,936,842 | |
| | | | | | | | | | | | |
Net Assets | | | $3,184,067,785 | | | | $1,302,012,069 | | | | $73,844,818 | |
| | | | | | | | | | | | |
| | | |
Investor Class Shares | | | | | | | | | | | | |
| | | |
Net Assets | | | $1,548,152,576 | | | | $1,052,658,732 | | | | $54,320,711 | |
| | | |
Shares Outstanding (no par value, unlimited authorized) | | | 19,530,662 | | | | 23,119,228 | | | | 3,099,119 | |
| | | |
Net Asset Value, Offering and Redemption Price per Share | | | $79.27 | | | | $45.53 | | | | $17.53 | |
| | | |
Institutional Class Shares | | | | | | | | | | | | |
| | | |
Net Assets | | | $1,635,915,209 | | | | $249,353,337 | | | | $19,524,107 | |
| | | |
Shares Outstanding (no par value, unlimited authorized) | | | 20,608,636 | | | | 5,462,909 | | | | 1,112,585 | |
| | | |
Net Asset Value, Offering and Redemption Price per Share | | | $79.38 | | | | $45.64 | | | | $17.55 | |
(a)See Note Seven, Transactions with Affiliated Companies, for information on affiliated issuers.
The accompanying notes are an integral part of the financial statements.
ARIELINVESTMENTS.COM 31
| | | | |
Statements of assets & liabilities | | | 03/31/22 | (UNAUDITED) |
| |
| | | | | | | | | | | | |
| | | |
| | | Ariel International Fund | | | | | | Ariel Global Fund | |
Assets | | | | | | | | | | | | |
| | | |
Investments in Unaffiliated Issuers, at Value (cost $580,286,475 and $132,919,637, respectively) | | | $691,695,040 | | | | | | | | $169,853,253 | |
| | | |
Short-Term Investments, at Value (cost $27,352,573 and $1,959,290, respectively) | | | 27,352,573 | | | | | | | | 1,959,290 | |
| | | |
Foreign Currencies (cost $27,167,160 and $4,682,080, respectively) | | | 26,633,292 | | | | | | | | 4,653,187 | |
| | | |
Dividends and Interest Receivable | | | 2,746,915 | | | | | | | | 755,390 | |
| | | |
Receivable for Dividend Reclaims | | | 2,565,992 | | | | | | | | 302,244 | |
| | | |
Receivable for Fund Shares Sold | | | 85,836 | | | | | | | | 1,195 | |
| | | |
Receivable for Securities and Foreign Currencies Sold | | | 11,875 | | | | | | | | 239,928 | |
| | | |
Unrealized Appreciation on Forward Currency Contracts | | | 1,711,301 | | | | | | | | 460,345 | |
| | | |
Prepaid and Other Assets | | | 28,545 | | | | | | | | 18,955 | |
| | | | | | | | | | | | |
Total Assets | | | 752,831,369 | | | | | | | | 178,243,787 | |
| | | | | | | | | | | | |
| | | |
Liabilities | | | | | | | | | | | | |
| | | |
Payable for Securities and Foreign Currencies Purchased | | | 357,108 | | | | | | | | 157,924 | |
| | | |
Payable for Fund Shares Redeemed | | | 130,037 | | | | | | | | 400,912 | |
| | | |
Unrealized Depreciation on Forward Currency Contracts | | | 2,938,979 | | | | | | | | 164,929 | |
| | | |
Other Liabilities | | | 145,126 | | | | | | | | 50,994 | |
| | | | | | | | | | | | |
| | | |
Total Liabilities | | | 3,571,250 | | | | | | | | 774,759 | |
| | | | | | | | | | | | |
Net Assets | | | $749,260,119 | | | | | | | | $177,469,028 | |
| | | | | | | | | | | | |
| | | |
Net Assets Consist of | | | | | | | | | | | | |
| | | |
Paid-in Capital | | | $699,010,124 | | | | | | | | $140,978,781 | |
| | | |
Distributable Earnings | | | 50,249,995 | | | | | | | | 36,490,247 | |
| | | | | | | | | | | | |
Net Assets | | | $749,260,119 | | | | | | | | $177,469,028 | |
| | | | | | | | | | | | |
| | | |
Investor Class Shares | | | | | | | | | | | | |
| | | |
Net Assets | | | $22,889,800 | | | | | | | | $12,112,930 | |
| | | |
Shares Outstanding (no par value, unlimited authorized) | | | 1,575,754 | | | | | | | | 662,344 | |
| | | |
Net Asset Value, Offering and Redemption Price per Share | | | $14.53 | | | | | | | | $18.29 | |
| | | |
Institutional Class Shares | | | | | | | | | | | | |
| | | |
Net Assets | | | $726,370,319 | | | | | | | | $165,356,098 | |
| | | |
Shares Outstanding (no par value, unlimited authorized) | | | 51,152,900 | | | | | | | | 9,345,088 | |
| | | |
Net Asset Value, Offering and Redemption Price per Share | | | $14.20 | | | | | | | | $17.69 | |
The accompanying notes are an integral part of the financial statements.
32 SLOW AND STEADY WINS THE RACE
| | |
Statements of operations | | SIX MONTHS ENDED 03/31/22 (UNAUDITED) |
|
| | | | | | | | | | | | |
| | | |
| | | Ariel Fund | | Ariel Appreciation Fund | | Ariel Focus Fund |
Investment Income | | | | | | | | | | | | |
Dividends | | | | | | | | | | | | |
Unaffiliated Issuers | | | $19,702,271 | (a) | | | $11,154,225 | (a) | | | $658,761 | |
Affiliated Issuers | | | 45,030 | (b) | | | — | | | | — | |
Interest | | | 8,019 | | | | 1,323 | | | | 121 | |
| | | | | | | | | | | | |
Total Investment Income | | | 19,755,320 | | | | 11,155,548 | | | | 658,882 | |
| | | | | | | | | | | | |
| | | |
Expenses | | | | | | | | | | | | |
Management Fees | | | 9,287,464 | | | | 4,823,932 | | | | 229,492 | |
Distribution Fees (Investor Class) | | | 2,126,211 | | | | 1,383,301 | | | | 65,143 | |
Shareholder Service Fees | | | | | | | | | | | | |
Investor Class | | | 870,151 | | | | 436,053 | | | | 11,963 | |
Institutional Class | | | 366,046 | | | | 44,865 | | | | 1,930 | |
Transfer Agent Fees and Expenses | | | | | | | | | | | | |
Investor Class | | | 127,013 | | | | 87,775 | | | | 6,751 | |
Institutional Class | | | 58,128 | | | | 13,244 | | | | 1,046 | |
Printing and Postage Expenses | | | | | | | | | | | | |
Investor Class | | | 141,675 | | | | 95,506 | | | | 5,595 | |
Institutional Class | | | 24,950 | | | | 9,762 | | | | 723 | |
Trustees’ Fees and Expenses | | | 198,430 | | | | 85,962 | | | | 4,127 | |
Professional Fees | | | 90,585 | | | | 48,417 | | | | 15,433 | |
Custody Fees and Expenses | | | 17,926 | | | | 8,442 | | | | 1,502 | |
Federal and State Registration Fees | | | 56,505 | | | | 23,065 | | | | 18,898 | |
Interest Expense | | | 1,018 | | | | — | | | | — | |
Miscellaneous Expenses | | | 149,489 | | | | 69,034 | | | | 9,281 | |
| | | | | | | | | | | | |
Total Expenses Before Reimbursements | | | 13,515,591 | | | | 7,129,358 | | | | 371,884 | |
Expense Reimbursements | | | — | | | | — | | | | (41,942) | |
| | | | | | | | | | | | |
Net Expenses | | | 13,515,591 | | | | 7,129,358 | | | | 329,942 | |
| | | | | | | | | | | | |
Net Investment Income | | | 6,239,729 | | | | 4,026,190 | | | | 328,940 | |
| | | | | | | | | | | | |
| | | |
Realized and Unrealized Gain (Loss) | | | | | | | | | | | | |
Net Realized Gain (Loss) on Investments | | | | | | | | | | | | |
Unaffiliated Issuers | | | 221,638,206 | | | | 87,304,708 | | | | 1,915,539 | |
Change in Net Unrealized Appreciation (Depreciation) on Investments | | | | | | | | | | | | |
Unaffiliated Issuers | | | (286,673,288) | | | | (58,716,894 | ) | | | 3,795,062 | |
Affiliated Issuers | | | (5,241,329) | (b) | | | — | | | | — | |
| | | | | | | | | | | | |
Net Gain (Loss) on Investments | | | (70,276,411) | | | | 28,587,814 | | | | 5,710,601 | |
| | | | | | | | | | | | |
Net Increase (Decrease) in Net Assets Resulting from Operations | | | $(64,036,682) | | | | $32,614,004 | | | | $6,039,541 | |
| | | | | | | | | | | | |
(a)Net of $6,755 and $1,626 in foreign taxes withheld, respectively.
(b)See Note Seven, Transactions with Affiliated Companies, for information on affiliated issuers.
The accompanying notes are an integral part of the financial statements.
ARIELINVESTMENTS.COM 33
| | | | |
Statements of operations | | | SIX MONTHS ENDED 03/31/22 | (UNAUDITED) |
| |
| | | | | | | | |
| | |
| | | Ariel International Fund | | | Ariel Global Fund | |
Investment Income | | | | | | | | |
Dividends | | | | | | | | |
Unaffiliated Issuers | | | $8,542,748(a) | | | | $2,369,269(a) | |
Interest | | | 2,524 | | | | 285 | |
| | | | | | | | |
Total Investment Income | | | 8,545,272 | | | | 2,369,554 | |
| | | | | | | | |
| | |
Expenses | | | | | | | | |
Management Fees | | | 3,151,483 | | | | 763,223 | |
Distribution Fees (Investor Class) | | | 30,694 | | | | 15,620 | |
Shareholder Service Fees | | | | | | | | |
Investor Class | | | 12,186 | | | | 5,124 | |
Institutional Class | | | 110,913 | | | | 6,557 | |
Transfer Agent Fees and Expenses | | | | | | | | |
Investor Class | | | 2,857 | | | | 2,256 | |
Institutional Class | | | 39,784 | | | | 7,327 | |
Printing and Postage Expenses | | | | | | | | |
Investor Class | | | 3,334 | | | | 2,321 | |
Institutional Class | | | 4,474 | | | | 1,006 | |
Trustees’ Fees and Expenses | | | 51,566 | | | | 12,200 | |
Professional Fees | | | 36,291 | | | | 21,745 | |
Custody Fees and Expenses | | | 160,729 | | | | 25,259 | |
Administration Fees | | | 29,240 | | | | 9,588 | |
Fund Accounting Fees | | | 16,149 | | | | 5,467 | |
Federal and State Registration Fees | | | 20,743 | | | | 17,776 | |
Interest Expense | | | — | | | | 136 | |
Miscellaneous Expenses | | | 43,013 | | | | 13,468 | |
| | | | | | | | |
Total Expenses Before Reimbursements | | | 3,713,456 | | | | 909,073 | |
Expense Reimbursements | | | (216,130) | | | | (53,908) | |
| | | | | | | | |
Net Expenses | | | 3,497,326 | | | | 855,165 | |
| | | | | | | | |
Net Investment Income | | | 5,047,946 | | | | 1,514,389 | |
| | | | | | | | |
| | |
Realized and Unrealized Gain (Loss) | | | | | | | | |
Net Realized Gain (Loss) on: | | | | | | | | |
Investments | | | (5,204,398) | | | | (980,264) | |
Translation of Assets and Liabilities in Foreign Currencies | | | (889,925) | | | | (2,827) | |
Forward Currency Contracts | | | (5,482,604) | | | | 1,485,539 | |
| | | | | | | | |
Total | | | (11,576,927) | | | | 502,448 | |
| | | | | | | | |
Change in Net Unrealized Appreciation (Depreciation) on: | | | | | | | | |
Investments | | | 19,725,813 | | | | 9,742,000 | |
Translation of Assets and Liabilities in Foreign Currencies | | | (185,893) | | | | (30,365) | |
Forward Currency Contracts | | | 1,625,868 | | | | (202,193) | |
| | | | | | | | |
Total | | | 21,165,788 | | | | 9,509,442 | |
| | | | | | | | |
Net Gain (Loss) on Investments | | | 9,588,861 | | | | 10,011,890 | |
| | | | | | | | |
Net Increase (Decrease) in Net Assets Resulting from Operations | | | $14,636,807 | | | | $11,526,279 | |
| | | | | | | | |
(a)Net of $849,119 and $179,076 in foreign taxes withheld, respectively.
The accompanying notes are an integral part of the financial statements.
34 SLOW AND STEADY WINS THE RACE
| | |
Statements of changes in net assets | | |
|
| | | | | | | | | | | | | | | | | | |
| | | Ariel Fund | | | | Ariel Appreciation Fund |
| | | Six Months Ended
March 31, 2022
(Unaudited) | | Year Ended
September 30, 2021 | | | | Six Months Ended
March 31, 2022
(Unaudited) | | Year Ended
September 30, 2021 |
Operations | | | | | | | | | | | | | | | | | | |
Net Investment Income (Loss) | | | $6,239,729 | | | | $7,025,467 | | | | | | $4,026,190 | | | | $7,956,690 | |
Net Realized Gain (Loss) on Investments | | | 221,638,206 | | | | 160,029,340 | | | | | | 87,304,708 | | | | 163,468,950 | |
Change in Net Unrealized Appreciation (Depreciation) on Investments | | | (291,914,617 | ) | | | 874,812,939 | | | | | | (58,716,894 | ) | | | 261,119,639 | |
| | | | | | | | | | | | | | | | | | |
Net Increase (Decrease) in Net Assets from Operations | | | (64,036,682 | ) | | | 1,041,867,746 | | | | | | 32,614,004 | | | | 432,545,279 | |
| | | | | | | | | | | | | | | | | | |
| | | | | |
Distributions to Shareholders | | | | | | | | | | | | | | | | | | |
Investor Class | | | (97,046,286 | ) | | | (64,581,986 | ) | | | | | (145,741,207 | ) | | | (84,552,421 | ) |
Institutional Class | | | (85,453,872 | ) | | | (39,817,967 | ) | | | | | (35,858,973 | ) | | | (22,647,630 | ) |
| | | | | | | | | | | | | | | | | | |
Total Distributions | | | (182,500,158 | ) | | | (104,399,953 | ) | | | | | (181,600,180 | ) | | | (107,200,051 | ) |
| | | | | | | | | | | | | | | | | | |
| | | | | |
Share Transactions | | | | | | | | | | | | | | | | | | |
Value of Shares Issued | | | | | | | | | | | | | | | | | | |
Investor Class | | | 98,476,264 | | | | 422,725,351 | | | | | | 24,847,325 | | | | 127,827,685 | |
Institutional Class | | | 602,094,544 | | | | 597,003,947 | | | | | | 29,731,579 | | | | 95,913,994 | |
Value of Shares Issued in Reinvestment of Dividends and Distributions | | | | | | | | | | | | | | | | | | |
Investor Class | | | 94,785,856 | | | | 63,007,966 | | | | | | 142,088,150 | | | | 82,432,501 | |
Institutional Class | | | 80,208,725 | | | | 38,667,730 | | | | | | 30,147,443 | | | | 21,745,195 | |
Value of Shares Redeemed | | | | | | | | | | | | | | | | | | |
Investor Class | | | (302,142,157 | ) | | | (284,138,775 | ) | | | | | (95,468,779 | ) | | | (142,583,661 | ) |
Institutional Class | | | (195,310,754 | ) | | | (314,748,184 | ) | | | | | (48,906,900 | ) | | | (115,534,957 | ) |
| | | | | | | | | | | | | | | | | | |
Net Increase (Decrease) in Net Assets from Share Transactions | | | 378,112,478 | | | | 522,518,035 | | | | | | 82,438,818 | | | | 69,800,757 | |
| | | | | | | | | | | | | | | | | | |
Total Increase (Decrease) in Net Assets | | | 131,575,638 | | | | 1,459,985,828 | | | | | | (66,547,358 | ) | | | 395,145,985 | |
| | | | | |
Net Assets | | | | | | | | | | | | | | | | | | |
Beginning of Period | | | 3,052,492,147 | | | | 1,592,506,319 | | | | | | 1,368,559,427 | | | | 973,413,442 | |
| | | | | | | | | | | | | | | | | | |
End of Period | | | $3,184,067,785 | | | | $3,052,492,147 | | | | | | $1,302,012,069 | | | | $1,368,559,427 | |
| | | | | | | | | | | | | | | | | | |
| | | | | |
Capital Share Transactions | | | | | | | | | | | | | | | | | | |
Investor Shares | | | | | | | | | | | | | | | | | | |
Shares Sold | | | 1,169,663 | | | | 5,247,995 | | | | | | 519,696 | | | | 2,519,360 | |
Shares Issued to Holders in Reinvestment of Dividends | | | 1,118,560 | | | | 1,024,148 | | | | | | 2,980,650 | | | | 2,028,460 | |
Shares Redeemed | | | (3,660,251 | ) | | | (3,676,478 | ) | | | | | (2,003,063 | ) | | | (2,983,856 | ) |
| | | | | | | | | | | | | | | | | | |
Net Increase (Decrease) | | | (1,372,028 | ) | | | 2,595,665 | | | | | | 1,497,283 | | | | 1,563,964 | |
| | | | | | | | | | | | | | | | | | |
Institutional Shares | | | | | | | | | | | | | | | | | | |
Shares Sold | | | 7,145,826 | | | | 7,435,305 | | | | | | 617,972 | | | | 1,996,054 | |
Shares Issued to Holders in Reinvestment of Dividends | | | 946,169 | | | | 624,851 | | | | | | 630,081 | | | | 532,800 | |
Shares Redeemed | | | (2,410,233 | ) | | | (4,075,453 | ) | | | | | (1,017,307 | ) | | | (2,340,171 | ) |
| | | | | | | | | | | | | | | | | | |
Net Increase (Decrease) | | | 5,681,762 | | | | 3,984,703 | | | | | | 230,746 | | | | 188,683 | |
| | | | | | | | | | | | | | | | | | |
The accompanying notes are an integral part of the financial statements.
ARIELINVESTMENTS.COM 35
| | |
Statements of changes in net assets | | |
|
| | | | | | | | |
| | | Ariel Focus Fund | |
| | | Six Months Ended
March 31, 2022
(Unaudited) | | | Year Ended
September 30, 2021 | |
Operations | | | | | | | | |
Net Investment Income (Loss) | | | $328,940 | | | | $606,624 | |
Net Realized Gain (Loss) on Investments | | | 1,915,539 | | | | 1,587,303 | |
Change in Net Unrealized Appreciation (Depreciation) on Investments | | | 3,795,062 | | | | 14,156,335 | |
| | | | | | | | |
Net Increase (Decrease) in Net Assets from Operations | | | 6,039,541 | | | | 16,350,262 | |
| | | | | | | | |
| | |
Distributions to Shareholders | | | | | | | | |
Investor Class | | | (1,693,729) | | | | (904,539) | |
Institutional Class | | | (625,242) | | | | (385,448) | |
| | | | | | | | |
Total Distributions | | | (2,318,971) | | | | (1,289,987) | |
| | | | | | | | |
| | |
Share Transactions | | | | | | | | |
Value of Shares Issued | | | | | | | | |
Investor Class | | | 8,389,633 | | | | 32,260,389 | |
Institutional Class | | | 497,115 | | | | 1,049,412 | |
Value of Shares Issued in Reinvestment of Dividends and Distributions | | | | | | | | |
Investor Class | | | 1,485,236 | | | | 774,921 | |
Institutional Class | | | 620,010 | | | | 382,043 | |
Value of Shares Redeemed | | | | | | | | |
Investor Class | | | (1,985,772) | | | | (31,467,695) | |
Institutional Class | | | (438,000) | | | | (1,087,605) | |
| | | | | | | | |
Net Increase (Decrease) in Net Assets from Share Transactions | | | 8,568,222 | | | | 1,911,465 | |
| | | | | | | | |
Total Increase (Decrease) in Net Assets | | | 12,288,792 | | | | 16,971,740 | |
| | |
Net Assets | | | | | | | | |
Beginning of Period | | | 61,556,026 | | | | 44,584,286 | |
| | | | | | | | |
End of Period | | | $73,844,818 | | | | $61,556,026 | |
| | | | | | | | |
| | |
Capital Share Transactions | | | | | | | | |
Investor Shares | | | | | | | | |
Shares Sold | | | 494,783 | | | | 1,805,096 | |
Shares Issued to Holders in Reinvestment of Dividends | | | 88,283 | | | | 57,611 | |
Shares Redeemed | | | (117,183) | | | | (1,854,405) | |
| | | | | | | | |
Net Increase (Decrease) | | | 465,883 | | | | 8,302 | |
| | | | | | | | |
Institutional Shares | | | | | | | | |
Shares Sold | | | 28,817 | | | | 63,570 | |
Shares Issued to Holders in Reinvestment of Dividends | | | 36,841 | | | | 28,339 | |
Shares Redeemed | | | (25,278) | | | | (68,083) | |
| | | | | | | | |
Net Increase (Decrease) | | | 40,380 | | | | 23,826 | |
| | | | | | | | |
The accompanying notes are an integral part of the financial statements.
36 SLOW AND STEADY WINS THE RACE
| | |
Statements of changes in net assets | | |
|
| | | | | | | | | | | | | | | | | | |
| | | Ariel International Fund | | | | | Ariel Global Fund | |
| | | Six Months Ended
March 31, 2022
(Unaudited) | | | Year Ended
September 30, 2021 | | | | | Six Months Ended
March 31, 2022
(Unaudited) | | | Year Ended
September 30, 2021 | |
Operations | | | | | | | | | | | | | | | | | | |
Net Investment Income (Loss) | | | $5,047,946 | | | | $21,706,821 | | | | | | $1,514,389 | | | | $3,088,085 | |
Net Realized Gain (Loss) on Investments, Foreign Currency Translations and Forward Currency Contracts | | | (11,576,927) | | | | (4,991,214) | | | | | | 502,448 | | | | 2,086,775 | |
Change in Net Unrealized Appreciation (Depreciation) on Investments, Foreign Currency Translations and Forward Currency Contracts | | | 21,165,788 | | | | 41,295,849 | | | | | | 9,509,442 | | | | 11,752,601 | |
| | | | | | | | | | | | | | | | | | |
Net Increase (Decrease) in Net Assets from Operations | | | 14,636,807 | | | | 58,011,456 | | | | | | 11,526,279 | | | | 16,927,461 | |
| | | | | | | | | | | | | | | | | | |
| | | | | |
Distributions to Shareholders | | | | | | | | | | | | | | | | | | |
Investor Class | | | (627,843) | | | | (325,333) | | | | | | (249,792) | | | | (102,891) | |
Institutional Class | | | (20,372,157) | | | | (11,974,667) | | | | | | (3,825,208) | | | | (1,247,109) | |
| | | | | | | | | | | | | | | | | | |
Total Distributions | | | (21,000,000) | | | | (12,300,000) | | | | | | (4,075,000) | | | | (1,350,000) | |
| | | | | | | | | | | | | | | | | | |
| | | | | |
Share Transactions | | | | | | | | | | | | | | | | | | |
Value of Shares Issued | | | | | | | | | | | | | | | | | | |
Investor Class | | | 2,709,203 | | | | 7,333,745 | | | | | | 710,005 | | | | 1,781,480 | |
Institutional Class | | | 56,582,723 | | | | 267,567,405 | | | | | | 529,692 | | | | 103,360,504 | |
Value of Shares Issued in Reinvestment of Dividends and Distributions | | | | | | | | | | | | | | | | | | |
Investor Class | | | 591,486 | | | | 301,565 | | | | | | 210,705 | | | | 87,285 | |
Institutional Class | | | 19,721,601 | | | | 11,521,695 | | | | | | 3,814,545 | | | | 1,242,779 | |
Value of Shares Redeemed | | | | | | | | | | | | | | | | | | |
Investor Class | | | (3,763,175) | | | | (7,388,772) | | | | | | (1,301,689) | | | | (2,231,345) | |
Institutional Class | | | (181,559,411) | | | | (85,353,399) | | | | | | (43,297,957) | | | | (16,428,111) | |
| | | | | | | | | | | | | | | | | | |
Net Increase (Decrease) in Net Assets from Share Transactions | | | (105,717,573) | | | | 193,982,239 | | | | | | (39,334,699) | | | | 87,812,592 | |
| | | | | | | | | | | | | | | | | | |
Total Increase (Decrease) in Net Assets | | | (112,080,766) | | | | 239,693,695 | | | | | | (31,883,420) | | | | 103,390,053 | |
| | | | | |
Net Assets | | | | | | | | | | | | | | | | | | |
Beginning of Period | | | 861,340,885 | | | | 621,647,190 | | | | | | 209,352,448 | | | | 105,962,395 | |
| | | | | | | | | | | | | | | | | | |
End of Period | | | $749,260,119 | | | | $861,340,885 | | | | | | $177,469,028 | | | | $209,352,448 | |
| | | | | | | | | | | | | | | | | | |
| | | | | |
Capital Share Transactions | | | | | | | | | | | | | | | | | | |
Investor Shares | | | | | | | | | | | | | | | | | | |
Shares Sold | | | 181,178 | | | | 498,033 | | | | | | 38,810 | | | | 104,448 | |
Shares Issued to Holders in Reinvestment of Dividends | | | 40,540 | | | | 21,162 | | | | | | 11,719 | | | | 5,339 | |
Shares Redeemed | | | (260,839) | | | | (503,624) | | | | | | (71,084) | | | | (125,736) | |
| | | | | | | | | | | | | | | | | | |
Net Increase (Decrease) | | | (39,121) | | | | 15,571 | | | | | | (20,555) | | | | (15,949) | |
| | | | | | | | | | | | | | | | | | |
| | | | | |
Institutional Shares | | | | | | | | | | | | | | | | | | |
Shares Sold | | | 3,936,188 | | | | 18,510,742 | | | | | | 30,349 | | | | 6,023,154 | |
Shares Issued to Holders in Reinvestment of Dividends | | | 1,383,972 | | | | 827,708 | | | | | | 219,479 | | | | 78,557 | |
Shares Redeemed | | | (12,406,617) | | | | (5,881,891) | | | | | | (2,438,912) | | | | (970,952) | |
| | | | | | | | | | | | | | | | | | |
Net Increase (Decrease) | | | (7,086,457) | | | | 13,456,559 | | | | | | (2,189,084) | | | | 5,130,759 | |
| | | | | | | | | | | | | | | | | | |
The accompanying notes are an integral part of the financial statements.
ARIELINVESTMENTS.COM 37
| | |
Financial highlights For a share outstanding throughout each period | | |
|
| | | | | | | | | | | | | | | | | | | | | | | | | | |
| | | | | | | Year Ended September 30 |
Ariel Fund (Investor Class) | | Six Months Ended
March 31, 2022
(Unaudited) | | | | 2021 | | 2020 | | 2019 | | 2018 | | 2017 |
Net Asset Value, Beginning of Period | | | $85.09 | | | | | | $54.40 | | | | $63.40 | | | | $74.58 | | | | $69.11 | | | | $63.74 | |
Income from Investment Operations | | | | | | | | | | | | | | | | | | | | | | | | | | |
Net Investment Income (Loss) | | | 0.16 | | | | | | (0.04 | ) | | | 0.50 | | | | 0.65 | | | | 0.57 | | | | 0.52 | |
Net Realized and Unrealized Gain (Loss) on Investments | | | (1.33 | ) | | | | | 34.33 | | | | (5.72 | ) | | | (6.10 | ) | | | 9.31 | | | | 9.07 | |
| | | | | | | | | | | | | | | | | | | | | | | | | | |
Total from Investment Operations | | | (1.17 | ) | | | | | 34.29 | | | | (5.22 | ) | | | (5.45 | ) | | | 9.88 | | | | 9.59 | |
| | | | | | | |
Distributions to Shareholders | | | | | | | | | | | | | | | | | | | | | | | | | | |
Dividends from Net Investment Income | | | (0.04 | ) | | | | | (0.20 | ) | | | (0.55 | ) | | | (0.59 | ) | | | (0.48 | ) | | | (0.18 | ) |
Distributions from Capital Gains | | | (4.61 | ) | | | | | (3.40 | ) | | | (3.23 | ) | | | (5.14 | ) | | | (3.93 | ) | | | (4.04 | ) |
| | | | | | | | | | | | | | | | | | | | | | | | | | |
Total Distributions | | | (4.65 | ) | | | | | (3.60 | ) | | | (3.78 | ) | | | (5.73 | ) | | | (4.41 | ) | | | (4.22 | ) |
| | | | | | | | | | | | | | | | | | | | | | | | | | |
Net Asset Value, End of Period | | | $79.27 | | | | | | $85.09 | | | | $54.40 | | | | $63.40 | | | | $74.58 | | | | $69.11 | |
| | | | | | | | | | | | | | | | | | | | | | | | | | |
Total Return | | | (1.74)% | (a) | | | | | 65.59% | | | | (9.03)% | | | | (7.17)% | | | | 14.98% | | | | 15.76% | |
| | | | | | | |
Supplemental Data and Ratios | | | | | | | | | | | | | | | | | | | | | | | | | | |
Net Assets, End of Period, in Thousands | | | $1,548,153 | | | | | | $1,778,696 | | | | $995,861 | | | | $1,302,745 | | | | $1,587,936 | | | | $1,542,730 | |
Ratio of Expenses to Average Net Assets | | | 0.99% | (b) | | | | | 1.00% | | | | 1.04% | | | | 1.02% | | | | 1.01% | | | | 1.01% | |
Ratio of Net Investment Income to Average Net Assets | | | 0.22% | (b) | | | | | 0.15% | | | | 0.70% | | | | 0.97% | | | | 0.74% | | | | 0.72% | |
Portfolio Turnover Rate | | | 16% | (a) | | | | | 24% | | | | 23% | | | | 22% | | | | 19% | | | | 14% | |
| | | | | | | | | | | | | | | | | | | | | | | | | | |
| | | | | | | Year Ended September 30 |
Ariel Fund (Institutional Class) | | Six Months Ended
March 31, 2022 (Unaudited) | | | | 2021 | | 2020 | | 2019 | | 2018 | | 2017 |
Net Asset Value, Beginning of Period | | | $85.34 | | | | | | $54.53 | | | | $63.55 | | | | $74.78 | | | | $69.28 | | | | $63.87 | |
Income from Investment Operations | | | | | | | | | | | | | | | | | | | | | | | | | | |
Net Investment Income (Loss) | | | 0.11 | | | | | | 0.25 | | | | 0.58 | | | | 0.74 | | | | 0.73 | | | | 0.63 | |
Net Realized and Unrealized Gain (Loss) on Investments | | | (1.16 | ) | | | | | 34.34 | | | | (5.62 | ) | | | (6.03 | ) | | | 9.38 | | | | 9.19 | |
| | | | | | | | | | | | | | | | | | | | | | | | | | |
Total from Investment Operations | | | (1.05 | ) | | | | | 34.59 | | | | (5.04 | ) | | | (5.29 | ) | | | 10.11 | | | | 9.82 | |
| | | | | | | |
Distributions to Shareholders | | | | | | | | | | | | | | | | | | | | | | | | | | |
Dividends from Net Investment Income | | | (0.30 | ) | | | | | (0.38 | ) | | | (0.75 | ) | | | (0.80 | ) | | | (0.68 | ) | | | (0.37 | ) |
Distributions from Capital Gains | | | (4.61 | ) | | | | | (3.40 | ) | | | (3.23 | ) | | | (5.14 | ) | | | (3.93 | ) | | | (4.04 | ) |
| | | | | | | | | | | | | | | | | | | | | | | | | | |
Total Distributions | | | (4.91 | ) | | | | | (3.78 | ) | | | (3.98 | ) | | | (5.94 | ) | | | (4.61 | ) | | | (4.41 | ) |
| | | | | | | | | | | | | | | | | | | | | | | | | | |
Net Asset Value, End of Period | | | $79.38 | | | | | | $85.34 | | | | $54.53 | | | | $63.55 | | | | $74.78 | | | | $69.28 | |
| | | | | | | | | | | | | | | | | | | | | | | | | | |
Total Return | | | (1.58)% | (a) | | | | | 66.12% | | | | (8.74)% | | | | (6.86)% | | | | 15.30% | | | | 16.11% | |
| | | | | | | |
Supplemental Data and Ratios | | | | | | | | | | | | | | | | | | | | | | | | | | |
Net Assets, End of Period, in Thousands | | | $1,635,915 | | | | | | $1,273,796 | | | | $596,645 | | | | $742,864 | | | | $673,273 | | | | $593,887 | |
Ratio of Expenses to Average Net Assets | | | 0.66% | (b) | | | | | 0.69% | | | | 0.72% | | | | 0.70% | | | | 0.72% | | | | 0.71% | |
Ratio of Net Investment Income to Average Net Assets | | | 0.56% | (b) | | | | | 0.45% | | | | 1.01% | | | | 1.31% | | | | 1.03% | | | | 1.01% | |
Portfolio Turnover Rate | | | 16% | (a) | | | | | 24% | | | | 23% | | | | 22% | | | | 19% | | | | 14% | |
(a) Not annualized.
(b) Annualized.
The accompanying notes are an integral part of the financial statements.
38 SLOW AND STEADY WINS THE RACE
| | |
Financial highlights For a share outstanding throughout each period | | |
|
| | | | | | | | | | | | | | | | | | | | | | | | | | |
| | | | | | | Year Ended September 30 |
Ariel Appreciation Fund (Investor Class) | | Six Months Ended
March 31, 2022
(Unaudited) | | | | 2021 | | 2020 | | 2019 | | 2018 | | 2017 |
Net Asset Value, Beginning of Period | | | $50.93 | | | | | | $38.76 | | | | $44.43 | | | | $49.48 | | | | $50.91 | | | | $48.90 | |
Income from Investment Operations | | | | | | | | | | | | | | | | | | | | | | | | | | |
Net Investment Income (Loss) | | | (0.07 | ) | | | | | 0.12 | | | | 0.48 | | | | 0.62 | | | | 0.40 | | | | 0.51 | |
Net Realized and Unrealized Gain (Loss) on Investments | | | 1.45 | | | | | | 16.31 | | | | (2.77 | ) | | | (2.83 | ) | | | 4.17 | | | | 5.21 | |
| | | | | | | | | | | | | | | | | | | | | | | | | | |
Total from Investment Operations | | | 1.38 | | | | | | 16.43 | | | | (2.29 | ) | | | (2.21 | ) | | | 4.57 | | | | 5.72 | |
| | | | | | | |
Distributions to Shareholders | | | | | | | | | | | | | | | | | | | | | | | | | | |
Dividends from Net Investment Income | | | (0.21 | ) | | | | | (0.24 | ) | | | (0.42 | ) | | | (0.42 | ) | | | (0.39 | ) | | | (0.30 | ) |
Distributions from Capital Gains | | | (6.57 | ) | | | | | (4.02 | ) | | | (2.96 | ) | | | (2.42 | ) | | | (5.61 | ) | | | (3.41 | ) |
| | | | | | | | | | | | | | | | | | | | | | | | | | |
Total Distributions | | | (6.78 | ) | | | | | (4.26 | ) | | | (3.38 | ) | | | (2.84 | ) | | | (6.00 | ) | | | (3.71 | ) |
| | | | | | | | | | | | | | | | | | | | | | | | | | |
Net Asset Value, End of Period | | | $45.53 | | | | | | $50.93 | | | | $38.76 | | | | $44.43 | | | | $49.48 | | | | $50.91 | |
| | | | | | | | | | | | | | | | | | | | | | | | | | |
Total Return | | | 2.16% | (a) | | | | | 45.27% | | | | (5.93)% | | | | (4.23)% | | | | 9.90% | | | | 12.41% | |
| | | | | | | |
Supplemental Data and Ratios | | | | | | | | | | | | | | | | | | | | | | | | | | |
Net Assets, End of Period, in Thousands | | | $1,052,659 | | | | | | $1,101,184 | | | | $777,404 | | | | $996,797 | | | | $1,321,843 | | | | $1,450,735 | |
Ratio of Expenses to Average Net Assets | | | 1.10% | (b) | | | | | 1.12% | | | | 1.15% | | | | 1.14% | | | | 1.13% | | | | 1.12% | |
Ratio of Net Investment Income to Average Net Assets | | | 0.53% | (b) | | | | | 0.55% | | | | 0.98% | | | | 1.05% | | | | 0.72% | | | | 0.94% | |
Portfolio Turnover Rate | | | 11% | (a) | | | | | 24% | | | | 24% | | | | 18% | | | | 11% | | | | 20% | |
| | | | | | | | | | | | | | | | | | | | | | | | | | |
| | | | | | | Year Ended September 30 |
Ariel Appreciation Fund (Institutional Class) | | Six Months Ended
March 31, 2022
(Unaudited) | | | | 2021 | | 2020 | | 2019 | | 2018 | | 2017 |
Net Asset Value, Beginning of Period | | | $51.10 | | | | | | $38.86 | | | | $44.55 | | | | $49.64 | | | | $51.07 | | | | $49.03 | |
Income from Investment Operations | | | | | | | | | | | | | | | | | | | | | | | | | | |
Net Investment Income (Loss) | | | 0.06 | | | | | | 0.36 | | | | 0.60 | | | | 0.59 | | | | 0.48 | | | | 0.59 | |
Net Realized and Unrealized Gain (Loss) on Investments | | | 1.40 | | | | | | 16.26 | | | | (2.77 | ) | | | (2.68 | ) | | | 4.25 | | | | 5.30 | |
| | | | | | | | | | | | | | | | | | | | | | | | | | |
Total from Investment Operations | | | 1.46 | | | | | | 16.62 | | | | (2.17 | ) | | | (2.09 | ) | | | 4.73 | | | | 5.89 | |
| | | | | | | |
Distributions to Shareholders | | | | | | | | | | | | | | | | | | | | | | | | | | |
Dividends from Net Investment Income | | | (0.35 | ) | | | | | (0.36 | ) | | | (0.56 | ) | | | (0.58 | ) | | | (0.55 | ) | | | (0.44 | ) |
Distributions from Capital Gains | | | (6.57 | ) | | | | | (4.02 | ) | | | (2.96 | ) | | | (2.42 | ) | | | (5.61 | ) | | | (3.41 | ) |
| | | | | | | | | | | | | | | | | | | | | | | | | | |
Total Distributions | | | (6.92 | ) | | | | | (4.38 | ) | | | (3.52 | ) | | | (3.00 | ) | | | (6.16 | ) | | | (3.85 | ) |
| | | | | | | | | | | | | | | | | | | | | | | | | | |
Net Asset Value, End of Period | | | $45.64 | | | | | | $51.10 | | | | $38.86 | | | | $44.55 | | | | $49.64 | | | | $51.07 | |
| | | | | | | | | | | | | | | | | | | | | | | | | | |
Total Return | | | 2.32% | (a) | | | | | 45.74% | | | | (5.65)% | | | | (3.91)% | | | | 10.21% | | | | 12.78% | |
| | | | | | | |
Supplemental Data and Ratios | | | | | | | | | | | | | | | | | | | | | | | | | | |
Net Assets, End of Period, in Thousands | | | $249,353 | | | | | | $267,375 | | | | $196,009 | | | | $298,211 | | | | $267,831 | | | | $247,526 | |
Ratio of Expenses to Average Net Assets | | | 0.79% | (b) | | | | | 0.81% | | | | 0.84% | | | | 0.82% | | | | 0.82% | | | | 0.81% | |
Ratio of Net Investment Income to Average Net Assets | | | 0.84% | (b) | | | | | 0.87% | | | | 1.26% | | | | 1.39% | | | | 1.03% | | | | 1.25% | |
Portfolio Turnover Rate | | | 11% | (a) | | | | | 24% | | | | 24% | | | | 18% | | | | 11% | | | | 20% | |
The accompanying notes are an integral part of the financial statements.
ARIELINVESTMENTS.COM 39
| | |
Financial highlights For a share outstanding throughout each period | | |
|
| | | | | | | | | | | | | | | | | | | | | | | | | | |
| | | | | | | Year Ended September 30 |
Ariel Focus Fund (Investor Class) | | Six Months Ended
March 31, 2022
(Unaudited) | | | | 2021 | | 2020 | | 2019 | | 2018 | | 2017 |
Net Asset Value, Beginning of Period | | | $16.60 | | | | | | $12.13 | | | | $12.89 | | | | $14.77 | | | | $13.71 | | | | $11.83 | |
Income from Investment Operations | | | | | | | | | | | | | | | | | | | | | | | | | | |
Net Investment Income (Loss) | | | 0.01 | | | | | | 0.16 | | | | 0.18 | | | | 0.16 | | | | 0.13 | | | | 0.13 | |
Net Realized and Unrealized Gain (Loss) on Investments | | | 1.48 | | | | | | 4.65 | | | | (0.80 | ) | | | (1.20 | ) | | | 1.71 | | | | 1.88 | |
| | | | | | | | | | | | | | | | | | | | | | | | | | |
Total from Investment Operations | | | 1.49 | | | | | | 4.81 | | | | (0.62 | ) | | | (1.04 | ) | | | 1.84 | | | | 2.01 | |
| | | | | | | |
Distributions to Shareholders | | | | | | | | | | | | | | | | | | | | | | | | | | |
Dividends from Net Investment Income | | | (0.14 | ) | | | | | (0.12 | ) | | | (0.14 | ) | | | (0.13 | ) | | | (0.11 | ) | | | (0.13 | ) |
Distributions from Capital Gains | | | (0.42 | ) | | | | | (0.22 | ) | | | — | | | | (0.71 | ) | | | (0.67 | ) | | | — | |
| | | | | | | | | | | | | | | | | | | | | | | | | | |
Total Distributions | | | (0.56 | ) | | | | | (0.34 | ) | | | (0.14 | ) | | | (0.84 | ) | | | (0.78 | ) | | | (0.13 | ) |
| | | | | | | | | | | | | | | | | | | | | | | | | | |
Net Asset Value, End of Period | | | $17.53 | | | | | | $16.60 | | | | $12.13 | | | | $12.89 | | | | $14.77 | | | | $13.71 | |
| | | | | | | | | | | | | | | | | | | | | | | | | | |
Total Return | | | 9.12% | (a) | | | | | 40.39% | | | | (4.91)% | | | | (6.86)% | | | | 14.26% | | | | 17.09% | |
| | | | | | | |
Supplemental Data and Ratios | | | | | | | | | | | | | | | | | | | | | | | | | | |
Net Assets, End of Period, in Thousands | | | $54,321 | | | | | | $43,721 | | | | $31,852 | | | | $40,770 | | | | $44,964 | | | | $40,607 | |
Ratio of Expenses to Average Net Assets, Including Waivers | | | 1.00% | (b) | | | | | 1.00% | | | | 1.00% | | | | 1.00% | | | | 1.00% | | | | 1.00% | |
Ratio of Expenses to Average Net Assets, Excluding Waivers | | | 1.13% | (b) | | | | | 1.20% | | | | 1.25% | | | | 1.23% | | | | 1.20% | | | | 1.19% | |
Ratio of Net Investment Income to Average Net Assets, Including Waivers | | | 0.87% | (b) | | | | | 0.92% | | | | 1.23% | | | | 1.30% | | | | 0.98% | | | | 0.93% | |
Ratio of Net Investment Income to Average Net Assets, Excluding Waivers | | | 0.74% | (b) | | | | | 0.72% | | | | 0.98% | | | | 1.07% | | | | 0.78% | | | | 0.74% | |
Portfolio Turnover Rate | | | 19% | (a) | | | | | 63% | | | | 22% | | | | 18% | | | | 27% | | | | 35% | |
| | | | | | | | | | | | | | | | | | | | | | | | | | |
| | | | | | | Year Ended September 30 |
Ariel Focus Fund (Institutional Class) | | Six Months Ended
March 31, 2022
(Unaudited) | | | | 2021 | | 2020 | | 2019 | | 2018 | | 2017 |
Net Asset Value, Beginning of Period | | | $16.63 | | | | | | $12.14 | | | | $12.89 | | | | $14.77 | | | | $13.69 | | | | $11.81 | |
Income from Investment Operations | | | | | | | | | | | | | | | | | | | | | | | | | | |
Net Investment Income (Loss) | | | 0.06 | | | | | | 0.18 | | | | 0.19 | | | | 0.19 | | | | 0.17 | | | | 0.15 | |
Net Realized and Unrealized Gain (Loss) on Investments | | | 1.45 | | | | | | 4.67 | | | | (0.78 | ) | | | (1.20 | ) | | | 1.71 | | | | 1.89 | |
| | | | | | | | | | | | | | | | | | | | | | | | | | |
Total from Investment Operations | | | 1.51 | | | | | | 4.85 | | | | (0.59 | ) | | | (1.01 | ) | | | 1.88 | | | | 2.04 | |
| | | | | | | |
Distributions to Shareholders | | | | | | | | | | | | | | | | | | | | | | | | | | |
Dividends from Net Investment Income | | | (0.17 | ) | | | | | (0.14 | ) | | | (0.16 | ) | | | (0.16 | ) | | | (0.13 | ) | | | (0.16 | ) |
Distributions from Capital Gains | | | (0.42 | ) | | | | | (0.22 | ) | | | — | | | | (0.71 | ) | | | (0.67 | ) | | | — | |
| | | | | | | | | | | | | | | | | | | | | | | | | | |
Total Distributions | | | (0.59 | ) | | | | | (0.36 | ) | | | (0.16 | ) | | | (0.87 | ) | | | (0.80 | ) | | | (0.16 | ) |
| | | | | | | | | | | | | | | | | | | | | | | | | | |
Net Asset Value, End of Period | | | $17.55 | | | | | | $16.63 | | | | $12.14 | | | | $12.89 | | | | $14.77 | | | | $13.69 | |
| | | | | | | | | | | | | | | | | | | | | | | | | | |
Total Return | | | 9.25% | (a) | | | | | 40.73% | | | | (4.69)% | | | | (6.56)% | | | | 14.54% | | | | 17.40% | |
| | | | | | | |
Supplemental Data and Ratios | | | | | | | | | | | | | | | | | | | | | | | | | | |
Net Assets, End of Period, in Thousands | | | $19,524 | | | | | | $17,835 | | | | $12,732 | | | | $15,552 | | | | $20,929 | | | | $14,378 | |
Ratio of Expenses to Average Net Assets, Including Waivers | | | 0.75% | (b) | | | | | 0.75% | | | | 0.75% | | | | 0.75% | | | | 0.75% | | | | 0.75% | |
Ratio of Expenses to Average Net Assets, Excluding Waivers | | | 0.83% | (b) | | | | | 0.86% | | | | 0.89% | | | | 0.89% | | | | 0.86% | | | | 0.90% | |
Ratio of Net Investment Income to Average Net Assets, Including Waivers | | | 1.11% | (b) | | | | | 1.14% | | | | 1.47% | | | | 1.54% | | | | 1.24% | | | | 1.18% | |
Ratio of Net Investment Income to Average Net Assets, Excluding Waivers | | | 1.03% | (b) | | | | | 1.03% | | | | 1.33% | | | | 1.40% | | | | 1.13% | | | | 1.03% | |
Portfolio Turnover Rate | | | 19% | (a) | | | | | 63% | | | | 22% | | | | 18% | | | | 27% | | | | 35% | |
(a) Not annualized.
The accompanying notes are an integral part of the financial statements.
40 SLOW AND STEADY WINS THE RACE
| | |
Financial highlights For a share outstanding throughout each period | | |
|
| | | | | | | | | | | | | | | | | | | | | | | | | | |
| | | | | | | Year Ended September 30 |
Ariel International Fund (Investor Class) | | Six Months Ended
March 31, 2022
(Unaudited) | | | | 2021 | | 2020 | | 2019 | | 2018 | | 2017 |
Net Asset Value, Beginning of Period | | | $14.69 | | | | | | $13.68 | | | | $13.42 | | | | $13.91 | | | | $14.23 | | | | $13.21 | |
Income from Investment Operations | | | | | | | | | | | | | | | | | | | | | | | | | | |
Net Investment Income (Loss) | | | 0.09 | | | | | | 0.36 | | | | 0.36 | | | | 0.79 | | | | 0.37 | | | | 0.26 | |
Net Realized and Unrealized Gain (Loss) on Investments | | | 0.13 | | | | | | 0.86 | | | | 0.12 | | | | (1.13 | ) | | | (0.44 | ) | | | 0.96 | |
| | | | | | | | | | | | | | | | | | | | | | | | | | |
Total from Investment Operations | | | 0.22 | | | | | | 1.22 | | | | 0.48 | | | | (0.34 | ) | | | (0.07 | ) | | | 1.22 | |
| | | | | | | |
Distributions to Shareholders | | | | | | | | | | | | | | | | | | | | | | | | | | |
Dividends from Net Investment Income | | | (0.38 | ) | | | | | (0.21 | ) | | | (0.22 | ) | | | (0.12 | ) | | | (0.10 | ) | | | (0.17 | ) |
Distributions from Capital Gains | | | — | | | | | | — | | | | — | | | | (0.03 | ) | | | (0.15 | ) | | | (0.03 | ) |
| | | | | | | | | | | | | | | | | | | | | | | | | | |
Total Distributions | | | (0.38 | ) | | | | | (0.21 | ) | | | (0.22 | ) | | | (0.15 | ) | | | (0.25 | ) | | | (0.20 | ) |
| | | | | | | | | | | | | | | | | | | | | | | | | | |
Net Asset Value, End of Period | | | $14.53 | | | | | | $14.69 | | | | $13.68 | | | | $13.42 | | | | $13.91 | | | | $14.23 | |
| | | | | | | | | | | | | | | | | | | | | | | | | | |
Total Return | | | 1.46% | (a) | | | | | 9.00% | | | | 3.57% | | | | (2.39)% | | | | (0.49)% | | | | 9.55% | |
| | | | | | | |
Supplemental Data and Ratios | | | | | | | | | | | | | | | | | | | | | | | | | | |
Net Assets, End of Period, in Thousands | | | $22,890 | | | | | | $23,717 | | | | $21,877 | | | | $24,849 | | | | $54,169 | | | | $70,616 | |
Ratio of Expenses to Average Net Assets, Including Waivers | | | 1.13% | (b) | | | | | 1.13% | | | | 1.13% | | | | 1.13% | | | | 1.13% | | | | 1.15% | (c) |
Ratio of Expenses to Average Net Assets, Excluding Waivers | | | 1.29% | (b) | | | | | 1.30% | | | | 1.33% | | | | 1.32% | | | | 1.31% | | | | 1.32% | |
Ratio of Net Investment Income to Average Net Assets, Including Waivers | | | 1.09% | (b) | | | | | 2.41% | | | | 1.69% | | | | 1.94% | | | | 1.80% | | | | 1.79% | |
Ratio of Net Investment Income to Average Net Assets, Excluding Waivers | | | 0.93% | (b) | | | | | 2.24% | | | | 1.49% | | | | 1.75% | | | | 1.62% | | | | 1.62% | |
Portfolio Turnover Rate | | | 5% | (a) | | | | | 22% | | | | 24% | | | | 20% | | | | 8% | | | | 23% | |
| | | | | | | | | | | | | | | | | | | | | | | | | | |
| | | | | | | Year Ended September 30 |
Ariel International Fund (Institutional Class) | | Six Months Ended
March 31, 2022
(Unaudited) | | | | 2021 | | 2020 | | 2019 | | 2018 | | 2017 |
Net Asset Value, Beginning of Period | | | $14.38 | | | | | | $13.39 | | | | $13.18 | | | | $13.68 | | | | $13.99 | | | | $13.00 | |
Income from Investment Operations | | | | | | | | | | | | | | | | | | | | | | | | | | |
Net Investment Income (Loss) | | | 0.15 | | | | | | 0.34 | | | | 0.29 | | | | 0.29 | | | | 0.23 | | | | 0.18 | |
Net Realized and Unrealized Gain (Loss) on Investments | | | 0.08 | | | | | | 0.89 | | | | 0.20 | | | | (0.60 | ) | | | (0.26 | ) | | | 1.05 | |
| | | | | | | | | | | | | | | | | | | | | | | | | | |
Total from Investment Operations | | | 0.23 | | | | | | 1.23 | | | | 0.49 | | | | (0.31 | ) | | | (0.03 | ) | | | 1.23 | |
| | | | | | | |
Distributions to Shareholders | | | | | | | | | | | | | | | | | | | | | | | | | | |
Dividends from Net Investment Income | | | (0.41 | ) | | | | | (0.24 | ) | | | (0.28 | ) | | | (0.16 | ) | | | (0.13 | ) | | | (0.21 | ) |
Distributions from Capital Gains | | | — | | | | | | — | | | | — | | | | (0.03 | ) | | | (0.15 | ) | | | (0.03 | ) |
| | | | | | | | | | | | | | | | | | | | | | | | | | |
Total Distributions | | | (0.41 | ) | | | | | (0.24 | ) | | | (0.28 | ) | | | (0.19 | ) | | | (0.28 | ) | | | (0.24 | ) |
| | | | | | | | | | | | | | | | | | | | | | | | | | |
Net Asset Value, End of Period | | | $14.20 | | | | | | $14.38 | | | | $13.39 | | | | $13.18 | | | | $13.68 | | | | $13.99 | |
| | | | | | | | | | | | | | | | | | | | | | | | | | |
Total Return | | | 1.60% | (a) | | | | | 9.26% | | | | 3.74% | | | | (2.13)% | | | | (0.17)% | | | | 9.80% | |
| | | | | | | |
Supplemental Data and Ratios | | | | | | | | | | | | | | | | | | | | | | | | | | |
Net Assets, End of Period, in Thousands | | | $726,370 | | | | | | $837,624 | | | | $599,770 | | | | $722,616 | | | | $620,017 | | | | $431,341 | |
Ratio of Expenses to Average Net Assets, Including Waivers | | | 0.88% | (b) | | | | | 0.88% | | | | 0.88% | | | | 0.88% | | | | 0.88% | | | | 0.89% | (c) |
Ratio of Expenses to Average Net Assets, Excluding Waivers | | | 0.93% | (b) | | | | | 0.93% | | | | 0.96% | | | | 0.93% | | | | 0.93% | | | | 0.95% | |
Ratio of Net Investment Income to Average Net Assets, Including Waivers | | | 1.28% | (b) | | | | | 2.75% | | | | 1.98% | | | | 2.49% | | | | 2.23% | | | | 2.52% | |
Ratio of Net Investment Income to Average Net Assets, Excluding Waivers | | | 1.23% | (b) | | | | | 2.70% | | | | 1.90% | | | | 2.44% | | | | 2.18% | | | | 2.46% | |
Portfolio Turnover Rate | | | 5% | (a) | | | | | 22% | | | | 24% | | | | 20% | | | | 8% | | | | 23% | |
| (c) | Effective November 29, 2016, the Adviser contractually agreed to waive fees and reimburse expenses in order to limit the Fund’s total annual operating expenses to 1.13% for the Investor Class and 0.88% for the Institutional Class. |
The accompanying notes are an integral part of the financial statements.
ARIELINVESTMENTS.COM 41
| | |
Financial highlights For a share outstanding throughout each period | | |
|
| | | | | | | | | | | | | | | | | | | | | | | | | | |
| | | | | | | Year Ended September 30 |
Ariel Global Fund (Investor Class) | | Six Months Ended
March 31, 2022
(Unaudited) | | | | 2021 | | 2020 | | 2019 | | 2018 | | 2017 |
Net Asset Value, Beginning of Period | | | $17.65 | | | | | | $15.36 | | | | $15.40 | | | | $16.48 | | | | $16.05 | | | | $14.60 | |
Income from Investment Operations | | | | | | | | | | | | | | | | | | | | | | | | | | |
Net Investment Income (Loss) | | | 0.14 | | | | | | 0.31 | | | | 0.27 | | | | 0.32 | | | | 0.19 | | | | 0.22 | |
Net Realized and Unrealized Gain (Loss) on Investments | | | 0.87 | | | | | | 2.12 | | | | 0.38 | | | | (0.92 | ) | | | 0.94 | | | | 1.60 | |
| | | | | | | | | | | | | | | | | | | | | | | | | | |
Total from Investment Operations | | | 1.01 | | | | | | 2.43 | | | | 0.65 | | | | (0.60 | ) | | | 1.13 | | | | 1.82 | |
| | | | | | | |
Distributions to Shareholders | | | | | | | | | | | | | | | | | | | | | | | | | | |
Dividends from Net Investment Income | | | (0.37 | ) | | | | | (0.14 | ) | | | (0.31 | ) | | | (0.32 | ) | | | (0.16 | ) | | | (0.21 | ) |
Distributions from Capital Gains | | | — | | | | | | — | | | | (0.38 | ) | | | (0.16 | ) | | | (0.54 | ) | | | (0.16 | ) |
| | | | | | | | | | | | | | | | | | | | | | | | | | |
Total Distributions | | | (0.37 | ) | | | | | (0.14 | ) | | | (0.69 | ) | | | (0.48 | ) | | | (0.70 | ) | | | (0.37 | ) |
| | | | | | | | | | | | | | | | | | | | | | | | | | |
Net Asset Value, End of Period | | | $18.29 | | | | | | $17.65 | | | | $15.36 | | | | $15.40 | | | | $16.48 | | | | $16.05 | |
| | | | | | | | | | | | | | | | | | | | | | | | | | |
Total Return | | | 5.73% | (a) | | | | | 15.91% | | | | 4.23% | | | | (3.41)% | | | | 7.38% | | | | 12.87% | |
| | | | | | | |
Supplemental Data and Ratios | | | | | | | | | | | | | | | | | | | | | | | | | | |
Net Assets, End of Period, in Thousands | | | $12,113 | | | | | | $12,053 | | | | $10,733 | | | | $12,159 | | | | $14,798 | | | | $11,459 | |
Ratio of Expenses to Average Net Assets, Including Waivers | | | 1.13% | (b) | | | | | 1.13% | | | | 1.13% | | | | 1.13% | | | | 1.13% | | | | 1.15% | (c) |
Ratio of Expenses to Average Net Assets, Excluding Waivers | | | 1.32% | (b) | | | | | 1.36% | | | | 1.46% | | | | 1.44% | | | | 1.46% | | | | 1.42% | |
Ratio of Net Investment Income to Average Net Assets, Including Waivers | | | 1.47% | (b) | | | | | 1.73% | | | | 1.61% | | | | 1.85% | | | | 1.60% | | | | 1.66% | |
Ratio of Net Investment Income to Average Net Assets, Excluding Waivers | | | 1.28% | (b) | | | | | 1.50% | | | | 1.28% | | | | 1.54% | | | | 1.27% | | | | 1.39% | |
Portfolio Turnover Rate | | | 7% | (a) | | | | | 24% | | | | 23% | | | | 29% | | | | 11% | | | | 24% | |
| | | | | | | | | | | | | | | | | | | | | | | | | | |
| | | | | | | Year Ended September 30 |
Ariel Global Fund (Institutional Class) | | Six Months Ended
March 31, 2022
(Unaudited) | | | | 2021 | | 2020 | | 2019 | | 2018 | | 2017 |
Net Asset Value, Beginning of Period | | | $17.11 | | | | | | $14.87 | | | | $14.92 | | | | $15.98 | | | | $15.57 | | | | $14.21 | |
Income from Investment Operations | | | | | | | | | | | | | | | | | | | | | | | | | | |
Net Investment Income (Loss) | | | 0.20 | | | | | | 0.25 | | | | 0.21 | | | | 0.39 | | | | 0.24 | | | | 0.25 | |
Net Realized and Unrealized Gain (Loss) on Investments | | | 0.79 | | | | | | 2.15 | | | | 0.45 | | | | (0.93 | ) | | | 0.89 | | | | 1.55 | |
| | | | | | | | | | | | | | | | | | | | | | | | | | |
Total from Investment Operations | | | 0.99 | | | | | | 2.40 | | | | 0.66 | | | | (0.54 | ) | | | 1.13 | | | | 1.80 | |
| | | | | | | |
Distributions to Shareholders | | | | | | | | | | | | | | | | | | | | | | | | | | |
Dividends from Net Investment Income | | | (0.41 | ) | | | | | (0.16 | ) | | | (0.33 | ) | | | (0.36 | ) | | | (0.18 | ) | | | (0.28 | ) |
Distributions from Capital Gains | | | — | | | | | | — | | | | (0.38 | ) | | | (0.16 | ) | | | (0.54 | ) | | | (0.16 | ) |
| | | | | | | | | | | | | | | | | | | | | | | | | | |
Total Distributions | | | (0.41 | ) | | | | | (0.16 | ) | | | (0.71 | ) | | | (0.52 | ) | | | (0.72 | ) | | | (0.44 | ) |
| | | | | | | | | | | | | | | | | | | | | | | | | | |
Net Asset Value, End of Period | | | $17.69 | | | | | | $17.11 | | | | $14.87 | | | | $14.92 | | | | $15.98 | | | | $15.57 | |
| | | | | | | | | | | | | | | | | | | | | | | | | | |
Total Return | | | 5.80% | (a) | | | | | 16.26% | | | | 4.48% | | | | (3.18)% | | | | 7.63% | | | | 13.10% | |
| | | | | | | |
Supplemental Data and Ratios | | | | | | | | | | | | | | | | | | | | | | | | | | |
Net Assets, End of Period, in Thousands | | | $165,356 | | | | | | $197,299 | | | | $95,229 | | | | $73,724 | | | | $119,609 | | | | $89,898 | |
Ratio of Expenses to Average Net Assets, Including Waivers | | | 0.88% | (b) | | | | | 0.88% | | | | 0.88% | | | | 0.88% | | | | 0.88% | | | | 0.90% | (c) |
Ratio of Expenses to Average Net Assets, Excluding Waivers | | | 0.93% | (b) | | | | | 0.95% | | | | 1.01% | | | | 0.99% | | | | 0.98% | | | | 1.01% | |
Ratio of Net Investment Income to Average Net Assets, Including Waivers | | | 1.60% | (b) | | | | | 2.16% | | | | 1.93% | | | | 2.07% | | | | 1.88% | | | | 1.91% | |
Ratio of Net Investment Income to Average Net Assets, Excluding Waivers | | | 1.55% | (b) | | | | | 2.09% | | | | 1.80% | | | | 1.96% | | | | 1.78% | | | | 1.80% | |
Portfolio Turnover Rate | | | 7% | (a) | | | | | 24% | | | | 23% | | | | 29% | | | | 11% | | | | 24% | |
| (c) | Effective November 29, 2016, the Adviser contractually agreed to waive fees and reimburse expenses in order to limit the Fund’s total annual operating expenses to 1.13% for the Investor Class and 0.88% for the Institutional Class. |
The accompanying notes are an integral part of the financial statements.
42 SLOW AND STEADY WINS THE RACE
| | |
Notes to the financial statements | | 03/31/22 (UNAUDITED) |
|
NOTE ONE | ORGANIZATION
Ariel Investment Trust (the “Trust”) is a Massachusetts business trust registered under the Investment Company Act of 1940, as amended (the “1940 Act”), as an open-end management investment company. Ariel Fund, Ariel Appreciation Fund, Ariel Focus Fund, Ariel International Fund and Ariel Global Fund (each, a “Fund” and collectively, the “Funds”) are series of the Trust. Ariel Focus Fund is a non-diversified Fund, all other Funds are diversified. The Funds issue two classes of shares: an Investor Class and an Institutional Class.
The Northern Trust Company (“Northern Trust”) provides fund administration and tax reporting services for the Funds in its role as sub-fund administrator engaged by the Adviser for Ariel Fund, Ariel Appreciation Fund and Ariel Focus Fund and as fund administrator engaged by the Trust for Ariel International Fund and Ariel Global Fund. Northern Trust also acts as the Funds’ accounting agent and custodian. U.S. Bank Global Fund Services serves as the Funds’ transfer agent.
NOTE TWO | SIGNIFICANT ACCOUNTING POLICIES
The following is a summary of significant accounting policies consistently followed by the Funds in the preparation of their financial statements. The Funds are investment companies and follow accounting and reporting guidance in the Financial Accounting Standards Board (FASB) Accounting Standards CodificationTM Topic 946 (ASC 946). The accompanying financial statements were prepared in accordance with accounting principles generally accepted in the United States of America (GAAP), including but not limited to ASC 946. GAAP requires management to make certain estimates and assumptions at the date of the financial statements. Actual results may differ from such estimates.
Securities valuation—Securities for which market quotations are readily available are valued at the last sale price on the national securities exchange on which such securities are primarily traded and, in the case of securities reported on the Nasdaq system, are valued based on the Nasdaq Official Closing Price. If a last sale price or a closing price is not reported, a security shall be valued using i) the closing price on another exchange on which the security traded (if such price is made available by the pricing vendor) or ii) the mean between the bid and ask prices for securities for which reliable bid and ask quotations are available.
Certain common stocks that trade on foreign exchanges are subject to valuation adjustments to account for the market movement between the close of a foreign market in which the security is traded and the close of the New York Stock Exchange. In the event the Funds become aware of a significant event that may materially affect the value of a security, a fair value of such security will be determined in accordance with procedures established by the Board of Trustees.
Investments in money market funds are valued at their closing net asset value each business day.
Debt securities having a maturity over 60 days are valued using evaluated prices or matrix pricing methods determined by a pricing service which take into consideration factors such as yield, maturity, ratings, and traded prices in identical or similar securities. Short-term debt obligations having a maturity of 60 days or less are valued at amortized cost, so long as it approximates fair value.
Securities and assets for which market quotations are not readily available are valued at fair value as determined in good faith by or under the direction of the Board of Trustees.
Securities transactions and investment income—Securities transactions are accounted for on a trade date basis. Realized gains and losses from securities transactions are recorded on the identified cost basis. Dividend income is recorded on the ex-dividend date and interest income is recognized on an accrual basis. Dividends from foreign securities are recorded on the ex-dividend date, or as soon as the information is available. Non-cash dividends are recorded as investment income at the fair value of the assets received.
Subsequent events—In preparing these financial statements, the Trust has evaluated subsequent events occurring after March 31, 2022 through the date the financial statements were issued and determined that there were no such events that would require adjustment to or additional disclosure in these financial statements.
Fair value measurements—Accounting Standards CodificationTM Topic 820-10 (ASC 820-10) establishes a three-tier framework for measuring fair value based on a hierarchy of inputs. The hierarchy distinguishes between market data obtained from independent sources (observable inputs) and the Funds’ own market assumptions (unobservable inputs). These inputs are used in determining the value of the Funds’ investments and are summarized below:
Level 1 – quoted prices in active markets for identical securities
Level 2 – other significant observable inputs (including quoted prices for similar securities, “quoted” prices in inactive markets, dealer indications, and inputs corroborated by observable market data)
Level 3 – significant unobservable inputs (including the Funds’ own assumptions in determining the fair value of investments)
The inputs or methodology used for valuing securities are not necessarily an indication of the risk associated with investing in those securities.
ARIELINVESTMENTS.COM 43
| | |
Notes to the financial statements | | 03/31/22 (UNAUDITED) |
|
The following tables summarize the inputs used as of March 31, 2022 in valuing the Funds’ investments carried at fair value:
| | | | | | | | | | | | |
| | | Ariel Fund | | | Ariel Appreciation Fund | | | Ariel Focus Fund | |
Level 1 | | | $3,192,684,707 | | | | $1,292,453,655 | | | | $74,596,192 | |
Level 2 | | | — | | | | — | | | | — | |
Level 3 | | | — | | | | — | | | | — | |
| | | | | | | | | | | | |
Total Investments | | | $3,192,684,707 | | | | $1,292,453,655 | | | | $74,596,192 | |
| | | | | | | | | | | | |
Industry classifications for Ariel Fund, Ariel Appreciation Fund, and Ariel Focus Fund are included in the Schedules of Investments for the respective Fund.
| | | | | | | | | | | | | | | | |
Ariel International Fund | | Level 1 | | Level 2* | | Level 3 | | Total |
Common Stocks | | | | | | | | | | | | | | | | |
Communication Services | | | $39,566,439 | | | | $73,971,161 | | | | $— | | | | $113,537,600 | |
Consumer Discretionary | | | 1,753,929 | | | | 88,090,703 | | | | — | | | | 89,844,632 | |
Consumer Staples | | | 43,858,144 | | | | 48,717,944 | | | | — | | | | 92,576,088 | |
Energy | | | — | | | | 3,805,447 | | | | — | | | | 3,805,447 | |
Financials | | | 24,561,815 | | | | 106,606,028 | | | | — | | | | 131,167,843 | |
Health Care | | | 563,814 | | | | 132,942,999 | | | | — | | | | 133,506,813 | |
Industrials | | | — | | | | 21,402,469 | | | | — | | | | 21,402,469 | |
Information Technology | | | 9,938,195 | | | | 15,555,215 | | | | — | | | | 25,493,410 | |
Real Estate | | | — | | | | 711,168 | | | | — | | | | 711,168 | |
Utilities | | | — | | | | 79,649,570 | | | | — | | | | 79,649,570 | |
| | | | | | | | | | | | | | | | |
Total Common Stocks | | | $120,242,336 | | | | $571,452,704 | | | | $— | | | | $691,695,040 | |
Short-Term Investments | | | 27,352,573 | | | | — | | | | — | | | | 27,352,573 | |
| | | | | | | | | | | | | | | | |
Total Investments | | | $147,594,909 | | | | $571,452,704 | | | | $— | | | | $719,047,613 | |
| | | | | | | | | | | | | | | | |
Other Financial Instruments | | | | | | | | | | | | | | | | |
Forward Currency Contracts^ | | | $— | | | | $(1,227,678) | | | | $— | | | | $(1,227,678) | |
| | | | | | | | | | | | | | | | |
Ariel Global Fund | | Level 1 | | Level 2* | | Level 3 | | Total |
Common Stocks | | | | | | | | | | | | | | | | |
Communication Services | | | $16,448,156 | | | | $5,664,494 | | | | $— | | | | $22,112,650 | |
Consumer Discretionary | | | 2,893,108 | | | | 11,629,572 | | | | — | | | | 14,522,680 | |
Consumer Staples | | | 10,595,520 | | | | 7,077,304 | | | | — | | | | 17,672,824 | |
Financials | | | 13,456,946 | | | | 10,769,689 | | | | — | | | | 24,226,635 | |
Health Care | | | 19,580,133 | | | | 26,310,701 | | | | — | | | | 45,890,834 | |
Industrials | | | — | | | | 2,049,548 | | | | — | | | | 2,049,548 | |
Information Technology | | | 25,623,308 | | | | 4,617,863 | | | | — | | | | 30,241,171 | |
Real Estate | | | 4,451,312 | | | | — | | | | — | | | | 4,451,312 | |
Utilities | | | — | | | | 8,685,599 | | | | — | | | | 8,685,599 | |
| | | | | | | | | | | | | | | | |
Total Common Stocks | | | $93,048,483 | | | | $76,804,770 | | | | $— | | | | $169,853,253 | |
Short-Term Investments | | | 1,959,290 | | | | — | | | | — | | | | 1,959,290 | |
| | | | | | | | | | | | | | | | |
Total Investments | | | $95,007,773 | | | | $76,804,770 | | | | $— | | | | $171,812,543 | |
| | | | | | | | | | | | | | | | |
Other Financial Instruments | | | | | | | | | | | | | | | | |
Forward Currency Contracts^ | | | $— | | | | $295,416 | | | | $— | | | | $295,416 | |
| * | As of March 31, 2022, the Level 2 investments held were securities subject to fair valuation and forward currency contracts. See Schedules of Investments. |
| ^ | Forward currency contracts derive their value from underlying exchange rates. These instruments are normally valued by pricing vendors using pricing models. The pricing models typically use inputs that are observed from trading in active forward foreign currency markets. As such, forward currency contracts are categorized as Level 2. The value of forward currency contracts that is disclosed in this table is equal to the difference between Open forward currency contracts with unrealized appreciation and Open forward currency contracts with unrealized depreciation shown in the Schedules of Investments. |
44 SLOW AND STEADY WINS THE RACE
| | |
Notes to the financial statements | | 03/31/22 (UNAUDITED) |
|
Offsetting assets and liabilities—The Funds are subject to various master netting agreements (“Master Netting Agreements”) that govern the terms of certain transactions with select counterparties. Master Netting Agreements seek to reduce the counterparty risk associated with relevant transactions by allowing the Funds to close out and net their total exposure to a counterparty in the event of a default by the other party or a termination event. Termination events include, but are not limited to, a failure to pay or deliver or a breach of the terms of the agreement with respect to transactions governed under a single agreement with that counterparty. The Master Netting Agreements may also specify collateral posting arrangements at pre-arranged exposure levels. The Funds are not currently collateralizing their exposures related to foreign exchange trades. For financial reporting purposes, the Funds do not offset financial assets and liabilities that are subject to the Master Netting Agreements in the Statements of Assets and Liabilities. Gross exposure relating to open forward currency contracts by counterparty is disclosed in the Schedules of Investments as Open forward currency contracts with unrealized appreciation (assets) and Open forward currency contracts with unrealized depreciation (liabilities) and in total by Fund on the Statements of Assets and Liabilities as Unrealized appreciation on forward currency contracts (assets) and Unrealized depreciation on forward currency contracts (liabilities). The net recognized asset (appreciation) or liability (depreciation) is shown in the Schedules of Investments as Net unrealized appreciation (depreciation) on forward currency contracts.
Foreign currency—Securities and other assets and liabilities denominated in foreign currencies are translated into U.S. dollars on a daily basis using exchange rates obtained from an independent third party. Net realized gain (loss) and Net unrealized appreciation (depreciation) on investments include the effects of changes in exchange rates on the underlying investments. Fluctuations in the value of other assets and liabilities resulting from changes in exchange rates are included as Distributable earnings on the Statements of Assets and Liabilities until the underlying assets or liabilities are settled in cash, at which time they are recorded as Net realized gain (loss) on translation of assets and liabilities in foreign currencies on the Statements of Operations.
Forward currency contracts—Ariel International Fund and Ariel Global Fund enter into forward currency contracts to provide the appropriate currency exposure related to protecting the value of securities and related receivables and payables against changes in foreign exchange rates. The primary risk associated with a Fund’s use of these contracts is that a counterparty will fail to fulfill its obligation to pay gains due to the Fund under the contracts. This counterparty risk is mitigated by entering into forward currency contracts only with highly rated counterparties. Forward currency contracts are “marked-to-market” daily, and as noted above, any resulting unrealized gain (loss) is recorded as Net unrealized appreciation (depreciation) on forward currency contracts as disclosed in the Schedules of Investments and in the Statements of Assets and Liabilities as a component of Distributable earnings. The Funds record realized gain (loss) when a forward currency contract is settled or closed and disclose such realized gain (loss) on the Statements of Operations as Net realized gain (loss) on forward currency contracts.
Class and expense allocations—Each class of shares of the Funds has equal rights as to assets and earnings, except that shareholders of each class bear certain class-specific expenses related to marketing and distribution and shareholder servicing and communication. Income, other non-class-specific expense, and realized and unrealized gains and losses on investments are allocated to each class of shares based on its relative net assets. Expenses that are not directly attributable to one or more Funds are allocated among applicable Funds on an equitable and consistent basis considering such things as the nature and type of expense and the relative net assets of the Funds.
Ariel Fund, Ariel Appreciation Fund and Ariel Focus Fund pay all operating expenses not expressly assumed by the Adviser, including custodial and transfer agency fees, federal and state securities registration fees, legal and audit fees, and brokerage commissions and other costs associated with the purchase and sale of portfolio securities. Ariel International Fund and Ariel Global Fund pay all operating expenses not expressly assumed by the Adviser, including custodial and transfer agency fees, fund administration, fund accounting, federal and state securities registration fees, legal and audit fees, and brokerage commissions and other costs associated with the purchase and sale of portfolio securities.
Distributions to shareholders—Dividends from net investment income and net realized capital gains, if any, are declared and paid to shareholders at least annually and are recorded on ex-dividend date.
NOTE THREE | INVESTMENT TRANSACTIONS
Purchases and sales—Cost of purchases and proceeds from sales of securities, excluding short-term investments, for the six months ended March 31, 2022 were as follows:
| | | | | | | | | | |
| | | | | |
| | | Ariel Fund | | Ariel Appreciation
Fund | | Ariel Focus Fund | | Ariel International
Fund | | Ariel Global Fund |
| | | | | |
Purchases | | $677,508,721 | | $150,242,548 | | $17,543,158 | | $35,546,022 | | $12,109,631 |
| | | | | |
Sales | | 517,402,394 | | $270,315,882 | | $12,790,884 | | 159,389,271 | | 44,473,268 |
ARIELINVESTMENTS.COM 45
| | |
Notes to the financial statements | | 03/31/22 (UNAUDITED) |
|
NOTE FOUR | INCOME TAX MATTERS AND DISTRIBUTIONS TO SHAREHOLDERS
Income Tax Matters—It is the Funds’ policy to comply with the requirements of the Internal Revenue Code applicable to regulated investment companies and to distribute substantially all taxable income to shareholders. The Funds file U.S. federal income tax returns in addition to state and local tax returns that may be required. Management has analyzed the Funds’ tax positions taken for all open federal income tax years (September 30, 2018 – 2021), and has concluded that no provision for federal income tax is required in the financial statements.
The cost and unrealized appreciation and depreciation of investments (including derivative instruments) on a federal income tax basis at March 31, 2022 were as follows:
| | | | | | | | | | | | | | | | | | | | |
| | | | | |
| | | Ariel Fund | | Ariel Appreciation
Fund | | Ariel Focus Fund | | Ariel International
Fund | | Ariel Global Fund | |
| | | | | |
Cost of Investments | | $ | 2,311,030,181 | | | $ | 843,717,632 | | | $ | 53,627,627 | | | $ | 615,917,883 | | | $ | 136,564,230 | |
| | | | | | | | | | | | | | | | | | | | |
| | | | | |
Gross Unrealized Appreciation | | | 937,332,189 | | | | 463,984,282 | | | | 21,963,900 | | | | 130,619,674 | | | | 38,157,137 | |
| | | | | |
Gross Unrealized Depreciation | | | (55,677,663) | | | | (15,248,259) | | | | (995,335) | | | | (27,489,944) | | | | (2,908,824) | |
| | | | | | | | | | | | | | | | | | | | |
| | | | | |
Net Unrealized Appreciation (Depreciation) | | $ | 881,654,526 | | | $ | 448,736,023 | | | $ | 20,968,565 | | | $ | 103,129,730 | | | $ | 35,248,313 | |
| | | | | | | | | | | | | | | | | | | | |
The difference between book basis and tax basis unrealized appreciation and depreciation is attributable primarily to the deferral of losses due to wash sales and partnership adjustments.
Tax adjustments are calculated annually. For interim periods, the Funds determine an estimate of tax cost adjustments based on a review of accounting reports for the interim period to identify changes from the adjustments calculated at the fiscal year end. For the previous fiscal year’s federal income tax information, please refer to the Notes to Financial Statements section in the Funds’ most recent annual report.
Distributions —The tax character of distributions paid during the periods ended March 31, 2022 and September 30, 2021 was as follows:
| | | | | | | | | | | | | | | | | | | | | | | | |
| | | Ariel Fund | | | Ariel Appreciation Fund | | | Ariel Focus Fund | |
| | | 03/31/22 | | | 09/30/21 | | | 03/31/22 | | | 09/30/21 | | | 03/31/22 | | | 09/30/21 | |
Distributions from: | | | | | | | | | | | | | | | | | | | | | | | | |
Ordinary income | | | $41,999,989 | | | | $8,000,000 | | | | $34,700,053 | | | | $7,200,001 | | | | $945,990 | | | | $470,000 | |
Long-term capital gains | | | 140,500,169 | | | | 96,399,953 | | | | 146,900,127 | | | | 100,000,050 | | | | 1,372,981 | | | | 819,987 | |
| | | | | | | | | | | | | | | | | | | | | | | | |
Total distributions | | | $182,500,158 | | | | $104,399,953 | | | | $181,600,180 | | | | $107,200,051 | | | | $2,318,971 | | | | $1,289,987 | |
| | | | | | | | | | | | | | | | | | | | | | | | |
| | | | | | | | | | | | | | | | | | | | | | | | |
| | | Ariel International Fund | | | Ariel Global Fund | | | | |
| | | 03/31/22 | | | 09/30/21 | | | 03/31/22 | | | 09/30/21 | | | | | | | |
| Distributions from: | | | | | | | | | | | | | | | | | | | | | | | | |
Ordinary income | | | $21,000,000 | | | | $12,300,000 | | | | $4,075,000 | | | | $1,350,000 | | | | | | | | | |
Long-term capital gains | | | — | | | | — | | | | — | | | | — | | | | | | | | | |
| | | | | | | | | | | | | | | | | | | | | | | | |
Total distributions | | | $21,000,000 | | | | $12,300,000 | | | | $4,075,000 | | | | $1,350,000 | | | | | | | | | |
| | | | | | | | | | | | | | | | | | | | | | | | |
Reclassifications between net asset accounts are made at the end of the fiscal year for such differences that are permanent in nature. These differences are primarily due to merger adjustments, distribution reclassifications, net operating loss, or foreign currency.
NOTE FIVE | INVESTMENT ADVISORY AND OTHER TRANSACTIONS WITH RELATED PARTIES
Management fees—Ariel Investments, LLC (the “Adviser”) provides investment advisory and administrative services to Ariel Fund, Ariel Appreciation Fund and Ariel Focus Fund under a Management Agreement. The Adviser provides investment advisory services to Ariel International Fund and Ariel Global Fund under an Advisory Agreement (collectively, the “Agreements”). Pursuant to the Agreements, the Adviser is paid a monthly fee on average daily net assets at the annual rates shown below:
46 SLOW AND STEADY WINS THE RACE
| | |
Notes to the financial statements | | 03/31/22 (UNAUDITED) |
|
| | | | | | | | | | | | | | | | | | | | |
Management fees | | Ariel Fund | | | Ariel Appreciation
Fund | | | Ariel Focus Fund | | | Ariel International
Fund | | | Ariel Global Fund | |
| | | | |
Average daily net assets: | | | | | | | | | | | | | | | | | |
First $500 million | | | 0.65 | % | | | 0.75 | % | | | 0.65 | % | | | 0.80 | % | | | 0.80 | % |
Next $500 million | | | 0.60 | % | | | 0.70 | % | | | 0.60 | % | | | 0.80 | % | | | 0.80 | % |
Over $1 billion | | | 0.55 | % | | | 0.65 | % | | | 0.55 | % | | | 0.75 | % | | | 0.75 | % |
The Adviser has contractually agreed to reimburse the Funds to the extent their respective total annual operating expenses (excluding brokerage, interest, taxes, distribution plan expenses and extraordinary items) exceed certain limits as shown below:
| | | | | | | | | | | | | | | | |
| | | | | | | | | Ariel Focus Fund | |
| | | Ariel Fund
Investor Class | | | Ariel Appreciation Fund
Investor Class | | | Investor Class | | | Institutional Class | |
First $30 million | | | 1.50% | | | | 1.50% | | | | — | | | | — | |
| | | | |
Over $30 million | | | 1.00% | | | | 1.00% | | | | — | | | | — | |
| | | | |
On average daily net assets | | | — | | | | — | | | | 1.00% | | | | 0.75% | |
| | | | |
Expiration of waivers* | | | — | | | | — | | | | 2023 | | | | 2023 | |
| | | | | | | | | | | | | | | | |
| | | Ariel International Fund | | | Ariel Global Fund | |
| | | | |
| | | Investor Class | | | Institutional Class | | | Investor Class | | | Institutional Class | |
On average daily net assets | | | 1.13% | | | | 0.88% | | | | 1.13% | | | | 0.88% | |
| | | | |
Expiration of waivers* | | | 2023 | | | | 2023 | | | | 2023 | | | | 2023 | |
| * | Through September 30 of the respective year. After this date, there is no assurance that such expenses will be limited. The Adviser has no right to recapture previously-waived fees. |
Distribution fees—Ariel Distributors, LLC is the Funds’ distributor and principal underwriter (the “Distributor”). The Trust has adopted a plan of distribution under Rule 12b-1 of the 1940 Act for the Investor Class of the Funds. Under the plan, the Investor Class of each Fund pays 12b-1 distribution fees calculated at an annual rate of 0.25% of average daily net assets on a weekly basis to the Distributor for its services. For the six months ended March 31, 2022, distribution fee expenses were as follows:
| | | | | | | | | | | | | | | | | | | | |
| | | | | |
| | | Ariel Fund | | | Ariel Appreciation
Fund | | | Ariel Focus Fund | | | Ariel International
Fund | | | Ariel Global Fund | |
Paid to Distributor | | | $2,126,211 | | | | $1,383,301 | | | | $65,143 | | | | $30,694 | | | | $15,620 | |
| | | | | |
Paid to Broker/Dealers | | | 1,644,956 | | | | 1,020,869 | | | | 35,779 | | | | 23,979 | | | | 9,194 | |
The remaining amounts were used by the Distributor to offset the costs of marketing, advertising, and other distribution expenses.
Trustees’ fees—Trustees’ fees and expenses represent only those expenses of disinterested (independent) trustees of the Funds.
NOTE SIX | FORWARD CURRENCY CONTRACTS
Net realized gain (loss) and the Change in net unrealized appreciation (depreciation) on forward currency contracts as reflected in the Statements of Operations as well as the Volume of forward currency contracts measured by the number of trades during the year, and the Average notional value of the forward currency contracts for the six months ended March 31, 2022 were:
| | | | | | | | |
| | |
| | | Ariel International Fund | | | Ariel Global Fund | |
| | |
Net realized gain (loss) on forward currency contracts | | | $(5,482,604) | | | | $1,485,539 | |
| | |
Change in net unrealized appreciation (depreciation) on forward currency contracts | | | $1,625,868 | | | | $(202,193) | |
| | |
Volume of forward currency contracts | | | 51 | | | | 46 | |
| | |
Average notional value of forward currency contracts | | | $8,882,275 | | | | $2,071,476 | |
ARIELINVESTMENTS.COM 47
| | |
Notes to the financial statements | | 03/31/22 (UNAUDITED) |
|
Complete lists of forward currency contracts open as of March 31, 2022 are included in the Schedules of Investments for the respective Fund.
NOTE SEVEN | TRANSACTIONS WITH AFFILIATED COMPANIES
If a fund’s holding represents ownership of 5% or more of the voting securities of a company, the company is deemed to be an affiliate of a fund as defined in the 1940 Act. The following transactions were made during the six months ended March 31, 2022 in securities that are deemed to be an affiliated company of the Funds:
| | | | | | | | | | | | | | | | | | | | | | | | | | | | | | | | | | | | |
| | | Share activity | | | Six months ended March 31, 2022 | |
| Security name | | Balance
September 30,
2021 | | | Purchases | | | Sales | | | Balance
March 31,
2022 | | | Value | | | Dividends
credited
to income | | | Amount of
gain (loss)
realized on
sale of shares | | | Amount of
change in
unrealized gain
(loss) on shares | | | Percent
of net
assets | |
Ariel Fund | | | | | | | | | | | | | | | | | | | | | | | | | | | | | | | | | | | | |
Adtalem Global Education, Inc. (Consumer discretionary) | | | 2,600,502 | | | | 1,463,019 | | | | — | | | | 4,063,521 | | | | $120,727,209 | | | | $— | | | | $— | | | | $(19,349,887) | | | | 3.8% | |
| | | | | | | | | |
Core Laboratories NV (Energy)^ | | | 1,190,310 | | | | 1,736,166 | | | | — | | | | 2,926,476 | | | | 92,564,436 | | | | 45,030 | | | | — | | | | 14,108,558 | | | | 2.9 | |
| | | | | | | | | | | | | | | | | | | | | | | | | | | | | | | | | | | | |
| | | | | | | | | | | | | | | | | | | $213,291,645 | | | | $45,030 | | | | $— | | | | $(5,241,329) | | | | 6.7% | |
| | | | | | | | | | | | | | | | | | | | | | | | | | | | | | | | | | | | |
| | | | | | | | | | | | | | | | | | | | | | | | | | | | | | | | | | | | | |
^ This security was not deemed to be an affiliate of the Fund as of September 30, 2021.
NOTE EIGHT | LINE OF CREDIT
The Funds have a $125,000,000 Line of Credit (the “Line”), which is uncommitted, with Northern Trust. The Line is for temporary or emergency purposes such as to provide liquidity for shareholder redemptions. The Funds incur interest expense to the extent of amounts drawn (borrowed) under the Line. Interest is based on the sum of 1.00% and the Federal Funds Effective Rate. As of March 31, 2022, there were no outstanding borrowings under the Line.
For the six months ended March 31, 2022, the details of the borrowings were as follows:
| | | | | | |
| Fund | | Average Daily Borrowings | | Number of Days Outstanding | | Weighted Average Annualized Interest Rate |
Ariel Fund | | $11,338,762 | | 3 | | 1.08% |
Ariel Global Fund | | 2,308,092 | | 2 | | 1.08% |
NOTE NINE | MARKET VOLATILITY
On February 24, 2022, Russia engaged in military actions in the sovereign territory of Ukraine. The current political and financial uncertainty surrounding Russia and Ukraine may increase market volatility and the economic risk of investing in securities in these countries and may also cause uncertainty for the global economy and broader financial markets. The ultimate fallout and long-term impact from these events are not known. The Funds will continue to assess the impact on valuations and liquidity and will take any potential actions needed in accordance with procedures approved by the Board.
48 SLOW AND STEADY WINS THE RACE
| | |
Important supplemental information | | 03/31/22 (UNAUDITED) |
|
PROXY VOTING POLICIES, PROCEDURES AND RECORD
Both a description of the policies and procedures that the Funds’ investment adviser uses to determine how to vote proxies relating to portfolio securities and information regarding how the Funds voted proxies relating to portfolio securities during the most recent 12-month period ended June 30 are available upon request by calling 800-292-7435. Such information for the Funds is also available on the Securities and Exchange Commission’s (“SEC”) website at www.sec.gov.
SHAREHOLDER STATEMENTS AND REPORTS
The Funds attempt to reduce the volume of mail sent to shareholders by sending one copy of financial reports, prospectuses and other regulatory materials to two or more account holders who share the same address. We will send you a notice at least 60 days before sending only one copy of these documents if we have not received written consent from you previously. Should you wish to receive individual copies of materials, please contact us at 800-292-7435. Once we have received your instructions, we will begin sending individual copies for each account within 30 days.
AVAILABILITY OF QUARTERLY PORTFOLIO SCHEDULES
The Funds file complete schedules of investments with the SEC for the quarters ended December 31 and June 30 of each fiscal year as an exhibit to its reports on Form N-PORT. Previously, the Funds filed complete schedules of investments with the SEC for the quarters ended December 31 and June 30 of each fiscal year on Form N-Q. The Fund’s Forms N-PORT and N-Q are available on the SEC’s website at www.sec.gov.
All of the Funds’ quarterly reports contain a complete schedule of portfolio holdings. All quarterly reports are made available to shareholders on the Funds’ website at www.arielinvestments.com. Shareholders also may obtain copies of shareholder reports upon request by calling 800-292-7435 or by writing to Ariel Investment Trust, c/o U.S. Bank Global Fund Services, P.O. Box 701, Milwaukee, Wisconsin, 53201-0701.
LIQUIDITY NARRATIVE FOR SHAREHOLDERS
Consistent with Rule 22e-4 under the Investment Company Act of 1940, as amended, the Funds have established a liquidity risk management program to govern their approach to managing liquidity risk (“Program”). The Program is overseen by the Liquidity Risk Management Committee (“LRMC”), a committee comprised of representatives of the Funds’ investment adviser, Ariel Investments, LLC. The Funds’ Board of Trustees (“Board”) has approved the designation of the LRMC to oversee the Program.
The Program’s principal objectives include supporting each Fund’s compliance with limits on investments in illiquid assets and mitigating the risk that a Fund will be unable to meet its redemption obligations in a timely manner. The Program also includes a number of elements that support the management and assessment of liquidity risk, including an annual assessment of factors that influence a Fund’s liquidity, and the periodic classification and re-classification of a Fund’s investments into groupings that reflect the LRMC’s assessment of their relative liquidity under current market conditions.
During the period covered by the report, there were no liquidity events that impacted the Funds or their respective ability to timely meet redemptions without dilution to existing shareholders. The LRMC has determined, and reported to the Board, that the Program has operated adequately and effectively to manage the Funds’ liquidity risk during the year ended December 31, 2021.
There can be no assurance that the Program will achieve its objectives in the future. Please refer to your Fund’s prospectus for more information regarding the Fund’s exposure to liquidity risk and other principal risks to which an investment in the Fund may be subject.
APPROVAL OF THE MANAGEMENT AGREEMENTS
Each year the Board of Trustees of the Trust (the “Board”), including a majority of the Trustees who are not “interested persons” of the Adviser or the Funds (“Independent Trustees”), is required by the 1940 Act to determine whether to continue each Fund’s management and advisory agreements with the Adviser (together the “Agreements”). At a meeting held in November 2021, the Board, including all of the Independent Trustees, upon recommendation of the Board’s Management Contracts Committee (the “Committee”), determined that the continuation of the Agreements was in the best interest of each Fund and its shareholders, and approved the continuation of each Agreement.
The Committee, which is comprised entirely of Independent Trustees and includes all Independent Trustees, led the Board in its consideration of the Agreements. In evaluating the Agreements with respect to each Fund, both the Committee and the Board held meetings in November 2021 to review and evaluate materials provided by the Adviser in response to questions submitted by the
ARIELINVESTMENTS.COM 49
| | |
Important supplemental information | | 03/31/22 (UNAUDITED) |
|
Independent Trustees and counsel that is independent of the Adviser (“Independent Counsel”). At its meetings, the Committee received presentations from members of management of the Adviser and from the portfolio manager(s) of each Fund. In addition, the Committee members received a memorandum from Independent Counsel describing the factors they should consider in performing their review, a supplemental report (the “Broadridge Report”) prepared by Broadridge, an independent provider of investment company data, and additional written material and presentations from the Adviser. During the meetings, the Committee was advised by, and met in executive session with, Independent Counsel. In connection with its deliberations, the Committee also considered a broad range of information relevant to the Board’s annual review of the Agreements that is provided to the Board and its various standing committees at meetings throughout the year, including investment performance reports and related portfolio information for each Fund, as well as periodic reports on, among other matters, pricing and valuation; brokerage and execution; compliance; and shareholder and other services provided by the Adviser, its affiliates, and the Funds’ other service providers.
Nature, Extent and Quality of Services. The Committee considered the Adviser’s specific responsibilities in the day-to-day management of the Funds, also taking into account information received at quarterly Board meetings related to the services rendered by the Adviser and the Independent Trustees’ knowledge of the Adviser’s operations. In addition, the Committee considered the Adviser’s historical approach in managing the Funds; the consistency of the Adviser’s investment approach; the background, education and experience of the Adviser’s investment personnel; the nature and quality of the Adviser’s services, including, among other things, compliance matters such as the Funds’ Liquidity Risk Management Program, trading practices, broker approval and selection, shareholder communications, Fund marketing and distribution strategies, information technology, and cybersecurity protections; and the Adviser’s commitment to diversity and civic affairs. The Committee also considered whether each Fund had operated within its investment objectives and each Fund’s record of compliance with its investment restrictions and other regulatory requirements. The Committee also considered information regarding the structure of the Adviser’s compensation program for portfolio managers and certain other employees, including with respect to the Adviser’s ability to attract and retain quality personnel. The Committee also considered the personal investments made by the Adviser’s personnel in the Funds, which aligns the interests of the Adviser and its personnel with those of the Funds’ shareholders.
Investment Performance. The Committee discussed with the Adviser’s portfolio managers factors that contributed to each Fund’s comparative performance as measured against its Broadridge Peer Group. The Committee considered the investment performance of both the Investor and Institutional Classes of each Fund over time, including information provided in the Broadridge Report, comparing each Fund’s performance with that of comparable funds selected by Broadridge (the “Peer Group” or “Broadridge Peer Group”) as well as an analysis of Fund performance as compared to the performance of its benchmark over specific historical periods. For each period, the Broadridge report ranks each fund with the highest investment performance at the top, the fund with the lowest investment performance at the bottom and separates the Peer Group into five levels that each contain 20% of the universe (“quintiles”), with the top 20% being the first quintile and the bottom 20% being the fifth quintile. Where applicable, the Committee considered the one-, two-, three-, four-, five-, and ten-year periods for the fiscal year ended September 30, 2021. In the case of those Funds that underperformed their Broadridge Peer Group in one or more periods, the Committee discussed with the Adviser factors that caused such underperformance; considered the Adviser’s long-term investment process; and noted that the long-term track records supported the investment philosophy that, over time, consistent implementation of the investment approach should result in positive performance, but also would involve periods of underperformance.
Fees and Expenses. The Committee considered comparative fee and expense information for each Fund’s Expense Group, as selected and analyzed in the Broadridge Report, which ranks funds with the lowest fee at the top, the funds with the highest fee at the bottom and separates the Expense Group into five levels that each contain 20% of the universe (“quintiles”), with the top being the first quintile and the bottom being the fifth quintile. The Committee also considered the historical expenses with respect to economies of scale realized by the Adviser and whether such benefits were being passed on to shareholders, such as through the use of breakpoints in the Adviser’s management fees. The Committee considered the impact of the Rule 12b-1 distribution services (“12b-1”) fees on the total expense ratio of the Investor Class of shares for all Funds and the resulting negative impact on the Funds’ Investor Class total expense ratio when compared to funds in their respective Broadridge Expense Groups that do not impose 12b-1 fees. The Committee observed that the Peer Group comparisons for the Funds’ Institutional Class shares were more illustrative since the Institutional Class does not charge 12b-1 fees.
The Committee considered the fees charged and services provided by Ariel to other types of clients and the rationale for any differences between those fees. The Committee also considered the revenue sharing payments made by the Adviser.
The Committee considered the following with respect to the investment performance and fees and expenses of each Fund for the fiscal year ended September 30, 2021:
50 SLOW AND STEADY WINS THE RACE
| | |
Important supplemental information | | 03/31/22 (UNAUDITED) |
|
Ariel Fund. Ariel Fund’s Investor Class performance ranked in the first quintile for the one-year, five-year and ten-year periods as compared to its Broadridge Peer Group. The Fund’s Institutional Class performance ranked in the first quintile for the one-year and five-year periods as compared to its Broadridge Peer Group.
The actual management fees for Ariel Fund (both share classes) ranked in the first quintile as compared to its Broadridge Expense Group. The total expenses for the Ariel Fund’s Investor Class ranked in the third quintile, and the Fund’s Institutional Class ranked in the first quintile as compared to its Broadridge Expense Group.
Ariel Appreciation Fund. Ariel Appreciation Fund’s Investor Class performance ranked in the third quintile for the one-year and five-year periods and the second quintile for the ten-year period as compared to its Broadridge Peer Group. The Fund’s Institutional Class performance ranked in the third quintile for the one-year period and the second quintile for the five-year period as compared to its Broadridge Peer Group.
The actual management fees for Ariel Appreciation Fund’s Investor Class ranked in the second quintile and the Fund’s Institutional Class ranked in the third quintile as compared to its Broadridge Expense Group. The total expenses for the Ariel Appreciation Fund’s Investor Class ranked in the fourth quintile and the Fund’s Institutional Class ranked in the third quintile as compared to its Broadridge Expense Group.
Ariel Focus Fund. Ariel Focus Fund’s Investor Class performance ranked in the second quintile for the one-year period, the third quintile for the five-year period and the fifth quintile for the ten-year period as compared to its Broadridge Peer Group. The Fund’s Institutional Class performance ranked in the second quintile for the one-year period and in the third quintile for the five-year period as compared to its Broadridge Peer Group.
The Fund had fee reimbursements and expense limitations in place which resulted in reduced fees and/or expenses. The actual management fees for Ariel Focus Fund’s Investor Class ranked in the second quintile and the Fund’s Institutional Class ranked in the third quintile as compared to its Broadridge Expense Group. The total expenses for the Ariel Focus Fund (both share classes) ranked in the first quintile as compared to its Broadridge Expense Group.
Ariel International Fund. Ariel International Fund’s Investor Class performance ranked in the fifth quintile for the one-year and five-year periods as compared to its Broadridge Peer Group. The Fund’s Institutional Class performance ranked in the fifth quintile for the one-year and five-year periods as compared to its Broadridge Peer Group.
The Fund had fee reimbursements and expense limitations in place which resulted in reduced fees and/or expenses. The actual management fees for Ariel International Fund’s Investor Class ranked in the first quintile and the Fund’s Institutional Class ranked in the third quintile as compared to its Broadridge Expense Group. The total expenses for the Ariel International Fund (both share classes) ranked in the third quintile as compared to its Broadridge Expense Group.
Ariel Global Fund. Ariel Global Fund’s Investor Class performance ranked in the fifth quintile for the one-year and five-year periods as compared to its Broadridge Peer Group. The Fund’s Institutional Class performance ranked in the fifth quintile for the one-year period and in the fourth quintile for the five-year period as compared to its Broadridge Peer Group.
The Fund had fee reimbursements and expense limitations in place, which resulted in reduced fees and/or expenses. The actual management fees for Ariel Global Fund’s Investor Class ranked in the first quintile and the Fund’s Institutional Class ranked in the fifth quintile as compared to its Broadridge Expense Group. The total expenses for the Ariel Global Fund’s Investor Class ranked in the third quintile and the Fund’s Institutional Class ranked in the second quintile as compared to its Broadridge Expense Group.
Profitability and Economies of Scale. The Committee considered the profitability to the Adviser from its relationship with each Fund, including the methodology by which that profitability analysis was calculated. The Committee also considered the fee reimbursements and expense limitations in place for Ariel Focus Fund, Ariel International Fund, and Ariel Global Fund. The Committee considered the extent to which economies of scale may be realized as Funds increase in size and that the management fee schedule for each Fund contains breakpoints at different levels. The Committee considered the effective advisory fee rates for the Funds and whether the advisory fee schedules provide an appropriate sharing between the Funds and the Adviser of such economies of scale as may exist under the Agreements. The Committee considered information about the Funds’ soft dollar arrangements that benefit the Adviser, as well as the Adviser’s brokerage and trading practices. The Committee also considered ancillary benefits, including whether the Funds benefited from Mr. Rogers’ and Ms. Hobson’s high media profiles.
ARIELINVESTMENTS.COM 51
| | |
Important supplemental information | | 03/31/22 (UNAUDITED) |
|
Approval. After full consideration of the above factors, as well as other factors that were instructive in evaluating the Agreements, the Board, including all of the Independent Trustees, concluded that continuation of each Fund’s Agreement was in the best interests of each Fund and its respective shareholders, and the Board approved the continuation of each Agreement. In reaching this determination, the Board considered that the nature, extent and quality of the services provided by the Adviser to each Fund were appropriate and consistent with the Fund’s Agreement; the Adviser’s commitment to its stated investment strategy and identified circle of competency, and its calm, reasoned and long-term approach to investing; that the management fees paid by each Fund were reasonable in light of the services provided; that the breakpoints in the fee schedule for each Fund have the potential to allow shareholders to benefit from economies of scale; that the profitability associated with the Adviser’s relationship with the Trust was within a reasonable range and was neither excessive nor so low that the Adviser could not be expected to continue to service the Funds effectively; and that the benefits accruing to the Adviser by virtue of its relationship with the Funds were reasonable in light of the costs of providing the investment management services and the benefits accruing to each Fund. The Board’s determinations were based upon a comprehensive consideration of all information provided to it, including both quantitative measures and qualitative factors, and were not the result of any single factor.
52 SLOW AND STEADY WINS THE RACE
| | |
Fund expense example | | 03/31/22 (UNAUDITED) |
|
EXAMPLE
As a shareholder of the Funds, you incur ongoing costs, including management fees, distribution and service (12b-1) fees and other Fund expenses. The Funds currently do not charge any transaction costs, such as sales charges (loads) on subscriptions, reinvested dividends or other distributions, redemption fees or exchange fees. The following example is intended to help you understand your ongoing costs (in dollars) of investing in each of the Funds and to compare these costs with the ongoing costs of investing in other mutual funds. Please note that IRA, 403(b) and Coverdell ESA account holders are charged an annual $15 recordkeeping fee or a one-time, lifetime $60 fee. If these fees were included in either the Actual Expense or Hypothetical Example below, your costs would be higher.
The example is based on an investment of $1,000 invested at the beginning of the period and held for the entire period of October 1, 2021 - March 31, 2022.
ACTUAL EXPENSES
The left portion of the table below for each Fund provides information about actual account values and actual expenses for that particular Fund. You may use the information in each of these lines, together with the amount you invested, to estimate the expenses that you paid over the period in each Fund. Simply divide your account value by $1,000 (for example, an $8,600 account value divided by $1,000=8.6), then multiply the result by the number under the heading, entitled “Expenses Paid During Period”, to estimate the expenses you paid on your account during this period in each Fund.
HYPOTHETICAL EXAMPLE FOR COMPARISON PURPOSES
The right portion of the table below for each Fund provides information about hypothetical account values and hypothetical expenses based on each Fund’s actual expense ratio and an assumed rate of return of 5% per year before expenses, which is not the actual return. The hypothetical account values and expenses may not be used to estimate the actual ending account balance or expenses you paid for the period. You may use this information to compare the ongoing costs of investing in each of the Funds to other funds. To do so, compare this 5% hypothetical example with the 5% hypothetical examples that appear in the shareholder reports of other funds.
Please note that the expenses shown in the table are meant to highlight only your ongoing costs in each of the Funds. Therefore, the right portion of the table for each Fund is useful in comparing ongoing costs only, and will not help you determine the relative total costs of owning different funds.
| | | | | | | | | | | | | | | | | | | | | | | | |
| | | | | | Actual* | | | Hypothetical (5% return before expenses) | | | | |
| Fund and Return | | Beginning
Account Value
10/01/21 | | | Ending
Account Value
03/31/22 | | | Expenses
Paid During
Period | | | Ending
Account Value
03/31/22 | | | Expenses
Paid During
Period | | | Annualized
Expense
Ratio | |
| | | | | | |
Ariel Fund | | | | | | | | | | | | | | | | | | | | | | | | |
Investor Class | | | $1,000.00 | | | | $982.60 | | | | $4.89 | | | | $1,020.00 | | | | $4.99 | | | | 0.99 | % |
Institutional Class | | | 1,000.00 | | | | 984.20 | | | | 3.26 | | | | 1,021.64 | | | | 3.33 | | | | 0.66 | % |
| | | | | | |
Ariel Appreciation Fund | | | | | | | | | | | | | | | | | | | | | | | | |
Investor Class | | | $1,000.00 | | | | $1,021.60 | | | | $5.54 | | | | $1,019.45 | | | | $5.54 | | | | 1.10 | % |
Institutional Class | | | 1,000.00 | | | | 1,023.20 | | | | 3.98 | | | | 1,020.99 | | | | 3.98 | | | | 0.79 | % |
| | | | | | |
Ariel Focus Fund | | | | | | | | | | | | | | | | | | | | | | | | |
Investor Class | | | $1,000.00 | | | | $1,091.20 | | | | $5.21 | | | | $1,019.95 | | | | $5.04 | | | | 1.00 | % |
Institutional Class | | | 1,000.00 | | | | 1,092.50 | | | | 3.91 | | | | 1,021.19 | | | | 3.78 | | | | 0.75 | % |
| | | | | | |
Ariel International Fund | | | | | | | | | | | | | | | | | | | | | | | | |
Investor Class | | | $1,000.00 | | | | $1,014.60 | | | | $5.68 | | | | $1,019.30 | | | | $5.69 | | | | 1.13 | % |
Institutional Class | | | 1,000.00 | | | | 1,016.00 | | | | 4.42 | | | | 1,020.54 | | | | 4.43 | | | | 0.88 | % |
| | | | | | |
Ariel Global Fund | | | | | | | | | | | | | | | | | | | | | | | | |
Investor Class | | | $1,000.00 | | | | $1,057.30 | | | | $5.80 | | | | $1,019.30 | | | | $5.69 | | | | 1.13 | % |
Institutional Class | | | 1,000.00 | | | | 1,058.00 | | | | 4.52 | | | | 1,020.54 | | | | 4.43 | | | | 0.88 | % |
* Expenses are calculated using each Portfolio’s annualized expense ratio (as disclosed in the table), multiplied by the average account value for the period, multiplied by the number of days in the most recent half fiscal year (182), and divided by the number of days in the current year (365).
ARIELINVESTMENTS.COM 53
| | | | | | | | |
| Name and age | | Position(s) held with Fund | | Term of office and length of time served | | Principal occupation(s)
during past 5 years | | Other directorships |
INDEPENDENT TRUSTEES: | | | | | | |
William C. Dietrich Age: 72 | | Lead Independent Trustee, Chair of Executive Committee, Member of Management Contracts, Audit and Governance Committees | | Indefinite, until successor elected; Trustee since 1986 | | Retired Executive Director, Shalem Institute for Spiritual Formation, Inc., 2006 to 2009 | | |
Eric H. Holder, Jr. Age: 71 | | Trustee, Chair of Governance Committee, Member of Management Contracts and Audit Committees | | Indefinite, until successor elected; Trustee since 2019 | | Partner, Covington & Burling since 2015 | | |
Christopher G. Kennedy Age: 58 | | Trustee, Chair of Audit Committee, Member of Management Contracts, Governance, and Executive Committees | | Indefinite, until successor elected; Trustee since 1994 | | Chair, Joseph P. Kennedy Enterprises, Inc. since 2012; Founder (2012) and Chairman (2012-2018, Emeritus since 2018), Top Box Foods | | Interface Inc. |
Kim Y. Lew Age: 55 | | Trustee, Member of Management Contracts, Audit and Governance Committees | | Indefinite, until successor elected; Trustee since 2014 | | President and Chief Executive Officer of the Columbia Investment Management Company since 2020; Vice President and Chief Investment Officer, Carnegie Corporation of New York 2016 to 2020 | | |
Stephen C. Mills Age: 62 | | Trustee, Member of Management Contracts, Audit and Governance Committees | | Indefinite, until successor elected; Trustee since 2015 | | President of Basketball Operations, New York Knicks, 2017 to 2020; NBA Alternate Governor, New York Knicks, 2013 to 2020; General Manager, New York Knicks, 2013 to 2017 | | Selective Insurance Group, Inc.; Madison Square Garden Sports Corp.; and MSG Networks Inc. |
James M. Williams Age: 74 | | Trustee, Chair of Management Contracts Committee, Member of Governance and Audit Committees | | Indefinite, until successor elected; Trustee since 2006 | | Vice President and Chief Investment Officer, J. Paul Getty Trust since 2002 | | SEI Mutual Funds (Mr. Williams oversees a total of 93 SEI Mutual Fund portfolios) |
INTERESTED TRUSTEES: | | | | | | |
Mellody L. Hobson Age: 52 | | Chair of the Board of Trustees and President, Member of Executive Committee | | Indefinite, until successor elected; Trustee since 1993; President since 2002; Chair since 2006 | | Co-CEO since 2019 and President since 2000, Ariel Investments, LLC | | Starbucks Corporation; JPMorgan Chase & Co. |
John W. Rogers, Jr. Age: 64 | | Trustee | | Indefinite, until successor elected; Trustee since 2000 and from 1986 to 1993 | | Founder, Chairman, Chief Investment Officer since 1983, and Co-CEO since 2019 (formerly CEO, 1983-2019) Ariel Investments, LLC; Lead Portfolio Manager, Ariel Fund since 1986 and Co-Portfolio Manager, Ariel Appreciation Fund since 2002 | | McDonald’s Corporation; Nike, Inc.; Ryan Specialty Group Holdings, Inc.; The New York Times Company |
The Statement of Additional Information (SAI) for Ariel Investment Trust includes additional information about the Funds’ Trustees. The SAI is available without charge by calling 800.292.7435 or by logging on to our website, arielinvestments.com.
Note: Number of portfolios in complex overseen by all Trustees is five. Address for all Trustees is 200 East Randolph Street, Suite 2900, Chicago, IL 60601-6505.
54 SLOW AND STEADY WINS THE RACE
| | | | | | | | |
| Name and age | | Position(s) held with Fund | | Term of office and length of time served | | Principal occupation(s)
during past 5 years | | Other directorships |
Mareilé B. Cusack Age: 63 | | Vice President, Anti-Money Laundering Officer and Secretary | | Indefinite, until successor elected; Vice President since 2008; Anti-Money Laundering Officer since 2010; Secretary since 2014; Assistant Secretary, 2008 to 2014 | | Chief Privacy Officer, Ariel Investments, LLC since 2019; Senior Vice President, Ariel Investments, LLC since 2012; Anti-Money Laundering Officer, Ariel Investments, LLC since 2010; General Counsel, Ariel Investments, LLC since 2008 | | |
Wendy D. Fox Age: 59 | | Chief Compliance Officer and Vice President | | Indefinite, until successor elected; Chief Compliance Officer and Vice President since 2014 | | Senior Vice President, Ariel Investments, LLC, since 2017; Chief Compliance Officer, Ariel Investments, LLC since 2004; Vice President, Ariel Investments, LLC, 2004 to 2017 | | |
James R. Rooney Age: 63 | | Chief Financial Officer, Vice President and Treasurer | | Indefinite, until successor elected; Chief Financial Officer, Vice President and Treasurer since 2015 | | Senior Vice President, Fund Administration, Ariel Investments, LLC since 2017; Vice President, Fund Administration, Ariel Investments, LLC, 2015 to 2017 | | |
Note: Number of portfolios in complex overseen by all Officers is five. Address for all officers is 200 East Randolph Street, Suite 2900, Chicago, IL 60601-6505.
ARIELINVESTMENTS.COM 55
IMPORTANT DISCLOSURES
Risks of investing in the Funds
The intrinsic value of the stocks in which the Funds invest may never be recognized by the broader market. The Funds are often concentrated in fewer sectors than their benchmarks, and their performance may suffer if these sectors underperform the overall stock market. Equity investments are affected by market conditions. Ariel Fund, Ariel Appreciation Fund and Ariel Focus Fund invest in small and/or mid-cap companies, which is riskier and more volatile than investing in large cap stocks. Ariel Focus Fund is a non-diversified fund and therefore may be more volatile than a more diversified investment. Ariel International Fund and Ariel Global Fund invest in foreign securities and may use currency derivatives and ETFs. Investments in foreign securities may underperform and may be more volatile than comparable U.S. stocks because of the risks involving foreign economies and markets, foreign political systems, foreign regulatory standards, foreign currencies and taxes. The International and Global Funds’ use of currency derivatives and ETFs may increase investment losses and expenses and create more volatility. The International and Global Funds’ investments in emerging markets present additional risks, such as difficulties selling on a timely basis and at an acceptable price.
Specific stocks held by the Funds
In this report, we candidly discuss specific stocks held by the Funds. Our opinions are current as of the date they were written but are subject to change. We want to remind investors that the information in this report is not sufficient on which to base an investment decision and should not be considered a recommendation to purchase or sell any particular security.
Please read the Funds’ prospectuses
Investors should consider carefully the investment objectives, risks, and charges and expenses before investing. For a current summary prospectus or full prospectus which contains this and other information about the Funds offered by Ariel Investment Trust, call us at 800.292.7435 or visit our website, arielinvestments.com. Please read the summary prospectus or full prospectus carefully before investing. Distributed by Ariel Distributors, LLC, a wholly owned subsidiary of Ariel Investments, LLC. Ariel Distributors, LLC is a member of the Securities Investor Protection Corporation.
56 SLOW AND STEADY WINS THE RACE
INFORMATION ABOUT THE FUNDS’ INDEXES AND THE GICS SECTOR CLASSIFICATION STANDARDS
The Russell 2500™ Value Index measures the performance of the small to mid-cap value segment of the U.S. equity universe. It includes those Russell 2500 companies with lower price-to-book ratios and lower forecasted growth values. This index pertains to Ariel Fund.
The Russell 2500™ Index measures the performance of the small to mid-cap segment of the U.S. equity universe, commonly referred to as “smid” cap. The Russell 2500 Index is a subset of the Russell 3000® Index. It includes approximately 2,500 of the smallest securities based on a combination of their market cap and current index membership. This index pertains to Ariel Fund.
The Russell Midcap® Value Index measures the performance of the mid-cap value segment of the U.S. equity universe. It includes those Russell Midcap Index companies with lower price-to-book ratios and lower forecasted growth values. This index pertains to Ariel Appreciation Fund.
The Russell Midcap® Index measures the performance of the mid-cap segment of the U.S. equity universe. The Russell Midcap Index is a subset of the Russell 1000® Index. It includes approximately 800 of the smallest securities based on a combination of their market cap and current index membership. This index pertains to Ariel Appreciation Fund.
The Russell 1000® Value Index measures the performance of the large-cap value segment of the U.S. equity universe. It includes those Russell 1000 companies with lower price-to-book ratios and lower expected growth values. This index pertains to Ariel Focus Fund.
The S&P 500® Index is the most widely accepted barometer of large cap U.S. equities. It includes 500 leading companies. This index pertains to Ariel Fund, Ariel Appreciation Fund and Ariel Focus Fund.
The MSCI EAFE Index is an unmanaged, market-weighted index of companies in developed markets, excluding the U.S. and Canada. The MSCI EAFE Value Index captures large and mid cap securities exhibiting overall value style characteristics across Developed Markets countries around the world, excluding the US and Canada. These indexes pertain to Ariel International Fund.
The MSCI ACWI (All Country World Index) ex-US Index is an unmanaged, market-weighted index of global developed and emerging markets, excluding the United States. The MSCI ACWI ex-US Value Index captures large and mid cap securities exhibiting overall value style characteristics across 22 Developed and 25 Emerging Markets countries. These indexes pertain to Ariel International Fund.
The MSCI ACWI (All Country World Index) Index is an unmanaged, market weighted index of global developed and emerging markets. The MSCI ACWI Value Index captures large and mid cap securities exhibiting overall value style characteristics across 23 Developed Markets countries and 25 Emerging Markets (EM) countries. These indexes pertain to Ariel Global Fund.
All MSCI Index net returns reflect the reinvestment of income and other earnings, including the dividends net of the maximum withholding tax applicable to non-resident institutional investors that do not benefit from double taxation treaties. MSCI uses the maximum tax rate applicable to institutional investors, as determined by the companies’ country of incorporation.
Frank Russell Company (“Russell”) is the source and owner of the trademarks, service marks and copyrights related to the Russell Indexes. Russell® is a trademark of Frank Russell Company. Neither Russell nor its licensors accept any liability for any errors or omissions in the Russell Indexes or underlying data and no party may rely on any Russell Indexes and/or underlying data contained in this communication. No further distribution of Russell data is permitted without Russell’s express written consent. Russell does not promote, sponsor or endorse the content of this communication.
MSCI makes no express or implied warranties or representations and shall have no liability whatsoever with respect to any MSCI data contained herein. The MSCI data may not be further redistributed or used to create indices or financial products. This report is not approved or produced by MSCI. Source: MSCI.
GICS was developed by and is the exclusive property and a service mark of MSCI Inc. (“MSCI”) and Standard & Poor’s, a division of The McGraw-Hill Companies, Inc. (“S&P”) and is licensed for use by Ariel Investments, LLC. Neither MSCI, S&P nor any third party involved in making or compiling the GICS or any GICS classifications makes any express or implied warranties or representations with respect to such standard or classification (or the results to be obtained by the use thereof), and all such parties hereby expressly disclaim all warranties of originality, accuracy, completeness, merchantability and fitness for a particular purpose with respect to any of such standard or classification. Without limiting any of the foregoing, in no event shall MSCI, S&P, any of their affiliates or any third party involved in making or compiling the GICS or any GICS classifications have any liability for any direct, indirect, special, punitive, consequential or any other damages (including lost profits) even if notified of the possibility of such damages.
ARIELINVESTMENTS.COM 57
Ariel Investment Trust
c/o U.S. Bank Global Fund Services
P.O. Box 701
Milwaukee, WI 53201-0701
800.292.7435
• arielinvestments.com
• linkedin.com/company/ariel-investments
• instagram.com/arielinvestments
• twitter.com/arielinvests
What’s inside
| • | | Mining for Value Co-CEOs Mellody Hobson and John W. Rogers, Jr. share their playbook for exploiting market volatility to unlock future gains. |
| • | | Sticking with It Vice Chairman Charlie Bobrinskoy on the themes he predicted would dominate in equity markets—and have—in the first quarter. |
| • | | Beware of “The Four Ls” Chief Investment Officer of Global Equities Rupal Bhansali warns investors to avoid Lofty Valuations, Loss Making Companies, Leveraged Balance Sheets and Liquidity Risk. |
| • | | Spotlights Perspectives from our domestic research team on Boyd Gaming (NYSE: BYD), Masco Corporation (NYSE: MAS) and Progressive Corporation (NYSE: PGR). |
| | | | |
 | | Slow and steady wins the race. | | The materials used to produce this report were sourced responsibly. The paper used along with the packaging are all recyclable. TPI (3,586) ©05/22 AI–01 |
(b) Not applicable.
Item 2. Code of Ethics.
Not applicable for the reporting period.
Item 3. Audit Committee Financial Expert.
Not applicable for the reporting period.
Item 4. Principal Accountant Fees and Services.
Not applicable for the reporting period.
Item 5. Audit Committee of Listed Registrants.
Not applicable.
Item 6. Investments.
(a) Included as part of the report to shareholders filed under Item 1(a) of this Form.
(b) Not applicable.
Item 7. Disclosure of Proxy Voting Policies and Procedures for Closed-End Management Investment Companies.
Not applicable.
Item 8. Portfolio Managers of Closed-End Management Investment Companies.
Not applicable.
Item 9. Purchases of Equity Securities by Closed-End Management Investment Company and Affiliated Purchasers.
Not applicable.
Item 10. Submission of Matters to a Vote of Security Holders.
There have been no changes to the procedures by which shareholders may recommend nominees to the registrant’s Board of Trustees.
Item 11. Controls and Procedures.
(a) The registrant’s certifying officers have reasonably designed such disclosure controls and procedures to ensure material information relating to the registrant is made known to them by others, particularly during the period in which this report is being prepared. The registrant’s certifying officers have determined that the registrant’s disclosure controls and procedures are effective based on their evaluation of these controls and procedures as of a date within 90 days prior to the filing date of this report.
(b) There were no significant changes in the registrant’s internal controls over financial reporting, or in other factors that could significantly affect these controls, that occurred during the period covered by this report, including any corrective actions with regard to significant deficiencies and material weaknesses.
Item 12. Disclosure of Securities Lending Activities for Closed-End Management Investment Companies.
Not applicable.
Item 13. Exhibits.
(a)(1) Code of Ethics – Not applicable for the reporting period.
(a)(2) Certification for each principal executive and principal financial officer of the registrant as required by Rule 30a-2 under the Act (17 CFR 270.30a-2(a)) – Filed as an attachment to this filing.
(a)(3) Written solicitation to purchase securities under Rule 23c-1 – Not applicable.
(a) (4) There has been no change to the registrant’s independent public accountant.
(b) Certifications required by Rule 30a-2(b) under the Act (17 CFR 270.30a-2(b)), Rule 13a-14(b) or Rule 15d-14(b) under the Exchange Act (17 CFR 240.13a-14(b) or 240.15d-14(b)), and Section 1350 of Chapter 63 of Title 18 of the United States Code (18 U.S.C. 1350). A certification furnished pursuant to this paragraph will not be deemed “filed” for purposes of Section 18 of the Securities Exchange Act of 1934, as amended, or otherwise subject to the liability of that section. Such certification will not be deemed to be incorporated by reference into any filing under the Securities Act of 1933 or the Exchange Act, except to the extent that the registrant specifically incorporates it by reference - Filed as an attachment to this filing.
SIGNATURES
Pursuant to the requirements of the Securities Exchange Act of 1934 and the Investment Company Act of 1940, the registrant has duly caused this report to be signed on its behalf by the undersigned, thereunto duly authorized.
| | |
| Ariel Investment Trust |
| |
| By: | | /s/ Mellody L. Hobson |
| | Mellody L. Hobson |
| | President |
| | (Principal Executive Officer) |
Date: May 24, 2022
Pursuant to the requirements of the Securities Exchange Act of 1934 and the Investment Company Act of 1940, this report has been signed below by the following persons on behalf of the registrant and in the capacities and on the dates indicated.
| | |
| By: | | /s/ Mellody L. Hobson |
| | Mellody L. Hobson |
| | President |
| | (Principal Executive Officer) |
Date: May 24, 2022
| | |
| By: | | /s/ James R. Rooney |
| | James R. Rooney |
| | Vice President, Chief Financial Officer and Treasurer (Principal Financial Officer) |
Date: May 24, 2022