As filed with the Securities and Exchange Commission on May 24, 2023
UNITED STATES
SECURITIES AND EXCHANGE COMMISSION
Washington, D.C. 20549
FORM N-CSR
CERTIFIED SHAREHOLDER REPORT OF REGISTERED
MANAGEMENT INVESTMENT COMPANIES
Investment Company Act File Number 811-4786
Ariel Investment Trust
(Exact name of registrant as specified in charter)
200 East Randolph Street
Suite 2900
Chicago, Illinois, 60601
(Address of principal executive offices) (Zip code)
Emma Rodriguez-Ayala, Esq.
200 East Randolph Street
Suite 2900
Chicago, Illinois 60601
(Name and address of agent for service)
with a copy to:
Arthur Don, Esq.
Greenberg Traurig, LLP
77 West Wacker Drive
Suite 3100
Chicago, IL 60601
Registrant’s telephone number, including area code: (312) 726-0140
Date of fiscal year end: September 30
Date of reporting period: March 31, 2023
Item 1. Reports to Stockholders.
(a) The following is a copy of the report transmitted to shareholders pursuant to Rule 30e-1 under the Investment Company Act of 1940 (the “Act”) (17 CFR 270.30e-1):

SEMI-ANNUAL REPORT March 31 | 2023

Ariel Investment Trust c/o U.S. Bank Global Fund Services P.O. Box 701 Milwaukee, WI 53201-0701 800.292.7435 • arielinvestments.com • linkedin.com/company/ariel-investments • instagram.com/arielinvestments • twitter.com/arielinvests

| | | | | | |
| | |  | | | | Ariel Fund Ariel Appreciation Fund |
| | | | |
| | | | As of March 31, 2023 |
| | | | | | | | | | | | | | | | | | | | | | | | | | | | | | |
|
Average Annual Total Returns (%) | |
| | | | | | |
| | | Quarter | | 1-Year | | 3-Year | | 5-Year | | 10-Year | | Since
Inception* |
| | | | | | |
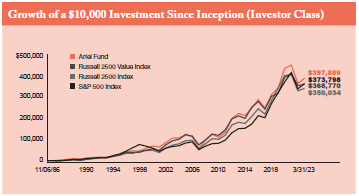
Ariel Fund | | | | 6.66 | | | | | -8.74 | | | | | 24.18 | | | | | 5.80 | | | | | 9.06 | | | | | 10.65 | |
| | | | | | |
Russell 2500 Value Index | | | | 1.40 | | | | | -10.53 | | | | | 21.82 | | | | | 5.61 | | | | | 7.72 | | | | | 10.42 | |
| | | | | | |
Russell 2500 Index | | | | 3.39 | | | | | -10.39 | | | | | 19.43 | | | | | 6.65 | | | | | 9.07 | | | | | 10.26 | |
| | | | | | |
S&P 500 Index | | | | 7.50 | | | | | -7.73 | | | | | 18.62 | | | | | 11.19 | | | | | 12.24 | | | | | 10.46 | |
* The inception date for Ariel Fund is 11/06/86. | | | | | | | | | | | | | | | | | | | | | | | | | | |
|
Average Annual Total Returns (%) | |
| | | | | | |
| | | Quarter | | 1-Year | | 3-Year | | 5-Year | | 10-Year | | Since
Inception* |
| | | | | | |
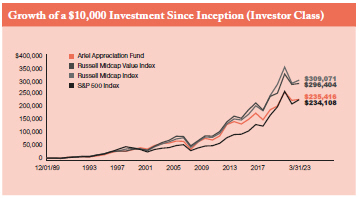
Ariel Appreciation Fund | | | | 1.72 | | | | | -6.66 | | | | | 20.63 | | | | | 5.32 | | | | | 7.94 | | | | | 9.94 | |
| | | | | | |
Russell Midcap Value Index | | | | 1.32 | | | | | -9.22 | | | | | 20.71 | | | | | 6.54 | | | | | 8.80 | | | | | 10.70 | |
| | | | | | |
Russell Midcap Index | | | | 4.06 | | | | | -8.78 | | | | | 19.21 | | | | | 8.06 | | | | | 10.05 | | | | | 10.84 | |
| | | | | | |
S&P 500 Index | | | | 7.50 | | | | | -7.73 | | | | | 18.62 | | | | | 11.19 | | | | | 12.24 | | | | | 9.92 | |
* The inception date for Ariel Appreciation Fund is 12/01/89.
Dear Fellow Shareholder: The positive quarter-end gains posted by U.S. stocks as of March 31, 2023, masked an increasingly volatile undercurrent fueled by the unintended consequences of rising interest rates which affected everything from regional banks to money market funds and tech shares. Despite the erratic backdrop, Ariel Fund performed well, meaningfully outperforming its primary and secondary benchmarks. This portfolio was buoyed by strong returns among our holdings in Consumer Discretionary, Financials and Industrials. These names easily overcame marginal weakness in the Real Estate, Basic Materials and Technology sectors where our weightings significantly trail those of our value benchmarks. Meanwhile, Ariel Appreciation Fund edged out the Russell Midcap Value Index but fell short of the secondary Russell Midcap Index. When compared to the value benchmark, strong stock
picking in the Consumer Discretionary sector was dampened by our Financials overweight, which was the worst-performing sector in the index.
Unintended Consequences—Regional Banks in Crisis
To tame stimulus-induced inflation, the Federal Reserve began the tedious effort of raising interest rates on March 2, 2022. They started slowly with a +0.25% move that immediately stepped up to +0.50% by May—with three consecutive +0.75% hikes in quick succession in July, September and November. By year-end, a +0.50% increase began to signal a shift, with two less aggressive +0.25% nudges this February and March. With the economy cooling and inflation decelerating, The Wall Street Journal noted,
Performance data quoted represents past performance. Past performance does not guarantee future results. All performance assumes the reinvestment of dividends and capital gains and represents returns of the Investor Class shares. The investment return and principal value of an investment will fluctuate so that an investor’s shares, when redeemed, may be worth more or less than their original cost. Current performance may be lower or higher than the performance data quoted. Any extraordinary performance shown for short-term periods may not be sustainable and is not representative of the performance over longer periods. Performance data current to the most recent month-end for Ariel Fund and Ariel Appreciation Fund may be obtained by visiting our website, arielinvestments.com.
| | |
| SLOW AND STEADY WINS THE RACE | | 3 |
“…many bet that would lead the Federal Reserve to switch quickly from raising interest rates to cutting them.“1 All seemed well.
And then a banking crisis came out of nowhere. Silicon Valley Bank (SVB), the 16th largest bank in the country, suffered a bank run and became the second-largest bank failure in U.S. history. Given the tech industry concentration, the bank’s demise was as fast as any viral phenomenon on the internet. A run that started on a Thursday ended when the bank was taken into receivership and did not re-open on Monday. With investors and the market on edge, the U.S. Treasury, Federal Reserve and FDIC issued a late Sunday joint press release guaranteeing SVB’s $209 billion in deposits—even those with account values over the $250,000 insured limit. That tripartite move helped, but did not stop the domino effect. Just two days later, Signature Bank became the third-largest bank failure ever in the United States. With financial stocks getting hit hard and confidence quickly eroding, big banks took matters into their own hands— raising $30 billion in deposits amongst themselves to stabilize the next weakest link, First Republic Bank (FRC).
While many agree some structural misses contributed to the recent bank failures—including industry and customer concentrations as well as less robust regulation for regional players—the bigger culprit was the banks’ supposedly safe fixed income securities known as their hold to maturity portfolios (HTM). As interest rates rose, these bond issues were quickly devalued and would need to be marked to today’s sagging prices to fund an avalanche of deposit outflows. It is worth noting that were these bonds held to maturity as intended, they would be paid out at “par” or 100% of their paper value. In short, the Fed’s recent rate hikes drove the need for more capital as bond prices fell and account holders fled. In the absence of that capital, SVB and Signature are gone. In Europe, Credit Suisse was hastily absorbed by its country cousin, UBS Group AG, with special dispensation from the Swiss government. And, First Republic was just acquired by JPMorgan Chase (NYSE: JPM).
As these banks were teetering, the biggest banks in the U.S. were working around the clock to digest a rush of new customers. Unlike the 2008-09 crisis, the health of the overall banking industry is not in question. Large bank balance
sheets have been stress tested for the most extreme conditions and are in great shape. And yet, regional banks in need of more capital remain under a cloud despite being the “essential workers” when it comes to lending to local communities. Plus, that lending is likely to tighten given growing capital requirements. As a result of a stingier credit environment, some of the biggest losers are expected to be the commercial real estate developers who need regular financing and subsequent refinancing. Another unintended consequence.
It is worth noting that our sole regional bank, Tulsa-based BOK Financial (BOKF), traded down in the recent financial sell off. While we believe government actions were well constructed and have proven effective in staving off more contagion, we acknowledge BOKF may be impacted by reduced earnings in the near-to-medium term. That said, asset quality remains sturdy as the company continues to exhibit solid loan growth, healthy net interest margins, strong capital levels and balance sheet liquidity. We therefore continue to believe BOKF remains well positioned for long-term success given its high underwriting standards, proven credit discipline, diversified business model and experienced management team.
Unintended Consequences—Popularity at Opposite Ends of the Risk Spectrum
Just as rising interest rates are settling in, “…investors are wagering that a general slowdown and tighter lending conditions stemming from the turmoil in the banking sector will force the Federal Reserve to loosen monetary policy sooner than expected.”2 These contrasting factors—today’s higher rates and the prospect of lower future rates—are driving two disparate and increasingly crowded trades: one into money market funds and the other into large company tech shares. With yields now in excess of 4%, “Investors have added $336 billion to U.S. money market funds this year…a shift from last year when the funds suffered nearly $46 billion in outflows.”3 Meanwhile, in a falling interest rate environment, investors are more willing to pay up for future earnings. Growth stocks that trade at higher multiples of earnings suddenly look more attractive. As such, 2022’s downtrodden technology shares are now amongst some of 2023’s biggest winners—driving up the tech heavy Nasdaq composite which soared +17% in the first quarter.
1 Otani, Akane. “Stocks Cap Wild Quarter to Notch Big Gains.” The Wall Street Journal. April 1-2, 2023. Page A1.
2 Pitcher, Jack. “Stocks Mostly Fall on Slowdown Fears.” The Wall Street Journal. April 6, 2023. Page B11.
3 Ge Huang, Vicky. “Tech, Money-Market Funds are Havens.” The Wall Street Journal. April 3, 2023. Page B9.
| | |
| 4 | | SLOW AND STEADY WINS THE RACE |
Looking Forward
Should rates fall, our value bias and underweight to the tech sector could be a drag on our near-term results. Still, with technology stocks now “trading at 24.7 times projected earnings over the next 12 months, while the broader index has a multiple of 18.2,” these stocks remain pricey, which could dampen their future ascent.4 Meanwhile, “value stocks are ‘dirt cheap’ relative to growth, now more discounted than they have been four-fifths of the time in the U.S. stock market history, according to Rob Arnott, founder and chairman of Research Affiliates.“5 It is also worth acknowledging that when inflation is elevated, value tends to outperform growth since higher levels of near-term cash flow are worth more today than in the future.
While monetary policy is driving recent market volatility, we remain focused on bottom-up stock picking. As the market swings from one scenario to another, our sole consideration of recent events and macroeconomic developments is to consider their effect on the long-term intrinsic worth of our names over the next five-to-ten years. Given our “slow and steady” approach, we remain confident in our portfolio positioning, especially with our small and mid cap portfolios trading at a discount to their respective value indices. With Ariel Fund selling at a -34.2% discount to our estimate of private market value (PMV) and Ariel Appreciation Fund at a -29.8% discount—our portfolios are on sale and poised to benefit as their full potential is realized over time.6 Looking ahead, we firmly believe the actively patient investor that consistently owns differentiated businesses with robust balance sheets will likely achieve strong returns over the long run.
“While monetary policy is driving recent market volatility, we remain focused on bottom-up stock picking.”
Portfolio Comings and Goings
In Ariel Fund, we initiated a position in Leslie’s Inc. (LESL), the leading direct-to-consumer pool and spa care services company in the U.S. Shares recently sold off on near-term operational issues as well as concerns around
the sustainability of the company’s growth profile in a normalized, post-pandemic environment. Although new pool installments will likely slow down, the install base has materially increased and approximately 80% of Leslie’s business is tied to recurring maintenance. We did not exit any holdings in the period.
In Ariel Appreciation Fund, we initiated a position in long-time Ariel holding Jones Lang LaSalle, also known as JLL (JLL), which is a leading professional services firm that specializes in real estate and investment management. Although the first half of 2023 will likely be choppy given macro-uncertainty, the company’s leadership is highly confident about the medium- and longer-term revenue outlook for both transactional and recurring revenue streams. JLL is also making efforts to streamline operations and increase efficiencies to generate higher profit over time. We successfully sold personal auto insurer, Progressive Corporation (PGR) as it surpassed our estimate of private market value.
As always, we appreciate the opportunity to serve you and welcome any questions or comments you might have.
Sincerely,
| | |
 | |  |
John W. Rogers, Jr. Chairman and Co-CEO | | Mellody Hobson Co-CEO and President |
| | 4 | Singh, Hardika. “S&P’s Resilience Amid Turmoil is Due to Tech.” The Wall Street Journal. April 4, 2023. Page B10. | |
| | 5 | Wallerstein, Eric. “Stocks Haven’t Looked This Ugly In Years.” The Wall Street Journal. April 4, 2023. Page A1. | |
| | 6 | Discount to Private Market Value is the percentage discount the portfolio’s holdings trade relative to Ariel Investments’ internal estimate of the portfolio’s holdings’ private market value (PMV). There is no guarantee that the companies we invest in will achieve our PMV. | |
| | |
| SLOW AND STEADY WINS THE RACE | | 5 |
| | | | | | |
| | | Performance Summary | | | | Ariel Fund |
| | | | |
| | | | As of March 31, 2023 |
Inception: November 6, 1986
| | | | | | | | | | | | | | | | |
|
Composition of Equity Holdings (%) | |
| | | | |
| | | Ariel
Fund | | | Russell
2500 Value
Index | | | Russell
2500
Index | | | S&P 500 Index |
| | | | |
Consumer Discretionary | | | 38.19 | | | | 15.48 | | | | 15.13 | | | | 13.93 | |
| | | | |
Industrials | | | 25.94 | | | | 19.10 | | | | 20.99 | | | | 12.55 | |
| | | | |
Financials | | | 18.63 | | | | 19.48 | | | | 14.35 | | | | 9.86 | |
| | | | |
Health Care | | | 5.45 | | | | 8.40 | | | | 12.26 | | | | 13.55 | |
| | | | |
Real Estate | | | 4.17 | | | | 11.24 | | | | 7.76 | | | | 2.64 | |
| | | | |
Energy | | | 2.87 | | | | 4.99 | | | | 5.44 | | | | 4.80 | |
| | | | |
Utilities | | | 2.33 | | | | 4.63 | | | | 3.45 | | | | 3.12 | |
| | | | |
Consumer Staples | | | 1.59 | | | | 2.86 | | | | 3.08 | | | | 6.00 | |
| | | | |
Basic Materials | | | 0.00 | | | | 5.21 | | | | 4.48 | | | | 1.95 | |
| | | | |
Technology | | | 0.00 | | | | 7.16 | | | | 11.64 | | | | 28.97 | |
| | | | |
Telecommunications | | | 0.00 | | | | 1.44 | | | | 1.42 | | | | 2.62 | |
| | | | |
Short-Term Investments | | | 0.58 | | | | 0.00 | | | | 0.00 | | | | 0.00 | |
Industry weightings are calculated based on equity holdings as a percentage of total net assets. Holdings are categorized according to the Russell Industry Classification Benchmark (ICB). Holdings not classified by ICB are categorized according to FactSet classification. Source: FactSet.
| | | | | | | | | | | | | | | | | | | | | | |
|
Average Annual Total Returns (%) |
| | | | | | |
| | | Quarter | | | 1-Year | | | 3-Year | | | 5-Year | | | 10-Year | | | Since Inception |
| | | | | | |
Ariel Fund-Investor Class | | | 6.66 | | | | -8.74 | | | | 24.18 | | | | 5.80 | | | | 9.06 | | | 10.65 |
| | | | | | |
Ariel Fund-Institutional Class* | | | 6.75 | | | | -8.45 | | | | 24.57 | | | | 6.14 | | | | 9.39 | | | 10.76 |
| | | | | | |
Russell 2500 Value Index | | | 1.40 | | | | -10.53 | | | | 21.82 | | | | 5.61 | | | | 7.72 | | | 10.42 |
| | | | | | |
Russell 2500 Index | | | 3.39 | | | | -10.39 | | | | 19.43 | | | | 6.65 | | | | 9.07 | | | 10.26 |
| | | | | | |
S&P 500 Index | | | 7.50 | | | | -7.73 | | | | 18.62 | | | | 11.19 | | | | 12.24 | | | 10.46 |
Performance data quoted represents past performance and does not guarantee future results. It includes the reinvestment of dividends and capital gains. The investment return and principal value of an investment will fluctuate so that an investor’s shares, when redeemed, may be worth more or less than their original cost. Current performance may be lower or higher than the performance data quoted. To access performance data as of the most recent month-end, visit arielinvestments.com. Any extraordinary short-term performance may not be sustainable and is not representative of the performance over longer periods. Annual Average Total Return does not reflect a maximum of 4.75% sales load charged prior to 7/15/94.
The graph and performance table do not reflect the deduction of taxes that a shareholder would pay on fund distributions or the redemption of fund shares.
| | | | |
|
Expense Ratio (as of September 30, 2022) | |
| | | | | |
| |
Investor Class | | | 0.98% | |
| |
Institutional Class | | | 0.67% | |
| | | | | | | | | | | | | | |
|
Top Ten Equity Holdings (% of net assets) | |
| | | | | |
| 1 | | Madison Square Garden Entertainment Corporation | | | 5.81 | | | 6 | | Mohawk Industries, Inc. | | | 3.63 | |
| | | | | |
| 2 | | Boyd Gaming Corporation | | | 4.24 | | | 7 | | Paramount Global | | | 3.61 | |
| | | | | |
| 3 | | Royal Caribbean Cruises, Ltd. | | | 4.23 | | | 8 | | Adtalem Global Education, Inc. | | | 3.51 | |
| | | | | |
| 4 | | Interpublic Group of Companies, Inc. | | | 3.93 | | | 9 | | Affiliated Managers Group, Inc. | | | 3.45 | |
| | | | | |
| 5 | | Zebra Technologies Corporation | | | 3.83 | | | 10 | | Mattel, Inc. | | | 3.43 | |
| | * | The inception date for the Institutional Class shares is December 30, 2011. Performance information for the Institutional Class prior to that date reflects the actual performance of the Fund’s Investor Class (and uses the actual expenses of the Fund’s Investor Class, for such period of time), without any adjustments. For any such period of time, the performance of the Fund’s Institutional Class would have been substantially similar to, yet higher than, the performance of the Fund’s Investor Class, because the shares of both classes are invested in the same portfolio of securities, but the classes bear different expenses, which are primarily differences in distribution and service fees. | |
| | |
| 6 | | SLOW AND STEADY WINS THE RACE |
| | | | | | |
| | | Performance Summary | | | | Ariel Appreciation Fund |
| | | | |
| | | | As of March 31, 2023 |


Inception: December 1, 1989
| | | | | | | | | | | | | | | | |
|
Composition of Equity Holdings (%) | |
| | | | |
| | | Ariel
Appreciation
Fund | | | Russell
Midcap
Value
Index | | | Russell
Midcap
Index | | | S&P 500
Index | |
| | | | |
Consumer Discretionary | | | 27.37 | | | | 14.10 | | | | 16.46 | | | | 13.93 | |
| | | | |
Financials | | | 23.60 | | | | 16.26 | | | | 12.44 | | | | 9.86 | |
| | | | |
Industrials | | | 21.59 | | | | 18.32 | | | | 19.14 | | | | 12.55 | |
| | | | |
Health Care | | | 11.68 | | | | 7.41 | | | | 10.15 | | | | 13.55 | |
| | | | |
Consumer Staples | | | 4.99 | | | | 4.69 | | | | 4.28 | | | | 6.00 | |
| | | | |
Energy | | | 3.49 | | | | 5.42 | | | | 5.30 | | | | 4.80 | |
| | | | |
Real Estate | | | 2.94 | | | | 10.79 | | | | 7.55 | | | | 2.64 | |
| | | | |
Utilities | | | 2.05 | | | | 9.59 | | | | 6.17 | | | | 3.12 | |
| | | | |
Basic Materials | | | 0.00 | | | | 4.57 | | | | 3.79 | | | | 1.95 | |
| | | | |
Technology | | | 0.00 | | | | 7.25 | | | | 13.16 | | | | 28.97 | |
| | | | |
Telecommunications | | | 0.00 | | | | 1.60 | | | | 1.54 | | | | 2.62 | |
| | | | |
Short-Term Investments | | | 2.62 | | | | 0.00 | | | | 0.00 | | | | 0.00 | |
Industry weightings are calculated based on equity holdings as a percentage of total net assets. Holdings are categorized according to the Russell Industry Classification Benchmark (ICB). Holdings not classified by ICB are categorized according to FactSet classification. Source: FactSet.
| | | | | | | | | | | | | | | | | | | | | | |
|
Average Annual Total Returns (%) |
| | | | | | |
| | | Quarter | | | 1-Year | | | 3-Year | | | 5-Year | | | 10-Year | | | Since Inception |
| | | | | | |
Ariel Appreciation Fund-Investor Class | | | 1.72 | | | | -6.66 | | | | 20.63 | | | | 5.32 | | | | 7.94 | | | 9.94 |
| | | | | | |
Ariel Appreciation Fund-Institutional Class* | | | 1.79 | | | | -6.37 | | | | 21.00 | | | | 5.65 | | | | 8.28 | | | 10.06 |
| | | | | | |
Russell Midcap Value Index | | | 1.32 | | | | -9.22 | | | | 20.71 | | | | 6.54 | | | | 8.80 | | | 10.70 |
| | | | | | |
Russell Midcap Index | | | 4.06 | | | | -8.78 | | | | 19.21 | | | | 8.06 | | | | 10.05 | | | 10.84 |
| | | | | | |
S&P 500 Index | | | 7.50 | | | | -7.73 | | | | 18.62 | | | | 11.19 | | | | 12.24 | | | 9.92 |
Performance data quoted represents past performance and does not guarantee future results. It includes the reinvestment of dividends and capital gains. The investment return and principal value of an investment will fluctuate so that an investor’s shares, when redeemed, may be worth more or less than their original cost. Current performance may be lower or higher than the performance data quoted. To access performance data as of the most recent month-end, visit arielinvestments.com. Any extraordinary short-term performance may not be sustainable and is not representative of the performance over longer periods. Annual Average Total Return does not reflect a maximum 4.75% sales load charged prior to 7/15/94.
The graph and performance table do not reflect the deduction of taxes that a shareholder would pay on fund distributions or the redemption of fund shares. Total return does not reflect a maximum 4.75% sales load charged prior to 7/15/94.
| | | | |
| |
Expense Ratio (as of September 30, 2022) | | | | |
| | | | | |
| |
Investor Class | | | 1.10% | |
| |
Institutional Class | | | 0.79% | |
| | | | | | | | | | | | | | |
|
Top Ten Equity Holdings (% of net assets) | |
| | | | | |
1 | | Goldman Sachs Group, Inc. | | | 4.11 | | | 6 | | Mattel, Inc. | | | 3.24 | |
| | | | | |
2 | | Northern Trust Corporation | | | 4.00 | | | 7 | | Interpublic Group of Companies, Inc. | | | 3.24 | |
| | | | | |
3 | | Laboratory Corporation of America Holdings | | | 3.61 | | | 8 | | Kennametal, Inc. | | | 3.11 | |
| | | | | |
4 | | BorgWarner, Inc. | | | 3.60 | | | 9 | | Axalta Coating Systems, Ltd. | | | 3.05 | |
| | | | | |
5 | | Madison Square Garden Entertainment Corporation | | | 3.28 | | | 10 | | CarMax, Inc. | | | 2.97 | |
| | * | The inception date for the Institutional Class shares is December 30, 2011. Performance information for the Institutional Class prior to that date reflects the actual performance of the Fund’s Investor Class (and uses the actual expenses of the Fund’s Investor Class, for such period of time), without any adjustments. For any such period of time, the performance of the Fund’s Institutional Class would have been substantially similar to, yet higher than, the performance of the Fund’s Investor Class, because the shares of both classes are invested in the same portfolio of securities, but the classes bear different expenses, which are primarily differences in distribution and service fees. | |
| | |
| SLOW AND STEADY WINS THE RACE | | 7 |
| | | | | | |
| | |  | | | | Ariel Focus Fund |
| | | | |
| | | | As of March 31, 2023 |
| | | | | | | | | | | | | | | | | | | | | | | | |
|
Average Annual Total Returns (%) | |
| | | | | | |
| | | Quarter | | | 1-Year | | | 3-Year | | | 5-Year | | | 10-Year | | | Since Inception* | |
| | | | | | |
Ariel Focus Fund | | | 0.35 | | | | -12.39 | | | | 20.69 | | | | 5.31 | | | | 7.36 | | | | 5.78 | |
| | | | | | |
Russell 1000 Value Index | | | 1.01 | | | | -5.91 | | | | 17.94 | | | | 7.50 | | | | 9.13 | | | | 7.41 | |
| | | | | | |
S&P 500 Index | | | 7.50 | | | | -7.73 | | | | 18.62 | | | | 11.19 | | | | 12.24 | | | | 9.40 | |
* The inception date for Ariel Focus Fund is 06/30/05.
Dear Fellow Shareholder: Ariel Focus Fund returned +0.35% in the first quarter, modestly trailing its primary benchmark, the Russell 1000 Value Index, which gained +1.01%. Meanwhile, the S&P 500 Index, with its heavy technology and growth stock weighting, grew +7.50% in the quarter. Last year, value stocks outperformed growth stocks by a wide margin. So far in 2023, growth has outperformed value, a headwind to our relative performance given the characteristics of our holdings. Of late, growth stock outperformance has been aided by falling interest rates, a decline we do not expect to continue.
Portfolio Recap
BorgWarner Inc. (BWA) and Madison Square Garden Entertainment Corp. (MSGE) were our top contributors in the quarter, while APA Corporation (APA) and BOK Financial Corp. (BOKF) were our biggest detractors. BorgWarner surged +22% on its growing leadership position in automotive propulsion and powertrains, particularly for electric vehicles. Last December, the company announced a spin-off of its fuel system and after-market parts businesses. Those businesses will focus on internal combustion engine
systems, while the remainder of BorgWarner will seek to expand its electric vehicle propulsion business. BorgWarner was Ariel Focus Fund’s largest holding at quarter end. We view the company as a leader in a growing industry with clear technical barriers to entry, trading at less than ten times our estimate of forward twelve months’ earnings.
After a difficult 2022, MSGE was our second largest contributor to performance this quarter jumping +31%. During the recent Super Bowl, the rock band U2 announced they would perform their first concert since 2019 at MSGE’s Sphere in Las Vegas this fall, which gave equity markets confidence that the Sphere would open on schedule. The company also announced a spinoff, creating a new separately traded company that will include Madison Square Garden, the Hulu Theater, Radio City Music Hall, The Beacon Theatre, and the Chicago Theatre.
Energy stocks were strong performers in 2022, including our portfolio holding APA Corporation, which leaped +76% for the year. By contrast, APA declined -22% in the most recent quarter. Fears of a global recession, the release of oil from America’s Strategic Petroleum Reserves, and a significant drop in U.S. natural gas prices all combined to pressure APA’s
Performance data quoted represents past performance. Past performance does not guarantee future results. All performance assumes the reinvestment of dividends and capital gains and represents returns of the Investor Class shares. The investment return and principal value of an investment will fluctuate so that an investor’s shares, when redeemed, may be worth more or less than their original cost. Current performance may be lower or higher than the performance data quoted. Any extraordinary performance shown for short-term periods may not be sustainable and is not representative of the performance over longer periods. Performance data current to the most recent month-end for Ariel Focus Fund may be obtained by visiting our website, arielinvestments.com.
| | |
| 8 | | SLOW AND STEADY WINS THE RACE |
shares. A recent decision by OPEC to reduce oil production has sent West Texas Intermediate (“WTI”) prices back above $80 per barrel from the mid $60s earlier this year. APA trades for less than six times our estimate of the next twelve-month earnings.
BOKF was our second largest detractor, declining -18%. BOKF was pressured by the “double whammy” of falling oil prices and recent difficulties at regional banks. Based in Tulsa, Oklahoma, BOKF is rightly considered a leading lender to the U.S. oil petroleum industry.
However, BOKF’s exposure to oil and gas has been exaggerated by the market. Energy loans represent only 15% of the company’s lending portfolio. The bank’s fortunes are more tied to the health of the general economy in America’s southwest region than any industry. Texas, Oklahoma, Arizona, and Nevada will continue to show healthy economic growth with well-publicized increases in population and corporate headquarters. However, the threat of deposit withdrawals at regional banks after the failure of Silicon Valley Bank could be a more serious challenge. Customer deposits represent the least expensive source of funding for most regional banks. Were depositors to move a substantial portion of their deposits from regional banks to the large money center banks known as the Systemically Important Financial Institutions, bank earnings could be severely impacted, certainly in the short term.
We think the best explanation of the current woes of regional banks came from George Bailey during the bank run scene in It’s a Wonderful Life; “You’re thinking of this place all wrong. As if I had the money back in a safe. The money’s not here. Your money’s in Joe’s house…right next to yours. And in the Kennedy house, and Ms. Macklin’s house, and a hundred others. Why, you are lending them the money to build, and then, they are going to pay it back to you as best they can.” Just as the fictional Bailey Building & Loan depositors could have forced George to close his doors, a bank depositor run can cause a liquidity crisis for even a well-capitalized bank such as BOKF. So far, we do not see evidence of outsized deposit withdrawals at BOKF. However, we remain cautious and have not added to our position, even at today’s lower share price.
Reversal of Fortunes: The End of Declining Rates
The chart below is from St. Louis Federal Reserve Bank. It shows the market yield on 30-year Treasuries from April 1980 through February 2023. This graph explains why certain financial asset classes have outperformed over the last 40 years. The graph also explains why the last 40 years have been challenging for traditional value managers and why this might be about to change.
Market Yield on U.S. Treasury Securities at 30-Year Constant Maturity, Quoted on an Investment Basis
January 1, 1981 through March 7, 2023

| | |
| SLOW AND STEADY WINS THE RACE | | 9 |
First, the graph shows a dramatic decline in interest rates over the last 40 years. The 30-year Treasury declined from over 15% in 1981 to 0.99% in 2020. While the totality of this decline is well understood among market participants, what is less noted is how consistent this decline in rates has been. From 1981 to 2021, every rolling 10-year period ended with 30-year rates lower than when the period began. This four-decade winning streak for lower rates was only recently snapped when 30-year Treasuries ended 2022 at 3.97%, higher than their 2.9% yield at the end of 2012.
This consistent decline in rates is important as some asset classes benefit more from falling rates than others. Leveraged companies benefit more than companies without debt. Long-term bonds benefit more than short-term bonds. Notably, growth stocks and technology stocks benefit more than value stocks. On the last point, growth stocks are like long-term bonds in that they have a long duration, meaning their cash flows are farther in the future than value stocks. A growth stock investor may be counting on earnings 30 years from now, earnings whose present value increases with a lower time value of money.
A value stock will earn a much larger percentage of its stock price in the near term, cash flows whose present value will be less impacted by lower discount rates. Just as a drop in interest rates will have a more significant positive effect on a 30-year bond than a 6-month treasury, a drop in interest rates will have a greater positive impact on a portfolio of growth stocks than on a comparable portfolio of value stocks.
This is important because the consistent decline in interest rates over the last 40 years has been a continuous positive factor for growth stocks and a persistent negative factor for value stocks, at least on a relative basis. While growth stocks have had a steady wind at their backs, value stocks have faced a steady headwind. We believe this extraordinary period of consistently declining rates is ending. At a minimum, interest rates cannot fall over the next 40 years as they have over the past four decades. There is nowhere further for long-term rates to go. In a crisis, 30-year rates could drop temporarily back to the 0.99% they reached during the Covid crisis of 2020. But rates cannot steadily decline in the future as they have in the past.
When I attended business school in the 1980s, academicians agreed on the existence of a “Value Anomaly.” Value stocks beat growth stocks by much more than any valuation model would predict. This Value Anomaly has disappeared, particularly over the last 25 years. We believe value’s underperformance owes much to reduced interest rates. We also believe this period of steady declining rates is over.
Perhaps rates will not steadily increase, but they are not likely to steadily fall. With a more level interest rate playing field, value may return to its rightful place atop the asset class pyramid. We believe Ariel Focus Fund should be well positioned for the future with its emphasis on companies trading at low prices relative to their expected earnings.
“With a more level interest rate playing field, value may return to its rightful place atop the asset class pyramid.”
As always, we appreciate the opportunity to serve you and welcome any questions or comments you might have.
Sincerely,

Charles K. Bobrinskoy
Vice Chairman
| | |
| 10 | | SLOW AND STEADY WINS THE RACE |
| | | | | | |
| | | Performance Summary | | | | Ariel Focus Fund |
| | | | |
| | | | As of March 31, 2023 |

Inception: June 30, 2005
| | | | | | |
|
Composition of Equity Holdings (%) |
| | | |
| | | Ariel
Focus
Fund | | Russell
1000 Value
Index | | S&P 500 Index |
| | | |
Financials | | 27.55 | | 18.07 | | 9.86 |
| | | |
Industrials | | 24.06 | | 13.04 | | 12.55 |
| | | |
Consumer Discretionary | | 16.25 | | 10.38 | | 13.93 |
| | | |
Health Care | | 10.32 | | 15.62 | | 13.55 |
| | | |
Basic Materials | | 8.65 | | 3.39 | | 1.95 |
| | | |
Energy | | 5.39 | | 8.09 | | 4.80 |
| | | |
Technology | | 5.01 | | 9.17 | | 28.97 |
| | | |
Consumer Staples | | 0.00 | | 7.09 | | 6.00 |
| | | |
Real Estate | | 0.00 | | 4.62 | | 2.64 |
| | | |
Telecommunications | | 0.00 | | 4.66 | | 2.62 |
| | | |
Utilities | | 0.00 | | 5.85 | | 3.12 |
| | | |
Short-Term Investments | | 3.34 | | 0.00 | | 0.00 |
Industry weightings are calculated based on equity holdings as a percentage of total net assets. Holdings are categorized according to the Russell Industry Classification Benchmark (ICB). Holdings not classified by ICB are categorized according to FactSet classification. Source: FactSet.
| | | | | | | | | | | | | | | | | | | | | | |
|
Average Annual Total Returns (%) |
| | | | | | |
| | | Quarter | | | 1-Year | | | 3-Year | | | 5-Year | | | 10-Year | | | Since Inception |
| | | | | | |
Ariel Focus Fund-Investor Class | | | 0.35 | | | | -12.39 | | | | 20.69 | | | | 5.31 | | | | 7.36 | | | 5.78 |
| | | | | | |
Ariel Focus Fund-Institutional Class* | | | 0.35 | | | | -12.19 | | | | 21.01 | | | | 5.58 | | | | 7.63 | | | 5.95 |
| | | | | | |
Russell 1000 Value Index | | | 1.01 | | | | -5.91 | | | | 17.94 | | | | 7.50 | | | | 9.13 | | | 7.41 |
| | | | | | |
S&P 500 Index | | | 7.50 | | | | -7.73 | | | | 18.62 | | | | 11.19 | | | | 12.24 | | | 9.40 |
Performance data quoted represents past performance and does not guarantee future results. It includes the reinvestment of dividends and capital gains. The investment return and principal value of an investment will fluctuate so that an investor’s shares, when redeemed, may be worth more or less than their original cost. Current performance may be lower or higher than the performance data quoted. To access performance data as of the most recent month-end, visit arielinvestments.com. Any extraordinary short-term performance may not be sustainable and is not representative of the performance over longer periods. The total returns reflect that certain fees and expenses have been waived or reduced by the Adviser.

The graph and performance table do not reflect the deduction of taxes that a shareholder would pay on fund distributions or the redemption of fund shares.
| | | | | | |
|
Expense Ratio (as of September 30, 2022) | |
| | |
| | | Net | | Gross | |
| | |
Investor Class | | 1.00% | | | 1.13% | |
| | |
Institutional Class | | 0.75% | | | 0.85% | |
Expense ratio caps of 1.00% for the Investor Class and 0.75% for the Institutional Class are in place to waive fees and reimburse certain expenses that exceed these caps. Ariel Investments, LLC (the Adviser) is contractually obligated to maintain these expense ratio caps through 9/30/24.
| | | | | | | | | | | | | | |
|
Top Ten Equity Holdings (% of net assets) | |
| | | | | |
| 1 | | BorgWarner, Inc. | | | 6.69 | | | 6 | | Lockheed Martin Corporation | | | 5.07 | |
| | | | | |
| 2 | | Snap-on, Inc. | | | 5.79 | | | 7 | | Oracle Corporation | | | 5.01 | |
| | | | | |
| 3 | | Goldman Sachs Group, Inc. | | | 5.72 | | | 8 | | Mosaic Company | | | 4.96 | |
| | | | | |
| 4 | | APA Corporation | | | 5.39 | | | 9 | | Northern Trust Corporation | | | 3.88 | |
| | | | | |
| 5 | | BOK Financial Corporation | | | 5.35 | | | 10 | | Resideo Technologies, Inc. | | | 3.77 | |
| | * | The inception date for the Institutional Class shares is December 30, 2011. Performance information for the Institutional Class prior to that date reflects the actual performance of the Fund’s Investor Class (and uses the actual expenses of the Fund’s Investor Class, for such period of time), without any adjustments. For any such period of time, the performance of the Fund’s Institutional Class would have been substantially similar to, yet higher than, the performance of the Fund’s Investor Class, because the shares of both classes are invested in the same portfolio of securities, but the classes bear different expenses, which are primarily differences in distribution and service fees. | |
| | |
| SLOW AND STEADY WINS THE RACE | | 11 |
| | | | | | |
| | | | | | | Ariel International Fund Ariel Global Fund |
| | | | |
| | | | As of March 31, 2023 |
| | | | | | | | | | | | |
|
Average Annual Total Returns (%) |
| | | | | | |
| | | Quarter | | 1-Year | | 3-Year | | 5-Year | | 10-Year | | Since Inception* |
| | | | | | |
Ariel International Fund | | 5.40 | | -4.61 | | 6.43 | | 0.89 | | 4.20 | | 4.47 |
| | | | | | |
MSCI EAFE Net Index | | 8.47 | | -1.38 | | 12.99 | | 3.52 | | 5.00 | | 6.40 |
| | | | | | |
MSCI ACWI ex-US Net Index | | 6.87 | | -5.07 | | 11.81 | | 2.47 | | 4.17 | | 5.43 |
| | | | | | |
MSCI EAFE Value Net Index | | 5.93 | | -0.31 | | 14.59 | | 1.75 | | 3.75 | | 5.15 |
| | | | | | |
MSCI ACWI ex-US Value Net Index | | 5.16 | | -4.00 | | 13.83 | | 1.26 | | 3.06 | | 4.32 |
* The inception date for Ariel International Fund is 12/30/11.
| | | | | | | | | | | | |
| |
Average Annual Total Returns (%) | | |
| | | | | | |
| | | Quarter | | 1-Year | | 3-Year | | 5-Year | | 10-Year | | Since Inception* |
| | | | | | |
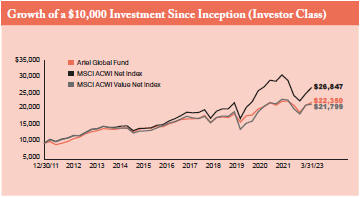
Ariel Global Fund | | 4.19 | | -1.61 | | 10.90 | | 5.15 | | 6.96 | | 7.41 |
| | | | | | |
MSCI ACWI Net Index | | 7.31 | | -7.44 | | 15.37 | | 6.93 | | 8.06 | | 9.18 |
| | | | | | |
MSCI ACWI Value Net Index | | 1.24 | | -5.50 | | 15.25 | | 4.27 | | 5.89 | | 7.17 |
* The inception date for Ariel Global Fund is 12/30/11.
Dear Fellow Shareholder: This quarter was a disruptive period for the U.S. banking sector. On March 10, 2023, the Federal Deposit Insurance Corporation (FDIC) took over Silicon Valley Bank (SVB) due to a bank run triggered by a sell-off of long-duration assets. SVB’s collapse was the second-largest failure of a financial institution in the nation’s history. As a result, bank stocks across all market caps slid to multi-year and all-time lows. While the industry has not experienced this level of distress since 2008-2009, we do not believe we are on the verge of another Great Financial Crisis. The U.S. government’s decision to increase regulation and guarantee regional bank deposits could have positive long-term effects. However, amid inflationary pressures, it could tighten financial conditions and induce a recession in the near term.
Our distinct focus on risk management aims to eliminate companies that assume outsized risks. We have avoided SVB, Signature Bank, and others with an asset-liability mismatch. In 2007, we witnessed a similar phenomenon called “the run on the Rock.” British bank Northern Rock was a darling stock in its heyday. Northern Rock’s meltdown was the first United Kingdom bank run in over 140 years, and, like SVB, investors were shocked when the company failed and requested the Bank of England’s support.
We rejected the company well before the debacle, believing the risks outweighed the rewards. Sixteen years later, we still apply the same approach. Unlike our peers, we do not screen on growth rates or multiples. We screen on risk—even if that means leaving money on the table. We target superior
Performance data quoted represents past performance. Past performance does not guarantee future results. All performance assumes the reinvestment of dividends and capital gains and represents returns of the Investor Class shares. The investment return and principal value of an investment will fluctuate so that an investor’s shares, when redeemed, may be worth more or less than their original cost. Current performance may be lower or higher than the performance data quoted. Any extraordinary performance shown for short-term periods may not be sustainable and is not representative of the performance over longer periods. Performance data current to the most recent month-end for Ariel International Fund and Ariel Global Fund may be obtained by visiting our website, arielinvestments.com.
| | |
| 12 | | SLOW AND STEADY WINS THE RACE |
risk-adjusted returns, not high returns at any cost, and believe this distinction serves our clients well.
We are highly selective in our Financials exposure. We prefer to own BNP Paribas, KBC Group, and U.S. Bancorp, which we believe offer better profitability and higher capital ratios—albeit with lower growth than the SVBs of the world. In our view, large U.S. and European banks can weather the storm. When the European Union imposed strict capital requirements for all banks under a new regulatory construct called Basel III, they created a resilient system. Meanwhile, American financial institutions under $250 billion in assets have been exempt from Basel III, making them more vulnerable. While interest rate hikes have stressed Financials, our main concern for small- and mid-size lenders is not deposit flight per se. In our view, the most significant risk is excessive exposure to commercial real estate.
The Next Challenge for Regional Banks: Commercial Real Estate Loan Exposure
The pivot from in-person work to remote or hybrid has presented significant challenges for commercial real estate. While businesses have reopened at total capacity and the U.S. unemployment rate is at a five-decade low, commercial real estate investors are still grappling with the long-term consequences of virtual employment. The lessened demand for office space has led to vacancies in commercial buildings. In the fourth quarter of 2022, U.S. vacancy and total office availability rates reached 12.5% and 16%, respectively, which resemble the highs of the Great Financial Crisis. Twenty-four percent of the $11 trillion commercial real estate market represents office space. The industry will likely be pressured should a recession ensue.
“In our view, the most significant risk is excessive exposure to commercial real estate.”
U.S. regional banks account for 68% of all commercial real estate loans, putting them at severe risk as loans mature and defaults spike. Over $1.5 trillion in commercial real estate debt, financed when interest rates were near zero, will mature in the next three years. As property values fall and debt maturities unfold at higher rates, we expect a wave of defaults. Delinquency rates on office mortgages reached 2.4% in February 2023, an increase from 1.5% six months ago. In mid-February, multinational real estate giant Brookfield Corporation
defaulted on two of the firm’s most prominent skyscrapers in Los Angeles. As noted in Figure 1 below, large banks—with more robust liquidity and regulation—have less loan exposure to commercial real estate than their smaller peers. The market calamity surrounding SVB’s failure has subsided, yet the risks to the financial services industry still loom.
Figure 1: Commercial Real Estate Loans from Small U.S. Banks Exceed Large U.S. Banks

Source: Federal Reserve, Morgan Stanley Research
As small domestic banks experience more headwinds, we expect local businesses to face challenges. Following SVB’s crash, approximately $500 billion flowed out of small lenders and into money-market funds and big banks. Outflows and stricter regulatory guidelines could reduce their capacity to extend credit. Most small businesses rely on community banks or credit unions for financing, as these institutions often leverage soft knowledge of local market conditions to inform a loan decision. Large, highly regulated creditors have more barriers for borrowers than their smaller brethren. Nearly 94% of small firms use credit to cover their expenses, and 52% of that funding comes from community banks. These companies are the fuel of America’s economic engine. We believe more stress on regional banks might lead to a more difficult recession than the market expects.
A Bright Spot in Emerging Market Banks
Amidst the recent financial services turmoil, emerging markets held up better than their Western peers. EM banks do not face the same mark-to-market fears in securities portfolios, as they distribute loans to individuals and corporates. Likewise, these local institutions have a structural advantage as their clients hold liquid assets such as deposits. The sizeable unbanked population in EM countries can
| | |
| SLOW AND STEADY WINS THE RACE | | 13 |
create significant opportunities for growth. Deposits in developing nations tend to be sticky. Therefore, we do not anticipate similar balance sheet issues in these regions. Our EM Financial holdings declined due to macro rather than micro concerns. For instance, Peruvian bank Credicorp and Brazilian lender Itau Bank have conservative yet progressive management teams prioritizing technology to lower costs and increase revenues. Both companies have experienced a credit cycle but remain profitable and resilient despite high inflation and interest rates. Their stock price underperformance stands in contrast to their improving franchise position. We took advantage of recent market volatility and added to our positions.
Outlook and Positioning
While we cannot predict the severity of a recession, our stress testing shows that consensus estimates are too optimistic and could disappoint in the coming quarters. We are overweight in recession-resilient sectors, such as Healthcare, Utilities, and Consumer Staples, and underweight in cyclical sectors, including Energy, Materials, and Industrials. We believe low debt and large dividends will be critical in delivering total returns to equity shareholders. As a result, we have positioned our portfolios accordingly. Ariel International Fund and Ariel Global Fund have a lower debt/equity ratio and higher return on equity than their respective benchmarks. In our view, these fundamental characteristics should help reduce risk and preserve capital from adverse outcomes that may still lie ahead.
As always, we appreciate the opportunity to serve you and welcome any questions or comments you might have.
Sincerely,

Rupal J. Bhansali
Chief Investment Officer
Global Equities
| | |
| 14 | | SLOW AND STEADY WINS THE RACE |
| | | | | | |
| | | Performance Summary | | | | Ariel International Fund |
| | | | |
| | | | As of March 31, 2023 |

Inception: December 30, 2011
| | | | | | | | | | | | | | | |
|
Composition of Equity Holdings (%) | |
| | | |
| | | Ariel Institutional Fund | | MSCI EAFE Net Index | | MSCI ACWI ex-US Net Index |
| | | |
Financials | | | | 19.73 | | | | | 17.68 | | | | | 19.93 | |
| | | |
Health Care | | | | 16.13 | | | | | 13.17 | | | | | 9.57 | |
| | | |
Consumer Discretionary | | | | 13.81 | | | | | 12.02 | | | | | 11.93 | |
| | | |
Utilities | | | | 13.25 | | | | | 3.42 | | | | | 3.22 | |
| | | |
Consumer Staples | | | | 11.57 | | | | | 10.44 | | | | | 8.88 | |
| | | |
Communication Services | | | | 11.44 | | | | | 4.51 | | | | | 6.05 | |
| | | |
Information Technology | | | | 3.70 | | | | | 8.56 | | | | | 11.80 | |
| | | |
Industrials | | | | 2.54 | | | | | 15.62 | | | | | 12.70 | |
| | | |
Energy | | | | 0.57 | | | | | 4.48 | | | | | 5.54 | |
| | | |
Real Estate | | | | 0.09 | | | | | 2.38 | | | | | 2.12 | |
| | | |
Materials | | | | 0.00 | | | | | 7.71 | | | | | 8.26 | |
| | | |
Short-Term Investments | | | | 2.95 | | | | | 0.00 | | | | | 0.00 | |
Sector weightings for the Fund are calculated based on equity holdings as a percentage of total net assets. Source: Northern Trust. The sectors above are the MSCI Global Industry Classification Standard (“GICS”) sector classifications.
| | | | | | | | | | |
|
Top Ten Country Weightings (% of net assets) | |
| | | |
Germany | | | 14.09 | | | Spain | | | 6.20 | |
| | | |
Japan | | | 10.98 | | | United States | | | 6.19 | |
| | | |
France | | | 10.98 | | | Italy | | | 5.35 | |
| | | |
United Kingdom | | | 10.58 | | | China | | | 5.12 | |
| | | |
Switzerland | | | 7.21 | | | Netherlands | | | 5.06 | |
Holdings are categorized according to MSCI Country. Holdings not classified by MSCI are categorized according to Bloomberg Country of Risk. Source: Factset.
| | | | | | | | | | | | |
|
Average Annual Total Returns (%) |
| | | | | | |
| | | Quarter | | 1-Year | | 3-Year | | 5-Year | | 10-Year | | Since
Inception |
| | | | | | |
Ariel International Fund-Investor Class | | 5.40 | | -4.61 | | 6.43 | | 0.89 | | 4.20 | | 4.47 |
| | | | | | |
Ariel International Fund-Institutional Class | | 5.44 | | -4.37 | | 6.71 | | 1.14 | | 4.45 | | 4.72 |
| | | | | | |
MSCI EAFE Net Index | | 8.47 | | -1.38 | | 12.99 | | 3.52 | | 5.00 | | 6.40 |
| | | | | | |
MSCI ACWI ex-US Net Index | | 6.87 | | -5.07 | | 11.81 | | 2.47 | | 4.17 | | 5.43 |
| | | | | | |
MSCI EAFE Value Net Index | | 5.93 | | -0.31 | | 14.59 | | 1.75 | | 3.75 | | 5.15 |
| | | | | | |
MSCI ACWI ex-US Value Net Index | | 5.16 | | -4.00 | | 13.83 | | 1.26 | | 3.06 | | 4.32 |
Performance data quoted represents past performance and does not guarantee future results. All performance assumes the reinvestment of dividends and capital gains. The investment return and principal value of an investment will fluctuate so that an investor’s shares, when redeemed, may be worth more or less than their original cost. Current performance may be lower or higher than the performance data quoted. To access performance data as of the most recent month-end, visit arielinvestments.com. Any extraordinary short-term performance may not be sustainable and is not representative of the performance over longer periods. The total returns reflect that certain fees and expenses have been waived or reduced by the Adviser.

The graph and performance table do not reflect the deduction of taxes that a shareholder would pay on fund distributions or the redemption of fund shares.
| | | | | | | | | | | | |
|
Expense Ratio (as of September 30, 2022) | |
| | | |
| | | Net | | | Gross | | | | |
| | | | |
Investor Class | | | 1.13% | | | | 1.28% | | | | | |
| | | |
Institutional Class | | | 0.88% | | | | 0.93% | | | | | |
Expense ratio caps of 1.13% for the Investor Class and 0.88% for the Institutional Class are in place to waive fees and reimburse certain expenses that exceed these caps. Ariel Investments, LLC (the Adviser) is contractually obligated to maintain these expense ratio caps through 9/30/24.
| | | | | | | | | | | | | | |
|
Top Ten Companies (% of net assets) | |
| | | | | |
| 1 | | Deutsche Boerse AG | | | 9.11 | | | 6 | | Koninklijke Ahold Delhaize NV | | | 5.06 | |
| | | | | |
| 2 | | Roche Holding AG | | | 5.93 | | | 7 | | Philip Morris International, Inc. | | | 5.02 | |
| | | | | |
| 3 | | Michelin (CGDE) | | | 5.75 | | | 8 | | Baidu, Inc. | | | 4.81 | |
| | | | | |
| 4 | | Endesa SA | | | 5.63 | | | 9 | | Snam SpA | | | 4.31 | |
| | | | | |
| 5 | | GSK plc | | | 5.07 | | | 10 | | Subaru Corporation | | | 3.80 | |
Holdings of the same issuer are aggregated and if held as depositary receipts it is not so specified. This list excludes ETFs.
| | |
| SLOW AND STEADY WINS THE RACE | | 15 |
| | | | | | |
| | | Performance Summary | | | | Ariel Global Fund |
| | | | |
| | | | As of March 31, 2023 |

Inception: December 30, 2011
| | | | | | | | | | |
|
| Composition of Equity Holdings (%) |
| | | | | | | | | | |
| | |
| | | Ariel Global Fund | | MSCI ACWI Net
Index |
| | |
Health Care | | 20.62 | | 12.29 |
| | |
Information Technology | | 14.66 | | 22.47 |
| | |
Financials | | 14.28 | | 13.92 |
| | |
Communication Services | | 14.19 | | 7.34 |
| | |
Consumer Staples | | 9.47 | | 7.46 |
| | |
Consumer Discretionary | | 8.89 | | 11.15 |
| | |
Utilities | | 7.05 | | 2.93 |
| | |
Real Estate | | 4.41 | | 2.44 |
| | |
Industrials | | 0.88 | | 10.16 |
| | |
Energy | | 0.00 | | 4.95 |
| | |
Materials | | 0.00 | | 4.88 |
| | |
Short-Term Investments | | 4.73 | | 0.00 |
Sector weightings for the Fund are calculated based on equity holdings as a percentage of total net assets. Source: Northern Trust. The sectors above are the MSCI Global Industry Classification Standard (“GICS”) sector classifications.
| | | | | | | | | | |
|
Top Ten Country Weightings (% of net assets) | |
| | | |
United States | | | 34.75 | | | Brazil | | | 4.88 | |
| | | |
United Kingdom | | | 8.57 | | | Japan | | | 4.88 | |
| | | |
China | | | 7.21 | | | Germany | | | 4.52 | |
| | | |
France | | | 7.07 | | | Spain | | | 4.34 | |
| | | |
Switzerland | | | 5.79 | | | Peru | | | 3.22 | |
Holdings are categorized according to MSCI Country. Holdings not classified by MSCI are categorized according to Bloomberg Country of Risk. Source: Factset.
| | | | | | | | | | | | | | | | | | | | | | |
|
| Average Annual Total Returns (%) |
| | | | | | |
| | | Quarter | | | 1-Year | | | 3-Year | | | 5-Year | | | 10-Year | | | Since Inception |
| | | | | | |
Ariel Global Fund-Investor Class | | | 4.19 | | | | -1.61 | | | | 10.90 | | | | 5.15 | | | | 6.96 | | | 7.41 |
| | | | | | |
Ariel Global Fund-Institutional Class | | | 4.27 | | | | -1.31 | | | | 11.19 | | | | 5.42 | | | | 7.24 | | | 7.68 |
| | | | | | |
MSCI ACWI Net Index | | | 7.31 | | | | -7.44 | | | | 15.37 | | | | 6.93 | | | | 8.06 | | | 9.18 |
| | | | | | |
MSCI ACWI Value Net Index | | | 1.24 | | | | -5.50 | | | | 15.25 | | | | 4.27 | | | | 5.89 | | | 7.17 |
Performance data quoted represents past performance and does not guarantee future results. All performance assumes the reinvestment of dividends and capital gains. The investment return and principal value of an investment will fluctuate so that an investor’s shares, when redeemed, may be worth more or less than their original cost. Current performance may be lower or higher than the performance data quoted. To access performance data as of the most recent month-end, visit arielinvestments.com. Any extraordinary short-term performance may not be sustainable and is not representative of the performance over longer periods. The total returns reflect that certain fees and expenses have been waived or reduced by the Adviser.
The graph and performance table do not reflect the deduction of taxes that a shareholder would pay on fund distributions or the redemption of fund shares.
| | | | | | | | | | | | |
|
Expense Ratio (as of September 30, 2022) | |
| | | |
| | | Net | | | Gross | | | | |
| | | | |
Investor Class | | | 1.13% | | | | 1.30% | | | | | |
| | | |
Institutional Class | | | 0.88% | | | | 0.94% | | | | | |
Expense ratio caps of 1.13% for the Investor Class and 0.88% for the Institutional Class are in place to waive fees and reimburse certain expenses that exceed those caps. Ariel Investments, LLC (the Adviser) is contractually obligated to maintain these expense ratio caps through 9/30/24.
| | | | | | | | | | | | | | |
|
Top Ten Companies (% of net assets) | |
| | | | | |
| 1 | | Microsoft Corporation | | | 8.19 | | | 6 | | Verizon Communications, Inc. | | | 4.50 | |
| | | | | |
| 2 | | Baidu, Inc. | | | 6.55 | | | 7 | | Equity Commonwealth | | | 4.41 | |
| | | | | |
| 3 | | Roche Holding AG | | | 5.03 | | | 8 | | Endesa SA | | | 4.34 | |
| | | | | |
| 4 | | GSK plc | | | 4.97 | | | 9 | | Michelin (CGDE) | | | 3.99 | |
| | | | | |
| 5 | | Philip Morris International, Inc. | | | 4.69 | | | 10 | | Deutsche Boerse AG | | | 3.34 | |
Holdings of the same issuer are aggregated and if held as depositary receipts it is not so specified. This list excludes ETFs.
| | |
| 16 | | SLOW AND STEADY WINS THE RACE |
| | | | | | |
| | | Company Spotlight | | | | Baidu, Inc. |
| | | | |
| | | | |

Founded in 2000, Baidu, Inc. is a leading artificial intelligence (AI) technology company that dominates internet search in China. As of 2022, its mobile platform reached 648 million monthly average users. Since 2016, Baidu has transitioned from an internet company into an AI technology company, offering a full AI stack, encompassing infrastructure that consists of AI chips, deep learning frameworks, The company also offers core AI capabilities, such as natural language processing, knowledge graphs, speech recognition, computer vision, augmented reality, as well as an open AI platform.
The Macro Recovery Play
Since the severe COVID-19 outbreak in March 2022, China’s COVID-Zero policy imposed strict measures and lockdowns to curb the spread of the virus, which disrupted outdoor activities and the overall macroeconomy. Companies like Baidu, which have substantial exposure to offline local services, travel and healthcare vertical industry advertisements, were particularly affected as the demand for these services dwindled. As the COVID-Zero policy eased last December and the country gradually reopened, Baidu was well-positioned to reap the rewards of the economic recovery. As industries like travel and local services continue to bounce back, the advertising demand from these sectors is anticipated to recover to 100% of pre-pandemic levels. We believe this will drive a resurgence in Baidu’s advertising revenue and overall business performance.
Internet Crackdown Fallout
Baidu’s stock was an indirect victim of the fallout resulting from China’s regulation of its internet sector, even though the company’s fundamentals were sound. Since the Ant Group and Didi IPO debacles in November 2020 and July 2021, respectively, the Chinese government has cracked down on the internet sector with a social agenda. Wide-ranging measures spanned protections for minors on video gaming, a ban on private education K-12 tutoring, anti-monopoly
steps for e-commerce, and strengthened data collection and data security on service platforms to protect national security and personal information. However, the regulatory impact on Baidu is limited given its low revenue exposure to video gaming and K-12 private tutoring. Its search engine also does not collect sensitive personal information. We believe Baidu’s multiple compression was excessive relative to the risk from the crackdown.
Driving Advancements in AI
Investors mischaracterize Baidu as merely an online marketing internet company. While 73% of the company’s core 2022 sales were generated by online marketing, Baidu has been an AI technology company since 2016, following a change in strategic focus by its visionary CEO Robin Li. Baidu proactively invested in AI research, integrating AI technologies into its existing products and services. Its initiatives span an open-source autonomous driving platform—Apollo (like Tesla’s full self-driving system) and an AI-powered voice assistant ecosystem—DuerOS (like Amazon’s Alexa). Most recently, the company launched Ernie Bot, an AI-based chatbot, which is the Chinese equivalent of ChatGPT. Drawing parallels with OpenAI, Baidu should be seen as China’s National Champion in AI, shaping the future of technology and driving AI advancements in the country.
Opportunity Awaits at a Deep Discount
On March 31, 2023, shares traded at $150.92, which was at a 30-40% discount to Tencent, Google and Meta. At current levels, investors have failed to capture both near-term economic recovery and long-term AI growth prospects in China.
| | |
| SLOW AND STEADY WINS THE RACE | | 17 |
| | | | | | |
| | | Company Spotlight | | | | Leslie’s, Inc. |
| | | | |
| | | | |

Founded in 1963, Leslie’s, Inc. (NYSE: LESL) is the largest direct-to-consumer brand in the U.S. pool and spa care industry, serving residential, professional and commercial consumers. As a market leader, its vertical integration, scale, and customer loyalty are differentiators in a highly fragmented industry positioned for consolidation. Eighty percent (80%) of Leslie’s revenue is considered recurring and non-discretionary. Demand continues to grow as homeowners invest in their properties. The addition of pools has increased the base of customers for the company’s specialty and maintenance products. As such, Leslie’s has experienced top-line growth in the worst economic cycles, such as the “dot com” bubble and the Great Financial Crisis. Resiliency through these periods has allowed Leslie’s to grow top-line revenue for 59 years.
After the closing of an attractive IPO aided by the pandemic, Leslie’s stock dipped as the market feared the company’s growth and new pool installations might be negatively impacted by a weakening housing market. However, we believe the market is undervaluing the industry’s resilience and Leslie’s ability to consolidate a niche and fragmented market. The company’s superior customer service and innovation have created a loyal customer base. Our belief is that this is an attractive opportunity to own a differentiated retailer in an industry poised to benefit from long lasting secular tailwinds uplifted by the pandemic.
It’s Not Just a Day at the Beach
Leslie’s has built a resilient business model in a consistent market. In-ground related pool installations have increased for 52 consecutive years. Pool maintenance is also much more complex and specialized than most realize, creating a unique opening between what specialty retailers and wholesalers can offer. Leslie’s is rare in that it is a one-stop shop for pool diagnostics. Not only does it provide a proprietary AccuBlu rapid testing option, but its tailored solutions are also designed to meet each customer’s needs. Other competitors
and wholesalers lack Leslie’s breadth of products, supplies and its high-quality pool equipment.
Swimming Around a Moat
The company manufactures and offers mostly proprietary formulas through physical and online channels. Leslie’s products are often the biggest sellers on e-commerce platforms such as Amazon. The company controls the entire process from manufacturing to the point of sales with visibility into the needs of pool owners. The company operates ~1,000 stores, a footprint 5x bigger than its 20 closest competitors combined and has more prominence on digital channels. Additionally, approximately 50% of the industry is composed of independent companies who lack Leslie’s bargaining acumen with suppliers to effectively compete. The company leverages its buying powers to boost margins on acquired stores. The geographical footprint puts 90% of all U.S. pools within 15 minutes of Leslie’s stores, allowing the company to remain top of mind for pool-related solutions or convenient purchases for pool professionals.
A Pool of Free Cash Flow
Leslie’s is the strongest player in a highly predictable industry with annuity-like revenue. For half a century, the number of pools in the U.S. has grown and Leslie’s revenue has expanded for nearly 60 years even through challenging economic times. Given the secular trends and its competitive advantages, Leslie’s is expected to continue driving top-line growth over the long run. As of March 31, 2023, shares traded at $11.01, a discount of 50% to our estimated private market value of $22.24.
| | |
| 18 | | SLOW AND STEADY WINS THE RACE |
| | | | | | |
| | | Company Spotlight | | | | Madison Square Garden Entertainment |
| | | | |
| | | | |

Madison Square Garden Entertainment (NYSE: MSGE) is a leader in live entertainment with assets such as Madison Square Garden, Hulu Theater, Radio City Music Hall, Beacon Theatre, The Chicago Theatre, and the Christmas Spectacular Starring the Radio City Rockettes. With much anticipation, the company will soon open MSG Sphere, an evolutionary venue for immersive concerts, shows and other events in Las Vegas. Madison Square Garden Entertainment also runs MSG Networks, home of the NY Knicks and NY Rangers who will soon be in the NBA and NHL playoffs, respectively.
Music to Our Ears
On April 20th, long-time holding Madison Square Garden Entertainment has the chance to transform itself again through a spinoff of its live entertainment business, which we believe should enhance shareholder value. During Ariel’s holding period, we have witnessed the 2015 separation of MSG Networks and MSG (Sports & Entertainment), the 2020 split of MSG into Madison Square Garden Entertainment and MSG Sports, which quickly resulted in Madison Square Garden Entertainment’s acquisition of MSG Networks in 2021.
In February of this year, board members approved the spin-off of the company’s live entertainment assets, including the iconic Madison Square Garden, to be named Madison Square Garden Entertainment Corp. (MSGE). The remaining entity, which includes the MSG Sphere, Tao Group Hospitality (dining and nightlife brands Tao and Hakkasan) and MSG Networks will be known as Sphere Entertainment Co. (SPHR).
Stronger Apart Than Together
Following disappointing stock performance, the board, led by Executive Chairman and CEO James Dolan, believes two separate publicly traded entities will offer investors better disclosure to properly value the businesses. We agree with this strategic corporate action and the market has responded favorably.
A Tale of Two Companies
Pre-market spinoff sentiment is positive on Madison Square Garden Entertainment given the expected cash flow from the iconic Madison Square Garden, Radio City Music Hall, and the Christmas Spectacular staring the Rockettes. The Garden has been the home of the NY Knicks and NY Rangers since 1968 and remains a ‘must-stop’ for many premier sporting events and performing acts, such as Elton John, Billy Joel, and Harry Styles. The fight of the century—Muhammad Ali versus Joe Frazier—and the matchup between Rocky Marciano versus Joe Lewis were also held at The Garden. The board’s recently announced $250 million share repurchase program should return value to shareholders.
By contrast, pre-market spinoff sentiment is soft on Sphere Entertainment. The substantial cost overruns in constructing the Sphere and the risks associated with filling such a unique, fully immersive entertainment experience are not trivial. That said, we remain optimistic that Madison Square Garden Entertainment will deliver operating results that will exceed expectations. Film makers and marquee events should produce higher than expected advertising revenue—U2 will be the venue’s first residency in the fall and the November 2023 Las Vegas Grand Prix will be winding through the MSG Sphere Zone with much enthusiasm. Given the estimated cash flow generation from the Sphere, a potential sale of its stake in Tao, significant cash flows from MSG Networks and a one-third interest in Madison Square Garden Entertainment, we are confident Sphere Entertainment Co. has more than adequate capital to address unforeseen circumstances.
Bargain Shopping for the Contrarian Investor
In our view, the market is being too pessimistic with its outlook for Madison Square Garden Entertainment and Sphere Entertainment. We believe spinoffs can create substantial shareholder value for investors over the long run. With an estimated private market value of $102.86, Madison Square Garden Entertainment is trading at a 43% discount to its March 31, 2023 price of $59.07.
| | |
| SLOW AND STEADY WINS THE RACE | | 19 |
| | | | | | |
| | | Company Spotlight | | | | Stericycle, Inc. |
| | | | |
| | | | |

Founded in 1989, Stericycle, Inc. (NYSE: SRCL) is a market leader for regulated waste and information destruction compliance-based solutions for industries and customers around the world. Regulated waste (needles, biohazard waste and expired pharmaceuticals) requires governmental-imposed handling, while regulated document disposal (confidential information) is discarded through a shredding or hard drive destruction process. The company’s more than one million customers range from healthcare facilities, veterinary and dental offices, cruise ships, government and military offices, banks, and many more businesses. The proper disposal of products in regulated industries is crucial to reputational preservation and the avoidance of high fines. With more than 440 facilities, Stericycle has the scale to service companies across the globe with a focus on large national and international customers. Given Stericycle’s history, reputation and reach, customers know they have a trusted solution to handle their waste and confidential information with the utmost care.
Focused and Innovating
In the past five years, Stericycle has revamped and upgraded its Board of Directors and managerial team with leaders Cindy Miller, President and Chief Executive Officer and Janet Zelenka, Chief Financial Officer. Cindy and Janet joined the company in 2018 and 2019, respectively and faced several challenges to refocus the business on its core strengths and value creation opportunities. This management team has executed on many initiatives, including small-customer pricing settlements, product and service rationalization, a secure information destruction Enterprise Resource Planning (ERP) software system implementation, and balance sheet improvements. We now sit on the precipice of the next greatest challenge—the implementation of the ERP system in the largest segment, Regulated Waste and Compliance Solutions. While this program is costly and disruptive in the short-term, we expect it to deliver meaningful operating efficiencies and margin upside over time.
Margin Expansion Creation
Stericycle, along with numerous other organizations, was negatively impacted in its Secure Information Destruction business by the pandemic due to office closures. In addition, the ERP implementation was delayed given the challenges in training employees as companies adapted to health recommendations on social distancing restrictions. Furthermore, the company has been adversely affected by the labor shortages and high inflationary environment. As these headwinds are stabilizing and with the long-anticipated roll-out of the ERP at hand this year, the company is positioned to exhibit significant margin expansion over the next several years. Unlocking the available data on a real-time basis will allow the company to increase service offering penetration, logistical efficiencies and productivity improvements. Given the years of work the team has already performed on the quality of revenue, Stericycle is expected to continue improving customer retention rates and cross-selling opportunities.
Fruits of Their Labors
Over the years, we have gained an appreciation for the significant amount of work the management team has undertaken and completed. These initiatives should improve the underlying business and provide a foundation for future growth and success. Our expectation is the hard work and dedication of Stericycle’s management and employees will deliver long-term results to patient investors. As of March 31, 2023, Stericycle traded at $43.61, a 46% discount to our valuation.
| | |
| 20 | | SLOW AND STEADY WINS THE RACE |
| | | | | | |
| | |  | | | | |
| | | | March 31, 2023 (Unaudited) |
| | | | |
| Number of Shares | | Common Stocks—99.17% | | Value ($) |
| | | Consumer Discretionary—38.19% | | |
| 2,692,235 | | Madison Square Garden Entertainment Corporation(a) | | 159,030,321 |
| 1,808,803 | | Boyd Gaming Corporation | | 115,980,448 |
| 1,771,242 | | Royal Caribbean Cruises, Ltd.(a) | | 115,662,103 |
| 2,884,183 | | Interpublic Group of Companies, Inc. | | 107,406,975 |
| 4,429,527 | | Paramount Global | | 98,822,747 |
| 2,483,699 | | Adtalem Global Education, Inc. (a)(b) | | 95,920,455 |
| 5,101,890 | | Mattel, lnc.(a) | | 93,925,795 |
| 3,027,551 | | Gentex Corporation | | 84,862,255 |
| 352,807 | | Madison Square Garden Sports Corporation | | 68,744,444 |
| 5,560,591 | | Leslie’s, lnc.(a) | | 61,222,107 |
| 1,954,771 | | Manchester United plc | | 43,298,178 |
| | | | | 1,044,875,828 |
| | | Consumer Staples—1.59% | | |
| 276,760 | | J.M. Smucker Company | | 43,553,721 |
| | | Energy—2.87% | | |
| 3,565,025 | | Core Laboratories NV(b) | | 78,608,801 |
| | | Financials—18.63% | | |
| 662,258 | | Affiliated Managers Group, Inc. | | 94,318,784 |
| 1,043,025 | | Northern Trust Corporation | | 91,921,793 |
| 2,589,887 | | Lazard, Ltd., Class A | | 85,751,159 |
| 1,178,222 | | First American Financial Corporation | | 65,579,837 |
| 1,705,585 | | Carlyle Group, Inc. | | 52,975,470 |
| 618,801 | | BOK Financial Corporation | | 52,232,992 |
| 1,903,797 | | Janus Henderson Group plc | | 50,717,152 |
| 2,070,647 | | GCM Grosvenor, Inc. | | 16,171,753 |
| | | | | 509,668,940 |
| | | Health Care—5.45% | | |
| 1,625,656 | | Envista Holdings Corporation(a) | | 66,456,817 |
| 226,536 | | Laboratory Corporation of America Holdings | | 51,971,889 |
| 152,341 | | Charles River Laboratories International, lnc.(a) | | 30,745,461 |
| | | | | 149,174,167 |
| | | Industrials—25.94% | | |
| 329,435 | | Zebra Technologies Corporation(a) | | 104,760,330 |
| 992,301 | | Mohawk Industries, Inc.(a) | | 99,448,406 |
| 4,892,079 | | Resideo Technologies, lnc.(a) | | 89,427,204 |
| 2,657,776 | | Axalta Coating Systems, Ltd.(a) | | 80,504,035 |
| 2,916,490 | | Kennametal, Inc. | | 80,436,794 |
| 9,347,528 | | ADT, Inc. | | 67,582,627 |
| 1,158,771 | | Masco Corporation | | 57,614,094 |
| 514,482 | | Generac Holdings, lnc.(a) | | 55,569,201 |
| 200,847 | | Snap-on, Inc. | | 49,587,116 |
| 225,232 | | Simpson Manufacturing Company, Inc. | | 24,694,437 |
| | | | | 709,624,244 |
| | | Real Estate—4.17% | | |
| 609,183 | | Jones Lang LaSalle, Inc.(a) | | 88,630,035 |
| 351,487 | | CBRE Group, Inc., Class A(a) | | 25,591,769 |
| | | | | 114,221,804 |
| | | Utilities—2.33% | | |
| 1,463,114 | | Stericycle, lnc.(a) | | 63,806,402 |
| | | Total Common Stocks (Cost $2,186,340,197) | | 2,713,533,907 |
The accompanying notes are an integral part of the financial statements.
| | |
| SLOW AND STEADY WINS THE RACE | | 21 |
| | | | | | |
| | | | | | | |
| | | | |
| | | | March 31, 2023 (Unaudited) |
| | | | |
| Number of Shares | | Short-Term Investments—0.58% | | Value ($) |
| 15,934,481 | | Northern Institutional Treasury Portfolio, 4.51%(c) | | 15,934,481 |
| | | Total Short-Term Investments (Cost $15,934,481) | | 15,934,481 |
| | | | | |
| | | Total Investments—99.75% (Cost $2,202,274,678) | | 2,729,468,388 |
| | | Other Assets less Liabilities—0.25% | | 6,723,665 |
| | | Net Assets—100.00% | | 2,736,192,053 |
| | | | |
| Number of Shares | | Common Stocks—97.71% | | Value ($) |
| | | Consumer Discretionary—27.37% | | |
| 838,171 | | BorgWarner, Inc. | | 41,162,578 |
| 635,225 | | Madison Square Garden Entertainment Corporation(a) | | 37,522,741 |
| 2,015,223 | | Mattel, lnc.(a) | | 37,100,255 |
| 995,635 | | Interpublic Group of Companies, Inc. | | 37,077,447 |
| 528,519 | | CarMax, lnc.(a) | | 33,973,201 |
| 163,613 | | Madison Square Garden Sports Corporation | | 31,879,993 |
| 1,383,688 | | Manchester United plc | | 30,648,689 |
| 1,496,351 | | Knowles Corporation(a) | | 25,437,967 |
| 780,368 | | Gentex Corporation | | 21,873,715 |
| 70,940 | | Vail Resorts, Inc. | | 16,577,259 |
| | | | | 313,253,845 |
| | | Consumer Staples—4.99% | | |
| 679,498 | | Walgreens Boots Alliance, Inc. | | 23,497,041 |
| 331,941 | | Molson Coors Beverage Company | | 17,154,711 |
| 104,937 | | J.M. Smucker Company | | 16,513,936 |
| | | | | 57,165,688 |
| | | Energy—3.49% | | |
| 1,301,527 | | Core Laboratories NV | | 28,698,670 |
| 607,944 | | NOV, Inc. | | 11,253,043 |
| | | | | 39,951,713 |
| | | Financials—23.60% | | |
| 143,693 | | Goldman Sachs Group, Inc. | | 47,003,417 |
| 519,494 | | Northern Trust Corporation | | 45,783,006 |
| 526,397 | | Aflac, Inc. | | 33,963,135 |
| 373,531 | | BOK Financial Corporation | | 31,529,752 |
| 600,094 | | The Charles Schwab Corporation | | 31,432,924 |
| 565,258 | | KKR & Company, Inc. | | 29,687,350 |
| 808,934 | | Lazard, Ltd., Class A | | 26,783,805 |
| 430,811 | | First American Financial Corporation | | 23,978,940 |
| | | | | 270,162,329 |
| | | Health Care—11.68% | | |
| 180,106 | | Laboratory Corporation of America Holdings | | 41,319,919 |
| 149,027 | | Charles River Laboratories International, lnc.(a) | | 30,076,629 |
| 199,654 | | Zimmer Biomet Holdings, Inc. | | 25,795,297 |
| 611,518 | | Envista Holdings Corporation(a) | | 24,998,856 |
| 152,395 | | Cardinal Health, Inc. | | 11,505,823 |
| | | | | 133,696,524 |
| | | Industrials—21.59% | | |
| 1,288,926 | | Kennametal, Inc. | | 35,548,579 |
| 1,151,884 | | Axalta Coating Systems, Ltd.(a) | | 34,890,566 |
| 728,042 | | nVent Electric plc | | 31,262,124 |
The accompanying notes are an integral part of the financial statements.
| | |
| 22 | | SLOW AND STEADY WINS THE RACE |
| | | | | | |
| | | | | | | |
| | | | |
| | | | March 31, 2023 (Unaudited) |
|
|
Ariel Appreciation Fund (Continued) |
| | | | |
| Number of Shares | | Common Stocks—97.71% | | Value ($) |
| | | Industrials—21.59% | | |
| 386,059 | | Stanley Black & Decker, Inc. | | 31,108,634 |
| 92,793 | | Littelfuse, Inc. | | 24,876,875 |
| 1,292,985 | | Resideo Technologies, lnc.(a) | | 23,635,766 |
| 197,594 | | Generac Holdings, lnc.(a) | | 21,342,128 |
| 125,954 | | Keysight Technologies, lnc.(a) | | 20,339,052 |
| 54,400 | | Snap-on, Inc. | | 13,430,816 |
| 1,472,337 | | ADT, Inc. | | 10,644,997 |
| | | | | 247,079,537 |
| | | Real Estate—2.94% | | |
| 343,757 | | CBRE Group, Inc., Class A(a) | | 25,028,947 |
| 59,468 | | Jones Lang LaSalle, lnc.(a) | | 8,651,999 |
| | | | | 33,680,946 |
| | | Utilities—2.05% | | |
| 538,568 | | Stericycle, lnc.(a) | | 23,486,951 |
| | | Total Common Stocks (Cost $835,276,358) | | 1,118,477,533 |
| | |
| Number of Shares | | Short-Term Investments—2.62% | | Value ($) |
| 29,988,711 | | Northern Institutional Treasury Portfolio, 4.51%(c) | | 29,988,711 |
| | | Total Short-Term Investments (Cost $29,988,711) | | 29,988,711 |
| | | | | |
| | | Total Investments—100.33% (Cost $865,265,069) | | 1,148,466,244 |
| | | Other Assets less Liabilities—(0.33)% | | (3,763,878) |
| | | Net Assets—100.00% | | 1,144,702,366 |
| | | | |
| Number of Shares | | Common Stocks—97.23% | | Value ($) |
| | | Basic Materials—8.65% | | |
| 70,819 | | Mosaic Company | | 3,249,176 |
| 130,161 | | Barrick Gold Corporation | | 2,417,090 |
| | | | | 5,666,266 |
| | | Consumer Discretionary—16.25% | | |
| 89,274 | | BorgWarner, Inc. | | 4,384,246 |
| 12,324 | | Madison Square Garden Sports Corporation | | 2,401,331 |
| 37,109 | | Madison Square Garden Entertainment Corporation(a) | | 2,192,028 |
| 26,016 | | Boyd Gaming Corporation | | 1,668,146 |
| | | | | 10,645,751 |
| | | Energy—5.39% | | |
| 97,865 | | APA Corporation | | 3,529,012 |
| | | Financials—27.55% | | |
| 11,454 | | Goldman Sachs Group, Inc. | | 3,746,718 |
| 41,536 | | BOK Financial Corporation | | 3,506,054 |
| 28,875 | | Northern Trust Corporation | | 2,544,754 |
| 33,504 | | First American Financial Corporation | | 1,864,833 |
| 64,883 | | Bank of America Corporation | | 1,855,654 |
| 40,643 | | Bank of New York Mellon Corporation | | 1,846,818 |
| 49,663 | | Lazard, Ltd., Class A | | 1,644,342 |
| 19,732 | | KKR & Company, Inc. | | 1,036,325 |
| | | | | 18,045,498 |
The accompanying notes are an integral part of the financial statements.
| | |
| SLOW AND STEADY WINS THE RACE | | 23 |
| | | | | | |
| | | | | | | |
| | | | |
| | | | March 31, 2023 (Unaudited) |
|
|
Ariel Focus Fund (Continued) |
| | | | |
| Number of Shares | | Common Stocks—97.23% | | Value ($) |
| | | Health Care-10.32% | | |
| 15,297 | | Johnson & Johnson | | 2,371,035 |
| 10,111 | | Laboratory Corporation of America Holdings | | 2,319,665 |
| 165,187 | | ZimVie, Inc. (a) | | 1,194,302 |
| 6,808 | | Zimmer Biomet Holdings, Inc. | | 879,593 |
| | | | | 6,764,595 |
| | | Industrials—24.06% | | |
| 15,357 | | Snap-on, Inc. | | 3,791,490 |
| 7,019 | | Lockheed Martin Corporation | | 3,318,092 |
| 135,237 | | Resideo Technologies, lnc.(a) | | 2,472,132 |
| 22,714 | | Mohawk Industries, lnc.(a) | | 2,276,397 |
| 4,307 | | Zebra Technologies Corporation(a) | | 1,369,626 |
| 113,932 | | Western Union Company | | 1,270,342 |
| 11,681 | | Generac Holdings, lnc.(a) | | 1,261,665 |
| | | | | 15,759,744 |
| | | Technology—5.01% | | |
| 35,307 | | Oracle Corporation | | 3,280,726 |
| | | Total Common Stocks (Cost $54,869,378) | | 63,691,592 |
| | |
| Number of Shares | | Short-Term Investments—3.34% | | Value ($) |
| 2,185,546 | | Northern Institutional Treasury Portfolio, 4.51%(c) | | 2,185,546 |
| | | Total Short-Term Investments (Cost $2,185,546) | | 2,185,546 |
| | | | | |
| | | Total Investments—100.57% (Cost $57,054,924) | | 65,877,138 |
| | | Other Assets less Liabilities—(0.57)% | | (373,437) |
| | | Net Assets—100.00% | | 65,503,701 |
| | | | |
| Number of Shares | | Common Stocks—92.28% | | Value ($) |
| | | Belgium—0.73% | | |
| 76,742 | | KBC Group NV | | 5,268,250 |
| | | Brazil—1.74% | | |
| 927,020 | | Telefonica Brasil SA ADR | | 7,017,541 |
| 217,877 | | TIM SA ADR | | 2,692,960 |
| 255,669 | | BB Seguridade Participacoes SA ADR | | 1,631,168 |
| 431,436 | | Ambev SA ADR(a) | | 1,216,650 |
| | | | | 12,558,319 |
| | | Canada—0.47% | | |
| 255,604 | | Element Fleet Management Corporation | | 3,356,989 |
| | | Chile—0.11% | | |
| 42,420 | | Banco Santander-Chile ADR | | 756,349 |
| | | China—5.12% | | |
| 229,712 | | Baidu, Inc. ADR(a) | | 34,668,135 |
| 992,353 | | TravelSky Technology, Ltd. | | 1,853,259 |
| 10,689 | | Trip.com Group, Ltd. ADR(a) | | 402,655 |
| | | | | 36,924,049 |
| | | Denmark—0.85% | | |
| 1,325,580 | | H Lundbeck A/S, Class B | | 6,132,594 |
The accompanying notes are an integral part of the financial statements.
| | |
| 24 | | SLOW AND STEADY WINS THE RACE |
| | | | | | |
| | | | | | | |
| | | | |
| | | | March 31, 2023 (Unaudited) |
|
|
Ariel International Fund (Continued) |
| | | | |
| Number of Shares | | Common Stocks—92.28% | | Value ($) |
| | | Finland—2.52% | | |
| 3,097,680 | | Nokia Corporation | | 15,169,524 |
| 617,732 | | Nokia Corporation ADR | | 3,033,064 |
| | | | | 18,202,588 |
| | | France—10.98% | | |
| 1,358,209 | | Michelin (CGDE) | | 41,456,957 |
| 193,300 | | Sanofi | | 21,013,697 |
| 220,906 | | BNP Paribas SA | | 13,226,801 |
| 17,973 | | Thales SA | | 2,657,696 |
| 5,668 | | Safran SA | | 839,304 |
| | | | | 79,194,455 |
| | | Germany—14.09% | | |
| 337,667 | | Deutsche Boerse AG | | 65,714,566 |
| 8,023,090 | | Telefonica Deutschland Holding | | 24,684,854 |
| 27,909 | | Muenchener Rueckver AG | | 9,761,208 |
| 35,608 | | Fresenius Medical Care AG & Company KGaA | | 1,509,920 |
| | | | | 101,670,548 |
| | | Hong Kong—2.27% | | |
| 2,270,500 | | CLP Holdings, Ltd. | | 16,399,871 |
| | | Italy—5.35% | | |
| 5,868,818 | | Snam SpA | | 31,117,181 |
| 1,225,252 | | Italgas SpA | | 7,474,420 |
| | | | | 38,591,601 |
| | | Japan—10.98% | | |
| 1,723,300 | | Subaru Corporation | | 27,444,307 |
| 600,400 | | Bridgestone Corporation | | 24,269,228 |
| 213,300 | | Secom Company, Ltd. | | 13,115,279 |
| 190,000 | | Nintendo Company, Ltd. | | 7,342,421 |
| 101,000 | | Sankyo Company, Ltd. | | 4,206,590 |
| 47,400 | | Mabuchi Motor Company, Ltd. | | 1,376,215 |
| 40,400 | | Ono Pharmaceutical Company, Ltd. | | 841,014 |
| 6,200 | | Daito Trust Construction Company, Ltd. | | 615,914 |
| | | | | 79,210,968 |
| | | Luxembourg—0.48% | | |
| 69,843 | | RTL Group | | 3,441,841 |
| | | Netherlands—5.06% | | |
| 1,068,547 | | Koninklijke Ahold Delhaize NV | | 36,491,847 |
| | | Peru—1.11% | | |
| 60,518 | | Credicorp, Ltd. | | 8,011,978 |
| | | Portugal—0.11% | | |
| 32,940 | | Jeronimo Martins SGPS SA | | 772,341 |
| | | Singapore—0.13% | | |
| 131,300 | | Singapore Exchange, Ltd. | | 927,427 |
| | | Spain—6.20% | | |
| 1,873,043 | | Endesa SA | | 40,626,303 |
| 374,536 | | Tecnicas Reunidas SA(a) | | 4,102,461 |
| | | | | 44,728,764 |
| | | Switzerland—7.21% | | |
| 150,002 | | Roche Holding AG | | 42,781,597 |
| 81,458 | | Novartis AG | | 7,457,153 |
| 11,939 | | Nestle SA | | 1,454,419 |
| 9,563 | | Adecco Group AG | | 346,482 |
| | | | | 52,039,651 |
The accompanying notes are an integral part of the financial statements.
| | |
| SLOW AND STEADY WINS THE RACE | | 25 |
| | | | | | |
| | | | | | | |
| | | | |
| | | | March 31, 2023 (Unaudited) |
|
|
Ariel International Fund (Continued) |
| | | | |
| Number of Shares | | Common Stocks—92.28% | | Value ($) |
| | | United Kingdom—10.58% | | |
| 2,076,482 | | GSK pIc | | 36,604,525 |
| 11,311,496 | | Direct Line Insurance Group plc | | 19,186,560 |
| 321,345 | | Admiral Group plc | | 8,078,860 |
| 50,516 | | Reckitt Benckiser Group plc | | 3,837,453 |
| 882,098 | | Haleon plc | | 3,503,863 |
| 2,429,637 | | Vodafone Group plc | | 2,676,500 |
| 154,871 | | Close Brothers Group plc | | 1,721,350 |
| 48,802 | | St. James’s Place plc | | 729,048 |
| | | | | 76,338,159 |
| | | United States—6.19% | | |
| 372,278 | | Philip Morris International, Inc. | | 36,204,036 |
| 65,108 | | Check Point Software Technologies, Ltd.(a) | | 8,464,040 |
| | | | | 44,668,076 |
| | | Total Common Stocks (Cost $602,778,393) | | 665,686,665 |
| | |
| Number of Shares | | Preferred Stocks—0.55% | | Value ($) |
| | | Brazil—0.55% | | |
| 811,247 | | Itau Unibanco Holding SA ADR, 0.54%(d) | | 3,950,773 |
| | | Total Preferred Stocks (Cost $3,790,593) | | 3,950,773 |
| | |
| Number of Shares | | Short-Term Investments—2.95% | | Value ($) |
| 21,267,623 | | Northern Institutional Treasury Portfolio, 4.51%(c) | | 21,267,623 |
| | | Total Short-Term Investments (Cost $21,267,623) | | 21,267,623 |
| | | | | |
| | | Total Investments—95.78% (Cost $627,836,609) | | 690,905,061 |
| | | Foreign Currency, Other Assets less Liabilities—4.22% | | 30,458,138 |
| | | Net Assets—100.00% | | 721,363,199 |
The accompanying notes are an integral part of the financial statements.
| | |
| 26 | | SLOW AND STEADY WINS THE RACE |
| | | | | | |
| | | | | | | |
| | | | |
| | | | March 31, 2023 (Unaudited) |
|
|
Ariel International Fund (Continued) |
|
|
Open Forward Currency Contracts |
| | | | | | | | | | | | | | | | | | | | | | | | |
| | | | | | | |
Contract Settlement Date | | Counterparty | | | Currency to be Received | | | Amount to be Received | | | Currency to be Delivered | | | Amount to be Delivered | | | Unrealized Appreciation (Depreciation) |
| |
Open Forward Currency Contracts with Unrealized Appreciation | | | | | |
| | | | | | |
04/27/2023 | | | UBS | | | | USD | | | | 12,595,688 | | | | CNH | | | | 85,089,540 | | | | $189,273 | |
| | | | | | |
04/27/2023 | | | UBS | | | | GBP | | | | 16,090,747 | | | | USD | | | | 19,602,086 | | | | 258,625 | |
| | | | | | |
Subtotal UBS | | | | | | | | | | | | | | | | | | | | | | | 447,898 | |
| | | | | | |
04/27/2023 | | | JPMorgan | | | | USD | | | | 3,102,011 | | | | CAD | | | | 4,164,989 | | | | 19,041 | |
| | | | | | |
Subtotal JPMorgan | | | | | | | | | | | | | | | | | | | | | | | 19,041 | |
| |
Subtotal - Open Forward Currency Contracts with Unrealized Appreciation | | | | $466,939 | |
| |
Open Forward Currency Contracts with Unrealized Depreciation | | | | | |
| | | | | | |
04/27/2023 | | | UBS | | | | AUD | | | | 12,834,839 | | | | EUR | | | | 8,291,143 | | | | (417,637) | |
| | | | | | |
04/27/2023 | | | UBS | | | | NOK | | | | 11,136,049 | | | | EUR | | | | 1,021,694 | | | | (44,728) | |
| | | | | | |
04/27/2023 | | | UBS | | | | SEK | | | | 24,602,810 | | | | EUR | | | | 2,217,036 | | | | (33,938) | |
| | | | | | |
04/27/2023 | | | UBS | | | | AUD | | | | 52,567,329 | | | | USD | | | | 36,717,070 | | | | (1,544,565) | |
| | | | | | |
04/27/2023 | | | UBS | | | | NOK | | | | 30,434,734 | | | | USD | | | | 3,019,205 | | | | (108,633) | |
| | | | | | |
04/27/2023 | | | UBS | | | | SEK | | | | 118,914,897 | | | | USD | | | | 11,586,224 | | | | (111,388) | |
| | | | | | |
04/27/2023 | | | UBS | | | | SGD | | | | 2,660,016 | | | | USD | | | | 2,015,000 | | | | (14,492) | |
| | | | | | |
Subtotal UBS | | | | | | | | | | | | | | | | | | | | | | | (2,275,381) | |
| | | | | | |
04/27/2023 | | | Northern Trust | | | | SEK | | | | 52,846,263 | | | | USD | | | | 5,140,437 | | | | (40,973) | |
| | | | | | |
04/27/2023 | | | Northern Trust | | | | SGD | | | | 7,390,104 | | | | USD | | | | 5,599,518 | | | | (41,672) | |
| | | | | | |
Subtotal Northern Trust | | | | | | | | | | | | | | | | | | | | | | | (82,645) | |
| | | | | | |
04/27/2023 | | | JPMorgan | | | | USD | | | | 565,244 | | | | CAD | | | | 768,205 | | | | (3,390) | |
| | | | | | |
04/27/2023 | | | JPMorgan | | | | JPY | | | | 1,285,613,730 | | | | CNH | | | | 66,915,731 | | | | (31,096) | |
| | | | | | |
04/27/2023 | | | JPMorgan | | | | SGD | | | | 1,548,216 | | | | EUR | | | | 1,085,288 | | | | (14,416) | |
| | | | | | |
04/27/2023 | | | JPMorgan | | | | USD | | | | 31,544,822 | | | | EUR | | | | 29,211,799 | | | | (183,330) | |
| | | | | | |
04/27/2023 | | | JPMorgan | | | | JPY | | | | 4,097,409,701 | | | | USD | | | | 31,576,973 | | | | (580,601) | |
| | | |
Subtotal JPMorgan | | | | | | | | | | | | (812,833) | |
| |
Subtotal - Open Forward Currency Contracts with Unrealized Depreciation | | | | $(3,170,859) | |
| |
Net Unrealized Appreciation (Depreciation) on Forward Currency Contracts | | | | $(2,703,920) | |
The accompanying notes are an integral part of the financial statements.
| | |
| SLOW AND STEADY WINS THE RACE | | 27 |
| | | | | | |
| | | | | | | |
| | | | |
| | | | March 31, 2023 (Unaudited) |
| | | | | | |
| Number of Shares | | Common Stocks—93.68% | | Value ($) |
| | | Belgium—0.29% | | | | |
| 8,402 | | KBC Group NV | | | 576,788 | |
| | | Brazil—4.11% | | | | |
| 578,040 | | BB Seguridade Participacoes SA | | | 3,707,658 | |
| 867,446 | | TIM SA | | | 2,153,019 | |
| 256,860 | | Telefonica Brasil SA | | | 1,959,220 | |
| 81,538 | | Ambev SA(a) | | | 230,532 | |
| | | | | | 8,050,429 | |
| | | Chile—0.27% | | | | |
| 29,508 | | Banco Santander-Chile ADR | | | 526,128 | |
| | | China—7.21% | | | | |
| 84,951 | | Baidu, Inc. ADR(a) | | | 12,820,805 | |
| 512,831 | | TravelSky Technology, Ltd. | | | 957,732 | |
| 8,527 | | Trip.com Group, Ltd. ADR(a) | | | 321,212 | |
| | | | | | 14,099,749 | |
| | | Denmark—0.23% | | | | |
| 99,080 | | H Lundbeck A/S, Class B | | | 458,379 | |
| | | Finland—1.60% | | | | |
| 639,939 | | Nokia Corporation | | | 3,133,820 | |
| | | France—7.07% | | | | |
| 255,876 | | Michelin (CGDE) | | | 7,810,168 | |
| 35,658 | | Sanofi | | | 3,876,391 | |
| 35,809 | | BNP Paribas SA | | | 2,144,073 | |
| | | | | | 13,830,632 | |
| | | Germany—4.52% | | | | |
| 33,548 | | Deutsche Boerse AG | | | 6,528,895 | |
| 398,239 | | Telefonica Deutschland Holding | | | 1,225,272 | |
| 3,098 | | Muenchener Rueckver AG | | | 1,083,529 | |
| | | | | | 8,837,696 | |
| | | Hong Kong—1.09% | | | | |
| 294,000 | | CLP Holdings, Ltd. | | | 2,123,568 | |
| | | Italy—1.62% | | | | |
| 501,638 | | Snam SpA | | | 2,659,745 | |
| 83,260 | | Italgas SpA | | | 507,912 | |
| | | | | | 3,167,657 | |
| | | Japan—4.88% | | | | |
| 301,700 | | Subaru Corporation | | | 4,804,705 | |
| 74,800 | | Bridgestone Corporation | | | 3,023,548 | |
| 27,900 | | Secom Company, Ltd. | | | 1,715,501 | |
| | | | | | 9,543,754 | |
| | | Luxembourg—0.14% | | | | |
| 5,553 | | RTL Group | | | 273,650 | |
| | | Netherlands—0.84% | | | | |
| 48,257 | | Koninklijke Ahold Delhaize NV | | | 1,648,020 | |
| | | Peru—3.22% | | | | |
| 47,583 | | Credicorp, Ltd. | | | 6,299,513 | |
| | | South Korea—2.60% | | | | |
| 78,940 | | KT&G Corporation | | | 5,087,426 | |
| | | Spain—4.34% | | | | |
| 391,710 | | Endesa SA | | | 8,496,190 | |
The accompanying notes are an integral part of the financial statements.
| | |
| 28 | | SLOW AND STEADY WINS THE RACE |
| | | | | | |
| | | | | | | |
| | | | |
| | | | March 31, 2023 (Unaudited) |
|
|
Ariel Global Fund (Continued) |
| | | | | | |
| Number of Shares | | Common Stocks—93.68% | | Value ($) |
| | | Switzerland—5.79% | | | | |
| 34,482 | | Roche Holding AG | | | 9,834,502 | |
| 8,787 | | Novartis AG | | | 804,415 | |
| 5,646 | | Nestle SA | | | 687,801 | |
| | | | | | 11,326,718 | |
| | | Taiwan—0.54% | | | | |
| 168,000 | | Catcher Technology Company, Ltd. | | | 1,048,362 | |
| | | United Kingdom—8.57% | | | | |
| 551,503 | | GSK plc | | | 9,721,975 | |
| 1,802,172 | | Direct Line Insurance Group plc | | | 3,056,844 | |
| 64,508 | | Admiral Group plc | | | 1,621,781 | |
| 14,081 | | Reckitt Benckiser Group plc | | | 1,069,664 | |
| 160,145 | | Haleon plc | | | 636,127 | |
| 370,522 | | Vodafone Group plc | | | 408,169 | |
| 12,149 | | Close Brothers Group plc | | | 135,033 | |
| 10,262 | | Vodafone Group plc ADR | | | 113,292 | |
| | | | | | 16,762,885 | |
| | | United States—34.75% | | | | |
| 55,585 | | Microsoft Corporation | | | 16,025,156 | |
| 94,327 | | Philip Morris International, Inc. | | | 9,173,301 | |
| 226,510 | | Verizon Communications, Inc. | | | 8,808,974 | |
| 416,210 | | Equity Commonwealth | | | 8,619,709 | |
| 76,189 | | Gilead Sciences, Inc. | | | 6,321,401 | |
| 36,237 | | Johnson & Johnson | | | 5,616,735 | |
| 42,957 | | Amdocs, Ltd. | | | 4,125,161 | |
| 53,444 | | Bristol-Myers Squibb Company | | | 3,704,204 | |
| 44,344 | | NetApp, Inc. | | | 2,831,364 | |
| 11,656 | | Check Point Software Technologies, Ltd.(a) | | | 1,515,280 | |
| 13,435 | | U.S. Bancorp | | | 484,332 | |
| 11,093 | | Tapestry, Inc. | | | 478,219 | |
| 898 | | Berkshire Hathaway, Inc., Class B(a) | | | 277,275 | |
| | | | | | 67,981,111 | |
| | | Total Common Stocks (Cost $157,419,107) | | | 183,272,475 | |
| | |
| Number of Shares | | Preferred Stocks—0.77% | | Value ($) |
| | | Brazil—0.77% | | | | |
| 306,837 | | Itau Unibanco Holding SA ADR, 0.54%(d) | | | 1,494,296 | |
| | | Total Preferred Stocks (Cost $1,459,780) | | | 1,494,296 | |
| | |
| Number of Shares | | Short-Term Investments—4.73% | | Value ($) |
| 9,262,648 | | Northern Institutional Treasury Portfolio, 4.51%(c) | | | 9,262,648 | |
| | | Total Short-Term Investments (Cost $9,262,648) | | | 9,262,648 | |
| | | | | | | |
| | | Total Investments—99.18% (Cost $168,141,535) | | | 194,029,419 | |
| | | Foreign Currency, Other Assets less Liabilities—0.82% | | | 1,604,384 | |
| | | Net Assets—100.00% | | | 195,633,803 | |
The accompanying notes are an integral part of the financial statements.
| | |
| SLOW AND STEADY WINS THE RACE | | 29 |
| | | | | | |
| | | | | | | |
| | | | |
| | | | March 31, 2023 (Unaudited) |
|
|
Ariel Global Fund (Continued) |
|
|
Open Forward Currency Contracts |
| | | | | | | | | | | | | | | | | | | | | | | | |
| | | | | | | |
Contract Settlement Date | | Counterparty | | | Currency to be Received | | | Amount to be Received | | | Currency to be Delivered | | | Amount to be Delivered | | | Unrealized Appreciation (Depreciation) |
| |
Open Forward Currency Contracts with Unrealized Appreciation | | | | | |
| | | | | | |
04/27/2023 | | | UBS | | | | USD | | | | 543,476 | | | | CHF | | | | 495,720 | | | | $98 | |
| | | | | | |
04/27/2023 | | | UBS | | | | USD | | | | 2,811,951 | | | | CNH | | | | 18,995,996 | | | | 42,255 | |
| | | | |
Subtotal UBS | | | | | | | | | | | | | | | | 42,353 | |
| | | | | | |
04/27/2023 | | | Northern Trust | | | | USD | | | | 1,318,933 | | | | CHF | | | | 1,203,156 | | | | 109 | |
| | | | |
Subtotal Northern Trust | | | | | | | | | | | | | | | | 109 | |
| | | | | | |
04/27/2023 | | | JPMorgan | | | | USD | | | | 3,001,548 | | | | JPY | | | | 389,550,694 | | | | 54,647 | |
| | | | |
Subtotal JPMorgan | | | | | | | | | | | | | | | | 54,647 | |
| |
Subtotal - Open Forward Currency Contracts with Unrealized Appreciation | | | | $97,109 | |
| |
Open Forward Currency Contracts with Unrealized Depreciation | | | | | |
| | | | | | |
04/27/2023 | | | UBS | | | | USD | | | | 380,597 | | | | CAD | | | | 517,230 | | | | (2,262) | |
| | | | | | |
04/27/2023 | | | UBS | | | | AUD | | | | 919,928 | | | | CHF | | | | 586,082 | | | | (26,907) | |
| | | | | | |
04/27/2023 | | | UBS | | | | CAD | | | | 1,103,663 | | | | EUR | | | | 761,334 | | | | (9,973) | |
| | | | | | |
04/27/2023 | | | UBS | | | | NOK | | | | 2,022,779 | | | | EUR | | | | 185,583 | | | | (8,124) | |
| | | | | | |
04/27/2023 | | | UBS | | | | USD | | | | 733,528 | | | | EUR | | | | 678,404 | | | | (3,315) | |
| | | | | | |
04/27/2023 | | | UBS | | | | USD | | | | 628,631 | | | | GBP | | | | 516,024 | | | | (8,294) | |
| | | | | | |
04/27/2023 | | | UBS | | | | CAD | | | | 510,272 | | | | USD | | | | 380,597 | | | | (2,888) | |
| | | | |
Subtotal UBS | | | | | | | | | | | | | | | | (61,763) | |
| | | | | | |
04/27/2023 | | | Northern Trust | | | | SEK | | | | 2,317,656 | | | | GBP | | | | 185,007 | | | | (4,708) | |
| | | | | | |
04/27/2023 | | | Northern Trust | | | | USD | | | | 391,670 | | | | GBP | | | | 321,420 | | | | (5,057) | |
| | | | | | |
04/27/2023 | | | Northern Trust | | | | SGD | | | | 719,754 | | | | USD | | | | 545,361 | | | | (4,059) | |
| | | | |
Subtotal Northern Trust | | | | | | | | | | | | | | | | (13,824) | |
| | | | | | |
04/27/2023 | | | JPMorgan | | | | AUD | | | | 1,225,067 | | | | CHF | | | | 780,754 | | | | (36,129) | |
| | | | | | |
04/27/2023 | | | JPMorgan | | | | CAD | | | | 4,465,244 | | | | CHF | | | | 3,037,408 | | | | (24,195) | |
| | | | | | |
04/27/2023 | | | JPMorgan | | | | USD | | | | 4,484,422 | | | | CHF | | | | 4,094,113 | | | | (3,290) | |
| | | | | | |
04/27/2023 | | | JPMorgan | | | | AUD | | | | 1,614,309 | | | | EUR | | | | 1,043,745 | | | | (53,530) | |
| | | | | | |
04/27/2023 | | | JPMorgan | | | | SEK | | | | 7,681,388 | | | | EUR | | | | 691,347 | | | | (9,676) | |
| | | | | | |
04/27/2023 | | | JPMorgan | | | | USD | | | | 13,462,190 | | | | EUR | | | | 12,466,540 | | | | (78,239) | |
| | | | | | |
04/27/2023 | | | JPMorgan | | | | USD | | | | 6,137,416 | | | | GBP | | | | 5,040,940 | | | | (84,586) | |
| | | | | | |
Subtotal JPMorgan | | | | | | | | | | | | | | | | | | | | | | | (289,645) | |
| |
Subtotal - Open Forward Currency Contracts with Unrealized Depreciation | | | | $(365,232) | |
| |
Net Unrealized Appreciation (Depreciation) on Forward Currency Contracts | | | | $(268,123) | |
(a) Non-income producing.
(b) Affiliated company (See Note Seven, Transactions with Affiliated Companies).
(c) The rate presented is the 7-day current yield as of March 31, 2023.
(d) Current yield is disclosed. Dividends are calculated based on a percentage of the issuer’s net income.
ADR American Depositary Receipt
A category may contain multiple industries as defined by the Global Industry Classification Standards.
The accompanying notes are an integral part of the financial statements.
| | |
| 30 | | SLOW AND STEADY WINS THE RACE |
| | | | | | |
| | | Statements of Assets & Liabilities | | | | |
| | | | |
| | | | March 31, 2023 (Unaudited) |
| | | | | | | | | | | | |
| | | | |
| | | Ariel Fund | | | Ariel Appreciation Fund | | | Ariel Focus Fund |
|
Assets | |
| | | |
Investments in Unaffiliated Issuers, at Value
(cost $2,052,810,773, $835,276,358 and $54,869,378, respectively) | | | $2,539,004,651 | | | | $1,118,477,533 | | | | $63,691,592 | |
| | | |
Investments in Affiliated Issuers, at Value (cost $133,529,424) | | | 174,529,256 | (a) | | | — | | | | — | |
| | | |
Short-Term Investments, at Value (cost $15,934,481, $29,988,711 and $2,185,546, respectively) | | | 15,934,481 | | | | 29,988,711 | | | | 2,185,546 | |
| | | |
Dividends and Interest Receivable | | | 2,475,599 | | | | 790,778 | | | | 35,492 | |
| | | |
Receivable for Fund Shares Sold | | | 17,668,312 | | | | 402,720 | | | | 3,597 | |
| | | |
Receivable for Securities Sold | | | — | | | | 3,077,164 | | | | — | |
| | | |
Prepaid and Other Assets | | | 44,656 | | | | 25,208 | | | | 13,289 | |
| | | |
Total Assets | | | 2,749,656,955 | | | | 1,152,762,114 | | | | 65,929,516 | |
|
Liabilities | |
| | | |
Payable for Securities Purchased | | | 8,562,722 | | | | 5,040,532 | | | | 391,519 | |
| | | |
Payable for Fund Shares Redeemed | | | 4,169,618 | | | | 2,698,565 | | | | 5,606 | |
| | | |
Other Liabilities | | | 732,562 | | | | 320,651 | | | | 28,690 | |
| | | |
Total Liabilities | | | 13,464,902 | | | | 8,059,748 | | | | 425,815 | |
| | | |
Net Assets | | | $2,736,192,053 | | | | $1,144,702,366 | | | | $65,503,701 | |
|
Net Assets Consist of | |
| | | |
Paid-in Capital | | | $2,196,143,189 | | | | $834,652,137 | | | | $56,895,847 | |
| | | |
Distributable Earnings | | | 540,048,864 | | | | 310,050,229 | | | | 8,607,854 | |
| | | |
Net Assets | | | $2,736,192,053 | | | | $1,144,702,366 | | | | $65,503,701 | |
|
Investor Class Shares | |
| | | |
Net Assets | | | $1,256,919,594 | | | | $935,842,775 | | | | $43,624,249 | |
| | | |
Shares Outstanding (no par value, unlimited authorized) | | | 18,906,208 | | | | 24,310,324 | | | | 3,072,975 | |
| | | |
Net Asset Value, Offering and Redemption Price per Share | | | $66.48 | | | | $38.50 | | | | $14.20 | |
|
Institutional Class Shares | |
| | | |
Net Assets | | | $1,479,272,459 | | | | $208,859,591 | | | | $21,879,452 | |
| | | |
Shares Outstanding (no par value, unlimited authorized) | | | 22,225,324 | | | | 5,410,714 | | | | 1,538,689 | |
| | | |
Net Asset Value, Offering and Redemption Price per Share | | | $66.56 | | | | $38.60 | | | | $14.22 | |
(a) See Note Seven, Transactions with Affiliated Companies, for information on affiliated issuers.
The accompanying notes are an integral part of the financial statements.
| | |
| SLOW AND STEADY WINS THE RACE | | 31 |
| | | | | | |
| | | Statements of Assets & Liabilities | | | | |
| | | | |
| | | | March 31, 2023 (Unaudited) |
| | | | | | | | |
| | | |
| | | Ariel International
Fund | | | Ariel Global Fund |
|
Assets | |
| | |
Investments in Unaffiliated Issuers, at Value (cost $606,568,986 and $158,878,887, respectively) | | | $669,637,438 | | | | $184,766,771 | |
| | |
Short-Term Investments, at Value (cost $21,267,623 and $9,262,648, respectively) | | | 21,267,623 | | | | 9,262,648 | |
| | |
Foreign Currencies (cost $26,761,707 and $825,638, respectively) | | | 26,984,187 | | | | 830,047 | |
| | |
Dividends and Interest Receivable | | | 2,117,998 | | | | 711,148 | |
| | |
Receivable for Dividend Reclaims | | | 3,528,499 | | | | 414,742 | |
| | |
Receivable for Fund Shares Sold | | | 1,044,320 | | | | 42,085 | |
| | |
Receivable for Securities and Foreign Currencies Sold | | | — | | | | 13 | |
| | |
Unrealized Appreciation on Forward Currency Contracts | | | 466,939 | | | | 97,109 | |
| | |
Prepaid and Other Assets | | | 26,782 | | | | 20,571 | |
| | |
Total Assets | | | 725,073,786 | | | | 196,145,134 | |
| | |
Liabilities | | | | | | | | |
| | |
Payable for Securities and Foreign Currencies Purchased | | | 380,649 | | | | 72,518 | |
| | |
Payable for Fund Shares Redeemed | | | 17,350 | | | | 35,660 | |
| | |
Unrealized Depreciation on Forward Currency Contracts | | | 3,170,859 | | | | 365,232 | |
| | |
Other Liabilities | | | 141,729 | | | | 37,921 | |
| | |
Total Liabilities | | | 3,710,587 | | | | 511,331 | |
| | |
Net Assets | | | $721,363,199 | | | | $195,633,803 | |
| | |
Net Assets Consist of | | | | | | | | |
| | |
Paid-in Capital | | | $706,335,058 | | | | $169,082,515 | |
| | |
Distributable Earnings | | | 15,028,141 | | | | 26,551,288 | |
| | |
Net Assets | | | $721,363,199 | | | | $195,633,803 | |
| | |
Investor Class Shares | | | | | | | | |
| | |
Net Assets | | | $28,112,575 | | | | $13,117,816 | |
| | |
Shares Outstanding (no par value, unlimited authorized) | | | 2,027,724 | | | | 764,257 | |
| | |
Net Asset Value, Offering and Redemption Price per Share | | | $13.86 | | | | $17.16 | |
| | |
Institutional Class Shares | | | | | | | | |
| | |
Net Assets | | | $693,250,624 | | | | $182,515,987 | |
| | |
Shares Outstanding (no par value, unlimited authorized) | | | 51,032,340 | | | | 11,002,592 | |
| | |
Net Asset Value, Offering and Redemption Price per Share | | | $13.58 | | | | $16.59 | |
The accompanying notes are an integral part of the financial statements.
| | |
| 32 | | SLOW AND STEADY WINS THE RACE |
| | | | | | |
| | | Statements of Operations | | | | |
| | | | |
| | | | Six Months Ended March 31, 2023 (Unaudited) |
| | | | | | | | | | | | |
| | | | |
| | | Ariel Fund | | | Ariel Appreciation Fund | | | Ariel Focus Fund |
| | | |
Investment Income | | | | | | | | | | | | |
| | | |
Dividends | | | | | | | | | | | | |
| | | |
Unaffiliated Issuers | | | $20,866,557 | (a) | | | $10,165,416 | (a) | | | $747,459 | (a) |
| | | |
Affiliated Issuers | | | 71,301 | | | | — | | | | — | |
| | | |
Interest | | | 414,294 | | | | 481,214 | | | | 28,605 | |
| | | |
Total Investment Income | | | 21,352,152 | | | | 10,646,630 | | | | 776,064 | |
| | | |
Expenses | | | | | | | | | | | | |
| | | |
Management Fees | | | 7,611,947 | | | | 4,105,573 | | | | 208,323 | |
| | | |
Distribution Fees (Investor Class) | | | 1,557,254 | | | | 1,179,700 | | | | 55,207 | |
| | | |
Shareholder Service Fees | | | | | | | | | | | | |
| | | |
Investor Class | | | 604,924 | | | | 359,644 | | | | 13,355 | |
| | | |
Institutional Class | | | 315,284 | | | | 28,497 | | | | 2,546 | |
| | | |
Transfer Agent Fees and Expenses | | | | | | | | | | | | |
| | | |
Investor Class | | | 114,913 | | | | 83,354 | | | | 7,066 | |
| | | |
Institutional Class | | | 75,423 | | | | 11,865 | | | | 1,152 | |
| | | |
Printing and Postage Expenses | | | | | | | | | | | | |
| | | |
Investor Class | | | 141,569 | | | | 95,356 | | | | 4,843 | |
| | | |
Institutional Class | | | 31,148 | | | | 7,653 | | | | 1,160 | |
| | | |
Trustees’ Fees and Expenses | | | 223,054 | | | | 95,437 | | | | 5,371 | |
| | | |
Professional Fees | | | 98,878 | | | | 49,756 | | | | 15,803 | |
| | | |
Custody Fees and Expenses | | | 15,814 | | | | 7,257 | | | | 1,252 | |
| | | |
Federal and State Registration Fees | | | 41,286 | | | | 21,341 | | | | 18,823 | |
| | | |
Interest Expense | | | 1,637 | | | | — | | | | 14 | |
| | | |
Miscellaneous Expenses | | | 152,330 | | | | 68,362 | | | | 8,925 | |
| | | |
Total Expenses Before Reimbursements | | | 10,985,461 | | | | 6,113,795 | | | | 343,840 | |
| | | |
Expense Reimbursements | | | — | | | | — | | | | (48,245 | ) |
| | | |
Net Expenses | | | 10,985,461 | | | | 6,113,795 | | | | 295,595 | |
| | | |
Net Investment Income | | | 10,366,691 | | | | 4,532,835 | | | | 480,469 | |
| | | |
Realized and Unrealized Gain (Loss) | | | | | | | | | | | | |
| | | |
Net Realized Gain (Loss) on Investments | | | | | | | | | | | | |
| | | |
Unaffiliated Issuers | | | 59,218,839 | | | | 29,335,748 | | | | 324,907 | |
| | | |
Affiliated Issuers | | | 1,020,428 | | | | — | | | | — | |
| | | |
Change in Net Unrealized Appreciation (Depreciation) on Investments | | | | | | | | | | | | |
| | | |
Unaffiliated Issuers | | | 346,740,192 | | | | 138,441,930 | | | | 6,072,983 | |
| | | |
Affiliated Issuers | | | 35,521,515 | | | | — | | | | — | |
| | | |
Net Gain (Loss) on Investments | | | 442,500,974 | | | | 167,777,678 | | | | 6,397,890 | |
| | | |
Net Increase (Decrease) in Net Assets Resulting from Operations | | | $452,867,665 | | | | $172,310,513 | | | | $6,878,359 | |
(a) Net of $10,695, $4,181 and $8,135 in foreign taxes withheld, respectively.
The accompanying notes are an integral part of the financial statements.
| | |
| SLOW AND STEADY WINS THE RACE | | 33 |
| | | | | | |
| | | Statements of Operations | | | | |
| | | | |
| | | | Six Months Ended March 31, 2023 (Unaudited) |
| | | | | | | | |
| | | |
| | | Ariel International
Fund | | | Ariel Global Fund |
Investment Income | |
Dividends | | | | | | | | |
Unaffiliated Issuers | | | $6,524,851 | (a) | | | $3,939,901 | (a) |
Interest | | | 450,294 | | | | 167,822 | |
Total Investment Income | | | 6,975,145 | | | | 4,107,723 | |
| | |
Expenses | | | | | | | | |
Management Fees | | | 2,700,099 | | | | 745,804 | |
Distribution Fees (Investor Class) | | | 31,551 | | | | 15,417 | |
Shareholder Service Fees | | | | | | | | |
Investor Class | | | 12,346 | | | | 4,382 | |
Institutional Class | | | 91,528 | | | | 7,322 | |
Transfer Agent Fees and Expenses | | | | | | | | |
Investor Class | | | 2,855 | | | | 2,323 | |
Institutional Class | | | 36,814 | | | | 8,727 | |
Printing and Postage Expenses | | | | | | | | |
Investor Class | | | 3,175 | | | | 2,409 | |
Institutional Class | | | 4,740 | | | | 1,659 | |
Trustees’ Fees and Expenses | | | 54,490 | | | | 14,273 | |
Professional Fees | | | 37,597 | | | | 22,337 | |
Custody Fees and Expenses | | | 112,622 | | | | 24,939 | |
Administration Fees | | | 25,826 | | | | 9,365 | |
Fund Accounting Fees | | | 17,222 | | | | 6,144 | |
Federal and State Registration Fees | | | 22,289 | | | | 17,851 | |
Interest Expense | | | 59 | | | | — | |
Miscellaneous Expenses | | | 41,513 | | | | 14,631 | |
Total Expenses Before Reimbursements | | | 3,194,726 | | | | 897,583 | |
Expense Reimbursements | | | (193,004 | ) | | | (61,832 | ) |
Net Expenses | | | 3,001,722 | | | | 835,751 | |
Net Investment Income | | | 3,973,423 | | | | 3,271,972 | |
| | |
Realized and Unrealized Gain (Loss) | | | | | | | | |
Net Realized Gain (Loss) on | | | | | | | | |
Investments | | | 3,386,435 | | | | 1,758,305 | |
Translation of Assets and Liabilities in Foreign Currencies | | | 1,510,542 | | | | 14,297 | |
Forward Currency Contracts | | | (58,527 | ) | | | (1,633,682 | ) |
Total | | | 4,838,450 | | | | 138,920 | |
Change in Net Unrealized Appreciation (Depreciation) on | | | | | | | | |
Investments | | | 110,154,584 | | | | 23,681,032 | |
Translation of Assets and Liabilities in Foreign Currencies | | | 1,019,031 | | | | 139,828 | |
Forward Currency Contracts | | | 3,456,695 | | | | (988,948 | ) |
Total | | | 114,630,310 | | | | 22,831,912 | |
Net Gain (Loss) on Investments | | | 119,468,760 | | | | 22,970,832 | |
Net Increase (Decrease) in Net Assets Resulting from Operations | | | $123,442,183 | | | | $26,242,804 | |
(a) Net of $602,857 and $169,387 in foreign taxes withheld, respectively.
The accompanying notes are an integral part of the financial statements.
| | |
| 34 | | SLOW AND STEADY WINS THE RACE |
| | | | | | |
| | | Statements of Changes in Net Assets | | | | |
| | | | |
| | | | |
| | | | | | | | | | | | | | | | |
| | | Ariel Fund | | | Ariel Appreciation Fund | |
| | | Six Months Ended March 31, 2023 (Unaudited) | | | Year Ended September 30, 2022 | | | Six Months Ended March 31, 2023 (Unaudited) | | | Year Ended September 30, 2022 | |
| | | | |
Operations | | | | | | | | | | | | | | | | |
| | | | |
Net Investment Income (Loss) | | | $10,366,691 | | | | $14,424,490 | | | | $4,532,835 | | | | $7,945,993 | |
| | | | |
Net Realized Gain (Loss) on Investments | | | 60,239,267 | | | | 251,361,016 | | | | 29,335,748 | | | | 129,285,977 | |
| | | | |
Change in Net Unrealized Appreciation (Depreciation) on Investments | | | 382,261,707 | | | | (1,067,660,535 | ) | | | 138,441,930 | | | | (366,228,469 | ) |
| | | | |
Net Increase (Decrease) in Net Assets from Operations | | | 452,867,665 | | | | (801,875,029 | ) | | | 172,310,513 | | | | (228,996,499 | ) |
| | | | |
Distributions to Shareholders | | | | | | | | | | | | | | | | |
| | | | |
Investor Class | | | (101,883,426 | ) | | | (97,046,286 | ) | | | (90,715,608 | ) | | | (145,741,207 | ) |
| | | | |
Institutional Class | | | (114,645,716 | ) | | | (85,453,872 | ) | | | (20,435,907 | ) | | | (35,858,973 | ) |
| | | | |
Total Distributions | | | (216,529,142 | ) | | | (182,500,158 | ) | | | (111,151,515 | ) | | | (181,600,180 | ) |
| | | | |
Share Transactions | | | | | | | | | | | | | | | | |
| | | | |
Value of Shares Issued | | | | | | | | | | | | | | | | |
| | | | |
Investor Class | | | 27,389,254 | | | | 127,988,974 | | | | 31,088,573 | | | | 71,643,777 | |
| | | | |
Institutional Class | | | 189,558,026 | | | | 768,348,012 | | | | 26,902,190 | | | | 41,844,015 | |
| | | | |
Value of Shares Issued in Reinvestment of Dividends and Distributions | | | | | | | | | | | | | | | | |
| | | | |
Investor Class | | | 98,914,214 | | | | 94,785,855 | | | | 88,774,874 | | | | 142,088,150 | |
| | | | |
Institutional Class | | | 108,614,831 | | | | 80,208,725 | | | | 18,958,974 | | | | 30,147,443 | |
| | | | |
Value of Shares Redeemed | | | | | | | | | | | | | | | | |
| | | | |
Investor Class | | | (93,996,673 | ) | | | (414,518,582 | ) | | | (74,841,005 | ) | | | (142,603,305 | ) |
| | | | |
Institutional Class | | | (149,860,332 | ) | | | (405,695,734 | ) | | | (22,133,934 | ) | | | (86,289,132 | ) |
| | | | |
Net Increase (Decrease) in Net Assets from Share Transactions | | | 180,619,320 | | | | 251,117,250 | | | | 68,749,672 | | | | 56,830,948 | |
| | | | |
Total Increase (Decrease) in Net Assets | | | 416,957,843 | | | | (733,257,937 | ) | | | 129,908,670 | | | | (353,765,731 | ) |
| | | | |
Net Assets | | | | | | | | | | | | | | | | |
| | | | |
Beginning of Period | | | 2,319,234,210 | | | | 3,052,492,147 | | | | 1,014,793,696 | | | | 1,368,559,427 | |
| | | | |
End of Period | | | $2,736,192,053 | | | | $2,319,234,210 | | | | $1,144,702,366 | | | | $1,014,793,696 | |
| | | | |
Capital Share Transactions | | | | | | | | | | | | | | | | |
| | | | |
Investor Shares | | | | | | | | | | | | | | | | |
| | | | |
Shares Sold | | | 412,513 | | | | 1,589,683 | | | | 806,373 | | | | 1,642,809 | |
| | | | |
Shares Issued to Holders in Reinvestment of Dividends and Distributions | | | 1,545,894 | | | | 1,118,559 | | | | 2,302,750 | | | | 2,980,651 | |
| | | | |
Shares Redeemed | | | (1,424,882 | ) | | | (5,238,249 | ) | | | (1,897,879 | ) | | | (3,146,326 | ) |
| | | | |
Net Increase (Decrease) | | | 533,525 | | | | (2,530,007 | ) | | | 1,211,244 | | | | 1,477,134 | |
| | | | |
Institutional Shares | | | | | | | | | | | | | | | | |
| | | | |
Shares Sold | | | 2,871,994 | | | | 9,487,952 | | | | 666,376 | | | | 913,369 | |
| | | | |
Shares Issued to Holders in Reinvestment of Dividends and Distributions | | | 1,695,356 | | | | 946,169 | | | | 490,193 | | | | 630,081 | |
| | | | |
Shares Redeemed | | | (2,269,667 | ) | | | (5,433,354 | ) | | | (567,522 | ) | | | (1,953,945 | ) |
| | | | |
Net Increase (Decrease) | | | 2,297,683 | | | | 5,000,767 | | | | 589,047 | | | | (410,495 | ) |
The accompanying notes are an integral part of the financial statements.
| | |
| SLOW AND STEADY WINS THE RACE | | 35 |
| | | | | | |
| | | Statements of Changes in Net Assets | | | | |
| | | | |
| | | | |
| | | | | | | | |
| | | Ariel Focus Fund | |
| | | Six Months Ended March 31, 2023 (Unaudited) | | | Year Ended September 30, 2022 | |
| | |
Operations | | | | | | | | |
| | |
Net Investment Income (Loss) | | | $480,469 | | | | $670,598 | |
| | |
Net Realized Gain (Loss) on Investments | | | 324,907 | | | | 4,452,740 | |
| | |
Change in Net Unrealized Appreciation (Depreciation) on Investments | | | 6,072,983 | | | | (15,159,975 | ) |
| | |
Net Increase (Decrease) in Net Assets from Operations | | | 6,878,359 | | | | (10,036,637 | ) |
| | |
Distributions to Shareholders | | | | | | | | |
| | |
Investor Class | | | (3,466,117 | ) | | | (1,693,729 | ) |
| | |
Institutional Class | | | (1,485,052 | ) | | | (625,242 | ) |
| | |
Total Distributions | | | (4,951,169 | ) | | | (2,318,971 | ) |
| | |
Share Transactions | | | | | | | | |
| | |
Value of Shares Issued | | | | | | | | |
| | |
Investor Class | | | 2,370,238 | | | | 10,615,733 | |
| | |
Institutional Class | | | 4,351,626 | | | | 1,997,436 | |
| | |
Value of Shares Issued in Reinvestment of Dividends and Distributions | | | | | | | | |
| | |
Investor Class | | | 3,037,384 | | | | 1,485,236 | |
| | |
Institutional Class | | | 1,474,854 | | | | 620,010 | |
| | |
Value of Shares Redeemed | | | | | | | | |
| | |
Investor Class | | | (3,714,823 | ) | | | (6,480,100 | ) |
| | |
Institutional Class | | | (518,952 | ) | | | (862,549 | ) |
| | |
Net Increase (Decrease) in Net Assets from Share Transactions | | | 7,000,327 | | | | 7,375,766 | |
| | |
Total Increase (Decrease) in Net Assets | | | 8,927,517 | | | | (4,979,842 | ) |
| | |
Net Assets | | | | | | | | |
| | |
Beginning of Period | | | 56,576,184 | | | | 61,556,026 | |
| | |
End of Period | | | $65,503,701 | | | | $56,576,184 | |
| | |
Capital Share Transactions | | | | | | | | |
| | |
Investor Shares | | | | | | | | |
| | |
Shares Sold | | | 164,696 | | | | 634,013 | |
| | |
Shares Issued to Holders in Reinvestment of Dividends and Distributions | | | 208,672 | | | | 88,283 | |
| | |
Shares Redeemed | | | (258,909 | ) | | | (397,016 | ) |
| | |
Net Increase (Decrease) | | | 114,459 | | | | 325,280 | |
| | |
Institutional Shares | | | | | | | | |
| | |
Shares Sold | | | 294,374 | | | | 121,933 | |
| | |
Shares Issued to Holders in Reinvestment of Dividends and Distributions | | | 101,225 | | | | 36,841 | |
| | |
Shares Redeemed | | | (35,676 | ) | | | (52,213 | ) |
| | |
Net Increase (Decrease) | | | 359,923 | | | | 106,561 | |
The accompanying notes are an integral part of the financial statements.
| | |
| 36 | | SLOW AND STEADY WINS THE RACE |
| | | | | | |
| | | Statements of Changes in Net Assets | | | | |
| | | | |
| | | | |
| | | | | | | | | | | | | | | | |
| | | Ariel International Fund | | | Ariel Global Fund | |
| | | Six Months Ended March 31, 2023 (Unaudited) | | | Year Ended September 30, 2022 | | | Six Months Ended March 31, 2023 (Unaudited) | | | Year Ended September 30, 2022 | |
| | | | |
Operations | | | | | | | | | | | | | | | | |
| | | | |
Net Investment Income (Loss) | | | $3,973,423 | | | | $18,967,758 | | | | $3,271,972 | | | | $3,998,053 | |
| | | | |
Net Realized Gain (Loss) on Investments, Foreign Currency Translations and Forward Currency Contracts | | | 4,838,450 | | | | (20,502,353 | ) | | | 138,920 | | | | 5,379,349 | |
| | | | |
Change in Net Unrealized Appreciation (Depreciation) on Investments, Foreign Currency Translations and Forward Currency Contracts | | | 114,630,310 | | | | (142,492,635 | ) | | | 22,831,912 | | | | (24,904,877 | ) |
| | | | |
Net Increase (Decrease) in Net Assets from Operations | | | 123,442,183 | | | | (144,027,230 | ) | | | 26,242,804 | | | | (15,527,475 | ) |
| | | | |
Distributions to Shareholders | | | | | | | | | | | | | | | | |
| | | | |
Investor Class | | | — | | | | (627,843 | ) | | | (580,195 | ) | | | (249,792 | ) |
| | | | |
Institutional Class | | | — | | | | (20,372,157 | ) | | | (8,547,814 | ) | | | (3,825,208 | ) |
| | | | |
Total Distributions | | | — | | | | (21,000,000 | ) | | | (9,128,009 | ) | | | (4,075,000 | ) |
| | | | |
Share Transactions | | | | | | | | | | | | | | | | |
| | | | |
Value of Shares Issued | | | | | | | | | | | | | | | | |
| | | | |
Investor Class | | | 5,820,165 | | | | 9,736,084 | | | | 1,126,432 | | | | 1,834,580 | |
| | | | |
Institutional Class | | | 32,695,453 | | | | 145,069,392 | | | | 24,848,798 | | | | 10,987,380 | |
| | | | |
Value of Shares Issued in Reinvestment of Dividends and Distributions | | | | | | | | | | | | | | | | |
| | | | |
Investor Class | | | — | | | | 591,486 | | | | 508,725 | | | | 210,705 | |
| | | | |
Institutional Class | | | — | | | | 19,721,601 | | | | 8,430,299 | | | | 3,814,546 | |
| | | | |
Value of Shares Redeemed | | | | | | | | | | | | | | | | |
| | | | |
Investor Class | | | (4,141,554 | ) | | | (6,369,822 | ) | | | (432,965 | ) | | | (1,895,654 | ) |
| | | | |
Institutional Class | | | (38,185,224 | ) | | | (263,330,220 | ) | | | (15,039,037 | ) | | | (45,624,774 | ) |
| | | | |
Net Increase (Decrease) in Net Assets from Share Transactions | | | (3,811,160 | ) | | | (94,581,479 | ) | | | 19,442,252 | | | | (30,673,217 | ) |
| | | | |
Total Increase (Decrease) in Net Assets | | | 119,631,023 | | | | (259,608,709 | ) | | | 36,557,047 | | | | (50,275,692 | ) |
| | | | |
Net Assets | | | | | | | | | | | | | | | | |
| | | | |
Beginning of Period | | | 601,732,176 | | | | 861,340,885 | | | | 159,076,756 | | | | 209,352,448 | |
| | | | |
End of Period | | | $721,363,199 | | | | $601,732,176 | | | | $195,633,803 | | | | $159,076,756 | |
| | | | |
Capital Share Transactions | | | | | | | | | | | | | | | | |
| | | | |
Investor Shares | | | | | | | | | | | | | | | | |
| | | | |
Shares Sold | | | 439,851 | | | | 704,165 | | | | 66,445 | | | | 103,166 | |
| | | | |
Shares Issued to Holders in Reinvestment of Dividends and Distributions | | | — | | | | 40,540 | | | | 31,024 | | | | 11,719 | |
| | | | |
Shares Redeemed | | | (315,726 | ) | | | (455,981 | ) | | | (25,797 | ) | | | (105,199 | ) |
| | | | |
Net Increase (Decrease) | | | 124,125 | | | | 288,724 | | | | 71,672 | | | | 9,686 | |
| | | | |
Institutional Shares | | | | | | | | | | | | | | | | |
| | | | |
Shares Sold | | | 2,569,895 | | | | 10,564,298 | | | | 1,574,838 | | | | 656,034 | |
| | | | |
Shares Issued to Holders in Reinvestment of Dividends and Distributions | | | — | | | | 1,383,972 | | | | 531,943 | | | | 219,479 | |
| | | | |
Shares Redeemed | | | (3,069,908 | ) | | | (18,655,274 | ) | | | (938,043 | ) | | | (2,575,831 | ) |
| | | | |
Net Increase (Decrease) | | | (500,013 | ) | | | (6,707,004 | ) | | | 1,168,738 | | | | (1,700,318 | ) |
The accompanying notes are an integral part of the financial statements.
| | |
| SLOW AND STEADY WINS THE RACE | | 37 |
| | | | | | |
| | | Financial Highlights For a share outstanding throughout each period | | | | |
| | | | |
| | | | |
| | | | | | | | | | | | | | | | | | | | | | | | |
| | | Year Ended September 30 | |
| | | | | | | |
Ariel Fund (Investor Class) | | Six Months
Ended
March 31,
2023
(Unaudited) | | | 2022 | | | 2021 | | | 2020 | | | 2019 | | | 2018 |
Net Asset Value, Beginning of Period | | | $60.46 | | | | $85.09 | | | | $54.40 | | | | $63.40 | | | | $74.58 | | | | $69.11 | |
Income from Investment Operations | | | | | | | | | | | | | | | | | | | | | | | | |
Net Investment Income (Loss) | | | 0.16 | | | | 0.39 | | | | (0.04 | ) | | | 0.50 | | | | 0.65 | | | | 0.57 | |
Net Realized and Unrealized Gain (Loss) on Investments | | | 11.47 | | | | (20.38 | ) | | | 34.33 | | | | (5.72 | ) | | | (6.10 | ) | | | 9.31 | |
Total from Investment Operations | | | 11.63 | | | | (19.99 | ) | | | 34.29 | | | | (5.22 | ) | | | (5.45 | ) | | | 9.88 | |
| | | | | | |
Distributions to Shareholders | | | | | | | | | | | | | | | | | | | | | | | | |
Dividends from Net Investment Income | | | (0.27 | ) | | | (0.03 | ) | | | (0.20 | ) | | | (0.55 | ) | | | (0.59 | ) | | | (0.48 | ) |
Distributions from Capital Gains | | | (5.34 | ) | | | (4.61 | ) | | | (3.40 | ) | | | (3.23 | ) | | | (5.14 | ) | | | (3.93 | ) |
Total Distributions | | | (5.61 | ) | | | (4.64 | ) | | | (3.60 | ) | | | (3.78 | ) | | | (5.73 | ) | | | (4.41 | ) |
Net Asset Value, End of Period | | | $66.48 | | | | $60.46 | | | | $85.09 | | | | $54.40 | | | | $63.40 | | | | $74.58 | |
Total Return | | | 19.65%(a | ) | | | (25.05)% | | | | 65.59% | | | | (9.03 | )% | | | (7.17 | )% | | | 14.98% | |
| | | | | | |
Supplemental Data and Ratios | | | | | | | | | | | | | | | | | | | | | | | | |
Net Assets, End of Period, in Thousands | | | $1,256,920 | | | | $1,110,849 | | | | $1,778,696 | | | | $995,861 | | | | $1,302,745 | | | | $1,587,936 | |
Ratio of Expenses to Average Net Assets | | | 1.01%(b | ) | | | 0.98% | | | | 1.00% | | | | 1.04% | | | | 1.02% | | | | 1.01% | |
Ratio of Net Investment Income to Average Net Assets | | | 0.61%(b | ) | | | 0.31% | | | | 0.15% | | | | 0.70% | | | | 0.97% | | | | 0.74% | |
Portfolio Turnover Rate | | | 9%(a | ) | | | 33% | | | | 24% | | | | 23% | | | | 22% | | | | 19% | |
| | | | | | | | | | | | | | | | | | |
| |
| | | Year Ended September 30 | |
| | | | | | | |
Ariel Fund (Institutional Class) | | Six Months Ended March 31, 2023 (Unaudited) | | | 2022 | | | 2021 | | | 2020 | | | 2019 | | | 2018 |
Net Asset Value, Beginning of Period | | | $60.64 | | | | $85.34 | | | | $54.53 | | | | $63.55 | | | | $74.78 | | | | $69.28 | |
Income from Investment Operations | | | | | | | | | | | | | | | | | | | | | | | | |
Net Investment Income (Loss) | | | 0.27 | | | | 0.38 | | | | 0.25 | | | | 0.58 | | | | 0.74 | | | | 0.73 | |
Net Realized and Unrealized Gain (Loss) on Investments | | | 11.49 | | | | (20.17 | ) | | | 34.34 | | | | (5.62 | ) | | | (6.03 | ) | | | 9.38 | |
Total from Investment Operations | | | 11.76 | | | | (19.79 | ) | | | 34.59 | | | | (5.04 | ) | | | (5.29 | ) | | | 10.11 | |
| | | | | | |
Distributions to Shareholders | | | | | | | | | | | | | | | | | | | | | | | | |
Dividends from Net Investment Income | | | (0.50 | ) | | | (0.30 | ) | | | (0.38 | ) | | | (0.75 | ) | | | (0.80 | ) | | | (0.68 | ) |
Distributions from Capital Gains | | | (5.34 | ) | | | (4.61 | ) | | | (3.40 | ) | | | (3.23 | ) | | | (5.14 | ) | | | (3.93 | ) |
Total Distributions | | | (5.84 | ) | | | (4.91 | ) | | | (3.78 | ) | | | (3.98 | ) | | | (5.94 | ) | | | (4.61 | ) |
Net Asset Value, End of Period | | | $66.56 | | | | $60.64 | | | | $85.34 | | | | $54.53 | | | | $63.55 | | | | $74.78 | |
Total Return | | | 19.85%(a | ) | | | (24.82 | )% | | | 66.12% | | | | (8.74 | )% | | | (6.86 | )% | | | 15.30% | |
| | | | | | |
Supplemental Data and Ratios | | | | | | | | | | | | | | | | | | | | | | | | |
Net Assets, End of Period, in Thousands | | | $1,479,272 | | | | $1,208,385 | | | | $1,273,796 | | | | $596,645 | | | | $742,864 | | | | $673,273 | |
Ratio of Expenses to Average Net Assets | | | 0.68%(b | ) | | | 0.67% | | | | 0.69% | | | | 0.72% | | | | 0.70% | | | | 0.72% | |
Ratio of Net Investment Income to Average Net Assets | | | 0.94%(b | ) | | | 0.65% | | | | 0.45% | | | | 1.01% | | | | 1.31% | | | | 1.03% | |
Portfolio Turnover Rate | | | 9%(a | ) | | | 33% | | | | 24% | | | | 23% | | | | 22% | | | | 19% | |
(a)Not annualized.
(b)Annualized.
The accompanying notes are an integral part of the financial statements.
| | |
| 38 | | SLOW AND STEADY WINS THE RACE |
| | | | | | |
| | | Financial Highlights For a share outstanding throughout each period | | | | |
| | | | |
| | | | |
| | | | | | | | | | | | | | | | | | | | | | | | |
| | | Year Ended September 30 | |
| | | | | | | |
Ariel Appreciation Fund (Investor Class) | | Six Months
Ended March 31, 2023 (Unaudited) | | | 2022 | | | 2021 | | | 2020 | | | 2019 | | | 2018 |
Net Asset Value, Beginning of Period | | | $36.32 | | | | $50.93 | | | | $38.76 | | | | $44.43 | | | | $49.48 | | | | $50.91 | |
Income from Investment Operations | | | | | | | | | | | | | | | | | | | | | | | | |
Net Investment Income (Loss) | | | 0.08 | | | | 0.06 | | | | 0.12 | | | | 0.48 | | | | 0.62 | | | | 0.40 | |
Net Realized and Unrealized Gain (Loss) on Investments | | | 6.08 | | | | (7.89 | ) | | | 16.31 | | | | (2.77 | ) | | | (2.83 | ) | | | 4.17 | |
Total from Investment Operations | | | 6.16 | | | | (7.83 | ) | | | 16.43 | | | | (2.29 | ) | | | (2.21 | ) | | | 4.57 | |
| | | | | | |
Distributions to Shareholders | | | | | | | | | | | | | | | | | | | | | | | | |
Dividends from Net Investment Income | | | (0.25 | ) | | | (0.21 | ) | | | (0.24 | ) | | | (0.42 | ) | | | (0.42 | ) | | | (0.39 | ) |
Distributions from Capital Gains | | | (3.73 | ) | | | (6.57 | ) | | | (4.02 | ) | | | (2.96 | ) | | | (2.42 | ) | | | (5.61 | ) |
Total Distributions | | | (3.98 | ) | | | (6.78 | ) | | | (4.26 | ) | | | (3.38 | ) | | | (2.84 | ) | | | (6.00 | ) |
Net Asset Value, End of Period | | | $38.50 | | | | $36.32 | | | | $50.93 | | | | $38.76 | | | | $44.43 | | | | $49.48 | |
Total Return | | | 17.01%(a | ) | | | (18.50 | )% | | | 45.27% | | | | (5.93 | )% | | | (4.23 | )% | | | 9.90% | |
| | | | | | |
Supplemental Data and Ratios | | | | | | | | | | | | | | | | | | | | | | | | |
Net Assets, End of Period, in Thousands | | | $935,843 | | | | $838,963 | | | | $1,101,184 | | | | $777,404 | | | | $996,797 | | | | $1,321,843 | |
Ratio of Expenses to Average Net Assets | | | 1.12%(b | ) | | | 1.10% | | | | 1.12% | | | | 1.15% | | | | 1.14% | | | | 1.13% | |
Ratio of Net Investment Income to Average Net Assets | | | 0.73%(b | ) | | | 0.57% | | | | 0.55% | | | | 0.98% | | | | 1.05% | | | | 0.72% | |
Portfolio Turnover Rate | | | 9%(a | ) | | | 26% | | | | 24% | | | | 24% | | | | 18% | | | | 11% | |
| | | | | | | | | | | | | | | | | | |
| |
| | | Year Ended September 30 | |
| | | | | | | |
Ariel Appreciation Fund (Institutional Class) | | Six Months
Ended
March 31,
2023
(Unaudited) | | | 2022 | | | 2021 | | | 2020 | | | 2019 | | | 2018 |
Net Asset Value, Beginning of Period | | | $36.47 | | | | $51.10 | | | | $38.86 | | | | $44.55 | | | | $49.64 | | | | $51.07 | |
Income from Investment Operations | | | | | | | | | | | | | | | | | | | | | | | | |
Net Investment Income (Loss) | | | 0.13 | | | | 0.29 | | | | 0.36 | | | | 0.60 | | | | 0.59 | | | | 0.48 | |
Net Realized and Unrealized Gain (Loss) on Investments | | | 6.11 | | | | (8.00 | ) | | | 16.26 | | | | (2.77 | ) | | | (2.68 | ) | | | 4.25 | |
Total from Investment Operations | | | 6.24 | | | | (7.71 | ) | | | 16.62 | | | | (2.17 | ) | | | (2.09 | ) | | | 4.73 | |
| | | | | | |
Distributions to Shareholders | | | | | | | | | | | | | | | | | | | | | | | | |
Dividends from Net Investment Income | | | (0.38 | ) | | | (0.35 | ) | | | (0.36 | ) | | | (0.56 | ) | | | (0.58 | ) | | | (0.55 | ) |
Distributions from Capital Gains | | | (3.73 | ) | | | (6.57 | ) | | | (4.02 | ) | | | (2.96 | ) | | | (2.42 | ) | | | (5.61 | ) |
Total Distributions | | | (4.11 | ) | | | (6.92 | ) | | | (4.38 | ) | | | (3.52 | ) | | | (3.00 | ) | | | (6.16 | ) |
Net Asset Value, End of Period | | | $38.60 | | | | $36.47 | | | | $51.10 | | | | $38.86 | | | | $44.55 | | | | $49.64 | |
Total Return | | | 17.17%(a | ) | | | (18.24 | )% | | | 45.74% | | | | (5.65 | )% | | | (3.91 | )% | | | 10.21% | |
| | | | | | |
Supplemental Data and Ratios | | | | | | | | | | | | | | | | | | | | | | | | |
Net Assets, End of Period, in Thousands | | | $208,859 | | | | $175,831 | | | | $267,375 | | | | $196,009 | | | | $298,211 | | | | $267,831 | |
Ratio of Expenses to Average Net Assets | | | 0.80%(b | ) | | | 0.79% | | | | 0.81% | | | | 0.84% | | | | 0.82% | | | | 0.82% | |
Ratio of Net Investment Income to Average Net Assets | | | 1.05%(b | ) | | | 0.87% | | | | 0.87% | | | | 1.26% | | | | 1.39% | | | | 1.03% | |
Portfolio Turnover Rate | | | 9%(a | ) | | | 26% | | | | 24% | | | | 24% | | | | 18% | | | | 11% | |
(a)Not annualized.
(b)Annualized.
The accompanying notes are an integral part of the financial statements.
| | |
| SLOW AND STEADY WINS THE RACE | | 39 |
| | | | | | |
| | | Financial Highlights For a share outstanding throughout each period | | | | |
| | | | |
| | | | |
| | | | | | | | | | | | | | | | | | | | | | | | |
| |
| | | Year Ended September 30 | |
| | | | | | | |
Ariel Focus Fund (Investor Class) | | Six Months
Ended
March 31,
2023
(Unaudited) | | | 2022 | | | 2021 | | | 2020 | | | 2019 | | | 2018 |
Net Asset Value, Beginning of Period | | | $13.67 | | | | $16.60 | | | | $12.13 | | | | $12.89 | | | | $14.77 | | | | $13.71 | |
Income from Investment Operations | | | | | | | | | | | | | | | | | | | | | | | | |
Net Investment Income (Loss) | | | 0.10 | | | | 0.13 | | | | 0.16 | | | | 0.18 | | | | 0.16 | | | | 0.13 | |
Net Realized and Unrealized Gain (Loss) on Investments | | | 1.60 | | | | (2.50 | ) | | | 4.65 | | | | (0.80 | ) | | | (1.20 | ) | | | 1.71 | |
Total from Investment Operations | | | 1.70 | | | | (2.37 | ) | | | 4.81 | | | | (0.62 | ) | | | (1.04 | ) | | | 1.84 | |
| | | | | | |
Distributions to Shareholders | | | | | | | | | | | | | | | | | | | | | | | | |
Dividends from Net Investment Income | | | (0.16 | ) | | | (0.14 | ) | | | (0.12 | ) | | | (0.14 | ) | | | (0.13 | ) | | | (0.11 | ) |
Distributions from Capital Gains | | | (1.01 | ) | | | (0.42 | ) | | | (0.22 | ) | | | — | | | | (0.71 | ) | | | (0.67 | ) |
Total Distributions | | | (1.17 | ) | | | (0.56 | ) | | | (0.34 | ) | | | (0.14 | ) | | | (0.84 | ) | | | (0.78 | ) |
Net Asset Value, End of Period | | | $14.20 | | | | $13.67 | | | | $16.60 | | | | $12.13 | | | | $12.89 | | | | $14.77 | |
Total Return | | | 12.34%(a | ) | | | (14.91)% | | | | 40.39% | | | | (4.91)% | | | | (6.86)% | | | | 14.26% | |
| | | | | | |
Supplemental Data and Ratios | | | | | | | | | | | | | | | | | | | | | | | | |
Net Assets, End of Period, in Thousands | | | $43,624 | | | | $40,429 | | | | $43,721 | | | | $31,852 | | | | $40,770 | | | | $44,964 | |
Ratio of Expenses to Average Net Assets, Including Waivers | | | 1.00%(b | ) | | | 1.00% | | | | 1.00% | | | | 1.00% | | | | 1.00% | | | | 1.00% | |
Ratio of Expenses to Average Net Assets, Excluding Waivers | | | 1.17%(b | ) | | | 1.13% | | | | 1.20% | | | | 1.25% | | | | 1.23% | | | | 1.20% | |
Ratio of Net Investment Income to Average Net Assets, Including Waivers | | | 1.42%(b | ) | | | 0.91% | | | | 0.92% | | | | 1.23% | | | | 1.30% | | | | 0.98% | |
Ratio of Net Investment Income to Average Net Assets, Excluding Waivers | | | 1.25%(b | ) | | | 0.78% | | | | 0.72% | | | | 0.98% | | | | 1.07% | | | | 0.78% | |
Portfolio Turnover Rate | | | 4%(a | ) | | | 33% | | | | 63% | | | | 22% | | | | 18% | | | | 27% | |
| | | | | | | | | | | | | | | | | | |
| |
| | | Year Ended September 30 | |
| | | | | | | |
Ariel Focus Fund (Institutional Class) | | Six Months
Ended
March 31,
2023
(Unaudited) | | | 2022 | | | 2021 | | | 2020 | | | 2019 | | | 2018 |
Net Asset Value, Beginning of Period | | | $13.70 | | | | $16.63 | | | | $12.14 | | | | $12.89 | | | | $14.77 | | | | $13.69 | |
Income from Investment Operations | | | | | | | | | | | | | | | | | | | | | | | | |
Net Investment Income (Loss) | | | 0.10 | | | | 0.18 | | | | 0.18 | | | | 0.19 | | | | 0.19 | | | | 0.17 | |
Net Realized and Unrealized Gain (Loss) on Investments | | | 1.63 | | | | (2.52 | ) | | | 4.67 | | | | (0.78 | ) | | | (1.20 | ) | | | 1.71 | |
Total from Investment Operations | | | 1.73 | | | | (2.34 | ) | | | 4.85 | | | | (0.59 | ) | | | (1.01 | ) | | | 1.88 | |
| | | | | | |
Distributions to Shareholders | | | | | | | | | | | | | | | | | | | | | | | | |
Dividends from Net Investment Income | | | (0.20 | ) | | | (0.17 | ) | | | (0.14 | ) | | | (0.16 | ) | | | (0.16 | ) | | | (0.13 | ) |
Distributions from Capital Gains | | | (1.01 | ) | | | (0.42 | ) | | | (0.22 | ) | | | — | | | | (0.71 | ) | | | (0.67 | ) |
Total Distributions | | | (1.21 | ) | | | (0.59 | ) | | | (0.36 | ) | | | (0.16 | ) | | | (0.87 | ) | | | (0.80 | ) |
Net Asset Value, End of Period | | | $14.22 | | | | $13.70 | | | | $16.63 | | | | $12.14 | | | | $12.89 | | | | $14.77 | |
Total Return | | | 12.48%(a | ) | | | (14.72)% | | | | 40.73% | | | | (4.69)% | | | | (6.56)% | | | | 14.54% | |
| | | | | | |
Supplemental Data and Ratios | | | | | | | | | | | | | | | | | | | | | | | | |
Net Assets, End of Period, in Thousands | | | $21,880 | | | | $16,147 | | | | $17,835 | | | | $12,732 | | | | $15,552 | | | | $20,929 | |
Ratio of Expenses to Average Net Assets, Including Waivers | | | 0.75%(b | ) | | | 0.75% | | | | 0.75% | | | | 0.75% | | | | 0.75% | | | | 0.75% | |
Ratio of Expenses to Average Net Assets, Excluding Waivers | | | 0.86%(b | ) | | | 0.85% | | | | 0.86% | | | | 0.89% | | | | 0.89% | | | | 0.86% | |
Ratio of Net Investment Income to Average Net Assets, Including Waivers | | | 1.68%(b | ) | | | 1.17% | | | | 1.14% | | | | 1.47% | | | | 1.54% | | | | 1.24% | |
Ratio of Net Investment Income to Average Net Assets, Excluding Waivers | | | 1.57%(b | ) | | | 1.07% | | | | 1.03% | | | | 1.33% | | | | 1.40% | | | | 1.13% | |
Portfolio Turnover Rate | | | 4%(a | ) | | | 33% | | | | 63% | | | | 22% | | | | 18% | | | | 27% | |
(a)Not annualized.
(b)Annualized.
The accompanying notes are an integral part of the financial statements.
| | |
| 40 | | SLOW AND STEADY WINS THE RACE |
| | | | | | |
| | | Financial Highlights For a share outstanding throughout each period | | | | |
| | | | |
| | | | |
| | | | | | | | | | | | | | | | | | | | | | | | |
| |
| | | Year Ended September 30 | |
| | | | | | | |
Ariel International Fund (Investor Class) | | Six Months
Ended
March 31,
2023
(Unaudited) | | | 2022 | | | 2021 | | | 2020 | | | 2019 | | | 2018 |
Net Asset Value, Beginning of Period | | | $11.50 | | | | $14.69 | | | | $13.68 | | | | $13.42 | | | | $13.91 | | | | $14.23 | |
Income from Investment Operations | | | | | | | | | | | | | | | | | | | | | | | | |
Net Investment Income (Loss) | | | 0.02 | | | | 0.14 | | | | 0.36 | | | | 0.36 | | | | 0.79 | | | | 0.37 | |
Net Realized and Unrealized Gain (Loss) on Investments | | | 2.34 | | | | (2.95 | ) | | | 0.86 | | | | 0.12 | | | | (1.13 | ) | | | (0.44 | ) |
Total from Investment Operations | | | 2.36 | | | | (2.81 | ) | | | 1.22 | | | | 0.48 | | | | (0.34 | ) | | | (0.07 | ) |
| | | | | | |
Distributions to Shareholders | | | | | | | | | | | | | | | | | | | | | | | | |
Dividends from Net Investment Income | | | — | | | | (0.38 | ) | | | (0.21 | ) | | | (0.22 | ) | | | (0.12 | ) | | | (0.10 | ) |
Distributions from Capital Gains | | | — | | | | — | | | | — | | | | — | | | | (0.03 | ) | | | (0.15 | ) |
Total Distributions | | | — | | | | (0.38 | ) | | | (0.21 | ) | | | (0.22 | ) | | | (0.15 | ) | | | (0.25 | ) |
Net Asset Value, End of Period | | | $13.86 | | | | $11.50 | | | | $14.69 | | | | $13.68 | | | | $13.42 | | | | $13.91 | |
Total Return | | | 20.52%(a | ) | | | (19.70 | )% | | | 9.00% | | | | 3.57% | | | | (2.39 | )% | | | (0.49 | )% |
| | | | | | |
Supplemental Data and Ratios | | | | | | | | | | | | | | | | | | | | | | | | |
Net Assets, End of Period, in Thousands | | | $28,112 | | | | $21,887 | | | | $23,717 | | | | $21,877 | | | | $24,849 | | | | $54,169 | |
Ratio of Expenses to Average Net Assets, Including Waivers | | | 1.13%(b) | | | | 1.13% | | | | 1.13% | | | | 1.13% | | | | 1.13% | | | | 1.13% | |
Ratio of Expenses to Average Net Assets, Excluding Waivers | | | 1.29%(b) | | | | 1.28% | | | | 1.30% | | | | 1.33% | | | | 1.32% | | | | 1.31% | |
Ratio of Net Investment Income to Average Net Assets, Including Waivers | | | 0.98%(b) | | | | 2.27% | | | | 2.41% | | | | 1.69% | | | | 1.94% | | | | 1.80% | |
Ratio of Net Investment Income to Average Net Assets, Excluding Waivers | | | 0.82%(b) | | | | 2.12% | | | | 2.24% | | | | 1.49% | | | | 1.75% | | | | 1.62% | |
Portfolio Turnover Rate | | | 5%(a) | | | | 20% | | | | 22% | | | | 24% | | | | 20% | | | | 8% | |
| | | | | | | | | | | | | | | | | | |
| |
| | | Year Ended September 30 | |
| | | | | | | |
Ariel International Fund (Institutional Class) | | Six Months
Ended
March 31,
2023
(Unaudited) | | | 2022 | | | 2021 | | | 2020 | | | 2019 | | | 2018 |
Net Asset Value, Beginning of Period | | | $11.25 | | | | $14.38 | | | | $13.39 | | | | $13.18 | | | | $13.68 | | | | $13.99 | |
Income from Investment Operations | | | | | | | | | | | | | | | | | | | | | | | | |
Net Investment Income (Loss) | | | 0.07 | | | | 0.41 | | | | 0.34 | | | | 0.29 | | | | 0.29 | | | | 0.23 | |
Net Realized and Unrealized Gain (Loss) on Investments | | | 2.26 | | | | (3.13 | ) | | | 0.89 | | | | 0.20 | | | | (0.60 | ) | | | (0.26 | ) |
Total from Investment Operations | | | 2.33 | | | | (2.72 | ) | | | 1.23 | | | | 0.49 | | | | (0.31 | ) | | | (0.03 | ) |
| | | | | | |
Distributions to Shareholders | | | | | | | | | | | | | | | | | | | | | | | | |
Dividends from Net Investment Income | | | — | | | | (0.41 | ) | | | (0.24 | ) | | | (0.28 | ) | | | (0.16 | ) | | | (0.13 | ) |
Distributions from Capital Gains | | | — | | | | — | | | | — | | | | — | | | | (0.03 | ) | | | (0.15 | ) |
Total Distributions | | | — | | | | (0.41 | ) | | | (0.24 | ) | | | (0.28 | ) | | | (0.19 | ) | | | (0.28 | ) |
Net Asset Value, End of Period | | | $13.58 | | | | $11.25 | | | | $14.38 | | | | $13.39 | | | | $13.18 | | | | $13.68 | |
Total Return | | | 20.71%(a | ) | | | (19.51 | )% | | | 9.26% | | | | 3.74% | | | | (2.13 | )% | | | (0.17 | )% |
| | | | | | |
Supplemental Data and Ratios | | | | | | | | | | | | | | | | | | | | | | | | |
Net Assets, End of Period, in Thousands | | | $693,251 | | | | $579,845 | | | | $837,624 | | | | $599,770 | | | | $722,616 | | | | $620,017 | |
Ratio of Expenses to Average Net Assets, Including Waivers | | | 0.88%(b) | | | | 0.88% | | | | 0.88% | | | | 0.88% | | | | 0.88% | | | | 0.88% | |
Ratio of Expenses to Average Net Assets, Excluding Waivers | | | 0.93%(b | ) | | | 0.93% | | | | 0.93% | | | | 0.96% | | | | 0.93% | | | | 0.93% | |
Ratio of Net Investment Income to Average Net Assets, Including Waivers | | | 1.18%(b | ) | | | 2.53% | | | | 2.75% | | | | 1.98% | | | | 2.49% | | | | 2.23% | |
Ratio of Net Investment Income to Average Net Assets, Excluding Waivers | | | 1.13%(b | ) | | | 2.48% | | | | 2.70% | | | | 1.90% | | | | 2.44% | | | | 2.18% | |
Portfolio Turnover Rate | | | 5%(a | ) | | | 20% | | | | 22% | | | | 24% | | | | 20% | | | | 8% | |
(a)Not annualized.
(b)Annualized.
The accompanying notes are an integral part of the financial statements.
| | |
| SLOW AND STEADY WINS THE RACE | | 41 |
| | | | | | |
| | | Financial Highlights For a share outstanding throughout each period | | | | |
| | | | |
| | | | |
| | | | | | | | | | | | | | | | | | | | | | | | |
| |
| | | Year Ended September 30 | |
| | | | | | | |
Ariel Global Fund (Investor Class) | | Six Months
Ended
March 31,
2023
(Unaudited) | | | 2022 | | | 2021 | | | 2020 | | | 2019 | | | 2018 |
Net Asset Value, Beginning of Period | | | $15.57 | | | | $17.65 | | | | $15.36 | | | | $15.40 | | | | $16.48 | | | | $16.05 | |
Income from Investment Operations | | | | | | | | | | | | | | | | | | | | | | | | |
Net Investment Income (Loss) | | | 0.22 | | | | 0.34 | | | | 0.31 | | | | 0.27 | | | | 0.32 | | | | 0.19 | |
Net Realized and Unrealized Gain (Loss) on Investments | | | 2.17 | | | | (2.05 | ) | | | 2.12 | | | | 0.38 | | | | (0.92 | ) | | | 0.94 | |
Total from Investment Operations | | | 2.39 | | | | (1.71 | ) | | | 2.43 | | | | 0.65 | | | | (0.60 | ) | | | 1.13 | |
| | | | | | |
Distributions to Shareholders | | | | | | | | | | | | | | | | | | | | | | | | |
Dividends from Net Investment Income | | | (0.73 | ) | | | (0.37 | ) | | | (0.14 | ) | | | (0.31 | ) | | | (0.32 | ) | | | (0.16 | ) |
Distributions from Capital Gains | | | (0.07 | ) | | | — | | | | — | | | | (0.38 | ) | | | (0.16 | ) | | | (0.54 | ) |
Total Distributions | | | (0.80 | ) | | | (0.37 | ) | | | (0.14 | ) | | | (0.69 | ) | | | (0.48 | ) | | | (0.70 | ) |
Net Asset Value, End of Period | | | $17.16 | | | | $15.57 | | | | $17.65 | | | | $15.36 | | | | $15.40 | | | | $16.48 | |
Total Return | | | 15.57%(a | ) | | | (9.99 | )% | | | 15.91% | | | | 4.23% | | | | (3.41 | )% | | | 7.38% | |
| | | | | | |
Supplemental Data and Ratios | | | | | | | | | | | | | | | | | | | | | | | | |
Net Assets, End of Period, in Thousands | | | $13,118 | | | | $10,781 | | | | $12,053 | | | | $10,733 | | | | $12,159 | | | | $14,798 | |
Ratio of Expenses to Average Net Assets, Including Waivers | | | 1.13%(b | ) | | | 1.13% | | | | 1.13% | | | | 1.13% | | | | 1.13% | | | | 1.13% | |
Ratio of Expenses to Average Net Assets, Excluding Waivers | | | 1.32%(b | ) | | | 1.30% | | | | 1.36% | | | | 1.46% | | | | 1.44% | | | | 1.46% | |
Ratio of Net Investment Income to Average Net Assets, Including Waivers | | | 3.29%(b | ) | | | 1.93% | | | | 1.73% | | | | 1.61% | | | | 1.85% | | | | 1.60% | |
Ratio of Net Investment Income to Average Net Assets, Excluding Waivers | | | 3.10%(b | ) | | | 1.76% | | | | 1.50% | | | | 1.28% | | | | 1.54% | | | | 1.27% | |
Portfolio Turnover Rate | | | 15%(a | ) | | | 19% | | | | 24% | | | | 23% | | | | 29% | | | | 11% | |
| | | | | | | | | | | | | | | | | | |
| |
| | | Year Ended September 30 | |
| | | | | | | |
Ariel Global Fund (Institutional Class) | | Six Months
Ended
March 31,
2023
(Unaudited) | | | 2022 | | | 2021 | | | 2020 | | | 2019 | | | 2018 |
Net Asset Value, Beginning of Period | | | $15.08 | | | | $17.11 | | | | $14.87 | | | | $14.92 | | | | $15.98 | | | | $15.57 | |
Income from Investment Operations | | | | | | | | | | | | | | | | | | | | | | | | |
Net Investment Income (Loss) | | | 0.25 | | | | 0.43 | | | | 0.25 | | | | 0.21 | | | | 0.39 | | | | 0.24 | |
Net Realized and Unrealized Gain (Loss) on Investments | | | 2.09 | | | | (2.05 | ) | | | 2.15 | | | | 0.45 | | | | (0.93 | ) | | | 0.89 | |
Total from Investment Operations | | | 2.34 | | | | (1.62 | ) | | | 2.40 | | | | 0.66 | | | | (0.54 | ) | | | 1.13 | |
| | | | | | |
Distributions to Shareholders | | | | | | | | | | | | | | | | | | | | | | | | |
Dividends from Net Investment Income | | | (0.76 | ) | | | (0.41 | ) | | | (0.16 | ) | | | (0.33 | ) | | | (0.36 | ) | | | (0.18 | ) |
Distributions from Capital Gains | | | (0.07 | ) | | | — | | | | — | | | | (0.38 | ) | | | (0.16 | ) | | | (0.54 | ) |
Total Distributions | | | (0.83 | ) | | | (0.41 | ) | | | (0.16 | ) | | | (0.71 | ) | | | (0.52 | ) | | | (0.72 | ) |
Net Asset Value, End of Period | | | $16.59 | | | | $15.08 | | | | $17.11 | | | | $14.87 | | | | $14.92 | | | | $15.98 | |
Total Return | | | 15.78%(a | ) | | | (9.81 | )% | | | 16.26% | | | | 4.48% | | | | (3.18 | )% | | | 7.63% | |
| | | | | | |
Supplemental Data and Ratios | | | | | | | | | | | | | | | | | | | | | | | | |
Net Assets, End of Period, in Thousands | | | $182,516 | | | | $148,296 | | | | $197,299 | | | | $95,229 | | | | $73,724 | | | | $119,609 | |
Ratio of Expenses to Average Net Assets, Including Waivers | | | 0.88%(b | ) | | | 0.88% | | | | 0.88% | | | | 0.88% | | | | 0.88% | | | | 0.88% | |
Ratio of Expenses to Average Net Assets, Excluding Waivers | | | 0.94%(b | ) | | | 0.94% | | | | 0.95% | | | | 1.01% | | | | 0.99% | | | | 0.98% | |
Ratio of Net Investment Income to Average Net Assets, Including Waivers | | | 3.53%(b | ) | | | 2.21% | | | | 2.16% | | | | 1.93% | | | | 2.07% | | | | 1.88% | |
Ratio of Net Investment Income to Average Net Assets, Excluding Waivers | | | 3.47%(b | ) | | | 2.15% | | | | 2.09% | | | | 1.80% | | | | 1.96% | | | | 1.78% | |
Portfolio Turnover Rate | | | 15%(a | ) | | | 19% | | | | 24% | | | | 23% | | | | 29% | | | | 11% | |
(a)Not annualized.
(b)Annualized.
The accompanying notes are an integral part of the financial statements.
| | |
| 42 | | SLOW AND STEADY WINS THE RACE |
| | | | | | |
| | | Notes to the Financial Statements | | | | |
| | | | |
| | | | March 31, 2023 (Unaudited) |
NOTE ONE | ORGANIZATION
Ariel Investment Trust (the “Trust”) is a Massachusetts business trust registered under the Investment Company Act of 1940, as amended (the “1940 Act”), as an open-end management investment company. Ariel Fund, Ariel Appreciation Fund, Ariel Focus Fund, Ariel International Fund and Ariel Global Fund (each, a “Fund” and collectively, the “Funds”) are series of the Trust. Ariel Focus Fund is a non-diversified Fund, all other Funds are diversified. The Funds issue two classes of shares: an Investor Class and an Institutional Class.
The Northern Trust Company (“Northern Trust”) provides fund administration and tax reporting services for the Funds in its role as sub-fund administrator engaged by Ariel Investments, LLC (the “Adviser” or “Ariel”) for Ariel Fund, Ariel Appreciation Fund and Ariel Focus Fund and as fund administrator engaged by the Trust for Ariel International Fund and Ariel Global Fund. Northern Trust also acts as the Funds’ accounting agent and custodian. U.S. Bank Global Fund Services serves as the Funds’ transfer agent.
NOTE TWO | SIGNIFICANT ACCOUNTING POLICIES
The following is a summary of significant accounting policies consistently followed by the Funds in the preparation of their financial statements. The Funds are investment companies and follow accounting and reporting guidance in the Financial Accounting Standards Board (FASB) Accounting Standards Codification™ Topic 946 (ASC 946). The accompanying financial statements were prepared in accordance with accounting principles generally accepted in the United States of America (GAAP), including but not limited to ASC 946. GAAP requires management to make certain estimates and assumptions at the date of the financial statements. Actual results may differ from such estimates.
Securities valuation—Securities for which market quotations are readily available are valued at the last sale price on the national securities exchange on which such securities are primarily traded and, in the case of securities reported on the Nasdaq system, are valued based on the Nasdaq Official Closing Price. If a last sale price or a closing price is not reported, a security shall be valued using i) the closing price on another exchange on which the security traded (if such price is made available by the pricing vendor) or ii) the mean between the bid and ask prices for securities for which reliable bid and ask quotations are available. Certain common stocks that trade on foreign exchanges are subject to valuation adjustments to account for the market movement between the close of a foreign market in which the security is traded and the close of the New York Stock Exchange.
The Adviser has established a Valuation Committee (the “Committee”) to carry out fair valuation responsibilities. The Committee has adopted policies and procedures, which have been approved by the Board, to govern the fair valuation process. In the event that the Committee becomes aware of a significant event that may materially affect the value of a security or that current market prices are not available or reliable, a fair value of such security will be determined in accordance with these valuation procedures.
Investments in money market funds are valued at their closing net asset value each business day.
Debt securities having a maturity over 60 days are valued using evaluated prices or matrix pricing methods determined by a pricing service which take into consideration factors such as yield, maturity, ratings, and traded prices in identical or similar securities. Short-term debt obligations having a maturity of 60 days or less are valued at amortized cost, so long as it approximates fair value.
Securities and assets for which market quotations are not readily available are valued at fair value as determined in good faith in accordance with the Funds’ valuation procedures.
Securities transactions and investment income—Securities transactions are accounted for on a trade date basis. Realized gains and losses from securities transactions are recorded on the identified cost basis. Dividend income is recorded on the ex-dividend date and interest income is recognized on an accrual basis. Dividends from foreign securities are recorded on the ex-dividend date, or as soon as the information is available. Non-cash dividends are recorded as investment income at the fair value of the assets received.
Subsequent events—In preparing these financial statements, the Trust has evaluated subsequent events occurring after March 31, 2023 through the date the financial statements were issued and determined that there were no such events that would require adjustment to or additional disclosure in these financial statements.
| | |
| SLOW AND STEADY WINS THE RACE | | 43 |
| | | | | | |
| | | Notes to the Financial Statements | | | | |
| | | | |
| | | | March 31, 2023 (Unaudited) |
Fair value measurements—Accounting Standards Codification™ Topic 820-10 (ASC 820-10) establishes a three-tier framework for measuring fair value based on a hierarchy of inputs. The hierarchy distinguishes between market data obtained from independent sources (observable inputs) and the Funds’ own market assumptions (unobservable inputs). These inputs are used in determining the value of the Funds’investments and are summarized below:
Level 1 - quoted prices in active markets for identical securities
Level 2 - other significant observable inputs (including quoted prices for similar securities, “quoted” prices in inactive markets, dealer indications, and inputs corroborated by observable market data)
Level 3 - significant unobservable inputs (including the Funds’ own assumptions in determining the fair value of investments)
The inputs or methodology used for valuing securities are not necessarily an indication of the risk associated with investing in those securities.
The following tables summarize the inputs used as of March 31, 2023 in valuing the Funds’ investments carried at fair value:
| | | | | | | | | | | | |
| | | | |
| | | Ariel Fund | | | Ariel Appreciation
Fund | | | Ariel Focus Fund | |
| | | |
Level 1 | | | $2,729,468,388 | | | | $1,148,466,244 | | | | $65,877,138 | |
| | | |
Level 2 | | | — | | | | — | | | | — | |
| | | |
Level 3 | | | — | | | | — | | | | — | |
| | | |
Total Investments | | | $2,729,468,388 | | | | $1,148,466,244 | | | | $65,877,138 | |
Industry classifications for Ariel Fund, Ariel Appreciation Fund, and Ariel Focus Fund are included in the Schedules of Investments for the respective Fund.
| | | | | | | | | | | | | | | | |
| | | | | |
| Ariel International Fund | | Level 1 | | | Level 2* | | | Level 3 | | | Total | |
| | | | |
Common Stocks | | | | | | | | | | | | | | | | |
| | | | |
Communication Services | | | $82,524,252 | | | | $— | | | | $— | | | | $82,524,252 | |
| | | | |
Consumer Discretionary | | | 99,632,996 | | | | — | | | | — | | | | 99,632,996 | |
| | | | |
Consumer Staples | | | 83,480,609 | | | | — | | | | — | | | | 83,480,609 | |
| | | | |
Energy | | | 4,102,461 | | | | — | | | | — | | | | 4,102,461 | |
| | | | |
Financials | | | 138,370,554 | | | | — | | | | — | | | | 138,370,554 | |
| | | | |
Health Care | | | 116,340,500 | | | | — | | | | — | | | | 116,340,500 | |
| | | | |
Industrials | | | 18,334,976 | | | | — | | | | — | | | | 18,334,976 | |
| | | | |
Information Technology | | | 26,666,628 | | | | — | | | | — | | | | 26,666,628 | |
| | | | |
Real Estate | | | 615,914 | | | | — | | | | — | | | | 615,914 | |
| | | | |
Utilities | | | 95,617,775 | | | | — | | | | — | | | | 95,617,775 | |
| | | | |
Total Common Stocks | | | $665,686,665 | | | | $— | | | | $— | | | | $665,686,665 | |
| | | | |
Preferred Stocks | | | | | | | | | | | | | | | | |
| | | | |
Financials | | | 3,950,773 | | | | — | | | | — | | | | 3,950,773 | |
| | | | |
Short-Term Investments | | | 21,267,623 | | | | — | | | | — | | | | 21,267,623 | |
| | | | |
Total Investments | | | $690,905,061 | | | | $— | | | | $— | | | | $690,905,061 | |
| | | | |
Other Financial Instruments | | | | | | | | | | | | | | | | |
| | | | |
Forward Currency Contracts^ | | | $— | | | | $(2,703,920 | ) | | | $— | | | | $(2,703,920 | ) |
| | |
| 44 | | SLOW AND STEADY WINS THE RACE |
| | | | | | |
| | | Notes to the Financial Statements | | | | |
| | | | |
| | | | March 31, 2023 (Unaudited) |
| | | | | | | | | | | | | | | | |
| | | | | |
| Ariel Global Fund | | Level 1 | | | Level 2* | | | Level 3 | | | Total | |
| | | | |
Common Stocks | | | | | | | | | | | | | | | | |
| | | | |
Communication Services | | | $27,762,401 | | | | $— | | | | $— | | | | $27,762,401 | |
| | | | |
Consumer Discretionary | | | 17,395,584 | | | | — | | | | — | | | | 17,395,584 | |
| | | | |
Consumer Staples | | | 18,532,871 | | | | — | | | | — | | | | 18,532,871 | |
| | | | |
Financials | | | 26,441,849 | | | | — | | | | — | | | | 26,441,849 | |
| | | | |
Health Care | | | 40,338,002 | | | | — | | | | — | | | | 40,338,002 | |
| | | | |
Industrials | | | 1,715,501 | | | | — | | | | — | | | | 1,715,501 | |
| | | | |
Information Technology | | | 28,679,143 | | | | — | | | | — | | | | 28,679,143 | |
| | | | |
Real Estate | | | 8,619,709 | | | | — | | | | — | | | | 8,619,709 | |
| | | | |
Utilities | | | 13,787,415 | | | | — | | | | — | | | | 13,787,415 | |
| | | | |
Total Common Stocks | | | $183,272,475 | | | | $— | | | | $— | | | | $183,272,475 | |
| | | | |
Preferred Stocks | | | | | | | | | | | | | | | | |
| | | | |
Financials | | | 1,494,296 | | | | — | | | | — | | | | 1,494,296 | |
| | | | |
Short-Term Investments | | | 9,262,648 | | | | — | | | | — | | | | 9,262,648 | |
| | | | |
Total Investments | | | $194,029,419 | | | | $— | | | | $— | | | | $194,029,419 | |
| | | | |
Other Financial Instruments | | | | | | | | | | | | | | | | |
| | | | |
Forward Currency Contracts^ | | | $— | | | | $(268,123 | ) | | | $— | | | | $(268,123 | ) |
| | * | As of March 31, 2023, the Level 2 investments held were forward currency contracts. See Schedules of Investments. |
| | ^ | Forward currency contracts derive their value from underlying exchange rates. These instruments are normally valued by pricing vendors using pricing models. The pricing models typically use inputs that are observed from trading in active forward foreign currency markets. As such, forward currency contracts are categorized as Level 2. The value of forward currency contracts that is disclosed in this table is equal to the difference between Open forward currency contracts with unrealized appreciation and Open forward currency contracts with unrealized depreciation shown in the Schedules of Investments. |
Offsetting assets and liabilities—The Funds are subject to various master netting agreements (“Master Netting Agreements”) that govern the terms of certain transactions with select counterparties. Master Netting Agreements seek to reduce the counterparty risk associated with relevant transactions by allowing the Funds to close out and net their total exposure to a counterparty in the event of a default by the other party or a termination event. Termination events include, but are not limited to, a failure to pay or deliver or a breach of the terms of the agreement with respect to transactions governed under a single agreement with that counterparty. The Master Netting Agreements may also specify collateral posting arrangements at pre-arranged exposure levels. The Funds are not currently collateralizing their exposures related to foreign exchange trades. For financial reporting purposes, the Funds do not offset financial assets and liabilities that are subject to the Master Netting Agreements in the Statements of Assets and Liabilities. Gross exposure relating to open forward currency contracts by counterparty is disclosed in the Schedules of Investments as Open forward currency contracts with unrealized appreciation (assets) and Open forward currency contracts with unrealized depreciation (liabilities) and in total by Fund on the Statements of Assets and Liabilities as Unrealized appreciation on forward currency contracts (assets) and Unrealized depreciation on forward currency contracts (liabilities). The net recognized asset (appreciation) or liability (depreciation) is shown in the Schedules of Investments as Net unrealized appreciation (depreciation) on forward currency contracts.
Foreign currency—Securities and other assets and liabilities denominated in foreign currencies are translated into U.S. dollars on a daily basis using exchange rates obtained from an independent third party. Net realized gain (loss) and Net unrealized appreciation (depreciation) on investments include the effects of changes in exchange rates on the underlying investments. Fluctuations in the value of other assets and liabilities resulting from changes in exchange rates are included as Distributable earnings on the Statements of Assets and Liabilities until the underlying assets or liabilities are settled in cash, at which time they are recorded as Net realized gain (loss) on translation of assets and liabilities in foreign currencies on the Statements of Operations.
Forward currency contracts—Ariel International Fund and Ariel Global Fund enter into forward currency contracts to provide the appropriate currency exposure related to protecting the value of securities and related receivables and payables against changes in foreign exchange rates. The primary risk associated with a Fund’s use of these contracts is that a counterparty will fail to fulfill its obligation to pay gains due to the Fund under the contracts. This counterparty risk is mitigated by entering into forward currency contracts only with highly rated counterparties. Forward currency contracts are “marked-to-market” daily, and as noted above, any resulting unrealized gain (loss) is recorded as Net unrealized appreciation (depreciation) on forward currency contracts as disclosed in the Schedules of Investments and in the Statements of Assets and Liabilities as a component of Distributable earnings. The Funds record realized gain (loss) when a forward currency contract is settled or closed and disclose such realized gain (loss) on the Statements of Operations as Net realized gain (loss) on forward currency contracts.
Class and expense allocations—Each class of shares of the Funds has equal rights as to assets and earnings, except that shareholders of each class bear certain class-specific expenses related to marketing and distribution and shareholder servicing and communication. Income, other non-class-specific expense, and realized and unrealized gains and losses on investments are allocated to each class of shares based on its relative net assets. Expenses that are not directly attributable to one or more Funds are allocated among applicable Funds on an equitable and consistent basis considering such things as the nature and type of expense and the relative net assets of the Funds.
| | |
| SLOW AND STEADY WINS THE RACE | | 45 |
| | | | | | |
| | | Notes to the Financial Statements | | | | |
| | | | |
| | | | March 31, 2023 (Unaudited) |
Ariel Fund, Ariel Appreciation Fund and Ariel Focus Fund pay all operating expenses not expressly assumed by the Adviser, including custodial and transfer agency fees, federal and state securities registration fees, legal and audit fees, and brokerage commissions and other costs associated with the purchase and sale of portfolio securities. Ariel International Fund and Ariel Global Fund pay all operating expenses not expressly assumed by the Adviser, including custodial and transfer agency fees, fund administration, fund accounting, federal and state securities registration fees, legal and audit fees, and brokerage commissions and other costs associated with the purchase and sale of portfolio securities.
Distributions to shareholders—Dividends from net investment income and net realized capital gains, if any, are declared and paid to shareholders at least annually and are recorded on ex-dividend date.
NOTE THREE | INVESTMENT TRANSACTIONS
Purchases and sales—Cost of purchases and proceeds from sales of securities, excluding short-term investments, for the six months ended March 31, 2023 were as follows:
| | | | | | | | | | | | | | | | | | | | |
| | | Ariel Fund | | | Ariel Appreciation Fund | | | Ariel Focus Fund | | | Ariel
International
Fund | | | Ariel Global
Fund | |
Purchases | | | $248,598,787 | | | | $96,898,219 | | | | $4,964,809 | | | | $31,851,124 | | | | $36,361,937 | |
Sales | | | 275,534,117 | | | | 150,184,364 | | | | 2,755,671 | | | | 29,961,503 | | | | 25,822,125 | |
NOTE FOUR | INCOME TAX MATTERS AND DISTRIBUTIONS TO SHAREHOLDERS
Income Tax Matters—It is the Funds’ policy to comply with the requirements of the Internal Revenue Code applicable to regulated investment companies and to distribute substantially all taxable income to shareholders. The Funds file U.S. federal income tax returns in addition to state and local tax returns that may be required. Management has analyzed the Funds’ tax positions taken for all open federal income tax years (September 30, 2019 - 2022), and has concluded that no provision for federal income tax is required in the financial statements.
The cost and unrealized appreciation and depreciation of investments (including derivative instruments) on a federal income tax basis at March 31, 2023 were as follows:
| | | | | | | | | | | | | | | | | | | | |
| | | Ariel Fund | | | Ariel Appreciation Fund | | | Ariel Focus
Fund | | | Ariel
International
Fund | | | Ariel Global
Fund | |
Cost of investments | | | $2,239,245,926 | | | | $865,525,708 | | | | $57,500,503 | | | | $639,699,346 | | | | $170,336,567 | |
Gross unrealized appreciation | | | 618,301,862 | | | | 327,573,745 | | | | 15,799,402 | | | | 94,682,575 | | | | 31,891,093 | |
Gross unrealized depreciation | | | (128,079,400 | ) | | | (44,633,209 | ) | | | (7,422,767 | ) | | | (43,476,860 | ) | | | (8,198,241 | ) |
Net unrealized appreciation (depreciation) | | | $490,222,462 | | | | $282,940,536 | | | | $8,376,635 | | | | $51,205,715 | | | | $23,692,852 | |
The difference between book basis and tax basis unrealized appreciation and depreciation is attributable primarily to the deferral of losses due to wash sales and partnership adjustments.
Tax adjustments are calculated annually. For interim periods, the Funds determine an estimate of tax cost adjustments based on a review of accounting reports for the interim period to identify changes from the adjustments calculated at the fiscal year end. For the previous fiscal year’s federal income tax information, please refer to the Notes to Financial Statements section in the Funds’ most recent annual report.
Distributions —The tax character of distributions paid during the periods ended March 31, 2023 and September 30, 2022 was as follows:
| | | | | | | | | | | | | | | | | | | | | | | | |
| | | Ariel Fund | | | Ariel Appreciation Fund | | | Ariel Focus Fund | |
| | | 03/31/23 | | | 09/30/22 | | | 03/31/23 | | | 09/30/22 | | | 03/31/23 | | | 09/30/22 | |
Distributions From | | | | | | | | | | | | | | | | | | | | | | | | |
Ordinary Income | | | $16,029,152 | | | | $41,999,989 | | | | $11,151,524 | | | | $34,700,053 | | | | $1,701,188 | | | | $945,990 | |
Long-Term Capital Gains | | | 200,499,990 | | | | 140,500,169 | | | | 99,999,991 | | | | 146,900,127 | | | | 3,249,982 | | | | 1,372,981 | |
Total Distributions | | | $216,529,142 | | | | $182,500,158 | | | | $111,151,515 | | | | $181,600,180 | | | | $4,951,170 | | | | $2,318,971 | |
| | |
| 46 | | SLOW AND STEADY WINS THE RACE |
| | | | | | |
| | | Notes to the Financial Statements | | | | |
| | | | |
| | | | March 31, 2023 (Unaudited) |
| | | | | | | | | | | | | | | | |
| | | |
| | | Ariel International Fund | | | Ariel Global Fund | |
| | | | |
| | | 03/31/23 | | | 09/30/22 | | | 03/31/23 | | | 09/30/22 | |
| | | | |
Distributions From | | | | | | | | | | | | | | | | |
| | | | |
Ordinary Income | | | $— | | | | $21,000,000 | | | | $8,417,998 | | | | $4,075,000 | |
| | | | |
Long-Term Capital Gains | | | — | | | | — | | | | 710,011 | | | | — | |
| | | | |
Total Distributions | | | $— | | | | $21,000,000 | | | | $9,128,009 | | | | $4,075,000 | |
Reclassifications between net asset accounts are made at the end of the fiscal year for such differences that are permanent in nature. These differences are primarily due to merger adjustments, foreign currency, distribution reclassifications or the utilization of a portion of payments made to redeeming shareholders as a distribution for income tax purposes.
NOTE FIVE | INVESTMENT ADVISORY AND OTHER TRANSACTIONS WITH RELATED PARTIES
Management fees—The Adviser provides investment advisory and administrative services to Ariel Fund, Ariel Appreciation Fund and Ariel Focus Fund under a Management Agreement. The Adviser provides investment advisory services to Ariel International Fund and Ariel Global Fund under an Advisory Agreement (collectively, the “Agreements”). Pursuant to the Agreements, the Adviser is paid a monthly fee on average daily net assets at the annual rates shown below:
| | | | | | | | | | | | | | | | | | | | |
| | | | | | |
| Management fees | | Ariel Fund | | | Ariel Appreciation Fund | | | Ariel Focus Fund | | | Ariel
International
Fund | | | Ariel Global
Fund | |
| | | | | |
Average daily net assets: | | | | | | | | | | | | | | | | | | | | |
| | | | | |
First $500 million | | | 0.65% | | | | 0.75% | | | | 0.65% | | | | 0.80% | | | | 0.80% | |
| | | | | |
Next $500 million | | | 0.60% | | | | 0.70% | | | | 0.60% | | | | 0.80% | | | | 0.80% | |
| | | | | |
Over $1 billion | | | 0.55% | | | | 0.65% | | | | 0.55% | | | | 0.75% | | | | 0.75% | |
The Adviser has contractually agreed to reimburse the Funds to the extent their respective total annual operating expenses (excluding brokerage, interest, taxes, distribution plan expenses and extraordinary items) exceed certain limits as shown below:
| | | | | | | | | | | | | | | | |
| | | | |
| | | | | | | | | Ariel Focus Fund | |
| | | | |
| | | Ariel Fund
Investor Class | | | Ariel Appreciation Fund
Investor Class | | | Investor Class | | | Institutional Class | |
| | | | |
First $30 million | | | 1.50% | | | | 1.50% | | | | — | | | | — | |
| | | | |
Over $30 million | | | 1.00% | | | | 1.00% | | | | — | | | | — | |
| | | | |
On average daily net assets | | | — | | | | — | | | | 1.00% | | | | 0.75% | |
| | | | |
Expiration of waivers* | | | — | | | | — | | | | 2024 | | | | 2024 | |
| | | | |
| | | | | | | | | | | | | | | | | |
| | |
| | | Ariel International Fund | | | Ariel Global Fund | |
| | | | |
| | | Investor Class | | | Institutional Class | | | Investor Class | | | Institutional Class | |
| | | | |
On average daily net assets | | | 1.13% | | | | 0.88% | | | | 1.13% | | | | 0.88% | |
| | | | |
Expiration of waivers* | | | 2024 | | | | 2024 | | | | 2024 | | | | 2024 | |
| * | Through September 30 of the respective year. After this date, there is no assurance that such expenses will be limited. The Adviser has no right to recapture previously-waived fees. |
Distribution fees—Ariel Distributors, LLC is the Funds’ distributor and principal underwriter (the “Distributor”). The Trust has adopted a plan of distribution under Rule 12b-l of the 1940 Act for the Investor Class of the Funds. Under the plan, the Investor Class of each Fund pays 12b-l distribution fees calculated at an annual rate of 0.25% of average daily net assets on a weekly basis to the Distributor for its services. For the six months ended March 31, 2023, distribution fee expenses were as follows:
| | | | | | | | | | | | | | | | | | | | |
| | | | | | |
| | | Ariel Fund | | | Ariel Appreciation
Fund | | | Ariel Focus Fund | | | Ariel
International
Fund | | | Ariel Global
Fund | |
| | | | | |
Paid to Distributor | | | $1,557,254 | | | | $1,179,700 | | | | $55,207 | | | | $31,551 | | | | $15,417 | |
| | |
| SLOW AND STEADY WINS THE RACE | | 47 |
| | | | | | |
| | | Notes to the Financial Statements | | | | |
| | | | |
| | | | March 31, 2023 (Unaudited) |
| | | | | | | | | | | | | | | | | | | | |
| | | | | | |
| | | Ariel Fund | | | Ariel Appreciation
Fund | | | Ariel Focus Fund | | | Ariel
International
Fund | | | Ariel Global
Fund | |
| | | | | |
Paid to Broker/Dealers | | | $1,163,822 | | | | $867,378 | | | | $29,508 | | | | $26,130 | | | | $9,045 | |
The remaining amounts were used by the Distributor to offset the costs of marketing, advertising, and other distribution expenses.
Trustees’ fees—Trustees’ fees and expenses represent only those expenses of disinterested (independent) trustees of the Funds.
NOTE SIX | FORWARD CURRENCY CONTRACTS
Net realized gain (loss) and the Change in net unrealized appreciation (depreciation) on forward currency contracts as reflected in the Statements of Operations as well as the Volume of forward currency contracts measured by the number of trades during the year, and the Average notional value of the forward currency contracts for the six months ended March 31, 2023 were:
| | | | | | | | |
| | | |
| | | Ariel
International
Fund | | | Ariel Global Fund | |
| | |
Net realized gain (loss) on forward currency contracts | | | $(58,527 | ) | | | $(1,633,682 | ) |
| | |
Change in net unrealized appreciation (depreciation) on forward currency contracts | | | $3,456,695 | | | | $(988,948 | ) |
| | |
Volume of forward currency contracts | | | 37 | | | | 46 | |
| | |
Average notional value of forward currency contracts | | | $10,547,842 | | | | $1,870,669 | |
Complete lists of forward currency contracts open as of March 31, 2023 are included in the Schedules of Investments for the respective Fund.
NOTE SEVEN | TRANSACTIONS WITH AFFILIATED COMPANIES
If a fund’s holding represents ownership of 5% or more of the voting securities of a company, the company is deemed to be an affiliate of a fund as defined in the 1940 Act. The following transactions were made during the six months ended March 31, 2023 in securities of a company deemed to be an affiliated company of the Funds as of March 31, 2023:
| | | | | | | | | | | | | | | | | | | | | | | | | | | | | | | | | | | | | | | | | | | | | |
| | | |
| | | Share activity | | Six months ended March 31, 2023 |
| | | | | | | | | |
| Security name | | Balance September 30, 2022 | | Purchases | | Sales | | Balance March
31, 2023 | | Value | | Dividends
credited to
income | | Amount of gain
(loss) realized on
sale of shares | | Amount of
change in
unrealized gain
(loss) on shares | | Percent
of net
assets |
| | | | | | | | | |
Ariel Fund | | | | | | | | | | | | | | | | | | | | | | | | | | | | | | | | | | | | | | | | | | | | | |
| | | | | | | | | |
Adtalem Global Education, Inc. (Consumer discretionary) | | | | 2,729,575 | | | | | — | | | | | 245,876 | | | | | 2,483,699 | | | | | $95,920,455 | | | | | $— | | | | | $1,020,428 | | | | | $4,969,251 | | | | | 3.5 | % |
| | | | | | | | | |
Core Laboratories NV (Energy) | | | | 3,565,025 | | | | | — | | | | | — | | | | | 3,565,025 | | | | | 78,608,801 | | | | | 71,301 | | | | | — | | | | | 30,552,264 | | | | | 2.9 | |
| | | | | | | | | |
| | | | | | | | | | | | | | | | | | | | | | | | | $174,529,256 | | | | | $71,301 | | | | | $1,020,428 | | | | | $35,521,515 | | | | | 6.4 | % |
NOTE EIGHT | LINE OF CREDIT
The Funds have a $125,000,000 Line of Credit (the “Line”), which is uncommitted, with Northern Trust. The Line is for temporary or emergency purposes such as to provide liquidity for shareholder redemptions. The Funds incur interest expense to the extent of amounts drawn (borrowed) under the Line. Interest is based on the sum of 1.00% and the Federal Funds Effective Rate. As of March 31, 2023, there were no outstanding borrowings under the Line.
For the six months ended March 31, 2023, the details of the borrowings were as follows:
| | | | | | | | | | | | |
| | | | |
| Fund | | Average daily
borrowings | | | Number of days
outstanding | | | Weighted average
annualized interest
rate | |
| | | |
Ariel Fund | | | $7,404,446 | | | | 1 | | | | 4.83% | |
| | | |
Ariel Focus Fund | | | 32,824 | | | | 3 | | | | 5.18% | |
| | |
| 48 | | SLOW AND STEADY WINS THE RACE |
| | | | | | |
| | | Important Supplemental Information | | | | |
| | | | |
| | | | March 31, 2023 (Unaudited) |
PROXY VOTING POLICIES, PROCEDURES AND RECORD
Both a description of the policies and procedures that the Funds’ investment adviser uses to determine how to vote proxies relating to portfolio securities and information regarding how the Funds voted proxies relating to portfolio securities during the most recent 12-month period ended June 30 are available upon request by calling 800-292-7435. Such information for the Funds is also available on the Securities and Exchange Commission’s (“SEC”) website at www.sec.gov.
SHAREHOLDER STATEMENTS AND REPORTS
The Funds attempt to reduce the volume of mail sent to shareholders by sending one copy of financial reports, prospectuses and other regulatory materials to two or more account holders who share the same address. We will send you a notice at least 60 days before sending only one copy of these documents if we have not received written consent from you previously. Should you wish to receive individual copies of materials, please contact us at 800-292-7435. Once we have received your instructions, we will begin sending individual copies for each account within 30 days.
AVAILABILITY OF QUARTERLY PORTFOLIO SCHEDULES
The Funds file complete schedules of investments with the SEC for the quarters ended December 31 and June 30 of each fiscal year as an exhibit to its reports on Form N-PORT. Prior to February 2019, the Funds filed complete schedules of investments with the SEC for the quarters ended December 31 and June 30 of each fiscal year on Form N-Q. The Funds’ Forms N-PORT and N-Q are available on the SEC’s website at www.sec.gov.
All of the Funds’ quarterly reports contain a complete schedule of portfolio holdings. All quarterly reports are made available to shareholders on the Funds’ website at www.arielinvestments.com. Shareholders also may obtain copies of shareholder reports upon request by calling 800-292-7435 or by writing to Ariel Investment Trust, c/o U.S. Bank Global Fund Services, P.O. Box 701, Milwaukee, Wisconsin, 53201-0701.
LIQUIDITY NARRATIVE FOR SHAREHOLDERS
Consistent with Rule 22e-4 under the Investment Company Act of 1940, as amended, the Funds have established a liquidity risk management program to govern their approach to managing liquidity risk (“Program”). The Program is overseen by the Liquidity Risk Management Committee (“LRMC”), a committee comprised of representatives of the Funds’ investment adviser, Ariel Investments, LLC. The Funds’ Board of Trustees (“Board”) has approved the designation of the LRMC to oversee the Program.
The Program’s principal objectives include supporting each Fund’s compliance with limits on investments in illiquid assets and mitigating the risk that a Fund will be unable to meet its redemption obligations in a timely manner. The Program also includes a number of elements that support the management and assessment of liquidity risk, including an annual assessment of factors that influence a Fund’s liquidity, and the periodic classification and re-classification of a Fund’s investments into groupings that reflect the LRMC’s assessment of their relative liquidity under current market conditions.
During the period covered by the report, there were no liquidity events that impacted the Funds or their respective ability to timely meet redemptions without dilution to existing shareholders. The LRMC has determined, and reported to the Board, that the Program has operated adequately and effectively to manage the Funds’ liquidity risk during the year ended December 31, 2022.
There can be no assurance that the Program will achieve its objectives in the future. Please refer to your Fund’s prospectus for more information regarding the Fund’s exposure to liquidity risk and other principal risks to which an investment in the Fund may be subject.
APPROVAL OF THE MANAGEMENT AGREEMENTS
Each year the Board of Trustees of the Trust (the “Board”), including a majority of the Trustees who are not “interested persons” of the Adviser or the Funds (“Independent Trustees”), is required by the 1940 Act to determine whether to continue each Fund’s management and advisory agreements with the Adviser (together the “Agreements”). At a meeting held in November 2022, the Board, including all of the Independent Trustees, upon recommendation of the Board’s Management Contracts Committee (the “Committee”), determined that the continuation of the Agreements was in the best interest of each Fund and its shareholders, and approved the continuation of each Agreement.
The Committee, which is comprised entirely of Independent Trustees and includes all Independent Trustees, led the Board in its consideration of the Agreements. In evaluating the Agreements with respect to each Fund, both the Committee and the Board held meetings in November 2022 to review and evaluate materials provided by the Adviser in response to questions submitted by the Independent Trustees and counsel that is independent of the Adviser (“Independent Counsel”). At its meetings, the Committee received presentations from members of management of the Adviser and from the portfolio manager(s) of each Fund. In addition, the Committee members received a memorandum from Independent Counsel describing the factors they should consider in performing their review, a supplemental report (the “Broadridge Report”) prepared by Broadridge, an independent provider of
| | |
| SLOW AND STEADY WINS THE RACE | | 49 |
| | | | | | |
| | | Important Supplemental Information | | | | |
| | | | |
| | | | March 31, 2023 (Unaudited) |
investment company data, and additional written material and presentations from the Adviser. During the meetings, the Committee was advised by, and met in executive session with, Independent Counsel. In connection with its deliberations, the Committee also considered a broad range of information relevant to the Board’s annual review of the Agreements that is provided to the Board and its various standing committees at meetings throughout the year, including investment performance reports and related portfolio information for each Fund, as well as periodic reports on, among other matters, pricing and valuation; brokerage and execution; compliance; and shareholder and other services provided by the Adviser, its affiliates, and the Funds’ other service providers.
Nature, Extent and Quality of Services. The Committee considered the Adviser’s specific responsibilities in the day-to-day management of the Funds, also taking into account information received at quarterly Board meetings related to the services rendered by the Adviser and the Independent Trustees’ knowledge of the Adviser’s operations. In addition, the Committee considered the Adviser’s historical approach in managing the Funds; the consistency of the Adviser’s investment approach; the background, education and experience of the Adviser’s investment personnel; the nature and quality of the Adviser’s services, including, among other things, compliance matters such as the Funds’ Liquidity Risk Management Program, trading practices, broker approval and selection, shareholder communications, Fund marketing and distribution strategies, information technology, and cybersecurity protections; and the Adviser’s commitment to diversity and civic affairs. The Committee also considered whether each Fund had operated within its investment objectives and each Fund’s record of compliance with its investment restrictions and other regulatory requirements. The Committee also considered information regarding the structure of the Adviser’s compensation program for portfolio managers and certain other employees, including with respect to the Adviser’s ability to attract and retain quality personnel. The Committee also considered the personal investments made by the Adviser’s personnel in the Funds, which aligns the interests of the Adviser and its personnel with those of the Funds’ shareholders.
Investment Performance. The Committee discussed with the Adviser’s portfolio managers factors that contributed to each Fund’s comparative performance as measured against its Broadridge Peer Group. The Committee considered the investment performance of both the Investor and Institutional Classes of each Fund over time, including information provided in the Broadridge Report, comparing each Fund’s performance with that of comparable funds selected by Broadridge (the “Peer Group” or “Broadridge Peer Group”) as well as an analysis of Fund performance as compared to the performance of its benchmark over specific historical periods. For each period, the Broadridge report ranks each fund with the highest investment performance at the top, the fund with the lowest investment performance at the bottom and separates the Peer Group into five levels that each contain 20% of the universe (“quintiles”), with the top 20% being the first quintile and the bottom 20% being the fifth quintile. Where applicable, the Committee considered the one-, two-, three-, four-, five-, and ten-year periods for the fiscal year ended September 30, 2022. In the case of those Funds that underperformed their Broadridge Peer Group in one or more periods, the Committee discussed with the Adviser factors that caused such underperformance; considered the Adviser’s long-term investment process; and noted that the long-term track records supported the investment philosophy that, over time, consistent implementation of the investment approach should result in positive performance, but also would involve periods of underperformance.
Fees and Expenses. The Committee considered comparative fee and expense information for each Fund’s Expense Group, as selected and analyzed in the Broadridge Report, which ranks funds with the lowest fee at the top, the funds with the highest fee at the bottom and separates the Expense Group into five levels that each contain 20% of the universe (“quintiles”), with the top being the first quintile and the bottom being the fifth quintile. The Committee also considered the historical expenses with respect to economies of scale realized by the Adviser and whether such benefits were being passed on to shareholders, such as through the use of breakpoints in the Adviser’s management fees. The Committee considered the impact of the Rule 12b-l distribution services (“12b-l”) fees on the total expense ratio of the Investor Class of shares for all Funds and the resulting negative impact on the Funds’ Investor Class total expense ratio when compared to funds in their respective Broadridge Expense Groups that do not impose 12b-l fees. The Committee observed that the Peer Group comparisons for the Funds’ Institutional Class shares were more illustrative since the Institutional Class does not charge 12b-l fees.
The Committee considered the fees charged and services provided by Ariel to other types of clients and the rationale for any differences between those fees. The Committee also considered the revenue sharing payments made by the Adviser.
The Committee considered the following with respect to the investment performance and fees and expenses of each Fund for the fiscal year ended September 30, 2022:
Ariel Fund. Ariel Fund’s Investor Class performance ranked in the fifth quintile for the one-year period, the fourth quintile for the five-year period and the second quintile for the ten-year period as compared to its Broadridge Peer Group. The Fund’s Institutional Class performance ranked in the fifth quintile for the one-year period, the third quintile for the five-year period and the first quintile for the ten-year period as compared to its Broadridge Peer Group.
The actual management fees for Ariel Fund (both share classes) ranked in the first quintile as compared to its Broadridge Expense Group. The total expenses for the Ariel Fund’s Investor Class ranked in the third quintile, and the Fund’s Institutional Class ranked in the first quintile as compared to its Broadridge Expense Group.
| | |
| 50 | | SLOW AND STEADY WINS THE RACE |
| | | | | | |
| | | Important Supplemental Information | | | | |
| | | | |
| | | | March 31, 2023 (Unaudited) |
Ariel Appreciation Fund. Ariel Appreciation Fund’s Investor Class performance ranked in the fifth quintile for the one-year period, and the fourth quintile for the five-year and ten-year periods as compared to its Broadridge Peer Group. The Fund’s Institutional Class performance ranked in the fifth quintile for the one-year period, the fourth quintile for the five-year period and the third quintile for the ten-year period as compared to its Broadridge Peer Group.
The actual management fees for Ariel Appreciation Fund’s Investor Class ranked in the second quintile and the Fund’s Institutional Class ranked in the third quintile as compared to its Broadridge Expense Group. The total expenses for the Ariel Appreciation Fund’s Investor Class ranked in the fourth quintile and the Fund’s Institutional Class ranked in the second quintile as compared to its Broadridge Expense Group.
Ariel Focus Fund. Ariel Focus Fund’s Investor Class performance ranked in the fifth quintile for the one-year, the five-year and the ten-year periods as compared to its Broadridge Peer Group. The Fund’s Institutional Class performance ranked in the fifth quintile for the one-year period, the fourth quintile for the five-year period and the fifth quintile for the ten-year period as compared to its Broadridge Peer Group.
The Fund had fee reimbursements and expense limitations in place which resulted in reduced fees and/or expenses. The actual management fees for Ariel Focus Fund’s Investor Class ranked in the second quintile and the Fund’s Institutional Class ranked in the fourth quintile as compared to its Broadridge Expense Group. The total expenses for the Ariel Focus Fund (both share classes) ranked in the second quintile as compared to its Broadridge Expense Group.
Ariel International Fund. Ariel International Fund’s Investor Class performance ranked in the first quintile for the one-year, the fifth quintile for the five-year period and the third quintile for the ten-year period as compared to its Broadridge Peer Group. The Fund’s Institutional Class performance ranked in the first quintile for the one-year period, the fourth quintile for the five-year period and the second quintile for the ten-year period as compared to its Broadridge Peer Group.
The Fund had fee reimbursements and expense limitations in place which resulted in reduced fees and/or expenses. The actual management fees for Ariel International Fund’s Investor Class ranked in the first quintile and the Fund’s Institutional Class ranked in the third quintile as compared to its Broadridge Expense Group. The total expenses for the Ariel International Fund (both share classes) ranked in the third quintile as compared to its Broadridge Expense Group.
Ariel Global Fund. Ariel Global Fund’s Investor Class performance ranked in the first quintile for the one-year period and the third quintile for the five-year and ten-year periods as compared to its Broadridge Peer Group. The Fund’s Institutional Class performance ranked in the first quintile for the one-year period, the third quintile for the five-year period and the second quintile for the ten-year period as compared to its Broadridge Peer Group.
The Fund had fee reimbursements and expense limitations in place, which resulted in reduced fees and/or expenses. The actual management fees for Ariel Global Fund’s Investor Class ranked in the second quintile and the Fund’s Institutional Class ranked in the fourth quintile as compared to its Broadridge Expense Group. The total expenses for the Ariel Global Fund (both share classes) ranked in the third quintile as compared to its Broadridge Expense Group.
Profitability and Economies of Scale. The Committee considered the profitability to the Adviser from its relationship with each Fund, including the methodology by which that profitability analysis was calculated. The Committee also considered the fee reimbursements and expense limitations in place for Ariel Focus Fund, Ariel International Fund, and Ariel Global Fund. The Committee considered the extent to which economies of scale may be realized as Funds increase in size and that the management fee schedule for each Fund contains breakpoints at different levels. The Committee considered the effective advisory fee rates for the Funds and whether the advisory fee schedules provide an appropriate sharing between the Funds and the Adviser of such economies of scale as may exist under the Agreements. The Committee considered information about the Funds’ soft dollar arrangements that benefit the Adviser, as well as the Adviser’s brokerage and trading practices. The Committee also considered ancillary benefits, including whether the Funds benefited from Mr. Rogers’ and Ms. Hobson’s high media profiles.
Approval. After full consideration of the above factors, as well as other factors that were instructive in evaluating the Agreements, the Board, including all of the Independent Trustees, concluded that continuation of each Fund’s Agreement was in the best interests of each Fund and its respective shareholders, and the Board approved the continuation of each Agreement. In reaching this determination, the Board considered that the nature, extent and quality of the services provided by the Adviser to each Fund were appropriate and consistent with the Fund’s Agreement; the Adviser’s commitment to its stated investment strategy and identified circle of competency, and its calm, reasoned and long-term approach to investing; that the management fees paid by each Fund were reasonable in light of the services provided; that the breakpoints in the fee schedule for each Fund have the potential to allow shareholders to benefit from economies of scale; that the profitability associated with the Adviser’s relationship with the Trust was within a reasonable range and was neither excessive nor so low that the Adviser could not be expected to continue to service the Funds effectively; and that the benefits accruing to the Adviser by virtue of its relationship with the Funds were reasonable in light of the costs of providing the investment management services and the benefits accruing to each Fund. The Board’s determinations were based upon a comprehensive consideration of all information provided to it, including both quantitative measures and qualitative factors, and were not the result of any single factor.
| | |
| SLOW AND STEADY WINS THE RACE | | 51 |
| | | | | | |
| | | Fund Expense Example | | | | |
| | | | |
| | | | March 31, 2023 (Unaudited) |
EXAMPLE
As a shareholder of the Funds, you incur ongoing costs, including management fees, distribution and service (12b-l) fees and other Fund expenses. The Funds currently do not charge any transaction costs, such as sales charges (loads) on subscriptions, reinvested dividends or other distributions, redemption fees or exchange fees. The following example is intended to help you understand your ongoing costs (in dollars) of investing in each of the Funds and to compare these costs with the ongoing costs of investing in other mutual funds. Please note that IRA, 403(b) and Coverdell ESA account holders are charged an annual $15 recordkeeping fee or a one-time, lifetime $60 fee. If these fees were included in either the Actual Expense or Hypothetical Example below, your costs would be higher.
The example is based on an investment of $1,000 invested at the beginning of the period and held for the entire period of October 1, 2022 - March 31, 2023.
ACTUAL EXPENSES
The left portion of the table below for each Fund provides information about actual account values and actual expenses for that particular Fund. You may use the information in each of these lines, together with the amount you invested, to estimate the expenses that you paid over the period in each Fund. Simply divide your account value by $1,000 (for example, an $8,600 account value divided by $1,000=8.6), then multiply the result by the number under the heading, entitled “Expenses Paid During Period”, to estimate the expenses you paid on your account during this period in each Fund.
HYPOTHETICAL EXAMPLE FOR COMPARISON PURPOSES
The right portion of the table below for each Fund provides information about hypothetical account values and hypothetical expenses based on each Fund’s actual expense ratio and an assumed rate of return of 5% per year before expenses, which is not the actual return. The hypothetical account values and expenses may not be used to estimate the actual ending account balance or expenses you paid for the period. You may use this information to compare the ongoing costs of investing in each of the Funds to other funds. To do so, compare this 5% hypothetical example with the 5% hypothetical examples that appear in the shareholder reports of other funds.
Please note that the expenses shown in the table are meant to highlight only your ongoing costs in each of the Funds. Therefore, the right portion of the table for each Fund is useful in comparing ongoing costs only, and will not help you determine the relative total costs of owning different funds.
| | | | | | | | | | | | | | | | | | | | | | | | |
| | | | Actual* | | | Hypothetical (5% return before expenses) | | | |
| | | | | | | |
| Fund and Return | | Beginning
Account Value 10/01/22 | | Ending
Account Value 03/31/23 | | | Expenses Paid During Period | | Ending
Account Value 03/31/23 | | | Expenses
Paid During Period | | Annualized Expense Ratio |
| | | | | |
Ariel Fund | | | | | | | | | | | | | | | | | | | | |
| | | | | | |
Investor Class | | | $1,000.00 | | | | $1,196.50 | | | | $5.53 | | | | $1,019.90 | | | | $5.09 | | | | 1.01 | % |
| | | | | | |
Institutional Class | | | 1,000.00 | | | | 1,198.50 | | | | 3.73 | | | | 1,021.54 | | | | 3.43 | | | | 0.68 | % |
| | | | | |
Ariel Appreciation Fund | | | | | | | | | | | | | | | | | | | | |
| | | | | | |
Investor Class | | | $1,000.00 | | | | $1,170.10 | | | | $6.06 | | | | $1,019.35 | | | | $5.64 | | | | 1.12 | % |
| | | | | | |
Institutional Class | | | 1,000.00 | | | | 1,171.70 | | | | 4.33 | | | | 1,020.94 | | | | 4.03 | | | | 0.80 | % |
| | | | | |
Ariel Focus Fund | | | | | | | | | | | | | | | | | | | | |
| | | | | | |
Investor Class | | | $1,000.00 | | | | $1,123.40 | | | | $5.29 | | | | $1,019.95 | | | | $5.04 | | | | 1.00 | % |
| | | | | | |
Institutional Class | | | 1,000.00 | | | | 1,124.80 | | | | 3.97 | | | | 1,021.19 | | | | 3.78 | | | | 0.75 | % |
| | | | | |
Ariel International Fund | | | | | | | | | | | | | | | | | | | | |
| | | | | | |
Investor Class | | | $1,000.00 | | | | $1,205.20 | | | | $6.21 | | | | $1,019.30 | | | | $5.69 | | | | 1.13 | % |
| | | | | | |
Institutional Class | | | 1,000.00 | | | | 1,207.10 | | | | 4.84 | | | | 1,020.54 | | | | 4.43 | | | | 0.88 | % |
| | | | | |
Ariel Global Fund | | | | | | | | | | | | | | | | | | | | |
| | | | | | |
Investor Class | | | $1,000.00 | | | | $1,155.70 | | | | $6.07 | | | | $1,019.30 | | | | $5.69 | | | | 1.13 | % |
| | | | | | |
Institutional Class | | | 1,000.00 | | | | 1,157.80 | | | | 4.73 | | | | 1,020.54 | | | | 4.43 | | | | 0.88 | % |
* Expenses are calculated using each Portfolio’s annualized expense ratio (as disclosed in the table), multiplied by the average account value for the period, multiplied by the number of days in the most recent half fiscal year (182), and divided by the number of days in the current year (365).
| | |
| 52 | | SLOW AND STEADY WINS THE RACE |
| | | | | | |
| | |  | | | | |
| | | | |
| | | | | | | |
| | | | | | |
| | | | | | | | |
| | | | |
| Name and age | | Position(s) held with Fund | | Term of office and length of time served | | Principal occupation(s) during past 5 years | | Other directorships |
| | | |
INDEPENDENT TRUSTEES: | | | | | | |
| | | | |
William C. Dietrich Age: 73 | | Lead Independent Trustee, Chair of Executive Committee, Member of Management Contracts, Audit and Governance Committees | | Indefinite, until successor elected; Trustee since 1986 | | Retired Executive Director, Shalem Institute for Spiritual Formation, Inc., 2006 to 2009 | | |
| | | | |
Eric H. Holder, Jr. Age: 72 | | Trustee, Chair of Governance Committee, Member of Management Contracts and Audit Committees | | Indefinite, until successor elected; Trustee since 2019 | | Partner, Covington & Burling since 2015 | | |
| | | | |
Christopher G. Kennedy Age: 59 | | Trustee, Chair of Audit Committee, Member of Management Contracts, Governance, and Executive Committees | | Indefinite, until successor elected; Trustee since 1994 | | Chair, Joseph P. Kennedy Enterprises, Inc. since 2012; Founder (2012) and Chairman (2012-2018, Emeritus since 2018), Top Box Foods | | Interface Inc. |
| | | | |
Kim Y Lew Age: 56 | | Trustee, Member of Management Contracts, Audit and Governance Committees | | Indefinite, until successor elected; Trustee since 2014 | | President and Chief Executive Officer of the Columbia Investment Management Company since 2020; Vice President and Chief Investment Officer, Carnegie Corporation of New York 2016 to 2020 | | |
| | | | |
Stephen C. Mills Age: 63 | | Trustee, Member of Management Contracts, Audit and Governance Committees | | Indefinite, until successor elected; Trustee since 2015 | | President of Basketball Operations, New York Knicks, 2017 to 2020; NBA Alternate Governor, New York Knicks, 2013 to 2020 | | Selective Insurance Group, Inc.; Madison Square Garden Sports Corp.; and MSG Networks Inc. |
| | | | |
James M. Williams Age: 75 | | Trustee, Chair of Management Contracts Committee, Member of Governance and Audit Committees | | Indefinite, until successor elected; Trustee since 2006 | | Vice President and Chief Investment Officer, J. Paul Getty Trust since 2002 | | SEI Mutual Funds (Mr. Williams oversees a total of 90 SEI Mutual Fund portfolios) |
INTERESTED TRUSTEES: | | | | | | | | |
| | | | |
Mellody L. Hobson Age: 53 | | Chair of the Board of Trustees and President, Member of Executive Committee | | Indefinite, until successor elected; Trustee since 1993; President since 2002; Chair since 2006 | | Co-CEO since 2019 and President since 2000, Ariel Investments, LLC | | Starbucks Corporation; JPMorgan Chase & Co. |
| | | | |
John W. Rogers, Jr. Age: 65 | | Trustee | | Indefinite, until successor elected; Trustee since 2000 and from 1986 to 1993 | | Founder, Chairman, Chief Investment Officer since 1983, and Co-CEO since 2019 (formerly CEO, 1983-2019) Ariel Investments, LLC; Lead Portfolio Manager, Ariel Fund since 1986 and Co-Portfolio Manager, Ariel Appreciation Fund since 2002 | | McDonald’s Corporation; Nike, Inc.; Ryan Specialty Group Holdings, Inc.; The New York Times Company |
The Statement of Additional Information (SAI) for Ariel Investment Trust includes additional information about the Funds’Trustees. The SAI is available without charge by calling 800.292.7435 or by logging on to our website, arielinvestments.com.
Note: Number of portfolios in complex overseen by all Trustees is five. Address for all Trustees is 200 East Randolph Street, Suite 2900, Chicago, IL 60601-6505.
| | |
| SLOW AND STEADY WINS THE RACE | | 53 |
| | | | | | | | |
| | | | |
| Name and age | | Position(s) held with Fund | | Term of office and length of time served | | Principal occupation(s)
during past 5 years | | |
| | | | |
Emma L. Rodriguez-Ayala Age: 41 | | Vice President, Anti-Money Laundering Officer and Secretary | | Indefinite, until successor elected since 2023 | | Chief Privacy Officer, Senior Vice President, Anti-Money Laundering Officer, and General Counsel, Ariel Investments, LLC since 2023; General Counsel and Chief Compliance Officer, LGIM America, 2020-2022; Partner in the Investment Management practice at Faegre Drinker Biddle & Reath, 2018-2020 | | |
| | | | |
Wendy D. Fox Age: 60 | | Chief Compliance Officer and Vice President | | Indefinite, until successor elected; Chief Compliance Officer and Vice President since 2014 | | Senior Vice President, Ariel Investments, LLC, since 2017; Chief Compliance Officer, Ariel Investments, LLC since 2004 | | |
| | | | |
James R. Rooney Age: 64 | | Chief Financial Officer, Vice President and Treasurer | | Indefinite, until successor elected; Chief Financial Officer, Vice President and Treasurer since 2015 | | Senior Vice President, Fund Administration, Ariel Investments, LLC since 2017 | | |
Note: Address for all officers is 200 East Randolph Street, Suite 2900, Chicago, IL 60601-6505.
| | |
| 54 | | SLOW AND STEADY WINS THE RACE |
Risks of Investing in the Funds
The intrinsic value of the stocks in which the Funds invest may never be recognized by the broader market. The Funds are often concentrated in fewer sectors than their benchmarks, and their performance may suffer if these sectors underperform the overall stock market. Equity investments are affected by market conditions. Ariel Fund, Ariel Appreciation Fund and Ariel Focus Fund invest in small and/or mid-cap companies, which is riskier and more volatile than investing in large cap stocks. Ariel Focus Fund is a non-diversified fund and therefore may be more volatile than a more diversified investment. Ariel International Fund and Ariel Global Fund invest in foreign securities and may use currency derivatives and ETFs. Investments in foreign securities may underperform and may be more volatile than comparable U.S. stocks because of the risks involving foreign economies and markets, foreign political systems, foreign regulatory standards, foreign currencies and taxes. The International and Global Funds’ use of currency derivatives and ETFs may increase investment losses and expenses and create more volatility. The International and Global Funds’ investments in emerging markets present additional risks, such as difficulties selling on a timely basis and at an acceptable price.
Specific Stocks Held by the Funds
In this report, we candidly discuss specific stocks held by the Funds. Our opinions are current as of the date they were written but are subject to change. We want to remind investors that the information in this report is not sufficient on which to base an investment decision and should not be considered a recommendation to purchase or sell any particular security.
Please Read the Funds’ Prospectuses
Investors should consider carefully the investment objectives, risks, and charges and expenses before investing. For a current summary prospectus or full prospectus which contains this and other information about the Funds offered by Ariel Investment Trust, call us at 800.292.7435 or visit our website, arielinvestments.com. Please read the summary prospectus or full prospectus carefully before investing. Distributed by Ariel Distributors, LLC, a wholly owned subsidiary of Ariel Investments, LLC. Ariel Distributors, LLC is a member of the Securities Investor Protection Corporation.
| | |
| SLOW AND STEADY WINS THE RACE | | 55 |
| | | | | | |
| | | Information about the Funds’ Indexes and the GICS Sector Classification Standards |
| | | | | | | |
| | | | | | |
Indexes are unmanaged. An investor cannot invest directly in an index.
The Russell 2500™ Value Index measures the performance of the small to mid-cap value segment of the U.S. equity universe. It includes those Russell 2500 companies with relatively lower price-to-book ratios, lower forecasted growth values and lower sales per share historical growth. Inception of this benchmark is July 1, 1995. This index pertains to Ariel Fund.
The Russell 2500™ Index measures the performance of the small to mid-cap segment of the U.S. equity universe, commonly referred to as “smid” cap. The Russell 2500™ Index is a subset of the Russell 3000® Index. It includes approximately 2500 of the smallest securities based on a combination of their market cap and current index membership. Inception of this benchmark is June 1, 1990. This index pertains to Ariel Fund.
The Russell Midcap® Value Index measures the performance of the mid-cap value segment of the U.S. equity universe. It includes those Russell Midcap Index companies with lower price-to-book ratios, lower forecasted growth values and lower sales per share historical growth. The inception date of this benchmark is February 1, 1995. This index pertains to Ariel Appreciation Fund.
The Russell Midcap® Index measures the performance of the mid-cap segment of the U.S. equity universe. The Russell Midcap® Index is a subset of the Russell 1000® Index. It includes approximately 800 of the smallest securities based on a combination of their market cap and current index membership. The inception date of this benchmark is November 1, 1991. This index pertains to Ariel Appreciation Fund.
The Russell 1000® Value Index measures the performance of the large-cap value segment of the U.S. equity universe. It includes those Russell 1000 companies with lower price-to-book ratios, lower forecasted growth values and lower sales per share historical growth. The inception date of this benchmark is January 1, 1987. This index pertains to Ariel Focus Fund.
The S&P 500® Index is widely regarded as the best gauge of large-cap U.S. equities. It includes 500 leading companies and covers approximately 80% of available U.S. market capitalization. This index pertains to Ariel Fund, Ariel Appreciation Fund and Ariel Focus Fund.
The MSCI EAFE Index is an equity index of large and mid-cap representation across 21 Developed Markets (DM) countries around the world, excluding the U.S. and Canada. Inception of this benchmark was May 31, 1986. The MSCI EAFE Value Index captures large and mid-cap securities exhibiting overall value style characteristics across Developed Markets countries around the world, excluding the U.S. and Canada. Inception of this benchmark was December 8, 1997. These indexes pertain to Ariel International Fund.
The MSCI ACWI (All Country World Index) ex-US Index is an index of large and mid-cap representation across 22 Developed Markets (DM) and 24 Emerging Markets (EM) countries. Inception of this benchmark was January 1, 2001. The MSCI ACWI ex-US Value Index captures large and mid-cap securities exhibiting overall value style characteristics across 22 Developed and 24 Emerging Markets countries. Inception of this benchmark was December 8, 1997. These indexes pertain to Ariel International Fund.
The MSCI ACWI (All Country World Index) Index is an equity index of large and mid-cap representation across 23 Developed Markets (DM) and 24 Emerging Markets (EM) countries. Inception of this benchmark was January 1, 2001.
The MSCI ACWI Value Index captures large and mid-cap securities exhibiting overall value style characteristics across 23 Developed Markets countries and 24 Emerging Markets (EM) countries. Inception date of this benchmark was December 8, 1997. These indexes pertain to Ariel Global Fund.
All MSCI Index net returns reflect the reinvestment of income and other earnings, including the dividends net of the maximum withholding tax applicable to non-resident institutional investors that do not benefit from double taxation treaties. MSCI uses the maximum tax rate applicable to institutional investors, as determined by the companies’ country of incorporation.
Russell® is a trademark of London Stock Exchange Group, which is the source and owner of the Russell Indexes’ trademarks, service marks and copyrights. Neither Russell nor its licensors accept any liability for any errors or omissions in the Russell Indexes or underlying data and no party may rely on any Russell Indexes and/or underlying data contained in this communication. No further distribution of Russell data is permitted without Russell’s express written consent. Russell does not promote, sponsor or endorse the content of this communication.
MSCI makes no express or implied warranties or representations and shall have no liability whatsoever with respect to any MSCI data contained herein. The MSCI data may not be further redistributed or used to create indices or financial products. This report is not approved or produced by MSCI. Source: MSCI.
The sectors shown for the Global strategies are the Global Industry Classification Standard (“GICS”). GICS was developed by and is the exclusive property and a service mark of MSCI Inc. (“MSCI”) and Standard & Poor’s, a division of The McGraw-Hill Companies, Inc. (“S&P”) and is licensed for use by Ariel Investments, LLC. Neither MSCI, S&P nor any third party involved in making or compiling the GICS or any GICS classifications makes any express or implied warranties or representations with respect to such standard or classification (or the results to be obtained by the use thereof ), and all such parties hereby expressly disclaim all warranties of originality, accuracy, completeness, merchantability and fitness for a particular purpose with respect to any of such standard or classification. Without limiting any of the foregoing, in no event shall MSCI, S&P, any of their affiliates or any third party involved in making or compiling the GICS or any GICS classifications have any liability for any direct, indirect, special, punitive, consequential or any other damages (including lost profits) even if notified of the possibility of such damages.
| | |
| 56 | | SLOW AND STEADY WINS THE RACE |

The materials used to produce this report were sourced responsibly. The paper used along with the packaging are all recyclable. .

Ariel Investment Trust c/o U.S. Bank Global Fund Services P.O. Box 701 Milwaukee, WI 53201-0701 800.292.7435 arielinvestments.com linkedin.com/company/ariel-investments instagram.com/arielinvestments twitter.com/arielinvests What’s Inside UNINTENDED CONSEQUENCES Co-CEOs Mellody Hobson and John W. Rogers, Jr. discuss how today’s higher interest rates and the prospect of lower future rates are driving two disparate and increasingly crowded trades. THE END OF DECLINING INTEREST RATES Vice Chairman Charlie Bobrinskoy explains why the last two decades have been challenging for traditional value managers and why this is about to change. THE NEXT CHALLENGE Chief Investment Officer, Global Equities Rupal Bhansali believes more stress on regional banks might lead to a more difficult recession than the market expects. PORTFOLIO COMPANY SPOTLIGHTS Perspectives from our investment team on Baidu, Inc., Leslie’s, Inc. (NYSE: LESL), Madison Square Garden Entertainment (NYSE: MSGE) and Stericycle, Inc. (NYSE: SRCL). TPI (4,500) ©5/23 AI-01
(b) Not applicable.
Item 2. Code of Ethics.
Not applicable for the reporting period.
Item 3. Audit Committee Financial Expert.
Not applicable for the reporting period.
Item 4. Principal Accountant Fees and Services.
Not applicable for the reporting period.
Item 5. Audit Committee of Listed Registrants.
Not applicable.
Item 6. Investments.
(a) Included as part of the report to shareholders filed under Item 1(a) of this Form.
(b) Not applicable.
Item 7. Disclosure of Proxy Voting Policies and Procedures for Closed-End Management Investment Companies.
Not applicable.
Item 8. Portfolio Managers of Closed-End Management Investment Companies.
Not applicable.
Item 9. Purchases of Equity Securities by Closed-End Management Investment Company and Affiliated Purchasers.
Not applicable.
Item 10. Submission of Matters to a Vote of Security Holders.
There have been no changes to the procedures by which shareholders may recommend nominees to the registrant’s Board of Trustees.
Item 11. Controls and Procedures.
(a) The registrant’s certifying officers have reasonably designed such disclosure controls and procedures to ensure material information relating to the registrant is made known to them by others, particularly during the period in which this report is being prepared. The registrant’s certifying officers have determined that the registrant’s disclosure controls and procedures are effective based on their evaluation of these controls and procedures as of a date within 90 days prior to the filing date of this report.
(b) There were no significant changes in the registrant’s internal controls over financial reporting, or in other factors that could significantly affect these controls, that occurred during the period covered by this report, including any corrective actions with regard to significant deficiencies and material weaknesses.
Item 12. Disclosure of Securities Lending Activities for Closed-End Management Investment Companies.
Not applicable.
Item 13. Exhibits.
(a)(1) Code of Ethics – Not applicable for the reporting period.
(a)(2) Certification for each principal executive and principal financial officer of the registrant as required by Rule 30a-2 under the Act (17 CFR 270.30a-2(a)) – Filed as an attachment to this filing.
(b) Certification for each principal executive and principal financial officer of the registrant as required by Rule 30a-2(a) under the Act (17 CFR 270.30a-2(a)). A certification furnished pursuant to this paragraph will not be deemed “filed” for purposes of Section 18 of the Securities Exchange Act of 1934, as amended, or otherwise subject to the liability of that section. Such certification will not be deemed to be incorporated by reference into any filing under the Securities Act of 1933 or the Exchange Act, except to the extent that the registrant specifically incorporates it by reference - Filed as an attachment to this filing.
SIGNATURES
Pursuant to the requirements of the Securities Exchange Act of 1934 and the Investment Company Act of 1940, the registrant has duly caused this report to be signed on its behalf by the undersigned, thereunto duly authorized.
| | |
| Ariel Investment Trust |
| |
| By: | | /s/ Mellody L. Hobson |
| | Mellody L. Hobson |
| | President |
| | (Principal Executive Officer) |
| |
| Date: | | May 24, 2023 |
Pursuant to the requirements of the Securities Exchange Act of 1934 and the Investment Company Act of 1940, this report has been signed below by the following persons on behalf of the registrant and in the capacities and on the dates indicated.
| | |
| By: | | /s/ Mellody L. Hobson |
| | Mellody L. Hobson |
| | President |
| | (Principal Executive Officer) |
| |
| Date: | | May 24, 2023 |
| |
| By: | | /s/ James R. Rooney |
| | James R. Rooney |
| | Vice President, Chief Financial Officer and Treasurer |
| | (Principal Financial Officer) |
| |
| Date: | | May 24, 2023 |