UNITED STATES
SECURITIES AND EXCHANGE COMMISSION
Washington, D.C. 20549
FORM N-CSR
CERTIFIED SHAREHOLDER REPORT
OF
REGISTERED MANAGEMENT COMPANY
| Investment Company Act file number: | 811-4526 |
| Name of Registrant: | Vanguard Quantitative Funds |
| Address of Registrant: | P.O. Box 2600 Valley Forge, PA 19482 |
| Name and address of agent for service: | R. Gregory Barton, Esquire P.O. Box 876 Valley Forge, PA 19482 |
Registrant’s telephone number, including area code: (610) 669-1000
| Date of fiscal year end: | September 30 |
| Date of reporting period: | October 1, 2003 - September 30, 2004 |
| Item 1: | Reports to Shareholders |
Vanguard® Growth and Income Fund
September 30, 2004

YOUR FUND REPORT
CONTENTS
| 1 | LETTER FROM THE CHAIRMAN |
| 6 | REPORT FROM THE ADVISOR |
| 9 | FUND PROFILE |
| 10 | GLOSSARY OF INVESTMENT TERMS |
| 11 | PERFORMANCE SUMMARY |
| 12 | YOUR FUND'S AFTER-TAX RETURNS |
| 13 | ABOUT YOUR FUND'S EXPENSES |
| 15 | FINANCIAL STATEMENTS |
| 26 | ADVANTAGES OF VANGUARD.COM |
SUMMARY
| o | The Investor Shares of Vanguard Growth and Income Fund returned 15.1% for the 2004 fiscal year. The fund topped the returns of its benchmark index and the average large-cap core mutual fund. |
| o | Stocks benefited from solid earnings growth and positive economic reports in the first half of the period; then the market turned sideways in reaction to rising oil prices and less-favorable economic news. |
| o | The investment advisor’s selections among technology and utilities stocks pushed the fund ahead of the S&P 500 Index in these volatile sectors. |
VANGUARD’S PLEDGE TO CLIENTS
We recognize that your relationship with Vanguard rests on the twin pillars of trust and excellence, each of which is built upon the character of our people. Our Pledge to Clients reflects our ongoing efforts to deserve your trust and to continually improve so that we can offer you excellence in all that we do.
We will:
| o | Put your interests first at all times. | |
| o | Continually seek to earn your trust by adhering to the highest standards of ethical behavior and fiduciary responsibility. |
| o | Strive to be the highest-value provider of investment services, which means outstanding investment performance and service, both at the lowest possible cost. |
| o | Communicate candidly not only about the rewards of investing but also about the risks and costs. |
| o | Maintain highly effective controls to safeguard your assets and protect your confidential information. | |
| o | Invest a majority of our personal assets alongside yours. |
Please note: The opinions expressed in this report are just that—informed opinions. They should not be considered promises or advice.
Want less clutter in your mailbox? Just register with Vanguard.com® and opt to get fund reports online.
LETTER FROM THE CHAIRMAN

Dear Shareholder,
Vanguard Growth and Income Fund held onto gains booked in the first half of its fiscal year, then treaded the roiling waters of the summer’s stock market. The advisor’s stock selections in some of the market’s most volatile sectors put the fund ahead of its market benchmark. The fund’s Investor Shares returned 15.1% and the Admiral Shares, 15.3%; by comparison, the Standard & Poor’s 500 Index returned 13.9%.
The Growth and Income Fund’s gains also exceeded the average return of competing mutual funds and the rise of the broad market, as measured by the Dow Jones Wilshire 5000 Composite Index.
The adjacent table presents the 12-month total return (capital change plus reinvested dividends) for the fund’s two share classes along with those of its comparative standards.
| 2004 Total Returns | |
|---|---|
| Fiscal Year Ended September 30 | |
| Vanguard Growth and Income Fund | |
| Investor Shares | 15.1% |
| Admiral Shares | 15.3 |
| S&P 500 Index | 13.9 |
| Average Large-Cap Core Fund* | 10.2 |
| Dow Jones Wilshire 5000 Index | 14.8 |
| *Derived from data provided by Lipper Inc. |
The fund’s distributions and its share prices at the beginning and end of the fiscal year are shown in the table on page 5. For those who hold the fund in a taxable account, page 12 shows after-tax returns for investors in the highest tax bracket.
STOCKS FARED WELL, THEN COOLED OFF
A strong rally in U.S. stock prices that lasted from the beginning of the fiscal year through February produced solid gains for most major indexes. These advances were fueled by solid corporate earnings growth and a slew of economic reports suggesting robust growth and job-
1
Admiral™ Shares
A lower-cost class of shares available to many longtime shareholders and to those with significant investments in the fund.
market improvement. However, despite volatility during the final seven months of the period—from March through September—most indexes saw relatively little change. The earlier enthusiasm for stocks wore thin, as economic reports turned less favorable and the economy showed the strain of rising crude-oil prices. For the 12 months, the Dow Jones Wilshire 5000 Index returned 14.8%.
Smaller-capitalization stocks provided higher returns for the fiscal year than did large-caps. Across the market-cap spectrum, value-oriented stocks (those that generally trade at below-market valuations relative to their book values and other fundamental measures) outpaced growth-oriented issues (those expected to return above-average earnings growth). Returns from most international markets were enhanced for U.S.-based investors by the continued weakness of the greenback relative to major currencies.
THE BOND MARKET WAS SWAYED BY ECONOMIC UNCERTAINTIES
In the first half of the period, a continued decline in yields boosted bond prices and returns. In April, however, yields began to march higher as reports showed higher-than-expected inflation and strong job growth. Yields tailed off again in August and September, as reports suggested the economic recovery had lost some steam. The yield of the 10-year U.S. Treasury note, a benchmark for longer-term interest rates, started the fiscal year at 3.94%, dropped to a low of 3.69% in March, climbed to 4.65% by the end of May, and finished the period at 4.12%.
| Market Barometer | Average Annual Total Returns Periods Ended September 30, 2004 | |||
|---|---|---|---|---|
| One Year | Three Years | Five Years | ||
| Stocks | ||||
| Russell 1000 Index (Large-caps) | 13.9% | 4.7% | -0.7% | |
| Russell 2000 Index (Small-caps) | 18.8 | 13.7 | 7.4 | |
| Dow Jones Wilshire 5000 Index | 14.8 | 6.1 | 0.0 | |
| MSCI All Country World Index | ||||
| ex USA (International) | 23.1 | 11.4 | 0.5 | |
| Bonds | ||||
| Lehman Aggregate Bond Index | 3.7% | 5.9% | 7.5% | |
| (Broad taxable market) | ||||
| Lehman Municipal Bond Index | 4.6 | 5.8 | 6.8 | |
| Citigroup 3-Month Treasury Bill Index | 1.0 | 1.4 | 3.0 | |
| CPI | ||||
| Consumer Price Index | 2.5% | 2.1% | 2.5% | |
2
Investment-grade taxable bonds, as measured by the Lehman Brothers Aggregate Bond Index, returned 3.7% for the 12 months. Corporate bonds continued to offer competitive returns relative to their government counterparts. The yield of the 3-month Treasury bill (a proxy for money market rates) rose 0.76 percentage point in the second six months in response to the Federal Reserve Board’s three separate actions—in June, August, and September—to raise its target for the federal funds rate. The Treasury bill, which yielded 0.94% at the start and midpoint of the fiscal year, yielded 1.70% as of September 30.
STOCKS OF BANKS AND OIL COMPANIES DROVE FUND PERFORMANCE
The Growth and Income Fund enjoyed positive performance across all sectors during the fiscal year, despite the stock market’s largely sideways move during the second six months. The advisor, Franklin Portfolio Associates, uses stock-selection models that overweight and underweight individual stocks relative to the S&P 500 Index while closely mirroring the index’s sector weightings. As a result, the fund has a risk profile very similar to that of its benchmark, but seeks to outperform it by successful stock selection.
In the fiscal year, both the fund and the index reaped their strongest gains from financial services companies and large energy companies, which together comprised about 30% of the fund’s holdings at the fiscal year-end. Banks benefited from a variety of trends, including efficiency-boosting mergers and profitable bond and commodities trading operations. Oil companies—including the fund’s largest holding, ExxonMobil—led the market for much of the year due to a persistent imbalance between demand and supply. (ExxonMobil is one of the companies in which the fund is overweighted compared with the S&P 500.)
The fund’s lead over the index came largely in two areas: technology and utilities. Franklin’s stock-selection models introduce a slight value bias into the fund, a factor that helped it to avoid some of the market’s worst performers when tech stocks slumped during the summer. Compared with the S&P 500, the fund picked up an extra percentage point of return from the sector, partly by avoiding trouble and partly by being heavily committed to some of the sector’s bright spots. For example, the fund held three times the benchmark weighting in QUALCOMM, a cell phone chipmaker. The stock soared 88.5%
3
during the year, contributing a full percentage point to the fund’s overall return; by contrast, QUALCOMM added just 0.3 percentage point to the S&P 500‘s gain. In the utilities group, the fund’s largest over-weightings were in companies that benefited from innovations in wireless technology—for example, Nextel Communications and BellSouth.
While successfully capturing much of the market return among integrated oil companies, the advisor enjoyed less success with “other energy,” a sector made up of companies focused on specialized aspects of oil and natural-gas exploration and production. The fund had a light weighting relative to the benchmark among these stocks, which boomed as energy supplies tightened.
THE FUND HAS REWARDED ITS LONG-TERM SHAREHOLDERS
The Growth and Income Fund’s approach to managing risk and reward relative to the S&P 500 Index has provided excellent long-term results for its investors: The fund has averaged an 11.5% annual return for the past ten years, compared with 11.1% for the S&P 500. As you can see in the table below, the fund also topped the average annual return for its peer group by more than 2 percentage points. A hypothetical investment of $10,000 in the Growth and Income Fund at the start of the decade would have grown to $29,662 by September 30, 2004, while the same investment in the average peer fund would have risen to $24,123—$5,539 less.
| Total Returns | ||
|---|---|---|
| Ten Years Ended September 30, 2004 | ||
| Average Annual Return | Final Value of a $10,000 Initial Investment | |
| Growth and Income Fund | ||
| Investor Shares | 11.5% | $29,662 |
| S&P 500 Index | 11.1 | 28,612 |
| Average Large-Cap | ||
| Core Fund | 9.2 | 24,123 |
| Dow Jones Wilshire | ||
| 5000 Index | 10.7 | 27,722 |
The fund’s performance edge can be explained partly by the advisor’s skill at stock selection and partly by the fund’s low costs. Owners of Investor Shares pay 0.42% in expenses annually, compared with 1.44% for the average competing fund, according to Lipper Inc. The latter figure represents a large handicap for any manager to overcome without taking on additional risk. (Investors in the Growth and Income Fund’s Admiral Shares qualify for an even lower 0.25% expense ratio.)
4
KEEPING A LONG-TERM OUTLOOK
A review of the Growth and Income Fund’s returns over the past decade shows six years of positive performance—most of it, sizable gains—followed by two wrenching down years and then two more years of robust gains (see the Performance Summary on page 11). The pattern serves to make a point near and dear to us at Vanguard: The timing and extent of future market moves are unknown to us all. The best way to protect yourself from the unknown is to plan for risk, which is inevitable. Select a mix of broadly diversified stock, bond, and money market funds reflecting your goals, time horizon, and risk tolerance.
An appropriately balanced portfolio can offer support from one asset class when another falters, helping you to take the long view and not overreact in any given down market. The Growth and Income Fund can have a place in such a strategy, providing a core holding for investors seeking an actively managed large-cap fund.
Thank you for entrusting your assets to Vanguard.
Sincerely,

John J. Brennan
CHAIRMAN AND CHIEF EXECUTIVE OFFICER
OCTOBER 14, 2004
| Your Fund's Performance at a Glance | September 30, 2003-September 30, 2004 | |||
|---|---|---|---|---|
| Distributions Per Share | ||||
| Starting Share Price | Ending Share Price | Income Dividends | Capital Gains | |
| Growth and Income Fund | ||||
| Investor Shares | $24.91 | $28.31 | $0.360 | $0.000 |
| Admiral Shares | 40.70 | 46.25 | 0.663 | 0.000 |
5
REPORT FROM THE ADVISOR
Over the year ended September 30, 2004, Vanguard Growth and Income Fund’s Investor Shares returned 15.1%, exceeding the return of the fund’s benchmark and the average gain of large-capitalization core funds.
INVESTMENT PERSPECTIVE
Looking forward to a new fiscal year, we face an investment and economic environment that is generally positive but does contain a number of concerns and challenges. The economy continues to expand, and corporate profit growth reflects impressive expense management and a degree (though, in our mind, an insufficient degree) of top-line revenue growth. Fiscal and monetary policies continue to stimulate the economy (despite the Federal Reserve Board’s rate increases), and corporate America has an excellent balance sheet with impressive liquidity. The twin deficits—trade and the federal budget—certainly are not sustainable indefinitely, but do not appear to be constraints on near-term economic growth or the markets. Energy costs have increased dramatically, but investors have pinned their resulting worries on the transportation sector; the implications of $50-a-barrel crude oil for the broader economy and the rest of the market have not been fully digested.
In our view, the more immediate concern is that the growth in consumer spending that initiated this economic recovery may finally be running out of steam. It remains to be seen whether business investment, measured by both capital expenditures and increased employment, will continue to grow sufficiently to keep the current expansion on track. Corporate cash balances are high and interest rates remain low, so the biggest impediment to business investment appears to be uncertainty about future returns and opportunities.
Investment Philosophy
The fund reflects a belief that superior long-term investment results can be achieved by using quantitative methods to select stocks that, in the aggregate, have risk characteristics similar to the S&P 500 Index but that are currently undervalued by the market.
While uncertainty about terrorist attacks will linger indefinitely, the uncertainty related to the 2004 elections will be removed by the time
6
you receive this report. It is quite possible that, once managements have a clearer picture of the kinds of tax, trade, and regulatory policies they can expect in the next four years, business investment will return to a more normal level for this point in an economic recovery. A sustainable level of corporate profit growth, fueled by a resurgence in capital expenditures and taking place in the current low-interest-rate environment, will make the valuation argument for stocks more compelling.
OUR SUCCESSES
In assessing stocks, we found that our measures focused on relative value were the most effective in differentiating winners from losers in recent months. Our stock selection was particularly good in industrials, consumer staples, and the generally weak technology sector during the fiscal year. Specific stocks that generated positive returns in excess of industry performance included Black & Decker (handheld tools and industrial parts), Countrywide Financial (mortgage loans), Electronic Arts (entertainment software), QUALCOMM (wireless telecommunications equipment), Johnson & Johnson (drugs), Guidant (medical devices), and Monsanto (chemicals). In comparison with the S&P 500 Index, we also benefited from being underweighted in certain poorly performing stocks, including Merck, Cisco Systems, and Fannie Mae.
While sector tilts (measured as the difference between the portfolio weighting and the S&P 500 Index weighting in a particular sector) are deliberately minimized in the Growth and Income Fund, we do not try to erase them. During the fiscal year, the fund benefited from small overweightings in energy stocks and consumer cyclicals, as well as from an underweighting in health care. Some benefit also came from the fund’s tendency to hold stocks that on average have a lower price/ earnings ratio than the S&P 500 Index.
OUR SHORTFALLS
The Growth and Income Fund is kept well diversified so that no single holding has an outsized impact on investment results. But invariably there are certain stocks that, in hindsight, we wish we hadn’t owned during the previous 12 months. In general, poor performance came from stocks in which we were overweighted compared with the benchmark and whose issuers announced results that fell short of expectations.
7
Holdings that hurt the fund’s result include Wyeth (prescription and nonprescription drugs), Cardinal Health (wholesale provider of drugs and delivery support systems), and Citigroup (diversified financial services). In addition, a mild overexposure in the tech sector and an underexposure to basic materials stocks hindered performance relative to the S&P 500 Index’s return.
OUR POSITIONING
We will remain focused on our investment discipline as it applies to stock selection, portfolio construction, and implementation, and we believe that the Growth and Income Fund is well positioned to achieve its goal of outperforming the S&P 500 Index while maintaining a similar level of investment risk. The fund will stay fully invested in those stocks we consider most undervalued, and we will continue to minimize its exposure to risk characteristics we believe are unrewarded. In our view, the Growth and Income Fund is an excellent choice for those seeking a diversified exposure to large-cap U.S. equities.
John S. Cone, CFA, PRESIDENT AND CHIEF EXECUTIVE OFFICERFRANKLIN PORTFOLIO ASSOCIATES, LLC
OCTOBER 18, 2004
8
FUND PROFILE As of 9/30/2004
This Profile provides a snapshot of the fund’s characteristics, compared where indicated with both an appropriate market index and a broad market index. Key terms are defined on page 10.
| GROWTH AND INCOME FUND | |||
|---|---|---|---|
| Portfolio Characteristics | |||
| Fund | Comparative Index* | Broad Index** | |
| Number of Stocks | 117 | 500 | 5,018 |
| Median Market Cap | $46.0B | $48.0B | $25.7B |
| Price/Earnings Ratio | 16.0x | 19.0x | 21.5x |
| Price/Book Ratio | 2.7x | 2.9x | 2.7x |
| Yield | 1.8% | 1.6% | |
| Investor Shares | 1.4% | ||
| Admiral Shares | 1.5% | ||
| Return on Equity | 21.1% | 20.6% | 15.9% |
| Earnings Growth Rate | 11.7% | 9.6% | 7.4% |
| Foreign Holdings | 0.0% | 0.0% | 0.8% |
| Turnover Rate | 79%† | -- | -- |
| Expense Ratio | -- | -- | |
| Investor Shares | 0.42% | ||
| Admiral Shares | 0.25% | ||
| Short-Term Reserves | 0% | -- | -- |
| Volatility Measures | Fund | Comparative Index* | Fund | Broad Index** |
|---|---|---|---|---|
| R-Squared | 0.99 | 1.00 | 0.98 | 1.00 |
| Beta | 0.95 | 1.00 | 0.96 | 1.00 |
| Sector Diversification (% of portfolio) | Fund | Comparative Index* | Broad Index** |
|---|---|---|---|
| Auto & Transportation | 4% | 3% | 3% |
| Consumer Discretionary | 17 | 14 | 16 |
| Consumer Staples | 5 | 7 | 6 |
| Financial Services | 22 | 22 | 23 |
| Health Care | 13 | 13 | 12 |
| Integrated Oils | 8 | 5 | 4 |
| Other Energy | 1 | 2 | 3 |
| Materials & Processing | 3 | 4 | 4 |
| Producer Durables | 5 | 4 | 5 |
| Technology | 16 | 14 | 13 |
| Utilities | 4 | 7 | 7 |
| Other | 2 | 5 | 4 |
**Dow Jones Wilshire 5000 Index.
† Excludes the value of portfolio securities received or delivered as a result of in-kind purchases or redemptions of the fund’s capital shares.
| Ten Largest Holdings (% of total net assets) | |
|---|---|
| ExxonMobil Corp. | 4.7% |
| (oil) | |
| Johnson & Johnson | 3.2 |
| (pharmaceuticals) | |
| Citigroup, Inc. | 3.1 |
| (banking) | |
| International Business Machines Corp. | 3.0 |
| (computer services) | |
| Wells Fargo & Co. | 2.6 |
| (banking) | |
| Home Depot, Inc. | 2.5 |
| (retail) | |
| Bank of America Corp. | 2.1 |
| (banking) | |
| ChevronTexaco Corp. | 2.0 |
| (energy and utilities) | |
| The Walt Disney Co. | 1.9 |
| (media) | |
| Kimberly-Clark Corp. | 1.9 |
| (consumer products manufacturers) | |
| Top Ten | 27.0% |
“Ten Largest Holdings” excludes any temporary cash investments and equity index products.
Investment Focus

Visit our website at Vanguard.com for regularly updated fund information.
9
GLOSSARY OF INVESTMENT TERMS
Beta. A measure of the magnitude of a fund’s past share-price fluctuations in relation to the ups and downs of a given market index. The index is assigned a beta of 1.00. Compared with a given index, a fund with a beta of 1.20 typically would have seen its share price rise or fall by 12% when the index rose or fell by 10%. A fund’s beta should be reviewed in conjunction with its R-squared (see definition below). The lower the R-squared, the less correlation there is between the fund and the index, and the less reliable beta is as an indicator of volatility.
Earnings Growth Rate. The average annual rate of growth in earnings over the past five years for the stocks now in a fund.
Expense Ratio. The percentage of a fund’s average net assets used to pay its annual administrative and advisory expenses. These expenses directly reduce returns to investors.
Foreign Holdings. The percentage of a fund’s equity assets represented by stocks or depositary receipts of companies based outside the United States.
Median Market Cap. An indicator of the size of companies in which a fund invests; the midpoint of market capitalization (market price x shares outstanding) of a fund’s stocks, weighted by the proportion of the fund’s assets invested in each stock. Stocks representing half of the fund’s assets have market capitalizations above the median, and the rest are below it.
Price/Book Ratio. The share price of a stock divided by its net worth, or book value, per share. For a fund, the weighted average price/book ratio of the stocks it holds.
Price/Earnings Ratio. The ratio of a stock’s current price to its per-share earnings over the past year. For a fund, the weighted average P/E of the stocks it holds. P/E is an indicator of market expectations about corporate prospects; the higher the P/E, the greater the expectations for a company’s future growth.
R-Squared. A measure of how much of a fund’s past returns can be explained by the returns from the market in general, as measured by a given index. If a fund’s total returns were precisely synchronized with an index’s returns, its R-squared would be 1.00. If the fund’s returns bore no relationship to the index’s returns, its R-squared would be 0.
Return on Equity. The annual average rate of return generated by a company during the past five years for each dollar of shareholder’s equity (net income divided by shareholder’s equity). For a fund, the weighted average return on equity for the companies whose stocks it holds.
Short-Term Reserves. The percentage of a fund invested in highly liquid, short-term securities that can be readily converted to cash.
Turnover Rate. An indication of the fund’s trading activity. Funds with high turnover rates incur higher transaction costs and may be more likely to distribute capital gains (which may be taxable to investors).
Yield. A snapshot of a fund’s income from interest and dividends. The yield, expressed as a percentage of the fund’s net asset value, is based on income earned over the past 30 days and is annualized, or projected forward for the coming year. The index yield is based on the current annualized rate of income provided by securities in the index.
10
PERFORMANCE SUMMARY As of 9/30/2004
All of the returns in this report represent past performance, which is not a guarantee of future results that may be achieved by the fund. (For performance data current to the most recent month-end, which may be higher or lower than that cited, visit our website at www.vanguard.com.) Note, too, that both investment returns and principal value can fluctuate widely, so an investor’s shares, when sold, could be worth more or less than their original cost. The returns shown do not reflect taxes that a shareholder would pay on fund distributions or on the sale of fund shares.
GROWTH AND INCOME FUND
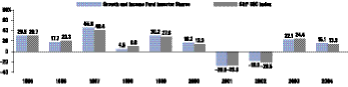
Cumulative Performance September 30, 1994–September 30, 2004

| Average Annual Total Returns Periods Ended September 30, 2004 | ||||
|---|---|---|---|---|
| One Year | Five Years | Ten Years | Final Value of a $10,000 Investment | |
| Growth and Income Fund Investor Shares | 15.12% | -0.43% | 11.49% | $29,662 |
| Dow Jones Wilshire 5000 Index | 14.76 | -0.05 | 10.73 | 27,722 |
| S&P 500 Index | 13.87 | -1.31 | 11.08 | 28,612 |
| Average Large-Cap Core Fund* | 10.19 | -1.95 | 9.21 | 24,123 |
| One Year | Since Inception** | Final Value of a $250,000 Investment | |
|---|---|---|---|
| Growth and Income Fund Admiral Shares | 15.29% | -0.94% | $242,174 |
| Dow Jones Wilshire 5000 Index | 14.76 | -0.07 | 249,433 |
| S&P 500 Index | 13.87 | -1.70 | 235,892 |
Fiscal-Year Total Returns (%) September 30, 1994–September 30, 2004
*Derived from data provided by Lipper Inc.
**May 14, 2001.
Note: See Financial Highlights tables on pages 20 and 21 for dividend and capital gains information.
11
YOUR FUND’S AFTER-TAX RETURNS
This table presents returns for your fund both before and after taxes. The after-tax returns are shown in two ways: (1) assuming that an investor owned the fund during the entire period and paid taxes on the fund’s distributions, and (2) assuming that an investor paid taxes on the fund’s distributions and sold all shares at the end of each period.
Calculations are based on the highest individual federal income tax and capital gains tax rates in effect at the times of the distributions and the hypothetical sales. State and local taxes were not considered. After-tax returns reflect the reduced tax rates on ordinary income (including qualified dividend income) and short-term capital gains that became effective as of January 1, 2003, and on long-term capital gains realized on or after May 6, 2003. To calculate qualified dividend income, we used actual 2003 figures and estimates for 2004. (In the example, returns after the sale of fund shares may be higher than those assuming no sale. This occurs when the sale would have produced a capital loss. The calculation assumes that the investor received a tax deduction for the loss.)
The table shows returns for Investor Shares only; returns for other share classes will differ. Please note that your actual after-tax returns will depend on your tax situation and may differ from those shown. Also note that if you own the fund in a tax-deferred account, such as an individual retirement account or a 401(k) plan, this information does not apply to you. Such accounts are not subject to current taxes.
Finally, keep in mind that a fund’s performance—whether before or after taxes—does not guarantee future results.
| Average Annual Total Returns | Periods Ended September 30, 2004 | ||
|---|---|---|---|
| One Year | Five Years | Ten Years | |
| Growth and Income Fund Investor Shares | |||
| Returns Before Taxes | 15.12% | -0.43% | 11.49% |
| Returns After Taxes on Distributions | 14.90 | -1.16 | 9.83 |
| Returns After Taxes on Distributions and Sale of Fund Shares | 10.11 | -0.67 | 9.27 |
12
ABOUT YOUR FUND’S EXPENSES
We believe it is important for you to understand the impact of costs on your investment. All mutual funds have operating expenses. As a shareholder of the fund, you incur ongoing costs, which include costs for portfolio management, administrative services, and shareholder reports (like this one), among others. Operating expenses, which are deducted from a fund’s gross income, directly reduce the investment return of the fund.
A fund’s expenses are expressed as a percentage of its average net assets. This figure is known as the expense ratio. The following examples are intended to help you understand the ongoing costs (in dollars) of investing in your fund and to compare these costs with those of other mutual funds. The examples are based on an investment of $1,000 made at the beginning of the period shown and held for the entire period.
The table below illustrates your fund’s costs in two ways:
| o | Based on actual fund return. This section helps you to estimate the actual expenses that you paid over the period. The “Ending Account Value” shown is derived from the fund’s actual return, and the third column shows the dollar amount that would have been paid by an investor who started with $1,000 in the fund. You may use the information here, together with the amount you invested, to estimate the expenses that you paid over the period. To do so, simply divide your account value by $1,000 (for example, an $8,600 account value divided by $1,000 = 8.6), then multiply the result by the number given for your fund under the heading “Expenses Paid During Period.” |
| o | Based on hypothetical 5% return. This section is intended to help you compare your fund’s costs with those of other mutual funds. It assumes that the fund had a yearly return of 5% before expenses, but that the expense ratio is unchanged. In this case—because the return used is not the fund’s actual return—the results do not apply to your investment. The example is useful in making comparisons because the Securities and Exchange Commission requires all mutual funds to calculate expenses based on a 5% return. You can assess your fund’s costs by comparing this hypothetical example with the hypothetical examples that appear in shareholder reports of other funds. |
| Six Months Ended September 30, 2004 | |||
|---|---|---|---|
| Growth and Income Fund | Beginning Account Value 3/31/2004 | Ending Account Value 9/30/2004 | Expenses Paid During Period* |
| Based on Actual Fund Return | |||
| Investor Shares | $1,000.00 | $997.85 | $2.00 |
| Admiral Shares | 1,000.00 | 998.53 | 1.25 |
| Based on Hypothetical 5% Yearly Return | |||
| Investor Shares | $1,000.00 | $1,023.00 | $2.02 |
| Admiral Shares | 1,000.00 | 1,023.75 | 1.26 |
*These calculations are based on expenses incurred in the most recent six-month period. The fund’s annualized six-month expense ratios for that period are 0.40% for Investor Shares and 0.25% for Admiral Shares. The dollar amounts shown as “Expenses Paid” are equal to the annualized expense ratio multiplied by the average account value over the period, multiplied by the number of days in the most recent six-month period, then divided by the number of days in the most recent 12-month period.
13
| Expense Ratios: Your fund compared with its peer group | Investor Shares | Admiral Shares | Average Large-Cap Core Fund |
|---|---|---|---|
| Growth and Income Fund | 0.42% | 0.25% | 1.44%* |
*Peer-group expense ratio is derived from data provided by Lipper Inc. and captures information through year-end 2003.
Note that the expenses shown in the table on page 13 are meant to highlight and help you compare ongoing costs only and do not reflect any transactional costs or account maintenance fees. They do not include your fund’s low-balance fee, which is described in the prospectus. If this fee were applied to your account, your costs would be higher. Your fund does not charge transaction fees, such as purchase or redemption fees, nor does it carry a “sales load.”
The calculations assume no shares were bought or sold during the period. Your actual costs may have been higher or lower, depending on the amount of your investment and the timing of any purchases or redemptions.
You can find more information about the fund’s expenses, including annual expense ratios, in the Financial Statements section of this report. For additional information on operating expenses and other shareholder costs, please refer to the appropriate fund prospectus.
14
FINANCIAL STATEMENTS As of 9/30/2004
STATEMENT OF NET ASSETS
This Statement provides a detailed list of the fund’s holdings, including each security’s market value on the last day of the reporting period. Securities are grouped and subtotaled by asset type (common stocks, bonds, etc.) and by industry sector. Other assets are added to, and liabilities are subtracted from, the value of Total Investments to calculate the fund’s Net Assets. Finally, Net Assets are divided by the outstanding shares of the fund to arrive at its share price, or Net Asset Value (NAV) Per Share.
At the end of the Statement of Net Assets, you will find a table displaying the composition of the fund’s net assets. Because all income and any realized gains must be distributed to shareholders each year, the bulk of net assets consists of Paid-in Capital (money invested by shareholders). The amounts shown for Undistributed Net Investment Income and Accumulated Net Realized Gains usually approximate the sums the fund had available to distribute to shareholders as income dividends or capital gains as of the statement date, but may differ because certain investments or transactions may be treated differently for financial statement and tax purposes. Any Accumulated Net Realized Losses, and any cumulative excess of distributions over net income or net realized gains, will appear as negative balances. Unrealized Appreciation (Depreciation) is the difference between the market value of the fund’s investments and their cost, and reflects the gains (losses) that would be realized if the fund were to sell all of its investments at their statement-date values.
The fund provides a complete list of its holdings four times in each fiscal year, at the quarter-ends. For the second and fourth quarters, the lists appear in the fund’s semiannual and annual reports to shareholders. For the first and third quarters, the fund files the lists with the Securities and Exchange Commission on Form N-Q. Shareholders can look up the fund’s Forms N-Q on the SEC’s website at www.sec.gov. Forms N-Q may also be reviewed and copied at the SEC’s Public Reference Room (see the back cover of this report for further information).
| Growth and Income Fund | Shares | Market Value^ (000) |
|---|---|---|
| COMMON STOCKS (98.7%)(1) | | |
| Auto & Transportation (3.6%) | ||
| Harley-Davidson, Inc. | 1,768,200 | $105,102 |
| United Parcel Service, Inc. | 1,363,500 | 103,517 |
| Burlington Northern | ||
| Santa Fe Corp. | 520,000 | 19,921 |
| General Motors Corp. | 140,700 | 5,977 |
| Ford Motor Co. | 174,700 | 2,455 |
| 236,972 | ||
| Consumer Discretionary (17.4%) | ||
| Home Depot, Inc. | 4,213,900 | 165,185 |
| The Walt Disney Co. | 5,678,700 | 128,055 |
| Kimberly-Clark Corp. | 1,911,400 | 123,457 |
| Cendant Corp. | 5,382,000 | 116,251 |
| Black & Decker Corp. | 1,344,200 | 104,095 |
| Waste Management, Inc. | 2,238,800 | 61,209 |
| Wal-Mart Stores, Inc. | 1,150,400 | 61,201 |
| Federated Department | ||
| Stores, Inc. | 1,320,300 | 59,981 |
| Clear Channel | ||
| Communications, Inc. | 1,672,600 | 52,135 |
| Limited Brands, Inc. | 2,127,800 | 47,429 |
| *Yahoo! Inc. | 1,385,100 | 46,969 |
| The Gap, Inc. | 2,470,800 | 46,204 |
| *Time Warner, Inc. | 2,468,400 | 39,840 |
| Viacom Inc. Class B | 785,167 | 26,350 |
| McDonald's Corp. | 849,500 | 23,811 |
| Staples, Inc. | 588,100 | 17,537 |
| Sabre Holdings Corp. | 610,300 | 14,971 |
| Costco Wholesale Corp. | 346,100 | 14,384 |
| 1,149,064 | ||
| Consumer Staples (4.6%) | ||
| The Procter & Gamble Co. | 1,584,600 | 85,759 |
| Sara Lee Corp. | 2,457,200 | 56,172 |
| The Coca-Cola Co. | 1,343,900 | 53,823 |
| Altria Group, Inc. | 1,040,306 | 48,936 |
| The Pepsi Bottling Group, Inc. | 1,768,700 | 48,020 |
| Albertson's, Inc. | 524,500 | 12,551 |
| 305,261 | ||
15
| Growth and Income Fund | Shares | Market Value^ (000) |
|---|---|---|
| Financial Services (22.1%) | ||
| Banks--New York City (0.3%) | ||
| JPMorgan Chase & Co. | 456,000 | $18,117 |
| Banks--Outside New York City (7.8%) | ||
| Wells Fargo & Co. | 2,865,200 | 170,852 |
| Bank of America Corp. | 3,168,560 | 137,294 |
| PNC Financial Services Group | 1,970,800 | 106,620 |
| SunTrust Banks, Inc. | 1,197,200 | 84,295 |
| SouthTrust Corp. | 395,000 | 16,456 |
| Diversified Financial Services (5.1%) | ||
| Citigroup, Inc. | 4,629,500 | 204,253 |
| The Goldman Sachs Group, Inc. | 1,003,000 | 93,520 |
| Morgan Stanley | 770,800 | 38,000 |
| Finance Companies (0.4%) | ||
| Capital One Financial Corp. | 352,900 | 26,079 |
| Financial Miscellaneous (1.2%) | ||
| MBNA Corp. | 2,715,800 | 68,438 |
| MBIA, Inc. | 136,400 | 7,940 |
| *Providian Financial Corp. | 233,200 | 3,624 |
| Insurance--Life (0.7%) | ||
| Jefferson-Pilot Corp. | 899,300 | 44,659 |
| Insurance--Multiline (4.6%) | ||
| Allstate Corp. | 2,474,500 | 118,751 |
| American International | ||
| Group, Inc. | 1,638,058 | 111,372 |
| Lincoln National Corp. | 882,200 | 41,463 |
| Cincinnati Financial Corp. | 828,865 | 34,166 |
| Insurance--Property-Casualty (0.4%) | ||
| Progressive Corp. of Ohio | 302,699 | 25,654 |
| ACE Ltd. | 76,900 | 3,081 |
| Securities Brokers & Services (1.6%) | ||
| Countrywide Financial Corp. | 2,064,200 | 81,309 |
| Lehman Brothers Holdings, Inc. | 343,800 | 27,408 |
| 1,463,351 | ||
| Health Care (12.6%) | ||
| Johnson & Johnson | 3,762,100 | 211,919 |
| Pfizer Inc. | 3,838,427 | 117,456 |
| Becton, Dickinson & Co. | 1,796,600 | 92,884 |
| * Amgen, Inc. | 1,624,600 | 92,082 |
| Abbott Laboratories | 2,087,600 | 88,431 |
| Bristol-Myers Squibb Co. | 2,330,000 | 55,151 |
| Cardinal Health, Inc. | 1,152,000 | 50,423 |
| AmerisourceBergen Corp. | 934,800 | 50,208 |
| Merck & Co., Inc. | 1,213,300 | 40,039 |
| Aetna Inc. | 119,500 | 11,942 |
| UnitedHealth Group Inc. | 157,800 | 11,636 |
| * Forest Laboratories, Inc. | 117,400 | 5,281 |
| * Express Scripts Inc. | 60,900 | 3,979 |
| HCA Inc. | 67,300 | 2,567 |
| Manor Care, Inc. | 28,400 | 851 |
| 834,849 | ||
| Integrated Oils (7.8%) | ||
| ExxonMobil Corp. | 6,414,936 | 310,034 |
| ChevronTexaco Corp. | 2,461,400 | 132,029 |
| ConocoPhillips Co. | 890,300 | 73,761 |
| 515,824 | ||
| Other Energy (0.6%) | ||
| Anadarko Petroleum Corp. | 616,000 | 40,878 |
| Valero Energy Corp. | 8,400 | 674 |
| 41,552 | ||
| Materials & Processing (3.4%) | ||
| Louisiana-Pacific Corp. | 2,486,700 | 64,530 |
| Archer-Daniels-Midland Co. | 2,428,600 | 41,238 |
| Sigma-Aldrich Corp. | 710,300 | 41,197 |
| Phelps Dodge Corp. | 349,300 | 32,146 |
| Worthington Industries, Inc. | 681,300 | 14,546 |
| Masco Corp. | 263,000 | 9,081 |
| Rohm & Haas Co. | 162,300 | 6,974 |
| Georgia Pacific Group | 191,900 | 6,899 |
| PPG Industries, Inc. | 41,800 | 2,562 |
| Dow Chemical Co. | 56,300 | 2,544 |
| Ball Corp. | 35,900 | 1,344 |
| 223,061 | ||
| Producer Durables (5.2%) | ||
| Deere & Co. | 1,533,700 | 99,000 |
| *Lexmark International, Inc. | 993,000 | 83,422 |
| Centex Corp. | 1,303,400 | 65,770 |
| Danaher Corp. | 761,000 | 39,024 |
| Northrop Grumman Corp. | 360,700 | 19,236 |
| United Technologies Corp. | 170,400 | 15,912 |
| KB HOME | 140,300 | 11,854 |
| Tektronix, Inc. | 246,400 | 8,193 |
| The Boeing Co. | 98,800 | 5,100 |
| 347,511 | ||
| Technology (15.4%) | ||
| International Business | ||
| Machines Corp. | 2,287,300 | 196,113 |
| QUALCOMM Inc. | 3,127,800 | 122,109 |
| Intel Corp. | 6,019,500 | 120,751 |
| General Dynamics Corp. | 1,139,200 | 116,312 |
| *EMC Corp. | 7,807,100 | 90,094 |
| *Symantec Corp. | 1,544,900 | 84,784 |
16
| Shares | Market Value^ (000) | |
|---|---|---|
| Microsoft Corp. | 2,975,126 | $82,262 |
| Motorola, Inc. | 3,963,031 | 71,493 |
| Maxim Integrated Products, Inc. | 853,600 | 36,099 |
| *Cisco Systems, Inc. | 1,340,100 | 24,256 |
| *NCR Corp. | 484,500 | 24,026 |
| *Computer Sciences Corp. | 384,400 | 18,105 |
| Xilinx, Inc. | 499,700 | 13,492 |
| Applera Corp.-Applied | ||
| Biosystems Group | 578,600 | 10,918 |
| *Veritas Software Corp. | 204,800 | 3,645 |
| Adobe Systems, Inc. | 67,700 | 3,349 |
| PerkinElmer, Inc. | 105,000 | 1,808 |
| *Corning, Inc. | 149,800 | 1,660 |
| 1,021,276 | ||
| Utilities (4.3%) | ||
| BellSouth Corp. | 3,558,600 | 96,509 |
| Edison International | 2,427,800 | 64,361 |
| *PG&E Corp. | 1,075,200 | 32,686 |
| AT&T Corp. | 2,195,000 | 31,432 |
| ALLTEL Corp. | 459,300 | 25,220 |
| *Nextel Communications, Inc. | 660,100 | 15,737 |
| Constellation Energy Group, Inc. | 390,000 | 15,538 |
| 281,483 | ||
| Other (1.7%) | ||
| General Electric Co. | 3,369,600 | 113,151 |
| TOTAL COMMON STOCKS | ||
| (Cost $5,637,890) | 6,533,355 | |
| TEMPORARY CASH INVESTMENTS (1.4%)(1) | ||
| Money Market Fund (1.3%) | ||
| Vanguard Market | ||
| Liquidity Fund | ||
| 1.74%** | 89,515,351 | 89,515 |
| Face Amount (000) | ||
|---|---|---|
| U.S. Government Obligation (0.1%) | ||
| U.S. Treasury Bill | ||
| (2)1.62%, 12/16/2004 | $4,905 | 4,889 |
| TOTAL TEMPORARY CASH INVESTMENTS | ||
| (Cost $94,404) | 94,404 | |
| TOTAL INVESTMENTS (100.1%) | ||
| (Cost $5,732,294) | 6,627,759 |
| Market Value^ (000) | |
|---|---|
| OTHER ASSETS AND LIABILITIES (-0.1%) | |
| Receivables for Investment Securities Sold | $161,462 |
| Other Assets--Note C | 12,521 |
| Payables for Investment Securities Purchased | (157,932) |
| Other Liabilities | (20,749) |
| | (4,698) |
| NET ASSETS (100%) | $6,623,061 |
^ See Note A in Notes to Financial Statements.
*Non-income-producing security.
**Money market fund available only Vanguard funds and certain trusts and accounts managed by Vanguard. Rate shown is the 7-day yield.
(1)The fund invests a portion of its cash reserves in equity markets through the use of index futures contracts. After giving effect to futures investments, the fund’s effective common stock and temporary cash investment positions represents 99.9% and 0.2%, respectively, of net assets. See Note E in Notes to Financial Statements.
(2)Security segregated as initial margin for open futures contracts.
AT SEPTEMBER 30, 2004, NET ASSETS CONSISTED OF:
| Amount (000) | |
|---|---|
| Paid-in Capital | $6,946,634 |
| Undistributed Net Investment Income | 15,980 |
| Accumulated Net Realized Losses | (1,234,130) |
| Unrealized Appreciation (Depreciation) | |
| Investment Securities | 895,465 |
| Futures Contracts | (888) |
| NET ASSETS | $6,623,061 |
| Investor Shares---Net Assets | |
| Applicable to 204,177,301 outstanding $.001 | |
| par value shares of beneficial interest | |
| (unlimited authorization) | $5,779,771 |
| NET ASSET VALUE PER SHARE-- | |
| INVESTOR SHARES | $28.31 |
| Admiral Shares--Net Assets | |
| Applicable to 18,233,640 outstanding $.001 | |
| par value shares of beneficial interest | |
| (unlimited authorization) | $843,290 |
| NET ASSET VALUE PER SHARE-- | |
| ADMIRAL SHARES | $46.25 |
See Note E in Notes to Financial Statements for the tax-basis components of net assets.
17
STATEMENT OF OPERATIONS
This Statement shows the types of income earned by the fund during the reporting period, and details the operating expenses charged to each class of its shares. These expenses directly reduce the amount of investment income available to pay to shareholders as income dividends. This Statement also shows any Net Gain (Loss) realized on the sale of investments, and the increase or decrease in the Unrealized Appreciation (Depreciation) of investments during the period.
| Growth and Income Fund Year Ended September 30, 2004 (000) | |
|---|---|
| INVESTMENT INCOME | |
| Income | |
| Dividends | $112,388 |
| Interest | 1,165 |
| Security Lending | 4 |
| Total Income | 113,557 |
| Expenses | |
| Investment Advisory Fees--Note B | |
| Basic Fee | 5,841 |
| Performance Adjustment | 434 |
| The Vanguard Group--Note C | |
| Management and Administrative | |
| Investor Shares | 16,909 |
| Admiral Shares | 1,335 |
| Marketing and Distribution | |
| Investor Shares | 706 |
| Admiral Shares | 111 |
| Custodian Fees | 62 |
| Auditing Fees | 18 |
| Shareholders' Reports | |
| Investor Shares | 169 |
| Admiral Shares | 1 |
| Trustees' Fees and Expenses | 7 |
| Total Expenses | 25,593 |
| Expenses Paid Indirectly--Note D | (1,561) |
| Net Expenses | 24,032 |
| NET INVESTMENT INCOME | 89,525 |
| REALIZED NET GAIN (LOSS) | |
| Investment Securities Sold | 678,218 |
| Futures Contracts | 8,584 |
| REALIZED NET GAIN (LOSS) | 686,802 |
| CHANGE IN UNREALIZED APPRECIATION (DEPRECIATION) | |
| Investment Securities | 114,528 |
| Futures Contracts | 648 |
| CHANGE IN UNREALIZED APPRECIATION (DEPRECIATION) | 115,176 |
| NET INCREASE (DECREASE) IN NET ASSETS RESULTING FROM OPERATIONS | $891,503 |
18
STATEMENT OF CHANGES IN NET ASSETS
This Statement shows how the fund’s total net assets changed during the two most recent reporting periods. The Operations section summarizes information detailed in the Statement of Operations. The amounts shown as Distributions to shareholders from the fund’s net income and capital gains may not match the amounts shown in the Operations section, because distributions are determined on a tax basis and may be made in a period different from the one in which the income was earned or the gains were realized on the financial statements. The Capital Share Transactions section shows the net amount shareholders invested in or redeemed from the fund. Distributions and Capital Share Transactions are shown separately for each class of shares.
| Growth and Income Fund | ||
|---|---|---|
| Year Ended September 30, | ||
| 2004 (000) | 2003 (000) | |
| INCREASE (DECREASE) IN NET ASSETS | ||
| Operations | ||
| Net Investment Income | $89,525 | $76,221 |
| Realized Net Gain (Loss) | 686,802 | (279,162) |
| Change in Unrealized Appreciation (Depreciation) | 115,176 | 1,273,164 |
| Net Increase (Decrease) in Net Assets Resulting from Operations | 891,503 | 1,070,223 |
| Distributions | ||
| Net Investment Income | ||
| Investor Shares | (72,761) | (64,832) |
| Admiral Shares | (13,705) | (10,759) |
| Realized Capital Gain | ||
| Investor Shares | -- | -- |
| Admiral Shares | -- | -- |
| Total Distributions | (86,466) | (75,591) |
| Capital Share Transactions--Note G | ||
| Investor Shares | (37,027) | (82,511) |
| Admiral Shares | (76,684) | 75,504 |
| Net Increase (Decrease) from Capital Share Transactions | (113,711) | (7,007) |
| Total Increase (Decrease) | 691,326 | 987,625 |
| Net Assets | ||
| Beginning of Period | 5,931,735 | 4,944,110 |
| End of Period | $6,623,061 | $5,931,735 |
19
FINANCIAL HIGHLIGHTS
This table summarizes the fund’s investment results and distributions to shareholders on a per-share basis for each class of shares. It also presents the Total Return and shows net investment income and expenses as percentages of average net assets. These data will help you assess: the variability of the fund’s net income and total returns from year to year; the relative contributions of net income and capital gains to the fund’s total return; how much it costs to operate the fund; and the extent to which the fund tends to distribute capital gains. The table also shows the Portfolio Turnover Rate, a measure of trading activity. A turnover rate of 100% means that the average security is held in the fund for one year.
Growth and Income Fund Investor Shares
| Year Ended September 30, | Year Ended December 31, | |||||
|---|---|---|---|---|---|---|
| For a Share Outstanding Throughout Each Period | 2004 | 2003 | 2002 | Jan.1 to Sept. 30, 2001* | 2000 | 1999 |
| Net Asset Value, Beginning of Period | $24.91 | $20.68 | $25.50 | $32.06 | $37.08 | $30.76 |
| Investment Operations | ||||||
| Net Investment Income | .37 | .318 | .27 | .22 | .35 | .33 |
| Net Realized and Unrealized Gain (Loss) | ||||||
| on Investments | 3.39 | 4.227 | (4.81) | (6.63) | (3.55) | 7.60 |
| Total from Investment Operations | 3.76 | 4.545 | (4.54) | (6.41) | (3.20) | 7.93 |
| Distributions | ||||||
| Dividends from Net Investment Income | (.36) | (.315) | (.28) | (.15) | (.35) | (.33) |
| Distributions from Realized Capital Gains | -- | -- | -- | -- | (1.47) | (1.28) |
| Total Distributions | (.36) | (.315) | (.28) | (.15) | (1.82) | (1.61) |
| Net Asset Value, End of Period | $28.31 | $24.91 | $20.68 | $25.50 | $32.06 | $37.08 |
| Total Return | 15.12% | 22.09% | -18.04% | -20.06% | -8.97% | 26.04% |
| Ratios/Supplemental Data | ||||||
| Net Assets, End of Period (Millions) | $5,780 | $5,119 | $4,338 | $6,382 | $8,968 | $8,816 |
| Ratio of Total Expenses to | ||||||
| Average Net Assets† | 0.42% | 0.46% | 0.45% | 0.40%** | 0.38% | 0.37% |
| Ratio of Net Investment Income to | ||||||
| Average Net Assets | 1.35% | 1.39% | 1.02% | 0.95%** | 1.02% | 1.04% |
| Portfolio Turnover Rate†† | 79% | 88% | 70% | 41% | 65% | 54% |
* The fund’s fiscal year-end changed from December 31 to September 30, effective September 30, 2001.
** Annualized.
† Includes performance-based investment advisory fee increases (decreases) of 0.01%, 0.00%, 0.03%, 0.01%, 0.01%, and (0.01%).
†† Excludes the value of portfolio securities received or delivered as a result of in-kind purchases or redemptions of the fund’s capital shares.
20
| Growth and Income Fund Admiral Shares | ||||
|---|---|---|---|---|
| Year Ended September 30, | ||||
| For a Share Outstanding Throughout Each Period | 2004 | 2003 | 2002 | May14* to Sept. 30, 2001** |
| Net Asset Value, Beginning of Period | $40.70 | $33.78 | $41.66 | $50.00 |
| Investment Operations | ||||
| Net Investment Income | .683 | .567 | .505 | .20 |
| Net Realized and Unrealized Gain (Loss) on Investments | 5.530 | 6.920 | (7.877) | (8.29) |
| Total from Investment Operations | 6.213 | 7.487 | (7.372) | (8.09) |
| Distributions | ||||
| Dividends from Net Investment Income | (.663) | (.567) | (.508) | (.25) |
| Distributions from Realized Capital Gains | -- | -- | -- | -- |
| Total Distributions | (.663) | (.567) | (.508) | (.25) |
| Net Asset Value, End of Period | $46.25 | $40.70 | $33.78 | $41.66 |
| Total Return | 15.29% | 22.29% | -17.95% | -16.26% |
| Ratios/Supplemental Data | ||||
| Net Assets, End of Period (Millions) | $843 | $812 | $606 | $490 |
| Ratio of Total Expenses to Average Net Assets†† | 0.25% | 0.31% | 0.34% | 0.35%† |
| Ratio of Net Investment Income to Average Net Assets | 1.51% | 1.54% | 1.17% | 1.04%† |
| Portfolio Turnover Rate‡ | 79% | 88% | 70% | 41% |
*Inception.
**The fund's fiscal year-end changed from December 31 to September 30, effective September 30, 2001.
†Annualized.
†† Includes performance-based investment advisory fee increases (decreases) of 0.01%, 0.00%, 0.03%, and 0.01%.
‡Excludes the value of portfolio securities received or delivered as a result of in-kind purchases or redemptions of the fund’s capital shares.
SEE ACCOMPANYING NOTES, WHICH ARE AN INTEGRAL PART OF THE fiNANCIAL STATEMENTS.
21
NOTES TO FINANCIAL STATEMENTS
Vanguard Growth and Income Fund is registered under the Investment Company Act of 1940 as an open-end investment company, or mutual fund. The fund offers two classes of shares, Investor Shares and Admiral Shares. Investor Shares are available to any investor who meets the fund’s minimum purchase requirements. Admiral Shares are designed for investors who meet certain administrative, servicing, tenure, and account-size criteria.
A. The following significant accounting policies conform to generally accepted accounting principles for U.S. mutual funds. The fund consistently follows such policies in preparing its financial statements.
1. Security Valuation: Securities are valued as of the close of trading on the New York Stock Exchange (generally 4:00 p.m. Eastern time) on the valuation date. Equity securities are valued at the latest quoted sales prices or official closing prices taken from the primary market in which each security trades; such securities not traded on the valuation date are valued at the mean of the latest quoted bid and asked prices. Securities for which market quotations are not readily available, or whose values have been materially affected by events occurring before the fund’s pricing time but after the close of the securities’ primary markets, are valued by methods deemed by the board of trustees to represent fair value. Investments in Vanguard® Market Liquidity Fund are valued at that fund’s net asset value. Temporary cash investments acquired over 60 days to maturity are valued using the latest bid prices or using valuations based on a matrix system (which considers such factors as security prices, yields, maturities, and ratings), both as furnished by independent pricing services. Other temporary cash investments are valued at amortized cost, which approximates market value.
2. Futures Contracts: The fund uses S&P 500 Index futures contracts to a limited extent, with the objective of maintaining full exposure to the stock market while maintaining liquidity. The fund may purchase or sell futures contracts to achieve a desired level of investment, whether to accommodate portfolio turnover or cash flows from capital share transactions. The primary risks associated with the use of futures contracts are imperfect correlation between changes in market values of stocks held by the fund and the prices of futures contracts, and the possibility of an illiquid market.
Futures contracts are valued at their quoted daily settlement prices. The aggregate principal amounts of the contracts are not recorded in the financial statements. Fluctuations in the value of the contracts are recorded in the Statement of Net Assets as an asset (liability) and in the Statement of Operations as unrealized appreciation (depreciation) until the contracts are closed, when they are recorded as realized futures gains (losses).
3. Repurchase Agreements: The fund, along with other members of The Vanguard Group, may transfer uninvested cash balances into a pooled cash account, which is invested in repurchase agreements secured by U.S. government and agency securities. Securities pledged as collateral for repurchase agreements are held by a custodian bank until the agreements mature. Each agreement requires that the market value of the collateral be sufficient to cover payments of interest and principal; however, in the event of default or bankruptcy by the other party to the agreement, retention of the collateral may be subject to legal proceedings.
4. Federal Income Taxes: The fund intends to continue to qualify as a regulated investment company and distribute all of its taxable income. Accordingly, no provision for federal income taxes is required in the financial statements.
5. Distributions: Distributions to shareholders are recorded on the ex-dividend date.
22
6. Other: Dividend income is recorded on the ex-dividend date. Interest income includes income distributions received from Vanguard Market Liquidity Fund and is accrued daily. Security transactions are accounted for on the date securities are bought or sold. Costs used to determine realized gains (losses) on the sale of investment securities are those of the specific securities sold.
Each class of shares has equal rights as to assets and earnings, except that each class separately bears certain class-specific expenses related to maintenance of shareholder accounts (included in Management and Administrative expenses) and shareholder reporting. Marketing and distribution expenses are allocated to each class of shares based on a method approved by the board of trustees. Income, other non-class-specific expenses, and gains and losses on investments are allocated to each class of shares based on its relative net assets.
B. Franklin Portfolio Associates, LLC, provides investment advisory services to the fund for a fee calculated at an annual percentage rate of average net assets. The basic fee is subject to quarterly adjustments based on the fund’s performance for the preceding three years relative to the S&P 500 Index. For the year ended September 30, 2004, the investment advisory fee represented an effective annual basic rate of 0.09% of the fund’s average net assets, before an increase of $434,000 (0.01%) based on performance.
C. The Vanguard Group furnishes at cost corporate management, administrative, marketing, and distribution services. The costs of such services are allocated to the fund under methods approved by the board of trustees. The fund has committed to provide up to 0.40% of its net assets in capital contributions to Vanguard. At September 30, 2004, the fund had contributed capital of $942,000 to Vanguard (included in Other Assets), representing 0.01% of the fund’s net assets and 0.94% of Vanguard’s capitalization. The fund’s trustees and officers are also directors and officers of Vanguard.
D. The fund has asked its investment advisor to direct certain security trades, subject to obtaining the best price and execution, to brokers who have agreed to rebate to the fund part of the commissions generated. Such rebates are used solely to reduce the fund’s management and administrative expenses. For the year ended September 30, 2004, these arrangements reduced the fund’s expenses by $1,561,000 (an annual rate of 0.02% of average net assets).
E. �� Distributions are determined on a tax basis and may differ from net investment income and realized capital gains for financial reporting purposes. Differences may be permanent or temporary. Permanent differences are reclassified among capital accounts in the financial statements to reflect their tax character. Temporary differences arise when certain items of income, expense, gain, or loss are recognized in different periods for financial statement and tax purposes; these differences will reverse at some time in the future. Differences in classification may also result from the treatment of short-term gains as ordinary income for tax purposes.
During the year ended September 30, 2004, the fund realized $108,183,000 of net capital gains resulting from in-kind redemptions—in which shareholders exchanged fund shares for securities held by the fund rather than for cash. Because such gains are not taxable to the fund, and are not distributed to shareholders, they have been reclassified from accumulated net realized gains to paid-in capital.
For tax purposes, at September 30, 2004, the fund had $23,149,000 of ordinary income available for distribution. The fund had available realized losses of $1,231,727,000 to offset future net capital gains of $489,838,000 through September 30, 2010, and $741,889,000 through September 30, 2011.
At September 30, 2004, net unrealized appreciation of investment securities for tax purposes was $895,051,000, consisting of unrealized gains of $1,030,413,000 on securities that had risen in value since their purchase and $135,362,000 in unrealized losses on securities that had fallen in value since their purchase.
23
NOTES TO FINANCIAL STATEMENTS (CONTINUED)
At September 30, 2004, the aggregate settlement value of open futures contracts expiring in December 2004 and the related unrealized appreciation (depreciation) were:
| (000) | |||
|---|---|---|---|
| Futures Contracts | Number of Long Contracts | Aggregate Settlement Value | Unrealized Appreciation (Depreciation) |
| S&P 500 Index | 305 | $85,011 | $(888) |
Unrealized appreciation (depreciation) on open futures contracts is required to be treated as realized gain (loss) for tax purposes.
F. During the year ended September 30, 2004, the fund purchased $5,217,399,000 of investment securities and sold $5,309,280,000 of investment securities, other than U.S. government securities and temporary cash investments.
G. Capital share transactions for each class of shares were:
| Year Ended September 30, | ||||
|---|---|---|---|---|
| 2004 | 2003 | |||
| Amount (000) | Shares (000) | Amount (000) | Shares (000) | |
| Investor Shares | ||||
| Issued | $ 988,942 | 35,497 | $ 757,232 | 33,048 |
| Issued in Lieu of Cash Distributions | 69,237 | 2,479 | 61,500 | 2,637 |
| Redeemed | (1,095,206) | (39,314) | (901,243) | (39,953) |
| Net Increase (Decrease)--Investor Shares | (37,027) | (1,338) | (82,511) | (4,268) |
| Admiral Shares | ||||
| Issued | 203,525 | 4,442 | 194,161 | 5,200 |
| Issued in Lieu of Cash Distributions | 12,258 | 268 | 9,832 | 258 |
| Redeemed | (292,467) | (6,434) | (128,489) | (3,456) |
| Net Increase (Decrease)--Admiral Shares | (76,684) | (1,724) | 75,504 | 2,002 |
24
REPORT OF INDEPENDENT REGISTERED PUBLIC ACCOUNTING FIRM
To the Shareholders and Trustees of Vanguard Growth and Income Fund:
In our opinion, the accompanying statement of net assets and the related statements of operations and of changes in net assets and the financial highlights present fairly, in all material respects, the financial position of Vanguard Growth and Income Fund (the “Fund”) at September 30, 2004, the results of its operations for the year then ended, the changes in its net assets for each of the two years in the period then ended and the financial highlights for each of the periods indicated, in conformity with accounting principles generally accepted in the United States of America. These financial statements and financial highlights (hereafter referred to as “financial statements”) are the responsibility of the Fund’s management; our responsibility is to express an opinion on these financial statements based on our audits. We conducted our audits of these financial statements in accordance with the standards of the Public Company Accounting Oversight Board (United States), which require that we plan and perform the audit to obtain reasonable assurance about whether the financial statements are free of material misstatement. An audit includes examining, on a test basis, evidence supporting the amounts and disclosures in the finan-cial statements, assessing the accounting principles used and significant estimates made by management, and evaluating the overall financial statement presentation. We believe that our audits, which included confirmation of securities at September 30, 2004 by correspondence with the custodian and brokers, provide a reasonable basis for our opinion.
PricewaterhouseCoopers LLP
Philadelphia, Pennsylvania
November 3, 2004
SPECIAL 2004 TAX INFORMATION(UNAUDITED)
FOR VANGUARD GROWTH AND INCOME FUND
This information for the fiscal year ended September 30, 2004, is included pursuant to provisions of the Internal Revenue Code.
The fund distributed $86,466,000 of qualified dividend income to shareholders during the fiscal year.
For corporate shareholders, 100% of investment income (dividend income plus short-term gains, if any) qualifies for the dividends-received deduction.
25
INVESTING IS FAST, EASY, AND SECURE ON VANGUARD.COM
| If you’re like many Vanguard investors, you believe in planning and taking control of your own investments. Vanguard.com was built for you—and it keeps getting better. |
RESEARCH AND PLAN YOUR INVESTMENTS WITH CONfiDENCE
| Use our Planning & Advice and Research Funds & Stocks sections to: • Determine what asset allocation might best suit your needs—by taking our Investor Questionnaire. • Find out how much to save for retirement and your children’s college education—by using our planning tools. |
| • Learn how to achieve your goals—by reading our PlainTalk® investment guides. • Find your next fund—by using the Compare Funds, Compare Costs, and Narrow Your Fund Choices tools. |
• Look up fund price, performance history, and distribution information—in a snap.
INVEST AND MANAGE ACCOUNTS WITH EASE
Log on to Vanguard.com to:
| • See what you own (at Vanguard and elsewhere) and how your investments are doing. • Elect to receive online statements, fund reports (like this one), prospectuses, and tax forms. |
• Analyze your portfolio’s holdings and performance.
| • Open new accounts, buy and sell shares, and exchange money between funds—securely and easily. • Sign up to receive electronic newsletters from Vanguard informing you of news on our funds, products, and services, as well as on investing and the financial markets. |
Find out what Vanguard.com can do for you. Log on today!
26
CAPITALIZE ON YOUR IRA
| Are you taking full advantage of your individual retirement account? You really should be. These tax-deferred accounts are powerful options for retirement savers. |
| Here’s how you can exploit your IRA—and improve your chances of having the retirement of your dreams. |
CONTRIBUTE THE MAXIMUM AMOUNT EACH YEAR
| It may be an obvious point, but if you invest as much in your IRA as the law allows—currently $3,000 per tax year if you are under age 50 and $3,500 if you are age 50 or over—you will increase the odds of meeting your retirement goals. “Max out” every year you can. |
MAKE IT AUTOMATIC
| Put your IRA on autopilot by taking advantage of Vanguard’s Automatic Investment Plan. Your IRA contributions will be deducted from your bank account on a schedule of your choosing, making retirement investing a healthy habit. |
CONSIDER COST
| The owners of low-cost investments keep a larger portion of their gross returns than the owners of high-cost investments. Over the long term, avoiding costlier mutual funds and brokerage commissions could significantly boost your retirement savings. Our low costs are one reason a Vanguard IRA® is such a smart choice. |
REQUEST A DIRECT ROLLOVER WHEN YOU CHANGE JOBS
| Don’t spend your retirement assets before you’ve retired. When you change jobs, roll your 401(k) or other employer-sponsored retirement plan assets directly into your IRA. |
| If you have questions about your IRA, want to transfer an IRA from another institution to Vanguard, or need help with any other IRA transaction, call our Retirement Resource Center at 1-800-205-6189 or visit Vanguard.com. You can open or fund your IRA on our website and have a confirmation in your hand within minutes. |
THE PEOPLE WHO GOVERN YOUR FUND
The trustees of your mutual fund are there to see that the fund is operated and managed in your best interests since, as a shareholder, you are a part owner of the fund. Your fund trustees also serve on the board of directors of The Vanguard Group, Inc., which is owned by the Vanguard® funds and provides services to them on an at-cost basis.
A majority of Vanguard's board members are independent, meaning that they have no affiliation with Vanguard or the funds they oversee, apart from the sizable personal investments they have made as private individuals.
Our independent board members bring distinguished backgrounds in business, academia, and public service to their task of working with Vanguard officers to establish the policies and oversee the activities of
| Name (Year of Birth) Trustee/Officer Since | Position(s) Held with Fund (Number of Vanguard Funds Overseen by Trustee/Officer) | Principal Occupation(s) During the Past Five Years |
|---|---|---|
| John J. Brennan* (1954) May 1987 | Chairman of the Board, Chief Executive Officer, and Trustee (131) | Chairman of the Board,Chief Executive Officer, and Director/Trustee of The Vanguard Group, Inc., and of each of the investment companies served by The Vanguard Group. |
| INDEPENDENT TRUSTEES | ||
| Charles D. Ellis (1937) January 2001 | Trustee (131) | The Partners of `63 (pro bono ventures in education); Senior Advisor to Greenwich Associates (international business strategy consulting); Successor Trustee of Yale University; Overseer of the Stern School of Business at New York University; Trustee of the Whitehead Institute for Biomedical Research. |
| Rajiv L. Gupta (1945) December 2001† | Trustee (131) | Chairman and Chief Executive Officer (since October 1999), Vice Chairman (January-September 1999), and Vice President (prior to September 1999) of Rohm and Haas Co. (chemicals); Director of Technitrol, Inc. (electronic components), and Agere Systems (commu- nications components); Board Member of the American Chemistry Council; Trustee of Drexel University. |
| JoAnn Heffernan Heisen (1950) July 1998 | Trustee (131) | Vice President, Chief Information Officer, and Member of the Executive Committee of Johnson & Johnson (pharmaceuticals/ consumer products); Director of the University Medical Center at Princeton and Women's Research and Education Institute. |
| Burton G. Malkiel (1932) May 1977 | Trustee (129) | Chemical Bank Chairman's Professor of Economics, Princeton University; Director of Vanguard Investment Series plc (Irish invest- ment fund) (since November 2001), Vanguard Group (Ireland) Limited (investment management) (since November 2001), Prudential Insurance Co. of America, BKF Capital (investment management), The Jeffrey Co. (holding company), and NeuVis, Inc. (software company). |
| † | December 2002 for Vanguard® Equity Income Fund, Vanguard® Growth Equity Fund, the Vanguard® Municipal Bond Funds, and the Vanguard® State Tax-Exempt Funds. |
the funds. Among board members’ responsibilities are selecting investment advisors for the funds; monitoring fund operations, performance, and costs; reviewing contracts; nominating and selecting new trustees/directors; and electing Vanguard officers.
Each trustee serves a fund until its termination; or until the trustee’s retirement, resignation, or death; or otherwise as specified in the fund’s organizational documents. Any trustee may be removed at a shareholders’ meeting by a vote representing two-thirds of the net asset value of all shares of the fund together with shares of other Vanguard funds organized within the same trust. The table on these two pages shows information for each trustee and executive officer of the fund. The mailing address of the trustees and officers is P.O. Box 876, Valley Forge, PA 19482.
| Name (Year of Birth) Trustee/Officer Since | Position(s) Held with Fund (Number of Vanguard Funds Overseen by Trustee/Officer) | Principal Occupation(s) During the Past Five Years |
|---|---|---|
| Alfred M. Rankin, Jr. (1941) January 1993 | Trustee (131) | Chairman, President, Chief Executive Officer, and Director of NACCO Industries, Inc. (forklift trucks/housewares/lignite); Director of Goodrich Corporation (industrial products/aircraft systems and services); Director of Standard Products Company (supplier for the automotive industry) until 1998. |
| J. Lawrence Wilson (1936) April 1985 | Trustee (131) | Retired Chairman and Chief Executive Officer of Rohm and Haas Co. (chemicals); Director of Cummins Inc. (diesel engines), MeadWestvaco Corp. (paper products), and AmerisourceBergen Corp. (pharmaceutical distribution); Trustee of Vanderbilt University. |
| EXECUTIVE OFFICERS* | ||
R. Gregory Barton (1951) June 2001 | Secretary (131) | Managing Director and General Counsel of The Vanguard Group, Inc.; Secretary of The Vanguard Group and of each of the investment companies served by The Vanguard Group. |
| Thomas J. Higgins (1957) July 1998 | Treasurer (131) | Principal of The Vanguard Group, Inc.; Treasurer of each of the investment companies served by The Vanguard Group. |
*Officers of the funds are “interested persons” as defined in the Investment Company Act of 1940.
More information about the trustees is in the Statement of Additional Information, available from The Vanguard Group.
| VANGUARD SENIOR MANAGEMENT TEAM | |
|---|---|
| Mortimer J. Buckley, Information Technology. James H. Gately, Investment Programs and Services. Kathleen C. Gubanich, Human Resources. F. William McNabb, III, Client Relationship Group. | Michael S. Miller, Planning and Development. Ralph K. Packard, Finance. George U. Sauter, Chief Investment Officer. |
John C. Bogle, Founder; Chairman and Chief Executive Officer, 1974-1996. | |

Post Office Box 2600
Valley Forge, PA 19482-2600
Vanguard, The Vanguard Group, Vanguard.com, Vanguard IRA, Admiral, PlainTalk, and the ship logo are trademarks of The Vanguard Group, Inc.
All other marks are the exclusive property of their respective owners.
All comparative mutual fund data are from Lipper Inc. or Morningstar, Inc., unless otherwise noted.
For More Information
This report is intended for the fund's shareholders. It may not be distributed to prospective investors unless it is preceded or accompanied by the current fund prospectus. To receive a free copy of the prospectus or the Statement of Additional Information, or to request additional information about the fund or other Vanguard funds, please contact us at one of the adjacent telephone numbers or by e-mail through Vanguard.com. Prospectuses may also be viewed online.
You can obtain a free copy of Vanguard's proxy voting guidelines by visiting our website, www.vanguard.com, and searching for "proxy voting guidelines," or by calling Vanguard at 1- 800- 662-2739. They are also available from the SEC's website, www.sec.gov. In addition, beginning August 31, 2004, you may obtain a free report on how the fund voted the proxies for securities it owned during the 12 months ended June 30. To get the report, visit either www.vanguard.com or www.sec.gov.
You can review and copy information about your fund at the SEC's Public Reference Room in Washington, D.C. To find out more about this public service, call the SEC at 1-202-942- 8090. Information about your fund is also available on the SEC's website, and you can receive copies of this information, for a fee, by sending a request in either of two ways: via e-mail addressed to publicinfo@sec.gov or via regular mail addressed to the Public Reference Section, Securities and Exchange Commission, Washington, DC 20549-0102.
World Wide Web
www.vanguard.com
Fund Information
1-800-662-7447
Direct Investor Account Services
1-800-662-2739
Institutional Investor Services
1-800-523-1036
Text Telephone
1-800-952-3335
(C)2004 The Vanguard Group, Inc.
All rights reserved.
Vanguard Marketing
Corporation, Distributor.
Q930 112004
Item 2: Code of Ethics. The Board of Trustees has adopted a code of ethics that applies to the principal executive officer, principal financial officer, principal accounting officer or controller of the Registrant and The Vanguard Group, Inc., and to persons performing similar functions.
Item 3: Audit Committee Financial Expert. All of the members of the Audit Committee have been determined by the Registrant’s Board of Trustees to be Audit Committee Financial Experts. The members of the Audit Committee are: Charles D. Ellis, Rajiv L. Gupta, JoAnn Heffernan Heisen, Burton G. Malkiel, Alfred M. Rankin, Jr., and J. Lawrence Wilson. All Audit Committee members are independent under applicable rules.
Item 4: Principal Accountant Fees and Services.
(a) Audit Fees.
Audit Fees of the Registrant
Fiscal Year Ended September 30, 2004: $18,000
Fiscal Year Ended September 30, 2003: $12,000
Aggregate Audit Fees of Registered Investment Companies in the Vanguard Group
Fiscal Year Ended September 30, 2004: $1,685,500
Fiscal Year Ended September 30, 2003: $1,620,200
(b) Audit-Related Fees.
Fiscal Year Ended September 30, 2004: $257,800
Fiscal Year Ended September 30, 2003: $324,460
Includes fees billed in connection with assurance and related services provided to the Registrant, The Vanguard Group, Inc., Vanguard Marketing Corporation, and other registered investment companies in the Vanguard Group.
(c) Tax Fees.
Fiscal Year Ended September 30, 2004: $76,400
Fiscal Year Ended September 30, 2003: $409,900
Includes fees billed in connection with tax compliance, planning and advice services provided to the Registrant, The Vanguard Group, Inc., Vanguard Marketing Corporation, and other registered investment companies in the Vanguard Group and related to income and excise taxes.
(d) All Other Fees.
Fiscal Year Ended September 30, 2004: $0
Fiscal Year Ended September 30, 2003: $31,000
Includes fees billed for services related to risk management and privacy matters. Services were provided to the Registrant, The Vanguard Group, Inc., Vanguard Marketing Corporation, and other registered investment companies in the Vanguard Group.
(e) (1) Pre-Approval Policies. The policy of the Registrant’s Audit Committee is to consider and, if appropriate, approve before the principal accountant is engaged for such services, all specific audit and non-audit services provided to: (1) the Registrant; (2) The Vanguard Group, Inc.; (3) other entities controlled by The Vanguard Group, Inc. that provide ongoing services to the Registrant; and (4) other registered investment companies in the Vanguard Group. In making a determination, the Audit Committee considers whether the services are consistent with maintaining the principal accountant’s independence.
In the event of a contingency situation in which the principal accountant is needed to provide services in between scheduled Audit Committee meetings, members of the Audit Committee would be called on to consider and, if appropriate, pre-approve audit or permitted non-audit services in an amount sufficient to complete services through the next Audit Committee meeting, and to determine if such services would be consistent with maintaining the accountant’s independence. At the next scheduled Audit Committee meeting, services and fees would be presented to the Audit Committee for formal consideration, and, if appropriate, approval by the entire Audit Committee. The Audit Committee would again consider whether such services and fees are consistent with maintaining the principal accountant’s independence.
The Registrant’s Audit Committee is informed at least annually of all audit and non-audit services provided by the principal accountant to the Vanguard complex, whether such services are provided to: (1) the Registrant; (2) The Vanguard Group, Inc.; (3) other entities controlled by The Vanguard Group, Inc. that provide ongoing services to the Registrant; or other registered investment companies in the Vanguard Group.
(2) No percentage of the principal accountant’s fees or services were approved pursuant to the waiver provision of paragraph (c)(7)(i)(C) of Rule 2-01 of Regulation S-X.
(f) For the most recent fiscal year, over 50% of the hours worked under the principal accountant’s engagement were not performed by persons other than full-time, permanent employees of the principal accountant.
(g) Aggregate Non-Audit Fees.
Fiscal Year Ended September 30, 2004: $76,400
Fiscal Year Ended September 30, 2003: $440,900
Includes fees billed for non-audit services provided to the Registrant, The Vanguard Group, Inc., Vanguard Marketing Corporation, and other registered investment companies in the Vanguard Group.
(h) For the most recent fiscal year, the Audit Committee has determined that the provision of all non-audit services was consistent with maintaining the principal accountant’s independence.
Item 5: Not applicable.
Item 6: Not applicable.
Item 7: Not applicable.
Item 8: Not applicable.
Item 9: Not applicable.
Item 10: Controls and Procedures.
(a) Disclosure Controls and Procedures. The Principal Executive and Financial Officers concluded that the Registrant’s Disclosure Controls and Procedures are effective based on their evaluation of the Disclosure Controls and Procedures as of a date within 90 days of the filing date of this report.
(b) Internal Control Over Financial Reporting. There were no significant changes in Registrant’s internal control over financial reporting or in other factors that could significantly affect this control subsequent to the date of the evaluation, including any corrective actions with regard to significant deficiencies and material weaknesses.
Item 11: Exhibits.
(a) Code of Ethics.
(b) Certifications.
Pursuant to the requirements of the Securities Exchange Act of 1934 and the Investment Company Act of 1940, the registrant has duly caused this report to be signed on its behalf by the undersigned, thereunto duly authorized.
| VANGUARD QUANTITATIVE FUNDS | |
| BY: | (signature) |
| (HEIDI STAM) JOHN J. BRENNAN* CHIEF EXECUTIVE OFFICER |
| Date: | November 15, 2004 |
Pursuant to the requirements of the Securities Exchange Act of 1934 and the Investment Company Act of 1940, this report has been signed below by the following persons on behalf of the registrant and in the capacities and on the dates indicated.
| VANGUARD QUANTITATIVE FUNDS | |
| BY: | (signature) |
| (HEIDI STAM) JOHN J. BRENNAN* CHIEF EXECUTIVE OFFICER |
| Date: | November 15, 2004 |
| VANGUARD QUANTITATIVE FUNDS | |
| BY: | (signature) |
| (HEIDI STAM) THOMAS J. HIGGINS* TREASURER |
| Date: | November 15, 2004 |
*By Power of Attorney. See File Number 2-57689, filed on December 26, 2002. Incorporated by Reference.