UNITED STATES
SECURITIES AND EXCHANGE COMMISSION
Washington, D.C. 20549
FORM N-CSR
CERTIFIED SHAREHOLDER REPORT
OF
REGISTERED MANAGEMENT COMPANY
| Investment Company Act file number: | 811-4526 |
| Name of Registrant: | Vanguard Quantitative Funds |
| Address of Registrant: | P.O. Box 2600 Valley Forge, PA 19482 |
| Name and address of agent for service: | Heidi Stam, Esquire P.O. Box 876 Valley Forge, PA 19482 |
Registrant’s telephone number, including area code: (610) 669-1000
| Date of fiscal year end: | September 30 |
| Date of reporting period: | October 1, 2005- September 30, 2006 |
| Item 1: | Reports to Shareholders |
|
|
|
|
| Vanguard® Growth And Income Fund |
|
|
|
|
|
|
|
|
|
|
| > Annual Report |
|
|
|
|
|
|
|
|
|
|
|
|
|
|
|
|
|
|
| September 30, 2006 |
|
|
|
|
|
|
|
| ||
|
|
| |
|
|
| |
|
|
| |
|
|
| |
|
|
| |
|
|
| |
|
|
| |
|
|
| |

> | Vanguard Growth and Income Fund Investor Shares gained 9.8% during a fiscal |
| year when large-cap stocks benefited from strong corporate earnings and tame |
| inflation; the fund’s Admiral Shares returned 10.0%. |
|
|
|
|
> | Although the advisor’s stock-picking was strong in some of the better-performing |
| sectors such as health care, stock selection was less successful in the information |
| technology and consumer discretionary sectors. |
|
|
|
|
> | The fund’s average gain of 9.1% per year for the past decade put it ahead of both |
| its benchmark index and the average return among peer funds for the period. |
Contents |
|
|
|
Your Fund’s Total Returns | 1 |
Chairman’s Letter | 2 |
Advisor’s Report | 7 |
Fund Profile | 9 |
Performance Summary | 10 |
Financial Statements | 12 |
Your Fund’s After-Tax Returns | 23 |
About Your Fund’s Expenses | 24 |
Trustees Approve Advisory Agreement | 26 |
Glossary | 27 |
Please note: The opinions expressed in this report are just that—informed opinions. They should not be considered promises or advice. Also, please keep in mind that the information and opinions cover the period through the date on the cover of this report. Of course, the risks of investing in your fund are spelled out in the prospectus.
Your Fund’s Total Returns
Fiscal Year Ended September 30, 2006
| Total |
| Return |
Vanguard Growth and Income Fund |
|
Investor Shares | 9.8% |
Admiral™ Shares1 | 10.0 |
S&P 500 Index | 10.8 |
Average Large-Cap Core Fund2 | 8.7 |
Dow Jones Wilshire 5000 Index | 10.5 |
Your Fund’s Performance at a Glance
September 30, 2005–September 30, 2006
|
|
| Distributions Per Share | |
| Starting | Ending | Income | Capital |
| Share Price | Share Price | Dividends | Gains |
Growth and Income Fund |
|
|
|
|
Investor Shares | $31.29 | $33.79 | $0.520 | $0.000 |
Admiral Shares | 51.12 | 55.20 | 0.953 | 0.000 |
1 A lower-cost class of shares available to many longtime shareholders and to those with significant investments in the fund.
2 Derived from data provided by Lipper Inc.
1

Chairman’s Letter
Dear Shareholder,
Although the U.S. economy slowed during the fiscal year ended September 30, 2006, corporate earnings remained strong and inflation low, boosting returns for the mostly large-capitalization stocks held by Vanguard Growth and Income Fund. The fund’s Investor Shares returned 9.8% for the 2006 fiscal year, and the Admiral Shares returned 10.0%. These returns were midway between those of the average large-cap core fund (8.7%) and the fund’s benchmark, the Standard & Poor’s 500 Index (10.8%). The index is an unmanaged market proxy whose return reflects no costs.
The fund’s goal is to best the S&P 500 Index over the long term, while maintaining a comparable level of risk. For the past decade, the fund has remained on target, outpacing the index by a respectable margin of 0.5 percentage point per year—a difficult feat given the fund’s need to overcome the disadvantage of real-world costs, low as they are for this fund. To see how your fund’s costs compare with industry averages, please turn to page 4.
Stocks endured some rough going, then recovered to post strong results
The stock market advanced through the first part of the fund’s fiscal year, then hit a speed bump in May, as investors feared that the economy was growing too rapidly. But a slowdown in the housing market,
2
coupled with a late-summer decline in oil prices, helped to allay inflation concerns. The broad market rebounded to post a solid 10.5% return for the 12 months. Value-oriented stocks outperformed growth stocks, and large-cap stocks edged out small-caps, one of the market’s best-performing segments in recent years.
International stocks handily outpaced domestic issues, continuing a multiyear trend. European and emerging market stocks fared particularly well. Stocks in the Pacific region also performed admirably, even though Japanese stocks did not fully participate in the global market’s summer recovery.
In the bond market, prices rallied as the Fed paused
At its August and September meetings, the Federal Reserve Board twice voted to maintain the federal funds rate at 5.25%, marking a pause in the central bank’s two-year inflation-fighting campaign. With investor sentiment buoyed by the Fed’s near-term inflation outlook, interest rates decreased, driving bond prices higher. The broad taxable bond market finished the period with a 3.7% return, and municipal bonds performed slightly better.
Although rates decreased along the entire maturity spectrum in late summer, the difference between the yields of the
Market Barometer
|
| Average Annual Total Returns | ||
|
| Periods Ended September 30, 2006 | ||
| One Year | Three Years | Five Years | |
Stocks |
|
|
| |
Russell 1000 Index (Large-caps) | 10.2% | 12.8% | 7.6% | |
Russell 2000 Index (Small-caps) | 9.9 | 15.5 | 13.8 | |
Dow Jones Wilshire 5000 Index (Entire market) | 10.5 | 13.3 | 8.6 | |
MSCI All Country World Index ex USA (International) | 19.4 | 23.9 | 16.4 | |
|
|
|
| |
Bonds |
|
|
| |
Lehman Aggregate Bond Index (Broad taxable market) | 3.7% | 3.4% | 4.8% | |
Lehman Municipal Bond Index | 4.5 | 4.4 | 5.2 | |
Citigroup 3-Month Treasury Bill Index | 4.4 | 2.6 | 2.2 | |
|
|
|
| |
CPI |
|
|
| |
Consumer Price Index | 2.1% | 3.1% | 2.6% | |
3
shortest- and longest-term issues remained narrow by historical standards. At the end of September, the U.S. Treasury yield curve was actually inverted, meaning that short-term issues such as 3-month and 6-month Treasury notes offered higher yields than those with longer maturities.
Performance uneven across industry sectors
The Growth and Income Fund’s investment advisor uses a quantitative strategy that, while aligning the fund’s sector weightings and risk profile with those of the S&P 500 Index, seeks to outperform the benchmark by overweighting those stocks deemed to have attractive prices and strong prospects for earnings growth.
During the fiscal year, the strategy produced overweighted positions in certain financial, health care, and materials stocks that benefited the fund. For example, on average the fund held more than twice the benchmark weighting of the pharmaceutical company Merck, which soared 61% during the year. In the financials sector—the fund’s largest industry group—its weighting of brokerage firm Lehman Brothers Holdings averaged more than six times the benchmark weight—a boon to the fund’s return given Lehman’s 28% climb. Biotech firm Gilead Sciences and regional bank Wachovia followed similar patterns. One of the fund’s largest holdings, Bank of America, was the single largest contributor to returns.
Expense Ratios1 |
|
|
|
Your fund compared with its peer group |
|
|
|
|
|
| Average |
| Investor | Admiral | Large-Cap |
| Shares | Shares | Core Fund |
Growth and Income Fund | 0.38% | 0.20% | 1.41% |
1. Fund expense ratios reflect the 12 months ended September 30, 2006. Peer-group expense ratio is derived from data provided by Lipper Inc. and captures information through year-end 2005.
4
On the whole, however, stock selection hurt performance relative to the fund’s benchmark. Among the culprits were large weightings in semiconductor stocks, including Intel and Advanced Micro Devices, whose earnings announcements disappointed investors. Stocks that were laid low by a softening housing market were also large holdings, including KB Home, down –39% for the year, and Lowe’s retail stores, down –13%. In the energy sector, the fund also was overweighted in ConocoPhillips, which lost ground as production slipped after the partial closure of an oil field in Prudhoe Bay, Alaska. ConocoPhillips owns more than a third of the oil field, which was shut down by operator BP owing to a leaking pipeline.
For additional details on the fund’s holdings and positions, see the Advisor’s Report, which begins on page 7.
Over a decade, the fund has led its benchmark index
As mentioned earlier, the Growth and Income Fund’s objective is to outperform the S&P 500 Index over time without taking on additional risk. In a single year, the fund may or may not meet this objective. The success of the advisor, Franklin Portfolio Associates, in meeting this goal is best assessed over longer periods. During the ten years ended September 30, 2006, the fund averaged an annual return of 9.1%, half a percentage point per year higher than
Total Returns |
|
|
Ten Years Ended September 30, 2006 |
|
|
| Average | Final Value of a $10,000 |
| Annual Return | Initial Investment |
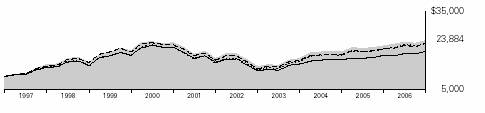
Growth and Income Fund Investor Shares | 9.1% | $23,884 |
S&P 500 Index | 8.6 | 22,792 |
Average Large-Cap Core Fund | 7.1 | 19,832 |
Dow Jones Wilshire 5000 Index | 8.6 | 22,871 |
5
the S&P 500 return. This feat is a testament to Franklin Portfolio Associates’ development and continued refinement of an effective quantitative methodology.
The fund is also ahead relative to the average return among its peers. The table on page 5 shows that a hypothetical investment of $10,000 made a decade ago in the Growth and Income Fund would have grown to $23,884 by September 30. The same investment, if compounded at the average rate of return for competitors, would have grown to $19,832. Franklin’s stock-selection methodology, combined with the fund’s low expenses, have provided a performance edge over time.
Provision your portfolio for a long-term journey
Although the stock market finished the 12-month period with a solid return, the journey was circuitous: a strong start, a mid-May swoon, and a powerful finish. These ups and downs are an unavoidable fact of investing life.
Our time-tested counsel to shareholders navigating the market’s peaks and valleys in pursuit of long-term goals is to diversify both within and across asset classes.
Within the stock market portion of your portfolio, for example, you can complement the large-cap-oriented Vanguard Growth and Income Fund with smaller stocks, potentially moderating your portfolio’s volatility. And you can temper portfolio risk more dramatically by balancing stock funds with bond and money market funds in an allocation consistent with your goals and circumstances.
This simple plan gives you the opportunity to pursue the high potential returns available from stocks, while paying heed to risk control. Vanguard Growth and Income Fund can play an important role in such a plan.
Thank you for entrusting your assets to Vanguard.
Sincerely,

John J. Brennan
Chairman and Chief Executive Officer
October 12, 2006
6
Advisor’s Report
The U.S. stock market has performed well as investors have dealt with considerable uncertainty over the direction of interest rates, commodity prices, the overall economy, and geopolitical issues. During the last few months of the Growth and Income Fund’s fiscal year, some of the uncertainty has abated in each area:
• | The Federal Reserve Board halted its series of interest rate increases and is likely to withhold further action until next spring, at the earliest. |
• | Commodity and energy prices are significantly off their highs (but are still high by historical standards). |
• | Economic growth is slowing, but employment and corporate profits remain strong. |
• | Geopolitical issues have recently had a negligible effect on markets and the economy. |
Notwithstanding the impact of the ongoing pullback in the housing market, the U.S. economy may well endure a slowdown without entering a recession. Europe and Japan show signs of strong growth in industrial production—indeed, global economic expansion could continue through the end of 2007, given current conditions. U.S. stocks, in particular large-capitalization growth and “quality” issues, could continue to rise well into next year as continued corporate profitability has kept valuations reasonable.
Our successes
Stock selection in Vanguard Growth and Income Fund during the fiscal year ended September 30 has been particularly good in health care, computer hardware, and basic materials. Specific stocks that have added value include Gilead Sciences (biotechnology); Apple Computer (computers and iPods); News Corporation (international multimedia); Becton, Dickinson (medical supplies and devices); Merck (drugs); Nucor (steel products); and Caremark Rx (pharmacy services). In addition, relative to the Standard & Poor’s 500 Index, the fund benefited from not holding certain poorly performing stocks, including Dell (–33%), Halliburton (–16%), and Boston Scientific (–37%).
Although sector tilts (measured as the difference between the portfolio’s and the S&P 500’s weighting in a particular sector) are deliberately minimized in the Growth and Income Fund, they are not forced to zero. Over the fiscal year, the fund’s small overweighting in the metals and mining subsector, and its underweighting in Internet stocks, helped the portfolio’s relative return. In addition, the fund’s tendency to hold stocks that, on average, have a lower price/earnings ratio relative to the S&P 500 had a positive impact on returns. The fund’s tilt toward stocks with near-term positive price momentum helped performance in the first half of fiscal 2006, but in the latter part of the 12 months was a drag on performance.
7
Our shortfalls
The fund’s performance lagged the S&P 500 Index for the full fiscal year. After a solid start in the last three months of 2005, the fund underperformed during the nine months ended September 30. In the 2006 semiannual report, we noted a shift in the factors driving successful stock selection. The valuation-oriented factors were declining in impact as the momentum (price- and earnings-related) factors took the lead in identifying future winners. However, since then we have experienced a reversal whereby the valuation factors have again been more effective, and momentum factors—especially price momentum—have inhibited investment returns. It is quite likely that the drifting effectiveness of the different stock-selection factors has been affected by uncertainties regarding the economy, interest rates, and market leadership.
Holdings that subtracted from the fund’s results include Intel and Advanced Micro Devices (microprocessors and related semi-conductor products), Nabors Industries (land-based oil and gas drilling), KB Home (home builder), and EMC
(computer storage devices). In addition, not holding JP Morgan Chase and Schlumberger, both strong performers over the past 12 months, had a negative impact on results.
The fund’s positioning
We continue to remain focused on our investment discipline as it applies to stock selection, portfolio construction, and implementation. We believe the Growth and Income Fund is well positioned to achieve its goal of outperforming the S&P 500 Index with a similar level of investment risk. The fund will remain fully invested in those stocks we consider most undervalued, and the portfolio risk will be focused to minimize exposure to characteristics we believe are unrewarded. Given the historically low level of risk in U.S. equities today (measured in terms of individual stock-price volatility), we are holding fewer names in the fund to meet our active risk targets. We continue to believe the Growth and Income Fund is an excellent choice for those seeking a diversified exposure to large-cap U.S. equities.
John S. Cone, CFA,
President and Chief Executive Officer
Franklin Portfolio Associates, LLC
October 11, 2006
8
Fund Profile
As of September 30, 2006
Portfolio Characteristics |
|
| |
| Comparative | Broad | |
| Fund | Index1 | Index2 |
Number of Stocks | 118 | 500 | 4,974 |
Median Market Cap | $48.0B | $56.1B | $27.5B |
Price/Earnings Ratio | 14.3x | 17.0x | 17.2x |
Price/Book Ratio | 2.9x | 2.8x | 3.7x |
Yield |
| 1.9% | 1.7% |
Investor Shares | 1.6% |
|
|
Admiral Shares | 1.8% |
|
|
Return on Equity | 19.1% | 18.9% | 15.4% |
Earnings Growth Rate | 21.4% | 17.0% | 15.7% |
Foreign Holdings | 0.0% | 0.0% | 1.1% |
Turnover Rate | 93% | — | — |
Expense Ratio |
| — | — |
Investor Shares | 0.38% |
|
|
Admiral Shares | 0.20% |
|
|
Short-Term Reserves | 0% | — | — |
Sector Diversification (% of portfolio) |
| ||
| Comparative | Broad | |
| Fund | Index1 | Index2 |
Consumer Discretionary | 13% | 10% | 12% |
Consumer Staples | 7 | 10 | 9 |
Energy | 10 | 9 | 9 |
Financials | 20 | 22 | 23 |
Health Care | 12 | 13 | 12 |
Industrials | 14 | 11 | 11 |
Information Technology | 15 | 15 | 15 |
Materials | 3 | 3 | 3 |
Telecommunication Services | 3 | 4 | 3 |
Utilities | 3 | 3 | 3 |
Volatility Measures3 |
| |
| Fund Versus | Fund Versus |
| Target Index1 | Broad Index2 |
R-Squared | 0.96 | 0.95 |
Beta | 1.05 | 0.96 |
Ten Largest Holdings4(% of total net assets) |
| ||
|
|
| |
|
|
| |
ExxonMobil Corp. | integrated oil and gas | 4.3% | |
Bank of America Corp. | diversified financial services | 3.8 | |
General Electric Co. | industrial conglomerates | 3.6 | |
International Business Machines Corp. | computer hardware | 2.9 | |
Cisco Systems, Inc. | communications equipment | 2.7 | |
The Goldman Sachs Group, Inc. | investment banking and brokerage | 2.5 | |
Johnson & Johnson | pharmaceuticals | 2.3 | |
News Corp., Class A | movies and entertainment | 2.2 | |
Hewlett-Packard Co. | computer hardware | 2.1 | |
TXU Corp. | independent power producers and energy traders | 2.0 | |
Top Ten |
| 28.4% | |
Investment Focus

1 | S&P 500 Index. |
2 | Dow Jones Wilshire 5000 Index. |
3 | For an explanation of R-squared, beta, and other terms used here, see the Glossary on page 27. |
4 | “Ten Largest Holdings” excludes any temporary cash investments and equity index products. |
9
Performance Summary
All of the returns in this report represent past performance, which is not a guarantee of future results that may be achieved by the fund. (Current performance may be lower or higher than the performance data cited. For performance data current to the most recent month-end, visit our website at www.vanguard.com.) Note, too, that both investment returns and principal value can fluctuate widely, so an investor’s shares, when sold, could be worth more or less than their original cost. The returns shown do not reflect taxes that a shareholder would pay on fund distributions or on the sale of fund shares.
Cumulative Performance: September 30, 1996–September 30, 2006
Initial Investment of $10,000
|
|
|
| ||
|
|
|
| ||
| Average Annual Total Returns | Final Value | |||
| Periods Ended September 30, 2006 | of a $10,000 | |||
| One Year | Five Years | Ten Years | Investment | |
Growth and Income Fund Investor Shares | 9.76% | 7.24% | 9.10% | $23,884 | |
Dow Jones Wilshire 5000 Index | 10.48 | 8.64 | 8.62 | 22,871 | |
S&P 500 Index | 10.79 | 6.97 | 8.59 | 22,792 | |
Average Large-Cap Core Fund1 | 8.73 | 5.15 | 7.09 | 19,832 | |
|
|
|
| Final Value |
|
|
| Since | of a $100,000 |
| One Year | Five Years | Inception2 | Investment |
Growth and Income Fund Admiral Shares | 9.97% | 7.41% | 3.40% | $119,723 |
Dow Jones Wilshire 5000 Index | 10.48 | 8.64 | 4.45 | 126,376 |
S&P 500 Index | 10.79 | 6.97 | 3.02 | 117,347 |
1 | Derived from data provided by Lipper Inc. |
2 | May 14, 2001. |
10
Fiscal-Year Total Returns (%): September 30, 1996–September 30, 2006

Note: See Financial Highlights tables on pages 17 and 18 for dividend and capital gains information.
11
Financial Statements
Statement of Net Assets
As of September 30, 2006
The fund provides a complete list of its holdings four times in each fiscal year, at the quarter-ends. For the second and fourth fiscal quarters, the lists appear in the fund’s semiannual and annual reports to shareholders. For the first and third fiscal quarters, the fund files the lists with the Securities and Exchange Commission on Form N-Q. Shareholders can look up the fund’s Forms N-Q on the SEC’s website at www.sec.gov. Forms N-Q may also be reviewed and copied at the SEC’s Public Reference Room (see the back cover of this report for further information).
|
| Market |
|
| Value• |
| Shares | ($000) |
Common Stocks (99.2%)1 |
|
|
Consumer Discretionary (12.5%) |
| |
News Corp., Class A | 8,380,600 | 164,679 |
Lowe’s Cos., Inc. | 4,823,400 | 135,345 |
Target Corp. | 2,034,700 | 112,417 |
Omnicom Group Inc. | 953,300 | 89,229 |
Home Depot, Inc. | 2,347,100 | 85,129 |
Sherwin-Williams Co. | 1,187,600 | 66,244 |
J.C. Penney Co., Inc. (Holding Co.) | 862,100 | 58,959 |
McDonald’s Corp. | 1,068,000 | 41,780 |
* Kohl’s Corp. | 623,800 | 40,497 |
* Sears Holdings Corp. | 207,100 | 32,741 |
Darden Restaurants Inc. | 656,200 | 27,869 |
Starwood Hotels & Resorts Worldwide, Inc. | 472,200 | 27,005 |
Time Warner, Inc. | 1,241,800 | 22,638 |
KB Home | 402,200 | 17,616 |
Harley-Davidson, Inc. | 85,900 | 5,390 |
|
| 927,538 |
Consumer Staples (6.8%) |
|
|
General Mills, Inc. | 1,903,200 | 107,721 |
The Coca-Cola Co. | 2,408,600 | 107,616 |
PepsiCo, Inc. | 920,600 | 60,078 |
The Kroger Co. | 2,070,900 | 47,921 |
Archer-Daniels-Midland Co. | 1,003,000 | 37,994 |
Kimberly-Clark Corp. | 500,200 | 32,693 |
McCormick & Co., Inc. | 795,000 | 30,194 |
Reynolds American Inc. | 447,400 | 27,725 |
Estee Lauder Cos. Class A | 462,600 | 18,657 |
The Procter & Gamble Co. | 252,100 | 15,625 |
Altria Group, Inc. | 167,200 | 12,799 |
Anheuser-Busch Cos., Inc. | 59,200 | 2,813 |
|
| 501,836 |
Energy (9.9%) |
|
|
ExxonMobil Corp. | 4,744,936 | 318,385 |
ConocoPhillips Co. | 2,452,919 | 146,022 |
* Nabors Industries, Inc. | 3,220,200 | 95,801 |
XTO Energy, Inc. | 2,125,400 | 89,543 |
|
| Market |
|
| Value• |
| Shares | ($000) |
Baker Hughes, Inc. | 620,100 | 42,291 |
Marathon Oil Corp. | 386,300 | 29,706 |
Sunoco, Inc. | 108,000 | 6,717 |
Chevron Corp. | 74,600 | 4,839 |
|
| 733,304 |
Financials (20.4%) |
|
|
Capital Markets (4.7%) |
|
|
The Goldman Sachs |
|
|
Group, Inc. | 1,087,000 | 183,888 |
Lehman Brothers Holdings, Inc. | 1,961,500 | 144,876 |
Bear Stearns Co., Inc. | 124,600 | 17,457 |
|
|
|
Commercial Banks (4.5%) |
|
|
National City Corp. | 2,594,700 | 94,966 |
U.S. Bancorp | 2,682,900 | 89,126 |
Wachovia Corp. | 1,284,650 | 71,684 |
Wells Fargo & Co. | 1,421,600 | 51,433 |
Comerica, Inc. | 442,500 | 25,187 |
KeyCorp | 111,200 | 4,163 |
|
|
|
Diversified Financial Services (5.8%) |
| |
Bank of America Corp. | 5,298,799 | 283,857 |
Citigroup, Inc. | 1,636,500 | 81,285 |
CIT Group Inc. | 1,333,700 | 64,858 |
|
|
|
Insurance (3.9%) |
|
|
AFLAC Inc. | 3,100,000 | 141,856 |
MetLife, Inc. | 1,209,600 | 68,560 |
Cincinnati Financial Corp. | 943,208 | 45,331 |
Ambac Financial Group, Inc. | 232,100 | 19,206 |
Safeco Corp. | 199,800 | 11,774 |
The Chubb Corp. | 44,200 | 2,297 |
|
|
|
Thrifts & Mortgage Finance (1.5%) |
| |
Countrywide Financial Corp. | 1,769,700 | 62,010 |
MGIC Investment Corp. | 435,700 | 26,129 |
Washington Mutual, Inc. | 555,444 | 24,145 |
|
| 1,514,088 |
12
|
| Market |
|
| Value• |
| Shares | ($000) |
Health Care (11.9%) |
|
|
Johnson & Johnson | 2,665,900 | 173,124 |
Merck & Co., Inc. | 3,062,200 | 128,306 |
Caremark Rx, Inc. | 2,134,300 | 120,951 |
* Amgen, Inc. | 1,069,800 | 76,523 |
Aetna Inc. | 1,863,600 | 73,705 |
Abbott Laboratories | 1,500,000 | 72,840 |
Becton, Dickinson & Co. | 755,500 | 53,391 |
Mylan Laboratories, Inc. | 2,164,000 | 43,561 |
Pfizer Inc. | 1,340,827 | 38,026 |
UnitedHealth Group Inc. | 733,600 | 36,093 |
Cardinal Health, Inc. | 461,100 | 30,313 |
Biomet, Inc. | 697,400 | 22,449 |
Schering-Plough Corp. | 288,000 | 6,362 |
Medtronic, Inc. | 55,000 | 2,554 |
|
| 878,198 |
Industrials (13.7%) |
|
|
General Electric Co. | 7,616,600 | 268,866 |
Lockheed Martin Corp. | 1,477,600 | 127,162 |
Norfolk Southern Corp. | 2,472,600 | 108,918 |
Caterpillar, Inc. | 1,280,200 | 84,237 |
PACCAR, Inc. | 1,115,400 | 63,600 |
United Parcel Service, Inc. | 843,900 | 60,710 |
Northrop Grumman Corp. | 840,100 | 57,186 |
Honeywell International Inc. | 1,319,000 | 53,947 |
Ingersoll-Rand Co. | 1,392,300 | 52,880 |
Cummins Inc. | 376,800 | 44,926 |
Southwest Airlines Co. | 1,776,200 | 29,591 |
Illinois Tool Works, Inc. | 641,800 | 28,817 |
Avery Dennison Corp. | 230,100 | 13,845 |
Danaher Corp. | 200,100 | 13,741 |
FedEx Corp. | 19,000 | 2,065 |
|
| 1,010,491 |
Information Technology (14.7%) |
| |
International Business Machines Corp. | 2,641,400 | 216,436 |
* Cisco Systems, Inc. | 8,796,100 | 202,310 |
Hewlett-Packard Co. | 4,278,300 | 156,971 |
* Freescale Semiconductor, Inc.Class B | 2,058,900 | 78,259 |
QUALCOMM Inc. | 1,851,800 | 67,313 |
Jabil Circuit, Inc. | 2,136,300 | 61,034 |
* Google Inc. | 146,700 | 58,959 |
Microsoft Corp. | 2,153,026 | 58,842 |
* Agilent Technologies, Inc. | 1,756,100 | 57,407 |
National Semiconductor Corp. | 1,759,400 | 41,399 |
Molex, Inc. | 860,300 | 33,526 |
* Intuit, Inc. | 603,700 | 19,373 |
Texas Instruments, Inc. | 411,400 | 13,679 |
* NCR Corp. | 201,500 | 7,955 |
Analog Devices, Inc. | 264,000 | 7,759 |
* Fiserv, Inc. | 97,800 | 4,605 |
Linear Technology Corp. | 99,900 | 3,109 |
|
| 1,088,936 |
|
| Market |
|
| Value• |
| Shares | ($000) |
Materials (3.3%) |
|
|
Freeport-McMoRan |
|
|
Copper & Gold, Inc. |
|
|
Class B | 1,382,400 | 73,627 |
Rohm & Haas Co. | 1,464,400 | 69,339 |
Nucor Corp. | 1,111,200 | 54,993 |
* Pactiv Corp. | 572,400 | 16,268 |
Phelps Dodge Corp. | 167,100 | 14,153 |
Bemis Co., Inc. | 343,500 | 11,287 |
United States Steel Corp. | 97,800 | 5,641 |
|
| 245,308 |
Telecommunication Services (2.8%) |
| |
AT&T Inc. | 4,416,100 | 143,788 |
Verizon Communications Inc. | 1,631,500 | 60,578 |
Embarq Corp. | 112,800 | 5,456 |
|
| 209,822 |
Utilities (3.2%) |
|
|
TXU Corp. | 2,404,400 | 150,323 |
Constellation Energy Group, Inc. | 623,900 | 36,935 |
PG&E Corp. | 517,300 | 21,546 |
PPL Corp. | 457,800 | 15,062 |
KeySpan Corp. | 338,700 | 13,934 |
CenterPoint Energy Inc. | 151,800 | 2,174 |
|
| 239,974 |
Total Common Stocks |
|
|
(Cost $6,307,178) |
| 7,349,495 |
Temporary Cash Investments (0.9%)1 |
| |
Money Market Fund (0.9%) |
|
|
2 Vanguard Market |
|
|
Liquidity Fund, 5.306% | 63,436,214 | 63,436 |
|
|
|
| Face |
|
| Amount |
|
| ($000) |
|
U.S. Government Obligation (0.0%) |
| |
U.S. Treasury Bill |
|
|
3 4.822% 12/21/2006 | 2,000 | 1,979 |
Total Temporary Cash Investments |
| |
(Cost $65,415) |
| 65,415 |
Total Investments (100.1%) |
|
|
(Cost $6,372,593) |
| 7,414,910 |
Other Assets and Liabilities (–0.1%) |
| |
Other Assets—Note C |
| 15,879 |
Liabilities |
| (22,613) |
|
| (6,734) |
Net Assets (100%) |
| $7,408,176 |
13
At September 30, 2006, net assets consisted of:4 | |
| Amount |
| ($000) |
Paid-in Capital | 6,476,480 |
Undistributed Net Investment Income | 22,322 |
Accumulated Net Realized Losses | (133,722) |
Unrealized Appreciation |
|
Investment Securities | 1,042,317 |
Futures Contracts | 779 |
Net Assets | 7,408,176 |
|
|
|
|
Investor Shares—Net Assets |
|
Applicable to 150,561,746 outstanding $.001 | |
par value shares of beneficial interest |
|
(unlimited authorization) | 5,087,637 |
Net Asset Value Per Share— |
|
Investor Shares | $33.79 |
|
|
Admiral Shares—Net Assets |
|
Applicable to 42,037,381 outstanding $.001 | |
par value shares of beneficial interest |
|
(unlimited authorization) | 2,320,539 |
Net Asset Value Per Share— |
|
Admiral Shares | $55.20 |
• | See Note A in Notes to Financial Statements. |
* | Non-income-producing security. |
1 The fund invests a portion of its cash reserves in equity markets through the use of index futures contracts. After giving effect to futures investments, the fund’s effective common stock and temporary cash investment positions represent 99.7% and 0.4%, respectively, of net assets. See Note E in Notes to Financial Statements.
2 Affiliated money market fund available only to Vanguard funds and certain trusts and accounts managed by Vanguard. Rate shown is the 7-day yield.
3 Securities with a value of $1,979,000 have been segregated as initial margin for open futures contracts.
4 See Note E in Notes to Financial Statements for the tax-basis components of net assets.
14
Statement of Operations
| Year Ended |
| September 30, 2006 |
| ($000) |
Investment Income |
|
Income |
|
Dividends | 143,934 |
Interest1 | 4,221 |
Security Lending | 14 |
Total Income | 148,169 |
Expenses |
|
Investment Advisory Fees—Note B |
|
Basic Fee | 6,298 |
Performance Adjustment | 438 |
The Vanguard Group—Note C |
|
Management and Administrative |
|
Investor Shares | 13,394 |
Admiral Shares | 1,950 |
Marketing and Distribution |
|
Investor Shares | 1,193 |
Admiral Shares | 418 |
Custodian Fees | 60 |
Auditing Fees | 20 |
Shareholders’ Reports |
|
Investor Shares | 161 |
Admiral Shares | 4 |
Trustees’ Fees and Expenses | 9 |
Total Expenses | 23,945 |
Expenses Paid Indirectly—Note D | (2,589) |
Net Expenses | 21,356 |
Net Investment Income | 126,813 |
Realized Net Gain (Loss) |
|
Investment Securities Sold | 619,787 |
Futures Contracts | 1,320 |
Realized Net Gain (Loss) | 621,107 |
Change in Unrealized Appreciation (Depreciation) |
|
Investment Securities | (62,234) |
Futures Contracts | 1,711 |
Change in Unrealized Appreciation (Depreciation) | (60,523) |
Net Increase (Decrease) in Net Assets Resulting from Operations | 687,397 |
1 Interest income from an affiliated company of the fund was $4,045,000.
15
Statement of Changes in Net Assets
| Year Ended September 30, | |
| 2006 | 2005 |
| ($000) | ($000) |
Increase (Decrease) In Net Assets |
|
|
Operations |
|
|
Net Investment Income | 126,813 | 110,894 |
Realized Net Gain (Loss) | 621,107 | 488,914 |
Change in Unrealized Appreciation (Depreciation) | (60,523) | 209,042 |
Net Increase (Decrease) in Net Assets Resulting from Operations | 687,397 | 808,850 |
Distributions |
|
|
Net Investment Income |
|
|
Investor Shares | (81,854) | (90,318) |
Admiral Shares | (39,539) | (19,654) |
Realized Capital Gain |
|
|
Investor Shares | — | — |
Admiral Shares | — | — |
Total Distributions | (121,393) | (109,972) |
Capital Share Transactions—Note G |
|
|
Investor Shares | (509,343) | (1,169,682) |
Admiral Shares | 110,294 | 1,088,964 |
Net Increase (Decrease) from Capital Share Transactions | (399,049) | (80,718) |
Total Increase (Decrease) | 166,955 | 618,160 |
Net Assets |
|
|
Beginning of Period | 7,241,221 | 6,623,061 |
End of Period1 | 7,408,176 | 7,241,221 |
1 Net Assets—End of Period includes undistributed net investment income of $22,322,000 and $16,902,000.
16
Financial Highlights
Growth and Income Fund Investor Shares |
|
|
|
|
|
|
|
| Year Ended September 30, | ||
For a Share Outstanding Throughout Each Period | 2006 | 2005 | 2004 | 2003 | 2002 |
Net Asset Value, |
|
|
|
|
|
Beginning of Period | $31.29 | $28.31 | $24.91 | $20.68 | $25.50 |
Investment Operations |
|
|
|
|
|
Net Investment Income | .55 | .46 | .37 | .318 | .27 |
Net Realized and Unrealized |
|
|
|
|
|
Gain (Loss) on Investments | 2.47 | 2.98 | 3.39 | 4.227 | (4.81) |
Total from Investment Operations | 3.02 | 3.44 | 3.76 | 4.545 | (4.54) |
Distributions |
|
|
|
|
|
Dividends from Net Investment Income | (.52) | (.46) | (.36) | (.315) | (.28) |
Distributions from Realized Capital Gains | — | — | — | — | — |
Total Distributions | (.52) | (.46) | (.36) | (.315) | (.28) |
Net Asset Value, End of Period | $33.79 | $31.29 | $28.31 | $24.91 | $20.68 |
|
|
|
|
|
|
Total Return | 9.76% | 12.20% | 15.12% | 22.09% | –18.04% |
|
|
|
|
|
|
Ratios/Supplemental Data |
|
|
|
|
|
Net Assets, End of |
|
|
|
|
|
Period (Millions) | $5,088 | $5,202 | $5,780 | $5,119 | $4,338 |
Ratio of Total Expenses to |
|
|
|
|
|
Average Net Assets1 | 0.38% | 0.40% | 0.42% | 0.46% | 0.45% |
Ratio of Net Investment |
|
|
|
|
|
Income to Average Net Assets | 1.65% | 1.53% | 1.35% | 1.39% | 1.02% |
Portfolio Turnover Rate2 | 93% | 84% | 79% | 88% | 70% |
1 Includes performance-based investment advisory fee increases (decreases) of 0.01%, 0.01%, 0.01%, 0.00%, and 0.03%.
2 Excludes the value of portfolio securities received or delivered as a result of in-kind purchases or redemptions of the fund’s capital shares.
17
Growth and Income Fund Admiral Shares |
|
|
|
|
|
|
|
| Year Ended September 30, | ||
For a Share Outstanding Throughout Each Period | 2006 | 2005 | 2004 | 2003 | 2002 |
Net Asset Value, Beginning of Period | $51.12 | $46.25 | $40.70 | $33.78 | $41.66 |
Investment Operations |
|
|
|
|
|
Net Investment Income | .997 | .849 | .683 | .567 | .505 |
Net Realized and Unrealized Gain (Loss) |
|
|
|
|
|
on Investments | 4.036 | 4.853 | 5.530 | 6.920 | (7.877) |
Total from Investment Operations | 5.033 | 5.702 | 6.213 | 7.487 | (7.372) |
Distributions |
|
|
|
|
|
Dividends from Net Investment Income | (.953) | (.832) | (.663) | (.567) | (.508) |
Distributions from Realized Capital Gains | — | — | — | — | — |
Total Distributions | (.953) | (.832) | (.663) | (.567) | (.508) |
Net Asset Value, End of Period | $55.20 | $51.12 | $46.25 | $40.70 | $33.78 |
|
|
|
|
|
|
Total Return | 9.97% | 12.39% | 15.29% | 22.29% | –17.95% |
|
|
|
|
|
|
Ratios/Supplemental Data |
|
|
|
|
|
Net Assets, End of Period (Millions) | $2,321 | $2,039 | $843 | $812 | $606 |
Ratio of Total Expenses to |
|
|
|
|
|
Average Net Assets1 | 0.20% | 0.23% | 0.25% | 0.31% | 0.34% |
Ratio of Net Investment Income to |
|
|
|
|
|
Average Net Assets | 1.83% | 1.68% | 1.51% | 1.54% | 1.17% |
Portfolio Turnover Rate2 | 93% | 84% | 79% | 88% | 70% |
1 Includes performance-based investment advisory fee increases (decreases) of 0.01%, 0.01%, 0.01%, 0.00%, and 0.03%.
2 Excludes the value of portfolio securities received or delivered as a result of in-kind purchases or redemptions of the fund’s capital shares. See accompanying Notes, which are an integral part of the Financial Statements.
18
Notes to Financial Statements
Vanguard Growth and Income Fund is registered under the Investment Company Act of 1940 as an open-end investment company, or mutual fund. The fund files reports with the SEC under the company name Vanguard Quantitative Funds. The fund offers two classes of shares, Investor Shares and Admiral Shares. Investor Shares are available to any investor who meets the fund’s minimum purchase requirements. Admiral Shares are designed for investors who meet certain administrative, servicing, tenure, and account-size criteria.
A. The following significant accounting policies conform to generally accepted accounting principles for U.S. mutual funds. The fund consistently follows such policies in preparing its financial statements.
1. Security Valuation: Securities are valued as of the close of trading on the New York Stock Exchange (generally 4:00 p.m., Eastern time) on the valuation date. Equity securities are valued at the latest quoted sales prices or official closing prices taken from the primary market in which each security trades; such securities not traded on the valuation date are valued at the mean of the latest quoted bid and asked prices. Securities for which market quotations are not readily available, or whose values have been materially affected by events occurring before the fund’s pricing time but after the close of the securities’ primary markets, are valued by methods deemed by the board of trustees to represent fair value. Investments in Vanguard Market Liquidity Fund are valued at that fund’s net asset value. Temporary cash investments acquired over 60 days to maturity are valued using the latest bid prices or using valuations based on a matrix system (which considers such factors as security prices, yields, maturities, and ratings), both as furnished by independent pricing services. Other temporary cash investments are valued at amortized cost, which approximates market value.
2. Futures Contracts: The fund uses index futures contracts to a limited extent, with the objective of maintaining full exposure to the stock market while maintaining liquidity. The fund may purchase or sell futures contracts to achieve a desired level of investment, whether to accommodate portfolio turnover or cash flows from capital share transactions. The primary risks associated with the use of futures contracts are imperfect correlation between changes in market values of stocks held by the fund and the prices of futures contracts, and the possibility of an illiquid market.
Futures contracts are valued at their quoted daily settlement prices. The aggregate principal amounts of the contracts are not recorded in the Statement of Net Assets. Fluctuations in the value of the contracts are recorded in the Statement of Net Assets as an asset (liability) and in the Statement of Operations as unrealized appreciation (depreciation) until the contracts are closed, when they are recorded as realized futures gains (losses).
3. Federal Income Taxes: The fund intends to continue to qualify as a regulated investment company and distribute all of its taxable income. Accordingly, no provision for federal income taxes is required in the financial statements.
4. Distributions: Distributions to shareholders are recorded on the ex-dividend date.
5. Security Lending: The fund may lend its securities to qualified institutional borrowers to earn additional income. Security loans are required to be secured at all times by collateral at least equal to the market value of securities loaned. The fund invests cash collateral received in Vanguard Market Liquidity Fund, and records a liability for the return of the collateral, during the period the securities are on loan. Security lending income represents the income earned on investing cash collateral, less expenses associated with the loan.
19
6. Other: Dividend income is recorded on the ex-dividend date. Interest income includes income distributions received from Vanguard Market Liquidity Fund and is accrued daily. Security transactions are accounted for on the date securities are bought or sold. Costs used to determine realized gains (losses) on the sale of investment securities are those of the specific securities sold.
Each class of shares has equal rights as to assets and earnings, except that each class separately bears certain class-specific expenses related to maintenance of shareholder accounts (included in Management and Administrative expenses) and shareholder reporting. Marketing and distribution expenses are allocated to each class of shares based on a method approved by the board of trustees. Income, other non-class-specific expenses, and gains and losses on investments are allocated to each class of shares based on its relative net assets.
B. Franklin Portfolio Associates, LLC, provides investment advisory services to the fund for a fee calculated at an annual percentage rate of average net assets. The basic fee is subject to quarterly adjustments based on the fund’s performance for the preceding three years relative to the S&P 500 Index. For the year ended September 30, 2006, the investment advisory fee represented an effective annual basic rate of 0.09% of the fund’s average net assets, before an increase of $438,000 (0.01%) based on performance.
C. The Vanguard Group furnishes at cost corporate management, administrative, marketing, and distribution services. The costs of such services are allocated to the fund under methods approved by the board of trustees. The fund has committed to provide up to 0.40% of its net assets in capital contributions to Vanguard. At September 30, 2006, the fund had contributed capital of $766,000 to Vanguard (included in Other Assets), representing 0.01% of the fund’s net assets and 0.77% of Vanguard’s capitalization. The fund’s trustees and officers are also directors and officers of Vanguard.
D. The fund has asked its investment advisor to direct certain security trades, subject to obtaining the best price and execution, to brokers who have agreed to rebate to the fund part of the commissions generated. Such rebates are used solely to reduce the fund’s management and administrative expenses. For the year ended September 30, 2006, these arrangements reduced the fund’s expenses by $2,589,000 (an annual rate of 0.04% of average net assets).
E. Distributions are determined on a tax basis and may differ from net investment income and realized capital gains for financial reporting purposes. Differences may be permanent or temporary. Permanent differences are reclassified among capital accounts in the financial statements to reflect their tax character. Temporary differences arise when certain items of income, expense, gain, or loss are recognized in different periods for financial statement and tax purposes; these differences will reverse at some time in the future. Differences in classification may also result from the treatment of short-term gains as ordinary income for tax purposes.
During the year ended September 30, 2006, the fund realized $9,613,000 of net capital gains resulting from in-kind redemptions, in which shareholders exchanged fund shares for securities held by the fund rather than for cash. Because such gains are not taxable to the fund, and are not distributed to shareholders, they have been reclassified from accumulated net realized losses to paid-in capital.
For tax purposes, at September 30, 2006, the fund had $33,280,000 of ordinary income available for distribution. The fund had available realized losses of $130,065,000 to offset future net capital gains through September 30, 2011.
20
At September 30, 2006, the cost of investment securities for tax purposes was $6,372,593,000. Net unrealized appreciation of investment securities for tax purposes was $1,042,317,000, consisting of unrealized gains of $1,144,770,000 on securities that had risen in value since their purchase and $102,453,000 in unrealized losses on securities that had fallen in value since their purchase.
At September 30, 2006, the aggregate settlement value of open futures contracts expiring in December 2006 and the related unrealized appreciation (depreciation) were:
|
|
| ($000) |
| Number | Aggregate | Unrealized |
| of Long | Settlement | Appreciation |
Futures Contracts | Contracts | Value | (Depreciation) |
S&P 500 Index | 110 | 36,999 | 779 |
Unrealized appreciation (depreciation) on open futures contracts is required to be treated as realized gain (loss) for tax purposes.
F. During the year ended September 30, 2006, the fund purchased $6,699,445,000 of investment securities and sold $7,052,894,000 of investment securities, other than U.S. government securities and temporary cash investments.
G. Capital share transactions for each class of shares were:
|
| Year Ended September 30, | ||
|
| 2006 |
| 2005 |
| Amount | Shares | Amount | Shares |
| ($000) | (000) | ($000) | (000) |
Investor Shares |
|
|
|
|
Issued | 551,404 | 17,017 | 741,054 | 24,449 |
Issued in Lieu of Cash Distributions | 77,996 | 2,451 | 85,823 | 2,817 |
Redeemed | (1,138,743) | (35,170) | (1,996,559) | (65,179) |
Net Increase (Decrease)—Investor Shares | (509,343) | (15,702) | (1,169,682) | (37,913) |
Admiral Shares |
|
|
|
|
Issued | 428,118 | 8,127 | 1,229,063 | 24,473 |
Issued in Lieu of Cash Distributions | 35,887 | 691 | 17,720 | 356 |
Redeemed | (353,711) | (6,672) | (157,819) | (3,171) |
Net Increase (Decrease)—Admiral Shares | 110,294 | 2,146 | 1,088,964 | 21,658 |
H. In June 2006, the Financial Accounting Standards Board issued Interpretation No. 48 (“FIN 48”), “Accounting for Uncertainty in Income Taxes.” FIN 48 establishes the minimum threshold for recognizing, and a system for measuring, the benefits of tax-return positions in financial statements. FIN 48 will be effective for the fund’s fiscal year beginning October 1, 2007. Management is in the process of analyzing the fund’s tax positions for purposes of implementing FIN 48; based on the analysis completed to date, management does not believe the adoption of FIN 48 will result in any material impact to the fund’s financial statements.
21
Report of Independent Registered Public Accounting Firm
To the Trustees of Vanguard Quantitative Funds and the Shareholders of Vanguard Growth and Income Fund:
In our opinion, the accompanying statement of net assets and the related statements of operations and of changes in net assets and the financial highlights present fairly, in all material respects, the financial position of Vanguard Growth and Income Fund (the “Fund”) at September 30, 2006, the results of its operations for the year then ended, the changes in its net assets for each of the two years in the period then ended, and the financial highlights for each of the five years in the period then ended, in conformity with accounting principles generally accepted in the United States of America. These financial statements and financial highlights (hereafter referred to as “financial statements”) are the responsibility of the Fund’s management; our responsibility is to express an opinion on these financial statements based on our audits. We conducted our audits of these financial statements in accordance with the standards of the Public Company Accounting Oversight Board (United States), which require that we plan and perform the audit to obtain reasonable assurance about whether the financial statements are free of material misstatement. An audit includes examining, on a test basis, evidence supporting the amounts and disclosures in the financial statements, assessing the accounting principles used and significant estimates made by management, and evaluating the overall financial statement presentation. We believe that our audits, which included confirmation of securities at September 30, 2006 by correspondence with the custodian and broker, and by agreement to the underlying ownership records for Vanguard Market Liquidity Fund, provide a reasonable basis for our opinion.
PricewaterhouseCoopers LLP
Philadelphia, Pennsylvania
November 13, 2006
Special 2006 tax information (unaudited) for Vanguard Growth and Income Fund
This information for the fiscal year ended September 30, 2006, is included pursuant to provisions of the Internal Revenue Code.
The fund distributed $121,393,000 of qualified dividend income to shareholders during the fiscal year.
For corporate shareholders, 100% of investment income (dividend income plus short-term gains, if any) qualifies for the dividends-received deduction.
22
Your Fund’s After-Tax Returns
This table presents returns for your fund both before and after taxes. The after-tax returns are shown in two ways: (1) assuming that an investor owned the fund during the entire period and paid taxes on the fund’s distributions, and (2) assuming that an investor paid taxes on the fund’s distributions and sold all shares at the end of each period.
Calculations are based on the highest individual federal income tax and capital gains tax rates in effect at the times of the distributions and the hypothetical sales. State and local taxes were not considered. After-tax returns reflect any qualified dividend income, using actual prior-year figures and estimates for 2006. (In the example, returns after the sale of fund shares may be higher than those assuming no sale. This occurs when the sale would have produced a capital loss. The calculation assumes that the investor received a tax deduction for the loss.)
The table shows returns for Investor Shares only; returns for other share classes will differ. Please note that your actual after-tax returns will depend on your tax situation and may differ from those shown. Also note that if you own the fund in a tax-deferred account, such as an individual retirement account or a 401(k) plan, this information does not apply to you. Such accounts are not subject to current taxes.
Finally, keep in mind that a fund’s performance—whether before or after taxes—does not guarantee future results.
Average Annual Total Returns: Growth and Income Investor Shares |
|
|
|
Periods Ended September 30, 2006 |
|
|
|
| One | Five | Ten |
| Year | Years | Years |
Returns Before Taxes | 9.76% | 7.24% | 9.10% |
Returns After Taxes on Distributions | 9.50 | 6.94 | 7.79 |
Returns After Taxes on Distributions and Sale of Fund Shares | 6.67 | 6.15 | 7.29 |
23
About Your Fund’s Expenses
As a shareholder of the fund, you incur ongoing costs, which include costs for portfolio management, administrative services, and shareholder reports (like this one), among others. Operating expenses, which are deducted from a fund’s gross income, directly reduce the investment return of the fund.
A fund’s expenses are expressed as a percentage of its average net assets. This figure is known as the expense ratio. The following examples are intended to help you understand the ongoing costs (in dollars) of investing in your fund and to compare these costs with those of other mutual funds. The examples are based on an investment of $1,000 made at the beginning of the period shown and held for the entire period.
The table below illustrates your fund’s costs in two ways:
• Based on actual fund return. This section helps you to estimate the actual expenses that you paid over the period. The “Ending Account Value” shown is derived from the fund’s actual return, and the third column shows the dollar amount that would have been paid by an investor who started with $1,000 in the fund. You may use the information here, together with the amount you invested, to estimate the expenses that you paid over the period.
To do so, simply divide your account value by $1,000 (for example, an $8,600 account value divided by $1,000 = 8.6), then multiply the result by the number given for your fund under the heading “Expenses Paid During Period.”
• Based on hypothetical 5% yearly return. This section is intended to help you compare your fund’s costs with those of other mutual funds. It assumes that the fund had a yearly return of 5% before expenses, but that the expense ratio is unchanged. In this case—because the return used is not the fund’s actual return—the results do not apply to your investment. The example is useful in making comparisons because the Securities and Exchange Commission requires all mutual funds to calculate expenses based on a 5% return. You can assess your fund’s costs by comparing this hypothetical example with the hypothetical examples that appear in shareholder reports of other funds.
Six Months Ended September 30, 2006 |
|
|
|
| Beginning | Ending | Expenses |
| Account Value | Account Value | Paid During |
Growth and Income Fund | 3/31/2006 | 9/30/2006 | Period1 |
Based on Actual Fund Return |
|
|
|
Investor Shares | $1,000.00 | $1,029.58 | $1.88 |
Admiral Shares | 1,000.00 | 1,030.72 | 0.92 |
Based on Hypothetical 5% Yearly Return |
|
|
|
Investor Shares | $1,000.00 | $1,023.21 | $1.88 |
Admiral Shares | 1,000.00 | 1,024.17 | 0.91 |
1.The calculations are based on expenses incurred in the most recent six-month period. The fund’s annualized six-month expense ratios for that period are 0.37% for Investor Shares and 0.18% for Admiral Shares. The dollar amounts shown as “Expenses Paid” are equal to the annualized expense ratio multiplied by the average account value over the period, multiplied by the number of days in the most recent six-month period, then divided by the number of days in the most recent 12-month period.
24
Note that the expenses shown in the table are meant to highlight and help you compare ongoing costs only and do not reflect any transactional costs or account maintenance fees. They do not include your fund’s low-balance fee, which is described in the prospectus. If this fee were applied to your account, your costs would be higher. Your fund does not charge transaction fees, such as purchase or redemption fees, nor does it carry a “sales load.”
The calculations assume no shares were bought or sold during the period. Your actual costs may have been higher or lower, depending on the amount of your investment and the timing of any purchases or redemptions.
You can find more information about the fund’s expenses, including annual expense ratios, in the Financial Statements section of this report. For additional information on operating expenses and other shareholder costs, please refer to the appropriate fund prospectus.
25
Trustees Approve Advisory Agreement
The board of trustees of Vanguard Growth and Income Fund has renewed the fund’s investment advisory agreement with Franklin Portfolio Associates, LLC. The board determined that the retention of Franklin was in the best interests of the fund and its shareholders.
The board based its decision upon an evaluation of Franklin’s investment staff, portfolio management process, and performance. The trustees considered the factors discussed below, among others. However, no single factor determined whether the board approved the agreement. Rather, it was the totality of the circumstances that drove the board’s decision.
Nature, extent, and quality of services
The board considered the quality of the fund’s investment management over both the short and long term and the organizational depth and stability of the advisory firm. The board noted that Franklin, founded in 1982, is known for quantitative equity management combining investment experience and the use of financial databases and computer modeling. The firm has advised the Growth and Income Fund since 1986. The investment team at Franklin employs a quantitative investment strategy that seeks to provide a total return greater than that of the S&P 500 Index by investing in U.S. large- and mid-capitalization stocks. Stock selection is driven by a series of more than 40 computer models covering a broad range of public data.
The board concluded that the advisor’s experience, stability, depth, and performance, among other factors, warranted continuation of the advisory agreement.
Investment performance
The board considered the short- and long-term performance of the fund, including any periods of outperformance or underperformance of a relevant benchmark and peer group. The board noted that the advisor has carried out the fund’s investment strategy in disciplined fashion, and that the results have been solid. Information about the fund’s performance, including some of the data considered by the board, can be found in the Performance Summary section of this report.
Cost
The board concluded that the fund’s expense ratio was far below the average expense ratio charged by funds in its peer group. The board noted that the fund’s advisory fee was also well below the peer-group average. Information about the fund’s expense ratio appears in the About Your Fund’s Expenses section of this report as well as in the Financial Statements section, which also includes information about the advisory fee rate. The board did not consider profitability of Franklin in determining whether to approve the advisory fee, because Franklin is independent of Vanguard, and the advisory fee is the result of arm’s-length negotiations.
The benefit of economies of scale
The board concluded that the fund’s shareholders benefit from economies of scale because of breakpoints in the fund’s advisory fee schedule. The breakpoints reduce the effective rate of the fee as the fund’s assets increase.
The board also approved a change in the process for the quarterly calculation of Franklin’s asset-based advisory fee. The calculation now will be based on the average daily net assets of the fund, rather than the average month-end net assets.
The advisory agreement will continue for one year and is renewable by the fund’s board after that for successive one-year periods.
26
Glossary
Beta. A measure of the magnitude of a fund’s past share-price fluctuations in relation to the ups and downs of a given market index. The index is assigned a beta of 1.00. Compared with a given index, a fund with a beta of 1.20 typically would have seen its share price rise or fall by 12% when the index rose or fell by 10%. A fund’s beta should be reviewed in conjunction with its R-squared (see definition below). The lower the R-squared, the less correlation there is between the fund and the index, and the less reliable beta is as an indicator of volatility.
Earnings Growth Rate. The average annual rate of growth in earnings over the past five years for the stocks now in a fund.
Expense Ratio. The percentage of a fund’s average net assets used to pay its annual administrative and advisory expenses. These expenses directly reduce returns to investors.
Foreign Holdings. The percentage of a fund represented by stocks or depositary receipts of companies based outside the United States.
Median Market Cap. An indicator of the size of companies in which a fund invests; the midpoint of market capitalization (market price x shares outstanding) of a fund’s stocks, weighted by the proportion of the fund’s assets invested in each stock. Stocks representing half of the fund’s assets have market capitalizations above the median, and the rest are below it.
Price/Book Ratio. The share price of a stock divided by its net worth, or book value, per share. For a fund, the weighted average price/book ratio of the stocks it holds.
Price/Earnings Ratio. The ratio of a stock’s current price to its per-share earnings over the past year. For a fund, the weighted average P/E of the stocks it holds. P/E is an indicator of market expectations about corporate prospects; the higher the P/E, the greater the expectations for a company’s future growth.
R-Squared. A measure of how much of a fund’s past returns can be explained by the returns from the market in general, as measured by a given index. If a fund’s total returns were precisely synchronized with an index’s returns, its R-squared would be 1.00. If the fund’s returns bore no relationship to the index’s returns, its R-squared would be 0.
Return on Equity. The annual average rate of return generated by a company during the past five years for each dollar of shareholder’s equity (net income divided by shareholder’s equity). For a fund, the weighted average return on equity for the companies whose stocks it holds.
Short-Term Reserves. The percentage of a fund invested in highly liquid, short-term securities that can be readily converted to cash.
Turnover Rate. An indication of the fund’s trading activity. Funds with high turnover rates incur higher transaction costs and may be more likely to distribute capital gains (which may be taxable to investors). The turnover rate excludes in-kind transactions, which have minimal impact on costs.
Yield. A snapshot of a fund’s income from interest and dividends. The yield, expressed as a percentage of the fund’s net asset value, is based on income earned over the past 30 days and is annualized, or projected forward for the coming year. The index yield is based on the current annualized rate of income provided by securities in the index.
27
The People Who Govern Your Fund
The trustees of your mutual fund are there to see that the fund is operated and managed in your best interests since, as a shareholder, you are a part owner of the fund. Your fund’s trustees also serve on the board of directors of The Vanguard Group, Inc., which is owned by the Vanguard funds and provides services to them on an at-cost basis.
A majority of Vanguard’s board members are independent, meaning that they have no affiliation with Vanguard or the funds they oversee, apart from the sizable personal investments they have made as private individuals.
Our independent board members bring distinguished backgrounds in business, academia, and public service to their task of working with Vanguard officers to establish the policies and oversee the activities of the funds. Among board members’ responsibilities are selecting investment advisors for the funds; monitoring fund operations, performance, and costs; reviewing contracts; nominating and selecting new trustees/directors; and electing Vanguard officers.
Each trustee serves a fund until its termination; or until the trustee’s retirement, resignation, or death; or otherwise as specified in the fund’s organizational documents. Any trustee may be removed at a shareholders’ meeting by a vote representing two-thirds of the net asset value of all shares of the fund together with shares of other Vanguard funds organized within the same trust. The table on these two pages shows information for each trustee and executive officer of the fund. The mailing address of the trustees and officers is P.O. Box 876, Valley Forge, PA 19482.
Chairman of the Board, Chief Executive Officer, and Trustee | |
|
|
John J. Brennan1 |
|
Born 1954 | Principal Occupation(s) During the Past Five Years: Chairman of the Board, Chief |
Trustee since May 1987; | Executive Officer, and Director/Trustee of The Vanguard Group, Inc., and of each |
Chairman of the Board and | of the investment companies served by The Vanguard Group. |
Chief Executive Officer |
|
142 Vanguard Funds Overseen | |
|
|
Independent Trustees |
|
|
|
Charles D. Ellis |
|
Born 1937 | Principal Occupation(s) During the Past Five Years: Applecore Partners (pro bono ventures |
Trustee since January 2001 | in education); Senior Advisor to Greenwich Associates (international business strategy |
142 Vanguard Funds Overseen | consulting); Successor Trustee of Yale University; Overseer of the Stern School of Business |
| at New York University; Trustee of the Whitehead Institute for Biomedical Research. |
|
|
Rajiv L. Gupta |
|
Born 1945 | Principal Occupation(s) During the Past Five Years: Chairman and Chief Executive Officer |
Trustee since December 20012 | of Rohm and Haas Co. (chemicals); Board Member of the American Chemistry Council; |
142 Vanguard Funds Overseen | Director of Tyco International, Ltd. (diversified manufacturing and services) (since 2005); |
| Trustee of Drexel University and of the Chemical Heritage Foundation. |
|
|
Amy Gutmann |
|
Born 1949 | Principal Occupation(s) During the Past Five Years: President of the University of |
Trustee since June 2006 | Pennsylvania since 2004; Professor in the School of Arts and Sciences, Annenberg School |
142 Vanguard Funds Overseen | for Communication, and Graduate School of Education of the University of Pennsylvania |
| since 2004; Provost (2001–2004) and Laurance S. Rockefeller Professor of Politics and the |
| University Center for Human Values (1990–2004), Princeton University; Director of Carnegie |
| Corporation of New York and of Philadelphia 2016 (since 2005) and of Schuylkill River |
| Development Corporation and Greater Philadelphia Chamber of Commerce (since 2004). |
JoAnn Heffernan Heisen |
| |
Born 1950 | Principal Occupation(s) During the Past Five Years: Corporate Vice President and Chief | |
Trustee since July 1998 | Global Diversity Officer (since January 2006), Vice President and Chief Information | |
142 Vanguard Funds Overseen | Officer (1997–2005), and Member of the Executive Committee of Johnson & Johnson | |
| (pharmaceuticals/consumer products); Director of the University Medical Center at | |
| Princeton and Women’s Research and Education Institute. | |
|
| |
André F. Perold |
| |
Born 1952 | Principal Occupation(s) During the Past Five Years: George Gund Professor of Finance and | |
Trustee since December 2004 | Banking, Harvard Business School (since 2000); Senior Associate Dean, Director of Faculty | |
142 Vanguard Funds Overseen | Recruiting, and Chair of Finance Faculty, Harvard Business School; Director and Chairman | |
| of UNX, Inc. (equities trading firm) (since 2003); Director of registered investment | |
| companies advised by Merrill Lynch Investment Managers and affiliates (1985–2004), | |
| Genbel Securities Limited (South African financial services firm) (1999–2003), Gensec | |
| Bank (1999–2003), Sanlam, Ltd. (South African insurance company) (2001–2003), and | |
| Stockback, Inc. (credit card firm) (2000–2002). | |
|
| |
Alfred M. Rankin, Jr. |
| |
Born 1941 | Principal Occupation(s) During the Past Five Years: Chairman, President, Chief Executive | |
Trustee since January 1993 | Officer, and Director of NACCO Industries, Inc. (forklift trucks/housewares/ lignite); | |
142 Vanguard Funds Overseen | Director of Goodrich Corporation (industrial products/aircraft systems and services). | |
|
| |
J. Lawrence Wilson |
| |
Born 1936 | Principal Occupation(s) During the Past Five Years: Retired Chairman and Chief Executive | |
Trustee since April 1985 | Officer of Rohm and Haas Co. (chemicals); Director of Cummins Inc. (diesel engines), | |
142 Vanguard Funds Overseen | MeadWestvaco Corp. (packaging products), and AmerisourceBergen Corp. (pharmaceutical | |
| distribution); Trustee of Vanderbilt University and of Culver Educational Foundation. | |
|
| |
Executive Officers1 |
| |
|
| |
Heidi Stam |
| |
Born 1956 | Principal Occupation(s) During the Past Five Years: Principal of The Vanguard Group, Inc., | |
Secretary since July 2005 | since November 1997; General Counsel of The Vanguard Group since July 2005; | |
142 Vanguard Funds Overseen | Secretary of The Vanguard Group and of each of the investment companies served | |
| by The Vanguard Group since July 2005. | |
|
| |
Thomas J. Higgins |
| |
Born 1957 | Principal Occupation(s) During the Past Five Years: Principal of The Vanguard Group, Inc.; | |
Treasurer since July 1998 | Treasurer of each of the investment companies served by The Vanguard Group. | |
142 Vanguard Funds Overseen |
| |
|
| |
Vanguard Senior Management Team | ||
|
| |
R. Gregory Barton | Kathleen C. Gubanich | Michael S. Miller |
Mortimer J. Buckley | Paul A. Heller | Ralph K. Packard |
James H. Gately | F. William McNabb, III | George U. Sauter |
|
| |
Founder |
| |
|
| |
John C. Bogle |
| |
Chairman and Chief Executive Officer, 1974–1996 | ||
1 Officers of the funds are “interested persons” as defined in the Investment Company Act of 1940.
2 December 2002 for Vanguard Equity Income Fund, Vanguard Growth Equity Fund, the Vanguard Municipal Bond Funds, and the Vanguard State Tax-Exempt Funds.
More information about the trustees is in the Statement of Additional Information, available from The Vanguard Group.
|
|
| P.O. Box 2600 |
| Valley Forge, PA 19482-2600 |

Connect with Vanguard™ > www.vanguard.com
Fund Information > 800-662-7447 | Vanguard, Admiral ,Connect with Vanguard, and the ship |
| logo are trademarks of The Vanguard Group, Inc. |
Direct Investor Account Services > 800-662-2739 |
|
| All other marks are the exclusive property of their |
Institutional Investor Services > 800-523-1036 | respective owners. |
|
|
Text Telephone > 800-952-3335 | All comparative mutual fund data are from Lipper Inc. |
| or Morningstar, Inc., unless otherwise noted. |
|
|
|
|
|
|
|
|
This material may be used in conjunction | You can obtain a free copy of Vanguard’s proxy voting |
with the offering of shares of any Vanguard | guidelines by visiting our website, www.vanguard.com, |
fund only if preceded or accompanied by | and searching for “proxy voting guidelines,” or by calling |
the fund’s current prospectus. | Vanguard at 800-662-2739. They are also available from |
| the SEC’s website, www.sec.gov. In addition, you may |
| obtain a free report on how your fund voted the proxies for |
| securities it owned during the 12 months ended June 30. |
| To get the report, visit either www.vanguard.com |
| or www.sec.gov. |
|
|
| You can review and copy information about your fund |
| at the SEC’s Public Reference Room in Washington, D.C. |
| To find out more about this public service, call the SEC |
| at 202-551-8090. Information about your fund is also |
| available on the SEC’s website, and you can receive |
| copies of this information, for a fee, by sending a |
| request in either of two ways: via e-mail addressed to |
| publicinfo@sec.gov or via regular mail addressed to the |
| Public Reference Section, Securities and Exchange |
| Commission, Washington, DC 20549-0102. |
|
|
|
|
|
|
|
|
| © 2006 The Vanguard Group, Inc. |
| All rights reserved. |
| Vanguard Marketing Corporation, Distributor. |
|
|
| Q930 112006 |
|
|
|
|
| Vanguard® Structured Large-Cap Equity Fund |
|
|
|
|
|
|
|
|
|
|
| > Annual Report |
|
|
|
|
|
|
|
|
|
|
|
|
|
|
|
|
|
|
| September 30, 2006 |
|
|
|
|
|
|
|
| ||
|
|
| |
|
|
| |
|
|
| |
|
|
| |
|
|
| |
|
|
| |
|
|
| |
|
|
| |
> | From the fund’s inception in May through the rest of the fiscal year |
| ended September 30, 2006, Vanguard Structured Large-Cap Equity |
| Fund returned more than 4%. |
|
|
> | The fund was launched during a fairly volatile period for stocks. |
|
|
|
|
> | Strong stock selection in the information technology and consumer |
| discretionary sectors boosted the fund’s relative performance. |
Contents |
|
|
|
Your Fund’s Total Returns | 1 |
Chairman’s Letter | 2 |
Advisor’s Report | 6 |
Fund Profile | 8 |
Performance Summary | 9 |
Financial Statements | 10 |
Glossary | 22 |
Please note: The opinions expressed in this report are just that—informed opinions. They should not be considered promises or advice. Also, please keep in mind that the information and opinions cover the period through the date on the cover of this report. Of course, the risks of investing in your fund are spelled out in the prospectus.
Your Fund’s Total Returns
Period Ended September 30, 2006 |
|
| Returns Since |
| Inception1 |
Vanguard Structured Large-Cap Equity Fund—Institutional Shares | 4.3% |
S&P 500 Index | 4.1 |
Average Large-Cap Core Fund2 | 3.1 |
Dow Jones Wilshire 5000 Index | 2.8 |
|
|
|
|
Vanguard Structured Large-Cap Equity Fund—Institutional Plus Shares | 4.1% |
S&P 500 Index | 3.9 |
Average Large-Cap Core Fund2 | 2.9 |
Dow Jones Wilshire 5000 Index | 2.7 |
Your Fund’s Performance at a Glance |
|
|
|
|
|
|
| Distributions Per Share | |
| Starting | Ending | Income | Capital |
| Share Price3 | Share Price | Dividends | Gains |
Vanguard Structured Large-Cap Equity Fund |
|
|
|
|
Institutional Shares | $24.96 | $26.03 | $0.00 | $0.00 |
Institutional Plus Shares | 50.00 | 52.07 | 0.00 | 0.00 |
1 | Inception was May 16, 2006, for Institutional Shares and May 15, 2006, for Institutional Plus Shares. |
2 | Derived from data provided by Lipper Inc. |
3 | At inception. |
1

Chairman’s Letter
Dear Shareholder,
I am pleased to present the first progress report for Vanguard Structured Large-Cap Equity Fund. Thank you for investing in the fund.
In its first 41/2 months of operation, the fund returned 4.3% for Institutional Shares and 4.1% for Institutional Plus Shares. (Note that the two share classes were launched on different days.) These results bested the performance of the benchmark Standard & Poor’s 500 Index and the average return of large-cap core funds. The fund’s structured approach to risk control was put to the test from the start, and the fund performed admirably during a particularly volatile May, June, and July.
Stocks endured some rough going, then recovered to post strong results
The stock market advanced through the first part of the past 12 months, then hit a speed bump in May, as investors feared that the economy was growing too rapidly. But a slowdown in the housing market, coupled with a late-summer decline in oil prices, helped to allay inflation concerns. The broad market rebounded to post a solid 10.5% return for the 12-month period. Value-oriented stocks outperformed growth stocks, and large-capitalization stocks edged out small-caps, one of the market’s best-performing segments in recent years.
2
International stocks handily outpaced domestic issues, continuing a multiyear trend. European and emerging market stocks fared particularly well. Stocks in the Pacific region also performed admirably, even though Japanese stocks did not fully participate in the global market’s summer recovery.
In the bond market, prices rallied as the Fed paused
At its August and September meetings, the Federal Reserve Board twice voted to maintain the federal funds rate at 5.25%, marking a pause in the central bank’s two-year inflation-fighting campaign. With investor sentiment buoyed by the Fed’s near-term inflation outlook, interest rates decreased, driving bond prices higher. The broad taxable bond market finished the 12-month period with a 3.7% return, and municipal bonds performed slightly better.
Although rates decreased along the entire maturity spectrum in late summer, the difference between the yields of the shortest- and longest-term issues remained narrow by historical standards. At the end of September, the U.S. Treasury yield curve was actually inverted, meaning that short-term issues such as 3-month and 6-month Treasury notes offered higher yields than those with longer maturities.
Market Barometer |
|
|
|
|
| Average Annual Total Returns | |
|
| Periods Ended September 30, 2006 | |
| One Year | Three Years | Five Years |
Stocks |
|
|
|
Russell 1000 Index (Large-caps) | 10.2% | 12.8% | 7.6% |
Russell 2000 Index (Small-caps) | 9.9 | 15.5 | 13.8 |
Dow Jones Wilshire 5000 Index (Entire market) | 10.5 | 13.3 | 8.6 |
MSCI All Country World Index ex USA (International) | 19.4 | 23.9 | 16.4 |
|
|
|
|
Bonds |
|
|
|
Lehman Aggregate Bond Index (Broad taxable market) | 3.7% | 3.4% | 4.8% |
Lehman Municipal Bond Index | 4.5 | 4.4 | 5.2 |
Citigroup 3-Month Treasury Bill Index | 4.4 | 2.6 | 2.2 |
|
|
|
|
CPI |
|
|
|
Consumer Price Index | 2.1% | 3.1% | 2.6% |
3
The fund established solid footing in an unsettled stock market
When Vanguard Structured Large-Cap Equity Fund began its operations on May 15, it entered a tumultuous stock market. The fund’s benchmark, the S&P 500 Index, declined 2.1% during the fund’s first week, then traced a jagged path over the next few months. The index did not close above its May 15 level until the middle of August.
Launching a fund in that environment immediately tested the risk-control strategy of the fund’s advisor, Vanguard Quantitative Equity Group. Through its quantitative stock-selection model, the advisor guided the fund past the results of the S&P 500 Index. The model factors in investor sentiment, valuation, and the quality of earnings for individual stocks, while maintaining sector weightings that are essentially the same as those in the benchmark.
Although a few months’ performance is largely meaningless, the fund did outperform the S&P 500 Index in six of its ten sectors. In tech, the fund’s positioning among software, semi-conductor, and communication equipment stocks drove its outperformance. In consumer discretionary, a handful of restaurants, retailers, and apparel companies did well. In the fund’s largest sector, financials, the advisor steered the fund to a performance that was largely in line with that of the benchmark.
Relative performance was hampered by selections in the energy and materials sectors. A number of oil and gas drillers, as well as some equipment and services firms, contributed to the fund’s –1% return in the energy sector. In materials, the fund’s smallest sector, metal and mining stocks were the greatest detractors from total return.
4
Fund seeks to outperform index while keeping risk in check
If you’ll pardon the baseball metaphor, the Structured Large-Cap Equity Fund does not attempt to hit grand slams. Rather, it’s designed to hit singles and doubles, edging past the results of the S&P 500 Index over time. Importantly, the fund seeks to achieve those returns without taking on significantly more risk than the benchmark. The fund’s structured risk-control process entails slightly overweighting or underweighting individual stocks, while keeping other measures such as sector exposure and valuation in line with the index.
Of course, a four-month span is not adequate to truly evaluate the performance of this, or any, new fund. But we are encouraged by its promising start, and we also have confidence in the time-tested strategies, models, and methods that the Vanguard Quantitative Equity Group has honed in the management of several successful Vanguard funds. We look forward to keeping you abreast of this fund’s performance.
Thank you for investing with Vanguard.
Sincerely,

John J. Brennan
Chairman and Chief Executive Officer
October 18, 2006
5
Advisor’s Report
For the partial fiscal year ended September 30, 2006, Vanguard Structured Large-Cap Equity Fund returned 4.3% for Institutional Shares (launched on May 16), and 4.1% for Institutional Plus Shares (launched on May 15). The fund topped the return of its benchmark, the Standard & Poor’s 500 Index, and the average return of large-cap core funds.
The investment environment
The fund began operations on May 15, just in time for a spike in market volatility, which by June reached levels not seen in the last three years. Our structured approach to risk management paid off during this period, allowing the fund to weather the change in the market environment and earn excess returns.
Our risk-management approach involves controlling exposures at the security, industry, and characteristic levels. Relative to the S&P 500 Index, our maximum overweighting or underweighting of a security is 0.35%. We also minimize our difference from the benchmark in industry weightings, and we attempt to match the index in terms of capitalization, growth, and overall valuation characteristics. These strict controls are essential to our attempt to generate consistent excess return over time.
The fund’s successes and shortfalls
Ultimately, our performance will depend on how well we identify top-performing stocks within each market sector. Since the fund’s inception, the sector that has done best for us has been information technology, where our overweight positions in BMC Software (+26%) and Molex (+15%) and an underweight position in QUALCOMM (–25%) boosted the relative return. Consumer discretionary stocks were also a bright spot, thanks in part to overweight positions in Darden Restaurants (+14%) and VF Corporation (+21%). On the other hand, we were hurt by our energy and materials positions, where overweightings in Nabors Industries
6
(–17%) and U.S. Steel (–16%) dragged down results. Overall, we outperformed the index in six of ten sectors.
Our investment approach
Our process seeks to build excess return purely on stock selection. As described above, we try to neutralize other sources of returns, as our research indicates they do not pay off given the amount of risk involved.
Our selection model evaluates each stock in the S&P 500 Index for its relative performance potential based on three elements: market sentiment, valuation, and earnings quality relative to its peers. We believe that the market overreacts to short-term news and that at least one of these elements captures that overreaction; further, the use of three measures serves to diversify our model’s information. During the fiscal period, our valuation measure was the most successful component in our model, while the earnings-quality measure produced slightly positive results, and the sentiment measure was slightly negative. Each component will shine in different periods, helping to provide consistent stock selection information.
The combination of a structured risk-control process and a focus on pure stock selection positions the fund for most market environments. We hold a subset of the S&P 500 that mimics the benchmark’s risk profile but offers an attractive mix of market acceptance, reasonable valuation, and high earnings quality. The fund’s life span is still too short for any conclusions to be drawn, but we feel that its performance so far has demonstrated the potential of our risk/reward trade-off. Thank you for your investment.
James D. Troyer, Principal and
Portfolio Manager
Joel M. Dickson, Principal
Vanguard Quantitative Equity Group
October 23, 2006
7
Fund Profile
As of September 30, 2006
Portfolio Characteristics |
|
| |
| Comparative | Broad | |
| Fund | Index1 | Index2 |
Number of Stocks | 281 | 500 | 4,974 |
Median Market Cap | $56.1B | $56.1B | $27.5B |
Price/Earnings Ratio | 16.0x | 17.0x | 17.2x |
Price/Book Ratio | 2.8x | 2.8x | 3.7x |
Yield |
| 1.9% | 1.7% |
Institutional Shares | 1.7% |
|
|
Institutional Plus Shares | 1.8% |
|
|
Return on Equity | 18.7% | 18.9% | 15.4% |
Earnings Growth Rate | 17.5% | 17.0% | 15.7% |
Foreign Holdings | 0.0% | 0.0% | 1.1% |
Turnover Rate | 30% | — | — |
Expense Ratio |
| — | — |
Institutional Shares | 0.25%3 |
|
|
Institutional Plus Shares | 0.15%3 |
|
|
Short-Term Reserves | 0% | — | — |
Sector Diversification (% of portfolio) |
| ||
| Comparative | Broad | |
| Fund | Index1 | Index2 |
Consumer Discretionary | 10% | 10% | 12% |
Consumer Staples | 10 | 10 | 9 |
Energy | 9 | 9 | 9 |
Financials | 22 | 22 | 23 |
Health Care | 13 | 13 | 12 |
Industrials | 11 | 11 | 11 |
Information Technology | 15 | 15 | 15 |
Materials | 3 | 3 | 3 |
Telecommunication Services | 4 | 4 | 3 |
Utilities | 3 | 3 | 3 |
Ten Largest Holdings4 (% of total net assets) | ||
|
|
|
|
|
|
ExxonMobil Corp. | integrated oil and gas | 3.2% |
General Electric Co. | industrial conglomerate | 2.9 |
Citigroup, Inc. | diversified financial services | 2.2 |
Bank of America Corp. | diversified financial services | 2.1 |
Microsoft Corp. | systems software | 2.0 |
Pfizer Inc. | pharmaceuticals | 1.8 |
The Procter & Gamble Co. | household products | 1.8 |
Johnson & Johnson | pharmaceuticals | 1.5 |
JPMorgan Chase & Co. | diversified financial services | 1.5 |
Altria Group, Inc. | tobacco | 1.4 |
Top Ten |
| 20.4% |
Investment Focus
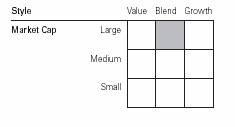
1 | S&P 500 Index. |
2 | Dow Jones Wilshire 5000 Index. |
3 | Annualized. |
4 | “Ten Largest Holdings” excludes any temporary cash investments and equity index products. See page 22 for a glossary of investment terms. |
8
Performance Summary
All of the returns in this report represent past performance, which is not a guarantee of future results that may be achieved by the fund. (Current performance may be lower or higher than the performance data cited. For performance data current to the most recent month-end, visit our website at www.vanguard.com.) Note, too, that both investment returns and principal value can fluctuate widely, so an investor’s shares, when sold, could be worth more or less than their original cost. The returns shown do not reflect taxes that a shareholder would pay on fund distributions or on the sale of fund shares.
Total Returns (%): Periods Ended September 30, 2006 |
|
|
|
| Final Value of a |
| Since | $5,000,000 |
| Inception1 | Investment |
Structured Large-Cap Equity Fund—Institutional Shares | 4.29% | $5,214,343 |
Dow Jones Wilshire 5000 Index | 2.80 | 5,140,162 |
S&P 500 Index | 4.12 | 5,206,066 |
Average Large Cap Core Fund2 | 3.07 | 5,153,594 |
|
|
|
|
| Final Value of a |
| Since | $200,000,000 |
| Inception3 | Investment |
Structured Large-Cap Equity Fund—Institutional Plus Shares | 4.14% | $208,280,000 |
Dow Jones Wilshire 5000 Index | 2.67 | 205,330,100 |
S&P 500 Index | 3.93 | 207,855,940 |
Total Returns (%): May 16, 2006–September 30, 2006

1 | May 16, 2006. |
2 | Derived from data provided by Lipper Inc. |
3 | May 15, 2006. |
Note: See Financial Highlights tables on pages 16 and 17 for dividend and capital gains information.
9
Financial Statements
Statement of Net Assets
As of September 30, 2006
The fund provides a complete list of its holdings four times in each fiscal year, at the quarter-ends. For the second and fourth fiscal quarters, the lists appear in the fund’s semiannual and annual reports to shareholders. For the first and third fiscal quarters, the fund files the lists with the Securities and Exchange Commission on Form N-Q. Shareholders can look up the fund’s Forms N-Q on the SEC’s website at www.sec.gov. Forms N-Q may also be reviewed and copied at the SEC’s Public Reference Room (see the back cover of this report for further information).
|
|
| Market | |
�� |
|
| Value• | |
|
| Shares | ($000) | |
Common Stocks (100.0%)1 |
|
| ||
Consumer Discretionary (10.2%) |
|
| ||
| Time Warner, Inc. | 127,480 | 2,324 | |
| The Walt Disney Co. | 69,763 | 2,156 | |
| Home Depot, Inc. | 51,660 | 1,874 | |
* | Comcast Corp. Class A | 48,297 | 1,780 | |
| Omnicom Group Inc. | 15,368 | 1,438 | |
| McDonald’s Corp. | 33,758 | 1,321 | |
| Darden Restaurants Inc. | 30,583 | 1,299 | |
| News Corp., Class A | 65,144 | 1,280 | |
| NIKE, Inc. Class B | 14,441 | 1,265 | |
| Sherwin-Williams Co. | 22,041 | 1,229 | |
| Limited Brands, Inc. | 45,580 | 1,207 | |
| Jones Apparel Group, Inc. | 34,000 | 1,103 | |
| Lowe’s Cos., Inc. | 38,658 | 1,085 | |
| Dillard’s Inc. | 31,522 | 1,032 | |
| General Motors Corp. | 29,386 | 977 | |
| Meredith Corp. | 19,800 | 977 | |
| Target Corp. | 17,593 | 972 | |
| J.C. Penney Co., Inc. (Holding Co.) | 13,255 | 906 | |
| Federated Department Stores, Inc. | 19,600 | 847 | |
| International Game Technology | 20,397 | 846 | |
| VF Corp. | 10,763 | 785 | |
* | Starbucks Corp. | 20,871 | 711 | |
| Whirlpool Corp. | 7,490 | 630 | |
* | AutoNation, Inc. | 28,034 | 586 | |
| CBS Corp. | 20,426 | 575 | |
| Yum! Brands, Inc. | 10,300 | 536 | |
* | Wyndham Worldwide Corp. | 19,026 | 532 | |
* | Viacom Inc. Class B | 10,827 | 403 | |
| Ford Motor Co. | 49,542 | 401 | |
| Johnson Controls, Inc. | 5,400 | 387 | |
* | Office Depot, Inc. | 9,008 | 358 | |
* | Sears Holdings Corp. | 1,800 | 285 | |
| Nordstrom, Inc. | 6,528 | 276 | |
| Best Buy Co., Inc. | 4,750 | 254 | |
| The McGraw-Hill Cos., Inc. | 3,900 | 226 | |
|
|
| Market |
|
|
| Value• |
|
| Shares | ($000) |
| Carnival Corp. | 4,407 | 207 |
| Starwood Hotels &Resorts Worldwide, Inc. | 3,000 | 172 |
| Newell Rubbermaid, Inc. | 4,456 | 126 |
| Genuine Parts Co. | 2,770 | 119 |
| Harrah’s Entertainment, Inc. | 1,656 | 110 |
* | The Goodyear Tire &Rubber Co. | 4,800 | 70 |
* | Kohl’s Corp. | 700 | 45 |
| Gannett Co., Inc. | 352 | 20 |
|
|
| 33,732 |
Consumer Staples (9.5%) |
|
| |
| The Procter & Gamble Co. | 93,494 | 5,795 |
| Altria Group, Inc. | 59,040 | 4,520 |
| Wal-Mart Stores, Inc. | 73,664 | 3,633 |
| PepsiCo, Inc. | 40,299 | 2,630 |
| The Coca-Cola Co. | 48,693 | 2,176 |
| Archer-Daniels-Midland Co. | 44,000 | 1,667 |
| The Kroger Co. | 60,542 | 1,401 |
| Anheuser-Busch Cos., Inc. | 28,986 | 1,377 |
| Reynolds American Inc. | 20,240 | 1,254 |
| Brown-Forman Corp. Class B | 15,380 | 1,179 |
| Kimberly-Clark Corp. | 17,949 | 1,173 |
| Walgreen Co. | 20,399 | 906 |
| The Pepsi Bottling Group, Inc. | 21,545 | 765 |
| Costco Wholesale Corp. | 15,354 | 763 |
| CVS Corp. | 20,368 | 654 |
| Colgate-Palmolive Co. | 8,454 | 525 |
| The Clorox Co. | 4,000 | 252 |
| Sysco Corp. | 7,380 | 247 |
| Molson Coors Brewing Co.Class B | 3,200 | 220 |
| Safeway, Inc. | 6,964 | 211 |
| Estee Lauder Cos. Class A | 1,200 | 48 |
|
|
| 31,396 |
Energy (9.3%) |
|
| |
| ExxonMobil Corp. | 157,755 | 10,585 |
| Chevron Corp. | 55,150 | 3,577 |
| ConocoPhillips Co. | 51,382 | 3,059 |
| Schlumberger Ltd. | 27,215 | 1,688 |
10
|
|
| Market | |
|
|
| Value• | |
|
| Shares | ($000) | |
| XTO Energy, Inc. | 29,928 | 1,261 | |
* | Nabors Industries, Inc. | 42,046 | 1,251 | |
| Noble Corp. | 18,376 | 1,179 | |
| Marathon Oil Corp. | 13,488 | 1,037 | |
| Rowan Cos., Inc. | 32,014 | 1,013 | |
| Anadarko Petroleum Corp. | 18,750 | 822 | |
| Occidental Petroleum Corp. | 16,900 | 813 | |
| Halliburton Co. | 27,338 | 778 | |
| Chesapeake Energy Corp. | 23,801 | 690 | |
| Baker Hughes, Inc. | 10,000 | 682 | |
| Hess Corp. | 15,984 | 662 | |
| Valero Energy Corp. | 11,621 | 598 | |
| Devon Energy Corp. | 6,834 | 432 | |
* | Transocean Inc. | 4,100 | 300 | |
| Apache Corp. | 4,383 | 277 | |
| EOG Resources, Inc. | 1,026 | 67 | |
|
|
| 30,771 | |
Financials (22.2%) |
|
| ||
| Capital Markets (4.0%) |
|
| |
| The Goldman |
|
| |
| Sachs Group, Inc. | 14,037 | 2,375 | |
| Morgan Stanley | 25,223 | 1,839 | |
| Merrill Lynch & Co., Inc. | 20,242 | 1,583 | |
| Bear Stearns Co., Inc. | 10,481 | 1,468 | |
| Mellon Financial Corp. | 36,400 | 1,423 | |
| Lehman Brothers Holdings, Inc. | 18,377 | 1,357 | |
* | E*TRADE Financial Corp. | 52,237 | 1,249 | |
| Ameriprise Financial, Inc. | 21,360 | 1,002 | |
| State Street Corp. | 7,027 | 438 | |
| The Bank of New York Co., Inc. | 11,303 | 399 | |
| Franklin Resources Corp. | 1,133 | 120 | |
|
|
|
| |
| Commercial Banks (4.0%) |
|
| |
| Wells Fargo & Co. | 100,034 | 3,619 | |
| Wachovia Corp. | 48,832 | 2,725 | |
| U.S. Bancorp | 53,392 | 1,774 | |
| PNC Financial Services Group | 20,951 | 1,518 | |
| KeyCorp | 22,225 | 832 | |
| Comerica, Inc. | 13,002 | 740 | |
| Regions Financial Corp. | 16,800 | 618 | |
| SunTrust Banks, Inc. | 5,854 | 452 | |
| BB&T Corp. | 7,387 | 323 | |
| National City Corp. | 7,686 | 281 | |
| Fifth Third Bancorp | 6,722 | 256 | |
| Compass Bancshares Inc. | 2,351 | 134 | |
|
|
|
| |
| Consumer Finance (0.6%) |
|
| |
| American Express Co. | 26,743 | 1,500 | |
| Capital One Financial Corp. | 3,898 | 307 | |
| SLM Corp. | 4,627 | 241 | |
| Diversified Financial Services (5.8%) |
| |||
| Citigroup, Inc. | 143,547 | 7,130 | ||
| Bank of America Corp. | 131,495 | 7,044 | ||
| JPMorgan Chase & Co. | 102,454 | 4,811 | ||
|
|
|
| ||
| Insurance (4.8%) |
|
| ||
| American International Group, Inc. | 66,483 | 4,405 | ||
| The Allstate Corp. | 22,906 | 1,437 | ||
| The St. Paul Travelers, Cos. Inc. | 26,351 | 1,236 | ||
| Safeco Corp. | 20,446 | 1,205 | ||
| Ambac Financial Group, Inc. | 13,952 | 1,155 | ||
| Torchmark Corp. | 17,919 | 1,131 | ||
| The Chubb Corp. | 17,736 | 922 | ||
| ACE Ltd. | 16,250 | 889 | ||
| Genworth Financial Inc. | 23,854 | 835 | ||
| MetLife, Inc. | 14,381 | 815 | ||
| Prudential Financial, Inc. | 8,316 | 634 | ||
| The Hartford Financial Services Group Inc. | 4,920 | 427 | ||
| AFLAC Inc. | 6,169 | 282 | ||
| Loews Corp. | 5,600 | 212 | ||
| Progressive Corp. of Ohio | 6,460 | 159 | ||
| MBIA, Inc. | 2,224 | 137 | ||
| UnumProvident Corp. | 4,757 | 92 | ||
|
|
|
| ||
| Real Estate Investment Trusts (1.1%) |
| |||
|
|
|
| ||
| Simon Property Group, Inc.REIT | 8,336 | 755 | ||
| Archstone-Smith Trust REIT | 11,341 | 617 | ||
| Boston Properties, Inc. REIT | 5,389 | 557 | ||
| Equity Residential REIT | 9,121 | 461 | ||
| Apartment Investment &Management Co. Class A REIT | 8,400 | 457 | ||
| Equity Office Properties Trust REIT | 5,900 | 235 | ||
| Plum Creek Timber Co. Inc. REIT | 5,859 | 199 | ||
| ProLogis REIT | 1,542 | 88 | ||
| Vornado Realty Trust REIT | 770 | 84 | ||
|
|
|
| ||
| Real Estate Management & Development (0.0%) |
|
| ||
* | Realogy Corp. | 4,408 | 100 | ||
|
|
|
| ||
| Thrifts & Mortgage Finance (1.9%) |
| |||
| Fannie Mae | 32,466 | 1,815 | ||
| MGIC Investment Corp. | 19,752 | 1,185 | ||
| Washington Mutual, Inc. | 21,858 | 950 | ||
| Countrywide Financial Corp. | 26,509 | 929 | ||
| Freddie Mac | 13,269 | 880 | ||
| Golden West Financial Corp. | 6,850 | 529 | ||
|
|
| 73,372 | ||
Health Care (12.8%) |
|
| |||
| Pfizer Inc. | 205,629 | 5,832 | ||
| Johnson & Johnson | 75,398 | 4,896 | ||
| Merck & Co., Inc. | 68,501 | 2,870 | ||
* | Amgen, Inc. | 36,997 | 2,646 | ||
| Wyeth | 41,739 | 2,122 | ||
11
|
|
| Market |
|
|
| Value• |
|
| Shares | ($000) |
| Abbott Laboratories | 35,439 | 1,721 |
| UnitedHealth Group Inc. | 30,812 | 1,516 |
* | Biogen Idec Inc. | 32,011 | 1,430 |
| Eli Lilly & Co. | 24,356 | 1,388 |
| McKesson Corp. | 25,981 | 1,370 |
* | WellPoint Inc. | 17,555 | 1,353 |
| Schering-Plough Corp. | 56,157 | 1,240 |
�� | AmerisourceBergen Corp. | 27,369 | 1,237 |
| Medtronic, Inc. | 24,934 | 1,158 |
* | Laboratory Corp. of America Holdings | 17,580 | 1,153 |
| Mylan Laboratories, Inc. | 51,928 | 1,045 |
| Manor Care, Inc. | 19,912 | 1,041 |
| CIGNA Corp. | 8,610 | 1,002 |
| Bristol-Myers Squibb Co. | 39,917 | 995 |
| Becton, Dickinson & Co. | 13,505 | 954 |
| Baxter International, Inc. | 18,364 | 835 |
| Quest Diagnostics, Inc. | 11,600 | 709 |
* | King Pharmaceuticals, Inc. | 36,218 | 617 |
| Aetna Inc. | 15,213 | 602 |
* | Gilead Sciences, Inc. | 7,173 | 493 |
| Cardinal Health, Inc. | 6,604 | 434 |
* | Barr Pharmaceuticals Inc. | 7,800 | 405 |
| Caremark Rx, Inc. | 6,347 | 360 |
| HCA Inc. | 6,571 | 328 |
* | Boston Scientific Corp. | 11,461 | 169 |
* | Zimmer Holdings, Inc. | 2,113 | 143 |
| Stryker Corp. | 1,750 | 87 |
|
|
| 42,151 |
Industrials (10.9%) |
|
| |
| General Electric Co. | 274,311 | 9,683 |
| United Parcel Service, Inc. | 29,727 | 2,139 |
| Caterpillar, Inc. | 23,635 | 1,555 |
| United Technologies Corp. | 22,754 | 1,441 |
| 3M Co. | 19,032 | 1,416 |
| The Boeing Co. | 17,185 | 1,355 |
| Eaton Corp. | 18,400 | 1,267 |
| Honeywell International Inc. | 30,487 | 1,247 |
| Lockheed Martin Corp. | 14,047 | 1,209 |
| Cummins Inc. | 10,071 | 1,201 |
| Tyco International Ltd. | 41,852 | 1,171 |
| Northrop Grumman Corp. | 15,021 | 1,022 |
| Union Pacific Corp. | 11,398 | 1,003 |
| FedEx Corp. | 8,444 | 918 |
* | Allied Waste Industries, Inc. | 76,213 | 859 |
| Burlington Northern Santa Fe Corp. | 11,091 | 815 |
| CSX Corp. | 23,284 | 764 |
| General Dynamics Corp. | 10,144 | 727 |
| Parker Hannifin Corp. | 8,787 | 683 |
| Masco Corp. | 24,710 | 678 |
| Illinois Tool Works, Inc. | 15,008 | 674 |
| Raytheon Co. | 13,205 | 634 |
| Rockwell Automation, Inc. | 10,642 | 618 |
|
|
| Market | |
|
|
| Value• | |
|
| Shares | ($000) | |
| Goodrich Corp. | 14,648 | 594 | |
| Emerson Electric Co. | 7,029 | 589 | |
| Ingersoll-Rand Co. | 13,836 | 525 | |
* | Monster Worldwide Inc. | 13,599 | 492 | |
| Waste Management, Inc. | 11,767 | 432 | |
| PACCAR, Inc. | 3,700 | 211 | |
| R.R. Donnelley & Sons Co. | 1,600 | 53 | |
| Ryder System, Inc. | 1,010 | 52 | |
|
|
| 36,027 | |
Information Technology (15.3%) |
|
| ||
| Microsoft Corp. | 237,504 | 6,491 | |
| International Business Machines Corp. | 46,015 | 3,770 | |
* | Cisco Systems, Inc. | 161,089 | 3,705 | |
| Intel Corp. | 158,548 | 3,261 | |
| Hewlett-Packard Co. | 85,047 | 3,120 | |
* | Oracle Corp. | 123,347 | 2,188 | |
* | Google Inc. | 5,065 | 2,036 | |
| Motorola, Inc. | 80,689 | 2,017 | |
* | Apple Computer, Inc. | 22,436 | 1,728 | |
* | Agilent Technologies, Inc. | 43,717 | 1,429 | |
| Texas Instruments, Inc. | 42,163 | 1,402 | |
| QUALCOMM Inc. | 36,992 | 1,345 | |
* | Fiserv, Inc. | 26,182 | 1,233 | |
* | Computer Sciences Corp. | 25,096 | 1,233 | |
* | Corning, Inc. | 50,361 | 1,229 | |
| Molex, Inc. | 31,500 | 1,228 | |
* | Lexmark International, Inc. | 19,997 | 1,153 | |
* | Novellus Systems, Inc. | 39,900 | 1,104 | |
* | Convergys Corp. | 51,721 | 1,068 | |
* | Dell Inc. | 45,464 | 1,038 | |
* | BMC Software, Inc. | 30,533 | 831 | |
| Electronic Data Systems Corp. | 30,740 | 754 | |
* | Teradyne, Inc. | 52,488 | 691 | |
| Applied Materials, Inc. | 38,134 | 676 | |
* | Intuit, Inc. | 19,974 | 641 | |
* | Advanced Micro Devices, Inc. | 25,782 | 641 | |
* | eBay Inc. | 20,646 | 586 | |
* | Yahoo! Inc. | 22,045 | 557 | |
| First Data Corp. | 12,733 | 535 | |
* | LSI Logic Corp. | 59,000 | 485 | |
* | Freescale Semiconductor, Inc.Class B | 10,912 | 415 | |
| Automatic Data Processing, Inc. | 8,620 | 408 | |
* | EMC Corp. | 31,650 | 379 | |
* | Sanmina-SCI Corp. | 97,800 | 366 | |
* | Micron Technology, Inc. | 12,600 | 219 | |
* | Symantec Corp. | 9,900 | 211 | |
* | Xerox Corp. | 10,200 | 159 | |
| National Semiconductor Corp. | 5,200 | 122 | |
* | Citrix Systems, Inc. | 2,962 | 107 | |
* | Compuware Corp. | 6,154 | 48 | |
|
|
| 50,609 | |
12
|
|
| Market |
|
|
| Value• |
|
| Shares | ($000) |
Materials (2.9%) |
|
| |
| Freeport-McMoRan Copper & Gold, Inc. Class B | 24,655 | 1,313 |
* | Pactiv Corp. | 40,878 | 1,162 |
| United States Steel Corp. | 19,106 | 1,102 |
| Alcoa Inc. | 35,700 | 1,001 |
| Nucor Corp. | 18,060 | 894 |
| Temple-Inland Inc. | 21,140 | 848 |
| Newmont Mining Corp. (Holding Co.) | 16,816 | 719 |
| E.I. du Pont de Nemours & Co. | 16,670 | 714 |
| Phelps Dodge Corp. | 8,078 | 684 |
| Dow Chemical Co. | 17,158 | 669 |
| Monsanto Co. | 7,760 | 365 |
|
|
| 9,471 |
Telecommunication Services (3.5%) |
| ||
| AT&T Inc. | 117,597 | 3,829 |
| Verizon Communications Inc. | 69,580 | 2,583 |
| BellSouth Corp. | 40,941 | 1,750 |
| Embarq Corp. | 24,972 | 1,208 |
| Sprint Nextel Corp. | 60,552 | 1,038 |
* | Qwest Communications International Inc. | 104,448 | 911 |
| Alltel Corp. | 4,640 | 258 |
|
|
| 11,577 |
Utilities (3.4%) |
|
| |
| FirstEnergy Corp. | 25,975 | 1,451 |
| American Electric Power Co., Inc. | 35,635 | 1,296 |
| TXU Corp. | 18,781 | 1,174 |
| Xcel Energy, Inc. | 56,503 | 1,167 |
| Pinnacle West Capital Corp. | 24,000 | 1,081 |
* | Allegheny Energy, Inc. | 26,409 | 1,061 |
| Duke Energy Corp. | 32,270 | 975 |
| Edison International | 20,008 | 833 |
| Exelon Corp. | 12,475 | 755 |
| Entergy Corp. | 5,750 | 450 |
| Dominion Resources, Inc. | 5,368 | 411 |
| Southern Co. | 10,512 | 362 |
| PG&E Corp. | 5,632 | 235 |
| Nicor Inc. | 1,400 | 60 |
|
|
| 11,311 |
Total Common Stocks |
|
| |
(Cost $318,064) |
| 330,417 | |
| Face | Market | |
| Amount | Value• | |
| ($000) | ($000) | |
Temporary Cash Investment (0.0%)1 |
|
| |
U.S. Agency Obligation (0.0%) |
|
| |
2 Federal Home Loan Mortgage Corp. |
| ||
3 5.334%, 10/24/06 |
|
| |
(Cost $100) | 100 | 100 | |
Total Investments (100.0%) |
|
| |
(Cost $318,164) |
| 330,517 | |
Other Assets and Liabilities (0.0%) |
|
| |
Other Assets—Note B |
| 399 | |
Liabilities |
| (372) | |
|
| 27 | |
Net Assets (100%) |
| 330,544 | |
At September 30, 2006, net assets consisted of:4 | ||
|
| Amount |
|
| ($000) |
Paid-in Capital |
| 316,432 |
Undistributed Net Investment Income | 1,597 | |
Accumulated Net Realized Gains |
| 161 |
Unrealized Appreciation |
|
|
Investment Securities |
| 12,353 |
Futures Contracts |
| 1 |
Net Assets |
| 330,544 |
|
|
|
|
|
|
Institutional Shares—Net Assets |
|
|
Applicable to 4,896,907 outstanding $.001 |
| |
par value shares of beneficial interest |
| |
(unlimited authorization) |
| 127,450 |
Net Asset Value Per Share— |
|
|
Institutional Shares |
| $26.03 |
|
|
|
Institutional Plus Shares—Net Assets |
| |
Applicable to 3,900,278 outstanding $.001 |
| |
par value shares of beneficial interest |
| |
(unlimited authorization) |
| 203,094 |
Net Asset Value Per Share— |
|
|
Institutional Plus Shares |
| $52.07 |
• | See Note A in Notes to Financial Statements. |
* | Non-income-producing security. |
1 | The fund invests a portion of its cash reserves in equity markets through the use of index futures contracts. After giving effect to futures investments, the fund’s effective common stock and temporary cash investment positions represent 100.0% and 0.0%, respectively, of net assets. See Note C in Notes to Financial Statements. |
2 | The issuer operates under a congressional charter; its securities are neither issued nor guaranteed by the U.S. government. If needed, access to additional funding from the U.S. Treasury (beyond the issuer’s line of credit) would require congressional action. |
3 | Securities with a value of $100,000 have been segregated as initial margin for open futures contracts. |
4 | See Note C in Notes to Financial Statements for the tax-basis components of net assets. |
13
Statement of Operations
| May 151 to |
| September 30, 2006 |
| ($000) |
Investment Income |
|
Income |
|
Dividends | 1,712 |
Interest2 | 38 |
Total Income | 1,750 |
Expenses |
|
The Vanguard Group—Note B |
|
Investment Advisory Services | 38 |
Management and Administrative |
|
Institutional Shares | 39 |
Institutional Plus Shares | 43 |
Marketing and Distribution |
|
Institutional Shares | — |
Institutional Plus Shares | 2 |
Custodian Fees | 7 |
Auditing Fees | 22 |
Shareholders’ Reports |
|
Institutional Shares | 1 |
Institutional Plus Shares | 1 |
Total Expenses | 153 |
Net Investment Income | 1,597 |
Realized Net Gain (Loss) |
|
Investment Securities Sold | 154 |
Futures Contracts | 7 |
Realized Net Gain (Loss) | 161 |
Unrealized Appreciation (Depreciation) |
|
Investment Securities | 12,353 |
Futures Contracts | 1 |
Unrealized Appreciation (Depreciation) | 12,354 |
Net Increase (Decrease) in Net Assets Resulting from Operations | 14,112 |
1 | Inception. |
2 | Interest income from an affiliated company of the fund was $37,000. |
14
Statement of Changes in Net Assets
| May 151 to |
| September 30, 2006 |
| ($000) |
Increase (Decrease) in Net Assets |
|
Operations |
|
Net Investment Income | 1,597 |
Realized Net Gain (Loss) | 161 |
Unrealized Appreciation (Depreciation) | 12,354 |
Net Increase (Decrease) in Net Assets Resulting from Operations | 14,112 |
Distributions |
|
Net Investment Income |
|
Institutional Shares | — |
Institutional Plus Shares | — |
Realized Capital Gain |
|
Institutional Shares | — |
Institutional Plus Shares | — |
Total Distributions | — |
Capital Share Transactions—Note E |
|
Institutional Shares | 121,426 |
Institutional Plus Shares | 195,006 |
Net Increase (Decrease) from Capital Share Transactions | 316,432 |
Total Increase (Decrease) | 330,544 |
Net Assets |
|
Beginning of Period | — |
End of Period2 | 330,544 |
1 | Inception. |
2 | Net Assets–End of Period includes undistributed net investment income of $1,597,000. |
15
Financial Highlights
Structured Large-Cap Equity Fund Institutional Shares |
|
| May 161 to |
For a Share Outstanding Throughout the Period | September 30, 2006 |
Net Asset Value, Beginning of Period | $24.96 |
Investment Operations |
|
Net Investment Income | .13 |
Net Realized and Unrealized Gain (Loss) on Investments | .94 |
Total from Investment Operations | 1.07 |
Distributions |
|
Dividends from Net Investment Income | — |
Distributions from Realized Capital Gains | — |
Total Distributions | — |
Net Asset Value, End of Period | $26.03 |
|
|
Total Return | 4.29% |
|
|
Ratios/Supplemental Data |
|
Net Assets, End of Period (Millions) | $127 |
Ratio of Total Expenses to Average Net Assets | 0.25%* |
Ratio of Net Investment Income to Average Net Assets | 1.67%* |
Portfolio Turnover Rate | 30% |
1 | Inception. |
* | Annualized. |
16
Structured Large-Cap Equity Fund Institutional Plus Shares |
|
| May 151 to |
For a Share Outstanding Throughout the Period | September 30, 2006 |
Net Asset Value, Beginning of Period | $50.00 |
Investment Operations |
|
Net Investment Income | .25 |
Net Realized and Unrealized Gain (Loss) on Investments | 1.82 |
Total from Investment Operations | 2.07 |
Distributions |
|
Dividends from Net Investment Income | — |
Distributions from Realized Capital Gains | — |
Total Distributions | — |
Net Asset Value, End of Period | $52.07 |
|
|
Total Return | 4.14% |
|
|
Ratios/Supplemental Data |
|
Net Assets, End of Period (Millions) | $203 |
Ratio of Total Expenses to Average Net Assets | 0.15%* |
Ratio of Net Investment Income to Average Net Assets | 1.77%* |
Portfolio Turnover Rate | 30% |
1 | Inception. |
* | Annualized. |
See accompanying Notes, which are an integral part of the Financial Statements.
17
Notes to Financial Statements
Vanguard Structured Large-Cap Equity Fund is registered under the Investment Company Act of 1940 as an open-end investment company, or mutual fund. The fund files reports with the SEC under the company name Vanguard Quantitative Funds.
A. The following significant accounting policies conform to generally accepted accounting principles for U.S. mutual funds. The fund consistently follows such policies in preparing its financial statements.
1. Security Valuation: Securities are valued as of the close of trading on the New York Stock Exchange (generally 4:00 p.m., Eastern time) on the valuation date. Equity securities are valued at the latest quoted sales prices or official closing prices taken from the primary market in which each security trades; such securities not traded on the valuation date are valued at the mean of the latest quoted bid and asked prices. Securities for which market quotations are not readily available, or whose values have been materially affected by events occurring before the fund’s pricing time but after the close of the securities’ primary markets, are valued by methods deemed by the board of trustees to represent fair value. Investments in Vanguard Market Liquidity Fund are valued at that fund’s net asset value. Temporary cash investments acquired over 60 days to maturity are valued using the latest bid prices or using valuations based on a matrix system (which considers such factors as security prices, yields, maturities, and ratings), both as furnished by independent pricing services. Other temporary cash investments are valued at amortized cost, which approximates market value.
2. Futures Contracts: The fund uses index futures contracts to a limited extent, with the objective of maintaining full exposure to the stock market while maintaining liquidity. The fund may purchase or sell futures contracts to achieve a desired level of investment, whether to accommodate portfolio turnover or cash flows from capital share transactions. The primary risks associated with the use of futures contracts are imperfect correlation between changes in market values of stocks held by the fund and the prices of futures contracts, and the possibility of an illiquid market.
Futures contracts are valued at their quoted daily settlement prices. The aggregate principal amounts of the contracts are not recorded in the Statement of Net Assets. Fluctuations in the value of the contracts are recorded in the Statement of Net Assets as an asset (liability) and in the Statement of Operations as unrealized appreciation (depreciation) until the contracts are closed, when they are recorded as realized futures gains (losses).
3. Federal Income Taxes: The fund intends to qualify as a regulated investment company and distribute all of its taxable income. Accordingly, no provision for federal income taxes is required in the financial statements.
4. Distributions: Distributions to shareholders are recorded on the ex-dividend date.
5. Other: Dividend income is recorded on the ex-dividend date. Interest income includes income distributions received from Vanguard Market Liquidity Fund and is accrued daily. Security transactions are accounted for on the date securities are bought or sold. Costs used to determine realized gains (losses) on the sale of investment securities are those of the specific securities sold.
B. The Vanguard Group furnishes at cost investment advisory, corporate management, administrative, marketing, and distribution services. The costs of such services are allocated to the fund under methods approved by the board of trustees. The fund has committed to provide up to 0.40% of its net assets in capital contributions to Vanguard. At September 30, 2006, the fund had contributed capital of $33,000 to Vanguard (included in Other Assets), representing 0.01% of
18
the fund’s net assets and 0.03% of Vanguard’s capitalization. The fund’s trustees and officers are also directors and officers of Vanguard.
C. Distributions are determined on a tax basis and may differ from net investment income and realized capital gains for financial reporting purposes. Differences may be permanent or temporary. Permanent differences are reclassified among capital accounts in the financial statements to reflect their tax character. Temporary differences arise when certain items of income, expense, gain, or loss are recognized in different periods for financial statement and tax purposes; these differences will reverse at some time in the future. Differences in classification may also result from the treatment of short-term gains as ordinary income for tax purposes.
For tax purposes, at September 30, 2006, the fund had $1,902,000 of ordinary income and $4,000 of long-term capital gains available for distribution.
At September 30, 2006, the cost of investment securities for tax purposes was $318,282,000. Net unrealized appreciation of investment securities for tax purposes was $12,235,000, consisting of unrealized gains of $18,043,000 on securities that had risen in value since their purchase and $5,808,000 in unrealized losses on securities that had fallen in value since their purchase.
At September 30, 2006, the aggregate settlement value of open futures contracts expiring in December 2006 and the related unrealized appreciation (depreciation) were:
|
|
| ($000) |
|
| Aggregate | Unrealized |
| Number of | Settlement | Appreciation |
Futures Contracts | Long Contracts | Value | (Depreciation) |
E-mini S&P 500 Index | 1 | 67 | 1 |
Unrealized appreciation (depreciation) on open futures contracts is required to be treated as realized gain (loss) for tax purposes.
D. During the period ended September 30, 2006, the fund purchased $393,478,000 of investment securities and sold $75,568,000 of investment securities, other than temporary cash investments.
E. Capital share transactions for each class of shares were:
| Inception1 to September 30, 2006 | |
| Amount | Shares |
| ($000) | (000) |
Institutional Shares |
|
|
Issued | 121,583 | 4,903 |
Issued in Lieu of Cash Distributions | — | — |
Redeemed | (157) | (6) |
Net Increase (Decrease)—Institutional Shares | 121,426 | 4,897 |
Institutional Plus Shares |
|
|
Issued | 195,006 | 3,900 |
Issued in Lieu of Cash Distributions | — | — |
Redeemed | — | — |
Net Increase (Decrease)—Institutional Plus Shares | 195,006 | 3,900 |
1 | Inception was May 16, 2006, for Institutional Shares and May 15, 2006, for Institutional Plus Shares. |
19
F. In June 2006, the Financial Accounting Standards Board issued Interpretation No. 48 (“FIN 48”), “Accounting for Uncertainty in Income Taxes.” FIN 48 establishes the minimum threshold for recognizing, and a system for measuring, the benefits of tax-return positions in financial statements. FIN 48 will be effective for the fund’s fiscal year beginning October 1, 2007. Management is in the process of analyzing the fund’s tax positions for purposes of implementing FIN 48; based on the analysis completed to date, management does not believe the adoption of FIN 48 will result in any material impact to the fund’s financial statements.
20
Report of Independent Registered Public Accounting Firm
To the Trustees of Vanguard Quantitative Funds and the Shareholders of Vanguard Structured Large-Cap Equity Fund:
In our opinion, the accompanying statement of net assets and the related statements of operations and of changes in net assets and the financial highlights present fairly, in all material respects, the financial position of Vanguard Structured Large-Cap Equity Fund (the “Fund”) at September 30, 2006, and the results of its operations, the changes in its net assets, and the financial highlights for the period from May 15, 2006 (commencement of operations) to September 30, 2006, in conformity with accounting principles generally accepted in the United States of America. These financial statements and financial highlights (hereafter referred to as “financial statements”) are the responsibility of the Fund’s management; our responsibility is to express an opinion on these financial statements based on our audit. We conducted our audit of these financial statements in accordance with the standards of the Public Company Accounting Oversight Board (United States), which require that we plan and perform the audit to obtain reasonable assurance about whether the financial statements are free of material misstatement. An audit includes examining, on a test basis, evidence supporting the amounts and disclosures in the financial statements, assessing the accounting principles used and significant estimates made by management, and evaluating the overall financial statement presentation. We believe that our audit, which included confirmation of securities at September 30, 2006 by correspondence with the custodian and broker, and by agreement to the underlying ownership records for Vanguard Market Liquidity Fund, provides a reasonable basis for our opinion.
PricewaterhouseCoopers LLP
Philadelphia, Pennsylvania
November 13, 2006
Special 2006 tax information (unaudited) for Vanguard Structured Large-Cap Equity Fund
This information for the fiscal period ended September 30, 2006, is included pursuant to provisions of the Internal Revenue Code.
For corporate shareholders, 87.3% of investment income (dividend income plus short-term gains, if any) qualifies for the dividends-received deduction.
21
Glossary
Earnings Growth Rate. The average annual rate of growth in earnings over the past five years for the stocks now in a fund.
Expense Ratio. The percentage of a fund’s average net assets used to pay its annual administrative and advisory expenses. These expenses directly reduce returns to investors.
Foreign Holdings. The percentage of a fund represented by stocks or depositary receipts of companies based outside the United States.
Median Market Cap. An indicator of the size of companies in which a fund invests; the midpoint of market capitalization (market price x shares outstanding) of a fund’s stocks, weighted by the proportion of the fund’s assets invested in each stock. Stocks representing half of the fund’s assets have market capitalizations above the median, and the rest are below it.
Price/Book Ratio. The share price of a stock divided by its net worth, or book value, per share. For a fund, the weighted average price/book ratio of the stocks it holds.
Price/Earnings Ratio. The ratio of a stock’s current price to its per-share earnings over the past year. For a fund, the weighted average P/E of the stocks it holds. P/E is an indicator of market expectations about corporate prospects; the higher the P/E, the greater the expectations for a company’s future growth.
Return on Equity. The annual average rate of return generated by a company during the past five years for each dollar of shareholder’s equity (net income divided by shareholder’s equity). For a fund, the weighted average return on equity for the companies whose stocks it holds.
Short-Term Reserves. The percentage of a fund invested in highly liquid, short-term securities that can be readily converted to cash.
Turnover Rate. An indication of the fund’s trading activity. Funds with high turnover rates incur higher transaction costs and may be more likely to distribute capital gains (which may be taxable to investors). The turnover rate excludes in-kind transactions, which have minimal impact on costs.
Yield. A snapshot of a fund’s income from interest and dividends. The yield, expressed as a percentage of the fund’s net asset value, is based on income earned over the past 30 days and is annualized, or projected forward for the coming year. The index yield is based on the current annualized rate of income provided by securities in the index.
This page intentionally left blank.
22
This page is intentionally left blank.
The People Who Govern Your Fund
The trustees of your mutual fund are there to see that the fund is operated and managed in your best interests since, as a shareholder, you are a part owner of the fund. Your fund’s trustees also serve on the board of directors of The Vanguard Group, Inc., which is owned by the Vanguard funds and provides services to them on an at-cost basis.
A majority of Vanguard’s board members are independent, meaning that they have no affiliation with Vanguard or the funds they oversee, apart from the sizable personal investments they have made as private individuals.
Our independent board members bring distinguished backgrounds in business, academia, and public service to their task of working with Vanguard officers to establish the policies and oversee the activities of the funds. Among board members’ responsibilities are selecting investment advisors for the funds; monitoring fund operations, performance, and costs; reviewing contracts; nominating and selecting new trustees/directors; and electing Vanguard officers.
Each trustee serves a fund until its termination; or until the trustee’s retirement, resignation, or death; or otherwise as specified in the fund’s organizational documents. Any trustee may be removed at a shareholders’ meeting by a vote representing two-thirds of the net asset value of all shares of the fund together with shares of other Vanguard funds organized within the same trust. The table on these two pages shows information for each trustee and executive officer of the fund. The mailing address of the trustees and officers is P.O. Box 876, Valley Forge, PA 19482.
Chairman of the Board, Chief Executive Officer, and Trustee | |
|
|
John J. Brennan1 |
|
Born 1954 | Principal Occupation(s) During the Past Five Years: Chairman of the Board, Chief |
Trustee since May 1987; | Executive Officer, and Director/Trustee of The Vanguard Group, Inc., and of each |
Chairman of the Board and | of the investment companies served by The Vanguard Group. |
Chief Executive Officer |
|
142 Vanguard Funds Overseen | |
|
|
Independent Trustees |
|
|
|
Charles D. Ellis |
|
Born 1937 | Principal Occupation(s) During the Past Five Years: Applecore Partners (pro bono ventures |
Trustee since January 2001 | in education); Senior Advisor to Greenwich Associates (international business strategy |
142 Vanguard Funds Overseen | consulting); Successor Trustee of Yale University; Overseer of the Stern School of Business |
| at New York University; Trustee of the Whitehead Institute for Biomedical Research. |
|
|
Rajiv L. Gupta |
|
Born 1945 | Principal Occupation(s) During the Past Five Years: Chairman and Chief Executive Officer |
Trustee since December 20012 | of Rohm and Haas Co. (chemicals); Board Member of the American Chemistry Council; |
142 Vanguard Funds Overseen | Director of Tyco International, Ltd. (diversified manufacturing and services) (since 2005); |
| Trustee of Drexel University and of the Chemical Heritage Foundation. |
|
|
Amy Gutmann |
|
Born 1949 | Principal Occupation(s) During the Past Five Years: President of the University of |
Trustee since June 2006 | Pennsylvania since 2004; Professor in the School of Arts and Sciences, Annenberg School |
142 Vanguard Funds Overseen | for Communication, and Graduate School of Education of the University of Pennsylvania |
| since 2004; Provost (2001–2004) and Laurance S. Rockefeller Professor of Politics and the |
| University Center for Human Values (1990–2004), Princeton University; Director of Carnegie |
| Corporation of New York and of Philadelphia 2016 (since 2005) and of Schuylkill River |
| Development Corporation and Greater Philadelphia Chamber of Commerce (since 2004). |
JoAnn Heffernan Heisen |
| |
Born 1950 | Principal Occupation(s) During the Past Five Years: Corporate Vice President and Chief | |
Trustee since July 1998 | Global Diversity Officer (since January 2006), Vice President and Chief Information | |
142 Vanguard Funds Overseen | Officer (1997–2005), and Member of the Executive Committee of Johnson & Johnson | |
| (pharmaceuticals/consumer products); Director of the University Medical Center at | |
| Princeton and Women’s Research and Education Institute. | |
|
| |
André F. Perold |
| |
Born 1952 | Principal Occupation(s) During the Past Five Years: George Gund Professor of Finance and | |
Trustee since December 2004 | Banking, Harvard Business School (since 2000); Senior Associate Dean, Director of Faculty | |
142 Vanguard Funds Overseen | Recruiting, and Chair of Finance Faculty, Harvard Business School; Director and Chairman | |
| of UNX, Inc. (equities trading firm) (since 2003); Director of registered investment | |
| companies advised by Merrill Lynch Investment Managers and affiliates (1985–2004), | |
| Genbel Securities Limited (South African financial services firm) (1999–2003), Gensec | |
| Bank (1999–2003), Sanlam, Ltd. (South African insurance company) (2001–2003), and | |
| Stockback, Inc. (credit card firm) (2000–2002). | |
|
| |
Alfred M. Rankin, Jr. |
| |
Born 1941 | Principal Occupation(s) During the Past Five Years: Chairman, President, Chief Executive | |
Trustee since January 1993 | Officer, and Director of NACCO Industries, Inc. (forklift trucks/housewares/ lignite); | |
142 Vanguard Funds Overseen | Director of Goodrich Corporation (industrial products/aircraft systems and services). | |
|
| |
J. Lawrence Wilson |
| |
Born 1936 | Principal Occupation(s) During the Past Five Years: Retired Chairman and Chief Executive | |
Trustee since April 1985 | Officer of Rohm and Haas Co. (chemicals); Director of Cummins Inc. (diesel engines), | |
142 Vanguard Funds Overseen | MeadWestvaco Corp. (packaging products), and AmerisourceBergen Corp. (pharmaceutical | |
| distribution); Trustee of Vanderbilt University and of Culver Educational Foundation. | |
|
| |
Executive Officers1 |
| |
|
| |
Heidi Stam |
| |
Born 1956 | Principal Occupation(s) During the Past Five Years: Principal of The Vanguard Group, Inc., | |
Secretary since July 2005 | since November 1997; General Counsel of The Vanguard Group since July 2005; | |
142 Vanguard Funds Overseen | Secretary of The Vanguard Group and of each of the investment companies served | |
| by The Vanguard Group since July 2005. | |
|
| |
Thomas J. Higgins |
| |
Born 1957 | Principal Occupation(s) During the Past Five Years: Principal of The Vanguard Group, Inc.; | |
Treasurer since July 1998 | Treasurer of each of the investment companies served by The Vanguard Group. | |
142 Vanguard Funds Overseen |
| |
|
| |
Vanguard Senior Management Team | ||
|
| |
R. Gregory Barton | Kathleen C. Gubanich | Michael S. Miller |
Mortimer J. Buckley | Paul A. Heller | Ralph K. Packard |
James H. Gately | F. William McNabb, III | George U. Sauter |
|
| |
Founder |
| |
|
| |
John C. Bogle |
| |
Chairman and Chief Executive Officer, 1974–1996 | ||
1 Officers of the funds are “interested persons” as defined in the Investment Company Act of 1940.
2 December 2002 for Vanguard Equity Income Fund, Vanguard Growth Equity Fund, the Vanguard Municipal Bond Funds, and the Vanguard State Tax-Exempt Funds.
More information about the trustees is in the Statement of Additional Information, available from The Vanguard Group.
|
|
| P.O. Box 2600 |
| Valley Forge, PA 19482-2600 |

Connect with Vanguard™ > www.vanguard.com
Fund Information > 800-662-7447 | Vanguard, Admiral, Connect with Vanguard, and the ship |
| logo are trademarks of The Vanguard Group, Inc. |
Direct Investor Account Services > 800-662-2739 |
|
| All other marks are the exclusive property of their |
Institutional Investor Services > 800-523-1036 | respective owners. |
|
|
Text Telephone > 800-952-3335 |
|
| All comparative mutual fund data are from Lipper Inc. |
| or Morningstar, Inc., unless otherwise noted. |
|
|
|
|
This material may be used in conjunction | You can obtain a free copy of Vanguard’s proxy voting |
with the offering of shares of any Vanguard | guidelines by visiting our website, www.vanguard.com, |
fund only if preceded or accompanied by | and searching for “proxy voting guidelines,” or by calling |
the fund’s current prospectus. | Vanguard at 800-662-2739. They are also available from |
| the SEC’s website, www.sec.gov. In addition, you may |
| obtain a free report on how your fund voted the proxies for |
| securities it owned during the 12 months ended June 30. |
| To get the report, visit either www.vanguard.com |
| or www.sec.gov. |
|
|
| You can review and copy information about your fund |
| at the SEC’s Public Reference Room in Washington, D.C. |
| To find out more about this public service, call the SEC |
| at 202-551-8090. Information about your fund is also |
| available on the SEC’s website, and you can receive |
| copies of this information, for a fee, by sending a |
| request in either of two ways: via e-mail addressed to |
| publicinfo@sec.gov or via regular mail addressed to the |
| Public Reference Section, Securities and Exchange |
| Commission, Washington, DC 20549-0102. |
|
|
|
|
|
|
|
|
| © 2006 The Vanguard Group, Inc. |
| All rights reserved. |
| Vanguard Marketing Corporation, Distributor. |
|
|
| Q08700 112006 |
Item 2: Code of Ethics. The Registrant has adopted a code of ethics that applies to the Registrant's principal executive officer, principal financial officer, principal accounting officer or controller or persons performing similar functions. The Code of Ethics was amended during the reporting period covered by this report to make certain technical, non-material changes.
Item 3: Audit Committee Financial Expert. The following members of the Audit Committee have been determined by the Registrant’s Board of Trustees to be Audit Committee Financial Experts serving on its Audit Committee, and to be independent: Charles D. Ellis, Rajiv L. Gupta, JoAnn Heffernan Heisen, André F. Perold, Alfred M. Rankin, Jr., and J. Lawrence Wilson.
Item 4: Principal Accountant Fees and Services.
(a) Audit Fees.
Audit Fees of the Registrant
Fiscal Year Ended September 30, 2006: $42,000
Fiscal Year Ended September 30, 2005: $18,000
Aggregate Audit Fees of Registered Investment Companies in the Vanguard Group
Fiscal Year Ended September 30, 2006: $2,347,620
Fiscal Year Ended September 30, 2005: $2,152,740
(b) Audit-Related Fees.
Fiscal Year Ended September 30, 2006: $530,000
Fiscal Year Ended September 30, 2005: $382,200
Includes fees billed in connection with assurance and related services provided to the Registrant, The Vanguard Group, Inc., Vanguard Marketing Corporation, and other registered investment companies in the Vanguard Group.
(c) Tax Fees.
Fiscal Year Ended September 30, 2006: $101,300
Fiscal Year Ended September 30, 2005: $98,400
Includes fees billed in connection with tax compliance, planning and advice services provided to the Registrant, The Vanguard Group, Inc., Vanguard Marketing Corporation, and other registered investment companies in the Vanguard Group and related to income and excise taxes.
(d) All Other Fees.
Fiscal Year Ended September 30, 2006: $0
Fiscal Year Ended September 30, 2005: $0
Includes fees billed for services related to risk management and privacy matters. Services were provided to the Registrant, The Vanguard Group, Inc., Vanguard Marketing Corporation, and other registered investment companies in the Vanguard Group.
(e) (1) Pre-Approval Policies. The policy of the Registrant’s Audit Committee is to consider and, if appropriate, approve before the principal accountant is engaged for such services, all specific audit and non-audit services provided to: (1) the Registrant; (2) The Vanguard Group, Inc.; (3) other entities controlled by The Vanguard Group, Inc. that provide ongoing services to the Registrant; and (4) other registered investment companies in the Vanguard Group. In making a determination, the Audit Committee considers whether the services are consistent with maintaining the principal accountant’s independence.
In the event of a contingency situation in which the principal accountant is needed to provide services in between scheduled Audit Committee meetings, the Chairman of the Audit Committee would be called on to consider and, if appropriate, pre-approve audit or permitted non-audit services in an amount sufficient to complete services through the next Audit Committee meeting, and to determine if such services would be consistent with maintaining the accountant’s independence. At the next scheduled Audit Committee meeting, services and fees would be presented to the Audit Committee for formal consideration, and, if appropriate, approval by the entire Audit Committee. The Audit Committee would again consider whether such services and fees are consistent with maintaining the principal accountant’s independence.
The Registrant’s Audit Committee is informed at least annually of all audit and non-audit services provided by the principal accountant to the Vanguard complex, whether such services are provided to: (1) the Registrant; (2) The Vanguard Group, Inc.; (3) other entities controlled by The Vanguard Group, Inc. that provide ongoing services to the Registrant; or other registered investment companies in the Vanguard Group.
(2) No percentage of the principal accountant’s fees or services were approved pursuant to the waiver provision of paragraph (c)(7)(i)(C) of Rule 2-01 of Regulation S-X.
(f) For the most recent fiscal year, over 50% of the hours worked under the principal accountant’s engagement were not performed by persons other than full-time, permanent employees of the principal accountant.
(g) Aggregate Non-Audit Fees.
Fiscal Year Ended September 30, 2006: $101,300
Fiscal Year Ended September 30, 2005: $98,400
Includes fees billed for non-audit services provided to the Registrant, The Vanguard Group, Inc., Vanguard Marketing Corporation, and other registered investment companies in the Vanguard Group.
(h) For the most recent fiscal year, the Audit Committee has determined that the provision of all non-audit services was consistent with maintaining the principal accountant’s independence.
Item 5: Not applicable.
Item 6: Not applicable.
Item 7: Not applicable.
Item 8: Not applicable.
Item 9: Not applicable.
Item 10: Not applicable
Item 11: Controls and Procedures.
(a) Disclosure Controls and Procedures. The Principal Executive and Financial Officers concluded that the Registrant’s Disclosure Controls and Procedures are effective based on their evaluation of the Disclosure Controls and Procedures as of a date within 90 days of the filing date of this report.
(b) Internal Control Over Financial Reporting. There were no significant changes in Registrant’s internal control over financial reporting or in other factors that could significantly affect this control subsequent to the date of the evaluation, including any corrective actions with regard to significant deficiencies and material weaknesses.
Item 12: Exhibits.
(a) Code of Ethics.
(b) Certifications.
Pursuant to the requirements of the Securities Exchange Act of 1934 and the Investment Company Act of 1940, the registrant has duly caused this report to be signed on its behalf by the undersigned, thereunto duly authorized.
| VANGUARD QUANTITATIVE FUNDS | |
| BY: | (signature) |
| (HEIDI STAM) JOHN J. BRENNAN* CHIEF EXECUTIVE OFFICER |
| Date: | November 17, 2006 |
Pursuant to the requirements of the Securities Exchange Act of 1934 and the Investment Company Act of 1940, this report has been signed below by the following persons on behalf of the registrant and in the capacities and on the dates indicated.
| VANGUARD QUANTITATIVE FUNDS | |
| BY: | (signature) |
| (HEIDI STAM) JOHN J. BRENNAN* CHIEF EXECUTIVE OFFICER |
| Date: | November 17, 2006 |
| VANGUARD QUANTITATIVE FUNDS | |
| BY: | (signature) |
| (HEIDI STAM) THOMAS J. HIGGINS* TREASURER |
| Date: | November 17, 2006 |
*By Power of Attorney. See File Number 002-65955-99, filed on July 27, 2006. Incorporated by Reference.