UNITED STATES
SECURITIES AND EXCHANGE COMMISSION
Washington, D.C. 20549
FORM N-CSR
CERTIFIED SHAREHOLDER REPORT
OF
REGISTERED MANAGEMENT INVESTMENT COMPANIES
Investment Company Act file number: 811-4526
Name of Registrant: Vanguard Quantitative Funds
Address of Registrant: | P.O. Box 2600 |
| Valley Forge, PA 19482 |
Name and address of agent for service: | Heidi Stam, Esquire |
| P.O. Box 876 |
| Valley Forge, PA 19482 |
Registrant’s telephone number, including area code: (610) 669-1000
Date of fiscal year end: September 30
Date of reporting period: October 1, 2006–September 30, 2007
Item 1: Reports to Shareholders

> In a tough 12 months for quantitative equity strategies, Vanguard Growth and Income Fund returned more than 16%, in line with the return of its benchmark index.
> The fund earned especially strong returns from its holdings in the technology and materials sectors.
> Health care and industrials stocks were among the weak spots.
Contents |
|
|
|
Your Fund’s Total Returns | 1 |
Chairman’s Letter | 2 |
Advisor’s Report | 7 |
Fund Profile | 9 |
Performance Summary | 10 |
Financial Statements | 12 |
Your Fund’s After-Tax Returns | 23 |
About Your Fund’s Expenses | 24 |
Trustees Approve Advisory Agreement | 26 |
Glossary | 27 |
Please note: The opinions expressed in this report are just that—informed opinions. They should not be considered promises or advice. Also, please keep in mind that the information and opinions cover the period through the date on the cover of this report. Of course, the risks of investing in your fund are spelled out in the prospectus.
Your Fund’s Total Returns
Fiscal Year Ended September 30, 2007 |
|
|
| Ticker | Total |
| Symbol | Returns |
Vanguard Growth and Income Fund |
|
|
Investor Shares | VQNPX | 16.2% |
Admiral™ Shares1 | VGIAX | 16.4 |
S&P 500 Index |
| 16.4 |
Average Large-Cap Core Fund2 |
| 16.0 |
Your Fund’s Performance at a Glance | ||||
September 30, 2006–September 30, 2007 | ||||
|
|
| Distributions Per Share | |
| Starting | Ending | Income | Capital |
| Share Price | Share Price | Dividends | Gains |
Vanguard Growth and Income Fund |
|
|
|
|
Investor Shares | $33.79 | $38.62 | $0.610 | $0.000 |
Admiral Shares | 55.20 | 63.08 | 1.093 | 0.000 |
1 A lower-cost class of shares available to many longtime shareholders and to those with significant investments in the fund.
2 Derived from data provided by Lipper Inc.
1

Chairman’s Letter
Dear Shareholder,
During the fiscal year ended September 30, the Investor Shares of Vanguard Growth and Income Fund returned 16.2%, while the lower-cost Admiral Shares matched the 16.4% return of the Standard & Poor’s 500 Index, the fund’s primary benchmark. The fund’s results were a bit above the peer-group average return.
Benchmark-matching performance might seem unremarkable, particularly for a fund with the explicit goal of outperforming the S&P 500 Index. It’s worth noting, however, that the past 12 months were an especially challenging time for actively managed quantitative strategies, which seek to match market levels of risk while outperforming their indexes with superior stock selection. Many of the stocks favored by these methodologies came under intense pressure, particularly in the final months of the period. In this environment, limiting shortfalls relative to the index was a notable success.
If you own the Growth and Income Fund in a taxable account, see page 23 for a report on the fund’s after-tax returns for the 12 months ended September 30. Please note: Our preliminary estimates suggest that the fund will distribute capital gains of roughly $3.40 per share for Investor Shares and $5.55 per share for Admiral Shares in December 2007.
Strong returns for U.S. stocks; even better for markets abroad
U.S. stocks produced excellent returns for the fiscal year. The gains came despite a midsummer shakeup brought on by problems in the subprime mortgage-loan market. Financials stocks—which represent a sizable share of the U.S. market’s value—were hardest hit, as investment banking and consumer lending businesses throttled back.
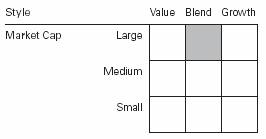
The broad U.S. equity market returned 17.1% for the year. Returns from large-capitalization stocks outpaced those of small-caps, and growth-oriented stocks outperformed their value-oriented counterparts. As investors took account of risk, they seemed to exhibit a preference for large-cap growth stocks, which seem better positioned to thrive in a period of economic uncertainty.
Although not immune from the effects of the turmoil in U.S. credit markets, international stocks handily surpassed the returns of domestic stocks over the 12 months. The dollar’s ongoing weakness further enhanced foreign market gains for U.S.-based investors.
2
The bond market was shaken, but regained ground in the end
Turmoil in the corporate bond and subprime lending markets caused a “flight to quality” that drove prices of U.S. Treasury bonds sharply higher, particularly toward the end of the fiscal period. As the bonds’ prices rose, their yields fell. The declines were greatest among Treasury securities with the shortest maturities. The yield of the 3-month Treasury bill, which started the fiscal year at 4.89%, dropped more than a full percentage point to 3.81%.
Market Barometer |
|
|
|
| Average Annual Total Returns | ||
| Periods Ended September 30, 2007 | ||
| One Year | Three Years | Five Years |
Stocks |
|
|
|
Russell 1000 Index (Large-caps) | 16.9% | 13.8% | 16.0% |
Russell 2000 Index (Small-caps) | 12.3 | 13.4 | 18.8 |
Dow Jones Wilshire 5000 Index (Entire market) | 17.1 | 14.0 | 16.5 |
MSCI All Country World Index ex USA (International) | 31.1 | 26.5 | 26.3 |
|
|
|
|
|
|
|
|
Bonds |
|
|
|
Lehman U.S. Aggregate Bond Index (Broad taxable market) | 5.1% | 3.9% | 4.1% |
Lehman Municipal Bond Index | 3.1 | 3.9 | 4.0 |
Citigroup 3-Month Treasury Bill Index | 5.0 | 4.0 | 2.8 |
|
|
|
|
|
|
|
|
CPI |
|
|
|
Consumer Price Index | 2.8% | 3.2% | 2.9% |
As short-term yields fell, the yield curve—which illustrates the relationship between short- and long-term bond yields—returned to its usual, upward-sloping pattern. The curve had been mildly inverted at the start of the period, with yields of shorter-term bonds above those of longer-term issues. For the year ended September 30, the broad taxable bond market returned 5.1%.
Returns from tax-exempt bonds were lower, as these issues did not benefit from the late-summer rally in Treasuries.
Fund held up well in a challenging market
During the past 12 months, Vanguard Growth and Income Fund returned more than 16%, an excellent return on an absolute basis. Like most actively managed quantitative strategies, however, the fund seeks to beat its index without assuming greater-than-index levels of risk. In fiscal year 2007, the Growth and Income Fund’s Investor Shares fell just shy of this goal.
Expense Ratios1 |
|
|
|
Your fund compared with its peer group |
|
|
|
|
|
| Average |
| Investor | Admiral | Large-Cap |
| Shares | Shares | Core Fund |
Growth and Income Fund | 0.32% | 0.18% | 1.35% |
1 Fund expense ratios reflect the 12 months ended September 30, 2007. Peer-group expense ratio is derived from data provided by Lipper Inc. and captures information through year-end 2006.
3
The context for evaluating the fund’s performance doesn’t end there, however. In general, active quantitative strategies favor the market’s less highly valued stocks. At year-end, for example, the stocks in Vanguard Growth and Income Fund’s portfolio carried an average price/earnings ratio of 15.2, compared with 17 for the S&P 500 Index.
This “value bias” created significant challenges for many quantitative strategies, as value-oriented stocks trailed their growth-oriented counterparts. The difference was especially pronounced during the final three months of the year, when problems in subprime mortgage loans reverberated through the global financial markets. The cause-and-effect relationship wasn’t entirely clear, but many quantitative funds were hit hard, at least on a relative basis.
Your fund avoided much of the fallout. Over the full year, the return of its Admiral Shares matched that of the S&P 500 Index, at 16.4%, while the Investor Shares fell just behind. This sturdy performance reflected excellent stock selection among information technology stocks. Like the index sector’s weighting, the fund’s weighting in tech was about 15%, but the fund managed to squeeze almost one full percentage point of additional return from its position. The fund also held some of the better-performing stocks in the materials sector.
Total Returns |
|
Ten Years Ended September 30, 2007 |
|
| Average |
| Annual Return |
Growth and Income Fund | 6.7% |
S&P 500 Index | 6.6 |
Average Large-Cap Core Fund1 | 5.5 |
The figures shown represent past performance, which is not a guarantee of future results. (Current performance may be lower or higher than the performance data cited. For performance data current to the most recent month-end, visit our website at www.vanguard.com/performance.) Note, too, that both investment returns and principal value can fluctuate widely, so an investor’s shares, when sold, could be worth more or less than their original cost.
1 Derived from data provided by Lipper Inc.
4
Disciplined management has kept fund on track
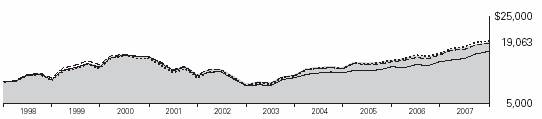
Over the past ten years, a period that includes one of the worst stock market downturns in modern financial history, the Growth and Income Fund has returned an annualized 6.7%, a tad better than the return of its index and 1.2 percentage points higher than the average return of large-cap core mutual funds. The Growth and Income Fund Investor Shares would have transformed an initial investment of $10,000 into $19,063 in wealth for the decade. The same investment compounded at the peer group’s average return would be worth $17,023, about $2,000 less.
The fund has achieved its benchmark-beating result with the same disciplined strategy that helped limit the damage of the stock market’s turmoil during the last three months of the fund’s 2007 fiscal year. The fund has also benefited from low operating costs, which have helped to maximize investors’ share of fund returns.
Uncertainty is par for the course
After several years of unusual calm, the financial markets experienced a jolt in the third quarter. Stock market volatility increased sharply, and several other long-established trends seemed to shift into reverse. The changes were dramatic, but a long-term perspective suggests that these occasional—and unpredictable—dislocations are an enduring feature of the financial markets.
A prudent response to this uncertainty is diversification both within and across asset classes, which is why we counsel investors to hold a broadly diversified portfolio of stocks and fixed income investments in proportions consistent with their goals, risk tolerance, and time horizons. Vanguard Growth and Income Fund can play a valuable role in such a portfolio.
Thank you for entrusting your assets to Vanguard.
Sincerely,

John J. Brennan
Chairman and Chief Executive Officer
October 17, 2007
5
Advisor’s Report
The U.S. stock market has performed extraordinarily well in the face of considerable uncertainty over the housing sector recession, the subprime loan debacle, the direction of interest rates and the U.S. dollar, and the potential for a broad U.S. economic recession in the near future. In the second week of August, the markets experienced a liquidity-driven upheaval as quantitatively managed hedge funds sharply deleveraged, although there was a significant rebound by the month-end. In September, the markets reacted favorably to the first cut in the federal funds target rate since 2003, and indications were that a serious liquidity crisis was averted.
In the spirit of “silver linings,” it is possible the recent financial stresses triggered by the sharp downturn in the housing sector may extend the ultimate duration of the current economic expansion, albeit at a slower pace. By slowing credit leverage now (in housing and private-equity deals, for example), and reinforcing the need to properly price risk into the cost and extension of credit, we may have avoided a more severe correction later in the economic cycle. And as non-U.S. economies (in emerging as well as developed countries) continue to expand and the U.S. dollar remains weak, corporations may increase their profits by relying on demand outside the United States to compensate for weak domestic demand.
Thus the growth slowdown in the United States, which began in spring 2006, may not lead to a wider recession, so long as the rest of the world economy remains in a moderate growth upswing. In my letter to shareholders one year ago I thought it possible that“global economic expansion could continue through the end of 2007, given current conditions. U.S. stocks, in particular large-capitalization growth and ‘quality’ issues, could continue to rise well into next year as continued corporate profitability has kept valuations reasonable.” I would now change “2007” to “2008” and reiterate that assessment, though perhaps with the caveat that there may be more risk or uncertainty surrounding this year’s prediction.
Our successes
Stock selection in the Growth and Income Fund during the 12 months ended September 30 was particularly good in technology, consumer durables, and basic materials. Specific stocks that generated positive active returns (that is, superior to the average return of their industries) included International Business Machines (computer software and services), Apple (computers and iPods), Goldman Sachs Group (investment banking and brokerage), Freeport-McMoRan Copper & Gold (metals and mining), Walgreen (specialty retail), PACCAR (trucks), and General Electric (industrial conglomerate). In addition, the fund’s performance relative to the Standard & Poor’s 500 Index benefited from not holding or from underweighting certain poorly performing stocks, including Motorola (wireless and broadband communications, down –25%), Countrywide Financial (mortgage lending, –45%), and Starbucks (coffee retailing/roasting, –23%).
Although sector and industry tilts (measured as the difference between the portfolio weighting and the S&P 500 Index weighting in a particular sector) are deliberately minimized in the Growth and Income Fund, they are not forced to zero. During the 2007 fiscal year, the fund’s small overweighting in mining & metals and energy reserves, and its underweighting in thrifts, helped the portfolio’s relative return. In addition, the fund’s tilt toward stocks with near-term positive price momentum aided performance.
6
Our shortfalls
The fund’s performance closely tracked that of the S&P 500 Index for the full fiscal year, but did not beat the index. The portfolio’s relative performance was good from October through March, lagged from April through July, and rebounded in August and September. Although the momentum and growth stock-selection factors were modestly successful, factors focused on valuation were ineffective and served as a brake on returns during fiscal 2007.
Holdings that had a negative impact on results included Valero Energy (oil refining), Lehman Brothers (investment banking and brokerage), Texas Utilities (electric utility taken private), National City Corp (bank), and Novellus Systems (semiconductor equipment). In addition, not holding Intel and Monsanto—strong performers over the past 12 months—had a negative impact on results.
The fund’s positioning
We continue to remain focused on our investment discipline as it applies to stock selection, portfolio construction, and implementation. We believe the Growth and Income Fund is well positioned to achieve its long-run goal of outperforming the S&P 500 Index. Our disciplined process leads us to favor reasonably priced stocks with good potential for future earnings growth. The fund will remain fully invested in those stocks we consider most attractive, and the portfolio risk will be focused to minimize exposure to characteristics we believe are unrewarded. In recent months there has been a measurable increase in individual stock volatility that increases the potential, though not the certitude, of outperforming the benchmark. We continue to believe the Growth and Income Fund is an excellent choice for those seeking a diversified exposure to large-cap U.S. equities.
John S. Cone, CFA, President and
Chief Executive Officer
Franklin Portfolio Associates, LLC
October 16, 2007
7
Fund Profile
As of September 30, 2007
Portfolio Characteristics |
|
| |
|
| Comparative | Broad |
| Fund | Index1 | Index2 |
Number of Stocks | 110 | 500 | 4,887 |
Median Market Cap | $47.1B | $59.2B | $36.1B |
Price/Earnings Ratio | 15.2x | 17.0x | 18.1x |
Price/Book Ratio | 2.8x | 2.9x | 2.8x |
Yield |
| 1.9% | 1.7% |
Investor Shares | 1.6% |
|
|
Admiral Shares | 1.7% |
|
|
Return on Equity | 21.2% | 19.9% | 18.8% |
Earnings Growth Rate | 27.8% | 21.8% | 21.6% |
Foreign Holdings | 0.0% | 0.0% | 0.0% |
Turnover Rate | 100% | — | — |
Expense Ratio |
| — | — |
Investor Shares | 0.32% |
|
|
Admiral Shares | 0.18% |
|
|
Short-Term Reserves | 0.5% | — | — |
Sector Diversification (% of equity exposure) | |||
|
| Comparative | Broad |
| Fund | Index1 | Index2 |
Consumer Discretionary | 9.0% | 9.2% | 10.4% |
Consumer Staples | 9.3 | 9.5 | 8.2 |
Energy | 12.5 | 11.7 | 11.2 |
Financials | 20.0 | 19.9 | 20.0 |
Health Care | 13.0 | 11.6 | 11.6 |
Industrials | 12.5 | 11.5 | 11.8 |
Information Technology | 15.4 | 16.2 | 16.0 |
Materials | 2.2 | 3.2 | 3.7 |
Telecommunication |
|
|
|
Services | 2.5 | 3.8 | 3.5 |
Utilities | 3.6 | 3.4 | 3.6 |
Volatility Measures3 |
| |
| Fund Versus | Fund Versus |
| Comparative Index1 | Broad Index2 |
R-Squared | 0.95 | 0.94 |
Beta | 1.02 | 0.94 |
8
Ten Largest Holdings4 (% of total net assets) | ||
|
|
|
General Electric Co. | industrial |
|
| conglomerates | 4.1% |
ExxonMobil Corp. | integrated oil |
|
| and gas | 3.7 |
Citigroup, Inc. | diversified |
|
| financial services | 3.5 |
The Procter & Gamble Co. | household products | 3.0 |
Apple Inc. | computer hardware | 3.0 |
Bank of America Corp. | diversified |
|
| financial services | 2.9 |
American |
|
|
International Group, Inc. | multi-line insurance | 2.8 |
Johnson & Johnson | pharmaceuticals | 2.6 |
International Business |
|
|
Machines Corp. | computer hardware | 2.4 |
QUALCOMM Inc. | communications |
|
| equipment | 2.4 |
Top Ten |
| 30.4% |
Investment Focus
1 S&P 500 Index.
2 Dow Jones Wilshire 5000 Index.
3 For an explanation of R-squared, beta, and other terms used here, see the Glossary on page 29.
4 “Ten Largest Holdings” excludes any temporary cash investments and equity index products.
9
Performance Summary
All of the returns in this report represent past performance, which is not a guarantee of future results that may be achieved by the fund. (Current performance may be lower or higher than the performance data cited. For performance data current to the most recent month-end, visit our website at www.vanguard.com/performance.) Note, too, that both investment returns and principal value can fluctuate widely, so an investor’s shares, when sold, could be worth more or less than their original cost. The returns shown do not reflect taxes that a shareholder would pay on fund distributions or on the sale of fund shares.
Cumulative Performance: September 30, 1997–September 30, 2007
Initial Investment of $10,000
| Average Annual Total Returns | Final Value | ||
| Periods Ended September 30, 2007 | of a $10,000 | ||
| One Year | Five Years | Ten Years | Investment |
Growth and Income Fund Investor Shares1 | 16.20% | 15.00% | 6.66% | $19,063 |
Dow Jones Wilshire 5000 Index | 17.08 | 16.53 | 6.85 | 19,399 |
S&P 500 Index | 16.44 | 15.45 | 6.57 | 18,896 |
Average Large-Cap Core Fund2 | 15.96 | 13.37 | 5.46 | 17,023 |
|
|
|
| Final Value |
|
|
| Since | of a $100,000 |
| One Year | Five Years | Inception3 | Investment |
Growth and Income Fund Admiral Shares | 16.37% | 15.19% | 5.33% | $139,324 |
Dow Jones Wilshire 5000 Index | 17.08 | 16.53 | 6.33 | 147,956 |
S&P 500 Index | 16.44 | 15.45 | 5.01 | 136,638 |
1 Total return figures do not include the account service fee that may be applicable to certain accounts with balances below $10,000.
2 Derived from data provided by Lipper Inc.
3 Performance for the fund’s Admiral Shares and comparative standards is calculated since the Admiral Shares’ inception: May 14, 2001.
10
Fiscal-Year Total Returns (%): September 30, 1997–September 30, 2007
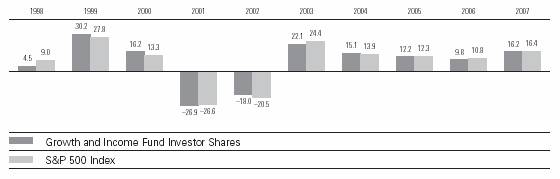
Note: See Financial Highlights tables on pages 19 and 20 for dividend and capital gains information.
11
Financial Statements
Statement of Net Assets
As of September 30, 2007
The fund provides a complete list of its holdings four times in each fiscal year, at the quarter-ends. For the second and fourth fiscal quarters, the lists appear in the fund’s semiannual and annual reports to shareholders. For the first and third fiscal quarters, the fund files the lists with the Securities and Exchange Commission on Form N-Q. Shareholders can look up the fund’s Forms N-Q on the SEC’s website at www.sec.gov. Forms N-Q may also be reviewed and copied at the SEC’s Public Reference Room (see the back cover of this report for further information).
|
|
| Market |
|
|
| Value• |
|
| Shares | ($000) |
Common Stocks (98.7%)1 |
|
| |
Consumer Discretionary (8.9%) |
|
| |
| Sherwin-Williams Co. | 1,859,000 | 122,155 |
| News Corp., Class A | 5,033,100 | 110,678 |
| Time Warner, Inc. | 5,279,000 | 96,922 |
* | Big Lots Inc. | 3,011,600 | 89,866 |
| Mattel, Inc. | 2,871,600 | 67,368 |
| Harley-Davidson, Inc. | 971,800 | 44,907 |
| NIKE, Inc. Class B | 726,500 | 42,616 |
* | Kohl’s Corp. | 602,800 | 34,559 |
| J.C. Penney Co., Inc. |
|
|
| (Holding Co.) | 464,100 | 29,410 |
* | Amazon.com, Inc. | 301,400 | 28,075 |
| The McGraw-Hill Cos., Inc. | 278,000 | 14,153 |
| Omnicom Group Inc. | 229,000 | 11,013 |
| TJX Cos., Inc. | 282,200 | 8,204 |
| Gannett Co., Inc. | 179,900 | 7,862 |
* | AutoZone Inc. | 50,500 | 5,865 |
| Hasbro, Inc. | 209,700 | 5,846 |
| Tribune Co. | 169,028 | 4,618 |
* | Viacom Inc. Class B | 103,500 | 4,033 |
| Family Dollar Stores, Inc. | 151,300 | 4,019 |
|
|
| 732,169 |
Consumer Staples (9.2%) |
|
| |
| The Procter & Gamble Co. | 3,531,400 | 248,399 |
| Sysco Corp. | 3,858,800 | 137,335 |
| Walgreen Co. | 2,830,800 | 133,727 |
| The Kroger Co. | 2,656,300 | 75,758 |
| PepsiCo, Inc. | 911,100 | 66,747 |
| UST, Inc. | 696,700 | 34,556 |
| Altria Group, Inc. | 357,400 | 24,850 |
| McCormick & Co., Inc. | 652,300 | 23,463 |
| Wal-Mart Stores, Inc. | 346,500 | 15,125 |
|
|
| 759,960 |
12
|
|
| Market |
|
|
| Value• |
|
| Shares | ($000) |
Energy (12.4%) |
|
| |
| ExxonMobil Corp. | 3,324,236 | 307,691 |
| XTO Energy, Inc. | 2,846,800 | 176,046 |
| Valero Energy Corp. | 2,466,600 | 165,706 |
* | National Oilwell Varco Inc. | 1,051,000 | 151,869 |
| Chevron Corp. | 903,400 | 84,540 |
| Chesapeake Energy Corp. | 1,924,500 | 67,858 |
| Marathon Oil Corp. | 933,600 | 53,234 |
| ConocoPhillips Co. | 159,519 | 14,001 |
|
|
| 1,020,945 |
Financials (19.7%) |
|
| |
| Citigroup, Inc. | 6,269,500 | 292,598 |
| Bank of America Corp. | 4,753,299 | 238,948 |
| American International |
|
|
| Group, Inc. | 3,423,800 | 231,620 |
| JPMorgan Chase & Co. | 3,087,700 | 141,478 |
| Wachovia Corp. | 2,806,050 | 140,723 |
| Prudential Financial, Inc. | 1,323,700 | 129,167 |
| ProLogis REIT | 1,436,400 | 95,305 |
| Safeco Corp. | 1,116,400 | 68,346 |
| Wells Fargo & Co. | 1,453,100 | 51,759 |
| Cincinnati Financial Corp. | 868,608 | 37,619 |
| Merrill Lynch & Co., Inc. | 456,600 | 32,546 |
| CIT Group Inc. | 792,900 | 31,875 |
| Ambac Financial Group, Inc. | 454,900 | 28,618 |
| MetLife, Inc. | 407,200 | 28,394 |
| Morgan Stanley | 440,100 | 27,726 |
| Boston Properties, Inc. REIT | 241,100 | 25,050 |
| The Allstate Corp. | 232,400 | 13,291 |
| The Chubb Corp. | 183,000 | 9,816 |
| Moody’s Corp. | 66,800 | 3,367 |
|
|
| 1,628,246 |
Health Care (12.8%) |
|
| |
| Johnson & Johnson | 3,251,500 | 213,624 |
| Pfizer Inc. | 6,795,527 | 166,015 |
* | Zimmer Holdings, Inc. | 1,924,500 | 155,865 |
| Aetna Inc. | 2,551,600 | 138,475 |
| CIGNA Corp. | 1,711,400 | 91,200 |
| AmerisourceBergen Corp. | 1,682,100 | 76,250 |
| Stryker Corp. | 1,089,500 | 74,914 |
* | Celgene Corp. | 985,400 | 70,269 |
* | Humana Inc. | 495,400 | 34,619 |
| Baxter International, Inc. | 373,000 | 20,992 |
| Schering-Plough Corp. | 387,800 | 12,266 |
* | Genzyme Corp. | 98,900 | 6,128 |
|
|
| 1,060,617 |
13
|
|
| Market |
|
|
| Value• |
|
| Shares | ($000) |
Industrials (12.3%) |
|
| |
| General Electric Co. | 8,177,600 | 338,553 |
| Lockheed Martin Corp. | 1,789,900 | 194,186 |
| Tyco International, Ltd. | 2,142,500 | 94,998 |
| CSX Corp. | 1,702,000 | 72,726 |
| PACCAR, Inc. | 852,000 | 72,633 |
* | Allied Waste Industries, Inc. | 3,747,500 | 47,781 |
| Precision Castparts Corp. | 316,500 | 46,836 |
| ITT Industries, Inc. | 646,500 | 43,917 |
| Norfolk Southern Corp. | 757,400 | 39,317 |
| Northrop Grumman Corp. | 302,800 | 23,618 |
| L-3 Communications |
|
|
| Holdings, Inc. | 202,400 | 20,673 |
| Eaton Corp. | 111,400 | 11,033 |
| Raytheon Co. | 169,200 | 10,798 |
|
|
| 1,017,069 |
Information Technology (15.2%) |
|
| |
* | Apple Inc. | 1,603,000 | 246,125 |
| International Business |
|
|
| Machines Corp. | 1,674,700 | 197,280 |
| QUALCOMM Inc. | 4,662,400 | 197,033 |
| Applied Materials, Inc. | 7,756,800 | 160,566 |
* | Oracle Corp. | 5,879,000 | 127,280 |
* | Google Inc. | 113,900 | 64,612 |
| Microsoft Corp. | 1,998,700 | 58,882 |
* | Xerox Corp. | 2,604,300 | 45,159 |
| Hewlett-Packard Co. | 851,200 | 42,381 |
* | Novellus Systems, Inc. | 1,099,700 | 29,978 |
* | ADC |
|
|
| Telecommunications, Inc. | 1,383,900 | 27,138 |
* | Dell Inc. | 818,100 | 22,580 |
| Electronic Data |
|
|
| Systems Corp. | 582,900 | 12,731 |
* | NCR Corp. | 199,700 | 9,945 |
* | Cisco Systems, Inc. | 232,800 | 7,708 |
* | MEMC Electronic |
|
|
| Materials, Inc. | 107,100 | 6,304 |
* | Verigy Ltd. | 1 | — |
|
|
| 1,255,702 |
Materials (2.1%) |
|
| |
| Freeport-McMoRan Copper |
|
|
| & Gold, Inc. Class B | 579,396 | 60,773 |
| Dow Chemical Co. | 799,300 | 34,418 |
* | Pactiv Corp. | 979,100 | 28,061 |
| Ball Corp. | 432,500 | 23,247 |
| United States Steel Corp. | 202,100 | 21,410 |
| Sealed Air Corp. | 392,800 | 10,040 |
|
|
| 177,949 |
14
|
|
| Market |
|
|
| Value• |
|
| Shares | ($000) |
Telecommunication Services (2.5%) |
|
| |
| AT&T Inc. | 2,560,000 | 108,314 |
* | Qwest Communications |
|
|
| International Inc. | 10,728,100 | 98,269 |
|
|
| 206,583 |
Utilities (3.6%) |
|
| |
| PG&E Corp. | 3,411,300 | 163,060 |
| CenterPoint Energy Inc. | 3,709,400 | 59,462 |
| Duke Energy Corp. | 1,519,400 | 28,398 |
| DTE Energy Co. | 471,400 | 22,835 |
| TXU Corp. | 298,900 | 20,466 |
|
|
| 294,221 |
Total Common Stocks |
|
| |
(Cost $6,977,599) |
| 8,153,461 | |
Temporary Cash Investments (1.6%)1 |
|
| |
Money Market Fund (1.6%) |
|
| |
2 | Vanguard Market Liquidity |
|
|
| Fund, 5.153% | 128,263,439 | 128,263 |
|
|
|
|
|
|
|
|
|
| Face |
|
|
| Amount |
|
|
| ($000) |
|
U.S. Government Obligations (0.0%) |
|
| |
| U.S. Treasury Bills |
|
|
3 | 3.641%–3.887%, 12/20/07 | 3,385 | 3,357 |
Total Temporary Cash Investments |
|
| |
(Cost $131,620) |
| 131,620 | |
Total Investments (100.3%) |
|
| |
(Cost $7,109,219) |
| 8,285,081 | |
Other Assets and Liabilities (–0.3%) |
|
| |
Receivables for Investment |
|
| |
| Securities Sold |
| 207,699 |
Other Assets—Note C |
| 12,688 | |
Payables for Investment |
|
| |
| Securities Purchased |
| (220,735) |
Other Liabilities |
| (26,233) | |
|
|
| (26,581) |
Net Assets (100%) |
| 8,258,500 | |
15
At September 30, 2007, net assets consisted of:4 | |
| Amount |
| ($000) |
Paid-in Capital | 6,334,996 |
Undistributed Net Investment Income | 19,803 |
Accumulated Net Realized Gains | 725,765 |
Unrealized Appreciation |
|
Investment Securities | 1,175,862 |
Futures Contracts | 2,074 |
Net Assets | 8,258,500 |
|
|
|
|
Investor Shares—Net Assets |
|
Applicable to 141,497,103 outstanding |
|
$.001 par value shares of beneficial |
|
interest (unlimited authorization) | 5,464,916 |
Net Asset Value Per Share— |
|
Investor Shares | $38.62 |
|
|
|
|
Admiral Shares—Net Assets |
|
Applicable to 44,286,054 outstanding |
|
$.001 par value shares of beneficial |
|
interest (unlimited authorization) | 2,793,584 |
Net Asset Value Per Share— |
|
Admiral Shares | $63.08 |
• See Note A in Notes to Financial Statements.
* Non-income-producing security.
1 The fund invests a portion of its cash reserves in equity markets through the use of index futures contracts. After giving effect to futures investments, the fund’s effective common stock and temporary cash investment positions represent 99.7% and 0.6%, respectively, of net assets, see Note E in Notes to Financial Statements.
2 Affiliated money market fund available only to Vanguard funds and certain trusts and accounts managed by Vanguard. Rate shown is the 7-day yield.
3 Securities with a value of $3,357,000 have been segregated as initial margin for open futures contracts.
4 See Note E in Notes to Financial Statements for the tax-basis components of net assets.
REIT—Real Estate Investment Trust.
16
Statement of Operations
| Year Ended |
| September 30, 2007 |
| ($000) |
Investment Income |
|
Income |
|
Dividends | 149,460 |
Interest1 | 3,763 |
Security Lending | 1 |
Total Income | 153,224 |
Expenses |
|
Investment Advisory Fees—Note B |
|
Basic Fee | 6,681 |
Performance Adjustment | — |
The Vanguard Group—Note C |
|
Management and Administrative—Investor Shares | 11,635 |
Management and Administrative—Admiral Shares | 2,125 |
Marketing and Distribution—Investor Shares | 953 |
Marketing and Distribution—Admiral Shares | 415 |
Custodian Fees | 67 |
Auditing Fees | 24 |
Shareholders’ Reports—Investor Shares | 148 |
Shareholders’ Reports—Admiral Shares | 9 |
Trustees’ Fees and Expenses | 12 |
Total Expenses | 22,069 |
Expenses Paid Indirectly—Note D | (1,570) |
Net Expenses | 20,499 |
Net Investment Income | 132,725 |
Realized Net Gain (Loss) |
|
Investment Securities Sold | 911,180 |
Futures Contracts | 1,669 |
Realized Net Gain (Loss) | 912,849 |
Change in Unrealized Appreciation (Depreciation) |
|
Investment Securities | 133,545 |
Futures Contracts | 1,295 |
Change in Unrealized Appreciation (Depreciation) | 134,840 |
Net Increase (Decrease) in Net Assets Resulting from Operations | 1,180,414 |
1 Interest income from an affiliated company of the fund was $3,653,000.
17
Statement of Changes in Net Assets
| Year Ended September 30, | |
| 2007 | 2006 |
| ($000) | ($000) |
Increase (Decrease) in Net Assets |
|
|
Operations |
|
|
Net Investment Income | 132,725 | 126,813 |
Realized Net Gain (Loss) | 912,849 | 621,107 |
Change in Unrealized Appreciation (Depreciation) | 134,840 | (60,523) |
Net Increase (Decrease) in Net Assets Resulting from Operations | 1,180,414 | 687,397 |
Distributions |
|
|
Net Investment Income |
|
|
Investor Shares | (88,650) | (81,854) |
Admiral Shares | (46,594) | (39,539) |
Realized Capital Gain |
|
|
Investor Shares | — | — |
Admiral Shares | — | — |
Total Distributions | (135,244) | (121,393) |
Capital Share Transactions—Note G |
|
|
Investor Shares | (333,115) | (509,343) |
Admiral Shares | 138,269 | 110,294 |
Net Increase (Decrease) from Capital Share Transactions | (194,846) | (399,049) |
Total Increase (Decrease) | 850,324 | 166,955 |
Net Assets |
|
|
Beginning of Period | 7,408,176 | 7,241,221 |
End of Period1 | 8,258,500 | 7,408,176 |
1 Net Assets—End of Period includes undistributed net investment income of $19,803,000 and $22,322,000.
18
Financial Highlights
Investor Shares |
|
|
|
|
|
|
|
|
|
|
|
|
|
|
|
|
|
| Year Ended September 30, | ||||
For a Share Outstanding Throughout Each Period | 2007 | 2006 | 2005 | 2004 | 2003 |
Net Asset Value, Beginning of Period | $33.79 | $31.29 | $28.31 | $24.91 | $20.68 |
Investment Operations |
|
|
|
|
|
Net Investment Income | .60 | .55 | .46 | .37 | .318 |
Net Realized and Unrealized Gain (Loss) |
|
|
|
|
|
on Investments | 4.84 | 2.47 | 2.98 | 3.39 | 4.227 |
Total from Investment Operations | 5.44 | 3.02 | 3.44 | 3.76 | 4.545 |
Distributions |
|
|
|
|
|
Dividends from Net Investment Income | (.61) | (.52) | (.46) | (.36) | (.315) |
Distributions from Realized Capital Gains | — | — | — | — | — |
Total Distributions | (.61) | (.52) | (.46) | (.36) | (.315) |
Net Asset Value, End of Period | $38.62 | $33.79 | $31.29 | $28.31 | $24.91 |
|
|
|
|
|
|
|
|
|
|
|
|
Total Return1 | 16.20% | 9.76% | 12.20% | 15.12% | 22.09% |
|
|
|
|
|
|
|
|
|
|
|
|
Ratios/Supplemental Data |
|
|
|
|
|
Net Assets, End of Period (Millions) | $5,465 | $5,088 | $5,202 | $5,780 | $5,119 |
Ratio of Total Expenses to |
|
|
|
|
|
Average Net Assets2 | 0.32% | 0.38% | 0.40% | 0.42% | 0.46% |
Ratio of Net Investment Income to |
|
|
|
|
|
Average Net Assets | 1.61% | 1.65% | 1.53% | 1.35% | 1.39% |
Portfolio Turnover Rate | 100% | 93% | 84% | 79%3 | 88% |
1 Total returns do not include the account service fee that may be applicable to certain accounts with balances below $10,000.
2 Includes performance-based investment advisory fee increases (decreases) of 0.00%, 0.01%, 0.01%, 0.01%, and 0.00%.
3 Excludes the value of portfolio securities received or delivered as a result of in-kind purchases or redemptions of the fund’s capital shares.
19
Admiral Shares |
|
|
|
|
|
|
|
|
|
|
|
|
|
|
|
|
|
| Year Ended September 30, | ||||
For a Share Outstanding Throughout Each Period | 2007 | 2006 | 2005 | 2004 | 2003 |
Net Asset Value, Beginning of Period | $55.20 | $51.12 | $46.25 | $40.70 | $33.78 |
Investment Operations |
|
|
|
|
|
Net Investment Income | 1.070 | .997 | .849 | .683 | .567 |
Net Realized and Unrealized Gain (Loss) |
|
|
|
|
|
on Investments | 7.903 | 4.036 | 4.853 | 5.530 | 6.920 |
Total from Investment Operations | 8.973 | 5.033 | 5.702 | 6.213 | 7.487 |
Distributions |
|
|
|
|
|
Dividends from Net Investment Income | (1.093) | (.953) | (.832) | (.663) | (.567) |
Distributions from Realized Capital Gains | — | — | — | — | — |
Total Distributions | (1.093) | (.953) | (.832) | (.663) | (.567) |
Net Asset Value, End of Period | $63.08 | $55.20 | $51.12 | $46.25 | $40.70 |
|
|
|
|
|
|
|
|
|
|
|
|
Total Return | 16.37% | 9.97% | 12.39% | 15.29% | 22.29% |
|
|
|
|
|
|
|
|
|
|
|
|
Ratios/Supplemental Data |
|
|
|
|
|
Net Assets, End of Period (Millions) | $2,794 | $2,321 | $2,039 | $843 | $812 |
Ratio of Total Expenses to |
|
|
|
|
|
Average Net Assets1 | 0.18% | 0.20% | 0.23% | 0.25% | 0.31% |
Ratio of Net Investment Income to |
|
|
|
|
|
Average Net Assets | 1.75% | 1.83% | 1.68% | 1.51% | 1.54% |
Portfolio Turnover Rate | 100% | 93% | 84% | 79%2 | 88% |
1 Includes performance-based investment advisory fee increases (decreases) of 0.00%, 0.01%, 0.01%, 0.01%, and 0.00%.
2 Excludes the value of portfolio securities received or delivered as a result of in-kind purchases or redemptions of the fund’s capital shares.
See accompanying Notes, which are an integral part of the Financial Statements.
20
Notes to Financial Statements
Vanguard Growth and Income Fund is registered under the Investment Company Act of 1940 as an open-end investment company, or mutual fund. The fund files reports with the SEC under the company name Vanguard Quantitative Funds. The fund offers two classes of shares, Investor Shares and Admiral Shares. Investor Shares are available to any investor who meets the fund’s minimum purchase requirements. Admiral Shares are designed for investors who meet certain administrative, service, tenure, and account-size criteria.
A. The following significant accounting policies conform to generally accepted accounting principles for U.S. mutual funds. The fund consistently follows such policies in preparing its financial statements.
1. Security Valuation: Securities are valued as of the close of trading on the New York Stock Exchange (generally 4 p.m., Eastern time) on the valuation date. Equity securities are valued at the latest quoted sales prices or official closing prices taken from the primary market in which each security trades; such securities not traded on the valuation date are valued at the mean of the latest quoted bid and asked prices. Securities for which market quotations are not readily available, or whose values have been materially affected by events occurring before the fund’s pricing time but after the close of the securities’ primary markets, are valued by methods deemed by the board of trustees to represent fair value. Investments in Vanguard Market Liquidity Fund are valued at that fund’s net asset value. Temporary cash investments acquired over 60 days to maturity are valued using the latest bid prices or using valuations based on a matrix system (which considers such factors as security prices, yields, maturities, and ratings), both as furnished by independent pricing services. Other temporary cash investments are valued at amortized cost, which approximates market value.
2. Futures Contracts: The fund uses index futures contracts to a limited extent, with the objective of maintaining full exposure to the stock market while maintaining liquidity. The fund may purchase or sell futures contracts to achieve a desired level of investment, whether to accommodate portfolio turnover or cash flows from capital share transactions. The primary risks associated with the use of futures contracts are imperfect correlation between changes in market values of stocks held by the fund and the prices of futures contracts, and the possibility of an illiquid market.
Futures contracts are valued at their quoted daily settlement prices. The aggregate principal amounts of the contracts are not recorded in the Statement of Net Assets. Fluctuations in the value of the contracts are recorded in the Statement of Net Assets as an asset (liability) and in the Statement of Operations as unrealized appreciation (depreciation) until the contracts are closed, when they are recorded as realized futures gains (losses).
3. Federal Income Taxes: The fund intends to continue to qualify as a regulated investment company and distribute all of its taxable income. Accordingly, no provision for federal income taxes is required in the financial statements.
4. Distributions: Distributions to shareholders are recorded on the ex-dividend date.
5. Security Lending: The fund may lend its securities to qualified institutional borrowers to earn additional income. Security loans are required to be secured at all times by collateral at least equal to the market value of securities loaned. The fund invests cash collateral received in Vanguard Market Liquidity Fund, and records a liability for the return of the collateral, during the period the securities are on loan. Security lending income represents the income earned on investing cash collateral, less expenses associated with the loan.
6. Other: Dividend income is recorded on the ex-dividend date. Interest income includes income distributions received from Vanguard Market Liquidity Fund and is accrued daily. Security transactions are accounted for on the date securities are bought or sold. Costs used to determine realized gains (losses) on the sale of investment securities are those of the specific securities sold.
21
Each class of shares has equal rights as to assets and earnings, except that each class separately bears certain class-specific expenses related to maintenance of shareholder accounts (included in Management and Administrative expenses) and shareholder reporting. Marketing and distribution expenses are allocated to each class of shares based on a method approved by the board of trustees. Income, other non-class-specific expenses, and gains and losses on investments are allocated to each class of shares based on its relative net assets.
B. Franklin Portfolio Associates, LLC, provides investment advisory services to the fund for a fee calculated at an annual percentage rate of average net assets. The basic fee is subject to quarterly adjustments based on the fund’s performance for the preceding three years relative to the S&P 500 Index. For the year ended September 30, 2007, the investment advisory fee represented an effective annual basic rate of 0.08% of the fund’s average net assets, with no adjustment required based on performance.
C. The Vanguard Group furnishes at cost corporate management, administrative, marketing, and distribution services. The costs of such services are allocated to the fund under methods approved by the board of trustees. The fund has committed to provide up to 0.40% of its net assets in capital contributions to Vanguard. At September 30, 2007, the fund had contributed capital of $690,000 to Vanguard (included in Other Assets), representing 0.01% of the fund’s net assets and 0.69% of Vanguard’s capitalization. The fund’s trustees and officers are also directors and officers of Vanguard.
D. The fund has asked its investment advisor to direct certain security trades, subject to obtaining the best price and execution, to brokers who have agreed to rebate to the fund part of the commissions generated. Such rebates are used solely to reduce the fund’s management and administrative expenses. The fund’s custodian bank has also agreed to reduce its fees when the fund maintains cash on deposit in the non-interest-bearing custody account. For the year ended September 30, 2007, these arrangements reduced the fund’s management and administrative expenses by $1,558,000 and custodian fees by $12,000. The total expense reduction represented an effective annual rate of 0.02% of the fund’s average net assets.
E. Distributions are determined on a tax basis and may differ from net investment income and realized capital gains for financial reporting purposes. Differences may be permanent or temporary. Permanent differences are reclassified among capital accounts in the financial statements to reflect their tax character. Temporary differences arise when certain items of income, expense, gain, or loss are recognized in different periods for financial statement and tax purposes; these differences will reverse at some time in the future. Differences in classification may also result from the treatment of short-term gains as ordinary income for tax purposes.
The fund used a tax accounting practice to treat a portion of the price of capital shares redeemed during the year as distributions from realized capital gains. Accordingly, the fund has reclassified $53,362,000 from accumulated net realized gains to paid-in capital.
The fund used a capital loss carryforward of $130,065,000 to offset taxable capital gains realized during the year ended September 30, 2007, reducing the amount of capital gains that would otherwise be available to distribute to shareholders. For tax purposes, at September 30, 2007, the fund had $111,355,000 of ordinary income and $651,369,000 of long-term capital gains available for distribution.
At September 30, 2007, the cost of investment securities for tax purposes was $7,109,219,000. Net unrealized appreciation of investment securities for tax purposes was $1,175,862,000, consisting of unrealized gains of $1,332,194,000 on securities that had risen in value since their purchase and $156,332,000 in unrealized losses on securities that had fallen in value since their purchase.
At September 30, 2007, the aggregate settlement value of open futures contracts expiring in December 2007 and the related unrealized appreciation (depreciation) were:
22
|
|
| ($000) |
|
| Aggregate | Unrealized |
| Number of | Settlement | Appreciation |
Futures Contracts | Long Contracts | Value | (Depreciation) |
S&P 500 Index | 207 | 79,597 | 2,074 |
Unrealized appreciation (depreciation) on open futures contracts is required to be treated as realized gain (loss) for tax purposes.
F. During the year ended September 30, 2007, the fund purchased $7,802,119,000 of investment securities and sold $8,033,314,000 of investment securities, other than U.S. government securities and temporary cash investments.
G. Capital share transactions for each class of shares were:
| Year Ended September 30, | ||||
|
| 2007 |
|
| 2006 |
| Amount | Shares |
| Amount | Shares |
| ($000) | (000) |
| ($000) | (000) |
Investor Shares |
|
|
|
|
|
Issued | 581,626 | 15,817 |
| 551,404 | 17,017 |
Issued in Lieu of Cash Distributions | 84,713 | 2,312 |
| 77,996 | 2,451 |
Redeemed | (999,454) | (27,194) |
| (1,138,743) | (35,170) |
Net Increase (Decrease)—Investor Shares | (333,115) | (9,065) |
| (509,343) | (15,702) |
Admiral Shares |
|
|
|
|
|
Issued | 491,880 | 8,143 |
| 428,118 | 8,127 |
Issued in Lieu of Cash Distributions | 42,270 | 706 |
| 35,887 | 691 |
Redeemed | (395,881) | (6,600) |
| (353,711) | (6,672) |
Net Increase (Decrease)—Admiral Shares | 138,269 | 2,249 |
| 110,294 | 2,146 |
H. In June 2006, the Financial Accounting Standards Board issued Interpretation No. 48 (“FIN 48”), “Accounting for Uncertainty in Income Taxes.” FIN 48 establishes the minimum threshold for recognizing, and a system for measuring, the benefits of tax-return positions in financial statements, and is effective for the fund’s fiscal year beginning October 1, 2007. Management has analyzed the fund’s tax positions taken on federal income tax returns for all open tax years (tax years ended September 30, 2004–2007) for purposes of implementing FIN 48, and has concluded that as of September 30, 2007, no provision for income tax would be required in the fund’s financial statements.
23
Report of Independent Registered
Public Accounting Firm
To the Trustees of Vanguard Quantitative Funds and the Shareholders of Vanguard Growth and Income Fund:
In our opinion, the accompanying statement of net assets and the related statements of operations and of changes in net assets and the financial highlights present fairly, in all material respects, the financial position of Vanguard Growth and Income Fund (the “Fund”) at September 30, 2007, the results of its operations for the year then ended, the changes in its net assets for each of the two years in the period then ended, and the financial highlights for each of the five years in the period then ended, in conformity with accounting principles generally accepted in the United States of America. These financial statements and financial highlights (hereafter referred to as “financial statements”) are the responsibility of the Fund’s management; our responsibility is to express an opinion on these financial statements based on our audits. We conducted our audits of these financial statements in accordance with the standards of the Public Company Accounting Oversight Board (United States), which require that we plan and perform the audit to obtain reasonable assurance about whether the financial statements are free of material misstatement. An audit includes examining, on a test basis, evidence supporting the amounts and disclosures in the financial statements, assessing the accounting principles used and significant estimates made by management, and evaluating the overall financial statement presentation. We believe that our audits, which included confirmation of securities at September 30, 2007 by correspondence with the custodian and broker, and by agreement to the underlying ownership records for Vanguard Market Liquidity Fund, provide a reasonable basis for our opinion.
PricewaterhouseCoopers LLP
Philadelphia, Pennsylvania
November 7, 2007
Special 2007 tax information (unaudited) for Vanguard Growth and Income Fund
This information for the fiscal year ended September 30, 2007, is included pursuant to provisions of the Internal Revenue Code.
The fund distributed $135,244,000 of qualified dividend income to shareholders during the fiscal year.
For corporate shareholders, 66.9% of investment income (dividend income plus short-term gains, if any) qualifies for the dividends-received deduction.
24
Your Fund’s After-Tax Returns
This table presents returns for your fund both before and after taxes. The after-tax returns are shown in two ways: (1) assuming that an investor owned the fund during the entire period and paid taxes on the fund’s distributions, and (2) assuming that an investor paid taxes on the fund’s distributions and sold all shares at the end of each period.
Calculations are based on the highest individual federal income tax and capital gains tax rates in effect at the times of the distributions and the hypothetical sales. State and local taxes were not considered. After-tax returns reflect any qualified dividend income, using actual prior-year figures and estimates for 2007. (In the example, returns after the sale of fund shares may be higher than those assuming no sale. This occurs when the sale would have produced a capital loss. The calculation assumes that the investor received a tax deduction for the loss.)
The table shows returns for Investor Shares only; returns for other share classes will differ. Please note that your actual after-tax returns will depend on your tax situation and may differ from those shown. Also note that if you own the fund in a tax-deferred account, such as an individual retirement account or a 401(k) plan, this information does not apply to you. Such accounts are not subject to current taxes.
Finally, keep in mind that a fund’s performance—whether before or after taxes—does not guarantee future results.
Average Annual Total Returns: Growth and Income Fund Investor Shares1 | |||
Periods Ended September 30, 2007 |
|
|
|
| One | Five | Ten |
| Year | Years | Years |
Returns Before Taxes | 16.20% | 15.00% | 6.66% |
Returns After Taxes on Distributions | 15.92 | 14.71 | 5.72 |
Returns After Taxes on Distributions and Sale of Fund Shares | 10.88 | 13.12 | 5.31 |
1 Total return figures do not include the account service fee that may be applicable to certain accounts with balances below $10,000.
25
About Your Fund’s Expenses
As a shareholder of the fund, you incur ongoing costs, which include costs for portfolio management, administrative services, and shareholder reports (like this one), among others. Operating expenses, which are deducted from a fund’s gross income, directly reduce the investment return of the fund.
A fund’s expenses are expressed as a percentage of its average net assets. This figure is known as the expense ratio. The following examples are intended to help you understand the ongoing costs (in dollars) of investing in your fund and to compare these costs with those of other mutual funds. The examples are based on an investment of $1,000 made at the beginning of the period shown and held for the entire period.
The table below illustrates your fund’s costs in two ways:
• Based on actual fund return. This section helps you to estimate the actual expenses that you paid over the period. The “Ending Account Value” shown is derived from the fund’s actual return, and the third column shows the dollar amount that would have been paid by an investor who started with $1,000 in the fund. You may use the information here, together with the amount you invested, to estimate the expenses that you paid over the period.
To do so, simply divide your account value by $1,000 (for example, an $8,600 account value divided by $1,000 = 8.6), then multiply the result by the number given for your fund under the heading “Expenses Paid During Period.”
• Based on hypothetical 5% yearly return. This section is intended to help you compare your fund’s costs with those of other mutual funds. It assumes that the fund had a yearly return of 5% before expenses, but that the expense ratio is unchanged. In this case—because the return used is not the fund’s actual return—the results do not apply to your investment. The example is useful in making comparisons because the Securities and Exchange Commission requires all mutual funds to calculate expenses based on a 5% return. You can assess your fund’s costs by comparing this hypothetical example with the hypothetical examples that appear in shareholder reports of other funds.
Six Months Ended September 30, 2007 |
|
|
|
| Beginning | Ending | Expenses |
| Account Value | Account Value | Paid During |
Growth and Income Fund | 3/31/2007 | 9/30/2007 | Period1 |
Based on Actual Fund Return |
|
|
|
Investor Shares | $1,000.00 | $1,067.09 | $1.50 |
Admiral Shares | 1,000.00 | 1,067.76 | 0.93 |
Based on Hypothetical 5% Yearly Return |
|
|
|
Investor Shares | $1,000.00 | $1,023.61 | $1.47 |
Admiral Shares | 1,000.00 | 1,024.17 | 0.91 |
1 The calculations are based on expenses incurred in the most recent six-month period. The fund’s annualized six-month expense ratios for that period are 0.29% for Investor Shares and 0.18% for Admiral Shares. The dollar amounts shown as “Expenses Paid” are equal to the annualized expense ratio multiplied by the average account value over the period, multiplied by the number of days in the most recent six-month period, then divided by the number of days in the most recent 12-month period.
26
Note that the expenses shown in the table on page 24 are meant to highlight and help you compare ongoing costs only and do not reflect transaction costs incurred by the fund for buying and selling securities. Further, the expenses do not include the account service fee described in the prospectus. If such a fee were applied to your account, your costs would be higher. Your fund does not charge transaction fees, such as purchase or redemption fees, nor does it carry a “sales load.”
The calculations assume no shares were bought or sold during the period. Your actual costs may have been higher or lower, depending on the amount of your investment and the timing of any purchases or redemptions.
You can find more information about the fund’s expenses, including annual expense ratios, in the Financial Statements section of this report. For additional information on operating expenses and other shareholder costs, please refer to your fund’s current prospectus.
27
Trustees Approve Advisory Agreement
The board of trustees of Vanguard Growth and Income Fund has renewed the fund’s investment advisory agreement with Franklin Portfolio Associates, LLC. The board determined that the retention of Franklin was in the best interests of the fund and its shareholders.
The board based its decision upon an evaluation of Franklin’s investment staff, portfolio management process, and performance. The trustees considered the factors discussed below, among others. However, no single factor determined whether the board approved the agreement. Rather, it was the totality of the circumstances that drove the board’s decision.
Nature, extent, and quality of services
The board considered the quality of investment management to the fund over both the short and long term and the organizational depth and stability of the advisory firm. The board noted that Franklin, founded in 1982, is known for quantitative equity management combining investment experience, financial databases, and computer modeling. The firm has advised the Growth and Income Fund since its inception in 1986. The investment team at Franklin employs a quantitative investment strategy that seeks to provide a total return greater than that of the S&P 500 Index by investing in U.S. large- and mid-capitalization stocks. Stock selection is driven by a series of more than 40 computer models covering a broad range of public data.
The board concluded that the advisor’s experience, stability, depth, and performance, among other factors, warranted continuation of the advisory agreement.
Investment performance
The board considered the short- and long-term performance of the fund, including any periods of outperformance or underperformance of a relevant benchmark and peer group. The board noted that the advisor has carried out the fund’s investment strategy in disciplined fashion, and that the results have been solid. Information about the fund’s most recent performance can be found in the Performance Summary section of this report.
Cost
The board concluded that the fund’s expense ratio was far below the average expense ratio charged by funds in its peer group. The board noted that the fund’s advisory fee rate was also well below the peer-group average. Information about the fund’s expense ratio appears in the About Your Fund’s Expenses section of this report as well as in the Financial Statements section, which also includes information about the advisory fee rate. The board did not consider profitability of Franklin in determining whether to approve the advisory fee, because Franklin is independent of Vanguard, and the advisory fee is the result of arm’s-length negotiations.
The benefit of economies of scale
The board concluded that the fund’s shareholders benefit from economies of scale because of breakpoints in the fund’s advisory fee schedule. The breakpoints reduce the effective rate of the fee as the fund’s assets increase.
The board will consider whether to renew the advisory agreement again after a one-year period.
28
Glossary
Beta. A measure of the magnitude of a fund’s past share-price fluctuations in relation to the ups and downs of a given market index. The index is assigned a beta of 1.00. Compared with a given index, a fund with a beta of 1.20 typically would have seen its share price rise or fall by 12% when the index rose or fell by 10%. A fund’s beta should be reviewed in conjunction with its R-squared (see definition below). The lower the R-squared, the less correlation there is between the fund and the index, and the less reliable beta is as an indicator of volatility.
Earnings Growth Rate. The average annual rate of growth in earnings over the past five years for the stocks now in a fund.
Equity Exposure. A measure that reflects a fund’s investments in stocks and stock futures. Any holdings in short-term reserves are excluded.
Expense Ratio. The percentage of a fund’s average net assets used to pay its annual administrative and advisory expenses. These expenses directly reduce returns to investors.
Foreign Holdings. The percentage of a fund represented by stocks or depositary receipts of companies based outside the United States.
Inception Date. The date on which the assets of a fund (or one of its share classes) are first invested in accordance with the fund’s investment objective. For funds with a subscription period, the inception date is the day after that period ends. Investment performance is measured from the inception date.
Median Market Cap. An indicator of the size of companies in which a fund invests; the midpoint of market capitalization (market price x shares outstanding) of a fund’s stocks, weighted by the proportion of the fund’s assets invested in each stock. Stocks representing half of the fund’s assets have market capitalizations above the median, and the rest are below it.
Price/Book Ratio. The share price of a stock divided by its net worth, or book value, per share. For a fund, the weighted average price/book ratio of the stocks it holds.
Price/Earnings Ratio. The ratio of a stock’s current price to its per-share earnings over the past year. For a fund, the weighted average P/E of the stocks it holds. P/E is an indicator of market expectations about corporate prospects; the higher the P/E, the greater the expectations for a company’s future growth.
R-Squared. A measure of how much of a fund’s past returns can be explained by the returns from the market in general, as measured by a given index. If a fund’s total returns were precisely synchronized with an index’s returns, its R-squared would be 1.00. If the fund’s returns bore no relationship to the index’s returns, its R-squared would be 0.
Return on Equity. The annual average rate of return generated by a company during the past five years for each dollar of shareholder’s equity (net income divided by shareholder’s equity). For a fund, the weighted average return on equity for the companies whose stocks it holds.
Short-Term Reserves. The percentage of a fund invested in highly liquid, short-term securities that can be readily converted to cash.
Turnover Rate. An indication of the fund’s trading activity. Funds with high turnover rates incur higher transaction costs and may be more likely to distribute capital gains (which may be taxable to investors). The turnover rate excludes in-kind transactions, which have minimal impact on costs.
Yield. A snapshot of a fund’s income from interest and dividends. The yield, expressed as a percentage of the fund’s net asset value, is based on income earned over the past 30 days and is annualized, or projected forward for the coming year. The index yield is based on the current annualized rate of income provided by securities in the index.
29
The People Who Govern Your Fund
The trustees of your mutual fund are there to see that the fund is operated and managed in your best interests since, as a shareholder, you are a part owner of the fund. Your fund’s trustees also serve on the board of directors of The Vanguard Group, Inc., which is owned by the Vanguard funds and provides services to them on an at-cost basis.
A majority of Vanguard’s board members are independent, meaning that they have no affiliation with Vanguard or the funds they oversee, apart from the sizable personal investments they have made as private individuals.
Our independent board members bring distinguished backgrounds in business, academia, and public service to their task of working with Vanguard officers to establish the policies and oversee the activities of the funds. Among board members’ responsibilities are selecting investment advisors for the funds; monitoring fund operations, performance, and costs; reviewing contracts; nominating and selecting new trustees/directors; and electing Vanguard officers.
Each trustee serves a fund until its termination; or until the trustee’s retirement, resignation, or death; or otherwise as specified in the fund’s organizational documents. Any trustee may be removed at a shareholders’ meeting by a vote representing two-thirds of the net asset value of all shares of the fund together with shares of other Vanguard funds organized within the same trust. The table on these two pages shows information for each trustee and executive officer of the fund. The mailing address of the trustees and officers is P.O. Box 876, Valley Forge, PA 19482.
Chairman of the Board, Chief Executive Officer, and Trustee | |
|
|
John J. Brennan1 |
|
Born 1954 | Principal Occupation(s) During the Past Five Years: Chairman of the Board, Chief Executive |
Trustee since May 1987; | Officer, and Director/Trustee of The Vanguard Group, Inc., and of each of the investment |
Chairman of the Board and | companies served by The Vanguard Group. |
Chief Executive Officer |
|
148 Vanguard Funds Overseen |
|
|
|
Independent Trustees |
|
|
|
Charles D. Ellis |
|
Born 1937 | Principal Occupation(s) During the Past Five Years: Applecore Partners (pro bono ventures |
Trustee since January 2001 | in education); Senior Advisor to Greenwich Associates (international business strategy |
148 Vanguard Funds Overseen | consulting); Successor Trustee of Yale University; Overseer of the Stern School of Business |
| at New York University; Trustee of the Whitehead Institute for Biomedical Research. |
|
|
Rajiv L. Gupta |
|
Born 1945 | Principal Occupation(s) During the Past Five Years: Chairman, President, and |
Trustee since December 20012 | Chief Executive Officer of Rohm and Haas Co. (chemicals); Board Member of |
148 Vanguard Funds Overseen | the American Chemistry Council; Director of Tyco International, Ltd. (diversified |
| manufacturing and services) since 2005; Trustee of Drexel University and of the |
| Chemical Heritage Foundation. |
|
|
Amy Gutmann |
|
Born 1949 | Principal Occupation(s) During the Past Five Years: President of the University of |
Trustee since June 2006 | Pennsylvania since 2004; Professor in the School of Arts and Sciences, Annenberg School |
148 Vanguard Funds Overseen | for Communication, and Graduate School of Education of the University of Pennsylvania |
| since 2004; Provost (2001–2004) and Laurance S. Rockefeller Professor of Politics and |
| the University Center for Human Values (1990–2004), Princeton University; Director of |
| Carnegie Corporation of New York since 2005 and of Schuylkill River Development |
| Corporation and Greater Philadelphia Chamber of Commerce since 2004. |
JoAnn Heffernan Heisen |
| ||
Born 1950 | Principal Occupation(s) During the Past Five Years: Corporate Vice President and | ||
Trustee since July 1998 | Chief Global Diversity Officer since 2006, Vice President and Chief Information | ||
148 Vanguard Funds Overseen | Officer (1997–2005), and Member of the Executive Committee of Johnson & | ||
| Johnson (pharmaceuticals/consumer products); Director of the University Medical | ||
| Center at Princeton and Women’s Research and Education Institute. | ||
|
| ||
André F. Perold |
| ||
Born 1952 | Principal Occupation(s) During the Past Five Years: George Gund Professor of Finance | ||
Trustee since December 2004 | and Banking, Harvard Business School; Senior Associate Dean, Director of Faculty | ||
148 Vanguard Funds Overseen | Recruiting, and Chair of Finance Faculty, Harvard Business School; Director and Chairman | ||
| of UNX, Inc. (equities trading firm) since 2003; Chair of the Investment Committee of | ||
| HighVista Strategies LLC (private investment firm) since 2005. | ||
|
| ||
Alfred M. Rankin, Jr. |
| ||
Born 1941 | Principal Occupation(s) During the Past Five Years: Chairman, President, Chief Executive | ||
Trustee since January 1993 | Officer, and Director of NACCO Industries, Inc. (forklift trucks/housewares/lignite); Director | ||
148 Vanguard Funds Overseen | of Goodrich Corporation (industrial products/aircraft systems and services). | ||
|
| ||
|
| ||
J. Lawrence Wilson |
| ||
Born 1936 | Principal Occupation(s) During the Past Five Years: Retired Chairman and Chief Executive | ||
Trustee since April 1985 | Officer of Rohm and Haas Co. (chemicals); Director of Cummins Inc. (diesel engines) and | ||
148 Vanguard Funds Overseen | AmerisourceBergen Corp. (pharmaceutical distribution); Trustee of Vanderbilt University | ||
| and of Culver Educational Foundation. | ||
|
| ||
Executive Officers1 |
| ||
|
| ||
Thomas J. Higgins |
| ||
Born 1957 | Principal Occupation(s) During the Past Five Years: Principal of The Vanguard Group, Inc.; | ||
Treasurer since July 1998 | Treasurer of each of the investment companies served by The Vanguard Group. | ||
148 Vanguard Funds Overseen |
| ||
|
| ||
|
| ||
Heidi Stam |
| ||
Born 1956 | Principal Occupation(s) During the Past Five Years: Managing Director of The Vanguard | ||
Secretary since July 2005 | Group, Inc., since 2006; General Counsel of The Vanguard Group since 2005; Secretary of | ||
148 Vanguard Funds Overseen | The Vanguard Group, and of each of the investment companies served by The Vanguard | ||
| Group, since 2005; Principal of The Vanguard Group (1997–2006). | ||
|
| ||
|
| ||
Vanguard Senior Management Team | |||
|
| ||
R. Gregory Barton | Kathleen C. Gubanich | F. William McNabb, III | Ralph K. Packard |
Mortimer J. Buckley | Paul A. Heller | Michael S. Miller | George U. Sauter |
|
| ||
|
| ||
Founder |
| ||
|
| ||
John C. Bogle |
| ||
Chairman and Chief Executive Officer, 1974–1996 | |||
1 Officers of the funds are “interested persons” as defined in the Investment Company Act of 1940.
2 December 2002 for Vanguard Equity Income Fund, Vanguard Growth Equity Fund, the Vanguard Municipal Bond Funds, and the Vanguard State Tax-Exempt Funds.
More information about the trustees is in the Statement of Additional Information, available from The Vanguard Group.

P.O. Box 2600
Valley Forge, PA 19482-2600
Connect with Vanguard® > www.vanguard.com
Fund Information > 800-662-7447 | Vanguard, Admiral, Connect with Vanguard, and the ship |
| logo are trademarks of The Vanguard Group, Inc. |
Direct Investor Account Services > 800-662-2739 |
|
| All other marks are the exclusive property of their |
Institutional Investor Services > 800-523-1036 | respective owners. |
|
|
Text Telephone for People |
|
With Hearing Impairment > 800-952-3335 | All comparative mutual fund data are from Lipper Inc. |
| or Morningstar, Inc., unless otherwise noted. |
|
|
|
|
| You can obtain a free copy of Vanguard’s proxy voting |
| guidelines by visiting our website, www.vanguard.com, |
This material may be used in conjunction | and searching for “proxy voting guidelines,” or by |
with the offering of shares of any Vanguard | calling Vanguard at 800-662-2739. The guidelines are |
fund only if preceded or accompanied by | also available from the SEC’s website, www.sec.gov. |
the fund’s current prospectus. | In addition, you may obtain a free report on how your |
| fund voted the proxies for securities it owned during |
| the 12 months ended June 30. To get the report, visit |
| either www.vanguard.com or www.sec.gov. |
|
|
|
|
|
|
| You can review and copy information about your fund |
| at the SEC’s Public Reference Room in Washington, D.C. |
| To find out more about this public service, call the SEC |
| at 202-551-8090. Information about your fund is also |
| available on the SEC’s website, and you can receive |
| copies of this information, for a fee, by sending a |
| request in either of two ways: via e-mail addressed to |
| publicinfo@sec.gov or via regular mail addressed to the |
| Public Reference Section, Securities and Exchange |
| Commission, Washington, DC 20549-0102. |
|
|
|
|
|
|
|
|
|
|
| © 2007 The Vanguard Group, Inc. |
| All rights reserved. |
| Vanguard Marketing Corporation, Distributor. |
|
|
| Q930 112007 |

> During the 12 months ended September 30, 2007, the broad U.S. stock market returned 17.1%. The market climbed steadily until August, when it dipped sharply before rallying in September.
> For the 12 months, the returns of the Institutional Plus Shares of the Vanguard Structured Equity portfolios ranged from 19.3% for the Structured Large-Cap Growth Fund to 14.5% for the Structured Large-Cap Value Fund.
> The funds’ returns adhered closely to the results of their index benchmarks.
Contents |
|
|
|
Your Fund’s Total Returns | 1 |
Chairman’s Letter | 2 |
Advisor’s Report | 6 |
Structured Large-Cap Equity Fund | 8 |
Structured Large-Cap Growth Fund | 22 |
Structured Large-Cap Value Fund | 36 |
Structured Broad Market Fund | 48 |
About Your Fund’s Expenses | 67 |
Glossary | 69 |
Please note: The opinions expressed in this report are just that—informed opinions. They should not be considered promises or advice. Also, please keep in mind that the information and opinions cover the period through the date on the cover of this report. Of course, the risks of investing in your fund are spelled out in the prospectus.
Your Fund’s Total Returns
Fiscal Year Ended September 30, 2007 |
|
|
| Ticker | Total |
| Symbol | Returns |
Vanguard Structured Large-Cap Equity Fund |
|
|
Institutional Shares | VSLIX | 15.9% |
Institutional Plus Shares | VSLPX | 16.1 |
S&P 500 Index |
| 16.4 |
Average Large-Cap Core Fund1 |
| 16.0 |
|
|
|
|
|
|
Vanguard Structured Large-Cap Growth Fund |
|
|
Institutional Shares | VSTLX | 3.1%2 |
Institutional Plus Shares | VSGPX | 19.3 |
Russell 1000 Growth Index |
| 19.4 |
Average Large-Cap Growth Fund1 |
| 20.4 |
|
|
|
|
|
|
Vanguard Structured Large-Cap Value Fund |
|
|
Institutional Plus Shares | VSLVX | 14.5% |
Russell 1000 Value Index |
| 14.4 |
Average Large-Cap Value Fund1 |
| 14.6 |
|
|
|
|
|
|
Vanguard Structured Broad Market Fund |
|
|
Institutional Shares | VSBMX | 8.7%3 |
Institutional Plus Shares | VSBPX | 15.4 |
Russell 3000 Index |
| 16.5 |
Average Multi-Cap Core Fund1 |
| 17.0 |
1 Derived from data provided by Lipper Inc.
2 Return since the share-class inception on June 22, 2007.
3 Return since the share-class inception on November 30, 2006.
1

Chairman’s Letter
Dear Shareholder,
During the 2007 fiscal year, returns for the Institutional Plus Shares of the Vanguard Structured Equity portfolios ranged from 19.3% for the Structured Large-Cap Growth Fund to 14.5% for the Structured Large-Cap Value Fund.
As you know, these funds employ a quantitative strategy in seeking stocks that can supply above-market returns. During the fiscal year, the portfolio managers were challenged by a surge in market volatility in late July and August. Returns for all four of the funds remained very much in line with the performance of their benchmark indexes.
The Structured Large-Cap Growth Fund and Structured Broad Market Fund each introduced a new class of Institutional Shares during the period. These recent introductions mark the latest step in our efforts to develop a broad range of active quantitative strategies for a variety of institutional clients. These efforts began with the creation of investment trusts that were later reorganized as mutual funds. As both trusts and mutual funds, the portfolios have been managed by our Quantitative Equity Group, with the same investment objectives, strategies, policies, and risks. Because there was no change in the portfolios' strategies or advisors, funds that began as trusts adopted the performance history of the trusts.
Strong returns for U.S. stocks; even better for markets abroad
Overall, U.S. stocks produced excellent returns for the fiscal year. The gains came despite the midsummer shake-up brought on by problems in the subprime mortgage-loan market. Financials stocks—which represent a sizable share of the U.S. market’s value—were hardest hit, as investment banking and consumer lending businesses throttled back.
The broad U.S. equity market returned 17.1% for the year. Returns from large-capitalization stocks outpaced those of small-caps, and growth-oriented stocks outperformed their value-oriented counterparts. As investors took account of risk, they seemed to exhibit a preference for large-cap growth stocks, which appeared better positioned to thrive in a period of economic uncertainty.
Although not immune to the effects of the turmoil in U.S. credit markets, international stocks handily surpassed the returns of domestic stocks over the 12 months. The dollar’s ongoing weakness further enhanced foreign market gains for U.S.-based investors.
2
The bond market was shaken, but it regained ground in the end
The turbulence in the corporate bond and subprime lending markets caused a “flight to quality” that drove prices of U.S. Treasury bonds sharply higher, particularly toward the end of the fiscal period. As the bonds’ prices rose, their yields fell. The declines were greatest among Treasury securities with the shortest maturities. The yield of the 3-month Treasury bill, which started the fiscal year at 4.89%, dropped more than a full percentage point to 3.81%.
Market Barometer |
|
|
|
| Average Annual Total Returns | ||
| Periods Ended September 30, 2007 | ||
| One Year | Three Years | Five Years |
Stocks |
|
|
|
Russell 1000 Index (Large-caps) | 16.9% | 13.8% | 16.0% |
Russell 2000 Index (Small-caps) | 12.3 | 13.4 | 18.8 |
Dow Jones Wilshire 5000 Index (Entire market) | 17.1 | 14.0 | 16.5 |
MSCI All Country World Index ex USA (International) | 31.1 | 26.5 | 26.3 |
|
|
|
|
|
|
|
|
Bonds |
|
|
|
Lehman U.S. Aggregate Bond Index (Broad taxable market) | 5.1% | 3.9% | 4.1% |
Lehman Municipal Bond Index | 3.1 | 3.9 | 4.0 |
Citigroup 3-Month Treasury Bill Index | 5.0 | 4.0 | 2.8 |
|
|
|
|
|
|
|
|
CPI |
|
|
|
Consumer Price Index | 2.8% | 3.2% | 2.9% |
As short-term yields fell, the yield curve—which illustrates the relationship between short- and long-term bond yields—returned to its usual, upward-sloping pattern. The curve had been mildly inverted at the start of the period, with yields of shorter-term bonds above those of longer-term issues. For the year ended September 30, the broad taxable bond market returned 5.1%. Returns from tax-exempt bonds were lower, as these issues did not benefit from the late-summer rally in Treasuries.
The funds held up well during an unsettled year
As I noted earlier, the four Vanguard Structured Equity Funds performed in line with their benchmark indexes during the fiscal year. Within each fund, sector performance versus the benchmark was mixed.
The Institutional Plus Shares of the Structured Large-Cap Equity Fund returned 16.1%, a bit behind the return of the Standard & Poor’s 500 Index. The fund outperformed the benchmark in six of ten sectors, and did especially well in the consumer discretionary, consumer staples, energy, and industrials sectors. In the consumer discretionary sector, a number of restaurants and apparel retailers had strong returns. In the beleaguered financials sector—the fund’s largest—the advisor steered the fund to a performance that was largely in line with the benchmark’s gain. In the information technology sector, on the other hand, the fund’s stock selections failed to match the benchmark’s return.
For the 12 months, the Institutional Plus Shares of the Structured Large-Cap Value Fund returned 14.5%, slightly ahead of the return of the Russell 1000 Value Index. The fund led the benchmark in four sectors—consumer discretionary, energy, industrials, and materials—each of which produced healthy gains. Compared with the benchmark, however, the fund’s stock selections in the information technology sector were disappointing.
3
The Institutional Plus Shares of the Structured Large-Cap Growth Fund earned 19.3%, slightly behind the return of the Russell 1000 Growth Index. The fund outperformed the benchmark in six sectors, achieving particularly strong returns in the consumer discretionary, industrials, and materials sectors. In the information technology sector, the fund’s largest, performance was similar to that of the index group.
The Institutional Plus Shares of the Structured Broad Market Fund returned 15.4%, behind the 16.5% return of the Russell 3000 Index. The fund topped the benchmark return in three sectors: consumer discretionary, materials, and telecommunication services. However, the fund’s performance in other sectors caused it to lag the benchmark’s overall gain.
The funds seek to outperform without increasing risk
Institutional investors often have very long time horizons, which allow them to tune out the market’s daily noise to focus on the enduring principles that can help their organizations reach their financial goals. The Vanguard Structured Equity portfolios embody many of these principles.
We believe that these funds’ broad diversification helps position your organization to benefit from the U.S. economy’s long-term potential. The funds benefit from the established expertise of Vanguard Quantitative Equity Group, which employs proprietary stock-selection models in seeking to outperform its benchmark indexes while keeping risk in check. The group’s stock-selection model factors in investor sentiment, valuation, and the quality of earnings for individual stocks, while maintaining sector weightings that are essentially the same as those in the benchmarks. The funds seek outperformance by slightly overweighting or underweighting individual stocks.
Although relative performance will go through periods of weakness and strength, we’re confident that the advisor’s experience and approach make these portfolios an excellent choice for a long-term investment program.
Thank you for investing with Vanguard.

Sincerely,
John J. Brennan
Chairman and Chief Executive Officer
October 17, 2007
4
Your Fund’s Performance at a Glance | ||||
|
|
|
|
|
|
|
| Distributions Per Share | |
| Starting | Ending | Income | Capital |
| Share Price1 | Share Price | Dividends | Gains |
Structured Large-Cap Equity Fund |
|
|
|
|
Institutional Shares | $26.03 | $29.98 | $0.172 | $0.011 |
Institutional Plus Shares | 52.07 | 60.02 | 0.363 | 0.022 |
Structured Large-Cap Growth Fund |
|
|
|
|
Institutional Shares | $29.04 | $29.93 | $0.000 | $0.000 |
Institutional Plus Shares | 50.00 | 59.60 | 0.150 | 0.053 |
Structured Large-Cap Value Fund |
|
|
|
|
Institutional Plus Shares | $60.09 | $63.87 | $0.000 | $0.000 |
Structured Broad Market Fund |
|
|
|
|
Institutional Shares | $26.59 | $28.67 | $0.116 | $0.095 |
Institutional Plus Shares | 50.00 | 57.39 | 0.234 | 0.190 |
1 For the Structured Large-Cap Equity Fund, starting price is as of September 30, 2006. For the three funds that were converted from trusts, the Institutional Plus Shares’ starting price is as of the conversion dates: October 3, 2006, for the Structured Large-Cap Growth Fund; January 18, 2007, for the Structured Large-Cap Value Fund; and October 3, 2006, for the Structured Broad Market Fund. For the Institutional Shares of the Structured Broad Market Fund and Structured Large-Cap Growth Fund, the starting prices are as of the share-class inceptions: respectively, November 30, 2006, and June 22, 2007.
5
Advisor’s Report
The 12 months ended September 30, 2007, was a mixed one for the Vanguard Structured Equity Funds.
The Structured Large-Cap Equity Fund returned 15.9% for Institutional Shares and 16.1% for Institutional Plus Shares, lagging the S&P 500 Index by, respectively, 0.5 and 0.3 percentage point.
The Structured Large-Cap Growth Fund’s Institutional Plus Shares returned 19.3%, close to the performance of the Russell 1000 Growth Index.
The Structured Large-Cap Value Fund’s Institutional Plus Shares returned 14.5%, in line with the gain of the Russell 1000 Value Index.
The Structured Broad Market Fund’s Institutional Plus Shares returned 15.4%, ending 1.1 percentage points behind the Russell 3000 Index.
The investment environment
In a departure from the trend of the past few years, growth stocks outperformed value stocks across the capitalization spectrum. The Russell 1000 Growth Index led the Russell 1000 Value Index by five percentage points, 19.4% to 14.4%. To place that change in context: For the three years ended September 30, 2006, the Russell 1000 Value Index topped its growth counterpart by almost nine percentage points annually.
This shift in the market’s leadership contributed to our mixed performance, even though we try to balance valuations against growth opportunities. In 2007, the negative impact of our valuation models offset the advantages of our other models. Since our model is attracted to stocks with reasonable valuations, strong growth markets, such as we experienced over the past six months, will be a journey uphill.
Our model, however, has more to it than valuation signals. We do not want to outperform only when the market prefers value stocks, so we diversify the model by including two additional signals: earnings quality and market sentiment. Ideally, the combination of the three indicators allows our model to identify attractive stocks regardless of market environment.
We begin our process by evaluating each stock in a fund’s benchmark index relative to peers based on the three component measures. We then draw upon the stocks with the most attractive evaluations to construct a portfolio that matches the benchmark’s exposure to industry, market capitalization, and other risk factors. In comparison with the respective benchmarks, the stocks in our portfolios generally have lower P/E ratios, slightly higher returns-on-equity, generally superior earnings, and similar dividend yields. We attempt to add value by taking many small positions across several hundred stocks, without tilting toward specific industries.
Structured Large-Cap Equity Fund
For this fund, our model had a slightly negative year. The market sentiment indicator was helpful, but it could not overcome the drag on performance stemming from our valuation indicator.
The fund’s best performance came from stocks in the capital goods industries, where Cummins Inc. was up 116%. Our energy and health care positions also performed well; however, holdings in the software industry and in technology were detractors.
6
Structured Large-Cap Growth Fund
The positive contribution of our sentiment indicator was exactly offset by the results from our valuation indicator. Stocks in the capital goods industries provided the fund’s best performance, paced by Cummins. Pharmaceuticals and financials dragged down the overall return.
Structured Large-Cap Value Fund
The valuation indicator reduced a positive contribution from our market sentiment indicator. The materials sector was one of the fund’s best performers, with Celanese up 119%. Offsetting these gains were our holdings in technology.
Structured Broad Market Fund
The subpar performance of our valuation indicator overwhelmed the positive influence of the market sentiment indicator. The materials sector was the fund’s strongest, with AK Steel Holdings leading the way. Pharmaceuticals holdings underperformed the benchmark sector.
Conclusion
In the end, our fund performance depends upon our model’s stock-picking ability, which was disappointing during the past 12 months. Our valuation indicator did not add value for any of the funds. Although our sentiment indicator did contribute, neither this measure nor our earnings quality signals proved sufficient to overcome the drag from the valuation measure.
Given that our sentiment indicator was successful, one might question why we did not increase our reliance on that signal during the year. We feel that doing so would be counterproductive, because we are trying to provide stock selection, not style timing. Betting relatively small amounts on a large number of stocks provides more diversification than making bets on broad-market style changes. Additionally, betting on style requires that you be right two times—first on when to make the bet and then on when to remove it. Being wrong either time can wreck the return of the portfolio.
Quantitative models, just like traditional portfolio management, will always encounter periods in which they fail to add value, and we have had similar periods in the past. Over the long run, our process has demonstrated its ability to add value, and we believe that our combination of reasonable valuations, high earnings quality, market acceptance, and disciplined risk control offers attractive portfolios to serve as part of a diversified investment plan.
Joel M. Dickson, Principal
James P. Stetler, Principal and
Portfolio Manager
James D. Troyer, CFA
Principal and Portfolio Manager
Vanguard Quantitative Equity Group
October 19, 2007
7
Structured Large-Cap Equity Fund
Fund Profile
As of September 30, 2007
Portfolio Characteristics |
|
| |
|
| Comparative | Broad |
| Fund | Index1 | Index2 |
Number of Stocks | 265 | 500 | 4,887 |
Median Market Cap | $59.2B | $59.2B | $36.1B |
Price/Earnings Ratio | 16.1x | 17.0x | 18.1x |
Price/Book Ratio | 2.9x | 2.9x | 2.8x |
Yield |
| 1.9% | 1.7% |
Institutional Shares | 1.6% |
|
|
Institutional |
|
|
|
Plus Shares | 1.7% |
|
|
Return on Equity | 19.5% | 19.9% | 18.8% |
Earnings Growth Rate | 21.9% | 21.8% | 21.6% |
Foreign Holdings | 0.0% | 0.0% | 0.0% |
Turnover Rate | 54% | — | — |
Expense Ratio |
| — | — |
Institutional Shares | 0.25% |
|
|
Institutional |
|
|
|
Plus Shares | 0.15% |
|
|
Short-Term Reserves | 0.1% | — | — |
Sector Diversification (% of equity exposure) | |||
|
| Comparative | Broad |
| Fund | Index1 | Index2 |
Consumer Discretionary | 9.5% | 9.2% | 10.4% |
Consumer Staples | 9.5 | 9.5 | 8.2 |
Energy | 11.5 | 11.7 | 11.2 |
Financials | 19.8 | 19.9 | 20.0 |
Health Care | 11.5 | 11.6 | 11.6 |
Industrials | 11.6 | 11.5 | 11.8 |
Information Technology | 16.2 | 16.2 | 16.0 |
Materials | 3.2 | 3.2 | 3.7 |
Telecommunication |
|
|
|
Services | 3.7 | 3.8 | 3.5 |
Utilities | 3.5 | 3.4 | 3.6 |
8
Ten Largest Holdings3 (% of total net assets) | ||
|
|
|
ExxonMobil Corp. | integrated oil |
|
| and gas | 3.8% |
General Electric Co. | industrial |
|
| conglomerates | 3.0 |
AT&T Inc. | integrated |
|
| telecommunication |
|
| services | 1.9 |
Microsoft Corp. | systems software | 1.9 |
Citigroup, Inc. | diversified financial |
|
| services | 1.8 |
Bank of America Corp. | diversified financial |
|
| services | 1.5 |
The Procter & Gamble Co. | household products | 1.5 |
Chevron Corp. | integrated oil |
|
| and gas | 1.5 |
Cisco Systems, Inc. | communications |
|
| equipment | 1.4 |
Pfizer Inc. | pharmaceuticals | 1.3 |
Top Ten |
| 19.6% |
Investment Focus

1 S&P 500 Index.
2 Dow Jones Wilshire 5000 Index.
3 “Ten Largest Holdings” excludes any temporary cash investments and equity index products. See page 92 for a glossary of investment terms.
9
Structured Large-Cap Equity Fund
Performance Summary
All of the returns in this report represent past performance, which is not a guarantee of future results that may be achieved by the fund. (Current performance may be lower or higher than the performance data cited. For performance data current to the most recent month-end, visit our website at www.vanguard.com/performance.) Note, too, that both investment returns and principal value can fluctuate widely, so an investor’s shares, when sold, could be worth more or less than their original cost. The returns shown do not reflect taxes that a shareholder would pay on fund distributions or on the sale of fund shares.
Cumulative Performance: May 15, 2006–September 30, 2007
Initial Investment of $200,000,000
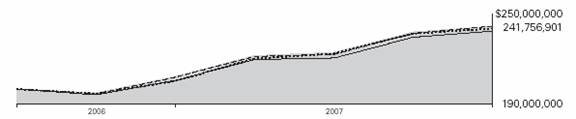
| Average Annual Total Returns | Final Value of a | |
| Periods Ended September 30, 2007 | $200,000,000 | |
| One Year | Since Inception1 | Investment |
Structured Large-Cap Equity Fund |
|
|
|
Institutional Plus Shares | 16.07% | 14.75% | $241,756,901 |
Dow Jones Wilshire 5000 Index | 17.08 | 14.28 | 240,393,268 |
S&P 500 Index | 16.44 | 14.84 | 242,026,812 |
Average Large-Cap Core Fund2 | 15.96 | 13.68 | 238,661,860 |
|
|
| Final Value of |
|
| Since | a $5,000,000 |
| One Year | Inception1 | Investment |
Structured Large-Cap Equity Fund |
|
|
|
Institutional Shares | 15.94% | 14.80% | $6,045,501 |
Dow Jones Wilshire 5000 Index | 17.08 | 14.42 | 6,017,906 |
S&P 500 Index | 16.44 | 15.03 | 6,061,927 |
1 Performance for the fund and its comparative standards is calculated since the following inception dates: May 15, 2006, for Institutional Plus Shares; May 16, 2006, for Institutional Shares.
2 Derived from data provided by Lipper Inc.
10
Structured Large-Cap Equity Fund
Fiscal-Year Total Returns (%): May 15, 2006–September 30, 2007

1 May 15, 2006, through September 30, 2006.
Note: See Financial Highlights tables on pages 22 and 23 for dividend and capital gains information.
11
Structured Large-Cap Equity Fund
Financial Statements
Statement of Net Assets
As of September 30, 2007
The fund provides a complete list of its holdings four times in each fiscal year, at the quarter-ends. For the second and fourth fiscal quarters, the lists appear in the fund’s semiannual and annual reports to shareholders. For the first and third fiscal quarters, the fund files the lists with the Securities and Exchange Commission on Form N-Q. Shareholders can look up the fund’s Forms N-Q on the SEC’s website at www.sec.gov. Forms N-Q may also be reviewed and copied at the SEC’s Public Reference Room (see the back cover of this report for further information).
|
| Market |
|
| Value• |
| Shares | ($000) |
Common Stocks (100.0%) |
|
|
Consumer Discretionary (9.4%) |
|
|
The Walt Disney Co. | 175,963 | 6,051 |
Time Warner, Inc. | 329,580 | 6,051 |
McDonald’s Corp. | 107,968 | 5,881 |
Target Corp. | 75,993 | 4,831 |
General Motors Corp. | 130,986 | 4,807 |
*Comcast Corp. Class A | 189,395 | 4,580 |
Lowe’s Cos., Inc. | 144,558 | 4,051 |
Omnicom Group Inc. | 81,736 | 3,931 |
J.C. Penney Co., Inc. |
|
|
(Holding Co.) | 61,055 | 3,869 |
Home Depot, Inc. | 116,360 | 3,775 |
Wyndham Worldwide Corp. | 109,766 | 3,596 |
Sherwin-Williams Co. | 53,141 | 3,492 |
*Amazon.com, Inc. | 36,800 | 3,428 |
Whirlpool Corp. | 36,090 | 3,216 |
*Viacom Inc. Class B | 75,150 | 2,929 |
News Corp., Class A | 125,044 | 2,750 |
CBS Corp. | 84,749 | 2,670 |
Carnival Corp. | 53,507 | 2,591 |
Wendy’s International, Inc. | 73,000 | 2,548 |
Newell Rubbermaid, Inc. | 86,837 | 2,503 |
NIKE, Inc. Class B | 41,800 | 2,452 |
*Kohl’s Corp. | 38,200 | 2,190 |
RadioShack Corp. | 102,500 | 2,118 |
Polo Ralph Lauren Corp. | 21,571 | 1,677 |
Johnson Controls, Inc. | 12,800 | 1,512 |
Mattel, Inc. | 62,300 | 1,462 |
Yum! Brands, Inc. | 42,000 | 1,421 |
Marriott International, Inc. |
|
|
Class A | 24,100 | 1,048 |
*Big Lots Inc. | 29,900 | 892 |
*DIRECTV Group, Inc. | 32,500 | 789 |
*Starbucks Corp. | 16,271 | 426 |
The McGraw-Hill Cos., Inc. | 7,700 | 392 |
12
|
| Market |
|
| Value• |
| Shares | ($000) |
Best Buy Co., Inc. | 6,150 | 283 |
Abercrombie & Fitch Co. | 3,153 | 254 |
Meredith Corp. | 3,500 | 201 |
Nordstrom, Inc. | 3,128 | 147 |
*Ford Motor Co. | 11,900 | 101 |
Eastman Kodak Co. | 2,500 | 67 |
|
| 94,982 |
Consumer Staples (9.5%) |
|
|
The Procter & Gamble Co. | 217,399 | 15,292 |
Altria Group, Inc. | 169,640 | 11,795 |
The Coca-Cola Co. | 166,493 | 9,568 |
Wal-Mart Stores, Inc. | 200,164 | 8,737 |
PepsiCo, Inc. | 104,199 | 7,634 |
Kraft Foods Inc. | 147,576 | 5,093 |
Walgreen Co. | 95,899 | 4,530 |
The Kroger Co. | 156,442 | 4,462 |
Sara Lee Corp. | 237,700 | 3,967 |
ConAgra Foods, Inc. | 148,000 | 3,867 |
Molson Coors |
|
|
Brewing Co. Class B | 38,000 | 3,787 |
Colgate-Palmolive Co. | 49,554 | 3,534 |
CVS/Caremark Corp. | 86,026 | 3,409 |
Kimberly-Clark Corp. | 47,449 | 3,334 |
Anheuser-Busch Cos., Inc. | 37,986 | 1,899 |
The Estee Lauder Cos. Inc. |
|
|
Class A | 31,069 | 1,319 |
Safeway, Inc. | 32,523 | 1,077 |
Costco Wholesale Corp. | 15,554 | 954 |
Reynolds American Inc. | 11,740 | 747 |
Archer-Daniels-Midland Co. | 20,400 | 675 |
The Pepsi Bottling Group, Inc. | 2,300 | 85 |
|
| 95,765 |
Energy (11.6%) |
|
|
ExxonMobil Corp. | 414,055 | 38,325 |
Chevron Corp. | 162,057 | 15,165 |
ConocoPhillips Co. | 132,382 | 11,619 |
Schlumberger Ltd. | 93,055 | 9,771 |
*National Oilwell Varco Inc. | 37,200 | 5,375 |
Marathon Oil Corp. | 68,776 | 3,922 |
Noble Corp. | 76,800 | 3,767 |
Valero Energy Corp. | 54,221 | 3,643 |
Sunoco, Inc. | 51,200 | 3,624 |
*Transocean Inc. | 30,300 | 3,425 |
ENSCO International, Inc. | 60,700 | 3,405 |
Halliburton Co. | 80,938 | 3,108 |
Occidental Petroleum Corp. | 44,686 | 2,863 |
Hess Corp. | 32,400 | 2,156 |
Devon Energy Corp. | 19,134 | 1,592 |
XTO Energy, Inc. | 18,628 | 1,152 |
Apache Corp. | 12,683 | 1,142 |
13
|
| Market |
|
| Value• |
| Shares | ($000) |
Baker Hughes, Inc. | 10,800 | 976 |
Anadarko Petroleum Corp. | 12,670 | 681 |
Murphy Oil Corp. | 6,200 | 433 |
|
| 116,144 |
Financials (19.8%) |
|
|
Citigroup, Inc. | 384,212 | 17,931 |
Bank of America Corp. | 307,793 | 15,473 |
JPMorgan Chase & Co. | 273,306 | 12,523 |
American |
|
|
International Group, Inc. | 176,683 | 11,953 |
Wells Fargo & Co. | 257,511 | 9,173 |
The Goldman Sachs Group, Inc. | 34,777 | 7,538 |
Wachovia Corp. | 119,182 | 5,977 |
Morgan Stanley | 93,398 | 5,884 |
Merrill Lynch & Co., Inc. | 76,912 | 5,482 |
Fannie Mae | 87,396 | 5,315 |
U.S. Bancorp | 159,102 | 5,176 |
ACE Ltd. | 73,250 | 4,437 |
Prudential Financial, Inc. | 45,382 | 4,428 |
Ameriprise Financial, Inc. | 66,920 | 4,223 |
American Express Co. | 69,443 | 4,123 |
XL Capital Ltd. Class A | 51,100 | 4,047 |
KeyCorp | 116,125 | 3,754 |
Synovus Financial Corp. | 129,743 | 3,639 |
American Capital |
|
|
Strategies, Ltd. | 83,100 | 3,551 |
The Allstate Corp. | 61,706 | 3,529 |
The Travelers Cos., Inc. | 67,851 | 3,416 |
Safeco Corp. | 55,246 | 3,382 |
Lehman Brothers |
|
|
Holdings, Inc. | 53,377 | 3,295 |
Washington Mutual, Inc. | 88,646 | 3,130 |
Sovereign Bancorp, Inc. | 173,100 | 2,950 |
State Street Corp. | 43,227 | 2,946 |
SunTrust Banks, Inc. | 38,354 | 2,902 |
Assurant, Inc. | 52,112 | 2,788 |
Simon Property Group, Inc. |
|
|
REIT | 27,136 | 2,714 |
Bank of New York Mellon Corp. | 60,663 | 2,678 |
MetLife, Inc. | 38,281 | 2,669 |
Franklin Resources Corp. | 19,933 | 2,541 |
The Chubb Corp. | 47,336 | 2,539 |
ProLogis REIT | 36,000 | 2,389 |
General Growth Properties Inc. |
|
|
REIT | 36,700 | 1,968 |
Freddie Mac | 31,269 | 1,845 |
Vornado Realty Trust REIT | 14,170 | 1,549 |
Legg Mason Inc. | 17,000 | 1,433 |
Comerica, Inc. | 26,602 | 1,364 |
14
|
| Market |
|
| Value• |
| Shares | ($000) |
*CB Richard Ellis Group, Inc. | 44,600 | 1,242 |
The Hartford Financial |
|
|
Services Group Inc. | 12,502 | 1,157 |
Janus Capital Group Inc. | 38,100 | 1,077 |
Capital One Financial Corp. | 14,998 | 996 |
Plum Creek Timber Co. Inc. |
|
|
REIT | 22,200 | 994 |
AFLAC Inc. | 16,069 | 917 |
*Discover Financial Services | 43,199 | 899 |
Equity Residential REIT | 20,921 | 886 |
PNC Financial Services Group | 11,951 | 814 |
Archstone-Smith Trust REIT | 10,141 | 610 |
Loews Corp. | 11,343 | 548 |
BB&T Corp. | 12,887 | 520 |
SLM Corp. | 9,727 | 483 |
Fifth Third Bancorp | 13,422 | 455 |
Charles Schwab Corp. | 18,200 | 393 |
National City Corp. | 8,086 | 203 |
Host Hotels & Resorts Inc. REIT | 4,300 | 96 |
Unum Group | 1,300 | 32 |
Countrywide Financial Corp. | 1,607 | 31 |
|
| 199,007 |
Health Care (11.6%) |
|
|
Pfizer Inc. | 545,869 | 13,336 |
Johnson & Johnson | 199,398 | 13,100 |
Merck & Co., Inc. | 180,701 | 9,340 |
UnitedHealth Group Inc. | 118,312 | 5,730 |
Wyeth | 119,339 | 5,317 |
*Medco Health Solutions, Inc. | 58,400 | 5,279 |
Abbott Laboratories | 96,139 | 5,155 |
*Biogen Idec Inc. | 71,811 | 4,763 |
Schering-Plough Corp. | 144,457 | 4,569 |
McKesson Corp. | 72,681 | 4,273 |
*Amgen, Inc. | 73,197 | 4,141 |
Medtronic, Inc. | 66,834 | 3,770 |
Baxter International, Inc. | 66,264 | 3,729 |
*Forest Laboratories, Inc. | 96,600 | 3,602 |
Bristol-Myers Squibb Co. | 113,617 | 3,274 |
Eli Lilly & Co. | 53,456 | 3,043 |
*Laboratory Corp. |
|
|
of America Holdings | 34,780 | 2,721 |
*Humana Inc. | 38,000 | 2,655 |
*Zimmer Holdings, Inc. | 31,100 | 2,519 |
*WellPoint Inc. | 31,255 | 2,467 |
Mylan Inc. | 102,428 | 1,635 |
*Gilead Sciences, Inc. | 39,946 | 1,633 |
*Express Scripts Inc. | 28,800 | 1,608 |
AmerisourceBergen Corp. | 29,669 | 1,345 |
CIGNA Corp. | 24,530 | 1,307 |
15
|
| Market |
|
| Value• |
| Shares | ($000) |
*Watson Pharmaceuticals, Inc. | 40,100 | 1,299 |
Aetna Inc. | 23,213 | 1,260 |
*King Pharmaceuticals, Inc. | 66,418 | 778 |
Cardinal Health, Inc. | 12,304 | 769 |
*Covidien Ltd. | 13,613 | 565 |
*Genzyme Corp. | 9,000 | 558 |
Stryker Corp. | 5,550 | 382 |
*Boston Scientific Corp. | 15,448 | 216 |
|
| 116,138 |
Industrials (11.6%) |
|
|
General Electric Co. | 736,611 | 30,496 |
The Boeing Co. | 67,585 | 7,096 |
United Parcel Service, Inc. | 91,727 | 6,889 |
3M Co. | 64,632 | 6,048 |
United Technologies Corp. | 59,254 | 4,769 |
Textron, Inc. | 72,020 | 4,480 |
Honeywell International Inc. | 73,487 | 4,370 |
PACCAR, Inc. | 51,050 | 4,352 |
Waste Management, Inc. | 111,367 | 4,203 |
Cummins Inc. | 32,696 | 4,181 |
Lockheed Martin Corp. | 36,847 | 3,998 |
CSX Corp. | 92,900 | 3,970 |
Caterpillar, Inc. | 47,075 | 3,692 |
Raytheon Co. | 51,305 | 3,274 |
Union Pacific Corp. | 28,098 | 3,177 |
W.W. Grainger, Inc. | 32,273 | 2,943 |
Northrop Grumman Corp. | 37,621 | 2,934 |
*Terex Corp. | 27,700 | 2,466 |
Emerson Electric Co. | 36,658 | 1,951 |
Tyco International, Ltd. | 35,113 | 1,557 |
General Dynamics Corp. | 16,144 | 1,364 |
FedEx Corp. | 12,644 | 1,324 |
Deere & Co. | 8,700 | 1,291 |
*Allied Waste Industries, Inc. | 96,313 | 1,228 |
Burlington Northern |
|
|
Santa Fe Corp. | 14,391 | 1,168 |
Goodrich Corp. | 17,100 | 1,167 |
Illinois Tool Works, Inc. | 12,308 | 734 |
Norfolk Southern Corp. | 9,100 | 472 |
Masco Corp. | 18,700 | 433 |
Cooper Industries, Inc. Class A | 8,200 | 419 |
Danaher Corp. | 4,300 | 356 |
|
| 116,802 |
Information Technology (16.2%) |
|
|
Microsoft Corp. | 642,133 | 18,917 |
*Cisco Systems, Inc. | 418,689 | 13,863 |
International Business |
|
|
Machines Corp. | 110,145 | 12,975 |
Intel Corp. | 467,168 | 12,081 |
Hewlett-Packard Co. | 215,515 | 10,730 |
16
|
| Market |
|
| Value• |
| Shares | ($000) |
*Apple Inc. | 57,146 | 8,774 |
*Google Inc. | 15,155 | 8,597 |
*Oracle Corp. | 342,737 | 7,420 |
*Dell Inc. | 198,764 | 5,486 |
*Sun Microsystems, Inc. | 818,000 | 4,589 |
QUALCOMM Inc. | 105,092 | 4,441 |
*Xerox Corp. | 246,500 | 4,274 |
*Agilent Technologies, Inc. | 108,300 | 3,994 |
*eBay Inc. | 99,746 | 3,892 |
Corning, Inc. | 156,261 | 3,852 |
*BMC Software, Inc. | 117,533 | 3,671 |
*Computer Sciences Corp. | 64,600 | 3,611 |
Electronic Data Systems Corp. | 156,140 | 3,410 |
Xilinx, Inc. | 129,800 | 3,393 |
*Symantec Corp. | 170,600 | 3,306 |
*NVIDIA Corp. | 81,000 | 2,935 |
Texas Instruments, Inc. | 79,363 | 2,904 |
National Semiconductor Corp. | 90,600 | 2,457 |
*Novellus Systems, Inc. | 78,301 | 2,134 |
*EMC Corp. | 99,450 | 2,068 |
Motorola, Inc. | 109,289 | 2,025 |
*Convergys Corp. | 98,621 | 1,712 |
*Yahoo! Inc. | 55,945 | 1,502 |
Applied Materials, Inc. | 56,534 | 1,170 |
Automatic Data |
|
|
Processing, Inc. | 20,020 | 920 |
*Teradyne, Inc. | 60,700 | 838 |
*Adobe Systems, Inc. | 17,100 | 747 |
*Compuware Corp. | 35,507 | 285 |
Western Union Co. | 9,933 | 208 |
*NCR Corp. | 1,800 | 90 |
|
| 163,271 |
Materials (3.2%) |
|
|
Monsanto Co. | 54,470 | 4,670 |
Nucor Corp. | 71,400 | 4,246 |
E.I. du Pont de Nemours & Co. | 83,970 | 4,162 |
International Paper Co. | 108,900 | 3,906 |
Alcoa Inc. | 91,400 | 3,575 |
United States Steel Corp. | 29,506 | 3,126 |
*Pactiv Corp. | 79,678 | 2,284 |
Dow Chemical Co. | 45,258 | 1,949 |
Vulcan Materials Co. | 20,100 | 1,792 |
Ball Corp. | 23,652 | 1,271 |
Freeport-McMoRan |
|
|
Copper & Gold, Inc. Class B | 7,300 | 766 |
Allegheny Technologies Inc. | 5,300 | 583 |
Eastman Chemical Co. | 500 | 33 |
|
| 32,363 |
17
|
| Market |
|
| Value• |
| Shares | ($000) |
Telecommunication Services (3.7%) |
| |
AT&T Inc. | 462,772 | 19,580 |
Verizon Communications Inc. | 190,580 | 8,439 |
Sprint Nextel Corp. | 263,382 | 5,004 |
*Qwest Communications |
|
|
International Inc. | 413,948 | 3,792 |
Alltel Corp. | 9,040 | 630 |
|
| 37,445 |
Utilities (3.4%) |
|
|
Public Service |
|
|
Enterprise Group, Inc. | 53,100 | 4,672 |
FirstEnergy Corp. | 69,775 | 4,420 |
Edison International | 77,700 | 4,308 |
Sempra Energy | 72,700 | 4,225 |
Xcel Energy, Inc. | 166,500 | 3,586 |
Southern Co. | 84,412 | 3,062 |
Consolidated Edison Inc. | 59,600 | 2,759 |
Exelon Corp. | 35,975 | 2,711 |
Dominion Resources, Inc. | 29,480 | 2,485 |
TXU Corp. | 19,081 | 1,306 |
Duke Energy Corp. | 57,670 | 1,078 |
|
| 34,612 |
Total Common Stocks |
|
|
(Cost $916,342) |
| 1,006,529 |
Temporary Cash Investments (0.1%) |
|
|
Money Market Fund (0.1%) |
|
|
1 Vanguard Market |
|
|
Liquidity Fund, 5.153% | 493,657 | 494 |
|
|
|
|
|
|
| Face |
|
| Amount |
|
| ($000) |
|
U.S. Agency Obligation (0.0%) |
|
|
2 Federal National Mortgage Assn. | ||
5.208%, 10/24/07 | 100 | 100 |
Total Temporary Cash Investments | ||
(Cost $593) |
| 594 |
Total Investments (100.1%) |
|
|
(Cost $916,935) |
| 1,007,123 |
Other Assets and Liabilities (–0.1%) | ||
Other Assets—Note B |
| 1,392 |
Liabilities |
| (2,481) |
|
| (1,089) |
Net Assets (100%) |
| 1,006,034 |
18
At September 30, 2007, net assets consisted of:3 | |
| Amount |
| ($000) |
Paid-in Capital | 897,172 |
Undistributed Net |
|
Investment Income | 10,462 |
Accumulated Net Realized Gains | 8,212 |
Unrealized Appreciation | 90,188 |
Net Assets | 1,006,034 |
|
|
|
|
Institutional Shares—Net Assets |
|
Applicable to 6,230,592 outstanding $.001 | |
par value shares of beneficial interest |
|
(unlimited authorization) | 186,776 |
Net Asset Value Per Share— |
|
Institutional Shares | $29.98 |
|
|
|
|
Institutional Plus Shares—Net Assets |
|
Applicable to 13,650,013 outstanding $.001 | |
par value shares of beneficial interest |
|
(unlimited authorization) | 819,258 |
Net Asset Value Per Share— |
|
Institutional Plus Shares | $60.02 |
• See Note A in Notes to Financial Statements.
* Non-income-producing security.
1 Affiliated money market fund available only to Vanguard funds and certain trusts and accounts managed by Vanguard. Rate shown is the 7-day yield.
2 The issuer operates under a congressional charter; its securities are neither issued nor guaranteed by the U.S. government. If needed, access to additional funding from the U.S. Treasury (beyond the issuer’s line of credit) would require congressional action.
3 See Note C in Notes to Financial Statements for the tax-basis components of net assets.
REIT—Real Estate Investment Trust.
19
Structured Large-Cap Equity Fund
Statement of Operations
| Year Ended |
| September 30, 2007 |
| ($000) |
Investment Income |
|
Income |
|
Dividends | 14,709 |
Interest1 | 110 |
Total Income | 14,819 |
Expenses |
|
The Vanguard Group—Note B |
|
Investment Advisory Services | 492 |
Management and Administrative |
|
Institutional Shares | 222 |
Institutional Plus Shares | 357 |
Marketing and Distribution |
|
Institutional Shares | 39 |
Institutional Plus Shares | 126 |
Custodian Fees | 45 |
Auditing Fees | 24 |
Shareholders’ Reports |
|
Institutional Shares | 4 |
Institutional Plus Shares | — |
Trustees’ Fees and Expenses | 1 |
Total Expenses | 1,310 |
Net Investment Income | 13,509 |
Realized Net Gain (Loss) |
|
Investment Securities Sold | 7,921 |
Futures Contracts | 415 |
Realized Net Gain (Loss) | 8,336 |
Change in Unrealized Appreciation (Depreciation) |
|
Investment Securities | 77,835 |
Futures Contracts | (1) |
Change in Unrealized Appreciation (Depreciation) | 77,834 |
Net Increase (Decrease) in Net Assets Resulting from Operations | 99,679 |
1 Interest income from an affiliated company of the fund was $102,000.
20
Structured Large-Cap Equity Fund
Statement of Changes in Net Assets
| Year Ended | May 15, 20061 to |
| September 30, | September 30, |
| 2007 | 2006 |
| ($000) | ($000) |
Increase (Decrease) in Net Assets |
|
|
Operations |
|
|
Net Investment Income | 13,509 | 1,597 |
Realized Net Gain (Loss) | 8,336 | 161 |
Change in Unrealized Appreciation (Depreciation) | 77,834 | 12,354 |
Net Increase (Decrease) in Net Assets Resulting from Operations | 99,679 | 14,112 |
Distributions |
|
|
Net Investment Income |
|
|
Institutional Shares | (940) | — |
Institutional Plus Shares | (3,704) | — |
Realized Capital Gain2 |
|
|
Institutional Shares | (67) | — |
Institutional Plus Shares | (218) | — |
Total Distributions | (4,929) | — |
Capital Share Transactions—Note E |
|
|
Institutional Shares | 36,315 | 121,426 |
Institutional Plus Shares | 544,425 | 195,006 |
Net Increase (Decrease) from Capital Share Transactions | 580,740 | 316,432 |
Total Increase (Decrease) | 675,490 | 330,544 |
Net Assets |
|
|
Beginning of Period | 330,544 | — |
End of Period3 | 1,006,034 | 330,544 |
1 Inception.
2 Includes fiscal 2007 short-term gain distributions totaling $285,000. Short-term gain distributions are treated as ordinary income dividends for tax purposes.
3 Net Assets—End of Period includes undistributed net investment income of $10,462,000 and $1,597,000.
21
Structured Large-Cap Equity Fund
Financial Highlights
Institutional Shares |
|
|
| Year | May 16, |
| Ended | 20061 to |
| Sept. 30, | Sept. 30, |
For a Share Outstanding Throughout Each Period | 2007 | 2006 |
Net Asset Value, Beginning of Period | $26.03 | $24.96 |
Investment Operations |
|
|
Net Investment Income | .4762 | .13 |
Net Realized and Unrealized Gain (Loss) on Investments | 3.657 | .94 |
Total from Investment Operations | 4.133 | 1.07 |
Distributions |
|
|
Dividends from Net Investment Income | (.172) | — |
Distributions from Realized Capital Gains | (.011) | — |
Total Distributions | (.183) | — |
Net Asset Value, End of Period | $29.98 | $26.03 |
|
|
|
|
|
|
Total Return | 15.94% | 4.29% |
|
|
|
|
|
|
Ratios/Supplemental Data |
|
|
Net Assets, End of Period (Millions) | $187 | $127 |
Ratio of Total Expenses to Average Net Assets | 0.25% | 0.25%* |
Ratio of Net Investment Income to Average Net Assets | 1.69% | 1.67%* |
Portfolio Turnover Rate | 54%3 | 30% |
1 Inception.
2 Calculated based on average shares outstanding.
3 Excludes the value of portfolio securities received or delivered as a result of in-kind purchases or redemptions of the fund’s capital shares.
* Annualized.
22
Structured Large-Cap Equity Fund
Institutional Plus Shares |
|
|
| Year | May 15, |
| Ended | 20061 to |
| Sept. 30, | Sept. 30, |
For a Share Outstanding Throughout Each Period | 2007 | 2006 |
Net Asset Value, Beginning of Period | $52.07 | $50.00 |
Investment Operations |
|
|
Net Investment Income | 1.0182 | .25 |
Net Realized and Unrealized Gain (Loss) on Investments | 7.317 | 1.82 |
Total from Investment Operations | 8.335 | 2.07 |
Distributions |
|
|
Dividends from Net Investment Income | (.363) | — |
Distributions from Realized Capital Gains | (.022) | — |
Total Distributions | (.385) | — |
Net Asset Value, End of Period | $60.02 | $52.07 |
|
|
|
|
|
|
Total Return | 16.07% | 4.14% |
|
|
|
|
|
|
Ratios/Supplemental Data |
|
|
Net Assets, End of Period (Millions) | $819 | $203 |
Ratio of Total Expenses to Average Net Assets | 0.15% | 0.15%* |
Ratio of Net Investment Income to Average Net Assets | 1.79% | 1.77%* |
Portfolio Turnover Rate | 54%3 | 30% |
1 Inception.
2 Calculated based on average shares outstanding.
3 Excludes the value of portfolio securities received or delivered as a result of in-kind purchases or redemptions of the fund’s capital shares.
* Annualized.
See accompanying Notes, which are an integral part of the Financial Statements.
23
Structured Large-Cap Equity Fund
Notes to Financial Statements
Vanguard Structured Large-Cap Equity Fund is registered under the Investment Company Act of 1940 as an open-end investment company, or mutual fund. The fund files reports with the SEC under the company name Vanguard Quantitative Funds. The fund offers two classes of shares, Institutional Shares and Institutional Plus Shares. Institutional Shares are available to investors who invest a minimum amount of $5 million. Institutional Plus Shares are available to investors who invest a minimum amount of $200 million ($100 million for investors with total Vanguard investments of at least $1 billion).
A. The following significant accounting policies conform to generally accepted accounting principles for U.S. mutual funds. The fund consistently follows such policies in preparing its financial statements.
1. Security Valuation: Securities are valued as of the close of trading on the New York Stock Exchange (generally 4 p.m., Eastern time) on the valuation date. Equity securities are valued at the latest quoted sales prices or official closing prices taken from the primary market in which each security trades; such securities not traded on the valuation date are valued at the mean of the latest quoted bid and asked prices. Securities for which market quotations are not readily available, or whose values have been materially affected by events occurring before the fund’s pricing time but after the close of the securities’ primary markets, are valued by methods deemed by the board of trustees to represent fair value. Investments in Vanguard Market Liquidity Fund are valued at that fund’s net asset value. Temporary cash investments acquired over 60 days to maturity are valued using the latest bid prices or using valuations based on a matrix system (which considers such factors as security prices, yields, maturities, and ratings), both as furnished by independent pricing services. Other temporary cash investments are valued at amortized cost, which approximates market value.
2. Futures Contracts: The fund uses index futures contracts to a limited extent, with the objective of maintaining full exposure to the stock market while maintaining liquidity. The fund may purchase or sell futures contracts to achieve a desired level of investment, whether to accommodate portfolio turnover or cash flows from capital share transactions. The primary risks associated with the use of futures contracts are imperfect correlation between changes in market values of stocks held by the fund and the prices of futures contracts, and the possibility of an illiquid market.
Futures contracts are valued at their quoted daily settlement prices. The aggregate principal amounts of the contracts are not recorded in the Statement of Net Assets. Fluctuations in the value of the contracts are recorded in the Statement of Net Assets as an asset (liability) and in the Statement of Operations as unrealized appreciation (depreciation) until the contracts are closed, when they are recorded as realized futures gains (losses).
3. Federal Income Taxes: The fund intends to continue to qualify as a regulated investment company and distribute all of its taxable income. Accordingly, no provision for federal income taxes is required in the financial statements.
4. Distributions: Distributions to shareholders are recorded on the ex-dividend date.
5. Other: Dividend income is recorded on the ex-dividend date. Interest income includes income distributions received from Vanguard Market Liquidity Fund and is accrued daily. Security transactions are accounted for on the date securities are bought or sold. Costs used to determine realized gains (losses) on the sale of investment securities are those of the specific securities sold.
24
Structured Large-Cap Equity Fund
Each class of shares has equal rights as to assets and earnings, except that each class separately bears certain class-specific expenses related to maintenance of shareholder accounts (included in Management and Administrative expenses) and shareholder reporting. Marketing and distribution expenses are allocated to each class of shares based on a method approved by the board of trustees. Income, other non-class-specific expenses, and gains and losses on investments are allocated to each class of shares based on its relative net assets.
B. The Vanguard Group furnishes at cost investment advisory, corporate management, administrative, marketing, and distribution services. The costs of such services are allocated to the fund under methods approved by the board of trustees. The fund has committed to provide up to 0.40% of its net assets in capital contributions to Vanguard. At September 30, 2007, the fund had contributed capital of $85,000 to Vanguard (included in Other Assets), representing 0.01% of the fund’s net assets and 0.08% of Vanguard’s capitalization. The fund’s trustees and officers are also directors and officers of Vanguard.
C. Distributions are determined on a tax basis and may differ from net investment income and realized capital gains for financial reporting purposes. Differences may be permanent or temporary. Permanent differences are reclassified among capital accounts in the financial statements to reflect their tax character. Temporary differences arise when certain items of income, expense, gain, or loss are recognized in different periods for financial statement and tax purposes; these differences will reverse at some time in the future. Differences in classification may also result from the treatment of short-term gains as ordinary income for tax purposes.
For tax purposes, at September 30, 2007, the fund had $17,159,000 of ordinary income and $1,748,000 of long-term capital gains available for distribution.
At September 30, 2007, the cost of investment securities for tax purposes was $916,935,000. Net unrealized appreciation of investment securities for tax purposes was $90,188,000, consisting of unrealized gains of $111,892,000 on securities that had risen in value since their purchase and $21,704,000 in unrealized losses on securities that had fallen in value since their purchase.
D. During the year ended September 30, 2007, the fund purchased $1,005,008,000 of investment securities and sold $414,547,000 of investment securities, other than temporary cash investments.
E. Capital share transactions for each class of shares were:
25
Structured Large-Cap Equity Fund
| Year Ended |
| Inception1 to | ||
| September 30, 2007 |
| September 30, 2006 | ||
| Amount | Shares |
| Amount | Shares |
| ($000) | (000) |
| ($000) | (000) |
Institutional Shares |
|
|
|
|
|
Issued | 43,142 | 1,567 |
| 121,583 | 4,903 |
Issued in Lieu of Cash Distributions | 34 | 1 |
| — | — |
Redeemed | (6,861) | (234) |
| (157) | (6) |
Net Increase (Decrease)—Institutional Shares | 36,315 | 1,334 |
| 121,426 | 4,897 |
Institutional Plus Shares |
|
|
|
|
|
Issued | 540,496 | 9,679 |
| 195,006 | 3,900 |
Issued in Lieu of Cash Distributions | 3,929 | 71 |
| — | — |
Redeemed | — | — |
| — | — |
Net Increase (Decrease)—Institutional Plus Shares | 544,425 | 9,750 |
| 195,006 | 3,900 |
F. In June 2006, the Financial Accounting Standards Board issued Interpretation No. 48 (“FIN 48”), “Accounting for Uncertainty in Income Taxes.” FIN 48 establishes the minimum threshold for recognizing, and a system for measuring, the benefits of tax-return positions in financial statements, and is effective for the fund’s fiscal year beginning October 1, 2007. Management has analyzed the fund’s tax positions taken on federal income tax returns for all open tax years (tax years ended September 30, 2006–2007) for purposes of implementing FIN 48, and has concluded that as of September 30, 2007, no provision for income tax would be required in the fund’s financial statements.
1 Inception was May 16, 2006, for Institutional Shares and May 15, 2006, for Institutional Plus Shares.
26
Structured Large-Cap Growth Fund
Fund Profile
As of September 30, 2007
Portfolio Characteristics |
|
| |
|
| Comparative | Broad |
| Fund | Index1 | Index2 |
Number of Stocks | 262 | 698 | 4,887 |
Median Market Cap | $38.2B | $38.2B | $36.1B |
Price/Earnings Ratio | 19.6x | 21.6x | 18.1x |
Price/Book Ratio | 4.1x | 4.4x | 2.8x |
Yield |
| 1.1% | 1.7% |
Institutional Shares | 0.8%3 |
|
|
Institutional |
|
|
|
Plus Shares | 0.9% |
|
|
Return on Equity | 20.9% | 21.2% | 18.8% |
Earnings Growth Rate | 24.1% | 22.8% | 21.6% |
Foreign Holdings | 0.6% | 0.0% | 0.0% |
Turnover Rate | 56% | — | — |
Expense Ratio |
| — | — |
Institutional Shares | 0.25%3 |
|
|
Institutional |
|
|
|
Plus Shares | 0.15% |
|
|
Short-Term Reserves | 0.0% | — | — |
Sector Diversification (% of equity exposure) | |||
|
| Comparative | Broad |
| Fund | Index1 | Index2 |
Consumer Discretionary | 12.6% | 12.7% | 10.4% |
Consumer Staples | 9.8 | 9.8 | 8.2 |
Energy | 8.4 | 8.3 | 11.2 |
Financials | 7.1 | 7.1 | 20.0 |
Health Care | 15.8 | 15.7 | 11.6 |
Industrials | 13.0 | 13.1 | 11.8 |
Information Technology | 27.7 | 27.6 | 16.0 |
Materials | 3.2 | 3.2 | 3.7 |
Telecommunication |
|
|
|
Services | 0.8 | 0.9 | 3.5 |
Utilities | 1.6 | 1.6 | 3.6 |
27
Ten Largest Holdings4 (% of total net assets) | ||
|
|
|
Microsoft Corp. | systems software | 3.1% |
Cisco Systems, Inc. | communications |
|
| equipment | 2.4 |
Intel Corp. | semiconductors | 2.0 |
Hewlett-Packard Co. | computer hardware | 1.7 |
International Business |
|
|
Machines Corp. | computer hardware | 1.7 |
Apple Inc. | computer hardware | 1.7 |
PepsiCo, Inc. | soft drinks | 1.6 |
Google Inc. | Internet software |
|
| and services | 1.6 |
Schlumberger Ltd. | oil and gas equipment | |
| and services | 1.5 |
ExxonMobil Corp. | integrated oil |
|
| and gas | 1.3 |
Top Ten |
| 18.6% |
Investment Focus

1 Russell 1000 Growth Index.
2 Dow Jones Wilshire 5000 Index.
3 Annualized.
4 “Ten Largest Holdings” excludes any temporary cash investments and equity index products. See page 92 for a glossary of investment terms.
28
Structured Large-Cap Growth Fund
Performance Summary
All of the returns in this report represent past performance, which is not a guarantee of future results that may be achieved by the fund. (Current performance may be lower or higher than the performance data cited. For performance data current to the most recent month-end, visit our website at www.vanguard.com/performance.) Note, too, that both investment returns and principal value can fluctuate widely, so an investor’s shares, when sold, could be worth more or less than their original cost. The returns shown do not reflect taxes that a shareholder would pay on fund distributions or on the sale of fund shares.
Cumulative Performance: January 19, 2006–September 30, 2007
Initial Investment of $200,000,000
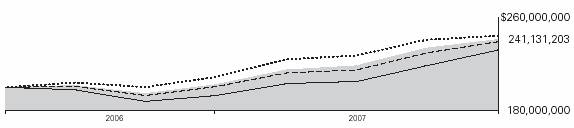
| Average Annual Total Returns | Final Value of a | |
| Periods Ended September 30, 2007 | $200,000,000 | |
| One Year | Since Inception1 | Investment |
Structured Large-Cap Growth Fund |
|
|
|
Institutional Plus Shares | 19.35% | 11.66% | $241,131,203 |
Dow Jones Wilshire 5000 Index | 17.08 | 12.56 | 244,427,759 |
Russell 1000 Growth Index | 19.35 | 11.16 | 239,296,192 |
Average Large-Cap Growth Fund2 | 20.44 | 9.20 | 232,197,241 |
|
| Final Value of |
| Since | a $5,000,000 |
| Inception1 | Investment |
Structured Large-Cap Growth Fund Institutional Shares | 3.06% | $5,153,237 |
Dow Jones Wilshire 5000 Index | 1.50 | 5,075,232 |
Russell 1000 Growth Index | 4.19 | 5,209,485 |
1 Performance for the fund and its comparative standards is calculated since the following inception dates: January 19, 2006, for Institutional Plus Shares; June 22, 2007, for Institutional Shares.
2 Derived from data provided by Lipper Inc.
29
Structured Large-Cap Growth Fund
Fiscal-Year Total Returns (%): January 19, 2006–September 30, 2007
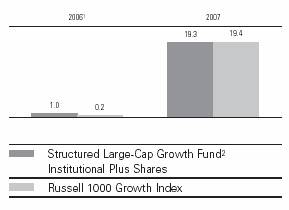
1 January 19, 2006, through September 30, 2006.
2 The fund commenced operations as a registered investment company on October 3, 2006. The fund’s performance includes the performance of a predecessor trust, Vanguard Fiduciary Trust Company Structured Large-Cap Growth Trust, from January 19, 2006, to October 3, 2006.
Note: See Financial Highlights tables on pages 41 and 42 for dividend and capital gains information.
30
Structured Large-Cap Growth Fund
Financial Statements
Statement of Net Assets
As of September 30, 2007
The fund provides a complete list of its holdings four times in each fiscal year, at the quarter-ends. For the second and fourth fiscal quarters, the lists appear in the fund’s semiannual and annual reports to shareholders. For the first and third fiscal quarters, the fund files the lists with the Securities and Exchange Commission on Form N-Q. Shareholders can look up the fund’s Forms N-Q on the SEC’s website at www.sec.gov. Forms N-Q may also be reviewed and copied at the SEC’s Public Reference Room (see the back cover of this report for further information).
|
| Market |
|
| Value• |
| Shares | ($000) |
Common Stocks (99.8%)1 |
|
|
Consumer Discretionary (12.6%) |
|
|
Target Corp. | 8,220 | 523 |
*Amazon.com, Inc. | 5,000 | 466 |
Lowe’s Cos., Inc. | 14,923 | 418 |
Yum! Brands, Inc. | 10,418 | 352 |
The Walt Disney Co. | 9,242 | 318 |
Home Depot, Inc. | 9,659 | 313 |
J.C. Penney Co., Inc. |
|
|
(Holding Co.) | 4,875 | 309 |
*Comcast Corp. Class A | 12,529 | 303 |
Omnicom Group Inc. | 6,102 | 293 |
*EchoStar Communications Corp. |
|
|
Class A | 6,086 | 285 |
Wynn Resorts Ltd. | 1,800 | 284 |
NIKE, Inc. Class B | 4,828 | 283 |
Nordstrom, Inc. | 6,007 | 282 |
*ITT Educational Services, Inc. | 2,100 | 256 |
Sherwin-Williams Co. | 3,770 | 248 |
Whirlpool Corp. | 2,521 | 225 |
News Corp., Class A | 9,534 | 210 |
*Clear Channel Outdoor |
|
|
Holdings, Inc. Class A | 7,900 | 201 |
*The Goodyear Tire & Rubber Co. | 6,460 | 196 |
McDonald’s Corp. | 3,364 | 183 |
*Kohl’s Corp. | 3,180 | 182 |
*DIRECTV Group, Inc. | 7,360 | 179 |
Darden Restaurants Inc. | 4,184 | 175 |
Brinker International, Inc. | 6,257 | 172 |
Polo Ralph Lauren Corp. | 2,192 | 170 |
Time Warner, Inc. | 7,949 | 146 |
Carnival Corp. | 2,885 | 140 |
*Viacom Inc. Class B | 3,459 | 135 |
Harley-Davidson, Inc. | 2,900 | 134 |
31
|
| Market |
|
| Value• |
| Shares | ($000) |
The McGraw-Hill Cos., Inc. | 2,427 | 124 |
OfficeMax, Inc. | 3,000 | 103 |
*Starbucks Corp. | 3,693 | 97 |
*Coach, Inc. | 1,900 | 90 |
TJX Cos., Inc. | 2,900 | 84 |
*MGM Mirage, Inc. | 930 | 83 |
Best Buy Co., Inc. | 1,673 | 77 |
Burger King Holdings Inc. | 3,008 | 77 |
*Dollar Tree Stores, Inc. | 1,741 | 71 |
*AnnTaylor Stores Corp. | 2,149 | 68 |
Abercrombie & Fitch Co. | 760 | 61 |
*Las Vegas Sands Corp. | 330 | 44 |
*NVR, Inc. | 88 | 41 |
BorgWarner, Inc. | 400 | 37 |
Autoliv, Inc. | 400 | 24 |
Marriott International, Inc. |
|
|
Class A | 435 | 19 |
|
| 8,481 |
Consumer Staples (9.8%) |
|
|
PepsiCo, Inc. | 14,411 | 1,056 |
Altria Group, Inc. | 11,169 | 777 |
Wal-Mart Stores, Inc. | 16,257 | 710 |
The Coca-Cola Co. | 11,583 | 666 |
The Procter & Gamble Co. | 9,449 | 665 |
Walgreen Co. | 9,860 | 466 |
Carolina Group | 3,100 | 255 |
Sysco Corp. | 6,794 | 242 |
*NBTY, Inc. | 5,300 | 215 |
Colgate-Palmolive Co. | 3,005 | 214 |
CVS/Caremark Corp. | 5,184 | 205 |
Kimberly-Clark Corp. | 2,679 | 188 |
H.J. Heinz Co. | 2,900 | 134 |
Anheuser-Busch Cos., Inc. | 2,589 | 129 |
The Kroger Co. | 4,400 | 125 |
Dean Foods Co. | 4,800 | 123 |
*Energizer Holdings, Inc. | 1,007 | 112 |
Sara Lee Corp. | 6,671 | 111 |
The Estee Lauder Cos. Inc. |
|
|
Class A | 2,300 | 98 |
Costco Wholesale Corp. | 1,475 | 91 |
|
| 6,582 |
Energy (8.3%) |
|
|
Schlumberger Ltd. | 9,500 | 997 |
ExxonMobil Corp. | 9,673 | 895 |
*National Oilwell Varco Inc. | 2,174 | 314 |
Valero Energy Corp. | 4,503 | 303 |
32
|
| Market |
|
| Value• |
| Shares | ($000) |
*Transocean Inc. | 2,441 | 276 |
Chesapeake Energy Corp. | 7,582 | 267 |
Sunoco, Inc. | 3,670 | 260 |
ENSCO International, Inc. | 4,497 | 252 |
Tesoro Corp. | 5,191 | 239 |
Halliburton Co. | 5,890 | 226 |
*Global Industries Ltd. | 8,700 | 224 |
*Superior Energy Services, Inc. | 6,200 | 220 |
*Cameron International Corp. | 2,300 | 212 |
Tidewater Inc. | 3,200 | 201 |
XTO Energy, Inc. | 3,155 | 195 |
Baker Hughes, Inc. | 1,839 | 166 |
*Dresser Rand Group, Inc. | 2,900 | 124 |
Noble Corp. | 2,052 | 101 |
Diamond Offshore Drilling, Inc. | 790 | 89 |
*Unit Corp. | 506 | 24 |
|
| 5,585 |
Financials (7.1%) |
|
|
American Express Co. | 8,727 | 518 |
The Goldman Sachs Group, Inc. | 1,795 | 389 |
Northern Trust Corp. | 4,130 | 274 |
State Street Corp. | 3,666 | 250 |
Franklin Resources Corp. | 1,886 | 240 |
Janus Capital Group Inc. | 8,200 | 232 |
The First Marblehead Corp. | 5,533 | 210 |
ProLogis REIT | 2,829 | 188 |
Merrill Lynch & Co., Inc. | 2,578 | 184 |
XL Capital Ltd. Class A | 2,100 | 166 |
Synovus Financial Corp. | 5,127 | 144 |
AFLAC Inc. | 2,469 | 141 |
Prudential Financial, Inc. | 1,397 | 136 |
Legg Mason Inc. | 1,600 | 135 |
Simon Property Group, Inc. REIT | 1,291 | 129 |
*AmeriCredit Corp. | 7,060 | 124 |
Charles Schwab Corp. | 5,615 | 121 |
NYSE Euronext | 1,500 | 119 |
CME Group, Inc. | 202 | 119 |
The Macerich Co. REIT | 1,300 | 114 |
SLM Corp. | 2,164 | 107 |
Forest City Enterprise Class A | 1,590 | 88 |
Bank of New York Mellon Corp. | 1,830 | 81 |
Freddie Mac | 1,090 | 64 |
Federated Investors, Inc. | 1,500 | 60 |
SL Green Realty Corp. REIT | 500 | 58 |
Taubman Co. REIT | 1,000 | 55 |
Apartment Investment & |
|
|
Management Co. Class A REIT | 1,200 | 54 |
T. Rowe Price Group Inc. | 900 | 50 |
Bank of Hawaii Corp. | 799 | 42 |
*Affiliated Managers Group, Inc. | 300 | 38 |
33
|
| Market |
|
| Value• |
| Shares | ($000) |
CNA Financial Corp. | 900 | 35 |
Morgan Stanley | 549 | 35 |
American International Group, Inc. | 362 | 24 |
ACE Ltd. | 400 | 24 |
*E*TRADE Financial Corp. | 1,400 | 18 |
|
| 4,766 |
Health Care (15.8%) |
|
|
Merck & Co., Inc. | 16,203 | 838 |
Abbott Laboratories | 11,769 | 631 |
UnitedHealth Group Inc. | 12,549 | 608 |
Johnson & Johnson | 8,963 | 589 |
Bristol-Myers Squibb Co. | 18,018 | 519 |
Medtronic, Inc. | 8,440 | 476 |
Schering-Plough Corp. | 14,832 | 469 |
*Medco Health Solutions, Inc. | 4,845 | 438 |
Baxter International, Inc. | 6,642 | 374 |
*Amgen, Inc. | 6,418 | 363 |
*Zimmer Holdings, Inc. | 4,370 | 354 |
McKesson Corp. | 5,640 | 332 |
*Express Scripts Inc. | 5,878 | 328 |
Wyeth | 6,353 | 283 |
Aetna Inc. | 4,817 | 261 |
*Forest Laboratories, Inc. | 6,994 | 261 |
*Gilead Sciences, Inc. | 6,220 | 254 |
*Genentech, Inc. | 3,055 | 238 |
*WellCare Health Plans Inc. | 2,200 | 232 |
*WellPoint Inc. | 2,928 | 231 |
*Techne Corp. | 3,600 | 227 |
*Endo Pharmaceuticals |
|
|
Holdings, Inc. | 7,192 | 223 |
*Cephalon, Inc. | 3,038 | 222 |
*Laboratory Corp. |
|
|
of America Holdings | 2,750 | 215 |
Becton, Dickinson & Co. | 2,541 | 208 |
Mylan Inc. | 12,001 | 192 |
AmerisourceBergen Corp. | 3,530 | 160 |
Eli Lilly & Co. | 2,779 | 158 |
*Humana Inc. | 2,200 | 154 |
*Warner Chilcott Ltd. | 8,300 | 147 |
Cardinal Health, Inc. | 2,280 | 143 |
*Biogen Idec Inc. | 1,731 | 115 |
*DaVita, Inc. | 1,800 | 114 |
Stryker Corp. | 1,627 | 112 |
*Genzyme Corp. | 1,200 | 74 |
*Health Net Inc. | 760 | 41 |
Allergan, Inc. | 546 | 35 |
|
| 10,619 |
Industrials (13.0%) |
|
|
The Boeing Co. | 6,604 | 693 |
3M Co. | 5,726 | 536 |
34
|
| Market | |
|
| Value• | |
| Shares | ($000) | |
United Parcel Service, Inc. | 6,547 | 492 | |
Caterpillar, Inc. | 5,225 | 410 | |
Lockheed Martin Corp. | 3,654 | 396 | |
PACCAR, Inc. | 4,290 | 366 | |
Textron, Inc. | 5,578 | 347 | |
United Technologies Corp. | 4,282 | 345 | |
Precision Castparts Corp. | 2,247 | 332 | |
General Electric Co. | 7,851 | 325 | |
Cummins Inc. | 2,535 | 324 | |
*Terex Corp. | 3,209 | 286 | |
The Manitowoc Co., Inc. | 6,212 | 275 | |
Honeywell International Inc. | 4,580 | 272 | |
Emerson Electric Co. | 4,146 | 221 | |
Burlington Northern |
|
| |
Santa Fe Corp. | 2,600 | 211 | |
Manpower Inc. | 3,250 | 209 | |
Union Pacific Corp. | 1,783 | 202 | |
*AMR Corp. | 8,979 | 200 | |
Raytheon Co. | 3,104 | 198 | |
CSX Corp. | 4,635 | 198 | |
Trinity Industries, Inc. | 4,957 | 186 | |
Goodrich Corp. | 2,700 | 184 | |
*Allied Waste Industries, Inc. | 14,409 | 184 | |
FedEx Corp. | 1,584 | 166 | |
Harsco Corp. | 2,660 | 158 | |
L-3 Communications |
|
| |
Holdings, Inc. | 1,514 | 155 | |
Waste Management, Inc. | 4,058 | 153 | |
*Corrections Corp. of America | 5,210 | 136 | |
Illinois Tool Works, Inc. | 1,958 | 117 | |
Danaher Corp. | 1,200 | 99 | |
C.H. Robinson Worldwide Inc. | 1,600 | 87 | |
*Hertz Global Holdings Inc. | 3,700 | 84 | |
Northrop Grumman Corp. | 982 | 77 | |
*General Cable Corp. | 1,000 | 67 | |
GATX Corp. | 916 | 39 | |
*AGCO Corp. | 200 | 10 | |
|
| 8,740 | |
Information Technology (27.6%) |
|
| |
Communications Equipment (4.2%) |
| ||
*Cisco Systems, Inc. | 49,050 | 1,624 | |
QUALCOMM Inc. | 15,603 | 659 | |
Corning, Inc. | 15,907 | 392 | |
Harris Corp. | 2,127 | 123 | |
|
|
| |
Computers & Peripherals (6.6%) |
| ||
Hewlett-Packard Co. | 23,477 | 1,169 | |
International Business |
|
| |
Machines Corp. | 9,707 | 1,143 | |
*Apple Inc. | 7,412 | 1,138 | |
35
|
| Market |
|
| Value• |
| Shares | ($000) |
*Dell Inc. | 18,281 | 505 |
*EMC Corp. | 14,294 | 297 |
*Brocade Communications |
|
|
Systems, Inc. | 26,503 | 227 |
|
|
|
Electronic Equipment & Instruments (1.1%) |
|
|
*Arrow Electronics, Inc. | 5,352 | 228 |
*Avnet, Inc. | 4,940 | 197 |
*Vishay Intertechnology, Inc. | 9,900 | 129 |
*Agilent Technologies, Inc. | 3,200 | 118 |
*Dolby Laboratories Inc. | 1,333 | 46 |
|
|
|
Internet Software & Services (2.7%) |
|
|
*Google Inc. | 1,845 | 1,047 |
*eBay Inc. | 11,356 | 443 |
*Yahoo! Inc. | 7,457 | 200 |
*WebMD Health Corp. Class A | 2,900 | 151 |
IT Services (2.2%) |
|
|
Accenture Ltd. | 9,635 | 388 |
Automatic Data Processing, Inc. | 6,000 | 276 |
Western Union Co. | 12,622 | 265 |
MasterCard, Inc. Class A | 1,600 | 237 |
Electronic Data Systems Corp. | 9,565 | 209 |
*Fiserv, Inc. | 1,039 | 53 |
*Alliance Data Systems Corp. | 600 | 46 |
*CheckFree Corp. | 100 | 5 |
|
|
|
Semiconductors & |
|
|
Semiconductor Equipment (5.1%) |
| |
Intel Corp. | 51,320 | 1,327 |
*NVIDIA Corp. | 10,500 | 381 |
Texas Instruments, Inc. | 10,061 | 368 |
*MEMC Electronic Materials, Inc. | 5,291 | 311 |
*LAM Research Corp. | 4,160 | 222 |
*Varian Semiconductor |
|
|
Equipment Associates, Inc. | 3,821 | 204 |
Applied Materials, Inc. | 8,699 | 180 |
National Semiconductor Corp. | 6,102 | 165 |
*Novellus Systems, Inc. | 4,853 | 132 |
*Teradyne, Inc. | 5,800 | 80 |
*International Rectifier Corp. | 2,000 | 66 |
|
|
|
Software (5.7%) |
|
|
Microsoft Corp. | 71,085 | 2,094 |
*Oracle Corp. | 35,796 | 775 |
*BMC Software, Inc. | 8,460 | 264 |
*Intuit, Inc. | 7,802 | 236 |
*Synopsys, Inc. | 8,100 | 219 |
*Adobe Systems, Inc. | 4,183 | 183 |
36
|
| Market | |
|
| Value• | |
| Shares | ($000) | |
*Symantec Corp. | 4,600 | 89 | |
|
| 18,611 | |
Materials (3.2%) |
|
| |
Monsanto Co. | 4,527 | 388 | |
Southern Peru |
|
| |
Copper Corp. (U.S. Shares) | 2,436 | 302 | |
Celanese Corp. Series A | 5,470 | 213 | |
Allegheny Technologies Inc. | 1,900 | 209 | |
RPM International, Inc. | 7,700 | 184 | |
*Pactiv Corp. | 6,030 | 173 | |
Steel Dynamics, Inc. | 3,413 | 159 | |
Freeport-McMoRan |
|
| |
Copper & Gold, Inc. Class B | 1,371 | 144 | |
Lubrizol Corp. | 1,783 | 116 | |
*Owens-Illinois, Inc. | 2,700 | 112 | |
Nalco Holding Co. | 2,400 | 71 | |
Alcoa Inc. | 1,580 | 62 | |
Ball Corp. | 700 | 38 | |
|
| 2,171 | |
Telecommunication Services (0.8%) |
|
| |
Telephone & Data Systems, Inc. | 3,491 | 233 | |
*U.S. Cellular Corp. | 1,692 | 166 | |
*MetroPCS Communications Inc. | 5,500 | 150 | |
|
| 549 | |
Utilities (1.6%) |
|
| |
Exelon Corp. | 3,472 | 262 | |
*Mirant Corp. | 6,300 | 256 | |
CenterPoint Energy Inc. | 11,386 | 183 | |
*Dynegy, Inc. | 17,900 | 165 | |
TXU Corp. | 1,714 | 117 | |
*NRG Energy, Inc. | 1,700 | 72 | |
|
| 1,055 | |
Total Common Stocks |
|
| |
(Cost $58,582) |
| 67,159 | |
Temporary Cash Investments (0.2%)1 |
| ||
Money Market Fund (0.0%) |
|
| |
2 Vanguard Market |
|
| |
Liquidity Fund, 5.153% | 694 | 1 | |
|
|
| |
|
|
| |
| Face |
| |
| Amount |
| |
| ($000) |
| |
U.S. Agency Obligation (0.2%) |
|
| |
3 Federal National Mortgage Assn. |
| ||
4 5.208%, 10/24/07 | 100 | 100 | |
Total Temporary Cash Investments |
| ||
(Cost $101) |
| 101 | |
37
|
| Market |
|
| Value• |
| Shares | ($000) |
Total Investments (100.0%) |
|
|
(Cost $58,683) |
| 67,260 |
Other Assets and Liabilities (0.0%) |
| |
Other Assets—Note B |
| 156 |
Liabilities |
| (142) |
|
| 14 |
Net Assets (100%) |
| 67,274 |
At September 30, 2007, net assets consisted of:5,6 | |
| Amount |
| ($000) |
Paid-in Capital | 57,140 |
Undistributed Net Investment Income | 446 |
Accumulated Net Realized Gains | 1,111 |
Unrealized Appreciation |
|
Investment Securities | 8,577 |
Futures Contracts | — |
Net Assets | 67,274 |
|
|
|
|
Institutional Shares—Net Assets |
|
Applicable to 296,446 outstanding $.001 |
|
par value shares of beneficial interest |
|
(unlimited authorization) | 8,872 |
Net Asset Value Per Share— |
|
Institutional Shares | $29.93 |
|
|
|
|
Institutional Plus Shares—Net Assets |
|
Applicable to 979,863 outstanding $.001 |
|
par value shares of beneficial interest |
|
(unlimited authorization) | 58,402 |
Net Asset Value Per Share— |
|
Institutional Plus Shares | $59.60 |
• See Note A in Notes to Financial Statements.
* Non-income-producing security.
1 The fund invests a portion of its cash reserves in equity markets through the use of index futures contracts. After giving effect to futures investments, the fund’s effective common stock and temporary cash investment positions represent 99.9% and 0.1%, respectively, of net assets. See Note D in Notes to Financial Statements.
2 Affiliated money market fund available only to Vanguard funds and certain trusts and accounts managed by Vanguard. Rate shown is the 7-day yield.
3 The issuer operates under a congressional charter; its securities are neither issued nor guaranteed by the U.S. government. If needed, access to additional funding from the U.S. Treasury (beyond the issuer’s line of credit) would require congressional action.
4 Securities with a value of $100,000 have been segregated as initial margin for open futures contracts.
5 See Note D in Notes to Financial Statements for the tax-basis components of net assets.
6 See Note F in Notes to Financial Statements.
REIT—Real Estate Investment Trust.
38
Structured Large-Cap Growth Fund
Statement of Operations
| October 3, 20061 to |
| September 30, 2007 |
| ($000) |
Investment Income |
|
Income |
|
Dividends | 671 |
Interest2 | 6 |
Security Lending | 1 |
Total Income | 678 |
Expenses |
|
The Vanguard Group—Note B |
|
Investment Advisory Services | 24 |
Management and Administrative |
|
Institutional Shares | 3 |
Institutional Plus Shares | 24 |
Marketing and Distribution |
|
Institutional Shares | — |
Institutional Plus Shares | 9 |
Custodian Fees | 5 |
Auditing Fees | 21 |
Shareholders’ Reports |
|
Institutional Shares | — |
Institutional Plus Shares | 1 |
Total Expenses | 87 |
Expenses Paid Indirectly—Note C | (1) |
Net Expenses | 86 |
Net Investment Income | 592 |
Realized Net Gain (Loss) |
|
Investment Securities Sold | 1,154 |
Futures Contracts | 9 |
Realized Net Gain (Loss) | 1,163 |
Unrealized Appreciation (Depreciation) |
|
Investment Securities | 8,104 |
Futures Contracts | — |
Unrealized Appreciation (Depreciation) | 8,104 |
Net Increase (Decrease) in Net Assets Resulting from Operations | 9,859 |
1 Commencement of operations as a registered investment company.
2 Interest income from an affiliated company of the fund was $6,000.
39
Structured Large-Cap Growth Fund
Statement of Changes in Net Assets
| October 3, 20061 to |
| September 30, 2007 |
| ($000) |
Increase (Decrease) in Net Assets |
|
Operations |
|
Net Investment Income | 592 |
Realized Net Gain (Loss) | 1,163 |
Unrealized Appreciation (Depreciation) | 8,104 |
Net Increase (Decrease) in Net Assets Resulting from Operations | 9,859 |
Distributions |
|
Net Investment Income |
|
Institutional Shares | — |
Institutional Plus Shares | (146) |
Realized Capital Gain2 |
|
Institutional Shares | — |
Institutional Plus Shares | (52) |
Total Distributions | (198) |
Capital Share Transactions—Notes F, G |
|
Institutional Shares | 8,608 |
Institutional Plus Shares | 49,005 |
Net Increase (Decrease) from Capital Share Transactions | 57,613 |
Total Increase (Decrease) | 67,274 |
Net Assets |
|
Beginning of Period | — |
End of Period3 | 67,274 |
1 Commencement of operations as a registered investment company.
2 Includes fiscal 2007 short-term gain distributions totaling $52,000. Short-term gain distributions are treated as ordinary income dividends for tax purposes.
3 Net Assets—End of Period includes undistributed net investment income of $446,000.
40
Structured Large-Cap Growth Fund
Financial Highlights
Institutional Shares |
|
| June 22, 20071 to |
For a Share Outstanding Throughout the Period | September 30, 2007 |
Net Asset Value, Beginning of Period | $29.04 |
Investment Operations |
|
Net Investment Income | .05 |
Net Realized and Unrealized Gain (Loss) on Investments | .84 |
Total from Investment Operations | .89 |
Distributions |
|
Dividends from Net Investment Income | — |
Distributions from Realized Capital Gains | — |
Total Distributions | — |
Net Asset Value, End of Period | $29.93 |
|
|
|
|
Total Return | 3.06% |
|
|
|
|
Ratios/Supplemental Data |
|
Net Assets, End of Period (Millions) | $9 |
Ratio of Total Expenses to Average Net Assets | 0.25%* |
Ratio of Net Investment Income to Average Net Assets | 0.84%* |
Portfolio Turnover Rate | 56% |
1 Inception.
* Annualized.
41
Structured Large-Cap Growth Fund
Institutional Plus Shares |
|
| October 3, 20061 to |
For a Share Outstanding Throughout the Period | September 30, 2007 |
Net Asset Value, Beginning of Period | $50.00 |
Investment Operations |
|
Net Investment Income | .547 |
Net Realized and Unrealized Gain (Loss) on Investments | 9.256 |
Total from Investment Operations | 9.803 |
Distributions |
|
Dividends from Net Investment Income | (.150) |
Distributions from Realized Capital Gains | (.053) |
Total Distributions | (.203) |
Net Asset Value, End of Period | $59.60 |
|
|
|
|
Total Return | 19.66% |
|
|
|
|
Ratios/Supplemental Data |
|
Net Assets, End of Period (Millions) | $58 |
Ratio of Total Expenses to Average Net Assets | 0.15%* |
Ratio of Net Investment Income to Average Net Assets | 0.94%* |
Portfolio Turnover Rate | 56% |
1 Commencement of operations as a registered investment company.
* Annualized.
See accompanying Notes, which are an integral part of the Financial Statements.
42
Structured Large-Cap Growth Fund
Notes to Financial Statements
Vanguard Structured Large-Cap Growth Fund is registered under the Investment Company Act of 1940 as an open-end investment company, or mutual fund. The fund files reports with the SEC under the company name Vanguard Quantitative Funds. The fund offers two classes of shares, Institutional Shares and Institutional Plus Shares. Institutional Shares are available to investors who invest a minimum amount of $5 million. Institutional Plus Shares are available to investors who invest a minimum amount of $200 million ($100 million for investors with total Vanguard investments of at least $1 billion).
A. The following significant accounting policies conform to generally accepted accounting principles for U.S. mutual funds. The fund consistently follows such policies in preparing its financial statements.
1. Security Valuation: Securities are valued as of the close of trading on the New York Stock Exchange (generally 4 p.m., Eastern time) on the valuation date. Equity securities are valued at the latest quoted sales prices or official closing prices taken from the primary market in which each security trades; such securities not traded on the valuation date are valued at the mean of the latest quoted bid and asked prices. Securities for which market quotations are not readily available, or whose values have been materially affected by events occurring before the fund’s pricing time but after the close of the securities’ primary markets, are valued by methods deemed by the board of trustees to represent fair value. Investments in Vanguard Market Liquidity Fund are valued at that fund’s net asset value. Temporary cash investments acquired over 60 days to maturity are valued using the latest bid prices or using valuations based on a matrix system (which considers such factors as security prices, yields, maturities, and ratings), both as furnished by independent pricing services. Other temporary cash investments are valued at amortized cost, which approximates market value.
2. Futures Contracts: The fund uses index futures contracts to a limited extent, with the objective of maintaining full exposure to the stock market while maintaining liquidity. The fund may purchase or sell futures contracts to achieve a desired level of investment, whether to accommodate portfolio turnover or cash flows from capital share transactions. The primary risks associated with the use of futures contracts are imperfect correlation between changes in market values of stocks held by the fund and the prices of futures contracts, and the possibility of an illiquid market.
Futures contracts are valued at their quoted daily settlement prices. The aggregate principal amounts of the contracts are not recorded in the Statement of Net Assets. Fluctuations in the value of the contracts are recorded in the Statement of Net Assets as an asset (liability) and in the Statement of Operations as unrealized appreciation (depreciation) until the contracts are closed, when they are recorded as realized futures gains (losses).
3. Federal Income Taxes: The fund intends to qualify as a regulated investment company and distribute all of its taxable income. Accordingly, no provision for federal income taxes is required in the financial statements.
4. Distributions: Distributions to shareholders are recorded on the ex-dividend date.
5. Security Lending: The fund may lend its securities to qualified institutional borrowers to earn additional income. Security loans are required to be secured at all times by collateral at least equal to the market value of securities loaned. The fund invests cash collateral received in Vanguard Market Liquidity Fund, and records a liability for the return of the collateral, during the period the securities are on loan. Security lending income represents the income earned on investing cash collateral, less expenses associated with the loan.
43
Structured Large-Cap Growth Fund
6. Other: Dividend income is recorded on the ex-dividend date. Interest income includes income distributions received from Vanguard Market Liquidity Fund and is accrued daily. Security transactions are accounted for on the date securities are bought or sold. Costs used to determine realized gains (losses) on the sale of investment securities are those of the specific securities sold.
Each class of shares has equal rights as to assets and earnings, except that each class separately bears certain class-specific expenses related to maintenance of shareholder accounts (included in Management and Administrative expenses) and shareholder reporting. Marketing and distribution expenses are allocated to each class of shares based on a method approved by the board of trustees. Income, other non-class-specific expenses, and gains and losses on investments are allocated to each class of shares based on its relative net assets.
B. The Vanguard Group furnishes at cost investment advisory, corporate management, administrative, marketing, and distribution services. The costs of such services are allocated to the fund under methods approved by the board of trustees. The fund has committed to provide up to 0.40% of its net assets in capital contributions to Vanguard. At September 30, 2007, the fund had contributed capital of $6,000 to Vanguard (included in Other Assets), representing 0.01% of the fund’s net assets and 0.01% of Vanguard’s capitalization. The fund’s trustees and officers are also directors and officers of Vanguard.
C. The fund’s custodian bank has agreed to reduce its fees when the fund maintains cash on deposit in the non-interest-bearing custody account. For the period ended September 30, 2007, custodian fee offset arrangements reduced the fund’s expenses by $1,000.
D. Distributions are determined on a tax basis and may differ from net investment income and realized capital gains for financial reporting purposes. Differences may be permanent or temporary. Permanent differences are reclassified among capital accounts in the financial statements to reflect their tax character. Temporary differences arise when certain items of income, expense, gain, or loss are recognized in different periods for financial statement and tax purposes; these differences will reverse at some time in the future. Differences in classification may also result from the treatment of short-term gains as ordinary income for tax purposes.
For tax purposes, at September 30, 2007, the fund had $1,001,000 of ordinary income and $571,000 of long-term capital gains available for distribution.
At September 30, 2007, the cost of investment securities for tax purposes was $58,683,000. Net unrealized appreciation of investment securities for tax purposes was $8,577,000, consisting of unrealized gains of $10,127,000 on securities that had risen in value since their purchase and $1,550,000 in unrealized losses on securities that had fallen in value since their purchase.
At September 30, 2007, the aggregate settlement value of open futures contracts expiring in December 2007 and the related unrealized appreciation (depreciation) were:
|
|
| ($000) |
|
| Aggregate | Unrealized |
| Number of | Settlement | Appreciation |
Futures Contracts | Long Contracts | Value | (Depreciation) |
E-mini S&P 500 Index | 1 | 77 | — |
Unrealized appreciation (depreciation) on open futures contracts is required to be treated as realized gain (loss) for tax purposes.
44
Structured Large-Cap Growth Fund
E. During the period ended September 30, 2007, the fund purchased $41,022,000 of investment securities and sold $31,852,000 of investment securities, other than temporary cash investments.
F. Pursuant to a plan of reorganization approved by the trustee of Vanguard Fiduciary Trust Company Structured Large-Cap Growth Trust (the “trust”) on July 18, 2006, the trust purchased shares of the fund through a non-taxable in-kind transfer of all of the trust’s investment securities on October 3, 2006, resulting in the issuance of 976,000 fund shares at a net asset value per share of $50.00. The trust’s net assets transferred to the fund were $48,807,000, including net unrealized appreciation of $473,000. On October 4, 2006, the trust liquidated by distributing to unitholders shares of the fund equal to the value of the unitholders’ investments in the trust.
G. Capital share transactions for each class of shares were:
| October 3, 20061 to | |
| September 30, 2007 | |
| Amount | Shares |
| ($000) | (000) |
Institutional Shares |
|
|
Issued | 8,608 | 296 |
Issued in Lieu of Cash Distributions | — | — |
Redeemed | — | — |
Net Increase (Decrease)—Institutional Shares | 8,608 | 296 |
Institutional Plus Shares |
|
|
Issued2 | 48,807 | 976 |
Issued in Lieu of Cash Distributions | 198 | 4 |
Redeemed | — | — |
Net Increase (Decrease)—Institutional Plus Shares | 49,005 | 980 |
H. In June 2006, the Financial Accounting Standards Board issued Interpretation No. 48 (“FIN 48”), “Accounting for Uncertainty in Income Taxes.” FIN 48 establishes the minimum threshold for recognizing, and a system for measuring, the benefits of tax-return positions in financial statements, and is effective for the fund’s fiscal year beginning October 1, 2007. Management has analyzed the fund’s federal tax positions for the period ended September 30, 2007, for purposes of implementing FIN 48, and has concluded that as of September 30, 2007, no provision for income tax would be required in the fund’s financial statements.
1 Commencement of operations as a registered investment company.
2 Includes shares converted from the net assets of Vanguard Fiduciary Trust Company Structured Large-Cap Growth Trust. See Note F in Notes to Financial Statements.
45
Structured Large-Cap Value Fund
Fund Profile
As of September 30, 2007
Portfolio Characteristics |
|
| |
|
| Comparative | Broad |
| Fund | Index1 | Index2 |
Number of Stocks | 246 | 621 | 4,887 |
Median Market Cap | $55.4B | $55.0B | $36.1B |
Price/Earnings Ratio | 13.8x | 14.6x | 18.1x |
Price/Book Ratio | 2.2x | 2.2x | 2.8x |
Yield—Institutional |
|
|
|
Plus Shares | 2.3% | 2.5% | 1.7% |
Return on Equity | 17.8% | 17.8% | 18.8% |
Earnings Growth Rate | 22.1% | 21.2% | 21.6% |
Foreign Holdings | 0.2% | 0.0% | 0.0% |
Turnover Rate | 48% | — | — |
Expense Ratio— |
|
|
|
Institutional Plus Shares | 0.15% | — | — |
Short-Term Reserves | –0.1%3 | — | — |
Sector Diversification (% of equity exposure) | |||
|
| Comparative | Broad |
| Fund | Index1 | Index2 |
Consumer Discretionary | 7.6% | 7.6% | 10.4% |
Consumer Staples | 7.9 | 7.8 | 8.2 |
Energy | 14.4 | 14.4 | 11.2 |
Financials | 32.3 | 32.3 | 20.0 |
Health Care | 7.0 | 7.0 | 11.6 |
Industrials | 10.4 | 10.5 | 11.8 |
Information Technology | 3.7 | 3.6 | 16.0 |
Materials | 4.1 | 4.1 | 3.7 |
Telecommunication |
|
|
|
Services | 6.6 | 6.7 | 3.5 |
Utilities | 6.0 | 6.0 | 3.6 |
46
Ten Largest Holdings4 (% of total net assets) | ||
|
|
|
ExxonMobil Corp. | integrated oil |
|
| and gas | 5.4% |
General Electric Co. | industrial |
|
| conglomerates | 4.8 |
AT&T Inc. | integrated |
|
| telecommunication |
|
| services | 3.5 |
Citigroup, Inc. | diversified financial |
|
| services | 3.0 |
Bank of America Corp. | diversified financial |
|
| services | 3.0 |
Chevron Corp. | integrated oil |
|
| and gas | 2.7 |
Pfizer Inc. | pharmaceuticals | 2.2 |
JPMorgan Chase & Co. | diversified financial |
|
| services | 2.1 |
ConocoPhillips Co. | integrated oil |
|
| and gas | 2.0 |
American |
|
|
International Group, Inc. | multi-line insurance | 1.7 |
Top Ten |
| 30.4% |
Investment Focus

1 Russell 1000 Value Index.
2 Dow Jones Wilshire 5000 Index.
3 The fund invested a portion of its cash reserves in equity markets through the use of index futures contracts. After the effect of the futures investments, the fund’s temporary cash postion was negative.
4 “Ten Largest Holdings” excludes any temporary cash investments and equity index products. See 92 for a glossary of investment terms.
47
Structured Large-Cap Value Fund
Performance Summary
All of the returns in this report represent past performance, which is not a guarantee of future results that may be achieved by the fund. (Current performance may be lower or higher than the performance data cited. For performance data current to the most recent month-end, visit our website at www.vanguard.com/performance.) Note, too, that both investment returns and principal value can fluctuate widely, so an investor’s shares, when sold, could be worth more or less than their original cost. The returns shown do not reflect taxes that a shareholder would pay on fund distributions or on the sale of fund shares.
Cumulative Performance: December 15, 2005–September 30, 2007
Initial Investment of $200,000,000

| Average Annual Total Returns | Final Value of a | |
| Periods Ended September 30, 2007 | $200,000,000 | |
| One Year | Since inception1 | Investment |
Structured Large-Cap Value Fund |
|
|
|
Institutional Plus Shares | 14.46% | 14.64% | $255,480,000 |
Dow Jones Wilshire 5000 Index | 17.08 | 12.98 | 248,895,880 |
Russell 1000 Value Index | 14.45 | 14.74 | 255,873,385 |
Average Large-Cap Value Fund2 | 14.63 | 13.13 | 249,489,086 |
48
Fiscal-Year Total Returns (%): December 15, 2005–September 30, 2007

1 Performance for the fund and its comparative standards is calculated since the fund’s inception: December 15, 2005.
2 Derived from data provided by Lipper Inc.
3 December 15, 2005, through September 30, 2006.
4 The fund commenced operations as a registered investment company on January 18, 2007. The fund’s performance includes the performance of a predecessor trust, Vanguard Fiduciary Trust Company Structured Large-Cap Value Trust, from December 15, 2005, to January 18, 2007.
Note: See Financial Highlights table on page 60 for dividend and capital gains information.
49
Structured Large-Cap Value Fund
Financial Statements
Statement of Net Assets
As of September 30, 2007
The fund provides a complete list of its holdings four times in each fiscal year, at the quarter-ends. For the second and fourth fiscal quarters, the lists appear in the fund’s semiannual and annual reports to shareholders. For the first and third fiscal quarters, the fund files the lists with the Securities and Exchange Commission on Form N-Q. Shareholders can look up the fund’s Forms N-Q on the SEC’s website at www.sec.gov. Forms N-Q may also be reviewed and copied at the SEC’s Public Reference Room (see the back cover of this report for further information).
|
| Market |
|
| Value• |
| Shares | ($000) |
Common Stocks (99.5%)1 |
|
|
Consumer Discretionary (7.6%) |
|
|
Time Warner, Inc. | 37,220 | 683 |
McDonald’s Corp. | 11,104 | 605 |
The Walt Disney Co. | 13,790 | 474 |
*Liberty Media Corp.- |
|
|
Capital Series A | 3,300 | 412 |
General Motors Corp. | 10,400 | 382 |
Home Depot, Inc. | 10,300 | 334 |
Newell Rubbermaid, Inc. | 9,636 | 278 |
Macy’s Inc. | 8,300 | 268 |
Idearc Inc. | 8,300 | 261 |
*Mohawk Industries, Inc. | 3,100 | 252 |
*Comcast Corp. Class A | 8,775 | 212 |
Wyndham Worldwide Corp. | 5,748 | 188 |
J.C. Penney Co., Inc. |
|
|
(Holding Co.) | 2,800 | 177 |
Eastman Kodak Co. | 6,300 | 169 |
Regal Entertainment |
|
|
Group Class A | 7,400 | 162 |
Gannett Co., Inc. | 3,030 | 132 |
CBS Corp. | 4,150 | 131 |
*NVR, Inc. | 200 | 94 |
News Corp., Class A | 4,210 | 93 |
Sherwin-Williams Co. | 1,400 | 92 |
Mattel, Inc. | 3,900 | 92 |
*TRW Automotive Holdings Corp. | 2,500 | 79 |
Service Corp. International | 6,100 | 79 |
*DreamWorks |
|
|
Animation SKG, Inc. | 1,800 | 60 |
*Dollar Tree Stores, Inc. | 1,200 | 49 |
Carnival Corp. | 1,000 | 48 |
Whirlpool Corp. | 500 | 45 |
RadioShack Corp. | 2,100 | 43 |
*Sears Holdings Corp. | 300 | 38 |
50
|
| Market |
|
| Value• |
| Shares | ($000) |
*Ford Motor Co. | 1,900 | 16 |
Tribune Co. | 588 | 16 |
OfficeMax, Inc. | 300 | 10 |
|
| 5,974 |
Consumer Staples (7.9%) |
|
|
The Procter & Gamble Co. | 18,390 | 1,294 |
Altria Group, Inc. | 10,330 | 718 |
Kraft Foods Inc. | 18,701 | 645 |
The Coca-Cola Co. | 7,290 | 419 |
ConAgra Foods, Inc. | 14,600 | 382 |
Wal-Mart Stores, Inc. | 8,200 | 358 |
Reynolds American Inc. | 5,540 | 352 |
The Kroger Co. | 11,800 | 337 |
Molson Coors |
|
|
Brewing Co. Class B | 3,200 | 319 |
Carolina Group | 3,500 | 288 |
Kimberly-Clark Corp. | 3,570 | 251 |
CVS/Caremark Corp. | 5,200 | 206 |
Safeway, Inc. | 4,400 | 146 |
Archer-Daniels-Midland Co. | 4,300 | 142 |
*Energizer Holdings, Inc. | 1,000 | 111 |
Corn Products International, Inc. | 2,400 | 110 |
Anheuser-Busch Cos., Inc. | 1,490 | 74 |
Costco Wholesale Corp. | 200 | 12 |
Sara Lee Corp. | 600 | 10 |
|
| 6,174 |
Energy (14.3%) |
|
|
ExxonMobil Corp. | 45,610 | 4,222 |
Chevron Corp. | 22,790 | 2,133 |
ConocoPhillips Co. | 17,674 | 1,551 |
Occidental Petroleum Corp. | 9,320 | 597 |
Marathon Oil Corp. | 8,500 | 485 |
Hess Corp. | 6,500 | 432 |
Noble Energy, Inc. | 5,300 | 371 |
Devon Energy Corp. | 3,600 | 300 |
Apache Corp. | 2,500 | 225 |
Anadarko Petroleum Corp. | 3,350 | 180 |
ENSCO International, Inc. | 3,200 | 180 |
Chesapeake Energy Corp. | 4,400 | 155 |
Valero Energy Corp. | 2,220 | 149 |
Tesoro Corp. | 3,200 | 147 |
Overseas Shipholding Group Inc. | 800 | 61 |
Western Refining, Inc. | 1,100 | 45 |
St. Mary Land & Exploration Co. | 300 | 11 |
*SEACOR Holdings Inc. | 100 | 10 |
|
| 11,254 |
Financials (32.0%) |
|
|
Capital Markets (4.0%) |
|
|
Morgan Stanley | 11,090 | 699 |
Merrill Lynch & Co., Inc. | 7,700 | 549 |
51
|
| Market |
|
| Value• |
| Shares | ($000) |
The Goldman Sachs Group, Inc. | 1,960 | 425 |
Lehman Brothers Holdings, Inc. | 6,460 | 399 |
Ameriprise Financial, Inc. | 6,200 | 391 |
American Capital Strategies, Ltd. | 7,100 | 303 |
Bank of New York Mellon Corp. | 5,643 | 249 |
Northern Trust Corp. | 1,500 | 99 |
|
|
|
Commercial Banks (6.8%) |
|
|
Wells Fargo & Co. | 36,300 | 1,293 |
Wachovia Corp. | 18,040 | 905 |
U.S. Bancorp | 20,470 | 666 |
KeyCorp | 11,100 | 359 |
SunTrust Banks, Inc. | 4,560 | 345 |
Comerica, Inc. | 6,000 | 308 |
UnionBanCal Corp. | 4,426 | 259 |
Synovus Financial Corp. | 9,000 | 252 |
PNC Financial Services Group | 2,500 | 170 |
Webster Financial Corp. | 3,700 | 156 |
BB&T Corp. | 3,750 | 151 |
Fifth Third Bancorp | 3,550 | 120 |
Bank of Hawaii Corp. | 2,130 | 113 |
Commerce Bancshares, Inc. | 2,242 | 103 |
National City Corp. | 2,920 | 73 |
Regions Financial Corp. | 2,000 | 59 |
East West Bancorp, Inc. | 300 | 11 |
|
|
|
Consumer Finance (0.4%) |
|
|
Capital One Financial Corp. | 2,940 | 195 |
*Discover Financial Services | 5,545 | 115 |
|
|
|
Diversified Financial Services (8.1%) |
| |
Citigroup, Inc. | 51,290 | 2,394 |
Bank of America Corp. | 46,492 | 2,337 |
JPMorgan Chase & Co. | 36,580 | 1,676 |
|
|
|
Insurance (8.0%) |
|
|
American International |
|
|
Group, Inc. | 20,140 | 1,362 |
Prudential Financial, Inc. | 4,450 | 434 |
The Allstate Corp. | 7,550 | 432 |
The Travelers Cos., Inc. | 8,300 | 418 |
XL Capital Ltd. Class A | 4,700 | 372 |
ACE Ltd. | 5,400 | 327 |
Everest Re Group, Ltd. | 2,900 | 320 |
Safeco Corp. | 5,200 | 318 |
RenaissanceRe Holdings Ltd. | 4,800 | 314 |
The Chubb Corp. | 5,800 | 311 |
*Arch Capital Group Ltd. | 3,900 | 290 |
MetLife, Inc. | 3,710 | 259 |
52
|
| Market |
|
| Value• |
| Shares | ($000) |
Nationwide Financial |
|
|
Services, Inc. | 4,800 | 258 |
Ambac Financial Group, Inc. | 3,900 | 245 |
The Hartford Financial |
|
|
Services Group Inc. | 2,600 | 241 |
Loews Corp. | 2,800 | 135 |
CNA Financial Corp. | 3,300 | 130 |
Unum Group | 3,700 | 91 |
Assurant, Inc. | 900 | 48 |
Genworth Financial Inc. | 600 | 18 |
Reinsurance Group |
|
|
of America, Inc. | 200 | 11 |
|
|
|
Real Estate Investment Trusts (2.7%) |
|
|
Vornado Realty Trust REIT | 2,100 | 230 |
Boston Properties, Inc. REIT | 1,900 | 197 |
Host Hotels & Resorts Inc. REIT | 8,300 | 186 |
Simon Property Group, Inc. REIT | 1,770 | 177 |
HCP, Inc. REIT | 4,700 | 156 |
SL Green Realty Corp. REIT | 1,197 | 140 |
General Growth |
|
|
Properties Inc. REIT | 2,500 | 134 |
Regency Centers Corp. REIT | 1,700 | 130 |
Apartment Investment & |
|
|
Management Co. Class A REIT | 2,790 | 126 |
Federal Realty |
|
|
Investment Trust REIT | 1,300 | 115 |
Colonial Properties Trust REIT | 2,800 | 96 |
Taubman Co. REIT | 1,700 | 93 |
Equity Residential REIT | 1,780 | 75 |
Liberty Property Trust REIT | 1,400 | 56 |
Archstone-Smith Trust REIT | 910 | 55 |
CBL & Associates |
|
|
Properties, Inc. REIT | 1,100 | 39 |
iStar Financial Inc. REIT | 1,000 | 34 |
Avalonbay Communities, Inc. REIT | 150 | 18 |
Kimco Realty Corp. REIT | 312 | 14 |
Mack-Cali Realty Corp. REIT | 300 | 12 |
Public Storage, Inc. REIT | 100 | 8 |
|
|
|
Thrifts & Mortgage Finance (2.0%) |
| |
Fannie Mae | 11,130 | 677 |
Washington Mutual, Inc. | 11,190 | 395 |
Sovereign Bancorp, Inc. | 16,000 | 273 |
Freddie Mac | 2,870 | 169 |
Countrywide Financial Corp. | 3,390 | 64 |
|
| 25,177 |
Health Care (6.9%) |
|
|
Pfizer Inc. | 69,720 | 1,703 |
53
|
| Market |
|
| Value• |
| Shares | ($000) |
Johnson & Johnson | 17,390 | 1,143 |
Wyeth | 8,150 | 363 |
Merck & Co., Inc. | 5,480 | 283 |
Eli Lilly & Co. | 3,630 | 207 |
*Charles River Laboratories, Inc. | 3,600 | 202 |
*WellPoint Inc. | 2,490 | 197 |
*Biogen Idec Inc. | 2,800 | 186 |
*Covidien Ltd. | 4,375 | 182 |
*King Pharmaceuticals, Inc. | 14,800 | 173 |
McKesson Corp. | 2,900 | 171 |
Aetna Inc. | 2,680 | 145 |
*Medco Health Solutions, Inc. | 1,500 | 136 |
AmerisourceBergen Corp. | 2,654 | 120 |
*Boston Scientific Corp. | 7,900 | 110 |
*Amgen, Inc. | 1,800 | 102 |
|
| 5,423 |
Industrials (10.4%) |
|
|
General Electric Co. | 92,050 | 3,811 |
CSX Corp. | 8,100 | 346 |
Northrop Grumman Corp. | 4,350 | 339 |
Deere & Co. | 2,100 | 312 |
Crane Co. | 5,900 | 283 |
General Dynamics Corp. | 3,280 | 277 |
*Alliant Techsystems, Inc. | 2,300 | 251 |
Teleflex Inc. | 3,100 | 242 |
United Technologies Corp. | 3,000 | 241 |
Parker Hannifin Corp. | 2,100 | 235 |
Raytheon Co. | 3,600 | 230 |
*Hertz Global Holdings Inc. | 9,900 | 225 |
Tyco International, Ltd. | 4,375 | 194 |
Trinity Industries, Inc. | 4,400 | 165 |
Honeywell International Inc. | 2,250 | 134 |
3M Co. | 1,400 | 131 |
Union Pacific Corp. | 1,120 | 127 |
Waste Management, Inc. | 3,200 | 121 |
*Allied Waste Industries, Inc. | 7,000 | 89 |
Kennametal, Inc. | 1,000 | 84 |
*Gardner Denver Inc. | 1,700 | 66 |
*UAL Corp. | 1,300 | 61 |
R.R. Donnelley & Sons Co. | 1,600 | 59 |
Textron, Inc. | 800 | 50 |
GATX Corp. | 800 | 34 |
*United Rentals, Inc. | 800 | 26 |
*Northwest Airlines Corp. | 1,200 | 21 |
*Owens Corning Inc. | 400 | 10 |
|
| 8,164 |
Information Technology (3.7%) |
|
|
International Business |
|
|
Machines Corp. | 3,560 | 419 |
*Xerox Corp. | 23,500 | 408 |
54
|
| Market |
|
| Value• |
| Shares | ($000) |
Motorola, Inc. | 19,280 | 357 |
*Cadence Design Systems, Inc. | 13,100 | 291 |
*NCR Corp. | 5,400 | 269 |
*Sun Microsystems, Inc. | 36,100 | 203 |
*Convergys Corp. | 10,800 | 188 |
*Teradyne, Inc. | 12,400 | 171 |
*Vishay Intertechnology, Inc. | 12,200 | 159 |
Tyco Electronics Ltd. | 4,375 | 155 |
*International Rectifier Corp. | 1,700 | 56 |
*Symantec Corp. | 2,170 | 42 |
*Computer Sciences Corp. | 750 | 42 |
*Synopsys, Inc. | 1,400 | 38 |
*Unisys Corp. | 4,200 | 28 |
Electronic Data Systems Corp. | 600 | 13 |
*Fairchild Semiconductor |
|
|
International, Inc. | 600 | 11 |
*Hewitt Associates, Inc. | 300 | 11 |
*ADC Telecommunications, Inc. | 226 | 4 |
|
| 2,865 |
Materials (4.1%) |
|
|
Alcoa Inc. | 11,020 | 431 |
United States Steel Corp. | 3,500 | 371 |
Dow Chemical Co. | 7,910 | 341 |
E.I. du Pont de Nemours & Co. | 6,200 | 307 |
Lubrizol Corp. | 4,500 | 293 |
Celanese Corp. Series A | 7,100 | 277 |
Steel Dynamics, Inc. | 5,800 | 271 |
*Owens-Illinois, Inc. | 6,400 | 265 |
International Paper Co. | 6,400 | 230 |
Ashland, Inc. | 3,200 | 193 |
RPM International, Inc. | 6,400 | 153 |
Cytec Industries, Inc. | 1,400 | 96 |
|
| 3,228 |
Telecommunication Services (6.6%) |
|
|
AT&T Inc. | 64,513 | 2,730 |
Verizon Communications Inc. | 28,140 | 1,246 |
Sprint Nextel Corp. | 32,620 | 620 |
*Qwest Communications |
|
|
International Inc. | 37,400 | 343 |
Alltel Corp. | 2,320 | 162 |
Telephone & Data Systems, Inc. | 1,100 | 73 |
Embarq Corp. | 650 | 36 |
|
| 5,210 |
Utilities (6.0%) |
|
|
FirstEnergy Corp. | 7,000 | 443 |
PG&E Corp. | 9,000 | 430 |
55
|
| Market |
|
| Value• |
| Shares | ($000) |
Public Service |
|
|
Enterprise Group, Inc. | 4,800 | 422 |
Edison International | 7,600 | 421 |
Sempra Energy | 6,900 | 401 |
Exelon Corp. | 4,900 | 369 |
Consolidated Edison Inc. | 7,900 | 366 |
Dominion Resources, Inc. | 3,884 | 327 |
Duke Energy Corp. | 17,160 | 321 |
Atmos Energy Corp. | 8,400 | 238 |
Energen Corp. | 3,800 | 217 |
Southern Co. | 5,690 | 206 |
Xcel Energy, Inc. | 7,587 | 163 |
*Mirant Corp. | 3,100 | 126 |
Pepco Holdings, Inc. | 4,200 | 114 |
Vectren Corp. | 3,100 | 85 |
ONEOK, Inc. | 1,100 | 52 |
FPL Group, Inc. | 400 | 24 |
|
| 4,725 |
Total Common Stocks |
|
|
(Cost $68,392) |
| 78,194 |
Temporary Cash Investments (0.4%)1 |
|
|
Money Market Fund (0.3%) |
|
|
2 Vanguard Market |
|
|
Liquidity Fund, 5.153% | 222,745 | 223 |
|
|
|
|
|
|
| Face |
|
| Amount |
|
| ($000) |
|
U.S. Agency Obligation (0.1%) |
|
|
3 Federal National Mortgage Assn. |
|
|
4 5.208%, 10/24/07 | 100 | 100 |
Total Temporary Cash Investments |
|
|
(Cost $323) |
| 323 |
Total Investments (99.9%) |
|
|
(Cost $68,715) |
| 78,517 |
Other Assets and Liabilities (0.1%) |
|
|
Other Assets—Note B |
| 124 |
Liabilities |
| (48) |
|
| 76 |
Net Assets (100%) |
|
|
Applicable to 1,230,578 outstanding $.001 |
|
|
par value shares of beneficial interest |
|
|
(unlimited authorization) |
| 78,593 |
Net Asset Value Per Share |
| $63.87 |
56
At September 30, 2007, net assets consisted of:5,6 | ||
| Amount | Per |
| ($000) | Share |
Paid-in Capital | 62,803 | $51.04 |
Undistributed Net |
|
|
Investment Income | 1,263 | 1.03 |
Accumulated Net Realized Gains | 4,724 | 3.84 |
Unrealized Appreciation |
|
|
Investment Securities | 9,802 | 7.96 |
Futures Contracts | 1 | — |
Net Assets | 78,593 | $63.87 |
• See Note A in Notes to Financial Statements.
* Non-income-producing security.
1 The fund invests a portion of its cash reserves in equity markets through the use of index futures contracts. After giving effect to futures investments, the fund’s effective common stock and temporary cash investment positions represent 99.9% and 0%, respectively, of net assets. See Note D in Notes to Financial Statements.
2 Affiliated money market fund available only to Vanguard funds and certain trusts and accounts managed by Vanguard. Rate shown is the 7-day yield.
3 The issuer operates under a congressional charter; its securities are neither issued nor guaranteed by the U.S. government. If needed, access to additional funding from the U.S. Treasury (beyond the issuer’s line of credit) would require congressional action.
4 Securities with a value of $100,000 have been segregated as initial margin for open futures contracts.
5 See Note D in Notes to Financial Statements for the tax-basis components of net assets.
6 See Note F in Notes to Financial Statements.
57
Structured Large-Cap Value Fund
Statement of Operations
| January 18, 20071 to |
| September 30, 2007 |
| ($000) |
Investment Income |
|
Income |
|
Dividends | 1,343 |
Interest2 | 1 |
Security Lending | 1 |
Total Income | 1,345 |
Expenses |
|
The Vanguard Group—Note B |
|
Investment Advisory Services | 27 |
Management and Administrative | 18 |
Marketing and Distribution | 8 |
Custodian Fees | 6 |
Auditing Fees | 23 |
Shareholders’ Reports | 1 |
Total Expenses | 83 |
Expenses Paid Indirectly—Note C | (1) |
Net Expenses | 82 |
Net Investment Income | 1,263 |
Realized Net Gain (Loss) |
|
Investment Securities Sold | 4,725 |
Futures Contracts | (1) |
Realized Net Gain (Loss) | 4,724 |
Unrealized Appreciation (Depreciation) |
|
Investment Securities | (1,055) |
Futures Contracts | 1 |
Unrealized Appreciation (Depreciation) | (1,054) |
Net Increase (Decrease) in Net Assets Resulting from Operations | 4,933 |
1 Commencement of operations as a registered investment company.
2 Interest income from an affiliated company of the fund was $1,000.
58
Structured Large-Cap Value Fund
Statement of Changes in Net Assets
| January 18, 20071 to |
| September 30, 2007 |
| ($000) |
Increase (Decrease) in Net Assets |
|
Operations |
|
Net Investment Income | 1,263 |
Realized Net Gain (Loss) | 4,724 |
Unrealized Appreciation (Depreciation) | (1,054) |
Net Increase (Decrease) in Net Assets Resulting from Operations | 4,933 |
Distributions |
|
Net Investment Income | — |
Realized Capital Gain | — |
Total Distributions | — |
Capital Share Transactions—Note G |
|
Issued2 | 78,660 |
Issued in Lieu of Cash Distributions | — |
Redeemed | (5,000) |
Net Increase (Decrease) from Capital Share Transactions | 73,660 |
Total Increase (Decrease) | 78,593 |
Net Assets |
|
Beginning of Period | — |
End of Period3 | 78,593 |
1 Commencement of operations as a registered investment company.
2 Includes shares converted from the net assets of Vanguard Fiduciary Trust Company Structured Large-Cap Value Trust. See Note F in Notes to Financial Statements.
3 Net Assets—End of Period includes undistributed net investment income of $1,263,000.
59
Structured Large-Cap Value Fund
Financial Highlights
Institutional Plus Shares |
|
| January 18, 20071 to |
For a Share Outstanding Throughout the Period | September 30, 2007 |
Net Asset Value, Beginning of Period | $60.09 |
Investment Operations |
|
Net Investment Income | 1.03 |
Net Realized and Unrealized Gain (Loss) on Investments | 2.75 |
Total from Investment Operations | 3.78 |
Distributions |
|
Dividends from Net Investment Income | — |
Distributions from Realized Capital Gains | — |
Total Distributions | — |
Net Asset Value, End of Period | $63.87 |
|
|
|
|
Total Return | 6.29% |
|
|
|
|
Ratios/Supplemental Data |
|
Net Assets, End of Period (Millions) | $79 |
Ratio of Total Expenses to Average Net Assets | 0.15%* |
Ratio of Net Investment Income to Average Net Assets | 2.29%* |
Portfolio Turnover Rate | 48% |
1 Commencement of operations as a registered investment company.
* Annualized.
See accompanying Notes, which are an integral part of the Financial Statements.
60
Structured Large-Cap Value Fund
Notes to Financial Statements
Vanguard Structured Large-Cap Value Fund is registered under the Investment Company Act of 1940 as an open-end investment company, or mutual fund. The fund files reports with the SEC under the company name Vanguard Quantitative Funds. The fund offers two classes of shares, Institutional Shares and Institutional Plus Shares. Institutional Shares are available to investors who invest a minimum amount of $5 million. Institutional Plus Shares are available to investors who invest a minimum amount of $200 million ($100 million for investors with total Vanguard investments of at least $1 billion). The fund has not issued any Institutional Shares through September 30, 2007.
A. The following significant accounting policies conform to generally accepted accounting principles for U.S. mutual funds. The fund consistently follows such policies in preparing its financial statements.
1. Security Valuation: Securities are valued as of the close of trading on the New York Stock Exchange (generally 4 p.m., Eastern time) on the valuation date. Equity securities are valued at the latest quoted sales prices or official closing prices taken from the primary market in which each security trades; such securities not traded on the valuation date are valued at the mean of the latest quoted bid and asked prices. Securities for which market quotations are not readily available, or whose values have been materially affected by events occurring before the fund’s pricing time but after the close of the securities’ primary markets, are valued by methods deemed by the board of trustees to represent fair value. Investments in Vanguard Market Liquidity Fund are valued at that fund’s net asset value. Temporary cash investments acquired over 60 days to maturity are valued using the latest bid prices or using valuations based on a matrix system (which considers such factors as security prices, yields, maturities, and ratings), both as furnished by independent pricing services. Other temporary cash investments are valued at amortized cost, which approximates market value.
2. Futures Contracts: The fund uses index futures contracts to a limited extent, with the objective of maintaining full exposure to the stock market while maintaining liquidity. The fund may purchase or sell futures contracts to achieve a desired level of investment, whether to accommodate portfolio turnover or cash flows from capital share transactions. The primary risks associated with the use of futures contracts are imperfect correlation between changes in market values of stocks held by the fund and the prices of futures contracts, and the possibility of an illiquid market.
Futures contracts are valued at their quoted daily settlement prices. The aggregate principal amounts of the contracts are not recorded in the Statement of Net Assets. Fluctuations in the value of the contracts are recorded in the Statement of Net Assets as an asset (liability) and in the Statement of Operations as unrealized appreciation (depreciation) until the contracts are closed, when they are recorded as realized futures gains (losses).
3. Federal Income Taxes: The fund intends to qualify as a regulated investment company and distribute all of its taxable income. Accordingly, no provision for federal income taxes is required in the financial statements.
4. Distributions: Distributions to shareholders are recorded on the ex-dividend date.
61
Structured Large-Cap Value Fund
5. Security Lending: The fund may lend its securities to qualified institutional borrowers to earn additional income. Security loans are required to be secured at all times by collateral at least equal to the market value of securities loaned. The fund invests cash collateral received in Vanguard Market Liquidity Fund, and records a liability for the return of the collateral, during the period the securities are on loan. Security lending income represents the income earned on investing cash collateral, less expenses associated with the loan.
6. Other: Dividend income is recorded on the ex-dividend date. Interest income includes income distributions received from Vanguard Market Liquidity Fund and is accrued daily. Security transactions are accounted for on the date securities are bought or sold. Costs used to determine realized gains (losses) on the sale of investment securities are those of the specific securities sold.
B. The Vanguard Group furnishes at cost investment advisory, corporate management, administrative, marketing, and distribution services. The costs of such services are allocated to the fund under methods approved by the board of trustees. The fund has committed to provide up to 0.40% of its net assets in capital contributions to Vanguard. At September 30, 2007, the fund had contributed capital of $7,000 to Vanguard (included in Other Assets), representing 0.01% of the fund’s net assets and 0.01% of Vanguard’s capitalization. The fund’s trustees and officers are also directors and officers of Vanguard.
C. The fund’s custodian bank has agreed to reduce its fees when the fund maintains cash on deposit in the non-interest-bearing custody account. For the period ended September 30, 2007, custodian fee offset arrangements reduced the fund’s expenses by $1,000.
D. Distributions are determined on a tax basis and may differ from net investment income and realized capital gains for financial reporting purposes. Differences may be permanent or temporary. Permanent differences are reclassified among capital accounts in the financial statements to reflect their tax character. Temporary differences arise when certain items of income, expense, gain, or loss are recognized in different periods for financial statement and tax purposes; these differences will reverse at some time in the future. Differences in classification may also result from the treatment of short-term gains as ordinary income for tax purposes.
For tax purposes, at September 30, 2007, the fund had $2,853,000 of ordinary income and $3,150,000 of long-term capital gains available for distribution.
At September 30, 2007, the cost of investment securities for tax purposes was $68,715,000. Net unrealized appreciation of investment securities for tax purposes was $9,802,000, consisting of unrealized gains of $11,625,000 on securities that had risen in value since their purchase and $1,823,000 in unrealized losses on securities that had fallen in value since their purchase.
At September 30, 2007, the aggregate settlement value of open futures contracts expiring in December 2007 and the related unrealized appreciation (depreciation) were:
|
|
| ($000) |
|
| Aggregate | Unrealized |
| Number of | Settlement | Appreciation |
Futures Contracts | Long Contracts | Value | (Depreciation) |
E-mini S&P 500 Index | 5 | 385 | 1 |
Unrealized appreciation (depreciation) on open futures contracts is required to be treated as realized gain (loss) for tax purposes.
62
Structured Large-Cap Value Fund
E. During the period ended September 30, 2007, the fund purchased $37,231,000 of investment securities and sold $41,159,000 of investment securities, other than temporary cash investments.
F. Pursuant to a plan of reorganization approved by the trustee of Vanguard Fiduciary Trust Company Structured Large-Cap Value Trust (the “trust”) on October 20, 2006, the trust purchased shares of the fund through a non-taxable in-kind transfer of all of the trust’s investment securities on January 18, 2007, resulting in the issuance of 1,309,000 fund shares at a net asset value per share of $60.09. The trust’s net assets transferred to the fund were $78,660,000, including net unrealized appreciation of $10,857,000. On January 19, 2007, the trust liquidated by distributing to unitholders shares of the fund equal to the value of the unitholders’ investments in the trust.
G. Capital shares issued and redeemed were:
| January 18, 20071 to |
| September 30, 2007 |
| Shares |
| (000) |
Issued | 1,309 |
Issued in Lieu of Cash Distributions | — |
Redeemed | (78) |
Net Increase (Decrease) in Shares Outstanding | 1,231 |
H. In June 2006, the Financial Accounting Standards Board issued Interpretation No. 48 (“FIN 48”), “Accounting for Uncertainty in Income Taxes.” FIN 48 establishes the minimum threshold for recognizing, and a system for measuring, the benefits of tax-return positions in financial statements, effective for the fund’s current fiscal period. Management has analyzed the fund’s federal tax positions taken for the period from inception to September 30, 2007, and has concluded that no provision for income tax is required in the fund’s financial statements.
1 Commencement of operations as a registered investment company.
63
Structured Broad Market Fund
Fund Profile
As of September 30, 2007
Portfolio Characteristics |
|
| |
|
| Comparative | Broad |
| Fund | Index1 | Index2 |
Number of Stocks | 495 | 2,921 | 4,887 |
Median Market Cap | $36.5B | $36.5B | $36.1B |
Price/Earnings Ratio | 16.0x | 17.9x | 18.1x |
Price/Book Ratio | 2.7x | 2.9x | 2.8x |
Yield |
| 1.7% | 1.7% |
Institutional Shares | 1.5%3 |
|
|
Institutional |
|
|
|
Plus Shares | 1.6% |
|
|
Return on Equity | 18.6% | 18.9% | 18.8% |
Earnings Growth Rate | 22.8% | 21.6% | 21.6% |
Foreign Holdings | 0.3% | 0.0% | 0.0% |
Turnover Rate | 66% | — | — |
Expense Ratio |
| — | — |
Institutional Shares | 0.25%3 |
|
|
Institutional |
|
|
|
Plus Shares | 0.15% |
|
|
Short-Term Reserves | –0.1%4 | — | — |
Sector Diversification (% of equity exposure) | |||
|
| Comparative | Broad |
| Fund | Index1 | Index2 |
Consumer Discretionary | 10.6% | 10.6% | 10.4% |
Consumer Staples | 8.4 | 8.4 | 8.2 |
Energy | 10.9 | 10.9 | 11.2 |
Financials | 19.4 | 19.4 | 20.0 |
Health Care | 11.7 | 11.6 | 11.6 |
Industrials | 12.0 | 12.0 | 11.8 |
Information Technology | 16.1 | 16.1 | 16.0 |
Materials | 3.8 | 3.8 | 3.7 |
Telecommunication |
|
|
|
Services | 3.5 | 3.5 | 3.5 |
Utilities | 3.6 | 3.7 | 3.6 |
64
Ten Largest Holdings5 (% of total net assets) | ||
|
|
|
ExxonMobil Corp. | integrated oil |
|
| and gas | 3.0% |
General Electric Co. | industrial |
|
| conglomerates | 2.4 |
AT&T Inc. | integrated |
|
| telecommunication |
|
| services | 1.6 |
Microsoft Corp. | systems software | 1.5 |
Citigroup, Inc. | diversified financial |
|
| services | 1.5 |
The Procter & Gamble Co. | household products | 1.4 |
Bank of America Corp. | diversified financial |
|
| services | 1.2 |
Chevron Corp. | integrated oil |
|
| and gas | 1.2 |
Pfizer Inc. | pharmaceuticals | 1.1 |
Cisco Systems, Inc. | communications |
|
| equipment | 1.1 |
Top Ten |
| 16.0% |
Investment Focus

1 Russell 3000 Index.
2 Dow Jones Wilshire 5000 Index.
3 Annualized.
4 The fund invested a portion of its cash reserves in equity markets through the use of index futures contracts. After the effect of the futures investments, the fund’s temporary cash postion was negative.
5 “Ten Largest Holdings” excludes any temporary cash investments and equity index products.
See page 92 for a glossary of investment terms.
65
Structured Broad Market Fund
Performance Summary
All of the returns in this report represent past performance, which is not a guarantee of future results that may be achieved by the fund. (Current performance may be lower or higher than the performance data cited. For performance data current to the most recent month-end, visit our website at www.vanguard.com/performance.) Note, too, that both investment returns and principal value can fluctuate widely, so an investor’s shares, when sold, could be worth more or less than their original cost. The returns shown do not reflect taxes that a shareholder would pay on fund distributions or on the sale of fund shares.
Cumulative Performance: May 3, 2004–September 30, 2007
Initial Investment of $200,000,000

| Average Annual Total Returns | Final Value of a | |
| Periods Ended September 30, 2007 | $200,000,000 | |
| One Year | Since Inception1 | Investment |
Structured Broad Market Fund |
|
|
|
Institutional Plus Shares | 15.39% | 12.42% | $298,071,630 |
Dow Jones Wilshire 5000 Index | 17.08 | 12.50 | 298,793,688 |
Russell 3000 Index | 16.52 | 12.18 | 295,921,418 |
Average Multi-Cap Core Fund2 | 17.00 | 11.67 | 291,353,665 |
|
| Final Value of |
| Since | a $5,000,000 |
| Inception1 | Investment |
Structured Broad Market Fund |
|
|
Institutional Shares | 8.68% | $5,433,809 |
Dow Jones Wilshire 5000 Index | 10.33 | 5,516,683 |
Russell 3000 Index | 10.08 | 5,503,767 |
1 Performance for the fund and its comparative standards is calculated since the following inception dates: May 3, 2004, for Institutional Plus Shares; November 30, 2006, for Institutional Shares.
2 Derived from data provided by Lipper Inc.
66
Structured Broad Market Fund
Fiscal-Year Total Returns (%): May 3, 2004–September 30, 2007

1 May 3, 2004, through September 30, 2004.
2 The fund commenced operations as a registered investment company on October 3, 2006. The fund’s performance includes the performance of a predecessor trust, Vanguard Fiduciary Trust Company Structured Broad Market Trust, from May 3, 2004, to October 3, 2006.
Note: See Financial Highlights tables on pages 83 and 84 for dividend and capital gains information.
67
Structured Broad Market Fund
Financial Statements
Statement of Net Assets
As of September 30, 2007
The fund provides a complete list of its holdings four times in each fiscal year, at the quarter-ends. For the second and fourth fiscal quarters, the lists appear in the fund’s semiannual and annual reports to shareholders. For the first and third fiscal quarters, the fund files the lists with the Securities and Exchange Commission on Form N-Q. Shareholders can look up the fund’s Forms N-Q on the SEC’s website at www.sec.gov. Forms N-Q may also be reviewed and copied at the SEC’s Public Reference Room (see the back cover of this report for further information).
|
| Market |
|
| Value• |
| Shares | ($000) |
Common Stocks (99.6%)1 |
|
|
Consumer Discretionary (10.5%) |
|
|
Time Warner, Inc. | 82,590 | 1,516 |
The Walt Disney Co. | 43,190 | 1,485 |
McDonald’s Corp. | 26,560 | 1,447 |
*Amazon.com, Inc. | 13,100 | 1,220 |
Lowe’s Cos., Inc. | 36,670 | 1,027 |
*Comcast Corp. Class A | 39,165 | 947 |
NIKE, Inc. Class B | 15,520 | 910 |
*Liberty Media Corp.- |
|
|
Capital Series A | 7,200 | 899 |
Home Depot, Inc. | 27,420 | 889 |
Yum! Brands, Inc. | 25,720 | 870 |
Omnicom Group Inc. | 17,660 | 849 |
General Motors Corp. | 22,700 | 833 |
J.C. Penney Co., Inc. |
|
|
(Holding Co.) | 12,540 | 795 |
Harley-Davidson, Inc. | 16,900 | 781 |
*Expedia, Inc. | 23,500 | 749 |
*Viacom Inc. Class B | 17,695 | 690 |
Whirlpool Corp. | 7,700 | 686 |
Sherwin-Williams Co. | 10,400 | 683 |
*DreamWorks |
|
|
Animation SKG, Inc. | 19,800 | 662 |
Target Corp. | 10,290 | 654 |
Wyndham Worldwide Corp. | 19,694 | 645 |
CBS Corp. | 20,455 | 644 |
Carnival Corp. | 13,300 | 644 |
Burger King Holdings Inc. | 25,100 | 640 |
*Mohawk Industries, Inc. | 7,200 | 585 |
News Corp., Class A | 26,490 | 583 |
*AutoZone Inc. | 5,000 | 581 |
Ross Stores, Inc. | 21,300 | 546 |
*Kohl’s Corp. | 9,500 | 545 |
Darden Restaurants Inc. | 12,300 | 515 |
68
|
| Market |
|
| Value• |
| Shares | ($000) |
*EchoStar Communications Corp. |
|
|
Class A | 10,250 | 480 |
*NVR, Inc. | 1,000 | 470 |
Eastman Kodak Co. | 17,500 | 468 |
Wynn Resorts Ltd. | 2,800 | 441 |
*Clear Channel |
|
|
Outdoor Holdings, Inc. Class A | 16,710 | 426 |
RadioShack Corp. | 19,000 | 393 |
*Aeropostale, Inc. | 19,950 | 380 |
International Speedway Corp. | 6,300 | 289 |
Men’s Wearhouse, Inc. | 5,650 | 285 |
*Jos. A. Bank Clothiers, Inc. | 8,300 | 277 |
Newell Rubbermaid, Inc. | 8,500 | 245 |
*Jack in the Box Inc. | 3,500 | 227 |
Polo Ralph Lauren Corp. | 2,759 | 215 |
*Lear Corp. | 6,100 | 196 |
Jackson Hewitt Tax Service Inc. | 6,770 | 189 |
Brinker International, Inc. | 6,800 | 187 |
Starwood Hotels & |
|
|
Resorts Worldwide, Inc. | 2,700 | 164 |
*Las Vegas Sands Corp. | 1,200 | 160 |
Phillips-Van Heusen Corp. | 2,870 | 151 |
Idearc Inc. | 3,900 | 123 |
*Marvel Entertainment, Inc. | 4,200 | 98 |
*Dollar Tree Stores, Inc. | 2,200 | 89 |
*CSK Auto Corp. | 7,900 | 84 |
Marriott International, Inc. |
|
|
Class A | 1,900 | 83 |
CSS Industries, Inc. | 2,000 | 72 |
Johnson Controls, Inc. | 600 | 71 |
Brown Shoe Co., Inc. | 3,000 | 58 |
Sonic Automotive, Inc. | 2,300 | 55 |
Regal Entertainment Group |
|
|
Class A | 2,500 | 55 |
*Starbucks Corp. | 1,960 | 51 |
*Lin TV Corp. | 3,800 | 49 |
*The Wet Seal, Inc. Class A | 11,600 | 45 |
Salem Communications Corp. | 5,483 | 44 |
*The Gymboree Corp. | 1,200 | 42 |
Interactive Data Corp. | 1,300 | 37 |
The Stanley Works | 600 | 34 |
UniFirst Corp. | 800 | 30 |
Regis Corp. | 900 | 29 |
*DIRECTV Group, Inc. | 1,170 | 28 |
Best Buy Co., Inc. | 590 | 27 |
American Greetings Corp. |
|
|
Class A | 1,000 | 26 |
*Perry Ellis International Corp. | 900 | 25 |
Stewart Enterprises, Inc. |
|
|
Class A | 2,197 | 17 |
69
|
| Market |
|
| Value• |
| Shares | ($000) |
The McGraw-Hill Cos., Inc. | 200 | 10 |
|
| 31,445 |
Consumer Staples (8.4%) |
|
|
The Procter & Gamble Co. | 59,920 | 4,215 |
Altria Group, Inc. | 41,450 | 2,882 |
The Coca-Cola Co. | 42,790 | 2,459 |
Wal-Mart Stores, Inc. | 48,410 | 2,113 |
PepsiCo, Inc. | 28,430 | 2,083 |
Kraft Foods Inc. | 36,029 | 1,243 |
Walgreen Co. | 23,230 | 1,097 |
The Kroger Co. | 31,800 | 907 |
Kimberly-Clark Corp. | 11,970 | 841 |
ConAgra Foods, Inc. | 30,800 | 805 |
Carolina Group | 9,370 | 770 |
CVS/Caremark Corp. | 18,736 | 742 |
Molson Coors Brewing Co. |
|
|
Class B | 7,400 | 738 |
Corn Products International, Inc. | 13,510 | 620 |
*NBTY, Inc. | 15,100 | 613 |
Fresh Del Monte Produce Inc. | 20,500 | 589 |
Anheuser-Busch Cos., Inc. | 7,490 | 374 |
Colgate-Palmolive Co. | 5,130 | 366 |
Reynolds American Inc. | 5,640 | 359 |
Nash-Finch Co. | 8,989 | 358 |
Safeway, Inc. | 8,500 | 281 |
Costco Wholesale Corp. | 2,870 | 176 |
*Winn-Dixie Stores, Inc. | 7,747 | 145 |
Sanderson Farms, Inc. | 3,100 | 129 |
Archer-Daniels-Midland Co. | 2,400 | 79 |
Dean Foods Co. | 900 | 23 |
|
| 25,007 |
Energy (10.9%) |
|
|
ExxonMobil Corp. | 95,920 | 8,878 |
Chevron Corp. | 38,865 | 3,637 |
ConocoPhillips Co. | 32,054 | 2,813 |
Schlumberger Ltd. | 20,500 | 2,152 |
*National Oilwell Varco Inc. | 8,100 | 1,170 |
Marathon Oil Corp. | 17,440 | 994 |
Valero Energy Corp. | 13,892 | 933 |
Hess Corp. | 13,900 | 925 |
Chesapeake Energy Corp. | 25,000 | 881 |
*Transocean Inc. | 7,500 | 848 |
Noble Energy, Inc. | 11,400 | 798 |
Noble Corp. | 15,600 | 765 |
*Pride International, Inc. | 19,200 | 702 |
ENSCO International, Inc. | 11,730 | 658 |
Tesoro Corp. | 13,700 | 630 |
Occidental Petroleum Corp. | 9,540 | 611 |
Tidewater Inc. | 8,200 | 515 |
*Bristow Group, Inc. | 11,400 | 498 |
70
|
| Market |
|
| Value• |
| Shares | ($000) |
*Gulfmark Offshore, Inc. | 9,300 | 453 |
Helmerich & Payne, Inc. | 11,600 | 381 |
*Bois d’Arc Energy, Inc. | 17,400 | 334 |
*Grant Prideco, Inc. | 6,000 | 327 |
Devon Energy Corp. | 3,760 | 313 |
Halliburton Co. | 7,570 | 291 |
*Rosetta Resources, Inc. | 14,300 | 262 |
Anadarko Petroleum Corp. | 4,040 | 217 |
*Grey Wolf, Inc. | 30,720 | 201 |
*Superior Energy Services, Inc. | 5,600 | 198 |
*Swift Energy Co. | 4,500 | 184 |
Apache Corp. | 2,040 | 184 |
Baker Hughes, Inc. | 1,960 | 177 |
GlobalSantaFe Corp. | 1,500 | 114 |
*Mariner Energy Inc. | 5,500 | 114 |
Sunoco, Inc. | 1,400 | 99 |
Diamond Offshore Drilling, Inc. | 800 | 91 |
*Parker Drilling Co. | 8,000 | 65 |
General Maritime Corp. | 1,300 | 36 |
Holly Corp. | 400 | 24 |
|
| 32,473 |
Financials (19.3%) |
|
|
Citigroup, Inc. | 93,520 | 4,365 |
Bank of America Corp. | 74,182 | 3,729 |
JPMorgan Chase & Co. | 66,546 | 3,049 |
Wells Fargo & Co. | 66,810 | 2,380 |
American |
|
|
International Group, Inc. | 34,900 | 2,361 |
The Goldman Sachs Group, Inc. | 8,030 | 1,740 |
Morgan Stanley | 23,250 | 1,465 |
Wachovia Corp. | 27,889 | 1,399 |
Merrill Lynch & Co., Inc. | 19,140 | 1,364 |
Fannie Mae | 21,890 | 1,331 |
U.S. Bancorp | 39,550 | 1,287 |
Prudential Financial, Inc. | 11,340 | 1,107 |
ACE Ltd. | 15,800 | 957 |
The Allstate Corp. | 15,770 | 902 |
The Travelers Cos., Inc. | 17,440 | 878 |
Ameriprise Financial, Inc. | 13,800 | 871 |
XL Capital Ltd. Class A | 10,900 | 863 |
Washington Mutual, Inc. | 23,033 | 813 |
State Street Corp. | 11,400 | 777 |
KeyCorp | 23,950 | 774 |
SunTrust Banks, Inc. | 10,090 | 763 |
American Express Co. | 12,820 | 761 |
Synovus Financial Corp. | 25,480 | 715 |
Assurant, Inc. | 13,288 | 711 |
Everest Re Group, Ltd. | 6,400 | 706 |
Simon Property Group, Inc. REIT | 6,996 | 700 |
The Chubb Corp. | 12,770 | 685 |
71
|
| Market |
|
| Value• |
| Shares | ($000) |
Franklin Resources Corp. | 5,110 | 652 |
Raymond James Financial, Inc. | 19,700 | 647 |
UnionBanCal Corp. | 10,783 | 630 |
Comerica, Inc. | 12,200 | 626 |
*Affiliated Managers Group, Inc. | 4,800 | 612 |
ProLogis REIT | 9,200 | 610 |
Vornado Realty Trust REIT | 5,100 | 558 |
Cash America International Inc. | 14,700 | 553 |
Bank of New York Mellon Corp. | 12,412 | 548 |
The Hartford Financial |
|
|
Services Group Inc. | 5,870 | 543 |
Southwest Bancorp, Inc. | 28,500 | 536 |
Endurance Specialty |
|
|
Holdings Ltd. | 12,700 | 528 |
Nationwide Financial |
|
|
Services, Inc. | 9,800 | 527 |
Archstone-Smith Trust REIT | 8,400 | 505 |
General Growth Properties Inc. |
|
|
REIT | 9,200 | 493 |
The First Marblehead Corp. | 12,819 | 486 |
*First Federal Financial Corp. | 9,600 | 476 |
HCP, Inc. REIT | 13,600 | 451 |
PartnerRe Ltd. | 5,500 | 434 |
SL Green Realty Corp. REIT | 3,700 | 432 |
CNA Financial Corp. | 10,600 | 417 |
Regions Financial Corp. | 14,000 | 413 |
Northern Trust Corp. | 5,800 | 384 |
Freddie Mac | 6,440 | 380 |
Host Hotels & Resorts Inc. REIT | 15,900 | 357 |
*Discover Financial Services | 16,900 | 352 |
Pennsylvania REIT | 8,100 | 315 |
Legg Mason Inc. | 3,700 | 312 |
Lehman Brothers Holdings, Inc. | 4,780 | 295 |
Safeco Corp. | 4,400 | 269 |
Zenith National Insurance Corp. | 6,000 | 269 |
WSFS Financial Corp. | 4,300 | 268 |
Forest City Enterprise Class A | 4,600 | 254 |
MetLife, Inc. | 3,500 | 244 |
Plum Creek Timber Co. Inc. REIT | 5,300 | 237 |
The Macerich Co. REIT | 2,600 | 228 |
Colonial Properties Trust REIT | 6,600 | 226 |
Gamco Investors Inc. Class A | 3,900 | 214 |
Advanta Corp. Class B | 7,803 | 214 |
First Community |
|
|
Bancshares, Inc. | 5,724 | 207 |
Capital One Financial Corp. | 2,960 | 197 |
Boston Properties, Inc. REIT | 1,700 | 177 |
BB&T Corp. | 4,280 | 173 |
Taubman Co. REIT | 3,100 | 170 |
Apartment Investment & |
|
|
72
|
| Market |
|
| Value• |
| Shares | ($000) |
Management Co. Class A REIT | 3,740 | 169 |
Nationwide Health |
|
|
Properties, Inc. REIT | 5,500 | 166 |
Aspen Insurance Holdings Ltd. | 5,900 | 165 |
*EZCORP, Inc. | 12,200 | 164 |
American Capital Strategies, Ltd. | 3,800 | 162 |
CIT Group Inc. | 3,900 | 157 |
First BanCorp Puerto Rico | 16,200 | 154 |
AFLAC Inc. | 2,640 | 151 |
PNC Financial Services Group | 2,040 | 139 |
Odyssey Re Holdings Corp. | 3,400 | 126 |
Kite Realty Group Trust REIT | 6,200 | 117 |
Federal Realty |
|
|
Investment Trust REIT | 1,300 | 115 |
Sovereign Bancorp, Inc. | 6,600 | 112 |
Countrywide Financial Corp. | 5,890 | 112 |
Associated Estates |
|
|
Realty Corp. REIT | 8,200 | 107 |
A.G. Edwards, Inc. | 1,247 | 104 |
City Bank Lynnwood (WA) | 3,100 | 89 |
*CB Richard Ellis Group, Inc. | 3,100 | 86 |
SLM Corp. | 1,280 | 64 |
FirstMerit Corp. | 3,100 | 61 |
Great Southern Bancorp, Inc. | 2,400 | 60 |
Fifth Third Bancorp | 1,700 | 58 |
Loews Corp. | 1,210 | 58 |
Charles Schwab Corp. | 2,500 | 54 |
Sierra Bancorp | 1,300 | 37 |
Saul Centers, Inc. REIT | 700 | 36 |
Bank of Hawaii Corp. | 400 | 21 |
Jones Lang LaSalle Inc. | 200 | 21 |
iStar Financial Inc. REIT | 600 | 20 |
|
| 57,757 |
Health Care (11.6%) |
|
|
Pfizer Inc. | 135,880 | 3,320 |
Johnson & Johnson | 46,010 | 3,023 |
Merck & Co., Inc. | 44,010 | 2,275 |
UnitedHealth Group Inc. | 29,650 | 1,436 |
Wyeth | 29,140 | 1,298 |
Bristol-Myers Squibb Co. | 41,730 | 1,203 |
Abbott Laboratories | 21,500 | 1,153 |
Medtronic, Inc. | 20,230 | 1,141 |
Schering-Plough Corp. | 35,810 | 1,133 |
*Medco Health Solutions, Inc. | 11,800 | 1,067 |
*Biogen Idec Inc. | 15,800 | 1,048 |
Becton, Dickinson & Co. | 11,620 | 953 |
Baxter International, Inc. | 16,660 | 938 |
McKesson Corp. | 15,000 | 882 |
*Zimmer Holdings, Inc. | 10,580 | 857 |
CIGNA Corp. | 15,750 | 839 |
73
|
| Market |
|
| Value• |
| Shares | ($000) |
*Amgen, Inc. | 14,615 | 827 |
Aetna Inc. | 14,680 | 797 |
*Laboratory Corp. |
|
|
of America Holdings | 9,100 | 712 |
Eli Lilly & Co. | 11,820 | 673 |
*Health Net Inc. | 12,400 | 670 |
AmerisourceBergen Corp. | 14,700 | 666 |
*Forest Laboratories, Inc. | 17,600 | 656 |
*Watson Pharmaceuticals, Inc. | 19,700 | 638 |
*Endo Pharmaceuticals |
|
|
Holdings, Inc. | 20,200 | 626 |
*Warner Chilcott Ltd. | 35,000 | 622 |
*Cephalon, Inc. | 7,900 | 577 |
*Express Scripts Inc. | 10,100 | 564 |
*WellPoint Inc. | 6,750 | 533 |
*Isis Pharmaceuticals, Inc. | 26,300 | 394 |
*Gilead Sciences, Inc. | 7,980 | 326 |
*Genentech, Inc. | 4,020 | 314 |
*King Pharmaceuticals, Inc. | 25,150 | 295 |
*GTx, Inc. | 17,700 | 288 |
Chemed Corp. | 4,100 | 255 |
Cardinal Health, Inc. | 4,010 | 251 |
*Pediatrix Medical Group, Inc. | 3,600 | 236 |
*Onyx Pharmaceuticals, Inc. | 4,200 | 183 |
*ViroPharma Inc. | 18,900 | 168 |
Mylan Inc. | 7,180 | 115 |
*Humana Inc. | 1,400 | 98 |
*WellCare Health Plans Inc. | 800 | 84 |
Perrigo Co. | 3,800 | 81 |
*Covidien Ltd. | 1,850 | 77 |
*Align Technology, Inc. | 2,300 | 58 |
*MedCath Corp. | 1,900 | 52 |
*Apria Healthcare Group Inc. | 1,350 | 35 |
West Pharmaceutical |
|
|
Services, Inc. | 800 | 33 |
*Obagi Medical Products, Inc. | 1,600 | 30 |
Stryker Corp. | 400 | 27 |
STERIS Corp. | 1,000 | 27 |
*Gentiva Health Services, Inc. | 1,300 | 25 |
74
|
| Market |
|
| Value• |
| Shares | ($000) |
*Skilled Healthcare Group Inc. | 1,400 | 22 |
*Boston Scientific Corp. | 1,509 | 21 |
*Techne Corp. | 330 | 21 |
*Xenoport Inc. | 347 | 16 |
*Myriad Genetics, Inc. | 300 | 16 |
*Amedisys Inc. | 300 | 12 |
*Cypress Bioscience, Inc. | 800 | 11 |
|
| 34,698 |
Industrials (12.0%) |
|
|
General Electric Co. | 173,880 | 7,199 |
3M Co. | 13,230 | 1,238 |
United Parcel Service, Inc. | 15,780 | 1,185 |
Honeywell International Inc. | 18,870 | 1,122 |
The Boeing Co. | 10,560 | 1,109 |
United Technologies Corp. | 13,340 | 1,074 |
Lockheed Martin Corp. | 9,050 | 982 |
PACCAR, Inc. | 11,270 | 961 |
General Dynamics Corp. | 10,750 | 908 |
Textron, Inc. | 14,188 | 883 |
Waste Management, Inc. | 23,200 | 876 |
Parker Hannifin Corp. | 7,600 | 850 |
Union Pacific Corp. | 7,400 | 837 |
Raytheon Co. | 12,700 | 811 |
Northrop Grumman Corp. | 9,630 | 751 |
The Manitowoc Co., Inc. | 16,200 | 717 |
Cummins Inc. | 5,560 | 711 |
Manpower Inc. | 10,400 | 669 |
W.W. Grainger, Inc. | 7,221 | 658 |
Tyco International, Ltd. | 13,750 | 610 |
Barnes Group, Inc. | 18,500 | 591 |
*Allied Waste Industries, Inc. | 45,320 | 578 |
Caterpillar, Inc. | 7,220 | 566 |
Acuity Brands, Inc. | 10,600 | 535 |
GATX Corp. | 12,320 | 527 |
Trinity Industries, Inc. | 13,600 | 511 |
*Gardner Denver Inc. | 12,900 | 503 |
Belden Inc. | 10,400 | 488 |
Burlington Northern |
|
|
Santa Fe Corp. | 5,870 | 476 |
*Genlyte Group, Inc. | 7,400 | 476 |
*Hertz Global Holdings Inc. | 20,700 | 470 |
*AMR Corp. | 20,510 | 457 |
*Delta Air Lines Inc. | 23,800 | 427 |
Emerson Electric Co. | 7,640 | 407 |
CSX Corp. | 8,800 | 376 |
*UAL Corp. | 7,800 | 363 |
*Terex Corp. | 4,040 | 360 |
A.O. Smith Corp. | 7,200 | 316 |
Crane Co. | 6,500 | 312 |
Steelcase Inc. | 16,200 | 291 |
75
|
| Market |
|
| Value• |
| Shares | ($000) |
FedEx Corp. | 2,460 | 258 |
Deere & Co. | 1,700 | 252 |
R.R. Donnelley & Sons Co. | 6,800 | 249 |
L-3 Communications |
|
|
Holdings, Inc. | 2,300 | 235 |
Apogee Enterprises, Inc. | 8,400 | 218 |
Kennametal, Inc. | 2,400 | 202 |
Illinois Tool Works, Inc. | 3,280 | 196 |
*United Stationers, Inc. | 2,100 | 117 |
*Continental Airlines, Inc. Class B | 3,400 | 112 |
Cascade Corp. | 1,700 | 111 |
*Saia, Inc. | 6,515 | 108 |
Norfolk Southern Corp. | 1,300 | 67 |
*Labor Ready, Inc. | 3,500 | 65 |
*GrafTech International Ltd. | 3,300 | 59 |
Kelly Services, Inc. Class A | 2,400 | 48 |
*United Rentals, Inc. | 1,400 | 45 |
*Perini Corp. | 800 | 45 |
Deluxe Corp. | 1,000 | 37 |
Knoll, Inc. | 1,800 | 32 |
*Ceradyne, Inc. | 400 | 30 |
Bowne & Co., Inc. | 1,700 | 28 |
Cooper Industries, Inc. Class A | 400 | 20 |
Danaher Corp. | 200 | 17 |
|
| 35,732 |
Information Technology (16.1%) |
|
|
Microsoft Corp. | 155,298 | 4,575 |
*Cisco Systems, Inc. | 96,950 | 3,210 |
International Business |
|
|
Machines Corp. | 26,710 | 3,146 |
Intel Corp. | 113,290 | 2,930 |
Hewlett-Packard Co. | 53,230 | 2,650 |
*Apple Inc. | 16,520 | 2,536 |
*Google Inc. | 3,810 | 2,161 |
*Oracle Corp. | 79,200 | 1,715 |
*Dell Inc. | 47,880 | 1,321 |
Corning, Inc. | 40,170 | 990 |
*Sun Microsystems, Inc. | 165,000 | 926 |
QUALCOMM Inc. | 21,220 | 897 |
*eBay Inc. | 22,410 | 874 |
Applied Materials, Inc. | 38,600 | 799 |
*Xerox Corp. | 44,200 | 766 |
*Arrow Electronics, Inc. | 17,500 | 744 |
*BMC Software, Inc. | 23,400 | 731 |
Automatic Data Processing, Inc. | 15,780 | 725 |
*LAM Research Corp. | 13,090 | 697 |
*Avnet, Inc. | 17,200 | 686 |
*Cadence Design Systems, Inc. | 29,500 | 655 |
*Skyworks Solutions, Inc. | 72,000 | 651 |
*Synopsys, Inc. | 23,700 | 642 |
76
|
| Market |
|
| Value• |
| Shares | ($000) |
Electronic Data Systems Corp. | 28,740 | 628 |
*CommScope, Inc. | 11,900 | 598 |
Texas Instruments, Inc. | 15,770 | 577 |
Total System Services, Inc. | 19,800 | 550 |
*Teradyne, Inc. | 39,400 | 544 |
*THQ Inc. | 21,300 | 532 |
*Mentor Graphics Corp. | 35,000 | 528 |
*SPSS, Inc. | 12,700 | 522 |
*Greenfield Online, Inc. | 33,700 | 514 |
Seagate Technology | 19,500 | 499 |
*Vishay Intertechnology, Inc. | 37,800 | 493 |
*NVIDIA Corp. | 13,350 | 484 |
*SAVVIS, Inc. | 11,600 | 450 |
*ON Semiconductor Corp. | 35,500 | 446 |
*EMC Corp. | 21,430 | 446 |
Motorola, Inc. | 22,830 | 423 |
*Intevac, Inc. | 23,300 | 354 |
Western Union Co. | 16,040 | 336 |
MasterCard, Inc. Class A | 2,200 | 326 |
*MEMC Electronic Materials, Inc. | 5,120 | 301 |
*Vignette Corp. | 14,900 | 299 |
*C-COR Inc. | 22,300 | 256 |
Accenture Ltd. | 5,800 | 233 |
*Yahoo! Inc. | 8,070 | 217 |
*Cymer, Inc. | 5,300 | 203 |
*AMIS Holdings Inc. | 16,800 | 163 |
*Amkor Technology, Inc. | 12,790 | 147 |
*CSG Systems International, Inc. | 6,670 | 142 |
*Equinix, Inc. | 1,500 | 133 |
*Dolby Laboratories Inc. | 3,800 | 132 |
*Varian Semiconductor |
|
|
Equipment Associates, Inc. | 2,300 | 123 |
National Semiconductor Corp. | 4,400 | 119 |
*Adobe Systems, Inc. | 2,700 | 118 |
United Online, Inc. | 7,600 | 114 |
*Novellus Systems, Inc. | 3,600 | 98 |
*MKS Instruments, Inc. | 5,000 | 95 |
Tyco Electronics Ltd. | 2,550 | 90 |
*Comtech |
|
|
Telecommunications Corp. | 1,300 | 70 |
*Mettler-Toledo International Inc. | 600 | 61 |
*CMGI Inc. | 44,800 | 61 |
*AsiaInfo Holdings, Inc. | 6,500 | 59 |
*Coherent, Inc. | 1,800 | 58 |
*Interwoven Inc. | 3,900 | 55 |
*ADC Telecommunications, Inc. | 2,200 | 43 |
Xilinx, Inc. | 1,600 | 42 |
*Aspen Technologies, Inc. | 2,800 | 40 |
*Dycom Industries, Inc. | 1,200 | 37 |
*PC Connection, Inc. | 2,900 | 36 |
77
|
| Market |
|
| Value• |
| Shares | ($000) |
*Brooks Automation, Inc. | 2,500 | 36 |
Broadridge Financial |
|
|
Solutions LLC | 1,620 | 31 |
*Emulex Corp. | 1,500 | 29 |
*Computer Sciences Corp. | 500 | 28 |
*Quantum Corp. | 8,000 | 27 |
*Immersion Corp. | 1,600 | 26 |
*Ciber, Inc. | 3,200 | 25 |
*Sybase, Inc. | 1,000 | 23 |
Jack Henry & Associates Inc. | 500 | 13 |
|
| 48,060 |
Materials (3.7%) |
|
|
Monsanto Co. | 13,826 | 1,185 |
Alcoa Inc. | 23,310 | 912 |
Southern Peru Copper Corp. |
|
|
(U.S. Shares) | 7,120 | 882 |
International Paper Co. | 24,300 | 872 |
United States Steel Corp. | 8,100 | 858 |
Nucor Corp. | 12,930 | 769 |
E.I. du Pont de Nemours & Co. | 14,280 | 708 |
Steel Dynamics, Inc. | 13,300 | 621 |
Metal Management, Inc. | 11,300 | 612 |
*Pactiv Corp. | 18,700 | 536 |
Lubrizol Corp. | 8,000 | 520 |
Kaiser Aluminum Corp. | 7,100 | 501 |
Dow Chemical Co. | 11,120 | 479 |
Celanese Corp. Series A | 11,000 | 429 |
*Headwaters Inc. | 28,100 | 418 |
Eastman Chemical Co. | 3,400 | 227 |
*Owens-Illinois, Inc. | 4,800 | 199 |
*OM Group, Inc. | 3,600 | 190 |
Ball Corp. | 1,802 | 97 |
Rock-Tenn Co. | 2,900 | 84 |
Ryerson Tull, Inc. | 1,700 | 57 |
Greif Inc. Class A | 700 | 42 |
|
| 11,198 |
Telecommunication Services (3.5%) |
|
|
AT&T Inc. | 115,029 | 4,867 |
Verizon Communications Inc. | 44,430 | 1,967 |
Sprint Nextel Corp. | 49,789 | 946 |
*Qwest Communications |
|
|
International Inc. | 85,200 | 780 |
Telephone & Data Systems, Inc. | 7,304 | 488 |
*Cincinnati Bell Inc. | 97,500 | 482 |
CenturyTel, Inc. | 9,500 | 439 |
USA Mobility, Inc. | 11,400 | 192 |
Embarq Corp. | 3,200 | 178 |
Alaska Communications |
|
|
Systems Holdings, Inc. | 6,300 | 91 |
78
|
| Market |
|
| Value• |
| Shares | ($000) |
Alltel Corp. | 1,230 | 86 |
SureWest Communications | 1,100 | 28 |
|
| 10,544 |
Utilities (3.6%) |
|
|
Public Service |
|
|
Enterprise Group, Inc. | 11,100 | 977 |
FirstEnergy Corp. | 14,500 | 918 |
PG&E Corp. | 18,400 | 880 |
Consolidated Edison Inc. | 17,600 | 815 |
Sempra Energy | 13,500 | 785 |
*Mirant Corp. | 19,100 | 777 |
Southern Co. | 20,860 | 757 |
Duke Energy Corp. | 37,890 | 708 |
Edison International | 12,440 | 690 |
FPL Group, Inc. | 10,800 | 657 |
Exelon Corp. | 8,640 | 651 |
Alliant Energy Corp. | 16,000 | 613 |
Portland General Electric Co. | 20,600 | 573 |
TXU Corp. | 3,150 | 216 |
Dominion Resources, Inc. | 2,450 | 207 |
Xcel Energy, Inc. | 9,000 | 194 |
Westar Energy, Inc. | 6,300 | 155 |
WGL Holdings Inc. | 2,600 | 88 |
SCANA Corp. | 1,600 | 62 |
Energen Corp. | 500 | 29 |
Northeast Utilities | 400 | 11 |
|
| 10,763 |
Total Common Stocks |
|
|
(Cost $281,165) |
| 297,677 |
Temporary Cash Investments (0.3%)1 |
|
|
Money Market Fund (0.3%) |
|
|
2 Vanguard Market |
|
|
Liquidity Fund, 5.153% | 748,440 | 748 |
|
|
|
|
|
|
| Face |
|
| Amount |
|
| ($000) |
|
U.S. Agency Obligation (0.0%) |
|
|
3 Federal National Mortgage Assn. |
|
|
4 5.208%, 10/24/07 | 100 | 100 |
Total Temporary Cash Investments |
|
|
(Cost $848) |
| 848 |
Total Investments (99.9%) |
|
|
(Cost $282,013) |
| 298,525 |
Other Assets and Liabilities (0.1%) |
|
|
Other Assets—Note B |
| 383 |
Liabilities |
| (135) |
|
| 248 |
Net Assets (100%) |
| 298,773 |
79
Structured Broad Market Fund
At September 30, 2007, net assets consisted of:5,6 | |
| Amount |
| ($000) |
Paid-in Capital | 276,097 |
Undistributed Net Investment Income | 2,031 |
Accumulated Net Realized Gains | 4,110 |
Unrealized Appreciation |
|
Investment Securities | 16,512 |
Futures Contracts | 23 |
Net Assets | 298,773 |
|
|
|
|
Institutional Shares—Net Assets |
|
Applicable to 488,639 outstanding $.001 |
|
par value shares of beneficial interest |
|
(unlimited authorization) | 14,012 |
Net Asset Value Per Share— |
|
Institutional Shares | $28.67 |
|
|
|
|
Institutional Plus Shares—Net Assets |
|
Applicable to 4,961,791 outstanding $.001 |
|
par value shares of beneficial interest |
|
(unlimited authorization) | 284,761 |
Net Asset Value Per Share— |
|
Institutional Plus Shares | $57.39 |
• See Note A in Notes to Financial Statements.
* Non-income-producing security.
1 The fund invests a portion of its cash reserves in equity markets through the use of index futures contracts. After giving effect to futures investments, the fund’s effective common stock and temporary cash investment positions represent 99.9% and 0%, respectively, of net assets. See Note D in Notes to Financial Statements.
2 Affiliated money market fund available only to Vanguard funds and certain trusts and accounts managed by Vanguard. Rate shown is the 7-day yield.
3 The issuer operates under a congressional charter; its securities are neither issued nor guaranteed by the U.S. government. If needed, access to additional funding from the U.S. Treasury (beyond the issuer’s line of credit) would require congressional action.
4 Securities with a value of $100,000 have been segregated as initial margin for open futures contracts.
5 See Note D in Notes to Financial Statements for the tax-basis components of net assets.
6 See Note F in Notes to Financial Statements.
REIT—Real Estate Investment Trust.
80
Structured Broad Market Fund
Statement of Operations
| October 3, 20061 to |
| September 30, 2007 |
| ($000) |
Investment Income |
|
Income |
|
Dividends | 2,632 |
Interest2 | 94 |
Security Lending | 8 |
Total Income | 2,734 |
Expenses |
|
The Vanguard Group—Note B |
|
Investment Advisory Services | 72 |
Management and Administrative |
|
Institutional Shares | 14 |
Institutional Plus Shares | 92 |
Marketing and Distribution |
|
Institutional Shares | — |
Institutional Plus Shares | 11 |
Custodian Fees | 24 |
Auditing Fees | 21 |
Shareholders’ Reports |
|
Institutional Shares | 1 |
Institutional Plus Shares | 1 |
Total Expenses | 236 |
Expenses Paid Indirectly—Note C | (2) |
Net Expenses | 234 |
Net Investment Income | 2,500 |
Realized Net Gain (Loss) |
|
Investment Securities Sold | 4,505 |
Futures Contracts | (14) |
Realized Net Gain (Loss) | 4,491 |
Unrealized Appreciation (Depreciation) |
|
Investment Securities | 8,160 |
Futures Contracts | 23 |
Unrealized Appreciation (Depreciation) | 8,183 |
Net Increase (Decrease) in Net Assets Resulting from Operations | 15,174 |
1 Commencement of operations as a registered investment company.
2 Interest income from an affiliated company of the fund was $94,000.
81
Structured Broad Market Fund
Statement of Changes in Net Assets
| October 3, 20061 to |
| September 30, 2007 |
| ($000) |
Increase (Decrease) in Net Assets |
|
Operations |
|
Net Investment Income | 2,500 |
Realized Net Gain (Loss) | 4,491 |
Unrealized Appreciation (Depreciation) | 8,183 |
Net Increase (Decrease) in Net Assets Resulting from Operations | 15,174 |
Distributions |
|
Net Investment Income |
|
Institutional Shares | (22) |
Institutional Plus Shares | (447) |
Realized Capital Gain2 |
|
Institutional Shares | (18) |
Institutional Plus Shares | (363) |
Total Distributions | (850) |
Capital Share Transactions—Notes F, G |
|
Institutional Shares | 13,025 |
Institutional Plus Shares | 271,424 |
Net Increase (Decrease) from Capital Share Transactions | 284,449 |
Total Increase (Decrease) | 298,773 |
Net Assets |
|
Beginning of Period | — |
End of Period3 | 298,773 |
1 Commencement of operations as a registered investment company.
2 Includes fiscal 2007 short-term gain distributions totaling $216,000. Short-term gain distributions are treated as ordinary income dividends for tax purposes.
3 Net Assets—End of Period includes undistributed net investment income of $2,031,000.
82
Structured Broad Market Fund
Financial Highlights
Institutional Shares |
|
| November 30, 20061 to |
For a Share Outstanding Throughout the Period | September 30, 2007 |
Net Asset Value, Beginning of Period | $26.59 |
Investment Operations |
|
Net Investment Income | .3612 |
Net Realized and Unrealized Gain (Loss) on Investments | 1.930 |
Total from Investment Operations | 2.291 |
Distributions |
|
Dividends from Net Investment Income | (.116) |
Distributions from Realized Capital Gains | (.095) |
Total Distributions | (.211) |
Net Asset Value, End of Period | $28.67 |
|
|
|
|
Total Return | 8.68% |
|
|
|
|
Ratios/Supplemental Data |
|
Net Assets, End of Period (Millions) | $14 |
Ratio of Total Expenses to Average Net Assets | 0.25%* |
Ratio of Net Investment Income to Average Net Assets | 1.55%* |
Portfolio Turnover Rate | 66% |
1 Inception.
2 Calculated based on average shares outstanding.
* Annualized.
83
Structured Broad Market Fund
Institutional Plus Shares |
|
| October 3, 20061 to |
For a Share Outstanding Throughout the Period | September 30, 2007 |
Net Asset Value, Beginning of Period | $50.00 |
Investment Operations |
|
Net Investment Income | .9042 |
Net Realized and Unrealized Gain (Loss) on Investments | 6.910 |
Total from Investment Operations | 7.814 |
Distributions |
|
Dividends from Net Investment Income | (.234) |
Distributions from Realized Capital Gains | (.190) |
Total Distributions | (.424) |
Net Asset Value, End of Period | $57.39 |
|
|
|
|
Total Return | 15.69% |
|
|
|
|
Ratios/Supplemental Data |
|
Net Assets, End of Period (Millions) | $285 |
Ratio of Total Expenses to Average Net Assets | 0.15%* |
Ratio of Net Investment Income to Average Net Assets | 1.65%* |
Portfolio Turnover Rate | 66% |
1 Commencement of operations as a registered investment company.
2 Calculated based on average shares outstanding.
* Annualized.
See accompanying Notes, which are an integral part of the Financial Statements.
84
Structured Broad Market Fund
Notes to Financial Statements
Vanguard Structured Broad Market Fund is registered under the Investment Company Act of 1940 as an open-end investment company, or mutual fund. The fund files reports with the SEC under the company name Vanguard Quantitative Funds. The fund offers two classes of shares, Institutional Shares and Institutional Plus Shares. Institutional Shares are available to investors who invest a minimum amount of $5 million. Institutional Plus Shares are available to investors who invest a minimum amount of $200 million ($100 million for investors with total Vanguard investments of at least $1 billion).
A. The following significant accounting policies conform to generally accepted accounting principles for U.S. mutual funds. The fund consistently follows such policies in preparing its financial statements.
1. Security Valuation: Securities are valued as of the close of trading on the New York Stock Exchange (generally 4 p.m., Eastern time) on the valuation date. Equity securities are valued at the latest quoted sales prices or official closing prices taken from the primary market in which each security trades; such securities not traded on the valuation date are valued at the mean of the latest quoted bid and asked prices. Securities for which market quotations are not readily available, or whose values have been materially affected by events occurring before the fund’s pricing time but after the close of the securities’ primary markets, are valued by methods deemed by the board of trustees to represent fair value. Investments in Vanguard Market Liquidity Fund are valued at that fund’s net asset value. Temporary cash investments acquired over 60 days to maturity are valued using the latest bid prices or using valuations based on a matrix system (which considers such factors as security prices, yields, maturities, and ratings), both as furnished by independent pricing services. Other temporary cash investments are valued at amortized cost, which approximates market value.
2. Futures Contracts: The fund uses index futures contracts to a limited extent, with the objective of maintaining full exposure to the stock market while maintaining liquidity. The fund may purchase or sell futures contracts to achieve a desired level of investment, whether to accommodate portfolio turnover or cash flows from capital share transactions. The primary risks associated with the use of futures contracts are imperfect correlation between changes in market values of stocks held by the fund and the prices of futures contracts, and the possibility of an illiquid market.
Futures contracts are valued at their quoted daily settlement prices. The aggregate principal amounts of the contracts are not recorded in the Statement of Net Assets. Fluctuations in the value of the contracts are recorded in the Statement of Net Assets as an asset (liability) and in the Statement of Operations as unrealized appreciation (depreciation) until the contracts are closed, when they are recorded as realized futures gains (losses).
3. Federal Income Taxes: The fund intends to qualify as a regulated investment company and distribute all of its taxable income. Accordingly, no provision for federal income taxes is required in the financial statements.
4. Distributions: Distributions to shareholders are recorded on the ex-dividend date.
5. Security Lending: The fund may lend its securities to qualified institutional borrowers to earn additional income. Security loans are required to be secured at all times by collateral at least equal to the market value of securities loaned. The fund invests cash collateral received in Vanguard Market Liquidity Fund, and records a liability for the return of the collateral, during the period the securities are on loan. Security lending income represents the income earned on investing cash collateral, less expenses associated with the loan.
85
Structured Broad Market Fund
6. Other: Dividend income is recorded on the ex-dividend date. Interest income includes income distributions received from Vanguard Market Liquidity Fund and is accrued daily. Security transactions are accounted for on the date securities are bought or sold. Costs used to determine realized gains (losses) on the sale of investment securities are those of the specific securities sold.
Each class of shares has equal rights as to assets and earnings, except that each class separately bears certain class-specific expenses related to maintenance of shareholder accounts (included in Management and Administrative expenses) and shareholder reporting. Marketing and distribution expenses are allocated to each class of shares based on a method approved by the board of trustees. Income, other non-class-specific expenses, and gains and losses on investments are allocated to each class of shares based on its relative net assets.
B. The Vanguard Group furnishes at cost investment advisory, corporate management, administrative, marketing, and distribution services. The costs of such services are allocated to the fund under methods approved by the board of trustees. The fund has committed to provide up to 0.40% of its net assets in capital contributions to Vanguard. At September 30, 2007, the fund had contributed capital of $25,000 to Vanguard (included in Other Assets), representing 0.01% of the fund’s net assets and 0.02% of Vanguard’s capitalization. The fund’s trustees and officers are also directors and officers of Vanguard.
C. The fund’s custodian bank has agreed to reduce its fees when the fund maintains cash on deposit in the non-interest-bearing custody account. For the period ended September 30, 2007, custodian fee offset arrangements reduced the fund’s expenses by $2,000.
D. Distributions are determined on a tax basis and may differ from net investment income and realized capital gains for financial reporting purposes. Differences may be permanent or temporary. Permanent differences are reclassified among capital accounts in the financial statements to reflect their tax character. Temporary differences arise when certain items of income, expense, gain, or loss are recognized in different periods for financial statement and tax purposes; these differences will reverse at some time in the future. Differences in classification may also result from the treatment of short-term gains as ordinary income for tax purposes.
For tax purposes, at September 30, 2007, the fund had $2,156,000 of ordinary income and $4,043,000 of long-term capital gains available for distribution.
At September 30, 2007, the cost of investment securities for tax purposes was $282,013,000. Net unrealized appreciation of investment securities for tax purposes was $16,512,000, consisting of unrealized gains of $25,409,000 on securities that had risen in value since their purchase and $8,897,000 in unrealized losses on securities that had fallen in value since their purchase.
At September 30, 2007, the aggregate settlement value of open futures contracts expiring in December 2007 and the related unrealized appreciation (depreciation) were:
|
|
| ($000) |
|
| Aggregate | Unrealized |
| Number of | Settlement | Appreciation |
Futures Contracts | Long Contracts | Value | (Depreciation) |
S&P 500 Index | 2 | 769 | 22 |
E-mini S&P 500 Index | 4 | 308 | 1 |
Unrealized appreciation (depreciation) on open futures contracts is required to be treated as realized gain (loss) for tax purposes.
86
Structured Broad Market Fund
E. During the period ended September 30, 2007, the fund purchased $292,621,000 of investment securities and sold $102,986,000 of investment securities, other than temporary cash investments.
F. Pursuant to a plan of reorganization approved by the trustee of Vanguard Fiduciary Trust Company Structured Broad Market Trust (the “trust”) on July 18, 2006, the trust purchased shares of the fund through a non-taxable in-kind transfer of all of the trust’s investment securities on October 3, 2006, resulting in the issuance of 1,908,000 fund shares at a net asset value per share of $50.00. The trust’s net assets transferred to the fund were $95,424,000, including net unrealized appreciation of $8,352,000. On October 4, 2006, the trust liquidated by distributing to unitholders shares of the fund equal to the value of the unitholders’ investments in the trust.
G. Capital share transactions for each class of shares were:
| October 3, 20061 to | |
| September 30, 2007 | |
| Amount | Shares |
| ($000) | (000) |
Institutional Shares |
|
|
Issued | 12,985 | 488 |
Issued in Lieu of Cash Distributions | 40 | 1 |
Redeemed | — | — |
Net Increase (Decrease)—Institutional Shares | 13,025 | 489 |
Institutional Plus Shares |
|
|
Issued2 | 278,615 | 5,086 |
Issued in Lieu of Cash Distributions | 809 | 15 |
Redeemed | (8,000) | (139) |
Net Increase (Decrease)—Institutional Plus Shares | 271,424 | 4,962 |
H. In June 2006, the Financial Accounting Standards Board issued Interpretation No. 48 (“FIN 48”), “Accounting for Uncertainty in Income Taxes.” FIN 48 establishes the minimum threshold for recognizing, and a system for measuring, the benefits of tax-return positions in financial statements, and is effective for the fund’s fiscal year beginning October 1, 2007. Management has analyzed the fund’s federal tax positions for the period ended September 30, 2007, for purposes of implementing FIN 48, and has concluded that as of September 30, 2007, no provision for income tax would be required in the fund’s financial statements.
1 Commencement of operations as a registered investment company.
2 Includes shares converted from the net assets of Vanguard Fiduciary Trust Company Structured Broad Market Trust. See Note F in Notes to Financial Statements.
87
Report of Independent Registered
Public Accounting Firm
To the Trustees of Vanguard Quantitative Funds and the Shareholders of Vanguard Structured Large-Cap Equity Fund, Vanguard Structured Large-Cap Growth Fund, Vanguard Structured Large-Cap Value Fund, and Vanguard Structured Broad Market Fund:
In our opinion, the accompanying statements of net assets and the related statements of operations and of changes in net assets and the financial highlights present fairly, in all material respects, the financial position of Vanguard Structured Large-Cap Equity Fund, Vanguard Structured Large-Cap Growth Fund, Vanguard Structured Large-Cap Value Fund, and Vanguard Structured Broad Market Fund (the “Funds”) at September 30, 2007, and the results of each of their operations, changes in each of their net assets and the financial highlights for each of the periods indicated, in conformity with accounting principles generally accepted in the United States of America. These financial statements and financial highlights (hereafter referred to as “financial statements”) are the responsibility of the Funds’ management; our responsibility is to express an opinion on these financial statements based on our audits. We conducted our audits of these financial statements in accordance with the standards of the Public Company Accounting Oversight Board (United States), which require that we plan and perform the audit to obtain reasonable assurance about whether the financial statements are free of material misstatement. An audit includes examining, on a test basis, evidence supporting the amounts and disclosures in the financial statements, assessing the accounting principles used and significant estimates made by management, and evaluating the overall financial statement presentation. We believe that our audits, which included confirmation of securities at September 30, 2007 by correspondence with the custodian and broker, and by agreement to the underlying ownership records for Vanguard Market Liquidity Fund, provide a reasonable basis for our opinion.
PricewaterhouseCoopers LLP
Philadelphia, Pennsylvania
November 7, 2007
88
Special 2007 tax information (unaudited) for Vanguard Structured Equity Funds
This information for the fiscal period ended September 30, 2007, is included pursuant to provisions of the Internal Revenue Code.
The funds distributed capital gain dividends to shareholders during the fiscal period as follows:
| Qualified Dividend Income |
Fund | ($000) |
Structured Large-Cap Equity | 4,695 |
Structured Large-Cap Growth | 158 |
Structured Large-Cap Value | 0 |
Structured Broad Market | 458 |
For corporate shareholders, the percentage of investment income (dividend income plus short-term gains, if any) that qualifies for the dividends-received deduction is as follows:
Fund | Percentage |
Structured Large-Cap Equity | 71.0% |
Structured Large-Cap Growth | 54.5 |
Structured Large-Cap Value | 44.3 |
Structured Broad Market | 87.6 |
The funds distributed capital gain dividends (from net long-term capital gains) to shareholders during the fiscal period as follows:
| Long-Term Capital |
| Gain Dividends |
Fund | ($000) |
Structured Large-Cap Equity | 4 |
Structured Large-Cap Growth | 0 |
Structured Large-Cap Value | 0 |
Structured Broad Market | 164 |
89
About Your Fund’s Expenses
As a shareholder of the fund, you incur ongoing costs, which include costs for portfolio management, administrative services, and shareholder reports (like this one), among others. Operating expenses, which are deducted from a fund’s gross income, directly reduce the investment return of the fund.
A fund’s expenses are expressed as a percentage of its average net assets. This figure is known as the expense ratio. The following examples are intended to help you understand the ongoing costs (in dollars) of investing in your fund and to compare these costs with those of other mutual funds. The examples are based on an investment of $1,000 made at the beginning of the period shown and held for the entire period.
The table on page 68 illustrates your fund’s costs in two ways:
• Based on actual fund return. This section helps you to estimate the actual expenses that you paid over the period. The “Ending Account Value” shown is derived from the fund’s actual return, and the third column shows the dollar amount that would have been paid by an investor who started with $1,000 in the fund. You may use the information here, together with the amount you invested, to estimate the expenses that you paid over the period.
To do so, simply divide your account value by $1,000 (for example, an $8,600 account value divided by $1,000 = 8.6), then multiply the result by the number given for your fund under the heading “Expenses Paid During Period.”
• Based on hypothetical 5% yearly return. This section is intended to help you compare your fund’s costs with those of other mutual funds. It assumes that the fund had a yearly return of 5% before expenses, but that the expense ratio is unchanged. In this case—because the return used is not the fund’s actual return—the results do not apply to your investment. The example is useful in making comparisons because the Securities and Exchange Commission requires all mutual funds to calculate expenses based on a 5% return. You can assess your fund’s costs by comparing this hypothetical example with the hypothetical examples that appear in shareholder reports of other funds.
90
Six Months Ended September 30, 20071 |
|
|
|
| Beginning | Ending | Expenses |
| Account Value | Account Value | Paid During |
| 3/31/2007 | 9/30/2007 | Period2 |
Based on Actual Fund Return |
|
|
|
Structured Large-Cap Equity Fund |
|
|
|
Institutional Shares | $1,000.00 | $1,076.48 | $1.30 |
Institutional Plus Shares | 1,000.00 | 1,076.98 | 0.78 |
Structured Large-Cap Growth Fund |
|
|
|
Institutional Plus Shares | $1,000.00 | $1,103.70 | $0.79 |
Structured Large-Cap Value Fund |
|
|
|
Institutional Plus Shares | $1,000.00 | $1,046.71 | $0.77 |
Structured Broad Market Fund |
|
|
|
Institutional Shares | $1,000.00 | $1,056.76 | $1.29 |
Institutional Plus Shares | 1,000.00 | 1,057.49 | 0.77 |
Based on Hypothetical 5% Yearly Return |
|
|
|
Structured Large-Cap Equity Fund |
|
|
|
Institutional Shares | $1,000.00 | $1,023.82 | $1.27 |
Institutional Plus Shares | 1,000.00 | 1,024.32 | 0.76 |
Structured Large-Cap Growth Fund |
|
|
|
Institutional Plus Shares | $1,000.00 | $1,024.32 | $0.76 |
Structured Large-Cap Value Fund |
|
|
|
Institutional Plus Shares | $1,000.00 | $1,024.32 | $0.76 |
Structured Broad Market Fund |
|
|
|
Institutional Shares | $1,000.00 | $1,023.82 | $1.27 |
Institutional Plus Shares | 1,000.00 | 1,024.32 | 0.76 |
Note that the expenses shown in the table are meant to highlight and help you compare ongoing costs only and do not reflect transaction costs incurred by the fund for buying and selling securities. Your fund does not charge transaction fees, such as purchase or redemption fees, nor does it carry a “sales load.”
The calculations assume no shares were bought or sold during the period. Your actual costs may have been higher or lower, depending on the amount of your investment and the timing of any purchases or redemptions.
You can find more information about the fund’s expenses, including annual expense ratios, in the Financial Statements section of this report. For additional information on operating expenses and other shareholder costs, please refer to your fund’s current prospectus.
1 Results are shown only for share classes that have existed for at least six months.
2 The calculations are based on expenses incurred in the most recent six-month period. The funds’ annualized six-month expense ratios for that period are: for the Structured Large-Cap Equity Fund, 0.25% for Institutional Shares and 0.15% for Institutional Plus Shares; for the Structured Large-Cap Growth Fund, 0.15% for Institutional Plus Shares; for the Structured Large-Cap Value Fund, 0.15% for Institutional Plus Shares; for the Structured Broad Market Fund, 0.25% for Institutional Shares and 0.15% for Institutional Plus Shares. The dollar amounts shown as “Expenses Paid” are equal to the annualized expense ratio multiplied by the average account value over the period, multiplied by the number of days in the most recent six-month period, then divided by the number of days in the most recent 12-month period.
91
Glossary
Earnings Growth Rate. The average annual rate of growth in earnings over the past five years for the stocks now in a fund.
Equity Exposure. A measure that reflects a fund’s investments in stocks and stock futures. Any holdings in short-term reserves are excluded.
Expense Ratio. The percentage of a fund’s average net assets used to pay its annual administrative and advisory expenses. These expenses directly reduce returns to investors.
Foreign Holdings. The percentage of a fund represented by stocks or depositary receipts of companies based outside the United States.
Median Market Cap. An indicator of the size of companies in which a fund invests; the midpoint of market capitalization (market price x shares outstanding) of a fund’s stocks, weighted by the proportion of the fund’s assets invested in each stock. Stocks representing half of the fund’s assets have market capitalizations above the median, and the rest are below it.
Price/Book Ratio. The share price of a stock divided by its net worth, or book value, per share. For a fund, the weighted average price/book ratio of the stocks it holds.
Price/Earnings Ratio. The ratio of a stock’s current price to its per-share earnings over the past year. For a fund, the weighted average P/E of the stocks it holds. P/E is an indicator of market expectations about corporate prospects; the higher the P/E, the greater the expectations for a company’s future growth.
Return on Equity. The annual average rate of return generated by a company during the past five years for each dollar of shareholder’s equity (net income divided by shareholder’s equity). For a fund, the weighted average return on equity for the companies whose stocks it holds.
Short-Term Reserves. The percentage of a fund invested in highly liquid, short-term securities that can be readily converted to cash.
Turnover Rate. An indication of the fund’s trading activity. Funds with high turnover rates incur higher transaction costs and may be more likely to distribute capital gains (which may be taxable to investors). The turnover rate excludes in-kind transactions, which have minimal impact on costs.
Yield. A snapshot of a fund’s income from interest and dividends. The yield, expressed as a percentage of the fund’s net asset value, is based on income earned over the past 30 days and is annualized, or projected forward for the coming year. The index yield is based on the current annualized rate of income provided by securities in the index.
92
This page intentionally left blank.
This page intentionally left blank.
The People Who Govern Your Fund
The trustees of your mutual fund are there to see that the fund is operated and managed in your best interests since, as a shareholder, you are a part owner of the fund. Your fund’s trustees also serve on the board of directors of The Vanguard Group, Inc., which is owned by the Vanguard funds and provides services to them on an at-cost basis.
A majority of Vanguard’s board members are independent, meaning that they have no affiliation with Vanguard or the funds they oversee, apart from the sizable personal investments they have made as private individuals.
Our independent board members bring distinguished backgrounds in business, academia, and public service to their task of working with Vanguard officers to establish the policies and oversee the activities of the funds. Among board members’ responsibilities are selecting investment advisors for the funds; monitoring fund operations, performance, and costs; reviewing contracts; nominating and selecting new trustees/directors; and electing Vanguard officers.
Each trustee serves a fund until its termination; or until the trustee’s retirement, resignation, or death; or otherwise as specified in the fund’s organizational documents. Any trustee may be removed at a shareholders’ meeting by a vote representing two-thirds of the net asset value of all shares of the fund together with shares of other Vanguard funds organized within the same trust. The table on these two pages shows information for each trustee and executive officer of the fund. The mailing address of the trustees and officers is P.O. Box 876, Valley Forge, PA 19482.
Chairman of the Board, Chief Executive Officer, and Trustee | |
|
|
John J. Brennan1 |
|
Born 1954 | Principal Occupation(s) During the Past Five Years: Chairman of the Board, Chief Executive |
Trustee since May 1987; | Officer, and Director/Trustee of The Vanguard Group, Inc., and of each of the investment |
Chairman of the Board and | companies served by The Vanguard Group. |
Chief Executive Officer |
|
148 Vanguard Funds Overseen |
|
|
|
Independent Trustees |
|
|
|
Charles D. Ellis |
|
Born 1937 | Principal Occupation(s) During the Past Five Years: Applecore Partners (pro bono ventures |
Trustee since January 2001 | in education); Senior Advisor to Greenwich Associates (international business strategy |
148 Vanguard Funds Overseen | consulting); Successor Trustee of Yale University; Overseer of the Stern School of Business |
| at New York University; Trustee of the Whitehead Institute for Biomedical Research. |
|
|
Rajiv L. Gupta |
|
Born 1945 | Principal Occupation(s) During the Past Five Years: Chairman, President, and |
Trustee since December 20012 | Chief Executive Officer of Rohm and Haas Co. (chemicals); Board Member of |
148 Vanguard Funds Overseen | the American Chemistry Council; Director of Tyco International, Ltd. (diversified |
| manufacturing and services) since 2005; Trustee of Drexel University and of the |
| Chemical Heritage Foundation. |
|
|
Amy Gutmann |
|
Born 1949 | Principal Occupation(s) During the Past Five Years: President of the University of |
Trustee since June 2006 | Pennsylvania since 2004; Professor in the School of Arts and Sciences, Annenberg School |
148 Vanguard Funds Overseen | for Communication, and Graduate School of Education of the University of Pennsylvania |
| since 2004; Provost (2001–2004) and Laurance S. Rockefeller Professor of Politics and |
| the University Center for Human Values (1990–2004), Princeton University; Director of |
| Carnegie Corporation of New York since 2005 and of Schuylkill River Development |
| Corporation and Greater Philadelphia Chamber of Commerce since 2004. |
JoAnn Heffernan Heisen |
|
Born 1950 | Principal Occupation(s) During the Past Five Years: Corporate Vice President and |
Trustee since July 1998 | Chief Global Diversity Officer since 2006, Vice President and Chief Information |
148 Vanguard Funds Overseen | Officer (1997–2005), and Member of the Executive Committee of Johnson & |
| Johnson (pharmaceuticals/consumer products); Director of the University Medical |
| Center at Princeton and Women’s Research and Education Institute. |
|
|
André F. Perold |
|
Born 1952 | Principal Occupation(s) During the Past Five Years: George Gund Professor of Finance |
Trustee since December 2004 | and Banking, Harvard Business School; Senior Associate Dean, Director of Faculty |
148 Vanguard Funds Overseen | Recruiting, and Chair of Finance Faculty, Harvard Business School; Director and Chairman |
| of UNX, Inc. (equities trading firm) since 2003; Chair of the Investment Committee of |
| HighVista Strategies LLC (private investment firm) since 2005. |
|
|
Alfred M. Rankin, Jr. |
|
Born 1941 | Principal Occupation(s) During the Past Five Years: Chairman, President, Chief Executive |
Trustee since January 1993 | Officer, and Director of NACCO Industries, Inc. (forklift trucks/housewares/lignite); Director |
148 Vanguard Funds Overseen | of Goodrich Corporation (industrial products/aircraft systems and services). |
|
|
|
|
J. Lawrence Wilson |
|
Born 1936 | Principal Occupation(s) During the Past Five Years: Retired Chairman and Chief Executive |
Trustee since April 1985 | Officer of Rohm and Haas Co. (chemicals); Director of Cummins Inc. (diesel engines) and |
148 Vanguard Funds Overseen | AmerisourceBergen Corp. (pharmaceutical distribution); Trustee of Vanderbilt University |
| and of Culver Educational Foundation. |
|
|
Executive Officers1 |
|
|
|
Thomas J. Higgins |
|
Born 1957 | Principal Occupation(s) During the Past Five Years: Principal of The Vanguard Group, Inc.; |
Treasurer since July 1998 | Treasurer of each of the investment companies served by The Vanguard Group. |
148 Vanguard Funds Overseen |
|
|
|
|
|
Heidi Stam |
|
Born 1956 | Principal Occupation(s) During the Past Five Years: Managing Director of The Vanguard |
Secretary since July 2005 | Group, Inc., since 2006; General Counsel of The Vanguard Group since 2005; Secretary of |
148 Vanguard Funds Overseen | The Vanguard Group, and of each of the investment companies served by The Vanguard |
| Group, since 2005; Principal of The Vanguard Group (1997–2006). |
Vanguard Senior Management Team |
|
| |
|
|
|
|
R. Gregory Barton | Kathleen C. Gubanich | F. William McNabb, III | Ralph K. Packard |
Mortimer J. Buckley | Paul A. Heller | Michael S. Miller | George U. Sauter |
Founder |
|
John C. Bogle |
Chairman and Chief Executive Officer, 1974–1996 |
1 Officers of the funds are “interested persons” as defined in the Investment Company Act of 1940.
2 December 2002 for Vanguard Equity Income Fund, Vanguard Growth Equity Fund, the Vanguard Municipal Bond Funds, and the Vanguard State Tax-Exempt Funds.
More information about the trustees is in the Statement of Additional Information, available from The Vanguard Group.

P.O. Box 2600
Valley Forge, PA 19482-2600
Connect with Vanguard® > www.vanguard.com
Fund Information > 800-662-7447 | Vanguard, Connect with Vanguard, and the ship logo are |
| trademarks of The Vanguard Group, Inc. |
Direct Investor Account Services > 800-662-2739 |
|
| All other marks are the exclusive property of their |
Institutional Investor Services > 800-523-1036 | respective owners. |
|
|
Text Telephone for People |
|
With Hearing Impairment > 800-952-3335 | All comparative mutual fund data are from Lipper Inc. |
| or Morningstar, Inc., unless otherwise noted. |
|
|
|
|
| You can obtain a free copy of Vanguard’s proxy voting |
| guidelines by visiting our website, www.vanguard.com, |
This material may be used in conjunction | and searching for “proxy voting guidelines,” or by |
with the offering of shares of any Vanguard | calling Vanguard at 800-662-2739. The guidelines are |
fund only if preceded or accompanied by | also available from the SEC’s website, www.sec.gov. |
the fund’s current prospectus. | In addition, you may obtain a free report on how your |
| fund voted the proxies for securities it owned during |
| the 12 months ended June 30. To get the report, visit |
| either www.vanguard.com or www.sec.gov. |
|
|
|
|
|
|
| You can review and copy information about your fund |
| at the SEC’s Public Reference Room in Washington, D.C. |
| To find out more about this public service, call the SEC |
| at 202-551-8090. Information about your fund is also |
| available on the SEC’s website, and you can receive |
| copies of this information, for a fee, by sending a |
| request in either of two ways: via e-mail addressed to |
| publicinfo@sec.gov or via regular mail addressed to the |
| Public Reference Section, Securities and Exchange |
| Commission, Washington, DC 20549-0102. |
|
|
|
|
|
|
|
|
|
|
| © 2007 The Vanguard Group, Inc. |
| All rights reserved. |
| Vanguard Marketing Corporation, Distributor. |
|
|
| Q08700 112007 |
Item 2: Code of Ethics. The Registrant has adopted a code of ethics that applies to the Registrant’s principal executive officer, principal financial officer, principal accounting officer or controller or persons performing similar functions. The Code of Ethics was amended during the reporting period covered by this report to make certain technical, non-material changes.
Item 3: Audit Committee Financial Expert. The following members of the Audit Committee have been determined by the Registrant’s Board of Trustees to be Audit Committee Financial Experts serving on its Audit Committee, and to be independent: Charles D. Ellis, Rajiv L. Gupta, JoAnn Heffernan Heisen, André F. Perold, Alfred M. Rankin, Jr., and J. Lawrence Wilson.
Item 4: Principal Accountant Fees and Services.
(a) Audit Fees.
Audit Fees of the Registrant
Fiscal Year Ended September 30, 2007: $113,000
Fiscal Year Ended September 30, 2006: $42,000
Aggregate Audit Fees of Registered Investment Companies in the Vanguard Group.
Fiscal Year Ended September 30, 2007: $2,835,320
Fiscal Year Ended September 30, 2006: $2,347,620
(b) Audit-Related Fees.
Fiscal Year Ended September 30, 2007: $630,400
Fiscal Year Ended September 30, 2006: $530,000
Includes fees billed in connection with assurance and related services provided to the Registrant, The Vanguard Group, Inc., Vanguard Marketing Corporation, and other registered investment companies in the Vanguard Group.
(c) Tax Fees.
Fiscal Year Ended September 30, 2007: $215,900
Fiscal Year Ended September 30, 2006: $101,300
Includes fees billed in connection with tax compliance, planning and advice services provided to the Registrant, The Vanguard Group, Inc., Vanguard Marketing Corporation, and other registered investment companies in the Vanguard Group and related to income and excise taxes.
(d) All Other Fees.
Fiscal Year Ended September 30, 2007: $0
Fiscal Year Ended September 30, 2006: $0
Includes fees billed for services related to risk management and privacy matters. Services were provided to the Registrant, The Vanguard Group, Inc., Vanguard Marketing Corporation, and other registered investment companies in the Vanguard Group.
(e) (1) Pre-Approval Policies. The policy of the Registrant’s Audit Committee is to consider and, if appropriate, approve before the principal accountant is engaged for such services, all specific audit and non-audit services provided to: (1) the Registrant; (2) The Vanguard Group, Inc.; (3) other entities controlled by The Vanguard Group, Inc. that provide ongoing services to the Registrant; and (4) other registered investment companies in the Vanguard Group. In making a determination, the Audit Committee considers whether the services are consistent with maintaining the principal accountant’s independence.
In the event of a contingency situation in which the principal accountant is needed to provide services in between scheduled Audit Committee meetings, the Chairman of the Audit Committee would be called on to consider and, if appropriate, pre-approve audit or permitted non-audit services in an amount sufficient to complete services through the next Audit Committee meeting, and to determine if such services would be consistent with maintaining the accountant’s independence. At the next scheduled Audit Committee meeting, services and fees would be presented to the Audit Committee for formal consideration, and, if appropriate, approval by the entire Audit Committee. The Audit Committee would again consider whether such services and fees are consistent with maintaining the principal accountant’s independence.
The Registrant’s Audit Committee is informed at least annually of all audit and non-audit services provided by the principal accountant to the Vanguard complex, whether such services are provided to: (1) the Registrant; (2) The Vanguard Group, Inc.; (3) other entities controlled by The Vanguard Group, Inc. that provide ongoing services to the Registrant; or (4) other registered investment companies in the Vanguard Group.
(2) No percentage of the principal accountant’s fees or services were approved pursuant to the waiver provision of paragraph (c)(7)(i)(C) of Rule 2-01 of Regulation S-X.
(f) For the most recent fiscal year, over 50% of the hours worked under the principal accountant’s engagement were not performed by persons other than full-time, permanent employees of the principal accountant.
(g) Aggregate Non-Audit Fees.
Fiscal Year Ended September 30, 2007: $215,900
Fiscal Year Ended September 30, 2006: $101,300
Includes fees billed for non-audit services provided to the Registrant, The Vanguard Group, Inc., Vanguard Marketing Corporation, and other registered investment companies in the Vanguard Group.
(h) For the most recent fiscal year, the Audit Committee has determined that the provision of all non-audit services was consistent with maintaining the principal accountant’s independence.
Item 5: Not Applicable.
Item 6: Not Applicable.
Item 7: Not Applicable.
Item 8: Not Applicable.
Item 9: Not Applicable.
Item 10: Not Applicable.
Item 11: Controls and Procedures.
(a) Disclosure Controls and Procedures. The Principal Executive and Financial Officers concluded that the Registrant's Disclosure Controls and Procedures are effective based on their evaluation of the Disclosure Controls and Procedures as of a date within 90 days of the filing date of this report.
(b) Internal Control Over Financial Reporting. There were no significant changes in Registrant’s Internal Control Over Financial Reporting or in other factors that could significantly affect this control subsequent to the date of the evaluation, including any corrective actions with regard to significant deficiencies and material weaknesses.
Item 12: Exhibits.
(a) Code of Ethics.
(b) Certifications.
Pursuant to the requirements of the Securities Exchange Act of 1934 and the Investment Company Act of 1940, the registrant has duly caused this report to be signed on its behalf by the undersigned, thereunto duly authorized.
VANGUARD QUANTITATIVE FUNDS | |
BY: |
|
| |
| (HEIDI STAM) |
| JOHN J. BRENNAN* |
| CHIEF EXECUTIVE OFFICER |
Date: November 14, 2007
Pursuant to the requirements of the Securities Exchange Act of 1934 and the Investment Company Act of 1940, this report has been signed below by the following persons on behalf of the registrant and in the capacities and on the dates indicated.
VANGUARD QUANTITATIVE FUNDS | |
BY: |
|
| |
| (HEIDI STAM) |
| JOHN J. BRENNAN* |
| CHIEF EXECUTIVE OFFICER |
Date: November 14, 2007
VANGUARD QUANTITATIVE FUNDS | |
BY: |
|
| |
| (HEIDI STAM) |
| THOMAS J. HIGGINS* |
| TREASURER |
Date: November 14, 2007
*By Power of Attorney. See File Number 333-145624, filed on August 22, 2007. Incorporated by Reference.