UNITED STATES
SECURITIES AND EXCHANGE COMMISSION
Washington, D.C. 20549
FORM N-CSR
CERTIFIED SHAREHOLDER REPORT
OF
REGISTERED MANAGEMENT INVESTMENT COMPANIES
Investment Company Act file number: 811-4526
Name of Registrant: Vanguard Quantitative Funds
Address of Registrant:
P.O. Box 2600
Valley Forge, PA 19482
Name and address of agent for service:
Heidi Stam, Esquire
P.O. Box 876
Valley Forge, PA 19482
Registrant’s telephone number, including area code: (610) 669-1000
Date of fiscal year end: September 30
Date of reporting period: October 1, 2007–September 30, 2008
Item 1: Reports to Shareholders |
> Over a turbulent 12 months, Vanguard Growth and Income Fund Investor Shares returned –23.3%.
> The fund’s return slightly lagged its benchmark index and the average return of its peer group.
> Relative to its benchmark, the fund’s health care, materials, and consumer staples stocks were its weakest performers.
Contents |
|
|
|
Your Fund’s Total Returns | 1 |
President’s Letter | 2 |
Advisor’s Report | 7 |
Fund Profile | 9 |
Performance Summary | 10 |
Financial Statements | 12 |
Your Fund’s After-Tax Returns | 24 |
About Your Fund’s Expenses | 25 |
Trustees Approve Advisory Agreement | 27 |
Glossary | 28 |
Please note: The opinions expressed in this report are just that—informed opinions. They should not be considered promises or advice. Also, please keep in mind that the information and opinions cover the period through the date on the front of this report. Of course, the risks of investing in your fund are spelled out in the prospectus.
Your Fund’s Total Returns
Fiscal Year Ended September 30, 2008 |
|
|
| Ticker | Total |
| Symbol | Returns |
Vanguard Growth and Income Fund |
|
|
Investor Shares | VQNPX | –23.3% |
Admiral™ Shares1 | VGIAX | –23.2 |
S&P 500 Index |
| –22.0 |
Average Large-Cap Core Fund2 |
| –22.0 |
Your Fund’s Performance at a Glance | ||||
September 30, 2007–September 30, 2008 | ||||
|
|
| Distributions Per Share | |
| Starting | Ending | Income | Capital |
| Share Price | Share Price | Dividends | Gains |
Vanguard Growth and Income Fund |
|
|
|
|
Investor Shares | $38.62 | $25.84 | $0.560 | $4.008 |
Admiral Shares | 63.08 | 42.20 | 0.985 | 6.545 |
1 A lower-cost class of shares available to many longtime shareholders and to those with significant investments in the fund.
2 Derived from data provided by Lipper Inc.
1

President’s Letter
Dear Shareholder,
During the fiscal year ended September 30, the Investor Shares of Vanguard Growth and Income Fund returned a disappointing –23.3%, while the lower-cost Admiral Shares returned –23.2%, slightly below the –22.0% return of the Standard & Poor’s 500 Index, the fund’s primary benchmark, and the average return of large-capitalization core mutual funds.
The tumultuous market during the past 12 months, particularly in September, was challenging for the Growth and Income Fund, an actively managed quantitative fund that seeks to outperform its benchmark index while matching the index’s risk characteristics. The fund fell short of this goal during the past year, largely because of subpar stock selections in the health care, materials, and consumer staples sectors that weighed on the fund’s overall performance.
If you own the Growth and Income Fund in a taxable account, see page 24 for a report on the fund’s after-tax returns for the 12 months ended September 30.
Credit-market turbulence weighed heavily on stock prices
Troubles simmering in the credit markets for much of the past year came to a boil at the end of the fiscal period, producing several high-profile bankruptcies and putting severe pressure on stock prices around the world. The broad U.S. stock market returned –21.2% for the 12 months
2
ended September 30. In September alone, stock prices fell more than –9%. International stock markets were similarly disappointing, returning –30.0% for the full 12 months.
Policymakers and elected officials, both in the United States and abroad, responded to the upheavals with dramatic new programs designed to help stabilize the credit markets. As participants struggled to make sense of the markets’ fast-changing dynamics, stock prices were exceptionally volatile, with daily ups and downs of 2 percentage points or more becoming commonplace.
U.S. Treasuries rallied in a nervous market
Nervousness in the stock market was echoed, and even amplified, in the bond market. For the 12 months, the broad U.S. bond market returned 3.7%, largely on the strength of Treasuries—investors’ security of choice in times of duress. Corporate bonds generally produced negative returns for the period, coming under heavy selling pressure during investors’ flight to safety. Even the municipal market, made up of generally high-quality securities issued by states and municipalities, recorded a negative 12-month return.
The U.S. Federal Reserve Board responded to the turmoil with a dramatic easing of monetary policy. Over the full 12 months, the Fed reduced its target for the federal
Market Barometer |
|
|
|
| Average Annual Total Returns | ||
| Periods Ended September 30, 2008 | ||
| One Year | Three Years | Five Years |
Stocks |
|
|
|
Russell 1000 Index (Large-caps) | –22.1% | 0.1% | 5.5% |
Russell 2000 Index (Small-caps) | –14.5 | 1.8 | 8.1 |
Dow Jones Wilshire 5000 Index (Entire market) | –21.2 | 0.6 | 6.0 |
MSCI All Country World Index ex USA (International) | –30.0 | 3.1 | 11.8 |
|
|
|
|
|
|
|
|
Bonds |
|
|
|
Lehman U.S. Aggregate Bond Index (Broad taxable market) | 3.7% | 4.2% | 3.8% |
Lehman Municipal Bond Index | –1.9 | 1.9 | 2.8 |
Citigroup 3-Month Treasury Bill Index | 2.6 | 4.0 | 3.1 |
|
|
|
|
|
|
|
|
CPI |
|
|
|
Consumer Price Index | 4.9% | 3.2% | 3.4% |
3
funds rate from 4.75% to 2.00%. On October 8, shortly after the close of the fiscal period, the Fed cut rates again, to 1.50%. The move was made in coordination with rate cuts by several other central banks.
Fund’s poor stock selection hurt performance
Vanguard Growth and Income Fund’s advisor, Franklin Portfolio Associates, LLC, seeks to outperform the S&P 500 Index by relying on stock-selection models that overweight and underweight individual stocks relative to the index while closely mirroring the index’s sector weightings.
In this challenging market environment, the fund fell short of this goal. The benchmark suffered a double-digit decline, and the fund finished the period a few steps behind. Although trailing the index overall, the fund outperformed it in some sectors. For example, in information technology, the fund’s selections finished 11 percentage points ahead of the index’s tech stocks. In financials, although both the fund and benchmark sustained steep losses, the advisor slightly moderated the decline by avoiding some of the hardest-hit companies, including Freddie Mac, Fannie Mae, and Lehman Brothers Holdings.
During the fiscal year, the Growth and Income Fund’s biggest challenges in seeking to outpace its benchmark lay in the health care, materials, and consumer staples sectors. In health care, the fund’s subpar stock picks left it underweighted in the few pharmaceutical and biotech stocks
Expense Ratios1 |
|
|
| |
Your Fund Compared With Its Peer Group |
|
|
| |
|
|
|
| Average |
|
| Investor | Admiral | Large-Cap |
|
| Shares | Shares | Core Fund |
Growth and Income Fund | 0.32% | 0.18% | 1.29% | |
1 The fund expense ratios shown are from the prospectus dated January 28, 2008. For the fiscal year ended September 30, 2008, the fund’s expense ratios were 0.31% for Investor Shares and 0.16% for Admiral Shares. The peer-group expense ratio is derived from data provided by Lipper Inc. and captures information through year-end 2007.
4
that posted gains during the period. The fund’s materials holdings suffered because of the weakness in metals and mining stocks. For example, the fund’s largest materials investment, Freeport-McMoRan Copper & Gold, a leading international mining company based in Arizona, registered one of the sector’s worst yearly returns (–45%). Lastly, the fund’s consumer staples holdings were overweighted in stocks that performed poorly, mainly beverage companies like Pepsi Bottling Group.
The fund has benefited long-term investors
Over the past ten years (a period that included two bear markets), the Growth and Income Fund has returned an annualized 3.4%, slightly higher than the results of the S&P 500 Index and almost a full percentage point more than the average return of large-cap core mutual funds.
The fund’s performance edge comes both from its advisor’s stock-selection skills and the fund’s low costs. The advisor seeks to outperform the index without taking on additional risk. When stocks struggle, as they have recently, the fund will struggle, too. Over time, however, the fund’s risk-controlled stock-selection strategies have enhanced performance, while the fund’s low expenses have helped ensure that investors keep more of their returns in both good and bad market conditions.
A long-term perspective is key in uncertain markets
The past year’s unsettled market has left many investors disappointed and uncertain about their investments.
Total Returns |
|
Ten Years Ended September 30, 2008 |
|
| Average |
| Annual Return |
Growth and Income Fund | 3.4% |
S&P 500 Index | 3.1 |
Average Large-Cap Core Fund1 | 2.4 |
The figures shown represent past performance, which is not a guarantee of future results. (Current performance may be lower or higher than the performance data cited. For performance data current to the most recent month-end, visit our website at www.vanguard.com/performance.) Note, too, that both investment returns and principal value can fluctuate widely, so an investor’s shares, when sold, could be worth more or less than their original cost.
1 Derived from data provided by Lipper Inc.
5
The stock market’s volatility has been dramatic, but a long-term perspective suggests that the financial markets’ sudden, unpredictable movements are an unavoidable trade-off for the potential to earn long-term returns superior to those of lower-risk assets. In such uncertain times, seasoned investors understand that panic is not the answer.
The best response to uncertainty is diversification both within and across asset classes, which is why we counsel investors to hold a broadly diversified portfolio of stocks and fixed income investments in proportions consistent with their goals, risk tolerance, and time horizon.
During the past 12 months, of course, even balanced portfolios of stocks and bonds have faced tough times, although they've outperformed many all-stock portfolios. Everything that history has taught us about the markets, however, suggests that these principles can put you in the best position to achieve long-term investment success. Vanguard Growth and Income Fund can play a valuable role in such a portfolio.
Thank you for entrusting your assets to Vanguard.
Sincerely,

F. William McNabb III
President and Chief Executive Officer
October 15, 2008
6
Advisor’s Report
A turbulent market environment
During the 12 months ended September 30, 2008, the U.S. stock market declined significantly. Although early in the period investors had hopes that rising delinquency and default rates on subprime home mortgages would remain an isolated issue and that the Federal Reserve Board’s rate cuts, which began last September, would help to stimulate the economy, such optimism proved unfounded.
The slow-motion credit crisis actually began in summer 2007, but gained speed in March 2008 when Bear Stearns was taken over by JPMorgan Chase and the U.S. Treasury. Financial stocks suffered through the rest of the first half of 2008, but in the third quarter IndyMac, Fannie Mae, Freddie Mac, Lehman Brothers Holdings, Merrill Lynch, American International Group, Washington Mutual, and Wachovia all either failed or required rescues of one kind or another.
Remarkably, the rest of the financial sector rebounded in the third quarter in anticipation of U.S. government assistance. This resulted in the extraordinary outcome that, despite the headline-grabbing failures, financial services was the strongest sector in the Standard & Poor’s 500 Index—the Growth and Income Fund’s benchmark—for the three months; however, financials was the index’s poorest-performing group for the full fiscal year.
We do not foresee a quick recovery from the current credit crisis. Banks do not have adequate capital to substitute for the disappearance of so much of the “shadow” banking system (commercial paper and asset-backed debt issuance). Also, for many banks, capital has been impaired and needs to be rebuilt. The deleveraging of the economy—even if the immediate crisis were solved today—will continue to reverberate through the system as financial and corporate deleveraging makes its way down to individual deleveraging. The slowdown that nine months ago was being called a “recession without layoffs” is certain to become a more traditional recession before long. On the positive side, it could eventually be an opportunity for patient capital to acquire high-quality assets at depressed prices.
Positive contributions from technology stocks and sector tilts
Stock selection in the fund over the past 12 months was strongest in the information technology sector. Tech stocks that generated positive returns relative to their index groupings include the following companies: Apple, which saw strong iPhone, iPod, and Macintosh sales during the year; Applied Materials, which had a difficult year but benefited from investor optimism about growth in its solar power and display businesses; and QUALCOMM, which settled its long-running patent dispute with Nokia. In other sectors, property insurer Chubb and pharmacy benefits provider Express Scripts outperformed their peers and also contributed to the fund’s performance.
7
Although we deliberately minimize the fund’s sector tilts (measured as the difference between the portfolio weighting and the S&P 500 Index weighting in a particular sector), we do not force the tilts to zero. During the previous 12 months, the fund’s small overweighting in energy and small underweighting in financials and telecommunication services contributed positively to the portfolio’s relative return. In addition, the fund’s tilt toward stocks with less leverage helped performance.
Stock-ranking process underperformed
The fund underperformed the S&P 500 Index for the full fiscal year primarily owing to the portfolio’s poor performance in fourth-quarter 2007. Year-to-date, the fund outpaced the index despite the turbulent market environment. Our stock-ranking process emphasizes stocks with positive value and growth/momentum characteristics. Over the full fiscal year, including our weak start, these types of stocks underperformed their average historical rate of return.
Holdings that weakened results included several financial stocks that were hurt by the mortgage crisis, such as Citigroup and Fifth Third Bancorp. At the same time, the fund either didn’t own, or held less than the benchmark weighting of, several financial stocks that performed relatively better, including Wells Fargo and U.S. Bancorp. In other sectors, oil refiner Valero Energy declined due to falling margins, and Biogen Idec fell as a result of safety concerns about its multiple sclerosis drug Tysabri.
The fund’s positioning and risk controls
We remain focused on our investment discipline as it applies to stock selection, portfolio construction, and implementation, and we believe the Growth and Income Fund is well positioned to achieve its long-run goal of outperforming the S&P 500 Index. We have emphasized and will continue to emphasize stocks with strong momentum and reasonable prices—stocks that historically have represented the most desirable market segment. At the same time, we are focused on controlling non-stock-specific risks in the portfolio. While we always seek to minimize the impact on the fund of industry, sector, market-capitalization, and other top-down risk factors, we believe that the current environment of increased volatility calls for increased caution, and in some cases tighter bands for allowable risk exposure. For example, we are being particularly careful to avoid positive exposure to leverage, as firms find it increasingly difficult to renew credit lines. We continue to believe the Growth and Income Fund is an excellent choice for those seeking a diversified exposure to large-cap U.S. equities.
Oliver E. Buckley, Chief Investment Officer
and Chief Executive Officer
Franklin Portfolio Associates, LLC1
October 17, 2008
1 Franklin Portfolio Associates, LLC has announced that, effective January 1, 2009, it expects to merge with Mellon Capital Management Corp. Both firms are wholly owned subsidiaries of The Bank of New York Mellon Corp.
8
Fund Profile
As of September 30, 2008
Portfolio Characteristics |
|
| |
|
| Comparative | Broad |
| Fund | Index1 | Index2 |
Number of Stocks | 123 | 499 | 4,679 |
Median Market Cap | $36.8B | $43.8B | $29.6B |
Price/Earnings Ratio | 13.0x | 14.8x | 15.5x |
Price/Book Ratio | 2.2x | 2.3x | 2.2x |
Yield3 |
| 2.4% | 2.3% |
Investor Shares | 2.2% |
|
|
Admiral Shares | 2.3% |
|
|
Return on Equity | 20.3% | 21.3% | 20.0% |
Earnings Growth Rate | 21.5% | 17.8% | 17.7% |
Foreign Holdings | 0.0% | 0.0% | 0.0% |
Turnover Rate | 96% | — | — |
Expense Ratio |
|
|
|
(9/30/2007)4 |
| — | — |
Investor Shares | 0.32% |
|
|
Admiral Shares | 0.18% |
|
|
Short-Term Reserves | 0.1% | — | — |
Sector Diversification (% of equity exposure) | |||
|
| Comparative | Broad |
| Fund | Index1 | Index2 |
Consumer Discretionary | 8.1% | 8.5% | 9.2% |
Consumer Staples | 12.7 | 12.2 | 10.5 |
Energy | 13.7 | 13.4 | 12.6 |
Financials | 15.5 | 15.9 | 17.3 |
Health Care | 12.3 | 13.1 | 13.0 |
Industrials | 11.4 | 11.1 | 11.4 |
Information Technology | 15.6 | 15.7 | 15.7 |
Materials | 3.6 | 3.4 | 3.7 |
Telecommunication |
|
|
|
Services | 2.8 | 3.1 | 2.8 |
Utilities | 4.3 | 3.6 | 3.8 |
Volatility Measures5 |
| |
| Fund Versus | Fund Versus |
| Comparative Index1 | Broad Index2 |
R-Squared | 0.97 | 0.96 |
Beta | 1.00 | 0.96 |
Ten Largest Holdings6 (% of total net assets) | |||
|
|
|
|
ExxonMobil Corp. | integrated oil |
|
|
| and gas | 5.2% |
|
General Electric Co. | industrial |
|
|
| conglomerates | 3.7 |
|
The Procter & Gamble Co. | household products | 3.3 |
|
Wal-Mart Stores, Inc. | hypermarkets and |
|
|
| supercenters | 2.5 |
|
Bank of America Corp. | diversified |
|
|
| financial services | 2.5 |
|
ConocoPhillips Co. | integrated oil |
|
|
| and gas | 2.5 |
|
Hewlett-Packard Co. | computer hardware | 2.2 |
|
Intel Corp. | semiconductors | 2.0 |
|
International Business |
|
|
|
Machines Corp. | computer hardware | 1.8 |
|
Monsanto Co. | fertilizers and |
|
|
| agricultural chemicals | 1.6 |
|
Top Ten |
| 27.3% |
|
Investment Focus
1 S&P 500 Index.
2 Dow Jones Wilshire 5000 Index.
3 30-day SEC yield for the fund; annualized dividend yield for the indexes. See the Glossary.
4 The expense ratios shown are from the prospectus dated January 28, 2008. For the fiscal year ended September 30, 2008, expense ratios were 0.31% for Investor Shares and 0.16% for Admiral Shares.
5 For an explanation of R-squared, beta, and other terms used here, see the Glossary.
6 The holdings listed exclude any temporary cash investments and equity index products.
9
Performance Summary
All of the returns in this report represent past performance, which is not a guarantee of future results that may be achieved by the fund. (Current performance may be lower or higher than the performance data cited. For performance data current to the most recent month-end, visit our website at www.vanguard.com/performance.) Note, too, that both investment returns and principal value can fluctuate widely, so an investor’s shares, when sold, could be worth more or less than their original cost. The returns shown do not reflect taxes that a shareholder would pay on fund distributions or on the sale of fund shares.
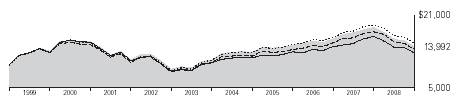
Cumulative Performance: September 30, 1998–September 30, 2008
Initial Investment of $10,000
| Average Annual Total Returns | Final Value | ||
| Periods Ended September 30, 2008 | of a $10,000 | ||
| One Year | Five Years | Ten Years | Investment |
Growth and Income Fund Investor Shares1 | –23.28% | 4.80% | 3.42% | $13,992 |
Dow Jones Wilshire 5000 Index | –21.20 | 6.04 | 4.00 | 14,801 |
S&P 500 Index | –21.98 | 5.17 | 3.06 | 13,520 |
Average Large-Cap Core Fund2 | –21.95 | 3.88 | 2.43 | 12,708 |
|
|
|
| Final Value |
|
|
| Since | of a $100,000 |
| One Year | Five Years | Inception3 | Investment |
Growth and Income Fund Admiral Shares | –23.19% | 4.96% | 0.92% | $107,016 |
Dow Jones Wilshire 5000 Index | –21.20 | 6.04 | 2.10 | 116,589 |
S&P 500 Index | –21.98 | 5.17 | 0.87 | 106,611 |
1 Total returns do not include the account service fee that may be applicable to certain accounts with balances below $10,000.
2 Derived from data provided by Lipper Inc.
3 Performance for the fund’s Admiral Shares and comparative standards is calculated since the Admiral Shares’ inception: May 14, 2001.
10
Fiscal-Year Total Returns (%): September 30, 1998–September 30, 2008
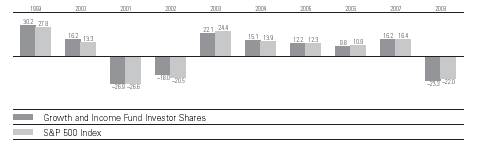
Note: See Financial Highlights tables for dividend and capital gains information.
11
Financial Statements
Statement of Net Assets
As of September 30, 2008
The fund provides a complete list of its holdings four times in each fiscal year, at the quarter-ends. For the second and fourth fiscal quarters, the lists appear in the fund’s semiannual and annual reports to shareholders. For the first and third fiscal quarters, the fund files the lists with the Securities and Exchange Commission on Form N-Q. Shareholders can look up the fund’s Forms N-Q on the SEC’s website at www.sec.gov. Forms N-Q may also be reviewed and copied at the SEC’s Public Reference Room (see the back cover of this report for further information).
|
|
| Market |
|
|
| Value• |
|
| Shares | ($000) |
Common Stocks (98.5%)1 |
|
| |
Consumer Discretionary (8.0%) |
|
| |
| The Walt Disney Co. | 2,420,285 | 74,279 |
| NIKE, Inc. Class B | 765,000 | 51,178 |
| Best Buy Co., Inc. | 1,202,900 | 45,109 |
| News Corp., Class A | 3,531,600 | 42,344 |
| H & R Block, Inc. | 1,412,900 | 31,861 |
| The Gap, Inc. | 1,591,400 | 28,295 |
* | Big Lots Inc. | 963,000 | 26,800 |
| Time Warner, Inc. | 1,816,200 | 23,810 |
* | GameStop Corp. Class A | 680,700 | 23,287 |
| Omnicom Group Inc. | 575,800 | 22,203 |
| Jones Apparel Group, Inc. | 1,059,600 | 19,613 |
| McDonald’s Corp. | 252,300 | 15,567 |
| Pulte Homes, Inc. | 1,110,300 | 15,511 |
| Tiffany & Co. | 395,200 | 14,037 |
| Hasbro, Inc. | 403,700 | 14,016 |
* | The Goodyear Tire & |
|
|
| Rubber Co. | 525,700 | 8,048 |
* | DIRECTV Group, Inc. | 299,900 | 7,848 |
|
|
| 463,806 |
Consumer Staples (12.5%) |
|
| |
| The Procter & Gamble Co. | 2,726,400 | 190,003 |
| Wal-Mart Stores, Inc. | 2,472,000 | 148,048 |
| Philip Morris |
|
|
| International Inc. | 1,715,300 | 82,506 |
| Sysco Corp. | 2,266,900 | 69,889 |
| Altria Group, Inc. | 2,169,400 | 43,041 |
| The Coca-Cola Co. | 683,800 | 36,159 |
| Coca-Cola Enterprises, Inc. | 1,946,600 | 32,644 |
| The Pepsi Bottling |
|
|
| Group, Inc. | 1,057,800 | 30,856 |
| Avon Products, Inc. | 453,400 | 18,848 |
| Archer-Daniels-Midland Co. | 818,900 | 17,942 |
| Reynolds American Inc. | 272,200 | 13,234 |
| Wm. Wrigley Jr. Co. | 162,500 | 12,902 |
| CVS/Caremark Corp. | 352,600 | 11,868 |
| Safeway, Inc. | 453,400 | 10,755 |
| PepsiCo, Inc. | 133,700 | 9,529 |
|
|
| 728,224 |
Energy (13.5%) |
|
| |
| ExxonMobil Corp. | 3,895,736 | 302,543 |
| ConocoPhillips Co. | 2,000,919 | 146,567 |
* | National Oilwell Varco Inc. | 1,508,400 | 75,767 |
| Williams Cos., Inc. | 2,643,000 | 62,507 |
| Chevron Corp. | 749,100 | 61,786 |
| Apache Corp. | 580,400 | 60,524 |
| BJ Services Co. | 1,410,600 | 26,985 |
| Baker Hughes, Inc. | 403,000 | 24,398 |
* | Southwestern Energy Co. | 605,500 | 18,492 |
| Massey Energy Co. | 148,700 | 5,304 |
|
|
| 784,873 |
Financials (15.2%) |
|
| |
| Bank of America Corp. | 4,191,599 | 146,706 |
| Northern Trust Corp. | 1,020,600 | 73,687 |
| Prudential Financial, Inc. | 1,007,500 | 72,540 |
| American Express Co. | 1,831,700 | 64,897 |
| AFLAC Inc. | 857,900 | 50,402 |
| State Street Corp. | 857,700 | 48,786 |
| Charles Schwab Corp. | 1,869,000 | 48,594 |
| The Goldman Sachs |
|
|
| Group, Inc. | 367,300 | 47,014 |
| ProLogis REIT | 1,016,400 | 41,947 |
| Hudson City Bancorp, Inc. | 2,069,000 | 38,173 |
| The Chubb Corp. | 638,800 | 35,070 |
| MetLife, Inc. | 551,700 | 30,895 |
| Wells Fargo & Co. | 755,700 | 28,361 |
| Apartment Investment |
|
|
| & Management Co. |
|
|
| Class A REIT | 755,600 | 26,461 |
| ^Zions Bancorp | 656,000 | 25,387 |
| ^BB&T Corp. | 655,800 | 24,789 |
| Marsh & |
|
|
| McLennan Cos., Inc. | 756,800 | 24,036 |
| Cincinnati Financial Corp. | 513,108 | 14,593 |
| NYSE Euronext | 324,200 | 12,702 |
* | IntercontinentalExchange Inc. | 150,800 | 12,167 |
| PNC Financial |
|
|
| Services Group | 151,200 | 11,295 |
| JPMorgan Chase & Co. | 180,400 | 8,425 |
|
|
| 886,927 |
12
|
|
| Market |
|
|
| Value• |
|
| Shares | ($000) |
Health Care (12.1%) |
|
| |
| Bristol-Myers Squibb Co. | 4,037,300 | 84,178 |
* | Express Scripts Inc. | 1,108,300 | 81,815 |
* | Biogen Idec Inc. | 1,513,700 | 76,124 |
| Stryker Corp. | 1,101,300 | 68,611 |
| Aetna Inc. | 1,817,400 | 65,626 |
| Pfizer Inc. | 3,529,227 | 65,079 |
| Merck & Co., Inc. | 1,816,200 | 57,319 |
* | Boston Scientific Corp. | 3,832,300 | 47,022 |
| Eli Lilly & Co. | 949,000 | 41,784 |
| CIGNA Corp. | 895,700 | 30,436 |
| Abbott Laboratories | 403,600 | 23,239 |
| Johnson & Johnson | 302,200 | 20,936 |
* | Watson Pharmaceuticals, Inc. | 602,500 | 17,171 |
| AmerisourceBergen Corp. | 302,200 | 11,378 |
* | Thermo Fisher Scientific, Inc. | 156,400 | 8,602 |
* | St. Jude Medical, Inc. | 185,300 | 8,059 |
|
|
| 707,379 |
Industrials (11.2%) |
|
| |
| General Electric Co. | 8,433,500 | 215,054 |
| Caterpillar, Inc. | 1,310,200 | 78,088 |
| Ingersoll-Rand Co. | 1,853,800 | 57,783 |
| CSX Corp. | 952,000 | 51,951 |
| General Dynamics Corp. | 654,900 | 48,214 |
| Northrop Grumman Corp. | 781,000 | 47,282 |
| Fluor Corp. | 622,700 | 34,684 |
| Union Pacific Corp. | 403,700 | 28,727 |
* | Allied Waste Industries, Inc. | 2,346,600 | 26,071 |
* | Jacobs Engineering |
|
|
| Group Inc. | 387,500 | 21,045 |
| L-3 Communications |
|
|
| Holdings, Inc. | 189,600 | 18,641 |
| The Manitowoc Co., Inc. | 921,200 | 14,325 |
| Deere & Co. | 176,400 | 8,732 |
| Goodrich Corp. | 118,700 | 4,938 |
|
|
| 655,535 |
Information Technology (15.3%) |
|
| |
| Hewlett-Packard Co. | 2,720,300 | 125,787 |
| Intel Corp. | 6,347,400 | 118,887 |
| International Business |
|
|
| Machines Corp. | 908,100 | 106,211 |
* | Oracle Corp. | 4,227,700 | 85,865 |
| Microsoft Corp. | 3,022,500 | 80,670 |
* | Apple Inc. | 706,300 | 80,278 |
* | Computer Sciences Corp. | 1,516,100 | 60,841 |
* | Google Inc. | 145,940 | 58,452 |
* | Cisco Systems, Inc. | 1,816,900 | 40,989 |
* | Juniper Networks, Inc. | 1,712,700 | 36,087 |
| Texas Instruments, Inc. | 1,410,400 | 30,324 |
* | Autodesk, Inc. | 745,000 | 24,995 |
* | Agilent Technologies, Inc. | 548,200 | 16,260 |
| Xilinx, Inc. | 503,800 | 11,814 |
| Corning, Inc. | 586,300 | 9,170 |
| Jabil Circuit, Inc. | 614,800 | 5,865 |
|
|
| 892,495 |
Materials (3.6%) |
|
| |
| Monsanto Co. | 959,700 | 94,991 |
| Freeport-McMoRan |
|
|
| Copper & Gold, Inc. |
|
|
| Class B | 807,996 | 45,935 |
| Nucor Corp. | 958,900 | 37,877 |
| Dow Chemical Co. | 723,400 | 22,990 |
| Alcoa Inc. | 335,000 | 7,564 |
|
|
| 209,357 |
Telecommunication Services (2.8%) |
|
| |
| AT&T Inc. | 3,375,100 | 94,233 |
| CenturyTel, Inc. | 1,882,800 | 69,005 |
|
|
| 163,238 |
Utilities (4.3%) |
|
| |
| Duke Energy Corp. | 4,685,000 | 81,660 |
| American Electric |
|
|
| Power Co., Inc. | 2,197,000 | 81,465 |
| Public Service Enterprise |
|
|
| Group, Inc. | 1,866,600 | 61,206 |
| Integrys Energy Group, Inc. | 201,800 | 10,078 |
* | AES Corp. | 805,500 | 9,416 |
| CenterPoint Energy Inc. | 403,400 | 5,878 |
|
|
| 249,703 |
Total Common Stocks |
|
| |
(Cost $6,083,548) |
| 5,741,537 | |
Temporary Cash Investments (2.0%)1 |
|
| |
Money Market Fund (1.9%) |
|
| |
2,3 | Vanguard Market |
|
|
| Liquidity Fund, 2.296% | 109,755,869 | 109,756 |
|
|
|
|
|
|
|
|
|
| Face |
|
|
| Amount |
|
|
| ($000) |
|
U.S. Government Obligation (0.1%) |
|
| |
| U.S. Treasury Bill |
|
|
4 | 1.252%, 11/6/08 | 6,200 | 6,194 |
Total Temporary Cash Investments |
|
| |
(Cost $115,950) |
| 115,950 | |
Total Investments (100.5%) |
|
| |
(Cost $6,199,498) |
| 5,857,487 | |
Other Assets and Liabilities (–0.5%) |
|
| |
Other Assets |
| 16,244 | |
Liabilities3 |
| (47,831) | |
|
|
| (31,587) |
Net Assets (100%) |
| 5,825,900 | |
13
At September 30, 2008, net assets consisted of: | |
| Amount |
| ($000) |
Paid-in Capital | 6,720,351 |
Undistributed Net Investment Income | 17,713 |
Accumulated Net Realized Losses | (569,252) |
Unrealized Appreciation (Depreciation) |
|
Investment Securities | (342,011) |
Futures Contracts | (901) |
Net Assets | 5,825,900 |
|
|
|
|
Investor Shares—Net Assets |
|
Applicable to 151,679,223 outstanding |
|
$.001 par value shares of beneficial |
|
interest (unlimited authorization) | 3,918,851 |
Net Asset Value Per Share— |
|
Investor Shares | $25.84 |
|
|
|
|
Admiral Shares—Net Assets |
|
Applicable to 45,191,727 outstanding |
|
$.001 par value shares of beneficial |
|
interest (unlimited authorization) | 1,907,049 |
Net Asset Value Per Share— |
|
Admiral Shares | $42.20 |
• See Note A in Notes to Financial Statements.
* Non-income-producing security.
^ Part of security position is on loan to broker-dealers.The total value of securities on loan is $20,509,000.
1 The fund invests a portion of its cash reserves in equity markets through the use of index futures contracts. After giving effect to futures investments, the fund’s effective common stock and temporary cash investment positions represent 100.0% and 0.5%, respectively, of net assets.
2 Affiliated money market fund available only to Vanguard funds and certain trusts and accounts managed by Vanguard. Rate shown is the 7-day yield.
3 Includes $21,178,000 of collateral received for securities on loan.
4 Securities with a value of $6,194,000 have been segregated as initial margin for open futures contracts.
REIT—Real Estate Investment Trust.
See accompanying Notes, which are an integral part of the Financial Statements.
14
Statement of Operations
| Year Ended |
| September 30, 2008 |
| ($000) |
Investment Income |
|
Income |
|
Dividends | 136,118 |
Interest1 | 3,293 |
Security Lending | 993 |
Total Income | 140,404 |
Expenses |
|
Investment Advisory Fees—Note B |
|
Basic Fee | 6,148 |
Performance Adjustment | (1,446) |
The Vanguard Group—Note C |
|
Management and Administrative—Investor Shares | 10,094 |
Management and Administrative—Admiral Shares | 1,771 |
Marketing and Distribution—Investor Shares | 965 |
Marketing and Distribution—Admiral Shares | 465 |
Custodian Fees | 53 |
Auditing Fees | 21 |
Shareholders’ Reports—Investor Shares | 136 |
Shareholders’ Reports—Admiral Shares | 12 |
Trustees’ Fees and Expenses | 11 |
Total Expenses | 18,230 |
Expenses Paid Indirectly | (1,556) |
Net Expenses | 16,674 |
Net Investment Income | 123,730 |
Realized Net Gain (Loss) |
|
Investment Securities Sold | (425,923) |
Futures Contracts | (20,593) |
Realized Net Gain (Loss) | (446,516) |
Change in Unrealized Appreciation (Depreciation) |
|
Investment Securities | (1,517,873) |
Futures Contracts | (2,975) |
Change in Unrealized Appreciation (Depreciation) | (1,520,848) |
Net Increase (Decrease) in Net Assets Resulting from Operations | (1,843,634) |
1 Interest income from an affiliated company of the fund was $3,200,000.
See accompanying Notes, which are an integral part of the Financial Statements.
15
Statement of Changes in Net Assets
| Year Ended September 30, | |
| 2008 | 2007 |
| ($000) | ($000) |
Increase (Decrease) in Net Assets |
|
|
Operations |
|
|
Net Investment Income | 123,730 | 132,725 |
Realized Net Gain (Loss) | (446,516) | 912,849 |
Change in Unrealized Appreciation (Depreciation) | (1,520,848) | 134,840 |
Net Increase (Decrease) in Net Assets Resulting from Operations | (1,843,634) | 1,180,414 |
Distributions |
|
|
Net Investment Income |
|
|
Investor Shares | (81,970) | (88,650) |
Admiral Shares | (43,850) | (46,594) |
Realized Capital Gain1 |
|
|
Investor Shares | (564,334) | — |
Admiral Shares | (284,167) | — |
Total Distributions | (974,321) | (135,244) |
Capital Share Transactions |
|
|
Investor Shares | 335,349 | (333,115) |
Admiral Shares | 50,006 | 138,269 |
Net Increase (Decrease) from Capital Share Transactions | 385,355 | (194,846) |
Total Increase (Decrease) | (2,432,600) | 850,324 |
Net Assets |
|
|
Beginning of Period | 8,258,500 | 7,408,176 |
End of Period2 | 5,825,900 | 8,258,500 |
1 Includes fiscal 2008 short-term gain distributions totaling $89,550,000. Short-term gain distributions are treated as ordinary income dividends for tax purposes.
2 Net Assets—End of Period includes undistributed net investment income of $17,713,000 and $19,803,000. See accompanying Notes, which are an integral part of the Financial Statements.
16
Financial Highlights
Investor Shares |
|
|
|
|
|
|
|
|
|
|
|
|
|
|
|
|
|
|
|
|
| ||
For a Share Outstanding | Year Ended September 30, | ||||
Throughout Each Period | 2008 | 2007 | 2006 | 2005 | 2004 |
Net Asset Value, Beginning of Period | $38.62 | $33.79 | $31.29 | $28.31 | $24.91 |
Investment Operations |
|
|
|
|
|
Net Investment Income | .546 | .600 | .550 | .460 | .370 |
Net Realized and Unrealized Gain (Loss) |
|
|
|
|
|
on Investments | (8.758) | 4.840 | 2.470 | 2.980 | 3.390 |
Total from Investment Operations | (8.212) | 5.440 | 3.020 | 3.440 | 3.760 |
Distributions |
|
|
|
|
|
Dividends from Net Investment Income | (.560) | (.610) | (.520) | (.460) | (.360) |
Distributions from Realized Capital Gains | (4.008) | — | — | — | — |
Total Distributions | (4.568) | (.610) | (.520) | (.460) | (.360) |
Net Asset Value, End of Period | $25.84 | $38.62 | $33.79 | $31.29 | $28.31 |
|
|
|
|
|
|
|
|
|
|
|
|
Total Return1 | –23.28% | 16.20% | 9.76% | 12.20% | 15.12% |
|
|
|
|
|
|
|
|
|
|
|
|
Ratios/Supplemental Data |
|
|
|
|
|
Net Assets, End of Period (Millions) | $3,919 | $5,465 | $5,088 | $5,202 | $5,780 |
Ratio of Total Expenses to |
|
|
|
|
|
Average Net Assets2 | 0.31% | 0.32% | 0.38% | 0.40% | 0.42% |
Ratio of Net Investment Income to |
|
|
|
|
|
Average Net Assets | 1.69% | 1.61% | 1.65% | 1.53% | 1.35% |
Portfolio Turnover Rate | 96% | 100% | 93% | 84% | 79%3 |
1 Total returns do not include the account service fee that may be applicable to certain accounts with balances below $10,000.
2 Includes performance-based investment advisory fee increases (decreases) of (0.02%), 0.00%, 0.01%, 0.01%, and 0.01%.
3 Excludes the value of portfolio securities received or delivered as a result of in-kind purchases or redemptions of the fund’s capital shares. See accompanying Notes, which are an integral part of the Financial Statements.
17
Admiral Shares |
|
|
|
|
|
|
|
|
|
|
|
|
|
|
|
|
|
|
|
|
| ||
For a Share Outstanding | Year Ended September 30, | ||||
Throughout Each Period | 2008 | 2007 | 2006 | 2005 | 2004 |
Net Asset Value, Beginning of Period | $63.08 | $55.20 | $51.12 | $46.25 | $40.70 |
Investment Operations |
|
|
|
|
|
Net Investment Income | .963 | 1.070 | .997 | .849 | .683 |
Net Realized and Unrealized Gain (Loss) |
|
|
|
|
|
on Investments | (14.313) | 7.903 | 4.036 | 4.853 | 5.530 |
Total from Investment Operations | (13.350) | 8.973 | 5.033 | 5.702 | 6.213 |
Distributions |
|
|
|
|
|
Dividends from Net Investment Income | (.985) | (1.093) | (.953) | (.832) | (.663) |
Distributions from Realized Capital Gains | (6.545) | — | — | — | — |
Total Distributions | (7.530) | (1.093) | (.953) | (.832) | (.663) |
Net Asset Value, End of Period | $42.20 | $63.08 | $55.20 | $51.12 | $46.25 |
|
|
|
|
|
|
|
|
|
|
|
|
Total Return | –23.19% | 16.37% | 9.97% | 12.39% | 15.29% |
|
|
|
|
|
|
|
|
|
|
|
|
Ratios/Supplemental Data |
|
|
|
|
|
Net Assets, End of Period (Millions) | $1,907 | $2,794 | $2,321 | $2,039 | $843 |
Ratio of Total Expenses to |
|
|
|
|
|
Average Net Assets1 | 0.16% | 0.18% | 0.20% | 0.23% | 0.25% |
Ratio of Net Investment Income to |
|
|
|
|
|
Average Net Assets | 1.84% | 1.75% | 1.83% | 1.68% | 1.51% |
Portfolio Turnover Rate | 96% | 100% | 93% | 84% | 79%2 |
1 Includes performance-based investment advisory fee increases (decreases) of (0.02%), 0.00%, 0.01%, 0.01%, and 0.01%.
2 Excludes the value of portfolio securities received or delivered as a result of in-kind purchases or redemptions of the fund’s capital shares. See accompanying Notes, which are an integral part of the Financial Statements.
18
Notes to Financial Statements
Vanguard Growth and Income Fund is registered under the Investment Company Act of 1940 as an open-end investment company, or mutual fund. The fund offers two classes of shares, Investor Shares and Admiral Shares. Investor Shares are available to any investor who meets the fund’s minimum purchase requirements. Admiral Shares are designed for investors who meet certain administrative, service, tenure, and account-size criteria.
A. The following significant accounting policies conform to generally accepted accounting principles for U.S. mutual funds. The fund consistently follows such policies in preparing its financial statements.
1. Security Valuation: Securities are valued as of the close of trading on the New York Stock Exchange (generally 4 p.m., Eastern time) on the valuation date. Equity securities are valued at the latest quoted sales prices or official closing prices taken from the primary market in which each security trades; such securities not traded on the valuation date are valued at the mean of the latest quoted bid and asked prices. Securities for which market quotations are not readily available, or whose values have been materially affected by events occurring before the fund’s pricing time but after the close of the securities’ primary markets, are valued by methods deemed by the board of trustees to represent fair value. Investments in Vanguard Market Liquidity Fund are valued at that fund’s net asset value. Temporary cash investments acquired over 60 days to maturity are valued using the latest bid prices or using valuations based on a matrix system (which considers such factors as security prices, yields, maturities, and ratings), both as furnished by independent pricing services. Other temporary cash investments are valued at amortized cost, which approximates market value.
2. Futures Contracts: The fund uses index futures contracts to a limited extent, with the objective of maintaining full exposure to the stock market while maintaining liquidity. The fund may purchase or sell futures contracts to achieve a desired level of investment, whether to accommodate portfolio turnover or cash flows from capital share transactions. The primary risks associated with the use of futures contracts are imperfect correlation between changes in market values of stocks held by the fund and the prices of futures contracts, and the possibility of an illiquid market.
Futures contracts are valued at their quoted daily settlement prices. The aggregate principal amounts of the contracts are not recorded in the Statement of Net Assets. Fluctuations in the value of the contracts are recorded in the Statement of Net Assets as an asset (liability) and in the Statement of Operations as unrealized appreciation (depreciation) until the contracts are closed, when they are recorded as realized futures gains (losses).
3. Federal Income Taxes: The fund intends to continue to qualify as a regulated investment company and distribute all of its taxable income. Management has analyzed the fund’s tax positions taken on federal income tax returns for all open tax years (tax years ended September 30, 2005–2008), and has concluded that no provision for federal income tax is required in the fund’s financial statements.
4. Distributions: Distributions to shareholders are recorded on the ex-dividend date.
5. Security Lending: The fund may lend its securities to qualified institutional borrowers to earn additional income. Security loans are required to be secured at all times by collateral at least equal to the market value of securities loaned. The fund invests cash collateral received in Vanguard Market Liquidity Fund, and records a liability for the return of the collateral, during the period the securities are on loan. Security lending income represents the income earned on investing cash collateral, less expenses associated with the loan.
19
6. Other: Dividend income is recorded on the ex-dividend date. Interest income includes income distributions received from Vanguard Market Liquidity Fund and is accrued daily. Security transactions are accounted for on the date securities are bought or sold. Costs used to determine realized gains (losses) on the sale of investment securities are those of the specific securities sold.
Each class of shares has equal rights as to assets and earnings, except that each class separately bears certain class-specific expenses related to maintenance of shareholder accounts (included in Management and Administrative expenses) and shareholder reporting. Marketing and distribution expenses are allocated to each class of shares based on a method approved by the board of trustees. Income, other non-class-specific expenses, and gains and losses on investments are allocated to each class of shares based on its relative net assets.
B. Franklin Portfolio Associates, LLC, provides investment advisory services to the fund for a fee calculated at an annual percentage rate of average net assets. The basic fee is subject to quarterly adjustments based on the fund’s performance for the preceding three years relative to the S&P 500 Index. For the year ended September 30, 2008, the investment advisory fee represented an effective annual basic rate of 0.09% of the fund’s average net assets before a decrease of $1,446,000 (0.02%) based on performance.
C. The Vanguard Group furnishes at cost corporate management, administrative, marketing, and distribution services. The costs of such services are allocated to the fund under methods approved by the board of trustees. The fund has committed to provide up to 0.40% of its net assets in capital contributions to Vanguard. At September 30, 2008, the fund had contributed capital of $555,000 to Vanguard (included in Other Assets), representing 0.01% of the fund’s net assets and 0.55% of Vanguard’s capitalization. The fund’s trustees and officers are also directors and officers of Vanguard.
D. The fund has asked its investment advisor to direct certain security trades, subject to obtaining the best price and execution, to brokers who have agreed to rebate to the fund part of the commissions generated. Such rebates are used solely to reduce the fund’s management and administrative expenses. The fund’s custodian bank has also agreed to reduce its fees when the fund maintains cash on deposit in the non-interest-bearing custody account. For the year ended September 30, 2008, these arrangements reduced the fund’s management and administrative expenses by $1,555,000 and custodian fees by $1,000. The total expense reduction represented an effective annual rate of 0.02% of the fund’s average net assets.
E. Distributions are determined on a tax basis and may differ from net investment income and realized capital gains for financial reporting purposes. Differences may be permanent or temporary. Permanent differences are reclassified among capital accounts in the financial statements to reflect their tax character. Temporary differences arise when certain items of income, expense, gain, or loss are recognized in different periods for financial statement and tax purposes; these differences will reverse at some time in the future. Differences in classification may also result from the treatment of short-term gains as ordinary income for tax purposes.
For tax purposes, at September 30, 2008, the fund had $34,599,000 of ordinary income available for distribution. Tax-basis capital gains required to be distributed in December 2007 included net capital gains realized through October 31, 2007. Subsequently, the fund realized capital losses of $570,743,000, which are available to offset future net capital gains.
20
At September 30, 2008, the cost of investment securities for tax purposes was $6,199,498,000. Net unrealized depreciation of investment securities for tax purposes was $342,011,000, consisting of unrealized gains of $390,992,000 on securities that had risen in value since their purchase and $733,003,000 in unrealized losses on securities that had fallen in value since their purchase.
At September 30, 2008, the aggregate settlement value of open futures contracts expiring in December 2008 and the related unrealized appreciation (depreciation) were:
|
|
| ($000) |
| Number of | Aggregate | Unrealized |
| Long (Short) | Settlement | Appreciation |
Futures Contracts | Contracts | Value | (Depreciation) |
S&P 500 Index | 290 | 84,753 | (901) |
Unrealized appreciation (depreciation) on open futures contracts is required to be treated as realized gain (loss) for tax purposes.
F. During the year ended September 30, 2008, the fund purchased $6,696,223,000 of investment securities and sold $7,157,841,000 of investment securities, other than temporary cash investments.
G. Capital share transactions for each class of shares were:
| Year Ended September 30, | ||||
|
| 2008 |
|
| 2007 |
| Amount | Shares |
| Amount | Shares |
| ($000) | (000) |
| ($000) | (000) |
Investor Shares |
|
|
|
|
|
Issued | 550,897 | 17,490 |
| 581,626 | 15,817 |
Issued in Lieu of Cash Distributions | 622,470 | 19,829 |
| 84,713 | 2,312 |
Redeemed | (838,018) | (27,137) |
| (999,454) | (27,194) |
Net Increase (Decrease)—Investor Shares | 335,349 | 10,182 |
| (333,115) | (9,065) |
Admiral Shares |
|
|
|
|
|
Issued | 220,621 | 4,296 |
| 491,880 | 8,143 |
Issued in Lieu of Cash Distributions | 305,215 | 5,955 |
| 42,270 | 706 |
Redeemed | (475,830) | (9,345) |
| (395,881) | (6,600) |
Net Increase (Decrease)—Admiral Shares | 50,006 | 906 |
| 138,269 | 2,249 |
21
H. In September 2006, the Financial Accounting Standards Board issued Statement of Financial Accounting Standards No. 157 (“FAS 157”), “Fair Value Measurements.” FAS 157 establishes a framework for measuring fair value and expands disclosures about fair value measurements in financial statements.
The various inputs that may be used to determine the value of the fund’s investments are summarized in three broad levels. The inputs or methodologies used for valuing securities are not necessarily an indication of the risk associated with investing in those securities.
Level 1—Quoted prices in active markets for identical securities.
Level 2—Other significant observable inputs (including quoted prices for similar securities, interest rates, prepayment speeds, credit risk, etc.).
Level 3—Significant unobservable inputs (including the fund’s own assumptions used to determine the fair value of investments).
The following table summarizes the fund's investments as of September 30, 2008, based on the inputs used to value them:
| Investments | Futures |
| in Securities | Contracts |
Valuation Inputs | ($000) | ($000) |
Level 1—Quoted prices | 5,851,293 | (901) |
Level 2—Other significant observable inputs | 6,194 | — |
Level 3—Significant unobservable inputs | — | — |
Total | 5,857,487 | (901) |
22
Report of Independent Registered
Public Accounting Firm
To the Trustees of Vanguard Quantitative Funds and the Shareholders of Vanguard Growth and Income Fund:
In our opinion, the accompanying statement of net assets and the related statements of operations and of changes in net assets and the financial highlights present fairly, in all material respects, the financial position of Vanguard Growth and Income Fund (the “Fund”) at September 30, 2008, the results of its operations for the year then ended, the changes in its net assets for each of the two years in the period then ended and the financial highlights for each of the five years in the period then ended, in conformity with accounting principles generally accepted in the United States of America. These financial statements and financial highlights (hereafter referred to as “financial statements”) are the responsibility of the Fund’s management; our responsibility is to express an opinion on these financial statements based on our audits. We conducted our audits of these financial statements in accordance with the standards of the Public Company Accounting Oversight Board (United States). Those standards require that we plan and perform the audit to obtain reasonable assurance about whether the financial statements are free of material misstatement. An audit includes examining, on a test basis, evidence supporting the amounts and disclosures in the financial statements, assessing the accounting principles used and significant estimates made by management, and evaluating the overall financial statement presentation. We believe that our audits, which included confirmation of securities at September 30, 2008 by correspondence with the custodian and broker, and by agreement to the underlying ownership records for Vanguard Market Liquidity Fund, provide a reasonable basis for our opinion.
PricewaterhouseCoopers LLP
Philadelphia, Pennsylvania
November 19, 2008
Special 2008 tax information (unaudited) for Vanguard Growth and Income Fund
This information for the fiscal year ended September 30, 2008, is included pursuant to provisions of the Internal Revenue Code.
The fund distributed $759,528,000 as capital gain dividends (from net long-term capital gains) to shareholders during the fiscal year.
For non-resident alien shareholders, 100% of short-term capital gain dividends distributed by the fund are qualified short-term capital gains.
The fund distributed $135,688,000 of qualified dividend income to shareholders during the fiscal year.
For corporate shareholders, 96.8% of investment income (dividend income plus short-term gains, if any) qualifies for the dividends-received deduction.
23
Your Fund’s After-Tax Returns
This table presents returns for your fund both before and after taxes. The after-tax returns are shown in two ways: (1) assuming that an investor owned the fund during the entire period and paid taxes on the fund’s distributions, and (2) assuming that an investor paid taxes on the fund’s distributions and sold all shares at the end of each period.
Calculations are based on the highest individual federal income tax and capital gains tax rates in effect at the times of the distributions and the hypothetical sales. State and local taxes were not considered. After-tax returns reflect any qualified dividend income, using actual prior-year figures and estimates for 2008. (In the example, returns after the sale of fund shares may be higher than those assuming no sale. This occurs when the sale would have produced a capital loss. The calculation assumes that the investor received a tax deduction for the loss.)
The table shows returns for Investor Shares only; returns for other share classes will differ. Please note that your actual after-tax returns will depend on your tax situation and may differ from those shown. Also note that if you own the fund in a tax-deferred account, such as an individual retirement account or a 401(k) plan, this information does not apply to you. Such accounts are not subject to current taxes.
Finally, keep in mind that a fund’s performance—whether before or after taxes—does not guarantee future results.
Average Annual Total Returns: Growth and Income Fund Investor Shares1 |
|
| |
Periods Ended September 30, 2008 |
|
|
|
| One | Five | Ten |
| Year | Years | Years |
Returns Before Taxes | –23.28% | 4.80% | 3.42% |
Returns After Taxes on Distributions | –24.92 | 4.15 | 2.65 |
Returns After Taxes on Distributions and Sale of Fund Shares | –12.73 | 4.18 | 2.81 |
1 Total returns do not include the account service fee that may be applicable to certain accounts with balances below $10,000.
24
About Your Fund’s Expenses
As a shareholder of the fund, you incur ongoing costs, which include costs for portfolio management, administrative services, and shareholder reports (like this one), among others. Operating expenses, which are deducted from a fund’s gross income, directly reduce the investment return of the fund.
A fund’s expenses are expressed as a percentage of its average net assets. This figure is known as the expense ratio. The following examples are intended to help you understand the ongoing costs (in dollars) of investing in your fund and to compare these costs with those of other mutual funds. The examples are based on an investment of $1,000 made at the beginning of the period shown and held for the entire period.
The accompanying table illustrates your fund’s costs in two ways:
• Based on actual fund return. This section helps you to estimate the actual expenses that you paid over the period. The “Ending Account Value” shown is derived from the fund’s actual return, and the third column shows the dollar amount that would have been paid by an investor who started with $1,000 in the fund. You may use the information here, together with the amount you invested, to estimate the expenses that you paid over the period.
To do so, simply divide your account value by $1,000 (for example, an $8,600 account value divided by $1,000 = 8.6), then multiply the result by the number given for your fund under the heading “Expenses Paid During Period.”
• Based on hypothetical 5% yearly return. This section is intended to help you compare your fund’s costs with those of other mutual funds. It assumes that the fund had a yearly return of 5% before expenses, but that the expense ratio is unchanged. In this case—because the return used is not the fund’s actual return—the results do not apply to your investment. The example is useful in making comparisons because the Securities and Exchange Commission requires all mutual funds to calculate expenses based on a 5% return. You can assess your fund’s costs by comparing this hypothetical example with the hypothetical examples that appear in shareholder reports of other funds.
Six Months Ended September 30, 2008 |
|
|
|
| Beginning | Ending | Expenses |
| Account Value | Account Value | Paid During |
Growth and Income Fund | 3/31/2008 | 9/30/2008 | Period1 |
Based on Actual Fund Return |
|
|
|
Investor Shares | $1,000.00 | $895.47 | $1.47 |
Admiral Shares | 1,000.00 | 896.06 | 0.76 |
Based on Hypothetical 5% Yearly Return |
|
|
|
Investor Shares | $1,000.00 | $1,023.51 | $1.57 |
Admiral Shares | 1,000.00 | 1,024.27 | 0.81 |
1 The calculations are based on expenses incurred in the most recent six-month period. The fund’s annualized six-month expense ratios for that period are 0.31% for Investor Shares and 0.16% for Admiral Shares. The dollar amounts shown as “Expenses Paid” are equal to the annualized expense ratio multiplied by the average account value over the period, multiplied by the number of days in the most recent six-month period, then divided by the number of days in the most recent 12-month period.
25
Note that the expenses shown in the table are meant to highlight and help you compare ongoing costs only and do not reflect transaction costs incurred by the fund for buying and selling securities. Further, the expenses do not include the account service fee described in the prospectus. If such a fee were applied to your account, your costs would be higher. Your fund does not charge transaction fees, such as purchase or redemption fees, nor does it carry a “sales load.”
The calculations assume no shares were bought or sold during the period. Your actual costs may have been higher or lower, depending on the amount of your investment and the timing of any purchases or redemptions.
You can find more information about the fund’s expenses, including annual expense ratios, in the Financial Statements section of this report. For additional information on operating expenses and other shareholder costs, please refer to your fund’s current prospectus.
26
Trustees Approve Advisory Agreement
The board of trustees of Vanguard Growth and Income Fund has renewed the fund’s investment advisory agreement with Franklin Portfolio Associates, LLC. The board determined that the retention of Franklin was in the best interests of the fund and its shareholders.
The board based its decision upon an evaluation of the advisor’s investment staff, portfolio management process, and performance. The trustees considered the factors discussed below, among others. However, no single factor determined whether the board approved the agreement. Rather, it was the totality of the circumstances that drove the board’s decision.
Nature, extent, and quality of services
The board considered the quality of investment management to the fund over both the short and long term, and took into account the organizational depth and stability of the advisor. The board noted that Franklin, founded in 1982, is known for quantitative equity management combining investment experience, financial databases, and computer modeling. The firm has advised the Growth and Income Fund since the fund’s inception in 1986. The investment team at Franklin employs a quantitative investment strategy that seeks to provide a total return greater than that of the S&P 500 Index by investing in U.S. large- and mid-capitalization stocks. Stock selection is driven by a series of more than 40 computer models covering a broad range of public data.
The board concluded that the advisor’s experience, stability, depth, and performance, among other factors, warranted continuation of the advisory agreement.
Investment performance
The board considered the short- and long-term performance of the fund, including any periods of outperformance or underperformance of a relevant benchmark and peer group. The board noted that the advisor has carried out the fund’s investment strategy in disciplined fashion, and that the results have been in line with expectations. Information about the fund’s most recent performance can be found in the Performance Summary section of this report.
Cost
The board concluded that the fund’s expense ratio was far below the average expense ratio charged by funds in its peer group. The board noted that the fund’s advisory fee rate was also well below the peer-group average. Information about the fund’s expense ratio appears in the About Your Fund’s Expenses section of this report as well as in the Financial Statements section, which also includes information about the advisory fee rate. The board did not consider profitability of Franklin in determining whether to approve the advisory fee, because Franklin is independent of Vanguard, and the advisory fee is the result of arm’s-length negotiations.
The benefit of economies of scale
The board concluded that the fund’s shareholders benefit from economies of scale because of breakpoints in the fund’s advisory fee schedule. The breakpoints reduce the effective rate of the fee as the fund’s assets increase.
The board will consider whether to renew the advisory agreement again after a one-year period.
27
Glossary
Beta. A measure of the magnitude of a fund’s past share-price fluctuations in relation to the ups and downs of a given market index. The index is assigned a beta of 1.00. Compared with a given index, a fund with a beta of 1.20 typically would have seen its share price rise or fall by 12% when the index rose or fell by 10%. For this report, beta is based on returns over the past 36 months for both the fund and the index. Note that a fund’s beta should be reviewed in conjunction with its R-squared (see definition). The lower the R-squared, the less correlation there is between the fund and the index, and the less reliable beta is as an indicator of volatility.
Earnings Growth Rate. The average annual rate of growth in earnings over the past five years for the stocks now in a fund.
Equity Exposure. A measure that reflects a fund’s investments in stocks and stock futures. Any holdings in short-term reserves are excluded.
Expense Ratio. The percentage of a fund’s average net assets used to pay its annual administrative and advisory expenses. These expenses directly reduce returns to investors.
Foreign Holdings. The percentage of a fund represented by stocks or depositary receipts of companies based outside the United States.
Inception Date. The date on which the assets of a fund (or one of its share classes) are first invested in accordance with the fund’s investment objective. For funds with a subscription period, the inception date is the day after that period ends. Investment performance is measured from the inception date.
Median Market Cap. An indicator of the size of companies in which a fund invests; the midpoint of market capitalization (market price x shares outstanding) of a fund’s stocks, weighted by the proportion of the fund’s assets invested in each stock. Stocks representing half of the fund’s assets have market capitalizations above the median, and the rest are below it.
Price/Book Ratio. The share price of a stock divided by its net worth, or book value, per share. For a fund, the weighted average price/book ratio of the stocks it holds.
Price/Earnings Ratio. The ratio of a stock’s current price to its per-share earnings over the past year. For a fund, the weighted average P/E of the stocks it holds. P/E is an indicator of market expectations about corporate prospects; the higher the P/E, the greater the expectations for a company’s future growth.
R-Squared. A measure of how much of a fund’s past returns can be explained by the returns from the market in general, as measured by a given index. If a fund’s total returns were precisely synchronized with an index’s returns, its R-squared would be 1.00. If the fund’s returns bore no relationship to the index’s returns, its R-squared would be 0. For this report, R-squared is based on returns over the past 36 months for both the fund and the index.
Return on Equity. The annual average rate of return generated by a company during the past five years for each dollar of shareholder’s equity (net income divided by shareholder’s equity). For a fund, the weighted average return on equity for the companies whose stocks it holds.
Short-Term Reserves. The percentage of a fund invested in highly liquid, short-term securities that can be readily converted to cash.
28
Turnover Rate. An indication of the fund’s trading activity. Funds with high turnover rates incur higher transaction costs and may be more likely to distribute capital gains (which may be taxable to investors). The turnover rate excludes in-kind transactions, which have minimal impact on costs.
Yield. A fund’s 30-day SEC yield is derived using a formula specified by the U.S. Securities and Exchange Commission. Under the formula, data related to the fund’s security holdings in the previous 30 days are used to calculate the fund’s hypothetical net income for that period, which is then annualized and divided by the fund’s estimated average net assets over the calculation period. For the purposes of this calculation, a security’s income is based on its current market yield to maturity (in the case of bonds) or its projected dividend yield (for stocks). Because the SEC yield represents hypothetical annualized income, it will differ—at times significantly—from the fund’s actual experience. As a result, the fund’s income distributions may be higher or lower than implied by the SEC yield.
29
This page intentionally left blank.
This page intentionally left blank.
The People Who Govern Your Fund
The trustees of your mutual fund are there to see that the fund is operated and managed in your best interests since, as a shareholder, you are a part owner of the fund. Your fund’s trustees also serve on the board of directors of The Vanguard Group, Inc., which is owned by the Vanguard funds and provides services to them on an at-cost basis.
A majority of Vanguard’s board members are independent, meaning that they have no affiliation with Vanguard or the funds they oversee, apart from the sizable personal investments they have made as private individuals.
Our independent board members bring distinguished backgrounds in business, academia, and public service to their task of working with Vanguard officers to establish the policies and oversee the activities of the funds. Among board members’ responsibilities are selecting investment advisors for the funds; monitoring fund operations, performance, and costs; reviewing contracts; nominating and selecting new trustees/directors; and electing Vanguard officers.
Each trustee serves a fund until its termination; or until the trustee’s retirement, resignation, or death; or otherwise as specified in the fund’s organizational documents. Any trustee may be removed at a shareholders’ meeting by a vote representing two-thirds of the net asset value of all shares of the fund together with shares of other Vanguard funds organized within the same trust. The table on these two pages shows information for each trustee and executive officer of the fund. The mailing address of the trustees and officers is P.O. Box 876, Valley Forge, PA 19482.
Chairman of the Board and Trustee
John J. Brennan1
Born 1954 Principal Occupation(s) During the Past Five Years: Chairman of the Board and Director/ Trustee Since May 1987; Trustee of The Vanguard Group, Inc., and of each of the investment companies served Chairman of the Board by The Vanguard Group; Chief Executive Officer and President of The Vanguard Group 156 Vanguard Funds Overseen and of each of the investment companies served by The Vanguard Group (1996–2008).
Independent Trustees
Charles D. Ellis
Born 1937 Principal Occupation(s) During the Past Five Years: Applecore Partners (pro bono ventures Trustee Since January 2001 in education); Senior Advisor to Greenwich Associates (international business strategy 156 Vanguard Funds Overseen consulting); Successor Trustee of Yale University; Overseer of the Stern School of Business at New York University; Trustee of the Whitehead Institute for Biomedical Research.
Emerson U. Fullwood
Born 1948 Principal Occupation(s) During the Past Five Years: Executive Chief Staff and Marketing Trustee Since January 2008 Officer for North America since 2004 and Corporate Vice President of Xerox Corporation 156 Vanguard Funds Overseen (photocopiers and printers); Director of SPX Corporation (multi-industry manufacturing), of the United Way of Rochester, and of the Boy Scouts of America.
Rajiv L. Gupta
Born 1945 Principal Occupation(s) During the Past Five Years: Chairman, President, and Trustee Since December 20012 Chief Executive Officer of Rohm and Haas Co. (chemicals); Board Member of 156 Vanguard Funds Overseen the American Chemistry Council; Director of Tyco International, Ltd. (diversified manufacturing and services) since 2005.
Amy Gutmann
Born 1949 Principal Occupation(s) During the Past Five Years: President of the University of
Trustee Since June 2006 Pennsylvania since 2004; Professor in the School of Arts and Sciences, Annenberg School 156 Vanguard Funds Overseen for Communication, and Graduate School of Education of the University of Pennsylvania since 2004; Provost (2001–2004) and Laurance S. Rockefeller Professor of Politics and the University Center for Human Values (1990–2004), Princeton University; Director of Carnegie Corporation of New York since 2005 and of Schuylkill River Development Corporation and Greater Philadelphia Chamber of Commerce since 2004; Trustee of the National Constitution Center since 2007.
JoAnn Heffernan Heisen
Born 1950 Principal Occupation(s) During the Past Five Years: Corporate Vice President and Trustee Since July 1998 Chief Global Diversity Officer since 2006, Vice President and Chief Information 156 Vanguard Funds Overseen Officer (1997–2005), and Member of the Executive Committee of Johnson & Johnson (pharmaceuticals/consumer products); Director of the University Medical Center at Princeton and Women’s Research and Education Institute.
André F. Perold
Born 1952 Principal Occupation(s) During the Past Five Years: George Gund Professor of Finance Trustee Since December 2004 and Banking, Harvard Business School; Senior Associate Dean and Director of Faculty 156 Vanguard Funds Overseen Recruiting, Harvard Business School; Director and Chairman of UNX, Inc. (equities trading firm); Chair of the Investment Committee of HighVista Strategies LLC (private investment firm) since 2005.
Alfred M. Rankin, Jr.
Born 1941 Principal Occupation(s) During the Past Five Years: Chairman, President, Chief Executive Trustee Since January 1993 Officer, and Director of NACCO Industries, Inc. (forklift trucks/housewares/lignite); Director 156 Vanguard Funds Overseen of Goodrich Corporation (industrial products/aircraft systems and services).
J. Lawrence Wilson
Born 1936 Principal Occupation(s) During the Past Five Years: Retired Chairman and Chief Executive Trustee Since April 1985 Officer of Rohm and Haas Co. (chemicals); Director of Cummins Inc. (diesel engines) and 156 Vanguard Funds Overseen AmerisourceBergen Corp. (pharmaceutical distribution); Trustee of Vanderbilt University and of Culver Educational Foundation.
Executive Officers1
Thomas J. Higgins
Born 1957 Principal Occupation(s) During the Past Five Years: Principal of The Vanguard Group, Inc.; Chief Financial Officer Treasurer of each of the investment companies served by The Vanguard Group; Chief Since September 2008 Financial Officer of each of the investment companies served by The Vanguard Treasurer Since July 1998 Group since 2008. 156 Vanguard Funds Overseen
F. William McNabb III
Born 1957 Principal Occupation(s) During the Past Five Years: Chief Executive Officer, Director, Chief Executive Officer and President of The Vanguard Group, Inc., since 2008; Chief Executive Officer and Since August 31, 2008 President of each of the investment companies served by The Vanguard Group since President Since March 2008 2008; Director of Vanguard Marketing Corporation; Managing Director of The Vanguard 156 Vanguard Funds Overseen Group (1995–2008).
Heidi Stam
Born 1956 Principal Occupation(s) During the Past Five Years: Managing Director of The Vanguard Secretary Since July 2005 Group, Inc., since 2006; General Counsel of The Vanguard Group since 2005; Secretary of 156 Vanguard Funds Overseen The Vanguard Group and of each of the investment companies served by The Vanguard Group since 2005; Director and Senior Vice President of Vanguard Marketing Corporation since 2005; Principal of The Vanguard Group (1997–2006).
Vanguard Senior Management Team |
|
| |
|
|
|
|
R. Gregory Barton | Kathleen C. Gubanich | Michael S. Miller | Glenn W. Reed |
Mortimer J. Buckley | Paul A. Heller | Ralph K. Packard | George U. Sauter |
Founder
John C. Bogle
Chairman and Chief Executive Officer, 1974–1996
1 These individuals are “interested persons” as defined in the Investment Company Act of 1940.
2 December 2002 for Vanguard Equity Income Fund, Vanguard Growth Equity Fund, the Vanguard Municipal Bond Funds, and the Vanguard State Tax-Exempt Funds.
More information about the trustees is in the Statement of Additional Information, available from The Vanguard Group.

P.O. Box 2600
Valley Forge, PA 19482-2600
Connect with Vanguard® > www.vanguard.com
Fund Information > 800-662-7447 | All comparative mutual fund data are from Lipper Inc. |
| or Morningstar, Inc., unless otherwise noted. |
Direct Investor Account Services > 800-662-2739 |
|
| You can obtain a free copy of Vanguard’s proxy voting |
Institutional Investor Services > 800-523-1036 | guidelines by visiting our website, www.vanguard.com, |
| and searching for “proxy voting guidelines,” or by |
Text Telephone for People | calling Vanguard at 800-662-2739. The guidelines are |
With Hearing Impairment > 800-952-3335 | also available from the SEC’s website, www.sec.gov. |
| In addition, you may obtain a free report on how your |
| fund voted the proxies for securities it owned during |
| the 12 months ended June 30. To get the report, visit |
This material may be used in conjunction | either www.vanguard.com or www.sec.gov. |
with the offering of shares of any Vanguard |
|
fund only if preceded or accompanied by |
|
the fund’s current prospectus. |
|
|
|
| You can review and copy information about your fund |
| at the SEC’s Public Reference Room in Washington, D.C. |
| To find out more about this public service, call the SEC |
The funds or securities referred to herein are not | at 202-551-8090. Information about your fund is also |
sponsored, endorsed, or promoted by MSCI, and MSCI | available on the SEC’s website, and you can receive |
bears no liability with respect to any such funds or | copies of this information, for a fee, by sending a |
securities. For any such funds or securities, the | request in either of two ways: via e-mail addressed to |
prospectus or the Statement of Additional Information | publicinfo@sec.gov or via regular mail addressed to the |
contains a more detailed description of the limited | Public Reference Section, Securities and Exchange |
relationship MSCI has with The Vanguard Group and | Commission, Washington, DC 20549-0102. |
any related funds. |
|
|
|
Standard & Poor’s 500®, S&P 500®, and 500 are |
|
trademarks of The McGraw-Hill Companies, Inc., and |
|
have been licensed for use by The Vanguard Group, Inc. |
|
Vanguard mutual funds are not sponsored, endorsed, |
|
sold, or promoted by Standard & Poor’s, and Standard & |
|
Poor’s makes no representation regarding the advisability |
|
of investing in the funds. |
|
|
|
Russell is a trademark of The Frank Russell Company. |
|
| © 2008 The Vanguard Group, Inc. |
| All rights reserved. |
| Vanguard Marketing Corporation, Distributor. |
|
|
| Q930 112008 |
> As the credit crisis intensified, the broad U.S. stock market fell –21.2% during the fiscal year ended September 30, 2008.
> For the 12-month period, returns for the Institutional Plus Shares of the Vanguard Structured Equity portfolios ranged from –22.2% for the Structured Large-Cap Growth Fund to –24.5% for the Structured Large-Cap Value Fund.
> All four Vanguard Structured Equity Funds trailed their benchmark indexes.
Contents |
|
|
|
Your Fund’s Total Returns | 1 |
President’s Letter | 2 |
Advisor’s Report | 7 |
Structured Large-Cap Equity Fund | 10 |
Structured Large-Cap Growth Fund | 24 |
Structured Large-Cap Value Fund | 39 |
Structured Broad Market Fund | 52 |
About Your Fund’s Expenses | 71 |
Glossary | 73 |
Please note: The opinions expressed in this report are just that—informed opinions. They should not be considered promises or advice. Also, please keep in mind that the information and opinions cover the period through the date on the front of this report. Of course, the risks of investing in your fund are spelled out in the prospectus.
Your Fund’s Total Returns
Fiscal Year Ended September 30, 2008 |
|
|
| Ticker | Total |
| Symbol | Returns |
Vanguard Structured Large-Cap Equity Fund |
|
|
Institutional Shares | VSLIX | –22.5% |
Institutional Plus Shares | VSLPX | –22.5 |
S&P 500 Index |
| –22.0 |
Average Large-Cap Core Fund1 |
| –22.0 |
|
|
|
|
|
|
Vanguard Structured Large-Cap Growth Fund |
|
|
Institutional Shares | VSTLX | –22.2% |
Institutional Plus Shares | VSGPX | –22.2 |
Russell 1000 Growth Index |
| –20.9 |
Average Large-Cap Growth Fund1 |
| –23.0 |
|
|
|
|
|
|
Vanguard Structured Large-Cap Value Fund |
|
|
Institutional Plus Shares | VSLVX | –24.5% |
Russell 1000 Value Index |
| –23.6 |
Average Large-Cap Value Fund1 |
| –23.8 |
|
|
|
|
|
|
Vanguard Structured Broad Market Fund |
|
|
Institutional Shares | VSBMX | –22.9% |
Institutional Plus Shares | VSBPX | –22.9 |
Russell 3000 Index |
| –21.5 |
Average Multi-Cap Core Fund1 |
| –22.8 |
1 Derived from data provided by Lipper Inc.
1

President’s Letter
Dear Shareholder,
For the fiscal year ending September 30, 2008, all four Vanguard Structured Equity Funds posted negative results and fell a few steps short of their benchmark indexes.
As the financial market turmoil intensified, the four funds registered returns ranging from –24.5% for the Structured Large-Cap Value Fund to –22.2% for the Structured Large-Cap Growth Fund.
Credit market turbulence weighed heavily on stock prices
Troubles simmering in the credit markets for much of the past year came to a boil at the end of the fiscal period, producing several high-profile bankruptcies and putting severe pressure on stock prices around the world. The broad U.S. stock market returned –21.2% for the 12 months ended September 30. In September alone, the market fell more than 9%. International stock markets were similarly disappointing, returning –30.0% for the full 12 months.
Policymakers and elected officials, both in the United States and abroad, responded to the upheavals with dramatic new programs designed to help stabilize the credit markets. As participants struggled to make sense of the markets’ fast-changing dynamics, stock prices were exceptionally volatile, with daily ups and downs of 2 percentage points or more becoming commonplace.
2
U.S. Treasuries rallied in a nervous market
Nervousness in the stock market was echoed, and even amplified, in the bond market. For the 12 months, the broad U.S. bond market returned 3.7%, largely on the strength of Treasuries—investors’ security of choice in times of duress. Corporate bonds generally produced negative returns for the period, coming under heavy selling pressure during investors’ flight to safety. Even the municipal market, made up of generally high-quality securities issued by states and municipalities, recorded a negative 12-month return.
The U.S. Federal Reserve Board responded to the turmoil with a dramatic easing of monetary policy. Over the full 12 months, the Fed reduced its target for the federal funds rate from 4.75% to 2.00%. On October 8, shortly after the close of the fiscal period, the Fed cut rates again, to 1.50%. The move was made in coordination with rate cuts by several other central banks.
Trouble in all sectors weighed on fund returns
The Vanguard Structured Equity Funds seek to keep their risk characteristics in line with those of their benchmark indexes while using a quantitative stock-selection process with the goal of outperforming the indexes. During the volatile 2008 fiscal year, the funds had trouble meeting this goal. All four portfolios suffered from subpar stock selection in industrials, consumer staples, and materials, and they fell short of their respective benchmarks.
Market Barometer |
|
|
|
| Average Annual Total Returns | ||
| Periods Ended September 30, 2008 | ||
| One Year | Three Years | Five Years |
Stocks |
|
|
|
Russell 1000 Index (Large-caps) | –22.1% | 0.1% | 5.5% |
Russell 2000 Index (Small-caps) | –14.5 | 1.8 | 8.1 |
Dow Jones Wilshire 5000 Index (Entire market) | –21.2 | 0.6 | 6.0 |
MSCI All Country World Index ex USA (International) | –30.0 | 3.1 | 11.8 |
|
|
|
|
|
|
|
|
Bonds |
|
|
|
Lehman U.S. Aggregate Bond Index (Broad taxable market) | 3.7% | 4.2% | 3.8% |
Lehman Municipal Bond Index | –1.9 | 1.9 | 2.8 |
Citigroup 3-Month Treasury Bill Index | 2.6 | 4.0 | 3.1 |
|
|
|
|
|
|
|
|
CPI |
|
|
|
Consumer Price Index | 4.9% | 3.2% | 3.4% |
3
Total Returns |
|
May 15, 20061 Through September 30, 2008 |
|
| Average |
| Annual Return |
Structured Large-Cap Equity Fund Institutional Plus Shares | –2.7% |
S&P 500 Index | –2.4 |
Average Large-Cap Core Fund2 | –2.9 |
|
|
|
|
January 19, 20061 Through September 30, 2008 |
|
| Average |
| Annual Return |
Structured Large-Cap Growth Fund Institutional Plus Shares | –2.3% |
Russell 1000 Growth Index | –2.0 |
Average Large-Cap Growth Fund2 | –4.0 |
|
|
|
|
December 15, 20051 Through September 30, 2008 |
|
| Average |
| Annual Return |
Structured Large-Cap Value Fund Institutional Shares | –1.3% |
Russell 1000 Value Index | –0.8 |
Average Large-Cap Value Fund2 | –1.8 |
|
|
|
|
May 3, 20041 Through September 30, 2008 |
|
| Average |
| Annual Return |
Structured Broad Market Fund Institutional Plus Shares | 3.2% |
Russell 3000 Index | 3.4 |
Average Multi-Cap Core Fund2 | 2.7 |
The figures shown represent past performance, which is not a guarantee of future results. (Current performance may be lower or higher than the performance data cited. For performance data current to the most recent month-end, visit our website at www.vanguard.com/performance.) Note, too, that both investment returns and principal value can fluctuate widely, so an investor’s shares, when sold, could be worth more or less than their original cost.
1 Share-class inception.
2 Derived from data provided by Lipper Inc.
4
Over the 12-month period, the funds experienced negative returns in all ten industry sectors. However, in some areas of the market, the funds fared better than their respective indexes.
Each of the funds suffered from disappointing stock selection in the industrials sector, which has been hit hard by expectations that the tight credit market will crimp demand for big-ticket machinery and construction projects. In the health care sector, managed-care stocks took a toll on the Structured Large-Cap Equity Fund.
All four portfolios performed relatively well in the financial sector. Losses were steep, but the funds held up better than their benchmarks thanks to good stock selection, along with underweighted positions in some of the hardest-hit financial companies, including Washington Mutual, Countrywide, Lehman Brothers Holdings, and American International Group.
The consumer discretionary sector was another bright spot for the funds, with strong stock selection in restaurants and apparel companies. A significant underweighting in casino stocks provided the Structured Large-Cap Growth Fund with a boost in that area of the market.
A long-term perspective is key for institutional investors
As the credit crisis endured through the end of the fiscal year, the U.S. stock markets continued to experience sometimes startling volatility. As would be expected, the Vanguard Structured Equity Funds have participated in the market’s ups and downs.
The funds’ advisor, Vanguard Quantitative Equity Group, uses proprietary stock-selection systems to keep the portfolios’ risk metrics close to those of their benchmarks while seeking above-market performance. The systems factor in such variables as investor sentiment, valuation, and the quality of a company’s earnings, helping the portfolio managers to choose individual stocks that are overweighted or
5
underweighted versus the benchmark. In the limited time since their inceptions, the funds’ stock-selection model has come up short, leaving fund returns a bit behind those of their indexes. (See the table on page 4.)
It’s worth remembering that the portfolios’ risk controls make no effort to moderate overall stock market risk. Over the past year, exposure to the stock market came at a high cost. Such volatility is why we remind shareholders to avoid reacting to short-term market “noise.” Instead, Vanguard suggests that investors maintain a long-term perspective.
A long-term focus is especially important for institutional investors dedicated to helping their organizations to reach financial goals. The broadly diversified Vanguard Structured Equity Funds provide a useful tool to support a carefully constructed approach toward these goals.
Thank you for investing with Vanguard.
Sincerely,

F. William McNabb III
President and Chief Executive Officer October 15, 2008
Your Fund’s Performance at a Glance |
|
|
|
|
September 30, 2007–September 30, 2008 | ||||
|
|
| Distributions Per Share | |
| Starting | Ending | Income | Capital |
| Share Price | Share Price | Dividends | Gains |
Structured Large-Cap Equity Fund |
|
|
|
|
Institutional Shares | $29.98 | $22.56 | $0.430 | $0.391 |
Institutional Plus Shares | 60.02 | 45.15 | 0.920 | 0.782 |
Structured Large-Cap Growth Fund |
|
|
|
|
Institutional Shares | $29.93 | $22.63 | $0.270 | $0.571 |
Institutional Plus Shares | 59.60 | 45.07 | 0.564 | 1.137 |
Structured Large-Cap Value Fund |
|
|
|
|
Institutional Plus Shares | $63.87 | $44.00 | $1.370 | $3.980 |
Structured Broad Market Fund |
|
|
|
|
Institutional Shares | $28.67 | $21.53 | $0.280 | $0.429 |
Institutional Plus Shares | 57.39 | 43.07 | 0.621 | 0.858 |
6
Advisor’s Report
The fiscal year ended September 30, 2008, was a disappointing year for the Vanguard Structured Equity Funds. As you saw in the tables on page 1 of this report, all of the funds suffered steep declines over the 12 months, and all of them trailed their benchmark indexes. The Structured Large-Cap Equity Fund lagged the S&P 500 Index by about half a percentage point, and the gaps were even wider for the other funds.
The investment environment
Painful as this year’s market decline has been, it would be melodramatic to describe it as stunning or unprecedented. To place the last 12 months in historical context, since 1926 the broad market has had a calendar-year decline of more than 20% five times. This doesn’t make the current losses more palatable, but it does remind us that what we’ve been experiencing is nothing truly new. Such dramatic volatility from time to time is part of the risk that goes with investing in stocks.
Nonetheless, the last 12 months was an extreme period, and our portfolios underperformed their benchmarks.
Quantitative management, as we implement it, is similar to traditional stock selection, although we use computer models to make our choices. We attempt to identify attributes that will indicate whether a stock’s market price is too high or too low relative to the company’s fundamentals. We test our investment theses by running simulations using historical information to determine whether those attributes do identify stocks that have consistently outperformed their peers. Overall, we are trying to find several hundred stocks that individually, and as a group, will outperform their peers. This aspect of our strategy differs from a traditional stock-picking approach, which generally tries to spot a small number of stocks that will outperform.
However, the resulting characteristics of our quantitative portfolio are similar to those of a traditional portfolio. Our portfolio holdings typically exhibit growth rates similar to the market average but were purchased at price/earnings ratios below the market average. Our investment judgment and our simulations tell us that buying a growth rate like the market’s but at a discount to the market is an attractive proposition, over the long run.
Our specific quantitative approach uses computer models to assess stocks in terms of three components: market sentiment, valuation, and earnings quality. For the market-sentiment component, our model assesses each stock’s strength based on signals derived from market participants; for example, we look at characteristics of a company’s recent earnings pronouncements and the resulting stock-price movements. To evaluate the prices associated with these market-sentiment
7
indicators, our valuation model analyzes various earnings and cash-flow metrics together with dividend payouts for each stock. Finally, the earnings-quality model attempts to predict the persistence of earnings by analyzing company financial statements.
Our research indicates that each of these models individually has the ability to identify a group of stocks that will outperform their industry peers over the long term. By combining the results from the three models, we benefit from their relatively low correlation with one another, which diversifies the risk in our portfolio. Just as adding bonds and international stocks to a domestic stock portfolio can help to reduce absolute risk through diversification, using multiple models to pick stocks should improve our overall ability to add relative value consistently. Our three-component approach doesn’t work every year, but over the long run we are confident in the power of its stock-selection capability and in the diversification it provides.
Following are brief reviews of each fund’s performance.
Structured Large-Cap Equity Fund
Relative to the benchmark index, the fund benefited most from its financial holdings, and particularly from its underweightings of American International Group, Freddie Mac, and Lehman Brothers Holdings.
Stock selection was worst in the health care sector, where Cigna and Humana were the fund’s largest detractors.
Structured Large-Cap Growth Fund
The fund’s holdings in consumer discretionary stocks added the most to its returns. Most helpful, in relative terms, were an overweighted stake in Big Lots and underweightings in International Game Technology and Las Vegas Sands. Industrials was the fund’s worst-performing sector, with Manitowoc and Hertz Global Holdings having the largest negative impact.
Structured Large-Cap Value Fund
Financials was among this fund’s best-performing sector, thanks to underweightings of AIG, Lehman, and Freddie Mac. Consumer staples stocks dragged down the overall return. Notably poor performers were Bunge and Archer-Daniels-Midland.
Structured Broad Market Fund
The fund’s best-performing sector was financials, followed by consumer discretionary, which was led by returns from Aeropostale and NVR. Relative to the benchmark, the fund also performed well in financials, where we underweighted a number of poorly performing stocks. Industrial holdings did the worst as a group, with Manitowoc and UAL as leading detractors.
8
Conclusion
As disappointed as we are with the investment environment and with our relative performance, we are confident that the stock market will have worthwhile returns for long-term investors in the future, and that our focus on value and sentiment will reward patience. We thank you for your decision to entrust your investment dollars to us, and we look forward to the future.
James. D. Troyer, CFA
Principal and Portfolio Manager
James P. Stetler
Principal and Portfolio Manager Vanguard Quantitative Equity Group
October 20, 2008
9
Structured Large-Cap Equity Fund
Fund Profile
As of September 30, 2008
Portfolio Characteristics |
|
| |
|
| Comparative | Broad |
| Fund | Index1 | Index2 |
Number of Stocks | 264 | 499 | 4,679 |
Median Market Cap | $46.3B | $43.8B | $29.6B |
Price/Earnings Ratio | 13.7x | 14.8x | 15.5x |
Price/Book Ratio | 2.2x | 2.3x | 2.2x |
Yield3 |
| 2.4% | 2.3% |
Institutional Shares | 2.3% |
|
|
Institutional |
|
|
|
Plus Shares | 2.4% |
|
|
Return on Equity | 21.2% | 21.3% | 20.0% |
Earnings Growth Rate | 19.3% | 17.8% | 17.7% |
Foreign Holdings | 0.0% | 0.0% | 0.0% |
Turnover Rate | 72% | — | — |
Expense Ratio |
|
|
|
(9/30/2007)4 |
| — | — |
Institutional Shares | 0.25% |
|
|
Institutional |
|
|
|
Plus Shares | 0.15% |
|
|
Short-Term Reserves5 | –0.2% | — | — |
Sector Diversification (% of equity exposure) | |||
|
| Comparative | Broad |
| Fund | Index1 | Index2 |
Consumer Discretionary | 8.9% | 8.5% | 9.2% |
Consumer Staples | 11.9 | 12.2 | 10.5 |
Energy | 13.4 | 13.4 | 12.6 |
Financials | 15.9 | 15.9 | 17.3 |
Health Care | 13.2 | 13.1 | 13.0 |
Industrials | 10.9 | 11.1 | 11.4 |
Information Technology | 16.0 | 15.7 | 15.7 |
Materials | 3.0 | 3.4 | 3.7 |
Telecommunication |
|
|
|
Services | 3.1 | 3.1 | 2.8 |
Utilities | 3.7 | 3.6 | 3.8 |
Ten Largest Holdings6 (% of total net assets) | ||
|
|
|
ExxonMobil Corp. | integrated oil |
|
| and gas | 3.9% |
General Electric Co. | industrial |
|
| conglomerate | 2.4 |
The Procter & |
|
|
Gamble Co. | household products | 2.2 |
Microsoft Corp. | systems software | 2.2 |
Johnson & Johnson | pharmaceuticals | 2.0 |
Chevron Corp. | integrated oil |
|
| and gas | 1.8 |
AT&T Inc. | integrated |
|
| telecommunication |
|
| services | 1.7 |
International Business |
|
|
Machines Corp. | computer hardware | 1.7 |
JPMorgan Chase & Co. | other diversified |
|
| financial services | 1.6 |
Bank of America Corp. | diversified |
|
| financial services | 1.4 |
Top Ten |
| 20.9% |
Investment Focus
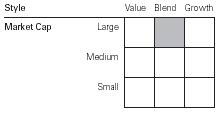
1 S&P 500 Index.
2 Dow Jones Wilshire 5000 Index.
3 30-day SEC yield for the fund; annualized dividend yield for the indexes. See the Glossary.
4 The expense ratios shown are from the prospectus dated January 28, 2008. For the fiscal year ended September 30, 2008, the expense ratios were 0.20% for Institutional Shares and 0.12% for Institutional Plus Shares.
5 The fund invested a portion of its cash reserves in equity markets through the use of index futures contracts. After the effect of the futures investments, the fund’s temporary cash position was negative.
6 The holdings listed exclude any temporary cash investments and equity index products.
10
Structured Large-Cap Equity Fund
Performance Summary
All of the returns in this report represent past performance, which is not a guarantee of future results that may be achieved by the fund. (Current performance may be lower or higher than the performance data cited. For performance data current to the most recent month-end, visit our website at www.vanguard.com/performance.) Note, too, that both investment returns and principal value can fluctuate widely, so an investor’s shares, when sold, could be worth more or less than their original cost. The returns shown do not reflect taxes that a shareholder would pay on fund distributions or on the sale of fund shares.
Cumulative Performance: May 15, 2006–September 30, 2008
Initial Investment of $200,000,000
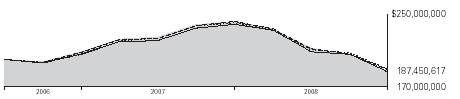
|
|
|
|
| Average Annual Total Returns |
| |
| Periods Ended September 30, 2008 | Final Value of a | |
|
| Since | $200,000,000 |
| One Year | Inception1 | Investment |
Structured Large-Cap Equity Fund |
|
|
|
Institutional Plus Shares | –22.46% | –2.69% | $187,450,617 |
Dow Jones Wilshire 5000 Index | –21.20 | –2.26 | 189,428,998 |
S&P 500 Index | –21.98 | –2.38 | 188,839,388 |
Average Large-Cap Core Fund2 | –21.95 | –2.94 | 186,275,581 |
|
|
| Final Value of a |
|
| Since | $5,000,000 |
| One Year | Inception1 | Investment |
Structured Large-Cap Equity Fund |
|
|
|
Institutional Shares | –22.52% | –2.71% | $4,684,133 |
Dow Jones Wilshire 5000 Index | –21.20 | –2.20 | 4,742,099 |
S&P 500 Index | –21.98 | –2.31 | 4,729,768 |
1 Performance for the fund and its comparative standards is calculated since the following inception dates: May 15, 2006, for Institutional Plus Shares; May 16, 2006, for Institutional Shares.
2 Derived from data provided by Lipper Inc.
11
Structured Large-Cap Equity Fund
Fiscal-Year Total Returns (%): May 15, 2006–September 30, 2008
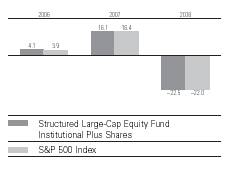
Note: See Financial Highlights tables for dividend and capital gains information.
12
Structured Large-Cap Equity Fund
Financial Statements
Statement of Net Assets
As of September 30, 2008
The fund provides a complete list of its holdings four times in each fiscal year, at the quarter-ends. For the second and fourth fiscal quarters, the lists appear in the fund’s semiannual and annual reports to shareholders. For the first and third fiscal quarters, the fund files the lists with the Securities and Exchange Commission on Form N-Q. Shareholders can look up the fund’s Forms N-Q on the SEC’s website at www.sec.gov. Forms N-Q may also be reviewed and copied at the SEC’s Public Reference Room (see the back cover of this report for further information).
|
|
| Market |
|
|
| Value• |
|
| Shares | ($000) |
Common Stocks (98.8%)1 |
|
| |
Consumer Discretionary (8.7%) |
|
| |
| McDonald’s Corp. | 103,868 | 6,409 |
| Comcast Corp. Class A | 277,795 | 5,453 |
| The Walt Disney Co. | 171,363 | 5,259 |
| Time Warner, Inc. | 346,980 | 4,549 |
| Home Depot, Inc. | 159,960 | 4,141 |
| Target Corp. | 77,693 | 3,811 |
| Lowe’s Cos., Inc. | 153,658 | 3,640 |
| VF Corp. | 41,400 | 3,201 |
* | AutoZone Inc. | 24,200 | 2,985 |
| The Gap, Inc. | 165,200 | 2,937 |
| News Corp., Class A | 240,444 | 2,883 |
| Darden Restaurants Inc. | 95,200 | 2,726 |
* | Big Lots Inc. | 90,400 | 2,516 |
* | The Goodyear Tire & |
|
|
| Rubber Co. | 159,100 | 2,436 |
| Carnival Corp. | 55,007 | 1,944 |
| Black & Decker Corp. | 29,500 | 1,792 |
* | Viacom Inc. Class B | 71,450 | 1,775 |
| Best Buy Co., Inc. | 46,750 | 1,753 |
| Omnicom Group Inc. | 42,000 | 1,620 |
| NIKE, Inc. Class B | 18,300 | 1,224 |
| Lennar Corp. Class A | 75,600 | 1,148 |
| CBS Corp. | 74,649 | 1,088 |
| H & R Block, Inc. | 46,500 | 1,049 |
* | Amazon.com, Inc. | 12,500 | 910 |
| The Stanley Works | 18,500 | 772 |
| Johnson Controls, Inc. | 24,300 | 737 |
* | DIRECTV Group, Inc. | 22,000 | 576 |
| D. R. Horton, Inc. | 36,300 | 473 |
| Wyndham Worldwide Corp. | 28,166 | 442 |
| Limited Brands, Inc. | 19,300 | 334 |
| Jones Apparel Group, Inc. | 17,500 | 324 |
* | Ford Motor Co. | 18,100 | 94 |
| RadioShack Corp. | 4,500 | 78 |
* | Expedia, Inc. | 3,000 | 45 |
| Polo Ralph Lauren Corp. | 300 | 20 |
|
|
| 71,144 |
Consumer Staples (11.8%) |
|
| |
| The Procter & Gamble Co. | 252,799 | 17,618 |
| Wal-Mart Stores, Inc. | 192,364 | 11,521 |
| Philip Morris International Inc. | 181,840 | 8,746 |
| PepsiCo, Inc. | 111,499 | 7,946 |
| The Coca-Cola Co. | 141,593 | 7,487 |
| Altria Group, Inc. | 209,540 | 4,157 |
| CVS/Caremark Corp. | 121,926 | 4,104 |
| The Kroger Co. | 146,600 | 4,029 |
| Anheuser-Busch Cos., Inc. | 56,686 | 3,678 |
| General Mills, Inc. | 48,500 | 3,333 |
| Kimberly-Clark Corp. | 46,849 | 3,038 |
| Kraft Foods Inc. | 90,923 | 2,978 |
| Molson Coors Brewing Co. |
|
|
| Class B | 63,100 | 2,950 |
| Colgate-Palmolive Co. | 31,754 | 2,393 |
| Archer-Daniels-Midland Co. | 78,100 | 1,711 |
| Reynolds American Inc. | 34,100 | 1,658 |
| Walgreen Co. | 49,999 | 1,548 |
| Costco Wholesale Corp. | 21,454 | 1,393 |
* | Constellation Brands, Inc. |
|
|
| Class A | 63,100 | 1,354 |
| The Pepsi Bottling Group, Inc. | 41,400 | 1,208 |
| The Estee Lauder Cos. Inc. |
|
|
| Class A | 21,700 | 1,083 |
| UST, Inc. | 11,700 | 778 |
| SuperValu Inc. | 25,500 | 553 |
| Sysco Corp. | 13,100 | 404 |
| ConAgra Foods, Inc. | 4,100 | 80 |
|
|
| 95,748 |
Energy (13.2%) |
|
| |
| ExxonMobil Corp. | 410,255 | 31,860 |
| Chevron Corp. | 173,257 | 14,290 |
| ConocoPhillips Co. | 122,682 | 8,986 |
| Schlumberger Ltd. | 85,555 | 6,681 |
| Occidental Petroleum Corp. | 75,886 | 5,346 |
| Devon Energy Corp. | 39,434 | 3,596 |
| Apache Corp. | 33,383 | 3,481 |
| Noble Corp. | 66,800 | 2,933 |
| Murphy Oil Corp. | 45,644 | 2,928 |
13
Structured Large-Cap Equity Fund
|
|
| Market |
|
|
| Value• |
|
| Shares | ($000) |
| Williams Cos., Inc. | 116,800 | 2,762 |
| ENSCO International, Inc. | 47,700 | 2,749 |
| Noble Energy, Inc. | 43,200 | 2,402 |
| Anadarko Petroleum Corp. | 49,270 | 2,390 |
| Chesapeake Energy Corp. | 57,800 | 2,073 |
* | Transocean, Inc. | 18,777 | 2,062 |
| Halliburton Co. | 50,138 | 1,624 |
| Hess Corp. | 19,000 | 1,560 |
| Marathon Oil Corp. | 36,576 | 1,458 |
* | Southwestern Energy Co. | 40,400 | 1,234 |
| Massey Energy Co. | 34,500 | 1,231 |
| XTO Energy, Inc. | 26,100 | 1,214 |
* | National Oilwell Varco Inc. | 21,900 | 1,100 |
| EOG Resources, Inc. | 12,000 | 1,074 |
* | Weatherford International Ltd. | 33,500 | 842 |
| Baker Hughes, Inc. | 12,700 | 769 |
| Valero Energy Corp. | 19,821 | 601 |
| Spectra Energy Corp. | 16,100 | 383 |
|
|
| 107,629 |
Financials (15.7%) |
|
| |
| JPMorgan Chase & Co. | 286,006 | 13,356 |
| Bank of America Corp. | 333,193 | 11,662 |
| Wells Fargo & Co. | 284,511 | 10,678 |
| Citigroup, Inc. | 382,012 | 7,835 |
| U.S. Bancorp | 163,202 | 5,879 |
| The Goldman Sachs |
|
|
| Group, Inc. | 37,922 | 4,854 |
| BB&T Corp. | 114,387 | 4,324 |
| The Chubb Corp. | 75,136 | 4,125 |
| Bank of New York |
|
|
| Mellon Corp. | 109,163 | 3,557 |
| Northern Trust Corp. | 48,800 | 3,523 |
| Unum Group | 137,800 | 3,459 |
| Hudson City Bancorp, Inc. | 177,800 | 3,280 |
| AFLAC Inc. | 51,869 | 3,047 |
| The Travelers Cos., Inc. | 66,851 | 3,022 |
| Ameriprise Financial, Inc. | 77,920 | 2,977 |
| Discover Financial Services | 213,299 | 2,948 |
| State Street Corp. | 46,827 | 2,663 |
| Simon Property Group, Inc. |
|
|
| REIT | 27,236 | 2,642 |
| American Express Co. | 67,243 | 2,382 |
| Morgan Stanley | 103,198 | 2,374 |
| MetLife, Inc. | 41,708 | 2,336 |
| Merrill Lynch & Co., Inc. | 86,012 | 2,176 |
| Capital One Financial Corp. | 40,998 | 2,091 |
| Charles Schwab Corp. | 74,400 | 1,934 |
| HCP, Inc. REIT | 44,400 | 1,782 |
| Prudential Financial, Inc. | 23,682 | 1,705 |
| Plum Creek Timber Co. Inc. |
|
|
| REIT | 32,900 | 1,640 |
| ProLogis REIT | 38,500 | 1,589 |
| The Hartford Financial |
|
|
| Services Group Inc. | 38,202 | 1,566 |
| Janus Capital Group Inc. | 51,200 | 1,243 |
| Public Storage, Inc. REIT | 11,700 | 1,158 |
| PNC Financial Services Group | 15,351 | 1,147 |
| Apartment Investment |
|
|
| & Management Co. |
|
|
| Class A REIT | 32,422 | 1,135 |
| The Allstate Corp. | 24,106 | 1,112 |
| CME Group, Inc. | 2,800 | 1,040 |
| Lincoln National Corp. | 23,400 | 1,002 |
| Assurant, Inc. | 15,700 | 863 |
* | CB Richard Ellis Group, Inc. | 58,600 | 783 |
| Wachovia Corp. | 184,182 | 645 |
| American International |
|
|
| Group, Inc. | 181,283 | 604 |
| Loews Corp. | 12,143 | 479 |
| SunTrust Banks, Inc. | 8,454 | 380 |
| Franklin Resources Corp. | 2,733 | 241 |
| Vornado Realty Trust REIT | 1,100 | 100 |
| Boston Properties, Inc. REIT | 800 | 75 |
|
|
| 127,413 |
Health Care (13.0%) |
|
| |
| Johnson & Johnson | 233,869 | 16,203 |
| Pfizer Inc. | 557,169 | 10,274 |
| Abbott Laboratories | 105,839 | 6,094 |
| Merck & Co., Inc. | 191,101 | 6,031 |
* | Express Scripts Inc. | 57,332 | 4,232 |
* | Amgen, Inc. | 71,197 | 4,220 |
| Eli Lilly & Co. | 95,056 | 4,185 |
| Baxter International, Inc. | 62,764 | 4,119 |
* | Gilead Sciences, Inc. | 88,046 | 4,013 |
| Wyeth | 107,139 | 3,958 |
| Medtronic, Inc. | 70,734 | 3,544 |
* | Biogen Idec Inc. | 64,811 | 3,259 |
* | Laboratory Corp. of |
|
|
| America Holdings | 45,300 | 3,148 |
| UnitedHealth Group Inc. | 120,112 | 3,050 |
* | Watson Pharmaceuticals, Inc. | 101,400 | 2,890 |
* | WellPoint Inc. | 57,555 | 2,692 |
* | Thermo Fisher Scientific, Inc. | 47,600 | 2,618 |
| Cardinal Health, Inc. | 53,004 | 2,612 |
| CIGNA Corp. | 70,730 | 2,403 |
| Bristol-Myers Squibb Co. | 111,517 | 2,325 |
| Aetna Inc. | 59,413 | 2,145 |
* | Tenet Healthcare Corp. | 360,700 | 2,002 |
* | Forest Laboratories, Inc. | 66,100 | 1,869 |
* | St. Jude Medical, Inc. | 42,000 | 1,827 |
| Schering-Plough Corp. | 83,957 | 1,551 |
| AmerisourceBergen Corp. | 39,400 | 1,483 |
* | Celgene Corp. | 21,000 | 1,329 |
* | Medco Health Solutions, Inc. | 28,700 | 1,292 |
| Stryker Corp. | 4,650 | 290 |
|
|
| 105,658 |
Industrials (10.8%) |
|
| |
| General Electric Co. | 759,411 | 19,365 |
| The Boeing Co. | 72,985 | 4,186 |
| United Parcel Service, Inc. | 66,527 | 4,184 |
| Lockheed Martin Corp. | 34,547 | 3,789 |
| Union Pacific Corp. | 53,196 | 3,785 |
14
Structured Large-Cap Equity Fund
|
|
| Market |
|
|
| Value• |
|
| Shares | ($000) |
| United Technologies Corp. | 61,954 | 3,721 |
| Caterpillar, Inc. | 61,675 | 3,676 |
| Waste Management, Inc. | 114,100 | 3,593 |
| CSX Corp. | 62,700 | 3,422 |
| Cooper Industries, Inc. |
|
|
| Class A | 78,000 | 3,116 |
| Honeywell International Inc. | 72,287 | 3,003 |
| Burlington Northern |
|
|
| Santa Fe Corp. | 32,291 | 2,985 |
| 3M Co. | 42,432 | 2,898 |
| Parker Hannifin Corp. | 50,700 | 2,687 |
| Raytheon Co. | 48,005 | 2,569 |
| Cummins Inc. | 57,500 | 2,514 |
| Ryder System, Inc. | 36,900 | 2,288 |
| Ingersoll-Rand Co. | 70,900 | 2,210 |
| Emerson Electric Co. | 42,558 | 1,736 |
| Fluor Corp. | 27,800 | 1,548 |
| General Dynamics Corp. | 20,244 | 1,490 |
| The Manitowoc Co., Inc. | 94,400 | 1,468 |
| Textron, Inc. | 46,320 | 1,356 |
| FedEx Corp. | 14,544 | 1,150 |
| Deere & Co. | 21,800 | 1,079 |
| Northrop Grumman Corp. | 13,921 | 843 |
| Goodrich Corp. | 18,300 | 761 |
| L-3 Communications |
|
|
| Holdings, Inc. | 6,900 | 678 |
| Danaher Corp. | 7,600 | 527 |
| Illinois Tool Works, Inc. | 11,808 | 525 |
| Tyco International, Ltd. | 9,413 | 330 |
* | Allied Waste Industries, Inc. | 13,013 | 145 |
|
|
| 87,627 |
Information Technology (15.8%) |
|
| |
| Microsoft Corp. | 655,333 | 17,491 |
| International Business |
|
|
| Machines Corp. | 114,745 | 13,421 |
| Hewlett-Packard Co. | 213,515 | 9,873 |
* | Cisco Systems, Inc. | 431,789 | 9,741 |
| Intel Corp. | 482,068 | 9,029 |
* | Apple Inc. | 71,846 | 8,166 |
* | Oracle Corp. | 356,637 | 7,243 |
* | Google Inc. | 16,655 | 6,671 |
| QUALCOMM Inc. | 110,592 | 4,752 |
* | Symantec Corp. | 203,800 | 3,990 |
| Tyco Electronics Ltd. | 113,800 | 3,148 |
| Texas Instruments, Inc. | 136,163 | 2,927 |
* | BMC Software, Inc. | 95,733 | 2,741 |
* | EMC Corp. | 220,450 | 2,637 |
* | Yahoo! Inc. | 150,845 | 2,610 |
* | Adobe Systems, Inc. | 65,400 | 2,581 |
| Corning, Inc. | 162,961 | 2,549 |
* | Dell Inc. | 153,964 | 2,537 |
| Western Union Co. | 85,800 | 2,117 |
* | Lexmark International, Inc. | 61,500 | 2,003 |
* | Novell, Inc. | 374,500 | 1,925 |
* | NVIDIA Corp. | 170,100 | 1,822 |
* | MEMC Electronic |
|
|
| Materials, Inc. | 44,300 | 1,252 |
* | eBay Inc. | 55,346 | 1,239 |
| Analog Devices, Inc. | 43,500 | 1,146 |
| CA, Inc. | 45,200 | 902 |
| Applied Materials, Inc. | 57,934 | 876 |
| Automatic Data |
|
|
| Processing, Inc. | 19,120 | 817 |
| Motorola, Inc. | 82,089 | 586 |
* | Sun Microsystems, Inc. | 68,525 | 521 |
* | QLogic Corp. | 13,000 | 200 |
* | Affiliated Computer |
|
|
| Services, Inc. Class A | 3,400 | 172 |
* | Convergys Corp. | 10,300 | 152 |
| National Semiconductor Corp. | 6,000 | 103 |
* | LSI Corp. | 19,200 | 103 |
| Xilinx, Inc. | 3,700 | 87 |
|
|
| 128,130 |
Materials (3.0%) |
|
| |
| Monsanto Co. | 50,470 | 4,996 |
| Eastman Chemical Co. | 49,700 | 2,737 |
| Nucor Corp. | 60,900 | 2,406 |
| Freeport-McMoRan Copper |
|
|
| & Gold, Inc. Class B | 39,900 | 2,268 |
| E.I. du Pont de Nemours & Co. | 50,070 | 2,018 |
| Alcoa Inc. | 88,900 | 2,007 |
| United States Steel Corp. | 22,606 | 1,754 |
| Dow Chemical Co. | 47,758 | 1,518 |
| Allegheny Technologies Inc. | 40,100 | 1,185 |
| Praxair, Inc. | 16,000 | 1,148 |
| International Paper Co. | 41,500 | 1,086 |
| AK Steel Holding Corp. | 37,900 | 982 |
| Air Products & Chemicals, Inc. | 2,600 | 178 |
|
|
| 24,283 |
Telecommunication Services (3.1%) |
|
| |
| AT&T Inc. | 497,572 | 13,892 |
| Verizon Communications Inc. | 199,480 | 6,401 |
| Windstream Corp. | 151,900 | 1,662 |
| Qwest Communications |
|
|
| International Inc. | 445,048 | 1,437 |
| Sprint Nextel Corp. | 119,282 | 728 |
| Embarq Corp. | 16,800 | 681 |
| CenturyTel, Inc. | 9,900 | 363 |
|
|
| 25,164 |
Utilities (3.7%) |
|
| |
| American Electric |
|
|
| Power Co., Inc. | 99,900 | 3,704 |
| Consolidated Edison Inc. | 83,600 | 3,592 |
| Entergy Corp. | 37,800 | 3,365 |
| Edison International | 79,200 | 3,160 |
| Dominion Resources, Inc. | 65,060 | 2,783 |
| Exelon Corp. | 41,375 | 2,591 |
| Duke Energy Corp. | 146,770 | 2,558 |
| FPL Group, Inc. | 43,500 | 2,188 |
15
Structured Large-Cap Equity Fund
|
|
| Market |
|
|
| Value• |
|
| Shares | ($000) |
| Public Service Enterprise |
|
|
| Group, Inc. | 62,700 | 2,056 |
| Southern Co. | 37,012 | 1,395 |
| Ameren Corp. | 23,300 | 909 |
| Questar Corp. | 21,900 | 896 |
| DTE Energy Co. | 15,300 | 614 |
| CMS Energy Corp. | 7,500 | 94 |
| Pepco Holdings, Inc. | 2,500 | 57 |
|
|
| 29,962 |
Total Common Stocks |
|
| |
(Cost $904,229) |
| 802,758 | |
Temporary Cash Investments (1.0%)1 |
|
| |
Money Market Fund (0.9%) |
|
| |
2 | Vanguard Market |
|
|
| Liquidity Fund, 2.296% | 7,254,210 | 7,254 |
|
|
|
|
|
|
|
|
|
| Face |
|
|
| Amount |
|
|
| ($000) |
|
U.S. Government Agency Obligations (0.1%) | |||
3,4 | Federal Home Loan Bank, |
|
|
| 2.433%, 11/6/08 | 200 | 199 |
3,4 | Federal Home Loan Bank, |
|
|
| 2.576%, 11/24/08 | 300 | 299 |
3,4 | Federal Home Loan Bank, |
|
|
| 3.257%, 2/2/09 | 500 | 495 |
|
|
| 993 |
Total Temporary Cash Investments |
|
| |
(Cost $8,247) |
| 8,247 | |
Total Investments (99.8%) |
|
| |
(Cost $912,476) |
| 811,005 | |
Other Assets and Liabilities (0.2%) |
|
| |
Other Assets |
| 2,190 | |
Liabilities |
| (627) | |
|
|
| 1,563 |
Net Assets (100%) |
| 812,568 | |
At September 30, 2008, net assets consisted of: | |
| Amount |
| ($000) |
Paid-in Capital | 961,941 |
Undistributed Net Investment Income | 13,193 |
Accumulated Net Realized Losses | (60,659) |
Unrealized Appreciation (Depreciation) |
|
Investment Securities | (101,471) |
Futures Contracts | (436) |
Net Assets | 812,568 |
|
|
|
|
Institutional Shares—Net Assets |
|
Applicable to 6,005,569 outstanding |
|
$.001 par value shares of beneficial |
|
interest (unlimited authorization) | 135,478 |
Net Asset Value Per Share— |
|
Institutional Shares | $22.56 |
|
|
|
|
Institutional Plus Shares—Net Assets |
|
Applicable to 14,995,075 outstanding |
|
$.001 par value shares of beneficial |
|
interest (unlimited authorization) | 677,090 |
Net Asset Value Per Share— |
|
Institutional Plus Shares | $45.15 |
• See Note A in Notes to Financial Statements.
* Non-income-producing security.
1 The fund invests a portion of its cash reserves in equity markets through the use of index futures contracts. After giving effect to futures investments, the fund’s effective common stock and temporary cash investment positions represent 100.0% and –0.2%, respectively, of net assets.
2 Affiliated money market fund available only to Vanguard funds and certain trusts and accounts managed by Vanguard. Rate shown is the 7-day yield.
3 The issuer operates under a congressional charter; its securities are neither issued nor guaranteed by the U.S. government.
4 Securities with a value of $993,000 have been segregated as initial margin for open futures contracts.
REIT—Real Estate Investment Trust.
See accompanying Notes, which are an integral part of the Financial Statements.
16
Structured Large-Cap Equity Fund
Statement of Operations
| Year Ended |
| September 30, 2008 |
| ($000) |
Investment Income |
|
Income |
|
Dividends | 19,268 |
Interest1 | 56 |
Security Lending | 10 |
Total Income | 19,334 |
Expenses |
|
The Vanguard Group—Note B |
|
Investment Advisory Services | 287 |
Management and Administrative—Institutional Shares | 194 |
Management and Administrative—Institutional Plus Shares | 411 |
Marketing and Distribution—Institutional Shares | 43 |
Marketing and Distribution—Institutional Plus Shares | 197 |
Custodian Fees | 49 |
Auditing Fees | 24 |
Shareholders’ Reports—Institutional Shares | 7 |
Shareholders’ Reports—Institutional Plus Shares | 3 |
Trustees’ Fees and Expenses | 1 |
Total Expenses | 1,216 |
Net Investment Income | 18,118 |
Realized Net Gain (Loss) |
|
Investment Securities Sold | (55,274) |
Futures Contracts | (360) |
Realized Net Gain (Loss) | (55,634) |
Change in Unrealized Appreciation (Depreciation) |
|
Investment Securities | (191,659) |
Futures Contracts | (436) |
Change in Unrealized Appreciation (Depreciation) | (192,095) |
Net Increase (Decrease) in Net Assets Resulting from Operations | (229,611) |
1 Interest income from an affiliated company of the fund was $47,000.
See accompanying Notes, which are an integral part of the Financial Statements.
17
Structured Large-Cap Equity Fund
Statement of Changes in Net Assets
| Year Ended September 30, | |
| 2008 | 2007 |
| ($000) | ($000) |
Increase (Decrease) in Net Assets |
|
|
Operations |
|
|
Net Investment Income | 18,118 | 13,509 |
Realized Net Gain (Loss) | (55,634) | 8,336 |
Change in Unrealized Appreciation (Depreciation) | (192,095) | 77,834 |
Net Increase (Decrease) in Net Assets Resulting from Operations | (229,611) | 99,679 |
Distributions |
|
|
Net Investment Income |
|
|
Institutional Shares | (2,671) | (940) |
Institutional Plus Shares | (12,716) | (3,704) |
Realized Capital Gain1 |
|
|
Institutional Shares | (2,428) | (67) |
Institutional Plus Shares | (10,809) | (218) |
Total Distributions | (28,624) | (4,929) |
Capital Share Transactions |
|
|
Institutional Shares | (5,788) | 36,315 |
Institutional Plus Shares | 70,557 | 544,425 |
Net Increase (Decrease) from Capital Share Transactions | 64,769 | 580,740 |
Total Increase (Decrease) | (193,466) | 675,490 |
Net Assets |
|
|
Beginning of Period | 1,006,034 | 330,544 |
End of Period2 | 812,568 | 1,006,034 |
1 Includes fiscal 2008 and 2007 short-term gain distributions totaling $9,615,000 and $285,000, respectively. Short-term gain distributions are treated as ordinary income dividends for tax purposes.
2 Net Assets—End of Period includes undistributed net investment income of $13,193,000 and $10,462,000. See accompanying Notes, which are an integral part of the Financial Statements.
18
Structured Large-Cap Equity Fund
Financial Highlights
Institutional Shares |
|
|
|
|
|
|
|
|
| May 16, | |
| Year Ended | 20061 to | |
| September 30, | Sept. 30, | |
For a Share Outstanding Throughout Each Period | 2008 | 2007 | 2006 |
Net Asset Value, Beginning of Period | $29.98 | $26.03 | $24.96 |
Investment Operations |
|
|
|
Net Investment Income | .492 | .4762 | .130 |
Net Realized and Unrealized Gain (Loss) on Investments | (7.091) | 3.657 | .940 |
Total from Investment Operations | (6.599) | 4.133 | 1.070 |
Distributions |
|
|
|
Dividends from Net Investment Income | (.430) | (.172) | — |
Distributions from Realized Capital Gains | (.391) | (.011) | — |
Total Distributions | (.821) | (.183) | — |
Net Asset Value, End of Period | $22.56 | $29.98 | $26.03 |
|
|
|
|
|
|
|
|
Total Return | –22.52% | 15.94% | 4.29% |
|
|
|
|
|
|
|
|
Ratios/Supplemental Data |
|
|
|
Net Assets, End of Period (Millions) | $135 | $187 | $127 |
Ratio of Total Expenses to Average Net Assets | 0.20% | 0.25% | 0.25%3 |
Ratio of Net Investment Income to Average Net Assets | 1.91% | 1.69% | 1.67%3 |
Portfolio Turnover Rate | 72% | 54%4 | 30% |
1 Inception.
2 Calculated based on average shares outstanding.
3 Annualized.
4 Excludes the value of portfolio securities received or delivered as a result of in-kind purchases or redemptions of the fund’s capital shares. See accompanying Notes, which are an integral part of the Financial Statements.
19
Structured Large-Cap Equity Fund
Institutional Plus Shares |
|
|
|
|
|
|
|
|
| May 15, | |
| Year Ended | 20061 to | |
| September 30, | Sept. 30, | |
For a Share Outstanding Throughout Each Period | 2008 | 2007 | 2006 |
Net Asset Value, Beginning of Period | $60.02 | $52.07 | $50.00 |
Investment Operations |
|
|
|
Net Investment Income | 1.025 | 1.0182 | .250 |
Net Realized and Unrealized Gain (Loss) on Investments | (14.193) | 7.317 | 1.820 |
Total from Investment Operations | (13.168) | 8.335 | 2.070 |
Distributions |
|
|
|
Dividends from Net Investment Income | (.920) | (.363) | — |
Distributions from Realized Capital Gains | (.782) | (.022) | — |
Total Distributions | (1.702) | (.385) | — |
Net Asset Value, End of Period | $45.15 | $60.02 | $52.07 |
|
|
|
|
|
|
|
|
Total Return | –22.46% | 16.07% | 4.14% |
|
|
|
|
|
|
|
|
Ratios/Supplemental Data |
|
|
|
Net Assets, End of Period (Millions) | $677 | $819 | $203 |
Ratio of Total Expenses to Average Net Assets | 0.12% | 0.15% | 0.15%3 |
Ratio of Net Investment Income to Average Net Assets | 1.99% | 1.79% | 1.77%3 |
Portfolio Turnover Rate | 72% | 54%4 | 30% |
1 Inception.
2 Calculated based on average shares outstanding.
3 Annualized.
4 Excludes the value of portfolio securities received or delivered as a result of in-kind purchases or redemptions of the fund’s capital shares. See accompanying Notes, which are an integral part of the Financial Statements.
20
Structured Large-Cap Equity Fund
Notes to Financial Statements
Vanguard Structured Large-Cap Equity Fund is registered under the Investment Company Act of 1940 as an open-end investment company, or mutual fund. The fund offers two classes of shares: Institutional Shares and Institutional Plus Shares. Institutional Shares are available to investors who invest a minimum amount of $5 million. Institutional Plus Shares are available to investors who invest a minimum amount of $200 million ($100 million for investors with total Vanguard investments of at least $1 billion).
A. The following significant accounting policies conform to generally accepted accounting principles for U.S. mutual funds. The fund consistently follows such policies in preparing its financial statements.
1. Security Valuation: Securities are valued as of the close of trading on the New York Stock Exchange (generally 4 p.m., Eastern time) on the valuation date. Equity securities are valued at the latest quoted sales prices or official closing prices taken from the primary market in which each security trades; such securities not traded on the valuation date are valued at the mean of the latest quoted bid and asked prices. Securities for which market quotations are not readily available, or whose values have been materially affected by events occurring before the fund’s pricing time but after the close of the securities’ primary markets, are valued by methods deemed by the board of trustees to represent fair value. Investments in Vanguard Market Liquidity Fund are valued at that fund’s net asset value. Temporary cash investments acquired over 60 days to maturity are valued using the latest bid prices or using valuations based on a matrix system (which considers such factors as security prices, yields, maturities, and ratings), both as furnished by independent pricing services. Other temporary cash investments are valued at amortized cost, which approximates market value.
2. Futures Contracts: The fund uses index futures contracts to a limited extent, with the objective of maintaining full exposure to the stock market while maintaining liquidity. The fund may purchase or sell futures contracts to achieve a desired level of investment, whether to accommodate portfolio turnover or cash flows from capital share transactions. The primary risks associated with the use of futures contracts are imperfect correlation between changes in market values of stocks held by the fund and the prices of futures contracts, and the possibility of an illiquid market.
Futures contracts are valued at their quoted daily settlement prices. The aggregate principal amounts of the contracts are not recorded in the Statement of Net Assets. Fluctuations in the value of the contracts are recorded in the Statement of Net Assets as an asset (liability) and in the Statement of Operations as unrealized appreciation (depreciation) until the contracts are closed, when they are recorded as realized futures gains (losses).
3. Federal Income Taxes: The fund intends to continue to qualify as a regulated investment company and distribute all of its taxable income. Management has analyzed the fund’s tax positions taken on federal income tax returns for all open tax years (tax years ended September 30, 2006–2008), and has concluded that no provision for federal income tax is required in the fund’s financial statements.
4. Distributions: Distributions to shareholders are recorded on the ex-dividend date.
5. Security Lending: The fund may lend its securities to qualified institutional borrowers to earn additional income. Security loans are required to be secured at all times by collateral at least equal to the market value of securities loaned. The fund invests cash collateral received in Vanguard Market Liquidity Fund, and records a liability for the return of the collateral, during the period the securities are on loan. Security lending income represents the income earned on investing cash collateral, less expenses associated with the loan.
21
Structured Large-Cap Equity Fund
6. Other: Dividend income is recorded on the ex-dividend date. Interest income includes income distributions received from Vanguard Market Liquidity Fund and is accrued daily. Security transactions are accounted for on the date securities are bought or sold. Costs used to determine realized gains (losses) on the sale of investment securities are those of the specific securities sold.
Each class of shares has equal rights as to assets and earnings, except that each class separately bears certain class-specific expenses related to maintenance of shareholder accounts (included in Management and Administrative expenses) and shareholder reporting. Marketing and distribution expenses are allocated to each class of shares based on a method approved by the board of trustees. Income, other non-class-specific expenses, and gains and losses on investments are allocated to each class of shares based on its relative net assets.
B. The Vanguard Group furnishes at cost investment advisory, corporate management, administrative, marketing, and distribution services. The costs of such services are allocated to the fund under methods approved by the board of trustees. The fund has committed to provide up to 0.40% of its net assets in capital contributions to Vanguard. At September 30, 2008, the fund had contributed capital of $77,000 to Vanguard (included in Other Assets), representing 0.01% of the fund’s net assets and 0.08% of Vanguard’s capitalization. The fund’s trustees and officers are also directors and officers of Vanguard.
C. Distributions are determined on a tax basis and may differ from net investment income and realized capital gains for financial reporting purposes. Differences may be permanent or temporary. Permanent differences are reclassified among capital accounts in the financial statements to reflect their tax character. Temporary differences arise when certain items of income, expense, gain, or loss are recognized in different periods for financial statement and tax purposes; these differences will reverse at some time in the future. Differences in classification may also result from the treatment of short-term gains as ordinary income for tax purposes.
For tax purposes, at September 30, 2008, the fund had $13,689,000 of ordinary income available for distribution. Tax-basis capital gains required to be distributed in December 2007 included net gains realized through October 31, 2007. Subsequently, the fund realized capital losses of $61,104,000, which are available to offset future net capital gains.
At September 30, 2008, the cost of investment securities for tax purposes was $912,476,000. Net unrealized depreciation of investment securities for tax purposes was $101,471,000, consisting of unrealized gains of $46,230,000 on securities that had risen in value since their purchase and $147,701,000 in unrealized losses on securities that had fallen in value since their purchase.
At September 30, 2008, the aggregate settlement value of open futures contracts expiring in December 2008 and the related unrealized appreciation (depreciation) were:
|
|
| ($000) |
| Number of | Aggregate | Unrealized |
| Long (Short) | Settlement | Appreciation |
Futures Contracts | Contracts | Value | (Depreciation) |
S&P 500 Index | 22 | 6,430 | (352) |
E-mini S&P 500 Index | 56 | 3,273 | (84) |
Unrealized appreciation (depreciation) on open futures contracts is required to be treated as realized gain (loss) for tax purposes.
22
Structured Large-Cap Equity Fund
D. During the year ended September 30, 2008, the fund purchased $708,684,000 of investment securities and sold $665,224,000 of investment securities, other than temporary cash investments.
E. Capital share transactions for each class of shares were:
| Year Ended September 30, | ||||
|
| 2008 |
|
| 2007 |
| Amount | Shares |
| Amount | Shares |
| ($000) | (000) |
| ($000) | (000) |
Institutional Shares |
|
|
|
|
|
Issued | 2,581 | 99 |
| 43,142 | 1,567 |
Issued in Lieu of Cash Distributions | 958 | 35 |
| 34 | 1 |
Redeemed | (9,327) | (359) |
| (6,861) | (234) |
Net Increase (Decrease)—Institutional Shares | (5,788) | (225) |
| 36,315 | 1,334 |
Institutional Plus Shares |
|
|
|
|
|
Issued | 53,067 | 1,029 |
| 540,496 | 9,679 |
Issued in Lieu of Cash Distributions | 17,490 | 316 |
| 3,929 | 71 |
Redeemed | — | — |
| — | — |
Net Increase (Decrease)—Institutional Plus Shares | 70,557 | 1,345 |
| 544,425 | 9,750 |
F. In September 2006, the Financial Accounting Standards Board issued Statement of Financial Accounting Standards No. 157 (“FAS 157”), “Fair Value Measurements.” FAS 157 establishes a framework for measuring fair value and expands disclosures about fair value measurements in financial statements.
The various inputs that may be used to determine the value of the fund’s investments are summarized in three broad levels. The inputs or methodologies used for valuing securities are not necessarily an indication of the risk associated with investing in those securities.
Level 1—Quoted prices in active markets for identical securities.
Level 2—Other significant observable inputs (including quoted prices for similar securities, interest rates, prepayment speeds, credit risk, etc.).
Level 3—Significant unobservable inputs (including the fund’s own assumptions used to determine the fair value of investments).
The following table summarizes the fund’s investments as of September 30, 2008, based on the inputs used to value them:
| Investments | Futures |
| in Securities | Contracts |
Valuation Inputs | ($000) | ($000) |
Level 1—Quoted prices | 810,012 | (436) |
Level 2—Other significant observable inputs | 993 | — |
Level 3—Significant unobservable inputs | — | — |
Total | 811,005 | (436) |
23
Structured Large-Cap Growth Fund
Fund Profile
As of September 30, 2008
Portfolio Characteristics |
|
| |
|
| Comparative | Broad |
| Fund | Index1 | Index2 |
Number of Stocks | 244 | 647 | 4,679 |
Median Market Cap | $33.0B | $31.9B | $29.6B |
Price/Earnings Ratio | 14.6x | 16.1x | 15.5x |
Price/Book Ratio | 3.1x | 3.4x | 2.2x |
Yield3 |
| 1.5% | 2.3% |
Institutional Shares | 1.3% |
|
|
Institutional |
|
|
|
Plus Shares | 1.4% |
|
|
Return on Equity | 22.9% | 23.5% | 20.0% |
Earnings Growth Rate | 23.3% | 22.6% | 17.7% |
Foreign Holdings | 0.0% | 0.0% | 0.0% |
Turnover Rate | 70% | — | — |
Expense Ratio |
|
|
|
(9/30/2007)4 |
| — | — |
Institutional Shares | 0.25% |
|
|
Institutional |
|
|
|
Plus Shares | 0.15% |
|
|
Short-Term Reserves | 0.0% | — | — |
Sector Diversification (% of equity exposure) | |||
|
| Comparative | Broad |
| Fund | Index1 | Index2 |
Consumer Discretionary | 9.4% | 9.5% | 9.2% |
Consumer Staples | 13.6 | 13.7 | 10.5 |
Energy | 10.3 | 10.2 | 12.6 |
Financials | 4.6 | 4.5 | 17.3 |
Health Care | 14.3 | 14.1 | 13.0 |
Industrials | 13.0 | 13.1 | 11.4 |
Information Technology | 28.6 | 28.6 | 15.7 |
Materials | 3.7 | 3.8 | 3.7 |
Telecommunication |
|
|
|
Services | 0.8 | 0.8 | 2.8 |
Utilities | 1.7 | 1.7 | 3.8 |
Ten Largest Holdings5 (% of total net assets) | ||
|
|
|
Microsoft Corp. | systems software | 3.8% |
International Business |
|
|
Machines Corp. | computer hardware | 2.8 |
Cisco Systems, Inc. | communications |
|
| equipment | 2.2 |
Hewlett-Packard Co. | computer hardware | 2.1 |
Wal-Mart Stores, Inc. | hypermarkets and |
|
| super centers | 2.0 |
PepsiCo, Inc. | soft drinks | 1.9 |
Philip Morris |
|
|
International Inc. |
| 1.8 |
Apple Inc. | computer hardware | 1.8 |
Intel Corp. | semiconductors | 1.7 |
Google Inc. | internet software |
|
| and services | 1.6 |
Top Ten |
| 21.7% |
Investment Focus
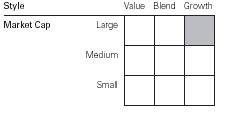
1 Russell 1000 Growth Index.
2 Dow Jones Wilshire 5000 Index.
3 30-day SEC yield for the fund; annualized dividend yield for the indexes. See the Glossary.
4 The expense ratios shown are from the prospectus dated January 28, 2008. For the fiscal year ended September 30, 2008, the expense ratios were 0.20% for Institutional Shares and 0.12% for Institutional Plus Shares.
5 The holdings listed exclude any temporary cash investments and equity index products.
24
Structured Large-Cap Growth Fund
Performance Summary
All of the returns in this report represent past performance, which is not a guarantee of future results that may be achieved by the fund. (Current performance may be lower or higher than the performance data cited. For performance data current to the most recent month-end, visit our website at www.vanguard.com/performance.) Note, too, that both investment returns and principal value can fluctuate widely, so an investor’s shares, when sold, could be worth more or less than their original cost. The returns shown do not reflect taxes that a shareholder would pay on fund distributions or on the sale of fund shares.
Cumulative Performance: January 19, 2006–September 30, 2008
Initial Investment of $200,000,000
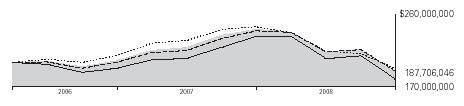
|
|
|
|
| Average Annual Total Returns |
| |
| Periods Ended September 30, 2008 | Final Value of a | |
|
| Since | $200,000,000 |
| One Year | Inception1 | Investment |
Structured Large-Cap Growth Fund |
|
|
|
Institutional Plus Shares | –22.16% | –2.33% | $187,706,046 |
Dow Jones Wilshire 5000 Index | –21.20 | –1.39 | 192,608,635 |
Russell 1000 Growth Index | –20.88 | –2.01 | 189,334,974 |
Average Large-Cap Growth Fund2 | –22.95 | –4.05 | 178,907,974 |
|
|
| Final Value of a |
|
| Since | $5,000,000 |
| One Year | Inception1 | Investment |
Structured Large-Cap Growth Fund |
|
|
|
Institutional Shares | –22.20% | –15.91% | $4,009,111 |
Dow Jones Wilshire 5000 Index | –21.20 | –16.07 | 3,999,274 |
Russell 1000 Growth Index | –20.88 | –14.06 | 4,121,828 |
1 Performance for the fund and its comparative standards is calculated since the following inception dates: January 19, 2006, for Institutional Plus Shares; June 22, 2007, for Institutional Shares.
2 Derived from data provided by Lipper Inc.
25
Structured Large-Cap Growth Fund
Fiscal-Year Total Returns (%): January 19, 2006–September 30, 2008
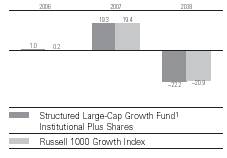
1 The fund commenced operations as a registered investment company on October 3, 2006. The fund’s performance includes the performance of a predecessor trust, Vanguard Fiduciary Trust Company Structured Large-Cap Growth Trust, from January 19, 2006, to October 3, 2006.
Note: See Financial Highlights tables for dividend and capital gains information.
26
Structured Large-Cap Growth Fund
Financial Statements
Statement of Net Assets
As of September 30, 2008
The fund provides a complete list of its holdings four times in each fiscal year, at the quarter-ends. For the second and fourth fiscal quarters, the lists appear in the fund’s semiannual and annual reports to shareholders. For the first and third fiscal quarters, the fund files the lists with the Securities and Exchange Commission on Form N-Q. Shareholders can look up the fund’s Forms N-Q on the SEC’s website at www.sec.gov. Forms N-Q may also be reviewed and copied at the SEC’s Public Reference Room (see the back cover of this report for further information).
|
|
| Market |
|
|
| Value• |
|
| Shares | ($000) |
Common Stocks (99.5%)1 |
|
| |
Consumer Discretionary (9.4%) |
|
| |
| McDonald’s Corp. | 10,764 | 664 |
| Target Corp. | 6,520 | 320 |
| Best Buy Co., Inc. | 7,273 | 273 |
| NIKE, Inc. Class B | 3,728 | 249 |
| H & R Block, Inc. | 10,900 | 246 |
* | AutoZone Inc. | 1,750 | 216 |
| Comcast Corp. Class A | 10,829 | 213 |
| Omnicom Group Inc. | 5,502 | 212 |
| The Gap, Inc. | 11,700 | 208 |
* | ITT Educational Services, Inc. | 2,400 | 194 |
| Darden Restaurants Inc. | 6,684 | 191 |
* | Urban Outfitters, Inc. | 6,000 | 191 |
* | Big Lots Inc. | 6,500 | 181 |
| Burger King Holdings Inc. | 7,308 | 179 |
* | Hanesbrands Inc. | 7,600 | 165 |
* | Amazon.com, Inc. | 2,200 | 160 |
* | The Goodyear Tire & |
|
|
| Rubber Co. | 10,300 | 158 |
* | DISH Network Corp. | 7,286 | 153 |
| News Corp., Class A | 11,934 | 143 |
| The Walt Disney Co. | 3,942 | 121 |
* | DIRECTV Group, Inc. | 4,460 | 117 |
| DeVry, Inc. | 1,800 | 89 |
| TJX Cos., Inc. | 2,900 | 88 |
| Carnival Corp. | 2,485 | 88 |
| Lowe’s Cos., Inc. | 3,323 | 79 |
* | Viacom Inc. Class B | 2,659 | 66 |
* | GameStop Corp. Class A | 1,900 | 65 |
| Time Warner, Inc. | 3,849 | 50 |
| Advance Auto Parts, Inc. | 1,200 | 48 |
| The McGraw-Hill Cos., Inc. | 1,200 | 38 |
| Starwood Hotels & Resorts |
|
|
| Worldwide, Inc. | 1,200 | 34 |
| Polo Ralph Lauren Corp. | 300 | 20 |
* | Las Vegas Sands Corp. | 130 | 5 |
|
|
| 5,224 |
Consumer Staples (13.5%) |
|
| |
| Wal-Mart Stores, Inc. | 18,257 | 1,093 |
| PepsiCo, Inc. | 14,611 | 1,041 |
| Philip Morris International Inc. | 21,369 | 1,028 |
| The Procter & Gamble Co. | 11,649 | 812 |
| The Coca-Cola Co. | 14,483 | 766 |
| Altria Group, Inc. | 18,069 | 358 |
| Costco Wholesale Corp. | 5,075 | 330 |
| Colgate-Palmolive Co. | 4,005 | 302 |
| Walgreen Co. | 9,510 | 294 |
| Brown-Forman Corp. Class B | 3,100 | 223 |
| Herbalife Ltd. | 4,800 | 190 |
| CVS/Caremark Corp. | 5,584 | 188 |
| Anheuser-Busch Cos., Inc. | 2,789 | 181 |
* | NBTY, Inc. | 5,800 | 171 |
| The Kroger Co. | 4,800 | 132 |
| Lorillard, Inc. | 1,300 | 92 |
| H.J. Heinz Co. | 1,800 | 90 |
* | Dean Foods Co. | 3,600 | 84 |
| General Mills, Inc. | 800 | 55 |
| Kimberly-Clark Corp. | 679 | 44 |
* | Bare Escentuals, Inc. | 4,000 | 43 |
| Sysco Corp. | 1,194 | 37 |
|
|
| 7,554 |
Energy (10.3%) |
|
| |
| Schlumberger Ltd. | 10,700 | 835 |
| ExxonMobil Corp. | 8,473 | 658 |
| Occidental Petroleum Corp. | 8,600 | 606 |
* | Transocean, Inc. | 2,957 | 325 |
| Williams Cos., Inc. | 12,000 | 284 |
| Murphy Oil Corp. | 4,300 | 276 |
| Hess Corp. | 3,300 | 271 |
| Noble Corp. | 5,652 | 248 |
| Halliburton Co. | 6,690 | 217 |
| ENSCO International, Inc. | 3,697 | 213 |
* | Plains Exploration & |
|
|
| Production Co. | 4,400 | 155 |
* | National Oilwell Varco Inc. | 3,048 | 153 |
| W&T Offshore, Inc. | 5,500 | 150 |
* | Whiting Petroleum Corp. | 2,100 | 150 |
27
Structured Large-Cap Growth Fund
|
|
| Market |
|
|
| Value• |
|
| Shares | ($000) |
* | Denbury Resources, Inc. | 7,408 | 141 |
* | Unit Corp. | 2,600 | 129 |
| Baker Hughes, Inc. | 2,039 | 123 |
* | Weatherford International Ltd. | 4,700 | 118 |
* | Mariner Energy Inc. | 5,200 | 107 |
* | Southwestern Energy Co. | 3,400 | 104 |
| EOG Resources, Inc. | 1,150 | 103 |
* | Pride International, Inc. | 3,300 | 98 |
| Massey Energy Co. | 2,700 | 96 |
| Tidewater Inc. | 1,300 | 72 |
| Chesapeake Energy Corp. | 1,700 | 61 |
| Noble Energy, Inc. | 800 | 44 |
|
|
| 5,737 |
Financials (4.5%) |
|
| |
| Northern Trust Corp. | 4,230 | 305 |
| Charles Schwab Corp. | 11,615 | 302 |
| American Express Co. | 6,427 | 228 |
| AFLAC Inc. | 3,569 | 210 |
* | TD Ameritrade Holding Corp. | 11,100 | 180 |
| Simon Property Group, Inc. |
|
|
| REIT | 1,791 | 174 |
* | Nasdaq Stock Market Inc. | 4,800 | 147 |
| State Street Corp. | 1,966 | 112 |
| CME Group, Inc. | 292 | 109 |
| The Goldman Sachs Group, Inc. | 816 | 104 |
| Taubman Co. REIT | 1,700 | 85 |
| HCP, Inc. REIT | 2,100 | 84 |
| Axis Capital Holdings Ltd. | 2,400 | 76 |
| Camden Property Trust REIT | 1,600 | 73 |
| Transatlantic Holdings, Inc. | 1,200 | 65 |
| Hudson City Bancorp, Inc. | 3,500 | 65 |
| Ventas, Inc. REIT | 1,300 | 64 |
| Discover Financial Services | 4,100 | 57 |
| Morgan Stanley | 1,700 | 39 |
| Franklin Resources Corp. | 186 | 16 |
|
|
| 2,495 |
Health Care (14.3%) |
|
| |
| Abbott Laboratories | 13,769 | 793 |
| Medtronic, Inc. | 10,940 | 548 |
| Johnson & Johnson | 7,412 | 514 |
| Baxter International, Inc. | 6,442 | 423 |
* | Gilead Sciences, Inc. | 9,270 | 423 |
* | Express Scripts Inc. | 4,578 | 338 |
* | Genentech, Inc. | 3,755 | 333 |
* | St. Jude Medical, Inc. | 7,200 | 313 |
* | Celgene Corp. | 4,900 | 310 |
| Bristol-Myers Squibb Co. | 14,018 | 292 |
* | Medco Health Solutions, Inc. | 6,190 | 279 |
* | Biogen Idec Inc. | 5,031 | 253 |
| McKesson Corp. | 4,240 | 228 |
* | Cephalon, Inc. | 2,938 | 228 |
| Quest Diagnostics, Inc. | 4,400 | 227 |
| Merck & Co., Inc. | 7,103 | 224 |
| Schering-Plough Corp. | 11,832 | 219 |
* | DaVita, Inc. | 3,600 | 205 |
* | Watson Pharmaceuticals, Inc. | 7,000 | 199 |
* | Warner Chilcott Ltd. | 12,600 | 191 |
* | Invitrogen Corp. | 4,800 | 181 |
| AmerisourceBergen Corp. | 4,730 | 178 |
* | Boston Scientific Corp. | 14,200 | 174 |
| Becton, Dickinson & Co. | 1,941 | 156 |
| Aetna Inc. | 4,217 | 152 |
* | Thermo Fisher Scientific, Inc. | 2,400 | 132 |
| Stryker Corp. | 1,927 | 120 |
| Eli Lilly & Co. | 2,200 | 97 |
| UnitedHealth Group Inc. | 2,049 | 52 |
* | Intuitive Surgical, Inc. | 200 | 48 |
* | Charles River Laboratories, Inc. | 800 | 44 |
* | WellCare Health Plans Inc. | 1,100 | 40 |
| Perrigo Co. | 700 | 27 |
* | Genzyme Corp. | 200 | 16 |
* | Fresenius Kabi |
|
|
| Pharmaceuticals |
|
|
| Holding, Inc. | 1,300 | 1 |
|
|
| 7,958 |
Industrials (12.9%) |
|
| |
| Caterpillar, Inc. | 6,825 | 407 |
| Lockheed Martin Corp. | 3,704 | 406 |
| 3M Co. | 5,826 | 398 |
| Union Pacific Corp. | 5,366 | 382 |
| CSX Corp. | 6,435 | 351 |
| The Boeing Co. | 6,104 | 350 |
| United Parcel Service, Inc. | 5,547 | 349 |
| Honeywell International Inc. | 7,780 | 323 |
| L-3 Communications |
|
|
| Holdings, Inc. | 2,700 | 265 |
| United Technologies Corp. | 4,282 | 257 |
| Emerson Electric Co. | 5,946 | 243 |
| Burlington Northern |
|
|
| Santa Fe Corp. | 2,600 | 240 |
| Tyco International, Ltd. | 6,800 | 238 |
| Cummins Inc. | 4,870 | 213 |
| Waste Management, Inc. | 6,658 | 210 |
| Fluor Corp. | 3,700 | 206 |
| The Brink’s Co. | 3,200 | 195 |
| The Timken Co. | 6,000 | 170 |
| Norfolk Southern Corp. | 2,400 | 159 |
* | AGCO Corp. | 3,700 | 158 |
| Textron, Inc. | 5,278 | 155 |
| Parker Hannifin Corp. | 2,900 | 154 |
| Deere & Co. | 3,100 | 153 |
| SPX Corp. | 1,900 | 146 |
| Raytheon Co. | 2,504 | 134 |
| GATX Corp. | 3,216 | 127 |
| The Manitowoc Co., Inc. | 7,412 | 115 |
* | First Solar, Inc. | 600 | 113 |
| Precision Castparts Corp. | 1,277 | 101 |
| Dover Corp. | 2,000 | 81 |
* | Kirby Corp. | 2,100 | 80 |
| Northrop Grumman Corp. | 1,200 | 73 |
| Danaher Corp. | 800 | 56 |
| Ingersoll-Rand Co. | 1,700 | 53 |
28
Structured Large-Cap Growth Fund
|
|
| Market |
|
|
| Value• |
|
| Shares | ($000) |
| Manpower Inc. | 850 | 37 |
* | Hertz Global Holdings Inc. | 4,800 | 36 |
| Equifax, Inc. | 952 | 33 |
| Cooper Industries, Inc. Class A | 700 | 28 |
| Goodrich Corp. | 500 | 21 |
| Ryder System, Inc. | 200 | 12 |
|
|
| 7,228 |
Information Technology (28.5%) |
|
| |
| Communications Equipment (4.2%) |
|
|
* | Cisco Systems, Inc. | 53,550 | 1,208 |
| QUALCOMM Inc. | 15,503 | 666 |
| Corning, Inc. | 18,107 | 283 |
* | Juniper Networks, Inc. | 9,300 | 196 |
|
|
|
|
| Computers & Peripherals (8.2%) |
|
|
| International Business |
|
|
| Machines Corp. | 13,607 | 1,591 |
| Hewlett-Packard Co. | 24,777 | 1,146 |
* | Apple Inc. | 8,712 | 990 |
* | Dell Inc. | 16,481 | 272 |
* | EMC Corp. | 17,194 | 206 |
| Seagate Technology | 12,700 | 154 |
* | Western Digital Corp. | 7,200 | 153 |
* | Lexmark International, Inc. | 2,400 | 78 |
| Diebold, Inc. | 500 | 17 |
|
|
|
|
| Electronic Equipment, Instruments |
|
|
| & Components (0.1%) |
|
|
* | Arrow Electronics, Inc. | 1,252 | 33 |
|
|
|
|
| Internet Software & Services (2.5%) |
|
|
* | Google Inc. | 2,175 | 871 |
* | eBay Inc. | 7,656 | 171 |
* | Yahoo! Inc. | 9,857 | 171 |
* | Sohu.com Inc. | 2,700 | 150 |
* | WebMD Health Corp. Class A | 800 | 24 |
|
|
|
|
| IT Services (2.8%) |
|
|
| Western Union Co. | 13,759 | 339 |
| Accenture Ltd. | 7,335 | 279 |
| Visa Inc. | 4,300 | 264 |
| Automatic Data |
|
|
| Processing, Inc. | 5,900 | 252 |
| MasterCard, Inc. Class A | 1,125 | 200 |
* | Metavante Technologies | 8,500 | 164 |
* | Genpact, Ltd. | 8,100 | 84 |
|
|
|
|
| Semiconductors & Semiconductor |
|
|
| Equipment (4.0%) |
|
|
| Intel Corp. | 50,120 | 939 |
| Texas Instruments, Inc. | 13,761 | 296 |
| Analog Devices, Inc. | 7,200 | 190 |
| National Semiconductor Corp. | 10,902 | 188 |
* | Marvell Technology Group Ltd. | 16,700 | 155 |
* | NVIDIA Corp. | 13,100 | 140 |
| Applied Materials, Inc. | 8,999 | 136 |
* | Integrated Device |
|
|
| Technology Inc. | 9,500 | 74 |
* | LSI Corp. | 9,900 | 53 |
* | MEMC Electronic |
|
|
| Materials, Inc. | 1,291 | 36 |
|
|
|
|
| Software (6.7%) |
|
|
| Microsoft Corp. | 78,785 | 2,103 |
* | Oracle Corp. | 38,696 | 786 |
* | BMC Software, Inc. | 7,010 | 200 |
* | Adobe Systems, Inc. | 4,783 | 189 |
* | Symantec Corp. | 9,000 | 176 |
* | salesforce.com, inc. | 3,600 | 174 |
* | Activision Blizzard, Inc. | 9,000 | 139 |
|
|
| 15,936 |
Materials (3.7%) |
|
| |
| Monsanto Co. | 5,727 | 567 |
| United States Steel Corp. | 2,500 | 194 |
| Alcoa Inc. | 8,100 | 183 |
| CF Industries Holdings, Inc. | 1,900 | 174 |
| Celanese Corp. Series A | 6,070 | 169 |
| Praxair, Inc. | 2,170 | 156 |
| The Mosaic Co. | 2,100 | 143 |
* | Owens-Illinois, Inc. | 4,600 | 135 |
| AK Steel Holding Corp. | 4,600 | 119 |
| Terra Industries, Inc. | 3,100 | 91 |
* | Intrepid Potash, Inc. | 2,100 | 62 |
| Steel Dynamics, Inc. | 2,226 | 38 |
| Nucor Corp. | 700 | 28 |
| Southern Peru Copper Corp. |
|
|
| (U.S. Shares) | 408 | 8 |
|
|
| 2,067 |
Telecommunication Services (0.8%) |
|
| |
* | American Tower Corp. Class A | 5,600 | 201 |
* | Crown Castle International Corp. | 3,200 | 93 |
| Embarq Corp. | 2,200 | 89 |
| Telephone & Data Systems, Inc. | 1,200 | 43 |
| Windstream Corp. | 500 | 6 |
|
|
| 432 |
Utilities (1.6%) |
|
| |
* | AES Corp. | 20,100 | 235 |
| CenterPoint Energy Inc. | 13,900 | 203 |
| Sierra Pacific Resources | 18,500 | 177 |
| Exelon Corp. | 2,172 | 136 |
* | Mirant Corp. | 6,300 | 115 |
| Energen Corp. | 1,200 | 54 |
|
|
| 920 |
Total Common Stocks |
|
| |
(Cost $59,334) |
| 55,551 | |
29
Structured Large-Cap Growth Fund
|
|
| Market | |
|
|
| Value• | |
|
| Shares | ($000) | |
Temporary Cash Investments (0.5%)1 |
|
| ||
Money Market Fund (0.3%) |
|
| ||
2 | Vanguard Market |
|
| |
| Liquidity Fund, 2.296% | 170,670 | 171 | |
|
|
|
| |
|
|
|
| |
|
| Face |
| |
|
| Amount |
| |
|
| ($000) |
| |
U.S. Government Agency Obligation (0.2%) |
|
| ||
3,4 | Federal Home Loan Bank, |
|
| |
| 2.432%, 10/15/08 | 100 | 100 | |
Total Temporary Cash Investments |
|
| ||
(Cost $270) |
| 271 | ||
Total Investments (100.0%) |
|
| ||
(Cost $59,604) |
| 55,822 | ||
Other Assets and Liabilities (0.0%) |
|
| ||
Other Assets |
| 88 | ||
Liabilities |
| (62) | ||
|
|
| 26 | |
Net Assets (100%) |
| 55,848 | ||
At September 30, 2008, net assets consisted of: | |
| Amount |
| ($000) |
Paid-in Capital | 62,956 |
Undistributed Net Investment Income | 522 |
Accumulated Net Realized Losses | (3,824) |
Unrealized Appreciation (Depreciation) |
|
Investment Securities | (3,782) |
Futures Contracts | (24) |
Net Assets | 55,848 |
|
|
|
|
Institutional Shares—Net Assets |
|
Applicable to 459,056 outstanding |
|
$.001 par value shares of beneficial |
|
interest (unlimited authorization) | 10,386 |
Net Asset Value Per Share— |
|
Institutional Shares | $22.63 |
|
|
|
|
Institutional Plus Shares—Net Assets |
|
Applicable to 1,008,669 outstanding |
|
$.001 par value shares of beneficial |
|
interest (unlimited authorization) | 45,462 |
Net Asset Value Per Share— |
|
Institutional Plus Shares | $45.07 |
• See Note A in Notes to Financial Statements.
* Non-income-producing security.
1 The fund invests a portion of its cash reserves in equity markets through the use of index futures contracts. After giving effect to futures investments, the fund’s effective common stock and temporary cash investment positions represent 100.0% and 0.0%, respectively, of net assets.
2 Affiliated money market fund available only to Vanguard funds and certain trusts and accounts managed by Vanguard. Rate shown is the 7-day yield.
3 The issuer operates under a congressional charter; its securities are neither issued nor guaranteed by the U.S. government.
4 Securities with a value of $100,000 have been segregated as initial margin for open futures contracts.
REIT—Real Estate Investment Trust.
See accompanying Notes, which are an integral part of the Financial Statements.
30
Structured Large-Cap Growth Fund
Statement of Operations
| Year Ended |
| September 30, 2008 |
| ($000) |
Investment Income |
|
Income |
|
Dividends | 784 |
Interest1 | 5 |
Security Lending | 1 |
Total Income | 790 |
Expenses |
|
The Vanguard Group—Note B |
|
Investment Advisory Services | — |
Management and Administrative—Institutional Shares | 9 |
Management and Administrative—Institutional Plus Shares | 25 |
Marketing and Distribution—Institutional Shares | 3 |
Marketing and Distribution—Institutional Plus Shares | 10 |
Custodian Fees | 11 |
Auditing Fees | 22 |
Shareholders’ Reports—Institutional Shares | — |
Shareholders’ Reports—Institutional Plus Shares | 1 |
Total Expenses | 81 |
Net Investment Income | 709 |
Realized Net Gain (Loss) |
|
Investment Securities Sold | (3,603) |
Futures Contracts | (49) |
Realized Net Gain (Loss) | (3,652) |
Change in Unrealized Appreciation (Depreciation) |
|
Investment Securities | (12,359) |
Futures Contracts | (24) |
Change in Unrealized Appreciation (Depreciation) | (12,383) |
Net Increase (Decrease) in Net Assets Resulting from Operations | (15,326) |
1 Interest income from an affiliated company of the fund was $5,000.
See accompanying Notes, which are an integral part of the Financial Statements.
31
Structured Large-Cap Growth Fund
Statement of Changes in Net Assets
|
|
| October 3, |
| Year Ended |
| 20061 to |
| September 30, |
| September 30, |
| 2008 |
| 2007 |
| ($000) |
| ($000) |
Increase (Decrease) in Net Assets |
|
|
|
Operations |
|
|
|
Net Investment Income | 709 |
| 592 |
Realized Net Gain (Loss) | (3,652) |
| 1,163 |
Change in Unrealized Appreciation (Depreciation) | (12,383) |
| 8,104 |
Net Increase (Decrease) in Net Assets Resulting from Operations | (15,326) |
| 9,859 |
Distributions |
|
|
|
Net Investment Income |
|
|
|
Institutional Shares | (80) |
| — |
Institutional Plus Shares | (553) |
| (146) |
Realized Capital Gain2 |
|
|
|
Institutional Shares | (169) |
| — |
Institutional Plus Shares | (1,114) |
| (52) |
Total Distributions | (1,916) |
| (198) |
Capital Share Transactions |
|
|
|
Institutional Shares | 4,149 |
| 8,608 |
Institutional Plus Shares | 1,667 |
| 49,005 |
Net Increase (Decrease) from Capital Share Transactions | 5,816 |
| 57,613 |
Total Increase (Decrease) | (11,426) |
| 67,274 |
Net Assets |
|
|
|
Beginning of Period | 67,274 |
| — |
End of Period3 | 55,848 |
| 67,274 |
1 Commencement of operations as a registered investment company.
2 Includes fiscal 2008 and 2007 short-term gain distributions totaling $540,000 and $52,000, respectively. Short-term gain distributions are treated as ordinary income dividends for tax purposes.
3 Net Assets—End of Period includes undistributed net investment income of $522,000 and $446,000. See accompanying Notes, which are an integral part of the Financial Statements.
32
Structured Large-Cap Growth Fund
Financial Highlights
Institutional Shares |
|
|
| Year | June 22, |
| Ended | 20071 to |
| Sept. 30, | Sept. 30, |
For a Share Outstanding Throughout Each Period | 2008 | 2007 |
Net Asset Value, Beginning of Period | $29.93 | $29.04 |
Investment Operations |
|
|
Net Investment Income | .283 | .050 |
Net Realized and Unrealized Gain (Loss) on Investments | (6.742) | .840 |
Total from Investment Operations | (6.459) | .890 |
Distributions |
|
|
Dividends from Net Investment Income | (.270) | — |
Distributions from Realized Capital Gains | (.571) | — |
Total Distributions | (.841) | — |
Net Asset Value, End of Period | $22.63 | $29.93 |
|
|
|
|
|
|
Total Return | –22.20% | 3.06% |
|
|
|
|
|
|
Ratios/Supplemental Data |
|
|
Net Assets, End of Period (Millions) | $10 | $9 |
Ratio of Total Expenses to Average Net Assets | 0.20% | 0.25%2 |
Ratio of Net Investment Income to Average Net Assets | 1.07% | 0.84%2 |
Portfolio Turnover Rate | 70% | 56% |
1 Inception.
2 Annualized.
See accompanying Notes, which are an integral part of the Financial Statements.
33
Structured Large-Cap Growth Fund
Institutional Plus Shares |
|
|
| Year | Oct. 3, |
| Ended | 20061 to |
| Sept. 30, | Sept. 30, |
For a Share Outstanding Throughout Each Period | 2008 | 2007 |
Net Asset Value, Beginning of Period | $59.60 | $50.00 |
Investment Operations |
|
|
Net Investment Income | .591 | .547 |
Net Realized and Unrealized Gain (Loss) on Investments | (13.420) | 9.256 |
Total from Investment Operations | (12.829) | 9.803 |
Distributions |
|
|
Dividends from Net Investment Income | (.564) | (.150) |
Distributions from Realized Capital Gains | (1.137) | (.053) |
Total Distributions | (1.701) | (.203) |
Net Asset Value, End of Period | $45.07 | $59.60 |
|
|
|
|
|
|
Total Return | –22.16% | 19.66% |
|
|
|
|
|
|
Ratios/Supplemental Data |
|
|
Net Assets, End of Period (Millions) | $45 | $58 |
Ratio of Total Expenses to Average Net Assets | 0.12% | 0.15%2 |
Ratio of Net Investment Income to Average Net Assets | 1.15% | 0.94%2 |
Portfolio Turnover Rate | 70% | 56% |
1 Commencement of operations as a registered investment company.
2 Annualized.
See accompanying Notes, which are an integral part of the Financial Statements.
34
Structured Large-Cap Growth Fund
Notes to Financial Statements
Vanguard Structured Large-Cap Growth Fund is registered under the Investment Company Act of 1940 as an open-end investment company, or mutual fund. The fund offers two classes of shares: Institutional Shares and Institutional Plus Shares. Institutional Shares are available to investors who invest a minimum amount of $5 million. Institutional Plus Shares are available to investors who invest a minimum amount of $200 million ($100 million for investors with total Vanguard investments of at least $1 billion).
A. The following significant accounting policies conform to generally accepted accounting principles for U.S. mutual funds. The fund consistently follows such policies in preparing its financial statements.
1. Security Valuation: Securities are valued as of the close of trading on the New York Stock Exchange (generally 4 p.m., Eastern time) on the valuation date. Equity securities are valued at the latest quoted sales prices or official closing prices taken from the primary market in which each security trades; such securities not traded on the valuation date are valued at the mean of the latest quoted bid and asked prices. Securities for which market quotations are not readily available, or whose values have been materially affected by events occurring before the fund’s pricing time but after the close of the securities’ primary markets, are valued by methods deemed by the board of trustees to represent fair value. Investments in Vanguard Market Liquidity Fund are valued at that fund’s net asset value. Temporary cash investments acquired over 60 days to maturity are valued using the latest bid prices or using valuations based on a matrix system (which considers such factors as security prices, yields, maturities, and ratings), both as furnished by independent pricing services. Other temporary cash investments are valued at amortized cost, which approximates market value.
2. Futures Contracts: The fund uses index futures contracts to a limited extent, with the objective of maintaining full exposure to the stock market while maintaining liquidity. The fund may purchase or sell futures contracts to achieve a desired level of investment, whether to accommodate portfolio turnover or cash flows from capital share transactions. The primary risks associated with the use of futures contracts are imperfect correlation between changes in market values of stocks held by the fund and the prices of futures contracts, and the possibility of an illiquid market.
Futures contracts are valued at their quoted daily settlement prices. The aggregate principal amounts of the contracts are not recorded in the Statement of Net Assets. Fluctuations in the value of the contracts are recorded in the Statement of Net Assets as an asset (liability) and in the Statement of Operations as unrealized appreciation (depreciation) until the contracts are closed, when they are recorded as realized futures gains (losses).
3. Federal Income Taxes: The fund intends to continue to qualify as a regulated investment company and distribute all of its taxable income. Management has analyzed the fund’s tax positions taken on federal income tax returns for all open tax years (tax years ended September 30, 2007–2008), and has concluded that no provision for federal income tax is required in the fund’s financial statements.
4. Distributions: Distributions to shareholders are recorded on the ex-dividend date.
5. Security Lending: The fund may lend its securities to qualified institutional borrowers to earn additional income. Security loans are required to be secured at all times by collateral at least equal to the market value of securities loaned. The fund invests cash collateral received in Vanguard Market Liquidity Fund, and records a liability for the return of the collateral, during the period the securities are on loan. Security lending income represents the income earned on investing cash collateral, less expenses associated with the loan.
35
Structured Large-Cap Growth Fund
6. Other: Dividend income is recorded on the ex-dividend date. Interest income includes income distributions received from Vanguard Market Liquidity Fund and is accrued daily. Security transactions are accounted for on the date securities are bought or sold. Costs used to determine realized gains (losses) on the sale of investment securities are those of the specific securities sold.
Each class of shares has equal rights as to assets and earnings, except that each class separately bears certain class-specific expenses related to maintenance of shareholder accounts (included in Management and Administrative expenses) and shareholder reporting. Marketing and distribution expenses are allocated to each class of shares based on a method approved by the board of trustees. Income, other non-class-specific expenses, and gains and losses on investments are allocated to each class of shares based on its relative net assets.
B. The Vanguard Group furnishes at cost investment advisory, corporate management, administrative, marketing, and distribution services. The costs of such services are allocated to the fund under methods approved by the board of trustees. The fund has committed to provide up to 0.40% of its net assets in capital contributions to Vanguard. At September 30, 2008, the fund had contributed capital of $6,000 to Vanguard (included in Other Assets), representing 0.01% of the fund’s net assets and 0.01% of Vanguard’s capitalization. The fund’s trustees and officers are also directors and officers of Vanguard.
C. Distributions are determined on a tax basis and may differ from net investment income and realized capital gains for financial reporting purposes. Differences may be permanent or temporary. Permanent differences are reclassified among capital accounts in the financial statements to reflect their tax character. Temporary differences arise when certain items of income, expense, gain, or loss are recognized in different periods for financial statement and tax purposes; these differences will reverse at some time in the future. Differences in classification may also result from the treatment of short-term gains as ordinary income for tax purposes.
For tax purposes, at September 30, 2008, the fund had $554,000 of ordinary income available for distribution. Tax-basis capital gains required to be distributed in December 2007 included net gains realized through October 31, 2007. Subsequently, the fund realized capital losses of $3,839,000, which are available to offset future net capital gains.
At September 30, 2008, the cost of investment securities for tax purposes was $59,613,000. Net unrealized depreciation of investment securities for tax purposes was $3,791,000, consisting of unrealized gains of $3,755,000 on securities that had risen in value since their purchase and $7,546,000 in unrealized losses on securities that had fallen in value since their purchase.
At September 30, 2008, the aggregate settlement value of open futures contracts expiring in December 2008 and the related unrealized appreciation (depreciation) were:
|
|
| ($000) |
| Number of | Aggregate | Unrealized |
| Long (Short) | Settlement | Appreciation |
Futures Contracts | Contracts | Value | (Depreciation) |
E-mini S&P 500 Index | 5 | 292 | (24) |
Unrealized appreciation (depreciation) on open futures contracts is required to be treated as realized gain (loss) for tax purposes.
36
Structured Large-Cap Growth Fund
D. During the year ended September 30, 2008, the fund purchased $48,194,000 of investment securities and sold $43,817,000 of investment securities, other than temporary cash investments.
E. Pursuant to a plan of reorganization approved by the trustee of Vanguard Fiduciary Trust Company Structured Large-Cap Growth Trust (the “trust”) on July 18, 2006, the trust purchased shares of the fund through a nontaxable in-kind transfer of all of the trust’s investment securities on October 3, 2006, resulting in the issuance of 976,000 fund shares at a net asset value per share of $50.00. The trust’s net assets transferred to the fund were $48,807,000, including net unrealized appreciation of $473,000. On October 4, 2006, the trust liquidated by distributing to unitholders shares of the fund equal to the value of the unitholders’ investments in the trust
F. Capital share transactions for each class of shares were:
| Year Ended | October 3, 20061 to | |||
| September 30, 2008 | September 30, 2007 | |||
| Amount | Shares |
| Amount | Shares |
| ($000) | (000) |
| ($000) | (000) |
Institutional Shares |
|
|
|
|
|
Issued | 5,000 | 194 |
| 8,608 | 296 |
Issued in Lieu of Cash Distributions | 249 | 9 |
| — | — |
Redeemed | (1,100) | (40) |
| — | — |
Net Increase (Decrease)—Institutional Shares | 4,149 | 163 |
| 8,608 | 296 |
Institutional Plus Shares |
|
|
|
|
|
Issued | — | — |
| 48,8072 | 9762 |
Issued in Lieu of Cash Distributions | 1,667 | 29 |
| 198 | 4 |
Redeemed | — | — |
| — | — |
Net Increase (Decrease)—Institutional Plus Shares | 1,667 | 29 |
| 49,005 | 980 |
G. In September 2006, the Financial Accounting Standards Board issued Statement of Financial Accounting Standards No. 157 (“FAS 157”), “Fair Value Measurements.” FAS 157 establishes a framework for measuring fair value and expands disclosures about fair value measurements in financial statements.
The various inputs that may be used to determine the value of the fund’s investments are summarized in three broad levels. The inputs or methodologies used for valuing securities are not necessarily an indication of the risk associated with investing in those securities.
Level 1—Quoted prices in active markets for identical securities.
Level 2—Other significant observable inputs (including quoted prices for similar securities, interest rates, prepayment speeds, credit risk, etc.).
Level 3—Significant unobservable inputs (including the fund’s own assumptions used to determine the fair value of investments).
1 Commencement of operations as a registered investment company.
2 Includes shares converted from the net assets of Vanguard Fiduciary Trust Company Structured Large-Cap Growth Trust.
37
Structured Large-Cap Growth Fund
The following table summarizes the fund’s investments as of September 30, 2008, based on the inputs used to value them:
| Investments | Futures |
| in Securities | Contracts |
Valuation Inputs | ($000) | ($000) |
Level 1—Quoted prices | 55,722 | (24) |
Level 2—Other significant observable inputs | 100 | — |
Level 3—Significant unobservable inputs | — | — |
Total | 55,822 | (24) |
38
Structured Large-Cap Value Fund
Fund Profile
As of September 30, 2008
Portfolio Characteristics |
|
| |
|
| Comparative | Broad |
| Fund | Index1 | Index2 |
Number of Stocks | 233 | 662 | 4,679 |
Median Market Cap | $40.7B | $38.7B | $29.6B |
Price/Earnings Ratio | 13.0x | 14.0x | 15.5x |
Price/Book Ratio | 1.7x | 1.7x | 2.2x |
Yield—Institutional |
|
|
|
Plus Shares3 | 3.0% | 3.2% | 2.3% |
Return on Equity | 18.7% | 18.3% | 20.0% |
Earnings Growth Rate | 13.8% | 13.8% | 17.7% |
Foreign Holdings | 0.0% | 0.0% | 0.0% |
Turnover Rate | 104% | — | — |
Expense Ratio |
|
|
|
(9/30/2007)4 |
| — | — |
Institutional |
|
|
|
Plus Shares | 0.15% |
|
|
Short-Term Reserves5 | –0.5% | — | — |
Sector Diversification (% of equity exposure) | |||
|
| Comparative | Broad |
| Fund | Index1 | Index2 |
Consumer Discretionary | 8.7% | 8.8% | 9.2% |
Consumer Staples | 8.9 | 8.9 | 10.5 |
Energy | 15.7 | 15.6 | 12.6 |
Financials | 27.4 | 27.6 | 17.3 |
Health Care | 11.8 | 11.8 | 13.0 |
Industrials | 9.7 | 9.5 | 11.4 |
Information Technology | 3.1 | 2.9 | 15.7 |
Materials | 3.6 | 3.7 | 3.7 |
Telecommunication |
|
|
|
Services | 5.2 | 5.2 | 2.8 |
Utilities | 5.9 | 6.0 | 3.8 |
Ten Largest Holdings6 (% of total net assets) | ||
|
|
|
ExxonMobil Corp. | integrated oil |
|
| and gas | 5.9% |
General Electric Co. | industrial |
|
| conglomerate | 4.3 |
Chevron Corp. | integrated oil |
|
| and gas | 3.0 |
JPMorgan Chase & Co. | other diversified |
|
| financial services | 2.9 |
AT&T Inc. | integrated |
|
| telecommunication |
|
| services | 2.8 |
Bank of America Corp. | diversified |
|
| financial services | 2.6 |
Johnson & Johnson | pharmaceuticals | 2.6 |
The Procter & Gamble Co. | household products | 2.4 |
Pfizer Inc. | pharmaceuticals | 2.3 |
Wells Fargo & Co. | diversified banks | 2.2 |
Top Ten |
| 31.0% |
Investment Focus
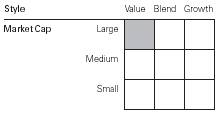
1 Russell 1000 Value Index.
2 Dow Jones Wilshire 5000 Index.
3 30-day SEC yield for the fund; annualized dividend yield for the indexes. See the Glossary.
4 The expense ratio shown is from the prospectus dated January 28, 2008. For the fiscal year ended September 30, 2008, the expense ratio was 0.12%.
5 The fund invested a portion of its cash reserves in equity markets through the use of index futures contracts. After the effect of the futures investments, the fund’s temporary cash position was negative.
6 The holdings listed exclude any temporary cash investments and equity index products.
39
Structured Large-Cap Value Fund
Performance Summary
All of the returns in this report represent past performance, which is not a guarantee of future results that may be achieved by the fund. (Current performance may be lower or higher than the performance data cited. For performance data current to the most recent month-end, visit our website at www.vanguard.com/performance.) Note, too, that both investment returns and principal value can fluctuate widely, so an investor’s shares, when sold, could be worth more or less than their original cost. The returns shown do not reflect taxes that a shareholder would pay on fund distributions or on the sale of fund shares.
Cumulative Performance: December 15, 2005–September 30, 2008
Initial Investment of $200,000,000
|
|
|
|
| Average Annual Total Returns |
| |
| Periods Ended September 30, 2008 | Final Value of a | |
|
| Since | $200,000,000 |
| One Year | Inception1 | Investment |
Structured Large-Cap Value Fund |
|
|
|
Institutional Plus Shares | –24.47% | –1.27% | $192,971,882 |
Dow Jones Wilshire 5000 Index | –21.20 | –0.70 | 196,129,504 |
Russell 1000 Value Index | –23.56 | –0.79 | 195,595,515 |
Average Large-Cap Value Fund2 | –23.80 | –1.80 | 190,110,684 |
1 Performance for the fund and its comparative standards is calculated since the fund’s inception: December 15, 2005.
2 Derived from data provided by Lipper Inc.
40
Structured Large-Cap Value Fund
Fiscal-Year Total Returns (%): December 15, 2005–September 30, 2008
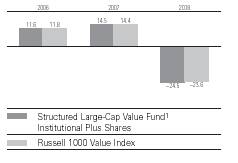
1 The fund commenced operations as a registered investment company on January 18, 2007. The fund’s performance includes the performance of a predecessor trust, Vanguard Fiduciary Trust Company Structured Large-Cap Growth Trust, from December 15, 2005, to January 18, 2007.
Note: See Financial Highlights tables for dividend and capital gains information.
41
Structured Large-Cap Value Fund
Financial Statements
Statement of Net Assets
As of September 30, 2008
The fund provides a complete list of its holdings four times in each fiscal year, at the quarter-ends. For the second and fourth fiscal quarters, the lists appear in the fund’s semiannual and annual reports to shareholders. For the first and third fiscal quarters, the fund files the lists with the Securities and Exchange Commission on Form N-Q. Shareholders can look up the fund’s Forms N-Q on the SEC’s website at www.sec.gov. Forms N-Q may also be reviewed and copied at the SEC’s Public Reference Room (see the back cover of this report for further information).
|
|
| Market |
|
|
| Value• |
|
| Shares | ($000) |
Common Stocks (98.9%)1 |
|
| |
Consumer Discretionary (8.6%) |
|
| |
| The Walt Disney Co. | 18,890 | 580 |
| Time Warner, Inc. | 36,520 | 479 |
| Comcast Corp. Class A | 23,275 | 457 |
| Home Depot, Inc. | 16,300 | 422 |
| Lowe’s Cos., Inc. | 13,100 | 310 |
| The Gap, Inc. | 13,000 | 231 |
| News Corp., Class A | 19,210 | 230 |
| Lennar Corp. Class A | 14,900 | 226 |
| RadioShack Corp. | 12,100 | 209 |
| The Stanley Works | 5,000 | 209 |
* | NVR, Inc. | 350 | 200 |
* | TRW Automotive |
|
|
| Holdings Corp. | 11,400 | 181 |
| Limited Brands, Inc. | 10,300 | 179 |
| Barnes & Noble, Inc. | 5,800 | 151 |
| Omnicom Group Inc. | 3,700 | 143 |
| Autoliv, Inc. | 4,200 | 142 |
| McDonald’s Corp. | 2,104 | 130 |
* | Toll Brothers, Inc. | 5,000 | 126 |
| Warner Music Group Corp. | 13,900 | 106 |
| Royal Caribbean Cruises, Ltd. | 4,400 | 91 |
| Carnival Corp. | 2,000 | 71 |
| International Speedway Corp. | 900 | 35 |
* | Liberty Global, Inc. Class A | 1,100 | 33 |
* | The Goodyear Tire & |
|
|
| Rubber Co. | 1,000 | 15 |
| CBS Corp. | 950 | 14 |
| Pulte Homes, Inc. | 500 | 7 |
|
|
| 4,977 |
Consumer Staples (8.8%) |
|
| |
| The Procter & Gamble Co. | 20,090 | 1,400 |
| Kraft Foods Inc. | 14,076 | 461 |
| Wal-Mart Stores, Inc. | 5,300 | 317 |
| The Coca-Cola Co. | 5,990 | 317 |
* | Dr. Pepper Snapple Group, Inc. | 10,200 | 270 |
| Bunge Ltd. | 3,800 | 240 |
| Molson Coors Brewing Co. |
|
|
| Class B | 5,000 | 234 |
* | Constellation Brands, Inc. |
|
|
| Class A | 10,700 | 230 |
| The Kroger Co. | 7,900 | 217 |
| Anheuser-Busch Cos., Inc. | 3,090 | 200 |
| Altria Group, Inc. | 8,630 | 171 |
| CVS/Caremark Corp. | 4,800 | 162 |
| ConAgra Foods, Inc. | 6,700 | 130 |
| The Pepsi Bottling Group, Inc. | 4,300 | 125 |
| SuperValu Inc. | 5,000 | 109 |
| Reynolds American Inc. | 2,140 | 104 |
| Kimberly-Clark Corp. | 1,570 | 102 |
| Archer-Daniels-Midland Co. | 4,300 | 94 |
| Alberto-Culver Co. | 2,900 | 79 |
| Del Monte Foods Co. | 4,100 | 32 |
| Corn Products |
|
|
| International, Inc. | 800 | 26 |
| J.M. Smucker Co. | 500 | 25 |
| General Mills, Inc. | 300 | 21 |
| PepsiCo, Inc. | 100 | 7 |
|
|
| 5,073 |
Energy (15.5%) |
|
| |
| ExxonMobil Corp. | 43,810 | 3,402 |
| Chevron Corp. | 21,390 | 1,764 |
| ConocoPhillips Co. | 16,274 | 1,192 |
| Devon Energy Corp. | 5,000 | 456 |
| Apache Corp. | 3,900 | 407 |
| Pioneer Natural Resources Co. | 4,700 | 246 |
| Marathon Oil Corp. | 5,600 | 223 |
| Anadarko Petroleum Corp. | 3,650 | 177 |
| XTO Energy, Inc. | 3,700 | 172 |
* | Newfield Exploration Co. | 4,600 | 147 |
* | Forest Oil Corp. | 2,800 | 139 |
| Cimarex Energy Co. | 2,500 | 122 |
| Valero Energy Corp. | 3,800 | 115 |
| Chesapeake Energy Corp. | 3,000 | 108 |
* | Unit Corp. | 1,900 | 95 |
* | Plains Exploration & |
|
|
| Production Co. | 1,800 | 63 |
| Occidental Petroleum Corp. | 720 | 51 |
| EOG Resources, Inc. | 500 | 45 |
42
Structured Large-Cap Value Fund
|
|
| Market |
|
|
| Value• |
|
| Shares | ($000) |
| Noble Energy, Inc. | 400 | 22 |
| ENSCO International, Inc. | 300 | 17 |
* | Encore Acquisition Co. | 400 | 17 |
|
|
| 8,980 |
Financials (27.3%) |
|
| |
| JPMorgan Chase & Co. | 35,680 | 1,666 |
| Bank of America Corp. | 43,639 | 1,527 |
| Wells Fargo & Co. | 34,600 | 1,299 |
| Citigroup, Inc. | 55,390 | 1,136 |
| U.S. Bancorp | 19,270 | 694 |
| The Chubb Corp. | 7,500 | 412 |
| BB&T Corp. | 10,350 | 391 |
| The Goldman Sachs |
|
|
| Group, Inc. | 3,025 | 387 |
| Bank of New York |
|
|
| Mellon Corp. | 10,843 | 353 |
| Merrill Lynch & Co., Inc. | 13,900 | 352 |
| The Travelers Cos., Inc. | 7,500 | 339 |
| PNC Financial Services Group | 4,400 | 329 |
| Progressive Corp. of Ohio | 18,000 | 313 |
| Morgan Stanley | 12,790 | 294 |
| Unum Group | 11,300 | 284 |
| Discover Financial Services | 17,945 | 248 |
| Ameriprise Financial, Inc. | 6,400 | 244 |
| RenaissanceRe Holdings Ltd. | 4,700 | 244 |
| Invesco, Ltd. | 11,400 | 239 |
| State Street Corp. | 4,200 | 239 |
| Axis Capital Holdings Ltd. | 7,000 | 222 |
| Prudential Financial, Inc. | 3,050 | 220 |
| Bank of Hawaii Corp. | 3,830 | 205 |
| Northern Trust Corp. | 2,800 | 202 |
| MetLife, Inc. | 3,591 | 201 |
| American Financial Group, Inc. | 6,800 | 201 |
| The Allstate Corp. | 4,150 | 191 |
| Equity Residential REIT | 4,280 | 190 |
| SunTrust Banks, Inc. | 3,960 | 178 |
| ProLogis REIT | 4,200 | 173 |
| HCP, Inc. REIT | 4,100 | 165 |
| The Hartford Financial |
|
|
| Services Group Inc. | 3,900 | 160 |
| MBIA, Inc. | 13,200 | 157 |
| Popular, Inc. | 18,100 | 150 |
| Plum Creek Timber Co. Inc. |
|
|
| REIT | 2,600 | 130 |
| Annaly Mortgage |
|
|
| Management Inc. REIT | 8,400 | 113 |
| PartnerRe Ltd. | 1,600 | 109 |
| UDR, Inc. REIT | 4,100 | 107 |
| Nationwide Health |
|
|
| Properties, Inc. REIT | 2,900 | 104 |
* | Arch Capital Group Ltd. | 1,400 | 102 |
| Sovereign Bancorp, Inc. | 25,800 | 102 |
| Host Hotels & Resorts Inc. |
|
|
| REIT | 7,500 | 100 |
| Loews Corp. | 2,400 | 95 |
| Apartment Investment & |
|
|
| Management Co. |
|
|
| Class A REIT | 2,698 | 94 |
| Mack-Cali Realty Corp. REIT | 2,600 | 88 |
| Wachovia Corp. | 24,340 | 85 |
| Cullen/Frost Bankers, Inc. | 1,400 | 84 |
* | The St. Joe Co. | 2,000 | 78 |
| Camden Property Trust REIT | 1,700 | 78 |
| Hospitality Properties |
|
|
| Trust REIT | 3,700 | 76 |
| American International |
|
|
| Group, Inc. | 22,240 | 74 |
| Douglas Emmett, Inc. REIT | 3,200 | 74 |
| New York Community |
|
|
| Bancorp, Inc. | 4,300 | 72 |
| Developers Diversified |
|
|
| Realty Corp. REIT | 2,200 | 70 |
| Vornado Realty Trust REIT | 700 | 64 |
* | Nasdaq Stock Market Inc. | 1,900 | 58 |
| Public Storage, Inc. REIT | 500 | 50 |
| Boston Properties, Inc. REIT | 500 | 47 |
| Hudson City Bancorp, Inc. | 2,100 | 39 |
| Capital One Financial Corp. | 440 | 22 |
| OneBeacon Insurance |
|
|
| Group Ltd. | 900 | 19 |
| Fannie Mae | 8,327 | 13 |
| Kimco Realty Corp. REIT | 312 | 12 |
| Assurant, Inc. | 200 | 11 |
| CapitalSource Inc. REIT | 800 | 10 |
| Franklin Resources Corp. | 100 | 9 |
| CME Group, Inc. | 20 | 7 |
| Avalonbay Communities, Inc. |
|
|
| REIT | 50 | 5 |
|
|
| 15,806 |
Health Care (11.7%) |
|
| |
| Johnson & Johnson | 21,390 | 1,482 |
| Pfizer Inc. | 71,120 | 1,312 |
* | Amgen, Inc. | 12,000 | 711 |
| Wyeth | 12,750 | 471 |
| Merck & Co., Inc. | 13,380 | 422 |
| Eli Lilly & Co. | 8,730 | 384 |
| Covidien Ltd. | 7,075 | 380 |
| Omnicare, Inc. | 7,200 | 207 |
* | DaVita, Inc. | 3,600 | 205 |
* | Thermo Fisher Scientific, Inc. | 3,700 | 204 |
| Universal Health Services |
|
|
| Class B | 3,300 | 185 |
* | LifePoint Hospitals, Inc. | 5,500 | 177 |
* | WellPoint Inc. | 3,490 | 163 |
* | Forest Laboratories, Inc. | 5,600 | 158 |
| UnitedHealth Group Inc. | 5,400 | 137 |
| Aetna Inc. | 3,500 | 127 |
| CIGNA Corp. | 700 | 24 |
| AmerisourceBergen Corp. | 300 | 11 |
|
|
| 6,760 |
43
Structured Large-Cap Value Fund
|
|
| Market |
|
|
| Value• |
|
| Shares | ($000) |
Industrials (9.5%) |
|
| |
| General Electric Co. | 96,950 | 2,472 |
| Norfolk Southern Corp. | 4,900 | 324 |
| General Dynamics Corp. | 3,480 | 256 |
| Waste Management, Inc. | 7,400 | 233 |
| Northrop Grumman Corp. | 3,650 | 221 |
| United Technologies Corp. | 3,500 | 210 |
| FedEx Corp. | 2,600 | 206 |
| Ryder System, Inc. | 3,200 | 198 |
| Raytheon Co. | 3,600 | 193 |
| Trinity Industries, Inc. | 6,800 | 175 |
* | AGCO Corp. | 4,000 | 170 |
| Cooper Industries, Inc. Class A | 4,100 | 164 |
| Illinois Tool Works, Inc. | 3,300 | 147 |
| The Timken Co. | 3,400 | 96 |
* | Allied Waste Industries, Inc. | 7,916 | 88 |
| The Dun & Bradstreet Corp. | 800 | 75 |
| L-3 Communications |
|
|
| Holdings, Inc. | 700 | 69 |
| Ingersoll-Rand Co. | 2,200 | 69 |
* | Gardner Denver Inc. | 1,800 | 63 |
| Tyco International, Ltd. | 1,125 | 39 |
* | Terex Corp. | 1,200 | 37 |
* | United Rentals, Inc. | 743 | 11 |
| Hubbell Inc. Class B | 300 | 11 |
|
|
| 5,527 |
Information Technology (2.9%) |
|
| |
* | Symantec Corp. | 18,600 | 364 |
| Tyco Electronics Ltd. | 11,575 | 320 |
* | Integrated Device |
|
|
| Technology Inc. | 19,200 | 149 |
| Intel Corp. | 7,700 | 144 |
| CA, Inc. | 6,700 | 134 |
| Seagate Technology | 11,000 | 133 |
* | Lexmark International, Inc. | 3,600 | 117 |
| Motorola, Inc. | 14,680 | 105 |
| Diebold, Inc. | 2,100 | 70 |
| International Business |
|
|
| Machines Corp. | 560 | 66 |
* | Western Digital Corp. | 1,900 | 41 |
* | EMC Corp. | 1,500 | 18 |
* | LSI Corp. | 1,900 | 10 |
* | NCR Corp. | 400 | 9 |
|
|
| 1,680 |
Materials (3.6%) |
|
| |
| E.I. du Pont de |
|
|
| Nemours & Co. | 7,600 | 306 |
| Dow Chemical Co. | 8,110 | 258 |
| Eastman Chemical Co. | 4,100 | 226 |
* | Owens-Illinois, Inc. | 7,500 | 221 |
| Reliance Steel & |
|
|
| Aluminum Co. | 4,800 | 182 |
| Freeport-McMoRan |
|
|
| Copper & Gold, Inc. Class B | 2,900 | 165 |
| United States Steel Corp. | 2,100 | 163 |
| Celanese Corp. Series A | 5,338 | 149 |
| Nucor Corp. | 3,500 | 138 |
| Schnitzer Steel |
|
|
| Industries, Inc. Class A | 2,800 | 110 |
| Alcoa Inc. | 4,220 | 95 |
| The Mosaic Co. | 500 | 34 |
| International Paper Co. | 1,200 | 31 |
|
|
| 2,078 |
Telecommunication Services (5.1%) |
| ||
| AT&T Inc. | 57,213 | 1,597 |
| Verizon |
|
|
| Communications Inc. | 30,440 | 977 |
| Qwest Communications |
|
|
| International Inc. | 45,100 | 146 |
| Embarq Corp. | 3,000 | 122 |
| Sprint Nextel Corp. | 19,420 | 118 |
| Windstream Corp. | 800 | 9 |
|
|
| 2,969 |
Utilities (5.9%) |
|
| |
| American Electric |
|
|
| Power Co., Inc. | 9,100 | 338 |
| Edison International | 8,100 | 323 |
| Sempra Energy | 6,100 | 308 |
| Consolidated Edison Inc. | 7,100 | 305 |
| Duke Energy Corp. | 16,304 | 284 |
| Dominion Resources, Inc. | 6,268 | 268 |
| Southern Co. | 6,439 | 243 |
| Alliant Energy Corp. | 5,600 | 180 |
| FPL Group, Inc. | 3,200 | 161 |
| Exelon Corp. | 2,400 | 150 |
| Ameren Corp. | 3,700 | 144 |
| Sierra Pacific Resources | 15,000 | 144 |
| Progress Energy, Inc. | 2,800 | 121 |
| Questar Corp. | 2,900 | 119 |
| MDU Resources Group, Inc. | 3,600 | 104 |
| Xcel Energy, Inc. | 3,500 | 70 |
| Entergy Corp. | 700 | 62 |
| Pepco Holdings, Inc. | 1,558 | 36 |
| FirstEnergy Corp. | 400 | 27 |
* | Reliant Energy, Inc. | 2,300 | 17 |
|
|
| 3,404 |
Total Common Stocks |
|
| |
(Cost $64,728) |
| 57,254 | |
44
Structured Large-Cap Value Fund
|
| Market |
|
| Value• |
| Shares | ($000) |
Temporary Cash Investments (0.6%)1 |
|
|
Money Market Fund (0.2%) |
|
|
2 Vanguard Market |
|
|
Liquidity Fund, 2.296% | 108,172 | 108 |
|
|
|
|
|
|
| Face |
|
| Amount |
|
| ($000) |
|
U.S. Government Agency Obligation (0.4%) |
|
|
3,4 Federal Home Loan Bank, |
|
|
2.432%, 10/15/08 | 200 | 200 |
Total Temporary Cash Investments |
|
|
(Cost $308) |
| 308 |
Total Investments (99.5%) |
|
|
(Cost $65,036) |
| 57,562 |
Other Assets and Liabilities (0.5%) |
|
|
Other Assets |
| 355 |
Liabilities |
| (44) |
|
| 311 |
Net Assets (100%) |
|
|
Applicable to 1,315,240 outstanding |
|
|
$.001 par value shares of beneficial |
|
|
interest (unlimited authorization) |
| 57,873 |
Net Asset Value Per Share |
| $44.00 |
At September 30, 2008, net assets consisted of: | |
| Amount |
| ($000) |
Paid-in Capital | 68,565 |
Undistributed Net Investment Income | 1,429 |
Accumulated Net Realized Losses | (4,641) |
Unrealized Appreciation (Depreciation) |
|
Investment Securities | (7,474) |
Futures Contracts | (6) |
Net Assets | 57,873 |
• See Note A in Notes to Financial Statements.
* Non-income-producing security.
1 The fund invests a portion of its cash reserves in equity markets through the use of index futures contracts. After giving effect to futures investments, the fund’s effective common stock and temporary cash investment positions represent 99.9% and –0.4%, respectively, of net assets.
2 Affiliated money market fund available only to Vanguard funds and certain trusts and accounts managed by Vanguard. Rate shown is the 7-day yield.
3 The issuer operates under a congressional charter; its securities are neither issued nor guaranteed by the U.S. government.
4 Securities with a value of $200,000 have been segregated as initial margin for open futures contracts.
REIT—Real Estate Investment Trust.
See accompanying Notes, which are an integral part of the Financial Statements.
45
Structured Large-Cap Value Fund
Statement of Operations
| Year Ended |
| September 30, 2008 |
| ($000) |
Investment Income |
|
Income |
|
Dividends | 1,965 |
Interest1 | 18 |
Total Income | 1,983 |
Expenses |
|
The Vanguard Group—Note B |
|
Investment Advisory Services | — |
Management and Administrative | 48 |
Custodian Fees | 15 |
Auditing Fees | 22 |
Shareholders’ Reports | 1 |
Total Expenses | 86 |
Net Investment Income | 1,897 |
Realized Net Gain (Loss) |
|
Investment Securities Sold | (4,227) |
Futures Contracts | (107) |
Realized Net Gain (Loss) | (4,334) |
Change in Unrealized Appreciation (Depreciation) |
|
Investment Securities | (17,276) |
Futures Contracts | (7) |
Change in Unrealized Appreciation (Depreciation) | (17,283) |
Net Increase (Decrease) in Net Assets Resulting from Operations | (19,720) |
1 Interest income from an affiliated company of the fund was $4,000.
See accompanying Notes, which are an integral part of the Financial Statements.
46
Structured Large-Cap Value Fund
Statement of Changes in Net Assets
|
|
| January 18, |
| Year Ended |
| 20071 to |
| September 30, |
| September 30, |
| 2008 |
| 2007 |
| ($000) |
| ($000) |
Increase (Decrease) in Net Assets |
|
|
|
Operations |
|
|
|
Net Investment Income | 1,897 |
| 1,263 |
Realized Net Gain (Loss) | (4,334) |
| 4,724 |
Change in Unrealized Appreciation (Depreciation) | (17,283) |
| (1,054) |
Net Increase (Decrease) in Net Assets Resulting from Operations | (19,720) |
| 4,933 |
Distributions |
|
|
|
Net Investment Income | (1,731) |
| — |
Realized Capital Gain2 | (5,031) |
| — |
Total Distributions | (6,762) |
| — |
|
|
|
|
Capital Share Transactions |
|
|
|
Issued | 4,000 |
| 78,6603 |
Issued in Lieu of Cash Distributions | 6,762 |
| — |
Redeemed | (5,000) |
| (5,000) |
Net Increase (Decrease) from Capital Share Transactions | 5,762 |
| 73,660 |
Total Increase (Decrease) | (20,720) |
| 78,593 |
Net Assets |
|
|
|
Beginning of Period | 78,593 |
| — |
End of Period4 | 57,873 |
| 78,593 |
1 Commencement of operations as a registered investment company.
2 Includes fiscal 2008 short-term gain distributions totaling $1,651,000. Short-term gain distributions are treated as ordinary income dividends for tax purposes.
3 Includes shares converted from the net assets of Vanguard Fiduciary Trust Company Structured Large-Cap Value Trust.
4 Net Assets—End of Period includes undistributed net investment income of $1,429,000 and $1,263,000. See accompanying Notes, which are an integral part of the Financial Statements.
47
Structured Large-Cap Value Fund
Financial Highlights
Institutional Plus Shares |
|
|
| Year | Jan. 18, |
| Ended | 20071 to |
| Sept. 30, | Sept. 30, |
For a Share Outstanding Throughout Each Period | 2008 | 2007 |
Net Asset Value, Beginning of Period | $63.87 | $60.09 |
Investment Operations |
|
|
Net Investment Income | 1.426 | 1.030 |
Net Realized and Unrealized Gain (Loss) on Investments | (15.946) | 2.750 |
Total from Investment Operations | (14.520) | 3.780 |
Distributions |
|
|
Dividends from Net Investment Income | (1.370) | — |
Distributions from Realized Capital Gains | (3.980) | — |
Total Distributions | (5.350) | — |
Net Asset Value, End of Period | $44.00 | $63.87 |
|
|
|
|
|
|
Total Return | –24.47% | 6.29% |
|
|
|
|
|
|
Ratios/Supplemental Data |
|
|
Net Assets, End of Period (Millions) | $58 | $79 |
Ratio of Total Expenses to Average Net Assets | 0.12% | 0.15%2 |
Ratio of Net Investment Income to Average Net Assets | 2.63% | 2.29%2 |
Portfolio Turnover Rate | 104% | 48% |
1 Commencement of operations as a registered investment company.
2 Annualized.
See accompanying Notes, which are an integral part of the Financial Statements.
48
Structured Large-Cap Value Fund
Notes to Financial Statements
Vanguard Structured Large-Cap Value Fund is registered under the Investment Company Act of 1940 as an open-end investment company, or mutual fund. The fund offers two classes of shares: Institutional Shares and Institutional Plus Shares. Institutional Shares are available to investors who invest a minimum amount of $5 million. Institutional Plus Shares are available to investors who invest a minimum amount of $200 million ($100 million for investors with total Vanguard investments of at least $1 billion). The fund has not issued any Institutional Shares through September 30, 2008.
A. The following significant accounting policies conform to generally accepted accounting principles for U.S. mutual funds. The fund consistently follows such policies in preparing its financial statements.
1. Security Valuation: Securities are valued as of the close of trading on the New York Stock Exchange (generally 4 p.m., Eastern time) on the valuation date. Equity securities are valued at the latest quoted sales prices or official closing prices taken from the primary market in which each security trades; such securities not traded on the valuation date are valued at the mean of the latest quoted bid and asked prices. Securities for which market quotations are not readily available, or whose values have been materially affected by events occurring before the fund’s pricing time but after the close of the securities’ primary markets, are valued by methods deemed by the board of trustees to represent fair value. Investments in Vanguard Market Liquidity Fund are valued at that fund’s net asset value. Temporary cash investments acquired over 60 days to maturity are valued using the latest bid prices or using valuations based on a matrix system (which considers such factors as security prices, yields, maturities, and ratings), both as furnished by independent pricing services. Other temporary cash investments are valued at amortized cost, which approximates market value.
2. Futures Contracts: The fund uses index futures contracts to a limited extent, with the objective of maintaining full exposure to the stock market while maintaining liquidity. The fund may purchase or sell futures contracts to achieve a desired level of investment, whether to accommodate portfolio turnover or cash flows from capital share transactions. The primary risks associated with the use of futures contracts are imperfect correlation between changes in market values of stocks held by the fund and the prices of futures contracts, and the possibility of an illiquid market.
Futures contracts are valued at their quoted daily settlement prices. The aggregate principal amounts of the contracts are not recorded in the Statement of Net Assets. Fluctuations in the value of the contracts are recorded in the Statement of Net Assets as an asset (liability) and in the Statement of Operations as unrealized appreciation (depreciation) until the contracts are closed, when they are recorded as realized futures gains (losses).
3. Federal Income Taxes: The fund intends to continue to qualify as a regulated investment company and distribute all of its taxable income. Management has analyzed the fund’s tax positions taken on federal income tax returns for all open tax years (tax years ended September 30, 2007–2008), and has concluded that no provision for federal income tax is required in the fund’s financial statements.
4. Distributions: Distributions to shareholders are recorded on the ex-dividend date.
5. Other: Dividend income is recorded on the ex-dividend date. Interest income includes income distributions received from Vanguard Market Liquidity Fund and is accrued daily. Security transactions are accounted for on the date securities are bought or sold. Costs used to determine realized gains (losses) on the sale of investment securities are those of the specific securities sold.
49
Structured Large-Cap Value Fund
B. The Vanguard Group furnishes at cost investment advisory, corporate management, administrative, marketing, and distribution services. The costs of such services are allocated to the fund under methods approved by the board of trustees. The fund has committed to provide up to 0.40% of its net assets in capital contributions to Vanguard. At September 30, 2008, the fund had contributed capital of $6,000 to Vanguard (included in Other Assets), representing 0.01% of the fund’s net assets and 0.01% of Vanguard’s capitalization. The fund’s trustees and officers are also directors and officers of Vanguard.
C. Distributions are determined on a tax basis and may differ from net investment income and realized capital gains for financial reporting purposes. Differences may be permanent or temporary. Permanent differences are reclassified among capital accounts in the financial statements to reflect their tax character. Temporary differences arise when certain items of income, expense, gain, or loss are recognized in different periods for financial statement and tax purposes; these differences will reverse at some time in the future. Differences in classification may also result from the treatment of short-term gains as ordinary income for tax purposes.
For tax purposes, at September 30, 2008, the fund had $1,465,000 of ordinary income available for distribution. Tax-basis capital gains required to be distributed in December 2007 included net gains realized through October 31, 2007. Subsequently, the fund realized capital losses of $4,504,000, which are available to offset future net capital gains.
At September 30, 2008, the cost of investment securities for tax purposes was $65,180,000. Net unrealized depreciation of investment securities for tax purposes was $7,618,000, consisting of unrealized gains of $4,494,000 on securities that had risen in value since their purchase and $12,112,000 in unrealized losses on securities that had fallen in value since their purchase.
At September 30, 2008, the aggregate settlement value of open futures contracts expiring in December 2008 and the related unrealized appreciation (depreciation) were:
|
|
| ($000) |
| Number of | Aggregate | Unrealized |
| Long (Short) | Settlement | Appreciation |
Futures Contracts | Contracts | Value | (Depreciation) |
E-mini S&P 500 Index | 10 | 585 | (6) |
Unrealized appreciation (depreciation) on open futures contracts is required to be treated as a realized gain (loss) for tax purposes.
D. During the year ended September 30, 2008, the fund purchased $75,085,000 of investment securities and sold $74,449,000 of investment securities, other than temporary cash investments.
E. Pursuant to a plan of reorganization approved by the trustee of Vanguard Fiduciary Trust Company Structured Large-Cap Value Trust (the “trust”) on October 20, 2006, the trust purchased shares of the fund through a nontaxable in-kind transfer of all of the trust’s investment securities on January 18, 2007, resulting in the issuance of 1,309,000 fund shares at a net asset value per share of $60.09. The trust’s net assets transferred to the fund were $78,660,000, including net unrealized appreciation of $10,857,000. On January 19, 2007, the trust liquidated by distributing to unitholders shares of the fund equal to the value of the unitholders’ investments in the trust.
50
Structured Large-Cap Value Fund
F. Capital shares issued and redeemed were:
| Year Ended |
| January 18, 20071 to |
| September 30, 2008 |
| September 30, 2007 |
| Shares |
| Shares |
| (000) |
| (000) |
Issued | 73 |
| 1,309 |
Issued in Lieu of Cash Distributions | 122 |
| — |
Redeemed | (110) |
| (78) |
Net Increase (Decrease) in Shares Outstanding | 85 |
| 1,231 |
G. In September 2006, the Financial Accounting Standards Board issued Statement of Financial Accounting Standards No. 157 (“FAS 157”), “Fair Value Measurements.” FAS 157 establishes a framework for measuring fair value and expands disclosures about fair value measurements in financial statements.
The various inputs that may be used to determine the value of the fund’s investments are summarized in three broad levels. The inputs or methodologies used for valuing securities are not necessarily an indication of the risk associated with investing in those securities.
Level 1—Quoted prices in active markets for identical securities.
Level 2—Other significant observable inputs (including quoted prices for similar securities, interest rates, prepayment speeds, credit risk, etc.).
Level 3—Significant unobservable inputs (including the fund’s own assumptions used to determine the fair value of investments).
The following table summarizes the fund’s investments as of September 30, 2008, based on the inputs used to value them:
| Investments | Futures |
| in Securities | Contracts |
Valuation Inputs | ($000) | ($000) |
Level 1—Quoted prices | 57,362 | (6) |
Level 2—Other significant observable inputs | 200 | — |
Level 3—Significant unobservable inputs | — | — |
Total | 57,562 | (6) |
1 Commencement of operations as a registered investment company.
51
Structured Broad Market Fund
Fund Profile
As of September 30, 2008
Portfolio Characteristics |
|
| |
|
| Comparative | Broad |
| Fund | Index1 | Index2 |
Number of Stocks | 435 | 2,959 | 4,679 |
Median Market Cap | $29.9B | $29.5B | $29.6B |
Price/Earnings Ratio | 13.4x | 15.4x | 15.5x |
Price/Book Ratio | 2.2x | 2.2x | 2.2x |
Yield3 |
| 2.3% | 2.3% |
Institutional Shares | 2.1% |
|
|
Institutional |
|
|
|
Plus Shares | 2.1% |
|
|
Return on Equity | 20.3% | 20.2% | 20.0% |
Earnings Growth Rate | 18.7% | 17.8% | 17.7% |
Foreign Holdings | 0.0% | 0.0% | 0.0% |
Turnover Rate | 70% | — | — |
Expense Ratio |
|
|
|
(9/30/2007)4 |
| — | — |
Institutional Shares | 0.25% |
|
|
Institutional |
|
|
|
Plus Shares | 0.15% |
|
|
Short-Term Reserves | 0.0% | — | — |
Sector Diversification (% of equity exposure) | |||
|
| Comparative | Broad |
| Fund | Index1 | Index2 |
Consumer Discretionary | 9.3% | 9.4% | 9.2% |
Consumer Staples | 10.6 | 10.7 | 10.5 |
Energy | 12.4 | 12.4 | 12.6 |
Financials | 16.5 | 16.4 | 17.3 |
Health Care | 13.2 | 13.1 | 13.0 |
Industrials | 11.6 | 11.7 | 11.4 |
Information Technology | 16.0 | 15.9 | 15.7 |
Materials | 3.7 | 3.8 | 3.7 |
Telecommunication |
|
|
|
Services | 2.9 | 2.8 | 2.8 |
Utilities | 3.8 | 3.8 | 3.8 |
Ten Largest Holdings5 (% of total net assets) | ||
|
|
|
ExxonMobil Corp. | integrated oil |
|
| and gas | 3.1% |
General Electric Co. | industrial |
|
| conglomerate | 1.9 |
The Procter & Gamble Co. | household products | 1.8 |
Johnson & Johnson | pharmaceuticals | 1.6 |
Microsoft Corp. | systems software | 1.6 |
Chevron Corp. | integrated oil |
|
| and gas | 1.5 |
AT&T Inc. | integrated |
|
| telecommunication |
|
| services | 1.4 |
International Business |
|
|
Machines Corp. | computer hardware | 1.4 |
JPMorgan Chase & Co. | other diversified |
|
| financial services | 1.2 |
Wal-Mart Stores, Inc. | hypermarkets and |
|
| super centers | 1.2 |
Top Ten |
| 16.7% |
Investment Focus
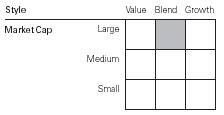
1 Russell 3000 Index.
2 Dow Jones Wilshire 5000 Index.
3 30-day SEC yield for the fund; annualized dividend yield for the indexes. See the Glossary.
4 The expense ratios shown are from the prospectus dated January 28, 2008. For the fiscal year ended September 30, 2008, the expense ratios were 0.20% for Institutional Shares and 0.12% for Institutional Plus Shares.
5 The holdings listed exclude any temporary cash investments and equity index products.
52
Structured Broad Market Fund
Performance Summary
All of the returns in this report represent past performance, which is not a guarantee of future results that may be achieved by the fund. (Current performance may be lower or higher than the performance data cited. For performance data current to the most recent month-end, visit our website at www.vanguard.com/performance.) Note, too, that both investment returns and principal value can fluctuate widely, so an investor’s shares, when sold, could be worth more or less than their original cost. The returns shown do not reflect taxes that a shareholder would pay on fund distributions or on the sale of fund shares.
Cumulative Performance: May 3, 2004–September 30, 2008
Initial Investment of $200,000,000
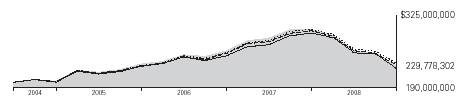
| Average Annual Total Returns |
| |
| Periods Ended September 30, 2008 | Final Value of a | |
|
| Since | $200,000,000 |
| One Year | Inception1 | Investment |
Structured Broad Market Fund |
|
|
|
Institutional Plus Shares | –22.91% | 3.20% | $229,778,302 |
Dow Jones Wilshire 5000 Index | –21.20 | 3.77 | 235,448,889 |
Russell 3000 Index | –21.52 | 3.45 | 232,230,879 |
Average Multi-Cap Core Fund2 | –22.79 | 2.70 | 224,951,164 |
|
|
| Final Value of a |
|
| Since | $5,000,000 |
| One Year | Inception1 | Investment |
Structured Broad Market Fund |
|
|
|
Institutional Shares | –22.95% | –9.23% | $4,186,933 |
Dow Jones Wilshire 5000 Index | –21.20 | –7.35 | 4,347,136 |
Russell 3000 Index | –21.52 | –7.67 | 4,319,202 |
1 Performance for the fund and its comparative standards is calculated since the following inception dates: May 3, 2004, for Institutional Plus Shares; November 30, 2006, for Institutional Shares.
2 Derived from data provided by Lipper Inc.
53
Structured Broad Market Fund
Fiscal-Year Total Returns (%): May 3, 2004–September 30, 2008
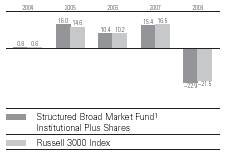
1 The fund commenced operations as a registered investment company on October 3, 2006. The fund’s performance includes the performance of a predecessor trust, Vanguard Fiduciary Trust Company Structured Large-Cap Growth Trust, from May 3, 2004, to October 3, 2006.
Note: See Financial Highlights tables for dividend and capital gains information.
54
Structured Broad Market Fund
Financial Statements
Statement of Net Assets
As of September 30, 2008
The fund provides a complete list of its holdings four times in each fiscal year, at the quarter-ends. For the second and fourth fiscal quarters, the lists appear in the fund’s semiannual and annual reports to shareholders. For the first and third fiscal quarters, the fund files the lists with the Securities and Exchange Commission on Form N-Q. Shareholders can look up the fund’s Forms N-Q on the SEC’s website at www.sec.gov. Forms N-Q may also be reviewed and copied at the SEC’s Public Reference Room (see the back cover of this report for further information).
|
|
| Market |
|
|
| Value• |
|
| Shares | ($000) |
Common Stocks (99.5%)1 |
|
| |
Consumer Discretionary (9.3%) |
|
| |
| McDonald’s Corp. | 27,131 | 1,674 |
| Comcast Corp. Class A | 68,265 | 1,340 |
| The Walt Disney Co. | 43,490 | 1,335 |
| Time Warner, Inc. | 74,090 | 971 |
| Lowe’s Cos., Inc. | 40,770 | 966 |
| Home Depot, Inc. | 36,420 | 943 |
| Omnicom Group Inc. | 21,160 | 816 |
| News Corp., Class A | 66,890 | 802 |
| Best Buy Co., Inc. | 20,190 | 757 |
| NIKE, Inc. Class B | 11,220 | 751 |
| The Gap, Inc. | 40,800 | 725 |
* | AutoZone Inc. | 5,500 | 678 |
* | NVR, Inc. | 1,040 | 595 |
* | Urban Outfitters, Inc. | 18,500 | 590 |
| Burger King Holdings Inc. | 22,900 | 562 |
| CBS Corp. | 37,655 | 549 |
| Darden Restaurants Inc. | 19,000 | 544 |
| Carnival Corp. | 15,100 | 534 |
| VF Corp. | 6,900 | 533 |
* | Big Lots Inc. | 19,100 | 532 |
| Target Corp. | 10,490 | 514 |
* | DISH Network Corp. | 24,250 | 509 |
* | Hanesbrands Inc. | 23,012 | 500 |
| Autoliv, Inc. | 14,400 | 486 |
* | Aeropostale, Inc. | 14,350 | 461 |
| Polo Ralph Lauren Corp. | 6,300 | 420 |
* | Expedia, Inc. | 21,900 | 331 |
* | Dollar Tree, Inc. | 8,200 | 298 |
| DeVry, Inc. | 6,000 | 297 |
| Royal Caribbean Cruises, Ltd. | 13,600 | 282 |
* | Jack in the Box Inc. | 13,100 | 276 |
* | The Goodyear Tire & |
|
|
| Rubber Co. | 17,000 | 260 |
| Black & Decker Corp. | 4,200 | 255 |
* | Ford Motor Co. | 49,062 | 255 |
* | Viacom Inc. Class B | 9,495 | 236 |
| Service Corp. International | 26,400 | 221 |
* | Valassis Communications, Inc. | 24,900 | 216 |
*, | ^Jos. A. Bank Clothiers, Inc. | 6,158 | 207 |
| RadioShack Corp. | 11,200 | 193 |
* | Amazon.com, Inc. | 2,553 | 186 |
* | Lear Corp. | 11,900 | 125 |
| Yum! Brands, Inc. | 3,400 | 111 |
* | Quiksilver, Inc. | 18,400 | 106 |
* | Liberty Media Corp. | 4,100 | 102 |
* | Fuel Systems Solutions, Inc. | 2,600 | 90 |
* | thinkorswim Group, Inc. | 7,200 | 60 |
| Advance Auto Parts, Inc. | 1,300 | 52 |
* | DIRECTV Group, Inc. | 1,870 | 49 |
* | Perry Ellis International Corp. | 2,400 | 36 |
* | GameStop Corp. Class A | 900 | 31 |
| The Stanley Works | 700 | 29 |
| Gray Television, Inc. | 5,000 | 9 |
| American Greetings Corp. |
|
|
| Class A | 400 | 6 |
|
|
| 23,406 |
Consumer Staples (10.5%) |
|
| |
| The Procter & Gamble Co. | 64,420 | 4,489 |
| Wal-Mart Stores, Inc. | 49,265 | 2,950 |
| The Coca-Cola Co. | 43,790 | 2,316 |
| Philip Morris International Inc. | 47,250 | 2,273 |
| PepsiCo, Inc. | 29,230 | 2,083 |
| Kraft Foods Inc. | 27,656 | 906 |
* | Dr. Pepper Snapple Group, Inc. | 28,800 | 763 |
| Reynolds American Inc. | 15,140 | 736 |
| CVS/Caremark Corp. | 21,336 | 718 |
| Altria Group, Inc. | 32,950 | 654 |
| The Kroger Co. | 23,700 | 651 |
| Anheuser-Busch Cos., Inc. | 9,990 | 648 |
| Molson Coors Brewing Co. |
|
|
| Class B | 13,800 | 645 |
| Walgreen Co. | 20,630 | 639 |
| The Pepsi Bottling Group, Inc. | 20,900 | 610 |
* | NBTY, Inc. | 19,200 | 567 |
| Herbalife Ltd. | 14,100 | 557 |
| Bunge Ltd. | 8,300 | 524 |
| SuperValu Inc. | 23,900 | 519 |
| Archer-Daniels-Midland Co. | 23,400 | 513 |
| Colgate-Palmolive Co. | 6,430 | 484 |
* | Fresh Del Monte Produce Inc. | 18,000 | 399 |
55
Structured Broad Market Fund
|
|
| Market |
|
|
| Value• |
|
| Shares | ($000) |
| Nash-Finch Co. | 8,089 | 349 |
| Diamond Foods, Inc. | 11,300 | 317 |
| Costco Wholesale Corp. | 4,870 | 316 |
| Kimberly-Clark Corp. | 4,070 | 264 |
| ConAgra Foods, Inc. | 13,500 | 263 |
* | Omega Protein Corp. | 22,300 | 262 |
| Universal Corp. (VA) | 1,400 | 69 |
* | China Sky One Medical Inc. | 200 | 2 |
|
|
| 26,486 |
Energy (12.3%) |
|
| |
| ExxonMobil Corp. | 101,220 | 7,861 |
| Chevron Corp. | 44,565 | 3,676 |
| ConocoPhillips Co. | 30,800 | 2,256 |
| Schlumberger Ltd. | 20,600 | 1,609 |
| Occidental Petroleum Corp. | 20,040 | 1,412 |
| Devon Energy Corp. | 10,813 | 986 |
| Apache Corp. | 9,240 | 964 |
| Hess Corp. | 8,600 | 706 |
| Williams Cos., Inc. | 28,500 | 674 |
| Murphy Oil Corp. | 10,500 | 673 |
| Noble Corp. | 15,000 | 659 |
| ENSCO International, Inc. | 11,130 | 641 |
| Chesapeake Energy Corp. | 17,700 | 635 |
| Anadarko Petroleum Corp. | 12,040 | 584 |
| Noble Energy, Inc. | 10,200 | 567 |
* | Pride International, Inc. | 17,500 | 518 |
* | Whiting Petroleum Corp. | 7,100 | 506 |
* | Transocean, Inc. | 4,460 | 490 |
| EOG Resources, Inc. | 5,200 | 465 |
| W&T Offshore, Inc. | 16,800 | 458 |
* | Mariner Energy Inc. | 21,600 | 443 |
* | Denbury Resources, Inc. | 21,700 | 413 |
| Halliburton Co. | 11,970 | 388 |
* | Unit Corp. | 7,700 | 384 |
* | Newfield Exploration Co. | 11,800 | 377 |
* | Plains Exploration & |
|
|
| Production Co. | 10,300 | 362 |
| Marathon Oil Corp. | 8,740 | 348 |
| XTO Energy, Inc. | 5,600 | 261 |
* | National Oilwell Varco Inc. | 4,800 | 241 |
| Frontline Ltd. | 5,000 | 240 |
* | Swift Energy Co. | 4,900 | 190 |
* | Stone Energy Corp. | 3,900 | 165 |
| Baker Hughes, Inc. | 2,460 | 149 |
* | Weatherford International Ltd. | 5,900 | 148 |
* | Encore Acquisition Co. | 3,200 | 134 |
* | McMoRan Exploration Co. | 5,400 | 128 |
| Pioneer Natural Resources Co. | 1,500 | 78 |
| Valero Energy Corp. | 1,992 | 60 |
| St. Mary Land & Exploration Co. | 1,200 | 43 |
* | Continental Resources, Inc. | 900 | 35 |
* | Superior Energy Services, Inc. | 1,100 | 34 |
| Berry Petroleum Class A | 800 | 31 |
* | Gulfmark Offshore, Inc. | 200 | 9 |
|
|
| 31,001 |
Financials (16.5%) |
|
| |
| JPMorgan Chase & Co. | 65,836 | 3,075 |
| Bank of America Corp. | 83,282 | 2,915 |
| Wells Fargo & Co. | 73,410 | 2,755 |
| Citigroup, Inc. | 92,851 | 1,904 |
| U.S. Bancorp | 42,450 | 1,529 |
| The Goldman Sachs |
|
|
| Group, Inc. | 10,011 | 1,281 |
| BB&T Corp. | 26,780 | 1,012 |
| Bank of New York |
|
|
| Mellon Corp. | 30,791 | 1,003 |
| The Chubb Corp. | 17,470 | 959 |
| Northern Trust Corp. | 11,800 | 852 |
| AFLAC Inc. | 13,940 | 819 |
| The Travelers Cos., Inc. | 18,040 | 815 |
| Unum Group | 31,500 | 791 |
| Charles Schwab Corp. | 30,000 | 780 |
| American Express Co. | 21,520 | 762 |
| MetLife, Inc. | 12,658 | 709 |
| State Street Corp. | 12,300 | 700 |
| Cullen/Frost Bankers, Inc. | 11,300 | 678 |
| Discover Financial Services | 48,600 | 672 |
| Morgan Stanley | 28,850 | 664 |
| Axis Capital Holdings Ltd. | 20,700 | 656 |
| RenaissanceRe Holdings Ltd. | 12,100 | 629 |
| Ameriprise Financial, Inc. | 15,700 | 600 |
| HCP, Inc. REIT | 14,000 | 562 |
| Bank of Hawaii Corp. | 10,300 | 550 |
| WSFS Financial Corp. | 9,000 | 540 |
| BOK Financial Corp. | 11,100 | 537 |
* | TD Ameritrade Holding Corp. | 32,700 | 530 |
| Pacific Capital Bancorp | 25,580 | 521 |
| Merrill Lynch & Co., Inc. | 19,740 | 499 |
* | Nasdaq Stock Market Inc. | 15,756 | 482 |
* | Crawford & Co. Class B | 30,337 | 475 |
| ProLogis REIT | 11,500 | 475 |
| The Hartford Financial |
|
|
| Services Group Inc. | 10,970 | 450 |
| American Financial Group, Inc. | 14,100 | 416 |
| Capital One Financial Corp. | 7,860 | 401 |
| Senior Housing Properties |
|
|
| Trust REIT | 15,600 | 372 |
| Prudential Financial, Inc. | 5,140 | 370 |
| Aspen Insurance |
|
|
| Holdings Ltd. | 13,400 | 368 |
* | The St. Joe Co. | 9,400 | 367 |
| Washington REIT | 9,900 | 363 |
| PNC Financial Services Group | 4,840 | 362 |
| First Industrial Realty |
|
|
| Trust REIT | 12,400 | 356 |
| Taubman Co. REIT | 7,000 | 350 |
| National Retail Properties |
|
|
| REIT | 14,500 | 347 |
| Highwood Properties, Inc. |
|
|
| REIT | 9,629 | 342 |
| Douglas Emmett, Inc. REIT | 14,700 | 339 |
56
Structured Broad Market Fund
|
|
| Market |
|
|
| Value• |
|
| Shares | ($000) |
| Saul Centers, Inc. REIT | 6,000 | 303 |
| Mid-America Apartment |
|
|
| Communities, Inc. REIT | 5,900 | 290 |
| Plum Creek Timber Co. Inc. |
|
|
| REIT | 5,300 | 264 |
| Hospitality Properties Trust |
|
|
| REIT | 12,700 | 261 |
| Loews Corp. | 6,510 | 257 |
| First BanCorp Puerto Rico | 22,400 | 248 |
| The Allstate Corp. | 5,158 | 238 |
| CME Group, Inc. | 590 | 219 |
| City Bank Lynnwood (WA) | 13,900 | 217 |
| Home Properties, Inc. REIT | 3,700 | 214 |
* | Arch Capital Group Ltd. | 2,900 | 212 |
| Nationwide Health |
|
|
| Properties, Inc. REIT | 5,500 | 198 |
| Cash America |
|
|
| International Inc. | 5,100 | 184 |
| FirstMerit Corp. | 8,100 | 170 |
| Invesco, Ltd. | 7,700 | 162 |
| General Growth |
|
|
| Properties Inc. REIT | 9,500 | 143 |
| Wachovia Corp. | 40,616 | 142 |
| Simon Property Group, Inc. |
|
|
| REIT | 1,296 | 126 |
| Associated Estates |
|
|
| Realty Corp. REIT | 9,500 | 124 |
| American International |
|
|
| Group, Inc. | 36,200 | 121 |
| International Bancshares Corp. | 3,000 | 81 |
| Allied Capital Corp. | 7,400 | 80 |
* | Reinsurance Group of |
|
|
| America, Inc. Group–B | 1,572 | 75 |
| Host Hotels & Resorts Inc. |
|
|
| REIT | 4,700 | 62 |
| Popular, Inc. | 7,100 | 59 |
| EastGroup Properties, Inc. |
|
|
| REIT | 1,000 | 48 |
^ | Sierra Bancorp | 2,000 | 42 |
* | CB Richard Ellis Group, Inc. | 3,100 | 41 |
| Oriental Financial Group Inc. | 2,100 | 37 |
| Commerce Bancshares, Inc. | 600 | 28 |
| S & T Bancorp, Inc. | 700 | 26 |
| American Physicians Capital, Inc. | 500 | 21 |
| PartnerRe Ltd. | 300 | 20 |
| Sovereign Bancorp, Inc. | 4,800 | 19 |
| Assurant, Inc. | 300 | 16 |
| Franklin Resources Corp. | 110 | 10 |
|
|
| 41,692 |
Health Care (13.1%) |
|
| |
| Johnson & Johnson | 59,807 | 4,143 |
| Pfizer Inc. | 140,035 | 2,582 |
| Abbott Laboratories | 27,800 | 1,601 |
* | Amgen, Inc. | 26,115 | 1,548 |
| Medtronic, Inc. | 23,730 | 1,189 |
| Baxter International, Inc. | 16,760 | 1,100 |
| Merck & Co., Inc. | 34,810 | 1,099 | |||
| Eli Lilly & Co. | 22,220 | 978 | |||
* | Express Scripts Inc. | 12,600 | 930 | |||
* | St. Jude Medical, Inc. | 20,300 | 883 | |||
| Wyeth | 22,240 | 822 | |||
* | Gilead Sciences, Inc. | 17,880 | 815 | |||
| McKesson Corp. | 13,900 | 748 | |||
* | Medco Health Solutions, Inc. | 15,785 | 710 | |||
* | Laboratory Corp. of |
|
| |||
| America Holdings | 9,400 | 653 | |||
* | DaVita, Inc. | 11,300 | 644 | |||
* | Myriad Genetics, Inc. | 9,800 | 636 | |||
* | Isis Pharmaceuticals, Inc. | 37,530 | 634 | |||
| Perrigo Co. | 16,200 | 623 | |||
| AmerisourceBergen Corp. | 16,200 | 610 | |||
* | CONMED Corp. | 18,900 | 605 | |||
* | Genentech, Inc. | 6,315 | 560 | |||
| Bristol-Myers Squibb Co. | 26,630 | 555 | |||
* | Watson Pharmaceuticals, Inc. | 18,800 | 536 | |||
* | OSI Pharmaceuticals, Inc. | 10,200 | 503 | |||
* | Forest Laboratories, Inc. | 17,600 | 498 | |||
* | Thermo Fisher Scientific, Inc. | 8,900 | 489 | |||
* | Alnylam Pharmaceuticals Inc. | 16,400 | 475 | |||
* | Warner Chilcott Ltd. | 31,100 | 470 | |||
| Covidien Ltd. | 8,500 | 457 | |||
* | Cynosure Inc. | 23,100 | 414 | |||
* | AMERIGROUP Corp. | 16,400 | 414 | |||
| Aetna Inc. | 10,880 | 393 | |||
| UnitedHealth Group Inc. | 14,675 | 373 | |||
| Becton, Dickinson & Co. | 4,420 | 355 | |||
| Cardinal Health, Inc. | 7,110 | 350 | |||
| Schering-Plough Corp. | 18,510 | 342 | |||
* | Celgene Corp. | 4,900 | 310 | |||
* | Bruker BioSciences Corp. | 22,200 | 296 | |||
* | Emergent BioSolutions Inc. | 21,000 | 275 | |||
* | Onyx Pharmaceuticals, Inc. | 7,500 | 271 | |||
* | WellPoint Inc. | 5,550 | 260 | |||
* | Lincare Holdings, Inc. | 6,000 | 181 | |||
| Ensign Group Inc. | 8,500 | 145 | |||
| Stryker Corp. | 1,800 | 112 | |||
* | Kindred Healthcare, Inc. | 3,300 | 91 | |||
| Universal Health Services |
|
| |||
| Class B | 1,600 | 90 | |||
* | Invitrogen Corp. | 2,100 | 79 | |||
*, | ^Pozen Inc. | 5,700 | 60 | |||
| Owens & Minor, Inc. |
|
| |||
| Holding Co. | 1,100 | 53 | |||
* | Hospira, Inc. | 800 | 31 | |||
* | Bio-Rad Laboratories, Inc. |
|
| |||
| Class A | 200 | 20 | |||
* | eResearch Technology, Inc. | 1,200 | 14 | |||
|
|
| 33,025 | |||
Industrials (11.6%) |
|
|
| |||
| General Electric Co. | 188,180 | 4,799 | |||
| The Boeing Co. | 19,660 | 1,127 | |||
| Caterpillar, Inc. | 16,776 | 1,000 | |||
57
Structured Broad Market Fund
|
|
| Market |
|
|
| Value• |
|
| Shares | ($000) |
| Union Pacific Corp. | 13,900 | 989 |
| CSX Corp. | 18,037 | 984 |
| Lockheed Martin Corp. | 8,950 | 982 |
| United Technologies Corp. | 15,740 | 945 |
| Honeywell International Inc. | 20,224 | 840 |
| L-3 Communications |
|
|
| Holdings, Inc. | 8,500 | 836 |
| Waste Management, Inc. | 25,900 | 816 |
| Burlington Northern |
|
|
| Santa Fe Corp. | 8,470 | 783 |
| Raytheon Co. | 13,500 | 722 |
| 3M Co. | 10,130 | 692 |
| Deere & Co. | 13,000 | 643 |
| United Parcel Service, Inc. | 9,980 | 628 |
| Ryder System, Inc. | 10,000 | 620 |
| Cooper Industries, Inc. |
|
|
| Class A | 15,400 | 615 |
| Parker Hannifin Corp. | 11,400 | 604 |
| Ingersoll-Rand Co. | 19,100 | 595 |
| Fluor Corp. | 10,400 | 579 |
* | American Reprographics Co. | 32,900 | 568 |
* | EMCOR Group, Inc. | 19,600 | 516 |
| GATX Corp. | 12,320 | 487 |
* | AGCO Corp. | 11,400 | 486 |
| Manpower Inc. | 10,102 | 436 |
| Emerson Electric Co. | 10,440 | 426 |
| Textron, Inc. | 14,488 | 424 |
| Robbins & Myers, Inc. | 13,500 | 418 |
* | First Solar, Inc. | 2,000 | 378 |
* | United Rentals, Inc. | 24,189 | 369 |
| General Dynamics Corp. | 4,750 | 350 |
| Cummins Inc. | 7,620 | 333 |
| The Manitowoc Co., Inc. | 19,800 | 308 |
* | NCI Building Systems, Inc. | 9,300 | 295 |
* | Consolidated Graphics, Inc. | 8,800 | 267 |
| FedEx Corp. | 2,944 | 233 |
| SPX Corp. | 3,000 | 231 |
| Genco Shipping and |
|
|
| Trading Ltd. | 6,400 | 213 |
* | Cenveo Inc. | 26,900 | 207 |
* | On Assignment, Inc. | 24,991 | 197 |
* | GrafTech International Ltd. | 10,800 | 163 |
| Northrop Grumman Corp. | 2,530 | 153 |
| Arkansas Best Corp. | 4,500 | 152 |
| Illinois Tool Works, Inc. | 3,380 | 150 |
| Flowserve Corp. | 1,600 | 142 |
* | Alliant Techsystems, Inc. | 1,500 | 141 |
* | TBS International Ltd. | 10,400 | 140 |
* | AMREP Corp. | 3,300 | 140 |
* | Perini Corp. | 5,400 | 139 |
| The Dun & Bradstreet Corp. | 1,400 | 132 |
* | Foster Wheeler Ltd. | 3,400 | 123 |
| Tyco International, Ltd. | 3,250 | 114 |
| Insteel Industries, Inc. | 8,000 | 109 |
| Pacer International, Inc. | 6,000 | 99 |
| Danaher Corp. | 1,300 | 90 |
* | Allied Waste Industries, Inc. | 7,620 | 85 |
| Norfolk Southern Corp. | 1,200 | 79 |
* | Gardner Denver Inc. | 1,700 | 59 |
| R.R. Donnelley & Sons Co. | 1,200 | 29 |
| Trinity Industries, Inc. | 756 | 19 |
* | First Advantage Corp. Class A | 900 | 13 |
|
|
| 29,212 |
Information Technology (15.9%) |
|
| |
| Microsoft Corp. | 149,197 | 3,982 |
| International Business |
|
|
| Machines Corp. | 29,742 | 3,479 |
| Hewlett-Packard Co. | 54,899 | 2,539 |
* | Cisco Systems, Inc. | 109,350 | 2,467 |
| Intel Corp. | 119,490 | 2,238 |
* | Oracle Corp. | 90,548 | 1,839 |
* | Apple Inc. | 15,820 | 1,798 |
* | Google Inc. | 4,130 | 1,654 |
| QUALCOMM Inc. | 35,520 | 1,526 |
| Western Union Co. | 38,300 | 945 |
* | Symantec Corp. | 47,200 | 924 |
| Tyco Electronics Ltd. | 26,850 | 743 |
| Accenture Ltd. | 18,900 | 718 |
| Corning, Inc. | 45,670 | 714 |
| Automatic Data |
|
|
| Processing, Inc. | 16,380 | 700 |
* | Dell Inc. | 42,480 | 700 |
| Texas Instruments, Inc. | 32,270 | 694 |
| Analog Devices, Inc. | 24,500 | 646 |
* | BMC Software, Inc. | 21,700 | 621 |
* | EarthLink, Inc. | 72,300 | 615 |
| MasterCard, Inc. Class A | 3,207 | 569 |
* | Metavante Technologies | 26,400 | 508 |
* | Western Digital Corp. | 23,300 | 497 |
* | MEMC Electronic |
|
|
| Materials, Inc. | 16,720 | 472 |
* | Affiliated Computer |
|
|
| Services, Inc. Class A | 9,100 | 461 |
* | Multi-Fineline Electronix, Inc. | 31,000 | 458 |
* | S1 Corp. | 73,900 | 452 |
* | SPSS, Inc. | 15,100 | 443 |
| Seagate Technology | 36,200 | 439 |
* | Skyworks Solutions, Inc. | 49,800 | 416 |
* | NVIDIA Corp. | 38,550 | 413 |
* | Genpact, Ltd. | 39,300 | 408 |
* | EMC Corp. | 33,730 | 403 |
* | Sohu.com Inc. | 7,200 | 401 |
* | Lexmark International, Inc. | 11,100 | 362 |
* | Plexus Corp. | 16,800 | 348 |
* | Adobe Systems, Inc. | 8,100 | 320 |
| Visa Inc. | 5,000 | 307 |
* | LSI Corp. | 56,000 | 300 |
* | Neutral Tandem, Inc. | 13,800 | 256 |
* | eBay Inc. | 11,310 | 253 |
* | Yahoo! Inc. | 13,570 | 235 |
| PC-Tel, Inc. | 24,700 | 230 |
* | Marvell Technology Group Ltd. | 19,400 | 180 |
58
Structured Broad Market Fund
|
|
| Market |
|
|
| Value• |
|
| Shares | ($000) |
| Black Box Corp. | 5,200 | 180 |
| Applied Materials, Inc. | 11,800 | 179 |
* | Integral Systems, Inc. | 7,200 | 150 |
* | Harmonic, Inc. | 16,200 | 137 |
* | Sybase, Inc. | 4,462 | 137 |
* | Dolby Laboratories Inc. | 3,800 | 134 |
| Motorola, Inc. | 14,630 | 104 |
* | Amkor Technology, Inc. | 12,790 | 81 |
| Methode Electronics, Inc. |
|
|
| Class A | 8,800 | 79 |
| Diebold, Inc. | 2,300 | 76 |
| United Online, Inc. | 7,600 | 71 |
* | MKS Instruments, Inc. | 3,400 | 68 |
* | TriQuint Semiconductor, Inc. | 9,100 | 44 |
| National Semiconductor Corp. | 2,400 | 41 |
* | Silicon Image, Inc. | 5,300 | 28 |
* | CSG Systems International, Inc. | 1,200 | 21 |
* | Ceva, Inc. | 2,487 | 21 |
* | Parametric Technology Corp. | 900 | 17 |
* | Convergys Corp. | 100 | 1 |
|
|
| 40,242 |
Materials (3.7%) |
|
| |
| Monsanto Co. | 12,926 | 1,280 |
| United States Steel Corp. | 9,000 | 699 |
| International Paper Co. | 24,300 | 636 |
| Nucor Corp. | 15,700 | 620 |
| Freeport-McMoRan |
|
|
| Copper & Gold, Inc. Class B | 10,800 | 614 |
| AK Steel Holding Corp. | 20,500 | 531 |
| Terra Industries, Inc. | 17,900 | 526 |
| CF Industries Holdings, Inc. | 5,500 | 503 |
| E.I. du Pont de |
|
|
| Nemours & Co. | 12,180 | 491 |
* | Owens-Illinois, Inc. | 14,500 | 426 |
| The Mosaic Co. | 5,900 | 402 |
| Reliance Steel & |
|
|
| Aluminum Co. | 10,300 | 391 |
| Innophos Holdings Inc. | 14,900 | 363 |
| Dow Chemical Co. | 10,420 | 331 |
| Alcoa Inc. | 14,410 | 325 |
| Celanese Corp. Series A | 11,500 | 321 |
| Praxair, Inc. | 3,000 | 215 |
| Carpenter Technology Corp. | 6,900 | 177 |
| Rock-Tenn Co. | 4,200 | 168 |
* | Sutor Technology Group, Ltd. | 42,000 | 138 |
| Eastman Chemical Co. | 2,200 | 121 |
| Schnitzer Steel |
|
|
| Industries, Inc. Class A | 1,700 | 67 |
*, | ^ShengdaTech Inc. | 6,567 | 46 |
|
|
| 9,391 |
Telecommunication Services (2.9%) |
|
| |
| AT&T Inc. | 127,129 | 3,549 |
| Verizon Communications Inc. | 65,030 | 2,087 |
| Telephone & Data |
|
|
| Systems, Inc. | 13,500 | 483 |
| Embarq Corp. | 7,929 | 322 |
* | Cincinnati Bell Inc. | 97,500 | 301 | |
| Qwest Communications |
|
| |
| International Inc. | 71,400 | 231 | |
| Sprint Nextel Corp. | 21,989 | 134 | |
* | American Tower Corp. |
|
| |
| Class A | 2,900 | 104 | |
|
|
| 7,211 | |
Utilities (3.7%) |
|
| ||
| American Electric |
|
| |
| Power Co., Inc. | 22,300 | 827 | |
| Southern Co. | 21,660 | 816 | |
| Consolidated Edison Inc. | 18,000 | 773 | |
| Dominion Resources, Inc. | 17,800 | 761 | |
| Edison International | 18,840 | 752 | |
| Sempra Energy | 14,800 | 747 | |
| Duke Energy Corp. | 40,690 | 709 | |
| MDU Resources Group, Inc. | 22,200 | 644 | |
| Exelon Corp. | 9,640 | 604 | |
| ONEOK, Inc. | 16,200 | 557 | |
| Progress Energy, Inc. | 12,000 | 517 | |
| Energen Corp. | 10,200 | 462 | |
* | Mirant Corp. | 20,700 | 379 | |
| Alliant Energy Corp. | 9,500 | 306 | |
* | AES Corp. | 18,500 | 216 | |
| FPL Group, Inc. | 3,733 | 188 | |
| SCANA Corp. | 2,971 | 116 | |
| Pepco Holdings, Inc. | 2,600 | 60 | |
|
|
| 9,434 | |
Total Common Stocks |
|
| ||
(Cost $285,339) |
| 251,100 | ||
Temporary Cash Investments (0.5%)1 |
| |||
Money Market Fund (0.4%) |
|
| ||
2,3 | Vanguard Market |
|
| |
| Liquidity Fund, 2.296% | 1,096,238 | 1,096 | |
|
|
|
| |
|
|
|
| |
|
| Face |
| |
|
| Amount |
| |
|
| ($000) |
| |
U.S. Government Agency Obligation (0.1%) |
|
| ||
4,5 | Federal Home Loan Bank, |
|
| |
| 2.576%, 11/24/08 | 300 | 299 | |
Total Temporary Cash Investments |
|
| ||
(Cost $1,395) |
| 1,395 | ||
Total Investments (100.0%) |
|
| ||
(Cost $286,734) |
| 252,495 | ||
Other Assets and Liabilities (0.0%) |
|
| ||
Other Assets |
| 647 | ||
Liabilities3 |
| (678) | ||
|
|
| (31) | |
Net Assets (100%) |
| 252,464 | ||
59
Structured Broad Market Fund
At September 30, 2008, net assets consisted of: | |
| Amount |
| ($000) |
Paid-in Capital | 310,453 |
Undistributed Net Investment Income | 3,776 |
Accumulated Net Realized Losses | (27,464) |
Unrealized Appreciation (Depreciation) |
|
Investment Securities | (34,239) |
Futures Contracts | (62) |
Net Assets | 252,464 |
|
|
|
|
Institutional Shares—Net Assets |
|
Applicable to 193,529 outstanding |
|
$.001 par value shares of beneficial |
|
interest (unlimited authorization) | 4,166 |
Net Asset Value Per Share— |
|
Institutional Shares | $21.53 |
|
|
|
|
Institutional Plus Shares—Net Assets |
|
Applicable to 5,765,519 outstanding |
|
$.001 par value shares of beneficial |
|
interest (unlimited authorization) | 248,298 |
Net Asset Value Per Share— |
|
Institutional Plus Shares | $43.07 |
• See Note A in Notes to Financial Statements.
* Non-income-producing security.
^ Part of security position is on loan to broker-dealers. The total value of securities on loan is $244,000.
1 The fund invests a portion of its cash reserves in equity markets through the use of index futures contracts. After giving effect to futures investments, the fund’s effective common stock and temporary cash investment positions represent 100.0% and 0.0%, respectively, of net assets.
2 Affiliated money market fund available only to Vanguard funds and certain trusts and accounts managed by Vanguard. Rate shown is the 7-day yield.
3 Includes $254,000 of collateral received for securities on loan.
4 The issuer operates under a congressional charter; its securities are neither issued nor guaranteed by the U.S. government.
5 Securities with a value of $299,000 have been segregated as initial margin for open futures contracts. REIT—Real Estate Investment Trust.
See accompanying Notes, which are an integral part of the Financial Statements.
60
Structured Broad Market Fund
Statement of Operations
| Year Ended |
| September 30, 2008 |
| ($000) |
Investment Income |
|
Income |
|
Dividends | 5,403 |
Interest1 | 33 |
Security Lending | 14 |
Total Income | 5,450 |
Expenses |
|
The Vanguard Group—Note B |
|
Investment Advisory Services | 152 |
Management and Administrative—Institutional Shares | 8 |
Management and Administrative—Institutional Plus Shares | 85 |
Marketing and Distribution—Institutional Shares | 2 |
Marketing and Distribution—Institutional Plus Shares | 50 |
Custodian Fees | 23 |
Auditing Fees | 22 |
Shareholders’ Reports—Institutional Shares | — |
Shareholders’ Reports—Institutional Plus Shares | 1 |
Total Expenses | 343 |
Net Investment Income | 5,107 |
Realized Net Gain (Loss) |
|
Investment Securities Sold | (26,842) |
Futures Contracts | (66) |
Realized Net Gain (Loss) | (26,908) |
Change in Unrealized Appreciation (Depreciation) |
|
Investment Securities | (50,751) |
Futures Contracts | (85) |
Change in Unrealized Appreciation (Depreciation) | (50,836) |
Net Increase (Decrease) in Net Assets Resulting from Operations | (72,637) |
1 Interest income from an affiliated company of the fund was $33,000.
See accompanying Notes, which are an integral part of the Financial Statements.
61
Structured Broad Market Fund
Statement of Changes in Net Assets
|
|
| October 3, |
| Year Ended |
| 20061 to |
| September 30, |
| September 30, |
| 2008 |
| 2007 |
| ($000) |
| ($000) |
Increase (Decrease) in Net Assets |
|
|
|
Operations |
|
|
|
Net Investment Income | 5,107 |
| 2,500 |
Realized Net Gain (Loss) | (26,908) |
| 4,491 |
Change in Unrealized Appreciation (Depreciation) | (50,836) |
| 8,183 |
Net Increase (Decrease) in Net Assets Resulting from Operations | (72,637) |
| 15,174 |
Distributions |
|
|
|
Net Investment Income |
|
|
|
Institutional Shares | (137) |
| (22) |
Institutional Plus Shares | (3,225) |
| (447) |
Realized Capital Gain2 |
|
|
|
Institutional Shares | (210) |
| (18) |
Institutional Plus Shares | (4,456) |
| (363) |
Total Distributions | (8,028) |
| (850) |
Capital Share Transactions |
|
|
|
Institutional Shares | (7,621) |
| 13,025 |
Institutional Plus Shares | 41,977 |
| 271,424 |
Net Increase (Decrease) from Capital Share Transactions | 34,356 |
| 284,449 |
Total Increase (Decrease) | (46,309) |
| 298,773 |
Net Assets |
|
|
|
Beginning of Period | 298,773 |
| — |
End of Period3 | 252,464 |
| 298,773 |
1 Commencement of operations as a registered investment company.
2 Includes fiscal 2008 and 2007 short-term gain distributions totaling $239,000 and $216,000, respectively. Short-term gain distributions are treated as ordinary income dividends for tax purposes.
3 Net Assets—End of Period includes undistributed net investment income of $3,776,000 and $2,031,000. See accompanying Notes, which are an integral part of the Financial Statements.
62
Structured Broad Market Fund
Financial Highlights
Institutional Shares |
|
|
| Year | Nov. 30, |
| Ended | 20061 to |
| Sept. 30, | Sept. 30, |
For a Share Outstanding Throughout Each Period | 2008 | 2007 |
Net Asset Value, Beginning of Period | $28.67 | $26.59 |
Investment Operations |
|
|
Net Investment Income | .402 | .3612 |
Net Realized and Unrealized Gain (Loss) on Investments | (6.833) | 1.930 |
Total from Investment Operations | (6.431) | 2.291 |
Distributions |
|
|
Dividends from Net Investment Income | (.280) | (.116) |
Distributions from Realized Capital Gains | (.429) | (.095) |
Total Distributions | (.709) | (.211) |
Net Asset Value, End of Period | $21.53 | $28.67 |
|
|
|
|
|
|
Total Return | –22.95% | 8.68% |
|
|
|
|
|
|
Ratios/Supplemental Data |
|
|
Net Assets, End of Period (Millions) | $4 | $14 |
Ratio of Total Expenses to Average Net Assets | 0.20% | 0.25%3 |
Ratio of Net Investment Income to Average Net Assets | 1.72% | 1.55%3 |
Portfolio Turnover Rate | 70% | 66% |
1 Inception.
2 Calculated based on average shares outstanding.
3 Annualized.
See accompanying Notes, which are an integral part of the Financial Statements.
63
Structured Broad Market Fund
Institutional Plus Shares |
|
|
| Year | Oct. 3, |
| Ended | 20061 to |
| Sept. 30, | Sept. 30, |
For a Share Outstanding Throughout Each Period | 2008 | 2007 |
Net Asset Value, Beginning of Period | $57.39 | $50.00 |
Investment Operations |
|
|
Net Investment Income | .873 | .9042 |
Net Realized and Unrealized Gain (Loss) on Investments | (13.714) | 6.910 |
Total from Investment Operations | (12.841) | 7.814 |
Distributions |
|
|
Dividends from Net Investment Income | (.621) | (.234) |
Distributions from Realized Capital Gains | (.858) | (.190) |
Total Distributions | (1.479) | (.424) |
Net Asset Value, End of Period | $43.07 | $57.39 |
|
|
|
|
|
|
Total Return | –22.91% | 15.69% |
|
|
|
|
|
|
Ratios/Supplemental Data |
|
|
Net Assets, End of Period (Millions) | $248 | $285 |
Ratio of Total Expenses to Average Net Assets | 0.12% | 0.15%3 |
Ratio of Net Investment Income to Average Net Assets | 1.80% | 1.65%3 |
Portfolio Turnover Rate | 70% | 66% |
1 Commencement of operations as a registered investment company.
2 Calculated based on average shares outstanding.
3 Annualized.
See accompanying Notes, which are an integral part of the Financial Statements.
64
Structured Broad Market Fund
Notes to Financial Statements
Vanguard Structured Broad Market Fund is registered under the Investment Company Act of 1940 as an open-end investment company, or mutual fund. The fund offers two classes of shares: Institutional Shares and Institutional Plus Shares. Institutional Shares are available to investors who invest a minimum amount of $5 million. Institutional Plus Shares are available to investors who invest a minimum amount of $200 million ($100 million for investors with total Vanguard investments of at least $1 billion).
A. The following significant accounting policies conform to generally accepted accounting principles for U.S. mutual funds. The fund consistently follows such policies in preparing its financial statements.
1. Security Valuation: Securities are valued as of the close of trading on the New York Stock Exchange (generally 4 p.m., Eastern time) on the valuation date. Equity securities are valued at the latest quoted sales prices or official closing prices taken from the primary market in which each security trades; such securities not traded on the valuation date are valued at the mean of the latest quoted bid and asked prices. Securities for which market quotations are not readily available, or whose values have been materially affected by events occurring before the fund’s pricing time but after the close of the securities’ primary markets, are valued by methods deemed by the board of trustees to represent fair value. Investments in Vanguard Market Liquidity Fund are valued at that fund’s net asset value. Temporary cash investments acquired over 60 days to maturity are valued using the latest bid prices or using valuations based on a matrix system (which considers such factors as security prices, yields, maturities, and ratings), both as furnished by independent pricing services. Other temporary cash investments are valued at amortized cost, which approximates market value.
2. Futures Contracts: The fund uses index futures contracts to a limited extent, with the objective of maintaining full exposure to the stock market while maintaining liquidity. The fund may purchase or sell futures contracts to achieve a desired level of investment, whether to accommodate portfolio turnover or cash flows from capital share transactions. The primary risks associated with the use of futures contracts are imperfect correlation between changes in market values of stocks held by the fund and the prices of futures contracts, and the possibility of an illiquid market.
Futures contracts are valued at their quoted daily settlement prices. The aggregate principal amounts of the contracts are not recorded in the Statement of Net Assets. Fluctuations in the value of the contracts are recorded in the Statement of Net Assets as an asset (liability) and in the Statement of Operations as unrealized appreciation (depreciation) until the contracts are closed, when they are recorded as realized futures gains (losses).
3. Federal Income Taxes: The fund intends to continue to qualify as a regulated investment company and distribute all of its taxable income. Management has analyzed the fund’s tax positions taken on federal income tax returns for all open tax years (tax years ended September 30, 2007–2008), and has concluded that no provision for federal income tax is required in the fund’s financial statements.
4. Distributions: Distributions to shareholders are recorded on the ex-dividend date.
5. Security Lending: The fund may lend its securities to qualified institutional borrowers to earn additional income. Security loans are required to be secured at all times by collateral at least equal to the market value of securities loaned. The fund invests cash collateral received in Vanguard Market Liquidity Fund, and records a liability for the return of the collateral, during the period the securities are on loan. Security lending income represents the income earned on investing cash collateral, less expenses associated with the loan.
65
Structured Broad Market Fund
6. Other: Dividend income is recorded on the ex-dividend date. Interest income includes income distributions received from Vanguard Market Liquidity Fund and is accrued daily. Security transactions are accounted for on the date securities are bought or sold. Costs used to determine realized gains (losses) on the sale of investment securities are those of the specific securities sold.
Each class of shares has equal rights as to assets and earnings, except that each class separately bears certain class-specific expenses related to maintenance of shareholder accounts (included in Management and Administrative expenses) and shareholder reporting. Marketing and distribution expenses are allocated to each class of shares based on a method approved by the board of trustees. Income, other non-class-specific expenses, and gains and losses on investments are allocated to each class of shares based on its relative net assets.
B. The Vanguard Group furnishes at cost investment advisory, corporate management, administrative, marketing, and distribution services. The costs of such services are allocated to the fund under methods approved by the board of trustees. The fund has committed to provide up to 0.40% of its net assets in capital contributions to Vanguard. At September 30, 2008, the fund had contributed capital of $24,000 to Vanguard (included in Other Assets), representing 0.01% of the fund’s net assets and 0.02% of Vanguard’s capitalization. The fund’s trustees and officers are also directors and officers of Vanguard.
C. Distributions are determined on a tax basis and may differ from net investment income and realized capital gains for financial reporting purposes. Differences may be permanent or temporary. Permanent differences are reclassified among capital accounts in the financial statements to reflect their tax character. Temporary differences arise when certain items of income, expense, gain, or loss are recognized in different periods for financial statement and tax purposes; these differences will reverse at some time in the future. Differences in classification may also result from the treatment of short-term gains as ordinary income for tax purposes.
For tax purposes, at September 30, 2008, the fund had $3,887,000 of ordinary income available for distribution. Tax-basis capital gains required to be distributed in December 2007 included net gains realized through October 31, 2007. Subsequently, the fund realized capital losses of $27,520,000, which are available to offset future net capital gains.
At September 30, 2008, the cost of investment securities for tax purposes was $286,734,000. Net unrealized depreciation of investment securities for tax purposes was $34,239,000, consisting of unrealized gains of $13,319,000 on securities that had risen in value since their purchase and $47,558,000 in unrealized losses on securities that had fallen in value since their purchase.
At September 30, 2008, the aggregate settlement value of open futures contracts expiring in December 2008 and the related unrealized appreciation (depreciation) were:
|
|
| ($000) |
| Number of | Aggregate | Unrealized |
| Long (Short) | Settlement | Appreciation |
Futures Contracts | Contracts | Value | (Depreciation) |
S&P 500 Index | 4 | 1,169 | (58) |
E-mini S&P 500 Index | 3 | 175 | (4) |
Unrealized appreciation (depreciation) on open futures contracts is required to be treated as realized gain (loss) for tax purposes.
66
Structured Broad Market Fund
D During the year ended September 30, 2008, the fund purchased $229,439,000 of investment securities and sold $198,280,000 of investment securities, other than temporary cash investments.
E. Pursuant to a plan of reorganization approved by the trustee of Vanguard Fiduciary Trust Company Structured Broad Market Trust (the “trust”) on July 18, 2006, the trust purchased shares of the fund through a nontaxable in-kind transfer of all of the trust’s investment securities on October 3, 2006, resulting in the issuance of 1,908,000 fund shares at a net asset value per share of $50.00. The trust’s net assets transferred to the fund were $95,424,000, including net unrealized appreciation of $8,352,000. On October 4, 2006, the trust liquidated by distributing to unitholders shares of the fund equal to the value of the unitholders’ investments in the trust.
F. Capital share transactions for each class of shares were:
| Year Ended | October 3, 20061 to | |||
| September 30, 2008 | September 30, 2007 | |||
| Amount | Shares |
| Amount | Shares |
| ($000) | (000) |
| ($000) | (000) |
Institutional Shares |
|
|
|
|
|
Issued | — | — |
| 12,985 | 488 |
Issued in Lieu of Cash Distributions | 347 | 13 |
| 40 | 1 |
Redeemed | (7,968) | (308) |
| — | — |
Net Increase (Decrease)—Institutional Shares | (7,621) | (295) |
| 13,025 | 489 |
Institutional Plus Shares |
|
|
|
|
|
Issued | 58,835 | 1,175 |
| 278,6152 | 5,0862 |
Issued in Lieu of Cash Distributions | 3,142 | 58 |
| 809 | 15 |
Redeemed | (20,000) | (429) |
| (8,000) | (139) |
Net Increase (Decrease)—Institutional Plus Shares | 41,977 | 804 |
| 271,424 | 4,962 |
G. In September 2006, the Financial Accounting Standards Board issued Statement of Financial Accounting Standards No. 157 (“FAS 157”), “Fair Value Measurements.” FAS 157 establishes a framework for measuring fair value and expands disclosures about fair value measurements in financial statements.
The various inputs that may be used to determine the value of the fund’s investments are summarized in three broad levels. The inputs or methodologies used for valuing securities are not necessarily an indication of the risk associated with investing in those securities.
Level 1—Quoted prices in active markets for identical securities.
Level 2—Other significant observable inputs (including quoted prices for similar securities, interest rates, prepayment speeds, credit risk, etc.).
Level 3—Significant unobservable inputs (including the fund’s own assumptions used to determine the fair value of investments).
1 Commencement of operations as a registered investment company.
2 Includes shares converted from the net assets of Vanguard Fiduciary Trust Company Structured Broad Market Trust.
67
Structured Broad Market Fund
The following table summarizes the fund’s investments as of September 30, 2008, based on the inputs used to value them:
| Investments | Futures |
| in Securities | Contracts |
Valuation Inputs | ($000) | ($000) |
Level 1—Quoted prices | 252,196 | (62) |
Level 2—Other significant observable inputs | 299 | — |
Level 3—Significant unobservable inputs | — | — |
Total | 252,495 | (62) |
68
Report of Independent Registered
Public Accounting Firm
To the Trustees of Vanguard Quantitative Funds and the Shareholders of Vanguard Structured Large-Cap Equity Fund, Vanguard Structured Large-Cap Growth Fund, Vanguard Structured Large-Cap Value Fund, and Vanguard Structured Broad Market Fund:
In our opinion, the accompanying statements of net assets and the related statements of operations and of changes in net assets and the financial highlights present fairly, in all material respects, the financial position of Vanguard Structured Large-Cap Equity Fund, Vanguard Structured Large-Cap Growth Fund, Vanguard Structured Large-Cap Value Fund, and Vanguard Structured Broad Market Fund (the “Funds”) at September 30, 2008, and the results of each of their operations for the year ended, and the changes in each of their net assets and the financial highlights for each of the periods indicated, in conformity with accounting principles generally accepted in the United States of America. These financial statements and financial highlights (hereafter referred to as “financial statements”) are the responsibility of the Funds’ management; our responsibility is to express an opinion on these financial statements based on our audits. We conducted our audits of these financial statements in accordance with the standards of the Public Company Accounting Oversight Board (United States). Those standards require that we plan and perform the audit to obtain reasonable assurance about whether the financial statements are free of material misstatement. An audit includes examining, on a test basis, evidence supporting the amounts and disclosures in the financial statements, assessing the accounting principles used and significant estimates made by management, and evaluating the overall financial statement presentation. We believe that our audits, which included confirmation of securities at September 30, 2008 by correspondence with the custodian and broker, and by agreement to the underlying ownership records for Vanguard Market Liquidity Fund, provide a reasonable basis for our opinion.
PricewaterhouseCoopers LLP
Philadelphia, Pennsylvania
November 19, 2008
69
Special 2008 tax information (unaudited) for Vanguard Structured Equity Funds
This information for the fiscal year ended September 30, 2008, is included pursuant to provisions of the Internal Revenue Code.
The funds distributed capital gain dividends (from net long-term capital gains) to shareholders during the fiscal year as follows:
| Long-Term Capital |
| Gain Dividends |
Fund | ($000) |
Structured Large-Cap Equity | 3,622 |
Structured Large-Cap Growth | 744 |
Structured Large-Cap Value | 3,380 |
Structured Broad Market | 4,427 |
For non-resident alien shareholders, 100% of short-term capital gain dividends distributed by each of the Vanguard Structured Equity Funds are qualified short-term capital gains.
The funds distributed qualified dividend income to shareholders during the fiscal year as follows:
| Qualified Dividend Income |
Fund | ($000) |
Structured Large-Cap Equity | 15,920 |
Structured Large-Cap Growth | 680 |
Structured Large-Cap Value | 1,687 |
Structured Broad Market | 3,305 |
For corporate shareholders, the percentage of investment income (dividend income plus short-term gains, if any) that qualifies for the dividends-received deduction is as follows:
Fund | Percentage |
Structured Large-Cap Equity | 85.9% |
Structured Large-Cap Growth | 100.0 |
Structured Large-Cap Value | 91.8 |
Structured Broad Market | 93.0 |
70
About Your Fund’s Expenses
As a shareholder of the fund, you incur ongoing costs, which include costs for portfolio management, administrative services, and shareholder reports (like this one), among others. Operating expenses, which are deducted from a fund’s gross income, directly reduce the investment return of the fund.
A fund’s expenses are expressed as a percentage of its average net assets. This figure is known as the expense ratio. The following examples are intended to help you understand the ongoing costs (in dollars) of investing in your fund and to compare these costs with those of other mutual funds. The examples are based on an investment of $1,000 made at the beginning of the period shown and held for the entire period.
The accompanying table illustrates your fund’s costs in two ways:
• Based on actual fund return. This section helps you to estimate the actual expenses that you paid over the period. The “Ending Account Value” shown is derived from the fund’s actual return, and the third column shows the dollar amount that would have been paid by an investor who started with $1,000 in the fund. You may use the information here, together with the amount you invested, to estimate the expenses that you paid over the period.
To do so, simply divide your account value by $1,000 (for example, an $8,600 account value divided by $1,000 = 8.6), then multiply the result by the number given for your fund under the heading “Expenses Paid During Period.”
• Based on hypothetical 5% yearly return. This section is intended to help you compare your fund’s costs with those of other mutual funds. It assumes that the fund had a yearly return of 5% before expenses, but that the expense ratio is unchanged. In this case—because the return used is not the fund’s actual return—the results do not apply to your investment. The example is useful in making comparisons because the Securities and Exchange Commission requires all mutual funds to calculate expenses based on a 5% return. You can assess your fund’s costs by comparing this hypothetical example with the hypothetical examples that appear in shareholder reports of other funds.
Note that the expenses shown in the table are meant to highlight and help you compare ongoing costs only and do not reflect transaction costs incurred by the fund for buying and selling securities. Your fund does not charge transaction fees, such as purchase or redemption fees, nor does it carry a “sales load.”
The calculations assume no shares were bought or sold during the period. Your actual costs may have been higher or lower, depending on the amount of your investment and the timing of any purchases or redemptions.
You can find more information about the fund’s expenses, including annual expense ratios, in the Financial Statements section of this report. For additional information on operating expenses and other shareholder costs, please refer to your fund’s current prospectus.
71
Six Months Ended September 30, 2008 |
|
|
|
| Beginning | Ending | Expenses |
| Account Value | Account Value | Paid During |
| 3/31/2008 | 9/30/2008 | Period1 |
Based on Actual Fund Return |
|
|
|
Structured Large-Cap Equity Fund |
|
|
|
Institutional Shares | $1,000.00 | $883.32 | $0.85 |
Institutional Plus Shares | 1,000.00 | 883.56 | 0.52 |
Structured Large-Cap Growth Fund |
|
|
|
Institutional Shares | $1,000.00 | $882.61 | $0.80 |
Institutional Plus Shares | 1,000.00 | 882.86 | 0.42 |
Structured Large-Cap Value Fund |
|
|
|
Institutional Plus Shares | $1,000.00 | $879.65 | $0.52 |
Structured Broad Market Fund |
|
|
|
Institutional Shares | $1,000.00 | $887.84 | $0.71 |
Institutional Plus Shares | 1,000.00 | 888.04 | 0.47 |
Based on Hypothetical 5% Yearly Return |
|
|
|
Structured Large-Cap Equity Fund |
|
|
|
Institutional Shares | $1,000.00 | $1,024.17 | $0.91 |
Institutional Plus Shares | 1,000.00 | 1,024.52 | 0.56 |
Structured Large-Cap Growth Fund |
|
|
|
Institutional Shares | $1,000.00 | $1,024.22 | $0.86 |
Institutional Plus Shares | 1,000.00 | 1,024.62 | 0.46 |
Structured Large-Cap Value Fund |
|
|
|
Institutional Plus Shares | $1,000.00 | $1,024.52 | $0.56 |
Structured Broad Market Fund |
|
|
|
Institutional Shares | $1,000.00 | $1,024.32 | $0.76 |
Institutional Plus Shares | 1,000.00 | 1,024.57 | 0.51 |
1 The calculations are based on expenses incurred in the most recent six-month period. The funds’ annualized six-month expense ratios for that period are: 0.18% for the Structured Large-Cap Equity Fund Institutional Shares, 0.11% for the Institutional Plus Shares; 0.17% for the Structured Large-Cap Growth Fund Institutional Shares, 0.09% for the Institutional Plus Shares; 0.11% for the Structured Large-Cap Value Fund Institutional Plus Shares; 0.15% for the Structured Broad Market Fund Institutional Shares, 0.10% for the Institutional Plus Shares. The dollar amounts shown as “Expenses Paid” are equal to the annualized expense ratio multiplied by the average account value over the period, multiplied by the number of days in the most recent six-month period, then divided by the number of days in the most recent 12-month period.
72
Glossary
Earnings Growth Rate. The average annual rate of growth in earnings over the past five years for the stocks now in a fund.
Equity Exposure. A measure that reflects a fund’s investments in stocks and stock futures. Any holdings in short-term reserves are excluded.
Expense Ratio. The percentage of a fund’s average net assets used to pay its annual administrative and advisory expenses. These expenses directly reduce returns to investors.
Foreign Holdings. The percentage of a fund represented by stocks or depositary receipts of companies based outside the United States.
Median Market Cap. An indicator of the size of companies in which a fund invests; the midpoint of market capitalization (market price x shares outstanding) of a fund’s stocks, weighted by the proportion of the fund’s assets invested in each stock. Stocks representing half of the fund’s assets have market capitalizations above the median, and the rest are below it.
Price/Book Ratio. The share price of a stock divided by its net worth, or book value, per share. For a fund, the weighted average price/book ratio of the stocks it holds.
Price/Earnings Ratio. The ratio of a stock’s current price to its per-share earnings over the past year. For a fund, the weighted average P/E of the stocks it holds. P/E is an indicator of market expectations about corporate prospects; the higher the P/E, the greater the expectations for a company’s future growth.
Return on Equity. The annual average rate of return generated by a company during the past five years for each dollar of shareholder’s equity (net income divided by shareholder’s equity). For a fund, the weighted average return on equity for the companies whose stocks it holds.
Short-Term Reserves. The percentage of a fund invested in highly liquid, short-term securities that can be readily converted to cash.
Turnover Rate. An indication of the fund’s trading activity. Funds with high turnover rates incur higher transaction costs and may be more likely to distribute capital gains (which may be taxable to investors). The turnover rate excludes in-kind transactions, which have minimal impact on costs.
Yield. A fund’s 30-day SEC yield is derived using a formula specified by the U.S. Securities and Exchange Commission. Under the formula, data related to the fund’s security holdings in the previous 30 days are used to calculate the fund’s hypothetical net income for that period, which is then annualized and divided by the fund’s estimated average net assets over the calculation period. For the purposes of this calculation, a security’s income is based on its current market yield to maturity (in the case of bonds) or its projected dividend yield (for stocks). Because the SEC yield represents hypothetical annualized income, it will differ—at times significantly—from the fund’s actual experience. As a result, the fund’s income distributions may be higher or lower than implied by the SEC yield.
73
This page intentionally left blank.
This page intentionally left blank.
The People Who Govern Your Fund
The trustees of your mutual fund are there to see that the fund is operated and managed in your best interests since, as a shareholder, you are a part owner of the fund. Your fund’s trustees also serve on the board of directors of The Vanguard Group, Inc., which is owned by the Vanguard funds and provides services to them on an at-cost basis.
A majority of Vanguard’s board members are independent, meaning that they have no affiliation with Vanguard or the funds they oversee, apart from the sizable personal investments they have made as private individuals.
Our independent board members bring distinguished backgrounds in business, academia, and public service to their task of working with Vanguard officers to establish the policies and oversee the activities of the funds. Among board members’ responsibilities are selecting investment advisors for the funds; monitoring fund operations, performance, and costs; reviewing contracts; nominating and selecting new trustees/directors; and electing Vanguard officers.
Each trustee serves a fund until its termination; or until the trustee’s retirement, resignation, or death; or otherwise as specified in the fund’s organizational documents. Any trustee may be removed at a shareholders’ meeting by a vote representing two-thirds of the net asset value of all shares of the fund together with shares of other Vanguard funds organized within the same trust. The table on these two pages shows information for each trustee and executive officer of the fund. The mailing address of the trustees and officers is P.O. Box 876, Valley Forge, PA 19482.
Chairman of the Board and Trustee
John J. Brennan1
Born 1954 Principal Occupation(s) During the Past Five Years: Chairman of the Board and Director/ Trustee Since May 1987; Trustee of The Vanguard Group, Inc., and of each of the investment companies served Chairman of the Board by The Vanguard Group; Chief Executive Officer and President of The Vanguard Group 156 Vanguard Funds Overseen and of each of the investment companies served by The Vanguard Group (1996–2008).
Independent Trustees
Charles D. Ellis
Born 1937 Principal Occupation(s) During the Past Five Years: Applecore Partners (pro bono ventures Trustee Since January 2001 in education); Senior Advisor to Greenwich Associates (international business strategy 156 Vanguard Funds Overseen consulting); Successor Trustee of Yale University; Overseer of the Stern School of Business at New York University; Trustee of the Whitehead Institute for Biomedical Research.
Emerson U. Fullwood
Born 1948 Principal Occupation(s) During the Past Five Years: Executive Chief Staff and Marketing Trustee Since January 2008 Officer for North America since 2004 and Corporate Vice President of Xerox Corporation 156 Vanguard Funds Overseen (photocopiers and printers); Director of SPX Corporation (multi-industry manufacturing), of the United Way of Rochester, and of the Boy Scouts of America.
Rajiv L. Gupta
Born 1945 Principal Occupation(s) During the Past Five Years: Chairman, President, and Trustee Since December 20012 Chief Executive Officer of Rohm and Haas Co. (chemicals); Board Member of 156 Vanguard Funds Overseen the American Chemistry Council; Director of Tyco International, Ltd. (diversified manufacturing and services) since 2005.
Amy Gutmann
Born 1949 Principal Occupation(s) During the Past Five Years: President of the University of
Trustee Since June 2006 Pennsylvania since 2004; Professor in the School of Arts and Sciences, Annenberg School 156 Vanguard Funds Overseen for Communication, and Graduate School of Education of the University of Pennsylvania since 2004; Provost (2001–2004) and Laurance S. Rockefeller Professor of Politics and the University Center for Human Values (1990–2004), Princeton University; Director of Carnegie Corporation of New York since 2005 and of Schuylkill River Development Corporation and Greater Philadelphia Chamber of Commerce since 2004; Trustee of the National Constitution Center since 2007.
JoAnn Heffernan Heisen
Born 1950 Principal Occupation(s) During the Past Five Years: Corporate Vice President and Trustee Since July 1998 Chief Global Diversity Officer since 2006, Vice President and Chief Information 156 Vanguard Funds Overseen Officer (1997–2005), and Member of the Executive Committee of Johnson & Johnson (pharmaceuticals/consumer products); Director of the University Medical Center at Princeton and Women’s Research and Education Institute.
André F. Perold
Born 1952 Principal Occupation(s) During the Past Five Years: George Gund Professor of Finance Trustee Since December 2004 and Banking, Harvard Business School; Senior Associate Dean and Director of Faculty 156 Vanguard Funds Overseen Recruiting, Harvard Business School; Director and Chairman of UNX, Inc. (equities trading firm); Chair of the Investment Committee of HighVista Strategies LLC (private investment firm) since 2005.
Alfred M. Rankin, Jr.
Born 1941 Principal Occupation(s) During the Past Five Years: Chairman, President, Chief Executive Trustee Since January 1993 Officer, and Director of NACCO Industries, Inc. (forklift trucks/housewares/lignite); Director 156 Vanguard Funds Overseen of Goodrich Corporation (industrial products/aircraft systems and services).
J. Lawrence Wilson
Born 1936 Principal Occupation(s) During the Past Five Years: Retired Chairman and Chief Executive Trustee Since April 1985 Officer of Rohm and Haas Co. (chemicals); Director of Cummins Inc. (diesel engines) and 156 Vanguard Funds Overseen AmerisourceBergen Corp. (pharmaceutical distribution); Trustee of Vanderbilt University and of Culver Educational Foundation.
Executive Officers1
Thomas J. Higgins
Born 1957 Principal Occupation(s) During the Past Five Years: Principal of The Vanguard Group, Inc.; Chief Financial Officer Treasurer of each of the investment companies served by The Vanguard Group; Chief Since September 2008 Financial Officer of each of the investment companies served by The Vanguard Treasurer Since July 1998 Group since 2008. 156 Vanguard Funds Overseen
F. William McNabb III
Born 1957 Principal Occupation(s) During the Past Five Years: Chief Executive Officer, Director, Chief Executive Officer and President of The Vanguard Group, Inc., since 2008; Chief Executive Officer and Since August 31, 2008 President of each of the investment companies served by The Vanguard Group since President Since March 2008 2008; Director of Vanguard Marketing Corporation; Managing Director of The Vanguard 156 Vanguard Funds Overseen Group (1995–2008).
Heidi Stam
Born 1956 Principal Occupation(s) During the Past Five Years: Managing Director of The Vanguard Secretary Since July 2005 Group, Inc., since 2006; General Counsel of The Vanguard Group since 2005; Secretary of 156 Vanguard Funds Overseen The Vanguard Group and of each
of the investment companies served by The Vanguard Group since 2005; Director and Senior Vice President of Vanguard Marketing Corporation since 2005; Principal of The Vanguard Group (1997–2006).
Vanguard Senior Management Team |
|
| |
|
|
|
|
R. Gregory Barton | Kathleen C. Gubanich | Michael S. Miller | Glenn W. Reed |
Mortimer J. Buckley | Paul A. Heller | Ralph K. Packard | George U. Sauter |
Founder
John C. Bogle
Chairman and Chief Executive Officer, 1974–1996
1 These individuals are “interested persons” as defined in the Investment Company Act of 1940.
2 December 2002 for Vanguard Equity Income Fund, Vanguard Growth Equity Fund, the Vanguard Municipal Bond Funds, and the Vanguard State Tax-Exempt Funds.
More information about the trustees is in the Statement of Additional Information, available from The Vanguard Group.

P.O. Box 2600
Valley Forge, PA 19482-2600
Connect with Vanguard® > www.vanguard.com
Fund Information > 800-662-7447 | All comparative mutual fund data are from Lipper Inc. |
| or Morningstar, Inc., unless otherwise noted. |
Direct Investor Account Services > 800-662-2739 |
|
| You can obtain a free copy of Vanguard’s proxy voting |
Institutional Investor Services > 800-523-1036 | guidelines by visiting our website, www.vanguard.com, |
| and searching for “proxy voting guidelines,” or by |
Text Telephone for People | calling Vanguard at 800-662-2739. The guidelines are |
With Hearing Impairment > 800-952-3335 | also available from the SEC’s website, www.sec.gov. |
| In addition, you may obtain a free report on how your |
| fund voted the proxies for securities it owned during |
| the 12 months ended June 30. To get the report, visit |
This material may be used in conjunction | either www.vanguard.com or www.sec.gov. |
with the offering of shares of any Vanguard |
|
fund only if preceded or accompanied by |
|
the fund’s current prospectus. |
|
|
|
| You can review and copy information about your fund |
| at the SEC’s Public Reference Room in Washington, D.C. |
| To find out more about this public service, call the SEC |
The funds or securities referred to herein are not | at 202-551-8090. Information about your fund is also |
sponsored, endorsed, or promoted by MSCI, and MSCI | available on the SEC’s website, and you can receive |
bears no liability with respect to any such funds or | copies of this information, for a fee, by sending a |
securities. For any such funds or securities, the | request in either of two ways: via e-mail addressed to |
prospectus or the Statement of Additional Information | publicinfo@sec.gov or via regular mail addressed to the |
contains a more detailed description of the limited | Public Reference Section, Securities and Exchange |
relationship MSCI has with The Vanguard Group and | Commission, Washington, DC 20549-0102. |
any related funds. |
|
|
|
CFA® is a trademark owned by CFA Institute. |
|
|
|
Russell is a trademark of The Frank Russell Company. |
|
|
|
S&P ® and S&P 500 ® are trademarks of The McGraw-Hill |
|
Companies, Inc., and have been licensed for use by The |
|
Vanguard Group, Inc. Vanguard mutual funds are not |
|
sponsored, endorsed, sold, or promoted by Standard & |
|
Poor’s, and Standard & Poor’s makes no representation |
|
regarding the advisability of investing in the funds. |
|
| © 2008 The Vanguard Group, Inc. |
| All rights reserved. |
| Vanguard Marketing Corporation, Distributor. |
|
|
| Q08700 112008 |
Item 2: Code of Ethics. The Registrant has adopted a code of ethics that applies to the Registrant’s principal executive officer, principal financial officer, principal accounting officer or controller or persons performing similar functions. The Code of Ethics was amended during the reporting period covered by this report to make certain technical, non-material changes.
Item 3: Audit Committee Financial Expert. The following members of the Audit Committee have been determined by the Registrant’s Board of Trustees to be Audit Committee Financial Experts serving on its Audit Committee, and to be independent: Charles D. Ellis, Rajiv L. Gupta, JoAnn Heffernan Heisen, André F. Perold, Alfred M. Rankin, Jr., and J. Lawrence Wilson.
Item 4: Principal Accountant Fees and Services.
(a) Audit Fees.
Audit Fees of the Registrant
Fiscal Year Ended September 30, 2008: $111,000
Fiscal Year Ended September 30, 2007: $113,000
Aggregate Audit Fees of Registered Investment Companies in the Vanguard Group.
Fiscal Year Ended September 30, 2008: $3,055,590
Fiscal Year Ended September 30, 2007: $2,835,320
(b) Audit-Related Fees.
Fiscal Year Ended September 30, 2008: $626,240
Fiscal Year Ended September 30, 2007: $630,400
Includes fees billed in connection with assurance and related services provided to the Registrant, The Vanguard Group, Inc., Vanguard Marketing Corporation, and other registered investment companies in the Vanguard Group.
(c) Tax Fees.
Fiscal Year Ended September 30, 2008: $230,400
Fiscal Year Ended September 30, 2007: $215,900
Includes fees billed in connection with tax compliance, planning and advice services provided to the Registrant, The Vanguard Group, Inc., Vanguard Marketing Corporation, and other registered investment companies in the Vanguard Group and related to income and excise taxes.
(d) All Other Fees.
Fiscal Year Ended September 30, 2008: $0
Fiscal Year Ended September 30, 2007: $0
Includes fees billed for services related to risk management and privacy matters. Services were provided to the Registrant, The Vanguard Group, Inc., Vanguard Marketing Corporation, and other registered investment companies in the Vanguard Group.
(e) (1) Pre-Approval Policies. The policy of the Registrant’s Audit Committee is to consider and, if appropriate, approve before the principal accountant is engaged for such services, all specific audit and non-audit services provided to: (1) the Registrant; (2) The Vanguard Group, Inc.; (3) other entities controlled by The Vanguard Group, Inc. that provide ongoing services to the Registrant; and (4) other registered investment companies in the Vanguard Group. In making a determination, the Audit Committee considers whether the services are consistent with maintaining the principal accountant’s independence.
In the event of a contingency situation in which the principal accountant is needed to provide services in between scheduled Audit Committee meetings, the Chairman of the Audit Committee would be called on to consider and, if appropriate, pre-approve audit or permitted non-audit services in an amount sufficient to complete services through the next Audit Committee meeting, and to determine if such services would be consistent with maintaining the accountant’s independence. At the next scheduled Audit Committee meeting, services and fees would be presented to the Audit Committee for formal consideration, and, if appropriate, approval by the entire Audit Committee. The Audit Committee would again consider whether such services and fees are consistent with maintaining the principal accountant’s independence.
The Registrant’s Audit Committee is informed at least annually of all audit and non-audit services provided by the principal accountant to the Vanguard complex, whether such services are provided to: (1) the Registrant; (2) The Vanguard Group, Inc.; (3) other entities controlled by The Vanguard Group, Inc. that provide ongoing services to the Registrant; or (4) other registered investment companies in the Vanguard Group.
(2) No percentage of the principal accountant’s fees or services were approved pursuant to the waiver provision of paragraph (c)(7)(i)(C) of Rule 2-01 of Regulation S-X.
(f) For the most recent fiscal year, over 50% of the hours worked under the principal accountant’s engagement were not performed by persons other than full-time, permanent employees of the principal accountant.
(g) Aggregate Non-Audit Fees.
Fiscal Year Ended September 30, 2008: $230,400
Fiscal Year Ended September 30, 2007: $215,900
Includes fees billed for non-audit services provided to the Registrant, The Vanguard Group, Inc., Vanguard Marketing Corporation, and other registered investment companies in the Vanguard Group.
(h) For the most recent fiscal year, the Audit Committee has determined that the provision of all non-audit services was consistent with maintaining the principal accountant’s independence.
Item 5: Not Applicable.
Item 6: Not Applicable.
Item 7: Not Applicable.
Item 8: Not Applicable.
Item 9: Not Applicable.
Item 10: Not Applicable.
Item 11: Controls and Procedures.
(a) Disclosure Controls and Procedures. The Principal Executive and Financial Officers concluded that the Registrant's Disclosure Controls and Procedures are effective based on their evaluation of the Disclosure Controls and Procedures as of a date within 90 days of the filing date of this report.
(b) Internal Control Over Financial Reporting. There were no significant changes in Registrant’s Internal Control Over Financial Reporting or in other factors that could significantly affect this control subsequent to the date of the evaluation, including any corrective actions with regard to significant deficiencies and material weaknesses.
Item 12: Exhibits.
(a) Code of Ethics.
(b) Certifications.
Pursuant to the requirements of the Securities Exchange Act of 1934 and the Investment Company Act of 1940, the registrant has duly caused this report to be signed on its behalf by the undersigned, thereunto duly authorized.
VANGUARD QUANTITATIVE FUNDS | |
BY: | /s/ F. WILLIAM MCNABB III* |
| F. WILLIAM MCNABB III |
| CHIEF EXECUTIVE OFFICER |
Date: November 18, 2008
Pursuant to the requirements of the Securities Exchange Act of 1934 and the Investment Company Act of 1940, this report has been signed below by the following persons on behalf of the registrant and in the capacities and on the dates indicated.
VANGUARD QUANTITATIVE FUNDS | |
BY: | /s/ F. WILLIAM MCNABB III* |
| F. WILLIAM MCNABB III |
| CHIEF EXECUTIVE OFFICER |
Date: November 18, 2008
VANGUARD QUANTITATIVE FUNDS | |
BY: | /s/ THOMAS J. HIGGINS* |
| THOMAS J. HIGGINS |
| CHIEF FINANCIAL OFFICER |
Date: November 18, 2008
* By: /s/ Heidi Stam
Heidi Stam, pursuant to a Power of Attorney filed on January 18, 2008, see file Number 2-29601, Incorporated by Reference; and pursuant to a Power of Attorney filed on September 26, 2008, see File Number 2-47371, Incorporated by Reference.