UNITED STATES
SECURITIES AND EXCHANGE COMMISSION
Washington, D.C. 20549
FORM N-CSR
CERTIFIED SHAREHOLDER REPORT
OF
REGISTERED MANAGEMENT INVESTMENT COMPANIES
Investment Company Act file number: 811-4526
Name of Registrant: Vanguard Quantitative Funds
Address of Registrant:
P.O. Box 2600
Valley Forge, PA 19482
Name and address of agent for service:
Heidi Stam, Esquire
P.O. Box 876
Valley Forge, PA 19482
Registrant’s telephone number, including area code: (610) 669-1000
Date of fiscal year end: September 30
Date of reporting period: October 1, 2008 – September 30, 2009
Item 1: Reports to Shareholders
| Vanguard Growth and Income Fund |
| Annual Report |
| September 30, 2009 |
 |
> Vanguard Growth and Income Fund returned about –11% in a difficult 12 months for quantitative equity strategies.
> The fund trailed both the return of its benchmark index and the average return of peer funds.
> Consumer discretionary, health care, and financial stocks were the fund’s weakest sectors compared with the index.
| Contents | |
| Your Fund’s Total Returns | 1 |
| President’s Letter | 2 |
| Advisor’s Report | 7 |
| Results of Proxy Voting | 9 |
| Fund Profile | 10 |
| Performance Summary | 11 |
| Financial Statements | 13 |
| Your Fund’s After-Tax Returns | 25 |
| About Your Fund’s Expenses | 26 |
| Trustees Approve Advisory Agreement | 28 |
| Glossary | 29 |
Please note: The opinions expressed in this report are just that—informed opinions. They should not be considered promises or advice. Also, please keep in mind that the information and opinions cover the period through the date on the front of this report. Of course, the risks of investing in your fund are spelled out in the prospectus.
Cover photograph: Veronica Coia.
Your Fund’s Total Returns
| Fiscal Year Ended September 30, 2009 | ||
| Ticker | Total | |
| Symbol | Returns | |
| Vanguard Growth and Income Fund | ||
| Investor Shares | VQNPX | –11.29% |
| Admiral™ Shares1 | VGIAX | –11.15 |
| S&P 500 Index | –6.91 | |
| Large-Cap Core Funds Average2 | –5.85 |
| Your Fund’s Performance at a Glance | ||||
| September 30, 2008–September 30, 2009 | ||||
| Distributions Per Share | ||||
| Starting | Ending | Income | Capital | |
| Share Price | Share Price | Dividends | Gains | |
| Vanguard Growth and Income Fund | ||||
| Investor Shares | $25.84 | $22.34 | $0.494 | $0.000 |
| Admiral Shares | 42.20 | 36.48 | 0.857 | 0.000 |
1 A lower-cost class of shares available to many longtime shareholders and to those with significant investments in the fund.
2 Derived from data provided by Lipper Inc.
1

President’s Letter
Dear Shareholder,
Vanguard Growth and Income Fund returned about –11% for the fiscal year ended September 30. This disappointing result was below both the return of the Standard & Poor’s 500 Index, the fund’s market benchmark, and the average return of large-cap core funds.
The fiscal year is best viewed as two distinct periods. For the year’s first half, the fund returned about –33% as the global financial crisis deepened and investors lost their tolerance for risk. Midway through March, however, the stock market began to recover as government stimulus programs took hold, the economy showed signs of improving, and investors’ taste for risk returned. With the rally continuing through the summer, the fund advanced about 32% during the year’s second half. Compared with its benchmark, however, the fund fell a bit farther during the descent and didn’t rise quite as high during the ascent.
Quantitative equity strategies, which attempt to outperform their benchmark indexes with superior stock selection, have faced a particularly difficult environment, as the stocks typically favored by these approaches trailed the market’s more speculative stocks for the year. For the Growth and Income Fund, poorly performing stock selections in the consumer discretionary, health care, and financial sectors were a further barrier to reaching the fund’s goals.
2
If you hold shares of the fund in a taxable account, you may wish to review information on the fund’s after-tax returns that appears later in this report.
After a precipitous fall, stock markets rebound
In recent months, the financial markets have performed so strongly that it’s almost hard to remember that less than a year ago the global financial system stood on the brink of collapse. Since then, markets have pulled back from the abyss. Although unemployment remains near generational highs, and the prospects of a robust recovery seem dim, the global economy has begun to grind into gear.
Reminders of the markets’ dark days are nevertheless apparent in the index returns for both the past 12 months and the past three years. Over both periods, U.S. stocks recorded negative returns. Global stocks did better over the past 12 months, recouping their late-2008 losses thanks to general strength in developed economies and a powerful rally in emerging markets. Over the past three years, however, international stocks posted a modestly negative return.
The bond market’s turnabout has been equally dramatic
The stock market’s collapse and recovery echo even more dramatic developments in the bond market. At the end of 2008, as the credit markets nearly ceased to
| Market Barometer | |||
| Average Annual Total Returns | |||
| Periods Ended September 30, 2009 | |||
| One Year | Three Years | Five Years | |
| Stocks | |||
| Russell 1000 Index (Large-caps) | –6.14% | –5.10% | 1.49% |
| Russell 2000 Index (Small-caps) | –9.55 | –4.57 | 2.41 |
| Dow Jones U.S. Total Stock Market Index | –5.83 | –4.58 | 1.93 |
| MSCI All Country World Index ex USA (International) | 6.43 | –0.78 | 8.59 |
| Bonds | |||
| Barclays Capital U.S. Aggregate Bond Index | |||
| (Broad taxable market) | 10.56% | 6.41% | 5.13% |
| Barclays Capital Municipal Bond Index | 14.85 | 5.13 | 4.78 |
| Citigroup 3-Month Treasury Bill Index | 0.39 | 2.63 | 2.96 |
| CPI | |||
| Consumer Price Index | –1.29% | 2.10% | 2.61% |
3
function, the difference between the yields of corporate bonds and Treasury bonds spiked to levels last seen during the Great Depression.
The Federal Reserve and its central bank counterparts around the world responded with aggressive monetary stimulus efforts, while global governments opened the fiscal taps. Investors first tiptoed, then stampeded, back into the market, boosting bond prices and bringing down yields. Over the past 12 months, taxable U.S. bonds returned more than 10%; municipal securities did even better, returning almost 15%, as measured by the Barclays Capital Municipal Bond Index.
The Fed’s rescue campaign has imposed a heavy price on short-term savings vehicles such as money market funds. In December 2008, the Fed reduced its target for the federal funds rate, a benchmark for the interest rates paid by money market instruments and other very short-term securities, to between 0% and 0.25%. The Fed has said it expects to maintain its target at this level “for an extended period.”
High-quality stocks were not rewarded
The Growth and Income Fund’s advisor, Mellon Capital Management (formerly known as Franklin Portfolio Associates, LLC), aims to beat its benchmark by using computer models to select the market’s better-performing stocks––and to do so without taking on more risk than the benchmark. The stocks it selects are mostly high-quality dividend-payers that are relatively undervalued by the market and have potential for growth.
| Expense Ratios1 | |||
| Your Fund Compared With Its Peer Group | |||
| Large-Cap | |||
| Investor | Admiral | Core Funds | |
| Shares | Shares | Average | |
| Growth and Income Fund | 0.37% | 0.23% | 1.26% |
1 The fund expense ratios shown are from the prospectus dated January 23, 2009, and represent estimated costs for the current fiscal year based on the fund’s net assets as of the prospectus date. For the fiscal year ended September 30, 2009, the fund’s expense ratios were 0.35% for Investor Shares and 0.21% for Admiral Shares. The peer-group expense ratio is derived from data provided by Lipper Inc. and captures information through year-end 2008.
4
Investors following quantitative programs were not in the best position to participate in the stock market rally during the fiscal year’s second half. Indeed, the market comeback was largely led by lower-quality, highly leveraged companies that surged after being trampled in the financial crisis.
While the fund’s sector weightings hovered near those in the benchmark––true to the fund’s strategy––the advisor’s selections within those sectors did not perform as well. Relative to the index, the weakest performers were in the consumer discretionary, financial, and health care sectors.
The advisor’s choices among large diversified financial firms, commercial banks, insurance companies, and real estate investment trusts all contributed to the financial sector’s subpar performance. Apparel, fast food, entertainment, and education services companies all had a hand in dragging down the consumer discretionary sector. Within health care, the fund was overexposed to several weak stocks and did not own shares of a major pharmaceutical company that rose after its acquisition was announced.
In contrast, the fund performed better than its benchmark in the information technology, utilities, and energy sectors. Stock selection was especially strong in the tech sector, most notably among computer hardware and software companies. Both businesses and consumers began to spend again on technology after budget-paring during the depths of the financial crisis.
| Total Returns | |
| Ten Years Ended September 30, 2009 | |
| Average | |
| Annual Return | |
| Growth and Income Fund | –0.48% |
| S&P 500 Index | –0.15 |
| Large-Cap Core Funds Average1 | –1.21 |
The figures shown represent past performance, which is not a guarantee of future results. (Current performance may be lower or higher than the performance data cited. For performance data current to the most recent month-end, visit our website at www.vanguard.com/performance.) Note, too, that both investment returns and principal value can fluctuate widely, so an investor’s shares, when sold, could be worth more or less than their original cost.
1 Derived from data provided by Lipper Inc.
5
Expertise and low expenses have characterized the fund
It’s prudent to evaluate the Growth and Income Fund in comparison with its benchmark and peer group––and within the context of its times. The fund has returned an average of –0.48% annually over the past ten years, a period that includes two of the most severe bear markets in history. This performance slightly lags that of its benchmark and is a bit better than the average return for large-cap core funds.
Although the fund is actively managed, the advisor keeps its investment characteristics very similar to those of the S&P 500 Index, while seeking to choose stocks with prospects for higher return. Mellon Capital Management’s expertise and the fund’s low expense ratio offer investors the potential (though clearly not the guarantee) to do a bit better than the benchmark without assuming extra risk.
Counter market uncertainty with a well-designed plan
After five straight years of gains, from 2003 through 2007, the broad U.S. stock market began the type of bumpy and circuitous trip for which it is periodically known. Of course, the recent path was harsher and harder than any since the 1930s. From its all-time highs in October 2007, the broad market fell about 55% through March 9 of this year. From there, it abruptly changed course and rose about 60% through September 30. The market, however, is still down more than 30% from its peak, and the only thing certain about its near-term future is uncertainty.
Although the markets often follow an uncharted route, investors don’t have to do the same. After evaluating their risk tolerance, goals, and time horizon, investors are encouraged to maintain a diversified portfolio of stocks and fixed income investments. A well-diversified portfolio can��t shield you from extreme market volatility, but it can provide a cushion and potentially curb some of the risk.
Complemented by international funds and small-cap funds within the stock asset class, and balanced by bond funds and money market funds to limit risk, the large-cap Vanguard Growth and Income Fund can serve an important role in your plan.
Thank you for entrusting your assets to Vanguard.
Sincerely,

F. William McNabb III
President and Chief Executive Officer
October 14, 2009
6
Advisor’s Report
Market decline and rebound
We’ve come a long way since the financial system meltdown started by the bankruptcy of Lehman Brothers one year ago in September. During the fourth quarter of 2008, markets fell precipitously as it became increasingly clear that the credit crisis would result in an extended global recession. After rebounding briefly on hopes spurred by massive government intervention, the markets continued to decline in the first quarter of 2009, hitting bottom in early March.
A sharp reversal led by the lowest-quality, most highly leveraged stocks ensued, as leading indicators suggested the economy might return to growth sooner than expected. Investors’ relief propelled the markets upward: The second and third quarters brought the strongest quarterly gains since the fourth quarter of 1998. Still, as our fiscal year ended on September 30, the markets remained approximately a third below their October 2007 high.
If the worst is over, the current recession will not have been substantially different in output decline or unemployment than the severe recessions of 1973–1975 and 1981–1983. Data for the second half of 2009 are expected to show that gross domestic product (GDP) is growing again, particularly in the sectors that have received stimulus from the federal government. On a more cautionary note, some economists believe that these sectors may again struggle as the stimulus programs wind down. Unemployment is expected to remain high for a time as spare capacity is utilized and as workers come back into the labor pool looking for work. In the most recent two recessions (1990–1991 and 2001), it took more than a year after the recession’s end for unemployment to peak.
Our stock ranking process underperformed the index
Our ranking process emphasizes stocks with attractive valuation and momentum characteristics, and also considers factors such as corporate share activity and earnings-quality metrics. The review period was highly volatile, with frequent shifts in market leadership and in the drivers underlying market direction. This environment proved to be challenging for our investment process, and the fund underperformed the S&P 500 Index for the full fiscal year. In particular, the part of our model that emphasizes earnings and price momentum subtracted value.
Total returns in the financial sector were significantly lower than elsewhere, with the sector’s very weak performance in the fourth quarter of 2008 dominating its sharp rebound starting in March. Overall, the portfolio benefited from a slight underweighting in financials, but our stock picks in the sector lagged the S&P 500. Although we did not own some of the sector’s weakest performers, such as Citigroup and Merrill Lynch, we were on average overweighted in several financial stocks with lower returns than their peers,
7
including Bank of America and the equity REIT ProLogis. On average, we were underweighted in JPMorgan Chase, one of the better-performing financial stocks.
The portfolio also lagged the benchmark in the health care sector. We held some strong performers, including Bristol-Myers Squibb and Watson Pharmaceuticals. However, the portfolio was hurt by the weak returns of several holdings, such as Eli Lilly. We also did not own Schering-Plough, which rose approximately 50% on news of its acquisition by Merck.
Stock selection was notably stronger in the technology sector, particularly among computer hardware and software firms. For example, throughout the year we owned Apple, which performed extremely well as analysts continued to recommend the stock, expecting the company to see continued growth. These beliefs are driven by the success of Apple’s iPhone and the increases in market share of its Macintosh computers.
The fund also held Oracle over the full fiscal year. Despite a decline in new contracts during the downturn, the enterprise-software maker maintained profitability through cost-cutting and reliance on its stable revenue from recurring software maintenance. Oracle is expected to benefit from a return of business investment as the economy improves.
Keeping a watchful eye on the fund’s risk controls
The recent period was characterized by higher-than-usual volatility, and as a result we have been particularly careful in the implementation of our risk controls. Even relatively small residual tilts had the potential to result in outsized impacts, and we therefore maintained tight control over industry, sector, capitalization, and other top-down differences between the portfolio and the index.
Although we have begun to return to more normal levels of risk control, we remain watchful of our exposures in the most volatile sectors, such as financials, materials, and energy. As always, we are maintaining our focus on stocks that exhibit both attractive value and improving fundamentals. We believe that as markets begin to reward fundamentals once more, the fund will be well positioned to benefit.
Oliver E. Buckley, Executive Vice President and Head of Active Equity Strategies
Mellon Capital Management Corp.
October 20, 2009
8
Results of Proxy Voting
At a special meeting of shareholders on July 2, 2009, fund shareholders approved the following two proposals:
Proposal 1—Elect trustees for each fund.*
The individuals listed in the table below were elected as trustees for each fund. All trustees with the exception of Messrs. McNabb and Volanakis (both of whom already served as directors of The Vanguard Group, Inc.) served as trustees to the funds prior to the shareholder meeting.
| Percentage | |||
| Trustee | For | Withheld | For |
| John J. Brennan | 159,956,902 | 5,954,687 | 96.4% |
| Charles D. Ellis | 157,719,476 | 8,192,112 | 95.1% |
| Emerson U. Fullwood | 158,422,350 | 7,489,238 | 95.5% |
| Rajiv L. Gupta | 159,601,353 | 6,310,235 | 96.2% |
| Amy Gutmann | 159,929,264 | 5,982,324 | 96.4% |
| JoAnn Heffernan Heisen | 159,793,652 | 6,117,936 | 96.3% |
| F. William McNabb III | 159,924,396 | 5,987,192 | 96.4% |
| André F. Perold | 158,350,070 | 7,561,519 | 95.4% |
| Alfred M. Rankin, Jr. | 159,681,434 | 6,230,154 | 96.2% |
| Peter F. Volanakis | 159,820,426 | 6,091,162 | 96.3% |
| * Results are for all funds within the same trust. |
Proposal 2—Update and standardize the funds’ fundamental policies regarding:
(a) Purchasing and selling real estate.
(b) Issuing senior securities.
(c) Borrowing money.
(d) Making loans.
(e) Purchasing and selling commodities.
(f) Concentrating investments in a particular industry or group of industries.
(g) Eliminating outdated fundamental investment policies not required by law.
The revised fundamental policies are clearly stated and simple, yet comprehensive, making oversight and compliance more efficient than under the former policies. The revised fundamental policies will allow the funds to respond more quickly to regulatory and market changes, while avoiding the costs and delays associated with successive shareholder meetings.
| Broker | Percentage | ||||
| Vanguard Fund | For | Abstain | Against | Non-Votes | For |
| Growth and Income Fund | |||||
| 2a | 120,275,455 | 5,052,367 | 3,888,353 | 11,043,547 | 85.8% |
| 2b | 119,217,826 | 5,486,179 | 4,512,168 | 11,043,547 | 85.0% |
| 2c | 117,327,673 | 5,535,781 | 6,352,718 | 11,043,550 | 83.7% |
| 2d | 117,649,708 | 5,481,093 | 6,085,371 | 11,043,549 | 83.9% |
| 2e | 118,074,549 | 5,288,964 | 5,852,661 | 11,043,548 | 84.2% |
| 2f | 119,377,554 | 5,379,922 | 4,458,696 | 11,043,549 | 85.1% |
| 2g | 119,997,396 | 5,324,485 | 3,894,293 | 11,043,546 | 85.6% |
9
Growth and Income Fund
Fund Profile
As of September 30, 2009
| Portfolio Characteristics | |||
| Comparative | Broad | ||
| Fund | Index1 | Index2 | |
| Number of Stocks | 139 | 500 | 4,324 |
| Median Market Cap | $41.2B | $41.5B | $29.0B |
| Price/Earnings Ratio | 17.4x | 23.5x | 27.9x |
| Price/Book Ratio | 2.0x | 2.2x | 2.1x |
| Yield3 | 2.0% | 1.9% | |
| Investor Shares | 1.8% | ||
| Admiral Shares | 2.0% | ||
| Return on Equity | 20.1% | 20.6% | 19.1% |
| Earnings Growth Rate | 12.5% | 9.8% | 9.6% |
| Foreign Holdings | 0.0% | 0.0% | 0.0% |
| Turnover Rate | 83% | — | — |
| Expense Ratio4 | — | — | |
| Investor Shares | 0.37% | ||
| Admiral Shares | 0.23% | ||
| Short-Term Reserves | 0.1% | — | — |
| Sector Diversification (% of equity exposure) | |||
| Comparative | Broad | ||
| Fund | Index1 | Index2 | |
| Consumer Discretionary | 7.9% | 9.1% | 10.1% |
| Consumer Staples | 11.7 | 11.5 | 9.9 |
| Energy | 11.3 | 11.7 | 11.0 |
| Financials | 15.0 | 15.2 | 16.7 |
| Health Care | 13.9 | 13.1 | 12.9 |
| Industrials | 10.1 | 10.3 | 10.6 |
| Information Technology | 20.1 | 18.7 | 18.2 |
| Materials | 2.8 | 3.5 | 3.9 |
| Telecommunication | |||
| Services | 4.1 | 3.2 | 2.9 |
| Utilities | 3.1 | 3.7 | 3.8 |
| Volatility Measures5 | ||
| Fund Versus | Fund Versus | |
| Comparative Index1 | Broad Index2 | |
| R-Squared | 0.99 | 0.98 |
| Beta | 1.02 | 0.99 |
| Ten Largest Holdings6 (% of total net assets) | ||
| Exxon Mobil Corp. | integrated oil | |
| and gas | 3.8% | |
| General Electric Co. | industrial | |
| conglomerates | 2.8 | |
| AT&T Inc. | integrated | |
| telecommunication | ||
| services | 2.7 | |
| Johnson & Johnson | pharmaceuticals | 2.6 |
| International Business | ||
| Machines Corp. | computer hardware | 2.6 |
| Apple Inc. | computer hardware | 2.4 |
| Wells Fargo & Co. | diversified banks | 2.2 |
| Procter & Gamble Co. | household products | 2.2 |
| Pfizer Inc. | pharmaceuticals | 2.1 |
| Goldman Sachs | investment banking | |
| Group Inc. | and brokerage | 1.7 |
| Top Ten | 25.1% | |
Investment Focus
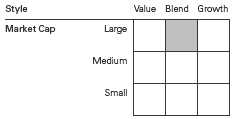
1 S&P 500 Index.
2 Dow Jones U.S. Total Stock Market Index.
3 30-day SEC yield for the fund; annualized dividend yield for the indexes. See the Glossary.
4 The expense ratios shown are from the prospectus dated January 23, 2009, and represent estimated costs for the current fiscal year based on the fund’s net assets as of the prospectus date. For the fiscal year ended September 30, 2009, the fund’s expense ratios were 0.35% for Investor Shares and 0.21% for Admiral Shares.
5 For an explanation of R-squared, beta, and other terms used here, see the Glossary.
6 The holdings listed exclude any temporary cash investments and equity index products.
10
Growth and Income Fund
Performance Summary
All of the returns in this report represent past performance, which is not a guarantee of future results that may be achieved by the fund. (Current performance may be lower or higher than the performance data cited. For performance data current to the most recent month-end, visit our website at www.vanguard.com/performance.) Note, too, that both investment returns and principal value can fluctuate widely, so an investor’s shares, when sold, could be worth more or less than their original cost. The returns shown do not reflect taxes that a shareholder would pay on fund distributions or on the sale of fund shares.
Cumulative Performance: September 30, 1999–September 30, 2009
Initial Investment of $10,000

| Average Annual Total Returns | Final Value | |||
| Periods Ended September 30, 2009 | of a $10,000 | |||
| One Year | Five Years | Ten Years | Investment | |
| Growth and Income Fund Investor Shares1 | –11.29% | –0.53% | –0.48% | $9,531 |
| Dow Jones U.S. Total Stock Market Index | –5.83 | 1.93 | 0.94 | 10,978 |
| S&P 500 Index | –6.91 | 1.02 | –0.15 | 9,848 |
| Large-Cap Core Funds Average2 | –5.85 | 0.47 | –1.21 | 8,852 |
| Final Value | ||||
| Since | of a $100,000 | |||
| One Year | Five Years | Inception3 | Investment | |
| Growth and Income Fund Admiral Shares | –11.15% | –0.37% | –0.60% | $95,079 |
| Dow Jones U.S. Total Stock Market Index | –5.83 | 1.93 | 1.12 | 109,788 |
| S&P 500 Index | –6.91 | 1.02 | –0.09 | 99,247 |
1 Total returns do not include the account service fee that may be applicable to certain accounts with balances below $10,000. 2 Derived from data provided by Lipper Inc.
3 Performance for the fund’s Admiral Shares and comparative standards is calculated since the Admiral Shares’ inception: May 14, 2001.
11
Growth and Income Fund
Fiscal-Year Total Returns (%): September 30, 1999–September 30, 2009
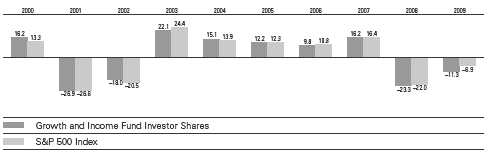
Note: See Financial Highlights tables for dividend and capital gains information.
12
Growth and Income Fund
Financial Statements
Statement of Net Assets
As of September 30, 2009
The fund reports a complete list of its holdings in regulatory filings four times in each fiscal year, at the quarter-ends. For the second and fourth fiscal quarters, the lists appear in the fund’s semiannual and annual reports to shareholders. For the first and third fiscal quarters, the fund files the lists with the Securities and Exchange Commission on Form N-Q. Shareholders can look up the fund’s Forms N-Q on the SEC’s website at www.sec.gov. Forms N-Q may also be reviewed and copied at the SEC’s Public Reference Room (see the back cover of this report for further information).
| Market | |||
| Value• | |||
| Shares | ($000) | ||
| Common Stocks (98.4%)1 | |||
| Consumer Discretionary (7.8%) | |||
| Comcast Corp. Class A | 4,136,200 | 69,860 | |
| McDonald’s Corp. | 925,100 | 52,795 | |
| Genuine Parts Co. | 943,500 | 35,910 | |
| * | Apollo Group Inc. Class A | 314,700 | 23,184 |
| Sherwin-Williams Co. | 323,400 | 19,456 | |
| Family Dollar Stores Inc. | 588,600 | 15,539 | |
| *,^ | Sears Holdings Corp. | 231,700 | 15,132 |
| Time Warner Inc. | 524,100 | 15,083 | |
| Pulte Homes Inc. | 1,345,200 | 14,784 | |
| * | Big Lots Inc. | 519,530 | 12,999 |
| Time Warner Cable Inc. | 276,766 | 11,926 | |
| Polo Ralph Lauren Corp. | |||
| Class A | 152,300 | 11,669 | |
| Coach Inc. | 328,500 | 10,814 | |
| RadioShack Corp. | 619,000 | 10,257 | |
| * | AutoNation Inc. | 530,400 | 9,590 |
| Wyndham Worldwide Corp. | 541,600 | 8,839 | |
| * | AutoZone Inc. | 56,900 | 8,320 |
| McGraw-Hill Cos. Inc. | 311,900 | 7,841 | |
| * | Starbucks Corp. | 352,800 | 7,285 |
| Target Corp. | 105,700 | 4,934 | |
| 366,217 | |||
| Consumer Staples (11.6%) | |||
| Procter & Gamble Co. | 1,745,900 | 101,123 | |
| Wal-Mart Stores Inc. | 1,416,000 | 69,511 | |
| Philip Morris | |||
| International Inc. | 1,299,700 | 63,347 | |
| Sysco Corp. | 2,074,800 | 51,559 | |
| PepsiCo Inc. | 769,100 | 45,115 | |
| Archer-Daniels-Midland Co. | 1,451,000 | 42,398 | |
| Kraft Foods Inc. | 1,471,800 | 38,664 | |
| Walgreen Co. | 1,012,300 | 37,931 | |
| Tyson Foods Inc. Class A | 2,527,600 | 31,924 | |
| Kimberly-Clark Corp. | 331,900 | 19,576 | |
| Coca-Cola Enterprises Inc. | 814,000 | 17,428 | |
| Safeway Inc. | 588,800 | 11,611 | |
| Market | |||
| Value• | |||
| Shares | ($000) | ||
| Hershey Co. | 170,900 | 6,641 | |
| Molson Coors Brewing Co. | |||
| Class B | 118,200 | 5,754 | |
| 542,582 | |||
| Energy (11.1%) | |||
| Exxon Mobil Corp. | 2,580,636 | 177,057 | |
| XTO Energy Inc. | 1,586,000 | 65,534 | |
| Chevron Corp. | 925,900 | 65,211 | |
| * | National Oilwell Varco Inc. | 1,123,400 | 48,452 |
| * | Cameron | ||
| International Corp. | 1,039,100 | 39,299 | |
| Tesoro Corp. | 1,660,400 | 24,873 | |
| Marathon Oil Corp. | 725,700 | 23,150 | |
| Peabody Energy Corp. | 619,600 | 23,062 | |
| Pioneer Natural | |||
| Resources Co. | 512,600 | 18,602 | |
| Williams Cos. Inc. | 696,800 | 12,452 | |
| Murphy Oil Corp. | 162,500 | 9,355 | |
| ConocoPhillips | 166,219 | 7,506 | |
| EOG Resources Inc. | 75,800 | 6,330 | |
| 520,883 | |||
| Financials (14.7%) | |||
| Wells Fargo & Co. | 3,624,300 | 102,133 | |
| Goldman Sachs Group Inc. | 421,900 | 77,777 | |
| JPMorgan Chase & Co. | 1,759,000 | 77,079 | |
| Bank of America Corp. | 3,381,399 | 57,213 | |
| Ameriprise Financial Inc. | 1,268,600 | 46,088 | |
| Morgan Stanley | 1,178,500 | 36,392 | |
| Hudson City Bancorp Inc. | 2,729,500 | 35,893 | |
| Northern Trust Corp. | 601,100 | 34,960 | |
| Prudential Financial Inc. | 547,200 | 27,311 | |
| Travelers Cos. Inc. | 532,200 | 26,200 | |
| Unum Group | 1,200,700 | 25,743 | |
| Equity Residential | 781,200 | 23,983 | |
| Cincinnati Financial Corp. | 783,008 | 20,350 | |
| Chubb Corp. | 375,600 | 18,934 | |
| Loews Corp. | 548,200 | 18,776 | |
| * | NASDAQ OMX Group Inc. | 778,600 | 16,390 |
13
| Growth and Income Fund | |||
| Market | |||
| Value• | |||
| Shares | ($000) | ||
| Principal Financial | |||
| Group Inc. | 433,900 | 11,885 | |
| Aflac Inc. | 272,900 | 11,664 | |
| HCP Inc. | 229,800 | 6,604 | |
| Public Storage | 80,500 | 6,057 | |
| CME Group Inc. | 18,700 | 5,763 | |
| State Street Corp. | 86,400 | 4,545 | |
| 691,740 | |||
| Health Care (13.7%) | |||
| Johnson & Johnson | 2,031,300 | 123,686 | |
| Pfizer Inc. | 5,862,127 | 97,018 | |
| * | Amgen Inc. | 1,015,300 | 61,152 |
| Eli Lilly & Co. | 1,480,400 | 48,898 | |
| Abbott Laboratories | 945,300 | 46,764 | |
| Stryker Corp. | 918,900 | 41,746 | |
| * | Biogen Idec Inc. | 721,800 | 36,465 |
| Aetna Inc. | 1,243,800 | 34,615 | |
| Bristol-Myers Squibb Co. | 1,403,300 | 31,602 | |
| UnitedHealth Group Inc. | 875,300 | 21,917 | |
| Cardinal Health Inc. | 756,200 | 20,266 | |
| * | Humana Inc. | 438,500 | 16,356 |
| * | Zimmer Holdings Inc. | 302,300 | 16,158 |
| * | Forest Laboratories Inc. | 513,400 | 15,114 |
| Wyeth | 253,700 | 12,325 | |
| Medtronic Inc. | 261,000 | 9,605 | |
| * | Millipore Corp. | 75,600 | 5,317 |
| * | Gilead Sciences Inc. | 94,900 | 4,420 |
| 643,424 | |||
| Industrials (9.9%) | |||
| General Electric Co. | 8,092,400 | 132,877 | |
| General Dynamics Corp. | 1,075,900 | 69,503 | |
| Raytheon Co. | 812,000 | 38,952 | |
| CSX Corp. | 874,600 | 36,611 | |
| L-3 Communications | |||
| Holdings Inc. | 454,000 | 36,465 | |
| United Parcel Service Inc. | |||
| Class B | 510,100 | 28,805 | |
| CH Robinson | |||
| Worldwide Inc. | 377,200 | 21,783 | |
| Northrop Grumman Corp. | 406,600 | 21,042 | |
| * | Jacobs Engineering | ||
| Group Inc. | 404,200 | 18,573 | |
| Flowserve Corp. | 170,800 | 16,831 | |
| Expeditors International of | |||
| Washington Inc. | 358,300 | 12,594 | |
| Honeywell International Inc. | 327,400 | 12,163 | |
| WW Grainger Inc. | 86,300 | 7,712 | |
| Pitney Bowes Inc. | 291,300 | 7,239 | |
| Snap-On Inc. | 178,000 | 6,187 | |
| 467,337 | |||
| Information Technology (19.7%) | |||
| International Business | |||
| Machines Corp. | 1,016,600 | 121,596 | |
| * | Apple Inc. | 604,900 | 112,130 |
| Market | |||
| Value• | |||
| Shares | ($000) | ||
| * | Cisco Systems Inc. | 3,238,100 | 76,225 |
| * | Google Inc. Class A | 152,940 | 75,835 |
| Microsoft Corp. | 2,716,500 | 70,330 | |
| * | Computer Sciences Corp. | 1,167,300 | 61,528 |
| QUALCOMM Inc. | 1,329,800 | 59,814 | |
| Oracle Corp. | 2,086,000 | 43,472 | |
| Intel Corp. | 2,009,400 | 39,324 | |
| CA Inc. | 1,502,300 | 33,036 | |
| Xilinx Inc. | 1,399,300 | 32,772 | |
| * | Broadcom Corp. Class A | 1,020,600 | 31,322 |
| * | Intuit Inc. | 1,051,700 | 29,974 |
| Harris Corp. | 735,900 | 27,670 | |
| * | eBay Inc. | 1,101,700 | 26,011 |
| * | BMC Software Inc. | 640,500 | 24,038 |
| Fidelity National | |||
| Information Services Inc. | 924,900 | 23,594 | |
| * | Akamai Technologies Inc. | 1,182,500 | 23,272 |
| * | Novellus Systems Inc. | 373,600 | 7,838 |
| * | Teradata Corp. | 212,900 | 5,859 |
| 925,640 | |||
| Materials (2.7%) | |||
| Bemis Co. Inc. | 1,199,600 | 31,082 | |
| Airgas Inc. | 482,200 | 23,324 | |
| Ecolab Inc. | 429,100 | 19,837 | |
| * | Pactiv Corp. | 607,200 | 15,818 |
| Newmont Mining Corp. | 312,500 | 13,756 | |
| Allegheny Technologies Inc. | 377,900 | 13,223 | |
| Titanium Metals Corp. | 1,216,500 | 11,666 | |
| 128,706 | |||
| Telecommunication Services (4.1%) | |||
| AT&T Inc. | 4,694,700 | 126,804 | |
| Verizon | |||
| Communications Inc. | 1,193,500 | 36,127 | |
| CenturyTel Inc. | 861,100 | 28,933 | |
| 191,864 | |||
| Utilities (3.1%) | |||
| FPL Group Inc. | 923,700 | 51,016 | |
| Exelon Corp. | 981,100 | 48,682 | |
| Sempra Energy | 265,400 | 13,220 | |
| Questar Corp. | 337,400 | 12,673 | |
| Dominion | |||
| Resources Inc. | 248,700 | 8,580 | |
| Public Service Enterprise | |||
| Group Inc. | 167,900 | 5,279 | |
| Ameren Corp. | 164,500 | 4,158 | |
| 143,608 | |||
| Total Common Stocks | |||
| (Cost $4,419,370) | 4,622,001 | ||
14
| Growth and Income Fund | ||
| Market | ||
| Value• | ||
| Shares | ($000) | |
| Temporary Cash Investments (1.9%)1 | ||
| Money Market Fund (1.7%) | ||
| 2,3 Vanguard Market | ||
| Liquidity Fund, | ||
| 0.267% | 81,072,347 | 81,072 |
| Face | ||
| Amount | ||
| ($000) | ||
| U.S. Government and Agency Obligations (0.2%) | ||
| 4 United States | ||
| Treasury Bill, | ||
| 0.080%, 12/17/09 | 7,450 | 7,449 |
| Total Temporary Cash Investments | ||
| (Cost $88,521) | 88,521 | |
| Total Investments (100.3%) | ||
| (Cost $4,507,891) | 4,710,522 | |
| Other Assets and Liabilities (–0.3%) | ||
| Other Assets | 187,148 | |
| Liabilities3 | (203,494) | |
| (16,346) | ||
| Net Assets (100%) | 4,694,176 | |
| At September 30, 2009, net assets consisted of: | |
| Amount | |
| ($000) | |
| Paid-in Capital | 6,425,614 |
| Undistributed Net Investment Income | 6,443 |
| Accumulated Net Realized Losses | (1,940,672) |
| Unrealized Appreciation (Depreciation) | |
| Investment Securities | 202,631 |
| Futures Contracts | 160 |
| Net Assets | 4,694,176 |
| Investor Shares—Net Assets | |
| Applicable to 145,586,165 outstanding | |
| $.001 par value shares of beneficial | |
| interest (unlimited authorization) | 3,252,737 |
| Net Asset Value Per Share— | |
| Investor Shares | $22.34 |
| Admiral Shares—Net Assets | |
| Applicable to 39,507,988 outstanding | |
| $.001 par value shares of beneficial | |
| interest (unlimited authorization) | 1,441,439 |
| Net Asset Value Per Share— | |
| Admiral Shares | $36.48 |
• See Note A in Notes to Financial Statements. * Non-income-producing security.
^ Part of security position is on loan to broker-dealers. The total value of securities on loan is $14,375,000.
1 The fund invests a portion of its cash reserves in equity markets through the use of index futures contracts. After giving effect to futures investments, the fund’s effective common stock and temporary cash investment positions represent 100.0% and 0.3%, respectively, of net assets.
2 Affiliated money market fund available only to Vanguard funds and certain trusts and accounts managed by Vanguard. Rate shown is the 7-day yield.
3 Includes $14,967,000 of collateral received for securities on loan.
4 Securities with a value of $7,449,000 have been segregated as initial margin for open futures contracts.
See accompanying Notes, which are an integral part of the Financial Statements.
15
| Growth and Income Fund | |
| Statement of Operations | |
| Year Ended | |
| September 30, 2009 | |
| ($000) | |
| Investment Income | |
| Income | |
| Dividends | 109,267 |
| Interest1 | 643 |
| Security Lending | 724 |
| Total Income | 110,634 |
| Expenses | |
| Investment Advisory Fees—Note B | |
| Basic Fee | 4,283 |
| Performance Adjustment | (1,791) |
| The Vanguard Group—Note C | |
| Management and Administrative—Investor Shares | 7,001 |
| Management and Administrative—Admiral Shares | 1,551 |
| Marketing and Distribution—Investor Shares | 832 |
| Marketing and Distribution—Admiral Shares | 379 |
| Custodian Fees | 46 |
| Auditing Fees | 23 |
| Shareholders’ Reports and Proxies—Investor Shares | 394 |
| Shareholders’ Reports and Proxies—Admiral Shares | 18 |
| Trustees’ Fees and Expenses | 10 |
| Total Expenses | 12,746 |
| Expenses Paid Indirectly | (446) |
| Net Expenses | 12,300 |
| Net Investment Income | 98,334 |
| Realized Net Gain (Loss) | |
| Investment Securities Sold | (1,362,837) |
| Futures Contracts | (8,583) |
| Realized Net Gain (Loss) | (1,371,420) |
| Change in Unrealized Appreciation (Depreciation) | |
| Investment Securities | 544,642 |
| Futures Contracts | 1,061 |
| Change in Unrealized Appreciation (Depreciation) | 545,703 |
| Net Increase (Decrease) in Net Assets Resulting from Operations | (727,383) |
| 1 Interest income from an affiliated company of the fund was $625,000. | |
See accompanying Notes, which are an integral part of the Financial Statements.
16
| Growth and Income Fund | ||
| Statement of Changes in Net Assets | ||
| Year Ended September 30, | ||
| 2009 | 2008 | |
| ($000) | ($000) | |
| Increase (Decrease) in Net Assets | ||
| Operations | ||
| Net Investment Income | 98,334 | 123,730 |
| Realized Net Gain (Loss) | (1,371,420) | (446,516) |
| Change in Unrealized Appreciation (Depreciation) | 545,703 | (1,520,848) |
| Net Increase (Decrease) in Net Assets Resulting from Operations | (727,383) | (1,843,634) |
| Distributions | ||
| Net Investment Income | ||
| Investor Shares | (73,186) | (81,970) |
| Admiral Shares | (36,418) | (43,850) |
| Realized Capital Gain1 | ||
| Investor Shares | — | (564,334) |
| Admiral Shares | — | (284,167) |
| Total Distributions | (109,604) | (974,321) |
| Capital Share Transactions | ||
| Investor Shares | (120,422) | 335,349 |
| Admiral Shares | (174,315) | 50,006 |
| Net Increase (Decrease) from Capital Share Transactions | (294,737) | 385,355 |
| Total Increase (Decrease) | (1,131,724) | (2,432,600) |
| Net Assets | ||
| Beginning of Period | 5,825,900 | 8,258,500 |
| End of Period2 | 4,694,176 | 5,825,900 |
1 Includes fiscal 2008 short-term gain distributions totaling $89,550,000. Short-term gain distributions are treated as ordinary income dividends for tax purposes.
2 Net Assets—End of Period includes undistributed net investment income of $6,443,000 and $17,713,000.
See accompanying Notes, which are an integral part of the Financial Statements.
17
| Growth and Income Fund | |||||
| Financial Highlights | |||||
| Investor Shares | |||||
| For a Share Outstanding | Year Ended September 30, | ||||
| Throughout Each Period | 2009 | 2008 | 2007 | 2006 | 2005 |
| Net Asset Value, Beginning of Period | $25.84 | $38.62 | $33.79 | $31.29 | $28.31 |
| Investment Operations | |||||
| Net Investment Income | .447 | .546 | .600 | .550 | .460 |
| Net Realized and Unrealized Gain (Loss) | |||||
| on Investments | (3.453) | (8.758) | 4.840 | 2.470 | 2.980 |
| Total from Investment Operations | (3.006) | (8.212) | 5.440 | 3.020 | 3.440 |
| Distributions | |||||
| Dividends from Net Investment Income | (.494) | (.560) | (.610) | (.520) | (.460) |
| Distributions from Realized Capital Gains | — | (4.008) | — | — | — |
| Total Distributions | (.494) | (4.568) | (.610) | (.520) | (.460) |
| Net Asset Value, End of Period | $22.34 | $25.84 | $38.62 | $33.79 | $31.29 |
| Total Return1 | –11.29% | –23.28% | 16.20% | 9.76% | 12.20% |
| Ratios/Supplemental Data | |||||
| Net Assets, End of Period (Millions) | $3,253 | $3,919 | $5,465 | $5,088 | $5,202 |
| Ratio of Total Expenses to | |||||
| Average Net Assets2 | 0.35% | 0.31% | 0.32% | 0.38% | 0.40% |
| Ratio of Net Investment Income to | |||||
| Average Net Assets | 2.28% | 1.69% | 1.61% | 1.65% | 1.53% |
| Portfolio Turnover Rate | 83% | 96% | 100% | 93% | 84% |
1 Total returns do not include the account service fee that may be applicable to certain accounts with balances below $10,000.
2 Includes performance-based investment advisory fee increases (decreases) of (0.04%), (0.02%), 0.00%, 0.01% and 0.01%.
See accompanying Notes, which are an integral part of the Financial Statements.
18
| Growth and Income Fund | |||||
| Financial Highlights | |||||
| Admiral Shares | |||||
| For a Share Outstanding | Year Ended September 30, | ||||
| Throughout Each Period | 2009 | 2008 | 2007 | 2006 | 2005 |
| Net Asset Value, Beginning of Period | $42.20 | $63.08 | $55.20 | $51.12 | $46.25 |
| Investment Operations | |||||
| Net Investment Income | .775 | .963 | 1.070 | .997 | .849 |
| Net Realized and Unrealized Gain (Loss) | |||||
| on Investments | (5.638) | (14.313) | 7.903 | 4.036 | 4.853 |
| Total from Investment Operations | (4.863) | (13.350) | 8.973 | 5.033 | 5.702 |
| Distributions | |||||
| Dividends from Net Investment Income | (.857) | (.985) | (1.093) | (.953) | (.832) |
| Distributions from Realized Capital Gains | — | (6.545) | — | — | — |
| Total Distributions | (.857) | (7.530) | (1.093) | (.953) | (.832) |
| Net Asset Value, End of Period | $36.48 | $42.20 | $63.08 | $55.20 | $51.12 |
| Total Return | –11.15% | –23.19% | 16.37% | 9.97% | 12.39% |
| Ratios/Supplemental Data | |||||
| Net Assets, End of Period (Millions) | $1,441 | $1,907 | $2,794 | $2,321 | $2,039 |
| Ratio of Total Expenses to | |||||
| Average Net Assets1 | 0.21% | 0.16% | 0.18% | 0.20% | 0.23% |
| Ratio of Net Investment Income to | |||||
| Average Net Assets | 2.42% | 1.84% | 1.75% | 1.83% | 1.68% |
| Portfolio Turnover Rate | 83% | 96% | 100% | 93% | 84% |
| 1 Includes performance-based investment advisory fee increases (decreases) of (0.04%), (0.02%), 0.00%, 0.01% and 0.01%. | |||||
See accompanying Notes, which are an integral part of the Financial Statements.
19
Growth and Income Fund
Notes to Financial Statements
Vanguard Growth and Income Fund is registered under the Investment Company Act of 1940 as an open-end investment company, or mutual fund. The fund offers two classes of shares: Investor Shares and Admiral Shares. Investor Shares are available to any investor who meets the fund’s minimum purchase requirements. Admiral Shares are designed for investors who meet certain administrative, service, tenure, and account-size criteria.
A. The following significant accounting policies conform to generally accepted accounting principles for U.S. mutual funds. The fund consistently follows such policies in preparing its financial statements.
1. Security Valuation: Securities are valued as of the close of trading on the New York Stock Exchange (generally 4 p.m., Eastern time) on the valuation date. Equity securities are valued at the latest quoted sales prices or official closing prices taken from the primary market in which each security trades; such securities not traded on the valuation date are valued at the mean of the latest quoted bid and asked prices. Securities for which market quotations are not readily available, or whose values have been materially affected by events occurring before the fund’s pricing time but after the close of the securities’ primary markets, are valued by methods deemed by the board of trustees to represent fair value. Investments in Vanguard Market Liquidity Fund are valued at that fund’s net asset value. Temporary cash investments acquired over 60 days to maturity are valued using the latest bid prices or using valuations based on a matrix system (which considers such factors as security prices, yields, maturities, and ratings), both as furnished by independent pricing services. Other temporary cash investments are valued at amortized cost, which approximates market value.
2. Futures Contracts: The fund uses index futures contracts to a limited extent, with the objective of maintaining full exposure to the stock market while maintaining liquidity. The fund may purchase or sell futures contracts to achieve a desired level of investment, whether to accommodate portfolio turnover or cash flows from capital share transactions. The primary risks associated with the use of futures contracts are imperfect correlation between changes in market values of stocks held by the fund and the prices of futures contracts, and the possibility of an illiquid market.
Futures contracts are valued at their quoted daily settlement prices. The aggregate principal amounts of the contracts are not recorded in the Statement of Net Assets. Fluctuations in the value of the contracts are recorded in the Statement of Net Assets as an asset (liability) and in the Statement of Operations as unrealized appreciation (depreciation) until the contracts are closed, when they are recorded as realized futures gains (losses).
3. Federal Income Taxes: The fund intends to continue to qualify as a regulated investment company and distribute all of its taxable income. Management has analyzed the fund’s tax positions taken for all open federal income tax years (September 30, 2006–2009), and has concluded that no provision for federal income tax is required in the fund’s financial statements.
4. Distributions: Distributions to shareholders are recorded on the ex-dividend date.
5. Security Lending: The fund may lend its securities to qualified institutional borrowers to earn additional income. Security loans are required to be secured at all times by collateral at least equal to the market value of securities loaned. The fund invests cash collateral received in Vanguard Market Liquidity Fund, and records a liability for the return of the collateral, during the period the securities are on loan. Security lending income represents the income earned on investing cash collateral, less expenses associated with the loan.
20
Growth and Income Fund
6. Other: Dividend income is recorded on the ex-dividend date. Interest income includes income distributions received from Vanguard Market Liquidity Fund and is accrued daily. Security transactions are accounted for on the date securities are bought or sold. Costs used to determine realized gains (losses) on the sale of investment securities are those of the specific securities sold.
Each class of shares has equal rights as to assets and earnings, except that each class separately bears certain class-specific expenses related to maintenance of shareholder accounts (included in Management and Administrative expenses), shareholder reporting, and proxies. Marketing and distribution expenses are allocated to each class of shares based on a method approved by the board of trustees. Income, other non-class-specific expenses, and gains and losses on investments are allocated to each class of shares based on its relative net assets.
B. Mellon Capital Management Corporation provides investment advisory services to the fund for a fee calculated at an annual percentage rate of average net assets. The basic fee is subject to quarterly adjustments based on the fund’s performance for the preceding three years relative to the S&P 500 Index. For the year ended September 30, 2009, the investment advisory fee represented an effective annual basic rate of 0.10% of the fund’s average net assets before a decrease of $1,791,000 (0.04%) based on performance.
C. The Vanguard Group furnishes at cost corporate management, administrative, marketing, and distribution services. The costs of such services are allocated to the fund under methods approved by the board of trustees. The fund has committed to provide up to 0.40% of its net assets in capital contributions to Vanguard. At September 30, 2009, the fund had contributed capital of $974,000 to Vanguard (included in Other Assets), representing 0.02% of the fund’s net assets and 0.39% of Vanguard’s capitalization. The fund’s trustees and officers are also directors and officers of Vanguard.
D. The fund has asked its investment advisor to direct certain security trades, subject to obtaining the best price and execution, to brokers who have agreed to rebate to the fund part of the commissions generated. Such rebates are used solely to reduce the fund’s management and administrative expenses. For the year ended September 30, 2009, these arrangements reduced the fund’s expenses by $446,000 (an annual rate of 0.01% of average net assets).
E. Various inputs may be used to determine the value of the fund’s investments. These inputs are summarized in three broad levels for financial statement purposes. The inputs or methodologies used to value securities are not necessarily an indication of the risk associated with investing in those securities.
Level 1—Quoted prices in active markets for identical securities.
Level 2—Other significant observable inputs (including quoted prices for similar securities, interest rates, prepayment speeds, credit risk, etc.).
Level 3—Significant unobservable inputs (including the fund’s own assumptions used to determine the fair value of investments).
21
Growth and Income Fund
The following table summarizes the fund’s investments as of September 30, 2009, based on the inputs used to value them:
| Level 1 | Level 2 | Level 3 | |
| Investments | ($000) | ($000) | ($000) |
| Common Stocks | 4,622,001 | — | — |
| Temporary Cash Investments | 81,072 | 7,449 | — |
| Futures Contracts—Liabilities1 | (128) | — | — |
| Total | 4,702,945 | 7,449 | — |
| 1 Represents variation margin on the last day of the reporting period. |
F. At September 30, 2009, the aggregate settlement value of open futures contracts and the related unrealized appreciation (depreciation) were:
| ($000) | ||||
| Number of | Aggregate | Unrealized | ||
| Long (Short) | Settlement | Appreciation | ||
| Futures Contracts | Expiration | Contracts | Value | (Depreciation) |
| S&P 500 Index | December 2009 | 270 | 71,071 | 160 |
Unrealized appreciation (depreciation) on open futures contracts is required to be treated as realized gain (loss) for tax purposes.
G. Distributions are determined on a tax basis and may differ from net investment income and realized capital gains for financial reporting purposes. Differences may be permanent or temporary. Permanent differences are reclassified among capital accounts in the financial statements to reflect their tax character. Temporary differences arise when certain items of income, expense, gain, or loss are recognized in different periods for financial statement and tax purposes; these differences will reverse at some time in the future. Differences in classification may also result from the treatment of short-term gains as ordinary income for tax purposes.
For tax purposes, at September 30, 2009, the fund had $22,522,000 of ordinary income available for distribution. The fund had available capital loss carryforwards totaling $845,748,000 to offset future net capital gains through September 30, 2017. In addition, the fund realized losses of $1,093,871,000 during the period from November 1, 2008, through September 30, 2009, which are deferred and will be treated as realized for tax purposes in fiscal 2010.
At September 30, 2009, the cost of investment securities for tax purposes was $4,509,373,000. Net unrealized appreciation of investment securities for tax purposes was $201,149,000, consisting of unrealized gains of $533,428,000 on securities that had risen in value since their purchase and $332,279,000 in unrealized losses on securities that had fallen in value since their purchase.
H. During the year ended September 30, 2009, the fund purchased $3,511,095,000 of investment securities and sold $3,799,385,000 of investment securities, other than temporary cash investments.
22
Growth and Income Fund
| I. Capital share transactions for each class of shares were: | ||||
| Year Ended September 30, | ||||
| 2009 | 2008 | |||
| Amount | Shares | Amount | Shares | |
| ($000) | (000) | ($000) | (000) | |
| Investor Shares | ||||
| Issued | 342,754 | 17,955 | 550,897 | 17,490 |
| Issued in Lieu of Cash Distributions | 70,600 | 3,711 | 622,470 | 19,829 |
| Redeemed | (533,776) | (27,759) | (838,018) | (27,137) |
| Net Increase (Decrease)—Investor Shares | (120,422) | (6,093) | 335,349 | 10,182 |
| Admiral Shares | ||||
| Issued | 152,599 | 4,878 | 220,621 | 4,296 |
| Issued in Lieu of Cash Distributions | 32,886 | 1,059 | 305,215 | 5,955 |
| Redeemed | (359,800) | (11,621) | (475,830) | (9,345) |
| Net Increase (Decrease)—Admiral Shares | (174,315) | (5,684) | 50,006 | 906 |
J. In preparing the financial statements as of September 30, 2009, management considered the impact of subsequent events occurring through November 10, 2009, for potential recognition or disclosure in these financial statements.
23
Report of Independent Registered Public Accounting Firm
To the Trustees of Vanguard Quantitative Funds and the Shareholders of Vanguard Growth and Income Fund:
In our opinion, the accompanying statement of net assets and the related statements of operations and of changes in net assets and the financial highlights present fairly, in all material respects, the financial position of Vanguard Growth and Income Fund (the “Fund”) at September 30, 2009, the results of its operations for the year then ended, the changes in its net assets for each of the two years in the period then ended and the financial highlights for each of the five years in the period then ended, in conformity with accounting principles generally accepted in the United States of America. These financial statements and financial highlights (hereafter referred to as “financial statements”) are the responsibility of the Fund’s management; our responsibility is to express an opinion on these financial statements based on our audits. We conducted our audits of these financial statements in accor dance with the standards of the Public Company Accounting Oversight Board (United States). Those standards require that we plan and perform the audit to obtain reasonable assurance about whether the financial statements are free of material misstatement. An audit includes examining, on a test basis, evidence supporting the amounts and disclosures in the financial statements, assessing the accounting principles used and significant estimates made by management, and evaluating the overall financial statement presentation. We believe that our audits, which included confirmation of securities at September 30, 2009 by correspondence with the custodian and broker, and by agreement to the underlying ownership records for Vanguard Market Liquidity Fund, provide a reasonable basis for our opinion.
PricewaterhouseCoopers LLP
Philadelphia, Pennsylvania
November 10, 2009
| Special 2009 tax information (unaudited) for Vanguard Growth and Income Fund |
This information for the fiscal year ended September 30, 2009, is included pursuant to provisions of the Internal Revenue Code.
The fund distributed $109,604,000 of qualified dividend income to shareholders during the fiscal year.
For corporate shareholders, 100.0% of investment income (dividend income plus short-term gains, if any) qualifies for the dividends-received deduction.
24
Your Fund’s After-Tax Returns
This table presents returns for your fund both before and after taxes. The after-tax returns are shown in two ways: (1) assuming that an investor owned the fund during the entire period and paid taxes on the fund’s distributions, and (2) assuming that an investor paid taxes on the fund’s distributions and sold all shares at the end of each period.
Calculations are based on the highest individual federal income tax and capital gains tax rates in effect at the times of the distributions and the hypothetical sales. State and local taxes were not considered. After-tax returns reflect any qualified dividend income, using actual prior-year figures and estimates for 2009. (In the example, returns after the sale of fund shares may be higher than those assuming no sale. This occurs when the sale would have produced a capital loss. The calculation assumes that the investor received a tax deduction for the loss.)
The table shows returns for Investor Shares only; returns for other share classes will differ. Please note that your actual after-tax returns will depend on your tax situation and may differ from those shown. Also note that if you own the fund in a tax-deferred account, such as an individual retirement account or a 401(k) plan, this information does not apply to you. Such accounts are not subject to current taxes.
Finally, keep in mind that a fund’s performance—whether before or after taxes—does not guarantee future results.
| Average Annual Total Returns: Growth and Income Fund Investor Shares1 | |||
| Periods Ended September 30, 2009 | |||
| One | Five | Ten | |
| Year | Years | Years | |
| Returns Before Taxes | –11.29% | –0.53% | –0.48% |
| Returns After Taxes on Distributions | –11.63 | –1.17 | –1.17 |
| Returns After Taxes on Distributions and Sale of Fund Shares | –6.99 | –0.36 | –0.51 |
1 Total returns figures do not include the account service fee that may be applicable to certain accounts with balances below $10,000.
25
About Your Fund’s Expenses
As a shareholder of the fund, you incur ongoing costs, which include costs for portfolio management, administrative services, and shareholder reports (like this one), among others. Operating expenses, which are deducted from a fund’s gross income, directly reduce the investment return of the fund.
A fund’s expenses are expressed as a percentage of its average net assets. This figure is known as the expense ratio. The following examples are intended to help you understand the ongoing costs (in dollars) of investing in your fund and to compare these costs with those of other mutual funds. The examples are based on an investment of $1,000 made at the beginning of the period shown and held for the entire period.
The accompanying table illustrates your fund’s costs in two ways:
• Based on actual fund return. This section helps you to estimate the actual expenses that you paid over the period. The “Ending Account Value” shown is derived from the fund’s actual return, and the third column shows the dollar amount that would have been paid by an investor who started with $1,000 in the fund. You may use the information here, together with the amount you invested, to estimate the expenses that you paid over the period.
To do so, simply divide your account value by $1,000 (for example, an $8,600 account value divided by $1,000 = 8.6), then multiply the result by the number given for your fund under the heading “Expenses Paid During Period.”
• Based on hypothetical 5% yearly return. This section is intended to help you compare your fund’s costs with those of other mutual funds. It assumes that the fund had a yearly return of 5% before expenses, but that the expense ratio is unchanged. In this case—because the return used is not the fund’s actual return—the results do not apply to your investment. The example is useful in making comparisons because the Securities and Exchange Commission requires all mutual funds to calculate expenses based on a 5% return. You can assess your fund’s costs by comparing this hypothetical example with the hypothetical examples that appear in shareholder reports of other funds.
| Six Months Ended September 30, 2009 | |||
| Beginning | Ending | Expenses | |
| Account Value | Account Value | Paid During | |
| Growth and Income Fund | 3/31/2009 | 9/30/2009 | Period1 |
| Based on Actual Fund Return | |||
| Investor Shares | $1,000.00 | $1,317.69 | $1.98 |
| Admiral Shares | 1,000.00 | 1,319.04 | 1.16 |
| Based on Hypothetical 5% Yearly Return | |||
| Investor Shares | $1,000.00 | $1,023.36 | $1.72 |
| Admiral Shares | 1,000.00 | 1,024.07 | 1.01 |
1 The calculations are based on expenses incurred in the most recent six-month period. The fund’s annualized six-month expense ratios for that period are 0.34% for Investor Shares and 0.20% for Admiral Shares. The dollar amounts shown as “Expenses Paid” are equal to the annualized expense ratio multiplied by the average account value over the period, multiplied by the number of days in the most recent six-month period, then divided by the number of days in the most recent 12-month period.
26
Note that the expenses shown in the table are meant to highlight and help you compare ongoing costs only and do not reflect transaction costs incurred by the fund for buying and selling securities. Further, the expenses do not include the account service fee described in the prospectus. If such a fee were applied to your account, your costs would be higher. Your fund does not charge transaction fees, such as purchase or redemption fees, nor does it carry a “sales load.”
The calculations assume no shares were bought or sold during the period. Your actual costs may have been higher or lower, depending on the amount of your investment and the timing of any purchases or redemptions.
You can find more information about the fund’s expenses, including annual expense ratios, in the Financial Statements section of this report. For additional information on operating expenses and other shareholder costs, please refer to your fund’s current prospectus.
27
Trustees Approve Advisory Agreement
The board of trustees of Vanguard Growth and Income Fund has renewed the fund’s investment advisory agreement with Mellon Capital Management Corporation. The board determined that the retention of the advisor was in the best interests of the fund and its shareholders.
The board based its decision upon an evaluation of the advisor’s investment staff, portfolio management process, and performance. The trustees considered the factors discussed below, among others. However, no single factor determined whether the board approved the agreement. Rather, it was the totality of the circumstances that drove the board’s decision.
Nature, extent, and quality of services
The board considered the quality of the fund’s investment management over both the short and long term, and took into account the organizational depth and stability of the advisor. The board noted that Mellon Capital was founded in 1983. The firm is a leader in asset allocation and quantitative investment strategies. The firm, through its predecessor, Franklin Portfolio Associates, has advised the fund since 1986. The investment team at Mellon Capital employs a quantitative investment strategy that seeks to provide a total return greater than that of the S&P 500 Index by investing in U.S. large- and mid-capitalization stocks. Stock selection is driven by a series of more than 40 computer models covering a broad range of public data. The board concluded that the advisor’s experience, stability, depth, and performance, among other factors, warranted continuation of the advisory agreement.
Investment performance
The board considered the short- and long-term performance of the fund, including any periods of outperformance or underperformance of a relevant benchmark and peer group. The board noted that the advisor has carried out the fund’s investment strategy in disciplined fashion, and the results have been mixed—with periods of outperformance and periods of underperformance versus the fund’s benchmark and peer group. Information about the fund’s most recent performance can be found in the Performance Summary section of this report.
Cost
The board concluded that the fund’s expense ratio was well below the average expense ratio charged by funds in its peer group and that the fund’s advisory fee rate was also well below its peer-group average. Information about the fund’s expense ratio appears in the About Your Fund’s Expenses section of this report as well as in the Financial Statements section, which also includes information about the fund’s advisory fee rate.
The board did not consider profitability of Mellon Capital in determining whether to approve the advisory fee, because Mellon Capital is independent of Vanguard, and the advisory fee is the result of arm’s-length negotiations.
The benefit of economies of scale
The board concluded that the fund’s shareholders benefit from economies of scale because of breakpoints in the advisory fee schedule. The breakpoints reduce the effective rate of the fee as the fund’s assets increase.
The board will consider whether to renew the advisory agreement after a one-year period.
28
Glossary
Beta. A measure of the magnitude of a fund’s past share-price fluctuations in relation to the ups and downs of a given market index. The index is assigned a beta of 1.00. Compared with a given index, a fund with a beta of 1.20 typically would have seen its share price rise or fall by 12% when the index rose or fell by 10%. For this report, beta is based on returns over the past 36 months for both the fund and the index. Note that a fund’s beta should be reviewed in conjunction with its R-squared (see definition). The lower the R-squared, the less correlation there is between the fund and the index, and the less reliable beta is as an indicator of volatility.
Earnings Growth Rate. The average annual rate of growth in earnings over the past five years for the stocks now in a fund.
Equity Exposure. A measure that reflects a fund’s investments in stocks and stock futures. Any holdings in short-term reserves are excluded.
Expense Ratio. The percentage of a fund’s average net assets used to pay its annual administrative and advisory expenses. These expenses directly reduce returns to investors.
Foreign Holdings. The percentage of a fund represented by stocks or depositary receipts of companies based outside the United States.
Inception Date. The date on which the assets of a fund (or one of its share classes) are first invested in accordance with the fund’s investment objective. For funds with a subscription period, the inception date is the day after that period ends. Investment performance is measured from the inception date.
Median Market Cap. An indicator of the size of companies in which a fund invests; the midpoint of market capitalization (market price x shares outstanding) of a fund’s stocks, weighted by the proportion of the fund’s assets invested in each stock. Stocks representing half of the fund’s assets have market capitalizations above the median, and the rest are below it.
Price/Book Ratio. The share price of a stock divided by its net worth, or book value, per share. For a fund, the weighted average price/book ratio of the stocks it holds.
Price/Earnings Ratio. The ratio of a stock’s current price to its per-share earnings over the past year. For a fund, the weighted average P/E of the stocks it holds. P/E is an indicator of market expectations about corporate prospects; the higher the P/E, the greater the expectations for a company’s future growth.
R-Squared. A measure of how much of a fund’s past returns can be explained by the returns from the market in general, as measured by a given index. If a fund’s total returns were precisely synchronized with an index’s returns, its R-squared would be 1.00. If the fund’s returns bore no relationship to the index’s returns, its R-squared would be 0. For this report, R-squared is based on returns over the past 36 months for both the fund and the index.
Return on Equity. The annual average rate of return generated by a company during the past five years for each dollar of shareholder’s equity (net income divided by shareholder’s equity). For a fund, the weighted average return on equity for the companies whose stocks it holds.
Short-Term Reserves. The percentage of a fund invested in highly liquid, short-term securities that can be readily converted to cash.
29
Turnover Rate. An indication of the fund’s trading activity. Funds with high turnover rates incur higher transaction costs and may be more likely to distribute capital gains (which may be taxable to investors). The turnover rate excludes in-kind transactions, which have minimal impact on costs.
Yield. A fund’s 30-day SEC yield is derived using a formula specified by the U.S. Securities and Exchange Commission. Under the formula, data related to the fund’s security holdings in the previous 30 days are used to calculate the fund’s hypothetical net income for that period, which is then annualized and divided by the fund’s estimated average net assets over the calculation period. For the purposes of this calculation, a security’s income is based on its current market yield to maturity (in the case of bonds) or its projected dividend yield (for stocks). Because the SEC yield represents hypothetical annualized income, it will differ—at times significantly—from the fund’s actual experience. As a result, the fund’s income distributions may be higher or lower than implied by the SEC yield.
30
This page intentionally left blank.
The People Who Govern Your Fund
The trustees of your mutual fund are there to see that the fund is operated and managed in your best interests since, as a shareholder, you are a part owner of the fund. Your fund’s trustees also serve on the board of directors of The Vanguard Group, Inc., which is owned by the Vanguard funds and provides services to them on an at-cost basis.
A majority of Vanguard’s board members are independent, meaning that they have no affiliation with Vanguard or the funds they oversee, apart from the sizable personal investments they have made as private individuals. The independent board members have distinguished backgrounds in business, academia, and public service. Each of the trustees and executive officers oversees 156 Vanguard funds.
The following table provides information for each trustee and executive officer of the fund. More information about the trustees is in the Statement of Additional Information, which can be obtained, without charge, by contacting Vanguard at 800-662-7447, or online at www.vanguard.com.
| Interested Trustees | Emerson U. Fullwood |
| Born 1948. Trustee Since January 2008. Principal | |
| John J. Brennan1 | Occupation(s) During the Past Five Years: Executive |
| Born 1954. Trustee Since May 1987. Chairman of | Chief Staff and Marketing Officer for North America |
| the Board. Principal Occupation(s) During the Past | and Corporate Vice President (retired 2008) of Xerox |
| Five Years: Chairman of the Board and Director/Trustee | Corporation (photocopiers and printers); Director of |
| of The Vanguard Group, Inc., and of each of the | SPX Corporation (multi-industry manufacturing), the |
| investment companies served by The Vanguard Group; | United Way of Rochester, the Boy Scouts of America, |
| Chief Executive Officer (1996–2008) and President | Amerigroup Corporation (direct health and medical |
| (1989–2008) of The Vanguard Group and of each of the | insurance carriers), and Monroe Community College |
| investment companies served by The Vanguard Group; | Foundation. |
| Chairman of the Financial Accounting Foundation; | |
| Governor of the Financial Industry Regulatory Authority | Rajiv L. Gupta |
| (FINRA); Director of United Way of Southeastern | Born 1945. Trustee Since December 2001.2 Principal |
| Pennsylvania. | Occupation(s) During the Past Five Years: Chairman |
| and Chief Executive Officer (retired 2009) and President | |
| F. William McNabb III1 | (2006–2008) of Rohm and Haas Co. (chemicals); Board |
| Born 1957. Trustee Since July 2009. Principal | Member of American Chemistry Council; Director of |
| Occupation(s) During the Past Five Years: Director of | Tyco International, Ltd. (diversified manufacturing and |
| The Vanguard Group, Inc., since 2008; Chief Executive | services) and Hewlett-Packard Co. (electronic computer |
| Officer and President of The Vanguard Group and of | manufacturing); Trustee of The Conference Board. |
| each of the investment companies served by The | |
| Vanguard Group since 2008; Director of Vanguard | Amy Gutmann |
| Marketing Corporation; Managing Director of The | Born 1949. Trustee Since June 2006. Principal |
| Vanguard Group (1995–2008). | Occupation(s) During the Past Five Years: President of |
| the University of Pennsylvania; Christopher H. Browne | |
| Distinguished Professor of Political Science in the School | |
| Independent Trustees | of Arts and Sciences with secondary appointments |
| at the Annenberg School for Communication and the | |
| Charles D. Ellis | Graduate School of Education of the University of |
| Born 1937. Trustee Since January 2001. Principal | Pennsylvania; Director of Carnegie Corporation of |
| Occupation(s) During the Past Five Years: Applecore | New York, Schuylkill River Development Corporation, |
| Partners (pro bono ventures in education); Senior | and Greater Philadelphia Chamber of Commerce; |
| Advisor to Greenwich Associates (international business | Trustee of the National Constitution Center. |
| strategy consulting); Successor Trustee of Yale University; | |
| Overseer of the Stern School of Business at New York | |
| University; Trustee of the Whitehead Institute for | |
| Biomedical Research. |
| JoAnn Heffernan Heisen | Executive Officers | |
| Born 1950. Trustee Since July 1998. Principal | ||
| Occupation(s) During the Past Five Years: Corporate | Thomas J. Higgins1 | |
| Vice President and Chief Global Diversity Officer since | Born 1957. Chief Financial Officer Since September | |
| 2006 (retired 2008) and Member of the Executive | 2008. Principal Occupation(s) During the Past Five | |
| Committee (retired 2008) of Johnson & Johnson | Years: Principal of The Vanguard Group, Inc.; Chief | |
| (pharmaceuticals/consumer products); Vice President | Financial Officer of each of the investment companies | |
| and Chief Information Officer of Johnson & Johnson | served by The Vanguard Group since 2008; Treasurer | |
| (1997–2005); Director of the University Medical Center | of each of the investment companies served by The | |
| at Princeton and Women’s Research and Education | Vanguard Group (1998–2008). | |
| Institute. | ||
| Kathryn J. Hyatt1 | ||
| André F. Perold | Born 1955. Treasurer Since November 2008. Principal | |
| Born 1952. Trustee Since December 2004. Principal | Occupation(s) During the Past Five Years: Principal of | |
| Occupation(s) During the Past Five Years: George Gund | The Vanguard Group, Inc.; Treasurer of each of the | |
| Professor of Finance and Banking, Harvard Business | investment companies served by The Vanguard | |
| School; Chairman of UNX, Inc. (equities trading firm); | Group since 2008; Assistant Treasurer of each of the | |
| Chair of the Investment Committee of HighVista | investment companies served by The Vanguard Group | |
| Strategies LLC (private investment firm). | (1988–2008). | |
| Alfred M. Rankin, Jr. | Heidi Stam1 | |
| Born 1941. Trustee Since January 1993. Principal | Born 1956. Secretary Since July 2005. Principal | |
| Occupation(s) During the Past Five Years: Chairman, | Occupation(s) During the Past Five Years: Managing | |
| President, and Chief Executive Officer of NACCO | Director of The Vanguard Group, Inc., since 2006; | |
| Industries, Inc. (forklift trucks/housewares/lignite); | General Counsel of The Vanguard Group since 2005; | |
| Director of Goodrich Corporation (industrial products/ | Secretary of The Vanguard Group and of each of the | |
| aircraft systems and services); Deputy Chairman of | investment companies served by The Vanguard Group | |
| the Federal Reserve Bank of Cleveland. | since 2005; Director and Senior Vice President of | |
| Vanguard Marketing Corporation since 2005; Principal | ||
| Peter F. Volanakis | of The Vanguard Group (1997–2006). | |
| Born 1955. Trustee Since July 2009. Principal | ||
| Occupation(s) During the Past Five Years: President | ||
| since 2007 and Chief Operating Officer since 2005 | Vanguard Senior Management Team | |
| of Corning Incorporated (communications equipment); | ||
| President of Corning Technologies (2001–2005); Director | R. Gregory Barton | Michael S. Miller |
| of Corning Incorporated and Dow Corning; Trustee of | Mortimer J. Buckley | James M. Norris |
| the Corning Incorporated Foundation and the Corning | Kathleen C. Gubanich | Glenn W. Reed |
| Museum of Glass; Overseer of the Amos Tuck School | Paul A. Heller | George U. Sauter |
| of Business Administration at Dartmouth College. | ||
| Founder | ||
| John C. Bogle | ||
| Chairman and Chief Executive Officer, 1974–1996 | ||
1 These individuals are “interested persons” as defined in the Investment Company Act of 1940.
2 December 2002 for Vanguard Equity Income Fund, Vanguard Growth Equity Fund, the Vanguard Municipal Bond Funds, and the Vanguard State Tax-Exempt Funds.
 | ||
| P.O. Box 2600 | ||
| Valley Forge, PA 19482-2600 | ||
| Connect with Vanguard® > www.vanguard.com | ||
| Fund Information > 800-662-7447 | All comparative mutual fund data are from Lipper Inc. |
| or Morningstar, Inc., unless otherwise noted. | |
| Direct Investor Account Services > 800-662-2739 | |
| Institutional Investor Services > 800-523-1036 | You can obtain a free copy of Vanguard’s proxy voting |
| guidelines by visiting our website, www.vanguard.com, | |
| Text Telephone for People | and searching for “proxy voting guidelines,” or by |
| With Hearing Impairment > 800-952-3335 | calling Vanguard at 800-662-2739. The guidelines are |
| also available from the SEC’s website, www.sec.gov. | |
| In addition, you may obtain a free report on how your | |
| fund voted the proxies for securities it owned during | |
| This material may be used in conjunction | the 12 months ended June 30. To get the report, visit |
| with the offering of shares of any Vanguard | either www.vanguard.com or www.sec.gov. |
| fund only if preceded or accompanied by | |
| the fund’s current prospectus. | You can review and copy information about your fund |
| at the SEC’s Public Reference Room in Washington, D.C. | |
| To find out more about this public service, call the SEC | |
| at 202-551-8090. Information about your fund is also | |
| available on the SEC’s website, and you can receive | |
| copies of this information, for a fee, by sending a | |
| request in either of two ways: via e-mail addressed to | |
| publicinfo@sec.gov or via regular mail addressed to the | |
| Public Reference Section, Securities and Exchange | |
| Commission, Washington, DC 20549-0102. | |
| © 2009 The Vanguard Group, Inc. | |
| All rights reserved. | |
| Vanguard Marketing Corporation, Distributor. | |
| Q930 112009 | |
| Vanguard Structured Equity Funds |
| Annual Report |
| September 30, 2009 |
 |
| Vanguard Structured Large-Cap Equity Fund |
| Vanguard Structured Large-Cap Growth Fund |
| Vanguard Structured Large-Cap Value Fund |
| Vanguard Structured Broad Market Fund |
> For the fiscal year ended September 30, 2009, returns for the Vanguard Structured Equity Funds ranged from about –14% for the Structured Large-Cap Value Fund to about –4% for the Structured Large-Cap Growth Fund.
> The funds’ results for the fiscal year covered two very different market environments—a first half of dramatic declines followed by a second half of robust gains.
> For the 12-month period, the funds’ returns fell behind those of their benchmark indexes and the average returns of peer-group funds.
| Contents | |
| Your Fund’s Total Returns | 1 |
| President’s Letter | 2 |
| Advisor’s Report | 7 |
| Results of Proxy Voting | 9 |
| Structured Large-Cap Equity Fund | 11 |
| Structured Large-Cap Growth Fund | 26 |
| Structured Large-Cap Value Fund | 40 |
| Structured Broad Market Fund | 53 |
| About Your Fund’s Expenses | 72 |
| Glossary | 74 |
Please note: The opinions expressed in this report are just that—informed opinions. They should not be considered promises or advice. Also, please keep in mind that the information and opinions cover the period through the date on the front of this report. Of course, the risks of investing in your fund are spelled out in the prospectus.
Cover photograph: Veronica Coia.
Your Fund’s Total Returns
| Fiscal Year Ended September 30, 2009 | ||
| Ticker | Total | |
| Symbol | Returns | |
| Vanguard Structured Large-Cap Equity Fund | ||
| Institutional Shares1 | VSLIX | –10.25% |
| Institutional Plus Shares2 | VSLPX | –10.16 |
| S&P 500 Index | –6.91 | |
| Large-Cap Core Funds Average3 | –5.85 | |
| Vanguard Structured Large-Cap Growth Fund | ||
| Institutional Shares1 | VSTLX | –3.89% |
| Institutional Plus Shares2 | VSGPX | –3.79 |
| Russell 1000 Growth Index | –1.85 | |
| Large-Cap Growth Funds Average3 | –3.02 | |
| Vanguard Structured Large-Cap Value Fund | ||
| Institutional Plus Shares2 | VSLVX | –13.73% |
| Russell 1000 Value Index | –10.62 | |
| Large-Cap Value Funds Average3 | –7.67 | |
| Vanguard Structured Broad Market Fund | ||
| Institutional Shares1 | VSBMX | –9.67% |
| Institutional Plus Shares2 | VSBPX | –9.60 |
| Russell 3000 Index | –6.42 | |
| Multi-Cap Core Funds Average3 | –4.30 | |
1 This class of shares carries low expenses and is available for a minimum investment of $5 million.
2 This class of shares also carries low expenses and is available for a minimum investment of $200 million.
3 Derived from data provided by Lipper Inc.
1

President’s Letter
Dear Shareholder,
The results for the Vanguard Structured Equity Funds for the 12 months ended September 30, 2009, were disappointing. However, they masked a dramatic turnaround in market sentiment and fund performance that began midway through the funds’ fiscal year.
Investor confidence abruptly revived in March in both the stock and bond markets, as turmoil in the credit markets began to subside and economic reports began to suggest that the economy was on the mend—turning the second half of the fiscal year into a mirror image of the first.
To take a representative example, the Structured Broad Market Fund returned about –32% for the six months ended March 31, 2009, while the fund returned about plus 33% for the subsequent six months. Considered together, these almost perfectly inverse results produced a 12-month loss of about –10%.
After a precipitous fall, stock markets rebound
In recent months, the financial markets have performed so strongly that it’s almost hard to remember that less than a year ago the global financial system stood on the brink of collapse. Since then, markets have pulled back from the abyss. Although unemployment remains near generational highs, and the prospects of a robust recovery seem dim, the global economy has begun to grind into gear.
2
Reminders of the markets’ dark days are nevertheless apparent in the index returns for both the past 12 months and the past three years. Over both periods, U.S. stocks recorded negative returns. Global stocks did better over the past 12 months, recouping their late-2008 losses thanks to general strength in developed economies and a powerful rally in emerging markets. Over the past three years, however, international stocks posted a modestly negative return.
The bond market’s turnabout has been equally dramatic
The stock market’s collapse and recovery echo even more dramatic developments in the bond market. At the end of 2008, as the credit markets nearly ceased to function, the difference between the yields of corporate bonds and Treasury bonds spiked to levels last seen during the Great Depression.
The Federal Reserve and its central bank counterparts around the world responded with aggressive monetary stimulus efforts, while global governments opened the fiscal taps. Investors first tiptoed, then stampeded, back into the market, boosting bond prices and bringing down yields. Over the past 12 months, taxable U.S. bonds returned more than 10%; municipal securities did even better, returning almost 15%, as measured by the Barclays Capital Municipal Bond Index.
The Fed’s rescue campaign has imposed a heavy price on short-term savings vehicles such as money market funds.
| Market Barometer | |||
| Average Annual Total Returns | |||
| Periods Ended September 30, 2009 | |||
| One Year | Three Years | Five Years | |
| Stocks | |||
| Russell 1000 Index (Large-caps) | –6.14% | –5.10% | 1.49% |
| Russell 2000 Index (Small-caps) | –9.55 | –4.57 | 2.41 |
| Dow Jones U.S. Total Stock Market Index | –5.83 | –4.58 | 1.93 |
| MSCI All Country World Index ex USA (International) | 6.43 | –0.78 | 8.59 |
| Bonds | |||
| Barclays Capital U.S. Aggregate Bond Index (Broad taxable market) | 10.56% | 6.41% | 5.13% |
| Barclays Capital Municipal Bond Index | 14.85 | 5.13 | 4.78 |
| Citigroup 3-Month Treasury Bill Index | 0.39 | 2.63 | 2.96 |
| CPI | |||
| Consumer Price Index | –1.29% | 2.10% | 2.61% |
3
| Total Returns | |
| May 15, 2006,1 Through September 30, 2009 | |
| Average | |
| Annual Return | |
| Structured Large-Cap Equity Fund Institutional Plus Shares | –4.96% |
| S&P 500 Index | –3.75 |
| Large-Cap Core Funds Average2 | –4.06 |
| January 19, 2006,1 Through September 30, 2009 | |
| Average | |
| Annual Return | |
| Structured Large-Cap Growth Fund Institutional Plus Shares | –-2.72% |
| Russell 1000 Growth Index | –1.97 |
| Large-Cap Growth Funds Average2 | –3.47 |
| December 15, 2005,1 Through September 30, 2009 | |
| Average | |
| Annual Return | |
| Structured Large-Cap Value Fund Institutional Plus Shares | –4.72% |
| Russell 1000 Value Index | –3.49 |
| Large-Cap Value Funds Average2 | –3.43 |
| May 3, 2004,1 Through September 30, 2009 | |
| Average | |
| Annual Return | |
| Structured Broad Market Fund Institutional Plus Shares | 0.70% |
| Russell 3000 Index | 1.55 |
| Multi-Cap Core Funds Average2 | 1.30 |
The figures shown represent past performance, which is not a guarantee of future results. (Current performance may be lower or higher than the performance data cited. For performance data current to the most recent month-end, visit our website at www.vanguard.com/performance.) Note, too, that both investment returns and principal value can fluctuate widely, so an investor's shares, when sold, could be worth more or less than their original cost.
1 Share-class inception.
2 Derived from data provided by Lipper Inc.
4
In December 2008, the Fed reduced its target for the federal funds rate, a benchmark for the interest rates paid by money market instruments and other very short-term securities, to between 0% and 0.25%. The Fed has said it expects to maintain its target at this level “for an extended period.”
Early-in-the-year results weigh on full-year returns
The recent fiscal year has been a historically anomalous period in the financial markets, to say the least. One consequence for stocks has been that the worst-performing stocks in the dizzying market of the first six months of the fiscal year generally were among the best performers during the exceptionally strong rally that characterized the final six months of the period.
The first-half results weighed heavily on the performance of stocks for the full fiscal year, so it’s not surprising that each of the funds posted a negative return. It was disappointing, however, that the funds fell short of their benchmark indexes, as their risk-controlled quantitative stock-selection processes are intended both to produce above-benchmark returns and limit big deviations from their benchmarks.
In the usual seesaw of dominance between growth stocks and value stocks, growth stocks performed better than value stocks during the fiscal year. (Of course, in bear markets, “better” performance is a relative concept.) This resulted in the Structured Large-Cap Growth Fund outpacing the Structured Large-Cap Value Fund.
The performance of the Structured Large-Cap Equity Fund, which blends large-cap growth and value stocks, fell in between. The Structured Broad Market Fund, which encompasses large-cap stocks as well as mid- and small-cap issues, performed marginally better than its large-cap counterpart.
Financial stocks contributed somewhat more than half of the negative returns posted by the large-cap value, large-cap equity, and broad-market funds. This is understandable given the relative importance of financials in those portfolios and the travails encountered by that sector. In addition, because of poor stock selection, the funds’ financial holdings detracted more from their returns than the benchmark indexes’ holdings did from theirs. By contrast, the sector had less of an impact on the large-cap growth fund, where it represented a more modest portion of the portfolio.
For each fund, the contribution to returns from the information technology and consumer discretionary sectors cushioned the effect of the general market downdraft. And compared with the performance of the funds’ benchmarks, good stock selection among consumer discretionary stocks aided the performance of the Structured Large-Cap Value Fund and, to a lesser extent, of the Structured Large-Cap Equity and Structured Broad Market Funds.
5
A long-term view can curb short-term distractions
A stock market rally is always welcome, of course. But not all rallies are alike when you look under the hood.
The stock market rally that characterized the final six months of the 2009 fiscal year was led, in general, by the stocks of companies in suspect financial health. Unfortunately, the models that our advisor uses are designed to sift through thousands of stocks and find those with higher-quality characteristics. We believe those stocks have the potential to produce the strongest results over the long term.
That is why we remain confident in the funds’ underlying stock-selection methodology, despite the disappointing short-term results and, indeed, their unsatisfactory performance since inception within the past few years.
In recent months, the market’s and the fund’s performance have improved. The latest rally reinforces our belief that it’s important to step back (difficult as it may be) from the distraction of short-term results and think about investing as a long-term process—one that is set in motion after you’ve developed a low-cost portfolio that is balanced and diversified among the major asset classes.
Thank you for entrusting your assets to Vanguard.
Sincerely,

F. William McNabb III
President and Chief Executive Officer
October 14, 2009
| Your Fund’s Performance at a Glance | ||||
| September 30, 2008–September 30, 2009 | ||||
| Distributions Per Share | ||||
| Starting | Ending | Income | Capital | |
| Share Price | Share Price | Dividends | Gains | |
| Structured Large-Cap Equity Fund | ||||
| Institutional Shares | $22.56 | $19.47 | $0.643 | $0.000 |
| Institutional Plus Shares | 45.15 | 38.97 | 1.316 | 0.000 |
| Structured Large-Cap Growth Fund | ||||
| Institutional Shares | $22.63 | $21.38 | $0.297 | $0.000 |
| Institutional Plus Shares | 45.07 | 42.60 | 0.613 | 0.000 |
| Structured Large-Cap Value Fund | ||||
| Institutional Plus Shares | $44.00 | $36.43 | $1.388 | $0.000 |
| Structured Broad Market Fund | ||||
| Institutional Shares | $21.53 | $18.99 | $0.392 | $0.000 |
| Institutional Plus Shares | 43.07 | 37.94 | 0.849 | 0.000 |
6
Advisor’s Report
The financial crisis that began in 2007 continued to influence the stock market during the past fiscal year, resulting in each of the structured portfolios under-performing its benchmark. The Structured Large-Cap Equity Fund returned about –10%, compared with a return of about –7% for the Standard and Poor’s 500 Index. The Structured Broad Market Fund also returned about –10%, versus a return of about –6% for the Russell 3000 Index. The Structured Large-Cap Growth Fund returned about –4% compared with the Russell 1000 Growth Index’s return of about –2%. And the Structured Large-Cap Value Fund returned about –14% against a return of about –11% for the Russell 1000 Value Index.
During the panic that ruled the market in the first half of the fiscal year, the S&P 500 Index returned about –30%. The worst-performing stocks during those six months became the best-returning stocks of the next period. This “junk” rally in stocks, which began after the market’s close brush with financial disaster, led the S&P 500 to a gain of more than 30% in the second half of the period.
Our investment process led to mixed results in this period. Our model has five components: valuation, quality, growth, management decisions, and market sentiment.
Valuation measures the price we will pay for a stock’s earnings or cash flow. By itself, valuation can be a powerful investment tool, but our research leads us to conclude that other components improve upon a valuation signal. Our quality score separates cheap stocks that deserve their low valuations because of poor margins from their more profitable peers.
Our growth indicator likewise differentiates between companies with low valuations due to poor growth prospects and firms with more attractive prospects. Since actions often speak louder than words, another component of our model helps determine the attractiveness of a stock by evaluating the decisions corporate managers make. These include decisions to issue stock, raise debt, and make capital investments. Finally, our sentiment score measures the market’s overall evaluation of the company’s value. Our logic is that a stock’s performance reflects the news affecting that stock, which helps to verify the results of our other scores.
We combine the five components into an overall score, with each indicator serving as a verification of the others. Our research tells us that the attributes we prefer in stocks—such as low ratios of price to earnings and price to cash flow and higher return on equity compared with other stocks—are likely to be successful in the long term, but may not work in some periods, such as this past fiscal year.
The panic in the first part of the year drove down all stocks, regardless of individual characteristics, as investors sought to exit the market. In March, once companies
that had almost ceased to exist seemed more likely to survive, the stocks of these firms roared back to life. This happened even though these firms had attributes that our model does not favor, such as negative earnings, low margins, and low growth.
Value-oriented stocks, which we prefer, were particularly out of favor during the year. While we are disappointed that our performance for the year was below the benchmarks’, we are not surprised that we lagged during this period. All investment styles endure periods of underperformance, and we can look back to earlier periods—such as the Internet boom—to see when our process similarly underperformed.
In contrast to our recent stock-market meltdown, the dot-com boom that began in the late 1990s was a “melt-up”—stock prices climbed strongly and steeply before plummeting. Nevertheless, just as in the past year, a very few factors dominated performance in that time. For example, it was acceptable for a stock to have little or no earnings if it had an Internet-related story line. Throughout the dot-com boom, our model rejected many stocks that did not pass our earnings and quality criteria, causing our portfolios to underperform.
Last year, the factor that dominated was the credit crisis. In an environment such as the past year, or during the late 1990s, when one or two factors dominate investor decision-making, our process will suffer. We continue to maintain our commitment to a portfolio with lower ratios of price to earnings and price to cash flow, growth rates near the market’s overall rate, and a slightly higher relative return on equity, because such a portfolio offers an attractive profile that we expect the market will reward in the long term.
We thank you for your investment and look forward to the upcoming year.
James D. Troyer, CFA Principal and Portfolio Manager
James P. Stetler, Principal and Portfolio Manager
Joel M. Dickson, Ph.D. Principal and Head of Active Quantitative Equity Management
Vanguard Quantitative Equity Group
October 16, 2009
8
Results of Proxy Voting
At a special meeting of shareholders on July 2, 2009, fund shareholders approved the following two proposals:
Proposal 1—Elect trustees for each fund.*
The individuals listed in the table below were elected as trustees for each fund. All trustees with the exception of Messrs. McNabb and Volanakis (both of whom already served as directors of The Vanguard Group, Inc.) served as trustees to the funds prior to the shareholder meeting.
| Structured Large-Cap Equity Fund, Structured Large-Cap Growth Fund, Structured Large-Cap Value | |||
| Fund, Structured Broad Market Fund | |||
| Percentage | |||
| Trustee | For | Withheld | For |
| John J. Brennan | 159,956,902 | 5,954,687 | 96.4% |
| Charles D. Ellis | 157,719,476 | 8,192,112 | 95.1% |
| Emerson U. Fullwood | 158,422,350 | 7,489,238 | 95.5% |
| Rajiv L. Gupta | 159,601,353 | 6,310,235 | 96.2% |
| Amy Gutmann | 159,929,264 | 5,982,324 | 96.4% |
| JoAnn Heffernan Heisen | 159,793,652 | 6,117,936 | 96.3% |
| F. William McNabb III | 159,924,396 | 5,987,192 | 96.4% |
| André F. Perold | 158,350,070 | 7,561,519 | 95.4% |
| Alfred M. Rankin, Jr. | 159,681,434 | 6,230,154 | 96.2% |
| Peter F. Volanakis | 159,820,426 | 6,091,162 | 96.3% |
| * Results are for all funds within the same trust. | |||
Proposal 2—Update and standardize the funds’ fundamental policies regarding:
(a) Purchasing and selling real estate.
(b) Issuing senior securities.
(c) Borrowing money.
(d) Making loans.
(e) Purchasing and selling commodities.
(f) Concentrating investments in a particular industry or group of industries.
(g) Eliminating outdated fundamental investment policies not required by law.
The revised fundamental policies are clearly stated and simple, yet comprehensive, making oversight and compliance more efficient than under the former policies. The revised fundamental policies will allow the funds to respond more quickly to regulatory and market changes, while avoiding the costs and delays associated with successive shareholder meetings.
9
| Broker | Percentage | ||||
| Vanguard Fund | For | Abstain | Against | Non-Votes | For |
| Structured Large-Cap Equity Fund | |||||
| 2a | 15,973,706 | 0 | 0 | 0 | 100.0% |
| 2b | 15,973,706 | 0 | 0 | 0 | 100.0% |
| 2c | 15,973,706 | 0 | 0 | 0 | 100.0% |
| 2d | 15,973,706 | 0 | 0 | 0 | 100.0% |
| 2e | 15,973,706 | 0 | 0 | 0 | 100.0% |
| 2f | 15,973,706 | 0 | 0 | 0 | 100.0% |
| 2g | 15,973,706 | 0 | 0 | 0 | 100.0% |
| Structured Large-Cap Growth Fund | |||||
| 2a | 1,026,701 | 0 | 0 | 0 | 100.0% |
| 2b | 1,026,701 | 0 | 0 | 0 | 100.0% |
| 2c | 1,026,701 | 0 | 0 | 0 | 100.0% |
| 2d | 1,026,701 | 0 | 0 | 0 | 100.0% |
| 2e | 1,026,701 | 0 | 0 | 0 | 100.0% |
| 2f | 1,026,701 | 0 | 0 | 0 | 100.0% |
| 2g | 1,026,701 | 0 | 0 | 0 | 100.0% |
| Structured Large-Cap Value Fund | |||||
| 2a | 1,370,426 | 0 | 0 | 0 | 100.0% |
| 2b | 1,370,426 | 0 | 0 | 0 | 100.0% |
| 2c | 1,370,426 | 0 | 0 | 0 | 100.0% |
| 2d | 1,370,426 | 0 | 0 | 0 | 100.0% |
| 2e | 1,370,426 | 0 | 0 | 0 | 100.0% |
| 2f | 1,370,426 | 0 | 0 | 0 | 100.0% |
| 2g | 1,370,426 | 0 | 0 | 0 | 100.0% |
| Structured Broad Market Fund | |||||
| 2a | 7,281,035 | 0 | 0 | 0 | 100.0% |
| 2b | 7,281,035 | 0 | 0 | 0 | 100.0% |
| 2c | 7,281,035 | 0 | 0 | 0 | 100.0% |
| 2d | 7,281,035 | 0 | 0 | 0 | 100.0% |
| 2e | 7,281,035 | 0 | 0 | 0 | 100.0% |
| 2f | 7,281,035 | 0 | 0 | 0 | 100.0% |
| 2g | 7,281,035 | 0 | 0 | 0 | 100.0% |
10
Structured Large-Cap Equity Fund
Fund Profile
As of September 30, 2009
| Portfolio Characteristics | |||
| Comparative | Broad | ||
| Fund | Index1 | Index2 | |
| Number of Stocks | 207 | 500 | 4,324 |
| Median Market Cap | $44.6B | $41.5B | $29.0B |
| Price/Earnings Ratio | 19.3x | 23.5x | 27.9x |
| Price/Book Ratio | 2.5x | 2.2x | 2.1x |
| Yield3 | 2.0% | 1.9% | |
| Institutional Shares | 1.8% | ||
| Institutional | |||
| Plus Shares | 1.9% | ||
| Return on Equity | 21.2% | 20.6% | 19.1% |
| Earnings Growth Rate | 13.3% | 9.8% | 9.6% |
| Foreign Holdings | 0.0% | 0.0% | 0.0% |
| Turnover Rate | 80% | — | — |
| Expense Ratio4 | — | — | |
| Institutional Shares | 0.25% | ||
| Institutional | |||
| Plus Shares | 0.17% | ||
| Short-Term Reserves5 | –0.2% | — | — |
| Sector Diversification (% of equity exposure) | |||
| Comparative | Broad | ||
| Fund | Index1 | Index2 | |
| Consumer Discretionary | 10.2% | 9.1% | 10.1% |
| Consumer Staples | 10.7 | 11.5 | 9.9 |
| Energy | 12.2 | 11.7 | 11.0 |
| Financials | 15.1 | 15.2 | 16.7 |
| Health Care | 12.3 | 13.1 | 12.9 |
| Industrials | 11.1 | 10.3 | 10.6 |
| Information Technology | 18.2 | 18.7 | 18.2 |
| Materials | 3.6 | 3.5 | 3.9 |
| Telecommunication | |||
| Services | 3.3 | 3.2 | 2.9 |
| Utilities | 3.3 | 3.7 | 3.8 |
| Volatility Measures6 | ||
| Fund Versus | Fund Versus | |
| Comparative Index1 | Broad Index2 | |
| R-Squared | 1.00 | 0.99 |
| Beta | 0.99 | 0.96 |
| Ten Largest Holdings7 (% of total net assets) | ||
| Exxon Mobil Corp. | integrated oil | |
| and gas | 4.1% | |
| Apple Inc. | computer hardware | 2.3 |
| AT&T Inc. | integrated | |
| telecommunication | ||
| services | 2.3 | |
| International Business | ||
| Machines Corp. | computer hardware | 2.3 |
| Chevron Corp. | integrated oil | |
| and gas | 2.0 | |
| Google Inc. Class A | Internet software | |
| and services | 1.8 | |
| Hewlett-Packard Co. | computer hardware | 1.8 |
| Johnson & Johnson | pharmaceuticals | 1.8 |
| Procter & Gamble Co. | household products | 1.7 |
| Intel Corp. | semiconductors | 1.7 |
| Top Ten | 21.8% | |
Investment Focus
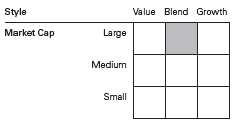
1 S&P 500 Index.
2 Dow Jones U.S. Total Stock Market Index.
3 30-day SEC yield for the fund; annualized dividend yield for the indexes. See the Glossary.
4 The expense ratios shown are from the prospectus dated January 23, 2009, and represent estimated costs for the current fiscal year based
on the fund’s net assets as of the prospectus date. For the fiscal year ended September 30, 2009, the expense ratios were 0.25% for the
Institutional Shares and 0.17% for the Institutional Plus Shares.
5 The fund invested a portion of its cash reserves in equity markets through the use of index futures contracts. After the effect of the futures
investments, the fund’s temporary cash position was negative.
6 For an explanation of R-squared, beta, and other terms used here, see the Glossary.
7 The holdings listed exclude any temporary cash investments and equity index products.
11
Structured Large-Cap Equity Fund
Performance Summary
All of the returns in this report represent past performance, which is not a guarantee of future results that may be achieved by the fund. (Current performance may be lower or higher than the performance data cited. For performance data current to the most recent month-end, visit our website at www.vanguard.com/performance.) Note, too, that both investment returns and principal value can fluctuate widely, so an investor’s shares, when sold, could be worth more or less than their original cost. The returns shown do not reflect taxes that a shareholder would pay on fund distributions or on the sale of fund shares.
Cumulative Performance: May 15, 2006–September 30, 2009
Initial Investment of $200,000,000

| Average Annual Total Returns | |||
| Periods Ended September 30, 2009 | Final Value of a | ||
| Since | $200,000,000 | ||
| One Year | Inception1 | Investment | |
| Structured Large-Cap Equity Fund | |||
| Institutional Plus Shares | –10.16% | –4.96% | $168,397,127 |
| Dow Jones U.S. Total Stock Market Index | –5.83 | –3.33 | 178,377,806 |
| S&P 500 Index | –6.91 | –3.75 | 175,795,290 |
| Large-Cap Core Funds Average2 | –5.85 | –4.06 | 173,881,160 |
| Final Value of a | |||
| Since | $5,000,000 | ||
| One Year | Inception1 | Investment | |
| Structured Large-Cap Equity Fund | |||
| Institutional Shares | –10.25% | –5.01% | $4,203,808 |
| Dow Jones U.S. Total Stock Market Index | –5.83 | –3.29 | 4,465,447 |
| S&P 500 Index | –6.91 | –3.70 | 4,403,059 |
1 Performance for the fund and its comparative standards is calculated since the following inception dates: May 15, 2006, for Institutional
Plus Shares; May 16, 2006, for Institutional Shares.
2 Derived from data provided by Lipper Inc.
12
Structured Large-Cap Equity Fund
Fiscal-Year Total Returns (%): May 15, 2006–September 30, 2009

Note: See Financial Highlights tables for dividend and capital gains information.
13
Structured Large-Cap Equity Fund
Financial Statements
Statement of Net Assets
As of September 30, 2009
The fund reports a complete list of its holdings in regulatory filings four times in each fiscal year, at the quarter-ends. For the second and fourth fiscal quarters, the lists appear in the fund’s semiannual and annual reports to shareholders. For the first and third fiscal quarters, the fund files the lists with the Securities and Exchange Commission on Form N-Q. Shareholders can look up the fund’s Forms N-Q on the SEC’s website at www.sec.gov. Forms N-Q may also be reviewed and copied at the SEC’s Public Reference Room (see the back cover of this report for further information).
| Market | |||
| Value• | |||
| Shares | ($000) | ||
| Common Stocks (99.7%)1 | |||
| Consumer Discretionary (10.1%) | |||
| * | Ford Motor Co. | 606,006 | 4,369 |
| McDonald’s Corp. | 74,897 | 4,274 | |
| Comcast Corp. Class A | 238,685 | 4,031 | |
| Gap Inc. | 180,722 | 3,867 | |
| Home Depot Inc. | 141,300 | 3,764 | |
| Omnicom Group Inc. | 98,413 | 3,635 | |
| Wyndham Worldwide Corp. | 216,940 | 3,541 | |
| Time Warner Cable Inc. | 63,500 | 2,736 | |
| Gannett Co. Inc. | 193,300 | 2,418 | |
| RadioShack Corp. | 137,459 | 2,278 | |
| Comcast Corp. | 134,800 | 2,168 | |
| Limited Brands Inc. | 126,993 | 2,158 | |
| * | AutoZone Inc. | 14,604 | 2,135 |
| * | Apollo Group Inc. Class A | 26,054 | 1,919 |
| DR Horton Inc. | 141,600 | 1,616 | |
| Newell Rubbermaid Inc. | 86,900 | 1,364 | |
| * | DIRECTV Group Inc. | 44,900 | 1,238 |
| TJX Cos. Inc. | 30,916 | 1,149 | |
| Target Corp. | 24,400 | 1,139 | |
| NIKE Inc. Class B | 16,963 | 1,098 | |
| McGraw-Hill Cos. Inc. | 40,500 | 1,018 | |
| News Corp. Class A | 80,640 | 967 | |
| * | Starbucks Corp. | 41,700 | 861 |
| Yum! Brands Inc. | 25,075 | 847 | |
| * | Big Lots Inc. | 33,100 | 828 |
| Darden Restaurants Inc. | 20,200 | 689 | |
| H&R Block Inc. | 32,530 | 598 | |
| Whirlpool Corp. | 5,358 | 375 | |
| Pulte Homes Inc. | 24,955 | 274 | |
| Walt Disney Co. | 9,829 | 270 | |
| Family Dollar Stores Inc. | 8,390 | 222 | |
| Mattel Inc. | 8,600 | 159 | |
| Sherwin-Williams Co. | 900 | 54 | |
| Leggett & Platt Inc. | 2,700 | 52 | |
| 58,111 | |||
| Consumer Staples (10.7%) | |||
| Procter & Gamble Co. | 169,294 | 9,805 | |
| Wal-Mart Stores Inc. | 193,096 | 9,479 | |
| Market | |||
| Value• | |||
| Shares | ($000) | ||
| Philip Morris | |||
| International Inc. | 176,036 | 8,580 | |
| Coca-Cola Co. | 80,140 | 4,303 | |
| Archer-Daniels-Midland Co. | 103,240 | 3,017 | |
| PepsiCo Inc. | 46,692 | 2,739 | |
| Kellogg Co. | 53,500 | 2,634 | |
| CVS Caremark Corp. | 72,833 | 2,603 | |
| Sysco Corp. | 102,289 | 2,542 | |
| ConAgra Foods Inc. | 112,038 | 2,429 | |
| Coca-Cola Enterprises Inc. | 105,900 | 2,267 | |
| Kimberly-Clark Corp. | 32,844 | 1,937 | |
| * | Dr Pepper Snapple Group Inc. | 64,800 | 1,863 |
| Campbell Soup Co. | 49,258 | 1,607 | |
| General Mills Inc. | 20,083 | 1,293 | |
| Clorox Co. | 21,000 | 1,235 | |
| HJ Heinz Co. | 27,789 | 1,105 | |
| Lorillard Inc. | 7,500 | 557 | |
| Hershey Co. | 11,341 | 441 | |
| Molson Coors Brewing Co. | |||
| Class B | 7,370 | 359 | |
| Colgate-Palmolive Co. | 3,600 | 274 | |
| Pepsi Bottling Group Inc. | 2,900 | 106 | |
| 61,175 | |||
| Energy (12.2%) | |||
| Exxon Mobil Corp. | 342,439 | 23,495 | |
| Chevron Corp. | 164,456 | 11,583 | |
| Apache Corp. | 51,546 | 4,733 | |
| Anadarko Petroleum Corp. | 71,492 | 4,485 | |
| Peabody Energy Corp. | 97,802 | 3,640 | |
| Consol Energy Inc. | 77,300 | 3,487 | |
| ConocoPhillips | 72,159 | 3,259 | |
| Occidental Petroleum Corp. | 39,951 | 3,132 | |
| Murphy Oil Corp. | 41,385 | 2,383 | |
| * | Cameron International Corp. | 54,900 | 2,076 |
| * | FMC Technologies Inc. | 38,700 | 2,022 |
| Schlumberger Ltd. | 29,955 | 1,785 | |
| ENSCO International Inc. | 40,309 | 1,715 | |
| Marathon Oil Corp. | 24,900 | 794 | |
| El Paso Corp. | 64,050 | 661 | |
| Rowan Cos. Inc. | 11,700 | 270 | |
| * | National Oilwell Varco Inc. | 5,754 | 248 |
14
| Structured Large-Cap Equity Fund | |||
| Market | |||
| Value• | |||
| Shares | ($000) | ||
| Diamond Offshore | |||
| Drilling Inc. | 900 | 86 | |
| 69,854 | |||
| Financials (15.0%) | |||
| Goldman Sachs Group Inc. | 48,998 | 9,033 | |
| Wells Fargo & Co. | 298,615 | 8,415 | |
| JPMorgan Chase & Co. | 177,079 | 7,760 | |
| Bank of America Corp. | 350,253 | 5,926 | |
| US Bancorp | 245,924 | 5,376 | |
| State Street Corp. | 90,034 | 4,736 | |
| Bank of New York | |||
| Mellon Corp. | 142,475 | 4,130 | |
| Chubb Corp. | 80,843 | 4,075 | |
| Aflac Inc. | 93,394 | 3,992 | |
| Franklin Resources Inc. | 37,926 | 3,815 | |
| American Express Co. | 92,285 | 3,129 | |
| Northern Trust Corp. | 53,717 | 3,124 | |
| Unum Group | 144,713 | 3,103 | |
| Travelers Cos. Inc. | 61,068 | 3,006 | |
| Citigroup Inc. | 437,456 | 2,117 | |
| Hudson City Bancorp Inc. | 153,201 | 2,015 | |
| Moody’s Corp. | 91,100 | 1,864 | |
| Simon Property Group Inc. | 25,361 | 1,761 | |
| BB&T Corp. | 52,837 | 1,439 | |
| Charles Schwab Corp. | 73,196 | 1,402 | |
| Public Storage | 15,129 | 1,138 | |
| Host Hotels & Resorts Inc. | 86,329 | 1,016 | |
| Torchmark Corp. | 20,295 | 881 | |
| * | MBIA Inc. | 101,000 | 784 |
| Morgan Stanley | 18,363 | 567 | |
| HCP Inc. | 17,163 | 493 | |
| * | CB Richard Ellis Group Inc. | ||
| Class A | 31,200 | 366 | |
| * | Progressive Corp. | 16,400 | 272 |
| Federated Investors Inc. | |||
| Class B | 7,890 | 208 | |
| Vornado Realty Trust | 1,175 | 76 | |
| Plum Creek Timber Co. Inc. | 2,100 | 64 | |
| PNC Financial Services | |||
| Group Inc. | 1,200 | 58 | |
| Boston Properties Inc. | 700 | 46 | |
| Health Care REIT Inc. | 400 | 17 | |
| 86,204 | |||
| Health Care (12.3%) | |||
| Johnson & Johnson | 165,346 | 10,068 | |
| * | Amgen Inc. | 108,213 | 6,518 |
| Bristol-Myers Squibb Co. | 252,031 | 5,676 | |
| Pfizer Inc. | 333,145 | 5,513 | |
| * | Medco Health Solutions Inc. | 79,766 | 4,412 |
| UnitedHealth Group Inc. | 152,274 | 3,813 | |
| Abbott Laboratories | 65,068 | 3,219 | |
| AmerisourceBergen Corp. | |||
| Class A | 140,698 | 3,149 | |
| * | Mylan Inc. | 182,800 | 2,927 |
| Quest Diagnostics Inc. | 55,698 | 2,907 | |
| Schering-Plough Corp. | 100,100 | 2,828 | |
| Market | |||
| Value• | |||
| Shares | ($000) | ||
| Wyeth | 56,203 | 2,730 | |
| McKesson Corp. | 44,800 | 2,668 | |
| Baxter International Inc. | 43,818 | 2,498 | |
| * | Biogen Idec Inc. | 45,985 | 2,323 |
| Eli Lilly & Co. | 58,687 | 1,938 | |
| Merck & Co. Inc. | 57,867 | 1,830 | |
| * | Watson Pharmaceuticals Inc. | 38,041 | 1,394 |
| * | WellPoint Inc. | 29,384 | 1,392 |
| * | Cephalon Inc. | 14,505 | 845 |
| * | Millipore Corp. | 11,900 | 837 |
| * | Forest Laboratories Inc. | 22,100 | 650 |
| * | Hospira Inc. | 5,500 | 245 |
| * | Tenet Healthcare Corp. | 20,500 | 120 |
| 70,500 | |||
| Industrials (11.1%) | |||
| General Electric Co. | 570,322 | 9,365 | |
| United Parcel Service Inc. | |||
| Class B | 110,921 | 6,264 | |
| Union Pacific Corp. | 83,704 | 4,884 | |
| General Dynamics Corp. | 68,437 | 4,421 | |
| Lockheed Martin Corp. | 51,438 | 4,016 | |
| Flowserve Corp. | 37,474 | 3,693 | |
| Dover Corp. | 91,158 | 3,533 | |
| Goodrich Corp. | 64,345 | 3,497 | |
| United Technologies Corp. | 53,536 | 3,262 | |
| Northrop Grumman Corp. | 57,316 | 2,966 | |
| Fluor Corp. | 52,560 | 2,673 | |
| 3M Co. | 32,513 | 2,399 | |
| Honeywell International Inc. | 53,783 | 1,998 | |
| Waste Management Inc. | 63,430 | 1,892 | |
| Raytheon Co. | 34,627 | 1,661 | |
| L-3 Communications | |||
| Holdings Inc. | 19,487 | 1,565 | |
| CSX Corp. | 30,618 | 1,282 | |
| RR Donnelley & Sons Co. | 56,800 | 1,208 | |
| Burlington Northern | |||
| Santa Fe Corp. | 10,877 | 868 | |
| Pitney Bowes Inc. | 31,000 | 770 | |
| * | Jacobs Engineering | ||
| Group Inc. | 12,300 | 565 | |
| ITT Corp. | 9,800 | 511 | |
| Expeditors International | |||
| of Washington Inc. | 10,309 | 362 | |
| 63,655 | |||
| Information Technology (18.1%) | |||
| * | Apple Inc. | 71,042 | 13,169 |
| International Business | |||
| Machines Corp. | 107,840 | 12,899 | |
| * | Google Inc. Class A | 21,155 | 10,490 |
| Hewlett-Packard Co. | 217,700 | 10,278 | |
| Intel Corp. | 494,453 | 9,676 | |
| Microsoft Corp. | 360,641 | 9,337 | |
| Oracle Corp. | 375,688 | 7,829 | |
| * | Cisco Systems Inc. | 325,015 | 7,651 |
| * | Computer Sciences Corp. | 67,698 | 3,568 |
| Analog Devices Inc. | 87,299 | 2,408 | |
15
| Structured Large-Cap Equity Fund | |||
| Market | |||
| Value• | |||
| Shares | ($000) | ||
| Xilinx Inc. | 99,853 | 2,339 | |
| * | Symantec Corp. | 140,607 | 2,316 |
| Automatic Data | |||
| Processing Inc. | 52,988 | 2,082 | |
| QUALCOMM Inc. | 37,057 | 1,667 | |
| * | LSI Corp. | 301,900 | 1,657 |
| * | Western Digital Corp. | 40,400 | 1,476 |
| * | EMC Corp. | 77,907 | 1,328 |
| Texas Instruments Inc. | 46,568 | 1,103 | |
| * | Micron Technology Inc. | 81,700 | 670 |
| CA Inc. | 23,663 | 520 | |
| * | Teradata Corp. | 15,639 | 430 |
| * | Affiliated Computer | ||
| Services Inc. Class A | 5,926 | 321 | |
| * | QLogic Corp. | 13,564 | 233 |
| Xerox Corp. | 18,700 | 145 | |
| * | Tellabs Inc. | 15,400 | 107 |
| Fidelity National Information | |||
| Services Inc. | 2,400 | 61 | |
| 103,760 | |||
| Materials (3.6%) | |||
| EI Du Pont de | |||
| Nemours & Co. | 148,253 | 4,765 | |
| Freeport-McMoRan Copper | |||
| & Gold Inc. | 66,900 | 4,590 | |
| Praxair Inc. | 51,087 | 4,173 | |
| * | Pactiv Corp. | 70,400 | 1,834 |
| Newmont Mining Corp. | 41,500 | 1,827 | |
| Monsanto Co. | 16,961 | 1,313 | |
| Ball Corp. | 19,400 | 954 | |
| United States Steel Corp. | 20,462 | 908 | |
| Bemis Co. Inc. | 4,200 | 109 | |
| 20,473 | |||
| Telecommunication Services (3.3%) | |||
| AT&T Inc. | 480,735 | 12,985 | |
| Verizon Communications Inc. | 77,496 | 2,346 | |
| * | American Tower Corp. | ||
| Class A | 40,222 | 1,464 | |
| Qwest Communications | |||
| International Inc. | 294,600 | 1,122 | |
| Windstream Corp. | 65,006 | 659 | |
| CenturyTel Inc. | 12,180 | 409 | |
| * | Sprint Nextel Corp. | 22,300 | 88 |
| 19,073 | |||
| Utilities (3.3%) | |||
| Dominion Resources Inc. | 122,000 | 4,209 | |
| Public Service Enterprise | |||
| Group Inc. | 122,600 | 3,855 | |
| Exelon Corp. | 54,400 | 2,699 | |
| FirstEnergy Corp. | 52,200 | 2,387 | |
| Market | ||
| Value• | ||
| Shares | ($000) | |
| American Electric | ||
| Power Co. Inc. | 72,324 | 2,241 |
| FPL Group Inc. | 27,808 | 1,536 |
| CMS Energy Corp. | 73,438 | 984 |
| NiSource Inc. | 25,500 | 354 |
| Sempra Energy | 6,713 | 334 |
| * AES Corp. | 5,741 | 85 |
| 18,684 | ||
| Total Common Stocks | ||
| (Cost $554,943) | 571,489 | |
| Face | ||
| Amount | ||
| ($000) | ||
| Temporary Cash Investment (0.1%)1 | ||
| U.S. Government and Agency Obligations (0.1%) | ||
| 2,3 Federal Home Loan | ||
| Bank Discount Notes | ||
| 0.275%, 2/19/10 | ||
| (Cost $400) | 400 | 400 |
| Total Investments (99.8%) | ||
| (Cost $555,343) | 571,889 | |
| Other Assets and Liabilities (0.2%) | ||
| Other Assets | 2,145 | |
| Liabilities | (871) | |
| 1,274 | ||
| Net Assets (100%) | 573,163 | |
16
| Structured Large-Cap Equity Fund | |
| At September 30, 2009, net assets consisted of: | |
| Amount | |
| ($000) | |
| Paid-in Capital | 831,357 |
| Undistributed Net Investment Income | 7,841 |
| Accumulated Net Realized Losses | (282,573) |
| Unrealized Appreciation (Depreciation) | |
| Investment Securities | 16,546 |
| Futures Contracts | (8) |
| Net Assets | 573,163 |
| Institutional Shares—Net Assets | |
| Applicable to 5,465,686 outstanding | |
| $.001 par value shares of beneficial | |
| interest (unlimited authorization) | 106,417 |
| Net Asset Value Per Share— | |
| Institutional Shares | $19.47 |
| Institutional Plus Shares—Net Assets | |
| Applicable to 11,978,076 outstanding | |
| $.001 par value shares of beneficial | |
| interest (unlimited authorization) | 466,746 |
| Net Asset Value Per Share— | |
| Institutional Plus Shares | $38.97 |
• See Note A in Notes to Financial Statements.
* Non-income-producing security.
1 The fund invests a portion of its cash reserves in equity markets through the use of index futures contracts. After giving effect to futures
investments, the fund’s effective common stock and temporary cash investment positions represent 100.0% and –0.2%, respectively, of
net assets.
2 The issuer operates under a congressional charter; its securities are not backed by the full faith and credit of the U.S. government.
3 Securities with a value of $400,000 have been segregated as initial margin for open futures contracts.
REIT—Real Estate Investment Trust.
See accompanying Notes, which are an integral part of the Financial Statements.
17
| Structured Large-Cap Equity Fund | |
| Statement of Operations | |
| Year Ended | |
| September 30, 2009 | |
| ($000) | |
| Investment Income | |
| Income | |
| Dividends | 13,270 |
| Interest1 | 35 |
| Security Lending | 124 |
| Total Income | 13,429 |
| Expenses | |
| The Vanguard Group—Note B | |
| Investment Advisory Services | 352 |
| Management and Administrative—Institutional Shares | 134 |
| Management and Administrative—Institutional Plus Shares | 269 |
| Marketing and Distribution—Institutional Shares | 29 |
| Marketing and Distribution—Institutional Plus Shares | 120 |
| Custodian Fees | 19 |
| Auditing Fees | 25 |
| Shareholders’ Reports and Proxies—Institutional Shares | 4 |
| Shareholders’ Reports and Proxies—Institutional Plus Shares | 2 |
| Trustees’ Fees and Expenses | 1 |
| Total Expenses | 955 |
| Net Investment Income | 12,474 |
| Realized Net Gain (Loss) | |
| Investment Securities Sold | (239,514) |
| Futures Contracts | (2,547) |
| Realized Net Gain (Loss) | (242,061) |
| Change in Unrealized Appreciation (Depreciation) | |
| Investment Securities | 118,017 |
| Futures Contracts | 428 |
| Change in Unrealized Appreciation (Depreciation) | 118,445 |
| Net Increase (Decrease) in Net Assets Resulting from Operations | (111,142) |
| 1 Interest income from an affiliated company of the fund was $25,000. | |
See accompanying Notes, which are an integral part of the Financial Statements.
18
| Structured Large-Cap Equity Fund | ||
| Statement of Changes in Net Assets | ||
| Year Ended September 30, | ||
| 2009 | 2008 | |
| ($000) | ($000) | |
| Increase (Decrease) in Net Assets | ||
| Operations | ||
| Net Investment Income | 12,474 | 18,118 |
| Realized Net Gain (Loss) | (242,061) | (55,634) |
| Change in Unrealized Appreciation (Depreciation) | 118,445 | (192,095) |
| Net Increase (Decrease) in Net Assets Resulting from Operations | (111,142) | (229,611) |
| Distributions | ||
| Net Investment Income | ||
| Institutional Shares | (3,907) | (2,671) |
| Institutional Plus Shares | (13,919) | (12,716) |
| Realized Capital Gain1 | ||
| Institutional Shares | — | (2,428) |
| Institutional Plus Shares | — | (10,809) |
| Total Distributions | (17,826) | (28,624) |
| Capital Share Transactions | ||
| Institutional Shares | (10,600) | (5,788) |
| Institutional Plus Shares | (99,837) | 70,557 |
| Net Increase (Decrease) from Capital Share Transactions | (110,437) | 64,769 |
| Total Increase (Decrease) | (239,405) | (193,466) |
| Net Assets | ||
| Beginning of Period | 812,568 | 1,006,034 |
| End of Period2 | 573,163 | 812,568 |
1 Includes fiscal 2008 short-term gain distributions totaling $9,615,000. Short-term gain distributions are treated as ordinary income
dividends for tax purposes.
2 Net Assets—End of Period includes undistributed net investment income of $7,841,000 and $13,193,000.
See accompanying Notes, which are an integral part of the Financial Statements.
19
Structured Large-Cap Equity Fund
| Financial Highlights | ||||
| Institutional Shares | ||||
| May 16, | ||||
| 20061 to | ||||
| Year Ended September 30, | Sept. 30, | |||
| For a Share Outstanding Throughout Each Period | 2009 | 2008 | 2007 | 2006 |
| Net Asset Value, Beginning of Period | $22.56 | $29.98 | $26.03 | $24.96 |
| Investment Operations | ||||
| Net Investment Income | .546 | .492 | .4762 | .130 |
| Net Realized and Unrealized Gain (Loss) | ||||
| on Investments | (2.993) | (7.091) | 3.657 | .940 |
| Total from Investment Operations | (2.447) | (6.599) | 4.133 | 1.070 |
| Distributions | ||||
| Dividends from Net Investment Income | (.643) | (.430) | (.172) | — |
| Distributions from Realized Capital Gains | — | (.391) | (.011) | — |
| Total Distributions | (.643) | (.821) | (.183) | — |
| Net Asset Value, End of Period | $19.47 | $22.56 | $29.98 | $26.03 |
| Total Return | –10.25% | –22.52% | 15.94% | 4.29% |
| Ratios/Supplemental Data | ||||
| Net Assets, End of Period (Millions) | $106 | $135 | $187 | $127 |
| Ratio of Total Expenses to | ||||
| Average Net Assets | 0.25% | 0.20% | 0.25% | 0.25%3 |
| Ratio of Net Investment Income to | ||||
| Average Net Assets | 2.33% | 1.91% | 1.69% | 1.67%3 |
| Portfolio Turnover Rate | 80%4 | 72% | 54%4 | 30% |
1 Inception.
2 Calculated based on average shares outstanding.
3 Annualized.
4 Excludes the value of portfolio securities received or delivered as a result of in-kind purchases or redemptions of the fund’s capital shares.
See accompanying Notes, which are an integral part of the Financial Statements.
20
Structured Large-Cap Equity Fund
| Financial Highlights | ||||
| Institutional Plus Shares | ||||
| May 15, | ||||
| 20061 to | ||||
| Year Ended September 30, | Sept. 30, | |||
| For a Share Outstanding Throughout Each Period | 2009 | 2008 | 2007 | 2006 |
| Net Asset Value, Beginning of Period | $45.15 | $60.02 | $52.07 | $50.00 |
| Investment Operations | ||||
| Net Investment Income | 1.116 | 1.025 | 1.0182 | .250 |
| Net Realized and Unrealized Gain (Loss) | ||||
| on Investments | (5.980) | (14.193) | 7.317 | 1.820 |
| Total from Investment Operations | (4.864) | (13.168) | 8.335 | 2.070 |
| Distributions | ||||
| Dividends from Net Investment Income | (1.316) | (.920) | (.363) | — |
| Distributions from Realized Capital Gains | — | (.782) | (.022) | — |
| Total Distributions | (1.316) | (1.702) | (.385) | — |
| Net Asset Value, End of Period | $38.97 | $45.15 | $60.02 | $52.07 |
| Total Return | –10.16% | –22.46% | 16.07% | 4.14% |
| Ratios/Supplemental Data | ||||
| Net Assets, End of Period (Millions) | $467 | $677 | $819 | $203 |
| Ratio of Total Expenses to | ||||
| Average Net Assets | 0.17% | 0.12% | 0.15% | 0.15%3 |
| Ratio of Net Investment Income to | ||||
| Average Net Assets | 2.41% | 1.99% | 1.79% | 1.77%3 |
| Portfolio Turnover Rate | 80%4 | 72% | 54%4 | 30% |
1 Inception.
2 Calculated based on average shares outstanding.
3 Annualized.
4 Excludes the value of portfolio securities received or delivered as a result of in-kind purchases or redemptions of the fund’s capital shares.
See accompanying Notes, which are an integral part of the Financial Statements.
21
Structured Large-Cap Equity Fund
Notes to Financial Statements
Vanguard Structured Large-Cap Equity Fund is registered under the Investment Company Act of 1940 as an open-end investment company, or mutual fund. The fund offers two classes of shares: Institutional Shares and Institutional Plus Shares. Institutional Shares are available to investors who invest a minimum of $5 million. Institutional Plus Shares are available to investors who invest a minimum of $200 million ($100 million for investors with total Vanguard investments of at least $1 billion).
A. The following significant accounting policies conform to generally accepted accounting principles for U.S. mutual funds. The fund consistently follows such policies in preparing its financial statements.
1. Security Valuation: Securities are valued as of the close of trading on the New York Stock Exchange (generally 4 p.m., Eastern time) on the valuation date. Equity securities are valued at the latest quoted sales prices or official closing prices taken from the primary market in which each security trades; such securities not traded on the valuation date are valued at the mean of the latest quoted bid and asked prices. Securities for which market quotations are not readily available, or whose values have been materially affected by events occurring before the fund’s pricing time but after the close of the securities’ primary markets, are valued by methods deemed by the board of trustees to represent fair value. Investments in Vanguard Market Liquidity Fund are valued at that fund’s net asset value. Temporary cash investments acquired over 60 days to maturity are valued using the latest bid pr ices or using valuations based on a matrix system (which considers such factors as security prices, yields, maturities, and ratings), both as furnished by independent pricing services. Other temporary cash investments are valued at amortized cost, which approximates market value.
2. Futures Contracts: The fund uses index futures contracts to a limited extent, with the objective of maintaining full exposure to the stock market while maintaining liquidity. The fund may purchase or sell futures contracts to achieve a desired level of investment, whether to accommodate portfolio turnover or cash flows from capital share transactions. The primary risks associated with the use of futures contracts are imperfect correlation between changes in market values of stocks held by the fund and the prices of futures contracts, and the possibility of an illiquid market.
Futures contracts are valued at their quoted daily settlement prices. The aggregate principal amounts of the contracts are not recorded in the Statement of Net Assets. Fluctuations in the value of the contracts are recorded in the Statement of Net Assets as an asset (liability) and in the Statement of Operations as unrealized appreciation (depreciation) until the contracts are closed, when they are recorded as realized futures gains (losses).
3. Federal Income Taxes: The fund intends to continue to qualify as a regulated investment company and distribute all of its taxable income. Management has analyzed the fund’s tax positions taken for all open federal income tax years (September 30, 2006–2009), and has concluded that no provision for federal income tax is required in the fund’s financial statements.
4. Distributions: Distributions to shareholders are recorded on the ex-dividend date.
5. Security Lending: The fund may lend its securities to qualified institutional borrowers to earn additional income. Security loans are required to be secured at all times by collateral at least equal to the market value of securities loaned. The fund invests cash collateral received in Vanguard Market Liquidity Fund, and records a liability for the return of the collateral, during the period the securities are on loan. Security lending income represents the income earned on investing cash collateral, less expenses associated with the loan.
22
Structured Large-Cap Equity Fund
6. Other: Dividend income is recorded on the ex-dividend date. Interest income includes income distributions received from Vanguard Market Liquidity Fund and is accrued daily. Security transactions are accounted for on the date securities are bought or sold. Costs used to determine realized gains (losses) on the sale of investment securities are those of the specific securities sold.
Each class of shares has equal rights as to assets and earnings, except that each class separately bears certain class-specific expenses related to maintenance of shareholder accounts (included in Management and Administrative expenses), shareholder reporting, and proxies. Marketing and distribution expenses are allocated to each class of shares based on a method approved by the board of trustees. Income, other non-class-specific expenses, and gains and losses on investments are allocated to each class of shares based on its relative net assets.
B. The Vanguard Group furnishes at cost investment advisory, corporate management, administrative, marketing, and distribution services. The costs of such services are allocated to the fund under methods approved by the board of trustees. The fund has committed to provide up to 0.40% of its net assets in capital contributions to Vanguard. At September 30, 2009, the fund had contributed capital of $120,000 to Vanguard (included in Other Assets), representing 0.02% of the fund’s net assets and 0.05% of Vanguard’s capitalization. The fund’s trustees and officers are also directors and officers of Vanguard.
C. Various inputs may be used to determine the value of the fund’s investments. These inputs are summarized in three broad levels for financial statement purposes. The inputs or methodologies used to value securities are not necessarily an indication of the risk associated with investing in those securities.
Level 1—Quoted prices in active markets for identical securities.
Level 2—Other significant observable inputs (including quoted prices for similar securities, interest rates, prepayment speeds, credit risk, etc.).
Level 3—Significant unobservable inputs (including the fund’s own assumptions used to determine the fair value of investments).
The following table summarizes the fund’s investments as of September 30, 2009, based on the inputs used to value them:
| Level 1 | Level 2 | Level 3 | |
| Investments | ($000) | ($000) | ($000) |
| Common Stocks | 571,489 | — | — |
| Temporary Cash Investments | — | 400 | — |
| Futures Contracts—Liabilities1 | (3) | — | — |
| Total | 571,486 | 400 | — |
| 1 Represents variation margin on the last day of the reporting period. |
23
Structured Large-Cap Equity Fund
D. At September 30, 2009, the aggregate settlement value of open futures contracts and the related unrealized appreciation (depreciation) were:
| ($000) | ||||
| Number of | Aggregate | Unrealized | ||
| Long (Short) | Settlement | Appreciation | ||
| Futures Contracts | Expiration | Contracts | Value | (Depreciation) |
| E-mini S&P 500 Index | December 2009 | 30 | 1,579 | (8) |
Unrealized appreciation (depreciation) on open futures contracts is required to be treated as realized gain (loss) for tax purposes.
E. Distributions are determined on a tax basis and may differ from net investment income and realized capital gains for financial reporting purposes. Differences may be permanent or temporary. Permanent differences are reclassified among capital accounts in the financial statements to reflect their tax character. Temporary differences arise when certain items of income, expense, gain, or loss are recognized in different periods for financial statement and tax purposes; these differences will reverse at some time in the future. Differences in classification may also result from the treatment of short-term gains as ordinary income for tax purposes.
During the year ended September 30, 2009, the fund realized $20,147,000 of net capital losses resulting from in-kind redemptions—in which shareholders exchanged fund shares for securities held by the fund rather than for cash. Because such losses are not taxable losses to the fund, they have been reclassified from accumulated net realized losses to paid-in capital.
For tax purposes, at September 30, 2009, the fund had $8,385,000 of ordinary income available for distribution. The fund had available capital loss carryforwards totaling $163,235,000 to offset future net capital gains through September 30, 2017. In addition, the fund realized losses of $119,350,000 during the period from November 1, 2008, through September 30, 2009, which are deferred and will be treated as realized for tax purposes in fiscal 2010.
At September 30, 2009, the cost of investment securities for tax purposes was $555,348,000. Net unrealized appreciation of investment securities for tax purposes was $16,541,000, consisting of unrealized gains of $57,736,000 on securities that had risen in value since their purchase and $41,195,000 in unrealized losses on securities that had fallen in value since their purchase.
F. During the year ended September 30, 2009, the fund purchased $466,548,000 of investment securities and sold $575,916,000 of investment securities, other than temporary cash investments.
24
Structured Large-Cap Equity Fund
| G. | Capital share transactions for each class of shares were: |
| Year Ended September 30, | ||||
| 2009 | 2008 | |||
| Amount | Shares | Amount | Shares | |
| ($000) | (000) | ($000) | (000) | |
| Institutional Shares | ||||
| Issued | 4,395 | 272 | 2,581 | 99 |
| Issued in Lieu of Cash Distributions | 1,002 | 62 | 958 | 35 |
| Redeemed | (15,997) | (874) | (9,327) | (359) |
| Net Increase (Decrease)—Institutional Shares | (10,600) | (540) | (5,788) | (225) |
| Institutional Plus Shares | ||||
| Issued | 41,945 | 1,312 | 53,067 | 1,029 |
| Issued in Lieu of Cash Distributions | 7,918 | 246 | 17,490 | 316 |
| Redeemed | (149,700) | (4,575) | — | — |
| Net Increase (Decrease)—Institutional Plus Shares | (99,837) | (3,017) | 70,557 | 1,345 |
H. In preparing the financial statements as of September 30, 2009, management considered the impact of subsequent events occurring through November 10, 2009, for potential recognition or disclosure in these financial statements.
25
Structured Large-Cap Growth Fund
Fund Profile
As of September 30, 2009
| Portfolio Characteristics | |||
| Comparative | Broad | ||
| Fund | Index1 | Index2 | |
| Number of Stocks | 192 | 624 | 4,324 |
| Median Market Cap | $34.5B | $37.2B | $29.0B |
| Price/Earnings Ratio | 17.9x | 22.0x | 27.9x |
| Price/Book Ratio | 3.7x | 3.6x | 2.1x |
| Yield3 | 1.6% | 1.9% | |
| Institutional Shares | 1.4% | ||
| Institutional | |||
| Plus Shares | 1.5% | ||
| Return on Equity | 23.9% | 23.5% | 19.1% |
| Earnings Growth Rate | 18.2% | 16.6% | 9.6% |
| Foreign Holdings | 0.6% | 0.0% | 0.0% |
| Turnover Rate | 66% | — | — |
| Expense Ratio4 | — | — | |
| Institutional Shares | 0.25% | ||
| Institutional | |||
| Plus Shares | 0.17% | ||
| Short-Term Reserves | 0.0% | — | — |
| Sector Diversification (% of equity exposure) | |||
| Comparative | Broad | ||
| Fund | Index1 | Index2 | |
| Consumer Discretionary | 10.8% | 10.4% | 10.1% |
| Consumer Staples | 15.0 | 16.0 | 9.9 |
| Energy | 4.7 | 4.2 | 11.0 |
| Financials | 5.4 | 5.2 | 16.7 |
| Health Care | 16.0 | 16.7 | 12.9 |
| Industrials | 10.9 | 10.2 | 10.6 |
| Information Technology | 31.3 | 31.7 | 18.2 |
| Materials | 4.4 | 4.0 | 3.9 |
| Telecommunication | |||
| Services | 0.2 | 0.6 | 2.9 |
| Utilities | 1.3 | 1.0 | 3.8 |
| Volatility Measures5 | ||
| Fund Versus | Fund Versus | |
| Comparative Index1 | Broad Index2 | |
| R-Squared | 1.00 | 0.96 |
| Beta | 0.99 | 0.95 |
| Ten Largest Holdings6 (% of total net assets) | ||
| Apple Inc. | computer hardware | 3.7% |
| International Business | ||
| Machines Corp. | computer hardware | 3.5 |
| Microsoft Corp. | systems software | 3.3 |
| Johnson & Johnson | pharmaceuticals | 3.0 |
| Google Inc. Class A | Internet software | |
| and services | 2.8 | |
| Wal-Mart Stores Inc. | hypermarkets and | |
| super centers | 2.6 | |
| Philip Morris | ||
| International Inc. | tobacco | 2.3 |
| Hewlett-Packard Co. | computer hardware | 2.2 |
| Cisco Systems Inc. | communications | |
| equipment | 2.1 | |
| Oracle Corp. | systems software | 2.0 |
| Top Ten | 27.5% | |
Investment Focus
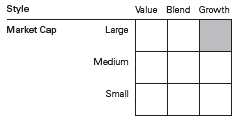
1 Russell 1000 Growth Index.
2 Dow Jones U.S. Total Stock Market Index.
3 30-day SEC yield for the fund; annualized dividend yield for the indexes. See the Glossary.
4 The expense ratios shown are from the prospectus dated January 23, 2009, and represent estimated costs for the current fiscal year based
on the fund’s net assets as of the prospectus date. For the fiscal year ended September 30, 2009, the expense ratios were 0.25% for the
Institutional Shares and 0.17% for the Institutional Plus Shares.
5 For an explanation of R-squared, beta, and other terms used here, see the Glossary.
6 The holdings listed exclude any temporary cash investments and equity index products.
26
Structured Large-Cap Growth Fund
Performance Summary
All of the returns in this report represent past performance, which is not a guarantee of future results that may be achieved by the fund. (Current performance may be lower or higher than the performance data cited. For performance data current to the most recent month-end, visit our website at www.vanguard.com/performance.) Note, too, that both investment returns and principal value can fluctuate widely, so an investor’s shares, when sold, could be worth more or less than their original cost. The returns shown do not reflect taxes that a shareholder would pay on fund distributions or on the sale of fund shares.
Cumulative Performance: January 19, 2006–September 30, 2009
Initial Investment of $200,000,000
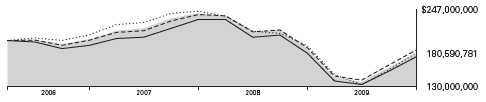
| Average Annual Total Returns | |||
| Periods Ended September 30, 2009 | Final Value of a | ||
| Since | $200,000,000 | ||
| One Year | Inception1 | Investment | |
| Structured Large-Cap Growth Fund | |||
| Institutional Plus Shares | –3.79% | –2.72% | $180,590,781 |
| Dow Jones U.S. Total Stock Market Index | –5.83 | –2.61 | 181,371,945 |
| Russell 1000 Growth Index | –1.85 | –1.97 | 185,826,374 |
| Large-Cap Growth Funds Average2 | –3.02 | –3.47 | 175,493,560 |
| Final Value of a | |||
| Since | $5,000,000 | ||
| One Year | Inception1 | Investment | |
| Structured Large-Cap Growth Fund | |||
| Institutional Shares | –3.89% | –10.83% | $3,852,989 |
| Dow Jones U.S. Total Stock Market Index | –5.83 | –11.72 | 3,765,958 |
| Russell 1000 Growth Index | –1.85 | –8.90 | 4,045,445 |
1 Performance for the fund and its comparative standards is calculated since the following inception dates: January 19, 2006, for
Institutional Plus Shares; June 22, 2007, for Institutional Shares.
2 Derived from data provided by Lipper Inc.
27
Structured Large-Cap Growth Fund
Fiscal-Year Total Returns (%): January 19, 2006–September 30, 2009
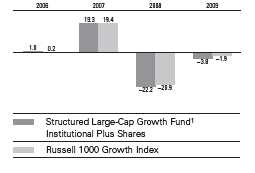
1 The fund commenced operations as a registered investment company on October 3, 2006. The fund’s performance includes the
performance of a predeccesor trust, Vanguard Fiduciary Trust Company Structured Large-Cap Growth Trust, from January 19, 2006, to
October 3, 2006.
Note: See Financial Highlights tables for dividend and capital gains information.
28
Structured Large-Cap Growth Fund
Financial Statements
Statement of Net Assets
As of September 30, 2009
The fund reports a complete list of its holdings in regulatory filings four times in each fiscal year, at the quarter-ends. For the second and fourth fiscal quarters, the lists appear in the fund’s semiannual and annual reports to shareholders. For the first and third fiscal quarters, the fund files the lists with the Securities and Exchange Commission on Form N-Q. Shareholders can look up the fund’s Forms N-Q on the SEC’s website at www.sec.gov. Forms N-Q may also be reviewed and copied at the SEC’s Public Reference Room (see the back cover of this report for further information).
| Market | |||
| Value• | |||
| Shares | ($000) | ||
| Common Stocks (99.7%)1 | |||
| Consumer Discretionary (10.8%) | |||
| McDonald’s Corp. | 9,464 | 540 | |
| Yum! Brands Inc. | 12,000 | 405 | |
| Gap Inc. | 16,900 | 362 | |
| * | Apollo Group Inc. Class A | 4,600 | 339 |
| Ross Stores Inc. | 7,000 | 334 | |
| Home Depot Inc. | 11,200 | 298 | |
| Omnicom Group Inc. | 8,002 | 296 | |
| Mattel Inc. | 14,900 | 275 | |
| * | AutoZone Inc. | 1,820 | 266 |
| NIKE Inc. Class B | 3,728 | 241 | |
| * | Big Lots Inc. | 9,600 | 240 |
| Darden Restaurants Inc. | 6,500 | 222 | |
| * | Aeropostale Inc. | 5,000 | 217 |
| Comcast Corp. | 12,300 | 198 | |
| TJX Cos. Inc. | 5,200 | 193 | |
| * | ITT Educational Services Inc. | 1,600 | 177 |
| Target Corp. | 3,120 | 146 | |
| * | Amazon.com Inc. | 1,500 | 140 |
| * | NVR Inc. | 200 | 127 |
| H&R Block Inc. | 6,900 | 127 | |
| McGraw-Hill Cos. Inc. | 4,800 | 121 | |
| * | Starbucks Corp. | 5,700 | 118 |
| * | DIRECTV Group Inc. | 3,900 | 108 |
| Advance Auto Parts Inc. | 2,400 | 94 | |
| MDC Holdings Inc. | 2,400 | 83 | |
| Sherwin-Williams Co. | 1,300 | 78 | |
| Comcast Corp. Class A | 1,729 | 29 | |
| * | Dollar Tree Inc. | 300 | 15 |
| 5,789 | |||
| Consumer Staples (15.0%) | |||
| Wal-Mart Stores Inc. | 27,957 | 1,372 | |
| Philip Morris International Inc. | 25,569 | 1,246 | |
| Procter & Gamble Co. | 14,403 | 834 | |
| Coca-Cola Co. | 13,548 | 728 | |
| Colgate-Palmolive Co. | 8,605 | 656 | |
| PepsiCo Inc. | 11,111 | 652 | |
| General Mills Inc. | 5,800 | 373 | |
| Coca-Cola Enterprises Inc. | 16,800 | 360 | |
| Market | |||
| Value• | |||
| Shares | ($000) | ||
| Lorillard Inc. | 4,200 | 312 | |
| Mead Johnson Nutrition Co. | |||
| Class A | 6,900 | 311 | |
| Clorox Co. | 4,700 | 276 | |
| Sysco Corp. | 9,494 | 236 | |
| CVS Caremark Corp. | 5,984 | 214 | |
| Walgreen Co. | 2,910 | 109 | |
| Altria Group Inc. | 5,269 | 94 | |
| Campbell Soup Co. | 2,600 | 85 | |
| Molson Coors Brewing Co. | |||
| Class B | 1,000 | 49 | |
| Pepsi Bottling Group Inc. | 1,200 | 44 | |
| Archer-Daniels-Midland Co. | 1,100 | 32 | |
| * | Dean Foods Co. | 1,600 | 29 |
| Alberto-Culver Co. Class B | 1,000 | 28 | |
| Avon Products Inc. | 100 | 3 | |
| 8,043 | |||
| Energy (4.6%) | |||
| Exxon Mobil Corp. | 14,673 | 1,007 | |
| Diamond Offshore Drilling Inc. | 3,400 | 325 | |
| Peabody Energy Corp. | 8,000 | 298 | |
| Murphy Oil Corp. | 4,400 | 253 | |
| Consol Energy Inc. | 3,900 | 176 | |
| * | Cameron International Corp. | 3,000 | 114 |
| * | Alpha Natural Resources Inc. | 2,833 | 99 |
| * | FMC Technologies Inc. | 1,400 | 73 |
| * | Dresser-Rand Group Inc. | 2,000 | 62 |
| Schlumberger Ltd. | 700 | 42 | |
| * | Pride International Inc. | 800 | 24 |
| Tidewater Inc. | 300 | 14 | |
| 2,487 | |||
| Financials (5.4%) | |||
| Aflac Inc. | 10,169 | 435 | |
| Goldman Sachs Group Inc. | 1,916 | 353 | |
| * | TD Ameritrade Holding Corp. | 15,900 | 312 |
| State Street Corp. | 5,666 | 298 | |
| American Express Co. | 6,427 | 218 | |
| Charles Schwab Corp. | 11,315 | 217 | |
| Hudson City Bancorp Inc. | 16,400 | 216 | |
| Moody’s Corp. | 9,100 | 186 | |
29
Structured Large-Cap Growth Fund
| Market | |||
| Value• | |||
| Shares | ($000) | ||
| BOK Financial Corp. | 3,600 | 167 | |
| BlackRock Inc. | 500 | 108 | |
| Wells Fargo & Co. | 3,400 | 96 | |
| * | St Joe Co. | 2,500 | 73 |
| Digital Realty Trust Inc. | 1,300 | 59 | |
| Public Storage | 700 | 53 | |
| Federated Investors Inc. | |||
| Class B | 1,600 | 42 | |
| Simon Property Group Inc. | 350 | 24 | |
| Axis Capital Holdings Ltd. | 600 | 18 | |
| * | Jefferies Group Inc. | 600 | 16 |
| * | Investment Technology | ||
| Group Inc. | 400 | 11 | |
| 2,902 | |||
| Health Care (15.9%) | |||
| Johnson & Johnson | 26,112 | 1,590 | |
| Abbott Laboratories | 16,169 | 800 | |
| Baxter International Inc. | 10,542 | 601 | |
| Bristol-Myers Squibb Co. | 24,418 | 550 | |
| * | Medco Health Solutions Inc. | 9,790 | 542 |
| Schering-Plough Corp. | 14,132 | 399 | |
| * | Amgen Inc. | 5,900 | 355 |
| McKesson Corp. | 5,740 | 342 | |
| * | Mylan Inc. | 18,800 | 301 |
| Quest Diagnostics Inc. | 5,700 | 298 | |
| AmerisourceBergen Corp. | |||
| Class A | 13,060 | 292 | |
| * | Warner Chilcott PLC Class A | 12,100 | 262 |
| * | Valeant | ||
| Pharmaceuticals International | 8,200 | 230 | |
| * | Watson Pharmaceuticals Inc. | 6,000 | 220 |
| CIGNA Corp. | 7,700 | 216 | |
| * | Biogen Idec Inc. | 4,131 | 209 |
| * | Hospira Inc. | 4,600 | 205 |
| * | DaVita Inc. | 3,500 | 198 |
| * | Forest Laboratories Inc. | 6,300 | 185 |
| * | Gilead Sciences Inc. | 3,370 | 157 |
| Medtronic Inc. | 4,240 | 156 | |
| Eli Lilly & Co. | 3,400 | 112 | |
| * | Dendreon Corp. | 3,400 | 95 |
| * | Mettler-Toledo | ||
| International Inc. | 900 | 82 | |
| * | Community Health | ||
| Systems Inc. | 1,800 | 57 | |
| * | Myriad Genetics Inc. | 1,600 | 44 |
| * | Waters Corp. | 500 | 28 |
| * | Cephalon Inc. | 238 | 14 |
| * | Health Management | ||
| Associates Inc. Class A | 1,200 | 9 | |
| 8,549 | |||
| Industrials (10.9%) | |||
| United Parcel Service Inc. | |||
| Class B | 11,647 | 658 | |
| United Technologies Corp. | 9,882 | 602 | |
| Lockheed Martin Corp. | 6,104 | 476 | |
| Union Pacific Corp. | 7,566 | 441 | |
| Market | |||
| Value• | |||
| Shares | ($000) | ||
| 3M Co. | 4,726 | 349 | |
| Fluor Corp. | 6,700 | 341 | |
| Honeywell International Inc. | 8,580 | 319 | |
| Flowserve Corp. | 2,800 | 276 | |
| Goodrich Corp. | 4,900 | 266 | |
| Joy Global Inc. | 4,500 | 220 | |
| L-3 Communications | |||
| Holdings Inc. | 2,700 | 217 | |
| ITT Corp. | 3,600 | 188 | |
| Dover Corp. | 4,500 | 174 | |
| Waste Management Inc. | 5,458 | 163 | |
| * | Shaw Group Inc. | 4,800 | 154 |
| Dun & Bradstreet Corp. | 2,000 | 151 | |
| Precision Castparts Corp. | 1,277 | 130 | |
| * | Jacobs Engineering Group Inc. | 2,800 | 129 |
| Raytheon Co. | 2,604 | 125 | |
| * | Iron Mountain Inc. | 3,700 | 99 |
| Northrop Grumman Corp. | 1,800 | 93 | |
| Pitney Bowes Inc. | 3,200 | 79 | |
| RR Donnelley & Sons Co. | 3,000 | 64 | |
| * | Thomas & Betts Corp. | 1,500 | 45 |
| * | Cooper Industries PLC | ||
| Class A | 700 | 26 | |
| * | URS Corp. | 500 | 22 |
| * | WESCO International Inc. | 500 | 14 |
| Emerson Electric Co. | 346 | 14 | |
| Copa Holdings SA Class A | 200 | 9 | |
| 5,844 | |||
| Information Technology (31.3%) | |||
| * | Apple Inc. | 10,612 | 1,967 |
| International Business | |||
| Machines Corp. | 15,807 | 1,891 | |
| Microsoft Corp. | 68,085 | 1,763 | |
| * | Google Inc. Class A | 3,015 | 1,495 |
| Hewlett-Packard Co. | 25,577 | 1,207 | |
| * | Cisco Systems Inc. | 47,450 | 1,117 |
| Oracle Corp. | 51,496 | 1,073 | |
| Intel Corp. | 34,320 | 672 | |
| QUALCOMM Inc. | 10,903 | 490 | |
| Automatic Data | |||
| Processing Inc. | 10,400 | 409 | |
| Texas Instruments Inc. | 16,961 | 402 | |
| * | Marvell Technology | ||
| Group Ltd. | 21,400 | 346 | |
| Xilinx Inc. | 14,500 | 340 | |
| * | Western Digital Corp. | 8,300 | 303 |
| * | Hewitt Associates Inc. | ||
| Class A | 8,300 | 302 | |
| * | Accenture PLC Class A | 7,835 | 292 |
| * | Sohu.com Inc. | 3,900 | 268 |
| * | EMC Corp. | 15,294 | 261 |
| * | BMC Software Inc. | 6,510 | 244 |
| * | Genpact Ltd. | 18,800 | 231 |
| * | ON Semiconductor Corp. | 25,500 | 210 |
| CA Inc. | 9,300 | 205 | |
30
Structured Large-Cap Growth Fund
| Market | |||
| Value• | |||
| Shares | ($000) | ||
| Broadridge Financial | |||
| Solutions Inc. | 9,000 | 181 | |
| * | NeuStar Inc. Class A | 7,500 | 170 |
| Diebold Inc. | 5,000 | 165 | |
| * | Teradata Corp. | 5,500 | 151 |
| * | Alliance Data Systems Corp. | 2,100 | 128 |
| * | Red Hat Inc. | 3,800 | 105 |
| * | NCR Corp. | 6,800 | 94 |
| Linear Technology Corp. | 3,100 | 86 | |
| Visa Inc. Class A | 800 | 55 | |
| * | Micron Technology Inc. | 4,900 | 40 |
| * | Dolby Laboratories Inc. | ||
| Class A | 1,000 | 38 | |
| * | Affiliated Computer | ||
| Services Inc. Class A | 600 | 33 | |
| * | QLogic Corp. | 1,500 | 26 |
| * | NetApp Inc. | 900 | 24 |
| Mastercard Inc. Class A | 100 | 20 | |
| 16,804 | |||
| Materials (4.4%) | |||
| Praxair Inc. | 6,470 | 529 | |
| Newmont Mining Corp. | 11,400 | 502 | |
| EI Du Pont de | |||
| Nemours & Co. | 12,100 | 389 | |
| * | Pactiv Corp. | 7,800 | 203 |
| FMC Corp. | 3,400 | 191 | |
| Monsanto Co. | 2,227 | 172 | |
| Celanese Corp. Class A | 6,070 | 152 | |
| * | Owens-Illinois Inc. | 2,800 | 103 |
| Freeport-McMoRan Copper | |||
| & Gold Inc. | 1,300 | 89 | |
| Ball Corp. | 600 | 30 | |
| 2,360 | |||
| Telecommunication Services (0.2%) | |||
| * | American Tower Corp. | ||
| Class A | 1,800 | 66 | |
| Windstream Corp. | 3,000 | 30 | |
| 96 | |||
| Utilities (1.2%) | |||
| Exelon Corp. | 5,972 | 296 | |
| * | AES Corp. | 12,400 | 184 |
| Public Service Enterprise | |||
| Group Inc. | 5,749 | 181 | |
| FPL Group Inc. | 100 | 5 | |
| 666 | |||
| Total Common Stocks | |||
| (Cost $47,403) | 53,540 | ||
| Temporary Cash Investments (0.3%)1 | |||
| Money Market Fund (0.1%) | |||
| 2 | Vanguard Market | ||
| Liquidity Fund, 0.267% | 57,757 | 58 | |
| Face | Market | |
| Amount | Value• | |
| ($000) | ($000) | |
| U.S. Government and Agency Obligations (0.2%) | ||
| 3,4 Freddie Mac Discount Notes, | ||
| 0.260%, 12/22/09 | 100 | 100 |
| Total Temporary Cash Investments | ||
| (Cost $158) | 158 | |
| Total Investments (100.0%) | ||
| (Cost $47,561) | 53,698 | |
| Other Assets and Liabilities (0.0%) | ||
| Other Assets | 257 | |
| Liabilities | (238) | |
| 19 | ||
| Net Assets (100%) | 53,717 | |
31
| Structured Large-Cap Growth Fund | |
| At September 30, 2009, net assets consisted of: | |
| Amount | |
| ($000) | |
| Paid-in Capital | 63,711 |
| Undistributed Net Investment Income | 522 |
| Accumulated Net Realized Losses | (16,651) |
| Unrealized Appreciation (Depreciation) | |
| Investment Securities | 6,137 |
| Futures Contracts | (2) |
| Net Assets | 53,717 |
| Institutional Shares—Net Assets | |
| Applicable to 466,973 outstanding | |
| $.001 par value shares of beneficial | |
| interest (unlimited authorization) | 9,983 |
| Net Asset Value Per Share— | |
| Institutional Shares | $21.38 |
| Institutional Plus Shares—Net Assets | |
| Applicable to 1,026,701 outstanding | |
| $.001 par value shares of beneficial | |
| interest (unlimited authorization) | 43,734 |
| Net Asset Value Per Share— | |
| Institutional Plus Shares | $42.60 |
• See Note A in Notes to Financial Statements.
* Non-income-producing security.
1 The fund invests a portion of its cash reserves in equity markets through the use of index futures contracts. After giving effect to futures
investments, the fund’s effective common stock and temporary cash investment positions represent 100.0% and 0.0%, respectively, of
net assets.
2 Affiliated money market fund available only to Vanguard funds and certain trusts and accounts managed by Vanguard. Rate shown is the
7-day yield.
3 The issuer operates under a congressional charter; its securities are not backed by the full faith and credit of the U.S. government.
4 Securities with a value of $100,000 have been segregated as initial margin for open futures contracts.
See accompanying Notes, which are an integral part of the Financial Statements.
32
| Structured Large-Cap Growth Fund | |
| Statement of Operations | |
| Year Ended | |
| September 30, 2009 | |
| ($000) | |
| Investment Income | |
| Income | |
| Dividends | 836 |
| Interest1 | 1 |
| Total Income | 837 |
| Expenses | |
| The Vanguard Group—Note B | |
| Investment Advisory Services | — |
| Management and Administrative—Institutional Shares | 11 |
| Management and Administrative—Institutional Plus Shares | 29 |
| Marketing and Distribution—Institutional Shares | 3 |
| Marketing and Distribution—Institutional Plus Shares | 8 |
| Custodian Fees | 7 |
| Auditing Fees | 23 |
| Shareholders’ Reports and Proxies—Institutional Shares | 1 |
| Shareholders’ Reports and Proxies—Institutional Plus Shares | — |
| Total Expenses | 82 |
| Net Investment Income | 755 |
| Realized Net Gain (Loss) | |
| Investment Securities Sold | (12,720) |
| Futures Contracts | (107) |
| Realized Net Gain (Loss) | (12,827) |
| Change in Unrealized Appreciation (Depreciation) | |
| Investment Securities | 9,919 |
| Futures Contracts | 22 |
| Change in Unrealized Appreciation (Depreciation) | 9,941 |
| Net Increase (Decrease) in Net Assets Resulting from Operations | (2,131) |
| 1 Interest income from an affiliated company of the fund was $1,000. | |
See accompanying Notes, which are an integral part of the Financial Statements.
33
| Structured Large-Cap Growth Fund | ||
| Statement of Changes in Net Assets | ||
| Year Ended September 30, | ||
| 2009 | 2008 | |
| ($000) | ($000) | |
| Increase (Decrease) in Net Assets | ||
| Operations | ||
| Net Investment Income | 755 | 709 |
| Realized Net Gain (Loss) | (12,827) | (3,652) |
| Change in Unrealized Appreciation (Depreciation) | 9,941 | (12,383) |
| Net Increase (Decrease) in Net Assets Resulting from Operations | (2,131) | (15,326) |
| Distributions | ||
| Net Investment Income | ||
| Institutional Shares | (137) | (80) |
| Institutional Plus Shares | (618) | (553) |
| Realized Capital Gain1 | ||
| Institutional Shares | — | (169) |
| Institutional Plus Shares | — | (1,114) |
| Total Distributions | (755) | (1,916) |
| Capital Share Transactions | ||
| Institutional Shares | 137 | 4,149 |
| Institutional Plus Shares | 618 | 1,667 |
| Net Increase (Decrease) from Capital Share Transactions | 755 | 5,816 |
| Total Increase (Decrease) | (2,131) | (11,426) |
| Net Assets | ||
| Beginning of Period | 55,848 | 67,274 |
| End of Period2 | 53,717 | 55,848 |
1 Includes fiscal 2008 short-term gain distributions totaling $540,000. Short-term gain distributions are treated as ordinary income dividends
for tax purposes.
2 Net Assets—End of Period includes undistributed net investment income of $522,000 and $522,000.
See accompanying Notes, which are an integral part of the Financial Statements.
34
| Structured Large-Cap Growth Fund | |||
| Financial Highlights | |||
| Institutional Shares | |||
| June 22, | |||
| Year Ended | 20071 to | ||
| September 30, | Sept. 30, | ||
| For a Share Outstanding Throughout Each Period | 2009 | 2008 | 2007 |
| Net Asset Value, Beginning of Period | $22.63 | $29.93 | $29.04 |
| Investment Operations | |||
| Net Investment Income | .290 | .283 | .050 |
| Net Realized and Unrealized Gain (Loss) on Investments | (1.243) | (6.742) | .840 |
| Total from Investment Operations | (.953) | (6.459) | .890 |
| Distributions | |||
| Dividends from Net Investment Income | (.297) | (.270) | — |
| Distributions from Realized Capital Gains | — | (.571) | — |
| Total Distributions | (.297) | (.841) | — |
| Net Asset Value, End of Period | $21.38 | $22.63 | $29.93 |
| Total Return | –3.89% | –22.20% | 3.06% |
| Ratios/Supplemental Data | |||
| Net Assets, End of Period (Millions) | $10 | $10 | $9 |
| Ratio of Total Expenses to Average Net Assets | 0.25% | 0.20% | 0.25%2 |
| Ratio of Net Investment Income to Average Net Assets | 1.60% | 1.07% | 0.84%2 |
| Portfolio Turnover Rate | 66% | 70% | 56% |
| 1 Inception. | |||
| 2 Annualized. | |||
See accompanying Notes, which are an integral part of the Financial Statements.
35
| Structured Large-Cap Growth Fund | |||
| Financial Highlights | |||
| Institutional Plus Shares | |||
| Oct. 3, | |||
| Year Ended | 20061 to | ||
| September 30, | Sept. 30, | ||
| For a Share Outstanding Throughout Each Period | 2009 | 2008 | 2007 |
| Net Asset Value, Beginning of Period | $45.07 | $59.60 | $50.00 |
| Investment Operations | |||
| Net Investment Income | .607 | .591 | .547 |
| Net Realized and Unrealized Gain (Loss) on Investments | (2.464) | (13.420) | 9.256 |
| Total from Investment Operations | (1.857) | (12.829) | 9.803 |
| Distributions | |||
| Dividends from Net Investment Income | (.613) | (.564) | (.150) |
| Distributions from Realized Capital Gains | — | (1.137) | (.053) |
| Total Distributions | (.613) | (1.701) | (.203) |
| Net Asset Value, End of Period | $42.60 | $45.07 | $59.60 |
| Total Return | –3.79% | –22.16% | 19.66% |
| Ratios/Supplemental Data | |||
| Net Assets, End of Period (Millions) | $44 | $45 | $58 |
| Ratio of Total Expenses to Average Net Assets | 0.17% | 0.12% | 0.15%2 |
| Ratio of Net Investment Income to Average Net Assets | 1.68% | 1.15% | 0.94%2 |
| Portfolio Turnover Rate | 66% | 70% | 56% |
1 Commencement of operations as a registered investment company.
2 Annualized.
See accompanying Notes, which are an integral part of the Financial Statements.
36
Structured Large-Cap Growth Fund
Notes to Financial Statements
Vanguard Structured Large-Cap Growth Fund is registered under the Investment Company Act of 1940 as an open-end investment company, or mutual fund. The fund offers two classes of shares: Institutional Shares and Institutional Plus Shares. Institutional Shares are available to investors who invest a minimum of $5 million. Institutional Plus Shares are available to investors who invest a minimum of $200 million ($100 million for investors with total Vanguard investments of at least $1 billion).
A. The following significant accounting policies conform to generally accepted accounting principles for U.S. mutual funds. The fund consistently follows such policies in preparing its financial statements.
1. Security Valuation: Securities are valued as of the close of trading on the New York Stock Exchange (generally 4 p.m., Eastern time) on the valuation date. Equity securities are valued at the latest quoted sales prices or official closing prices taken from the primary market in which each security trades; such securities not traded on the valuation date are valued at the mean of the latest quoted bid and asked prices. Securities for which market quotations are not readily available, or whose values have been materially affected by events occurring before the fund’s pricing time but after the close of the securities’ primary markets, are valued by methods deemed by the board of trustees to represent fair value. Investments in Vanguard Market Liquidity Fund are valued at that fund’s net asset value. Temporary cash investments acquired over 60 days to maturity are valued using the latest bid pr ices or using valuations based on a matrix system (which considers such factors as security prices, yields, maturities, and ratings), both as furnished by independent pricing services. Other temporary cash investments are valued at amortized cost, which approximates market value.
2. Futures Contracts: The fund uses index futures contracts to a limited extent, with the objective of maintaining full exposure to the stock market while maintaining liquidity. The fund may purchase or sell futures contracts to achieve a desired level of investment, whether to accommodate portfolio turnover or cash flows from capital share transactions. The primary risks associated with the use of futures contracts are imperfect correlation between changes in market values of stocks held by the fund and the prices of futures contracts, and the possibility of an illiquid market.
Futures contracts are valued at their quoted daily settlement prices. The aggregate principal amounts of the contracts are not recorded in the Statement of Net Assets. Fluctuations in the value of the contracts are recorded in the Statement of Net Assets as an asset (liability) and in the Statement of Operations as unrealized appreciation (depreciation) until the contracts are closed, when they are recorded as realized futures gains (losses).
3. Federal Income Taxes: The fund intends to continue to qualify as a regulated investment company and distribute all of its taxable income. Management has analyzed the fund’s tax positions taken for all open federal income tax years (September 30, 2007–2009), and has concluded that no provision for federal income tax is required in the fund’s financial statements.
4. Distributions: Distributions to shareholders are recorded on the ex-dividend date.
5. Other: Dividend income is recorded on the ex-dividend date. Interest income includes income distributions received from Vanguard Market Liquidity Fund and is accrued daily. Security transactions are accounted for on the date securities are bought or sold. Costs used to determine realized gains (losses) on the sale of investment securities are those of the specific securities sold.
Each class of shares has equal rights as to assets and earnings, except that each class separately bears certain class-specific expenses related to maintenance of shareholder accounts (included in Management and Administrative expenses), shareholder reporting, and proxies. Marketing and
37
Structured Large-Cap Growth Fund
distribution expenses are allocated to each class of shares based on a method approved by the board of trustees. Income, other non-class-specific expenses, and gains and losses on investments are allocated to each class of shares based on its relative net assets.
B. The Vanguard Group furnishes at cost investment advisory, corporate management, administrative, marketing, and distribution services. The costs of such services are allocated to the fund under methods approved by the board of trustees. The fund has committed to provide up to 0.40% of its net assets in capital contributions to Vanguard. At September 30, 2009, the fund had contributed capital of $11,000 to Vanguard (included in Other Assets), representing 0.02% of the fund’s net assets and 0.00% of Vanguard’s capitalization. The fund’s trustees and officers are also directors and officers of Vanguard.
C. Various inputs may be used to determine the value of the fund’s investments. These inputs are summarized in three broad levels for financial statement purposes. The inputs or methodologies used to value securities are not necessarily an indication of the risk associated with investing in those securities.
Level 1—Quoted prices in active markets for identical securities.
Level 2—Other significant observable inputs (including quoted prices for similar securities, interest rates, prepayment speeds, credit risk, etc.).
Level 3—Significant unobservable inputs (including the fund’s own assumptions used to determine the fair value of investments).
The following table summarizes the fund’s investments as of September 30, 2009, based on the inputs used to value them:
| Level 1 | Level 2 | Level 3 | |
| Investments | ($000) | ($000) | ($000) |
| Common Stocks | 53,540 | — | — |
| Temporary Cash Investments | 58 | 100 | — |
| Total | 53,598 | 100 | — |
D. At September 30, 2009, the aggregate settlement value of open futures contracts and the related unrealized appreciation (depreciation) were:
| ($000) | ||||
| Number of | Aggregate | Unrealized | ||
| Long (Short) | Settlement | Appreciation | ||
| Futures Contracts | Expiration | Contracts | Value | (Depreciation) |
| E-mini S&P 500 Index | December 2009 | 3 | 158 | (2) |
Unrealized appreciation (depreciation) on open futures contracts is required to be treated as realized gain (loss) for tax purposes.
38
Structured Large-Cap Growth Fund
E. Distributions are determined on a tax basis and may differ from net investment income and realized capital gains for financial reporting purposes. Differences may be permanent or temporary. Permanent differences are reclassified among capital accounts in the financial statements to reflect their tax character. Temporary differences arise when certain items of income, expense, gain, or loss are recognized in different periods for financial statement and tax purposes; these differences will reverse at some time in the future. Differences in classification may also result from the treatment of short-term gains as ordinary income for tax purposes.
For tax purposes, at September 30, 2009, the fund had $559,000 of ordinary income available for distribution. The fund had available capital loss carryforwards totaling $5,741,000 to offset future net capital gains through September 30, 2017. In addition, the fund realized losses of $10,912,000 during the period from November 1, 2008, through September 30, 2009, which are deferred and will be treated as realized for tax purposes in fiscal 2010.
At September 30, 2009, the cost of investment securities for tax purposes was $47,561,000. Net unrealized appreciation of investment securities for tax purposes was $6,137,000, consisting of unrealized gains of $7,353,000 on securities that had risen in value since their purchase and $1,216,000 in unrealized losses on securities that had fallen in value since their purchase.
F. During the year ended September 30, 2009, the fund purchased $31,107,000 of investment securities and sold $30,289,000 of investment securities, other than temporary cash investments.
| G. Capital share transactions for each class of shares were: | ||||
| Year Ended September 30, | ||||
| 2009 | 2008 | |||
| Amount | Shares | Amount | Shares | |
| ($000) | (000) | ($000) | (000) | |
| Institutional Shares | ||||
| Issued | — | — | 5,000 | 194 |
| Issued in Lieu of Cash Distributions | 137 | 8 | 249 | 9 |
| Redeemed | — | — | (1,100) | (40) |
| Net Increase (Decrease)—Institutional Shares | 137 | 8 | 4,149 | 163 |
| Institutional Plus Shares | ||||
| Issued | — | — | — | — |
| Issued in Lieu of Cash Distributions | 618 | 18 | 1,667 | 29 |
| Redeemed | — | — | — | — |
| Net Increase (Decrease)—Institutional Plus Shares | 618 | 18 | 1,667 | 29 |
H. In preparing the financial statements as of September 30, 2009, management considered the impact of subsequent events occurring through November 10, 2009, for potential recognition or disclosure in these financial statements.
39
Structured Large-Cap Value Fund
Fund Profile
As of September 30, 2009
| Portfolio Characteristics | |||
| Comparative | Broad | ||
| Fund | Index1 | Index2 | |
| Number of Stocks | 218 | 675 | 4,324 |
| Median Market Cap | $30.8B | $30.4B | $29.0B |
| Price/Earnings Ratio | 22.5x | 30.8x | 27.9x |
| Price/Book Ratio | 1.7x | 1.6x | 2.1x |
| Yield—Institutional | |||
| Plus Shares3 | 2.1% | 2.3% | 1.9% |
| Return on Equity | 17.2% | 16.7% | 19.1% |
| Earnings Growth Rate | 6.2% | 3.0% | 9.6% |
| Foreign Holdings | 0.0% | 0.0% | 0.0% |
| Turnover Rate | 68% | — | — |
| Expense Ratio4 | — | — | |
| Institutional | |||
| Plus Shares | 0.17% | ||
| Short-Term Reserves | 0.3% | — | — |
| Sector Diversification (% of equity exposure) | |||
| Comparative | Broad | ||
| Fund | Index1 | Index2 | |
| Consumer Discretionary | 10.0% | 9.4% | 10.1% |
| Consumer Staples | 4.7 | 5.5 | 9.9 |
| Energy | 18.6 | 18.4 | 11.0 |
| Financials | 25.4 | 25.4 | 16.7 |
| Health Care | 9.1 | 9.1 | 12.9 |
| Industrials | 10.6 | 10.7 | 10.6 |
| Information Technology | 5.5 | 5.1 | 18.2 |
| Materials | 4.3 | 3.9 | 3.9 |
| Telecommunication | |||
| Services | 5.4 | 5.6 | 2.9 |
| Utilities | 6.4 | 6.9 | 3.8 |
| Volatility Measures5 | ||
| Fund Versus | Fund Versus | |
| Comparative Index1 | Broad Index2 | |
| R-Squared | 1.00 | 0.96 |
| Beta | 0.98 | 1.01 |
| Ten Largest Holdings6 (% of total net assets) | ||
| Exxon Mobil Corp. | integrated oil | |
| and gas | 5.2% | |
| AT&T Inc. | integrated | |
| telecommunication | ||
| services | 3.4 | |
| General Electric Co. | industrial | |
| conglomerates | 3.3 | |
| Chevron Corp. | integrated oil | |
| and gas | 3.1 | |
| JPMorgan Chase & Co. | diversified | |
| financial services | 3.0 | |
| Wells Fargo & Co. | diversified banks | 2.6 |
| Bank of America Corp. | diversified | |
| financial services | 2.6 | |
| Pfizer Inc. | pharmaceuticals | 2.4 |
| Goldman Sachs Group Inc. | investment banking | |
| and brokerage | 2.2 | |
| ConocoPhillips | integrated oil | |
| and gas | 1.6 | |
| Top Ten | 29.4% | |
Investment Focus

1 Russell 1000 Value Index.
2 Dow Jones U.S. Total Stock Market Index.
3 30-day SEC yield for the fund; annualized dividend yield for the indexes. See the Glossary.
4 The expense ratio shown is from the prospectus dated January 23, 2009, and represents estimated costs for the current fiscal year based
on the fund’s net assets as of the prospectus date. For the fiscal year ended September 30, 2009, the fund’s expense ratio was 0.17%.
5 For an explanation of R-squared, beta, and other terms used here, see the Glossary.
6 The holdings listed exclude any temporary cash investments and equity index products.
40
Structured Large-Cap Value Fund
Performance Summary
All of the returns in this report represent past performance, which is not a guarantee of future results that may be achieved by the fund. (Current performance may be lower or higher than the performance data cited. For performance data current to the most recent month-end, visit our website at www.vanguard.com/performance.) Note, too, that both investment returns and principal value can fluctuate widely, so an investor’s shares, when sold, could be worth more or less than their original cost. The returns shown do not reflect taxes that a shareholder would pay on fund distributions or on the sale of fund shares.
Cumulative Performance: December 15, 2005–September 30, 2009
Initial Investment of $200,000,000
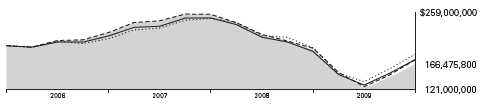
| Average Annual Total Returns | |||
| Periods Ended September 30, 2009 | Final Value of a | ||
| Since | $200,000,000 | ||
| One Year | Inception1 | Investment | |
| Structured Large-Cap Value Fund | |||
| Institutional Plus Shares | –13.73% | –4.72% | $166,475,800 |
| Dow Jones U.S. Total Stock Market Index | –5.83 | –2.08 | 184,687,409 |
| Russell 1000 Value Index | –10.62 | –3.49 | 174,825,926 |
| Large-Cap Value Funds Average2 | –7.67 | –3.43 | 175,235,501 |
1 Performance for the fund and its comparative standards is calculated since the fund’s inception: December 15, 2005.
2 Derived from data provided by Lipper Inc.
41
Structured Large-Cap Value Fund
Fiscal-Year Total Returns (%): December 15, 2005–September 30, 2009
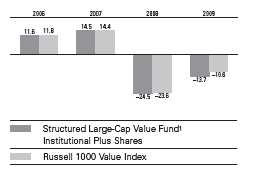
1 The fund commenced operations as a registered investment company on January 18, 2007. The fund’s performance includes the
performance of a predeccesor trust, Vanguard Fiduciary Trust Company Structured Large-Cap Value Trust, from December 15, 2005, to
January 18, 2007.
Note: See Financial Highlights table for dividend and capital gains information.
42
Structured Large-Cap Value Fund
Financial Statements
Statement of Net Assets
As of September 30, 2009
The fund reports a complete list of its holdings in regulatory filings four times in each fiscal year, at the quarter-ends. For the second and fourth fiscal quarters, the lists appear in the fund’s semiannual and annual reports to shareholders. For the first and third fiscal quarters, the fund files the lists with the Securities and Exchange Commission on Form N-Q. Shareholders can look up the fund’s Forms N-Q on the SEC’s website at www.sec.gov. Forms N-Q may also be reviewed and copied at the SEC’s Public Reference Room (see the back cover of this report for further information).
| Market | |||
| Value• | |||
| Shares | ($000) | ||
| Common Stocks (99.8%)1 | |||
| Consumer Discretionary (10.0%) | |||
| Home Depot Inc. | 20,200 | 538 | |
| * | Ford Motor Co. | 62,700 | 452 |
| Time Warner Cable Inc. | 9,800 | 422 | |
| Comcast Corp. Class A | 24,676 | 417 | |
| Gannett Co. Inc. | 25,200 | 315 | |
| Gap Inc. | 13,000 | 278 | |
| News Corp. Class A | 20,010 | 240 | |
| Walt Disney Co. | 8,290 | 228 | |
| Wyndham Worldwide Corp. | 12,600 | 206 | |
| McGraw-Hill Cos. Inc. | 7,900 | 199 | |
| DR Horton Inc. | 16,500 | 188 | |
| RadioShack Corp. | 11,300 | 187 | |
| Comcast Corp. | 11,200 | 180 | |
| Limited Brands Inc. | 10,300 | 175 | |
| Autoliv Inc. | 4,800 | 161 | |
| * | NVR Inc. | 200 | 128 |
| Carnival Corp. | 3,600 | 120 | |
| Cablevision Systems Corp. | |||
| Class A | 5,000 | 119 | |
| Lennar Corp. Class A | 6,800 | 97 | |
| Whirlpool Corp. | 1,200 | 84 | |
| Pulte Homes Inc. | 7,100 | 78 | |
| Time Warner Inc. | 2,340 | 67 | |
| * | Liberty | ||
| Media Corp. - Interactive | 5,200 | 57 | |
| MDC Holdings Inc. | 500 | 17 | |
| * | DISH Network Corp. Class A | 900 | 17 |
| * | Warner Music Group Corp. | 2,500 | 14 |
| * | Las Vegas Sands Corp. | 500 | 9 |
| 4,993 | |||
| Consumer Staples (4.7%) | |||
| Kraft Foods Inc. | 16,376 | 430 | |
| * | Dr Pepper Snapple Group Inc. | 12,000 | 345 |
| Procter & Gamble Co. | 5,215 | 302 | |
| Archer-Daniels-Midland Co. | 10,100 | 295 | |
| ConAgra Foods Inc. | 12,400 | 269 | |
| Wal-Mart Stores Inc. | 4,500 | 221 | |
| General Mills Inc. | 3,100 | 199 | |
| CVS Caremark Corp. | 4,800 | 171 | |
| Market | |||
| Value• | |||
| Shares | ($000) | ||
| Mead Johnson Nutrition Co. | |||
| Class A | 1,200 | 54 | |
| Molson Coors Brewing Co. | |||
| Class B | 670 | 33 | |
| Alberto-Culver Co. Class B | 600 | 17 | |
| Clorox Co. | 200 | 12 | |
| Hershey Co. | 300 | 12 | |
| 2,360 | |||
| Energy (18.6%) | |||
| Exxon Mobil Corp. | 38,010 | 2,608 | |
| Chevron Corp. | 22,290 | 1,570 | |
| ConocoPhillips | 17,674 | 798 | |
| Apache Corp. | 6,000 | 551 | |
| Anadarko Petroleum Corp. | 5,950 | 373 | |
| Spectra Energy Corp. | 18,800 | 356 | |
| Occidental Petroleum Corp. | 4,300 | 337 | |
| Murphy Oil Corp. | 5,700 | 328 | |
| Devon Energy Corp. | 4,600 | 310 | |
| Rowan Cos. Inc. | 11,100 | 256 | |
| Tidewater Inc. | 5,400 | 254 | |
| * | SEACOR Holdings Inc. | 3,100 | 253 |
| * | Newfield Exploration Co. | 5,200 | 221 |
| * | National Oilwell Varco Inc. | 4,000 | 173 |
| Marathon Oil Corp. | 5,300 | 169 | |
| * | Pride International Inc. | 5,000 | 152 |
| Tesoro Corp. | 8,400 | 126 | |
| Schlumberger Ltd. | 1,800 | 107 | |
| Chesapeake Energy Corp. | 2,900 | 82 | |
| ENSCO International Inc. | 1,300 | 55 | |
| Frontier Oil Corp. | 3,400 | 47 | |
| * | Plains Exploration & | ||
| Production Co. | 1,400 | 39 | |
| Overseas Shipholding | |||
| Group Inc. | 900 | 34 | |
| EOG Resources Inc. | 400 | 34 | |
| El Paso Corp. | 2,800 | 29 | |
| * | Helix Energy Solutions | ||
| Group Inc. | 1,600 | 24 | |
| Massey Energy Co. | 300 | 9 | |
| 9,295 | |||
43
| Structured Large-Cap Value Fund | |||
| Market | |||
| Value• | |||
| Shares | ($000) | ||
| Financials (25.3%) | |||
| JPMorgan Chase & Co. | 33,980 | 1,489 | |
| Wells Fargo & Co. | 46,445 | 1,309 | |
| Bank of America Corp. | 77,035 | 1,303 | |
| Goldman Sachs Group Inc. | 5,925 | 1,092 | |
| Travelers Cos. Inc. | 10,700 | 527 | |
| US Bancorp | 22,069 | 482 | |
| Citigroup Inc. | 98,488 | 477 | |
| Bank of New York | |||
| Mellon Corp. | 14,743 | 427 | |
| Chubb Corp. | 8,300 | 418 | |
| BB&T Corp. | 14,850 | 404 | |
| American Express Co. | 11,600 | 393 | |
| State Street Corp. | 7,000 | 368 | |
| Unum Group | 14,900 | 319 | |
| BlackRock Inc. | 1,300 | 282 | |
| Torchmark Corp. | 5,800 | 252 | |
| Hudson City Bancorp Inc. | 14,800 | 195 | |
| American Financial | |||
| Group Inc. | 7,400 | 189 | |
| * | Jefferies Group Inc. | 6,900 | 188 |
| * | Progressive Corp. | 9,800 | 162 |
| PNC Financial Services | |||
| Group Inc. | 3,300 | 160 | |
| Morgan Stanley | 4,990 | 154 | |
| Bank of Hawaii Corp. | 3,530 | 147 | |
| Annaly Capital | |||
| Management Inc. | 7,100 | 129 | |
| PartnerRe Ltd. | 1,600 | 123 | |
| Host Hotels & Resorts Inc. | 9,400 | 111 | |
| Axis Capital Holdings Ltd. | 3,500 | 106 | |
| HCP Inc. | 3,400 | 98 | |
| Liberty Property Trust | 2,600 | 84 | |
| BOK Financial Corp. | 1,700 | 79 | |
| Hospitality Properties Trust | 3,600 | 73 | |
| New York Community | |||
| Bancorp Inc. | 6,200 | 71 | |
| Senior Housing | |||
| Properties Trust | 3,700 | 71 | |
| Brandywine Realty Trust | 6,400 | 71 | |
| Alexandria Real | |||
| Estate Equities Inc. | 1,300 | 71 | |
| HRPT Properties Trust | 9,000 | 68 | |
| Nationwide Health | |||
| Properties Inc. | 1,900 | 59 | |
| Plum Creek Timber Co. Inc. | 1,900 | 58 | |
| Equity Residential | 1,880 | 58 | |
| * | AmeriCredit Corp. | 3,600 | 57 |
| Hartford Financial Services | |||
| Group Inc. | 2,100 | 56 | |
| Fifth Third Bancorp | 4,700 | 48 | |
| Protective Life Corp. | 2,100 | 45 | |
| * | MBIA Inc. | 5,200 | 40 |
| Vornado Realty Trust | 619 | 40 | |
| * | American International | ||
| Group Inc. | 900 | 40 | |
| Market | |||
| Value• | |||
| Shares | ($000) | ||
| Boston Properties Inc. | 600 | 39 | |
| * | St Joe Co. | 1,200 | 35 |
| Simon Property Group Inc. | 502 | 35 | |
| Franklin Resources Inc. | 300 | 30 | |
| Corporate Office | |||
| Properties Trust SBI | 800 | 29 | |
| Allstate Corp. | 750 | 23 | |
| Genworth Financial Inc. | |||
| Class A | 1,400 | 17 | |
| Prudential Financial Inc. | 300 | 15 | |
| ProLogis | 1,100 | 13 | |
| Ventas Inc. | 300 | 11 | |
| AvalonBay Communities Inc. | 100 | 7 | |
| 12,647 | |||
| Health Care (9.1%) | |||
| Pfizer Inc. | 72,120 | 1,194 | |
| Johnson & Johnson | 9,790 | 596 | |
| Wyeth | 9,250 | 449 | |
| UnitedHealth Group Inc. | 11,700 | 293 | |
| Eli Lilly & Co. | 8,230 | 272 | |
| Merck & Co. Inc. | 8,480 | 268 | |
| Bristol-Myers Squibb Co. | 11,500 | 259 | |
| AmerisourceBergen Corp. | |||
| Class A | 11,200 | 251 | |
| * | WellPoint Inc. | 3,590 | 170 |
| * | Forest Laboratories Inc. | 5,500 | 162 |
| * | LifePoint Hospitals Inc. | 5,500 | 149 |
| Universal Health Services Inc. | |||
| Class B | 2,100 | 130 | |
| * | Mylan Inc. | 8,100 | 130 |
| Schering-Plough Corp. | 2,000 | 56 | |
| Quest Diagnostics Inc. | 900 | 47 | |
| CIGNA Corp. | 1,500 | 42 | |
| IMS Health Inc. | 2,300 | 35 | |
| Cooper Cos. Inc. | 400 | 12 | |
| 4,515 | |||
| Industrials (10.6%) | |||
| General Electric Co. | 99,150 | 1,628 | |
| General Dynamics Corp. | 7,180 | 464 | |
| United Technologies Corp. | 5,000 | 305 | |
| Joy Global Inc. | 5,400 | 264 | |
| Union Pacific Corp. | 4,300 | 251 | |
| CSX Corp. | 5,800 | 243 | |
| RR Donnelley & Sons Co. | 10,200 | 217 | |
| Northrop Grumman Corp. | 3,650 | 189 | |
| Burlington Northern | |||
| Santa Fe Corp. | 2,200 | 176 | |
| Raytheon Co. | 3,600 | 173 | |
| * | General Cable Corp. | 4,400 | 172 |
| L-3 Communications | |||
| Holdings Inc. | 2,100 | 169 | |
| Pitney Bowes Inc. | 6,400 | 159 | |
| * | Hertz Global Holdings Inc. | 13,600 | 147 |
| * | URS Corp. | 3,200 | 140 |
| Flowserve Corp. | 1,100 | 108 | |
| ITT Corp. | 2,000 | 104 | |
44
| Structured Large-Cap Value Fund | |||
| Market | |||
| Value• | |||
| Shares | ($000) | ||
| * | Thomas & Betts Corp. | 2,600 | 78 |
| Dover Corp. | 2,000 | 77 | |
| Hubbell Inc. Class B | 1,500 | 63 | |
| Waste Management Inc. | 2,000 | 60 | |
| Boeing Co. | 1,100 | 60 | |
| * | Owens Corning | 1,400 | 31 |
| 5,278 | |||
| Information Technology (5.4%) | |||
| Hewlett-Packard Co. | 10,700 | 505 | |
| Intel Corp. | 21,900 | 429 | |
| * | Computer Sciences Corp. | 6,200 | 327 |
| * | Micron Technology Inc. | 26,100 | 214 |
| * | Ingram Micro Inc. | 10,800 | 182 |
| * | Marvell Technology | ||
| Group Ltd. | 10,600 | 172 | |
| Diebold Inc. | 4,700 | 155 | |
| CA Inc. | 6,700 | 147 | |
| * | Tellabs Inc. | 17,400 | 120 |
| * | Teradata Corp. | 4,000 | 110 |
| * | PMC - Sierra Inc. | 8,800 | 84 |
| * | Tech Data Corp. | 1,800 | 75 |
| * | LSI Corp. | 10,000 | 55 |
| * | Genpact Ltd. | 4,400 | 54 |
| * | EMC Corp. | 2,200 | 37 |
| Xerox Corp. | 4,800 | 37 | |
| * | Western Digital Corp. | 300 | 11 |
| 2,714 | |||
| Materials (4.3%) | |||
| EI Du Pont de | |||
| Nemours & Co. | 13,800 | 444 | |
| Freeport-McMoRan | |||
| Copper & Gold Inc. | 5,100 | 350 | |
| * | Owens-Illinois Inc. | 6,800 | 251 |
| Bemis Co. Inc. | 8,400 | 218 | |
| FMC Corp. | 3,400 | 191 | |
| Eastman Chemical Co. | 3,300 | 177 | |
| * | Pactiv Corp. | 5,700 | 148 |
| Sonoco Products Co. | 5,300 | 146 | |
| Compass Minerals | |||
| International Inc. | 1,000 | 62 | |
| AK Steel Holding Corp. | 3,000 | 59 | |
| International Paper Co. | 2,300 | 51 | |
| Temple-Inland Inc. | 1,300 | 21 | |
| Dow Chemical Co. | 610 | 16 | |
| 2,134 | |||
| Telecommunication Services (5.4%) | |||
| AT&T Inc. | 63,013 | 1,702 | |
| Verizon Communications Inc. | 19,340 | 585 | |
| Windstream Corp. | 19,700 | 200 | |
| * | Sprint Nextel Corp. | 22,900 | 90 |
| CenturyTel Inc. | 1,834 | 62 | |
| Qwest Communications | |||
| International Inc. | 15,200 | 58 | |
| * | NII Holdings Inc. | 400 | 12 |
| 2,709 | |||
| Market | |||
| Value• | |||
| Shares | ($000) | ||
| Utilities (6.4%) | |||
| Exelon Corp. | 9,800 | 486 | |
| Dominion Resources Inc. | 11,900 | 411 | |
| Public Service Enterprise | |||
| Group Inc. | 12,700 | 399 | |
| Atmos Energy Corp. | 9,200 | 259 | |
| American Electric | |||
| Power Co. Inc. | 8,100 | 251 | |
| * | NRG Energy Inc. | 8,900 | 251 |
| UGI Corp. | 9,200 | 231 | |
| * | AES Corp. | 12,700 | 188 |
| PG&E Corp. | 4,500 | 182 | |
| FPL Group Inc. | 2,200 | 122 | |
| CMS Energy Corp. | 7,400 | 99 | |
| NSTAR | 2,900 | 92 | |
| Sempra Energy | 1,800 | 90 | |
| Edison International | 1,500 | 50 | |
| NiSource Inc. | 3,400 | 47 | |
| FirstEnergy Corp. | 584 | 27 | |
| * | Mirant Corp. | 1,100 | 18 |
| 3,203 | |||
| Total Common Stocks | |||
| (Cost $48,802) | 49,848 | ||
| Face | |||
| Amount | |||
| ($000) | |||
| Temporary Cash Investment (0.4%)1 | |||
| U.S. Government and Agency Obligations (0.4%) | |||
| 2,3 | Freddie Mac | ||
| Discount Notes, | |||
| 0.260%, 12/22/09 | |||
| (Cost $200) | 200 | 200 | |
| Total Investments (100.2%) | |||
| (Cost $49,002) | 50,048 | ||
| Other Assets and Liabilities (–0.2%) | |||
| Other Assets | 69 | ||
| Liabilities | (186) | ||
| (117) | |||
| Net Assets (100%) | |||
| Applicable to 1,370,426 outstanding | |||
| $.001 par value shares of beneficial | |||
| interest (unlimited authorization) | 49,931 | ||
| Net Asset Value Per Share | $36.43 | ||
45
Structured Large-Cap Value Fund
| At September 30, 2009, net assets consisted of: | |
| Amount | |
| ($000) | |
| Paid-in Capital | 70,392 |
| Undistributed Net Investment Income | 855 |
| Accumulated Net Realized Losses | (22,361) |
| Unrealized Appreciation (Depreciation) | |
| Investment Securities | 1,046 |
| Futures Contracts | (1) |
| Net Assets | 49,931 |
• See Note A in Notes to Financial Statements.
* Non-income-producing security.
1 The fund invests a portion of its cash reserves in equity markets through the use of index futures contracts. After giving effect to futures
investments, the fund’s effective common stock and temporary cash investment positions represent 99.9% and 0.3%, respectively, of
net assets.
2 Securities with a value of $200,000 have been segregated as initial margin for open futures contracts.
3 The issuer operates under a congressional charter; its securities are not backed by the full faith and credit of the U.S. government.
See accompanying Notes, which are an integral part of the Financial Statements.
46
| Structured Large-Cap Value Fund | |
| Statement of Operations | |
| Year Ended | |
| September 30, 2009 | |
| ($000) | |
| Investment Income | |
| Income | |
| Dividends | 1,322 |
| Interest1 | 4 |
| Total Income | 1,326 |
| Expenses | |
| The Vanguard Group—Note B | |
| Investment Advisory Services | — |
| Management and Administrative | 35 |
| Marketing and Distribution | 6 |
| Custodian Fees | 8 |
| Auditing Fees | 23 |
| Shareholders’ Reports and Proxies | 1 |
| Total Expenses | 73 |
| Net Investment Income | 1,253 |
| Realized Net Gain (Loss) | |
| Investment Securities Sold | (17,568) |
| Futures Contracts | (152) |
| Realized Net Gain (Loss) | (17,720) |
| Change in Unrealized Appreciation (Depreciation) | |
| Investment Securities | 8,520 |
| Futures Contracts | 5 |
| Change in Unrealized Appreciation (Depreciation) | 8,525 |
| Net Increase (Decrease) in Net Assets Resulting from Operations | (7,942) |
| 1 Interest income from an affiliated company of the fund was $1,000. | |
| See accompanying Notes, which are an integral part of the Financial Statements. | |
47
| Structured Large-Cap Value Fund | ||
| Statement of Changes in Net Assets | ||
| Year Ended September 30, | ||
| 2009 | 2008 | |
| ($000) | ($000) | |
| Increase (Decrease) in Net Assets | ||
| Operations | ||
| Net Investment Income | 1,253 | 1,897 |
| Realized Net Gain (Loss) | (17,720) | (4,334) |
| Change in Unrealized Appreciation (Depreciation) | 8,525 | (17,283) |
| Net Increase (Decrease) in Net Assets Resulting from Operations | (7,942) | (19,720) |
| Distributions | ||
| Net Investment Income | (1,827) | (1,731) |
| Realized Capital Gain1 | — | (5,031) |
| Total Distributions | (1,827) | (6,762) |
| Capital Share Transactions | ||
| Issued | — | 4,000 |
| Issued in Lieu of Cash Distributions | 1,827 | 6,762 |
| Redeemed | — | (5,000) |
| Net Increase (Decrease) from Capital Share Transactions | 1,827 | 5,762 |
| Total Increase (Decrease) | (7,942) | (20,720) |
| Net Assets | ||
| Beginning of Period | 57,873 | 78,593 |
| End of Period2 | 49,931 | 57,873 |
1 Includes fiscal 2008 short-term gain distributions totaling $1,651,000. Short-term gain distributions are treated as ordinary income
dividends for tax purposes.
2 Net Assets—End of Period includes undistributed net investment income of $855,000 and $1,429,000.
See accompanying Notes, which are an integral part of the Financial Statements.
48
| Structured Large-Cap Value Fund | |||
| Financial Highlights | |||
| Institutional Plus Shares | |||
| Jan. 18, | |||
| Year Ended | 20071 to | ||
| September 30, | Sept. 30, | ||
| For a Share Outstanding Throughout Each Period | 2009 | 2008 | 2007 |
| Net Asset Value, Beginning of Period | $44.00 | $63.87 | $60.09 |
| Investment Operations | |||
| Net Investment Income | .926 | 1.426 | 1.030 |
| Net Realized and Unrealized Gain (Loss) on Investments | (7.108) | (15.946) | 2.750 |
| Total from Investment Operations | (6.182) | (14.520) | 3.780 |
| Distributions | |||
| Dividends from Net Investment Income | (1.388) | (1.370) | — |
| Distributions from Realized Capital Gains | — | (3.980) | — |
| Total Distributions | (1.388) | (5.350) | — |
| Net Asset Value, End of Period | $36.43 | $44.00 | $63.87 |
| Total Return | –13.73% | –24.47% | 6.29% |
| Ratios/Supplemental Data | |||
| Net Assets, End of Period (Millions) | $50 | $58 | $79 |
| Ratio of Total Expenses to Average Net Assets | 0.17% | 0.12% | 0.15%2 |
| Ratio of Net Investment Income to Average Net Assets | 2.90% | 2.63% | 2.29%2 |
| Portfolio Turnover Rate | 68% | 104% | 48% |
1 Commencement of operations as a registered investment company.
2 Annualized.
See accompanying Notes, which are an integral part of the Financial Statements.
49
Structured Large-Cap Value Fund
Notes to Financial Statements
Vanguard Structured Large-Cap Value Fund is registered under the Investment Company Act of 1940 as an open-end investment company, or mutual fund. The fund offers two classes of shares: Institutional Shares and Institutional Plus Shares. Institutional Shares are available to investors who invest a minimum of $5 million. Institutional Plus Shares are available to investors who invest a minimum of $200 million ($100 million for investors with total Vanguard investments of at least $1 billion). The fund has not issued any Institutional Shares through September 30, 2009.
A. The following significant accounting policies conform to generally accepted accounting principles for U.S. mutual funds. The fund consistently follows such policies in preparing its financial statements.
1. Security Valuation: Securities are valued as of the close of trading on the New York Stock Exchange (generally 4 p.m., Eastern time) on the valuation date. Equity securities are valued at the latest quoted sales prices or official closing prices taken from the primary market in which each security trades; such securities not traded on the valuation date are valued at the mean of the latest quoted bid and asked prices. Securities for which market quotations are not readily available, or whose values have been materially affected by events occurring before the fund’s pricing time but after the close of the securities’ primary markets, are valued by methods deemed by the board of trustees to represent fair value. Investments in Vanguard Market Liquidity Fund are valued at that fund’s net asset value. Temporary cash investments acquired over 60 days to maturity are valued using the latest bid pr ices or using valuations based on a matrix system (which considers such factors as security prices, yields, maturities, and ratings), both as furnished by independent pricing services. Other temporary cash investments are valued at amortized cost, which approximates market value.
2. Futures Contracts: The fund uses index futures contracts to a limited extent, with the objective of maintaining full exposure to the stock market while maintaining liquidity. The fund may purchase or sell futures contracts to achieve a desired level of investment, whether to accommodate portfolio turnover or cash flows from capital share transactions. The primary risks associated with the use of futures contracts are imperfect correlation between changes in market values of stocks held by the fund and the prices of futures contracts, and the possibility of an illiquid market.
Futures contracts are valued at their quoted daily settlement prices. The aggregate principal amounts of the contracts are not recorded in the Statement of Net Assets. Fluctuations in the value of the contracts are recorded in the Statement of Net Assets as an asset (liability) and in the Statement of Operations as unrealized appreciation (depreciation) until the contracts are closed, when they are recorded as realized futures gains (losses).
3. Federal Income Taxes: The fund intends to continue to qualify as a regulated investment company and distribute all of its taxable income. Management has analyzed the fund’s tax positions taken for all open federal income tax years (September 30, 2007–2009), and has concluded that no provision for federal income tax is required in the fund’s financial statements.
4. Distributions: Distributions to shareholders are recorded on the ex-dividend date.
5. Other: Dividend income is recorded on the ex-dividend date. Interest income includes income distributions received from Vanguard Market Liquidity Fund and is accrued daily. Security transactions are accounted for on the date securities are bought or sold. Costs used to determine realized gains (losses) on the sale of investment securities are those of the specific securities sold.
50
Structured Large-Cap Value Fund
B. The Vanguard Group furnishes at cost investment advisory, corporate management, administrative, marketing, and distribution services. The costs of such services are allocated to the fund under methods approved by the board of trustees. The fund has committed to provide up to 0.40% of its net assets in capital contributions to Vanguard. At September 30, 2009, the fund had contributed capital of $10,000 to Vanguard (included in Other Assets), representing 0.02% of the fund’s net assets and 0.00% of Vanguard’s capitalization. The fund’s trustees and officers are also directors and officers of Vanguard.
C. Various inputs may be used to determine the value of the fund’s investments. These inputs are summarized in three broad levels for financial statement purposes. The inputs or methodologies used to value securities are not necessarily an indication of the risk associated with investing in those securities.
Level 1—Quoted prices in active markets for identical securities.
Level 2—Other significant observable inputs (including quoted prices for similar securities, interest rates, prepayment speeds, credit risk, etc.).
Level 3—Significant unobservable inputs (including the fund’s own assumptions used to determine the fair value of investments).
The following table summarizes the fund’s investments as of September 30, 2009, based on the inputs used to value them:
| Level 1 | Level 2 | Level 3 | |
| Investments | ($000) | ($000) | ($000) |
| Common Stocks | 49,848 | — | — |
| Temporary Cash Investments | — | 200 | — |
| Total | 49,848 | 200 | — |
D. At September 30, 2009, the aggregate settlement value of open futures contracts and the related unrealized appreciation (depreciation) were:
| ($000) | ||||
| Number of | Aggregate | Unrealized | ||
| Long (Short) | Settlement | Appreciation | ||
| Futures Contracts | Expiration | Contracts | Value | (Depreciation) |
| E-mini S&P 500 Index | December 2009 | 1 | 53 | (1) |
Unrealized appreciation (depreciation) on open futures contracts is required to be treated as realized gain (loss) for tax purposes.
E. Distributions are determined on a tax basis and may differ from net investment income and realized capital gains for financial reporting purposes. Differences may be permanent or temporary. Permanent differences are reclassified among capital accounts in the financial statements to reflect their tax character. Temporary differences arise when certain items of income, expense, gain, or loss are recognized in different periods for financial statement and tax purposes; these differences will reverse at some time in the future. Differences in classification may also result from the treatment of short-term gains as ordinary income for tax purposes.
51
Structured Large-Cap Value Fund
For tax purposes, at September 30, 2009, the fund had $895,000 of ordinary income available for distribution. The fund had available capital loss carryforwards totaling $5,409,000 to offset future net capital gains through September 30, 2017. In addition, the fund realized losses of $16,953,000 during the period from November 1, 2008, through September 30, 2009, which are deferred and will be treated as realized for tax purposes in fiscal 2010.
At September 30, 2009, the cost of investment securities for tax purposes was $49,002,000. Net unrealized appreciation of investment securities for tax purposes was $1,046,000, consisting of unrealized gains of $5,457,000 on securities that had risen in value since their purchase and $4,411,000 in unrealized losses on securities that had fallen in value since their purchase.
F. During the year ended September 30, 2009, the fund purchased $31,880,000 of investment securities and sold $30,165,000 of investment securities, other than temporary cash investments.
| G. Capital shares issued and redeemed were: | ||
| Year Ended September 30, | ||
| 2009 | 2008 | |
| Shares | Shares | |
| (000) | (000) | |
| Issued | — | 73 |
| Issued in Lieu of Cash Distributions | 55 | 122 |
| Redeemed | — | (110) |
| Net Increase (Decrease) in Shares Outstanding | 55 | 85 |
H. In preparing the financial statements as of September 30, 2009, management considered the impact of subsequent events occurring through November 10, 2009, for potential recognition or disclosure in these financial statements.
52
Structured Broad Market Fund
Fund Profile
As of September 30, 2009
| Portfolio Characteristics | |||
| Comparative | Broad | ||
| Fund | Index1 | Index2 | |
| Number of Stocks | 366 | 2,968 | 4,324 |
| Median Market Cap | $26.7B | $28.8B | $29.0B |
| Price/Earnings Ratio | 19.9x | 27.4x | 27.9x |
| Price/Book Ratio | 2.4x | 2.2x | 2.1x |
| Yield3 | 1.9% | 1.9% | |
| Institutional Shares | 1.7% | ||
| Institutional | |||
| Plus Shares | 1.7% | ||
| Return on Equity | 20.7% | 19.3% | 19.1% |
| Earnings Growth Rate | 13.5% | 9.8% | 9.6% |
| Foreign Holdings | 0.5% | 0.0% | 0.0% |
| Turnover Rate | 62% | — | — |
| Expense Ratio4 | — | — | |
| Institutional Shares | 0.25% | ||
| Institutional | |||
| Plus Shares | 0.17% | ||
| Short-Term Reserves5 | –0.2% | — | — |
| Sector Diversification (% of equity exposure) | |||
| Comparative | Broad | ||
| Fund | Index1 | Index2 | |
| Consumer Discretionary 10.9% | 10.2% | 10.1% | |
| Consumer Staples | 9.3 | 10.2 | 9.9 |
| Energy | 10.9 | 10.8 | 11.0 |
| Financials | 15.8 | 15.7 | 16.7 |
| Health Care | 12.4 | 13.0 | 12.9 |
| Industrials | 11.2 | 10.9 | 10.6 |
| Information Technology | 19.0 | 18.4 | 18.2 |
| Materials | 4.3 | 4.0 | 3.9 |
| Telecommunication | |||
| Services | 2.6 | 2.9 | 2.9 |
| Utilities | 3.6 | 3.9 | 3.8 |
| Volatility Measures6 | ||
| Fund Versus | Fund Versus | |
| Comparative Index1 | Broad Index2 | |
| R-Squared | 1.00 | 1.00 |
| Beta | 0.99 | 0.99 |
| Ten Largest Holdings7 (% of total net assets) | ||
| Exxon Mobil Corp. | integrated oil | |
| and gas | 3.4% | |
| International Business | ||
| Machines Corp. | computer hardware | 1.9 |
| Cisco Systems Inc. | communications | |
| equipment | 1.7 | |
| Chevron Corp. | integrated oil | |
| and gas | 1.7 | |
| Google Inc. Class A | Internet software | |
| and services | 1.6 | |
| Apple Inc. | computer hardware | 1.5 |
| Johnson & Johnson | pharmaceuticals | 1.5 |
| Wal-Mart Stores Inc. | hypermarkets and | |
| super centers | 1.4 | |
| Intel Corp. | semiconductors | 1.4 |
| Goldman Sachs Group Inc. | investment banking | |
| and brokerage | 1.4 | |
| Top Ten | 17.5% | |
Investment Focus

1 Russell 3000 Index.
2 Dow Jones U.S. Total Stock Market Index.
3 30-day SEC yield for the fund; annualized dividend yield for the indexes. See the Glossary.
4 The expense ratios shown are from the prospectus dated January 23, 2009, and represent estimated costs for the current fiscal year based
on the fund’s net assets as of the prospectus date. For the fiscal year ended September 30, 2009, the expense ratios were 0.25% for the
Institutional Shares and 0.17% for the Institutional Plus Shares.
5 The fund invested a portion of its cash reserves in equity markets through the use of index futures contracts. After the effect of the futures
investments, the fund’s temporary cash position was negative.
6 For an explanation of R-squared, beta, and other terms used here, see the Glossary.
7 The holdings listed exclude any temporary cash investments and equity index products.
53
Structured Broad Market Fund
Performance Summary
All of the returns in this report represent past performance, which is not a guarantee of future results that may be achieved by the fund. (Current performance may be lower or higher than the performance data cited. For performance data current to the most recent month-end, visit our website at www.vanguard.com/performance.) Note, too, that both investment returns and principal value can fluctuate widely, so an investor’s shares, when sold, could be worth more or less than their original cost. The returns shown do not reflect taxes that a shareholder would pay on fund distributions or on the sale of fund shares.
Cumulative Performance: May 3, 2004–September 30, 2009
Initial Investment of $200,000,000
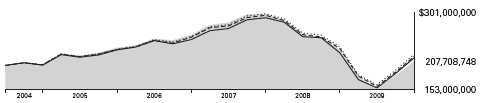
| Average Annual Total Returns | ||||
| Periods Ended September 30, 2009 | Final Value of a | |||
| Since | $200,000,000 | |||
| One Year | Five Years | Inception1 | Investment | |
| Structured Broad Market Fund | ||||
| Institutional Plus Shares | –9.60% | 0.59% | 0.70% | $207,708,748 |
| Dow Jones U.S. Total Stock Market Index | –5.83 | 1.93 | 1.92 | 221,712,920 |
| Russell 3000 Index | –6.42 | 1.56 | 1.55 | 217,330,872 |
| Multi-Cap Core Funds Average2 | –4.30 | 1.35 | 1.30 | 214,470,353 |
| Final Value of a | |||
| Since | $5,000,000 | ||
| One Year | Inception1 | Investment | |
| Structured Broad Market Fund | |||
| Institutional Shares | –9.67% | –9.38% | $3,782,121 |
| Dow Jones U.S. Total Stock Market Index | –5.83 | –6.82 | 4,093,527 |
| Russell 3000 Index | –6.42 | –7.23 | 4,042,081 |
| 1 Performance for the fund and its comparative standards is calculated since the following inception dates: May 3, 2004, for Institutional |
| Plus Shares; November 30, 2006, for Institutional Shares. |
| 2 Derived from data provided by Lipper Inc. |
54
Structured Broad Market Fund
Fiscal-Year Total Returns (%): May 3, 2004–September 30, 2009

1 The fund commenced operations as a registered investment company on October 3, 2006. The fund’s performance includes the performance of a predeccesor trust, Vanguard Fiduciary Trust Company Structured Broad Market Trust, from May 3, 2004, to October 3, 2006.
Note: See Financial Highlights tables for dividend and capital gains information.
55
Structured Broad Market Fund
Financial Statements
Statement of Net Assets
As of September 30, 2009
The fund reports a complete list of its holdings in regulatory filings four times in each fiscal year, at the quarter-ends. For the second and fourth fiscal quarters, the lists appear in the fund’s semiannual and annual reports to shareholders. For the first and third fiscal quarters, the fund files the lists with the Securities and Exchange Commission on Form N-Q. Shareholders can look up the fund’s Forms N-Q on the SEC’s website at www.sec.gov. Forms N-Q may also be reviewed and copied at the SEC’s Public Reference Room (see the back cover of this report for further information).
| Market | |||
| Value• | |||
| Shares | ($000) | ||
| Common Stocks (99.4%)1 | |||
| Consumer Discretionary (10.9%) | |||
| Comcast Corp. Class A | 110,291 | 1,863 | |
| * | Ford Motor Co. | 244,262 | 1,761 |
| McDonald’s Corp. | 30,431 | 1,737 | |
| Gap Inc. | 71,000 | 1,519 | |
| Home Depot Inc. | 47,320 | 1,261 | |
| Wyndham Worldwide Corp. | 74,300 | 1,213 | |
| McGraw-Hill Cos. Inc. | 46,900 | 1,179 | |
| Time Warner Inc. | 37,400 | 1,076 | |
| Time Warner Cable Inc. | 24,762 | 1,067 | |
| * | DIRECTV Group Inc. | 35,800 | 987 |
| Ross Stores Inc. | 17,900 | 855 | |
| Jarden Corp. | 30,200 | 848 | |
| Omnicom Group Inc. | 19,960 | 737 | |
| NIKE Inc. Class B | 11,220 | 726 | |
| * | Big Lots Inc. | 29,000 | 726 |
| * | Aeropostale Inc. | 16,650 | 724 |
| DR Horton Inc. | 55,300 | 631 | |
| * | DISH Network Corp. | ||
| Class A | 32,750 | 631 | |
| * | AutoZone Inc. | 4,200 | 614 |
| Limited Brands Inc. | 36,000 | 612 | |
| * | Sally Beauty Holdings Inc. | 81,100 | 577 |
| * | Pre-Paid Legal Services Inc. | 11,300 | 574 |
| * | Apollo Group Inc. Class A | 6,800 | 501 |
| * | Amazon.com Inc. | 4,953 | 462 |
| H&R Block Inc. | 22,500 | 414 | |
| * | Tempur-Pedic | ||
| International Inc. | 21,400 | 405 | |
| Darden Restaurants Inc. | 11,300 | 386 | |
| RadioShack Corp. | 22,600 | 374 | |
| * | WMS Industries Inc. | 8,000 | 356 |
| Comcast Corp. | 22,000 | 354 | |
| KB Home | 20,500 | 340 | |
| * | Warnaco Group Inc. | 7,700 | 338 |
| Cablevision Systems Corp. | |||
| Class A | 13,600 | 323 | |
| * | Bally Technologies Inc. | 7,800 | 299 |
| * | Dollar Tree Inc. | 5,900 | 287 |
| Market | |||
| Value• | |||
| Shares | ($000) | ||
| Autoliv Inc. | 8,100 | 272 | |
| * | CEC Entertainment Inc. | 10,504 | 272 |
| * | Viacom Inc. Class B | 9,495 | 266 |
| * | Dana Holding Corp. | 37,500 | 255 |
| * | Valassis Communications Inc. | 11,300 | 202 |
| ^ | Buckle Inc. | 5,900 | 201 |
| Gannett Co. Inc. | 15,600 | 195 | |
| Service Corp. | |||
| International | 26,400 | 185 | |
| Pulte Homes Inc. | 16,225 | 178 | |
| Lithia Motors Inc. Class A | 10,700 | 167 | |
| * | Isle of Capri Casinos Inc. | 13,800 | 163 |
| Tupperware Brands Corp. | 3,900 | 156 | |
| Yum! Brands Inc. | 4,400 | 149 | |
| * | Stein Mart Inc. | 11,300 | 144 |
| Sherwin-Williams Co. | 2,100 | 126 | |
| Newell Rubbermaid Inc. | 7,200 | 113 | |
| Whirlpool Corp. | 1,400 | 98 | |
| Polaris Industries Inc. | 1,700 | 69 | |
| * | NVR Inc. | 100 | 64 |
| Spartan Motors Inc. | 12,100 | 62 | |
| Brinker International Inc. | 3,900 | 61 | |
| Advance Auto Parts Inc. | 1,300 | 51 | |
| Standard Motor Products Inc. | 3,000 | 46 | |
| * | Dorman Products Inc. | 1,500 | 23 |
| 30,275 | |||
| Consumer Staples (9.2%) | |||
| Wal-Mart Stores Inc. | 79,065 | 3,881 | |
| Philip Morris International Inc. | 74,350 | 3,624 | |
| Procter & Gamble Co. | 46,751 | 2,708 | |
| Coca-Cola Co. | 29,490 | 1,584 | |
| CVS Caremark Corp. | 37,536 | 1,342 | |
| * | Dr Pepper Snapple Group Inc. | 36,800 | 1,058 |
| General Mills Inc. | 16,100 | 1,036 | |
| Archer-Daniels-Midland Co. | 35,100 | 1,026 | |
| Mead Johnson Nutrition Co. | |||
| Class A | 22,300 | 1,006 | |
| Clorox Co. | 16,900 | 994 | |
| Kraft Foods Inc. | 37,700 | 990 | |
| Coca-Cola Enterprises Inc. | 45,800 | 981 | |
56
| Structured Broad Market Fund | |||
| Market | |||
| Value• | |||
| Shares | ($000) | ||
| Colgate-Palmolive Co. | 11,230 | 857 | |
| PepsiCo Inc. | 14,330 | 841 | |
| Lorillard Inc. | 10,900 | 810 | |
| Kellogg Co. | 16,000 | 788 | |
| ConAgra Foods Inc. | 34,100 | 739 | |
| * | Energizer Holdings Inc. | 6,700 | 444 |
| Pepsi Bottling Group Inc. | 9,400 | 342 | |
| Kroger Co. | 16,100 | 332 | |
| Sysco Corp. | 7,100 | 176 | |
| * | Dean Foods Co. | 5,400 | 96 |
| Alberto-Culver Co. Class B | 2,900 | 80 | |
| 25,735 | |||
| Energy (10.8%) | |||
| Exxon Mobil Corp. | 137,820 | 9,456 | |
| Chevron Corp. | 66,965 | 4,716 | |
| Apache Corp. | 23,440 | 2,152 | |
| Occidental Petroleum Corp. | 24,840 | 1,947 | |
| Diamond Offshore | |||
| Drilling Inc. | 13,100 | 1,251 | |
| Murphy Oil Corp. | 20,600 | 1,186 | |
| * | Newfield Exploration Co. | 22,800 | 970 |
| Anadarko Petroleum Corp. | 14,040 | 881 | |
| Peabody Energy Corp. | 21,700 | 808 | |
| Rowan Cos. Inc. | 32,200 | 743 | |
| ENSCO International Inc. | 13,130 | 559 | |
| ConocoPhillips | 11,400 | 515 | |
| Consol Energy Inc. | 11,300 | 510 | |
| EOG Resources Inc. | 6,100 | 509 | |
| * | Southwestern Energy Co. | 10,500 | 448 |
| * | FMC Technologies Inc. | 7,100 | 371 |
| Schlumberger Ltd. | 5,800 | 346 | |
| * | James River Coal Co. | 15,500 | 296 |
| * | Alpha Natural Resources Inc. | 7,352 | 258 |
| * | National Oilwell Varco Inc. | 4,900 | 211 |
| El Paso Corp. | 19,700 | 203 | |
| * | Dresser-Rand Group Inc. | 6,300 | 196 |
| * | Bristow Group Inc. | 5,900 | 175 |
| Ship Finance | |||
| International Ltd. | 13,100 | 161 | |
| Tesoro Corp. | 10,600 | 159 | |
| * | Oil States International Inc. | 4,200 | 148 |
| Tidewater Inc. | 3,000 | 141 | |
| * | Geokinetics Inc. | 6,200 | 131 |
| * | Pride International Inc. | 3,900 | 119 |
| * | Cal Dive International Inc. | 8,800 | 87 |
| * | Global Industries Ltd. | 8,400 | 80 |
| Southern Union Co. | 3,700 | 77 | |
| * | Dawson Geophysical Co. | 2,100 | 57 |
| * | CVR Energy Inc. | 4,300 | 53 |
| * | PHI Inc. | 2,500 | 51 |
| * | McMoRan Exploration Co. | 5,400 | 41 |
| Frontier Oil Corp. | 2,700 | 38 | |
| 30,050 | |||
| Financials (15.7%) | |||
| Goldman Sachs Group Inc. | 20,811 | 3,836 | |
| JPMorgan Chase & Co. | 55,936 | 2,451 | |
| Market | |||
| Value• | |||
| Shares | ($000) | ||
| Bank of America Corp. | 123,445 | 2,089 | |
| Wells Fargo & Co. | 71,010 | 2,001 | |
| State Street Corp. | 36,000 | 1,894 | |
| Franklin Resources Inc. | 17,700 | 1,781 | |
| US Bancorp | 79,650 | 1,741 | |
| Aflac Inc. | 39,640 | 1,694 | |
| Unum Group | 66,900 | 1,434 | |
| * | TD Ameritrade Holding Corp. | 70,016 | 1,374 |
| Chubb Corp. | 25,070 | 1,264 | |
| BlackRock Inc. | 5,800 | 1,257 | |
| BOK Financial Corp. | 25,300 | 1,172 | |
| Travelers Cos. Inc. | 22,900 | 1,127 | |
| Northern Trust Corp. | 18,500 | 1,076 | |
| Bank of New York | |||
| Mellon Corp. | 36,791 | 1,067 | |
| * | Progressive Corp. | 60,300 | 1,000 |
| Moody’s Corp. | 47,400 | 970 | |
| BB&T Corp. | 35,080 | 956 | |
| Hudson City Bancorp Inc. | 70,800 | 931 | |
| AON Corp. | 22,300 | 907 | |
| Charles Schwab Corp. | 31,600 | 605 | |
| Citigroup Inc. | 122,449 | 593 | |
| * | Knight Capital Group Inc. | ||
| Class A | 26,300 | 572 | |
| Axis Capital Holdings Ltd. | 18,400 | 555 | |
| American Financial | |||
| Group Inc. | 21,300 | 543 | |
| Oriental Financial Group Inc. | 40,000 | 508 | |
| Simon Property Group Inc. | 7,066 | 491 | |
| American Express Co. | 13,420 | 455 | |
| New York Community | |||
| Bancorp Inc. | 35,000 | 400 | |
| Bank of Hawaii Corp. | 9,600 | 399 | |
| Hospitality Properties Trust | 19,500 | 397 | |
| Highwoods Properties Inc. | 11,929 | 375 | |
| Mid-America Apartment | |||
| Communities Inc. | 7,800 | 352 | |
| Senior Housing | |||
| Properties Trust | 18,300 | 350 | |
| Sun Communities Inc. | 15,600 | 336 | |
| * | St Joe Co. | 11,100 | 323 |
| Washington Real Estate | |||
| Investment Trust | 11,000 | 317 | |
| Kilroy Realty Corp. | 11,000 | 305 | |
| Associated Estates | |||
| Realty Corp. | 29,300 | 282 | |
| Sovran Self Storage Inc. | 8,300 | 252 | |
| * | First Horizon National Corp. | 17,232 | 228 |
| Cullen/Frost Bankers Inc. | 4,400 | 227 | |
| PS Business Parks Inc. | 4,400 | 226 | |
| * | MBIA Inc. | 29,000 | 225 |
| HRPT Properties Trust | 28,900 | 217 | |
| FirstMerit Corp. | 11,059 | 210 | |
| Federated Investors Inc. | |||
| Class B | 7,800 | 206 | |
| Brandywine Realty Trust | 18,200 | 201 |
57
| Structured Broad Market Fund | |||
| Market | |||
| Value• | |||
| Shares | ($000) | ||
| Raymond James Financial Inc. | 7,800 | 182 | |
| * | Nelnet Inc. Class A | 13,900 | 173 |
| Plum Creek Timber Co. Inc. | 5,300 | 162 | |
| Extra Space Storage Inc. | 14,800 | 156 | |
| * | World Acceptance Corp. | 5,700 | 144 |
| Aspen Insurance | |||
| Holdings Ltd. | 4,400 | 116 | |
| Healthcare Realty Trust Inc. | 5,000 | 106 | |
| U-Store-It Trust | 15,500 | 97 | |
| Banco Latinoamericano de | |||
| Comercio Exterior SA | 5,600 | 80 | |
| Host Hotels & Resorts Inc. | 4,700 | 55 | |
| Odyssey Re Holdings Corp. | 800 | 52 | |
| Pennsylvania Real Estate | |||
| Investment Trust | 6,100 | 46 | |
| Parkway Properties Inc. | 2,200 | 43 | |
| Torchmark Corp. | 900 | 39 | |
| * | AmeriCredit Corp. | 2,400 | 38 |
| * | CNA Surety Corp. | 2,000 | 32 |
| International | |||
| Bancshares Corp. | 1,700 | 28 | |
| Suffolk Bancorp | 600 | 18 | |
| 43,739 | |||
| Health Care (12.3%) | |||
| Johnson & Johnson | 66,907 | 4,074 | |
| Pfizer Inc. | 148,835 | 2,463 | |
| * | Amgen Inc. | 40,015 | 2,410 |
| Bristol-Myers Squibb Co. | 97,830 | 2,203 | |
| * | Medco Health Solutions Inc. | 36,585 | 2,024 |
| Abbott Laboratories | 34,100 | 1,687 | |
| McKesson Corp. | 20,300 | 1,209 | |
| Merck & Co. Inc. | 34,910 | 1,104 | |
| * | Warner Chilcott PLC Class A | 50,800 | 1,098 |
| Baxter International Inc. | 19,260 | 1,098 | |
| * | Biogen Idec Inc. | 20,900 | 1,056 |
| * | Mylan Inc. | 62,411 | 999 |
| Eli Lilly & Co. | 29,220 | 965 | |
| * | Watson Pharmaceuticals Inc. | 24,800 | 909 |
| Quest Diagnostics Inc. | 17,100 | 892 | |
| AmerisourceBergen Corp. | |||
| Class A | 36,400 | 815 | |
| * | WellPoint Inc. | 16,850 | 798 |
| UnitedHealth Group Inc. | 29,875 | 748 | |
| Universal Health | |||
| Services Inc. Class B | 11,600 | 718 | |
| * | Forest Laboratories Inc. | 24,000 | 707 |
| * | Endo Pharmaceuticals | ||
| Holdings Inc. | 26,400 | 597 | |
| * | Laboratory Corp. of | ||
| America Holdings | 8,900 | 585 | |
| * | DaVita Inc. | 10,300 | 583 |
| CIGNA Corp. | 17,000 | 478 | |
| * | Isis Pharmaceuticals Inc. | 32,730 | 477 |
| Cooper Cos. Inc. | 12,700 | 378 | |
| * | Myriad Genetics Inc. | 13,200 | 362 |
| Wyeth | 7,340 | 357 | |
| Market | |||
| Value• | |||
| Shares | ($000) | ||
| * | Dendreon Corp. | 12,200 | 341 |
| * | Maxygen Inc. | 50,700 | 339 |
| * | AMERIGROUP Corp. | 13,100 | 290 |
| Beckman Coulter Inc. | 4,100 | 283 | |
| Schering-Plough Corp. | 7,410 | 209 | |
| * | Mettler-Toledo | ||
| International Inc. | 2,100 | 190 | |
| * | Lincare Holdings Inc. | 6,000 | 188 |
| * | Healthsouth Corp. | 9,700 | 152 |
| * | Health Management | ||
| Associates Inc. Class A | 20,000 | 150 | |
| *,^ | BioCryst | ||
| Pharmaceuticals Inc. | 8,700 | 72 | |
| * | Cephalon Inc. | 1,100 | 64 |
| * | Human Genome | ||
| Sciences Inc. | 3,300 | 62 | |
| * | Community Health | ||
| Systems Inc. | 1,200 | 38 | |
| * | Accelrys Inc. | 5,900 | 34 |
| * | Questcor | ||
| Pharmaceuticals Inc. | 4,900 | 27 | |
| 34,233 | |||
| Industrials (11.1%) | |||
| General Electric Co. | 189,780 | 3,116 | |
| United Technologies Corp. | 42,140 | 2,568 | |
| United Parcel Service Inc. | |||
| Class B | 41,300 | 2,332 | |
| Union Pacific Corp. | 37,100 | 2,165 | |
| General Dynamics Corp. | 28,000 | 1,809 | |
| Lockheed Martin Corp. | 21,150 | 1,651 | |
| Joy Global Inc. | 31,100 | 1,522 | |
| Fluor Corp. | 23,100 | 1,175 | |
| Honeywell International Inc. | 29,424 | 1,093 | |
| Goodrich Corp. | 17,300 | 940 | |
| Waste Management Inc. | 31,300 | 933 | |
| * | General Cable Corp. | 22,700 | 889 |
| Raytheon Co. | 18,000 | 863 | |
| Northrop Grumman Corp. | 15,830 | 819 | |
| 3M Co. | 10,130 | 748 | |
| Flowserve Corp. | 7,500 | 739 | |
| ITT Corp. | 13,000 | 678 | |
| Dover Corp. | 16,900 | 655 | |
| Bucyrus International Inc. | |||
| Class A | 16,100 | 573 | |
| L-3 Communications | |||
| Holdings Inc. | 7,100 | 570 | |
| Burlington Northern | |||
| Santa Fe Corp. | 6,270 | 501 | |
| * | EMCOR Group Inc. | 19,600 | 496 |
| * | Chart Industries Inc. | 22,200 | 479 |
| * | Hertz Global Holdings Inc. | 38,500 | 417 |
| Norfolk Southern Corp. | 9,600 | 414 | |
| Pitney Bowes Inc. | 14,300 | 355 | |
| * | Cooper Industries PLC | ||
| Class A | 7,900 | 297 | |
58
| Structured Broad Market Fund | |||
| Market | |||
| Value• | |||
| Shares | ($000) | ||
| * | Jacobs Engineering | ||
| Group Inc. | 6,300 | 290 | |
| Watson Wyatt | |||
| Worldwide Inc. Class A | 5,800 | 253 | |
| RR Donnelley & Sons Co. | 11,500 | 245 | |
| CSX Corp. | 5,437 | 228 | |
| * | Dollar Thrifty | ||
| Automotive Group Inc. | 7,000 | 172 | |
| Expeditors International of | |||
| Washington Inc. | 4,500 | 158 | |
| Ameron International Corp. | 1,700 | 119 | |
| Dun & Bradstreet Corp. | 1,400 | 105 | |
| Genco Shipping & Trading Ltd. | 4,300 | 89 | |
| * | Alliant Techsystems Inc. | 1,000 | 78 |
| * | EnerSys | 3,500 | 77 |
| * | Force Protection Inc. | 12,500 | 68 |
| Federal Signal Corp. | 9,100 | 65 | |
| Apogee Enterprises Inc. | 3,700 | 56 | |
| * | Thomas & Betts Corp. | 1,400 | 42 |
| Ampco-Pittsburgh Corp. | 1,373 | 37 | |
| 30,879 | |||
| Information Technology (19.0%) | |||
| International Business | |||
| Machines Corp. | 43,942 | 5,256 | |
| * | Cisco Systems Inc. | 205,050 | 4,827 |
| * | Google Inc. Class A | 8,790 | 4,358 |
| * | Apple Inc. | 22,620 | 4,193 |
| Intel Corp. | 197,190 | 3,859 | |
| Hewlett-Packard Co. | 79,599 | 3,758 | |
| Microsoft Corp. | 131,997 | 3,417 | |
| Oracle Corp. | 152,048 | 3,169 | |
| * | Alliance Data Systems Corp. | 19,900 | 1,215 |
| * | Accenture PLC Class A | 31,900 | 1,189 |
| * | Micron Technology Inc. | 136,100 | 1,116 |
| * | Symantec Corp. | 67,200 | 1,107 |
| * | Computer Sciences Corp. | 19,500 | 1,028 |
| * | Western Digital Corp. | 26,600 | 972 |
| Automatic Data | |||
| Processing Inc. | 22,480 | 883 | |
| * | Multi-Fineline Electronix Inc. | 30,200 | 867 |
| Texas Instruments Inc. | 32,270 | 764 | |
| * | QLogic Corp. | 38,000 | 654 |
| * | Skyworks Solutions Inc. | 47,300 | 626 |
| * | EMC Corp. | 33,730 | 575 |
| Visa Inc. Class A | 8,300 | 574 | |
| * | Sohu.com Inc. | 7,500 | 516 |
| Xilinx Inc. | 21,600 | 506 | |
| Earthlink Inc. | 58,000 | 488 | |
| * | Teradata Corp. | 17,600 | 484 |
| * | Genpact Ltd. | 39,300 | 483 |
| QUALCOMM Inc. | 10,620 | 478 | |
| * | Sybase Inc. | 11,762 | 458 |
| * | Ceva Inc. | 40,300 | 433 |
| * | Marvell Technology | ||
| Group Ltd. | 25,500 | 413 | |
| * | Radisys Corp. | 36,000 | 313 |
| Market | |||
| Value• | |||
| Shares | ($000) | ||
| * | Hewitt Associates Inc. | ||
| Class A | 8,400 | 306 | |
| * | NCR Corp. | 21,900 | 303 |
| * | Lexmark International Inc. | ||
| Class A | 12,800 | 276 | |
| * | Plexus Corp. | 9,900 | 261 |
| * | NVE Corp. | 4,900 | 260 |
| Altera Corp. | 12,500 | 256 | |
| * | Broadcom Corp. Class A | 7,800 | 239 |
| * | PC Mall Inc. | 34,600 | 237 |
| CA Inc. | 10,100 | 222 | |
| * | ON Semiconductor Corp. | 26,300 | 217 |
| * | Dolby Laboratories Inc. | ||
| Class A | 5,600 | 214 | |
| Linear Technology Corp. | 6,500 | 180 | |
| * | TIBCO Software Inc. | 16,400 | 156 |
| Black Box Corp. | 5,500 | 138 | |
| Broadridge Financial | |||
| Solutions Inc. | 6,100 | 123 | |
| * | Affiliated Computer | ||
| Services Inc. Class A | 2,200 | 119 | |
| Diebold Inc. | 2,300 | 76 | |
| Analog Devices Inc. | 2,300 | 63 | |
| * | Quest Software Inc. | 2,100 | 35 |
| Solera Holdings Inc. | 900 | 28 | |
| * | LSI Corp. | 4,800 | 26 |
| * | RF Micro Devices Inc. | 3,600 | 20 |
| 52,734 | |||
| Materials (4.3%) | |||
| Freeport-McMoRan | |||
| Copper & Gold Inc. | 29,900 | 2,051 | |
| Praxair Inc. | 24,600 | 2,010 | |
| EI Du Pont de | |||
| Nemours & Co. | 58,980 | 1,896 | |
| Ball Corp. | 21,700 | 1,068 | |
| * | Pactiv Corp. | 39,700 | 1,034 |
| Celanese Corp. Class A | 29,600 | 740 | |
| Eastman Chemical Co. | 12,100 | 648 | |
| * | Owens-Illinois Inc. | 16,700 | 616 |
| Newmont Mining Corp. | 12,300 | 541 | |
| FMC Corp. | 5,600 | 315 | |
| Monsanto Co. | 2,926 | 227 | |
| * | Clearwater Paper Corp. | 5,200 | 215 |
| Rock-Tenn Co. Class A | 4,200 | 198 | |
| Innophos Holdings Inc. | 8,500 | 157 | |
| Terra Industries Inc. | 4,070 | 141 | |
| Glatfelter | 9,100 | 104 | |
| 11,961 | |||
| Telecommunication Services (2.5%) | |||
| AT&T Inc. | 110,929 | 2,996 | |
| Verizon Communications Inc. | 60,157 | 1,821 | |
| CenturyTel Inc. | 16,908 | 568 | |
| * | American Tower Corp. | ||
| Class A | 11,300 | 411 | |
| Qwest Communications | |||
| International Inc. | 92,000 | 351 | |
59
| Structured Broad Market Fund | |||
| Market | |||
| Value• | |||
| Shares | ($000) | ||
| * | Premiere Global | ||
| Services Inc. | 33,500 | 279 | |
| Windstream Corp. | 26,538 | 269 | |
| NTELOS Holdings Corp. | 12,300 | 217 | |
| * | Syniverse Holdings Inc. | 7,900 | 138 |
| 7,050 | |||
| Utilities (3.6%) | |||
| Dominion Resources Inc. | 43,800 | 1,511 | |
| Public Service Enterprise | |||
| Group Inc. | 36,900 | 1,160 | |
| FirstEnergy Corp. | 23,500 | 1,074 | |
| * | NRG Energy Inc. | 37,100 | 1,046 |
| Exelon Corp. | 18,440 | 915 | |
| FPL Group Inc. | 13,733 | 758 | |
| American Electric | |||
| Power Co. Inc. | 21,200 | 657 | |
| Edison International | 18,840 | 633 | |
| Duke Energy Corp. | 38,790 | 611 | |
| CMS Energy Corp. | 33,400 | 448 | |
| NiSource Inc. | 25,700 | 357 | |
| IDACORP Inc. | 10,000 | 288 | |
| DTE Energy Co. | 6,600 | 232 | |
| * | Mirant Corp. | 8,300 | 136 |
| * | AES Corp. | 7,400 | 110 |
| UGI Corp. | 1,400 | 35 | |
| 9,971 | |||
| Total Common Stocks | |||
| (Cost $256,468) | 276,627 | ||
| Temporary Cash Investments (0.4%)1 | |||
| Money Market Fund (0.3%) | |||
| 2,3 | Vanguard Market | ||
| Liquidity Fund, 0.267% | 854,089 | 854 | |
| Face | Market | |
| Amount | Value• | |
| ($000) | ($000) | |
| U.S. Government and Agency Obligations (0.1%) | ||
| 4,5 Federal Home Loan | ||
| Bank Discount Notes, | ||
| 0.220%, 3/26/10 | 300 | 300 |
| Total Temporary Cash Investments | ||
| (Cost $1,154) | 1,154 | |
| Total Investments (99.8%) | ||
| (Cost $257,622) | 277,781 | |
| Other Assets and Liabilities (0.2%) | ||
| Other Assets | 1,108 | |
| Liabilities3 | (583) | |
| 525 | ||
| Net Assets (100%) | 278,306 | |
60
Structured Broad Market Fund
| At September 30, 2009, net assets consisted of: | |
| Amount | |
| ($000) | |
| Paid-in Capital | 356,139 |
| Undistributed Net Investment Income | 3,578 |
| Accumulated Net Realized Losses | (101,575) |
| Unrealized Appreciation (Depreciation) | |
| Investment Securities | 20,159 |
| Futures Contracts | 5 |
| Net Assets | 278,306 |
| Institutional Shares—Net Assets | |
| Applicable to 198,200 outstanding | |
| $.001 par value shares of beneficial | |
| interest (unlimited authorization) | 3,763 |
| Net Asset Value Per Share— | |
| Institutional Shares | $18.99 |
| Institutional Plus Shares—Net Assets | |
| Applicable to 7,236,343 outstanding | |
| $.001 par value shares of beneficial | |
| interest (unlimited authorization) | 274,543 |
| Net Asset Value Per Share— | |
| Institutional Plus Shares | $37.94 |
• See Note A in Notes to Financial Statements.
* Non-income-producing security.
^ Part of security position is on loan to broker-dealers. The total value of securities on loan is $151,000.
1 The fund invests a portion of its cash reserves in equity markets through the use of index futures contracts. After giving effect to futures
investments, the fund’s effective common stock and temporary cash investment positions represent 100.0% and –0.2%, respectively, of
net assets.
2 Affiliated money market fund available only to Vanguard funds and certain trusts and accounts managed by Vanguard. Rate shown is the
7-day yield.
3 Includes $160,000 of collateral received for securities on loan.
4 The issuer operates under a congressional charter; its securities are not backed by the full faith and credit of the U.S. government.
5 Securities with a value of $300,000 have been segregated as initial margin for open futures contracts.
See accompanying Notes, which are an integral part of the Financial Statements.
61
| Structured Broad Market Fund | |
| Statement of Operations | |
| Year Ended | |
| September 30, 2009 | |
| ($000) | |
| Investment Income | |
| Income | |
| Dividends | 5,278 |
| Interest1 | 54 |
| Security Lending | 21 |
| Total Income | 5,353 |
| Expenses | |
| The Vanguard Group—Note B | |
| Investment Advisory Services | 155 |
| Management and Administrative—Institutional Shares | 5 |
| Management and Administrative—Institutional Plus Shares | 120 |
| Marketing and Distribution—Institutional Shares | — |
| Marketing and Distribution—Institutional Plus Shares | 60 |
| Custodian Fees | 13 |
| Auditing Fees | 23 |
| Shareholders’ Reports and Proxies—Institutional Shares | — |
| Shareholders’ Reports and Proxies—Institutional Plus Shares | 1 |
| Total Expenses | 377 |
| Net Investment Income | 4,976 |
| Realized Net Gain (Loss) | |
| Investment Securities Sold | (73,393) |
| Futures Contracts | (718) |
| Realized Net Gain (Loss) | (74,111) |
| Change in Unrealized Appreciation (Depreciation) | |
| Investment Securities | 54,398 |
| Futures Contracts | 67 |
| Change in Unrealized Appreciation (Depreciation) | 54,465 |
| Net Increase (Decrease) in Net Assets Resulting from Operations | (14,670) |
| 1 Interest income from an affiliated company of the fund was $54,000. | |
See accompanying Notes, which are an integral part of the Financial Statements.
62
| Structured Broad Market Fund | ||
| Statement of Changes in Net Assets | ||
| Year Ended September 30, | ||
| 2009 | 2008 | |
| ($000) | ($000) | |
| Increase (Decrease) in Net Assets | ||
| Operations | ||
| Net Investment Income | 4,976 | 5,107 |
| Realized Net Gain (Loss) | (74,111) | (26,908) |
| Change in Unrealized Appreciation (Depreciation) | 54,465 | (50,836) |
| Net Increase (Decrease) in Net Assets Resulting from Operations | (14,670) | (72,637) |
| Distributions | ||
| Net Investment Income | ||
| Institutional Shares | (76) | (137) |
| Institutional Plus Shares | (5,098) | (3,225) |
| Realized Capital Gain1 | ||
| Institutional Shares | — | (210) |
| Institutional Plus Shares | — | (4,456) |
| Total Distributions | (5,174) | (8,028) |
| Capital Share Transactions | ||
| Institutional Shares | 76 | (7,621) |
| Institutional Plus Shares | 45,610 | 41,977 |
| Net Increase (Decrease) from Capital Share Transactions | 45,686 | 34,356 |
| Total Increase (Decrease) | 25,842 | (46,309) |
| Net Assets | ||
| Beginning of Period | 252,464 | 298,773 |
| End of Period2 | 278,306 | 252,464 |
1 Includes fiscal 2008 short-term gain distributions totaling $239,000. Short-term gain distributions are treated as ordinary income dividends
for tax purposes.
2 Net Assets—End of Period includes undistributed net investment income of $3,578,000 and $3,776,000.
See accompanying Notes, which are an integral part of the Financial Statements.
63
| Structured Broad Market Fund | |||
| Financial Highlights | |||
| Institutional Shares | |||
| Nov. 30, | |||
| Year Ended | 20061 to | ||
| September 30, | Sept. 30, | ||
| For a Share Outstanding Throughout Each Period | 2009 | 2008 | 2007 |
| Net Asset Value, Beginning of Period | $21.53 | $28.67 | $26.59 |
| Investment Operations | |||
| Net Investment Income | .3522 | .402 | .3612 |
| Net Realized and Unrealized Gain (Loss) on Investments | (2.500) | (6.833) | 1.930 |
| Total from Investment Operations | (2.148) | (6.431) | 2.291 |
| Distributions | |||
| Dividends from Net Investment Income | (.392) | (.280) | (.116) |
| Distributions from Realized Capital Gains | — | (.429) | (.095) |
| Total Distributions | (.392) | (.709) | (.211) |
| Net Asset Value, End of Period | $18.99 | $21.53 | $28.67 |
| Total Return | –9.67% | –22.95% | 8.68% |
| Ratios/Supplemental Data | |||
| Net Assets, End of Period (Millions) | $4 | $4 | $14 |
| Ratio of Total Expenses to Average Net Assets | 0.25% | 0.20% | 0.25%3 |
| Ratio of Net Investment Income to Average Net Assets | 2.15% | 1.72% | 1.55%3 |
| Portfolio Turnover Rate | 62% | 70% | 66% |
1 Inception.
2 Calculated based on average shares outstanding.
3 Annualized.
See accompanying Notes, which are an integral part of the Financial Statements.
64
| Structured Broad Market Fund | |||
| Financial Highlights | |||
| Institutional Plus Shares | |||
| Oct. 3, | |||
| Year Ended | 20061 to | ||
| September 30, | Sept. 30, | ||
| For a Share Outstanding Throughout Each Period | 2009 | 2008 | 2007 |
| Net Asset Value, Beginning of Period | $43.07 | $57.39 | $50.00 |
| Investment Operations | |||
| Net Investment Income | .7252 | .873 | .9042 |
| Net Realized and Unrealized Gain (Loss) on Investments | (5.006) | (13.714) | 6.910 |
| Total from Investment Operations | (4.281) | (12.841) | 7.814 |
| Distributions | |||
| Dividends from Net Investment Income | (.849) | (.621) | (.234) |
| Distributions from Realized Capital Gains | — | (.858) | (.190) |
| Total Distributions | (.849) | (1.479) | (.424) |
| Net Asset Value, End of Period | $37.94 | $43.07 | $57.39 |
| Total Return | –9.60% | –22.91% | 15.69% |
| Ratios/Supplemental Data | |||
| Net Assets, End of Period (Millions) | $275 | $248 | $285 |
| Ratio of Total Expenses to Average Net Assets | 0.17% | 0.12% | 0.15%3 |
| Ratio of Net Investment Income to Average Net Assets | 2.23% | 1.80% | 1.65%3 |
| Portfolio Turnover Rate | 62% | 70% | 66% |
1 Commencement of operations as a registered investment company.
2 Calculated based on average shares outstanding.
3 Annualized.
See accompanying Notes, which are an integral part of the Financial Statements.
65
Structured Broad Market Fund
Notes to Financial Statements
Vanguard Structured Broad Market Fund is registered under the Investment Company Act of 1940 as an open-end investment company, or mutual fund. The fund offers two classes of shares: Institutional Shares and Institutional Plus Shares. Institutional Shares are available to investors who invest a minimum of $5 million. Institutional Plus Shares are available to investors who invest a minimum of $200 million ($100 million for investors with total Vanguard investments of at least $1 billion).
A. The following significant accounting policies conform to generally accepted accounting principles for U.S. mutual funds. The fund consistently follows such policies in preparing its financial statements.
1. Security Valuation: Securities are valued as of the close of trading on the New York Stock Exchange (generally 4 p.m., Eastern time) on the valuation date. Equity securities are valued at the latest quoted sales prices or official closing prices taken from the primary market in which each security trades; such securities not traded on the valuation date are valued at the mean of the latest quoted bid and asked prices. Securities for which market quotations are not readily available, or whose values have been materially affected by events occurring before the fund’s pricing time but after the close of the securities’ primary markets, are valued by methods deemed by the board of trustees to represent fair value. Investments in Vanguard Market Liquidity Fund are valued at that fund’s net asset value. Temporary cash investments acquired over 60 days to maturity are valued using the latest bid pr ices or using valuations based on a matrix system (which considers such factors as security prices, yields, maturities, and ratings), both as furnished by independent pricing services. Other temporary cash investments are valued at amortized cost, which approximates market value.
2. Futures Contracts: The fund uses index futures contracts to a limited extent, with the objective of maintaining full exposure to the stock market while maintaining liquidity. The fund may purchase or sell futures contracts to achieve a desired level of investment, whether to accommodate portfolio turnover or cash flows from capital share transactions. The primary risks associated with the use of futures contracts are imperfect correlation between changes in market values of stocks held by the fund and the prices of futures contracts, and the possibility of an illiquid market.
Futures contracts are valued at their quoted daily settlement prices. The aggregate principal amounts of the contracts are not recorded in the Statement of Net Assets. Fluctuations in the value of the contracts are recorded in the Statement of Net Assets as an asset (liability) and in the Statement of Operations as unrealized appreciation (depreciation) until the contracts are closed, when they are recorded as realized futures gains (losses).
3. Federal Income Taxes: The fund intends to continue to qualify as a regulated investment company and distribute all of its taxable income. Management has analyzed the fund’s tax positions taken for all open federal income tax years (September 30, 2007–2009), and has concluded that no provision for federal income tax is required in the fund’s financial statements.
4. Distributions: Distributions to shareholders are recorded on the ex-dividend date.
5. Security Lending: The fund may lend its securities to qualified institutional borrowers to earn additional income. Security loans are required to be secured at all times by collateral at least equal to the market value of securities loaned. The fund invests cash collateral received in Vanguard Market Liquidity Fund, and records a liability for the return of the collateral, during the period the securities are on loan. Security lending income represents the income earned on investing cash collateral, less expenses associated with the loan.
66
Structured Broad Market Fund
6. Other: Dividend income is recorded on the ex-dividend date. Interest income includes income distributions received from Vanguard Market Liquidity Fund and is accrued daily. Security transactions are accounted for on the date securities are bought or sold. Costs used to determine realized gains (losses) on the sale of investment securities are those of the specific securities sold.
Each class of shares has equal rights as to assets and earnings, except that each class separately bears certain class-specific expenses related to maintenance of shareholder accounts (included in Management and Administrative expenses), shareholder reporting, and proxies. Marketing and distribution expenses are allocated to each class of shares based on a method approved by the board of trustees. Income, other non-class-specific expenses, and gains and losses on investments are allocated to each class of shares based on its relative net assets.
B. The Vanguard Group furnishes at cost investment advisory, corporate management, administrative, marketing, and distribution services. The costs of such services are allocated to the fund under methods approved by the board of trustees. The fund has committed to provide up to 0.40% of its net assets in capital contributions to Vanguard. At September 30, 2009, the fund had contributed capital of $58,000 to Vanguard (included in Other Assets), representing 0.02% of the fund’s net assets and 0.02% of Vanguard’s capitalization. The fund’s trustees and officers are also directors and officers of Vanguard.
C. Various inputs may be used to determine the value of the fund’s investments. These inputs are summarized in three broad levels for financial statement purposes. The inputs or methodologies used to value securities are not necessarily an indication of the risk associated with investing in those securities.
Level 1—Quoted prices in active markets for identical securities.
Level 2—Other significant observable inputs (including quoted prices for similar securities, interest rates, prepayment speeds, credit risk, etc.).
Level 3—Significant unobservable inputs (including the fund’s own assumptions used to determine the fair value of investments).
The following table summarizes the fund’s investments as of September 30, 2009, based on the inputs used to value them:
| Level 1 | Level 2 | Level 3 | |
| Investments | ($000) | ($000) | ($000) |
| Common Stocks | 276,627 | — | — |
| Temporary Cash Investments | 854 | 300 | — |
| Futures Contracts—Liabilities1 | (3) | — | — |
| Total | 277,478 | 300 | — |
| 1 Represents variation margin on the last day of the reporting period. |
67
Structured Broad Market Fund
D. At September 30, 2009, the aggregate settlement value of open futures contracts and the related unrealized appreciation (depreciation) were:
| ($000) | ||||
| Number of | Aggregate | Unrealized | ||
| Long (Short) | Settlement | Appreciation | ||
| Futures Contracts | Expiration | Contracts | Value | (Depreciation) |
| E-mini S&P 500 Index | December 2009 | 16 | 842 | (6) |
| S&P 500 Index | December 2009 | 3 | 790 | 11 |
Unrealized appreciation (depreciation) on open futures contracts is required to be treated as realized gain (loss) for tax purposes.
E. Distributions are determined on a tax basis and may differ from net investment income and realized capital gains for financial reporting purposes. Differences may be permanent or temporary. Permanent differences are reclassified among capital accounts in the financial statements to reflect their tax character. Temporary differences arise when certain items of income, expense, gain, or loss are recognized in different periods for financial statement and tax purposes; these differences will reverse at some time in the future. Differences in classification may also result from the treatment of short-term gains as ordinary income for tax purposes.
For tax purposes, at September 30, 2009, the fund had $3,719,000 of ordinary income available for distribution. The fund had available capital loss carryforwards totaling $53,713,000 to offset future net capital gains through September 30, 2017. In addition, the fund realized losses of $47,850,000 during the period from November 1, 2008, through September 30, 2009, which are deferred and will be treated as realized for tax purposes in fiscal 2010.
At September 30, 2009, the cost of investment securities for tax purposes was $257,622,000. Net unrealized appreciation of investment securities for tax purposes was $20,159,000, consisting of unrealized gains of $35,057,000 on securities that had risen in value since their purchase and $14,898,000 in unrealized losses on securities that had fallen in value since their purchase.
F. During the year ended September 30, 2009, the fund purchased $185,270,000 of investment securities and sold $140,527,000 of investment securities, other than temporary cash investments.
68
Structured Broad Market Fund
| G. Capital share transactions for each class of shares were: | ||||
| Year Ended September 30, | ||||
| 2009 | 2008 | |||
| Amount | Shares | Amount | Shares | |
| ($000) | (000) | ($000) | (000) | |
| Institutional Shares | ||||
| Issued | — | — | — | — |
| Issued in Lieu of Cash Distributions | 76 | 5 | 347 | 13 |
| Redeemed | — | — | (7,968) | (308) |
| Net Increase (Decrease)—Institutional Shares | 76 | 5 | (7,621) | (295) |
| Institutional Plus Shares | ||||
| Issued | 43,734 | 1,413 | 58,835 | 1,175 |
| Issued in Lieu of Cash Distributions | 1,876 | 58 | 3,142 | 58 |
| Redeemed | — | — | (20,000) | (429) |
| Net Increase (Decrease)—Institutional Plus Shares | 45,610 | 1,471 | 41,977 | 804 |
H. In preparing the financial statements as of September 30, 2009, management considered the impact of subsequent events occurring through November 10, 2009, for potential recognition or disclosure in these financial statements.
69
Report of Independent Registered Public Accounting Firm
To the Trustees of Vanguard Quantitative Funds and the Shareholders of Vanguard Structured Large-Cap Equity Fund, Vanguard Structured Large-Cap Growth Fund, Vanguard Structured Large-Cap Value Fund, and Vanguard Structured Broad Market Fund:
In our opinion, the accompanying statements of net assets and the related statements of operations and of changes in net assets and the financial highlights present fairly, in all material respects, the financial position of Vanguard Structured Large-Cap Equity Fund, Vanguard Structured Large-Cap Growth Fund, Vanguard Structured Large-Cap Value Fund, and Vanguard Structured Broad Market Fund (the “Funds”) at September 30, 2009, and the results of each of their operations, for the year ended, and the changes in each of their net assets and the financial highlights for each of the periods indicated, in conformity with accounting principles generally accepted in the United States of America. These financial statements and financial highlights (hereafter referred to as “financial statements”) are the responsibility of the Funds’ management; our responsibility is to express an opinion on t hese financial statements based on our audits. We conducted our audits of these financial statements in accordance with the standards of the Public Company Accounting Oversight Board (United States). Those standards require that we plan and perform the audit to obtain reasonable assurance about whether the financial statements are free of material misstatement. An audit includes examining, on a test basis, evidence supporting the amounts and disclosures in the financial statements, assessing the accounting principles used and significant estimates made by management, and evaluating the overall financial statement presentation. We believe that our audits, which included confirmation of securities at September 30, 2009 by correspondence with the custodian and broker, and by agreement to the underlying ownership records for Vanguard Market Liquidity Fund, provide a reasonable basis for our opinion.
PricewaterhouseCoopers LLP
Philadelphia, Pennsylvania
November 10, 2009
70
| Special 2009 tax information (unaudited) for Vanguard Structured Equity Funds |
This information for the fiscal year ended September 30, 2009, is included pursuant to provisions of the Internal Revenue Code.
The funds distributed qualified dividend income to shareholders during the fiscal year as follows:
| Qualified | |
| Dividend | |
| Income | |
| Fund | ($000) |
| Structured Large-Cap Equity | 17,826 |
| Structured Large-Cap Growth | 755 |
| Structured Large-Cap Value | 1,827 |
| Structured Broad Market | 5,174 |
For corporate shareholders, the percentage of investment income (dividend income plus short-term gains, if any) that qualifies for the dividends-received deduction is as follows:
| Fund | Percentage |
| Structured Large-Cap Equity | 100.0% |
| Structured Large-Cap Growth | 100.0 |
| Structured Large-Cap Value | 100.0 |
| Structured Broad Market | 99.8 |
71
About Your Fund’s Expenses
As a shareholder of the fund, you incur ongoing costs, which include costs for portfolio management, administrative services, and shareholder reports (like this one), among others. Operating expenses, which are deducted from a fund’s gross income, directly reduce the investment return of the fund.
A fund’s expenses are expressed as a percentage of its average net assets. This figure is known as the expense ratio. The following examples are intended to help you understand the ongoing costs (in dollars) of investing in your fund and to compare these costs with those of other mutual funds. The examples are based on an investment of $1,000 made at the beginning of the period shown and held for the entire period.
The accompanying table illustrates your fund’s costs in two ways:
• Based on actual fund return. This section helps you to estimate the actual expenses that you paid over the period. The “Ending Account Value” shown is derived from the fund’s actual return, and the third column shows the dollar amount that would have been paid by an investor who started with $1,000 in the fund. You may use the information here, together with the amount you invested, to estimate the expenses that you paid over the period.
To do so, simply divide your account value by $1,000 (for example, an $8,600 account value divided by $1,000 = 8.6), then multiply the result by the number given for your fund under the heading “Expenses Paid During Period.”
• Based on hypothetical 5% yearly return. This section is intended to help you compare your fund’s costs with those of other mutual funds. It assumes that the fund had a yearly return of 5% before expenses, but that the expense ratio is unchanged. In this case—because the return used is not the fund’s actual return—the results do not apply to your investment. The example is useful in making comparisons because the Securities and Exchange Commission requires all mutual funds to calculate expenses based on a 5% return. You can assess your fund’s costs by comparing this hypothetical example with the hypothetical examples that appear in shareholder reports of other funds.
Note that the expenses shown in the table are meant to highlight and help you compare ongoing costs only and do not reflect transaction costs incurred by the fund for buying and selling securities. Your fund does not charge transaction fees, such as purchase or redemption fees, nor does it carry a “sales load.”
The calculations assume no shares were bought or sold during the period. Your actual costs may have been higher or lower, depending on the amount of your investment and the timing of any purchases or redemptions.
You can find more information about the fund’s expenses, including annual expense ratios, in the Financial Statements section of this report. For additional information on operating expenses and other shareholder costs, please refer to your fund’s current prospectus.
72
| Six Months Ended September 30, 2009 | |||
| Beginning | Ending | Expenses | |
| Account Value | Account Value | Paid During | |
| Structured Equity Fund | 3/31/2009 | 9/30/2009 | Period1 |
| Based on Actual Fund Return | |||
| Structured Large-Cap Equity | |||
| Institutional Shares | $1,000.00 | $1,313.77 | $1.45 |
| Institutional Plus Shares | 1,000.00 | 1,313.89 | 1.04 |
| Structured Large-Cap Growth | |||
| Institutional Shares | $1,000.00 | $1,314.88 | $1.45 |
| Institutional Plus Shares | 1,000.00 | 1,315.22 | 0.99 |
| Structured Large-Cap Value | |||
| Institutional Plus Shares | $1,000.00 | $1,342.30 | $1.06 |
| Structured Broad Market | |||
| Institutional Shares | $1,000.00 | $1,327.04 | $1.40 |
| Institutional Plus Shares | 1,000.00 | 1,327.50 | 0.99 |
| Based on Hypothetical 5% Yearly Return | |||
| Structured Large-Cap Equity | |||
| Institutional Shares | $1,000.00 | $1,023.82 | $1.27 |
| Institutional Plus Shares | 1,000.00 | 1,024.17 | 0.91 |
| Structured Large-Cap Growth | |||
| Institutional Shares | $1,000.00 | $1,023.82 | $1.27 |
| Institutional Plus Shares | 1,000.00 | 1,024.22 | 0.86 |
| Structured Large-Cap Value | |||
| Institutional Plus Shares | $1,000.00 | $1,024.17 | $0.91 |
| Structured Broad Market | |||
| Institutional Shares | $1,000.00 | $1,023.87 | $1.22 |
| Institutional Plus Shares | 1,000.00 | 1,024.22 | 0.86 |
1 The calculations are based on expenses incurred in the most recent six-month period. The funds’ annualized six-month expense ratios for that period are: 0.25% for the Structured Large-Cap Equity Fund Institutional Shares, 0.18% for the Institutional Plus Shares; 0.25% for the Structured Large-Cap Growth Fund Institutional Shares, 0.17% for the Institutional Plus Shares; 0.18% for the Structured Large-Cap Value Fund Institutional Plus Shares; 0.24% for the Structured Broad Market Fund Institutional Shares, 0.17% for the Institutional Plus Shares.
The dollar amounts shown as “Expenses Paid” are equal to the annualized expense ratio multiplied by the average account value over the period, multiplied by the number of days in the most recent six-month period, then divided by the number of days in the most recent 12-month period.
73
Glossary
Beta. A measure of the magnitude of a fund’s past share-price fluctuations in relation to the ups and downs of a given market index. The index is assigned a beta of 1.00. Compared with a given index, a fund with a beta of 1.20 typically would have seen its share price rise or fall by 12% when the index rose or fell by 10%. For this report, beta is based on returns over the past 36 months for both the fund and the index. Note that a fund’s beta should be reviewed in conjunction with its R-squared (see definition). The lower the R-squared, the less correlation there is between the fund and the index, and the less reliable beta is as an indicator of volatility.
Earnings Growth Rate. The average annual rate of growth in earnings over the past five years for the stocks now in a fund.
Equity Exposure. A measure that reflects a fund’s investments in stocks and stock futures. Any holdings in short-term reserves are excluded.
Expense Ratio. The percentage of a fund’s average net assets used to pay its annual administrative and advisory expenses. These expenses directly reduce returns to investors.
Foreign Holdings. The percentage of a fund represented by stocks or depositary receipts of companies based outside the United States.
Median Market Cap. An indicator of the size of companies in which a fund invests; the midpoint of market capitalization (market price x shares outstanding) of a fund’s stocks, weighted by the proportion of the fund’s assets invested in each stock. Stocks representing half of the fund’s assets have market capitalizations above the median, and the rest are below it.
Price/Book Ratio. The share price of a stock divided by its net worth, or book value, per share. For a fund, the weighted average price/book ratio of the stocks it holds.
Price/Earnings Ratio. The ratio of a stock’s current price to its per-share earnings over the past year. For a fund, the weighted average P/E of the stocks it holds. P/E is an indicator of market expectations about corporate prospects; the higher the P/E, the greater the expectations for a company’s future growth.
R-Squared. A measure of how much of a fund’s past returns can be explained by the returns from the market in general, as measured by a given index. If a fund’s total returns were precisely synchronized with an index’s returns, its R-squared would be 1.00. If the fund’s returns bore no relationship to the index’s returns, its R-squared would be 0. For this report, R-squared is based on returns over the past 36 months for both the fund and the index.
Return on Equity. The annual average rate of return generated by a company during the past five years for each dollar of shareholder’s equity (net income divided by shareholder’s equity). For a fund, the weighted average return on equity for the companies whose stocks it holds.
Short-Term Reserves. The percentage of a fund invested in highly liquid, short-term securities that can be readily converted to cash.
74
Turnover Rate. An indication of the fund’s trading activity. Funds with high turnover rates incur higher transaction costs and may be more likely to distribute capital gains (which may be taxable to investors). The turnover rate excludes in-kind transactions, which have minimal impact on costs.
Yield. A fund’s 30-day SEC yield is derived using a formula specified by the U.S. Securities and Exchange Commission. Under the formula, data related to the fund’s security holdings in the previous 30 days are used to calculate the fund’s hypothetical net income for that period, which is then annualized and divided by the fund’s estimated average net assets over the calculation period. For the purposes of this calculation, a security’s income is based on its current market yield to maturity (in the case of bonds) or its projected dividend yield (for stocks). Because the SEC yield represents hypothetical annualized income, it will differ—at times significantly—from the fund’s actual experience. As a result, the fund’s income distributions may be higher or lower than implied by the SEC y ield.
75
The People Who Govern Your Fund
The trustees of your mutual fund are there to see that the fund is operated and managed in your best interests since, as a shareholder, you are a part owner of the fund. Your fund’s trustees also serve on the board of directors of The Vanguard Group, Inc., which is owned by the Vanguard funds and provides services to them on an at-cost basis.
A majority of Vanguard’s board members are independent, meaning that they have no affiliation with Vanguard or the funds they oversee, apart from the sizable personal investments they have made as private individuals. The independent board members have distinguished backgrounds in business, academia, and public service. Each of the trustees and executive officers oversees 156 Vanguard funds.
The following table provides information for each trustee and executive officer of the fund. More information about the trustees is in the Statement of Additional Information, which can be obtained, without charge, by contacting Vanguard at 800-662-7447, or online at www.vanguard.com.
| Interested Trustees | Emerson U. Fullwood |
| Born 1948. Trustee Since January 2008. Principal | |
| John J. Brennan1 | Occupation(s) During the Past Five Years: Executive |
| Born 1954. Trustee Since May 1987. Chairman of | Chief Staff and Marketing Officer for North America |
| the Board. Principal Occupation(s) During the Past | and Corporate Vice President (retired 2008) of Xerox |
| Five Years: Chairman of the Board and Director/Trustee | Corporation (photocopiers and printers); Director of |
| of The Vanguard Group, Inc., and of each of the | SPX Corporation (multi-industry manufacturing), the |
| investment companies served by The Vanguard Group; | United Way of Rochester, the Boy Scouts of America, |
| Chief Executive Officer (1996–2008) and President | Amerigroup Corporation (direct health and medical |
| (1989–2008) of The Vanguard Group and of each of the | insurance carriers), and Monroe Community College |
| investment companies served by The Vanguard Group; | Foundation. |
| Chairman of the Financial Accounting Foundation; | |
| Governor of the Financial Industry Regulatory Authority | Rajiv L. Gupta |
| (FINRA); Director of United Way of Southeastern | Born 1945. Trustee Since December 2001.2 Principal |
| Pennsylvania. | Occupation(s) During the Past Five Years: Chairman |
| and Chief Executive Officer (retired 2009) and President | |
| F. William McNabb III1 | (2006–2008) of Rohm and Haas Co. (chemicals); Board |
| Born 1957. Trustee Since July 2009. Principal | Member of American Chemistry Council; Director of |
| Occupation(s) During the Past Five Years: Director of | Tyco International, Ltd. (diversified manufacturing and |
| The Vanguard Group, Inc., since 2008; Chief Executive | services) and Hewlett-Packard Co. (electronic computer |
| Officer and President of The Vanguard Group and of | manufacturing); Trustee of The Conference Board. |
| each of the investment companies served by The | |
| Vanguard Group since 2008; Director of Vanguard | Amy Gutmann |
| Marketing Corporation; Managing Director of The | Born 1949. Trustee Since June 2006. Principal |
| Vanguard Group (1995–2008). | Occupation(s) During the Past Five Years: President of |
| the University of Pennsylvania; Christopher H. Browne | |
| Distinguished Professor of Political Science in the School | |
| Independent Trustees | of Arts and Sciences with secondary appointments |
| at the Annenberg School for Communication and the | |
| Charles D. Ellis | Graduate School of Education of the University of |
| Born 1937. Trustee Since January 2001. Principal | Pennsylvania; Director of Carnegie Corporation of |
| Occupation(s) During the Past Five Years: Applecore | New York, Schuylkill River Development Corporation, |
| Partners (pro bono ventures in education); Senior | and Greater Philadelphia Chamber of Commerce; |
| Advisor to Greenwich Associates (international business | Trustee of the National Constitution Center. |
| strategy consulting); Successor Trustee of Yale University; | |
| Overseer of the Stern School of Business at New York | |
| University; Trustee of the Whitehead Institute for | |
| Biomedical Research. |
| JoAnn Heffernan Heisen | Executive Officers | |
| Born 1950. Trustee Since July 1998. Principal | ||
| Occupation(s) During the Past Five Years: Corporate | Thomas J. Higgins1 | |
| Vice President and Chief Global Diversity Officer since | Born 1957. Chief Financial Officer Since September | |
| 2006 (retired 2008) and Member of the Executive | 2008. Principal Occupation(s) During the Past Five | |
| Committee (retired 2008) of Johnson & Johnson | Years: Principal of The Vanguard Group, Inc.; Chief | |
| (pharmaceuticals/consumer products); Vice President | Financial Officer of each of the investment companies | |
| and Chief Information Officer of Johnson & Johnson | served by The Vanguard Group since 2008; Treasurer | |
| (1997–2005); Director of the University Medical Center | of each of the investment companies served by The | |
| at Princeton and Women’s Research and Education | Vanguard Group (1998–2008). | |
| Institute. | ||
| Kathryn J. Hyatt1 | ||
| André F. Perold | Born 1955. Treasurer Since November 2008. Principal | |
| Born 1952. Trustee Since December 2004. Principal | Occupation(s) During the Past Five Years: Principal of | |
| Occupation(s) During the Past Five Years: George Gund | The Vanguard Group, Inc.; Treasurer of each of the | |
| Professor of Finance and Banking, Harvard Business | investment companies served by The Vanguard | |
| School; Chairman of UNX, Inc. (equities trading firm); | Group since 2008; Assistant Treasurer of each of the | |
| Chair of the Investment Committee of HighVista | investment companies served by The Vanguard Group | |
| Strategies LLC (private investment firm). | (1988–2008). | |
| Alfred M. Rankin, Jr. | Heidi Stam1 | |
| Born 1941. Trustee Since January 1993. Principal | Born 1956. Secretary Since July 2005. Principal | |
| Occupation(s) During the Past Five Years: Chairman, | Occupation(s) During the Past Five Years: Managing | |
| President, and Chief Executive Officer of NACCO | Director of The Vanguard Group, Inc., since 2006; | |
| Industries, Inc. (forklift trucks/housewares/lignite); | General Counsel of The Vanguard Group since 2005; | |
| Director of Goodrich Corporation (industrial products/ | Secretary of The Vanguard Group and of each of the | |
| aircraft systems and services); Deputy Chairman of | investment companies served by The Vanguard Group | |
| the Federal Reserve Bank of Cleveland. | since 2005; Director and Senior Vice President of | |
| Vanguard Marketing Corporation since 2005; Principal | ||
| Peter F. Volanakis | of The Vanguard Group (1997–2006). | |
| Born 1955. Trustee Since July 2009. Principal | ||
| Occupation(s) During the Past Five Years: President | ||
| since 2007 and Chief Operating Officer since 2005 | Vanguard Senior Management Team | |
| of Corning Incorporated (communications equipment); | ||
| President of Corning Technologies (2001–2005); Director | R. Gregory Barton | Michael S. Miller |
| of Corning Incorporated and Dow Corning; Trustee of | Mortimer J. Buckley | James M. Norris |
| the Corning Incorporated Foundation and the Corning | Kathleen C. Gubanich | Glenn W. Reed |
| Museum of Glass; Overseer of the Amos Tuck School | Paul A. Heller | George U. Sauter |
| of Business Administration at Dartmouth College. | ||
| Founder | ||
| John C. Bogle | ||
| Chairman and Chief Executive Officer, 1974–1996 | ||
1 These individuals are “interested persons” as defined in the Investment Company Act of 1940.
2 December 2002 for Vanguard Equity Income Fund, Vanguard Growth Equity Fund, the Vanguard Municipal Bond Funds, and the Vanguard State Tax-Exempt Funds.
 | ||
| P.O. Box 2600 | ||
| Valley Forge, PA 19482-2600 | ||
| Connect with Vanguard® > www.vanguard.com | ||
| Fund Information > 800-662-7447 | All comparative mutual fund data are from Lipper Inc. |
| or Morningstar, Inc., unless otherwise noted. | |
| Direct Investor Account Services > 800-662-2739 | |
| Institutional Investor Services > 800-523-1036 | You can obtain a free copy of Vanguard’s proxy voting |
| guidelines by visiting our website, www.vanguard.com, | |
| Text Telephone for People | and searching for “proxy voting guidelines,” or by |
| With Hearing Impairment > 800-749-7273 | calling Vanguard at 800-662-2739. The guidelines are |
| also available from the SEC’s website, www.sec.gov. | |
| In addition, you may obtain a free report on how your | |
| fund voted the proxies for securities it owned during | |
| This material may be used in conjunction | the 12 months ended June 30. To get the report, visit |
| with the offering of shares of any Vanguard | either www.vanguard.com or www.sec.gov. |
| fund only if preceded or accompanied by | |
| the fund’s current prospectus. | You can review and copy information about your fund |
| at the SEC’s Public Reference Room in Washington, D.C. | |
| CFA® is a trademark owned by CFA Institute. | To find out more about this public service, call the SEC |
| at 202-551-8090. Information about your fund is also | |
| available on the SEC’s website, and you can receive | |
| copies of this information, for a fee, by sending a | |
| request in either of two ways: via e-mail addressed to | |
| publicinfo@sec.gov or via regular mail addressed to the | |
| Public Reference Section, Securities and Exchange | |
| Commission, Washington, DC 20549-0102. | |
| © 2009 The Vanguard Group, Inc. | |
| All rights reserved. | |
| Vanguard Marketing Corporation, Distributor. | |
| Q08700 112009 | |
Item 2: Code of Ethics. The Registrant has adopted a code of ethics that applies to the Registrant’s principal executive officer, principal financial officer, principal accounting officer or controller or persons performing similar functions. The Code of Ethics was amended during the reporting period covered by this report to make certain technical, non-material changes.
Item 3: Audit Committee Financial Expert. The following members of the Audit Committee have been determined by the Registrant’s Board of Trustees to be Audit Committee Financial Experts serving on its Audit Committee, and to be independent: Charles D. Ellis, Rajiv L. Gupta, JoAnn Heffernan Heisen, André F. Perold, and Alfred M. Rankin, Jr.
Item 4: Principal Accountant Fees and Services.
(a) Audit Fees.
Audit Fees of the Registrant
Fiscal Year Ended September 30, 2009: $117,000
Fiscal Year Ended September 30, 2008: $111,000
Aggregate Audit Fees of Registered Investment Companies in the Vanguard Group.
Fiscal Year Ended September 30, 2009: $3,354,640
Fiscal Year Ended September 30, 2008: $3,055,590
(b) Audit-Related Fees.
Fiscal Year Ended September 30, 2009: $876,210
Fiscal Year Ended September 30, 2008: $626,240
Includes fees billed in connection with assurance and related services provided to the Registrant, The Vanguard Group, Inc., Vanguard Marketing Corporation, and other registered investment companies in the Vanguard Group.
(c) Tax Fees.
Fiscal Year Ended September 30, 2009: $423,070
Fiscal Year Ended September 30, 2008: $230,400
Includes fees billed in connection with tax compliance, planning and advice services provided to the Registrant, The Vanguard Group, Inc., Vanguard Marketing Corporation, and other registered investment companies in the Vanguard Group and related to income and excise taxes.
(d) All Other Fees.
Fiscal Year Ended September 30, 2009: $0
Fiscal Year Ended September 30, 2008: $0
Includes fees billed for services related to risk management and privacy matters. Services were provided to the Registrant, The Vanguard Group, Inc., Vanguard Marketing Corporation, and other registered investment companies in the Vanguard Group.
(e) (1) Pre-Approval Policies. The policy of the Registrant’s Audit Committee is to consider and, if appropriate, approve before the principal accountant is engaged for such services, all specific audit and non-audit services provided to: (1) the Registrant; (2) The Vanguard Group, Inc.; (3) other entities controlled by The Vanguard Group, Inc. that provide ongoing services to the Registrant; and (4) other registered investment companies in the Vanguard Group. In making a determination, the Audit Committee considers whether the services are consistent with maintaining the principal accountant’s independence.
In the event of a contingency situation in which the principal accountant is needed to provide services in between scheduled Audit Committee meetings, the Chairman of the Audit Committee would be called on to consider and, if appropriate, pre-approve audit or permitted non-audit services in an amount sufficient to complete services through the next Audit Committee meeting, and to determine if such services would be consistent with maintaining the accountant’s independence. At the next scheduled Audit Committee meeting, services and fees would be presented to the Audit Committee for formal consideration, and, if appropriate, approval by the entire Audit Committee. The Audit Committee would again consider whether such services and fees are consistent with maintaining the principal accountant’s independence.
The Registrant’s Audit Committee is informed at least annually of all audit and non-audit services provided by the principal accountant to the Vanguard complex, whether such services are provided to: (1) the Registrant; (2) The Vanguard Group, Inc.; (3) other entities controlled by The Vanguard Group, Inc. that provide ongoing services to the Registrant; or (4) other registered investment companies in the Vanguard Group.
(2) No percentage of the principal accountant’s fees or services were approved pursuant to the waiver provision of paragraph (c)(7)(i)(C) of Rule 2-01 of Regulation S-X.
(f) For the most recent fiscal year, over 50% of the hours worked under the principal accountant’s engagement were not performed by persons other than full-time, permanent employees of the principal accountant.
(g) Aggregate Non-Audit Fees.
Fiscal Year Ended September 30, 2009: $423,070
Fiscal Year Ended September 30, 2008: $230,400
Includes fees billed for non-audit services provided to the Registrant, The Vanguard Group, Inc., Vanguard Marketing Corporation, and other registered investment companies in the Vanguard Group.
(h) For the most recent fiscal year, the Audit Committee has determined that the provision of all non-audit services was consistent with maintaining the principal accountant’s independence.
Item 5: Not Applicable.
Item 6: Not Applicable.
Item 7: Not Applicable.
Item 8: Not Applicable.
Item 9: Not Applicable.
Item 10: Not Applicable.
Item 11: Controls and Procedures.
(a) Disclosure Controls and Procedures. The Principal Executive and Financial Officers concluded that the Registrant's Disclosure Controls and Procedures are effective based on their evaluation of the Disclosure Controls and Procedures as of a date within 90 days of the filing date of this report.
(b) Internal Control Over Financial Reporting. There were no significant changes in Registrant’s Internal Control Over Financial Reporting or in other factors that could significantly affect this control subsequent to the date of the evaluation, including any corrective actions with regard to significant deficiencies and material weaknesses.
Item 12: Exhibits.
(a) Code of Ethics.
(b) Certifications.
Pursuant to the requirements of the Securities Exchange Act of 1934 and the Investment Company Act of 1940, the registrant has duly caused this report to be signed on its behalf by the undersigned, thereunto duly authorized.
| VANGUARD QUANTITATIVE FUNDS | |
| By: | /s/ F. WILLIAM MCNABB III* |
| F. WILLIAM MCNABB III | |
| CHIEF EXECUTIVE OFFICER | |
Date: November 20, 2009
Pursuant to the requirements of the Securities Exchange Act of 1934 and the Investment Company Act of 1940, this report has been signed below by the following persons on behalf of the registrant and in the capacities and on the dates indicated.
| VANGUARD QUANTITATIVE FUNDS | |
| By: | /s/ F. WILLIAM MCNABB III* |
| F. WILLIAM MCNABB III | |
| CHIEF EXECUTIVE OFFICER | |
Date: November 20, 2009
| VANGUARD QUANTITATIVE FUNDS | |
| By: | /s/ THOMAS J. HIGGINS* |
| THOMAS J. HIGGINS | |
| CHIEF FINANCIAL OFFICER | |
Date: November 20, 2009
*By: /s/ Heidi Stam
Heidi Stam, pursuant to a Power of Attorney filed on July 24, 2009, see File Number 2-88373,
and a Power of Attorney filed on October 16, 2009, see File Number 2-52698,
both Incorporated by Reference.