UNITED STATES
SECURITIES AND EXCHANGE COMMISSION
Washington, D.C. 20549
FORM N-CSR
CERTIFIED SHAREHOLDER REPORT
OF
REGISTERED MANAGEMENT INVESTMENT COMPANIES
Investment Company Act file number: 811-04526
Name of Registrant: Vanguard Quantitative Funds
Address of Registrant:
P.O. Box 2600
Valley Forge, PA 19482
Name and address of agent for service:
Heidi Stam, Esquire
P.O. Box 876
Valley Forge, PA 19482
Registrant’s telephone number, including area code: (610) 669-1000
Date of fiscal year end: September 30
Date of reporting period: October 1, 2011 – September 30, 2012
Item 1: Reports to Shareholders
|
| Annual Report | September 30, 2012 |
| Vanguard Growth and Income Fund |
 |
> Vanguard Growth and Income Fund returned about 31% for the fiscal year ended September 30, 2012.
> For the 12-month period, the fund outpaced both its benchmark, the S&P 500 Index, and its large-capitalization core fund peers.
> Stocks in the information technology, financial, and consumer discretionary sectors helped fuel the fund’s advance.
| Contents | |
| Your Fund’s Total Returns. | 1 |
| Chairman’s Letter. | 2 |
| Advisors’ Report. | 8 |
| Fund Profile. | 13 |
| Performance Summary. | 14 |
| Financial Statements. | 16 |
| Your Fund’s After-Tax Returns. | 36 |
| About Your Fund’s Expenses. | 37 |
| Trustees Approve Advisory Arrangements. | 39 |
| Glossary. | 41 |
Please note: The opinions expressed in this report are just that—informed opinions. They should not be considered promises or advice. Also, please keep in mind that the information and opinions cover the period through the date on the front of this report. Of course, the risks of investing in your fund are spelled out in the prospectus.
See the Glossary for definitions of investment terms used in this report.
About the cover: Our cover photograph shows rigging on the HMSSurprise, a replica of an 18th-century Royal Navy frigate. It was featured in the 2003 movie Master and Commander: The Far Side of the World, which was based on Patrick O’Brian’s sea novels, set amid the Napoleonic Wars. Vanguard was named for another ship of that era, the HMSVanguard, which was the flagship of British Admiral Horatio Nelson at the Battle of the Nile.
Your Fund’s Total Returns
| Fiscal Year Ended September 30, 2012 | |
| Total | |
| Returns | |
| Vanguard Growth and Income Fund | |
| Investor Shares | 31.27% |
| Admiral™ Shares | 31.40 |
| S&P 500 Index | 30.20 |
| Large-Cap Core Funds Average | 27.34 |
Large-Cap Core Funds Average: Derived from data provided by Lipper Inc.
Admiral Shares carry lower expenses and are available to investors who meet certain account-balance requirements.
| Your Fund’s Performance at a Glance | ||||
| September 30, 2011, Through September 30, 2012 | ||||
| Distributions Per Share | ||||
| Starting | Ending | Income | Capital | |
| Share Price | Share Price | Dividends | Gains | |
| Vanguard Growth and Income Fund | ||||
| Investor Shares | $23.86 | $30.73 | $0.525 | $0.000 |
| Admiral Shares | 38.97 | 50.18 | 0.910 | 0.000 |
1

Chairman’s Letter
Dear Shareholder,
Global stock markets began the fiscal year strongly and, despite volatility in the middle of the period, finished on a high note with four straight monthly gains. In this robust environment, Vanguard Growth and Income Fund returned about 31% for both Investor and Admiral Shares. The fund’s returns exceeded the return of its benchmark, the Standard & Poor’s 500 Index, as well as the average return for its large-capitalization core fund peers.
The fund posted double-digit results in all ten market sectors for the 12-month period. Stocks in the information technology, financial, and consumer discretionary sectors were among the strongest performers.
Note: If you hold shares in a taxable account, you may wish to review the table and discussion of after-tax returns for the fiscal year, based on the highest tax braket, later in this report.
Stocks notched a powerful rally, with help from central bankers
U.S. stocks surged 30% in the 12 months ended September 30, 2012, outpacing the gains of their international counterparts. The rally came amid moves by U.S. and European central bankers to quiet—at least temporarily—investors’ concerns about the U.S. economy and the finances of European governments and banks.
2
Although U.S. stocks were the standouts, European and emerging markets stocks also posted double-digit results. The developed markets of the Pacific region were the weakest performers but still recorded a modest advance.
In July, the president of the European Central Bank declared that policymakers would do whatever was needed to preserve the euro common currency.
That pronouncement was encouraging to investors, but Europe’s financial troubles are by no means resolved. Vanguard economists believe the most likely scenario is that the Eurozone will “muddle through” for several years, with occasional spikes in market volatility, as fiscal tightening continues in the face of weak economic growth.
| Market Barometer | |||
| Average Annual Total Returns | |||
| Periods Ended September 30, 2012 | |||
| One | Three | Five | |
| Year | Years | Years | |
| Stocks | |||
| Russell 1000 Index (Large-caps) | 30.06% | 13.27% | 1.22% |
| Russell 2000 Index (Small-caps) | 31.91 | 12.99 | 2.21 |
| Dow Jones U.S. Total Stock Market Index | 30.00 | 13.29 | 1.53 |
| MSCI All Country World Index ex USA (International) | 14.48 | 3.17 | -4.12 |
| Bonds | |||
| Barclays U.S. Aggregate Bond Index (Broad taxable market) | 5.16% | 6.19% | 6.53% |
| Barclays Municipal Bond Index (Broad tax-exempt market) | 8.32 | 5.99 | 6.06 |
| Citigroup Three-Month U.S. Treasury Bill Index | 0.05 | 0.08 | 0.63 |
| CPI | |||
| Consumer Price Index | 1.99% | 2.33% | 2.11% |
3
Bonds produced solid returns; future results may be more muted
Bonds once again advanced; the broad U.S. taxable market returned about 5% for the 12 months. Among U.S. Treasuries, long-term bonds were particularly strong as they benefited from the Federal Reserve’s bond-buying program.
As bond prices rose, the yield of the 10-year U.S. Treasury note fell to a record low in July, closing below 1.5%. (Bond yields and prices move in opposite directions.) By the end of the period, the yield had climbed, but it still remained low by historical standards.
Bondholders have enjoyed years of strong returns. But as Tim Buckley, our incoming chief investment officer, has noted, investors shouldn’t be surprised if future results are much more modest. As yields tumble, the scope for further declines—and price increases—diminishes.
The Federal Reserve announced on September 13 that it would continue to hold its target for short-term interest rates between 0% and 0.25% at least through mid-2015. The exceptionally low rates, in place since late 2008, kept a tight lid on returns from money market funds and savings accounts.
| Expense Ratios | |||
| Your Fund Compared With Its Peer Group | |||
| Investor | Admiral | Peer Group | |
| Shares | Shares | Average | |
| Growth and Income Fund | 0.34% | 0.23% | 1.19% |
The fund expense ratios shown are from the prospectus dated January 26, 2012, and represent estimated costs for the current fiscal year. For the fiscal year ended September 30, 2012, the fund’s expense ratios were 0.36% for Investor Shares and 0.25% for Admiral Shares. The peer-group expense ratio is derived from data provided by Lipper Inc. and captures information through year-end 2011.
Peer group: Large-Cap Core Funds.
4
Strong stock selection boosted the fund’s returns
Vanguard Growth and Income Fund seeks to outperform the Standard & Poor’s 500 Index. The fund’s quantitative investment approach results in risk and sector profiles that are similar to those of its benchmark index, while providing broad exposure to a diverse group of large- and mid-cap U.S. companies.
During the past 12 months, the fund met its objective of outpacing the S&P 500 Index while maintaining sector weightings and other portfolio characteristics similar to those of the index. Information technology stocks—which constituted about 20% of the fund’s holdings, on average, during the period—contributed to the advance, adding more than 6 percentage points to total returns. The advisors’ strong stock selection in computer companies—especially those that have capitalized on the high demand for smartphones and tablets—also boosted the fund’s results relative to the benchmark.
Financial and consumer discretionary stocks also added significantly to total returns. Consumer finance stocks and REITs were among the top contributors to the fund’s strong overall showing in financials. The fund’s holdings among insurance firms and diversified financial services companies tempered results somewhat.
| Total Returns | |
| Ten Years Ended September 30, 2012 | |
| Average | |
| Annual Return | |
| Growth and Income Fund Investor Shares | 7.11% |
| S&P 500 Index | 8.01 |
| Large-Cap Core Funds Average | 6.30 |
| Large-Cap Core Funds Average: Derived from data provided by Lipper Inc. |
The figures shown represent past performance, which is not a guarantee of future results. (Current performance may be lower or higher than the performance data cited. For performance data current to the most recent month-end, visit our website at vanguard.com/performance.) Note, too, that both investment returns and principal value can fluctuate widely, so an investor’s shares, when sold, could be worth more or less than their original cost.
5
Within the consumer discretionary category, the shares of retailers, including internet retailers, helped elevate returns. The fund also benefited from its holdings in energy and consumer staples stocks.
An approach designed for competitive performance
For the ten-year period ended September 30, 2012, Investor Shares of Vanguard Growth and Income Fund returned an average of 7.11% a year, trailing the 8.01% average annual return of the fund’s benchmark index. The fund outperformed the 6.30% average annual return of large-cap core funds.
Last year, the fund restructured its advisory arrangement, moving from a single manager to a multimanager approach. The early results have been consistent with our expectation that the fund is well-positioned to deliver competitive long-term returns. The fund’s three talented advisory teams are aided in their efforts by its low costs.
The lessons of the financial crisis remain relevant four years later
In September, the end of your fund’s fiscal year, we marked the fourth anniversary of Lehman Brothers’ collapse, the start of the 2008–2009 financial crisis. When the Lehman news broke, I was speaking to institutional clients at an event in Washington, D.C., all of three weeks into my new role as Vanguard’s CEO.
In the ensuing months, I was struck both by how fortunate I was to work with a great team of Vanguard “crew” and by the remarkable steadiness demonstrated by our clients. Many clients experienced significant losses, but signs of panic were few. On balance, they remained committed to their long-term investment programs and managed to benefit from the financial markets’ subsequent recovery.
As the crisis recedes further in time, it’s important not to lose sight of the lessons that it illuminated about investing and sound financial practices generally. First among those lessons is that diversification does work. Diversification didn’t immunize investors from the market’s decline, but it certainly helped to insulate them from the worst of it.
Second, saving money and living within your means are critical. Investors are acting on this lesson as they pay off debt, which is a form of saving, and increase their savings rates from the dangerously low levels that prevailed before the crisis.
6
Third, having the courage to stick with a sound investment plan—as so many of our clients did—is important during volatile, uncertain times. Investors who resisted the urge to bail out of stocks at the depths of the crisis have largely been rewarded in the succeeding years.
I am very optimistic that, if investors embrace these lessons, they can give themselves a better chance of reaching their long-term goals.
As always, thank you for investing with Vanguard.
Sincerely,

F. William McNabb III
Chairman and Chief Executive Officer
October 11, 2012
7
Advisors’ Report
Vanguard Growth and Income Fund’s Investor Shares returned 31.27% for the 12 months ended September 30, 2012. The Admiral Shares returned 31.40%. The benchmark S&P 500 Index returned 30.20%, while the average return of large-cap core funds was 27.34%.
Your fund is managed by three independent advisors, a strategy that enhances the fund’s diversification by providing exposure to distinct, yet complementary, investment approaches. It is not uncommon for different advisors
to have different views about individual securities or the broader investment environment.
The advisors, the percentage of fund assets each manages, and brief descriptions of their investment strategies are presented in the table below. The advisors have also prepared a discussion of the investment environment that existed during the fiscal year and of how the portfolio’s positioning reflects this assessment. These comments were prepared on October 17, 2012.
| Vanguard Growth and Income Fund Investment Advisors | |||
| Fund Assets Managed | |||
| Investment Advisor | % | $ Million | Investment Strategy |
| Vanguard Equity Investment | 33 | 1,446 | Employs a quantitative, fundamental management |
| Group | approach, using models that assess valuation, growth | ||
| prospects, management decisions, market sentiment, | |||
| and earnings quality of companies versus their peers. | |||
| D. E. Shaw Investment | 33 | 1,442 | Employs quantitative models that seek to capture |
| Management, L.L.C. | predominantly “bottom up” stock-specific return | ||
| opportunities while aiming to keep the portfolio’s | |||
| sector weights, size, and style characteristics similar to | |||
| the benchmark. | |||
| Los Angeles Capital | 33 | 1,432 | Employs a quantitative model that emphasizes stocks |
| with characteristics investors are currently seeking and | |||
| underweights stocks with characteristics investors are | |||
| currently avoiding. The portfolio’s sector weights, size, | |||
| and style characteristics may differ modestly from the | |||
| benchmark in a risk-controlled manner. | |||
| Cash Investments | 1 | 69 | These short-term reserves are invested by Vanguard in |
| equity index products to simulate investments in | |||
| stocks. Each advisor also may maintain a modest cash | |||
| position. | |||
8
D. E. Shaw Investment Management, L.L.C.
Portfolio Manager:
Anthony Foley, Managing Director and Chief Investment Officer
Macroeconomic pressures such as Europe’s sovereign-debt crisis and concerns about slowing growth, particularly in the United States, significantly affected U.S. equity markets during the fiscal year. The European crisis dominated perceptions of equity valuations in the early part of the fourth quarter of 2011. However, positive news suggesting that the U.S. economy was recovering, albeit slowly, began to outweigh negative news from Europe toward the end of the fourth quarter. This appeared to help drive equity markets higher, and that trend continued through the first quarter of 2012 amid signs that the U.S. economy was gaining strength.
The start of the second quarter saw investor sentiment shift as markets pulled back from the “risk-on” trade that dominated the first quarter. Those macro headwinds abated to some extent in the third quarter when the European Central Bank unveiled new policy initiatives to address the Eurozone crisis, the U.S. Federal Reserve announced another round of quantitative easing, and considerable speculation swirled that China would relax monetary policy to reinvigorate economic growth.
We generally attribute portfolio performance to three major sources: bottom-up stock selection; exposure to common risk factors such as value, growth, and market capitalization; and exposure to industry groups. Based on our analysis, the vast majority of our portfolio’s performance was attributable to stock selection. Among the biggest contributors to the portfolio’s excess return over the period were overweight positions in Apple, Marathon Petroleum, and priceline.com. The three largest single-stock detractors from excess return were overweights in Marvell Technology Group, International Flavors & Fragrances, and Occidental Petroleum.
Common risk factors had a modest positive net impact on the portfolio’s relative performance. The largest single positive contribution was a modest tilt toward stocks with high earnings estimates, and the largest detractor was a tilt toward higher-volatility stocks. Industry and sector exposures modestly influenced excess return. The net impact of sector and industry deviations from benchmark weights on portfolio returns over the fiscal year was modestly positive. The largest positive contributor to excess return was the building supplies industry; the largest detractor was the drug research, biotechnology, and therapeutics industry.
9
We believe that substantial disappointment about prospects for economic growth in the United States and globally in general or a resurgence of concerns about Europe’s debt crisis—or both—remain clear risks. Furthermore, absent a concrete plan by the U.S. government to address the federal deficit, the consequences of the so-called fiscal cliff—that is, reduced government outlays and the expiration of certain tax cuts—could play an increasingly important role in the deliberations of market participants in coming quarters.
Los Angeles Capital
Portfolio Managers:
Thomas D. Stevens, CFA, Chairman and Principal
Hal W. Reynolds, CFA,
Chief Investment Officer and Principal
The S&P 500 Index gained 30.20% for the fiscal year ended September 30, 2012, generating significant gains in three out of four quarters. Market participation was broad, with all sectors except utilities generating returns exceeding 20%. With downward revisions in global growth rates, the European Central Bank and the Federal Reserve have taken aggressive steps to ward off deflationary risks. Over the past 18 months, long-term U.S. Treasury yields fell from 4.51% to 2.83%, with real yields falling from 1.88% to only 0.43%. Despite lower growth rates and an expectation of negative earnings growth for S&P 500 constituents for the trailing year, the surge in prices suggests that investors think the Fed will ultimately succeed in stimulating growth without introducing unwanted inflation.
An analysis of equity factors over this period shows that size, momentum, and earnings quality contributed positively to return. The largest companies with strong balance sheets, higher-quality earnings, and positive estimate revisions generally performed the best. The banking industry benefited most directly from the Fed’s aggressive steps, rising 48%. Although riskier, more volatile securities rebounded in anticipation of monetary easing, it is interesting to note that the market again turned cautious one day after the Fed’s September 13 announcement of the third round of easing, suggesting that the Fed’s influence in supporting asset prices may be nearing an end.
Equity risk as measured by the Chicago Board Options Exchange Volatility Index fell from 38.8% one year ago to 15.7% at the end of September, a level close to the index’s long-term average. Although falling volatilities suggest that investors’ financial concerns have for the moment subsided, investors must further recognize that three significant risks are on the horizon. First, how will fiscal deleveraging affect growth rates? Second, how will central banks control inflation when growth rates pick up? And finally, how will increased regulation in the financial and health care sectors affect productivity?
Over the 12-month period, the portfolio maintained its bias toward higher-quality, lower-beta securities. Portfolio attribution shows that an underweighting in four large banks—JP Morgan Chase, Wells Fargo, Bank of America, and Citigroup—detracted from returns. Adding value was positive stock selection in technology, consumer
10
staples, consumer discretionary, and utilities, where we favored larger-cap companies with high earnings quality.
Despite strong equity returns over the past year, our models remain defensive. We continue to favor larger companies with strong balance sheets and high earnings quality and above-average payout ratios. We remain underweighted in riskier, more speculative companies. Our largest sector overweight is in finance, and our largest underweights are in energy and technology.
Vanguard Equity Investment Group
Portfolio Managers:
James D. Troyer, CFA, Principal
James P. Stetler, Principal
Michael R. Roach, CFA
For the 12-month period ended September 30, 2012, the Growth and Income Fund’s Investor Shares returned 31.27%, outperforming the fund’s benchmark’s gain of 30.20%. The full fiscal year presented two very different halves. For the first six months, large-cap stocks, the focus of your investment in the fund, rose sharply, gaining almost 26%. By the second half, however, the market’s momentum slowed dramatically, moving ahead by 3%. Although all ten sector groups generated positive returns within the benchmark, results were best in consumer discretionary, telecommunications, and financial companies. Utilities and consumer staples results were the laggards within the large-cap stock universe.
Equity markets have staged quite a rally since last fall, but investor concerns and economic uncertainty are still prominent. The United States faces a “fiscal cliff” scenario that could send us into recession if not resolved, and investors have renewed worries over the Eurozone crisis and slowing growth in China. Add to that stagnant employment, election-year uncertainty, and a lack of clarity on corporate profits, and it’s easy to see why investors’ appetite for riskier assets may be put on hold for a while. Market volatility, though it declined substantially during this period, is likely to persist amid our unresolved budget, deficit, and employment problems and anemic world economic growth.
Although it’s important to understand how these macro factors affect overall portfolio performance, our approach to investing focuses on specific stock fundamentals and employs five components:
• Valuation, which measures the price we pay for earnings and cash flows.
• Growth, which considers the growth of earnings as a factor in how much we pay for them.
• Management decisions, which assesses the actions taken by company management that signal its informed opinions regarding a firm’s prospects and earnings.
• Market sentiment, which captures how investors reflect their opinions of a company through their activity in the market.
11
• Quality, which measures balance-sheet strength and the sustainability of earnings.
Our risk-control process then neutralizes our exposure to market capitalization, volatility, and industry risks relative to our benchmark. In our view, the rewards available do not justify such risk exposures.
The results from our stock selection model continued the trend from the first six months of the year. Our quality and management decisions indicators were effective in distinguishing the outperformers from the underperformers, whereas our valuation indicator was ineffective and detracted from our results. The portfolio experienced modest gains from our growth and market sentiment signals.
The model’s effectiveness across sectors was strong, as we produced positive stock selection results in seven of the ten sectors in the benchmark. The materials, consumer discretionary, and energy sectors in the portfolio performed the best. Utilities, health care, and consumer staples underperformed.
At the individual stock level, the largest contributors came from overweight positions in Marathon Petroleum, CF Industries, and Constellation Brands. In addition, when comparing the portfolio’s performance to that of its benchmark, we benefited from underweighting or avoiding poor-performing stocks such as Hewlett-Packard, Electronic Arts, and Unum Group.
Unfortunately, we could not avoid all poor performers. Overweight positions in Helmerich & Payne and Goodyear Tire & Rubber directly lowered performance. Underweighting companies such as Walt Disney, Google, and Visa that our model’s fundamentals did not positively identify hurt our overall outperformance relative to our benchmark.
Although we cannot predict how broader political or economic events will affect the markets, we are confident that the stock market will provide worthwhile returns for long-term investors. With that in mind, we believe that equity exposure will continue to play an important part in a diversified investment plan.
We thank you for your investment and look forward to the new fiscal year.
12
Growth and Income Fund
Fund Profile
As of September 30, 2012
| Share-Class Characteristics | ||
| Investor | Admiral | |
| Shares | Shares | |
| Ticker Symbol | VQNPX | VGIAX |
| Expense Ratio1 | 0.34% | 0.23% |
| 30-Day SEC Yield | 1.93% | 2.04% |
| Portfolio Characteristics | |||
| DJ | |||
| U.S. Total | |||
| S&P 500 | Market | ||
| Fund | Index | Index | |
| Number of Stocks | 841 | 500 | 3,638 |
| Median Market Cap | $65.4B | $57.5B | $35.6B |
| Price/Earnings Ratio | 15.4x | 16.1x | 17.0x |
| Price/Book Ratio | 2.2x | 2.2x | 2.2x |
| Return on Equity | 18.5% | 19.3% | 18.0% |
| Earnings Growth Rate | 10.8% | 10.6% | 10.4% |
| Dividend Yield | 2.3% | 2.1% | 2.0% |
| Foreign Holdings | 0.1% | 0.0% | 0.0% |
| Turnover Rate | 102% | — | — |
| Short-Term Reserves | 0.4% | — | — |
| Sector Diversification (% of equity exposure) | |||
| DJ | |||
| U.S. Total | |||
| S&P 500 | Market | ||
| Fund | Index | Index | |
| Consumer Discretionary | 11.6% | 11.0% | 12.0% |
| Consumer Staples | 10.5 | 10.9 | 9.5 |
| Energy | 10.8 | 11.3 | 10.4 |
| Financials | 16.1 | 14.6 | 16.0 |
| Health Care | 11.5 | 12.0 | 11.9 |
| Industrials | 9.6 | 9.8 | 10.6 |
| Information Technology | 20.2 | 20.1 | 19.2 |
| Materials | 3.0 | 3.5 | 3.9 |
| Telecommunication | |||
| Services | 3.3 | 3.3 | 2.9 |
| Utilities | 3.4 | 3.5 | 3.6 |
| Volatility Measures | ||
| DJ | ||
| U.S. Total | ||
| S&P 500 | Market | |
| Index | Index | |
| R-Squared | 0.99 | 0.99 |
| Beta | 1.01 | 0.96 |
These measures show the degree and timing of the fund’s fluctuations compared with the indexes over 36 months.
| Ten Largest Holdings (% of total net assets) | ||
| Apple Inc. | Computer Hardware | 4.9% |
| Exxon Mobil Corp. | Integrated Oil & Gas | 3.4 |
| General Electric Co. | Industrial | |
| Conglomerates | 2.3 | |
| AT&T Inc. | Integrated | |
| Telecommunication | ||
| Services | 2.1 | |
| Pfizer Inc. | Pharmaceuticals | 2.0 |
| International Business | IT Consulting & | |
| Machines Corp. | Other Services | 2.0 |
| Chevron Corp. | Integrated Oil & Gas | 1.9 |
| Microsoft Corp. | Systems Software | 1.9 |
| Philip Morris | ||
| International Inc. | Tobacco | 1.8 |
| Wells Fargo & Co. | Diversified Banks | 1.7 |
| Top Ten | 24.0% | |
The holdings listed exclude any temporary cash investments and equity index products.
Investment Focus

1 The expense ratios shown are from the prospectus dated January 26, 2012, and represent estimated costs for the current fiscal year. For the fiscal year ended September 30, 2012, the expense ratios were 0.36% for Investor Shares and 0.25% for Admiral Shares.
13
Growth and Income Fund
Performance Summary
All of the returns in this report represent past performance, which is not a guarantee of future results that may be achieved by the fund. (Current performance may be lower or higher than the performance data cited. For performance data current to the most recent month-end, visit our website at vanguard.com/performance.) Note, too, that both investment returns and principal value can fluctuate widely, so an investor’s shares, when sold, could be worth more or less than their original cost. The returns shown do not reflect taxes that a shareholder would pay on fund distributions or on the sale of fund shares.
Cumulative Performance: September 30, 2002, Through September 30, 2012
Initial Investment of $10,000
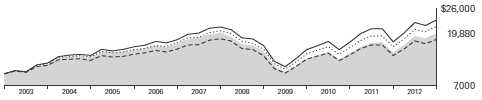
| Average Annual Total Returns | |||||
| Periods Ended September 30, 2012 | |||||
| Final Value | |||||
| One | Five | Ten | of a $10,000 | ||
| Year | Years | Years | Investment | ||
| Growth and Income Fund Investor | |||||
| Shares | 31.27% | -0.23% | 7.11% | $19,880 | |
| •••••••• | S&P 500 Index | 30.20 | 1.05 | 8.01 | 21,615 |
| – – – – | Large-Cap Core Funds Average | 27.34 | -0.19 | 6.30 | 18,427 |
| Dow Jones U.S. Total Stock Market | |||||
| Index | 30.00 | 1.53 | 8.77 | 23,184 | |
| Large-Cap Core Funds Average: Derived from data provided by Lipper Inc. | |||||
| Final Value | ||||
| One | Five | Ten | of a $50,000 | |
| Year | Years | Years | Investment | |
| Growth and Income Fund Admiral Shares | 31.40% | -0.11% | 7.26% | $100,811 |
| S&P 500 Index | 30.20 | 1.05 | 8.01 | 108,075 |
| Dow Jones U.S. Total Stock Market Index | 30.00 | 1.53 | 8.77 | 115,920 |
See Financial Highlights for dividend and capital gains information.
14
Growth and Income Fund
Fiscal-Year Total Returns (%): September 30, 2002, Through September 30, 2012
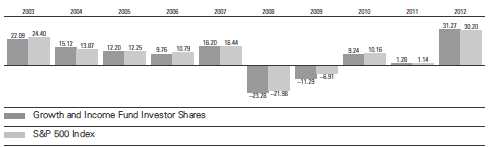
15
Growth and Income Fund
Financial Statements
Statement of Net Assets
As of September 30, 2012
The fund reports a complete list of its holdings in regulatory filings four times in each fiscal year, at the quarter-ends. For the second and fourth fiscal quarters, the lists appear in the fund’s semiannual and annual reports to shareholders. For the first and third fiscal quarters, the fund files the lists with the Securities and Exchange Commission on Form N-Q. Shareholders can look up the fund’s Forms N-Q on the SEC’s website at sec.gov. Forms N-Q may also be reviewed and copied at the SEC’s Public Reference Room (see the back cover of this report for further information).
| Market | |||
| Value | |||
| Shares | ($000) | ||
| Common Stocks (98.2%)1 | |||
| Consumer Discretionary (11.4%) | |||
| Home Depot Inc. | 700,632 | 42,297 | |
| Comcast Corp. Class A | 1,096,508 | 39,222 | |
| Wyndham Worldwide | |||
| Corp. | 519,234 | 27,249 | |
| McDonald’s Corp. | 270,524 | 24,821 | |
| * | DIRECTV | 426,957 | 22,398 |
| * | O’Reilly Automotive Inc. | 252,746 | 21,135 |
| * | Amazon.com Inc. | 79,430 | 20,201 |
| Viacom Inc. Class B | 354,210 | 18,982 | |
| TJX Cos. Inc. | 408,947 | 18,317 | |
| Walt Disney Co. | 321,125 | 16,788 | |
| Gap Inc. | 424,116 | 15,175 | |
| Macy’s Inc. | 363,300 | 13,667 | |
| * | priceline.com Inc. | 21,643 | 13,391 |
| Lowe’s Cos. Inc. | 437,100 | 13,218 | |
| Time Warner Cable Inc. | 136,300 | 12,957 | |
| CBS Corp. Class B | 314,504 | 11,426 | |
| Time Warner Inc. | 242,545 | 10,995 | |
| * | Goodyear Tire & Rubber | ||
| Co. | 658,395 | 8,026 | |
| News Corp. Class A | 323,518 | 7,936 | |
| Newell Rubbermaid Inc. | 414,200 | 7,907 | |
| Expedia Inc. | 136,340 | 7,886 | |
| * | AutoZone Inc. | 20,024 | 7,402 |
| Coach Inc. | 131,610 | 7,373 | |
| Harley-Davidson Inc. | 172,800 | 7,322 | |
| NIKE Inc. Class B | 69,960 | 6,640 | |
| Target Corp. | 91,694 | 5,820 | |
| Whirlpool Corp. | 67,300 | 5,580 | |
| Cablevision Systems Corp. | |||
| Class A | 342,074 | 5,422 | |
| H&R Block Inc. | 294,200 | 5,098 | |
| Ford Motor Co. | 472,400 | 4,658 | |
| * | TripAdvisor Inc. | 136,436 | 4,493 |
| Limited Brands Inc. | 86,810 | 4,276 | |
| Starbucks Corp. | 83,717 | 4,249 | |
| Ralph Lauren Corp. Class A | 27,733 | 4,194 | |
| Market | |||
| Value | |||
| Shares | ($000) | ||
| Genuine Parts Co. | 65,966 | 4,026 | |
| Washington Post Co. | |||
| Class B | 10,800 | 3,921 | |
| Best Buy Co. Inc. | 136,100 | 2,340 | |
| Ross Stores Inc. | 35,580 | 2,298 | |
| * | NVR Inc. | 2,700 | 2,280 |
| Nordstrom Inc. | 41,222 | 2,275 | |
| Family Dollar Stores Inc. | 33,771 | 2,239 | |
| Marriott International Inc. | |||
| Class A | 49,800 | 1,947 | |
| * | AutoNation Inc. | 44,140 | 1,928 |
| Gannett Co. Inc. | 98,914 | 1,756 | |
| * | Dollar Tree Inc. | 36,280 | 1,751 |
| * | Discovery | ||
| Communications Inc. | 28,300 | 1,586 | |
| Kohl’s Corp. | 28,400 | 1,455 | |
| Yum! Brands Inc. | 20,300 | 1,347 | |
| * | Bed Bath & Beyond Inc. | 20,900 | 1,317 |
| Harman International | |||
| Industries Inc. | 28,500 | 1,316 | |
| Starwood Hotels & | |||
| Resorts Worldwide Inc. | 22,000 | 1,275 | |
| * | Fossil Inc. | 14,000 | 1,186 |
| * | Sears Holdings Corp. | 20,700 | 1,149 |
| Omnicom Group Inc. | 20,700 | 1,067 | |
| Ameristar Casinos Inc. | 57,480 | 1,023 | |
| * | Chipotle Mexican Grill Inc. | ||
| Class A | 3,140 | 997 | |
| Hasbro Inc. | 22,807 | 871 | |
| Domino’s Pizza Inc. | 20,200 | 762 | |
| Six Flags Entertainment | |||
| Corp. | 11,346 | 667 | |
| * | Fifth & Pacific Cos. Inc. | 49,600 | 634 |
| Wynn Resorts Ltd. | 5,475 | 632 | |
| * | Penn National Gaming Inc. | 14,300 | 616 |
| * | Imax Corp. | 25,674 | 511 |
| * | Live Nation Entertainment | ||
| Inc. | 54,080 | 466 | |
| * | Orbitz Worldwide Inc. | 180,221 | 460 |
16
Growth and Income Fund
| Market | |||
| Value | |||
| Shares | ($000) | ||
| International Game | |||
| Technology | 32,700 | 428 | |
| * | Charter Communications Inc. | ||
| Class A | 5,600 | 420 | |
| * | Boyd Gaming Corp. | 57,700 | 407 |
| * | Big Lots Inc. | 13,168 | 390 |
| Movado Group Inc. | 11,100 | 374 | |
| * | Apollo Group Inc. Class A | 9,800 | 285 |
| * | Biglari Holdings Inc. | 746 | 272 |
| * | Liberty Media Corp. - | ||
| Liberty Capital Class A | 2,200 | 229 | |
| Signet Jewelers Ltd. | 4,300 | 210 | |
| Interpublic Group of | |||
| Cos. Inc. | 18,535 | 206 | |
| Churchill Downs Inc. | 2,800 | 176 | |
| * | Netflix Inc. | 3,200 | 174 |
| * | Beazer Homes USA Inc. | 48,500 | 172 |
| McGraw-Hill Cos. Inc. | 2,965 | 162 | |
| * | Sally Beauty Holdings Inc. | 5,300 | 133 |
| * | Barnes & Noble Inc. | 10,200 | 130 |
| * | Liberty Global Inc. | 2,200 | 124 |
| Scripps Networks | |||
| Interactive Inc. Class A | 1,900 | 116 | |
| * | Discovery Communications | ||
| Inc. Class A | 1,950 | 116 | |
| Abercrombie & Fitch Co. | 3,400 | 115 | |
| * | Liberty Global Inc. Class A | 1,812 | 110 |
| Ethan Allen Interiors Inc. | 4,300 | 94 | |
| * | Office Depot Inc. | 26,100 | 67 |
| * | Pinnacle Entertainment Inc. | 4,880 | 60 |
| * | American Apparel Inc. | 38,397 | 59 |
| * | Sears Hometown and | ||
| Outlet Stores Inc. | |||
| Rights Exp. 10/3/12 | 21,600 | 59 | |
| * | Carter’s Inc. | 1,091 | 59 |
| Blyth Inc. | 2,200 | 57 | |
| Christopher & Banks Corp. | 16,200 | 57 | |
| * | Bloomin’ Brands Inc. | 3,300 | 54 |
| GameStop Corp. Class A | 2,400 | 50 | |
| * | LodgeNet Interactive Corp. | 75,900 | 49 |
| Lear Corp. | 1,300 | 49 | |
| * | Capella Education Co. | 1,200 | 42 |
| * | Overstock.com Inc. | 4,000 | 41 |
| RadioShack Corp. | 16,700 | 40 | |
| * | New York & Co. Inc. | 9,565 | 36 |
| * | Pandora Media Inc. | 3,200 | 35 |
| Hooker Furniture Corp. | 2,584 | 34 | |
| * | Cumulus Media Inc. Class A | 12,198 | 33 |
| * | Career Education Corp. | 7,649 | 29 |
| Ambassadors Group Inc. | 5,104 | 28 | |
| * | Exide Technologies | 8,800 | 27 |
| * | Isle of Capri Casinos Inc. | 3,462 | 24 |
| * | Carmike Cinemas Inc. | 1,875 | 21 |
| * | Lee Enterprises Inc. | 14,075 | 21 |
| * | Build-A-Bear Workshop Inc. | 3,780 | 15 |
| Market | |||
| Value | |||
| Shares | ($000) | ||
| * | American Public Education | ||
| Inc. | 400 | 15 | |
| * | G-III Apparel Group Ltd. | 400 | 14 |
| AH Belo Corp. Class A | 2,937 | 14 | |
| Universal Technical | |||
| Institute Inc. | 889 | 12 | |
| * | Ascena Retail Group Inc. | 500 | 11 |
| * | Kirkland’s Inc. | 950 | 9 |
| * | Pacific Sunwear of | ||
| California Inc. | 3,700 | 9 | |
| * | Meritage Homes Corp. | 200 | 8 |
| * | Coldwater Creek Inc. | 9,000 | 7 |
| * | Blue Nile Inc. | 199 | 7 |
| * | Chuy’s Holdings Inc. | 300 | 7 |
| Lennar Corp. Class A | 197 | 7 | |
| Nutrisystem Inc. | 617 | 6 | |
| * | Furniture Brands | ||
| International Inc. | 4,200 | 6 | |
| * | Valuevision Media | ||
| Inc. Class A | 2,463 | 6 | |
| Standard Motor Products Inc. | 295 | 5 | |
| * | Five Below Inc. | 136 | 5 |
| * | School Specialty Inc. | 2,200 | 5 |
| American Greetings Corp. | |||
| Class A | 300 | 5 | |
| * | Corinthian Colleges Inc. | 2,000 | 5 |
| * | Reading International Inc. | ||
| Class A | 800 | 5 | |
| * | Education Management Corp. | 1,300 | 4 |
| * | rue21 inc | 120 | 4 |
| * | Body Central Corp. | 300 | 3 |
| * | Express Inc. | 200 | 3 |
| * | Vitacost.com Inc. | 317 | 2 |
| * | MTR Gaming Group Inc. | 500 | 2 |
| Fred’s Inc. Class A | 100 | 1 | |
| * | Summer Infant Inc. | 500 | 1 |
| 498,696 | |||
| Consumer Staples (10.3%) | |||
| Philip Morris | |||
| International Inc. | 860,881 | 77,428 | |
| Procter & Gamble Co. | 901,360 | 62,518 | |
| Wal-Mart Stores Inc. | 588,019 | 43,396 | |
| Coca-Cola Co. | 1,137,734 | 43,154 | |
| CVS Caremark Corp. | 640,540 | 31,015 | |
| Kraft Foods Inc. | 681,310 | 28,172 | |
| Altria Group Inc. | 736,048 | 24,577 | |
| PepsiCo Inc. | 325,851 | 23,060 | |
| Kroger Co. | 713,492 | 16,796 | |
| Kimberly-Clark Corp. | 160,431 | 13,762 | |
| Costco Wholesale Corp. | 131,370 | 13,153 | |
| Reynolds American Inc. | 237,542 | 10,295 | |
| Walgreen Co. | 251,100 | 9,150 | |
| * | Dean Foods Co. | 553,630 | 9,052 |
| Colgate-Palmolive Co. | 73,932 | 7,927 | |
17
Growth and Income Fund
| Market | |||
| Value | |||
| Shares | ($000) | ||
| * | Constellation Brands Inc. | ||
| Class A | 190,900 | 6,176 | |
| Lorillard Inc. | 42,439 | 4,942 | |
| Dr Pepper Snapple Group | |||
| Inc. | 92,301 | 4,110 | |
| Mead Johnson Nutrition Co. | 48,385 | 3,546 | |
| General Mills Inc. | 86,350 | 3,441 | |
| Sysco Corp. | 102,599 | 3,208 | |
| HJ Heinz Co. | 38,890 | 2,176 | |
| Estee Lauder Cos. Inc. | |||
| Class A | 35,221 | 2,169 | |
| Beam Inc. | 29,400 | 1,692 | |
| Hormel Foods Corp. | 43,700 | 1,278 | |
| Clorox Co. | 16,440 | 1,185 | |
| Campbell Soup Co. | 19,700 | 686 | |
| ConAgra Foods Inc. | 21,403 | 591 | |
| ^ | SUPERVALU Inc. | 164,000 | 395 |
| Avon Products Inc. | 21,500 | 343 | |
| Tyson Foods Inc. Class A | 17,100 | 274 | |
| * | Smart Balance Inc. | 10,913 | 132 |
| Hershey Co. | 1,807 | 128 | |
| Kellogg Co. | 1,607 | 83 | |
| * | Monster Beverage Corp. | 1,400 | 76 |
| * | Cott Corp. | 6,100 | 48 |
| B&G Foods Inc. Class A | 1,000 | 30 | |
| Energizer Holdings Inc. | 300 | 22 | |
| * | Post Holdings Inc. | 700 | 21 |
| * | Dole Food Co. Inc. | 800 | 11 |
| * | Natural Grocers by Vitamin | ||
| Cottage Inc. | 467 | 10 | |
| Safeway Inc. | 400 | 6 | |
| Archer-Daniels-Midland Co. | 200 | 5 | |
| * | Synutra International Inc. | 800 | 4 |
| 450,243 | |||
| Energy (10.6%) | |||
| Exxon Mobil Corp. | 1,610,014 | 147,236 | |
| Chevron Corp. | 719,642 | 83,881 | |
| ConocoPhillips | 661,894 | 37,847 | |
| Occidental Petroleum Corp. | 363,295 | 31,265 | |
| Marathon Petroleum Corp. | 476,300 | 26,001 | |
| Schlumberger Ltd. | 347,419 | 25,129 | |
| Phillips 66 | 472,102 | 21,891 | |
| National Oilwell Varco Inc. | 168,775 | 13,521 | |
| Anadarko Petroleum Corp. | 180,096 | 12,592 | |
| EOG Resources Inc. | 100,900 | 11,306 | |
| Williams Cos. Inc. | 284,900 | 9,963 | |
| Spectra Energy Corp. | 261,830 | 7,687 | |
| Marathon Oil Corp. | 241,600 | 7,144 | |
| Devon Energy Corp. | 98,891 | 5,983 | |
| Tesoro Corp. | 86,750 | 3,635 | |
| Kinder Morgan Inc. | 93,480 | 3,320 | |
| Valero Energy Corp. | 81,300 | 2,576 | |
| Halliburton Co. | 73,895 | 2,490 | |
| Murphy Oil Corp. | 37,840 | 2,032 | |
| * | Nabors Industries Ltd. | 133,900 | 1,879 |
| Market | |||
| Value | |||
| Shares | ($000) | ||
| * | Denbury Resources Inc. | 94,300 | 1,524 |
| Nexen Inc. | 55,100 | 1,396 | |
| * | Cameron International Corp. | 15,600 | 875 |
| Hess Corp. | 12,900 | 693 | |
| * | WPX Energy Inc. | 32,599 | 541 |
| Diamond Offshore | |||
| Drilling Inc. | 7,700 | 507 | |
| Baker Hughes Inc. | 6,829 | 309 | |
| * | Hercules Offshore Inc. | 50,300 | 245 |
| * | SemGroup Corp. Class A | 6,600 | 243 |
| SandRidge Mississippian | |||
| Trust II | 11,500 | 234 | |
| Peabody Energy Corp. | 7,296 | 163 | |
| W&T Offshore Inc. | 8,600 | 161 | |
| * | Cheniere Energy Inc. | 10,200 | 159 |
| * | Ocean Rig UDW Inc. | 9,458 | 154 |
| * | Renewable Energy Group | ||
| Inc. | 11,100 | 74 | |
| * | Lone Pine Resources Inc. | 33,028 | 52 |
| * | Halcon Resources Corp. | 5,100 | 37 |
| * | Willbros Group Inc. | 4,900 | 26 |
| * | Cal Dive International Inc. | 13,600 | 21 |
| * | Kosmos Energy Ltd. | 1,400 | 16 |
| Noble Energy Inc. | 169 | 16 | |
| * | Uranium Resources Inc. | 29,100 | 15 |
| Noble Corp. | 400 | 14 | |
| * | McDermott International Inc. | 1,000 | 12 |
| * | EPL Oil & Gas Inc. | 600 | 12 |
| * | Amyris Inc. | 3,400 | 12 |
| * | Oil States International Inc. | 100 | 8 |
| * | ZaZa Energy Corp. | 2,464 | 7 |
| * | Endeavour International Corp. | 700 | 7 |
| QEP Resources Inc. | 200 | 6 | |
| * | Newfield Exploration Co. | 200 | 6 |
| * | Rentech Inc. | 2,500 | 6 |
| CONSOL Energy Inc. | 200 | 6 | |
| * | Harvest Natural Resources | ||
| Inc. | 600 | 5 | |
| * | Alpha Natural Resources Inc. | 814 | 5 |
| * | Gevo Inc. | 1,200 | 3 |
| DHT Holdings Inc. | 300 | 2 | |
| * | Houston American Energy | ||
| Corp. | 1,404 | 1 | |
| 464,951 | |||
| Exchange-Traded Fund (0.1%) | |||
| SPDR S&P 500 ETF Trust | 45,400 | 6,534 | |
| Financials (15.8%) | |||
| Wells Fargo & Co. | 2,144,180 | 74,039 | |
| JPMorgan Chase & Co. | 1,471,411 | 59,563 | |
| * | American International | ||
| Group Inc. | 1,189,390 | 39,000 | |
| * | Berkshire Hathaway Inc. | ||
| Class B | 404,924 | 35,714 | |
| US Bancorp | 1,041,024 | 35,707 | |
18
Growth and Income Fund
| Market | ||
| Value | ||
| Shares | ($000) | |
| Bank of America Corp. | 3,996,930 | 35,293 |
| American Express Co. | 516,585 | 29,373 |
| Citigroup Inc. | 720,900 | 23,588 |
| Goldman Sachs Group Inc. | 174,050 | 19,786 |
| CME Group Inc. | 286,290 | 16,404 |
| Discover Financial Services | 389,370 | 15,470 |
| Torchmark Corp. | 280,900 | 14,424 |
| Simon Property Group Inc. | 94,600 | 14,361 |
| Equity Residential | 248,855 | 14,317 |
| Fifth Third Bancorp | 859,100 | 13,325 |
| Marsh & McLennan Cos. | ||
| Inc. | 380,475 | 12,910 |
| Invesco Ltd. | 485,255 | 12,127 |
| State Street Corp. | 287,881 | 12,080 |
| SLM Corp. | 681,956 | 10,720 |
| Allstate Corp. | 250,100 | 9,906 |
| HCP Inc. | 221,345 | 9,845 |
| Assurant Inc. | 215,500 | 8,038 |
| American Tower | ||
| Corporation | 112,455 | 8,028 |
| Public Storage | 51,839 | 7,214 |
| Health Care REIT Inc. | 116,000 | 6,699 |
| Kimco Realty Corp. | 327,320 | 6,635 |
| NASDAQ OMX Group Inc. | 278,642 | 6,491 |
| MetLife Inc. | 185,100 | 6,379 |
| Prudential Financial Inc. | 112,900 | 6,154 |
| Prologis Inc. | 175,300 | 6,141 |
| BB&T Corp. | 183,800 | 6,095 |
| AvalonBay Communities | ||
| Inc. | 43,291 | 5,887 |
| Ameriprise Financial Inc. | 100,884 | 5,719 |
| Progressive Corp. | 267,833 | 5,555 |
| BlackRock Inc. | 30,920 | 5,513 |
| Capital One Financial Corp. | 92,634 | 5,281 |
| Aon plc | 99,800 | 5,219 |
| Host Hotels & Resorts Inc. | 311,400 | 4,998 |
| Legg Mason Inc. | 191,992 | 4,738 |
| T. Rowe Price Group Inc. | 74,701 | 4,729 |
| Travelers Cos. Inc. | 68,216 | 4,656 |
| NYSE Euronext | 175,400 | 4,324 |
| SunTrust Banks Inc. | 138,300 | 3,910 |
| Ventas Inc. | 61,200 | 3,810 |
| Bank of New York Mellon | ||
| Corp. | 167,213 | 3,782 |
| Federated Investors Inc. | ||
| Class B | 173,339 | 3,586 |
| M&T Bank Corp. | 36,689 | 3,491 |
| Plum Creek Timber Co. Inc. | 78,386 | 3,436 |
| Chubb Corp. | 38,409 | 2,930 |
| Hudson City Bancorp Inc. | 331,800 | 2,641 |
| PNC Financial Services | ||
| Group Inc. | 41,439 | 2,615 |
| Unum Group | 134,700 | 2,589 |
| Apartment Investment & | ||
| Management Co. Class A | 90,756 | 2,359 |
| Market | |||
| Value | |||
| Shares | ($000) | ||
| Loews Corp. | 52,800 | 2,179 | |
| People’s United | |||
| Financial Inc. | 178,492 | 2,167 | |
| Granite Real Estate Inc. | 58,970 | 2,117 | |
| Equity Lifestyle | |||
| Properties Inc. | 30,871 | 2,103 | |
| Morgan Stanley | 91,200 | 1,527 | |
| Erie Indemnity Co. Class A | 22,889 | 1,471 | |
| * | IntercontinentalExchange | ||
| Inc. | 10,500 | 1,401 | |
| * | Genworth Financial Inc. | ||
| Class A | 244,070 | 1,277 | |
| Aflac Inc. | 25,387 | 1,216 | |
| Vornado Realty Trust | 12,300 | 997 | |
| Newcastle Investment | |||
| Corp. | 122,300 | 921 | |
| Huntington Bancshares Inc. | 96,200 | 664 | |
| Northern Trust Corp. | 12,993 | 603 | |
| XL Group plc Class A | 24,467 | 588 | |
| Lincoln National Corp. | 20,039 | 485 | |
| CNO Financial Group Inc. | 47,500 | 458 | |
| Symetra Financial Corp. | 34,800 | 428 | |
| ACE Ltd. | 5,400 | 408 | |
| Prospect Capital Corp. | 30,500 | 351 | |
| * | Alleghany Corp. | 1,000 | 345 |
| Starwood Property Trust Inc. | 13,700 | 319 | |
| American Assets Trust Inc. | 10,853 | 291 | |
| * | NewStar Financial Inc. | 23,000 | 276 |
| * | Popular Inc. | 15,300 | 267 |
| * | First Industrial Realty | ||
| Trust Inc. | 17,800 | 234 | |
| RLI Corp. | 3,200 | 213 | |
| KeyCorp | 22,200 | 194 | |
| Taubman Centers Inc. | 2,300 | 176 | |
| * | eHealth Inc. | 8,950 | 168 |
| * | Central Pacific Financial Corp. | 11,300 | 162 |
| White Mountains | |||
| Insurance Group Ltd. | 300 | 154 | |
| * | First BanCorp | 32,200 | 142 |
| Retail Properties of | |||
| America Inc. | 12,400 | 140 | |
| MarketAxess Holdings Inc. | 4,397 | 139 | |
| Potlatch Corp. | 3,500 | 131 | |
| Endurance Specialty | |||
| Holdings Ltd. | 2,900 | 112 | |
| Washington REIT | 3,500 | 94 | |
| Cash America | |||
| International Inc. | 1,700 | 66 | |
| Medley Capital Corp. | 3,100 | 44 | |
| EverBank Financial Corp. | 2,864 | 39 | |
| United Fire Group Inc. | 1,453 | 37 | |
| * | Ezcorp Inc. Class A | 1,500 | 34 |
| Sterling Financial Corp. | 1,500 | 33 | |
| * | Hilltop Holdings Inc. | 2,400 | 31 |
19
Growth and Income Fund
| Market | |||
| Value | |||
| Shares | ($000) | ||
| Healthcare Trust of | |||
| America Inc. | 3,100 | 30 | |
| * | FelCor Lodging Trust Inc. | 5,300 | 25 |
| SeaBright Holdings Inc. | 2,200 | 24 | |
| Kilroy Realty Corp. | 500 | 22 | |
| * | Southwest Bancorp Inc. | 2,042 | 22 |
| RLJ Lodging Trust | 1,100 | 21 | |
| First Financial Bankshares Inc. | 500 | 18 | |
| * | Sunstone Hotel Investors Inc. | 1,600 | 18 |
| * | HomeTrust Bancshares Inc. | 1,300 | 17 |
| Rouse Properties Inc. | 1,200 | 17 | |
| Terreno Realty Corp. | 1,054 | 17 | |
| Willis Group Holdings plc | 400 | 15 | |
| Post Properties Inc. | 300 | 14 | |
| Primerica Inc. | 500 | 14 | |
| Piedmont Office Realty | |||
| Trust Inc. Class A | 800 | 14 | |
| Principal Financial Group Inc. | 507 | 14 | |
| Extra Space Storage Inc. | 400 | 13 | |
| * | Strategic Hotels & | ||
| Resorts Inc. | 1,900 | 11 | |
| Western Asset | |||
| Mortgage Capital Corp. | 500 | 11 | |
| Getty Realty Corp. | 569 | 10 | |
| * | HFF Inc. Class A | 600 | 9 |
| Old Republic International | |||
| Corp. | 900 | 8 | |
| Winthrop Realty Trust | 700 | 8 | |
| Acadia Realty Trust | 299 | 7 | |
| * | Phoenix Cos. Inc. | 226 | 7 |
| * | FBR & Co. | 2,060 | 6 |
| STAG Industrial Inc. | 335 | 5 | |
| Old National Bancorp | 300 | 4 | |
| Provident New York Bancorp | 400 | 4 | |
| FBL Financial Group Inc. | |||
| Class A | 101 | 3 | |
| AmREIT Inc. Class B | 200 | 3 | |
| * | Preferred Bank | 196 | 3 |
| Heritage Financial Group Inc. | 209 | 3 | |
| * | Virginia Commerce | ||
| Bancorp Inc. | 300 | 3 | |
| Investors Real Estate Trust | 300 | 2 | |
| Parkway Properties Inc. | 176 | 2 | |
| NGP Capital Resources Co. | 300 | 2 | |
| * | Global Indemnity plc | 100 | 2 |
| * | Netspend Holdings Inc. | 211 | 2 |
| * | Citizens Republic Bancorp | ||
| Inc. | 100 | 2 | |
| SI Financial Group Inc. | 100 | 1 | |
| MidSouth Bancorp Inc. | 6 | — | |
| 693,229 | |||
| Health Care (11.3%) | |||
| Pfizer Inc. | 3,606,279 | 89,616 | |
| Johnson & Johnson | 861,193 | 59,345 | |
| Merck & Co. Inc. | 1,219,666 | 55,007 | |
| Market | |||
| Value | |||
| Shares | ($000) | ||
| Abbott Laboratories | 468,649 | 32,131 | |
| UnitedHealth Group Inc. | 547,998 | 30,365 | |
| Eli Lilly & Co. | 534,792 | 25,354 | |
| Bristol-Myers Squibb Co. | 611,132 | 20,626 | |
| Amgen Inc. | 184,826 | 15,585 | |
| McKesson Corp. | 170,970 | 14,709 | |
| Baxter International Inc. | 184,868 | 11,140 | |
| Aetna Inc. | 250,320 | 9,913 | |
| WellPoint Inc. | 168,912 | 9,799 | |
| * | Biogen Idec Inc. | 62,949 | 9,394 |
| Covidien plc | 151,900 | 9,026 | |
| * | Celgene Corp. | 115,660 | 8,836 |
| Cardinal Health Inc. | 211,610 | 8,246 | |
| Zimmer Holdings Inc. | 118,300 | 7,999 | |
| * | Mylan Inc. | 312,900 | 7,635 |
| * | DaVita Inc. | 64,300 | 6,662 |
| Thermo Fisher Scientific | |||
| Inc. | 112,711 | 6,631 | |
| Allergan Inc. | 63,300 | 5,797 | |
| * | Gilead Sciences Inc. | 78,800 | 5,227 |
| * | Tenet Healthcare Corp. | 764,185 | 4,791 |
| Medtronic Inc. | 106,410 | 4,588 | |
| Becton Dickinson and Co. | 54,002 | 4,242 | |
| * | Life Technologies Corp. | 86,700 | 4,238 |
| AmerisourceBergen Corp. | |||
| Class A | 102,810 | 3,980 | |
| * | Forest Laboratories Inc. | 109,447 | 3,897 |
| Humana Inc. | 47,716 | 3,347 | |
| * | Alexion Pharmaceuticals | ||
| Inc. | 28,900 | 3,306 | |
| Stryker Corp. | 41,110 | 2,288 | |
| * | XenoPort Inc. | 123,600 | 1,416 |
| * | Intuitive Surgical Inc. | 2,822 | 1,399 |
| * | Boston Scientific Corp. | 212,800 | 1,221 |
| * | CareFusion Corp. | 34,899 | 991 |
| * | Illumina Inc. | 20,100 | 969 |
| * | Allscripts Healthcare | ||
| Solutions Inc. | 50,388 | 626 | |
| HCA Holdings Inc. | 12,502 | 416 | |
| Patterson Cos. Inc. | 11,252 | 385 | |
| * | Medivation Inc. | 6,400 | 361 |
| * | Watson Pharmaceuticals | ||
| Inc. | 4,000 | 341 | |
| Teleflex Inc. | 4,900 | 337 | |
| PerkinElmer Inc. | 9,280 | 273 | |
| * | PharMerica Corp. | 21,100 | 267 |
| * | Emergent Biosolutions Inc. | 17,100 | 243 |
| * | Furiex Pharmaceuticals Inc. | 11,800 | 225 |
| * | Pain Therapeutics Inc. | 41,997 | 212 |
| * | Sequenom Inc. | 59,100 | 209 |
| * | Questcor | ||
| Pharmaceuticals Inc. | 8,400 | 155 | |
| *,^ | StemCells Inc. | 70,751 | 146 |
| * | ViroPharma Inc. | 4,500 | 136 |
| * | Theravance Inc. | 5,200 | 135 |
20
Growth and Income Fund
| Market | |||
| Value | |||
| Shares | ($000) | ||
| * | Threshold | ||
| Pharmaceuticals Inc. | 17,300 | 125 | |
| * | MEDNAX Inc. | 1,600 | 119 |
| * | Idenix Pharmaceuticals Inc. | 19,500 | 89 |
| * | Health Net Inc. | 3,900 | 88 |
| * | Array BioPharma Inc. | 14,451 | 85 |
| * | LCA-Vision Inc. | 20,797 | 84 |
| * | Synta Pharmaceuticals Corp. | 10,172 | 77 |
| * | MedAssets Inc. | 4,076 | 73 |
| * | AMAG Pharmaceuticals Inc. | 4,016 | 71 |
| * | Omeros Corp. | 6,371 | 60 |
| * | Sunesis Pharmaceuticals Inc. | 8,785 | 50 |
| * | HealthSouth Corp. | 2,000 | 48 |
| * | AngioDynamics Inc. | 3,942 | 48 |
| * | Exelixis Inc. | 9,600 | 46 |
| * | Neuralstem Inc. | 34,069 | 43 |
| * | BioDelivery Sciences | ||
| International Inc. | 5,700 | 36 | |
| * | Keryx Biopharmaceuticals | ||
| Inc. | 11,800 | 33 | |
| * | Nanosphere Inc. | 9,700 | 32 |
| * | Optimer Pharmaceuticals | ||
| Inc. | 2,247 | 32 | |
| * | Cambrex Corp. | 2,700 | 32 |
| * | Santarus Inc. | 3,300 | 29 |
| * | TranS1 Inc. | 10,180 | 27 |
| Invacare Corp. | 1,869 | 26 | |
| * | ACADIA Pharmaceuticals | ||
| Inc. | 10,415 | 26 | |
| * | Globus Medical Inc. | 1,400 | 25 |
| * | Achillion Pharmaceuticals Inc. | 2,100 | 22 |
| * | Nymox Pharmaceutical Corp. | 2,800 | 19 |
| * | SIGA Technologies Inc. | 5,900 | 19 |
| * | Infinity Pharmaceuticals Inc. | 800 | 19 |
| * | GTx Inc. | 3,100 | 14 |
| * | Arqule Inc. | 2,647 | 13 |
| * | Staar Surgical Co. | 1,400 | 11 |
| * | Enzon Pharmaceuticals Inc. | 1,520 | 11 |
| �� | Hill-Rom Holdings Inc. | 300 | 9 |
| * | Biosante Pharmaceuticals Inc. | 4,189 | 8 |
| * | Neurocrine Biosciences Inc. | 900 | 7 |
| * | Discovery Laboratories Inc. | 2,100 | 7 |
| * | Hospira Inc. | 200 | 7 |
| * | Alnylam Pharmaceuticals Inc. | 300 | 6 |
| * | Hologic Inc. | 227 | 5 |
| * | Biolase Inc. | 2,350 | 4 |
| * | Myrexis Inc. | 1,550 | 4 |
| * | Pacific Biosciences of | ||
| California Inc. | 2,000 | 4 | |
| * | Repligen Corp. | 612 | 4 |
| * | Rigel Pharmaceuticals Inc. | 300 | 3 |
| * | Anika Therapeutics Inc. | 200 | 3 |
| * | Masimo Corp. | 116 | 3 |
| * | Pozen Inc. | 300 | 2 |
| * | SurModics Inc. | 89 | 2 |
| Market | |||
| Value | |||
| Shares | ($000) | ||
| * | Ventrus Biosciences Inc. | 400 | 1 |
| * | Gentiva Health Services Inc. | 101 | 1 |
| * | Accretive Health Inc. | 100 | 1 |
| * | Alimera Sciences Inc. | 400 | 1 |
| 495,797 | |||
| Industrials (9.4%) | |||
| General Electric Co. | 4,425,774 | 100,509 | |
| Union Pacific Corp. | 219,588 | 26,065 | |
| General Dynamics Corp. | 384,481 | 25,422 | |
| United Parcel Service Inc. | |||
| Class B | 296,393 | 21,213 | |
| Lockheed Martin Corp. | 205,574 | 19,197 | |
| Northrop Grumman Corp. | 286,692 | 19,045 | |
| Caterpillar Inc. | 214,821 | 18,483 | |
| Tyco International Ltd. | 326,980 | 18,396 | |
| Raytheon Co. | 314,049 | 17,951 | |
| Boeing Co. | 212,250 | 14,777 | |
| Ingersoll-Rand plc | 249,400 | 11,178 | |
| United Technologies Corp. | 129,350 | 10,127 | |
| Parker Hannifin Corp. | 116,720 | 9,755 | |
| L-3 Communications | |||
| Holdings Inc. | 120,964 | 8,674 | |
| CSX Corp. | 409,686 | 8,501 | |
| Equifax Inc. | 180,000 | 8,384 | |
| Textron Inc. | 306,900 | 8,032 | |
| Emerson Electric Co. | 117,529 | 5,673 | |
| Honeywell International Inc. | 94,169 | 5,627 | |
| 3M Co. | 59,180 | 5,469 | |
| Republic Services Inc. | |||
| Class A | 189,900 | 5,224 | |
| Precision Castparts Corp. | 31,037 | 5,070 | |
| Norfolk Southern Corp. | 61,802 | 3,932 | |
| Southwest Airlines Co. | 443,600 | 3,890 | |
| Xylem Inc. | 119,271 | 3,000 | |
| Cintas Corp. | 67,600 | 2,802 | |
| Covanta Holding Corp. | 136,800 | 2,347 | |
| Cummins Inc. | 25,197 | 2,323 | |
| Waste Management Inc. | 69,500 | 2,230 | |
| Illinois Tool Works Inc. | 36,650 | 2,180 | |
| Pentair Inc. | 42,500 | 1,892 | |
| * | Sensata Technologies | ||
| Holding NV | 51,900 | 1,545 | |
| * | Verisk Analytics Inc. Class A | 30,700 | 1,462 |
| Rockwell Automation Inc. | 18,937 | 1,317 | |
| C.H. Robinson | |||
| Worldwide Inc. | 20,500 | 1,200 | |
| Iron Mountain Inc. | 28,300 | 965 | |
| WW Grainger Inc. | 4,266 | 889 | |
| Fluor Corp. | 14,918 | 840 | |
| Avery Dennison Corp. | 26,100 | 831 | |
| * | Nielsen Holdings NV | 20,200 | 606 |
| Expeditors International | |||
| of Washington Inc. | 16,400 | 596 | |
| AAR Corp. | 32,274 | 530 | |
| * | EnerNOC Inc. | 40,000 | 519 |
21
Growth and Income Fund
| Market | |||
| Value | |||
| Shares | ($000) | ||
| Ryder System Inc. | 11,631 | 454 | |
| * | Old Dominion Freight | ||
| Line Inc. | 14,500 | 437 | |
| Robert Half International Inc. | 16,200 | 431 | |
| Dun & Bradstreet Corp. | 5,300 | 422 | |
| * | Genesee & Wyoming Inc. | ||
| Class A | 5,500 | 368 | |
| Pitney Bowes Inc. | 22,300 | 308 | |
| Towers Watson & Co. | |||
| Class A | 5,300 | 281 | |
| * | Babcock & Wilcox Co. | 11,000 | 280 |
| * | Swift Transportation Co. | 32,240 | 278 |
| * | Engility Holdings Inc. | 14,297 | 264 |
| * | Shaw Group Inc. | 6,000 | 262 |
| Stanley Black & Decker Inc. | 3,000 | 229 | |
| * | DigitalGlobe Inc. | 9,309 | 190 |
| * | FuelCell Energy Inc. | 188,700 | 166 |
| Roper Industries Inc. | 1,500 | 165 | |
| Cooper Industries plc | 1,740 | 131 | |
| * | Spirit Aerosystems | ||
| Holdings Inc. Class A | 4,700 | 104 | |
| * | Huntington Ingalls | ||
| Industries Inc. | 2,200 | 93 | |
| US Ecology Inc. | 4,259 | 92 | |
| * | Odyssey Marine | ||
| Exploration Inc. | 26,700 | 84 | |
| * | Fuel Tech Inc. | 20,100 | 84 |
| Costamare Inc. | 4,900 | 75 | |
| * | AerCap Holdings NV | 5,900 | 74 |
| Rollins Inc. | 3,141 | 73 | |
| * | Nortek Inc. | 1,304 | 71 |
| Quad/Graphics Inc. | 4,000 | 68 | |
| Brink’s Co. | 2,200 | 57 | |
| Albany International Corp. | 2,200 | 48 | |
| American Science & | |||
| Engineering Inc. | 682 | 45 | |
| * | Sykes Enterprises Inc. | 3,075 | 41 |
| * | Rexnord Corp. | 2,100 | 38 |
| * | Teledyne Technologies Inc. | 400 | 25 |
| Crane Co. | 600 | 24 | |
| * | Esterline Technologies Corp. | 400 | 22 |
| * | Pendrell Corp. | 18,600 | 21 |
| H&E Equipment | |||
| Services Inc. | 1,400 | 17 | |
| Apogee Enterprises Inc. | 850 | 17 | |
| Star Bulk Carriers Corp. | 27,146 | 16 | |
| * | Federal Signal Corp. | 2,574 | 16 |
| * | American Reprographics Co. | 3,710 | 16 |
| * | CRA International Inc. | 900 | 16 |
| * | Xerium Technologies Inc. | 4,427 | 16 |
| Heartland Express Inc. | 1,100 | 15 | |
| Harsco Corp. | 700 | 14 | |
| Safe Bulkers Inc. | 2,300 | 13 | |
| Mueller Water Products Inc. | |||
| Class A | 2,700 | 13 |
| Market | |||
| Value | |||
| Shares | ($000) | ||
| * | WABCO Holdings Inc. | 200 | 12 |
| Alliant Techsystems Inc. | 200 | 10 | |
| * | NCI Building Systems Inc. | 900 | 9 |
| * | Jacobs Engineering | ||
| Group Inc. | 200 | 8 | |
| * | Pacer International Inc. | 1,949 | 8 |
| Fastenal Co. | 170 | 7 | |
| * | Zipcar Inc. | 900 | 7 |
| Encore Wire Corp. | 233 | 7 | |
| * | Quality Distribution Inc. | 600 | 6 |
| * | GeoEye Inc. | 200 | 5 |
| Kaman Corp. | 135 | 5 | |
| Aceto Corp. | 482 | 5 | |
| * | AECOM Technology Corp. | 200 | 4 |
| Briggs & Stratton Corp. | 216 | 4 | |
| * | MYR Group Inc. | 200 | 4 |
| * | Performant Financial Corp. | 361 | 4 |
| John Bean Technologies | |||
| Corp. | 200 | 3 | |
| * | CPI Aerostructures Inc. | 300 | 3 |
| * | Tecumseh Products Co. | ||
| Class A | 568 | 3 | |
| Acorn Energy Inc. | 300 | 3 | |
| * | ACCO Brands Corp. | 400 | 3 |
| 414,762 | |||
| Information Technology (19.8%) | |||
| Apple Inc. | 321,883 | 214,780 | |
| International Business | |||
| Machines Corp. | 431,259 | 89,465 | |
| Microsoft Corp. | 2,770,074 | 82,493 | |
| * | Google Inc. Class A | 74,679 | 56,345 |
| Cisco Systems Inc. | 2,178,997 | 41,597 | |
| QUALCOMM Inc. | 641,166 | 40,066 | |
| Intel Corp. | 1,582,959 | 35,901 | |
| Oracle Corp. | 1,114,625 | 35,100 | |
| Visa Inc. Class A | 242,558 | 32,571 | |
| Mastercard Inc. Class A | 47,620 | 21,499 | |
| Accenture plc Class A | 268,200 | 18,782 | |
| * | eBay Inc. | 297,866 | 14,420 |
| Motorola Solutions Inc. | 259,387 | 13,112 | |
| Seagate Technology plc | 346,810 | 10,751 | |
| Western Digital Corp. | 251,500 | 9,741 | |
| KLA-Tencor Corp. | 201,905 | 9,632 | |
| * | LSI Corp. | 1,225,300 | 8,467 |
| Hewlett-Packard Co. | 478,228 | 8,159 | |
| * | Citrix Systems Inc. | 103,523 | 7,927 |
| CA Inc. | 303,640 | 7,823 | |
| * | EMC Corp. | 282,400 | 7,701 |
| * | Symantec Corp. | 420,600 | 7,571 |
| Total System Services Inc. | 315,700 | 7,482 | |
| Intuit Inc. | 121,600 | 7,160 | |
| Jabil Circuit Inc. | 315,100 | 5,899 | |
| * | Yahoo! Inc. | 352,374 | 5,629 |
| * | VeriSign Inc. | 91,500 | 4,455 |
| * | F5 Networks Inc. | 41,410 | 4,336 |
22
Growth and Income Fund
| Market | |||
| Value | |||
| Shares | ($000) | ||
| Marvell Technology | |||
| Group Ltd. | 367,200 | 3,360 | |
| Texas Instruments Inc. | 112,102 | 3,088 | |
| Fidelity National | |||
| Information Services Inc. | 96,090 | 3,000 | |
| * | Juniper Networks Inc. | 174,024 | 2,978 |
| * | AOL Inc. | 84,000 | 2,959 |
| * | Zebra Technologies Corp. | 73,600 | 2,763 |
| * | Autodesk Inc. | 82,300 | 2,746 |
| * | Advanced Micro | ||
| Devices Inc. | 793,500 | 2,674 | |
| Analog Devices Inc. | 66,284 | 2,598 | |
| * | Red Hat Inc. | 44,600 | 2,540 |
| * | Lam Research Corp. | 75,300 | 2,393 |
| * | NetApp Inc. | 71,200 | 2,341 |
| * | NVIDIA Corp. | 173,900 | 2,320 |
| TE Connectivity Ltd. | 67,898 | 2,309 | |
| * | BMC Software Inc. | 51,400 | 2,133 |
| Applied Materials Inc. | 155,025 | 1,731 | |
| Xerox Corp. | 198,400 | 1,456 | |
| Automatic Data | |||
| Processing Inc. | 24,400 | 1,431 | |
| * | Teradata Corp. | 18,800 | 1,418 |
| * | Fiserv Inc. | 17,600 | 1,303 |
| Paychex Inc. | 37,400 | 1,245 | |
| Linear Technology Corp. | 27,101 | 863 | |
| * | First Solar Inc. | 36,000 | 797 |
| * | CoreLogic Inc. | 29,600 | 785 |
| Dell Inc. | 71,816 | 708 | |
| Harris Corp. | 12,600 | 645 | |
| Computer Sciences Corp. | 16,500 | 531 | |
| Microchip Technology Inc. | 16,178 | 530 | |
| Molex Inc. | 15,100 | 397 | |
| * | Silicon Image Inc. | 84,700 | 389 |
| * | Electronic Arts Inc. | 29,088 | 369 |
| * | Vocus Inc. | 16,600 | 333 |
| * | NCR Corp. | 12,600 | 294 |
| InterDigital Inc. | 6,000 | 224 | |
| FLIR Systems Inc. | 10,630 | 212 | |
| Altera Corp. | 6,000 | 204 | |
| Avago Technologies Ltd. | 5,700 | 199 | |
| * | Agilysys Inc. | 21,400 | 184 |
| * | Brocade Communications | ||
| Systems Inc. | 27,100 | 160 | |
| Loral Space & | |||
| Communications Inc. | 2,100 | 149 | |
| * | Acxiom Corp. | 7,638 | 140 |
| * | Progress Software Corp. | 6,100 | 130 |
| * | VistaPrint NV | 3,740 | 128 |
| * | Travelzoo Inc. | 5,024 | 118 |
| * | Quest Software Inc. | 2,700 | 76 |
| * | ShoreTel Inc. | 17,150 | 70 |
| Tessera Technologies Inc. | 4,704 | 64 | |
| * | Sonus Networks Inc. | 27,500 | 52 |
| * | Ancestry.com Inc. | 1,300 | 39 |
| Market | |||
| Value | |||
| Shares | ($000) | ||
| * | Aspen Technology Inc. | 1,500 | 39 |
| IAC/InterActiveCorp | 700 | 36 | |
| * | TeleCommunication | ||
| Systems Inc. Class A | 16,706 | 36 | |
| * | Peregrine | ||
| Semiconductor Corp. | 2,123 | 36 | |
| * | MoneyGram International | ||
| Inc. | 2,400 | 36 | |
| *,^ | Ubiquiti Networks Inc. | 2,500 | 30 |
| * | Mattson Technology Inc. | 29,900 | 29 |
| * | Cognizant Technology | ||
| Solutions Corp. Class A | 400 | 28 | |
| * | Maxwell Technologies Inc. | 3,200 | 26 |
| Black Box Corp. | 1,000 | 25 | |
| * | AsiaInfo-Linkage Inc. | 2,000 | 23 |
| * | International Rectifier Corp. | 1,400 | 23 |
| * | IntraLinks Holdings Inc. | 3,400 | 22 |
| * | Riverbed Technology Inc. | 900 | 21 |
| * | AVG Technologies NV | 2,000 | 19 |
| Micrel Inc. | 1,500 | 16 | |
| * | Dolby Laboratories Inc. | ||
| Class A | 400 | 13 | |
| * | Quantum Corp. | 8,033 | 13 |
| * | Calix Inc. | 2,000 | 13 |
| Xilinx Inc. | 314 | 10 | |
| * | Powerwave Technologies | ||
| Inc. | 15,776 | 10 | |
| Western Union Co. | 485 | 9 | |
| * | Integrated Device | ||
| Technology Inc. | 1,500 | 9 | |
| * | Netscout Systems Inc. | 312 | 8 |
| * | Anaren Inc. | 387 | 8 |
| * | UTStarcom Holdings Corp. | 7,200 | 7 |
| * | MaxLinear Inc. | 1,108 | 7 |
| * | NXP Semiconductor NV | 284 | 7 |
| * | Arrow Electronics Inc. | 200 | 7 |
| Corning Inc. | 478 | 6 | |
| * | TNS Inc. | 400 | 6 |
| Amphenol Corp. Class A | 100 | 6 | |
| * | SunPower Corp. Class A | 1,300 | 6 |
| * | NCI Inc. Class A | 700 | 5 |
| * | Tech Data Corp. | 100 | 5 |
| Digimarc Corp. | 200 | 4 | |
| * | Imation Corp. | 794 | 4 |
| * | Rovi Corp. | 300 | 4 |
| * | Global Cash Access | ||
| Holdings Inc. | 525 | 4 | |
| * | WebMD Health Corp. | 294 | 4 |
| * | Acme Packet Inc. | 229 | 4 |
| * | Demand Media Inc. | 357 | 4 |
| * | EPAM Systems Inc. | 200 | 4 |
| * | Dice Holdings Inc. | 400 | 3 |
| * | TeleTech Holdings Inc. | 171 | 3 |
| * | Seachange International Inc. | 358 | 3 |
| * | Dynamics Research Corp. | 300 | 2 |
23
Growth and Income Fund
| Market | |||
| Value | |||
| Shares | ($000) | ||
| * | Amtech Systems Inc. | 500 | 2 |
| * | Smith Micro Software Inc. | 969 | 2 |
| * | FriendFinder Networks Inc. | 1,250 | 1 |
| * | Monster Worldwide Inc. | 100 | 1 |
| 867,089 | |||
| Materials (2.9%) | |||
| Monsanto Co. | 342,300 | 31,156 | |
| Freeport-McMoRan | |||
| Copper & Gold Inc. | 395,493 | 15,654 | |
| Dow Chemical Co. | 380,863 | 11,030 | |
| PPG Industries Inc. | 95,430 | 10,959 | |
| EI du Pont de Nemours | |||
| & Co. | 213,452 | 10,730 | |
| CF Industries Holdings Inc. | 45,164 | 10,037 | |
| Praxair Inc. | 64,540 | 6,704 | |
| Ball Corp. | 146,640 | 6,204 | |
| Sherwin-Williams Co. | 25,200 | 3,753 | |
| LyondellBasell | |||
| Industries NV Class A | 46,600 | 2,407 | |
| Air Products & Chemicals | |||
| Inc. | 22,400 | 1,853 | |
| Ecolab Inc. | 23,440 | 1,519 | |
| Newmont Mining Corp. | 25,461 | 1,426 | |
| International Flavors | |||
| & Fragrances Inc. | 23,151 | 1,379 | |
| Georgia Gulf Corp. | 37,900 | 1,373 | |
| * | Owens-Illinois Inc. | 66,700 | 1,251 |
| Titanium Metals Corp. | 88,795 | 1,139 | |
| Airgas Inc. | 11,740 | 966 | |
| Cliffs Natural Resources Inc. | 23,900 | 935 | |
| Nucor Corp. | 23,860 | 913 | |
| United States Steel Corp. | 46,550 | 888 | |
| Eastman Chemical Co. | 12,380 | 706 | |
| American Vanguard Corp. | 15,618 | 544 | |
| * | Headwaters Inc. | 70,889 | 466 |
| * | Louisiana-Pacific Corp. | 36,400 | 455 |
| Eagle Materials Inc. | 8,800 | 407 | |
| Teck Resources Ltd. | |||
| Class B | 13,500 | 398 | |
| * | Mercer International Inc. | 50,341 | 376 |
| Bemis Co. Inc. | 11,800 | 371 | |
| Schweitzer-Mauduit | |||
| International Inc. | 9,571 | 316 | |
| Valspar Corp. | 5,500 | 309 | |
| *,^ | Rare Element | ||
| Resources Ltd. | 58,464 | 288 | |
| * | Clearwater Paper Corp. | 5,200 | 215 |
| FMC Corp. | 3,323 | 184 | |
| * | SunCoke Energy Inc. | 11,239 | 181 |
| Sealed Air Corp. | 11,100 | 172 | |
| * | Resolute Forest Products | 12,726 | 165 |
| Rockwood Holdings Inc. | 3,100 | 144 | |
| PH Glatfelter Co. | 5,737 | 102 | |
| MeadWestvaco Corp. | 2,900 | 89 | |
| Barrick Gold Corp. | 2,100 | 88 | |
| Market | |||
| Value | |||
| Shares | ($000) | ||
| Commercial Metals Co. | 4,200 | 55 | |
| Noranda Aluminum | |||
| Holding Corp. | 8,075 | 54 | |
| * | US Silica Holdings Inc. | 3,500 | 47 |
| Wausau Paper Corp. | 4,200 | 39 | |
| * | General Moly Inc. | 8,000 | 25 |
| Myers Industries Inc. | 1,600 | 25 | |
| * | New Gold Inc. | 1,400 | 17 |
| Alcoa Inc. | 1,907 | 17 | |
| * | Northern Dynasty | ||
| Minerals Ltd. | 3,300 | 15 | |
| * | GSE Holding Inc. | 1,768 | 14 |
| Cabot Corp. | 300 | 11 | |
| Goldcorp Inc. | 200 | 9 | |
| Allegheny Technologies Inc. | 223 | 7 | |
| Pan American Silver Corp. | 291 | 6 | |
| * | WR Grace & Co. | 100 | 6 |
| Hecla Mining Co. | 883 | 6 | |
| * | Tahoe Resources Inc. | 100 | 2 |
| Boise Inc. | 200 | 2 | |
| * | Penford Corp. | 100 | 1 |
| 128,610 | |||
| Telecommunication Services (3.2%) | |||
| AT&T Inc. | 2,430,538 | 91,631 | |
| Verizon Communications | |||
| Inc. | 868,806 | 39,591 | |
| CenturyLink Inc. | 117,010 | 4,727 | |
| * | Sprint Nextel Corp. | 584,700 | 3,228 |
| * | Crown Castle | ||
| International Corp. | 22,540 | 1,445 | |
| Frontier Communications | |||
| Corp. | 90,600 | 444 | |
| * | Leap Wireless | ||
| International Inc. | 55,696 | 380 | |
| Windstream Corp. | 18,500 | 187 | |
| Cellcom Israel Ltd. | 5,000 | 43 | |
| * | Vonage Holdings Corp. | 5,347 | 12 |
| * | MetroPCS | ||
| Communications Inc. | 591 | 7 | |
| USA Mobility Inc. | 67 | 1 | |
| 141,696 | |||
| Utilities (3.4%) | |||
| American Electric Power | |||
| Co. Inc. | 285,820 | 12,559 | |
| PG&E Corp. | 256,696 | 10,953 | |
| DTE Energy Co. | 159,680 | 9,571 | |
| Pinnacle West Capital Corp. | 157,911 | 8,338 | |
| Entergy Corp. | 119,400 | 8,274 | |
| Public Service | |||
| Enterprise Group Inc. | 247,927 | 7,978 | |
| Ameren Corp. | 238,800 | 7,802 | |
| Dominion Resources Inc. | 146,027 | 7,731 | |
| FirstEnergy Corp. | 146,800 | 6,474 | |
| CenterPoint Energy Inc. | 295,850 | 6,302 | |
24
Growth and Income Fund
| Market | |||
| Value | |||
| Shares | ($000) | ||
| NextEra Energy Inc. | 84,890 | 5,970 | |
| ONEOK Inc. | 116,650 | 5,635 | |
| Northeast Utilities | 139,549 | 5,335 | |
| Southern Co. | 112,659 | 5,193 | |
| Duke Energy Corp. | 71,620 | 4,641 | |
| Consolidated Edison Inc. | 70,597 | 4,228 | |
| CMS Energy Corp. | 178,703 | 4,209 | |
| * | AES Corp. | 380,600 | 4,175 |
| Exelon Corp. | 107,410 | 3,822 | |
| PPL Corp. | 77,400 | 2,249 | |
| NiSource Inc. | 79,167 | 2,017 | |
| Integrys Energy Group Inc. | 38,277 | 1,998 | |
| Xcel Energy Inc. | 69,910 | 1,937 | |
| Sempra Energy | 28,196 | 1,818 | |
| NRG Energy Inc. | 79,300 | 1,696 | |
| Wisconsin Energy Corp. | 36,540 | 1,377 | |
| Pepco Holdings Inc. | 55,600 | 1,051 | |
| AGL Resources Inc. | 23,402 | 957 | |
| TECO Energy Inc. | 49,100 | 871 | |
| SCANA Corp. | 13,000 | 628 | |
| ITC Holdings Corp. | 5,069 | 383 | |
| IDACORP Inc. | 7,288 | 315 | |
| NorthWestern Corp. | 6,200 | 225 | |
| MGE Energy Inc. | 1,800 | 95 | |
| * | Calpine Corp. | 4,900 | 85 |
| Southwest Gas Corp. | 1,800 | 80 | |
| WGL Holdings Inc. | 1,800 | 72 | |
| Chesapeake Utilities Corp. | 1,107 | 52 | |
| Great Plains Energy Inc. | 800 | 18 | |
| Alliant Energy Corp. | 400 | 17 | |
| Vectren Corp. | 500 | 14 | |
| UNS Energy Corp. | 240 | 10 | |
| 147,155 | |||
| Total Common Stocks (Cost $3,722,691) | 4,308,762 | ||
| Temporary Cash Investments (2.0%)1 | |||
| Money Market Fund (1.8%) | |||
| 2,3 | Vanguard Market | ||
| Liquidity Fund, | |||
| 0.163% | 82,107,393 | 82,107 | |
| Face | Market | ||
| Amount | Value | ||
| ($000) | ($000) | ||
| U.S. Government and Agency Obligations (0.2%) | |||
| 4,5 | Fannie Mae | ||
| Discount Notes, | |||
| 0.135%, 12/12/12 | 8,000 | 7,998 | |
| 5,6 | Federal Home Loan | ||
| Bank Discount Notes, | |||
| 0.130%, 10/19/12 | 100 | 100 | |
| 4,5 | Freddie Mac | ||
| Discount Notes, | |||
| 0.160%, 10/16/12 | 100 | 100 | |
| 8,198 | |||
| Total Temporary Cash Investments | |||
| (Cost $90,305) | 90,305 | ||
| Total Investments (100.2%) | |||
| (Cost $3,812,996) | 4,399,067 | ||
| Other Assets and Liabilities (-0.2%) | |||
| Other Assets | 35,003 | ||
| Liabilities3 | (45,190) | ||
| (10,187) | |||
| Net Assets (100%) | 4,388,880 | ||
25
Growth and Income Fund
| At September 30, 2012, net assets consisted of: | |
| Amount | |
| ($000) | |
| Paid-in Capital | 4,730,391 |
| Undistributed Net Investment Income | 9,985 |
| Accumulated Net Realized Losses | (936,553) |
| Unrealized Appreciation (Depreciation) | |
| Investment Securities | 586,071 |
| Futures Contracts | (1,014) |
| Net Assets | 4,388,880 |
| Investor Shares—Net Assets | |
| Applicable to 91,049,524 outstanding | |
| $.001 par value shares of beneficial | |
| interest (unlimited authorization) | 2,797,855 |
| Net Asset Value Per Share— | |
| Investor Shares | $30.73 |
| Admiral Shares—Net Assets | |
| Applicable to 31,705,945 outstanding | |
| $.001 par value shares of beneficial | |
| interest (unlimited authorization) | 1,591,025 |
| Net Asset Value Per Share— | |
| Admiral Shares | $50.18 |
• See Note A in Notes to Financial Statements.
* Non-income-producing security.
^ Part of security position is on loan to broker-dealers. The total value of securities on loan is $595,000.
1 The fund invests a portion of its cash reserves in equity markets through the use of index futures contracts. After giving effect to futures investments, the fund’s effective common stock and temporary cash investment positions represent 99.8% and 0.4%, respectively, of net assets.
2 Affiliated money market fund available only to Vanguard funds and certain trusts and accounts managed by Vanguard. Rate shown is the 7-day yield.
3 Includes $729,000 of collateral received for securities on loan.
4 The issuer was placed under federal conservatorship in September 2008; since that time, its daily operations have been managed by the Federal Housing Finance Agency and it receives capital from the U.S. Treasury, as needed to maintain a positive net worth, in exchange for senior preferred stock.
5 Securities with a value of $8,198,000 have been segregated as initial margin for open futures contracts.
6 The issuer operates under a congressional charter; its securities are generally neither guaranteed by the U.S. Treasury nor backed by the full faith and credit of the U.S. government.
REIT—Real Estate Investment Trust.
See accompanying Notes, which are an integral part of the Financial Statements.
26
Growth and Income Fund
| Statement of Operations | |
| Year Ended | |
| September 30, 2012 | |
| ($000) | |
| Investment Income | |
| Income | |
| Dividends1 | 94,609 |
| Interest2 | 182 |
| Security Lending | 637 |
| Total Income | 95,428 |
| Expenses | |
| Investment Advisory Fees—Note B | |
| Basic Fee | 4,602 |
| Performance Adjustment | 250 |
| The Vanguard Group—Note C | |
| Management and Administrative—Investor Shares | 6,018 |
| Management and Administrative—Admiral Shares | 1,593 |
| Marketing and Distribution—Investor Shares | 527 |
| Marketing and Distribution—Admiral Shares | 235 |
| Custodian Fees | 210 |
| Auditing Fees | 28 |
| Shareholders’ Reports—Investor Shares | 78 |
| Shareholders’ Reports—Admiral Shares | 6 |
| Trustees’ Fees and Expenses | 11 |
| Total Expenses | 13,558 |
| Expenses Paid Indirectly | (44) |
| Net Expenses | 13,514 |
| Net Investment Income | 81,914 |
| Realized Net Gain (Loss) | |
| Investment Securities Sold | 436,084 |
| Futures Contracts | 27,066 |
| Realized Net Gain (Loss) | 463,150 |
| Change in Unrealized Appreciation (Depreciation) | |
| Investment Securities | 546,580 |
| Futures Contracts | 11,711 |
| Change in Unrealized Appreciation (Depreciation) | 558,291 |
| Net Increase (Decrease) in Net Assets Resulting from Operations | 1,103,355 |
| 1 Dividends are net of foreign withholding taxes of $11,000 | |
| 2 Interest income from an affiliated company of the fund was $173,000 | |
See accompanying Notes, whhich are an integral part of the Financial Statements.
27
Growth and Income Fund
| Statement of Changes in Net Assets | ||
| Year Ended September 30, | ||
| 2012 | 2011 | |
| ($000) | ($000) | |
| Increase (Decrease) in Net Assets | ||
| Operations | ||
| Net Investment Income | 81,914 | 79,488 |
| Realized Net Gain (Loss) | 463,150 | 362,030 |
| Change in Unrealized Appreciation (Depreciation) | 558,291 | (312,354) |
| Net Increase (Decrease) in Net Assets Resulting from Operations | 1,103,355 | 129,164 |
| Distributions | ||
| Net Investment Income | ||
| Investor Shares | (51,327) | (53,125) |
| Admiral Shares | (27,485) | (26,147) |
| Realized Capital Gain | ||
| Investor Shares | — | — |
| Admiral Shares | — | — |
| Total Distributions | (78,812) | (79,272) |
| Capital Share Transactions | ||
| Investor Shares | (437,673) | (500,958) |
| Admiral Shares | 122,956 | (89,097) |
| Net Increase (Decrease) from Capital Share Transactions | (314,717) | (590,055) |
| Total Increase (Decrease) | 709,826 | (540,163) |
| Net Assets | ||
| Beginning of Period | 3,679,054 | 4,219,217 |
| End of Period1 | 4,388,880 | 3,679,054 |
| 1 Net Assets - End of Period includes undistributed net investment income of $9,985,000 and $6,880,000 | ||
See accompanying Notes, whhich are an integral part of the Financial Statements.
28
Growth and Income Fund
Financial Highlights
| Investor Shares | |||||
| For a Share Outstanding | Year Ended September 30, | ||||
| Throughout Each Period | 2012 | 2011 | 2010 | 2009 | 2008 |
| Net Asset Value, Beginning of Period | $23.86 | $23.98 | $22.34 | $25.84 | $38.62 |
| Investment Operations | |||||
| Net Investment Income | .549 | .482 | .418 | .447 | .546 |
| Net Realized and Unrealized Gain | |||||
| (Loss) on Investments | 6.846 | (.124) | 1.630 | (3.453) | (8.758) |
| Total from Investment Operations | 7.395 | .358 | 2.048 | (3.006) | (8.212) |
| Distributions | |||||
| Dividends from Net Investment Income | (.525) | (.478) | (.408) | (.494) | (.560) |
| Distributions from Realized Capital Gains | — | — | — | — | (4.008) |
| Total Distributions | (.525) | (.478) | (.408) | (.494) | (4.568) |
| Net Asset Value, End of Period | $30.73 | $23.86 | $23.98 | $22.34 | $25.84 |
| Total Return1 | 31.27% | 1.28% | 9.24% | -11.29% | -23.28% |
| Ratios/Supplemental Data | |||||
| Net Assets, End of Period (Millions) | $2,798 | $2,548 | $3,020 | $3,253 | $3,919 |
| Ratio of Total Expenses to | |||||
| Average Net Assets2 | 0.36% | 0.32% | 0.32% | 0.35% | 0.31% |
| Ratio of Net Investment Income | |||||
| to Average Net Assets | 1.94% | 1.78% | 1.74% | 2.28% | 1.69% |
| Portfolio Turnover Rate | 102% | 120% | 94% | 83% | 96% |
1 Total returns do not include account service fees that may have applied in the periods shown. Fund Prospectuses provide information about any applicable account service fees.
2 Includes performance-based investment advisory fee increases (decreases) of 0.01%, (0.04%), (0.04%), (0.04%), and (0.02%),
See accompanying Notes, whhich are an integral part of the Financial Statements.
29
Growth and Income Fund
Financial Highlights
| Admiral Shares | |||||
| For a Share Outstanding | Year Ended September 30, | ||||
| Throughout Each Period | 2012 | 2011 | 2010 | 2009 | 2008 |
| Net Asset Value, Beginning of Period | $38.97 | $39.15 | $36.48 | $42.20 | $63.08 |
| Investment Operations | |||||
| Net Investment Income | .952 | .832 | .722 | .775 | .963 |
| Net Realized and Unrealized Gain | |||||
| (Loss) on Investments | 11.168 | (.199) | 2.666 | (5.638) | (14.313) |
| Total from Investment Operations | 12.120 | .633 | 3.388 | (4.863) | (13.350) |
| Distributions | |||||
| Dividends from Net Investment Income | (.910) | (.813) | (.718) | (.857) | (.985) |
| Distributions from Realized Capital Gains | — | — | — | — | (6.545) |
| Total Distributions | (.910) | (.813) | (.718) | (.857) | (7.530) |
| Net Asset Value, End of Period | $50.18 | $38.97 | $39.15 | $36.48 | $42.20 |
| Total Return1 | 31.40% | 1.39% | 9.37% | -11.15% | -23.19% |
| Ratios/Supplemental Data | |||||
| Net Assets, End of Period (Millions) | $1,591 | $1,131 | $1,199 | $1,441 | $1,907 |
| Ratio of Total Expenses | |||||
| to Average Net Assets2 | 0.25% | 0.21% | 0.21% | 0.21% | 0.16% |
| Ratio of Net Investment Income | |||||
| to Average Net Assets | 2.05% | 1.89% | 1.85% | 2.42% | 1.84% |
| Portfolio Turnover Rate | 102% | 120% | 94% | 83% | 96% |
1 Total returns do not include account service fees that may have applied in the periods shown. Fund Prospectuses provide information about any applicable account service fees.
2 Includes performance-based investment advisory fee increases (decreases) of 0.01%, (0.04%), (0.04%), (0.04%), and (0.02%),
See accompanying Notes, whhich are an integral part of the Financial Statements.
30
Growth and Income Fund
Notes to Financial Statements
Vanguard Growth and Income Fund is registered under the Investment Company Act of 1940 as an open-end investment company, or mutual fund. The fund offers two classes of shares: Investor Shares and Admiral Shares. Investor Shares are available to any investor who meets the fund’s minimum purchase requirements. Admiral Shares are designed for investors who meet certain administrative, service, and account-size criteria.
A. The following significant accounting policies conform to generally accepted accounting principles for U.S. mutual funds. The fund consistently follows such policies in preparing its financial statements.
1. Security Valuation: Securities are valued as of the close of trading on the New York Stock Exchange (generally 4 p.m., Eastern time) on the valuation date. Equity securities are valued at the latest quoted sales prices or official closing prices taken from the primary market in which each security trades; such securities not traded on the valuation date are valued at the mean of the latest quoted bid and asked prices. Securities for which market quotations are not readily available, or whose values have been materially affected by events occurring before the fund’s pricing time but after the close of the securities’ primary markets, are valued by methods deemed by the board of trustees to represent fair value. Investments in Vanguard Market Liquidity Fund are valued at that fund’s net asset value. Temporary cash investments acquired over 60 days to maturity are valued using the latest bid prices or using valuations based on a matrix system (which considers such factors as security prices, yields, maturities, and ratings), both as furnished by independent pricing services. Other temporary cash investments are valued at amortized cost, which approximates market value.
2. Futures Contracts: The fund uses index futures contracts to a limited extent, with the objective of maintaining full exposure to the stock market while maintaining liquidity. The fund may purchase or sell futures contracts to achieve a desired level of investment, whether to accommodate portfolio turnover or cash flows from capital share transactions. The primary risks associated with the use of futures contracts are imperfect correlation between changes in market values of stocks held by the fund and the prices of futures contracts, and the possibility of an illiquid market.
Futures contracts are valued at their quoted daily settlement prices. The aggregate principal amounts of the contracts are not recorded in the Statement of Net Assets. Fluctuations in the value of the contracts are recorded in the Statement of Net Assets as an asset (liability) and in the Statement of Operations as unrealized appreciation (depreciation) until the contracts are closed, when they are recorded as realized futures gains (losses).
During the year ended September 30, 2012, the fund’s average investment in futures contracts represented 4% of net assets, based on quarterly average aggregate settlement values.
3. Federal Income Taxes: The fund intends to continue to qualify as a regulated investment company and distribute all of its taxable income. Management has analyzed the fund’s tax positions taken for all open federal income tax years (September 30, 2009–2012), and has concluded that no provision for federal income tax is required in the fund’s financial statements.
4. Distributions: Distributions to shareholders are recorded on the ex-dividend date.
5. Security Lending: The fund may lend its securities to qualified institutional borrowers to earn additional income. Security loans are required to be secured at all times by collateral at least equal to the market value of securities loaned. The fund invests cash collateral received in Vanguard Market Liquidity Fund, and records a liability for the return of the collateral, during the period the securities are on loan. Security lending income represents fees charged to borrowers plus income earned on investing cash collateral, less expenses associated with the loan.
31
Growth and Income Fund
6. Other: Dividend income is recorded on the ex-dividend date. Interest income includes income distributions received from Vanguard Market Liquidity Fund and is accrued daily. Security transactions are accounted for on the date securities are bought or sold. Costs used to determine realized gains (losses) on the sale of investment securities are those of the specific securities sold.
Each class of shares has equal rights as to assets and earnings, except that each class separately bears certain class-specific expenses related to maintenance of shareholder accounts (included in Management and Administrative expenses) and shareholder reporting. Marketing and distribution expenses are allocated to each class of shares based on a method approved by the board of trustees. Income, other non-class-specific expenses, and gains and losses on investments are allocated to each class of shares based on its relative net assets.
B. D. E. Shaw Investment Management, L.L.C., and Los Angeles Capital Management and Equity Research, Inc., each provide investment advisory services to a portion of the fund for a fee calculated at an annual percentage rate of average net assets managed by the advisor. The basic fees for D. E. Shaw Investment Management, L.L.C., are subject to quarterly adjustments based on performance since September 30, 2011, relative to the S&P 500 Index. In accordance with the advisory contract entered into with Los Angeles Capital Management and Equity Research, Inc., beginning October 1, 2012, the investment advisory fee will be subject to quarterly adjustments based on performance since September 30, 2011, relative to the S&P 500 Index.
The Vanguard Group provides investment advisory services to a portion of the fund on an at-cost basis; the fund paid Vanguard advisory fees of $543,000 for the year ended September 30, 2012.
For the year ended September 30, 2012, the aggregate investment advisory fee represented an effective annual basic rate of 0.11% of the fund’s average net assets, before an increase of $250,000 (0.01%) based on performance.
C. The Vanguard Group furnishes at cost investment advisory, corporate management, administrative, marketing, and distribution services. The costs of such services are allocated to the fund under methods approved by the board of trustees. The fund has committed to provide up to 0.40% of its net assets in capital contributions to Vanguard. At September 30, 2012, the fund had contributed capital of $611,000 to Vanguard (included in Other Assets), representing 0.01% of the fund’s net assets and 0.24% of Vanguard’s capitalization. The fund’s trustees and officers are also directors and officers of Vanguard.
D. The fund has asked its investment advisors to direct certain security trades, subject to obtaining the best price and execution, to brokers who have agreed to rebate to the fund part of the commissions generated. Such rebates are used solely to reduce the fund’s management and administrative expenses. For the year ended September 30, 2012, these arrangements reduced the fund’s expenses by $44,000 (an annual rate of 0.00% of average net assets).
E. Various inputs may be used to determine the value of the fund’s investments. These inputs are summarized in three broad levels for financial statement purposes. The inputs or methodologies used to value securities are not necessarily an indication of the risk associated with investing in those securities.
Level 1—Quoted prices in active markets for identical securities.
Level 2—Other significant observable inputs (including quoted prices for similar securities, interest rates, prepayment speeds, credit risk, etc.).
Level 3—Significant unobservable inputs (including the fund’s own assumptions used to determine the fair value of investments).
32
Growth and Income Fund
The following table summarizes the market value of the fund’s investments as of September 30, 2012, based on the inputs used to value them:
| Level 1 | Level 2 | Level 3 | |
| Investments | ($000) | ($000) | ($000) |
| Common Stocks | 4,308,762 | — | — |
| Temporary Cash Investments | 82,107 | 8,198 | — |
| Futures Contracts—Liabilities1 | (350) | — | — |
| Total | 4,390,519 | 8,198 | — |
| 1 Represents variation margin on the last day of the reporting period. | |||
F. At September 30, 2012, the aggregate settlement value of open futures contracts and the related unrealized appreciation (depreciation) were:
| ($000) | ||||
| Aggregate | ||||
| Number of | Settlement | Unrealized | ||
| Long (Short) | Value | Appreciation | ||
| Futures Contracts | Expiration | Contracts | Long (Short) | (Depreciation) |
| S&P 500 Index | December 2012 | 190 | 68,125 | (991) |
| E-mini S&P 500 Index | December 2012 | 64 | 4,589 | (23) |
Unrealized appreciation (depreciation) on open futures contracts is required to be treated as realized gain (loss) for tax purposes.
G. Distributions are determined on a tax basis and may differ from net investment income and realized capital gains for financial reporting purposes. Differences may be permanent or temporary. Permanent differences are reclassified among capital accounts in the financial statements to reflect their tax character. Temporary differences arise when certain items of income, expense, gain, or loss are recognized in different periods for financial statement and tax purposes; these differences will reverse at some time in the future. Differences in classification may also result from the treatment of short-term gains as ordinary income for tax purposes.
Certain of the fund’s investments are in securities considered to be “passive foreign investment companies,” for which any unrealized appreciation and/or realized gains are required to be included in distributable net income for tax purposes. During the year ended September 30, 2012, the fund realized gains on the sale of passive foreign investment companies of $3,000, which have been included in current and prior periods’ taxable income; accordingly, such gains have been reclassified from accumulated net realized losses to undistributed net investment income. Passive foreign investment companies held at September 30, 2012, had unrealized appreciation of $21,000, of which all has been distributed and is reflected in the balance of undistributed net investment income.
For tax purposes, at September 30, 2012, the fund had $22,338,000 of ordinary income available for distribution. The fund used capital loss carryforwards of $469,055,000 to offset taxable capital gains realized during the year ended September 30, 2012. At September 30, 2012, the fund had available capital losses totaling $937,041,000 to offset future net capital gains of $90,131,000 through September 30, 2017, and $846,910,000 through September 30, 2018.
33
Growth and Income Fund
At September 30, 2012, the cost of investment securities for tax purposes was $3,814,132,000. Net unrealized appreciation of investment securities for tax purposes was $584,935,000, consisting of unrealized gains of $645,689,000 on securities that had risen in value since their purchase and $60,754,000 in unrealized losses on securities that had fallen in value since their purchase.
H. During the year ended September 30, 2012, the fund purchased $4,060,733,000 of investment securities and sold $4,077,434,000 of investment securities, other than temporary cash investments.
I. Capital share transactions for each class of shares were:
| Year Ended September 30, | ||||
| 2012 | 2011 | |||
| Amount | Shares | Amount | Shares | |
| ($000) | (000) | ($000) | (000) | |
| Investor Shares | ||||
| Issued | 196,350 | 6,915 | 212,372 | 7,984 |
| Issued in Lieu of Cash Distributions | 49,896 | 1,822 | 51,795 | 1,927 |
| Redeemed | (683,919) | (24,460) | (765,125) | (29,070) |
| Net Increase (Decrease) —Investor Shares | (437,673) | (15,723) | (500,958) | (19,159) |
| Admiral Shares | ||||
| Issued | 303,344 | 6,585 | 352,128 | 8,358 |
| Issued in Lieu of Cash Distributions | 25,393 | 568 | 24,071 | 549 |
| Redeemed | (205,781) | (4,475) | (465,296) | (10,508) |
| Net Increase (Decrease)—Admiral Shares | 122,956 | 2,678 | (89,097) | (1,601) |
J. In preparing the financial statements as of September 30, 2012, management considered the impact of subsequent events for potential recognition or disclosure in these financial statements.
34
Report of Independent Registered Public Accounting Firm
To the Trustees of Vanguard Quantitative Funds and the Shareholders of Vanguard Growth and Income Fund: In our opinion, the accompanying statement of net assets and the related statements of operations and of changes in net assets and the financial highlights present fairly, in all material respects, the financial position of Vanguard Growth and Income Fund (constituting a separate portfolio of Vanguard Quantitative Funds, hereafter referred to as the “Fund”) at September 30, 2012, the results of its operations for the year then ended, the changes in its net assets for each of the two years in the period then ended and the financial highlights for each of the five years in the period then ended, in conformity with accounting principles generally accepted in the United States of America. These financial statements and financial highlights (hereafter referred to as “financial statements”) are the responsibility of the Fund’s management; our responsibility is to express an opinion on these financial statements based on our audits. We conducted our audits of these financial statements in accordance with the standards of the Public Company Accounting Oversight Board (United States). Those standards require that we plan and perform the audit to obtain reasonable assurance about whether the financial statements are free of material misstatement. An audit includes examining, on a test basis, evidence supporting the amounts and disclosures in the financial statements, assessing the accounting principles used and significant estimates made by management, and evaluating the overall financial statement presentation. We believe that our audits, which included confirmation of securities at September 30, 2012 by correspondence with the custodian and broker and by agreement to the underlying ownership records of the transfer agent, provide a reasonable basis for our opinion.
PricewaterhouseCoopers LLP
Philadelphia, Pennsylvania
November 9, 2012
| Special 2012 tax information (unaudited) for Vanguard Growth and Income Fund |
This information for the fiscal year ended September 30, 2012, is included pursuant to provisions of the Internal Revenue Code.
The fund distributed $78,812,000 of qualified dividend income to shareholders during the fiscal year.
For corporate shareholders, 100% of investment income (dividend income plus short-term gains, if any) qualifies for the dividends-received deduction.
35
Your Fund’s After-Tax Returns
This table presents returns for your fund both before and after taxes. The after-tax returns are shown in two ways: (1) assuming that an investor owned the fund during the entire period and paid taxes on the fund’s distributions, and (2) assuming that an investor paid taxes on the fund’s distributions and sold all shares at the end of each period.
Calculations are based on the highest individual federal income tax and capital gains tax rates in effect at the times of the distributions and the hypothetical sales. State and local taxes were not considered. After-tax returns reflect any qualified dividend income , using actual prior-year figures and estimates for 2012. (In the example, returns after the sale of fund shares may be higher than those assuming no sale. This occurs when the sale would have produced a capital loss. The calculation assumes that the investor received a tax deduction for the loss.)
The table shows returns for Investor Shares only; returns for other share classes will differ. Please note that your actual after-tax returns will depend on your tax situation and may differ from those shown. Also note that if you own the fund in a tax-deferred account, such as an individual retirement account or a 401(k) plan, this information does not apply to you. Such accounts are not subject to current taxes.
Finally, keep in mind that a fund’s performance—whether before or after taxes—does not guarantee future results.
| Average Annual Total Returns: Growth and Income Fund Investor Shares | |||
| Periods Ended September 30, 2012 | |||
| One | Five | Ten | |
| Year | Years | Years | |
| Returns Before Taxes | 31.27% | -0.23% | 7.11% |
| Returns After Taxes on Distributions | 30.90 | -0.90 | 6.62 |
| Returns After Taxes on Distributions and Sale of Fund Shares | 20.74 | -0.31 | 6.18 |
36
About Your Fund’s Expenses
As a shareholder of the fund, you incur ongoing costs, which include costs for portfolio management, administrative services, and shareholder reports (like this one), among others. Operating expenses, which are deducted from a fund’s gross income, directly reduce the investment return of the fund.
A typical fund’s expenses are expressed as a percentage of its average net assets. This figure is known as the expense ratio. The following examples are intended to help you understand the ongoing costs (in dollars) of investing in your fund and to compare these costs with those of other mutual funds. The examples are based on an investment of $1,000 made at the beginning of the period shown and held for the entire period.
The accompanying table illustrates your fund’s costs in two ways:
• Based on actual fund return. This section helps you to estimate the actual expenses that you paid over the period. The ”Ending Account Value“ shown is derived from the fund‘s actual return, and the third column shows the dollar amount that would have been paid by an investor who started with $1,000 in the fund. You may use the information here, together with the amount you invested, to estimate the expenses that you paid over the period.
To do so, simply divide your account value by $1,000 (for example, an $8,600 account value divided by $1,000 = 8.6), then multiply the result by the number given for your fund under the heading ”Expenses Paid During Period.“
• Based on hypothetical 5% yearly return. This section is intended to help you compare your fund‘s costs with those of other mutual funds. It assumes that the fund had a yearly return of 5% before expenses, but that the expense ratio is unchanged. In this case—because the return used is not the fund’s actual return—the results do not apply to your investment. The example is useful in making comparisons because the Securities and Exchange Commission requires all mutual funds to calculate expenses based on a 5% return. You can assess your fund’s costs by comparing this hypothetical example with the hypothetical examples that appear in shareholder reports of other funds.
Note that the expenses shown in the table are meant to highlight and help you compare ongoing costs only and do not reflect transaction costs incurred by the fund for buying and selling securities. Further, the expenses do not include any purchase, redemption, or account service fees described in the fund prospectus. If such fees were applied to your account, your costs would be higher. Your fund does not carry a “sales load.”
The calculations assume no shares were bought or sold during the period. Your actual costs may have been higher or lower, depending on the amount of your investment and the timing of any purchases or redemptions.
You can find more information about the fund’s expenses, including annual expense ratios, in the Financial Statements section of this report. For additional information on operating expenses and other shareholder costs, please refer to your fund’s current prospectus.
37
| Six Months Ended September 30, 2012 | |||
| Beginning | Ending | Expenses | |
| Account Value | Account Value | Paid During | |
| Growth and Income Fund | 3/31/2012 | 9/30/2012 | Period |
| Based on Actual Fund Return | |||
| Investor Shares | $1,000.00 | $1,035.03 | $1.84 |
| Admiral Shares | 1,000.00 | 1,035.37 | 1.28 |
| Based on Hypothetical 5% Yearly Return | |||
| Investor Shares | $1,000.00 | $1,023.26 | $1.83 |
| Admiral Shares | 1,000.00 | 1,023.82 | 1.27 |
The calculations are based on expenses incurred in the most recent six-month period. The fund’s annualized six-month expense ratios for that period are 0.36% for Investor Shares and 0.25% for Admiral Shares. The dollar amounts shown as “Expenses Paid” are equal to the annualized expense ratio multiplied by the average account value over the period, multiplied by the number of days in the most recent six-month period, then divided by the number of days in the most recent 12-month period.
38
Trustees Approve Advisory Arrangements
The board of trustees of Vanguard Growth and Income Fund has renewed the fund’s investment advisory arrangements with D. E. Shaw Investment Management, L.L.C., Los Angeles Capital Management and Equity Research, Inc., and The Vanguard Group, Inc. (through its Equity Investment Group). The board determined that the retention of the advisors was in the best interest of the fund and its shareholders.
The board based its decision upon an evaluation of each advisor’s investment staff, portfolio management process, and performance. The trustees considered the factors discussed below, among others. However, no single factor determined whether the board approved the arrangements. Rather, it was the totality of the circumstances that drove the board’s decision.
Nature, extent, and quality of services
The board considered the quality of each advisor’s investment management services provided to the fund since 2011, and took into account the organizational depth and stability of each advisor. The board noted the following:
D. E. Shaw Investment Management, L.L.C. Founded in 2005, DESIM is a global investment management and technology development firm. The firm employs quantitative models that seek to capture predominantly “bottom-up” stock-specific return opportunities while aiming to control overall portfolio risk and characteristics, such as size, sector weights, and style, to be similar to those of the benchmark. DESIM has managed a portion of the fund since 2011.
Los Angeles Capital Management and Equity Research, Inc. LA Capital was formed in 2002 from the equity portion of Wilshire Asset Management. The firm offers risk-controlled active equity portfolios managed both quantitatively and fundamentally. LA Capital employs a quantitative model that seeks to emphasize stocks with characteristics that investors are currently seeking and to underweight stocks with characteristics that investors are currently avoiding. LA Capital has managed a portion of the fund since 2011.
The Vanguard Group, Inc. Vanguard has been managing investments for more than three decades. The Equity Investment Group adheres to a sound, disciplined investment management process; the team has considerable experience, stability, and depth. Vanguard has managed a portion of the fund since 2011.
The board concluded that each advisor’s experience, stability, depth, and performance, among other factors, warranted continuation of the advisory arrangements.
Investment performance
The board considered the fund’s investment performance since each advisor began managing the fund in 2011, including any periods of outperformance or underperformance of a relevant benchmark and peer group. The board noted that each advisor has carried out the fund’s investment strategy in a disciplined fashion, and that performance results have allowed the fund to remain competitive versus the fund’s benchmark and peer group. Information about the fund’s most recent performance can be found in the Performance Summary section of this report.
39
Cost
The board concluded that the fund’s expense ratio was well below the average expense ratio charged by funds in its peer group and that the fund’s advisory fee rate was also well below its peer-group average. Information about the fund’s expense ratio appears in the About Your Fund’s Expenses section of this report as well as in the Financial Statements section, which also includes information about the fund’s advisory fee rate.
The board did not consider profitability of DESIM and LA Capital in determining whether to approve the advisory fees, because the firms are independent of Vanguard, and the advisory fees are the result of arm’s-length negotiations. The board does not conduct a profitability analysis of Vanguard, because of Vanguard’s unique “at-cost” structure. Unlike most other mutual fund management companies, Vanguard is owned by the funds it oversees, and produces “profits” only in the form of reduced expenses for fund shareholders.
The benefit of economies of scale
The board concluded that the fund’s shareholders benefit from economies of scale because of breakpoints in the advisory fee schedules for DESIM and LA Capital. The breakpoints reduce the effective rate of the fee as the fund’s assets managed by each advisor increase. The board also concluded that the fund’s low-cost arrangement with Vanguard ensures that the fund will realize economies of scale as it grows, with the cost to shareholders declining as the fund’s assets managed by Vanguard increase.
The board will consider whether to renew the advisory arrangements again after a one-year period.
40
Glossary
30-Day SEC Yield. A fund’s 30-day SEC yield is derived using a formula specified by the U.S. Securities and Exchange Commission. Under the formula, data related to the fund’s security holdings in the previous 30 days are used to calculate the fund’s hypothetical net income for that period, which is then annualized and divided by the fund’s estimated average net assets over the calculation period. For the purposes of this calculation, a security’s income is based on its current market yield to maturity (for bonds), its actual income (for asset-backed securities), or its projected dividend yield (for stocks). Because the SEC yield represents hypothetical annualized income, it will differ—at times significantly—from the fund’s actual experience. As a result, the fund’s income distributions may be higher or lower than implied by the SEC yield.
Beta. A measure of the magnitude of a fund’s past share-price fluctuations in relation to the ups and downs of a given market index. The index is assigned a beta of 1.00. Compared with a given index, a fund with a beta of 1.20 typically would have seen its share price rise or fall by 12% when the index rose or fell by 10%. For this report, beta is based on returns over the past 36 months for both the fund and the index. Note that a fund’s beta should be reviewed in conjunction with its R-squared (see definition). The lower the R-squared, the less correlation there is between the fund and the index, and the less reliable beta is as an indicator of volatility.
Dividend Yield. Dividend income earned by stocks, expressed as a percentage of the aggregate market value (or of net asset value, for a fund). The yield is determined by dividing the amount of the annual dividends by the aggregate value (or net asset value) at the end of the period. For a fund, the dividend yield is based solely on stock holdings and does not include any income produced by other investments.
Earnings Growth Rate. The average annual rate of growth in earnings over the past five years for the stocks now in a fund.
Equity Exposure. A measure that reflects a fund’s investments in stocks and stock futures. Any holdings in short-term reserves are excluded.
Expense Ratio. A fund’s total annual operating expenses expressed as a percentage of the fund’s average net assets. The expense ratio includes management and administrative expenses, but does not include the transaction costs of buying and selling portfolio securities.
Foreign Holdings. The percentage of a fund represented by securities or depositary receipts of companies based outside the United States.
Inception Date. The date on which the assets of a fund (or one of its share classes) are first invested in accordance with the fund’s investment objective. For funds with a subscription period, the inception date is the day after that period ends. Investment performance is measured from the inception date.
Median Market Cap. An indicator of the size of companies in which a fund invests; the midpoint of market capitalization (market price x shares outstanding) of a fund’s stocks, weighted by the proportion of the fund’s assets invested in each stock. Stocks representing half of the fund’s assets have market capitalizations above the median, and the rest are below it.
Price/Book Ratio. The share price of a stock divided by its net worth, or book value, per share. For a fund, the weighted average price/book ratio of the stocks it holds.
41
Price/Earnings Ratio. The ratio of a stock’s current price to its per-share earnings over the past year. For a fund, the weighted average P/E of the stocks it holds. P/E is an indicator of market expectations about corporate prospects; the higher the P/E, the greater the expectations for a company’s future growth.
R-Squared. A measure of how much of a fund’s past returns can be explained by the returns from the market in general, as measured by a given index. If a fund’s total returns were precisely synchronized with an index’s returns, its R-squared would be 1.00. If the fund’s returns bore no relationship to the index’s returns, its R-squared would be 0. For this report, R-squared is based on returns over the past 36 months for both the fund and the index.
Return on Equity. The annual average rate of return generated by a company during the past five years for each dollar of shareholder’s equity (net income divided by shareholder’s equity). For a fund, the weighted average return on equity for the companies whose stocks it holds.
Short-Term Reserves. The percentage of a fund invested in highly liquid, short-term securities that can be readily converted to cash.
Turnover Rate. An indication of the fund’s trading activity. Funds with high turnover rates incur higher transaction costs and may be more likely to distribute capital gains (which may be taxable to investors). The turnover rate excludes in-kind transactions, which have minimal impact on costs.
42
This page intentionally left blank.
The People Who Govern Your Fund
The trustees of your mutual fund are there to see that the fund is operated and managed in your best interests since, as a shareholder, you are a part owner of the fund. Your fund’s trustees also serve on the board of directors of The Vanguard Group, Inc., which is owned by the Vanguard funds and provides services to them on an at-cost basis.
A majority of Vanguard’s board members are independent, meaning that they have no affiliation with Vanguard or the funds they oversee, apart from the sizable personal investments they have made as private individuals. The independent board members have distinguished backgrounds in business, academia, and public service. Each of the trustees and executive officers oversees 179 Vanguard funds.
The following table provides information for each trustee and executive officer of the fund. More information about the trustees is in the Statement of Additional Information, which can be obtained, without charge, by contacting Vanguard at 800-662-7447, or online at vanguard.com.
| InterestedTrustee1 | and Delphi Automotive LLP (automotive components); |
| Senior Advisor at New Mountain Capital; Trustee of | |
| F. William McNabb III | The Conference Board. |
| Born 1957. Trustee Since July 2009. Chairman of the | |
| Board. Principal Occupation(s) During the Past Five | Amy Gutmann |
| Years: Chairman of the Board of The Vanguard Group, | Born 1949. Trustee Since June 2006. Principal |
| Inc., and of each of the investment companies served | Occupation(s) During the Past Five Years: President |
| by The Vanguard Group, since January 2010; Director | of the University of Pennsylvania; Christopher H. |
| of The Vanguard Group since 2008; Chief Executive | Browne Distinguished Professor of Political Science |
| Officer and President of The Vanguard Group and of | in the School of Arts and Sciences with secondary |
| each of the investment companies served by The | appointments at the Annenberg School for |
| Vanguard Group since 2008; Director of Vanguard | Communication and the Graduate School of Education |
| Marketing Corporation; Managing Director of The | of the University of Pennsylvania; Member of the |
| Vanguard Group (1995–2008). | National Commission on the Humanities and Social |
| Sciences; Trustee of Carnegie Corporation of New | |
| IndependentTrustees | York and of the National Constitution Center; Chair |
| of the U. S. Presidential Commission for the Study | |
| Emerson U. Fullwood | of Bioethical Issues. |
| Born 1948. Trustee Since January 2008. Principal | |
| Occupation(s) During the Past Five Years: Executive | JoAnn Heffernan Heisen |
| Chief Staff and Marketing Officer for North America | Born 1950. Trustee Since July 1998. Principal |
| and Corporate Vice President (retired 2008) of Xerox | Occupation(s) During the Past Five Years: Corporate |
| Corporation (document management products and | Vice President and Chief Global Diversity Officer |
| services); Executive in Residence and 2010 | (retired 2008) and Member of the Executive |
| Distinguished Minett Professor at the Rochester | Committee (1997–2008) of Johnson & Johnson |
| Institute of Technology; Director of SPX Corporation | (pharmaceuticals/medical devices/consumer |
| (multi-industry manufacturing), the United Way of | products); Director of Skytop Lodge Corporation |
| Rochester, Amerigroup Corporation (managed health | (hotels), the University Medical Center at Princeton, |
| care), the University of Rochester Medical Center, | the Robert Wood Johnson Foundation, and the Center |
| Monroe Community College Foundation, and North | for Talent Innovation; Member of the Advisory Board |
| Carolina A&T University. | of the Maxwell School of Citizenship and Public Affairs |
| at Syracuse University. | |
| Rajiv L. Gupta | F. Joseph Loughrey |
| Born 1945. Trustee Since December 2001.2 | Born 1949. Trustee Since October 2009. Principal |
| Principal Occupation(s) During the Past Five Years: | Occupation(s) During the Past Five Years: President |
| Chairman and Chief Executive Officer (retired 2009) | and Chief Operating Officer (retired 2009) of Cummins |
| and President (2006–2008) of Rohm and Haas Co. | Inc. (industrial machinery); Director of SKF AB |
| (chemicals); Director of Tyco International, Ltd. | (industrial machinery), Hillenbrand, Inc. (specialized |
| (diversified manufacturing and services), Hewlett- | consumer services), the Lumina Foundation for |
| Packard Co. (electronic computer manufacturing), | |
| Education, and Oxfam America; Chairman of the | Executive Officers | |
| Advisory Council for the College of Arts and Letters | ||
| and Member of the Advisory Board to the Kellogg | Glenn Booraem | |
| Institute for International Studies at the University | Born 1967. Controller Since July 2010. Principal | |
| of Notre Dame. | Occupation(s) During the Past Five Years: Principal | |
| of The Vanguard Group, Inc.; Controller of each of | ||
| Mark Loughridge | the investment companies served by The Vanguard | |
| Born 1953. Trustee Since March 2012. Principal | Group; Assistant Controller of each of the investment | |
| Occupation(s) During the Past Five Years: Senior Vice | companies served by The Vanguard Group (2001–2010). | |
| President and Chief Financial Officer at IBM (information | ||
| technology services); Fiduciary Member of IBM’s | Thomas J. Higgins | |
| Retirement Plan Committee. | Born 1957. Chief Financial Officer Since September | |
| 2008. Principal Occupation(s) During the Past Five | ||
| Scott C. Malpass | Years: Principal of The Vanguard Group, Inc.; Chief | |
| Born 1962. Trustee Since March 2012. Principal | Financial Officer of each of the investment companies | |
| Occupation(s) During the Past Five Years: Chief | served by The Vanguard Group; Treasurer of each of | |
| Investment Officer and Vice President at the University | the investment companies served by The Vanguard | |
| of Notre Dame; Assistant Professor of Finance at the | Group (1998–2008). | |
| Mendoza College of Business at Notre Dame; Member | ||
| of the Notre Dame 403(b) Investment Committee; | Kathryn J. Hyatt | |
| Director of TIFF Advisory Services, Inc. (investment | Born 1955. Treasurer Since November 2008. Principal | |
| advisor); Member of the Investment Advisory | Occupation(s) During the Past Five Years: Principal of | |
| Committees of the Financial Industry Regulatory | The Vanguard Group, Inc.; Treasurer of each of the | |
| Authority (FINRA) and of Major League Baseball. | investment companies served by The Vanguard | |
| Group; Assistant Treasurer of each of the investment | ||
| André F. Perold | companies served by The Vanguard Group (1988–2008). | |
| Born 1952. Trustee Since December 2004. Principal | ||
| Occupation(s) During the Past Five Years: George | Heidi Stam | |
| Gund Professor of Finance and Banking at the Harvard | Born 1956. Secretary Since July 2005. Principal | |
| Business School (retired 2011); Chief Investment | Occupation(s) During the Past Five Years: Managing | |
| Officer and Managing Partner of HighVista Strategies | Director of The Vanguard Group, Inc.; General Counsel | |
| LLC (private investment firm); Director of Rand | of The Vanguard Group; Secretary of The Vanguard | |
| Merchant Bank; Overseer of the Museum of Fine | Group and of each of the investment companies | |
| Arts Boston. | served by The Vanguard Group; Director and Senior | |
| Vice President of Vanguard Marketing Corporation. | ||
| Alfred M. Rankin, Jr. | ||
| Born 1941. Trustee Since January 1993. Principal | Vanguard Senior Management Team | |
| Occupation(s) During the Past Five Years: Chairman, | ||
| President, and Chief Executive Officer of NACCO | Mortimer J. Buckley | Michael S. Miller |
| Industries, Inc. (forklift trucks/housewares/lignite); | Kathleen C. Gubanich | James M. Norris |
| Director of Goodrich Corporation (industrial products/ | Paul A. Heller | Glenn W. Reed |
| aircraft systems and services) and the National | Martha G. King | George U. Sauter |
| Association of Manufacturers; Chairman of the Board | Chris D. McIsaac | |
| of the Federal Reserve Bank of Cleveland and of | ||
| University Hospitals of Cleveland; Advisory Chairman | ||
| of the Board of The Cleveland Museum of Art. | Chairman Emeritus and Senior Advisor | |
| Peter F. Volanakis | John J. Brennan | |
| Born 1955. Trustee Since July 2009. Principal | Chairman, 1996–2009 | |
| Occupation(s) During the Past Five Years: President | Chief Executive Officer and President, 1996–2008 | |
| and Chief Operating Officer (retired 2010) of Corning | ||
| Incorporated (communications equipment); Director | Founder | |
| of SPX Corporation (multi-industry manufacturing); | ||
| Overseer of the Amos Tuck School of Business | John C. Bogle | |
| Administration at Dartmouth College; Advisor to the | Chairman and Chief Executive Officer, 1974–1996 | |
| Norris Cotton Cancer Center. | ||
1 Mr. McNabb is considered an “interested person,” as defined in the Investment Company Act of 1940, because he is an officer of the Vanguard funds.
2 December 2002 for Vanguard Equity Income Fund, Vanguard Growth Equity Fund, the Vanguard Municipal Bond Funds, and the Vanguard State Tax-Exempt Funds.
 | |
| P.O. Box 2600 | |
| Valley Forge, PA 19482-2600 |
Connect with Vanguard® > vanguard.com
| Fund Information > 800-662-7447 | CFA® is a trademark owned by CFA Institute. |
| Direct Investor Account Services > 800-662-2739 | |
| Institutional Investor Services > 800-523-1036 | |
| Text Telephone for People | |
| With Hearing Impairment > 800-749-7273 | |
| This material may be used in conjunction | |
| with the offering of shares of any Vanguard | |
| fund only if preceded or accompanied by | |
| the fund’s current prospectus. | |
| All comparative mutual fund data are from Lipper Inc. or | |
| Morningstar, Inc., unless otherwise noted. | |
| You can obtain a free copy of Vanguard’s proxy voting | |
| guidelines by visiting vanguard.com/proxyreporting or by | |
| calling Vanguard at 800-662-2739. The guidelines are | |
| also available from the SEC’s website, sec.gov. In | |
| addition, you may obtain a free report on how your fund | |
| voted the proxies for securities it owned during the 12 | |
| months ended June 30. To get the report, visit either | |
| vanguard.com/proxyreporting or sec.gov. | |
| You can review and copy information about your fund at | |
| the SEC’s Public Reference Room in Washington, D.C. To | |
| find out more about this public service, call the SEC at | |
| 202-551-8090. Information about your fund is also | |
| available on the SEC’s website, and you can receive | |
| copies of this information, for a fee, by sending a | |
| request in either of two ways: via e-mail addressed to | |
| publicinfo@sec.gov or via regular mail addressed to the | |
| Public Reference Section, Securities and Exchange | |
| Commission, Washington, DC 20549-1520. | |
| © 2012 The Vanguard Group, Inc. | |
| All rights reserved. | |
| Vanguard Marketing Corporation, Distributor. | |
| Q930 112012 | |
|
| Annual Report | September 30, 2012 |
| Vanguard Structured Equity Funds |
 |
Vanguard Structured Large-Cap Equity Fund |
| Vanguard Structured Broad Market Fund |
> For the 12 months ended September 30, 2012, Vanguard Structured Large-Cap Equity Fund returned more than 32% and Vanguard Structured Broad Market Fund returned more than 31%.
> The funds outpaced their benchmark indexes and the average returns of their peers.
> For both funds, stock selection in the energy and materials sectors drove a large part of the outperformance.
| Contents | |
| Your Fund’s Total Returns. | 1 |
| Chairman’s Letter. | 2 |
| Advisor’s Report. | 7 |
| Structured Large-Cap Equity Fund. | 9 |
| Structured Broad Market Fund. | 22 |
| About Your Fund’s Expenses. | 39 |
| Glossary. | 41 |
Please note: The opinions expressed in this report are just that—informed opinions. They should not be considered promises or advice. Also, please keep in mind that the information and opinions cover the period through the date on the front of this report. Of course, the risks of investing in your fund are spelled out in the prospectus.
See the Glossary for definitions of investment terms used in this report.
About the cover: Our cover photograph shows rigging on the HMSSurprise, a replica of an 18th-century Royal Navy frigate. It was featured in the 2003 movie Master and Commander: The Far Side of the World, which was based on Patrick O’Brian’s sea novels, set amid the Napoleonic Wars. Vanguard was named for another ship of that era, the HMSVanguard, which was the flagship of British Admiral Horatio Nelson at the Battle of the Nile.
Your Fund’s Total Returns
| Fiscal Year Ended September 30, 2012 | |
| Total | |
| Returns | |
| Vanguard Structured Large-Cap Equity Fund | |
| Institutional Shares | 32.32% |
| Institutional Plus Shares | 32.42 |
| S&P 500 Index | 30.20 |
| Large-Cap Core Funds Average | 27.34 |
| Large-Cap Core Funds Average: Derived from data provided by Lipper Inc. | |
| Vanguard Structured Broad Market Fund | |
| Institutional Shares | 31.43% |
| Institutional Plus Shares | 31.56 |
| Russell 3000 Index | 30.20 |
| Multi-Cap Core Funds Average | 25.24 |
| Multi-Cap Core Funds Average: Derived from data provided by Lipper Inc. | |
Institutional Shares and Institutional Plus Shares are available to certain institutional investors who meet specific administrative, service, and account-size criteria.
| Your Fund’s Performance at a Glance | ||||
| September 30, 2011, Through September 30, 2012 | ||||
| Distributions Per Share | ||||
| Starting | Ending | Income | Capital | |
| Share Price | Share Price | Dividends | Gains | |
| Vanguard Structured Large-Cap Equity Fund | ||||
| Institutional Shares | $21.49 | $27.83 | $0.497 | $0.000 |
| Institutional Plus Shares | 42.48 | 55.02 | 1.010 | 0.000 |
| Vanguard Structured Broad Market Fund | ||||
| Institutional Shares | $21.03 | $27.10 | $0.447 | $0.000 |
| Institutional Plus Shares | 42.02 | 54.17 | 0.923 | 0.000 |
1

Chairman’s Letter
Dear Shareholder,
Over the past 12 months, stocks rebounded strongly from depressed levels. A large part of the gains came in the first six months as investors grew more optimistic about the economy. Returns were more modest in the second half of the fiscal year as concerns resurfaced about the pace of economic growth at home and abroad as well as the debt crisis in Europe.
Even as stocks rose across the board, gains differed modestly by market capitalization. Institutional Shares of the Structured Broad Market Fund returned 31.43% for the fiscal year, more than 1 percentage point better than the result for the benchmark Russell
3000 Index and about 6 percentage points better than the average return of peer funds. Institutional Shares of the Structured Large-Cap Equity Fund returned 32.32% for the same period, beating the return of the benchmark Standard & Poor’s 500 Index by about 2 percentage points and the average return of peer funds by about 5 percentage points.
The consumer discretionary, telecom-munication services, and financial sectors performed the best for both funds’ indexes, but the advisor found the most value for the funds versus their benchmarks among energy and materials stocks.
2
Stocks notched a powerful rally, with help from central bankers
U.S. stocks surged 30% in the 12 months ended September 30, 2012, outpacing the gains of their international counterparts. The rally came amid moves by U.S. and European central bankers to quiet—at least temporarily—investors’ concerns about the U.S. economy and the finances of European governments and banks.
U.S. stocks were the standouts, but European and emerging markets stocks also posted double-digit results. The developed markets of the Pacific region were the weakest performers but still recorded a modest advance.
In July, the president of the European Central Bank declared that policymakers would do whatever was needed to preserve the euro common currency.
That pronouncement was encouraging to investors, but Europe’s financial troubles are by no means resolved. Vanguard economists believe the most likely scenario is that the Eurozone will “muddle through” for several years, with occasional spikes in market volatility, as fiscal tightening continues in the face of weak economic growth.
Bonds produced solid returns; future results may be more muted
Bonds once again advanced; the broad U.S. taxable market returned about 5% for the 12 months. Among U.S. Treasuries,
| Market Barometer | |||
| Average Annual Total Returns | |||
| Periods Ended September 30, 2012 | |||
| One | Three | Five | |
| Year | Years | Years | |
| Stocks | |||
| Russell 1000 Index (Large-caps) | 30.06% | 13.27% | 1.22% |
| Russell 2000 Index (Small-caps) | 31.91 | 12.99 | 2.21 |
| Dow Jones U.S. Total Stock Market Index | 30.00 | 13.29 | 1.53 |
| MSCI All Country World Index ex USA (International) | 14.48 | 3.17 | -4.12 |
| Bonds | |||
| Barclays U.S. Aggregate Bond Index (Broad taxable market) | 5.16% | 6.19% | 6.53% |
| Barclays Municipal Bond Index (Broad tax-exempt market) | 8.32 | 5.99 | 6.06 |
| Citigroup Three-Month U.S. Treasury Bill Index | 0.05 | 0.08 | 0.63 |
| CPI | |||
| Consumer Price Index | 1.99% | 2.33% | 2.11% |
3
long-term bonds were particularly strong as they benefited from the Federal Reserve’s bond-buying program.
As bond prices rose, the yield of the 10-year U.S. Treasury note fell to a record low in July, closing below 1.5%. (Bond yields and prices move in opposite directions.) By the end of the period, the yield had climbed, but it still remained low by historical standards.
Bondholders have enjoyed years of strong returns. But as Tim Buckley, our incoming chief investment officer, has noted, investors shouldn’t be surprised if future results are much more modest. As yields tumble, the scope for further declines—and price increases—diminishes.
The Federal Reserve announced on September 13 that it would continue to hold its target for short-term interest rates between 0% and 0.25% at least through mid-2015. The exceptionally low rates, in place since late 2008, kept a tight lid on returns from money market funds and savings accounts.
Some sectors had solid gains; others had even stronger ones
Whether you look at the broad market or the large-cap market, overall returns for the 12-month period were very similar, topping 30%, with all sectors posting double-digit increases. Consumer discretionary, telecommunication services, and financials returned about 35% or more.
Both funds generated even better returns than their benchmarks. The advisor, Vanguard Equity Income Group, matches the weighting of each sector in a fund to its weighting in the benchmark, but it uses quantitative models to determine which stocks to overweight, underweight, or avoid. This proprietary approach—which tends to favor high-quality, attractively priced stocks—worked well, with stock choices outpacing those in the benchmark in seven of ten sectors in the broad market fund and in eight of ten in the large-cap fund.
Energy stock selections contributed the most to both funds’ relative outper-formance. The funds held sizable stakes in a small number of oil-refining stocks that paid off handsomely as margins rose on unexpectedly tight refining capacity. In contrast, the funds avoided coal stocks, which suffered from weak demand.
The funds also significantly outpaced their indexes in materials, where certain chemical and fertilizer stocks benefited as food prices rose and as production costs fell because of cheap natural gas. Avoiding underperforming metals and mining stocks also helped relative performance.
Overall health care selection was disappointing for both funds. Certain holdings in the life sciences and health care equipment segments performed well, but not well enough to offset poor stock selection among health care providers.
4
For the Structured Large-Cap Equity Fund, technology stock selection also detracted from relative performance. Investments in tablet and phone makers helped the fund, but underweights in certain fast-rising internet stocks took a toll.
The funds’ strategy has had some challenging periods
Since the funds’ inceptions—2004 for the broad market fund and 2006 for its large-cap counterpart—there have been periods when stock market movements have been driven largely by external developments, notably the financial crisis and the European debt crisis.
Those periods have been challenging for the funds’ strategy, which seeks to identify the stocks in each sector that are most likely to outperform their peers. Nevertheless, the annual returns of both funds since inception have kept pace with those of their benchmark indexes, which incur no costs. From inception through September 30, 2012, Institutional Plus Shares of the Structured Large-Cap Equity Fund matched the S&P 500 Index’s average annual return of 3.88%, and those of the Structured Broad Market Fund were in line with the Russell 3000 Index’s average annual return of 5.58%. Over the same period, both funds outpaced the average annual returns of their respective peer funds by more than a full percentage point.
| Total Returns | |
| Inception Through September 30, 2012 | |
| Average | |
| Annual Return | |
| Structured Large-Cap Equity Fund Institutional Plus Shares (Returns since inception: 5/15/2006) | 3.88% |
| S&P 500 Index | 3.88 |
| Large-Cap Core Funds Average | 2.62 |
| Large-Cap Core Funds Average: Derived from data provided by Lipper Inc. | |
| Structured Broad Market Fund Institutional Plus Shares (Returns since inception: 5/3/2004) | 5.49% |
| Russell 3000 Index | 5.58 |
| Multi-Cap Core Funds Average | 4.43 |
| Multi-Cap Core Funds Average: Derived from data provided by Lipper Inc. | |
The figures shown represent past performance, which is not a guarantee of future results. (Current performance may be lower or higher than the performance data cited. For performance data current to the most recent month-end, visit our website at vanguard.com/performance.) Note, too, that both investment returns and principal value can fluctuate widely, so an investor’s shares, when sold, could be worth more or less than their original cost.
5
The lessons of the financial crisis remain relevant four years later
In September, the end of your fund’s fiscal year, we marked the fourth anniversary of Lehman Brothers’ collapse, the start of the 2008–2009 financial crisis. When the Lehman news broke, I was speaking to institutional clients at an event in Washington, D.C., all of three weeks into my new role as Vanguard’s CEO.
In the ensuing months, I was struck both by how fortunate I was to work with a great team of Vanguard “crew” and by the remarkable steadiness demonstrated by our clients. Many clients experienced significant losses, but signs of panic were few. On balance, they remained committed to their long-term investment programs and managed to benefit from the financial markets’ subsequent recovery.
As the crisis recedes further in time, it’s important not to lose sight of the lessons that it illuminated about investing and sound financial practices generally. First among those lessons is that diversification does work. Diversification didn’t immunize investors from the market’s decline, but it certainly helped to insulate them from the worst of it.
Another important take-away is that having the courage to stick with a sound invest-ment plan—as so many of our clients did—is important during volatile, uncertain times. Investors who resisted the urge to bail out of stocks at the depths of the crisis have largely been rewarded in the succeeding years.
I am very optimistic that, if investors embrace these lessons, they can give themselves a better chance of reaching their long-term goals. As always, thank you for investing with Vanguard.
Sincerely,

F. William McNabb III
Chairman and Chief Executive Officer
October 18, 2012
6
Advisor’s Report
For the fiscal year ended September 30, 2012, Vanguard Structured Large-Cap Equity Fund returned 32.32% for Institutional Shares and 32.42% for Institutional Plus Shares, outperforming the return of its benchmark, the S&P 500 Index, by more than 2 percentage points.
The Structured Broad Market Fund returned 31.43% for Institutional Shares and 31.56% for Institutional Plus Shares, beating the return of its benchmark, the Russell 3000 Index, by more than 1 percentage point.
The investment environment
The broad market rose sharply in the first six months of the fiscal year, gaining more than 26%. By the second half, however, its momentum slowed dramatically, and it moved ahead by less than 3%. Although all ten sector groups generated positive returns within the benchmarks of both funds, results were best among consumer discretionary, telecommunications, and financial companies. Utilities and consumer staples were the laggards.
Equity markets have staged quite a rally since last fall, but investor concerns and economic uncertainty are still prominent. The United States faces a “fiscal cliff” scenario that could send us into recession if not resolved, and investors have renewed worries over the Eurozone crisis and slowing growth in China. Add to that stagnant employment, election-year uncertainty, and a lack of clarity on corporate profits, and it’s easy to see why
investors’ appetite for riskier assets may be put on hold for a while. Market volatility, though it declined substantially during this period, is likely to persist amid our unresolved budget, deficit, and employ-ment problems and anemic world economic growth.
Management of the funds
Although it’s important to understand how these macro factors affect overall portfolio performance, our approach to investing focuses on specific stock fundamentals and employs five components:
n Valuation, which measures the price we pay for earnings and cash flows.
n Growth, which considers the growth of earnings as a factor in how much we pay for them.n Management decisions, which assesses the actions taken by company management that signal its informed opinions regarding a firm’s prospects and earnings.
n Market sentiment, which captures how investors reflect their opinions of a company through their activity in the market.
n Quality, which measures balance-sheet strength and the sustainability of earnings.
Our risk-control process then neutralizes our exposure to market capitalization, volatility, and industry risks relative to our benchmark. In our view, the rewards available do not justify such risk exposures. As a result of these risk controls, our three-year tracking error was 1.24%
7
for the Structured Large-Cap Equity Fund and 1.71% for the Structured Broad Market Fund.
The results from our stock selection model continued the trend from the first six months of the fiscal year. The quality, management decisions, and growth indicators contributed positively to performance to varying degrees in each of the funds. For the Structured Broad Market Fund, the valuation indicator was neutral, whereas the market sentiment indicator detracted slightly from results. For the Structured Large-Cap Equity Fund, the valuation indicator detracted from returns, whereas the market sentiment component had a neutral effect.
The model’s breadth can be seen by its effectiveness across sectors. Our stock-selection results were positive in eight of ten sectors in the Structured Large-Cap Equity Fund and seven of ten in the Structured Broad Market Fund.
Structured Large-Cap Equity Fund
Company selections in materials, energy, and consumer staples added the most to our relative returns. In materials, CF Industries, Freeport-McMoRan, and PPG Industries were the largest contributors. The same was true for Tesoro, Marathon Oil, and Marathon Petroleum in energy, and for Constellation Brands, Dean Foods, and Whole Foods in consumer staples.
Selection results were disappointing in technology and health care, mostly because of underweight positions in Google, Visa, Amgen, and Gilead Sciences.
Structured Broad Market Fund
Selections in energy, materials, and consumer discretionary companies added the most to our relative returns. In energy, Marathon Petroleum, Tesoro, and National Oilwell Varco were the largest contributors. CBS, Brinker International, and Dillard’s led the way in consumer discretionary, as did CF Industries, Eastman Chemical, and PPG Industries in materials.
Selection results were disappointing in technology and health care, mostly because of underweights in Google, Visa, Merck, and Amgen.
Outlook
Although we cannot predict with certainty how broader political or economic events will affect the markets, we are confident that the stock market will provide worthwhile returns for long-term investors. With that in mind, we believe that equity exposure will continue to play an important part in a diversified investment plan.
We thank you for your investment and look forward to the new fiscal year.
James D. Troyer, CFA
Principal and Porfolio Manager
James P. Stetler
Principal and Porfolio Manager
Michael R. Roach, CFA
Porfolio Manager
Vanguard Equity Investment Group
October 16, 2012
8
Structured Large-Cap Equity Fund
Fund Profile
As of September 30, 2012
| Share-Class Characteristics | ||
| Institutional | Institutional | |
| Shares | Plus Shares | |
| Ticker Symbol | VSLIX | VSLPX |
| Expense Ratio1 | 0.24% | 0.17% |
| 30-Day SEC Yield | 2.15% | 2.22% |
| Portfolio Characteristics | |||
| DJ | |||
| U.S. Total | |||
| S&P 500 | Market | ||
| Fund | Index | Index | |
| Number of Stocks | 159 | 500 | 3,638 |
| Median Market Cap | $65.0B | $57.5B | $35.6B |
| Price/Earnings Ratio | 14.2x | 16.1x | 17.0x |
| Price/Book Ratio | 2.3x | 2.2x | 2.2x |
| Return on Equity | 18.8% | 19.3% | 18.0% |
| Earnings Growth Rate | 9.1% | 10.6% | 10.4% |
| Dividend Yield | 2.3% | 2.1% | 2.0% |
| Foreign Holdings | 0.0% | 0.0% | 0.0% |
| Turnover Rate | 64% | — | — |
| Short-Term Reserves | 0.0% | — | — |
| Sector Diversification (% of equity exposure) | |||
| DJ | |||
| U.S. Total | |||
| S&P 500 | Market | ||
| Fund | Index | Index | |
| Consumer Discretionary | 10.5% | 11.0% | 12.0% |
| Consumer Staples | 10.9 | 10.9 | 9.5 |
| Energy | 11.9 | 11.3 | 10.4 |
| Financials | 14.6 | 14.6 | 16.0 |
| Health Care | 12.0 | 12.0 | 11.9 |
| Industrials | 10.1 | 9.8 | 10.6 |
| Information Technology | 19.8 | 20.1 | 19.2 |
| Materials | 3.5 | 3.5 | 3.9 |
| Telecommunication | |||
| Services | 3.7 | 3.3 | 2.9 |
| Utilities | 3.0 | 3.5 | 3.6 |
| Volatility Measures | ||
| DJ | ||
| U.S. Total | ||
| S&P 500 | Market | |
| Index | Index | |
| R-Squared | 0.99 | 0.99 |
| Beta | 0.99 | 0.94 |
These measures show the degree and timing of the fund’s fluctuations compared with the indexes over 36 months.
| Ten Largest Holdings (% of total net assets) | ||
| Apple Inc. | Computer Hardware | 4.9% |
| Exxon Mobil Corp. | Integrated Oil & Gas | 3.8 |
| General Electric Co. | Industrial | |
| Conglomerates | 2.4 | |
| Chevron Corp. | Integrated Oil & Gas | 2.3 |
| International Business | IT Consulting & | |
| Machines Corp. | Other Services | 2.2 |
| AT&T Inc. | Integrated | |
| Telecommunication | ||
| Services | 2.2 | |
| Pfizer Inc. | Pharmaceuticals | 1.9 |
| Microsoft Corp. | Systems Software | 1.7 |
| JPMorgan Chase & Co. | Other Diversified | |
| Financial Services | 1.7 | |
| Wells Fargo & Co. | Diversified Banks | 1.7 |
| Top Ten | 24.8% | |
The holdings listed exclude any temporary cash investments and equity index products.
Investment Focus
1 The expense ratios shown are from the prospectus dated January 26, 2012. For the fiscal year ended September 30, 2012, the expense ratios were 0.24% for Institutional Shares and 0.17% for Institutional Plus Shares.
9
Structured Large-Cap Equity Fund
Performance Summary
All of the returns in this report represent past performance, which is not a guarantee of future results that may be achieved by the fund. (Current performance may be lower or higher than the performance data cited. For performance data current to the most recent month-end, visit our website at vanguard.com/performance.) Note, too, that both investment returns and principal value can fluctuate widely, so an investor’s shares, when sold, could be worth more or less than their original cost. The returns shown do not reflect taxes that a shareholder would pay on fund distributions or on the sale of fund shares.
Cumulative Performance: May 16, 2006, Through September 30, 2012
Initial Investment of $5,000,000

| Average Annual Total Returns | |||||
| Periods Ended September 30, 2012 | |||||
| Since | Final Value | ||||
| One | Five | Inception | of a $5,000,000 | ||
| Year | Years | (5/16/2006) | Investment | ||
| Structured Large-Cap Equity Fund | |||||
| Institutional Shares | 32.32% | 1.00% | 3.83% | $6,353,632 | |
| •••••••• | S&P 500 Index | 30.20 | 1.05 | 3.92 | 6,387,688 |
| – – – – | Large-Cap Core Funds Average | 27.34 | -0.19 | 2.64 | 5,905,041 |
| Dow Jones U.S. Total Stock Market | |||||
| Index | 30.00 | 1.53 | 4.18 | 6,493,693 | |
Large-Cap Core Funds Average: Derived from data provided by Lipper Inc.
"Since Inception" performance is calculated from the Institutional Shares’ inception date for both the fund and its comparative standards.
| Since | Final Value | |||
| One | Five | Inception | of a $200,000,000 | |
| Year | Years | (5/15/2006) | Investment | |
| Structured Large-Cap Equity Fund Institutional | ||||
| Plus Shares | 32.42% | 1.07% | 3.88% | $255,022,087 |
| S&P 500 Index | 30.20 | 1.05 | 3.88 | 255,033,044 |
| Dow Jones U.S. Total Stock Market Index | 30.00 | 1.53 | 4.16 | 259,398,559 |
| "Since Inception" performance is calculated from the Institutional Plus Shares’ inception date for both the fund and its comparative standards. | ||||
See Financial Highlights for dividend and capital gains information.
10
Structured Large-Cap Equity Fund
Fiscal-Year Total Returns (%): May 16, 2006, Through September 30, 2012

11
Structured Large-Cap Equity Fund
Financial Statements
Statement of Net Assets
As of September 30, 2012
The fund reports a complete list of its holdings in regulatory filings four times in each fiscal year, at the quarter-ends. For the second and fourth fiscal quarters, the lists appear in the fund’s semiannual and annual reports to shareholders. For the first and third fiscal quarters, the fund files the lists with the Securities and Exchange Commission on Form N-Q. Shareholders can look up the fund’s Forms N-Q on the SEC’s website at sec.gov. Forms N-Q may also be reviewed and copied at the SEC’s Public Reference Room (see the back cover of this report for further information).
| Market | |||
| Value | |||
| Shares | ($000) | ||
| Common Stocks (99.8%)1 | |||
| Consumer Discretionary (10.5%) | |||
| Home Depot Inc. | 106,475 | 6,428 | |
| Comcast Corp. Class A | 169,500 | 6,063 | |
| * | DIRECTV | 74,700 | 3,919 |
| CBS Corp. Class B | 94,890 | 3,447 | |
| Gap Inc. | 89,600 | 3,206 | |
| Macy’s Inc. | 84,300 | 3,171 | |
| Wyndham Worldwide Corp. | 54,000 | 2,834 | |
| * | O’ReillyAutomotive Inc. | 33,600 | 2,810 |
| Newell Rubbermaid Inc. | 144,800 | 2,764 | |
| TJX Cos. Inc. | 60,700 | 2,719 | |
| Harley-Davidson Inc. | 60,200 | 2,551 | |
| Lowe’s Cos. Inc. | 72,800 | 2,202 | |
| Marriott International Inc. | |||
| Class A | 48,600 | 1,900 | |
| * | Goodyear Tire & | ||
| Rubber Co. | 139,000 | 1,695 | |
| ExpediaInc. | 26,800 | 1,550 | |
| Viacom Inc. Class B | 20,500 | 1,099 | |
| McDonald’s Corp. | 11,247 | 1,032 | |
| Walt Disney Co. | 15,879 | 830 | |
| * | Amazon.com Inc. | 3,100 | 788 |
| H&RBlock Inc. | 42,100 | 730 | |
| Starwood Hotels & Resorts | |||
| Worldwide Inc. | 7,700 | 446 | |
| Gannett Co. Inc. | 21,200 | 376 | |
| Comcast Corp. | 10,525 | 366 | |
| * | Bed Bath & Beyond Inc. | 5,400 | 340 |
| Wynn Resorts Ltd. | 2,550 | 294 | |
| * | PulteGroup Inc. | 13,100 | 203 |
| 53,763 | |||
| Consumer Staples (10.8%) | |||
| Philip Morris | |||
| International Inc. | 95,936 | 8,629 | |
| Wal-Mart Stores Inc. | 77,646 | 5,730 | |
| Procter & Gamble Co. | 77,794 | 5,396 | |
| CVS Caremark Corp. | 105,100 | 5,089 | |
| Altria Group Inc. | 149,200 | 4,982 | |
| Market | |||
| Value | |||
| Shares | ($000) | ||
| Coca-Cola Co. | 108,280 | 4,107 | |
| Kimberly-Clark Corp. | 45,200 | 3,877 | |
| Kraft Foods Inc. | 87,500 | 3,618 | |
| Kroger Co. | 121,700 | 2,865 | |
| * | Dean Foods Co. | 152,800 | 2,498 |
| * | Constellation Brands Inc. | ||
| Class A | 68,000 | 2,200 | |
| Campbell Soup Co. | 53,700 | 1,870 | |
| PepsiCo Inc. | 23,992 | 1,698 | |
| Costco Wholesale Corp. | 13,600 | 1,362 | |
| Colgate-Palmolive Co. | 7,500 | 804 | |
| Lorillard Inc. | 4,100 | 477 | |
| Beam Inc. | 6,100 | 351 | |
| 55,553 | |||
| Energy (11.9%) | |||
| ExxonMobil Corp. | 211,839 | 19,373 | |
| ChevronCorp. | 99,356 | 11,581 | |
| ConocoPhillips | 92,459 | 5,287 | |
| Marathon Petroleum Corp. | 67,300 | 3,674 | |
| National Oilwell Varco Inc. | 41,300 | 3,308 | |
| Occidental Petroleum Corp. | 37,661 | 3,241 | |
| Tesoro Corp. | 74,700 | 3,130 | |
| EOG Resources Inc. | 27,900 | 3,126 | |
| Marathon Oil Corp. | 94,500 | 2,794 | |
| Valero Energy Corp. | 51,900 | 1,644 | |
| Phillips 66 | 24,579 | 1,140 | |
| Schlumberger Ltd. | 15,425 | 1,116 | |
| Williams Cos. Inc. | 24,300 | 850 | |
| Murphy Oil Corp. | 7,600 | 408 | |
| Diamond Offshore | |||
| Drilling Inc. | 2,700 | 178 | |
| 60,850 | |||
| Financials (14.6%) | |||
| JPMorgan Chase & Co. | 216,979 | 8,783 | |
| Wells Fargo & Co. | 251,635 | 8,689 | |
| US Bancorp | 155,224 | 5,324 | |
| American Express Co. | 83,200 | 4,731 | |
| Bank of America Corp. | 533,953 | 4,715 | |
| Discover Financial Services | 91,550 | 3,637 | |
12
Structured Large-Cap Equity Fund
| Market | |||
| Value | |||
| Shares | ($000) | ||
| Allstate Corp. | 87,500 | 3,466 | |
| * | American International | ||
| Group Inc. | 104,900 | 3,440 | |
| Simon Property Group Inc. | 19,900 | 3,021 | |
| Torchmark Corp. | 56,550 | 2,904 | |
| Invesco Ltd. | 109,300 | 2,731 | |
| Fifth Third Bancorp | 175,800 | 2,727 | |
| Franklin Resources Inc. | 21,000 | 2,627 | |
| MetLife Inc. | 74,300 | 2,560 | |
| Goldman Sachs Group Inc. | 19,000 | 2,160 | |
| * | Berkshire Hathaway Inc. | ||
| Class B | 22,805 | 2,011 | |
| HCP Inc. | 43,300 | 1,926 | |
| Host Hotels & Resorts Inc. | 109,600 | 1,759 | |
| Kimco Realty Corp. | 82,800 | 1,678 | |
| * | Berkshire Hathaway Inc. | ||
| Class A | 11 | 1,460 | |
| Citigroup Inc. | 41,625 | 1,362 | |
| BB&T Corp. | 27,200 | 902 | |
| Apartment Investment & | |||
| Management Co. Class A | 20,700 | 538 | |
| Assurant Inc. | 14,000 | 522 | |
| Ameriprise Financial Inc. | 8,500 | 482 | |
| Prologis Inc. | 12,000 | 420 | |
| Huntington Bancshares Inc. | 33,200 | 229 | |
| 74,804 | |||
| Health Care (11.9%) | |||
| Pfizer Inc. | 400,219 | 9,945 | |
| Merck & Co. Inc. | 176,844 | 7,976 | |
| Abbott Laboratories | 99,168 | 6,799 | |
| Johnson & Johnson | 71,046 | 4,896 | |
| UnitedHealth Group Inc. | 88,154 | 4,885 | |
| EliLilly & Co. | 97,887 | 4,641 | |
| Bristol-Myers Squibb Co. | 124,700 | 4,209 | |
| Baxter International Inc. | 60,100 | 3,622 | |
| McKesson Corp. | 37,800 | 3,252 | |
| * | Watson | ||
| Pharmaceuticals Inc. | 37,840 | 3,222 | |
| Aetna Inc. | 78,870 | 3,123 | |
| Zimmer Holdings Inc. | 27,200 | 1,839 | |
| * | Mylan Inc. | 69,900 | 1,705 |
| * | Biogen Idec Inc. | 4,600 | 686 |
| Amgen Inc. | 5,800 | 489 | |
| 61,289 | |||
| Industrials (10.1%) | |||
| General Electric Co. | 532,022 | 12,082 | |
| Union Pacific Corp. | 39,500 | 4,689 | |
| Lockheed Martin Corp. | 38,000 | 3,548 | |
| Raytheon Co. | 59,600 | 3,407 | |
| Northrop Grumman Corp. | 48,916 | 3,250 | |
| Parker Hannifin Corp. | 37,800 | 3,159 | |
| Ingersoll-Rand plc | 66,000 | 2,958 | |
| Textron Inc. | 107,300 | 2,808 | |
| Eaton Corp. | 57,200 | 2,703 | |
| Market | |||
| Value | |||
| Shares | ($000) | ||
| United Parcel Service Inc. | |||
| Class B | 37,321 | 2,671 | |
| Caterpillar Inc. | 30,600 | 2,633 | |
| Honeywell International Inc. | 39,300 | 2,348 | |
| Boeing Co. | 29,100 | 2,026 | |
| United Technologies Corp. | 20,986 | 1,643 | |
| Norfolk Southern Corp. | 22,800 | 1,451 | |
| Equifax Inc. | 4,600 | 214 | |
| Cintas Corp. | 4,200 | 174 | |
| Robert Half International Inc. | 5,500 | 147 | |
| 51,911 | |||
| Information Technology (19.8%) | |||
| Apple Inc. | 37,632 | 25,110 | |
| International Business | |||
| Machines Corp. | 55,340 | 11,480 | |
| Microsoft Corp. | 301,041 | 8,965 | |
| Intel Corp. | 289,453 | 6,565 | |
| Cisco Systems Inc. | 323,815 | 6,182 | |
| * | Google Inc. Class A | 6,505 | 4,908 |
| Accenture plc Class A | 64,400 | 4,510 | |
| Mastercard Inc. Class A | 8,300 | 3,747 | |
| Motorola Solutions Inc. | 61,950 | 3,131 | |
| * | Fiserv Inc. | 40,700 | 3,013 |
| Seagate Technology plc | 89,700 | 2,781 | |
| Western Digital Corp. | 71,700 | 2,777 | |
| CAInc. | 103,900 | 2,677 | |
| * | LSI Corp. | 342,900 | 2,369 |
| * | Symantec Corp. | 128,700 | 2,317 |
| KLA-Tencor Corp. | 44,600 | 2,128 | |
| Oracle Corp. | 67,088 | 2,113 | |
| Jabil Circuit Inc. | 99,300 | 1,859 | |
| Total System Services Inc. | 73,400 | 1,740 | |
| QUALCOMMInc. | 23,657 | 1,478 | |
| * | Citrix Systems Inc. | 9,400 | 720 |
| * | Teradata Corp. | 6,600 | 498 |
| * | Advanced Micro | ||
| Devices Inc. | 78,200 | 263 | |
| * | Autodesk Inc. | 7,500 | 250 |
| 101,581 | |||
| Materials (3.5%) | |||
| Monsanto Co. | 49,700 | 4,524 | |
| CF Industries Holdings Inc. | 15,385 | 3,419 | |
| PPG Industries Inc. | 29,100 | 3,342 | |
| International Paper Co. | 91,700 | 3,331 | |
| Eastman Chemical Co. | 24,100 | 1,374 | |
| Ball Corp. | 31,700 | 1,341 | |
| Sherwin-WilliamsCo. | 3,300 | 491 | |
| FMC Corp. | 5,400 | 299 | |
| 18,121 | |||
| Telecommunication Services (3.7%) | |||
| AT&T Inc. | 295,735 | 11,149 | |
| Verizon | |||
| Communications Inc. | 168,396 | 7,674 | |
| 18,823 | |||
13
Structured Large-Cap Equity Fund
| Market | |||
| Value | |||
| Shares | ($000) | ||
| Utilities (3.0%) | |||
| American Electric | |||
| Power Co. Inc. | 77,100 | 3,388 | |
| Ameren Corp. | 85,600 | 2,796 | |
| Pinnacle West Capital Corp. | 52,000 | 2,746 | |
| Public Service | |||
| Enterprise Group Inc. | 76,200 | 2,452 | |
| Consolidated Edison Inc. | 28,200 | 1,689 | |
| DTEEnergy Co. | 20,300 | 1,217 | |
| PPL Corp. | 31,400 | 912 | |
| 15,200 | |||
| Total Common Stocks | |||
| (Cost $403,536) | 511,895 | ||
| Temporary Cash Investments (0.2%)1 | |||
| Money Market Fund (0.1%) | |||
| 2 | Vanguard Market | ||
| Liquidity Fund, 0.163% | 687,775 | 688 | |
| Face | |||
| Amount | |||
| ($000) | |||
| U.S. Government and Agency Obligations (0.1%) | |||
| 3 | Fannie Mae Discount | ||
| Notes, 0.160%, 10/31/12 | 100 | 100 | |
| 3,4 | Freddie Mac Discount | ||
| Notes, 0.170%, 12/17/12 | 100 | 100 | |
| United States Treasury | |||
| Note/Bond, 4.000%, | |||
| 11/15/12 | 100 | 100 | |
| 300 | |||
| Total Temporary Cash Investments | |||
| (Cost $988) | 988 | ||
| Total Investments (100.0%) | |||
| (Cost $404,524) | 512,883 | ||
| Other Assets and Liabilities (0.0%) | |||
| Other Assets | 750 | ||
| Liabilities | (905) | ||
| (155) | |||
| Net Assets (100%) | 512,728 | ||
| At September 30, 2012, net assets consisted of: | |
| Amount | |
| ($000) | |
| Paid-in Capital | 581,281 |
| Undistributed Net Investment Income | 7,009 |
| Accumulated Net Realized Losses | (183,912) |
| Unrealized Appreciation (Depreciation) | |
| Investment Securities | 108,359 |
| Futures Contracts | (9) |
| Net Assets | 512,728 |
| Institutional Shares—Net Assets | |
| Applicable to 549,485 outstanding | |
| $.001 par value shares of beneficial | |
| interest (unlimited authorization) | 15,291 |
| Net Asset Value Per Share— | |
| Institutional Shares | $27.83 |
| Institutional Plus Shares—Net Assets | |
| Applicable to 9,041,833 outstanding | |
| $.001 par value shares of beneficial | |
| interest (unlimited authorization) | 497,437 |
| Net Asset Value Per Share— | |
| Institutional Plus Shares | $55.02 |
See Note A in Notes to Financial Statements.
* Non-income-producing security.
1 The fund invests a portion of its cash reserves in equity markets through the use of index futures contracts. After giving effect to futures investments, the fund’s effective common stock and temporary cash investment positions represent 100.0% and 0.0%, respectively, of net assets.
2 Affiliated money market fund available only to Vanguard funds and certain trusts and accounts managed by Vanguard. Rate shown is the 7-day yield.
3 The issuer was placed under federal conservatorship in September 2008; since that time, its daily operations have been managed by the Federal Housing Finance Agency and it receives capital from the U.S. Treasury, as needed to maintain a positive net worth, in exchange for senior preferred stock.
4 Securities with a value of $100,000 have been segregated as initial margin for open futures contracts.
See accompanying Notes, which are an integral part of the Financial Statements.
14
Structured Large-Cap Equity Fund
| Statement of Operations | |
| Year Ended | |
| September 30, 2012 | |
| ($000) | |
| Investment Income | |
| Income | |
| Dividends | 10,847 |
| Interest1 | 1 |
| Total Income | 10,848 |
| Expenses | |
| The Vanguard Group—Note B | |
| Investment Advisory Services | 359 |
| Management and Administrative—Institutional Shares | 17 |
| Management and Administrative—Institutional Plus Shares | 293 |
| Marketing and Distribution—Institutional Shares | 4 |
| Marketing and Distribution—Institutional Plus Shares | 84 |
| Custodian Fees | 11 |
| Auditing Fees | 29 |
| Shareholders’ Reports—Institutional Shares | — |
| Shareholders’ Reports—Institutional Plus Shares | 1 |
| Total Expenses | 798 |
| Net Investment Income | 10,050 |
| Realized Net Gain (Loss) | |
| Investment Securities Sold | 29,872 |
| Futures Contracts | 189 |
| Realized Net Gain (Loss) | 30,061 |
| Change in Unrealized Appreciation (Depreciation) | |
| Investment Securities | 85,500 |
| Futures Contracts | 17 |
| Change in Unrealized Appreciation (Depreciation) | 85,517 |
| Net Increase (Decrease) in Net Assets Resulting from Operations | 125,628 |
| 1 Interest income from an affiliated company of the fund was $1,000. | |
See accompanying Notes, which are an integral part of the Financial Statements.
15
Structured Large-Cap Equity Fund
| Statement of Changes in Net Assets | ||
| Year Ended September 30, | ||
| 2012 | 2011 | |
| ($000) | ($000) | |
| Increase (Decrease) in Net Assets | ||
| Operations | ||
| Net Investment Income | 10,050 | 9,663 |
| Realized Net Gain (Loss) | 30,061 | 61,992 |
| Change in Unrealized Appreciation (Depreciation) | 85,517 | (33,034) |
| Net Increase (Decrease) in Net Assets Resulting from Operations | 125,628 | 38,621 |
| Distributions | ||
| Net Investment Income | ||
| Institutional Shares | (271) | (183) |
| Institutional Plus Shares | (9,009) | (11,627) |
| Realized Capital Gain | ||
| Institutional Shares | — | — |
| Institutional Plus Shares | — | — |
| Total Distributions | (9,280) | (11,810) |
| Capital Share Transactions | ||
| Institutional Shares | 9 | (90,798) |
| Institutional Plus Shares | 5,674 | (210,058) |
| Net Increase (Decrease) from Capital Share Transactions | 5,683 | (300,856) |
| Total Increase (Decrease) | 122,031 | (274,045) |
| Net Assets | ||
| Beginning of Period | 390,697 | 664,742 |
| End of Period1 | 512,728 | 390,697 |
| 1 Net Assets—End of Period includes undistributed net investment income of $7,009,000 and $6,239,000. | ||
See accompanying Notes, which are an integral part of the Financial Statements.
16
Structured Large-Cap Equity Fund
Financial Highlights
| Institutional Shares | |||||
| For a Share Outstanding | Year Ended September 30, | ||||
| Throughout Each Period | 2012 | 2011 | 2010 | 2009 | 2008 |
| Net Asset Value, Beginning of Period | $21.49 | $20.97 | $19.47 | $22.56 | $29.98 |
| Investment Operations | |||||
| Net Investment Income | .531 | .4281 | .366 | .546 | .492 |
| Net Realized and Unrealized Gain (Loss) | |||||
| on Investments | 6.306 | .458 | 1.505 | (2.993) | (7.091) |
| Total from Investment Operations | 6.837 | .886 | 1.871 | (2.447) | (6.599) |
| Distributions | |||||
| Dividends from Net Investment Income | (.497) | (.366) | (.371) | (.643) | (.430) |
| Distributions from Realized Capital Gains | — | — | — | — | (.391) |
| Total Distributions | (.497) | (.366) | (.371) | (.643) | (.821) |
| Net Asset Value, End of Period | $27.83 | $21.49 | $20.97 | $19.47 | $22.56 |
| Total Return | 32.32% | 4.14% | 9.68% | -10.25% | -22.52% |
| Ratios/Supplemental Data | |||||
| Net Assets, End of Period (Millions) | $15 | $12 | $95 | $106 | $135 |
| Ratio of Total Expenses to | |||||
| Average Net Assets | 0.24% | 0.24% | 0.24% | 0.25% | 0.20% |
| Ratio of Net Investment Income to | |||||
| Average Net Assets | 2.10% | 1.95% | 1.86% | 2.33% | 1.91% |
| Portfolio Turnover Rate | 64% | 67% | 61% | 80%2 | 72% |
1 Calculated based on average shares outstanding.
2 Excludes the value of portfolio securities received or delivered as a result of in-kind purchases or redemptions of the fund’s capital shares.
See accompanying Notes, which are an integral part of the Financial Statements.
17
Structured Large-Cap Equity Fund
Financial Highlights
| Institutional Plus Shares | |||||
| For a Share Outstanding | Year Ended September 30, | ||||
| Throughout Each Period | 2012 | 2011 | 2010 | 2009 | 2008 |
| Net Asset Value, Beginning of Period | $42.48 | $41.98 | $38.97 | $45.15 | $60.02 |
| Investment Operations | |||||
| Net Investment Income | 1.084 | .9101 | .768 | 1.116 | 1.025 |
| Net Realized and Unrealized Gain (Loss) | |||||
| on Investments | 12.466 | .906 | 3.014 | (5.980) | (14.193) |
| Total from Investment Operations | 13.550 | 1.816 | 3.782 | (4.864) | (13.168) |
| Distributions | |||||
| Dividends from Net Investment Income | (1.010) | (1.316) | (.772) | (1.316) | (.920) |
| Distributions from Realized Capital Gains | — | — | — | — | (.782) |
| Total Distributions | (1.010) | (1.316) | (.772) | (1.316) | (1.702) |
| Net Asset Value, End of Period | $55.02 | $42.48 | $41.98 | $38.97 | $45.15 |
| Total Return | 32.42% | 4.18% | 9.78% | -10.16% | -22.46% |
| Ratios/Supplemental Data | |||||
| Net Assets, End of Period (Millions) | $497 | $379 | $570 | $467 | $677 |
| Ratio of Total Expenses to | |||||
| Average Net Assets | 0.17% | 0.17% | 0.17% | 0.17% | 0.12% |
| Ratio of Net Investment Income to | |||||
| Average Net Assets | 2.17% | 2.02% | 1.93% | 2.41% | 1.99% |
| Portfolio Turnover Rate | 64% | 67% | 61% | 80%2 | 72% |
1 Calculated based on average shares outstanding.
2 Excludes the value of portfolio securities received or delivered as a result of in-kind purchases or redemptions of the fund’s capital shares.
See accompanying Notes, which are an integral part of the Financial Statements.
18
Structured Large-Cap Equity Fund
Notes to Financial Statements
Vanguard Structured Large-Cap Equity Fund is registered under the Investment Company Act of 1940 as an open-end investment company, or mutual fund. The fund offers two classes of shares: Institutional Shares and Institutional Plus Shares. Institutional Shares and Institutional Plus Shares are designed for investors who meet certain administrative, service, and account-size criteria.
A. The following significant accounting policies conform to generally accepted accounting principles for U.S. mutual funds. The fund consistently follows such policies in preparing its financial statements.
1. Security Valuation: Securities are valued as of the close of trading on the New York Stock Exchange (generally 4 p.m., Eastern time) on the valuation date. Equity securities are valued at the latest quoted sales prices or official closing prices taken from the primary market in which each security trades; such securities not traded on the valuation date are valued at the mean of the latest quoted bid and asked prices. Securities for which market quotations are not readily available, or whose values have been materially affected by events occurring before the fund’s pricing time but after the close of the securities’ primary markets, are valued by methods deemed by the board of trustees to represent fair value. Investments in Vanguard Market Liquidity Fund are valued at that fund’s net asset value.
Temporary cash investments acquired over 60 days to maturity are valued using the latest bid prices or using valuations based on a matrix system (which considers such factors as security prices, yields, maturities, and ratings), both as furnished by independent pricing services. Other temporary cash investments are valued at amortized cost, which approximates market value.
2. Futures Contracts: The fund uses index futures contracts to a limited extent, with the objective of maintaining full exposure to the stock market while maintaining liquidity. The fund may purchase or sell futures contracts to achieve a desired level of investment, whether to accommodate portfolio turnover or cash flows from capital share transactions. The primary risks associated with the use of futures contracts are imperfect correlation between changes in market values of stocks held by the fund and the prices of futures contracts, and the possibility of an illiquid market.
Futures contracts are valued at their quoted daily settlement prices. The aggregate principal amounts of the contracts are not recorded in the Statement of Net Assets. Fluctuations in the value of the contracts are recorded in the Statement of Net Assets as an asset (liability) and in the Statement of Operations as unrealized appreciation (depreciation) until the contracts are closed, when they are recorded as realized futures gains (losses).
During the year ended September 30, 2012, the fund’s average investment in futures contracts represented less than 1% of net assets, based on quarterly average aggregate settlement values.
3. Federal Income Taxes: The fund intends to continue to qualify as a regulated investment company and distribute all of its taxable income. Management has analyzed the fund’s tax positions taken for all open federal income tax years (September 30, 2009–2012), and has concluded that no provision for federal income tax is required in the fund’s financial statements.
4. Distributions: Distributions to shareholders are recorded on the ex-dividend date.
5. Other: Dividend income is recorded on the ex-dividend date. Interest income includes income distributions received from Vanguard Market Liquidity Fund and is accrued daily. Security transactions are accounted for on the date securities are bought or sold. Costs used to determine realized gains (losses) on the sale of investment securities are those of the specific securities sold.
19
Structured Large-Cap Equity Fund
Each class of shares has equal rights as to assets and earnings, except that each class separately bears certain class-specific expenses related to maintenance of shareholder accounts (included in Management and Administrative expenses) and shareholder reporting. Marketing and distribution expenses are allocated to each class of shares based on a method approved by the board of trustees. Income, other non-class-specific expenses, and gains and losses on investments are allocated to each class of shares based on its relative net assets.
B. The Vanguard Group furnishes at cost investment advisory, corporate management, administrative, marketing, and distribution services. The costs of such services are allocated to the fund under methods approved by the board of trustees. The fund has committed to provide up to 0.40% of its net assets in capital contributions to Vanguard. At September 30, 2012, the fund had contributed capital of $71,000 to Vanguard (included in Other Assets), representing 0.01% of the fund’s net assets and 0.03% of Vanguard’s capitalization. The fund’s trustees and officers are also directors and officers of Vanguard.
C. Various inputs may be used to determine the value of the fund’s investments. These inputs are summarized in three broad levels for financial statement purposes. The inputs or methodologies used to value securities are not necessarily an indication of the risk associated with investing in those securities.
Level 1—Quoted prices in active markets for identical securities.
Level 2—Other significant observable inputs (including quoted prices for similar securities, interest rates, prepayment speeds, credit risk, etc.).
Level 3—Significant unobservable inputs (including the fund’s own assumptions used to determine the fair value of investments).
The following table summarizes the market value of the fund’s investments as of September 30, 2012, based on the inputs used to value them:
| Level 1 | Level 2 | Level 3 | |
| Investments | ($000) | ($000) | ($000) |
| Common Stocks | 511,895 | — | — |
| Temporary Cash Investments | 688 | 300 | — |
| Futures Contracts—Liabilities1 | (4) | — | — |
| Total | 512,579 | 300 | — |
| 1 Represents variation margin on the last day of the reporting period. | |||
D. At September 30, 2012, the aggregate settlement value of open futures contracts and the related unrealized appreciation (depreciation) were:
| ($000) | ||||
| Aggregate | ||||
| Number of | Settlement | Unrealized | ||
| Long (Short) | Value | Appreciation | ||
| Futures Contracts | Expiration | Contracts | Long (Short) | (Depreciation) |
| E-mini S&P 500 Index | December 2012 | 12 | 861 | (9) |
Unrealized appreciation (depreciation) on open futures contracts is required to be treated as realized gain (loss) for tax purposes.
20
Structured Large-Cap Equity Fund
E. Distributions are determined on a tax basis and may differ from net investment income and realized capital gains for financial reporting purposes. Differences may be permanent or temporary. Permanent differences are reclassified among capital accounts in the financial statements to reflect their tax character. Temporary differences arise when certain items of income, expense, gain, or loss are recognized in different periods for financial statement and tax purposes; these differences will reverse at some time in the future. Differences in classification may also result from the treatment of short-term gains as ordinary income for tax purposes.
For tax purposes, at September 30, 2012, the fund had $7,528,000 of ordinary income available for distribution. The fund used capital loss carryforwards of $29,981,000 to offset taxable capital gains realized during the year ended September 30, 2012. At September 30, 2012, the fund had available capital losses totaling $183,929,000 to offset future net capital gains of $71,219,000 through September 30, 2017, and $112,710,000 through September 30, 2018.
At September 30, 2012, the cost of investment securities for tax purposes was $404,524,000. Net unrealized appreciation of investment securities for tax purposes was $108,359,000, consisting of unrealized gains of $111,376,000 on securities that had risen in value since their purchase and $3,017,000 in unrealized losses on securities that had fallen in value since their purchase.
F. During the year ended September 30, 2012, the fund purchased $303,158,000 of investment securities and sold $296,447,000 of investment securities, other than temporary cash investments.
G. Capital share transactions for each class of shares were:
| Year Ended September 30, | ||||
| 2012 | 2011 | |||
| Amount | Shares | Amount | Shares | |
| ($000) | (000) | ($000) | (000) | |
| Institutional Shares | ||||
| Issued | 221 | 9 | 1,694 | 73 |
| Issued in Lieu of Cash Distributions | — | — | — | — |
| Redeemed | (212) | (9) | (92,492) | (4,062) |
| Net Increase (Decrease)—Institutional Shares | 9 | — | (90,798) | (3,989) |
| Institutional Plus Shares | ||||
| Issued | 2,675 | 56 | — | — |
| Issued in Lieu of Cash Distributions | 2,999 | 66 | 3,795 | 85 |
| Redeemed | — | — | (213,853) | (4,734) |
| Net Increase (Decrease)—Institutional Plus Shares | 5,674 | 122 | (210,058) | (4,649) |
At September 30, 2012, two shareholders were each a record or beneficial owner of 33% or more of the fund’s net assets, with a combined ownership of 97%. If one of these shareholders were to redeem its investment in the fund, the redemption might result in an increase in the fund’s expense ratio, cause the fund to incur higher transaction costs, or lead to the realization of taxable capital gains.
H. In preparing the financial statements as of September 30, 2012, management considered the impact of subsequent events for potential recognition or disclosure in these financial statements.
21
Structured Broad Market Fund
Fund Profile
As of September 30, 2012
| Share-Class Characteristics | ||
| Institutional | Institutional | |
| Shares | Plus Shares | |
| Ticker Symbol | VSBMX | VSBPX |
| Expense Ratio1 | 0.24% | 0.17% |
| 30-Day SEC Yield | 2.00% | 2.07% |
| Portfolio Characteristics | |||
| DJ | |||
| Russell | U.S. Total | ||
| 3000 | Market | ||
| Fund | Index | Index | |
| Number of Stocks | 194 | 2,961 | 3,638 |
| Median Market Cap | $33.6B | $35.8B | $35.6B |
| Price/Earnings Ratio | 14.2x | 17.0x | 17.0x |
| Price/Book Ratio | 2.4x | 2.2x | 2.2x |
| Return on Equity | 18.5% | 17.8% | 18.0% |
| Earnings Growth Rate | 11.0% | 10.4% | 10.4% |
| Dividend Yield | 2.2% | 2.0% | 2.0% |
| Foreign Holdings | 0.0% | 0.0% | 0.0% |
| Turnover Rate | 58% | — | — |
| Short-Term Reserves | 0.0% | — | — |
| Sector Diversification (% of equity exposure) | |||
| DJ | |||
| Russell | U.S. Total | ||
| 3000 | Market | ||
| Fund | Index | Index | |
| Consumer Discretionary | 13.1% | 12.2% | 12.0% |
| Consumer Staples | 9.2 | 9.5 | 9.5 |
| Energy | 10.8 | 10.2 | 10.4 |
| Financials | 16.4 | 16.0 | 16.0 |
| Health Care | 11.1 | 11.9 | 11.9 |
| Industrials | 10.2 | 10.7 | 10.6 |
| Information Technology | 19.1 | 19.1 | 19.2 |
| Materials | 3.8 | 3.9 | 3.9 |
| Telecommunication | |||
| Services | 3.2 | 2.9 | 2.9 |
| Utilities | 3.1 | 3.6 | 3.6 |
| Volatility Measures | ||
| DJ | ||
| U.S. Total | ||
| Russell 3000 | Market | |
| Index | Index | |
| R-Squared | 0.99 | 0.99 |
| Beta | 1.01 | 1.01 |
These measures show the degree and timing of the fund’s fluctuations compared with the indexes over 36 months.
| Ten Largest Holdings (% of total net assets) | ||
| Apple Inc. | Computer Hardware | 4.4% |
| Exxon Mobil Corp. | Integrated Oil & Gas | 3.2 |
| Chevron Corp. | Integrated Oil & Gas | 2.0 |
| International Business | IT Consulting & | |
| Machines Corp. | Other Services | 2.0 |
| AT&T Inc. | Integrated | |
| Telecommunication | ||
| Services | 1.9 | |
| Microsoft Corp. | Systems Software | 1.8 |
| General Electric Co. | Industrial | |
| Conglomerates | 1.7 | |
| Pfizer Inc. | Pharmaceuticals | 1.6 |
| Wells Fargo & Co. | Diversified Banks | 1.6 |
| JPMorgan Chase & Co. | Other Diversified | |
| Financial Services | 1.5 | |
| Top Ten | 21.7% | |
The holdings listed exclude any temporary cash investments and equity index products.
Investment Focus

1 The expense ratios shown are from the prospectus dated January 26, 2012. For the fiscal year ended September 30, 2012, the expense ratios were 0.24% for Institutional Shares and 0.17% for Institutional Plus Shares.
22
Structured Broad Market Fund
Performance Summary
All of the returns in this report represent past performance, which is not a guarantee of future results that may be achieved by the fund. (Current performance may be lower or higher than the performance data cited. For performance data current to the most recent month-end, visit our website at vanguard.com/performance.) Note, too, that both investment returns and principal value can fluctuate widely, so an investor’s shares, when sold, could be worth more or less than their original cost. The returns shown do not reflect taxes that a shareholder would pay on fund distributions or on the sale of fund shares.
Cumulative Performance: November 30, 2006, Through September 30, 2012
Initial Investment of $5,000,000

| Average Annual Total Returns | |||||
| Periods Ended September 30, 2012 | |||||
| Since | Final Value | ||||
| One | Five | Inception | of a $5,000,000 | ||
| Year | Years | (11/30/2006) | Investment | ||
| Structured Broad Market Fund | |||||
| Institutional Shares | 31.43% | 0.95% | 2.26% | $5,697,265 | |
| •••••••• | Russell 3000 Index | 30.20 | 1.30 | 2.79 | 5,871,903 |
| – – – – | Multi-Cap Core Funds Average | 25.24 | -0.23 | 1.52 | 5,458,835 |
| Dow Jones U.S. Total Stock Market | |||||
| Index | 30.00 | 1.53 | 3.04 | 5,952,842 | |
Multi-Cap Core Funds Average: Derived from data provided by Lipper Inc.
"Since Inception" performance is calculated from the Institutional Shares’ inception date for both the fund and its comparative standards.
| Since | Final Value | |||
| One | Five | Inception | of a $200,000,000 | |
| Year | Years | (5/3/2004) | Investment | |
| Structured Broad Market Fund Institutional | ||||
| Plus Shares | 31.56% | 1.02% | 5.49% | $313,608,412 |
| Russell 3000 Index | 30.20 | 1.30 | 5.58 | 315,715,030 |
| Dow Jones U.S. Total Stock Market Index | 30.00 | 1.53 | 5.84 | 322,416,859 |
The fund commenced operations as a registered investment company on October 3, 2006. The fund's performance includes the performance of a predecessor trust, Vanguard Fiduciary Trust Company Structured Broad Market Trust, from May 3, 2004, to October 3, 2006.
"Since Inception" performance is calculated from the Institutional Plus Shares’ inception date for both the fund and its comparative standards.
See Financial Highlights for dividend and capital gains information.
23
Structured Broad Market Fund
Fiscal-Year Total Returns (%): November 30, 2006, Through September 30, 2012

24
Structured Broad Market Fund
Financial Statements
Statement of Net Assets
As of September 30, 2012
The fund reports a complete list of its holdings in regulatory filings four times in each fiscal year, at the quarter-ends. For the second and fourth fiscal quarters, the lists appear in the fund’s semiannual and annual reports to shareholders. For the first and third fiscal quarters, the fund files the lists with the Securities and Exchange Commission on Form N-Q. Shareholders can look up the fund’s Forms N-Q on the SEC’s website at sec.gov. Forms N-Q may also be reviewed and copied at the SEC’s Public Reference Room (see the back cover of this report for further information).
| Market | |||
| Value | |||
| Shares | ($000) | ||
| Common Stocks (99.6%)1 | |||
| Consumer Discretionary (13.0%) | |||
| Home Depot Inc. | 71,200 | 4,298 | |
| Comcast Corp. Class A | 95,991 | 3,434 | |
| CBS Corp. Class B | 74,000 | 2,688 | |
| TJX Cos. Inc. | 59,500 | 2,665 | |
| Gap Inc. | 65,800 | 2,354 | |
| Jarden Corp. | 44,200 | 2,335 | |
| Macy’s Inc. | 59,800 | 2,250 | |
| Marriott International Inc. | |||
| Class A | 56,800 | 2,221 | |
| Foot Locker Inc. | 61,100 | 2,169 | |
| Thor Industries Inc. | 58,700 | 2,132 | |
| Brinker International Inc. | 60,000 | 2,118 | |
| PVH Corp. | 22,000 | 2,062 | |
| Dillard’s Inc. Class A | 28,400 | 2,054 | |
| * | PulteGroup Inc. | 122,900 | 1,905 |
| Harley-Davidson Inc. | 44,800 | 1,898 | |
| Wynn Resorts Ltd. | 16,100 | 1,859 | |
| Regal Entertainment | |||
| Group Class A | 124,700 | 1,755 | |
| Belo Corp. Class A | 215,000 | 1,683 | |
| * | DIRECTV | 26,400 | 1,385 |
| Coach Inc. | 19,300 | 1,081 | |
| * | Delphi Automotive plc | 34,200 | 1,060 |
| * | priceline.com Inc. | 1,300 | 804 |
| Cracker Barrel Old | |||
| Country Store Inc. | 11,200 | 752 | |
| Advance Auto Parts Inc. | 10,400 | 712 | |
| Starwood Hotels & Resorts | |||
| Worldwide Inc. | 11,900 | 690 | |
| Gannett Co. Inc. | 28,500 | 506 | |
| * | Conn’s Inc. | 20,300 | 448 |
| McDonald’s Corp. | 3,611 | 331 | |
| * | Bed Bath & Beyond Inc. | 4,300 | 271 |
| News Corp. Class A | 10,700 | 262 | |
| Walt Disney Co. | 2,700 | 141 | |
| * | Amazon.com Inc. | 400 | 102 |
| 50,425 | |||
| Market | |||
| Value | |||
| Shares | ($000) | ||
| Consumer Staples (9.2%) | |||
| Philip Morris | |||
| International Inc. | 63,950 | 5,752 | |
| CVS Caremark Corp. | 72,600 | 3,515 | |
| Altria Group Inc. | 103,200 | 3,446 | |
| Wal-Mart Stores Inc. | 37,465 | 2,765 | |
| Kimberly-Clark Corp. | 31,000 | 2,659 | |
| Procter & Gamble Co. | 36,651 | 2,542 | |
| Reynolds American Inc. | 48,400 | 2,098 | |
| Kroger Co. | 86,400 | 2,034 | |
| Kraft Foods Inc. | 45,900 | 1,898 | |
| * | Dean Foods Co. | 108,800 | 1,779 |
| Coca-Cola Co. | 40,980 | 1,554 | |
| Herbalife Ltd. | 31,400 | 1,488 | |
| Nu Skin Enterprises Inc. | |||
| Class A | 29,300 | 1,138 | |
| * | Pilgrim’s Pride Corp. | 190,800 | 975 |
| Beam Inc. | 13,500 | 777 | |
| PepsiCo Inc. | 9,300 | 658 | |
| * | USANA Health Sciences Inc. | 9,700 | 451 |
| 35,529 | |||
| Energy (10.8%) | |||
| ExxonMobil Corp. | 136,520 | 12,485 | |
| ChevronCorp. | 65,365 | 7,619 | |
| ConocoPhillips | 64,040 | 3,662 | |
| Phillips 66 | 59,870 | 2,776 | |
| Marathon Petroleum Corp. | 49,500 | 2,702 | |
| National Oilwell Varco Inc. | 33,700 | 2,700 | |
| HollyFrontier Corp. | 57,700 | 2,381 | |
| Tesoro Corp. | 40,700 | 1,705 | |
| Occidental Petroleum Corp. | 19,540 | 1,682 | |
| Williams Cos. Inc. | 45,400 | 1,588 | |
| Valero Energy Corp. | 26,100 | 827 | |
| * | Helix Energy Solutions | ||
| Group Inc. | 31,300 | 572 | |
| Schlumberger Ltd. | 7,800 | 564 | |
| * | Plains Exploration & | ||
| Production Co. | 8,200 | 307 | |
| 41,570 | |||
25
Structured Broad Market Fund
| Market | |||
| Value | |||
| Shares | ($000) | ||
| Financials (16.3%) | |||
| Wells Fargo & Co. | 174,870 | 6,038 | |
| JPMorgan Chase & Co. | 147,336 | 5,964 | |
| US Bancorp | 105,850 | 3,631 | |
| American Express Co. | 58,720 | 3,339 | |
| Discover Financial Services | 66,500 | 2,642 | |
| Fifth Third Bancorp | 160,000 | 2,482 | |
| Allstate Corp. | 61,800 | 2,448 | |
| State Street Corp. | 56,600 | 2,375 | |
| * | American International | ||
| Group Inc. | 72,200 | 2,367 | |
| Aflac Inc. | 49,040 | 2,348 | |
| Torchmark Corp. | 42,500 | 2,182 | |
| KeyCorp | 248,200 | 2,169 | |
| Assurant Inc. | 49,700 | 1,854 | |
| * | Berkshire Hathaway Inc. | ||
| Class B | 19,200 | 1,693 | |
| Allied World Assurance Co. | |||
| Holdings AG | 20,341 | 1,571 | |
| * | World Acceptance Corp. | 21,956 | 1,481 |
| * | American Capital Ltd. | 117,900 | 1,337 |
| Public Storage | 8,900 | 1,239 | |
| HCP Inc. | 26,700 | 1,188 | |
| Nelnet Inc. Class A | 45,100 | 1,071 | |
| Host Hotels & Resorts Inc. | 66,500 | 1,067 | |
| Kimco Realty Corp. | 48,700 | 987 | |
| CBL & Associates | |||
| Properties Inc. | 46,100 | 984 | |
| General Growth | |||
| Properties Inc. | 48,800 | 951 | |
| Digital Realty Trust Inc. | 12,400 | 866 | |
| Lexington Realty Trust | 88,700 | 857 | |
| Duke Realty Corp. | 58,200 | 855 | |
| Weingarten Realty | |||
| Investors | 30,000 | 843 | |
| Apartment Investment & | |||
| Management Co. Class A | 31,700 | 824 | |
| Omega Healthcare | |||
| Investors Inc. | 33,500 | 761 | |
| Moody’s Corp. | 17,200 | 760 | |
| * | Credit Acceptance Corp. | 6,999 | 598 |
| * | Sunstone Hotel | ||
| Investors Inc. | 43,400 | 477 | |
| EverestRe Group Ltd. | 4,400 | 471 | |
| NASDAQ OMX Group Inc. | 19,300 | 450 | |
| Simon Property Group Inc. | 2,600 | 395 | |
| BB&T Corp. | 11,900 | 395 | |
| Prologis Inc. | 8,100 | 284 | |
| Liberty Property Trust | 7,200 | 261 | |
| Citigroup Inc. | 7,300 | 239 | |
| Bank of America Corp. | 21,400 | 189 | |
| Regions Financial Corp. | 18,800 | 135 | |
| 63,068 | |||
| Market | |||
| Value | |||
| Shares | ($000) | ||
| Health Care (11.0%) | |||
| Pfizer Inc. | 254,264 | 6,318 | |
| Abbott Laboratories | 68,100 | 4,669 | |
| UnitedHealth Group Inc. | 61,275 | 3,395 | |
| Merck & Co. Inc. | 73,683 | 3,323 | |
| EliLilly & Co. | 69,920 | 3,315 | |
| Bristol-Myers Squibb Co. | 90,752 | 3,063 | |
| Johnson & Johnson | 37,007 | 2,550 | |
| McKesson Corp. | 27,800 | 2,392 | |
| Aetna Inc. | 51,700 | 2,047 | |
| AmerisourceBergen Corp. | |||
| Class A | 52,300 | 2,025 | |
| * | CharlesRiver Laboratories | ||
| International Inc. | 42,600 | 1,687 | |
| Warner Chilcott plc Class A | 94,200 | 1,272 | |
| * | Pharmacyclics Inc. | 19,000 | 1,225 |
| Cooper Cos. Inc. | 12,700 | 1,200 | |
| ResMed Inc. | 26,800 | 1,085 | |
| Zimmer Holdings Inc. | 15,700 | 1,062 | |
| * | Community Health | ||
| Systems Inc. | 31,000 | 903 | |
| * | Watson | ||
| Pharmaceuticals Inc. | 10,000 | 852 | |
| * | WellCare Health Plans Inc. | 5,100 | 288 |
| 42,671 | |||
| Industrials (10.1%) | |||
| General Electric Co. | 286,380 | 6,504 | |
| Union Pacific Corp. | 28,800 | 3,418 | |
| Lockheed Martin Corp. | 27,200 | 2,540 | |
| Northrop Grumman Corp. | 36,330 | 2,413 | |
| Raytheon Co. | 42,200 | 2,412 | |
| Parker Hannifin Corp. | 27,400 | 2,290 | |
| Ingersoll-Rand plc | 48,600 | 2,178 | |
| Textron Inc. | 81,000 | 2,120 | |
| ChicagoBridge & | |||
| Iron Co. NV | 51,400 | 1,958 | |
| * | Delta Air Lines Inc. | 183,600 | 1,682 |
| * | CNHGlobal NV | 42,300 | 1,640 |
| Caterpillar Inc. | 18,500 | 1,592 | |
| Manitowoc Co. Inc. | 98,300 | 1,311 | |
| * | Alaska Air Group Inc. | 34,800 | 1,220 |
| United Technologies Corp. | 14,140 | 1,107 | |
| Honeywell International Inc. | 17,400 | 1,040 | |
| Dun & Bradstreet Corp. | 8,700 | 693 | |
| United Parcel Service Inc. | |||
| Class B | 9,600 | 687 | |
| Pitney Bowes Inc. | 41,000 | 567 | |
| Cintas Corp. | 13,200 | 547 | |
| * | US Airways Group Inc. | 45,700 | 478 |
| Lincoln Electric | |||
| Holdings Inc. | 11,100 | 433 | |
| Deluxe Corp. | 7,100 | 217 | |
| * | WESCO International Inc. | 1,800 | 103 |
| 39,150 | |||
26
Structured Broad Market Fund
| Market | |||
| Value | |||
| Shares | ($000) | ||
| Information Technology (19.1%) | |||
| Apple Inc. | 25,420 | 16,962 | |
| International Business | |||
| Machines Corp. | 36,642 | 7,601 | |
| Microsoft Corp. | 234,097 | 6,971 | |
| Intel Corp. | 192,290 | 4,361 | |
| Cisco Systems Inc. | 179,350 | 3,424 | |
| Accenture plc Class A | 45,800 | 3,207 | |
| * | Google Inc. Class A | 3,350 | 2,528 |
| Motorola Solutions Inc. | 46,700 | 2,361 | |
| * | Alliance Data Systems Corp. | 16,200 | 2,300 |
| Western Digital Corp. | 53,900 | 2,088 | |
| KLA-Tencor Corp. | 43,400 | 2,070 | |
| IAC/InterActiveCorp | 39,300 | 2,046 | |
| * | Cadence Design | ||
| Systems Inc. | 158,300 | 2,037 | |
| * | Unisys Corp. | 97,500 | 2,030 |
| * | VMware Inc. Class A | 19,900 | 1,925 |
| Heartland Payment | |||
| Systems Inc. | 50,900 | 1,613 | |
| Anixter International Inc. | 27,400 | 1,574 | |
| * | LSI Corp. | 226,700 | 1,566 |
| Fair Isaac Corp. | 29,000 | 1,284 | |
| * | NVIDIA Corp. | 85,400 | 1,139 |
| Jabil Circuit Inc. | 54,300 | 1,016 | |
| Oracle Corp. | 29,248 | 921 | |
| Mastercard Inc. Class A | 1,600 | 722 | |
| Intuit Inc. | 10,300 | 606 | |
| QUALCOMMInc. | 8,400 | 525 | |
| * | Gartner Inc. | 7,500 | 346 |
| * | Advanced Micro | ||
| Devices Inc. | 66,500 | 224 | |
| MAXIMUSInc. | 3,400 | 203 | |
| 73,650 | |||
| Materials (3.8%) | |||
| Monsanto Co. | 35,700 | 3,249 | |
| CF Industries Holdings Inc. | 11,550 | 2,567 | |
| PPG Industries Inc. | 22,100 | 2,538 | |
| FMC Corp. | 38,800 | 2,149 | |
| Eastman Chemical Co. | 37,000 | 2,109 | |
| Sherwin-WilliamsCo. | 7,200 | 1,072 | |
| Rockwood Holdings Inc. | 21,200 | 988 | |
| 14,672 | |||
| Telecommunication Services (3.2%) | |||
| AT&T Inc. | 192,429 | 7,254 | |
| Verizon | |||
| Communications Inc. | 111,057 | 5,061 | |
| 12,315 | |||
| Utilities (3.1%) | |||
| American Electric | |||
| Power Co. Inc. | 56,500 | 2,482 | |
| Public Service Enterprise | |||
| Group Inc. | 69,400 | 2,233 | |
| Consolidated Edison Inc. | 35,300 | 2,114 | |
| Market | ||
| Value | ||
| Shares | ($000) | |
| PNM Resources Inc. | 98,800 | 2,078 |
| Ameren Corp. | 62,300 | 2,035 |
| Pinnacle West Capital Corp. | 13,800 | 729 |
| DTEEnergy Co. | 3,900 | 234 |
| PPL Corp. | 2,500 | 73 |
| 11,978 | ||
| Total Common Stocks | ||
| (Cost $314,691) | 385,028 | |
| Temporary Cash Investments (0.4%)1 | ||
| Money Market Fund (0.4%) | ||
| 2 Vanguard Market | ||
| Liquidity Fund, 0.163% | 1,544,691 | 1,545 |
| Face | ||
| Amount | ||
| ($000) | ||
| U.S. Government and Agency Obligations (0.0%) | ||
| 3,4 Fannie Mae | ||
| Discount Notes, | ||
| 0.135%, 12/12/12 | 100 | 100 |
| Total Temporary Cash Investments | ||
| (Cost $1,645) | 1,645 | |
| Total Investments (100.0%) | ||
| (Cost $316,336) | 386,673 | |
| Other Assets and Liabilities (0.0%) | ||
| Other Assets | 572 | |
| Liabilities | (619) | |
| (47) | ||
| Net Assets (100%) | 386,626 | |
27
Structured Broad Market Fund
| At September 30, 2012, net assets consisted of: | |
| Amount | |
| ($000) | |
| Paid-in Capital | 347,798 |
| Undistributed Net Investment Income | 5,666 |
| Accumulated Net Realized Losses | (37,155) |
| Unrealized Appreciation (Depreciation) | |
| Investment Securities | 70,337 |
| Futures Contracts | (20) |
| Net Assets | 386,626 |
| Institutional Shares—Net Assets | |
| Applicable to 270,954 outstanding | |
| $.001 par value shares of beneficial | |
| interest (unlimited authorization) | 7,344 |
| Net Asset Value Per Share— | |
| Institutional Shares | $27.10 |
| Institutional Plus Shares—Net Assets | |
| Applicable to 7,001,134 outstanding | |
| $.001 par value shares of beneficial | |
| interest (unlimited authorization) | 379,282 |
| Net Asset Value Per Share— | |
| Institutional Plus Shares | $54.17 |
See Note A in Notes to Financial Statements.
* Non-income-producing security.
1 The fund invests a portion of its cash reserves in equity markets through the use of index futures contracts. After giving effect to futures investments, the fund’s effective common stock and temporary cash investment positions represent 100.0% and 0.0%, respectively, of net assets.
2 Affiliated money market fund available only to Vanguard funds and certain trusts and accounts managed by Vanguard. Rate shown is the 7-day yield.
3 The issuer was placed under federal conservatorship in September 2008; since that time, its daily operations have been managed by the Federal Housing Finance Agency and it receives capital from the U.S. Treasury, as needed to maintain a positive net worth, in exchange for senior preferred stock.
4 Securities with a value of $100,000 have been segregated as initial margin for open futures contracts.
See accompanying Notes, which are an integral part of the Financial Statements.
28
Structured Broad Market Fund
| Statement of Operations | |
| Year Ended | |
| September 30, 2012 | |
| ($000) | |
| Investment Income | |
| Income | |
| Dividends | 8,571 |
| Interest1 | 2 |
| Security Lending | 4 |
| Total Income | 8,577 |
| Expenses | |
| The Vanguard Group—Note B | |
| Investment Advisory Services | 294 |
| Management and Administrative—Institutional Shares | 10 |
| Management and Administrative—Institutional Plus Shares | 206 |
| Marketing and Distribution—Institutional Shares | — |
| Marketing and Distribution—Institutional Plus Shares | 56 |
| Custodian Fees | 9 |
| Auditing Fees | 28 |
| Shareholders’ Reports—Institutional Shares | — |
| Shareholders’ Reports—Institutional Plus Shares | 1 |
| Total Expenses | 604 |
| Net Investment Income | 7,973 |
| Realized Net Gain (Loss) | |
| Investment Securities Sold | 25,539 |
| Futures Contracts | 360 |
| Realized Net Gain (Loss) | 25,899 |
| Change in Unrealized Appreciation (Depreciation) | |
| Investment Securities | 58,818 |
| Futures Contracts | 47 |
| Change in Unrealized Appreciation (Depreciation) | 58,865 |
| Net Increase (Decrease) in Net Assets Resulting from Operations | 92,737 |
| 1 Interest income from an affiliated company of the fund was $2,000. | |
See accompanying Notes, which are an integral part of the Financial Statements.
29
Structured Broad Market Fund
| Statement of Changes in Net Assets | ||
| Year Ended September 30, | ||
| 2012 | 2011 | |
| ($000) | ($000) | |
| Increase (Decrease) in Net Assets | ||
| Operations | ||
| Net Investment Income | 7,973 | 5,614 |
| Realized Net Gain (Loss) | 25,899 | 29,319 |
| Change in Unrealized Appreciation (Depreciation) | 58,865 | (24,482) |
| Net Increase (Decrease) in Net Assets Resulting from Operations | 92,737 | 10,451 |
| Distributions | ||
| Net Investment Income | ||
| Institutional Shares | (119) | (94) |
| Institutional Plus Shares | (6,371) | (5,546) |
| Realized Capital Gain | ||
| Institutional Shares | — | — |
| Institutional Plus Shares | — | — |
| Total Distributions | (6,490) | (5,640) |
| Capital Share Transactions | ||
| Institutional Shares | 119 | 843 |
| Institutional Plus Shares | 4,615 | (18,297) |
| Net Increase (Decrease) from Capital Share Transactions | 4,734 | (17,454) |
| Total Increase (Decrease) | 90,981 | (12,643) |
| Net Assets | ||
| Beginning of Period | 295,645 | 308,288 |
| End of Period1 | 386,626 | 295,645 |
| 1 Net Assets—End of Period includes undistributed net investment income of $5,666,000 and $4,183,000. | ||
See accompanying Notes, which are an integral part of the Financial Statements.
30
Structured Broad Market Fund
Financial Highlights
| Institutional Shares | |||||
| For a Share Outstanding | Year Ended September 30, | ||||
| Throughout Each Period | 2012 | 2011 | 2010 | 2009 | 2008 |
| Net Asset Value, Beginning of Period | $21.03 | $20.70 | $18.99 | $21.53 | $28.67 |
| Investment Operations | |||||
| Net Investment Income | .544 | .3851 | .376 | .3521 | .402 |
| Net Realized and Unrealized Gain (Loss) | |||||
| on Investments | 5.973 | .338 | 1.672 | (2.500) | (6.833) |
| Total from Investment Operations | 6.517 | .723 | 2.048 | (2.148) | (6.431) |
| Distributions | |||||
| Dividends from Net Investment Income | (.447) | (.393) | (.338) | (.392) | (.280) |
| Distributions from Realized Capital Gains | — | — | — | — | (.429) |
| Total Distributions | (.447) | (.393) | (.338) | (.392) | (.709) |
| Net Asset Value, End of Period | $27.10 | $21.03 | $20.70 | $18.99 | $21.53 |
| Total Return | 31.43% | 3.37% | 10.88% | -9.67% | -22.95% |
| Ratios/Supplemental Data | |||||
| Net Assets, End of Period (Millions) | $7 | $6 | $5 | $4 | $4 |
| Ratio of Total Expenses to | |||||
| Average Net Assets | 0.24% | 0.24% | 0.24% | 0.25% | 0.20% |
| Ratio of Net Investment Income to | |||||
| Average Net Assets | 2.19% | 1.64% | 1.91% | 2.15% | 1.72% |
| Portfolio Turnover Rate | 58% | 56% | 52% | 62% | 70% |
| 1 Calculated based on average shares outstanding. | |||||
See accompanying Notes, which are an integral part of the Financial Statements.
31
Structured Broad Market Fund
Financial Highlights
| Institutional Plus Shares | |||||
| For a Share Outstanding | Year Ended September 30, | ||||
| Throughout Each Period | 2012 | 2011 | 2010 | 2009 | 2008 |
| Net Asset Value, Beginning of Period | $42.02 | $41.36 | $37.94 | $43.07 | $57.39 |
| Investment Operations | |||||
| Net Investment Income | 1.122 | .7961 | .778 | .7251 | .873 |
| Net Realized and Unrealized Gain (Loss) | |||||
| on Investments | 11.951 | .672 | 3.343 | (5.006) | (13.714) |
| Total from Investment Operations | 13.073 | 1.468 | 4.121 | (4.281) | (12.841) |
| Distributions | |||||
| Dividends from Net Investment Income | (.923) | (.808) | (.701) | (.849) | (.621) |
| Distributions from Realized Capital Gains | — | — | — | — | (.858) |
| Total Distributions | (.923) | (.808) | (.701) | (.849) | (1.479) |
| Net Asset Value, End of Period | $54.17 | $42.02 | $41.36 | $37.94 | $43.07 |
| Total Return | 31.56% | 3.43% | 10.96% | -9.60% | -22.91% |
| Ratios/Supplemental Data | |||||
| Net Assets, End of Period (Millions) | $379 | $290 | $304 | $275 | $248 |
| Ratio of Total Expenses to | |||||
| Average Net Assets | 0.17% | 0.17% | 0.17% | 0.17% | 0.12% |
| Ratio of Net Investment Income to | |||||
| Average Net Assets | 2.26% | 1.71% | 1.98% | 2.23% | 1.80% |
| Portfolio Turnover Rate | 58% | 56% | 52% | 62% | 70% |
| 1 Calculated based on average shares outstanding. | |||||
See accompanying Notes, which are an integral part of the Financial Statements.
32
Structured Broad Market Fund
Notes to Financial Statements
Vanguard Structured Broad Market Fund is registered under the Investment Company Act of 1940 as an open-end investment company, or mutual fund. The fund offers two classes of shares: Institutional Shares and Institutional Plus Shares. Institutional Shares and Institutional Plus Shares are designed for investors who meet certain administrative, service, and account-size criteria.
A. The following significant accounting policies conform to generally accepted accounting principles for U.S. mutual funds. The fund consistently follows such policies in preparing its financial statements.
1. Security Valuation: Securities are valued as of the close of trading on the New York Stock Exchange (generally 4 p.m., Eastern time) on the valuation date. Equity securities are valued at the latest quoted sales prices or official closing prices taken from the primary market in which each security trades; such securities not traded on the valuation date are valued at the mean of the latest quoted bid and asked prices. Securities for which market quotations are not readily available, or whose values have been materially affected by events occurring before the fund’s pricing time but after the close of the securities’ primary markets, are valued by methods deemed by the board of trustees to represent fair value. Investments in Vanguard Market Liquidity Fund are valued at that fund’s net asset value.
Temporary cash investments acquired over 60 days to maturity are valued using the latest bid prices or using valuations based on a matrix system (which considers such factors as security prices, yields, maturities, and ratings), both as furnished by independent pricing services. Other temporary cash investments are valued at amortized cost, which approximates market value.
2. Futures Contracts: The fund uses index futures contracts to a limited extent, with the objective of maintaining full exposure to the stock market while maintaining liquidity. The fund may purchase or sell futures contracts to achieve a desired level of investment, whether to accommodate portfolio turnover or cash flows from capital share transactions. The primary risks associated with the use of futures contracts are imperfect correlation between changes in market values of stocks held by the fund and the prices of futures contracts, and the possibility of an illiquid market.
Futures contracts are valued at their quoted daily settlement prices. The aggregate principal amounts of the contracts are not recorded in the Statement of Net Assets. Fluctuations in the value of the contracts are recorded in the Statement of Net Assets as an asset (liability) and in the Statement of Operations as unrealized appreciation (depreciation) until the contracts are closed, when they are recorded as realized futures gains (losses).
During the year ended September 30, 2012, the fund’s average investment in futures contracts represented less than 1% of net assets, based on quarterly average aggregate settlement values.
3. Federal Income Taxes: The fund intends to continue to qualify as a regulated investment company and distribute all of its taxable income. Management has analyzed the fund’s tax positions taken for all open federal income tax years (September 30, 2009–2012), and has concluded that no provision for federal income tax is required in the fund’s financial statements.
4. Distributions: Distributions to shareholders are recorded on the ex-dividend date.
33
Structured Broad Market Fund
5. Security Lending: The fund may lend its securities to qualified institutional borrowers to earn additional income. Security loans are required to be secured at all times by collateral at least equal to the market value of securities loaned. The fund invests cash collateral received in Vanguard Market Liquidity Fund, and records a liability for the return of the collateral, during the period the securities are on loan. Security lending income represents fees charged to borrowers plus income earned on investing cash collateral, less expenses associated with the loan.
6. Other: Dividend income is recorded on the ex-dividend date. Interest income includes income distributions received from Vanguard Market Liquidity Fund and is accrued daily. Security transactions are accounted for on the date securities are bought or sold. Costs used to determine realized gains (losses) on the sale of investment securities are those of the specific securities sold.
Each class of shares has equal rights as to assets and earnings, except that each class separately bears certain class-specific expenses related to maintenance of shareholder accounts (included in Management and Administrative expenses) and shareholder reporting. Marketing and distribution expenses are allocated to each class of shares based on a method approved by the board of trustees. Income, other non-class-specific expenses, and gains and losses on investments are allocated to each class of shares based on its relative net assets.
B. The Vanguard Group furnishes at cost investment advisory, corporate management, administrative, marketing, and distribution services. The costs of such services are allocated to the fund under methods approved by the board of trustees. The fund has committed to provide up to 0.40% of its net assets in capital contributions to Vanguard. At September 30, 2012, the fund had contributed capital of $54,000 to Vanguard (included in Other Assets), representing 0.01% of the fund’s net assets and 0.02% of Vanguard’s capitalization. The fund’s trustees and officers are also directors and officers of Vanguard.
C. Various inputs may be used to determine the value of the fund’s investments. These inputs are summarized in three broad levels for financial statement purposes. The inputs or methodologies used to value securities are not necessarily an indication of the risk associated with investing in those securities.
Level 1—Quoted prices in active markets for identical securities.
Level 2—Other significant observable inputs (including quoted prices for similar securities, interest rates, prepayment speeds, credit risk, etc.).
Level 3—Significant unobservable inputs (including the fund’s own assumptions used to determine the fair value of investments).
The following table summarizes the market value of the fund’s investments as of September 30, 2012, based on the inputs used to value them:
| Level 1 | Level 2 | Level 3 | |
| Investments | ($000) | ($000) | ($000) |
| Common Stocks | 385,028 | — | — |
| Temporary Cash Investments | 1,545 | 100 | — |
| Futures Contracts—Liabilities1 | (8) | — | — |
| Total | 386,565 | 100 | — |
| 1 Represents variation margin on the last day of the reporting period. | |||
34
Structured Broad Market Fund
D. At September 30, 2012, the aggregate settlement value of open futures contracts and the related unrealized appreciation (depreciation) were:
| ($000) | ||||
| Aggregate | ||||
| Number of | Settlement | Unrealized | ||
| Long (Short) | Value | Appreciation | ||
| Futures Contracts | Expiration | Contracts | Long (Short) | (Depreciation) |
| E-mini S&P 500 Index | December 2012 | 22 | 1,578 | (20) |
Unrealized appreciation (depreciation) on open futures contracts is required to be treated as realized gain (loss) for tax purposes.
E. Distributions are determined on a tax basis and may differ from net investment income and realized capital gains for financial reporting purposes. Differences may be permanent or temporary. Permanent differences are reclassified among capital accounts in the financial statements to reflect their tax character. Temporary differences arise when certain items of income, expense, gain, or loss are recognized in different periods for financial statement and tax purposes; these differences will reverse at some time in the future. Differences in classification may also result from the treatment of short-term gains as ordinary income for tax purposes.
For tax purposes, at September 30, 2012, the fund had $5,912,000 of ordinary income available for distribution. The fund used capital loss carryforwards of $25,947,000 to offset taxable capital gains realized during the year ended September 30, 2012. At September 30, 2012, the fund had available capital losses totaling $37,168,000 to offset future net capital gains through September 30, 2018.
At September 30, 2012, the cost of investment securities for tax purposes was $316,336,000.
Net unrealized appreciation of investment securities for tax purposes was $70,337,000, consisting of unrealized gains of $76,010,000 on securities that had risen in value since their purchase and $5,673,000 in unrealized losses on securities that had fallen in value since their purchase.
F. During the year ended September 30, 2012, the fund purchased $210,892,000 of investment securities and sold $204,235,000 of investment securities, other than temporary cash investments.
35
Structured Broad Market Fund
G. Capital share transactions for each class of shares were:
| Year Ended September 30, | ||||
| 2012 | 2011 | |||
| Amount | Shares | Amount | Shares | |
| ($000) | (000) | ($000) | (000) | |
| Institutional Shares | ||||
| Issued | — | — | 749 | 32 |
| Issued in Lieu of Cash Distributions | 119 | 5 | 94 | 4 |
| Redeemed | — | — | — | — |
| Net Increase (Decrease)—Institutional Shares | 119 | 5 | 843 | 36 |
| Institutional Plus Shares | ||||
| Issued | 2,634 | 55 | — | — |
| Issued in Lieu of Cash Distributions | 1,981 | 44 | 1,703 | 38 |
| Redeemed | — | — | (20,000) | (475) |
| Net Increase (Decrease)—Institutional Plus Shares | 4,615 | 99 | (18,297) | (437) |
At September 30, 2012, one shareholder was the record or beneficial owner of 89% of the fund’s net assets. If the shareholder were to redeem its investment in the fund, the redemption might result in an increase in the fund’s expense ratio, cause the fund to incur higher transaction costs, or lead to the realization of taxable capital gains.
H. In preparing the financial statements as of September 30, 2012, management considered the impact of subsequent events for potential recognition or disclosure in these financial statements.
36
Report of Independent Registered Public Accounting Firm
To the Trustees of Vanguard Quantitative Funds and the Shareholders of Vanguard Structured Large-Cap Equity Fund and Vanguard Structured Broad Market Fund:
In our opinion, the accompanying statements of net assets and the related statements of operations and of changes in net assets and the financial highlights present fairly, in all material respects, the financial position of Vanguard Structured Large-Cap Equity Fund and Vanguard Structured Broad Market Fund (constituting two separate portfolios of Vanguard Quantitative Funds, hereafter referred to as the “Funds”) at September 30, 2012, the results of each of their operations for the year ended, the changes in each of their net assets for each of the two years in the period then ended and the financial highlights for each of the five years in the period then ended, in conformity with accounting principles generally accepted in the United States of America. These financial statements and financial highlights (hereafter referred to as “financial statements”) are the responsibility of the Funds’ management; our responsibility is to express an opinion on these financial statements based on our audits. We conducted our audits of these financial statements in accordance with the standards of the Public Company Accounting Oversight Board (United States). Those standards require that we plan and perform the audit to obtain reasonable assurance about whether the financial statements are free of material misstatement. An audit includes examining, on a test basis, evidence supporting the amounts and disclosures in the financial statements, assessing the accounting principles used and significant estimates made by management, and evaluating the overall financial statement presentation. We believe that our audits, which included confirmation of securities at September 30, 2012 by correspondence with the custodian and broker and by agreement to the underlying ownership records of the transfer agent, provide a reasonable basis for our opinion.
PricewaterhouseCoopers LLP
Philadelphia, Pennsylvania
November 12, 2012
37
| Special 2012 tax information (unaudited) for Vanguard Structured Equity Funds |
This information for the fiscal year ended September 30, 2012, is included pursuant to provisions of the Internal Revenue Code.
The funds distributed qualified dividend income to shareholders during the fiscal year as follows:
| Qualified Dividend Income | |
| Fund | ($000) |
| Structured Large-Cap Equity Fund | 9,280 |
| Structured Broad Market Fund | 6,490 |
For corporate shareholders, the percentage of investment income (dividend income plus short-term gains, if any) that qualifies for the dividends-received deduction is as follows:
| Fund | Percentage |
| Structured Large-Cap Equity Fund | 100% |
| Structured Broad Market Fund | 97 |
38
About Your Fund’s Expenses
As a shareholder of the fund, you incur ongoing costs, which include costs for portfolio management, administrative services, and shareholder reports (like this one), among others. Operating expenses, which are deducted from a fund’s gross income, directly reduce the investment return of the fund.
A fund’s expenses are expressed as a percentage of its average net assets. This figure is known as the expense ratio. The following examples are intended to help you understand the ongoing costs (in dollars) of investing in your fund and to compare these costs with those of other mutual funds. The examples are based on an investment of $1,000 made at the beginning of the period shown and held for the entire period.
The accompanying table illustrates your fund’s costs in two ways:
• Based on actual fund return. This section helps you to estimate the actual expenses that you paid over the period. The ”Ending Account Value“ shown is derived from the fund‘s actual return, and the third column shows the dollar amount that would have been paid by an investor who started with $1,000 in the fund. You may use the information here, together with the amount you invested, to estimate the expenses that you paid over the period.
To do so, simply divide your account value by $1,000 (for example, an $8,600 account value divided by $1,000 = 8.6), then multiply the result by the number given for your fund under the heading ”Expenses Paid During Period.“
• Based on hypothetical 5% yearly return. This section is intended to help you compare your fund‘s costs with those of other mutual funds. It assumes that the fund had a yearly return of 5% before expenses, but that the expense ratio is unchanged. In this case—because the return used is not the fund’s actual return—the results do not apply to your investment. The example is useful in making comparisons because the Securities and Exchange Commission requires all mutual funds to calculate expenses based on a 5% return. You can assess your fund’s costs by comparing this hypothetical example with the hypothetical examples that appear in shareholder reports of other funds.
Note that the expenses shown in the table are meant to highlight and help you compare ongoing costs only and do not reflect transaction costs incurred by the fund for buying and selling securities. Further, the expenses do not include any purchase, redemption, or account service fees described in the fund prospectus. If such fees were applied to your account, your costs would be higher. Your fund does not carry a “sales load.”
The calculations assume no shares were bought or sold during the period. Your actual costs may have been higher or lower, depending on the amount of your investment and the timing of any purchases or redemptions.
You can find more information about the fund’s expenses, including annual expense ratios, in the Financial Statements section of this report. For additional information on operating expenses and other shareholder costs, please refer to your fund’s current prospectus.
39
| Six Months Ended September 30, 2012 | |||
| Beginning | Ending | Expenses | |
| Account Value | Account Value | Paid During | |
| 3/31/2012 | 9/30/2012 | Period | |
| Based on Actual Fund Return | |||
| Structured Large-Cap Equity Fund | |||
| Institutional Shares | $1,000.00 | $1,042.32 | $1.23 |
| Institutional Plus Shares | 1,000.00 | 1,042.84 | 0.87 |
| Structured Broad Market Fund | |||
| Institutional Shares | $1,000.00 | $1,027.29 | $1.22 |
| Institutional Plus Shares | 1,000.00 | 1,027.70 | 0.86 |
| Based on Hypothetical 5% Yearly Return | |||
| Structured Large-Cap Equity Fund | |||
| Institutional Shares | $1,000.00 | $1,023.87 | $1.22 |
| Institutional Plus Shares | 1,000.00 | 1,024.22 | 0.86 |
| Structured Broad Market Fund | |||
| Institutional Shares | $1,000.00 | $1,023.87 | $1.22 |
| Institutional Plus Shares | 1,000.00 | 1,024.22 | 0.86 |
The calculations are based on expenses incurred in the most recent six-month period. The funds’ annualized six-month expense ratios for that period are: for the Structured Large-Cap Equity Fund, 0.24% for Institutional Shares and 0.17% for Institutional Plus Shares; for the Structured Broad Market Fund, 0.24% for Institutional Shares and 0.17% for Institutional Plus Shares. The dollar amounts shown as “Expenses Paid” are equal to the annualized expense ratio multiplied by the average account value over the period, multiplied by the number of days in the most recent six-month period, then divided by the number of days in the most recent 12-month period.
40
Glossary
30-Day SEC Yield. A fund’s 30-day SEC yield is derived using a formula specified by the U.S. Securities and Exchange Commission. Under the formula, data related to the fund’s security holdings in the previous 30 days are used to calculate the fund’s hypothetical net income for that period, which is then annualized and divided by the fund’s estimated average net assets over the calculation period. For the purposes of this calculation, a security’s income is based on its current market yield to maturity (for bonds), its actual income (for asset-backed securities), or its projected dividend yield (for stocks). Because the SEC yield represents hypothetical annualized income, it will differ—at times significantly—from the fund’s actual experience. As a result, the fund’s income distributions may be higher or lower than implied by the SEC yield.
Beta. A measure of the magnitude of a fund’s past share-price fluctuations in relation to the ups and downs of a given market index. The index is assigned a beta of 1.00. Compared with a given index, a fund with a beta of 1.20 typically would have seen its share price rise or fall by 12% when the index rose or fell by 10%. For this report, beta is based on returns over the past 36 months for both the fund and the index. Note that a fund’s beta should be reviewed in conjunction with its R-squared (see definition). The lower the R-squared, the less correlation there is between the fund and the index, and the less reliable beta is as an indicator of volatility.
Dividend Yield. Dividend income earned by stocks, expressed as a percentage of the aggregate market value (or of net asset value, for a fund). The yield is determined by dividing the amount of the annual dividends by the aggregate value (or net asset value) at the end of the period. For a fund, the dividend yield is based solely on stock holdings and does not include any income produced by other investments.
Earnings Growth Rate. The average annual rate of growth in earnings over the past five years for the stocks now in a fund.
Equity Exposure. A measure that reflects a fund’s investments in stocks and stock futures. Any holdings in short-term reserves are excluded.
Expense Ratio. A fund’s total annual operating expenses expressed as a percentage of the fund’s average net assets. The expense ratio includes management and administrative expenses, but does not include the transaction costs of buying and selling portfolio securities.
Foreign Holdings. The percentage of a fund represented by securities or depositary receipts of companies based outside the United States.
Median Market Cap. An indicator of the size of companies in which a fund invests; the midpoint of market capitalization (market price x shares outstanding) of a fund’s stocks, weighted by the proportion of the fund’s assets invested in each stock. Stocks representing half of the fund’s assets have market capitalizations above the median, and the rest are below it.
Price/Book Ratio. The share price of a stock divided by its net worth, or book value, per share. For a fund, the weighted average price/book ratio of the stocks it holds.
Price/Earnings Ratio. The ratio of a stock’s current price to its per-share earnings over the past year. For a fund, the weighted average P/E of the stocks it holds. P/E is an indicator of market expectations about corporate prospects; the higher the P/E, the greater the expectations for a company’s future growth.
41
R-Squared. A measure of how much of a fund’s past returns can be explained by the returns from the market in general, as measured by a given index. If a fund’s total returns were precisely synchronized with an index’s returns, its R-squared would be 1.00. If the fund’s returns bore no relationship to the index’s returns, its R-squared would be 0. For this report, R-squared is based on returns over the past 36 months for both the fund and the index.
Return on Equity. The annual average rate of return generated by a company during the past five years for each dollar of shareholder’s equity (net income divided by shareholder’s equity). For a fund, the weighted average return on equity for the companies whose stocks it holds.
Short-Term Reserves. The percentage of a fund invested in highly liquid, short-term securities that can be readily converted to cash.
Turnover Rate. An indication of the fund’s trading activity. Funds with high turnover rates incur higher transaction costs and may be more likely to distribute capital gains (which may be taxable to investors). The turnover rate excludes in-kind transactions, which have minimal impact on costs.
42
This page intentionally left blank.
The People Who Govern Your Fund
The trustees of your mutual fund are there to see that the fund is operated and managed in your best interests since, as a shareholder, you are a part owner of the fund. Your fund’s trustees also serve on the board of directors of The Vanguard Group, Inc., which is owned by the Vanguard funds and provides services to them on an at-cost basis.
A majority of Vanguard’s board members are independent, meaning that they have no affiliation with Vanguard or the funds they oversee, apart from the sizable personal investments they have made as private individuals. The independent board members have distinguished backgrounds in business, academia, and public service. Each of the trustees and executive officers oversees 179 Vanguard funds.
The following table provides information for each trustee and executive officer of the fund. More information about the trustees is in the Statement of Additional Information, which can be obtained, without charge, by contacting Vanguard at 800-662-7447, or online at vanguard.com.
| InterestedTrustee1 | and Delphi Automotive LLP (automotive components); |
| Senior Advisor at New Mountain Capital; Trustee of | |
| F. William McNabb III | The Conference Board. |
| Born 1957. Trustee Since July 2009. Chairman of the | |
| Board. Principal Occupation(s) During the Past Five | Amy Gutmann |
| Years: Chairman of the Board of The Vanguard Group, | Born 1949. Trustee Since June 2006. Principal |
| Inc., and of each of the investment companies served | Occupation(s) During the Past Five Years: President |
| by The Vanguard Group, since January 2010; Director | of the University of Pennsylvania; Christopher H. |
| of The Vanguard Group since 2008; Chief Executive | Browne Distinguished Professor of Political Science |
| Officer and President of The Vanguard Group and of | in the School of Arts and Sciences with secondary |
| each of the investment companies served by The | appointments at the Annenberg School for |
| Vanguard Group since 2008; Director of Vanguard | Communication and the Graduate School of Education |
| Marketing Corporation; Managing Director of The | of the University of Pennsylvania; Member of the |
| Vanguard Group (1995–2008). | National Commission on the Humanities and Social |
| Sciences; Trustee of Carnegie Corporation of New | |
| IndependentTrustees | York and of the National Constitution Center; Chair |
| of the U.S. Presidential Commission for the Study | |
| Emerson U. Fullwood | of Bioethical Issues. |
| Born 1948. Trustee Since January 2008. Principal | |
| Occupation(s) During the Past Five Years: Executive | JoAnn Heffernan Heisen |
| Chief Staff and Marketing Officer for North America | Born 1950. Trustee Since July 1998. Principal |
| and Corporate Vice President (retired 2008) of Xerox | Occupation(s) During the Past Five Years: Corporate |
| Corporation (document management products and | Vice President and Chief Global Diversity Officer |
| services); Executive in Residence and 2010 | (retired 2008) and Member of the Executive |
| Distinguished Minett Professor at the Rochester | Committee (1997–2008) of Johnson & Johnson |
| Institute of Technology; Director of SPX Corporation | (pharmaceuticals/medical devices/consumer |
| (multi-industry manufacturing), the United Way of | products); Director of Skytop Lodge Corporation |
| Rochester, Amerigroup Corporation (managed health | (hotels), the University Medical Center at Princeton, |
| care), the University of Rochester Medical Center, | the Robert Wood Johnson Foundation, and the Center |
| Monroe Community College Foundation, and North | for Talent Innovation; Member of the Advisory Board |
| Carolina A&T University. | of the Maxwell School of Citizenship and Public Affairs |
| at Syracuse University. | |
| Rajiv L. Gupta | F. Joseph Loughrey |
| Born 1945. Trustee Since December 2001. 2 | Born 1949. Trustee Since October 2009. Principal |
| Principal Occupation(s) During the Past Five Years: | Occupation(s) During the Past Five Years: President |
| Chairman and Chief Executive Officer (retired 2009) | and Chief Operating Officer (retired 2009) of Cummins |
| and President (2006–2008) of Rohm and Haas Co. | Inc. (industrial machinery); Director of SKF AB |
| (chemicals); Director of Tyco International, Ltd. | (industrial machinery), Hillenbrand, Inc. (specialized |
| (diversified manufacturing and services), Hewlett- | consumer services), the Lumina Foundation for |
| Packard Co. (electronic computer manufacturing), | |
| Education, and Oxfam America; Chairman of the | Executive Officers | |
| Advisory Council for the College of Arts and Letters | ||
| and Member of the Advisory Board to the Kellogg | Glenn Booraem | |
| Institute for International Studies at the University | Born 1967. Controller Since July 2010. Principal | |
| of Notre Dame. | Occupation(s) During the Past Five Years: Principal | |
| of The Vanguard Group, Inc.; Controller of each of | ||
| Mark Loughridge | the investment companies served by The Vanguard | |
| Born 1953. Trustee Since March 2012. Principal | Group; Assistant Controller of each of the investment | |
| Occupation(s) During the Past Five Years: Senior Vice | companies served by The Vanguard Group (2001–2010). | |
| President and Chief Financial Officer at IBM (information | ||
| technology services); Fiduciary Member of IBM’s | Thomas J. Higgins | |
| Retirement Plan Committee. | Born 1957. Chief Financial Officer Since September | |
| 2008. Principal Occupation(s) During the Past Five | ||
| Scott C. Malpass | Years: Principal of The Vanguard Group, Inc.; Chief | |
| Born 1962. Trustee Since March 2012. Principal | Financial Officer of each of the investment companies | |
| Occupation(s) During the Past Five Years: Chief | served by The Vanguard Group; Treasurer of each of | |
| Investment Officer and Vice President at the University | the investment companies served by The Vanguard | |
| of Notre Dame; Assistant Professor of Finance at the | Group (1998–2008). | |
| Mendoza College of Business at Notre Dame; Member | ||
| of the Notre Dame 403(b) Investment Committee; | Kathryn J. Hyatt | |
| Director of TIFF Advisory Services, Inc. (investment | Born 1955. Treasurer Since November 2008. Principal | |
| advisor); Member of the Investment Advisory | Occupation(s) During the Past Five Years: Principal of | |
| Committees of the Financial Industry Regulatory | The Vanguard Group, Inc.; Treasurer of each of the | |
| Authority (FINRA) and of Major League Baseball. | investment companies served by The Vanguard | |
| Group; Assistant Treasurer of each of the investment | ||
| André F. Perold | companies served by The Vanguard Group (1988–2008). | |
| Born 1952. Trustee Since December 2004. Principal | ||
| Occupation(s) During the Past Five Years: George | Heidi Stam | |
| Gund Professor of Finance and Banking at the Harvard | Born 1956. Secretary Since July 2005. Principal | |
| Business School (retired 2011); Chief Investment | Occupation(s) During the Past Five Years: Managing | |
| Officer and Managing Partner of HighVista Strategies | Director of The Vanguard Group, Inc.; General Counsel | |
| LLC (private investment firm); Director of Rand | of The Vanguard Group; Secretary of The Vanguard | |
| Merchant Bank; Overseer of the Museum of Fine | Group and of each of the investment companies | |
| Arts Boston. | served by The Vanguard Group; Director and Senior | |
| Vice President of Vanguard Marketing Corporation. | ||
| Alfred M. Rankin, Jr. | ||
| Born 1941. Trustee Since January 1993. Principal | Vanguard Senior ManagementTeam | |
| Occupation(s) During the Past Five Years: Chairman, | ||
| President, and Chief Executive Officer of NACCO | Mortimer J. Buckley | Michael S. Miller |
| Industries, Inc. (forklift trucks/housewares/lignite); | Kathleen C. Gubanich | James M. Norris |
| Director of Goodrich Corporation (industrial products/ | Paul A. Heller | Glenn W. Reed |
| aircraft systems and services) and the National | Martha G. King | George U. Sauter |
| Association of Manufacturers; Chairman of the Board | Chris D. McIsaac | |
| of the Federal Reserve Bank of Cleveland and of | ||
| University Hospitals of Cleveland; Advisory Chairman | Chairman Emeritus and Senior Advisor | |
| of the Board of The Cleveland Museum of Art. | ||
| John J. Brennan | ||
| Peter F. Volanakis | Chairman, 1996–2009 | |
| Born 1955. Trustee Since July 2009. Principal | Chief Executive Officer and President, 1996–2008 | |
| Occupation(s) During the Past Five Years: President | ||
| and Chief Operating Officer (retired 2010) of Corning | ||
| Incorporated (communications equipment); Director | Founder | |
| of SPX Corporation (multi-industry manufacturing); | ||
| Overseer of the Amos Tuck School of Business | John C. Bogle | |
| Administration at Dartmouth College; Advisor to the | Chairman and Chief Executive Officer, 1974–1996 | |
| Norris Cotton Cancer Center. | ||
1 Mr. McNabb is considered an “interested person,” as defined in the Investment Company Act of 1940, because he is an officer of the Vanguard funds.
2 December 2002 for Vanguard Equity Income Fund, Vanguard Growth Equity Fund, the Vanguard Municipal Bond Funds, and the Vanguard State Tax-Exempt Funds.
 | |
| P.O. Box 2600 | |
| Valley Forge, PA 19482-2600 |
Connect with Vanguard® > vanguard.com
| Fund Information > 800-662-7447 | CFA® is a trademark owned by CFA Institute. |
| Direct Investor Account Services > 800-662-2739 | |
| Institutional Investor Services > 800-523-1036 | |
| Text Telephone for People | |
| With Hearing Impairment > 800-749-7273 | |
| This material may be used in conjunction | |
| with the offering of shares of any Vanguard | |
| fund only if preceded or accompanied by | |
| the fund’s current prospectus. | |
| All comparative mutual fund data are from Lipper Inc. or | |
| Morningstar, Inc., unless otherwise noted. | |
| You can obtain a free copy of Vanguard’s proxy voting | |
| guidelines by visiting vanguard.com/proxyreporting or by | |
| calling Vanguard at 800-662-2739. The guidelines are | |
| also available from the SEC’s website, sec.gov. In | |
| addition, you may obtain a free report on how your fund | |
| voted the proxies for securities it owned during the 12 | |
| months ended June 30. To get the report, visit either | |
| vanguard.com/proxyreporting or sec.gov. | |
| You can review and copy information about your fund at | |
| the SEC’s Public Reference Room in Washington, D.C. To | |
| find out more about this public service, call the SEC at | |
| 202-551-8090. Information about your fund is also | |
| available on the SEC’s website, and you can receive | |
| copies of this information, for a fee, by sending a | |
| request in either of two ways: via e-mail addressed to | |
| publicinfo@sec.gov or via regular mail addressed to the | |
| Public Reference Section, Securities and Exchange | |
| Commission, Washington, DC 20549-1520. | |
| © 2012 The Vanguard Group, Inc. | |
| All rights reserved. | |
| Vanguard Marketing Corporation, Distributor. | |
| Q08700 112012 | |
Item 2: Code of Ethics. The Registrant has adopted a code of ethics that applies to the Registrant’s principal executive officer, principal financial officer, principal accounting officer or controller or persons performing similar functions. The Code of Ethics was amended during the reporting period covered by this report to make certain technical, non-material changes.
Item 3: Audit Committee Financial Expert. The following members of the Audit Committee have been determined by the Registrant’s Board of Trustees to be Audit Committee Financial Experts serving on its Audit Committee, and to be independent: Rajiv L. Gupta, Amy Gutmann, JoAnn Heffernan Heisen, F. Joseph Loughrey, Mark Loughridge, Scott C. Malpass, André F. Perold, and Alfred M. Rankin, Jr.
Item 4: Principal Accountant Fees and Services.
(a) Audit Fees.
Audit Fees of the Registrant
Fiscal Year Ended September 30, 2012: $85,000
Fiscal Year Ended September 30, 2011: $84,000
Aggregate Audit Fees of Registered Investment Companies in the Vanguard Group.
Fiscal Year Ended September 30, 2012: $4,809,780
Fiscal Year Ended September 30, 2011: $3,978,540
(b) Audit-Related Fees.
Fiscal Year Ended September 30, 2012: $1,812,565
Fiscal Year Ended September 30, 2011: $1,341,750
Includes fees billed in connection with assurance and related services provided to the Registrant, The Vanguard Group, Inc., Vanguard Marketing Corporation, and other registered investment companies in the Vanguard Group.
(c) Tax Fees.
Fiscal Year Ended September 30, 2012: $490,518
Fiscal Year Ended September 30, 2011: $373,830
Includes fees billed in connection with tax compliance, planning and advice services provided to the Registrant, The Vanguard Group, Inc., Vanguard Marketing Corporation, and other registered investment companies in the Vanguard Group and related to income and excise taxes.
(d) All Other Fees.
Fiscal Year Ended September 30, 2012: $16,000
Fiscal Year Ended September 30, 2011: $16,000
Includes fees billed for services related to risk management and privacy matters. Services were provided to the Registrant, The Vanguard Group, Inc., Vanguard Marketing Corporation, and other registered investment companies in the Vanguard Group.
(e) (1) Pre-Approval Policies. The policy of the Registrant’s Audit Committee is to consider and, if appropriate, approve before the principal accountant is engaged for such services, all specific audit and non-audit services provided to: (1) the Registrant; (2) The Vanguard Group, Inc.; (3) other entities controlled by The Vanguard Group, Inc. that provide ongoing services to the Registrant; and (4) other registered investment companies in the Vanguard Group. In making a determination, the Audit Committee considers whether the services are consistent with maintaining the principal accountant’s independence.
In the event of a contingency situation in which the principal accountant is needed to provide services in between scheduled Audit Committee meetings, the Chairman of the Audit Committee would be called on to consider and, if appropriate, pre-approve audit or permitted non-audit services in an amount sufficient to complete services through the next Audit Committee meeting, and to determine if such services would be consistent with maintaining the accountant’s independence. At the next scheduled Audit Committee meeting, services and fees would be presented to the Audit Committee for formal consideration, and, if appropriate, approval by the entire Audit Committee. The Audit Committee would again consider whether such services and fees are consistent with maintaining the principal accountant’s independence.
The Registrant’s Audit Committee is informed at least annually of all audit and non-audit services provided by the principal accountant to the Vanguard complex, whether such services are provided to: (1) the Registrant; (2) The Vanguard Group, Inc.; (3) other entities controlled by The Vanguard Group, Inc. that provide ongoing services to the Registrant; or (4) other registered investment companies in the Vanguard Group.
(2) No percentage of the principal accountant’s fees or services were approved pursuant to the waiver provision of paragraph (c)(7)(i)(C) of Rule 2-01 of Regulation S-X.
(f) For the most recent fiscal year, over 50% of the hours worked under the principal accountant’s engagement were not performed by persons other than full-time, permanent employees of the principal accountant.
(g) Aggregate Non-Audit Fees.
Fiscal Year Ended September 30, 2012: $506,518
Fiscal Year Ended September 30, 2011: $389,830
Includes fees billed for non-audit services provided to the Registrant, The Vanguard Group, Inc., Vanguard Marketing Corporation, and other registered investment companies in the Vanguard Group.
(h) For the most recent fiscal year, the Audit Committee has determined that the provision of all non-audit services was consistent with maintaining the principal accountant’s independence.
Item 5: Audit Committee of Listed Registrants.
Not Applicable.
Item 6: Investments.
Not Applicable.
Item 7: Disclosure of Proxy Voting Policies and Procedures for Closed-End Management Investment Companies.
Not Applicable.
Item 8: Portfolio Managers of Closed-End Management Investment Companies.
Not Applicable.
Item 9: Purchase of Equity Securities by Closed-End Management Investment Company and Affiliated
Purchasers.
Not Applicable.
Item 10: Submission of Matters to a Vote of Security Holders.
Not Applicable.
Item 11: Controls and Procedures.
(a) Disclosure Controls and Procedures. The Principal Executive and Financial Officers concluded that the Registrant's Disclosure Controls and Procedures are effective based on their evaluation of the Disclosure Controls and Procedures as of a date within 90 days of the filing date of this report.
(b) Internal Control Over Financial Reporting. There were no significant changes in Registrant’s Internal Control Over Financial Reporting or in other factors that could significantly affect this control subsequent to the date of the evaluation, including any corrective actions with regard to significant deficiencies and material weaknesses.
Item 12: Exhibits.
(a) Code of Ethics.
(b) Certifications.
Pursuant to the requirements of the Securities Exchange Act of 1934 and the Investment Company Act of 1940, the registrant has duly caused this report to be signed on its behalf by the undersigned, thereunto duly authorized.
| VANGUARD QUANTITATIVE FUNDS | |
| By: | /s/ F. WILLIAM MCNABB III* |
| F. WILLIAM MCNABB III | |
| CHIEF EXECUTIVE OFFICER | |
| Date: November 16, 2012 | |
Pursuant to the requirements of the Securities Exchange Act of 1934 and the Investment Company Act of 1940, this report has been signed below by the following persons on behalf of the registrant and in the capacities and on the dates indicated.
| VANGUARD QUANTITATIVE FUNDS | |
| By: | /s/ F. WILLIAM MCNABB III* |
| F. WILLIAM MCNABB III | |
| CHIEF EXECUTIVE OFFICER | |
| Date: November 16, 2012 | |
| VANGUARD QUANTITATIVE FUNDS | |
| By: | /s/ THOMAS J. HIGGINS* |
| THOMAS J. HIGGINS | |
| CHIEF FINANCIAL OFFICER | |
| Date: November 16, 2012 | |
* By: /s/ Heidi Stam
Heidi Stam, pursuant to a Power of Attorney filed on March 27, 2012 see file Number 2-11444, Incorporated by Reference.