UNITED STATES
SECURITIES AND EXCHANGE COMMISSION
Washington, D.C. 20549
FORM N-CSR
CERTIFIED SHAREHOLDER REPORT
OF
REGISTERED MANAGEMENT INVESTMENT COMPANIES
Investment Company Act file number: 811-4526
Name of Registrant: Vanguard Quantitative Funds
Address of Registrant:
P.O. Box 2600
Valley Forge, PA 19482
Name and address of agent for service:
Heidi Stam, Esquire
P.O. Box 876
Valley Forge, PA 19482
Registrant’s telephone number, including area code: (610) 669-1000
Date of fiscal year end: September 30
Date of reporting period: October 1, 2010 – September 30, 2011
Item 1: Reports to Shareholders
| Annual Report | September 30, 2011 |
| Vanguard Growth and Income Fund |
> Vanguard Growth and Income Fund’s Investor Shares returned 1.28% for the fiscal year ended September 30, 2011, outpacing the fund’s benchmark, which returned 1.14%, and its large-capitalization core fund peers, whose average return was –1.26%.
> Optimism gave way to anxiety over the 12-month period, with stock prices retreating amid pronounced volatility.
> Stock selection in financials, information technology, energy, and consumer staples helped returns, while the consumer discretionary sector detracted from performance.
| Contents | |
| Your Fund’s Total Returns. | 1 |
| Chairman’s Letter. | 2 |
| Fund Profile. | 7 |
| Performance Summary. | 8 |
| Financial Statements. | 10 |
| Your Fund’s After-Tax Returns. | 26 |
| About Your Fund’s Expenses. | 27 |
| Notice to Shareholders. | 29 |
| Glossary. | 35 |
Please note: The opinions expressed in this report are just that—informed opinions. They should not be considered promises or advice. Also, please keep in mind that the information and opinions cover the period through the date on the front of this report. Of course, the risks of investing in your fund are spelled out in the prospectus.
See the Glossary for definitions of investment terms used in this report.
About the cover: Vanguard was named for the HMS Vanguard, flagship of British Admiral Horatio Nelson. A ship—whose performance and safety depend on the work of all hands—has served as a fitting metaphor for the Vanguard crew as we strive to help clients reach their financial goals.
Your Fund’s Total Returns
| Fiscal Year Ended September 30, 2011 | |
| Total | |
| Returns | |
| Vanguard Growth and Income Fund | |
| Investor Shares | 1.28% |
| Admiral™ Shares | 1.39 |
| S&P 500 Index | 1.14 |
| Large-Cap Core Funds Average | -1.26 |
| Large-Cap Core Funds Average: Derived from data provided by Lipper Inc. | |
| Admiral Shares carry lower expenses and are available to investors who meet certain account-balance requirements. | |
| Your Fund’s Performance at a Glance | ||||
| September 30, 2010 , Through September 30, 2011 | ||||
| Distributions Per Share | ||||
| Starting | Ending | Income | Capital | |
| Share Price | Share Price | Dividends | Gains | |
| Vanguard Growth and Income Fund | ||||
| Investor Shares | $23.98 | $23.86 | $0.478 | $0.000 |
| Admiral Shares | 39.15 | 38.97 | 0.813 | 0.000 |
1

Chairman’s Letter
Dear Shareholder,
Stocks were on a roller-coaster ride for the fiscal year ended September 30, 2011, with a double-digit rally in stock prices followed by a double-digit slump. In this challenging environment, Vanguard Growth and Income Fund’s Investor Shares returned 1.28% and its Admiral Shares returned 1.39%—slightly ahead of the return of its benchmark, the S&P 500 Index, and well ahead of the average return for large-capitalization core fund peers.
Please note that effective September 30, 2011, Vanguard Growth and Income Fund adopted a multimanager approach, with three advisors assuming investment advisory responsibilities from Mellon Capital Management Corporation. The new advisors, each of which will manage approximately one-third of the fund’s assets, are Los Angeles Capital Management, D. E. Shaw Investment Management, L.L.C., and Vanguard Quantitative Equity Group.
Mellon Capital has distinguished itself for many years as an advisor to the fund, and we want to express our sincere gratitude for its dedication, commitment, and service to our clients.
The objective and investment strategy of the fund have not changed. The advisors continue to adhere to a quantitative approach, using computer models to select a broadly diversified group of stocks that, as a whole, have investment characteristics similar to those of the S&P
2
500 Index but, in the advisors’ judgement, better return prospects. For more details on the strategies of the advisors, please see the Notice to Shareholders that appears later in this report.
A swift change in sentiment weighed on stock prices
Global stock markets rallied through the first half of the fiscal year as corporate earnings surged and the economic recovery seemed to be gathering steam. In the second half, however, stock prices tumbled as economic indicators took a turn for the worse and U.S. and European policymaking strife dominated the headlines. (Standard & Poor’s, the ratings agency, downgraded the U.S. credit rating, in large part because of the political gridlock on display during the debt-ceiling debate. Vanguard’s confidence in the “full faith and credit” of the U.S. Treasury remains unshaken.)
The U.S. stock market’s second-half weakness offset its first-half strength. The broad market returned 0.31% for the full 12 months. International stocks, which gained less at the start of the year and lost more at the end, returned –10.81% in U.S. dollars.
Bond prices rallied as optimism faded
The stock market’s pattern of strength and weakness was inverted in the bond market. Early in the year, bond prices retreated, consistent with investor optimism about economic growth. Later in the year, as
| Market Barometer | |||
| Average Annual Total Returns | |||
| Periods Ended September 30, 2011 | |||
| One | Three | Five | |
| Year | Years | Years | |
| Stocks | |||
| Russell 1000 Index (Large-caps) | 0.91% | 1.61% | -0.91% |
| Russell 2000 Index (Small-caps) | -3.53 | -0.37 | -1.02 |
| Dow Jones U.S. Total Stock Market Index | 0.31 | 1.75 | -0.57 |
| MSCI All Country World Index ex USA (International) | -10.81 | 0.52 | -1.57 |
| Bonds | |||
| Barclays Capital U.S. Aggregate Bond Index (Broad | |||
| taxable market) | 5.26% | 7.97% | 6.53% |
| Barclays Capital Municipal Bond Index (Broad | |||
| tax-exempt market) | 3.88 | 8.08 | 5.01 |
| Citigroup Three-Month U.S. Treasury Bill Index | 0.11 | 0.19 | 1.61 |
| CPI | |||
| Consumer Price Index | 3.87% | 1.22% | 2.26% |
3
optimism gave way to anxiety, bond prices surged, driving yields to remarkable lows. At the end of September, the yield of the 10-year U.S. Treasury note, a benchmark for longer-term interest rates, stood at 1.93%. Bond indexes recorded impressive returns, though it’s worth noting that shrinking yields imply lower returns on prospective investments.
The yields of money market instruments hovered near zero, as they have since December 2008, when the Federal Reserve cut its target for short-term interest rates to between 0% and 0.25%. Toward the end of the period, the Fed indicated that it expected to maintain this exceptionally low target at least through mid-2013.
Modest success over the past 12 months
During the past 12 months, the fund met its objective, outperforming the S&P 500 Index while maintaining sector weightings and other portfolio characteristics similar to those of the index. Although the margin of outperformance was modest, the returns reflected the prior advisor’s success in identifying some of the better-performing stocks in each sector and avoiding the weaker performers. In the past year’s volatile market, bottom-up stock selection strategies struggled to distinguish themselves as stocks tended to rise and fall in response to big-picture shocks rather than based on individual stock fundamentals. That said, the fund’s Investor Shares outpaced the S&P 500 Index slightly and beat the average for
| Expense Ratios | |||
| Your Fund Compared With Its Peer Group | |||
| Investor | Admiral | Peer Group | |
| Shares | Shares | Average | |
| Growth and Income Fund | 0.34% | 0.23% | 1.26% |
The fund expense ratios shown are from the prospectus dated January 27, 2011, and represent estimated costs for the current fiscal year. For the fiscal year ended September 30, 2011, the fund’s expense ratios were 0.32% for Investor Shares and 0.21% for Admiral Shares. The peer-group expense ratio is derived from data provided by Lipper Inc. and captures information through year-end 2010.
Peer group: Large-Cap Core Funds.
4
large-capitalization core fund peers by more than 2 percentage points. Admiral Shares fared even better.
The prior advisor’s stock selection model performed best in the financial sector, where it managed to avoid some of the hardest-hit investment banks, brokerages, and financial services giants. Stock selection in the information technology sector paid off as well, with the fund avoiding some underperforming stocks in communications equipment and electronic components while maintaining above-benchmark holdings in strongly performing computer hardware stocks. The fund’s energy and consumer staples holdings also lifted its performance.
The main shortfall was in the consumer discretionary sector. These stocks performed surprisingly well in the sluggish economy, but the fund had limited exposure to the best performers.
Competitive returns over the past ten years
Financial markets have faced a number of difficulties since September 30, 2001, including record-high oil prices, a recession, and crises in both the housing and financial sectors. But at the end of an unusually troubled decade, the fund nevertheless had managed to post a positive return, exemplifying the value of taking a long-term approach to investing. During this period, the average annual return for the fund’s
| Total Returns | |
| Ten Years Ended September 30, 2011 | |
| Average | |
| Annual Return | |
| Growth and Income Fund Investor Shares | 2.18% |
| S&P 500 Index | 2.82 |
| Large-Cap Core Funds Average | 1.40 |
| Large-Cap Core Funds Average: Derived from data provided by Lipper Inc. |
The figures shown represent past performance, which is not a guarantee of future results. (Current performance may be lower or higher than the performance data cited. For performance data current to the most recent month-end, visit our website at vanguard.com/performance.) Note, too, that both investment returns and principal value can fluctuate widely, so an investor’s shares, when sold, could be worth more or less than their original cost.
5
Investor Shares was 2.18%, less than the 2.82% return of the S&P 500 Index, but above the average return of 1.40% for its large-capitalization core fund peers.
Although markets often shift, your investment plan shouldn’t
The past 12 months clearly illustrate how rapidly the financial markets can change direction. While the markets will inevitably continue to experience occasional setbacks, we believe a well-balanced investment portfolio can help provide some cushion in market downturns while still allowing investors to participate in the stock market’s long-term potential for growth. Vanguard Growth and Income Fund can be a core component of such a portfolio, given its broad exposure to large-capitalization stocks and the opportunity it provides to benefit from the experience and expertise of the fund’s three new advisors. And the fund’s low costs help investors maximize their share of any rewards produced by the advisors’ stock selection strategies.
As always, thank you for entrusting your assets to Vanguard.
Sincerely,

F. William McNabb III
Chairman and Chief Executive Officer
October 12, 2011
6
Growth and Income Fund
Fund Profile
As of September 30, 2011
| Share-Class Characteristics | ||
| Investor | Admiral | |
| Shares | Shares | |
| Ticker Symbol | VQNPX | VGIAX |
| Expense Ratio1 | 0.34% | 0.23% |
| 30-Day SEC Yield | 2.22% | 2.33% |
| Portfolio Characteristics | |||
| DJ | |||
| U.S. Total | |||
| S&P 500 | Market | ||
| Fund | Index | Index | |
| Number of Stocks | 480 | 500 | 3,717 |
| Median Market Cap | $42.8B | $45.5B | $28.7B |
| Price/Earnings Ratio | 12.4x | 12.9x | 13.6x |
| Price/Book Ratio | 1.9x | 1.9x | 1.9x |
| Return on Equity | 20.2% | 20.3% | 19.1% |
| Earnings Growth Rate | 7.4% | 7.4% | 7.3% |
| Dividend Yield | 2.5% | 2.4% | 2.2% |
| Foreign Holdings | 0.1% | 0.0% | 0.0% |
| Turnover Rate | 120% | — | — |
| Short-Term Reserves | 0.8% | — | — |
| Sector Diversification (% of equity exposure) | |||
| DJ | |||
| U.S. Total | |||
| S&P 500 | Market | ||
| Fund | Index | Index | |
| Consumer | |||
| Discretionary | 10.6% | 10.6% | 12.2% |
| Consumer Staples | 11.7 | 11.8 | 11.0 |
| Energy | 11.1 | 11.6 | 10.3 |
| Financials | 13.6 | 13.6 | 14.3 |
| Health Care | 12.5 | 12.1 | 11.7 |
| Industrials | 10.1 | 10.3 | 10.6 |
| Information | |||
| Technology | 19.1 | 19.4 | 19.4 |
| Materials | 3.5 | 3.3 | 4.0 |
| Telecommunication | |||
| Services | 4.0 | 3.3 | 2.8 |
| Utilities | 3.8 | 4.0 | 3.7 |
| Volatility Measures | ||
| DJ | ||
| U.S. Total | ||
| S&P 500 | Market | |
| Index | Index | |
| R-Squared | 0.99 | 0.99 |
| Beta | 1.03 | 0.99 |
These measures show the degree and timing of the fund’s fluctuations compared with the indexes over 36 months.
| Ten Largest Holdings (% of total net assets) | ||
| Apple Inc. | Computer | |
| Hardware | 3.6% | |
| Exxon Mobil Corp. | Integrated Oil & | |
| Gas | 3.2 | |
| Chevron Corp. | Integrated Oil & | |
| Gas | 2.0 | |
| AT&T Inc. | Integrated | |
| Telecommunication | ||
| Services | 2.0 | |
| International Business | IT Consulting & | |
| Machines Corp. | Other Services | 1.9 |
| Microsoft Corp. | Systems Software | 1.9 |
| Pfizer Inc. | Pharmaceuticals | 1.6 |
| Procter & Gamble Co. | Household | |
| Products | 1.5 | |
| Verizon Communications | Integrated | |
| Inc. | Telecommunication | |
| Services | 1.4 | |
| Philip Morris | ||
| International Inc. | Tobacco | 1.3 |
| Top Ten | 20.4% | |
The holdings listed exclude any temporary cash investments and equity index products.
Investment Focus

1 The expense ratios shown are from the prospectus dated January 27, 2011, and represent estimated costs for the current fiscal year. For the fiscal year ended September 30, 2011, the expense ratios were 0.32% for Investor Shares and 0.21% for Admiral Shares.
7
Growth and Income Fund
Performance Summary
All of the returns in this report represent past performance, which is not a guarantee of future results that may be achieved by the fund. (Current performance may be lower or higher than the performance data cited. For performance data current to the most recent month-end, visit our website at vanguard.com/performance.) Note, too, that both investment returns and principal value can fluctuate widely, so an investor’s shares, when sold, could be worth more or less than their original cost. The returns shown do not reflect taxes that a shareholder would pay on fund distributions or on the sale of fund shares.
Cumulative Performance: September 30, 2001, Through September 30, 2011
Initial Investment of $10,000
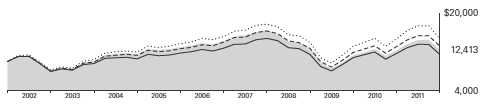
| Average Annual Total Returns | ||||
| Periods Ended September 30, 2011 | ||||
| Final Value | ||||
| One | Five | Ten | of a $10,000 | |
| Year | Years | Years | Investment | |
| Growth and Income Fund Investor | ||||
| Shares | 1.28% | -2.64% | 2.18% | $12,413 |
| Dow Jones U.S. Total Stock Market | ||||
| Index | 0.31 | -0.57 | 3.93 | 14,709 |
| S&P 500 Index | 1.14 | -1.18 | 2.82 | 13,200 |
| Large-Cap Core Funds Average | -1.26 | -2.05 | 1.40 | 11,489 |
| Large-Cap Core Funds Average: Derived from data provided by Lipper Inc. | ||||
| Average Annual Total Returns | ||||
| Periods Ended September 30, 2011 | ||||
| Final Value | ||||
| One | Five | Ten | of a $50,000 | |
| Year | Years | Years | Investment | |
| Growth and Income Fund Admiral | ||||
| Shares | 1.39% | -2.51% | 2.33% | $62,947 |
| Dow Jones U.S. Total Stock Market | ||||
| Index | 0.31 | -0.57 | 3.93 | 73,544 |
| S&P 500 Index | 1.14 | -1.18 | 2.82 | 66,001 |
See Financial Highlights for dividend and capital gains information.
8
Growth and Income Fund
Fiscal-Year Total Returns (%): September 30, 2001, Through September 30, 2011
9
Growth and Income Fund
Financial Statements
Statement of Net Assets
As of September 30, 2011
The fund reports a complete list of its holdings in regulatory filings four times in each fiscal year, at the quarter-ends. For the second and fourth fiscal quarters, the lists appear in the fund’s semiannual and annual reports to shareholders. For the first and third fiscal quarters, the fund files the lists with the Securities and Exchange Commission on Form N-Q. Shareholders can look up the fund’s Forms N-Q on the SEC’s website at sec.gov. Forms N-Q may also be reviewed and copied at the SEC’s Public Reference Room (see the back cover of this report for further information).
| Market | |||
| Value | |||
| Shares | ($000) | ||
| Common Stocks (90.9%)1 | |||
| Consumer Discretionary (9.6%) | |||
| McDonald’s Corp. | 305,224 | 26,805 | |
| Home Depot Inc. | 643,232 | 21,143 | |
| Time Warner Inc. | 677,536 | 20,306 | |
| * | Amazon.com Inc. | 93,337 | 20,182 |
| * | priceline.com Inc. | 38,643 | 17,368 |
| News Corp. Class A | 947,456 | 14,657 | |
| Walt Disney Co. | 460,500 | 13,889 | |
| Coach Inc. | 215,700 | 11,180 | |
| * | DIRECTV Class A | 264,557 | 11,177 |
| Starbucks Corp. | 298,767 | 11,141 | |
| * | O’Reilly Automotive Inc. | 163,304 | 10,881 |
| Macy’s Inc. | 404,000 | 10,633 | |
| * | Bed Bath & Beyond Inc. | 170,300 | 9,760 |
| Wynn Resorts Ltd. | 83,705 | 9,633 | |
| TJX Cos. Inc. | 151,800 | 8,420 | |
| Time Warner Cable Inc. | 125,300 | 7,853 | |
| Viacom Inc. Class B | 188,900 | 7,318 | |
| * | AutoZone Inc. | 21,000 | 6,703 |
| CBS Corp. Class B | 325,500 | 6,634 | |
| Limited Brands Inc. | 172,100 | 6,628 | |
| Family Dollar Stores Inc. | 129,211 | 6,572 | |
| Comcast Corp. Class A | 310,300 | 6,485 | |
| McGraw-Hill Cos. Inc. | 154,877 | 6,350 | |
| Lowe’s Cos. Inc. | 322,800 | 6,243 | |
| Ralph Lauren Corp. Class A | 43,700 | 5,668 | |
| Genuine Parts Co. | 97,766 | 4,966 | |
| Wyndham Worldwide Corp. | 169,450 | 4,831 | |
| Harley-Davidson Inc. | 139,784 | 4,799 | |
| Nordstrom Inc. | 93,300 | 4,262 | |
| * | Apollo Group Inc. Class A | 107,434 | 4,255 |
| * | Big Lots Inc. | 119,258 | 4,154 |
| Leggett & Platt Inc. | 154,333 | 3,054 | |
| Gap Inc. | 184,816 | 3,001 | |
| Washington Post Co. | |||
| Class B | 9,001 | 2,943 | |
| * | Discovery | ||
| Communications Inc. | 72,900 | 2,562 | |
| * | GameStop Corp. Class A | 105,405 | 2,435 |
| Market | |||
| Value | |||
| Shares | ($000) | ||
| Best Buy Co. Inc. | 88,294 | 2,057 | |
| NIKE Inc. Class B | 23,700 | 2,027 | |
| H&R Block Inc. | 151,433 | 2,016 | |
| Abercrombie & Fitch Co. | 32,500 | 2,001 | |
| Staples Inc. | 139,100 | 1,850 | |
| Kohl’s Corp. | 35,700 | 1,753 | |
| International Game | |||
| Technology | 109,400 | 1,590 | |
| Marriott International Inc. | |||
| Class A | 51,200 | 1,395 | |
| * | Coinstar Inc. | 33,800 | 1,352 |
| Hasbro Inc. | 39,207 | 1,278 | |
| Harman International | |||
| Industries Inc. | 43,400 | 1,240 | |
| * | Charter Communications Inc. | ||
| Class A | 24,500 | 1,148 | |
| Scripps Networks | |||
| Interactive Inc. Class A | 30,800 | 1,145 | |
| Newell Rubbermaid Inc. | 85,400 | 1,014 | |
| Tiffany & Co. | 13,800 | 839 | |
| Mattel Inc. | 27,700 | 717 | |
| DeVry Inc. | 18,880 | 698 | |
| Interpublic Group | |||
| of Cos. Inc. | 84,400 | 608 | |
| * | Ulta Salon Cosmetics | ||
| & Fragrance Inc. | 9,300 | 579 | |
| * | Urban Outfitters Inc. | 22,000 | 491 |
| * | Orbitz Worldwide Inc. | 199,300 | 432 |
| Ross Stores Inc. | 5,100 | 401 | |
| * | Pulte Group Inc. | 63,807 | 252 |
| * | Discovery | ||
| Communications Inc. | |||
| Class A | 6,100 | 229 | |
| * | Netflix Inc. | 1,821 | 206 |
| Nutrisystem Inc. | 15,600 | 189 | |
| Lithia Motors Inc. Class A | 10,200 | 147 | |
| * | Las Vegas Sands Corp. | 3,600 | 138 |
| * | LodgeNet Interactive Corp. | 75,900 | 128 |
| DR Horton Inc. | 12,343 | 112 | |
| * | Warnaco Group Inc. | 1,744 | 80 |
| * | ANN Inc. | 3,400 | 78 |
10
Growth and Income Fund
| Market | |||
| Value | |||
| Shares | ($000) | ||
| Whirlpool Corp. | 1,200 | 60 | |
| * | Ascena Retail Group Inc. | 2,100 | 57 |
| Gannett Co. Inc. | 5,200 | 50 | |
| Finish Line Inc. Class A | 2,400 | 48 | |
| * | Domino’s Pizza Inc. | 1,300 | 35 |
| * | Boyd Gaming Corp. | 5,200 | 25 |
| * | Pinnacle Entertainment Inc. | 2,200 | 20 |
| * | HSN Inc. | 600 | 20 |
| Rent-A-Center Inc. | 700 | 19 | |
| Stewart Enterprises Inc. | |||
| Class A | 1,200 | 7 | |
| * | DineEquity Inc. | 100 | 4 |
| * | Pier 1 Imports Inc. | 100 | 1 |
| 353,427 | |||
| Consumer Staples (10.6%) | |||
| Procter & Gamble Co. | 891,830 | 56,346 | |
| Philip Morris | |||
| International Inc. | 793,989 | 49,529 | |
| Wal-Mart Stores Inc. | 734,279 | 38,109 | |
| Coca-Cola Co. | 492,617 | 33,281 | |
| Altria Group Inc. | 1,020,268 | 27,353 | |
| Lorillard Inc. | 204,721 | 22,663 | |
| Walgreen Co. | 672,618 | 22,122 | |
| Coca-Cola Enterprises Inc. | 669,830 | 16,665 | |
| Tyson Foods Inc. Class A | 873,605 | 15,166 | |
| PepsiCo Inc. | 218,661 | 13,535 | |
| Colgate-Palmolive Co. | 143,312 | 12,709 | |
| CVS Caremark Corp. | 378,100 | 12,697 | |
| Dr Pepper Snapple | |||
| Group Inc. | 271,006 | 10,510 | |
| Kimberly-Clark Corp. | 142,261 | 10,102 | |
| Kroger Co. | 367,500 | 8,070 | |
| * | Constellation Brands Inc. | ||
| Class A | 420,290 | 7,565 | |
| Hershey Co. | 115,500 | 6,842 | |
| Reynolds American Inc. | 165,442 | 6,201 | |
| Estee Lauder Cos. Inc. | |||
| Class A | 52,335 | 4,597 | |
| Sysco Corp. | 169,699 | 4,395 | |
| Kraft Foods Inc. | 113,538 | 3,813 | |
| ConAgra Foods Inc. | 90,183 | 2,184 | |
| Whole Foods Market Inc. | 28,610 | 1,869 | |
| Sara Lee Corp. | 76,300 | 1,247 | |
| HJ Heinz Co. | 10,671 | 539 | |
| * | Fresh Market Inc. | 10,400 | 397 |
| * | Dean Foods Co. | 36,500 | 324 |
| Cosan Ltd. | 1,100 | 10 | |
| 388,840 | |||
| Energy (10.1%) | |||
| Exxon Mobil Corp. | 1,633,814 | 118,664 | |
| Chevron Corp. | 787,942 | 72,900 | |
| ConocoPhillips | 684,884 | 43,367 | |
| Occidental Petroleum Corp. | 268,545 | 19,201 | |
| Anadarko Petroleum Corp. | 236,296 | 14,898 | |
| Schlumberger Ltd. | 211,019 | 12,604 | |
| * | Tesoro Corp. | 623,365 | 12,136 |
| Market | |||
| Value | |||
| Shares | ($000) | ||
| Marathon Petroleum Corp. | 389,100 | 10,529 | |
| National Oilwell Varco Inc. | 204,324 | 10,465 | |
| Devon Energy Corp. | 181,191 | 10,045 | |
| Marathon Oil Corp. | 394,834 | 8,520 | |
| Valero Energy Corp. | 406,400 | 7,226 | |
| Halliburton Co. | 182,593 | 5,573 | |
| Noble Energy Inc. | 73,798 | 5,225 | |
| Range Resources Corp. | 57,600 | 3,367 | |
| Chesapeake Energy Corp. | 85,200 | 2,177 | |
| Cabot Oil & Gas Corp. | 32,806 | 2,031 | |
| Helmerich & Payne Inc. | 49,204 | 1,998 | |
| Apache Corp. | 18,744 | 1,504 | |
| Pioneer Natural | |||
| Resources Co. | 20,396 | 1,341 | |
| Baker Hughes Inc. | 25,781 | 1,190 | |
| Murphy Oil Corp. | 25,671 | 1,134 | |
| Sunoco Inc. | 28,300 | 878 | |
| * | Cheniere Energy Inc. | 167,400 | 862 |
| * | Southwestern Energy Co. | 20,200 | 673 |
| * | Denbury Resources Inc. | 57,500 | 661 |
| * | FMC Technologies Inc. | 4,900 | 184 |
| Consol Energy Inc. | 3,608 | 122 | |
| * | Nabors Industries Ltd. | 7,800 | 96 |
| * | Energy XXI Bermuda Ltd. | 2,500 | 54 |
| Crosstex Energy Inc. | 3,100 | 42 | |
| * | Newfield Exploration Co. | 900 | 36 |
| * | Hercules Offshore Inc. | 11,500 | 34 |
| Overseas Shipholding | |||
| Group Inc. | 2,300 | 32 | |
| * | Exterran Holdings Inc. | 2,800 | 27 |
| Talisman Energy Inc. | 2,200 | 27 | |
| * | Helix Energy Solutions | ||
| Group Inc. | 1,800 | 24 | |
| Teekay Corp. | 712 | 16 | |
| * | Gulfport Energy Corp. | 400 | 9 |
| * | Petroleum Development Corp. | 400 | 8 |
| Teekay Tankers Ltd. Class A | 1,500 | 7 | |
| * | Key Energy Services Inc. | 500 | 5 |
| Patterson-UTI Energy Inc. | 100 | 2 | |
| * | Patriot Coal Corp. | 100 | 1 |
| 369,895 | |||
| Exchange-Traded Funds (0.1%) | |||
| SPDR S&P 500 ETF Trust | 47,600 | 5,387 | |
| Financials (12.3%) | |||
| JPMorgan Chase & Co. | 1,276,601 | 38,451 | |
| Wells Fargo & Co. | 1,386,300 | 33,438 | |
| * | Berkshire Hathaway Inc. | ||
| Class B | 320,505 | 22,769 | |
| American Express Co. | 426,437 | 19,147 | |
| Simon Property Group Inc. | 171,200 | 18,829 | |
| CME Group Inc. | 65,888 | 16,235 | |
| Public Storage | 143,189 | 15,944 | |
| * | NASDAQ OMX Group Inc. | 681,950 | 15,780 |
| Marsh & McLennan | |||
| Cos. Inc. | 553,425 | 14,688 | |
11
Growth and Income Fund
| Market | |||
| Value | |||
| Shares | ($000) | ||
| Discover Financial Services | 602,900 | 13,830 | |
| US Bancorp | 586,541 | 13,807 | |
| Leucadia National Corp. | 505,687 | 11,469 | |
| Franklin Resources Inc. | 110,050 | 10,525 | |
| Goldman Sachs Group Inc. | 106,100 | 10,032 | |
| M&T Bank Corp. | 138,089 | 9,652 | |
| Ameriprise Financial Inc. | 243,284 | 9,576 | |
| Citigroup Inc. | 358,200 | 9,177 | |
| Chubb Corp. | 151,209 | 9,071 | |
| ACE Ltd. | 145,200 | 8,799 | |
| Capital One Financial Corp. | 216,834 | 8,593 | |
| Prudential Financial Inc. | 181,700 | 8,514 | |
| HCP Inc. | 225,345 | 7,901 | |
| Bank of America Corp. | 1,283,000 | 7,852 | |
| Unum Group | 355,955 | 7,461 | |
| Legg Mason Inc. | 265,692 | 6,831 | |
| Moody’s Corp. | 221,950 | 6,758 | |
| AvalonBay | |||
| Communities Inc. | 58,889 | 6,716 | |
| Torchmark Corp. | 178,900 | 6,236 | |
| PNC Financial Services | |||
| Group Inc. | 123,239 | 5,939 | |
| T Rowe Price Group Inc. | 120,966 | 5,779 | |
| Federated Investors Inc. | |||
| Class B | 295,162 | 5,174 | |
| Aon Corp. | 116,742 | 4,901 | |
| Assurant Inc. | 132,433 | 4,741 | |
| ProLogis Inc. | 189,100 | 4,586 | |
| Boston Properties Inc. | 50,215 | 4,474 | |
| People’s United | |||
| Financial Inc. | 374,992 | 4,275 | |
| Equity Residential | 82,339 | 4,271 | |
| American International | |||
| Group Inc. | 172,200 | 3,780 | |
| Plum Creek Timber Co. Inc. | 80,386 | 2,790 | |
| BB&T Corp. | 120,700 | 2,574 | |
| Aflac Inc. | 68,429 | 2,392 | |
| Loews Corp. | 68,100 | 2,353 | |
| Hudson City Bancorp Inc. | 381,900 | 2,162 | |
| Travelers Cos. Inc. | 43,216 | 2,106 | |
| Apartment Investment | |||
| & Management Co. | 80,056 | 1,771 | |
| SunTrust Banks Inc. | 92,800 | 1,666 | |
| Vornado Realty Trust | 20,600 | 1,537 | |
| Invesco Ltd. | 95,855 | 1,487 | |
| Erie Indemnity Co. Class A | 20,700 | 1,473 | |
| Hartford Financial | |||
| Services Group Inc. | 87,600 | 1,414 | |
| Bank of New York | |||
| Mellon Corp. | 66,400 | 1,234 | |
| Kimco Realty Corp. | 79,420 | 1,194 | |
| Progressive Corp. | 66,000 | 1,172 | |
| * | First Industrial | ||
| Realty Trust Inc. | 140,700 | 1,126 | |
| Healthcare Realty Trust Inc. | 56,600 | 954 | |
| Regions Financial Corp. | 218,600 | 728 |
| Market | |||
| Value | |||
| Shares | ($000) | ||
| * | CNO Financial Group Inc. | 125,100 | 677 |
| * | eHealth Inc. | 45,500 | 621 |
| * | IntercontinentalExchange Inc. | 5,100 | 603 |
| Post Properties Inc. | 15,400 | 535 | |
| KeyCorp | 89,350 | 530 | |
| Principal Financial Group Inc. | 22,100 | 501 | |
| BlackRock Inc. | 2,800 | 414 | |
| Transatlantic Holdings Inc. | 8,500 | 412 | |
| * | iStar Financial Inc. | 48,300 | 281 |
| First Horizon National Corp. | 39,100 | 233 | |
| Willis Group Holdings plc | 6,500 | 223 | |
| * | NewStar Financial Inc. | 21,700 | 203 |
| * | Ezcorp Inc. Class A | 7,100 | 203 |
| Zions Bancorporation | 13,138 | 185 | |
| CapitalSource Inc. | 24,600 | 151 | |
| Brookfield Office | |||
| Properties Inc. | 4,000 | 55 | |
| Cincinnati Financial Corp. | 1,700 | 45 | |
| * | Genworth Financial Inc. | ||
| Class A | 6,300 | 36 | |
| Prospect Capital Corp. | 3,900 | 33 | |
| Lincoln National Corp. | 2,000 | 31 | |
| Extra Space Storage Inc. | 1,700 | 32 | |
| Omega Healthcare | |||
| Investors Inc. | 1,400 | 22 | |
| Comerica Inc. | 900 | 21 | |
| Umpqua Holdings Corp. | 2,200 | 19 | |
| Iberiabank Corp. | 400 | 19 | |
| United Bankshares Inc. | 900 | 18 | |
| Old National Bancorp | 1,800 | 17 | |
| Susquehanna Bancshares Inc. | 2,700 | 15 | |
| Ashford Hospitality Trust Inc. | 2,100 | 15 | |
| FirstMerit Corp. | 1,100 | 12 | |
| Brookline Bancorp Inc. | 1,300 | 10 | |
| First Financial Bancorp | 600 | 8 | |
| FNB Corp. | 800 | 7 | |
| Apollo Investment Corp. | 100 | 1 | |
| 452,322 | |||
| Health Care (11.3%) | |||
| Pfizer Inc. | 3,299,184 | 58,330 | |
| Merck & Co. Inc. | 1,290,496 | 42,212 | |
| Johnson & Johnson | 595,855 | 37,962 | |
| UnitedHealth Group Inc. | 688,698 | 31,763 | |
| Abbott Laboratories | 549,423 | 28,097 | |
| WellPoint Inc. | 407,462 | 26,599 | |
| Eli Lilly & Co. | 547,875 | 20,255 | |
| Baxter International Inc. | 325,768 | 18,289 | |
| Bristol-Myers Squibb Co. | 487,812 | 15,308 | |
| Covidien plc | 330,900 | 14,593 | |
| Medtronic Inc. | 378,453 | 12,580 | |
| * | Boston Scientific Corp. | 2,102,893 | 12,428 |
| Aetna Inc. | 341,020 | 12,396 | |
| * | Biogen Idec Inc. | 100,589 | 9,370 |
| * | Celgene Corp. | 138,300 | 8,564 |
| Humana Inc. | 110,216 | 8,016 | |
| * | Coventry Health Care Inc. | 257,382 | 7,415 |
12
Growth and Income Fund
| Market | |||
| Value | |||
| Shares | ($000) | ||
| CIGNA Corp. | 161,100 | 6,757 | |
| PerkinElmer Inc. | 320,880 | 6,164 | |
| St. Jude Medical Inc. | 165,188 | 5,978 | |
| * | Tenet Healthcare Corp. | 1,335,104 | 5,514 |
| Becton Dickinson and Co. | 55,402 | 4,062 | |
| * | Forest Laboratories Inc. | 121,467 | 3,740 |
| * | Medco Health Solutions Inc. | 54,677 | 2,564 |
| * | Gilead Sciences Inc. | 58,521 | 2,271 |
| * | Edwards Lifesciences Corp. | 31,247 | 2,227 |
| AmerisourceBergen Corp. | |||
| Class A | 54,300 | 2,024 | |
| * | Express Scripts Inc. | 53,700 | 1,991 |
| Stryker Corp. | 42,093 | 1,984 | |
| Amgen Inc. | 25,690 | 1,412 | |
| DENTSPLY International Inc. | 34,770 | 1,067 | |
| * | XenoPort Inc. | 155,000 | 914 |
| * | Intuitive Surgical Inc. | 1,422 | 518 |
| Hill-Rom Holdings Inc. | 16,500 | 495 | |
| * | Myriad Genetics Inc. | 25,200 | 472 |
| Pain Therapeutics Inc. | 98,800 | 470 | |
| * | Onyx Pharmaceuticals Inc. | 14,300 | 429 |
| Patterson Cos. Inc. | 13,600 | 389 | |
| * | Varian Medical Systems Inc. | 6,200 | 323 |
| * | Allos Therapeutics Inc. | 147,100 | 271 |
| * | Theravance Inc. | 13,300 | 268 |
| * | Viropharma Inc. | 12,657 | 229 |
| * | Brookdale Senior Living Inc. | ||
| Class A | 17,900 | 224 | |
| * | Idenix Pharmaceuticals Inc. | 39,700 | 198 |
| * | Furiex Pharmaceuticals Inc. | 12,200 | 174 |
| * | Neurocrine Biosciences Inc. | 23,300 | 139 |
| Medicis Pharmaceutical | |||
| Corp. Class A | 3,500 | 128 | |
| * | Agilent Technologies Inc. | 3,600 | 112 |
| * | Alkermes plc | 1,000 | 15 |
| * | WellCare Health Plans Inc. | 400 | 15 |
| 417,715 | |||
| Industrials (9.2%) | |||
| General Electric Co. | 2,875,300 | 43,820 | |
| General Dynamics Corp. | 370,081 | 21,054 | |
| Northrop Grumman Corp. | 383,941 | 20,026 | |
| CSX Corp. | 1,059,057 | 19,773 | |
| Norfolk Southern Corp. | 311,002 | 18,977 | |
| United Technologies Corp. | 250,400 | 17,618 | |
| Lockheed Martin Corp. | 240,654 | 17,481 | |
| Tyco International Ltd. | 428,980 | 17,481 | |
| Caterpillar Inc. | 220,571 | 16,287 | |
| L-3 Communications | |||
| Holdings Inc. | 205,485 | 12,734 | |
| Union Pacific Corp. | 146,835 | 11,992 | |
| United Parcel Service Inc. | |||
| Class B | 189,693 | 11,979 | |
| Honeywell International Inc. | 212,900 | 9,349 | |
| Equifax Inc. | 270,600 | 8,318 | |
| Fluor Corp. | 168,447 | 7,841 | |
| Raytheon Co. | 178,031 | 7,276 | |
| Market | |||
| Value | |||
| Shares | ($000) | ||
| WW Grainger Inc. | 47,059 | 7,037 | |
| Cummins Inc. | 82,067 | 6,702 | |
| Emerson Electric Co. | 157,416 | 6,503 | |
| * | Sensata Technologies | ||
| Holding NV | 209,200 | 5,535 | |
| Pitney Bowes Inc. | 282,518 | 5,311 | |
| Republic Services Inc. | |||
| Class A | 187,200 | 5,253 | |
| Illinois Tool Works Inc. | 116,242 | 4,836 | |
| Southwest Airlines Co. | 564,900 | 4,542 | |
| Expeditors International | |||
| of Washington Inc. | 90,700 | 3,678 | |
| 3M Co. | 45,689 | 3,280 | |
| Precision Castparts Corp. | 20,767 | 3,228 | |
| Covanta Holding Corp. | 163,600 | 2,485 | |
| Snap-on Inc. | 53,822 | 2,390 | |
| Boeing Co. | 32,846 | 1,988 | |
| Pall Corp. | 38,042 | 1,613 | |
| PACCAR Inc. | 40,900 | 1,383 | |
| Deere & Co. | 19,600 | 1,266 | |
| Rockwell Automation Inc. | 19,337 | 1,083 | |
| Iron Mountain Inc. | 33,200 | 1,050 | |
| * | Verisk Analytics Inc. Class A | 25,200 | 876 |
| Ryder System Inc. | 21,626 | 811 | |
| * | Nielsen Holdings NV | 30,400 | 793 |
| Parker Hannifin Corp. | 8,820 | 557 | |
| Flowserve Corp. | 7,000 | 518 | |
| * | WABCO Holdings Inc. | 13,500 | 511 |
| Joy Global Inc. | 4,800 | 299 | |
| * | FuelCell Energy Inc. | 336,600 | 283 |
| * | SYKES Enterprises Inc. | 13,500 | 202 |
| KBR Inc. | 7,000 | 165 | |
| * | Swift Transportation Co. | 19,000 | 122 |
| * | TransDigm Group Inc. | 1,300 | 106 |
| CH Robinson Worldwide Inc. | 1,200 | 82 | |
| Stanley Black & Decker Inc. | 1,600 | 79 | |
| Eaton Corp. | 1,800 | 64 | |
| Actuant Corp. Class A | 1,833 | 36 | |
| Belden Inc. | 700 | 18 | |
| * | CNH Global NV | 600 | 16 |
| * | EnerNOC Inc. | 1,700 | 15 |
| Crane Co. | 338 | 12 | |
| Deluxe Corp. | 500 | 9 | |
| Brink’s Co. | 300 | 7 | |
| Federal Signal Corp. | 500 | 2 | |
| Titan International Inc. | 100 | 2 | |
| Dover Corp. | 23 | 1 | |
| 336,755 | |||
| Information Technology (17.4%) | |||
| * | Apple Inc. | 347,020 | 132,277 |
| International Business | |||
| Machines Corp. | 404,354 | 70,774 | |
| Microsoft Corp. | 2,768,254 | 68,902 | |
| Intel Corp. | 2,060,609 | 43,953 | |
| * | Google Inc. Class A | 73,809 | 37,966 |
| Oracle Corp. | 1,018,025 | 29,258 | |
13
Growth and Income Fund
| Market | |||
| Value | |||
| Shares | ($000) | ||
| Qualcomm Inc. | 494,206 | 24,033 | |
| Cisco Systems Inc. | 1,447,297 | 22,419 | |
| Visa Inc. Class A | 222,586 | 19,080 | |
| Accenture plc Class A | 268,000 | 14,118 | |
| Motorola Solutions Inc. | 334,700 | 14,024 | |
| * | Dell Inc. | 885,016 | 12,523 |
| Mastercard Inc. Class A | 38,039 | 12,064 | |
| Hewlett-Packard Co. | 472,500 | 10,608 | |
| * | Symantec Corp. | 448,369 | 7,308 |
| * | Intuit Inc. | 153,500 | 7,282 |
| * | eBay Inc. | 233,266 | 6,879 |
| * | Marvell Technology | ||
| Group Ltd. | 454,900 | 6,610 | |
| * | Electronic Arts Inc. | 322,700 | 6,599 |
| * | LSI Corp. | 1,259,400 | 6,524 |
| Western Union Co. | 426,500 | 6,521 | |
| * | Salesforce.com Inc. | 54,150 | 6,188 |
| * | NVIDIA Corp. | 481,928 | 6,024 |
| * | Western Digital Corp. | 233,200 | 5,998 |
| Automatic Data | |||
| Processing Inc. | 113,700 | 5,361 | |
| Jabil Circuit Inc. | 283,700 | 5,047 | |
| * | Cognizant Technology | ||
| Solutions Corp. Class A | 76,016 | 4,766 | |
| * | Yahoo! Inc. | 355,682 | 4,681 |
| * | Novellus Systems Inc. | 171,650 | 4,679 |
| Texas Instruments Inc. | 115,102 | 3,067 | |
| * | Red Hat Inc. | 63,556 | 2,686 |
| * | Fiserv Inc. | 50,360 | 2,557 |
| KLA-Tencor Corp. | 66,605 | 2,549 | |
| * | Compuware Corp. | 322,911 | 2,474 |
| Analog Devices Inc. | 68,984 | 2,156 | |
| * | Akamai Technologies Inc. | 103,072 | 2,049 |
| * | Zebra Technologies Corp. | 57,500 | 1,779 |
| * | Citrix Systems Inc. | 31,500 | 1,718 |
| Avago Technologies Ltd. | 52,100 | 1,707 | |
| Applied Materials Inc. | 158,025 | 1,636 | |
| Harris Corp. | 43,993 | 1,503 | |
| Microchip Technology Inc. | 48,278 | 1,502 | |
| * | AOL Inc. | 98,900 | 1,187 |
| * | Quest Software Inc. | 70,300 | 1,116 |
| * | Magma Design | ||
| Automation Inc. | 243,700 | 1,109 | |
| * | Autodesk Inc. | 34,900 | 970 |
| Linear Technology Corp. | 34,212 | 946 | |
| Molex Inc. | 36,781 | 749 | |
| Fidelity National Information | |||
| Services Inc. | 27,970 | 680 | |
| * | Adobe Systems Inc. | 22,600 | 546 |
| * | F5 Networks Inc. | 5,200 | 369 |
| * | Acxiom Corp. | 34,400 | 366 |
| * | Sina Corp. | 4,800 | 344 |
| * | BMC Software Inc. | 7,300 | 282 |
| * | Micron Technology Inc. | 42,400 | 214 |
| * | Agilysys Inc. | 29,000 | 207 |
| * | Ancestry.com Inc. | 8,100 | 190 |
| Market | |||
| Value | |||
| Shares | ($000) | ||
| Tellabs Inc. | 30,200 | 130 | |
| * | Dolby Laboratories Inc. | ||
| Class A | 4,200 | 115 | |
| TE Connectivity Ltd. | 2,600 | 73 | |
| Cypress | |||
| Semiconductor Corp. | 1,900 | 28 | |
| * | ValueClick Inc. | 1,500 | 23 |
| * | Tekelec | 2,368 | 14 |
| Micrel Inc. | 1,100 | 10 | |
| * | Applied Micro | ||
| Circuits Corp. | 1,800 | 10 | |
| * | LTX-Credence Corp. | 1,800 | 10 |
| * | Websense Inc. | 200 | 3 |
| * | Amtech Systems Inc. | 200 | 2 |
| 639,542 | |||
| Materials (3.2%) | |||
| Monsanto Co. | 259,000 | 15,550 | |
| EI du Pont de | |||
| Nemours & Co. | 373,796 | 14,941 | |
| Freeport-McMoRan | |||
| Copper & Gold Inc. | 463,773 | 14,122 | |
| International Flavors | |||
| & Fragrances Inc. | 214,700 | 12,070 | |
| CF Industries Holdings Inc. | 88,281 | 10,893 | |
| Newmont Mining Corp. | 168,417 | 10,593 | |
| International Paper Co. | 348,718 | 8,108 | |
| Eastman Chemical Co. | 101,140 | 6,931 | |
| Cliffs Natural | |||
| Resources Inc. | 94,645 | 4,843 | |
| Dow Chemical Co. | 210,500 | 4,728 | |
| Ecolab Inc. | 84,000 | 4,107 | |
| Airgas Inc. | 56,700 | 3,619 | |
| Sealed Air Corp. | 138,200 | 2,308 | |
| FMC Corp. | 16,400 | 1,134 | |
| Temple-Inland Inc. | 22,700 | 712 | |
| Mosaic Co. | 11,400 | 558 | |
| Nalco Holding Co. | 14,800 | 518 | |
| * | Georgia Gulf Corp. | 26,500 | 366 |
| Innophos Holdings Inc. | 8,500 | 339 | |
| * | Mercer International Inc. | 46,100 | 313 |
| Air Products & | |||
| Chemicals Inc. | 4,100 | 313 | |
| Teck Resources Ltd. | |||
| Class B | 8,900 | 260 | |
| * | Headwaters Inc. | 96,500 | 139 |
| Boise Inc. | 21,800 | 113 | |
| * | Century Aluminum Co. | 3,874 | 35 |
| Titanium Metals Corp. | 800 | 12 | |
| 117,625 | |||
| Telecommunication Services (3.7%) | |||
| AT&T Inc. | 2,552,837 | 72,807 | |
| Verizon | |||
| Communications Inc. | 1,394,455 | 51,316 | |
| * | American Tower Corp. | ||
| Class A | 156,455 | 8,417 | |
14
Growth and Income Fund
| Market | |||
| Value | |||
| Shares | ($000) | ||
| * | MetroPCS | ||
| Communications Inc. | 164,800 | 1,435 | |
| * | Level 3 | ||
| Communications Inc. | 530,600 | 791 | |
| * | Vonage Holdings Corp. | 237,900 | 619 |
| 135,385 | |||
| Utilities (3.4%) | |||
| Oneok Inc. | 261,763 | 17,287 | |
| Public Service | |||
| Enterprise Group Inc. | 434,855 | 14,511 | |
| CenterPoint Energy Inc. | 636,200 | 12,482 | |
| Integrys Energy Group Inc. | 223,877 | 10,885 | |
| Duke Energy Corp. | 468,126 | 9,358 | |
| PG&E Corp. | 200,500 | 8,483 | |
| American Electric | |||
| Power Co. Inc. | 217,900 | 8,284 | |
| Exelon Corp. | 157,200 | 6,698 | |
| DTE Energy Co. | 134,500 | 6,593 | |
| NiSource Inc. | 295,700 | 6,322 | |
| * | AES Corp. | 592,600 | 5,784 |
| Constellation Energy | |||
| Group Inc. | 119,000 | 4,529 | |
| FirstEnergy Corp. | 91,600 | 4,114 | |
| Edison International | 70,200 | 2,685 | |
| CMS Energy Corp. | 96,400 | 1,908 | |
| Xcel Energy Inc. | 65,396 | 1,615 | |
| Dominion Resources Inc. | 28,994 | 1,472 | |
| NextEra Energy Inc. | 17,200 | 929 | |
| Pinnacle West Capital Corp. | 20,700 | 889 | |
| NV Energy Inc. | 39,800 | 585 | |
| * | Calpine Corp. | 28,700 | 404 |
| * | NRG Energy Inc. | 14,300 | 303 |
| Consolidated Edison Inc. | 2,507 | 143 | |
| Northeast Utilities | 3,200 | 108 | |
| Hawaiian Electric | |||
| Industries Inc. | 1,300 | 32 | |
| 126,403 | |||
| Total Common Stocks | |||
| (Cost $3,303,797) | 3,343,296 | ||
| Temporary Cash Investments (5.1%)1 | |||
| Money Market Fund (4.3%) | |||
| 2 | Vanguard Market | ||
| Liquidity Fund, | |||
| 0.144% | 157,103,319 | 157,103 | |
| Face | Market | ||
| Amount | Value | ||
| ($000) | ($000) | ||
| U.S. Government and Agency Obligations (0.8%) | |||
| 3,4 | Federal Home Loan | ||
| Bank Discount Notes, | |||
| 0.025%, 12/2/11 | 25,000 | 24,993 | |
| 3,4 | Freddie Mac | ||
| Discount Notes, | |||
| 0.035%, 12/27/11 | 5,000 | 4,998 | |
| 29,991 | |||
| Total Temporary Cash Investments | |||
| (Cost $187,102) | 187,094 | ||
| Total Investments (96.0%) | |||
| (Cost $3,490,899) | 3,530,390 | ||
| Other Assets and Liabilities (4.0%) | |||
| Other Assets | 205,763 | ||
| Liabilities | (57,099) | ||
| 148,664 | |||
| Net Assets (100%) | 3,679,054 | ||
| Statement of Assets and Liabilities | |||
| Assets | |||
| Investments in Securities, at Value | 3,530,390 | ||
| Receivables for Investment | |||
| Securities Sold | 199,574 | ||
| Other Assets | 6,189 | ||
| Total Assets | 3,736,153 | ||
| Liabilities | |||
| Payables for Investment | |||
| Securities Purchased | 30,214 | ||
| Payables for Futures Variation Margin | 9,178 | ||
| Other Liabilities | 17,707 | ||
| Total Liabilities | 57,099 | ||
| Net Assets | 3,679,054 | ||
15
Growth and Income Fund
| At September 30, 2011, net assets consisted of: | |
| Amount | |
| ($000) | |
| Paid-in Capital | 5,045,108 |
| Undistributed Net Investment Income | 6,880 |
| Accumulated Net Realized Losses | (1,399,700) |
| Unrealized Appreciation (Depreciation) | |
| Investment Securities | 39,491 |
| Futures Contracts | (12,725) |
| Net Assets | 3,679,054 |
| Investor Shares—Net Assets | |
| Applicable to 106,772,259 outstanding | |
| $.001 par value shares of beneficial | |
| interest (unlimited authorization) | 2,547,825 |
| Net Asset Value Per Share— | |
| Investor Shares | $23.86 |
| Admiral Shares—Net Assets | |
| Applicable to 29,028,131 outstanding | |
| $.001 par value shares of beneficial | |
| interest (unlimited authorization) | 1,131,229 |
| Net Asset Value Per Share— | |
| Admiral Shares | $38.97 |
See Note A in Notes to Financial Statements.
* Non-income-producing security.
1 The fund invests a portion of its cash reserves in equity markets through the use of index futures contracts. After giving effect to futures investments, the fund’s effective common stock and temporary cash investment positions represent 100.0% and –4.0%, respectively, of net assets.
2 Affiliated money market fund available only to Vanguard funds and certain trusts and accounts managed by Vanguard. Rate shown is the 7-day yield.
3 The issuer operates under a congressional charter; its securities are not backed by the full faith and credit of the U.S. government.
4 Securities with a value of $24,992,000 have been segregated as initial margin for open futures contracts.
See accompanying Notes, which are an integral part of the Financial Statements.
16
Growth and Income Fund
| Statement of Operations | |
| Year Ended | |
| September 30, 2011 | |
| ($000) | |
| Investment Income | |
| Income | |
| Dividends | 91,584 |
| Interest1 | 126 |
| Security Lending | 52 |
| Total Income | 91,762 |
| Expenses | |
| Investment Advisory Fees—Note B | |
| Basic Fee | 4,278 |
| Performance Adjustment | (1,553) |
| The Vanguard Group—Note C | |
| Management and Administrative—Investor Shares | 6,985 |
| Management and Administrative—Admiral Shares | 1,762 |
| Marketing and Distribution—Investor Shares | 626 |
| Marketing and Distribution—Admiral Shares | 263 |
| Custodian Fees | 54 |
| Auditing Fees | 27 |
| Shareholders’ Reports—Investor Shares | 88 |
| Shareholders’ Reports—Admiral Shares | 6 |
| Trustees’ Fees and Expenses | 11 |
| Total Expenses | 12,547 |
| Expenses Paid Indirectly | (273) |
| Net Expenses | 12,274 |
| Net Investment Income | 79,488 |
| Realized Net Gain (Loss) | |
| Investment Securities Sold | 354,073 |
| Futures Contracts | 7,957 |
| Realized Net Gain (Loss) | 362,030 |
| Change in Unrealized Appreciation (Depreciation) | |
| Investment Securities | (297,286) |
| Futures Contracts | (15,068) |
| Change in Unrealized Appreciation (Depreciation) | (312,354) |
| Net Increase (Decrease) in Net Assets Resulting from Operations | 129,164 |
| 1 Interest income from an affiliated company of the fund was $126,000. | |
See accompanying Notes, which are an integral part of the Financial Statements.
17
Growth and Income Fund
| Statement of Changes in Net Assets | ||
| Year Ended September 30, | ||
| 2011 | 2010 | |
| ($000) | ($000) | |
| Increase (Decrease) in Net Assets | ||
| Operations | ||
| Net Investment Income | 79,488 | 79,921 |
| Realized Net Gain (Loss) | 362,030 | 178,942 |
| Change in Unrealized Appreciation (Depreciation) | (312,354) | 136,329 |
| Net Increase (Decrease) in Net Assets Resulting from Operations | 129,164 | 395,192 |
| Distributions | ||
| Net Investment Income | ||
| Investor Shares | (53,125) | (55,197) |
| Admiral Shares | (26,147) | (24,503) |
| Realized Capital Gain | ||
| Investor Shares | — | — |
| Admiral Shares | — | — |
| Total Distributions | (79,272) | (79,700) |
| Capital Share Transactions | ||
| Investor Shares | (500,958) | (455,269) |
| Admiral Shares | (89,097) | (335,182) |
| Net Increase (Decrease) from Capital Share Transactions | (590,055) | (790,451) |
| Total Increase (Decrease) | (540,163) | (474,959) |
| Net Assets | ||
| Beginning of Period | 4,219,217 | 4,694,176 |
| End of Period1 | 3,679,054 | 4,219,217 |
| 1 Net Assets—End of Period includes undistributed net investment income of $6,880,000 and $6,664,000. | ||
See accompanying Notes, which are an integral part of the Financial Statements.
18
Growth and Income Fund
Financial Highlights
| Investor Shares | |||||
| For a Share Outstanding | Year Ended September 30, | ||||
| Throughout Each Period | 2011 | 2010 | 2009 | 2008 | 2007 |
| Net Asset Value, Beginning of Period | $23.98 | $22.34 | $25.84 | $38.62 | $33.79 |
| Investment Operations | |||||
| Net Investment Income | .482 | .418 | .447 | .546 | .600 |
| Net Realized and Unrealized Gain (Loss) | |||||
| on Investments | (.124) | 1.630 | (3.453) | (8.758) | 4.840 |
| Total from Investment Operations | .358 | 2.048 | (3.006) | (8.212) | 5.440 |
| Distributions | |||||
| Dividends from Net Investment Income | (.478) | (.408) | (.494) | (.560) | (.610) |
| Distributions from Realized Capital Gains | — | — | — | (4.008) | — |
| Total Distributions | (.478) | (.408) | (.494) | (4.568) | (.610) |
| Net Asset Value, End of Period | $23.86 | $23.98 | $22.34 | $25.84 | $38.62 |
| Total Return1 | 1.28% | 9.24% | -11.29% | -23.28% | 16.20% |
| Ratios/Supplemental Data | |||||
| Net Assets, End of Period (Millions) | $2,548 | $3,020 | $3,253 | $3,919 | $5,465 |
| Ratio of Total Expenses to | |||||
| Average Net Assets2 | 0.32% | 0.32% | 0.35% | 0.31% | 0.32% |
| Ratio of Net Investment Income to | |||||
| Average Net Assets | 1.78% | 1.74% | 2.28% | 1.69% | 1.61% |
| Portfolio Turnover Rate | 120% | 94% | 83% | 96% | 100% |
1 Total returns do not include account service fees that may have applied in the periods shown. Fund prospectuses provide information about any applicable account service fees.
2 Includes performance-based investment advisory fee increases (decreases) of (0.04%), (0.04%), (0.04%), (0.02%), and 0.00%.
See accompanying Notes, which are an integral part of the Financial Statements.
19
Growth and Income Fund
Financial Highlights
| Admiral Shares | |||||
| For a Share Outstanding | Year Ended September 30, | ||||
| Throughout Each Period | 2011 | 2010 | 2009 | 2008 | 2007 |
| Net Asset Value, Beginning of Period | $39.15 | $36.48 | $42.20 | $63.08 | $55.20 |
| Investment Operations | |||||
| Net Investment Income | .832 | .722 | .775 | .963 | 1.070 |
| Net Realized and Unrealized Gain (Loss) | |||||
| on Investments | (.199) | 2.666 | (5.638) | (14.313) | 7.903 |
| Total from Investment Operations | .633 | 3.388 | (4.863) | (13.350) | 8.973 |
| Distributions | |||||
| Dividends from Net Investment Income | (.813) | (.718) | (.857) | (.985) | (1.093) |
| Distributions from Realized Capital Gains | — | — | — | (6.545) | — |
| Total Distributions | (.813) | (.718) | (.857) | (7.530) | (1.093) |
| Net Asset Value, End of Period | $38.97 | $39.15 | $36.48 | $42.20 | $63.08 |
| Total Return | 1.39% | 9.37% | -11.15% | -23.19% | 16.37% |
| Ratios/Supplemental Data | |||||
| Net Assets, End of Period (Millions) | $1,131 | $1,199 | $1,441 | $1,907 | $2,794 |
| Ratio of Total Expenses to | |||||
| Average Net Assets1 | 0.21% | 0.21% | 0.21% | 0.16% | 0.18% |
| Ratio of Net Investment Income to | |||||
| Average Net Assets | 1.89% | 1.85% | 2.42% | 1.84% | 1.75% |
| Portfolio Turnover Rate | 120% | 94% | 83% | 96% | 100% |
| 1 Includes performance-based investment advisory fee increases (decreases) of (0.04%), (0.04%), (0.04%), (0.02%), and 0.00%. | |||||
See accompanying Notes, which are an integral part of the Financial Statements.
20
Growth and Income Fund
Notes to Financial Statements
Vanguard Growth and Income Fund is registered under the Investment Company Act of 1940 as an open-end investment company, or mutual fund. The fund offers two classes of shares: Investor Shares and Admiral Shares. Investor Shares are available to any investor who meets the fund’s minimum purchase requirements. Admiral Shares are designed for investors who meet certain administrative, service, and account-size criteria.
A. The following significant accounting policies conform to generally accepted accounting principles for U.S. mutual funds. The fund consistently follows such policies in preparing its financial statements.
1. Security Valuation: Securities are valued as of the close of trading on the New York Stock Exchange (generally 4 p.m., Eastern time) on the valuation date. Equity securities are valued at the latest quoted sales prices or official closing prices taken from the primary market in which each security trades; such securities not traded on the valuation date are valued at the mean of the latest quoted bid and asked prices. Securities for which market quotations are not readily available, or whose values have been materially affected by events occurring before the fund’s pricing time but after the close of the securities’ primary markets, are valued by methods deemed by the board of trustees to represent fair value. Investments in Vanguard Market Liquidity Fund are valued at that fund’s net asset value. Temporary cash investments acquired over 60 days to maturity are valued using the latest bid prices or using valuations based on a matrix system (which considers such factors as security prices, yields, maturities, and ratings), both as furnished by independent pricing services. Other temporary cash investments are valued at amortized cost, which approximates market value.
2. Futures Contracts: The fund uses index futures contracts to a limited extent, with the objective of maintaining full exposure to the stock market while maintaining liquidity. The fund may purchase or sell futures contracts to achieve a desired level of investment, whether to accommodate portfolio turnover or cash flows from capital share transactions. The primary risks associated with the use of futures contracts are imperfect correlation between changes in market values of stocks held by the fund and the prices of futures contracts, and the possibility of an illiquid market.
Futures contracts are valued at their quoted daily settlement prices. The aggregate principal amounts of the contracts are not recorded in the Statement of Net Assets. Fluctuations in the value of the contracts are recorded in the Statement of Net Assets as an asset (liability) and in the Statement of Operations as unrealized appreciation (depreciation) until the contracts are closed, when they are recorded as realized futures gains (losses).
3. Federal Income Taxes: The fund intends to continue to qualify as a regulated investment company and distribute all of its taxable income. Management has analyzed the fund’s tax positions taken for all open federal income tax years (September 30, 2008–2011), and has concluded that no provision for federal income tax is required in the fund’s financial statements.
4. Distributions: Distributions to shareholders are recorded on the ex-dividend date.
5. Security Lending: The fund may lend its securities to qualified institutional borrowers to earn additional income. Security loans are required to be secured at all times by collateral at least equal to the market value of securities loaned. The fund invests cash collateral received in Vanguard Market Liquidity Fund, and records a liability for the return of the collateral, during the period the securities are on loan. Security lending income represents fees charged to borrowers plus income earned on investing cash collateral, less expenses associated with the loan.
21
Growth and Income Fund
6. Other: Dividend income is recorded on the ex-dividend date. Interest income includes income distributions received from Vanguard Market Liquidity Fund and is accrued daily. Security transactions are accounted for on the date securities are bought or sold. Costs used to determine realized gains (losses) on the sale of investment securities are those of the specific securities sold.
Each class of shares has equal rights as to assets and earnings, except that each class separately bears certain class-specific expenses related to maintenance of shareholder accounts (included in Management and Administrative expenses) and shareholder reporting. Marketing and distribution expenses are allocated to each class of shares based on a method approved by the board of trustees. Income, other non-class-specific expenses, and gains and losses on investments are allocated to each class of shares based on its relative net assets.
B. Beginning in September 2011, D. E. Shaw Investment Management, L.L.C., and Los Angeles Capital Management and Equity Research, Inc., each provide investment advisory services to a portion of the fund for a fee calculated at an annual percentage rate of average net assets managed by the advisor. In accordance with the advisory contract entered into with D. E. Shaw Investment Management, L.L.C., beginning October 1, 2011, its investment advisory fees will be subject to quarterly adjustments based on performance since September 30, 2011, relative to the S&P 500 Index. In accordance with the advisory contract entered into with Los Angeles Capital Management and Equity Research, Inc., beginning October 1, 2012, its investment advisory fees will be subject to quarterly adjustments based on performance since September 30, 2011, relative to the S&P 500 Index. Until late September 2011, Mellon Capital Management Corporation provided investment advisory services to the fund. The basic fee paid to Mellon Capital Management Corporation was subject to quarterly adjustments based on performance for the preceding three years relative to the S&P 500 Index.
The Vanguard Group provides investment advisory services to a portion of the fund (beginning in late September 2011) on an at-cost basis. The fund paid no investment advisory fees to the Vanguard Group for the fiscal year ended September 30, 2011.
For the year ended September 30, 2011, the aggregate investment advisory fee represented an effective annual basic rate of 0.10% of the fund’s average net assets, before a decrease of $1,553,000 (0.04%) based on performance.
C. The Vanguard Group furnishes at cost corporate management, administrative, marketing, and distribution services. The costs of such services are allocated to the fund under methods approved by the board of trustees. The fund has committed to provide up to 0.40% of its net assets in capital contributions to Vanguard. At September 30, 2011, the fund had contributed capital of $662,000 to Vanguard (included in Other Assets), representing 0.02% of the fund’s net assets and 0.26% of Vanguard’s capitalization. The fund’s trustees and officers are also directors and officers of Vanguard.
D. The fund has asked its investment advisors to direct certain security trades, subject to obtaining the best price and execution, to brokers who have agreed to rebate to the fund part of the commissions generated. Such rebates are used solely to reduce the fund’s management and administrative expenses. For the year ended September 30, 2011, these arrangements reduced the fund’s expenses by $273,000 (an annual rate of 0.01% of average net assets).
22
Growth and Income Fund
E. Various inputs may be used to determine the value of the fund’s investments. These inputs are summarized in three broad levels for financial statement purposes. The inputs or methodologies used to value securities are not necessarily an indication of the risk associated with investing in those securities.
Level 1—Quoted prices in active markets for identical securities.
Level 2—Other significant observable inputs (including quoted prices for similar securities, interest rates, prepayment speeds, credit risk, etc.).
Level 3—Significant unobservable inputs (including the fund’s own assumptions used to determine the fair value of investments).
The following table summarizes the fund’s investments as of September 30, 2011, based on the inputs used to value them:
| Level 1 | Level 2 | Level 3 | |
| Investments | ($000) | ($000) | ($000) |
| Common Stocks | 3,343,296 | — | — |
| Temporary Cash Investments | 157,103 | 29,991 | — |
| Futures Contracts—Assets1 | 144 | — | — |
| Futures Contracts—Liabilities1 | (9,178) | — | — |
| Total | 3,491,365 | 29,991 | — |
| 1 Represents variation margin on the last day of the reporting period. |
F. At September 30, 2011, the aggregate settlement value of open futures contracts and the related unrealized appreciation (depreciation) were:
| ($000) | ||||
| Aggregate | ||||
| Number of | Settlement | Unrealized | ||
| Long (Short) | Value | Appreciation | ||
| Futures Contracts | Expiration | Contracts | Long (Short) | (Depreciation) |
| E-mini S&P 500 Index | December 2011 | 5,335 | 300,361 | (11,563) |
| S&P 500 Index | December 2011 | 115 | 32,373 | (1,162) |
Unrealized appreciation (depreciation) on open futures contracts is required to be treated as realized gain (loss) for tax purposes.
G. Distributions are determined on a tax basis and may differ from net investment income and realized capital gains for financial reporting purposes. Differences may be permanent or temporary. Permanent differences are reclassified among capital accounts in the financial statements to reflect their tax character. Temporary differences arise when certain items of income, expense, gain, or loss are recognized in different periods for financial statement and tax purposes; these differences will reverse at some time in the future. Differences in classification may also result from the treatment of short-term gains as ordinary income for tax purposes.
For tax purposes, at September 30, 2011, the fund had $18,988,000 of ordinary income available for distribution. The fund had available capital loss carryforwards totaling $1,406,097,000 to offset future net capital gains of $559,187,000 through September 30, 2017, and $846,910,000 through September 30, 2018.
23
Growth and Income
At September 30, 2011, the cost of investment securities for tax purposes was $3,497,817,000. Net unrealized appreciation of investment securities for tax purposes was $32,573,000, consisting of unrealized gains of $242,708,000 on securities that had risen in value since their purchase and $210,135,000 in unrealized losses on securities that had fallen in value since their purchase.
H. During the year ended September 30, 2011, the fund purchased $5,113,296,000 of investment securities and sold $5,976,486,000 of investment securities, other than temporary cash investments.
I. Capital share transactions for each class of shares were:
| Year Ended September 30, | ||||
| 2011 | 2010 | |||
| Amount | Shares | Amount | Shares | |
| ($000) | (000) | ($000) | (000) | |
| Investor Shares | ||||
| Issued | 212,372 | 7,984 | 231,031 | 9,843 |
| Issued in Lieu of Cash Distributions | 51,795 | 1,927 | 53,684 | 2,315 |
| Redeemed | (765,125) | (29,070) | (739,984) | (31,813) |
| Net Increase (Decrease)—Investor Shares | (500,958) | (19,159) | (455,269) | (19,655) |
| Admiral Shares | ||||
| Issued | 352,128 | 8,358 | 131,639 | 3,429 |
| Issued in Lieu of Cash Distributions | 24,071 | 549 | 22,345 | 590 |
| Redeemed | (465,296) | (10,508) | (489,166) | (12,898) |
| Net Increase (Decrease)—Admiral Shares | (89,097) | (1,601) | (335,182) | (8,879) |
J. In preparing the financial statements as of September 30, 2011, management considered the impact of subsequent events for potential recognition or disclosure in these financial statements.
24
Report of Independent Registered Public Accounting Firm
To the Trustees of Vanguard Quantitative Funds and the Shareholders of Vanguard Growth and Income Fund:
In our opinion, the accompanying statement of net assets, the statement of assets and liabilities and the related statements of operations and of changes in net assets and the financial highlights present fairly, in all material respects, the financial position of Vanguard Growth and Income Fund (constituting a separate portfolio of Vanguard Quantitative Funds, hereafter referred to as the “Fund”) at September 30, 2011, the results of its operations for the year then ended, the changes in its net assets for each of the two years in the period then ended and the financial highlights for each of the five years in the period then ended, in conformity with accounting principles generally accepted in the United States of America. These financial statements and financial highlights (hereafter referred to as “financial statements”) are the responsibility of the Fund’s management; our responsibility is to express an opinion on these financial statements based on our audits. We conducted our audits of these financial statements in accordance with the standards of the Public Company Accounting Oversight Board (United States). Those standards require that we plan and perform the audit to obtain reasonable assurance about whether the financial statements are free of material misstatement. An audit includes examining, on a test basis, evidence supporting the amounts and disclosures in the financial statements, assessing the accounting principles used and significant estimates made by management, and evaluating the overall financial statement presentation. We believe that our audits, which included confirmation of securities at September 30, 2011 by correspondence with the custodian and broker and by agreement to the underlying ownership records of Vanguard Market Liquidity Fund, provide a reasonable basis for our opinion.
PricewaterhouseCoopers LLP
Philadelphia, Pennsylvania
November 11, 2011
| Special 2011 tax information (unaudited) for Vanguard Growth and Income Fund |
This information for the fiscal year ended September 30, 2011, is included pursuant to provisions of the Internal Revenue Code.
The fund distributed $79,272,000 of qualified dividend income to shareholders during the fiscal year.
For corporate shareholders, 100% of investment income (dividend income plus short-term gains, if any) qualifies for the dividends-received deduction.
25
Your Fund’s After-Tax Returns
This table presents returns for your fund both before and after taxes. The after-tax returns are shown in two ways: (1) assuming that an investor owned the fund during the entire period and paid taxes on the fund’s distributions, and (2) assuming that an investor paid taxes on the fund’s distributions and sold all shares at the end of each period.
Calculations are based on the highest individual federal income tax and capital gains tax rates in effect at the times of the distributions and the hypothetical sales. State and local taxes were not considered. After-tax returns reflect any qualified dividend income, using actual prior-year figures and estimates for 2011. (In the example, returns after the sale of fund shares may be higher than those assuming no sale. This occurs when the sale would have produced a capital loss. The calculation assumes that the investor received a tax deduction for the loss.)
The table shows returns for Investor Shares only; returns for other share classes will differ. Please note that your actual after-tax returns will depend on your tax situation and may differ from those shown. Also note that if you own the fund in a tax-deferred account, such as an individual retirement account or a 401(k) plan, this information does not apply to you. Such accounts are not subject to current taxes.
Finally, keep in mind that a fund’s performance—whether before or after taxes—does not guarantee future results.
| Average Annual Total Returns: Growth and Income Fund Investor Shares | |||
| Periods Ended September 30, 2011 | |||
| One | Five | Ten | |
| Year | Years | Years | |
| Returns Before Taxes | 1.28% | -2.64% | 2.18% |
| Returns After Taxes on Distributions | 1.01 | -3.28 | 1.70 |
| Returns After Taxes on Distributions and Sale of Fund Shares | 1.25 | -2.19 | 1.85 |
26
About Your Fund’s Expenses
As a shareholder of the fund, you incur ongoing costs, which include costs for portfolio management, administrative services, and shareholder reports (like this one), among others. Operating expenses, which are deducted from a fund’s gross income, directly reduce the investment return of the fund.
A fund’s expenses are expressed as a percentage of its average net assets. This figure is known as the expense ratio. The following examples are intended to help you understand the ongoing costs (in dollars) of investing in your fund and to compare these costs with those of other mutual funds. The examples are based on an investment of $1,000 made at the beginning of the period shown and held for the entire period.
The accompanying table illustrates your fund’s costs in two ways:
• Based on actual fund return. This section helps you to estimate the actual expenses that you paid over the period. The ”Ending Account Value“ shown is derived from the fund‘s actual return, and the third column shows the dollar amount that would have been paid by an investor who started with $1,000 in the fund. You may use the information here, together with the amount you invested, to estimate the expenses that you paid over the period.
To do so, simply divide your account value by $1,000 (for example, an $8,600 account value divided by $1,000 = 8.6), then multiply the result by the number given for your fund under the heading ”Expenses Paid During Period.“
• Based on hypothetical 5% yearly return. This section is intended to help you compare your fund‘s costs with those of other mutual funds. It assumes that the fund had a yearly return of 5% before expenses, but that the expense ratio is unchanged. In this case—because the return used is not the fund’s actual return—the results do not apply to your investment. The example is useful in making comparisons because the Securities and Exchange Commission requires all mutual funds to calculate expenses based on a 5% return. You can assess your fund’s costs by comparing this hypothetical example with the hypothetical examples that appear in shareholder reports of other funds.
Note that the expenses shown in the table are meant to highlight and help you compare ongoing costs only and do not reflect transaction costs incurred by the fund for buying and selling securities. Further, the expenses do not include any purchase, redemption, or account service fees described in the fund prospectus. If such fees were applied to your account, your costs would be higher. Your fund does not carry a “sales load.”
The calculations assume no shares were bought or sold during the period. Your actual costs may have been higher or lower, depending on the amount of your investment and the timing of any purchases or redemptions.
You can find more information about the fund’s expenses, including annual expense ratios, in the Financial Statements section of this report. For additional information on operating expenses and other shareholder costs, please refer to your fund’s current prospectus.
27
| Six Months Ended September 30, 2011 | |||
| Beginning | Ending | Expenses | |
| Account Value | Account Value | Paid During | |
| Growth and Income Fund | 3/31/2011 | 9/30/2011 | Period |
| Based on Actual Fund Return | |||
| Investor Shares | $1,000.00 | $860.66 | $1.49 |
| Admiral Shares | 1,000.00 | 861.04 | 0.98 |
| Based on Hypothetical 5% Yearly Return | |||
| Investor Shares | $1,000.00 | $1,023.46 | $1.62 |
| Admiral Shares | 1,000.00 | 1,024.02 | 1.07 |
The calculations are based on expenses incurred in the most recent six-month period. The fund’s annualized six-month expense ratios for that period are 0.32% for Investor Shares and 0.21% for Admiral Shares. The dollar amounts shown as “Expenses Paid” are equal to the annualized expense ratio multiplied by the average account value over the period, multiplied by the number of days in the most recent six-month period, then divided by the number of days in the most recent 12-month period.
28
Notice to Shareholders
Vanguard Growth and Income Fund Restructures Investment Advisory Team
The board of trustees of Vanguard Growth and Income Fund has announced the restructuring of the fund’s investment advisory team by adding D. E. Shaw Investment Management, L.L.C. (DESIM), Los Angeles Capital Management and Equity Research, Inc. (LA Capital), and The Vanguard Group, Inc. (Vanguard), as investment advisors and removing Mellon Capital Management Corporation (Mellon Capital). DESIM, LA Capital, and Vanguard each independently select and maintain a portfolio of common stocks for the fund. The assets of the fund formerly managed by Mellon Capital have been divided equally among DESIM, LA Capital, and Vanguard.
DESIM is a privately owned investment management firm founded in 2005; it had more than $5.9 billion in assets under management as of September 30, 2011. Anthony Foley, portfolio manager for the DESIM portion of the fund, has over 20 years of investment experience.
LA Capital is an investment management firm founded in 2002; it had more than $6.3 billion in assets under management as of September 30, 2011. Thomas D. Stevens and Hal W. Reynolds, portfolio managers for the LA Capital portion of the fund, each have over 25 years of investment experience.
Vanguard, which began operations in 1975, serves as advisor to the fund through its Quantitative Equity Group. As of September 30, 2011, Vanguard served as advisor for approximately $1.3 trillion in assets. James D. Troyer, portfolio manager for Vanguard’s portion of the fund, has 25 years of investment experience.
The restructuring of the fund’s investment advisory team is expected to result in an increase in the estimated expense ratio for the fund’s Investor Shares to 0.34% from 0.32% of the fund’s average net assets; the estimated expense ratio for the fund’s Admiral Shares is expected to increase to 0.23% from 0.21% of the fund’s average net assets. These estimated expense ratios remain at a substantial discount to the 1.26% average expense ratio for large-cap core funds in 2010 (derived from data provided by Lipper Inc.). In addition, the fund’s investment objective, primary investment strategies, and primary risks will not change.
The table and examples on the following page show the fund’s actual expenses and cost of investing for its most recent fiscal year compared with the “pro forma” expenses and cost of investing that would have applied if the new advisory realignment had been in effect for that period.
| Annual Fund Operating Expenses | ||||
| (Expenses deducted from the fund’s assets) | ||||
| Actual | Pro Forma | |||
| Investor | Admiral | Investor | Admiral | |
| Shares | Shares | Shares | Shares | |
| Management Expenses | 0.29% | 0.18% | 0.31% | 0.20% |
| 12b-1 Distribution Fee | None | None | None | None |
| Other Expenses | 0.03% | 0.03% | 0.03% | 0.03% |
| Total Annual Fund Operating Expenses | 0.32% | 0.21% | 0.34% | 0.23% |
29
Examples
The examples are intended to help you compare the cost of investing in the fund’s Investor Shares or Admiral Shares with the cost of investing in other mutual funds. They illustrate the hypothetical expenses that you would incur over various periods if you invest $10,000 in the fund’s shares. These examples assume that the shares provide a return of 5% a year and that operating expenses remain as stated. The results apply whether or not you redeem your investment at the end of the given period. Although your actual costs may be higher or lower, based on these assumptions, your costs would be:
| Actual | 1 Year | 3 Years | 5 years | 10 Years |
| Investor Shares | $33 | $103 | $180 | $406 |
| Admiral Shares | 22 | 68 | 118 | 268 |
| Pro Forma | 1 Year | 3 Years | 5 years | 10 Years |
| Investor Shares | $35 | $109 | $191 | $431 |
| Admiral Shares | 24 | 74 | 130 | 293 |
Additional Information
Vanguard Growth and Income Fund has entered into new investment advisory arrangements with DESIM, LA Capital, and Vanguard. These additions will not affect the fund’s investment objective, policies, or strategies.
Under the terms of the fund’s agreements with DESIM and LA Capital, the fund will pay DESIM and LA Capital a base fee at the end of each fiscal quarter. The fee is calculated by applying an annual percentage rate to the average daily net assets of the portions of the fund managed by DESIM and LA Capital, respectively, during the quarter. The base fee has breakpoints, which means that the percentage declines as assets go up. In addition, the quarterly payments to DESIM and LA Capital may be increased or decreased by applying a performance adjustment. The adjustment is based on the cumulative total return of the portions of the fund managed by DESIM and LA Capital, respectively, over a trailing 36-month period for DESIM and a 60-month period for LA Capital relative to the total return of the S&P 500 Index over the same period.
Vanguard provides services to the fund on an at-cost basis. Vanguard’s performance is also evaluated against the S&P 500 Index.
For the fiscal year ended September 30, 2011, the fund paid approximately $4.3 million in base investment advisory fees to its advisor, or 0.10% of the fund’s average net assets, before a performance based decrease of 0.04%.
Vanguard Growth and Income Fund receives corporate, management, administrative, and distribution services on an at-cost basis from The Vanguard Group, Inc., P.O. Box 1110, Valley Forge, PA 19482.
Each advisor is responsible for managing the investment and reinvestment of its portion of the Growth and Income Fund’s assets and for continuously reviewing, supervising, and administering the fund’s investment program. Each advisor is subject to the supervision and oversight of Vanguard’s Portfolio Review Department and the officers and trustees of the fund. The fund’s board of trustees designates the proportion of fund assets to be managed by each advisor and may change these proportions at any time.
30
Board Approval of the Investment Advisory Agreement With D. E. Shaw Investment Management, L.L.C.
The Growth and Income Fund’s board of trustees retained DESIM under the terms of a new investment advisory agreement. The board’s decision to hire DESIM as part of the fund’s multimanager structure was based on the board’s most recent evaluation of the fund’s former investment staff, portfolio management process, and investment advisory arrangements. In considering whether to approve the agreement, the board engaged in arm’s-length discussions with DESIM and considered the following factors, among others:
• The board considered the benefits to shareholders of adding DESIM as a new advisor to the fund, particularly in light of the nature, extent, and quality of services to be provided by DESIM. The board noted that DESIM employs quantitative models that seek to capture predominantly “bottom-up” stock-specific return opportunities while aiming to control the overall portfolio risk and characteristics such as size, sector weights, and style, to be similar to the benchmark. The board concluded that it is in the best interests of the fund and its shareholders to add a high-quality manager with a track record of success such as DESIM. The board noted that adding DESIM as an advisor would allow the fund to retain its character as a quantitative large-cap core equity offering while benefiting from multiple differentiated active managers, who each have the opportunity to generate superior returns. The attractive blend of proven managers should benefit fund shareholders over the long term.
• The board analyzed the performance of other funds and portfolios managed by DESIM. The board concluded that DESIM’s large-cap core strategy has posted competitive results over the long term.
• The board considered the advisory fee scheduleand the estimated expense ratios of the fund's share classes and compared them with the average advisory fee and expense ratio of the fund’s peer group. The board concluded that the addition of DESIM would result in a modest increase in the fund’s aggregate investment advisory fees, but that the fund’s advisory fee rate and expense ratios would remain significantly below the fund’s peer average.
• The board considered the extent to which economies of scale would be realized as the fund grows, including the impact of appropriate breakpoints in DESIM’s advisory fee schedule. By including asset-based breakpoints in the fee schedule, the fund’s trustees ensure that, if the portion of the fund managed by DESIM continues to grow, investors will capture economies of scale in the form of a lower advisory fee rate.
• Based on its informed business judgment, the board concluded that the course of action in the best interests of the fund and its shareholders was to approve the agreement with DESIM.
The new agreement will continue for two years from its effective date and is renewable after that for successive one-year periods. The agreement will be reviewed annually by the fund’s board of trustees, a majority of whom are not “interested persons” of either the fund or its advisors as defined in federal securities laws. The board may, at any time, reallocate the fund’s assets among the fund’s advisors, or allocate assets of the fund to other investment advisors, without terminating or revising the new agreement with DESIM.
31
Background Information on D. E. Shaw Investment Management, L.L.C.
D. E. Shaw Investment Management, L.L.C., 1166 Avenue of the Americas, 9th Floor, New York, NY 10036, is a privately owned investment management firm founded in 2005. As of September 30, 2011, DESIM managed approximately $5.9 billion in assets. The manager primarily responsible for overseeing the day-to-day management of DESIM’s portion of Vanguard Growth and Income Fund is:
Anthony Foley, Senior Vice President and Chief Investment Officer of DESIM. He has worked in investment management since 1987; has managed investment portfolios since 1991; and has managed a portion of the fund since September 2011. Education: B.A., Oxford University; M.Sc., London School of Economics and Political Science.
Board Approval of the Investment Advisory Agreement With Los Angeles Capital Management and Equity Research, Inc.
The Growth and Income Fund’s board of trustees retained LA Capital under the terms of a new investment advisory agreement. The board’s decision to hire LA Capital as part of the fund’s multi-manager structure was based on the board’s most recent evaluation of the fund’s former investment staff, portfolio management process, and investment advisory arrangements. In considering whether to approve the agreement, the board engaged in arm’s-length discussions with LA Capital and considered the following factors, among others:
• The board considered the benefits to shareholders of adding LA Capital as a new advisor to the fund, particularly in light of the nature, extent, and quality of services to be provided by LA Capital. The board noted that LA Capital employs a quantitative model that seeks to emphasize stocks with characteristics that investors are currently seeking, and to underweight stocks with characteristics that investors are currently avoiding. The board concluded that it is in the best interests of the fund and its shareholders to add a high-quality manager with a track record of success such as LA Capital. The board noted that adding LA Capital as an advisor would allow the fund to retain its character as a quantitative large-cap core equity offering while benefiting from multiple differentiated active managers, who each have the opportunity to generate superior returns. The attractive blend of proven managers should benefit fund shareholders over the long term.
• The board analyzed the performance of other funds and portfolios managed by LA Capital. The board concluded that LA Capital’s large-cap core strategy has delivered strong and consistent investment returns compared with peers and the benchmark over the long term.
• The board considered the advisory fee scheduleand the estimated expense ratios of the fund's share classes and compared them with the average advisory fee and expense ratio of the fund’s peer group. The board concluded that the addition of LA Capital would result in a modest increase in the fund’s aggregate investment advisory fees, but that the fund’s advisory fee rate and expense ratios would remain significantly below the fund’s peer average.
• The board considered the extent to which economies of scale would be realized as the fund grows, including the impact of appropriate breakpoints in LA Capital’s advisory fee schedule. By including asset-based breakpoints in the fee schedule, the fund’s trustees ensure that, if the portion of the fund managed by LA Capital continues to grow, investors will capture economies of scale in the form of a lower advisory fee rate.
• Based on its informed business judgment, the board concluded that the course of action in the best interests of the fund and its shareholders was to approve the agreement with LA Capital.
32
The new agreement will continue for two years from its effective date and is renewable after that for successive one-year periods. The agreement will be reviewed annually by the fund’s board of trustees, a majority of whom are not “interested persons” of either the fund or its advisors as defined in federal securities laws. The board may, at any time, reallocate the fund’s assets among the fund’s advisors, or allocate assets of the fund to other investment advisors, without terminating or revising the new agreement with LA Capital.
Background Information on Los Angeles Capital Management and Equity Research, Inc. Los Angeles Capital Management and Equity Research, Inc., 11150 Santa Monica Boulevard, Suite 200, Los Angeles, CA 90025, is an employee-owned investment advisory firm founded in 2002. As of September 30, 2011, LA Capital managed approximately $6.3 billion in assets. The managers primarily responsible for overseeing the day-to-day management of LA Capital’s portion of Vanguard Growth and Income Fund are:
Thomas D. Stevens, CFA, Chairman and Principal of LA Capital. He has worked in investment management since 1976; has managed investment portfolios since 1976; and has co-managed a portion of the fund since September 2011. Education: B.B.A. and M.B.A., University of Wisconsin.
Hal W. Reynolds, CFA, Chief Investment Officer and Principal of LA Capital. He has worked in investment management since 1982; has managed investment portfolios since 1998; and has co-managed a portion of the fund since September 2011. Education: B.A., University of Virginia; M.B.A., University of Pittsburgh.
Board Approval of the Investment Advisory Arrangement With Vanguard
The Growth and Income Fund’s board of trustees added Vanguard under the terms of the Fifth Amended and Restated Funds’ Service Agreement. The board’s decision to add Vanguard as part of the fund’s multimanager structure was based upon the board’s most recent evaluation of the fund’s former investment staff, portfolio management process, and investment advisory arrangements. In considering whether to approve the arrangement, the board engaged in arm’s-length discussions with Vanguard and considered the following factors, among others:
• The board considered the benefits to shareholders of adding LA Capital as a new advisor to the fund, particularly in light of the nature, extent, and quality of services to be provided by Vanguard. The board noted that Vanguard—through its Quantitative Equity Group—employs a multifactor model that evaluates stocks on growth, valuation, quality, management decision-making, and market sentiment in order to forecast individual stocks’ relative performance. The board concluded that it is in the best interests of the fund and its shareholders to add a high-quality manager with a track record of success such as Vanguard. The board noted that adding Vanguard as an advisor would allow the fund to retain its character as a quantitative large-cap core equity offering while benefiting from multiple differentiated active managers, who each have the opportunity to generate superior returns. The attractive blend of proven managers should benefit fund shareholders over the long term.
• The board analyzed the performance of other funds and portfolios managed by Vanguard. The board concluded that Vanguard’s large-cap core quantitative strategy has produced strong short-term investment returns relative to the benchmark and peers, but has modestly underperformed the benchmark longer-term.
33
• The board considered the at-cost advisory expenses to be paid by the fund to Vanguard and the estimated expense ratio for funds in the fund’s peer group. The board noted that, after the addition of Vanguard, the fund’s advisory fees and expenses as well as the expense ratio would be expected to remain significantly below the fund’s peer average.
• The board concluded that, under all the circumstances and based on its informed business judgment, the addition of Vanguard as an advisor to the fund would provide an appropriate complement to the fund’s other advisors and is in the best interests of the fund and its shareholders.
The internalized management arrangement with Vanguard is renewable for successive one-year periods. The arrangement will be reviewed annually by the fund’s board of trustees, a majority of whom are not “interested persons” of either the fund or its advisors as defined in federal securities laws. The board may, at any time, reallocate the fund’s assets among the fund’s advisors, or allocate assets of the fund to other investment advisors, without terminating or revising the arrangement with Vanguard.
Background Information on Vanguard Group
The Vanguard Group, Inc., P.O. Box 2600, Valley Forge, PA 19482, began operations in 1975, and serves as advisor to the fund through its Quantitative Equity Group. As of September 30, 2011, the Quantitative Equity Group served as advisor for approximately $728 billion in assets. The fund also receives corporate, management, administrative, and distribution services on an at-cost basis from Vanguard. The manager primarily responsible for overseeing the day-to-day management of Vanguard’s portion of Vanguard Growth and Income Fund is:
James D. Troyer, CFA, Principal of Vanguard. He has managed investment portfolios since 1986; has been with Vanguard since 1989; and has managed a portion of the fund since September 2011. Education: A.B., Occidental College.
34
Glossary
30-Day SEC Yield. A fund’s 30-day SEC yield is derived using a formula specified by the U.S. Securities and Exchange Commission. Under the formula, data related to the fund’s security holdings in the previous 30 days are used to calculate the fund’s hypothetical net income for that period, which is then annualized and divided by the fund’s estimated average net assets over the calculation period. For the purposes of this calculation, a security’s income is based on its current market yield to maturity (for bonds; excluding inflation for inflation-protected securities), its actual income (for asset-backed securities), or its projected dividend yield (for stocks). Because the SEC yield represents hypothetical annualized income, it will differ—at times significantly—from the fund’s actual experience. As a result, the fund’s income distributions may be higher or lower than implied by the SEC yield.
Beta. A measure of the magnitude of a fund’s past share-price fluctuations in relation to the ups and downs of a given market index. The index is assigned a beta of 1.00. Compared with a given index, a fund with a beta of 1.20 typically would have seen its share price rise or fall by 12% when the index rose or fell by 10%. For this report, beta is based on returns over the past 36 months for both the fund and the index. Note that a fund’s beta should be reviewed in conjunction with its R-squared (see definition). The lower the R-squared, the less correlation there is between the fund and the index, and the less reliable beta is as an indicator of volatility.
Dividend Yield. Dividend income earned by stocks, expressed as a percentage of the aggregate market value (or of net asset value, for a fund). The yield is determined by dividing the amount of the annual dividends by the aggregate value (or net asset value) at the end of the period. For a fund, the dividend yield is based solely on stock holdings and does not include any income produced by other investments.
Earnings Growth Rate. The average annual rate of growth in earnings over the past five years for the stocks now in a fund.
Equity Exposure. A measure that reflects a fund’s investments in stocks and stock futures. Any holdings in short-term reserves are excluded.
Expense Ratio. The percentage of a fund’s average net assets used to pay its annual administrative and advisory expenses. These expenses directly reduce returns to investors.
Foreign Holdings. The percentage of a fund represented by securities or depositary receipts of companies based outside the United States.
Inception Date. The date on which the assets of a fund (or one of its share classes) are first invested in accordance with the fund’s investment objective. For funds with a subscription period, the inception date is the day after that period ends. Investment performance is measured from the inception date.
Median Market Cap. An indicator of the size of companies in which a fund invests; the midpoint of market capitalization (market price x shares outstanding) of a fund’s stocks, weighted by the proportion of the fund’s assets invested in each stock. Stocks representing half of the fund’s assets have market capitalizations above the median, and the rest are below it.
Price/Book Ratio. The share price of a stock divided by its net worth, or book value, per share. For a fund, the weighted average price/book ratio of the stocks it holds.
35
Price/Earnings Ratio. The ratio of a stock’s current price to its per-share earnings over the past year. For a fund, the weighted average P/E of the stocks it holds. P/E is an indicator of market expectations about corporate prospects; the higher the P/E, the greater the expectations for a company’s future growth.
R-Squared. A measure of how much of a fund’s past returns can be explained by the returns from the market in general, as measured by a given index. If a fund’s total returns were precisely synchronized with an index’s returns, its R-squared would be 1.00. If the fund’s returns bore no relationship to the index’s returns, its R-squared would be 0. For this report, R-squared is based on returns over the past 36 months for both the fund and the index.
Return on Equity. The annual average rate of return generated by a company during the past five years for each dollar of shareholder’s equity (net income divided by shareholder’s equity). For a fund, the weighted average return on equity for the companies whose stocks it holds.
Short-Term Reserves. The percentage of a fund invested in highly liquid, short-term securities that can be readily converted to cash.
Turnover Rate. An indication of the fund’s trading activity. Funds with high turnover rates incur higher transaction costs and may be more likely to distribute capital gains (which may be taxable to investors). The turnover rate excludes in-kind transactions, which have minimal impact on costs.
36
This page intentionally left blank.
This page intentionally left blank.
This page intentionally left blank.
The People Who Govern Your Fund
The trustees of your mutual fund are there to see that the fund is operated and managed in your best interests since, as a shareholder, you are a part owner of the fund. Your fund’s trustees also serve on the board of directors of The Vanguard Group, Inc., which is owned by the Vanguard funds and provides services to them on an at-cost basis.
A majority of Vanguard’s board members are independent, meaning that they have no affiliation with Vanguard or the funds they oversee, apart from the sizable personal investments they have made as private individuals. The independent board members have distinguished backgrounds in business, academia, and public service. Each of the trustees and executive officers oversees 178 Vanguard funds.
The following table provides information for each trustee and executive officer of the fund. More information about the trustees is in the Statement of Additional Information, which can be obtained, without charge, by contacting Vanguard at 800-662-7447, or online at vanguard.com.
| Interested Trustee1 | and President (2006–2008) of Rohm and Haas Co. |
| (chemicals); Director of Tyco International, Ltd. | |
| F. William McNabb III | (diversified manufacturing and services) and Hewlett- |
| Born 1957. Trustee Since July 2009. Chairman of the | Packard Co. (electronic computer manufacturing); |
| Board. Principal Occupation(s) During the Past Five | Senior Advisor at New Mountain Capital; Trustee |
| Years: Chairman of the Board of The Vanguard Group, | of The Conference Board; Member of the Board of |
| Inc., and of each of the investment companies served | Managers of Delphi Automotive LLP (automotive |
| by The Vanguard Group, since January 2010; Director | components). |
| of The Vanguard Group since 2008; Chief Executive | |
| Officer and President of The Vanguard Group and of | Amy Gutmann |
| each of the investment companies served by The | Born 1949. Trustee Since June 2006. Principal |
| Vanguard Group since 2008; Director of Vanguard | Occupation(s) During the Past Five Years: President |
| Marketing Corporation; Managing Director of The | of the University of Pennsylvania; Christopher H. |
| Vanguard Group (1995–2008). | Browne Distinguished Professor of Political Science |
| in the School of Arts and Sciences with secondary | |
| appointments at the Annenberg School for Commu- | |
| Independent Trustees | nication and the Graduate School of Education |
| of the University of Pennsylvania; Director of | |
| Emerson U. Fullwood | Carnegie Corporation of New York, Schuylkill River |
| Born 1948. Trustee Since January 2008. Principal | Development Corporation, and Greater Philadelphia |
| Occupation(s) During the Past Five Years: Executive | Chamber of Commerce; Trustee of the National |
| Chief Staff and Marketing Officer for North America | Constitution Center; Chair of the Presidential |
| and Corporate Vice President (retired 2008) of Xerox | Commission for the Study of Bioethical Issues. |
| Corporation (document management products and | |
| services); Executive in Residence and 2010 | JoAnn Heffernan Heisen |
| Distinguished Minett Professor at the Rochester | Born 1950. Trustee Since July 1998. Principal |
| Institute of Technology; Director of SPX Corporation | Occupation(s) During the Past Five Years: Corporate |
| (multi-industry manufacturing), the United Way of | Vice President and Chief Global Diversity Officer |
| Rochester, Amerigroup Corporation (managed health | (retired 2008) and Member of the Executive |
| care), the University of Rochester Medical Center, | Committee (1997–2008) of Johnson & Johnson |
| Monroe Community College Foundation, and North | (pharmaceuticals/consumer products); Director of |
| Carolina A&T University. | Skytop Lodge Corporation (hotels), the University |
| Medical Center at Princeton, the Robert Wood | |
| Rajiv L. Gupta | Johnson Foundation, and the Center for Work Life |
| Born 1945. Trustee Since December 2001.2 | Policy; Member of the Advisory Board of the |
| Principal Occupation(s) During the Past Five Years: | Maxwell School of Citizenship and Public Affairs |
| Chairman and Chief Executive Officer (retired 2009) | at Syracuse University. |
| F. Joseph Loughrey | Thomas J. Higgins | |
| Born 1949. Trustee Since October 2009. Principal | Born 1957. Chief Financial Officer Since September | |
| Occupation(s) During the Past Five Years: President | 2008. Principal Occupation(s) During the Past Five | |
| and Chief Operating Officer (retired 2009) and Vice | Years: Principal of The Vanguard Group, Inc.; Chief | |
| Chairman of the Board (2008–2009) of Cummins Inc. | Financial Officer of each of the investment companies | |
| (industrial machinery); Director of SKF AB (industrial | served by The Vanguard Group since 2008; Treasurer | |
| machinery), Hillenbrand, Inc. (specialized consumer | of each of the investment companies served by The | |
| services), the Lumina Foundation for Education, and | Vanguard Group (1998–2008). | |
| Oxfam America; Chairman of the Advisory Council | ||
| for the College of Arts and Letters and Member | Kathryn J. Hyatt | |
| of the Advisory Board to the Kellogg Institute for | Born 1955. Treasurer Since November 2008. Principal | |
| International Studies at the University of Notre Dame. | Occupation(s) During the Past Five Years: Principal | |
| of The Vanguard Group, Inc.; Treasurer of each of | ||
| André F. Perold | the investment companies served by The Vanguard | |
| Born 1952. Trustee Since December 2004. Principal | Group since 2008; Assistant Treasurer of each of the | |
| Occupation(s) During the Past Five Years: George | investment companies served by The Vanguard Group | |
| Gund Professor of Finance and Banking at the Harvard | (1988–2008). | |
| Business School (retired July 2011); Chief Investment | ||
| Officer and co-Managing Partner of HighVista | Heidi Stam | |
| Strategies LLC (private investment firm); Director of | Born 1956. Secretary Since July 2005. Principal | |
| Rand Merchant Bank; Overseer of the Museum of | Occupation(s) During the Past Five Years: Managing | |
| Fine Arts Boston. | Director of The Vanguard Group, Inc., since 2006; | |
| General Counsel of The Vanguard Group since 2005; | ||
| Alfred M. Rankin, Jr. | Secretary of The Vanguard Group and of each of the | |
| Born 1941. Trustee Since January 1993. Principal | investment companies served by The Vanguard Group | |
| Occupation(s) During the Past Five Years: Chairman, | since 2005; Director and Senior Vice President of | |
| President, and Chief Executive Officer of NACCO | Vanguard Marketing Corporation since 2005; | |
| Industries, Inc. (forklift trucks/housewares/lignite); | Principal of The Vanguard Group (1997–2006). | |
| Director of Goodrich Corporation (industrial products/ | ||
| aircraft systems and services) and the National | ||
| Association of Manufacturers; Chairman of the | Vanguard Senior Management Team | |
| Federal Reserve Bank of Cleveland; Vice Chairman | ||
| of University Hospitals of Cleveland; President of | R. Gregory Barton | Chris D. McIsaac |
| the Board of The Cleveland Museum of Art. | Mortimer J. Buckley | Michael S. Miller |
| Kathleen C. Gubanich | James M. Norris | |
| Peter F. Volanakis | Paul A. Heller | Glenn W. Reed |
| Born 1955. Trustee Since July 2009. Principal | Martha G. King | George U. Sauter |
| Occupation(s) During the Past Five Years: President | ||
| and Chief Operating Officer (retired 2010) of Corning | ||
| Incorporated (communications equipment); Director of | Chairman Emeritus and Senior Advisor | |
| Corning Incorporated (2000–2010) and Dow Corning | ||
| (2001–2010); Overseer of the Amos Tuck School of | John J. Brennan | |
| Business Administration at Dartmouth College. | Chairman, 1996–2009 | |
| Chief Executive Officer and President, 1996–2008 | ||
| Executive Officers | ||
| Founder | ||
| Glenn Booraem | ||
| Born 1967. Controller Since July 2010. Principal | John C. Bogle | |
| Occupation(s) During the Past Five Years: Principal | Chairman and Chief Executive Officer, 1974–1996 | |
| of The Vanguard Group, Inc.; Controller of each of | ||
| the investment companies served by The Vanguard | ||
| Group since 2010; Assistant Controller of each of | ||
| the investment companies served by The Vanguard | ||
| Group (2001–2010). | ||
1 Mr. McNabb is considered an “interested person,” as defined in the Investment Company Act of 1940, because he is an officer of the Vanguard funds.
2 December 2002 for Vanguard Equity Income Fund, Vanguard Growth Equity Fund, the Vanguard Municipal Bond Funds, and the Vanguard State Tax-Exempt Funds.
 | |
| P.O. Box 2600 | |
| Valley Forge, PA 19482-2600 |
Connect with Vanguard® > vanguard.com
| Fund Information > 800-662-7447 | CFA® is a trademark owned by CFA Institute. |
| Direct Investor Account Services > 800-662-2739 | |
| Institutional Investor Services > 800-523-1036 | |
| Text Telephone for People | |
| With Hearing Impairment > 800-749-7273 | |
| This material may be used in conjunction | |
| with the offering of shares of any Vanguard | |
| fund only if preceded or accompanied by | |
| the fund’s current prospectus. | |
| All comparative mutual fund data are from Lipper Inc. or | |
| Morningstar, Inc., unless otherwise noted. | |
| You can obtain a free copy of Vanguard’s proxy voting | |
| guidelines by visiting vanguard.com/proxyreporting or by | |
| calling Vanguard at 800-662-2739. The guidelines are | |
| also available from the SEC’s website, sec.gov. In | |
| addition, you may obtain a free report on how your fund | |
| voted the proxies for securities it owned during the 12 | |
| months ended June 30. To get the report, visit either | |
| vanguard.com/proxyreporting or sec.gov. | |
| You can review and copy information about your fund at | |
| the SEC’s Public Reference Room in Washington, D.C. To | |
| find out more about this public service, call the SEC at | |
| 202-551-8090. Information about your fund is also | |
| available on the SEC’s website, and you can receive | |
| copies of this information, for a fee, by sending a | |
| request in either of two ways: via e-mail addressed to | |
| publicinfo@sec.gov or via regular mail addressed to the | |
| Public Reference Section, Securities and Exchange | |
| Commission, Washington, DC 20549-1520. | |
| © 2011 The Vanguard Group, Inc. | |
| All rights reserved. | |
| Vanguard Marketing Corporation, Distributor. | |
| Q930 112011 | |
| Annual Report | September 30, 2011 |
| Vanguard Structured Equity Funds |
| Vanguard Structured Large-Cap Equity Fund |
| Vanguard Structured Broad Market Fund |
> For the fiscal year ended September 30, 2011, Vanguard Structured Large-Cap Equity Fund returned about 4% and Vanguard Structured Broad Market Fund returned about 3%.
> Both funds outpaced their respective benchmark indexes and the average returns of their peers.
> The advisor’s strong stock selection across a variety of industries contributed to the funds’ outperformance.
| Contents | |
| Your Fund’s Total Returns. | 1 |
| Chairman’s Letter. | 2 |
| Advisor’s Report. | 7 |
| Structured Large-Cap Equity Fund. | 10 |
| Structured Broad Market Fund. | 23 |
| About Your Fund’s Expenses. | 39 |
| Glossary. | 41 |
Please note: The opinions expressed in this report are just that—informed opinions. They should not be considered promises or advice. Also, please keep in mind that the information and opinions cover the period through the date on the front of this report. Of course, the risks of investing in your fund are spelled out in the prospectus.
See the Glossary for definitions of investment terms used in this report.
About the cover: Vanguard was named for the HMS Vanguard, flagship of British Admiral Horatio Nelson. A ship—whose performance and safety depend on the work of all hands—has served as a fitting metaphor for the Vanguard crew as we strive to help clients reach their financial goals.
Your Fund’s Total Returns
| Fiscal Year Ended September 30, 2011 | |
| Total | |
| Returns | |
| Vanguard Structured Large-Cap Equity Fund | |
| Institutional Shares | 4.14% |
| Institutional Plus Shares | 4.18 |
| S&P 500 Index | 1.14 |
| Large-Cap Core Funds Average | -1.26 |
| Large-Cap Core Funds Average: Derived from data provided by Lipper Inc. | |
| Vanguard Structured Broad Market Fund | |
| Institutional Shares | 3.37% |
| Institutional Plus Shares | 3.43 |
| Russell 3000 Index | 0.55 |
| Multi-Cap Core Funds Average | -2.39 |
| Multi-Cap Core Funds Average: Derived from data provided by Lipper Inc. | |
Institutional Shares and Institutional Plus Shares are available to certain institutional investors who meet specific administrative, service, and account-size criteria.
| Your Fund’s Performance at a Glance | ||||
| September 30, 2010 , Through September 30, 2011 | ||||
| Distributions Per Share | ||||
| Starting | Ending | Income | Capital | |
| Share Price | Share Price | Dividends | Gains | |
| Vanguard Structured Large-Cap Equity Fund | ||||
| Institutional Shares | $20.97 | $21.49 | $0.366 | $0.000 |
| Institutional Plus Shares | 41.98 | 42.48 | 1.316 | 0.000 |
| Vanguard Structured Broad Market Fund | ||||
| Institutional Shares | $20.70 | $21.03 | $0.393 | $0.000 |
| Institutional Plus Shares | 41.36 | 42.02 | 0.808 | 0.000 |
1

Chairman’s Letter
Dear Shareholder,
Despite the recent volatility in U.S. stock markets, the Vanguard Structured Equity Funds delivered solid, benchmark-beating returns for the fiscal year ended September 30.
The Structured Large-Cap Equity Fund returned about 4% for the fiscal year, about 3 percentage points better than its benchmark, the Standard & Poor’s 500 Index. The Structured Broad Market Fund returned about 3% for the same period, nearly 3 percentage points more than its benchmark, the Russell 3000 Index. The funds also outperformed their respective peer-group average returns, both of which were in negative territory.
The funds’ stock selection models found success in several industry sectors. The funds’ advisor, Vanguard Quantitative Equity Group, uses computer models designed to find companies with seemingly undervalued stocks and strong growth prospects while maintaining risk profiles similar to those of the funds’ respective benchmarks.
A swift change in sentiment weighed on stock prices
Global stock markets rallied through the first half of the fiscal year as corporate earnings surged and the economic recovery seemed to be gathering steam. In the second half, however, stock prices tumbled as economic indicators took a turn for the worse and U.S. and European policymaking strife dominated the headlines. (Standard & Poor’s, the ratings
2
agency, downgraded the U.S. credit rating, in large part because of the political gridlock on display during the debt-ceiling debate. Vanguard’s confidence in the “full faith and credit” of the U.S. Treasury remains unshaken.)
The U.S. stock market’s second-half weakness sapped its first-half strength. The broad market returned 0.31% for the full 12 months. International stocks, which gained less at the start of the year and lost more at the end, returned –10.81% in U.S. dollars.
Bond prices rallied as optimism faded
The stock market’s pattern of strength and weakness was inverted in the bond market. Early in the year, bond prices retreated, consistent with investor optimism about economic growth. Later in the year, as optimism gave way to anxiety, bond prices surged, driving yields to remarkable lows. At the end of September, the yield of the 10-year U.S. Treasury note, a benchmark for longer-term interest rates, stood at 1.93%. Bond indexes recorded impressive returns, though it’s worth noting that shrinking yields imply lower returns on prospective investments.
The yields of money market instruments hovered near zero, as they have since December 2008, when the Federal Reserve cut its target for short-term interest rates to between 0% and 0.25%. Toward the end of the period, the Fed
| Market Barometer | |||
| Average Annual Total Returns | |||
| Periods Ended September 30, 2011 | |||
| One | Three | Five | |
| Year | Years | Years | |
| Stocks | |||
| Russell 1000 Index (Large-caps) | 0.91% | 1.61% | -0.91% |
| Russell 2000 Index (Small-caps) | -3.53 | -0.37 | -1.02 |
| Dow Jones U.S. Total Stock Market Index | 0.31 | 1.75 | -0.57 |
| MSCI All Country World Index ex USA (International) | -10.81 | 0.52 | -1.57 |
| Bonds | |||
| Barclays Capital U.S. Aggregate Bond Index (Broad | |||
| taxable market) | 5.26% | 7.97% | 6.53% |
| Barclays Capital Municipal Bond Index (Broad | |||
| tax-exempt market) | 3.88 | 8.08 | 5.01 |
| Citigroup Three-Month U.S. Treasury Bill Index | 0.11 | 0.19 | 1.61 |
| CPI | |||
| Consumer Price Index | 3.87% | 1.22% | 2.26% |
3
indicated that it expected to maintain this exceptionally low target at least through mid-2013.
Large-cap stocks beat the broad market
The Vanguard Structured Equity Funds produced double-digit gains for the first half of the fiscal year as many high-quality, reasonably valued stocks favored by quantitative models regained momentum. But by the end of the period, the funds’ returns had retreated as global stocks of all qualities plunged and fears of another U.S. recession resurfaced.
Still, both the Broad Market Fund and the Large-Cap Equity Fund handily surpassed their respective comparative standards for the fiscal year. Their success marked a shift in the performance of quantitative funds as a whole and these funds in particular, which struggled to keep up with their benchmarks in the two years after the 2008 financial crisis.
In the recovery that followed, the computer models used by many quantitative funds were out of sync with the prevailing mood of investors, who were more willing to take on risk by buying stocks of companies with marginal financials and keen sensitivity to the rhythms of the business cycle. Early in the fiscal year, the tide turned, and higher-quality companies with attractively priced stocks, such as those favored by your fund’s advisor and other quantitative managers, enjoyed a resurgence.
Of the two funds, the Large-Cap Equity Fund delivered the stronger return for the period. The fund’s performance relative to its benchmark index benefited from the advisor’s superior stock selection in the health care, consumer discretionary, and information technology sectors. In health care, stock picks among managed health care providers and pharmaceutical companies boosted results. As economic indicators turned negative in the second half of the fiscal year, health care stocks climbed, benefiting from the perception that health care demand is relatively insulated from changes in the broader economy.
In consumer discretionary, the fund’s selections among specialty retailers and media companies stood out. Despite meager growth in the U.S. economy and a lackluster job market, consumers have continued to spend on specialty apparel and cable and satellite services. In information technology, sizable holdings in companies that make cell phone and other telecommunication equipment held up best.
Financial, information technology, and health care stocks produced the strongest relative results for the Broad Market Fund, which invests in stocks of different sizes. Although both the fund and the index suffered their biggest losses in financials, the fund was successful in limiting its exposure to the worst performers in the treacherous banking environment. Holdings in consumer finance and diversified financial services also helped, although the sector as a whole has continued to grapple with bad mortgages and the lingering effects of the credit crisis.
4
In information technology, internet service providers and companies that make cell phones and related communications equipment performed best. Health care sector standouts were health care distributors, managed health care providers, and biotech companies.
Recent challenges hurt long-term performance
The Vanguard Structured Equity Funds and their share classes have different inception dates. The Broad Market Fund’s Institutional Plus Shares, which have been around the longest, have produced an average annual return of 2.40% since their inception in 2004. This result was a step behind that of the fund’s benchmark, the Russell 3000 Index (+2.63%), but ahead of the average annual return of its peers (+1.90%).
The Large-Cap Fund’s Institutional Plus Shares, introduced in 2006, posted an annualized return of –0.70% for the period since their inception. This return trailed that of the fund’s benchmark, the S&P 500 Index (–0.39%), but was ahead of the average annual return of peer-group funds (–1.42%).
Both funds aim to beat their comparative standards, but it hasn’t always been easy. The Structured Equity Funds’ weak absolute returns are partly attributable to the turbulent stock market environment
| Total Returns | |
| Inception Through September 30, 2011 | |
| Average | |
| Annual Return | |
| Structured Large-Cap Equity Fund Institutional Plus Shares | |
| (Returns since inception: 5/15/2006) | –0.70% |
| S&P 500 Index | –0.39 |
| Large-Cap Core Funds Average | –1.42 |
| Large-Cap Core Funds Average: Derived from data provided by Lipper Inc. |
| Structured Broad Market Fund Institutional Plus Shares | |
| (Returns since inception: 5/3/2004) | 2.40% |
| Russell 3000 Index | 2.63 |
| Multi-Cap Core Funds Average | 1.90 |
| Multi-Cap Core Funds Average: Derived from data provided by Lipper Inc. |
The figures shown represent past performance, which is not a guarantee of future results. (Current performance may be lower or higher than the performance data cited. For performance data current to the most recent month-end, visit our website at vanguard.com/performance.) Note, too, that both investment returns and principal value can fluctuate widely, so an investor’s shares, when sold, could be worth more or less than their original cost.
5
over the past few years. During the funds’ relatively short histories, they have endured an unusually challenging period, encompassing the financial crisis in 2008 and this year’s U.S. and European debt dramas. The funds’ shortfalls relative to their indexes also reflect some of the difficulties faced by quantitative strategies in recent years.
Still, we remain confident in the disciplined, quantitative investment process practiced by your fund’s advisor, and we believe this approach can produce benchmark-beating results over the long term.
Don’t let market volatility cloud your view
The stock market’s rise and fall over the past fiscal year has unnerved many investors. Just when markets seem to be doing well, they can take a turn for the worse. Although such volatility can be unsettling, it has done nothing to shake our confidence in the long-term growth opportunity offered by stocks. At the same time, the recent upheaval shows that a portfolio balanced between stock funds and less volatile bond and money market funds can limit some of the short-term damage inflicted by these occasional swoons.
A prudent response to this never-ending, always unpredictable change is to remain broadly diversified both within and across asset classes. The Vanguard Structured Equity Funds, which offer risk-controlled exposure to both the broad stock market and its larger-capitalization companies, can play an important role in such a portfolio.
Thank you for entrusting your assets to Vanguard.
Sincerely,

F. William McNabb III
Chairman and Chief Executive Officer
October 18, 2011
6
Advisor’s Report
For the fiscal year ended September 30, 2011, Vanguard Structured Large-Cap Equity Fund returned 4.14% for Institutional Shares and 4.18% for Institutional Plus Shares, outperforming the returns of its benchmark, the S&P 500 Index, by about 3 percentage points. Vanguard Structured Broad Market Fund returned 3.37% for Institutional Shares and 3.43% for Institutional Plus Shares, beating its benchmark, the Russell 3000 Index, by just under 3 percentage points.
When we reported to you six months ago, the Institutional Plus Shares of the Structured Large-Cap and Structured Broad Market Funds had advanced 18.99% and 20.73%, respectively. Since then, and particularly in the last three months of the fiscal year, there has been a sell-off of equities large and small, both in the United States and abroad. The pullback and increasing overall market volatility were driven by continued worries of a stalling U.S. economy, a lack of improvement in the country’s employment picture, and the unresolved European sovereign debt crisis.
With so much uncertainty, many investors reduced their equity exposure in favor of traditional safe havens such as U.S. Treasuries, the U.S. dollar, and gold. Most economists have reduced their growth estimates for the next year or two, which has cast doubt on the near-term prospects for equities. Investors will be looking to U.S. and European leaders for fresh solutions to these ongoing issues, as well as third-quarter corporate earnings reports and future earnings forecasts here in the
United States, to help determine the market’s direction over the next few months.
While overall fund performance is affected by the macro factors described, we continue to focus our portfolio construction on specific stock fundamentals. Thus, our portfolios will maintain benchmark-level exposures to common risk factors such as market capitalization and industry weightings while employing a multifactor model diversified across various elements to forecast the relative performances of individual stocks. Our quantitative approach is similar to traditional security selection, except that we use computerized models to help identify attractive stocks. Instead of attempting to spot a small number of companies that will outperform, we generally seek to find a larger number of stocks that individually and as a group will outpace their peers.
Our process has five components:
• Valuation, which measures the price we pay for earnings and cash flows.
• Growth, which considers the growth of earnings when factoring how much we pay for them.
• Management decisions, which looks at the actions taken by company management who are privy to better knowledge of a company’s prospects and earnings than any market participant.
7
• Market sentiment, which captures how investors reflect their opinions of a company through their activity in the market.
• Quality, which measures balance sheet strength and the sustainability of earnings.
Our stock selection model performed well in the unpredictable market, with a majority of our factors contributing positively in various degrees to both of the funds. The growth factor played the biggest role in identifying strong performers. However, the Broad Market Fund, which has greater exposure to mid- and small-capitalization companies, benefited equally from the other models, which did not have as big an impact on the Large-Cap Equity Fund.
The model’s breadth is illustrated by its effectiveness across sectors over the period. We were able to produce positive stock selection results in seven out of the ten sectors in both funds’ benchmarks.
Vanguard Structured Large-Cap Equity Fund
The best-performing sectors in the portfolio were consumer discretionary (+16%), health care (+15%), and consumer staples (+13%). Underperforming for the period were materials (–19%), financials (–11%), and industrials (–8%).
At the individual stock level, the largest contributions came from overweighted positions in Limited Brands (+65%), Biogen Idec (+66%), and Humana (+46%). Compared with its benchmark, the fund benefited from underweighting or avoiding poorly performing stocks such as Bank of America (–53%), Hewlett-Packard (–46%), and Goldman Sachs Group (–34%).
Unfortunately, we were not able to avoid all laggards. Overweighted positions in CB Richard Ellis Group (–26%), Freeport-McMoRan Copper & Gold (–26%), and Eastman Chemical (–5%) directly lowered performance. Underweighting companies that were not positively identified by our model, such as Pfizer (+7%), Amazon.com (+38%), and Anadarko Petroleum (+11%), also detracted.
Vanguard Structured Broad Market Fund
The best-performing sectors in the fund were consumer staples (+13%), health care (+12%), and consumer discretionary (+10%). Materials (–13%), industrials (–9%), and financials (–7%) detracted.
At the individual stock level, the largest contributions came from overweighted positions in Apple (+34%), Starbucks (+48%), and Estée Lauder (+40%). In comparison with its benchmark, the fund benefited from underweighting or avoiding poorly performing stocks such as Bank of America (–53%), Citigroup (–34%), and Cisco Systems (–29%).
Overweighted positions in Talbots (–79%), Amerigroup (–8%), and Charles River Laboratories (–14%) directly lowered performance. Underweighting companies that were not positively identified by our model, such as Pfizer (+7%) and Coca-Cola (+19%) also detracted.
8
While we cannot predict how broad political and economic events will affect the markets, we are confident that the stock market can provide worthwhile returns for long-term investors. We believe that equity exposure continues to play an important role in a diversified investment plan. Within such a plan, we believe a portfolio of companies with lower relative price-to-earnings and cash-flow ratios, growth rates near that of the market, higher returns on equity, quality balance sheets, and positive market sentiment remains attractive.
We thank you for your investment and look forward to the coming year.
James D. Troyer, CFA
Principal and Portfolio Manager
James P. Stetler
Principal and Portfolio Manager
Vanguard Quantitative Equity Group
October 21, 2011
9
Structured Large-Cap Equity Fund
Fund Profile
As of September 30, 2011
| Share-Class Characteristics | ||
| Institutional | Institutional | |
| Shares | Plus Shares | |
| Ticker Symbol | VSLIX | VSLPX |
| Expense Ratio1 | 0.24% | 0.17% |
| 30-Day SEC Yield | 2.22% | 2.29% |
| Portfolio Characteristics | |||
| DJ | |||
| U.S. Total | |||
| S&P 500 | Market | ||
| Fund | Index | Index | |
| Number of Stocks | 156 | 500 | 3,717 |
| Median Market Cap | $43.4B | $45.5B | $28.7B |
| Price/Earnings Ratio | 11.6x | 12.9x | 13.6x |
| Price/Book Ratio | 2.0x | 1.9x | 1.9x |
| Return on Equity | 20.5% | 20.3% | 19.1% |
| Earnings Growth Rate | 7.3% | 7.4% | 7.3% |
| Dividend Yield | 2.5% | 2.4% | 2.2% |
| Foreign Holdings | 0.0% | 0.0% | 0.0% |
| Turnover Rate | 67% | — | — |
| Short-Term Reserves | 0.1% | — | — |
| Sector Diversification (% of equity exposure) | |||
| DJ | |||
| U.S. Total | |||
| S&P 500 | Market | ||
| Fund | Index | Index | |
| Consumer | |||
| Discretionary | 10.2% | 10.6% | 12.2% |
| Consumer Staples | 11.4 | 11.8 | 11.0 |
| Energy | 11.6 | 11.6 | 10.3 |
| Financials | 13.8 | 13.6 | 14.3 |
| Health Care | 12.9 | 12.1 | 11.7 |
| Industrials | 10.3 | 10.3 | 10.6 |
| Information | |||
| Technology | 19.2 | 19.4 | 19.4 |
| Materials | 3.3 | 3.3 | 4.0 |
| Telecommunication | |||
| Services | 3.7 | 3.3 | 2.8 |
| Utilities | 3.6 | 4.0 | 3.7 |
| Volatility Measures | ||
| DJ | ||
| U.S. Total | ||
| S&P 500 | Market | |
| Index | Index | |
| R-Squared | 1.00 | 0.99 |
| Beta | 0.98 | 0.95 |
These measures show the degree and timing of the fund’s fluctuations compared with the indexes over 36 months.
| Ten Largest Holdings (% of total net assets) | ||
| Exxon Mobil Corp. | Integrated Oil & | |
| Gas | 3.9% | |
| Apple Inc. | Computer | |
| Hardware | 3.9 | |
| International Business | IT Consulting & | |
| Machines Corp. | Other Services | 2.6 |
| Chevron Corp. | Integrated Oil & | |
| Gas | 2.3 | |
| AT&T Inc. | Integrated | |
| Telecommunication | ||
| Services | 2.1 | |
| Microsoft Corp. | Systems Software | 2.1 |
| General Electric Co. | Industrial | |
| Conglomerates | 2.0 | |
| Pfizer Inc. | Pharmaceuticals | 1.8 |
| Procter & Gamble Co. | Household | |
| Products | 1.7 | |
| JPMorgan Chase & Co. | Diversified Financial | |
| Services | 1.6 | |
| Top Ten | 24.0% | |
The holdings listed exclude any temporary cash investments and equity index products.
Investment Focus

1 The expense ratios shown are from the prospectus dated January 27, 2011. For the fiscal year ended September 30, 2011, the expense ratios were 0.24% for Institutional Shares and 0.17% for Institutional Plus Shares.
10
Structured Large-Cap Equity Fund
Performance Summary
All of the returns in this report represent past performance, which is not a guarantee of future results that may be achieved by the fund. (Current performance may be lower or higher than the performance data cited. For performance data current to the most recent month-end, visit our website at vanguard.com/performance.) Note, too, that both investment returns and principal value can fluctuate widely, so an investor’s shares, when sold, could be worth more or less than their original cost. The returns shown do not reflect taxes that a shareholder would pay on fund distributions or on the sale of fund shares.
Cumulative Performance: May 16, 2006, Through September 30, 2011
Initial Investment of $5,000,000

| Average Annual Total Returns | ||||
| Periods Ended September 30, 2011 | ||||
| Since | Final Value | |||
| One | Five | Inception | of a $5,000,000 | |
| Year | Years | (5/16/2006) | Investment | |
| Structured Large-Cap Equity Fund | ||||
| Institutional Shares | 4.14% | -1.64% | -0.75% | $4,801,759 |
| Dow Jones U.S. Total Stock Market | ||||
| Index | 0.31 | -0.57 | -0.02 | 4,995,081 |
| S&P 500 Index | 1.14 | -1.18 | -0.35 | 4,905,983 |
| Large-Cap Core Funds Average | -1.26 | -2.05 | -1.39 | 4,637,315 |
Large-Cap Core Funds Average: Derived from data provided by Lipper Inc.
"Since Inception" performance is calculated from the fund’s Institutional Shares’ inception date for both the fund and its comparative standards.
See Financial Highlights for dividend and capital gains information.
11
Structured Large-Cap Equity Fund
| Since | Final Value | |||
| One | Five | Inception | of a $200,000,000 | |
| Year | Years | (5/15/2006) | Investment | |
| Structured Large-Cap Equity Fund | ||||
| Institutional Plus Shares | 4.18% | -1.55% | -0.70% | $192,590,906 |
| Dow Jones U.S. Total Stock Market | ||||
| Index | 0.31 | -0.57 | -0.04 | 199,534,653 |
| S&P 500 Index | 1.14 | -1.18 | -0.39 | 195,874,917 |
| "Since Inception" performance is calculated from the Institutional Plus Shares’ inception date for both the fund and its comparative standards. | ||||
Fiscal-Year Total Returns (%): May 16, 2006, Through September 30, 2011

12
Structured Large-Cap Equity Fund
Financial Statements
Statement of Net Assets
As of September 30, 2011
The fund reports a complete list of its holdings in regulatory filings four times in each fiscal year, at the quarter-ends. For the second and fourth fiscal quarters, the lists appear in the fund’s semiannual and annual reports to shareholders. For the first and third fiscal quarters, the fund files the lists with the Securities and Exchange Commission on Form N-Q. Shareholders can look up the fund’s Forms N-Q on the SEC’s website at sec.gov. Forms N-Q may also be reviewed and copied at the SEC’s Public Reference Room (see the back cover of this report for further information).
| Market | |||
| Value | |||
| Shares | ($000) | ||
| Common Stocks (99.8%)1 | |||
| Consumer Discretionary (10.2%) | |||
| * | DIRECTV Class A | 77,600 | 3,279 |
| Starbucks Corp. | 85,225 | 3,178 | |
| Time Warner Cable Inc. | 44,500 | 2,789 | |
| * | priceline.com Inc. | 6,100 | 2,742 |
| Viacom Inc. Class B | 68,200 | 2,642 | |
| * | AutoZone Inc. | 8,260 | 2,636 |
| Macy’s Inc. | 99,500 | 2,619 | |
| VF Corp. | 21,450 | 2,607 | |
| Limited Brands Inc. | 64,918 | 2,500 | |
| Target Corp. | 48,600 | 2,383 | |
| CBS Corp. Class B | 114,090 | 2,325 | |
| Ross Stores Inc. | 27,800 | 2,188 | |
| Comcast Corp. | 105,425 | 2,181 | |
| Wynn Resorts Ltd. | 17,950 | 2,066 | |
| McDonald’s Corp. | 14,397 | 1,264 | |
| * | Amazon.com Inc. | 3,800 | 822 |
| * | Ford Motor Co. | 62,806 | 607 |
| Harley-Davidson Inc. | 17,000 | 584 | |
| News Corp. Class A | 17,800 | 275 | |
| Walt Disney Co. | 8,029 | 242 | |
| 39,929 | |||
| Consumer Staples (11.4%) | |||
| Procter & Gamble Co. | 104,694 | 6,614 | |
| Philip Morris | |||
| International Inc. | 98,136 | 6,122 | |
| Wal-Mart Stores Inc. | 80,746 | 4,191 | |
| Altria Group Inc. | 144,900 | 3,885 | |
| Colgate-Palmolive Co. | 43,500 | 3,858 | |
| Coca-Cola Co. | 53,940 | 3,644 | |
| Walgreen Co. | 88,000 | 2,894 | |
| Lorillard Inc. | 25,200 | 2,790 | |
| Reynolds American Inc. | 67,100 | 2,515 | |
| Coca-Cola Enterprises Inc. | 93,700 | 2,331 | |
| Kroger Co. | 104,400 | 2,293 | |
| PepsiCo Inc. | 24,992 | 1,547 | |
| Hershey Co. | 9,000 | 533 | |
| Market | |||
| Value | |||
| Shares | ($000) | ||
| * | Constellation Brands Inc. | ||
| Class A | 21,800 | 392 | |
| Whole Foods Market Inc. | 5,100 | 333 | |
| Dr Pepper Snapple Group Inc. | 8,200 | 318 | |
| Kraft Foods Inc. | 2,200 | 74 | |
| 44,334 | |||
| Energy (11.6%) | |||
| Exxon Mobil Corp. | 211,939 | 15,393 | |
| Chevron Corp. | 96,856 | 8,961 | |
| ConocoPhillips | 84,359 | 5,342 | |
| Occidental Petroleum Corp. | 31,901 | 2,281 | |
| National Oilwell Varco Inc. | 40,700 | 2,085 | |
| Anadarko Petroleum Corp. | 31,500 | 1,986 | |
| Marathon Petroleum Corp. | 70,100 | 1,897 | |
| Hess Corp. | 27,300 | 1,432 | |
| Schlumberger Ltd. | 23,025 | 1,375 | |
| Halliburton Co. | 42,400 | 1,294 | |
| * | Tesoro Corp. | 62,700 | 1,221 |
| Chesapeake Energy Corp. | 45,950 | 1,174 | |
| Helmerich & Payne Inc. | 17,840 | 724 | |
| 45,165 | |||
| Financials (13.8%) | |||
| JPMorgan Chase & Co. | 203,929 | 6,142 | |
| Wells Fargo & Co. | 248,235 | 5,987 | |
| US Bancorp | 163,024 | 3,838 | |
| American Express Co. | 78,600 | 3,529 | |
| Chubb Corp. | 46,643 | 2,798 | |
| Capital One Financial Corp. | 64,400 | 2,552 | |
| PNC Financial | |||
| Services Group Inc. | 52,800 | 2,544 | |
| Discover Financial Services | 106,050 | 2,433 | |
| Torchmark Corp. | 61,550 | 2,146 | |
| ACE Ltd. | 34,400 | 2,085 | |
| Moody’s Corp. | 67,100 | 2,043 | |
| * | NASDAQ OMX Group Inc. | 85,400 | 1,976 |
| Lincoln National Corp. | 118,300 | 1,849 | |
| Kimco Realty Corp. | 121,800 | 1,831 | |
| Ameriprise Financial Inc. | 46,500 | 1,830 | |
| Simon Property Group Inc. | 13,300 | 1,463 | |
13
Structured Large-Cap Equity Fund
| Market | |||
| Value | |||
| Shares | ($000) | ||
| Franklin Resources Inc. | 14,876 | 1,423 | |
| * | CB Richard Ellis Group Inc. | ||
| Class A | 99,300 | 1,337 | |
| * | Berkshire Hathaway Inc. | ||
| Class B | 18,205 | 1,293 | |
| * | Berkshire Hathaway Inc. | ||
| Class A | 11 | 1,175 | |
| Citigroup Inc. | 36,125 | 925 | |
| Bank of America Corp. | 105,953 | 648 | |
| Marsh & McLennan | |||
| Cos. Inc. | 22,000 | 584 | |
| Vornado Realty Trust | 6,800 | 507 | |
| Prudential Financial Inc. | 8,100 | 380 | |
| HCP Inc. | 8,300 | 291 | |
| Public Storage | 600 | 67 | |
| Goldman Sachs Group Inc. | 498 | 47 | |
| 53,723 | |||
| Health Care (12.9%) | |||
| Pfizer Inc. | 408,119 | 7,215 | |
| Johnson & Johnson | 84,446 | 5,380 | |
| Bristol-Myers Squibb Co. | 141,000 | 4,425 | |
| UnitedHealth Group Inc. | 88,154 | 4,066 | |
| Eli Lilly & Co. | 99,087 | 3,663 | |
| * | Biogen Idec Inc. | 31,700 | 2,953 |
| WellPoint Inc. | 42,500 | 2,774 | |
| Humana Inc. | 36,120 | 2,627 | |
| * | Watson Pharmaceuticals Inc. | 37,840 | 2,583 |
| AmerisourceBergen Corp. | |||
| Class A | 67,798 | 2,527 | |
| CIGNA Corp. | 59,000 | 2,474 | |
| * | Forest Laboratories Inc. | 73,250 | 2,255 |
| * | Agilent Technologies Inc. | 70,750 | 2,211 |
| McKesson Corp. | 29,400 | 2,137 | |
| Merck & Co. Inc. | 47,394 | 1,550 | |
| Abbott Laboratories | 15,068 | 771 | |
| Baxter International Inc. | 11,200 | 629 | |
| Aetna Inc. | 6,270 | 228 | |
| 50,468 | |||
| Industrials (10.2%) | |||
| General Electric Co. | 517,822 | 7,892 | |
| United Parcel Service Inc. | |||
| Class B | 65,621 | 4,144 | |
| Caterpillar Inc. | 47,000 | 3,470 | |
| Honeywell International Inc. | 72,200 | 3,170 | |
| CSX Corp. | 136,044 | 2,540 | |
| Northrop Grumman Corp. | 47,616 | 2,484 | |
| Cummins Inc. | 30,095 | 2,457 | |
| Eaton Corp. | 57,200 | 2,031 | |
| Parker Hannifin Corp. | 32,000 | 2,020 | |
| PACCAR Inc. | 54,900 | 1,857 | |
| Norfolk Southern Corp. | 28,800 | 1,757 | |
| General Dynamics Corp. | 20,700 | 1,178 | |
| Union Pacific Corp. | 9,500 | 776 | |
| WW Grainger Inc. | 5,100 | 763 | |
| Market | |||
| Value | |||
| Shares | ($000) | ||
| Rockwell Automation Inc. | 13,000 | 728 | |
| Dover Corp. | 15,000 | 699 | |
| United Technologies Corp. | 7,736 | 544 | |
| Tyco International Ltd. | 12,000 | 489 | |
| Iron Mountain Inc. | 14,400 | 455 | |
| Pitney Bowes Inc. | 22,400 | 421 | |
| 3M Co. | 1,613 | 116 | |
| 39,991 | |||
| Information Technology (19.1%) | |||
| * | Apple Inc. | 40,342 | 15,377 |
| International Business | |||
| Machines Corp. | 57,840 | 10,124 | |
| Microsoft Corp. | 333,441 | 8,299 | |
| Oracle Corp. | 213,488 | 6,135 | |
| Intel Corp. | 231,453 | 4,937 | |
| * | Google Inc. Class A | 9,405 | 4,838 |
| Accenture plc Class A | 60,800 | 3,203 | |
| * | Dell Inc. | 203,100 | 2,874 |
| Motorola Solutions Inc. | 63,050 | 2,642 | |
| Jabil Circuit Inc. | 132,500 | 2,357 | |
| * | Symantec Corp. | 128,700 | 2,098 |
| Western Union Co. | 133,900 | 2,047 | |
| * | Western Digital Corp. | 76,700 | 1,973 |
| * | Electronic Arts Inc. | 95,300 | 1,949 |
| * | LSI Corp. | 241,600 | 1,251 |
| Cisco Systems Inc. | 66,115 | 1,024 | |
| QUALCOMM Inc. | 18,757 | 912 | |
| * | Advanced Micro | ||
| Devices Inc. | 177,100 | 900 | |
| * | Teradata Corp. | 10,739 | 575 |
| * | Autodesk Inc. | 18,000 | 500 |
| * | NVIDIA Corp. | 27,500 | 344 |
| * | Motorola Mobility | ||
| Holdings Inc. | 7,756 | 293 | |
| 74,652 | |||
| Materials (3.3%) | |||
| EI du Pont | |||
| de Nemours & Co. | 67,663 | 2,704 | |
| Freeport-McMoRan | |||
| Copper & Gold Inc. | 81,100 | 2,470 | |
| PPG Industries Inc. | 31,900 | 2,254 | |
| Dow Chemical Co. | 92,300 | 2,073 | |
| CF Industries Holdings Inc. | 15,200 | 1,876 | |
| Eastman Chemical Co. | 24,200 | 1,658 | |
| 13,035 | |||
| Telecommunication Services (3.7%) | |||
| AT&T Inc. | 293,235 | 8,363 | |
| Verizon | |||
| Communications Inc. | 165,996 | 6,109 | |
| 14,472 | |||
| Utilities (3.6%) | |||
| Duke Energy Corp. | 159,600 | 3,191 | |
| CMS Energy Corp. | 125,238 | 2,479 | |
| Northeast Utilities | 72,700 | 2,446 | |
14
Structured Large-Cap Equity Fund
| Market | |||
| Value | |||
| Shares | ($000) | ||
| American Electric | |||
| Power Co. Inc. | 59,200 | 2,251 | |
| Pepco Holdings Inc. | 114,700 | 2,170 | |
| CenterPoint Energy Inc. | 68,500 | 1,344 | |
| Sempra Energy | 3,400 | 175 | |
| Public Service | |||
| Enterprise Group Inc. | 2,400 | 80 | |
| Entergy Corp. | 1,000 | 66 | |
| 14,202 | |||
| Total Common Stocks | |||
| (Cost $367,112) | 389,971 | ||
| Temporary Cash Investments (0.4%)1 | |||
| Money Market Fund (0.3%) | |||
| 2 | Vanguard Market Liquidity | ||
| Fund, 0.144% | 1,138,508 | 1,139 | |
| Face | |||
| Amount | |||
| ($000) | |||
| U.S. Government and Agency Obligations (0.1%) | |||
| 3,4 | Fannie Mae Discount | ||
| Notes, 0.050%, 12/5/11 | 100 | 100 | |
| 3,4 | Fannie Mae Discount | ||
| Notes, 0.045%, 12/7/11 | 100 | 100 | |
| 200 | |||
| Total Temporary Cash Investments | |||
| (Cost $1,339) | 1,339 | ||
| Total Investments (100.2%) | |||
| (Cost $368,451) | 391,310 | ||
| Other Assets and Liabilities (-0.2%) | |||
| Other Assets | 831 | ||
| Liabilities | (1,444) | ||
| (613) | |||
| Net Assets (100%) | 390,697 | ||
| At September 30, 2011, net assets consisted of: | |
| Amount | |
| ($000) | |
| Paid-in Capital | 575,598 |
| Undistributed Net Investment Income | 6,239 |
| Accumulated Net Realized Losses | (213,973) |
| Unrealized Appreciation (Depreciation) | |
| Investment Securities | 22,859 |
| Futures Contracts | (26) |
| Net Assets | 390,697 |
| Institutional Shares—Net Assets | |
| Applicable to 549,336 outstanding | |
| $.001 par value shares of beneficial | |
| interest (unlimited authorization) | 11,803 |
| Net Asset Value Per Share— | |
| Institutional Shares | $21.49 |
| Institutional Plus Shares—Net Assets | |
| Applicable to 8,920,216 outstanding | |
| $.001 par value shares of beneficial | |
| interest (unlimited authorization) | 378,894 |
| Net Asset Value Per Share— | |
| Institutional Plus Shares | $42.48 |
See Note A in Notes to Financial Statements.
* Non-income-producing security.
1 The fund invests a portion of its cash reserves in equity markets through the use of index futures contracts. After giving effect to futures investments, the fund’s effective common stock and temporary cash investment positions represent 100.1% and 0.1%, respectively, of net assets.
2 Affiliated money market fund available only to Vanguard funds and certain trusts and accounts managed by Vanguard. Rate shown is the 7-day yield.
3 The issuer operates under a congressional charter; its securities are not backed by the full faith and credit of the U.S. government.
4 Securities with a value of $200,000 have been segregated as initial margin for open futures contracts.
See accompanying Notes, which are an integral part of the Financial Statements.
15
Structured Large-Cap Equity Fund
| Statement of Operations | |
| Year Ended | |
| September 30, 2011 | |
| ($000) | |
| Investment Income | |
| Income | |
| Dividends | 10,494 |
| Interest1 | 2 |
| Security Lending | 1 |
| Total Income | 10,497 |
| Expenses | |
| The Vanguard Group—Note B | |
| Investment Advisory Services | 446 |
| Management and Administrative—Institutional Shares | 25 |
| Management and Administrative—Institutional Plus Shares | 196 |
| Marketing and Distribution—Institutional Shares | 10 |
| Marketing and Distribution—Institutional Plus Shares | 104 |
| Custodian Fees | 16 |
| Auditing Fees | 29 |
| Shareholders’ Reports—Institutional Shares | 2 |
| Shareholders’ Reports—Institutional Plus Shares | 5 |
| Trustees’ Fees and Expenses | 1 |
| Total Expenses | 834 |
| Net Investment Income | 9,663 |
| Realized Net Gain (Loss) | |
| Investment Securities Sold | 61,915 |
| Futures Contracts | 77 |
| Realized Net Gain (Loss) | 61,992 |
| Change in Unrealized Appreciation (Depreciation) | |
| Investment Securities | (32,979) |
| Futures Contracts | (55) |
| Change in Unrealized Appreciation (Depreciation) | (33,034) |
| Net Increase (Decrease) in Net Assets Resulting from Operations | 38,621 |
| 1 Interest income from an affiliated company of the fund was $1,000. | |
See accompanying Notes, which are an integral part of the Financial Statements.
16
Structured Large-Cap Equity Fund
| Statement of Changes in Net Assets | ||
| Year Ended September 30, | ||
| 2011 | 2010 | |
| ($000) | ($000) | |
| Increase (Decrease) in Net Assets | ||
| Operations | ||
| Net Investment Income | 9,663 | 11,816 |
| Realized Net Gain (Loss) | 61,992 | 6,608 |
| Change in Unrealized Appreciation (Depreciation) | (33,034) | 39,329 |
| Net Increase (Decrease) in Net Assets Resulting from Operations | 38,621 | 57,753 |
| Distributions | ||
| Net Investment Income | ||
| Institutional Shares | (183) | (2,024) |
| Institutional Plus Shares | (11,627) | (9,247) |
| Realized Capital Gain | ||
| Institutional Shares | — | — |
| Institutional Plus Shares | — | — |
| Total Distributions | (11,810) | (11,271) |
| Capital Share Transactions | ||
| Institutional Shares | (90,798) | (19,348) |
| Institutional Plus Shares | (210,058) | 64,445 |
| Net Increase (Decrease) from Capital Share Transactions | (300,856) | 45,097 |
| Total Increase (Decrease) | (274,045) | 91,579 |
| Net Assets | ||
| Beginning of Period | 664,742 | 573,163 |
| End of Period1 | 390,697 | 664,742 |
| 1 Net Assets—End of Period includes undistributed net investment income of $6,239,000 and $8,386,000. | ||
See accompanying Notes, which are an integral part of the Financial Statements.
17
Structured Large-Cap Equity Fund
Financial Highlights
| Institutional Shares | |||||
| For a Share Outstanding | Year Ended September 30, | ||||
| Throughout Each Period | 2011 | 2010 | 2009 | 2008 | 2007 |
| Net Asset Value, Beginning of Period | $20.97 | $19.47 | $22.56 | $29.98 | $26.03 |
| Investment Operations | |||||
| Net Investment Income | .4281 | .366 | .546 | .492 | .4761 |
| Net Realized and Unrealized Gain (Loss) | |||||
| on Investments | .458 | 1.505 | (2.993) | (7.091) | 3.657 |
| Total from Investment Operations | .886 | 1.871 | (2.447) | (6.599) | 4.133 |
| Distributions | |||||
| Dividends from Net Investment Income | (.366) | (.371) | (.643) | (.430) | (.172) |
| Distributions from Realized Capital Gains | — | — | — | (.391) | (.011) |
| Total Distributions | (.366) | (.371) | (.643) | (.821) | (.183) |
| Net Asset Value, End of Period | $21.49 | $20.97 | $19.47 | $22.56 | $29.98 |
| Total Return | 4.14% | 9.68% | -10.25% | -22.52% | 15.94% |
| Ratios/Supplemental Data | |||||
| Net Assets, End of Period (Millions) | $12 | $95 | $106 | $135 | $187 |
| Ratio of Total Expenses to | |||||
| Average Net Assets | 0.24% | 0.24% | 0.25% | 0.20% | 0.25% |
| Ratio of Net Investment Income to | |||||
| Average Net Assets | 1.95% | 1.86% | 2.33% | 1.91% | 1.69% |
| Portfolio Turnover Rate | 67% | 61% | 80%2 | 72% | 54%2 |
1 Calculated based on average shares outstanding.
2 Excludes the value of portfolio securities received or delivered as a result of in-kind purchases or redemptions of the fund’s capital shares.
See accompanying Notes, which are an integral part of the Financial Statements.
18
Structured Large-Cap Equity Fund
Financial Highlights
| Institutional Plus Shares | |||||
| For a Share Outstanding | Year Ended September 30, | ||||
| Throughout Each Period | 2011 | 2010 | 2009 | 2008 | 2007 |
| Net Asset Value, Beginning of Period | $41.98 | $38.97 | $45.15 | $60.02 | $52.07 |
| Investment Operations | |||||
| Net Investment Income | .9101 | .768 | 1.116 | 1.025 | 1.0181 |
| Net Realized and Unrealized Gain (Loss) | |||||
| on Investments | .906 | 3.014 | (5.980) | (14.193) | 7.317 |
| Total from Investment Operations | 1.816 | 3.782 | (4.864) | (13.168) | 8.335 |
| Distributions | |||||
| Dividends from Net Investment Income | (1.316) | (.772) | (1.316) | (.920) | (.363) |
| Distributions from Realized Capital Gains | — | — | — | (.782) | (.022) |
| Total Distributions | (1.316) | (.772) | (1.316) | (1.702) | (.385) |
| Net Asset Value, End of Period | $42.48 | $41.98 | $38.97 | $45.15 | $60.02 |
| Total Return | 4.18% | 9.78% | -10.16% | -22.46% | 16.07% |
| Ratios/Supplemental Data | |||||
| Net Assets, End of Period (Millions) | $379 | $570 | $467 | $677 | $819 |
| Ratio of Total Expenses to | |||||
| Average Net Assets | 0.17% | 0.17% | 0.17% | 0.12% | 0.15% |
| Ratio of Net Investment Income to | |||||
| Average Net Assets | 2.02% | 1.93% | 2.41% | 1.99% | 1.79% |
| Portfolio Turnover Rate | 67% | 61% | 80%2 | 72% | 54%2 |
1 Calculated based on average shares outstanding.
2 Excludes the value of portfolio securities received or delivered as a result of in-kind purchases or redemptions of the fund’s capital shares.
See accompanying Notes, which are an integral part of the Financial Statements.
19
Structured Large-Cap Equity Fund
Notes to Financial Statements
Vanguard Structured Large-Cap Equity Fund is registered under the Investment Company Act of 1940 as an open-end investment company, or mutual fund. The fund offers two classes of shares: Institutional Shares and Institutional Plus Shares. Institutional Shares and Institutional Plus Shares are designed for investors who meet certain administrative, service, and account-size criteria.
A. The following significant accounting policies conform to generally accepted accounting principles for U.S. mutual funds. The fund consistently follows such policies in preparing its financial statements.
1. Security Valuation: Securities are valued as of the close of trading on the New York Stock Exchange (generally 4 p.m., Eastern time) on the valuation date. Equity securities are valued at the latest quoted sales prices or official closing prices taken from the primary market in which each security trades; such securities not traded on the valuation date are valued at the mean of the latest quoted bid and asked prices. Securities for which market quotations are not readily available, or whose values have been materially affected by events occurring before the fund’s pricing time but after the close of the securities’ primary markets, are valued by methods deemed by the board of trustees to represent fair value. Investments in Vanguard Market Liquidity Fund are valued at that fund’s net asset value. Temporary cash investments acquired over 60 days to maturity are valued using the latest bid prices or using valuations based on a matrix system (which considers such factors as security prices, yields, maturities, and ratings), both as furnished by independent pricing services. Other temporary cash investments are valued at amortized cost, which approximates market value.
2. Futures Contracts: The fund uses index futures contracts to a limited extent, with the objective of maintaining full exposure to the stock market while maintaining liquidity. The fund may purchase or sell futures contracts to achieve a desired level of investment, whether to accommodate portfolio turnover or cash flows from capital share transactions. The primary risks associated with the use of futures contracts are imperfect correlation between changes in market values of stocks held by the fund and the prices of futures contracts, and the possibility of an illiquid market.
Futures contracts are valued at their quoted daily settlement prices. The aggregate principal amounts of the contracts are not recorded in the Statement of Net Assets. Fluctuations in the value of the contracts are recorded in the Statements of Net Assets as an asset (liability) and in the Statement of Operations as unrealized appreciation (depreciation) until the contracts are closed, when they are recorded as realized futures gains (losses).
3. Federal Income Taxes: The fund intends to continue to qualify as a regulated investment company and distribute all of its taxable income. Management has analyzed the fund’s tax positions taken for all open federal income tax years (September 30, 2008–2011), and has concluded that no provision for federal income tax is required in the fund’s financial statements.
4. Distributions: Distributions to shareholders are recorded on the ex-dividend date.
5. Security Lending: The fund may lend its securities to qualified institutional borrowers to earn additional income. Security loans are required to be secured at all times by collateral at least equal to the market value of securities loaned. The fund invests cash collateral received in Vanguard Market Liquidity Fund, and records a liability for the return of the collateral, during the period the securities are on loan. Security lending income represents fees charged to borrowers plus income earned on investing cash collateral, less expenses associated with the loan.
6. Other: Dividend income is recorded on the ex-dividend date. Interest income includes income distributions received from Vanguard Market Liquidity Fund and is accrued daily. Security transactions are accounted for on the date securities are bought or sold. Costs used to determine realized gains (losses) on the sale of investment securities are those of the specific securities sold.
20
Structured Large-Cap Equity Fund
Each class of shares has equal rights as to assets and earnings, except that each class separately bears certain class-specific expenses related to maintenance of shareholder accounts (included in Management and Administrative expenses) and shareholder reporting. Marketing and distribution expenses are allocated to each class of shares based on a method approved by the board of trustees. Income, other non-class-specific expenses, and gains and losses on investments are allocated to each class of shares based on its relative net assets.
B. The Vanguard Group furnishes at cost investment advisory, corporate management, administrative, marketing, and distribution services. The costs of such services are allocated to the fund under methods approved by the board of trustees. The fund has committed to provide up to 0.40% of its net assets in capital contributions to Vanguard. At September 30, 2011, the fund had contributed capital of $69,000 to Vanguard (included in Other Assets), representing 0.02% of the fund’s net assets and 0.03% of Vanguard’s capitalization. The fund’s trustees and officers are also directors and officers of Vanguard.
C. Various inputs may be used to determine the value of the fund’s investments. These inputs are summarized in three broad levels for financial statement purposes. The inputs or methodologies used to value securities are not necessarily an indication of the risk associated with investing in those securities.
Level 1—Quoted prices in active markets for identical securities.
Level 2—Other significant observable inputs (including quoted prices for similar securities, interest rates, prepayment speeds, credit risk, etc.).
Level 3—Significant unobservable inputs (including the fund’s own assumptions used to determine the fair value of investments).
The following table summarizes the fund’s investments as of September 30, 2011, based on the inputs used to value them:
| Level 1 | Level 2 | Level 3 | |
| Investments | ($000) | ($000) | ($000) |
| Common Stocks | 389,971 | — | — |
| Temporary Cash Investments | 1,139 | 200 | — |
| Futures Contracts—Liabilities1 | (26) | — | — |
| Total | 391,084 | 200 | — |
| 1 Represents variation margin on the last day of the reporting period. |
D. At September 30, 2011, the aggregate settlement value of open futures contracts and the related unrealized appreciation (depreciation) were:
| ($000) | ||||
| Aggregate | ||||
| Number of | Settlement | Unrealized | ||
| Long (Short) | Value | Appreciation | ||
| Futures Contracts | Expiration | Contracts | Long (Short) | (Depreciation) |
| S&P 500 Index | December 2011 | 3 | 845 | (23) |
| E-mini S&P 500 Index | December 2011 | 2 | 113 | (3) |
Unrealized appreciation (depreciation) on open futures contracts is required to be treated as realized gain (loss) for tax purposes.
21
Structured Large-Cap Equity Fund
E. Distributions are determined on a tax basis and may differ from net investment income and realized capital gains for financial reporting purposes. Differences may be permanent or temporary. Permanent differences are reclassified among capital accounts in the financial statements to reflect their tax character. Temporary differences arise when certain items of income, expense, gain, or loss are recognized in different periods for financial statement and tax purposes; these differences will reverse at some time in the future. Differences in classification may also result from the treatment of short-term gains as ordinary income for tax purposes.
For tax purposes, at September 30, 2011, the fund had $6,761,000 of ordinary income available for distribution. The fund had available capital loss carryforwards totaling $213,911,000 to offset future net capital gains of $101,200,000 through September 30, 2017, and $112,711,000 through September 30, 2018.
At September 30, 2011, the cost of investment securities for tax purposes was $368,548,000. Net unrealized appreciation of investment securities for tax purposes was $22,762,000, consisting of unrealized gains of $52,734,000 on securities that had risen in value since their purchase and $29,972,000 in unrealized losses on securities that had fallen in value since their purchase.
F. During the year ended September 30, 2011, the fund purchased $327,874,000 of investment securities and sold $629,672,000 of investment securities, other than temporary cash investments.
G. Capital share transactions for each class of shares were:
| Year Ended September 30, | ||||
| 2011 | 2010 | |||
| Amount | Shares | Amount | Shares | |
| ($000) | (000) | ($000) | (000) | |
| Institutional Shares | ||||
| Issued | 1,694 | 73 | 1,649 | 41 |
| Issued in Lieu of Cash Distributions | — | — | 343 | 17 |
| Redeemed | (92,492) | (4,062) | (21,340) | (986) |
| Net Increase (Decrease)—Institutional Shares | (90,798) | (3,989) | (19,348) | (928) |
| Institutional Plus Shares | ||||
| Issued | — | — | 59,610 | 1,471 |
| Issued in Lieu of Cash Distributions | 3,795 | 85 | 4,835 | 120 |
| Redeemed | (213,853) | (4,734) | — | — |
| Net Increase (Decrease)—Institutional Plus Shares | (210,058) | (4,649) | 64,445 | 1,591 |
At September 30, 2011, two shareholders were each a record or beneficial owner of 32% or more of the fund’s net assets, with a combined ownership of 97%. If one or more of these shareholders were to redeem their total investment in the fund, the redemption might result in an increase in the fund’s expense ratio, cause the fund to incur higher transaction costs, or result in the realization of taxable capital gains.
H. In preparing the financial statements as of September 30, 2011, management considered the impact of subsequent events for potential recognition or disclosure in these financial statements.
22
Structured Broad Market Fund
Fund Profile
As of September 30, 2011
| Share-Class Characteristics | ||
| Institutional | Institutional | |
| Shares | Plus Shares | |
| Ticker Symbol | VSBMX | VSBPX |
| Expense Ratio1 | 0.24% | 0.17% |
| 30-Day SEC Yield | 2.07% | 2.14% |
| Portfolio Characteristics | |||
| DJ | |||
| Russell | U.S. Total | ||
| 3000 | Market | ||
| Fund | Index | Index | |
| Number of Stocks | 228 | 2,938 | 3,717 |
| Median Market Cap | $21.2B | $28.4B | $28.7B |
| Price/Earnings Ratio | 11.3x | 13.5x | 13.6x |
| Price/Book Ratio | 2.0x | 1.9x | 1.9x |
| Return on Equity | 19.0% | 18.7% | 19.1% |
| Earnings Growth Rate | 8.5% | 7.1% | 7.3% |
| Dividend Yield | 2.3% | 2.2% | 2.2% |
| Foreign Holdings | 0.2% | 0.0% | 0.0% |
| Turnover Rate | 56% | — | — |
| Short-Term Reserves | 0.0% | — | — |
| Sector Diversification (% of equity exposure) | |||
| DJ | |||
| Russell | U.S. Total | ||
| 3000 | Market | ||
| Fund | Index | Index | |
| Consumer | |||
| Discretionary | 11.6% | 11.6% | 12.2% |
| Consumer Staples | 9.8 | 10.2 | 11.0 |
| Energy | 10.9 | 10.7 | 10.3 |
| Financials | 14.8 | 14.7 | 14.3 |
| Health Care | 13.0 | 12.2 | 11.7 |
| Industrials | 9.9 | 10.8 | 10.6 |
| Information | |||
| Technology | 18.1 | 18.8 | 19.4 |
| Materials | 4.1 | 3.9 | 4.0 |
| Telecommunication | |||
| Services | 3.3 | 3.0 | 2.8 |
| Utilities | 4.5 | 4.1 | 3.7 |
| Volatility Measures | ||
| DJ | ||
| U.S. Total | ||
| Russell 3000 | Market | |
| Index | Index | |
| R-Squared | 0.99 | 0.99 |
| Beta | 0.98 | 0.99 |
These measures show the degree and timing of the fund’s fluctuations compared with the indexes over 36 months.
| Ten Largest Holdings (% of total net assets) | ||
| Apple Inc. | Computer | |
| Hardware | 3.3% | |
| Exxon Mobil Corp. | Integrated Oil & | |
| Gas | 3.3 | |
| International Business | IT Consulting & | |
| Machines Corp. | Other Services | 2.3 |
| Chevron Corp. | Integrated Oil & | |
| Gas | 2.0 | |
| Microsoft Corp. | Systems Software | 2.0 |
| AT&T Inc. | Integrated | |
| Telecommunication | ||
| Services | 1.9 | |
| Pfizer Inc. | Pharmaceuticals | 1.6 |
| General Electric Co. | Industrial | |
| Conglomerates | 1.5 | |
| Verizon Communications | Integrated | |
| Inc. | Telecommunication | |
| Services | 1.4 | |
| Philip Morris | ||
| International Inc. | Tobacco | 1.4 |
| Top Ten | 20.7% | |
The holdings listed exclude any temporary cash investments and equity index products.
Investment Focus

1 The expense ratios shown are from the prospectus dated January 27, 2011. For the fiscal year ended September 30, 2011, the expense ratios were 0.24% for Institutional Shares and 0.17% for Institutional Plus Shares.
23
Structured Broad Market Fund
Performance Summary
All of the returns in this report represent past performance, which is not a guarantee of future results that may be achieved by the fund. (Current performance may be lower or higher than the performance data cited. For performance data current to the most recent month-end, visit our website at vanguard.com/performance.) Note, too, that both investment returns and principal value can fluctuate widely, so an investor’s shares, when sold, could be worth more or less than their original cost. The returns shown do not reflect taxes that a shareholder would pay on fund distributions or on the sale of fund shares.
Cumulative Performance: November 30, 2006, Through September 30, 2011
Initial Investment of $5,000,000
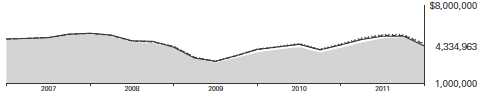
| Average Annual Total Returns | |||
| Periods Ended September 30, 2011 | |||
| Since | Final Value | ||
| One | Inception | of a $5,000,000 | |
| Year | (11/30/2006) | Investment | |
| Structured Broad Market Fund | |||
| Institutional Shares | 3.37% | -2.91% | $4,334,963 |
| Dow Jones U.S. Total Stock Market | |||
| Index | 0.31 | -1.80 | 4,579,047 |
| Russell 3000 Index | 0.55 | -2.11 | 4,509,849 |
| Multi-Cap Core Funds Average | -2.39 | -2.80 | 4,358,864 |
Multi-Cap Core Funds Average: Derived from data provided by Lipper Inc.
"Since Inception" performance is calculated from the fund’s Institutional Shares’ inception date for both the fund and its comparative standards.
See Financial Highlights for dividend and capital gains information.
24
Structured Broad Market Fund
| Since | Final Value | |||
| One | Five | Inception | of a $200,000,000 | |
| Year | Years | (5/3/2004) | Investment | |
| Structured Broad Market Fund | ||||
| Institutional Plus Shares | 3.43% | -1.59% | 2.40% | $238,367,882 |
| Dow Jones U.S. Total Stock Market | ||||
| Index | 0.31 | -0.57 | 2.95 | 248,009,612 |
| Russell 3000 Index | 0.55 | -0.92 | 2.63 | 242,481,412 |
"Since Inception" performance is calculated from the Institutional Plus Shares’ inception date for both the fund and its comparative standards.
The fund commenced operations as a registered investment company on October 3, 2006. The fund's performance includes the performance of a predecessor trust, Vanguard Fiduciary Trust Company Structured Broad Market Trust, from May 3, 2004, to October 3, 2006.
Fiscal-Year Total Returns (%): November 30, 2006, Through September 30, 2011
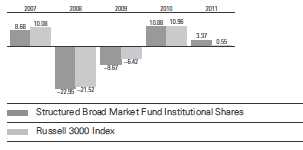
25
Structured Broad Market Fund
Financial Statements
Statement of Net Assets
As of September 30, 2011
The fund reports a complete list of its holdings in regulatory filings four times in each fiscal year, at the quarter-ends. For the second and fourth fiscal quarters, the lists appear in the fund’s semiannual and annual reports to shareholders. For the first and third fiscal quarters, the fund files the lists with the Securities and Exchange Commission on Form N-Q. Shareholders can look up the fund’s Forms N-Q on the SEC’s website at sec.gov. Forms N-Q may also be reviewed and copied at the SEC’s Public Reference Room (see the back cover of this report for further information).
| Market | |||
| Value | |||
| Shares | ($000) | ||
| Common Stocks (99.5%)1 | |||
| Consumer Discretionary (11.6%) | |||
| Starbucks Corp. | 62,400 | 2,327 | |
| Time Warner Cable Inc. | 31,962 | 2,003 | |
| * | AutoZone Inc. | 6,000 | 1,915 |
| Limited Brands Inc. | 48,850 | 1,881 | |
| Viacom Inc. Class B | 47,895 | 1,855 | |
| Macy’s Inc. | 69,100 | 1,819 | |
| * | priceline.com Inc. | 4,000 | 1,798 |
| CBS Corp. Class B | 87,000 | 1,773 | |
| * | DISH Network Corp. Class A | 68,500 | 1,717 |
| Polaris Industries Inc. | 33,700 | 1,684 | |
| Dillard’s Inc. Class A | 33,300 | 1,448 | |
| Ross Stores Inc. | 17,900 | 1,409 | |
| Wynn Resorts Ltd. | 11,900 | 1,369 | |
| Weight Watchers | |||
| International Inc. | 21,800 | 1,270 | |
| Brinker International Inc. | 60,000 | 1,255 | |
| Williams-Sonoma Inc. | 36,682 | 1,129 | |
| * | Tempur-Pedic | ||
| International Inc. | 21,400 | 1,126 | |
| * | Ford Motor Co. | 96,462 | 933 |
| Advance Auto Parts Inc. | 15,800 | 918 | |
| VF Corp. | 7,400 | 899 | |
| * | Las Vegas Sands Corp. | 22,900 | 878 |
| Comcast Corp. Class A | 29,291 | 612 | |
| Foot Locker Inc. | 27,200 | 546 | |
| McDonald’s Corp. | 5,911 | 519 | |
| * | TRW Automotive | ||
| Holdings Corp. | 12,663 | 415 | |
| * | Warnaco Group Inc. | 7,700 | 355 |
| Virgin Media Inc. | 8,500 | 207 | |
| * | Amazon.com Inc. | 900 | 195 |
| 34,255 | |||
| Consumer Staples (9.8%) | |||
| Philip Morris | |||
| International Inc. | 66,350 | 4,139 | |
| Procter & Gamble Co. | 45,551 | 2,878 | |
| Wal-Mart Stores Inc. | 52,265 | 2,712 | |
| Market | |||
| Value | |||
| Shares | ($000) | ||
| Walgreen Co. | 63,600 | 2,092 | |
| Hershey Co. | 32,900 | 1,949 | |
| Lorillard Inc. | 17,300 | 1,915 | |
| Coca-Cola Enterprises Inc. | 69,800 | 1,737 | |
| Dr Pepper Snapple | |||
| Group Inc. | 41,400 | 1,605 | |
| * | Constellation Brands Inc. | ||
| Class A | 86,300 | 1,553 | |
| Coca-Cola Co. | 21,990 | 1,486 | |
| Kroger Co. | 64,900 | 1,425 | |
| Estee Lauder Cos. Inc. | |||
| Class A | 12,000 | 1,054 | |
| Colgate-Palmolive Co. | 8,430 | 748 | |
| B&G Foods Inc. Class A | 39,000 | 650 | |
| PepsiCo Inc. | 9,900 | 613 | |
| Herbalife Ltd. | 10,600 | 568 | |
| * | Smithfield Foods Inc. | 28,100 | 548 |
| Tyson Foods Inc. Class A | 25,100 | 436 | |
| ConAgra Foods Inc. | 11,100 | 269 | |
| Hormel Foods Corp. | 9,000 | 243 | |
| Nu Skin Enterprises Inc. | |||
| Class A | 5,800 | 235 | |
| Church & Dwight Co. Inc. | 700 | 31 | |
| 28,886 | |||
| Energy (10.8%) | |||
| Exxon Mobil Corp. | 135,320 | 9,828 | |
| Chevron Corp. | 63,865 | 5,909 | |
| ConocoPhillips | 59,200 | 3,749 | |
| Apache Corp. | 21,540 | 1,728 | |
| National Oilwell Varco Inc. | 33,700 | 1,726 | |
| Occidental Petroleum Corp. | 24,040 | 1,719 | |
| Chesapeake Energy Corp. | 55,600 | 1,421 | |
| Hess Corp. | 20,900 | 1,096 | |
| Marathon Oil Corp. | 50,800 | 1,096 | |
| Devon Energy Corp. | 17,400 | 965 | |
| Valero Energy Corp. | 36,100 | 642 | |
| Schlumberger Ltd. | 10,300 | 615 | |
| El Paso Corp. | 19,700 | 344 | |
| Marathon Petroleum Corp. | 11,900 | 322 | |
| * | Newfield Exploration Co. | 7,400 | 294 |
26
Structured Broad Market Fund
| Market | |||
| Value | |||
| Shares | ($000) | ||
| Pioneer Natural | |||
| Resources Co. | 3,100 | 204 | |
| * | Tesoro Corp. | 7,800 | 152 |
| HollyFrontier Corp. | 4,200 | 110 | |
| 31,920 | |||
| Financials (14.7%) | |||
| JPMorgan Chase & Co. | 133,536 | 4,022 | |
| US Bancorp | 115,250 | 2,713 | |
| American Express Co. | 52,320 | 2,349 | |
| Chubb Corp. | 34,270 | 2,056 | |
| PNC Financial | |||
| Services Group Inc. | 41,000 | 1,976 | |
| * | Arch Capital Group Ltd. | 54,500 | 1,781 |
| Capital One Financial Corp. | 43,200 | 1,712 | |
| Moody’s Corp. | 50,600 | 1,541 | |
| Torchmark Corp. | 43,200 | 1,506 | |
| * | Berkshire Hathaway Inc. | ||
| Class B | 17,500 | 1,243 | |
| Wells Fargo & Co. | 51,370 | 1,239 | |
| * | World Acceptance Corp. | 21,956 | 1,228 |
| Aflac Inc. | 34,640 | 1,211 | |
| Discover Financial Services | 52,200 | 1,198 | |
| Allied World Assurance Co. | |||
| Holdings AG | 20,341 | 1,093 | |
| Reinsurance Group of | |||
| America Inc. Class A | 22,800 | 1,048 | |
| Ameriprise Financial Inc. | 26,000 | 1,023 | |
| KeyCorp | 168,200 | 997 | |
| Public Storage | 8,300 | 924 | |
| Vornado Realty Trust | 11,100 | 828 | |
| Franklin Resources Inc. | 7,970 | 762 | |
| Taubman Centers Inc. | 14,800 | 745 | |
| M&T Bank Corp. | 10,500 | 734 | |
| Rayonier Inc. | 18,600 | 684 | |
| Hospitality Properties Trust | 31,500 | 669 | |
| Sun Communities Inc. | 18,900 | 665 | |
| American Financial | |||
| Group Inc. | 21,300 | 662 | |
| Camden Property Trust | 11,400 | 630 | |
| CBL & Associates | |||
| Properties Inc. | 51,500 | 585 | |
| BOK Financial Corp. | 12,200 | 572 | |
| * | Credit Acceptance Corp. | 8,800 | 566 |
| Lexington Realty Trust | 78,600 | 514 | |
| * | Forest City Enterprises Inc. | ||
| Class A | 47,100 | 502 | |
| Nelnet Inc. Class A | 26,700 | 501 | |
| Commerce Bancshares Inc. | 14,200 | 494 | |
| * | NASDAQ OMX Group Inc. | 19,300 | 447 |
| Cash America | |||
| International Inc. | 8,600 | 440 | |
| Citigroup Inc. | 16,000 | 410 | |
| * | CB Richard Ellis Group Inc. | ||
| Class A | 25,100 | 338 | |
| Potlatch Corp. | 10,000 | 315 | |
| Market | |||
| Value | |||
| Shares | ($000) | ||
| Ashford Hospitality Trust Inc. | 28,300 | 199 | |
| NYSE Euronext | 5,900 | 137 | |
| Marsh & McLennan Cos. Inc. | 5,100 | 135 | |
| Bank of America Corp. | 18,645 | 114 | |
| National Retail Properties Inc. | 4,100 | 110 | |
| Simon Property Group Inc. | 300 | 33 | |
| 43,651 | |||
| Health Care (12.9%) | |||
| Pfizer Inc. | 265,764 | 4,699 | |
| Bristol-Myers Squibb Co. | 95,052 | 2,983 | |
| UnitedHealth Group Inc. | 61,475 | 2,835 | |
| Eli Lilly & Co. | 70,920 | 2,622 | |
| Johnson & Johnson | 37,807 | 2,409 | |
| Abbott Laboratories | 44,600 | 2,281 | |
| * | Biogen Idec Inc. | 23,400 | 2,180 |
| McKesson Corp. | 29,000 | 2,108 | |
| AmerisourceBergen Corp. | |||
| Class A | 52,300 | 1,949 | |
| Humana Inc. | 26,450 | 1,924 | |
| * | Forest Laboratories Inc. | 56,000 | 1,724 |
| Aetna Inc. | 41,700 | 1,516 | |
| * | Agilent Technologies Inc. | 46,500 | 1,453 |
| * | Charles River Laboratories | ||
| International Inc. | 42,600 | 1,219 | |
| CIGNA Corp. | 28,100 | 1,179 | |
| Cooper Cos. Inc. | 12,700 | 1,005 | |
| Cardinal Health Inc. | 21,400 | 896 | |
| * | Express Scripts Inc. | 20,700 | 767 |
| * | Watson Pharmaceuticals Inc. | 10,000 | 682 |
| Merck & Co. Inc. | 18,483 | 605 | |
| WellPoint Inc. | 5,000 | 326 | |
| * | Mettler-Toledo | ||
| International Inc. | 2,100 | 294 | |
| * | Health Management | ||
| Associates Inc. Class A | 20,000 | 138 | |
| * | Cephalon Inc. | 1,700 | 137 |
| * | Waters Corp. | 1,800 | 136 |
| * | Par Pharmaceutical Cos. Inc. | 1,800 | 48 |
| 38,115 | |||
| Industrials (9.9%) | |||
| General Electric Co. | 286,380 | 4,364 | |
| Caterpillar Inc. | 32,200 | 2,378 | |
| Norfolk Southern Corp. | 31,800 | 1,940 | |
| CSX Corp. | 92,711 | 1,731 | |
| Northrop Grumman Corp. | 32,630 | 1,702 | |
| Cummins Inc. | 20,800 | 1,699 | |
| Parker Hannifin Corp. | 24,200 | 1,528 | |
| Eaton Corp. | 42,200 | 1,498 | |
| PACCAR Inc. | 41,500 | 1,404 | |
| Joy Global Inc. | 20,800 | 1,297 | |
| FedEx Corp. | 19,000 | 1,286 | |
| * | Sauer-Danfoss Inc. | 42,100 | 1,217 |
| United Technologies Corp. | 14,140 | 995 | |
| Timken Co. | 30,100 | 988 | |
27
Structured Broad Market Fund
| Market | |||
| Value | |||
| Shares | ($000) | ||
| Dover Corp. | 18,600 | 867 | |
| * | AGCO Corp. | 21,000 | 726 |
| Honeywell International Inc. | 14,524 | 638 | |
| L-3 Communications | |||
| Holdings Inc. | 9,700 | 601 | |
| Rockwell Automation Inc. | 10,400 | 582 | |
| Waste Connections Inc. | 17,200 | 582 | |
| Towers Watson & Co. | |||
| Class A | 8,500 | 508 | |
| Pitney Bowes Inc. | 14,300 | 269 | |
| Deluxe Corp. | 7,100 | 132 | |
| Cintas Corp. | 3,000 | 84 | |
| Albany International Corp. | 4,200 | 77 | |
| * | Amerco Inc. | 600 | 37 |
| * | Dollar Thrifty Automotive | ||
| Group Inc. | 660 | 37 | |
| 29,167 | |||
| Information Technology (17.9%) | |||
| * | Apple Inc. | 25,820 | 9,842 |
| International Business | |||
| Machines Corp. | 38,242 | 6,693 | |
| Microsoft Corp. | 235,897 | 5,871 | |
| Oracle Corp. | 92,248 | 2,651 | |
| Accenture plc Class A | 45,800 | 2,413 | |
| * | Dell Inc. | 145,700 | 2,062 |
| Motorola Solutions Inc. | 46,700 | 1,957 | |
| * | Intuit Inc. | 37,900 | 1,798 |
| * | IAC/InterActiveCorp | 44,100 | 1,744 |
| * | VMware Inc. Class A | 21,200 | 1,704 |
| * | NVIDIA Corp. | 121,100 | 1,514 |
| * | Google Inc. Class A | 2,720 | 1,399 |
| Western Union Co. | 86,600 | 1,324 | |
| Anixter International Inc. | 27,900 | 1,323 | |
| Hewlett-Packard Co. | 57,099 | 1,282 | |
| Intel Corp. | 50,790 | 1,083 | |
| MKS Instruments Inc. | 36,300 | 788 | |
| KLA-Tencor Corp. | 19,900 | 762 | |
| Opnet Technologies Inc. | 21,000 | 733 | |
| Jabil Circuit Inc. | 38,200 | 680 | |
| * | LSI Corp. | 121,800 | 631 |
| * | Vishay Intertechnology Inc. | 72,800 | 609 |
| * | Electronic Arts Inc. | 27,600 | 564 |
| * | Novellus Systems Inc. | 17,700 | 482 |
| * | NCR Corp. | 24,000 | 405 |
| * | Fairchild Semiconductor | ||
| International Inc. Class A | 36,000 | 389 | |
| * | Advanced Micro | ||
| Devices Inc. | 66,500 | 338 | |
| * | Autodesk Inc. | 12,000 | 333 |
| Cisco Systems Inc. | 18,350 | 284 | |
| * | Ancestry.com Inc. | 10,900 | 256 |
| Altera Corp. | 7,600 | 240 | |
| Market | |||
| Value | |||
| Shares | ($000) | ||
| * | Motorola Mobility | ||
| Holdings Inc. | 6,037 | 228 | |
| QUALCOMM Inc. | 4,600 | 224 | |
| * | Veeco Instruments Inc. | 7,200 | 176 |
| MAXIMUS Inc. | 3,400 | 119 | |
| * | Teradyne Inc. | 8,500 | 94 |
| 52,995 | |||
| Materials (4.1%) | |||
| EI du Pont de | |||
| Nemours & Co. | 55,980 | 2,238 | |
| Freeport-McMoRan | |||
| Copper & Gold Inc. | 58,900 | 1,793 | |
| CF Industries Holdings Inc. | 10,300 | 1,271 | |
| Eastman Chemical Co. | 18,500 | 1,268 | |
| Ashland Inc. | 24,000 | 1,059 | |
| Ball Corp. | 26,200 | 813 | |
| International Paper Co. | 30,600 | 711 | |
| Southern Copper Corp. | 28,200 | 705 | |
| Dow Chemical Co. | 31,300 | 703 | |
| Domtar Corp. | 8,500 | 579 | |
| Celanese Corp. Class A | 13,700 | 446 | |
| Innophos Holdings Inc. | 11,100 | 443 | |
| 12,029 | |||
| Telecommunication Services (3.3%) | |||
| AT&T Inc. | 194,729 | 5,554 | |
| Verizon | |||
| Communications Inc. | 112,757 | 4,149 | |
| * | Vonage Holdings Corp. | 41,200 | 107 |
| 9,810 | |||
| Utilities (4.5%) | |||
| CMS Energy Corp. | 93,600 | 1,853 | |
| Northeast Utilities | 54,600 | 1,837 | |
| American Electric | |||
| Power Co. Inc. | 45,000 | 1,711 | |
| Portland General Electric Co. | 69,400 | 1,644 | |
| Cleco Corp. | 47,500 | 1,622 | |
| CenterPoint Energy Inc. | 78,100 | 1,532 | |
| Public Service Enterprise | |||
| Group Inc. | 42,100 | 1,405 | |
| Entergy Corp. | 17,600 | 1,167 | |
| Alliant Energy Corp. | 9,000 | 348 | |
| Southwest Gas Corp. | 6,700 | 242 | |
| 13,361 | |||
| Total Common Stocks | |||
| (Cost $282,671) | 294,189 | ||
| Temporary Cash Investments (0.5%)1 | |||
| Money Market Fund (0.4%) | |||
| 2 | Vanguard Market Liquidity | ||
| Fund, 0.144% | 1,335,584 | 1,336 | |
28
Structured Broad Market Fund
| Face | Market | ||
| Amount | Value | ||
| ($000) | ($000) | ||
| U.S. Government and Agency Obligations (0.1%) | |||
| 3,4 | Fannie Mae Discount | ||
| Notes, 0.080%, 12/19/11 | 100 | 100 | |
| 3,4 | Freddie Mac Discount | ||
| Notes, 0.080%, 12/29/11 | 100 | 100 | |
| 200 | |||
| Total Temporary Cash Investments | |||
| (Cost $1,535) | 1,536 | ||
| Total Investments (100.0%) | |||
| (Cost $284,206) | 295,725 | ||
| Other Assets and Liabilities (0.0%) | |||
| Other Assets | 402 | ||
| Liabilities | (482) | ||
| (80) | |||
| Net Assets (100%) | 295,645 | ||
| At September 30, 2011, net assets consisted of: | |
| Amount | |
| ($000) | |
| Paid-in Capital | 343,064 |
| Undistributed Net Investment Income | 4,183 |
| Accumulated Net Realized Losses | (63,054) |
| Unrealized Appreciation (Depreciation) | |
| Investment Securities | 11,519 |
| Futures Contracts | (67) |
| Net Assets | 295,645 |
| Institutional Shares—Net Assets | |
| Applicable to 265,676 outstanding | |
| $.001 par value shares of beneficial | |
| interest (unlimited authorization) | 5,586 |
| Net Asset Value Per Share— | |
| Institutional Shares | $21.03 |
| Institutional Plus Shares—Net Assets | |
| Applicable to 6,902,312 outstanding | |
| $.001 par value shares of beneficial | |
| interest (unlimited authorization) | 290,059 |
| Net Asset Value Per Share— | |
| Institutional Plus Shares | $42.02 |
See Note A in Notes to Financial Statements.
* Non-income-producing security.
1 The fund invests a portion of its cash reserves in equity markets through the use of index futures contracts. After giving effect to futures investments, the fund’s effective common stock and temporary cash investment positions represent 100.0% and 0.0%, respectively, of net assets.
2 Affiliated money market fund available only to Vanguard funds and certain trusts and accounts managed by Vanguard. Rate shown is the 7-day yield.
3 The issuer operates under a congressional charter; its securities are not backed by the full faith and credit of the U.S. government.
4 Securities with a value of $200,000 have been segregated as initial margin for open futures contracts.
See accompanying Notes, which are an integral part of the Financial Statements.
29
Structured Broad Market Fund
| Statement of Operations | |
| Year Ended | |
| September 30, 2011 | |
| ($000) | |
| Investment Income | |
| Income | |
| Dividends | 6,171 |
| Interest1 | 2 |
| Security Lending | 1 |
| Total Income | 6,174 |
| Expenses | |
| The Vanguard Group—Note B | |
| Investment Advisory Services | 286 |
| Management and Administrative—Institutional Shares | 8 |
| Management and Administrative—Institutional Plus Shares | 167 |
| Marketing and Distribution—Institutional Shares | — |
| Marketing and Distribution—Institutional Plus Shares | 61 |
| Custodian Fees | 10 |
| Auditing Fees | 28 |
| Total Expenses | 560 |
| Net Investment Income | 5,614 |
| Realized Net Gain (Loss) | |
| Investment Securities Sold | 29,197 |
| Futures Contracts | 122 |
| Realized Net Gain (Loss) | 29,319 |
| Change in Unrealized Appreciation (Depreciation) | |
| Investment Securities | (24,405) |
| Futures Contracts | (77) |
| Change in Unrealized Appreciation (Depreciation) | (24,482) |
| Net Increase (Decrease) in Net Assets Resulting from Operations | 10,451 |
| 1 Interest income from an affiliated company of the fund was $2,000. | |
See accompanying Notes, which are an integral part of the Financial Statements.
30
Structured Broad Market Fund
| Statement of Changes in Net Assets | ||
| Year Ended September 30, | ||
| 2011 | 2010 | |
| ($000) | ($000) | |
| Increase (Decrease) in Net Assets | ||
| Operations | ||
| Net Investment Income | 5,614 | 5,771 |
| Realized Net Gain (Loss) | 29,319 | 9,202 |
| Change in Unrealized Appreciation (Depreciation) | (24,482) | 15,770 |
| Net Increase (Decrease) in Net Assets Resulting from Operations | 10,451 | 30,743 |
| Distributions | ||
| Net Investment Income | ||
| Institutional Shares | (94) | (67) |
| Institutional Plus Shares | (5,546) | (5,073) |
| Realized Capital Gain | ||
| Institutional Shares | — | — |
| Institutional Plus Shares | — | — |
| Total Distributions | (5,640) | (5,140) |
| Capital Share Transactions | ||
| Institutional Shares | 843 | 630 |
| Institutional Plus Shares | (18,297) | 3,749 |
| Net Increase (Decrease) from Capital Share Transactions | (17,454) | 4,379 |
| Total Increase (Decrease) | (12,643) | 29,982 |
| Net Assets | ||
| Beginning of Period | 308,288 | 278,306 |
| End of Period1 | 295,645 | 308,288 |
| 1 Net Assets—End of Period includes undistributed net investment income of $4,183,000 and $4,209,000. | ||
See accompanying Notes, which are an integral part of the Financial Statements.
31
Structured Broad Market Fund
Financial Highlights
| Institutional Shares | |||||
| Nov. 30, | |||||
| 20061 to | |||||
| For a Share Outstanding | Year Ended September 30, | Sept. 30, | |||
| Throughout Each Period | 2011 | 2010 | 2009 | 2008 | 2007 |
| Net Asset Value, Beginning of Period | $20.70 | $18.99 | $21.53 | $28.67 | $26.59 |
| Investment Operations | |||||
| Net Investment Income | .3852 | .376 | .3522 | .402 | .3612 |
| Net Realized and Unrealized Gain (Loss) | |||||
| on Investments | .338 | 1.672 | (2.500) | (6.833) | 1.930 |
| Total from Investment Operations | .723 | 2.048 | (2.148) | (6.431) | 2.291 |
| Distributions | |||||
| Dividends from Net Investment Income | (.393) | (.338) | (.392) | (.280) | (.116) |
| Distributions from Realized Capital Gains | — | — | — | (.429) | (.095) |
| Total Distributions | (.393) | (.338) | (.392) | (.709) | (.211) |
| Net Asset Value, End of Period | $21.03 | $20.70 | $18.99 | $21.53 | $28.67 |
| Total Return | 3.37% | 10.88% | -9.67% | -22.95% | 8.68% |
| Ratios/Supplemental Data | |||||
| Net Assets, End of Period (Millions) | $6 | $5 | $4 | $4 | $14 |
| Ratio of Total Expenses to | |||||
| Average Net Assets | 0.24% | 0.24% | 0.25% | 0.20% | 0.25%3 |
| Ratio of Net Investment Income to | |||||
| Average Net Assets | 1.64% | 1.91% | 2.15% | 1.72% | 1.55%3 |
| Portfolio Turnover Rate | 56% | 52% | 62% | 70% | 66% |
1 Inception.
2 Calculated based on average shares outstanding.
3 Annualized.
See accompanying Notes, which are an integral part of the Financial Statements.
32
Structured Broad Market Fund
Financial Highlights
| Institutional Plus Shares | |||||
| Oct. 3, | |||||
| 20061 to | |||||
| For a Share Outstanding | Year Ended September 30, | Sept. 30, | |||
| Throughout Each Period | 2011 | 2010 | 2009 | 2008 | 2007 |
| Net Asset Value, Beginning of Period | $41.36 | $37.94 | $43.07 | $57.39 | $50.00 |
| Investment Operations | |||||
| Net Investment Income | .7962 | .778 | .7252 | .873 | .9042 |
| Net Realized and Unrealized Gain (Loss) | |||||
| on Investments | .672 | 3.343 | (5.006) | (13.714) | 6.910 |
| Total from Investment Operations | 1.468 | 4.121 | (4.281) | (12.841) | 7.814 |
| Distributions | |||||
| Dividends from Net Investment Income | (.808) | (.701) | (.849) | (.621) | (.234) |
| Distributions from Realized Capital Gains | — | — | — | (.858) | (.190) |
| Total Distributions | (.808) | (.701) | (.849) | (1.479) | (.424) |
| Net Asset Value, End of Period | $42.02 | $41.36 | $37.94 | $43.07 | $57.39 |
| Total Return | 3.43% | 10.96% | -9.60% | -22.91% | 15.69% |
| Ratios/Supplemental Data | |||||
| Net Assets, End of Period (Millions) | $290 | $304 | $275 | $248 | $285 |
| Ratio of Total Expenses to | |||||
| Average Net Assets | 0.17% | 0.17% | 0.17% | 0.12% | 0.15%3 |
| Ratio of Net Investment Income to | |||||
| Average Net Assets | 1.71% | 1.98% | 2.23% | 1.80% | 1.65%3 |
| Portfolio Turnover Rate | 56% | 52% | 62% | 70% | 66% |
1 Commencement of operations as a registered investment company.
2 Calculated based on average shares outstanding.
3 Annualized.
See accompanying Notes, which are an integral part of the Financial Statements.
33
Structured Broad Market Fund
Notes to Financial Statements
Vanguard Structured Broad Market Fund is registered under the Investment Company Act of 1940 as an open-end investment company, or mutual fund. The fund offers two classes of shares: Institutional Shares and Institutional Plus Shares. Institutional Shares and Institutional Plus Shares are designed for investors who meet certain administrative, service, and account-size criteria.
A. The following significant accounting policies conform to generally accepted accounting principles for U.S. mutual funds. The fund consistently follows such policies in preparing its financial statements.
1. Security Valuation: Securities are valued as of the close of trading on the New York Stock Exchange (generally 4 p.m., Eastern time) on the valuation date. Equity securities are valued at the latest quoted sales prices or official closing prices taken from the primary market in which each security trades; such securities not traded on the valuation date are valued at the mean of the latest quoted bid and asked prices. Securities for which market quotations are not readily available, or whose values have been materially affected by events occurring before the fund’s pricing time but after the close of the securities’ primary markets, are valued by methods deemed by the board of trustees to represent fair value. Investments in Vanguard Market Liquidity Fund are valued at that fund’s net asset value. Temporary cash investments acquired over 60 days to maturity are valued using the latest bid prices or using valuations based on a matrix system (which considers such factors as security prices, yields, maturities, and ratings), both as furnished by independent pricing services. Other temporary cash investments are valued at amortized cost, which approximates market value.
2. Futures Contracts: The fund uses index futures contracts to a limited extent, with the objective of maintaining full exposure to the stock market while maintaining liquidity. The fund may purchase or sell futures contracts to achieve a desired level of investment, whether to accommodate portfolio turnover or cash flows from capital share transactions. The primary risks associated with the use of futures contracts are imperfect correlation between changes in market values of stocks held by the fund and the prices of futures contracts, and the possibility of an illiquid market.
Futures contracts are valued at their quoted daily settlement prices. The aggregate principal amounts of the contracts are not recorded in the Statement of Net Assets. Fluctuations in the value of the contracts are recorded in the Statement of Net Assets as an asset (liability) and in the Statement of Operations as unrealized appreciation (depreciation) until the contracts are closed, when they are recorded as realized futures gains (losses).
3. Federal Income Taxes: The fund intends to continue to qualify as a regulated investment company and distribute all of its taxable income. Management has analyzed the fund’s tax positions taken for all open federal income tax years (September 30, 2008–2011), and has concluded that no provision for federal income tax is required in the fund’s financial statements.
4. Distributions: Distributions to shareholders are recorded on the ex-dividend date.
5. Security Lending: The fund may lend its securities to qualified institutional borrowers to earn additional income. Security loans are required to be secured at all times by collateral at least equal to the market value of securities loaned. The fund invests cash collateral received in Vanguard Market Liquidity Fund, and records a liability for the return of the collateral, during the period the securities are on loan. Security lending income represents fees charged to borrowers plus income earned on investing cash collateral, less expenses associated with the loan.
6. Other: Dividend income is recorded on the ex-dividend date. Interest income includes income distributions received from Vanguard Market Liquidity Fund and is accrued daily. Security transactions are accounted for on the date securities are bought or sold. Costs used to determine realized gains (losses) on the sale of investment securities are those of the specific securities sold.
34
Structured Broad Market Fund
Each class of shares has equal rights as to assets and earnings, except that each class separately bears certain class-specific expenses related to maintenance of shareholder accounts (included in Management and Administrative expenses) and shareholder reporting. Marketing and distribution expenses are allocated to each class of shares based on a method approved by the board of trustees. Income, other non-class-specific expenses, and gains and losses on investments are allocated to each class of shares based on its relative net assets.
B. The Vanguard Group furnishes at cost investment advisory, corporate management, administrative, marketing, and distribution services. The costs of such services are allocated to the fund under methods approved by the board of trustees. The fund has committed to provide up to 0.40% of its net assets in capital contributions to Vanguard. At September 30, 2011, the fund had contributed capital of $53,000 to Vanguard (included in Other Assets), representing 0.02% of the fund’s net assets and 0.02% of Vanguard’s capitalization. The fund’s trustees and officers are also directors and officers of Vanguard.
C. Various inputs may be used to determine the value of the fund’s investments. These inputs are summarized in three broad levels for financial statement purposes. The inputs or methodologies used to value securities are not necessarily an indication of the risk associated with investing in those securities.
Level 1—Quoted prices in active markets for identical securities.
Level 2—Other significant observable inputs (including quoted prices for similar securities, interest rates, prepayment speeds, credit risk, etc.).
Level 3—Significant unobservable inputs (including the fund’s own assumptions used to determine the fair value of investments).
The following table summarizes the fund’s investments as of September 30, 2011, based on the inputs used to value them:
| Level 1 | Level 2 | Level 3 | |
| Investments | ($000) | ($000) | ($000) |
| Common Stocks | 294,189 | — | — |
| Temporary Cash Investments | 1,336 | 200 | — |
| Futures Contracts—Liabilities1 | (38) | — | — |
| Total | 295,487 | 200 | — |
| 1 Represents variation margin on the last day of the reporting period. |
D. At September 30, 2011, the aggregate settlement value of open futures contracts and the related unrealized appreciation (depreciation) were:
| ($000) | ||||
| Aggregate | ||||
| Number of | Settlement | Unrealized | ||
| Long (Short) | Value | Appreciation | ||
| Futures Contracts | Expiration | Contracts | Long (Short) | (Depreciation) |
| S&P 500 Index | December 2011 | 4 | 1,126 | (49) |
| E-mini S&P 500 Index | December 2011 | 5 | 282 | (18) |
Unrealized appreciation (depreciation) on open futures contracts is required to be treated as realized gain (loss) for tax purposes.
35
Structured Broad Market Fund
E. Distributions are determined on a tax basis and may differ from net investment income and realized capital gains for financial reporting purposes. Differences may be permanent or temporary. Permanent differences are reclassified among capital accounts in the financial statements to reflect their tax character. Temporary differences arise when certain items of income, expense, gain, or loss are recognized in different periods for financial statement and tax purposes; these differences will reverse at some time in the future. Differences in classification may also result from the treatment of short-term gains as ordinary income for tax purposes.
For tax purposes, at September 30, 2011, the fund had $4,415,000 of ordinary income available for distribution. The fund had available capital loss carryforwards totaling $63,115,000 to offset future net capital gains of $24,472,000 through September 30, 2017, and $38,643,000 through September 30, 2018.
At September 30, 2011, the cost of investment securities for tax purposes was $284,206,000. Net unrealized appreciation of investment securities for tax purposes was $11,519,000, consisting of unrealized gains of $38,328,000 on securities that had risen in value since their purchase and $26,809,000 in unrealized losses on securities that had fallen in value since their purchase.
F. During the year ended September 30, 2011, the fund purchased $181,240,000 of investment securities and sold $199,313,000 of investment securities, other than temporary cash investments.
G. Capital share transactions for each class of shares were:
| Year Ended September 30, | ||||
| 2011 | 2010 | |||
| Amount | Shares | Amount | Shares | |
| ($000) | (000) | ($000) | (000) | |
| Institutional Shares | ||||
| Issued | 749 | 32 | 563 | 29 |
| Issued in Lieu of Cash Distributions | 94 | 4 | 67 | 3 |
| Redeemed | — | — | — | — |
| Net Increase (Decrease)—Institutional Shares | 843 | 36 | 630 | 32 |
| Institutional Plus Shares | ||||
| Issued | — | — | 16,974 | 437 |
| Issued in Lieu of Cash Distributions | 1,703 | 38 | 1,775 | 45 |
| Redeemed | (20,000) | (475) | (15,000) | (379) |
| Net Increase (Decrease)—Institutional Plus Shares | (18,297) | (437) | 3,749 | 103 |
At September 30, 2011, one shareholder was the record or beneficial owner of 68% of the fund’s net assets. If the shareholder were to redeem its total investment in the fund, the redemption might result in an increase in the fund’s expense ratio, cause the fund to incur higher transaction costs, or result in the realization of taxable capital gains.
H. In preparing the financial statements as of September 30, 2011, management considered the impact of subsequent events for potential recognition or disclosure in these financial statements.
36
Report of Independent Registered Public Accounting Firm
To the Trustees of Vanguard Quantitative Funds and the Shareholders of Vanguard Structured Large-Cap Equity Fund and Vanguard Structured Broad Market Fund:
In our opinion, the accompanying statements of net assets and the related statements of operations and of changes in net assets and the financial highlights present fairly, in all material respects, the financial position of Vanguard Structured Large-Cap Equity Fund and Vanguard Structured Broad Market Fund (constituting two separate portfolios of Vanguard Quantitative Funds, hereafter referred to as the “Funds”) at September 30, 2011, the results of each of their operations for the year ended, the changes in each of their net assets for each of the two years in the period then ended and the financial highlights for each of the periods indicated, in conformity with accounting principles generally accepted in the United States of America. These financial statements and financial highlights (hereafter referred to as “financial statements”) are the responsibility of the Funds’ management; our responsibility is to express an opinion on these financial statements based on our audits. We conducted our audits of these financial statements in accordance with the standards of the Public Company Accounting Oversight Board (United States). Those standards require that we plan and perform the audit to obtain reasonable assurance about whether the financial statements are free of material misstatement. An audit includes examining, on a test basis, evidence supporting the amounts and disclosures in the financial statements, assessing the accounting principles used and significant estimates made by management, and evaluating the overall financial statement presentation. We believe that our audits, which included confirmation of securities at September 30, 2011 by correspondence with the custodian and broker and by agreement to the underlying ownership records of Vanguard Market Liquidity Fund, provide a reasonable basis for our opinion.
PricewaterhouseCoopers LLP
Philadelphia, Pennsylvania
November 15, 2011
37
Special 2011 tax information (unaudited) for Vanguard Structured Equity Funds
This information for the fiscal year ended September 30, 2011, is included pursuant to provisions of the Internal Revenue Code.
The funds distributed qualified dividend income to shareholders during the fiscal year as follows:
| Qualified Dividend Income | |
| Fund | ($000) |
| Structured Large-Cap Equity | 11,810 |
| Structured Broad Market | 5,640 |
For corporate shareholders, the percentage of investment income (dividend income plus short-term gains, if any) that qualifies for the dividends-received deduction is as follows:
| Fund | Percentage |
| Structured Large-Cap Equity | 100% |
| Structured Broad Market | 100 |
38
About Your Fund’s Expenses
As a shareholder of the fund, you incur ongoing costs, which include costs for portfolio management, administrative services, and shareholder reports (like this one), among others. Operating expenses, which are deducted from a fund’s gross income, directly reduce the investment return of the fund.
A fund’s expenses are expressed as a percentage of its average net assets. This figure is known as the expense ratio. The following examples are intended to help you understand the ongoing costs (in dollars) of investing in your fund and to compare these costs with those of other mutual funds. The examples are based on an investment of $1,000 made at the beginning of the period shown and held for the entire period.
The accompanying table illustrates your fund’s costs in two ways:
• Based on actual fund return. This section helps you to estimate the actual expenses that you paid over the period. The ”Ending Account Value“ shown is derived from the fund‘s actual return, and the third column shows the dollar amount that would have been paid by an investor who started with $1,000 in the fund. You may use the information here, together with the amount you invested, to estimate the expenses that you paid over the period.
To do so, simply divide your account value by $1,000 (for example, an $8,600 account value divided by $1,000 = 8.6), then multiply the result by the number given for your fund under the heading ”Expenses Paid During Period.“
• Based on hypothetical 5% yearly return. This section is intended to help you compare your fund‘s costs with those of other mutual funds. It assumes that the fund had a yearly return of 5% before expenses, but that the expense ratio is unchanged. In this case—because the return used is not the fund’s actual return—the results do not apply to your investment. The example is useful in making comparisons because the Securities and Exchange Commission requires all mutual funds to calculate expenses based on a 5% return. You can assess your fund’s costs by comparing this hypothetical example with the hypothetical examples that appear in shareholder reports of other funds.
Note that the expenses shown in the table are meant to highlight and help you compare ongoing costs only and do not reflect transaction costs incurred by the fund for buying and selling securities. Further, the expenses do not include any purchase, redemption, or account service fees described in the fund prospectus. If such fees were applied to your account, your costs would be higher. Your fund does not carry a “sales load.”
The calculations assume no shares were bought or sold during the period. Your actual costs may have been higher or lower, depending on the amount of your investment and the timing of any purchases or redemptions.
You can find more information about the fund’s expenses, including annual expense ratios, in the Financial Statements section of this report. For additional information on operating expenses and other shareholder costs, please refer to your fund’s current prospectus.
39
| Six Months Ended September 30, 2011 | |||
| Beginning | Ending | Expenses | |
| Account Value | Account Value | Paid During | |
| 3/31/2011 | 9/30/2011 | Period | |
| Based on Actual Fund Return | |||
| Structured Large-Cap Equity Fund | |||
| Institutional Shares | $1,000.00 | $875.36 | $1.13 |
| Institutional Plus Shares | 1,000.00 | 875.52 | 0.80 |
| Structured Broad Market Fund | |||
| Institutional Shares | $1,000.00 | $856.62 | $1.12 |
| Institutional Plus Shares | 1,000.00 | 856.68 | 0.79 |
| Based on Hypothetical 5% Yearly Return | |||
| Structured Large-Cap Equity Fund | |||
| Institutional Shares | $1,000.00 | $1,023.87 | $1.22 |
| Institutional Plus Shares | 1,000.00 | 1,024.22 | 0.86 |
| Structured Broad Market Fund | |||
| Institutional Shares | $1,000.00 | $1,023.87 | $1.22 |
| Institutional Plus Shares | 1,000.00 | 1,024.22 | 0.86 |
The calculations are based on expenses incurred in the most recent six-month period. The funds’ annualized six-month expense ratios for that period are: for the Structured Large-Cap Equity Fund, 0.24% for Institutional Shares and 0.17% for Institutional Plus Shares; for the Structured Broad Market Fund, 0.24% for Institutional Shares and 0.17% for Institutional Plus Shares. The dollar amounts shown as “Expenses Paid” are equal to the annualized expense ratio multiplied by the average account value over the period, multiplied by the number of days in the most recent six-month period, then divided by the number of days in the most recent 12-month period.
40
Glossary
30-Day SEC Yield. A fund’s 30-day SEC yield is derived using a formula specified by the U.S. Securities and Exchange Commission. Under the formula, data related to the fund’s security holdings in the previous 30 days are used to calculate the fund’s hypothetical net income for that period, which is then annualized and divided by the fund’s estimated average net assets over the calculation period. For the purposes of this calculation, a security’s income is based on its current market yield to maturity (for bonds; excluding inflation for inflation-protected securities), its actual income (for asset-backed securities), or its projected dividend yield (for stocks). Because the SEC yield represents hypothetical annualized income, it will differ—at times significantly—from the fund’s actual experience. As a result, the fund’s income distributions may be higher or lower than implied by the SEC yield.
Beta. A measure of the magnitude of a fund’s past share-price fluctuations in relation to the ups and downs of a given market index. The index is assigned a beta of 1.00. Compared with a given index, a fund with a beta of 1.20 typically would have seen its share price rise or fall by 12% when the index rose or fell by 10%. For this report, beta is based on returns over the past 36 months for both the fund and the index. Note that a fund’s beta should be reviewed in conjunction with its R-squared (see definition). The lower the R-squared, the less correlation there is between the fund and the index, and the less reliable beta is as an indicator of volatility.
Dividend Yield. Dividend income earned by stocks, expressed as a percentage of the aggregate market value (or of net asset value, for a fund). The yield is determined by dividing the amount of the annual dividends by the aggregate value (or net asset value) at the end of the period. For a fund, the dividend yield is based solely on stock holdings and does not include any income produced by other investments.
Earnings Growth Rate. The average annual rate of growth in earnings over the past five years for the stocks now in a fund.
Equity Exposure. A measure that reflects a fund’s investments in stocks and stock futures. Any holdings in short-term reserves are excluded.
Expense Ratio. The percentage of a fund’s average net assets used to pay its annual administrative and advisory expenses. These expenses directly reduce returns to investors.
Foreign Holdings. The percentage of a fund represented by securities or depositary receipts of companies based outside the United States.
Median Market Cap. An indicator of the size of companies in which a fund invests; the midpoint of market capitalization (market price x shares outstanding) of a fund’s stocks, weighted by the proportion of the fund’s assets invested in each stock. Stocks representing half of the fund’s assets have market capitalizations above the median, and the rest are below it.
Price/Book Ratio. The share price of a stock divided by its net worth, or book value, per share. For a fund, the weighted average price/book ratio of the stocks it holds.
Price/Earnings Ratio. The ratio of a stock’s current price to its per-share earnings over the past year. For a fund, the weighted average P/E of the stocks it holds. P/E is an indicator of market expectations about corporate prospects; the higher the P/E, the greater the expectations for a company’s future growth.
41
R-Squared. A measure of how much of a fund’s past returns can be explained by the returns from the market in general, as measured by a given index. If a fund’s total returns were precisely synchronized with an index’s returns, its R-squared would be 1.00. If the fund’s returns bore no relationship to the index’s returns, its R-squared would be 0. For this report, R-squared is based on returns over the past 36 months for both the fund and the index.
Return on Equity. The annual average rate of return generated by a company during the past five years for each dollar of shareholder’s equity (net income divided by shareholder’s equity). For a fund, the weighted average return on equity for the companies whose stocks it holds.
Short-Term Reserves. The percentage of a fund invested in highly liquid, short-term securities that can be readily converted to cash.
Turnover Rate. An indication of the fund’s trading activity. Funds with high turnover rates incur higher transaction costs and may be more likely to distribute capital gains (which may be taxable to investors). The turnover rate excludes in-kind transactions, which have minimal impact on costs.
42
This page intentionally left blank.
The People Who Govern Your Fund
The trustees of your mutual fund are there to see that the fund is operated and managed in your best interests since, as a shareholder, you are a part owner of the fund. Your fund’s trustees also serve on the board of directors of The Vanguard Group, Inc., which is owned by the Vanguard funds and provides services to them on an at-cost basis.
A majority of Vanguard’s board members are independent, meaning that they have no affiliation with Vanguard or the funds they oversee, apart from the sizable personal investments they have made as private individuals. The independent board members have distinguished backgrounds in business, academia, and public service. Each of the trustees and executive officers oversees 178 Vanguard funds.
The following table provides information for each trustee and executive officer of the fund. More information about the trustees is in the Statement of Additional Information, which can be obtained, without charge, by contacting Vanguard at 800-662-7447, or online at vanguard.com.
| Interested Trustee1 | and President (2006–2008) of Rohm and Haas Co. |
| (chemicals); Director of Tyco International, Ltd. | |
| F. William McNabb III | (diversified manufacturing and services) and Hewlett- |
| Born 1957. Trustee Since July 2009. Chairman of the | Packard Co. (electronic computer manufacturing); |
| Board. Principal Occupation(s) During the Past Five | Senior Advisor at New Mountain Capital; Trustee |
| Years: Chairman of the Board of The Vanguard Group, | of The Conference Board; Member of the Board of |
| Inc., and of each of the investment companies served | Managers of Delphi Automotive LLP (automotive |
| by The Vanguard Group, since January 2010; Director | components). |
| of The Vanguard Group since 2008; Chief Executive | |
| Officer and President of The Vanguard Group and of | Amy Gutmann |
| each of the investment companies served by The | Born 1949. Trustee Since June 2006. Principal |
| Vanguard Group since 2008; Director of Vanguard | Occupation(s) During the Past Five Years: President |
| Marketing Corporation; Managing Director of The | of the University of Pennsylvania; Christopher H. |
| Vanguard Group (1995–2008). | Browne Distinguished Professor of Political Science |
| in the School of Arts and Sciences with secondary | |
| appointments at the Annenberg School for Commu- | |
| Independent Trustees | nication and the Graduate School of Education |
| of the University of Pennsylvania; Director of | |
| Emerson U. Fullwood | Carnegie Corporation of New York, Schuylkill River |
| Born 1948. Trustee Since January 2008. Principal | Development Corporation, and Greater Philadelphia |
| Occupation(s) During the Past Five Years: Executive | Chamber of Commerce; Trustee of the National |
| Chief Staff and Marketing Officer for North America | Constitution Center; Chair of the Presidential |
| and Corporate Vice President (retired 2008) of Xerox | Commission for the Study of Bioethical Issues. |
| Corporation (document management products and | |
| services); Executive in Residence and 2010 | JoAnn Heffernan Heisen |
| Distinguished Minett Professor at the Rochester | Born 1950. Trustee Since July 1998. Principal |
| Institute of Technology; Director of SPX Corporation | Occupation(s) During the Past Five Years: Corporate |
| (multi-industry manufacturing), the United Way of | Vice President and Chief Global Diversity Officer |
| Rochester, Amerigroup Corporation (managed health | (retired 2008) and Member of the Executive |
| care), the University of Rochester Medical Center, | Committee (1997–2008) of Johnson & Johnson |
| Monroe Community College Foundation, and North | (pharmaceuticals/consumer products); Director of |
| Carolina A&T University. | Skytop Lodge Corporation (hotels), the University |
| Medical Center at Princeton, the Robert Wood | |
| Rajiv L. Gupta | Johnson Foundation, and the Center for Work Life |
| Born 1945. Trustee Since December 2001.2 | Policy; Member of the Advisory Board of the |
| Principal Occupation(s) During the Past Five Years: | Maxwell School of Citizenship and Public Affairs |
| Chairman and Chief Executive Officer (retired 2009) | at Syracuse University. |
| F. Joseph Loughrey | Thomas J. Higgins | |
| Born 1949. Trustee Since October 2009. Principal | Born 1957. Chief Financial Officer Since September | |
| Occupation(s) During the Past Five Years: President | 2008. Principal Occupation(s) During the Past Five | |
| and Chief Operating Officer (retired 2009) and Vice | Years: Principal of The Vanguard Group, Inc.; Chief | |
| Chairman of the Board (2008–2009) of Cummins Inc. | Financial Officer of each of the investment companies | |
| (industrial machinery); Director of SKF AB (industrial | served by The Vanguard Group since 2008; Treasurer | |
| machinery), Hillenbrand, Inc. (specialized consumer | of each of the investment companies served by The | |
| services), the Lumina Foundation for Education, and | Vanguard Group (1998–2008). | |
| Oxfam America; Chairman of the Advisory Council | ||
| for the College of Arts and Letters and Member | Kathryn J. Hyatt | |
| of the Advisory Board to the Kellogg Institute for | Born 1955. Treasurer Since November 2008. Principal | |
| International Studies at the University of Notre Dame. | Occupation(s) During the Past Five Years: Principal | |
| of The Vanguard Group, Inc.; Treasurer of each of | ||
| André F. Perold | the investment companies served by The Vanguard | |
| Born 1952. Trustee Since December 2004. Principal | Group since 2008; Assistant Treasurer of each of the | |
| Occupation(s) During the Past Five Years: George | investment companies served by The Vanguard Group | |
| Gund Professor of Finance and Banking at the Harvard | (1988–2008). | |
| Business School (retired July 2011); Chief Investment | ||
| Officer and co-Managing Partner of HighVista | Heidi Stam | |
| Strategies LLC (private investment firm); Director of | Born 1956. Secretary Since July 2005. Principal | |
| Rand Merchant Bank; Overseer of the Museum of | Occupation(s) During the Past Five Years: Managing | |
| Fine Arts Boston. | Director of The Vanguard Group, Inc., since 2006; | |
| General Counsel of The Vanguard Group since 2005; | ||
| Alfred M. Rankin, Jr. | Secretary of The Vanguard Group and of each of the | |
| Born 1941. Trustee Since January 1993. Principal | investment companies served by The Vanguard Group | |
| Occupation(s) During the Past Five Years: Chairman, | since 2005; Director and Senior Vice President of | |
| President, and Chief Executive Officer of NACCO | Vanguard Marketing Corporation since 2005; | |
| Industries, Inc. (forklift trucks/housewares/lignite); | Principal of The Vanguard Group (1997–2006). | |
| Director of Goodrich Corporation (industrial products/ | ||
| aircraft systems and services) and the National | ||
| Association of Manufacturers; Chairman of the | Vanguard Senior Management Team | |
| Federal Reserve Bank of Cleveland; Vice Chairman | ||
| of University Hospitals of Cleveland; President of | R. Gregory Barton | Chris D. McIsaac |
| the Board of The Cleveland Museum of Art. | Mortimer J. Buckley | Michael S. Miller |
| Kathleen C. Gubanich | James M. Norris | |
| Peter F. Volanakis | Paul A. Heller | Glenn W. Reed |
| Born 1955. Trustee Since July 2009. Principal | Martha G. King | George U. Sauter |
| Occupation(s) During the Past Five Years: President | ||
| and Chief Operating Officer (retired 2010) of Corning | ||
| Incorporated (communications equipment); Director of | Chairman Emeritus and Senior Advisor | |
| Corning Incorporated (2000–2010) and Dow Corning | ||
| (2001–2010); Overseer of the Amos Tuck School of | John J. Brennan | |
| Business Administration at Dartmouth College. | Chairman, 1996–2009 | |
| Chief Executive Officer and President, 1996–2008 | ||
| Executive Officers | ||
| Founder | ||
| Glenn Booraem | ||
| Born 1967. Controller Since July 2010. Principal | John C. Bogle | |
| Occupation(s) During the Past Five Years: Principal | Chairman and Chief Executive Officer, 1974–1996 | |
| of The Vanguard Group, Inc.; Controller of each of | ||
| the investment companies served by The Vanguard | ||
| Group since 2010; Assistant Controller of each of | ||
| the investment companies served by The Vanguard | ||
| Group (2001–2010). | ||
1 Mr. McNabb is considered an “interested person,” as defined in the Investment Company Act of 1940, because he is an officer of the Vanguard funds.
2 December 2002 for Vanguard Equity Income Fund, Vanguard Growth Equity Fund, the Vanguard Municipal Bond Funds, and the Vanguard State Tax-Exempt Funds.
 | |
| P.O. Box 2600 | |
| Valley Forge, PA 19482-2600 |
Connect with Vanguard® > vanguard.com
| Fund Information > 800-662-7447 | CFA® is a trademark owned by CFA Institute. |
| Direct Investor Account Services > 800-662-2739 | |
| Institutional Investor Services > 800-523-1036 | |
| Text Telephone for People | |
| With Hearing Impairment > 800-749-7273 | |
| This material may be used in conjunction | |
| with the offering of shares of any Vanguard | |
| fund only if preceded or accompanied by | |
| the fund’s current prospectus. | |
| All comparative mutual fund data are from Lipper Inc. or | |
| Morningstar, Inc., unless otherwise noted. | |
| You can obtain a free copy of Vanguard’s proxy voting | |
| guidelines by visiting vanguard.com/proxyreporting or by | |
| calling Vanguard at 800-662-2739. The guidelines are | |
| also available from the SEC’s website, sec.gov. In | |
| addition, you may obtain a free report on how your fund | |
| voted the proxies for securities it owned during the 12 | |
| months ended June 30. To get the report, visit either | |
| vanguard.com/proxyreporting or sec.gov. | |
| You can review and copy information about your fund at | |
| the SEC’s Public Reference Room in Washington, D.C. To | |
| find out more about this public service, call the SEC at | |
| 202-551-8090. Information about your fund is also | |
| available on the SEC’s website, and you can receive | |
| copies of this information, for a fee, by sending a | |
| request in either of two ways: via e-mail addressed to | |
| publicinfo@sec.gov or via regular mail addressed to the | |
| Public Reference Section, Securities and Exchange | |
| Commission, Washington, DC 20549-1520. | |
| © 2011 The Vanguard Group, Inc. | |
| All rights reserved. | |
| Vanguard Marketing Corporation, Distributor. | |
| Q08700 112011 | |
Item 2: Code of Ethics. The Registrant has adopted a code of ethics that applies to the Registrant’s principal executive officer, principal financial officer, principal accounting officer or controller or persons performing similar functions. The Code of Ethics was amended during the reporting period covered by this report to make certain technical, non-material changes.
Item 3: Audit Committee Financial Expert. The following members of the Audit Committee have been determined by the Registrant’s Board of Trustees to be Audit Committee Financial Experts serving on its Audit Committee, and to be independent: Charles D. Ellis, Rajiv L. Gupta, JoAnn Heffernan Heisen, André F. Perold, and Alfred M. Rankin, Jr.
Item 4: Principal Accountant Fees and Services.
(a) Audit Fees.
Audit Fees of the Registrant
Fiscal Year Ended September 30, 2011: $84,000
Fiscal Year Ended September 30, 2010: $132,000
Aggregate Audit Fees of Registered Investment Companies in the Vanguard Group.
Fiscal Year Ended September 30, 2011: $3,978,540
Fiscal Year Ended September 30, 2010: $3,607,060
(b) Audit-Related Fees.
Fiscal Year Ended September 30, 2011: $1,341,750
Fiscal Year Ended September 30, 2010: $791,350
Includes fees billed in connection with assurance and related services provided to the Registrant, The Vanguard Group, Inc., Vanguard Marketing Corporation, and other registered investment companies in the Vanguard Group.
(c) Tax Fees.
Fiscal Year Ended September 30, 2011: $373,830
Fiscal Year Ended September 30, 2010: $336,090
Includes fees billed in connection with tax compliance, planning and advice services provided to the Registrant, The Vanguard Group, Inc., Vanguard Marketing Corporation, and other registered investment companies in the Vanguard Group and related to income and excise taxes.
(d) All Other Fees.
Fiscal Year Ended September 30, 2011: $16,000
Fiscal Year Ended September 30, 2010: $16,000
Includes fees billed for services related to risk management and privacy matters. Services were provided to the Registrant, The Vanguard Group, Inc., Vanguard Marketing Corporation, and other registered investment companies in the Vanguard Group.
(e) (1) Pre-Approval Policies. The policy of the Registrant’s Audit Committee is to consider and, if appropriate, approve before the principal accountant is engaged for such services, all specific audit and non-audit services provided to: (1) the Registrant; (2) The Vanguard Group, Inc.; (3) other entities controlled by The Vanguard Group, Inc. that provide ongoing services to the Registrant; and (4) other registered investment companies in the Vanguard Group. In making a determination, the Audit Committee considers whether the services are consistent with maintaining the principal accountant’s independence.
In the event of a contingency situation in which the principal accountant is needed to provide services in between scheduled Audit Committee meetings, the Chairman of the Audit Committee would be called on to consider and, if appropriate, pre-approve audit or permitted non-audit services in an amount sufficient to complete services through the next Audit Committee meeting, and to determine if such services would be consistent with maintaining the accountant’s independence. At the next scheduled Audit Committee meeting, services and fees would be presented to the Audit Committee for formal consideration, and, if appropriate, approval by the entire Audit Committee. The Audit Committee would again consider whether such services and fees are consistent with maintaining the principal accountant’s independence.
The Registrant’s Audit Committee is informed at least annually of all audit and non-audit services provided by the principal accountant to the Vanguard complex, whether such services are provided to: (1) the Registrant; (2) The Vanguard Group, Inc.; (3) other entities controlled by The Vanguard Group, Inc. that provide ongoing services to the Registrant; or (4) other registered investment companies in the Vanguard Group.
(2) No percentage of the principal accountant’s fees or services were approved pursuant to the waiver provision of paragraph (c)(7)(i)(C) of Rule 2-01 of Regulation S-X.
(f) For the most recent fiscal year, over 50% of the hours worked under the principal accountant’s engagement were not performed by persons other than full-time, permanent employees of the principal accountant.
(g) Aggregate Non-Audit Fees.
Fiscal Year Ended September 30, 2011: $389,830
Fiscal Year Ended September 30, 2010: $352,090
Includes fees billed for non-audit services provided to the Registrant, The Vanguard Group, Inc., Vanguard Marketing Corporation, and other registered investment companies in the Vanguard Group.
(h) For the most recent fiscal year, the Audit Committee has determined that the provision of all non-audit services was consistent with maintaining the principal accountant’s independence.
Item 5: Audit Committee of Listed Registrants.
Not Applicable.
Item 6: Investments.
Not Applicable.
Item 7: Disclosure of Proxy Voting Policies and Procedures for Closed-End Management Investment Companies.
Not Applicable.
Item 8: Portfolio Managers of Closed-End Management Investment Companies.
Not Applicable.
Item 9: Purchase of Equity Securities by Closed-End Management Investment Company and Affiliated Purchasers.
Not Applicable.
Item 10: Submission of Matters to a Vote of Security Holders.
Not Applicable.
Item 11: Controls and Procedures.
(a) Disclosure Controls and Procedures. The Principal Executive and Financial Officers concluded that the Registrant's Disclosure Controls and Procedures are effective based on their evaluation of the Disclosure Controls and Procedures as of a date within 90 days of the filing date of this report.
(b) Internal Control Over Financial Reporting. There were no significant changes in Registrant’s Internal Control Over Financial Reporting or in other factors that could significantly affect this control subsequent to the date of the evaluation, including any corrective actions with regard to significant deficiencies and material weaknesses.
Item 12: Exhibits.
(a) Code of Ethics.
(b) Certifications.
Pursuant to the requirements of the Securities Exchange Act of 1934 and the Investment Company Act of 1940, the registrant has duly caused this report to be signed on its behalf by the undersigned, thereunto duly authorized.
| VANGUARD QUANTITATIVE FUNDS | |
| By: | /s/ F. WILLIAM MCNABB III* |
| F. WILLIAM MCNABB III | |
| CHIEF EXECUTIVE OFFICER | |
| Date: November 18, 2011 | |
Pursuant to the requirements of the Securities Exchange Act of 1934 and the Investment Company Act of 1940, this report has been signed below by the following persons on behalf of the registrant and in the capacities and on the dates indicated.
| VANGUARD QUANTITATIVE FUNDS | |
| By: | /s/ F. WILLIAM MCNABB III* |
| F. WILLIAM MCNABB III | |
| CHIEF EXECUTIVE OFFICER | |
| Date: November 18, 2011 | |
| VANGUARD QUANTITATIVE FUNDS | |
| By: | /s/ THOMAS J. HIGGINS* |
| THOMAS J. HIGGINS | |
| CHIEF FINANCIAL OFFICER | |
| Date: November 18, 2011 | |
* By: /s/ Heidi Stam
Heidi Stam, pursuant to a Power of Attorney filed on November 28, 2011, see file Number 33-23444,
Incorporated by Reference.