UNITED STATES
SECURITIES AND EXCHANGE COMMISSION
Washington, D.C. 20549
FORM N-CSR
CERTIFIED SHAREHOLDER REPORT
OF
REGISTERED MANAGEMENT INVESTMENT COMPANIES
| Investment Company Act file number: | 811-04526 | |
Name of Registrant: | Vanguard Quantitative Funds | |
Address of Registrant: | P.O. Box 2600 | |
| Valley Forge, PA 19482 | ||
Name and address of agent for service: | Heidi Stam, Esquire | |
| P.O. Box 876 | ||
| Valley Forge, PA 19482 | ||
Registrant’s telephone number, including area code: (610) 669-1000 | ||
Date of fiscal year end: September 30 | ||
Date of reporting period: October 1, 2013 – September 30, 2014 | ||
Item 1: Reports to Shareholders | ||
Annual Report | September 30, 2014
Vanguard Growth and Income Fund
The mission continues
On May 1, 1975, Vanguard began operations, a fledgling company based on the simple but revolutionary idea that a mutual fund company should be managed solely in the interest of its investors.
Four decades later, that revolutionary spirit continues to animate the enterprise. Vanguard remains on a mission to give investors the best chance of investment success.
As we mark our 40th anniversary, we thank you for entrusting your assets to Vanguard and giving us the opportunity to help you reach your financial goals in the decades to come.
| Contents | |
| Your Fund’s Total Returns. | 1 |
| Chairman’s Letter. | 2 |
| Advisors’ Report. | 7 |
| Fund Profile. | 11 |
| Performance Summary. | 12 |
| Financial Statements. | 14 |
| Your Fund’s After-Tax Returns. | 33 |
| About Your Fund’s Expenses. | 34 |
| Trustees Approve Advisory Arrangements. | 36 |
| Glossary. | 38 |
Please note: The opinions expressed in this report are just that—informed opinions. They should not be considered promises or advice.
Also, please keep in mind that the information and opinions cover the period through the date on the front of this report. Of course, the risks of investing in your fund are spelled out in the prospectus.
See the Glossary for definitions of investment terms used in this report.
About the cover: Since our founding, Vanguard has drawn inspiration from the enterprise and valor demonstrated by British naval hero Horatio Nelson and his command at the Battle of the Nile in 1798. The photograph displays a replica of a merchant ship from the same era as Nelson’s flagship, the HMS Vanguard.
Your Fund’s Total Returns
| Fiscal Year Ended September 30, 2014 | |
| Total | |
| Returns | |
| Vanguard Growth and Income Fund | |
| Investor Shares | 20.42% |
| Admiral™ Shares | 20.55 |
| S&P 500 Index | 19.73 |
| Large-Cap Core Funds Average | 17.40 |
| Large-Cap Core Funds Average: Derived from data provided by Lipper, a Thomson Reuters Company. Admiral Shares carry lower expenses and are available to investors who meet certain account-balance requirements. | |
| Your Fund’s Performance at a Glance | ||||
| September 30, 2013, Through September 30, 2014 | ||||
| Distributions Per Share | ||||
| Starting | Ending | |||
| Share | Share | Income | Capital | |
| Price | Price | Dividends | Gains | |
| Vanguard Growth and Income Fund | ||||
| Investor Shares | $36.02 | $42.69 | $0.640 | $0.000 |
| Admiral Shares | 58.82 | 69.71 | 1.119 | 0.000 |
1

Chairman’s Letter
Dear Shareholder,
The broad U.S. stock market advanced for the 12 months ended September 30, 2014, despite investors’ concerns over the strength of the global economy, geopolitical turmoil, and the winding down of the Federal Reserve’s bond-buying program.
Vanguard Growth and Income Fund returned about 20% for the fiscal year. Its return exceeded that of its benchmark, the Standard & Poor’s 500 Index, and the average return of its large-capitalization core fund peers.
The fund posted strong results across all industry sectors. The industrial, consumer discretionary, and materials sectors contributed most to its outperformance.
If you own shares of the fund in a taxable account, you may wish to review information on the fund’s after-tax returns that appears later in this report. Please note that as of September 30, 2014, the fund had realized capital gains (primarily long-term) equal to about 6% of fund assets. Gains are distributed in December.
Brief patchiness for stocks didn’t hinder solid returns
The broad U.S. stock market managed a robust return of nearly 18% for the fiscal year ended September 30, despite stumbling in two of the final three months. Generally strong corporate profits and progress in the U.S. economy carried the markets through most of the period. High
stock valuations, international tensions, the unsettled global economy, and the Fed’s gradual shift from its accommodative policies restrained more recent results.
During the period’s final months, the performance gap between U.S. and international stocks widened amid tensions in the Middle East and Ukraine and anxiety over China’s slower growth and Europe’s slumping economy. International stocks returned about 5%. Emerging markets returned more than 6%, ahead of developed European markets; weakness in Japan weighed on the developed Pacific region.
Bonds bounced back strongly despite their recent pause
Bond returns, which were surprisingly robust through most of the fiscal year, also met resistance late in the period. Still, the broad U.S. taxable bond market returned 3.96%, a significant recovery from its negative outcome a year ago.
Since January, the Fed has pared back its bond-buying program, with the aim of ending it in October. For most of the fiscal year, interest rates did not rise as analysts had predicted. The yield of the 10-year U.S. Treasury note ended September at 2.48%, down from 2.63% a year earlier. (Bond prices and yields move in opposite directions.)
| Market Barometer | |||
| Average Annual Total Returns | |||
| Periods Ended September 30, 2014 | |||
| One | Three | Five | |
| Year | Years | Years | |
| Stocks | |||
| Russell 1000 Index (Large-caps) | 19.01% | 23.23% | 15.90% |
| Russell 2000 Index (Small-caps) | 3.93 | 21.26 | 14.29 |
| Russell 3000 Index (Broad U.S. market) | 17.76 | 23.08 | 15.78 |
| FTSE All-World ex US Index (International) | 5.11 | 12.12 | 6.31 |
| Bonds | |||
| Barclays U.S. Aggregate Bond Index (Broad taxable market) | 3.96% | 2.43% | 4.12% |
| Barclays Municipal Bond Index (Broad tax-exempt market) | 7.93 | 4.56 | 4.67 |
| Citigroup Three-Month U.S. Treasury Bill Index | 0.04 | 0.04 | 0.06 |
| CPI | |||
| Consumer Price Index | 1.66% | 1.61% | 1.96% |
3
Municipal bonds, which returned 7.93%, benefited from the broad market rally and a limited supply of new issues.
After this advance for U.S. taxable and tax-exempt bonds, it’s worth remembering that the current low yields imply lower future returns. As yields drop, the scope for further declines—and increases in prices—diminishes.
International bond markets (as measured by the Barclays Global Aggregate Index ex USD) returned –0.81% after sinking in September.
Money market funds and savings accounts posted negligible returns, as the Fed kept its target for short-term interest rates to 0%–0.25%.
All sectors contributed to the fund’s robust result
The Growth and Income Fund invests in a diversified portfolio of hundreds of large-cap stocks. The goal of the fund is to outpace the S&P 500 Index while maintaining similar risk and sector profiles. To do this, all of the fund’s three advisors use a quantitative investment strategy. They develop—and constantly refine—computer models to pinpoint opportunities among large-cap stocks.
During the period, the fund’s result was bolstered by large-caps’ strong performance. After posting exceptional results earlier in the period, small-cap stocks retreated amid growing concerns over their valuations. In general, small companies tend to be more volatile and
| Expense Ratios | |||
| Your Fund Compared With Its Peer Group | |||
| Investor | Admiral | Peer Group | |
| Shares | Shares | Average | |
| Growth and Income Fund | 0.36% | 0.26% | 1.15% |
| The fund expense ratios shown are from the prospectus dated January 27, 2014, and represent estimated costs for the current fiscal year. For the fiscal year ended September 30, 2014, the fund’s expense ratios were 0.37% for Investor Shares and 0.26% for Admiral Shares. The peer-group expense ratio is derived from data provided by Lipper, a Thomson Reuters Company, and captures information through year-end 2013. | |||
Peer group: Large-Cap Core Funds.
4
vulnerable to sharp swings in share price than large companies. This is the case partly because they lack the balance-sheet heft and other resources available to larger firms.
The underperformance of small-caps this fiscal year stands in contrast to recent years, when large-cap stocks lagged. Of course, market leadership alternates over time; that’s one of the reasons Vanguard suggests broad diversification as the best course.
For the 12 months, all of the fund’s sectors delivered double-digit gains.
Industrials contributed most to outperformance. Outsized positions in aerospace and defense stocks benefited as increased conflict in the Middle East led to expectations of greater demand for military equipment and contractors from the U.S. government and its allies. Commercial airline stocks also did well. The carriers have raised their earnings through industry consolidation, improved pricing dynamics, and more efficient use of seating capacity.
Choices among consumer discretionary and materials stocks were additional sources of strength. In consumer discretionary, the advisors took advantage of solid resort hotel, movie and entertainment company, and online retailer stocks. Limited exposure to some restaurants also helped.
In materials, holdings among commodity chemical manufacturers benefited from lower U.S. natural gas prices, which helped
| Total Returns | |
| Ten Years Ended September 30, 2014 | |
| Average | |
| Annual Return | |
| Growth and Income Fund Investor Shares | 7.37% |
| S&P 500 Index | 8.11 |
| Large-Cap Core Funds Average | 6.92 |
| Large-Cap Core Funds Average: Derived from data provided by Lipper, a Thomson Reuters Company. | |
The figures shown represent past performance, which is not a guarantee of future results. (Current performance may be lower or higher than the performance data cited. For performance data current to the most recent month-end, visit our website at vanguard.com/performance.) Note, too, that both investment returns and principal value can fluctuate widely, so an investor’s shares, when sold, could be worth more or less than their original cost.
5
lower their raw material costs. The fund’s weakest performance was in financials. The advisors missed several opportunities by underweighting some diversified banking stocks.
For more about the advisors’ strategy and the fund’s positioning during the 12 months, please see the Advisors’ Report that follows this letter.
The fund is now well positioned for competitive long-term results
For the decade ended September 30, 2014, Investor Shares of the Growth and Income Fund returned an annual average of 7.37%, lagging the benchmark but beating the average return of peers.
The fund suffered along with the broader stock market during the 2008–2009 financial crisis. It was a highly volatile period and an especially difficult one for funds relying on quantitative stock-selection strategies. The years immediately after the crisis remained a challenge, but the fund has shown its resilience and, over the past four years, has succeeded in outpacing its benchmark.
Some of this improvement coincides with changes that have taken place in the fund’s management. As you may be aware, this is the third year that the fund has used a multimanager approach. All the advisors share a quantitative strategy, but each brings to the table a slightly different approach, providing a diversification benefit to investors. We’re confident that these diverse yet complementary approaches will deliver competitive returns for you and other investors over the long term.
High costs don’t equal strong fund performance
The adage “you get what you pay for” doesn’t apply to mutual funds. In fact, the reverse is true: Research suggests that higher costs are consistent with weaker returns. (See, for example, Shopping for Alpha: You Get What You Don’t Pay For at vanguard.com/research.)
Shouldn’t paying the highest fees allow you to purchase the services of the greatest talents and therefore get the best returns? As it turns out, the data don’t support that argument. The explanation is simple: Every dollar paid for management fees is a dollar less earning potential return. Keeping expenses down can help narrow the gap between what the markets return and what investors actually earn.
That’s why Vanguard always seeks to minimize costs. Indexing, of course, is the purest form of low-cost investing. And we negotiate low fees for our actively managed funds, which are run by world-class advisors. It’s a strategy that reflects decades of experience and research, boiled down to one tenet: The less you pay, the more you keep.
As always, thank you for investing with Vanguard.
Sincerely,

F. William McNabb III
Chairman and Chief Executive Officer
October 14, 2014
6
Advisors’ Report
Vanguard Growth and Income Fund’s Investor Shares returned 20.42% for the 12 months ended September 30. The fund’s Admiral Shares returned 20.55%. Its benchmark, the Standard & Poor’s 500 Index, returned 19.73%, and the average return of its large-cap core fund peers was 17.40%.
Your fund is managed by three independent advisors, a strategy that enhances the fund’s diversification by providing exposure to distinct yet complementary investment approaches. It is not uncommon for different advisors to have different views about individual securities or the broader investment environment. The advisors, the percentage of fund assets each manages, and brief descriptions of their investment strategies are presented in the table below. The advisors have also prepared a discussion of the investment environment that existed during the fiscal year and of how the portfolio’s positioning reflects this assessment. (Please note that Los Angeles Capital’s discussion refers to industry sectors as defined by Russell classifications rather than by the Global Industry Classification Standard used elsewhere in this report.) These comments were prepared on October 16, 2014.
| Vanguard Growth and Income Fund Investment Advisors | ||||
| Fund Assets Managed | ||||
| Investment Advisor | % | $ Million | Investment Strategy | |
| Vanguard Equity Investment | 33 | 1,933 | Employs a quantitative fundamental management | |
| Group | approach, using models that assess valuation, growth | |||
| prospects, management decisions, market sentiment, | ||||
| and earnings and balance-sheet quality of companies | ||||
| as compared with their peers. | ||||
| D. E. Shaw Investment | 33 | 1,928 | Employs quantitative models that seek to capture | |
| Management, L.L.C. | predominantly “bottom up” stock-specific return | |||
| opportunities while aiming to keep the portfolio’s | ||||
| sector weights, size, and style characteristics similar to | ||||
| the benchmark. | ||||
| Los Angeles Capital | 33 | 1,922 | Employs a quantitative model that emphasizes stocks | |
| with characteristics investors are currently seeking and | ||||
| underweights stocks with characteristics investors are | ||||
| currently avoiding. The portfolio’s sector weights, size, | ||||
| and style characteristics may differ modestly from the | ||||
| benchmark in a risk-controlled manner. | ||||
| Cash Investments | 1 | 113 | These short-term reserves are invested by Vanguard in | |
| equity index products to simulate investments in | ||||
| stocks. Each advisor also may maintain a modest cash | ||||
| position. | ||||
7
Vanguard Equity Investment Group
Portfolio Managers:
James D. Troyer, CFA, Principal
James P. Stetler, Principal
Michael R. Roach, CFA
For the fiscal year ended September 30, 2014, equities continued to produce above-average returns. The broad U.S. equity market as measured by the Russell 3000 Index rose 17.76%. The Russell 1000 Index of large-capitalization stocks gained 19.01%, and the Russell 2000 Index of small-cap stocks was up 3.93%. All ten sectors in the fund’s benchmark, the Standard & Poor’s 500 Index, produced positive results. Information technology, health care, and financials did best; consumer discretionary, energy, and telecommunication services companies lagged.
Part of the strength in the U.S. equity markets can be attributed to the continued accommodative policies of central banks and lower volatility in the financial markets. The labor market continued to recover, and at fiscal year-end the U.S. unemployment rate fell to 5.9%—a level not seen since July 2008. That said, many factors could still affect the markets in the coming months, including the U.S. mid-term elections and the winding down of the Federal Reserve’s bond-purchase program at the end of October.
It’s important to understand how portfolio performance is affected by the macro factors listed above, but we think it is also important to focus on our approach, which emphasizes specific stock fundamentals. Our process compares stocks within the same industry groups in order to identify those with characteristics that we believe will help them outperform over the long run. We use a strict quantitative process that concentrates on a combination of valuation and other factors focused on fundamental growth. We then use the results of our model to construct our portfolio. Our goal is to maximize expected return and minimize exposure to risks that our research indicates do not improve returns, such as market-capitalization and other risks in relation to our benchmark.
The model’s effectiveness during the period was promising. Our stock selection was positive in eight of the ten sectors in the benchmark, although we underperformed in financials.
At the individual stock level, the largest contributions came from overweight positions in Southwest Airlines and Hewlett-Packard. Relative to the benchmark, we benefited from underweighting or avoiding poorly performing stocks including eBay and General Motors.
Unfortunately, we could not avoid all laggards. Overweight positions in Bank of America and Intel lowered results. Underweighting two companies—Actavis and Williams—that were not positively identified by the fundamentals in our model also hurt our relative performance.
8
D. E. Shaw Investment
Management, L.L.C.
Portfolio Managers:
Anne Dinning, Ph.D., Managing Director and Chief Investment Officer
Philip Kearns, Ph.D., Managing Director
Equity market valuations for the fiscal year ended September 30, 2014, were primarily driven by macroeconomic developments in the United States, Europe, and emerging markets. Stock markets appeared particularly sensitive to U.S. federal budget negotiations in late 2013, the Federal Reserve’s tapering of its monetary stimulus program, and tensions in Ukraine and the Middle East.
The continued resurgence of the U.S. oil industry, making the country less reliant on imports from the Middle East, was perhaps a major factor in the resilience of U.S. stock prices. Stronger-than-expected GDP growth and employment data, solid corporate profits, and rising merger-and-acquisition activity also seemed to contribute. And evidence of the United States’ strengthening economy and buoyant equity markets may have helped bolster global stock markets amid signs, albeit temporary, of weakness in China’s manufacturing sector.
The portion of Vanguard Growth and Income Fund managed by D. E. Shaw Investment Management, L.L.C. (DESIM) outpaced its Standard & Poor’s 500 Index benchmark for the period. We generally attribute this to three major factors: bottom-up stock selection; exposure to common risk factors such as value, growth, and market capitalization; and exposure to industry groups. Based on our analysis, the performance of the portion of the fund managed by DESIM was driven mostly by stock selection. The three largest single-stock contributors were underweight positions in Chevron and Gilead and an overweight allocation to LyondellBasell. The three biggest single-stock detractors were underweight positions in Google and Microsoft and an overweight allocation to Coach.
Common risk factors slightly crimped returns. The relative performance of the portion of the fund managed by DESIM benefited from modest exposures to high-momentum, low-dividend-yield, and value stocks, but small exposures to low-liquidity and high-volatility stocks detracted. Sector and industry deviations from benchmark weights boosted results modestly.
Favorable trends in the U.S. equity markets may have overcome potential problems including unrest in Ukraine and the Middle East, concerns about U.S. budgetary politics, and a reduction in the Federal Reserve’s monetary stimulus program. We believe that potential shocks on the macroeconomic or political front in the United States, Europe, or China constitute clear current risks.
9
Los Angeles Capital
Portfolio Managers:
Thomas D. Stevens, CFA, Chairman and Principal
Hal W. Reynolds, CFA, Chief Investment Officer and Principal
For the fiscal year ended September 30, the S&P 500 Index rose 19.73%, with gains broadly distributed across economic sectors. Mergers and acquisitions and divestment activity were important drivers of return. Falling growth rates and lower long-term interest rates have pushed companies to seek greater efficiencies while lowering their capital costs. To the surprise of many investors, U.S. profit margins continued to expand. Despite low real GDP estimates by historical standards, year-over-year profit growth remained strong, with earnings quality at one of the highest levels since the financial crisis. As the third quarter came to an end, however, investor concerns about valuations and growth rates rose again. The Chicago Board Options Exchange Volatility Index (VIX) moved well above its one-year average to 16.3.
Stocks with strong earnings yields and higher growth expectations contributed to return. Larger-capitalization stocks have been particularly strong, outpacing small-caps over the past year by 15%, a level not seen since the 1990s. Growth outpaced value, and higher-yielding stocks underperformed as investors anticipated an eventual rise in interest rates. Companies with higher foreign revenues also lagged because of the relative strength of the U.S. economy versus Europe and Japan.
Growth-oriented sectors including health care (biotechnology) and technology (internet) were the strongest performers. Energy was among the weakest sectors as prices fell as a result of expanded supply, Saudi Arabia’s price cuts, and increasing talk of divestment by institutional investors. These same factors were positive for transportation stocks, which benefited from the prospect of falling energy prices. Deteriorating growth projections hurt capital goods, cyclicals, and retail.
Over the year, the portfolio shifted out of cyclicals and finance toward the growth of technology and the stability of utilities. The portfolio increased its exposure to more attractively valued larger-market-cap securities with strong profit margins, and reduced its exposure to volatile, distressed securities. Today, the portfolio is positioned toward attractively priced securities with above-average earnings growth expectations.
10
Growth and Income Fund
Fund Profile
As of September 30, 2014
| Share-Class Characteristics | ||
| Investor | Admiral | |
| Shares | Shares | |
| Ticker Symbol | VQNPX | VGIAX |
| Expense Ratio1 | 0.36% | 0.26% |
| 30-Day SEC Yield | 1.64% | 1.75% |
| Portfolio Characteristics | |||
| DJ | |||
| U.S. | |||
| Total | |||
| Market | |||
| S&P 500 | FA | ||
| Fund | Index | Index | |
| Number of Stocks | 700 | 502 | 3,768 |
| Median Market Cap | $61.9B | $75.5B | $51.1B |
| Price/Earnings Ratio | 18.3x | 19.1x | 20.5x |
| Price/Book Ratio | 2.7x | 2.7x | 2.6x |
| Return on Equity | 19.0% | 19.1% | 17.8% |
| Earnings Growth | |||
| Rate | 15.5% | 15.2% | 15.2% |
| Dividend Yield | 2.1% | 2.0% | 1.9% |
| Foreign Holdings | 0.1% | 0.0% | 0.0% |
| Turnover Rate | 133% | — | — |
| Short-Term Reserves | 0.3% | — | — |
| Sector Diversification (% of equity exposure) | |||
| DJ | |||
| U.S. Total | |||
| S&P 500 | Market | ||
| Fund | Index | FA Index | |
| Consumer | |||
| Discretionary | 11.8% | 11.7% | 12.5% |
| Consumer Staples | 9.1 | 9.5 | 8.3 |
| Energy | 8.8 | 9.7 | 9.1 |
| Financials | 14.4 | 16.3 | 17.4 |
| Health Care | 16.0 | 13.9 | 13.5 |
| Industrials | 11.3 | 10.3 | 11.2 |
| Information | |||
| Technology | 18.9 | 19.7 | 19.0 |
| Materials | 3.8 | 3.5 | 3.8 |
| Telecommunication | |||
| Services | 3.1 | 2.4 | 2.2 |
| Utilities | 2.8 | 3.0 | 3.0 |
| Volatility Measures | ||
| DJ | ||
| U.S. Total | ||
| S&P 500 | Market | |
| Index | FA Index | |
| R-Squared | 0.99 | 0.98 |
| Beta | 1.00 | 0.95 |
| These measures show the degree and timing of the fund’s fluctuations compared with the indexes over 36 months. | ||
| Ten Largest Holdings (% of total net assets) | ||
| Apple Inc. | Technology | |
| Hardware, Storage & | ||
| Peripherals | 3.7% | |
| Johnson & Johnson | Pharmaceuticals | 2.3 |
| Exxon Mobil Corp. | Integrated Oil & Gas | 1.8 |
| General Electric Co. | Industrial | |
| Conglomerates | 1.8 | |
| Pfizer Inc. | Pharmaceuticals | 1.7 |
| Microsoft Corp. | Systems Software | 1.7 |
| Merck & Co. Inc. | Pharmaceuticals | 1.6 |
| Procter & Gamble Co. | Household Products | 1.5 |
| Gilead Sciences Inc. | Biotechnology | 1.5 |
| AT&T Inc. | Integrated | |
| Telecommunication | ||
| Services | 1.4 | |
| Top Ten | 19.0% | |
| The holdings listed exclude any temporary cash investments and equity index products. | ||
Investment Focus

1 The expense ratios shown are from the prospectus dated January 27, 2014, and represent estimated costs for the current fiscal year. For the fiscal year ended September 30, 2014, the expense ratios were 0.37% for Investor Shares and 0.26% for Admiral Shares.
11
Growth and Income Fund
Performance Summary
All of the returns in this report represent past performance, which is not a guarantee of future results that may be achieved by the fund. (Current performance may be lower or higher than the performance data cited. For performance data current to the most recent month-end, visit our website at vanguard.com/performance.) Note, too, that both investment returns and principal value can fluctuate widely, so an investor’s shares, when sold, could be worth more or less than their original cost. The returns shown do not reflect taxes that a shareholder would pay on fund distributions or on the sale of fund shares.
Cumulative Performance: September 30, 2004, Through September 30, 2014
Initial Investment of $10,000

| Average Annual Total Returns | |||||
| Periods Ended September 30, 2014 | |||||
| Final Value | |||||
| One | Five | Ten | of a $10,000 | ||
| Year | Years | Years | Investment | ||
| Growth and Income Fund*Investor | |||||
| Shares | 20.42% | 15.89% | 7.37% | $20,363 | |
| •••••••• | S&P 500 Index | 19.73 | 15.70 | 8.11 | 21,804 |
| – – – – | Large-Cap Core Funds Average | 17.40 | 13.80 | 6.92 | 19,531 |
| Dow Jones U.S. Total Stock Market | |||||
| Float Adjusted Index | 17.69 | 15.84 | 8.59 | 22,805 | |
| Large-Cap Core Funds Average: Derived from data provided by Lipper, a Thomson Reuters Company. | |||||
| Final Value | ||||
| One | Five | Ten | of a $50,000 | |
| Year | Years | Years | Investment | |
| Growth and Income Fund Admiral Shares | 20.55% | 16.02% | 7.51% | $103,172 |
| S&P 500 Index | 19.73 | 15.70 | 8.11 | 109,022 |
| Dow Jones U.S. Total Stock Market Float | ||||
| Adjusted Index | 17.69 | 15.84 | 8.59 | 114,024 |
See Financial Highlights for dividend and capital gains information.
12
Growth and Income Fund
Fiscal-Year Total Returns (%): September 30, 2004, Through September 30, 2014
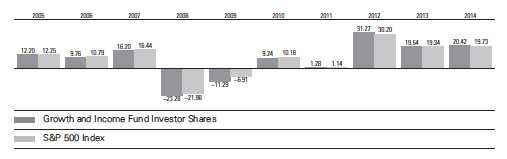
Growth and Income Fund
Financial Statements
Statement of Net Assets
As of September 30, 2014
The fund reports a complete list of its holdings in regulatory filings four times in each fiscal year, at the quarter-ends. For the second and fourth fiscal quarters, the lists appear in the fund’s semiannual and annual reports to shareholders. For the first and third fiscal quarters, the fund files the lists with the Securities and Exchange Commission on Form N-Q. Shareholders can look up the fund’s Forms N-Q on the SEC’s website at sec.gov. Forms N-Q may also be reviewed and copied at the SEC’s Public Reference Room (see the back cover of this report for further information).
| Market | |||
| Value | |||
| Shares | ($000) | ||
| Common Stocks (97.9%)1 | |||
| Consumer Discretionary (11.5%) | |||
| Home Depot Inc. | 526,078 | 48,262 | |
| Lowe’s Cos. Inc. | 811,322 | 42,935 | |
| Comcast Corp. Class A | 762,580 | 41,012 | |
| Walt Disney Co. | 434,475 | 38,681 | |
| Wyndham Worldwide Corp. | 455,297 | 36,997 | |
| * | Priceline Group Inc. | 26,410 | 30,598 |
| NIKE Inc. Class B | 336,700 | 30,034 | |
| Time Warner Inc. | 331,934 | 24,965 | |
| * | Netflix Inc. | 54,800 | 24,725 |
| Time Warner Cable Inc. | 143,320 | 20,565 | |
| Cablevision Systems Corp. | |||
| Class A | 1,165,432 | 20,407 | |
| McDonald’s Corp. | 205,871 | 19,519 | |
| Viacom Inc. Class B | 186,682 | 14,363 | |
| * | AutoZone Inc. | 28,115 | 14,329 |
| Delphi Automotive plc | 230,300 | 14,127 | |
| Marriott International Inc. | |||
| Class A | 201,126 | 14,059 | |
| Expedia Inc. | 148,801 | 13,038 | |
| * | Chipotle Mexican Grill Inc. | ||
| Class A | 19,470 | 12,978 | |
| Newell Rubbermaid Inc. | 371,685 | 12,790 | |
| Ford Motor Co. | 853,680 | 12,626 | |
| Best Buy Co. Inc. | 370,385 | 12,441 | |
| * | O’Reilly Automotive Inc. | 79,300 | 11,924 |
| H&R Block Inc. | 360,100 | 11,167 | |
| Kohl’s Corp. | 172,880 | 10,551 | |
| PVH Corp. | 83,010 | 10,057 | |
| General Motors Co. | 289,061 | 9,233 | |
| Omnicom Group Inc. | 116,050 | 7,991 | |
| * | Charter Communications | ||
| Inc. Class A | 51,200 | 7,750 | |
| Starbucks Corp. | 100,940 | 7,617 | |
| Graham Holdings Co. | |||
| Class B | 10,750 | 7,521 | |
| * | Fossil Group Inc. | 78,140 | 7,337 |
| Macy’s Inc. | 111,680 | 6,498 | |
| Market | |||
| Value | |||
| Shares | ($000) | ||
| * | DIRECTV | 72,277 | 6,253 |
| Gap Inc. | 143,296 | 5,974 | |
| Interpublic Group of | |||
| Cos. Inc. | 324,585 | 5,946 | |
| Staples Inc. | 437,462 | 5,293 | |
| Wynn Resorts Ltd. | 25,437 | 4,759 | |
| * | Ulta Salon Cosmetics & | ||
| Fragrance Inc. | 38,800 | 4,585 | |
| Johnson Controls Inc. | 83,160 | 3,659 | |
| * | MGM Resorts International | 159,000 | 3,622 |
| * | Amazon.com Inc. | 10,250 | 3,305 |
| Goodyear Tire & Rubber Co. | 126,900 | 2,866 | |
| Target Corp. | 44,390 | 2,782 | |
| * | NVR Inc. | 2,404 | 2,717 |
| Signet Jewelers Ltd. | 21,000 | 2,392 | |
| Whirlpool Corp. | 16,186 | 2,357 | |
| * | Liberty Global plc | 56,985 | 2,337 |
| GameStop Corp. Class A | 53,437 | 2,202 | |
| * | TripAdvisor Inc. | 23,000 | 2,103 |
| * | Liberty Media Corp. | 41,600 | 1,955 |
| Ross Stores Inc. | 21,400 | 1,617 | |
| Hasbro Inc. | 28,517 | 1,568 | |
| * | Discovery Communications | ||
| Inc. Class A | 39,940 | 1,510 | |
| * | Discovery | ||
| Communications Inc. | 39,940 | 1,489 | |
| * | Apollo Education Group Inc. | 50,460 | 1,269 |
| DeVry Education Group Inc. | 23,050 | 987 | |
| *,^ | Sears Holdings Corp. | 38,700 | 976 |
| Starwood Hotels & | |||
| Resorts Worldwide Inc. | 11,240 | 935 | |
| * | Time Inc. | 34,021 | 797 |
| * | Kate Spade & Co. | 20,600 | 540 |
| * | Jarden Corp. | 7,346 | 442 |
| * | Visteon Corp. | 3,600 | 350 |
| * | Sirius XM Holdings Inc. | 100,300 | 350 |
| * | Sally Beauty Holdings Inc. | 12,100 | 331 |
| SeaWorld Entertainment Inc. | 16,900 | 325 | |
| Genuine Parts Co. | 2,657 | 233 | |
| Advance Auto Parts Inc. | 1,700 | 221 |
14
Growth and Income Fund
| Market | |||
| Value | |||
| Shares | ($000) | ||
| Lamar Advertising Co. | |||
| Class A | 4,200 | 207 | |
| * | Lee Enterprises Inc. | 56,400 | 191 |
| Lear Corp. | 1,800 | 156 | |
| Big 5 Sporting Goods Corp. | 16,229 | 152 | |
| Tractor Supply Co. | 2,240 | 138 | |
| * | Live Nation | ||
| Entertainment Inc. | 5,570 | 134 | |
| Wendy’s Co. | 16,100 | 133 | |
| * | Tempur Sealy | ||
| International Inc. | 2,200 | 124 | |
| * | Orbitz Worldwide Inc. | 14,700 | 116 |
| * | Ascena Retail Group Inc. | 6,900 | 92 |
| TJX Cos. Inc. | 1,280 | 76 | |
| * | Cooper-Standard Holding Inc. | 1,200 | 75 |
| L Brands Inc. | 1,110 | 74 | |
| * | Biglari Holdings Inc. | 210 | 71 |
| DineEquity Inc. | 700 | 57 | |
| * | Libbey Inc. | 2,077 | 55 |
| * | Christopher & Banks Corp. | 5,100 | 50 |
| Einstein Noah | |||
| Restaurant Group Inc. | 2,100 | 42 | |
| * | Brookfield Residential | ||
| Properties Inc. | 2,200 | 42 | |
| Regis Corp. | 2,500 | 40 | |
| * | Hyatt Hotels Corp. Class A | 580 | 35 |
| * | Townsquare Media Inc. | 2,830 | 34 |
| CTC Media Inc. | 4,860 | 32 | |
| * | New York & Co. Inc. | 9,193 | 28 |
| Spartan Motors Inc. | 5,099 | 24 | |
| Hooker Furniture Corp. | 1,220 | 19 | |
| * | Ambassadors Group Inc. | 4,798 | 18 |
| * | Citi Trends Inc. | 700 | 15 |
| New Media Investment | |||
| Group Inc. | 882 | 15 | |
| * | Liberty Interactive Corp. | ||
| Class A | 400 | 11 | |
| * | La Quinta Holdings Inc. | 600 | 11 |
| * | Weight Watchers | ||
| International Inc. | 397 | 11 | |
| * | Barnes & Noble Inc. | 500 | 10 |
| Blyth Inc. | 1,000 | 8 | |
| * | New Home Co. Inc. | 600 | 8 |
| * | Central European Media | ||
| Enterprises Ltd. Class A | 3,100 | 7 | |
| Las Vegas Sands Corp. | 100 | 6 | |
| Twenty-First Century | |||
| Fox Inc. Class A | 122 | 4 | |
| Abercrombie & Fitch Co. | 100 | 4 | |
| Lincoln Educational | |||
| Services Corp. | 1,215 | 3 | |
| * | Liberty TripAdvisor | ||
| Holdings Inc. Class A | 100 | 3 | |
| Marcus Corp. | 200 | 3 | |
| * | Express Inc. | 200 | 3 |
| Market | |||
| Value | |||
| Shares | ($000) | ||
| * | Boyd Gaming Corp. | 208 | 2 |
| * | Quiksilver Inc. | 800 | 1 |
| * | Furniture Brands | ||
| International Inc. | 600 | — | |
| 678,484 | |||
| Consumer Staples (8.9%) | |||
| Procter & Gamble Co. | 1,084,740 | 90,836 | |
| Coca-Cola Co. | 1,399,834 | 59,717 | |
| Wal-Mart Stores Inc. | 742,279 | 56,762 | |
| PepsiCo Inc. | 478,981 | 44,588 | |
| Philip Morris | |||
| International Inc. | 521,268 | 43,474 | |
| CVS Health Corp. | 418,050 | 33,272 | |
| Archer-Daniels-Midland Co. | 486,120 | 24,841 | |
| * | Constellation Brands Inc. | ||
| Class A | 256,568 | 22,362 | |
| Dr Pepper Snapple | |||
| Group Inc. | 315,644 | 20,299 | |
| Tyson Foods Inc. Class A | 469,196 | 18,472 | |
| Kimberly-Clark Corp. | 166,467 | 17,907 | |
| Kroger Co. | 267,860 | 13,929 | |
| Mondelez International Inc. | |||
| Class A | 382,040 | 13,091 | |
| Molson Coors Brewing Co. | |||
| Class B | 158,500 | 11,799 | |
| Altria Group Inc. | 225,557 | 10,362 | |
| Coca-Cola Enterprises Inc. | 221,640 | 9,832 | |
| Avon Products Inc. | 706,470 | 8,901 | |
| Sysco Corp. | 109,927 | 4,172 | |
| Costco Wholesale Corp. | 28,517 | 3,574 | |
| Safeway Inc. | 75,810 | 2,600 | |
| Walgreen Co. | 41,880 | 2,482 | |
| Campbell Soup Co. | 55,020 | 2,351 | |
| Hormel Foods Corp. | 37,709 | 1,938 | |
| General Mills Inc. | 37,480 | 1,891 | |
| JM Smucker Co. | 18,093 | 1,791 | |
| * | Pilgrim’s Pride Corp. | 53,800 | 1,644 |
| Reynolds American Inc. | 19,895 | 1,174 | |
| Estee Lauder Cos. Inc. | |||
| Class A | 13,325 | 996 | |
| Keurig Green Mountain Inc. | 7,600 | 989 | |
| Kraft Foods Group Inc. | 16,509 | 931 | |
| * | Adecoagro SA | 37,600 | 331 |
| Cott Corp. | 10,502 | 72 | |
| * | Crimson Wine Group Ltd. | 6,540 | 60 |
| * | Farmer Bros Co. | 300 | 9 |
| 527,449 | |||
| Energy (8.6%) | |||
| Exxon Mobil Corp. | 1,141,547 | 107,363 | |
| Occidental | |||
| Petroleum Corp. | 551,099 | 52,988 | |
| Anadarko Petroleum Corp. | 430,266 | 43,646 | |
| Chevron Corp. | 365,072 | 43,560 | |
| ConocoPhillips | 492,990 | 37,724 | |
15
Growth and Income Fund
| Market | |||
| Value | |||
| Shares | ($000) | ||
| Schlumberger Ltd. | 213,529 | 21,714 | |
| EOG Resources Inc. | 194,700 | 19,279 | |
| Valero Energy Corp. | 404,870 | 18,733 | |
| Phillips 66 | 199,850 | 16,250 | |
| Kinder Morgan Inc. | 357,180 | 13,694 | |
| Hess Corp. | 145,100 | 13,686 | |
| Marathon Petroleum Corp. | 153,100 | 12,963 | |
| Nabors Industries Ltd. | 541,963 | 12,335 | |
| Chesapeake Energy Corp. | 508,830 | 11,698 | |
| National Oilwell Varco Inc. | 143,800 | 10,943 | |
| * | Newfield Exploration Co. | 253,900 | 9,412 |
| * | Cameron International Corp. | 118,710 | 7,880 |
| Devon Energy Corp. | 106,041 | 7,230 | |
| Marathon Oil Corp. | 182,510 | 6,861 | |
| Baker Hughes Inc. | 101,220 | 6,585 | |
| Halliburton Co. | 91,500 | 5,903 | |
| * | Southwestern Energy Co. | 155,800 | 5,445 |
| Helmerich & Payne Inc. | 33,011 | 3,231 | |
| * | FMC Technologies Inc. | 52,400 | 2,846 |
| Denbury Resources Inc. | 141,930 | 2,133 | |
| QEP Resources Inc. | 59,830 | 1,842 | |
| Spectra Energy Corp. | 40,594 | 1,594 | |
| ONEOK Inc. | 17,900 | 1,173 | |
| EnLink Midstream LLC | 23,600 | 975 | |
| * | Seventy Seven Energy Inc. | 38,926 | 924 |
| Williams Cos. Inc. | 15,400 | 852 | |
| * | WPX Energy Inc. | 24,800 | 597 |
| * | Unit Corp. | 7,287 | 427 |
| * | Pacific Drilling SA | 37,200 | 308 |
| * | Harvest Natural | ||
| Resources Inc. | 72,800 | 267 | |
| Tesoro Corp. | 3,264 | 199 | |
| * | TransAtlantic Petroleum Ltd. | 11,437 | 103 |
| * | Willbros Group Inc. | 11,400 | 95 |
| * | Kosmos Energy Ltd. | 8,500 | 85 |
| North Atlantic Drilling Ltd. | 12,200 | 81 | |
| * | Dorian LPG Ltd. | 2,900 | 52 |
| Ocean Rig UDW Inc. | 2,142 | 35 | |
| Nordic American | |||
| Offshore Ltd. | 1,839 | 32 | |
| EQT Corp. | 300 | 27 | |
| * | Apco Oil and Gas | ||
| International Inc. | 1,836 | 24 | |
| North American Energy | |||
| Partners Inc. | 3,300 | 21 | |
| * | Pioneer Energy | ||
| Services Corp. | 1,100 | 15 | |
| * | Cobalt International | ||
| Energy Inc. | 1,100 | 15 | |
| * | Key Energy Services Inc. | 2,700 | 13 |
| * | CHC Group Ltd. | 2,300 | 13 |
| * | Clayton Williams | ||
| Energy Inc. | 100 | 10 | |
| * | Hyperdynamics Corp. | 4,218 | 8 |
| * | Goodrich Petroleum Corp. | 400 | 6 |
| Market | |||
| Value | |||
| Shares | ($000) | ||
| Plains GP Holdings LP | |||
| Class A | 142 | 4 | |
| * | Ceres Inc. | 7,000 | 3 |
| Cosan Ltd. | 100 | 1 | |
| 503,903 | |||
| Financials (14.0%) | |||
| Wells Fargo & Co. | 1,453,807 | 75,409 | |
| JPMorgan Chase & Co. | 973,571 | 58,648 | |
| Citigroup Inc. | 1,108,578 | 57,447 | |
| Capital One Financial Corp. | 558,940 | 45,621 | |
| * | Berkshire Hathaway Inc. | ||
| Class B | 282,725 | 39,056 | |
| Bank of America Corp. | 1,821,790 | 31,062 | |
| American Express Co. | 323,403 | 28,311 | |
| American International | |||
| Group Inc. | 479,200 | 25,886 | |
| Assurant Inc. | 394,110 | 25,341 | |
| Goldman Sachs Group Inc. | 137,820 | 25,300 | |
| Ameriprise Financial Inc. | 188,704 | 23,282 | |
| KeyCorp | 1,548,540 | 20,642 | |
| Simon Property Group Inc. | 115,899 | 19,056 | |
| Travelers Cos. Inc. | 190,026 | 17,851 | |
| SunTrust Banks Inc. | 454,750 | 17,294 | |
| McGraw Hill Financial Inc. | 198,400 | 16,755 | |
| Navient Corp. | 944,600 | 16,729 | |
| Discover Financial Services | 235,738 | 15,179 | |
| Aon plc | 165,760 | 14,532 | |
| Legg Mason Inc. | 264,096 | 13,511 | |
| Host Hotels & Resorts Inc. | 598,800 | 12,772 | |
| PNC Financial Services | |||
| Group Inc. | 148,498 | 12,709 | |
| Aflac Inc. | 207,087 | 12,063 | |
| BlackRock Inc. | 35,264 | 11,578 | |
| Lincoln National Corp. | 215,530 | 11,548 | |
| Prudential Financial Inc. | 123,339 | 10,846 | |
| Progressive Corp. | 428,839 | 10,841 | |
| Regions Financial Corp. | 1,079,590 | 10,839 | |
| Unum Group | 303,000 | 10,417 | |
| General Growth | |||
| Properties Inc. | 359,705 | 8,471 | |
| Moody’s Corp. | 88,300 | 8,344 | |
| Crown Castle | |||
| International Corp. | 100,500 | 8,093 | |
| MetLife Inc. | 144,020 | 7,737 | |
| Ventas Inc. | 112,700 | 6,982 | |
| Prologis Inc. | 184,600 | 6,959 | |
| �� | BB&T Corp. | 158,050 | 5,881 |
| Principal Financial | |||
| Group Inc. | 93,710 | 4,917 | |
| T. Rowe Price Group Inc. | 60,400 | 4,735 | |
| Morgan Stanley | 131,530 | 4,547 | |
| Vornado Realty Trust | 44,900 | 4,488 | |
| HCP Inc. | 110,660 | 4,394 | |
| * | Realogy Holdings Corp. | 106,409 | 3,958 |
16
Growth and Income Fund
| Market | |||
| Value | |||
| Shares | ($000) | ||
| People’s United | |||
| Financial Inc. | 231,042 | 3,343 | |
| Kimco Realty Corp. | 140,637 | 3,081 | |
| Apartment Investment & | |||
| Management Co. Class A | 95,160 | 3,028 | |
| Validus Holdings Ltd. | 76,970 | 3,013 | |
| Bank of New York | |||
| Mellon Corp. | 77,625 | 3,006 | |
| US Bancorp | 68,216 | 2,854 | |
| Chubb Corp. | 30,269 | 2,757 | |
| * | E*TRADE Financial Corp. | 117,316 | 2,650 |
| Loews Corp. | 52,780 | 2,199 | |
| First Horizon National Corp. | 178,470 | 2,192 | |
| Equity Residential | 30,740 | 1,893 | |
| Allstate Corp. | 30,770 | 1,888 | |
| Leucadia National Corp. | 73,354 | 1,749 | |
| NASDAQ OMX Group Inc. | 35,180 | 1,492 | |
| Invesco Ltd. | 36,460 | 1,439 | |
| Equity Lifestyle | |||
| Properties Inc. | 33,200 | 1,406 | |
| Public Storage | 8,325 | 1,381 | |
| Torchmark Corp. | 25,900 | 1,356 | |
| SLM Corp. | 140,700 | 1,204 | |
| Retail Properties of | |||
| America Inc. | 80,700 | 1,181 | |
| Hartford Financial | |||
| Services Group Inc. | 29,530 | 1,100 | |
| XL Group plc Class A | 32,507 | 1,078 | |
| Northern Trust Corp. | 15,580 | 1,060 | |
| Charles Schwab Corp. | 34,900 | 1,026 | |
| * | CBRE Group Inc. Class A | 30,616 | 911 |
| ACE Ltd. | 7,900 | 829 | |
| AG Mortgage | |||
| Investment Trust Inc. | 39,800 | 708 | |
| CIT Group Inc. | 14,100 | 648 | |
| Excel Trust Inc. | 52,170 | 614 | |
| Health Care REIT Inc. | 8,500 | 530 | |
| Columbia Property Trust Inc. | 21,500 | 513 | |
| Erie Indemnity Co. Class A | 6,143 | 466 | |
| Endurance Specialty | |||
| Holdings Ltd. | 8,000 | 441 | |
| Macerich Co. | 6,538 | 417 | |
| State Street Corp. | 4,000 | 294 | |
| Chimera Investment Corp. | 96,100 | 292 | |
| Symetra Financial Corp. | 11,700 | 273 | |
| * | Genworth Financial Inc. | ||
| Class A | 18,970 | 249 | |
| * | NewStar Financial Inc. | 16,983 | 191 |
| ^ | Orchid Island Capital Inc. | 13,100 | 174 |
| Spirit Realty Capital Inc. | 15,635 | 172 | |
| Home Properties Inc. | 2,675 | 156 | |
| * | Equity Commonwealth | 5,900 | 152 |
| Washington Prime Group Inc. | 8,600 | 150 | |
| BankUnited Inc. | 4,200 | 128 | |
| Voya Financial Inc. | 2,900 | 113 |
| Market | |||
| Value | |||
| Shares | ($000) | ||
| Comerica Inc. | 2,238 | 112 | |
| Zions Bancorporation | 3,757 | 109 | |
| American Tower Corporation | 1,090 | 102 | |
| * | Synchrony Financial | 4,000 | 98 |
| Geo Group Inc. | 2,100 | 80 | |
| Arbor Realty Trust Inc. | 8,610 | 58 | |
| CME Group Inc. | 700 | 56 | |
| Apollo Residential | |||
| Mortgage Inc. | 3,500 | 54 | |
| First Niagara Financial | |||
| Group Inc. | 6,300 | 53 | |
| Plum Creek Timber Co. Inc. | 1,300 | 51 | |
| TFS Financial Corp. | 3,500 | 50 | |
| Brixmor Property Group Inc. | 2,246 | 50 | |
| CorEnergy Infrastructure | |||
| Trust Inc. | 6,019 | 45 | |
| Starwood Property Trust Inc. | 2,000 | 44 | |
| * | Alleghany Corp. | 100 | 42 |
| Investors Real Estate Trust | 4,400 | 34 | |
| RCS Capital Corp. Class A | 1,500 | 34 | |
| Apollo Commercial Real | |||
| Estate Finance Inc. | 2,100 | 33 | |
| ZAIS Financial Corp. | 1,872 | 32 | |
| BancorpSouth Inc. | 1,600 | 32 | |
| MVC Capital Inc. | 2,700 | 29 | |
| FelCor Lodging Trust Inc. | 3,100 | 29 | |
| ProAssurance Corp. | 600 | 27 | |
| * | Flagstar Bancorp Inc. | 1,495 | 25 |
| New Mountain Finance Corp. | 1,700 | 25 | |
| Marsh & McLennan Cos. Inc. 400 | 21 | ||
| * | Meridian Bancorp Inc. | 1,500 | 16 |
| Select Income REIT | 318 | 8 | |
| Suffolk Bancorp | 300 | 6 | |
| Oppenheimer Holdings Inc. | |||
| Class A | 200 | 4 | |
| * | Blue Hills Bancorp Inc. | 287 | 4 |
| Monmouth Real Estate | |||
| Investment Corp. | 208 | 2 | |
| Ashford Hospitality Trust Inc. | 200 | 2 | |
| SI Financial Group Inc. | 100 | 1 | |
| 827,196 | |||
| Health Care (15.7%) | |||
| Johnson & Johnson | 1,291,816 | 137,695 | |
| Pfizer Inc. | 3,433,590 | 101,531 | |
| Merck & Co. Inc. | 1,548,276 | 91,782 | |
| * | Gilead Sciences Inc. | 834,410 | 88,823 |
| AbbVie Inc. | 716,923 | 41,410 | |
| Eli Lilly & Co. | 619,605 | 40,181 | |
| * | Express Scripts | ||
| Holding Co. | 566,029 | 39,979 | |
| Cardinal Health Inc. | 390,680 | 29,270 | |
| * | Boston Scientific Corp. | 2,244,629 | 26,509 |
| WellPoint Inc. | 211,560 | 25,307 | |
| UnitedHealth Group Inc. | 266,018 | 22,944 | |
| Allergan Inc. | 110,600 | 19,708 | |
17
Growth and Income Fund
| Market | |||
| Value | |||
| Shares | ($000) | ||
| Thermo Fisher | |||
| Scientific Inc. | 156,133 | 19,001 | |
| Cigna Corp. | 206,738 | 18,749 | |
| Abbott Laboratories | 432,893 | 18,004 | |
| Amgen Inc. | 100,390 | 14,101 | |
| * | DaVita HealthCare | ||
| Partners Inc. | 178,301 | 13,041 | |
| * | Mylan Inc. | 283,390 | 12,891 |
| * | Biogen Idec Inc. | 37,070 | 12,263 |
| * | Edwards | ||
| Lifesciences Corp. | 112,400 | 11,482 | |
| Aetna Inc. | 135,820 | 11,001 | |
| * | Laboratory Corp. of | ||
| America Holdings | 107,110 | 10,898 | |
| Bristol-Myers Squibb Co. | 201,472 | 10,311 | |
| Humana Inc. | 76,870 | 10,015 | |
| * | Regeneron | ||
| Pharmaceuticals Inc. | 26,530 | 9,565 | |
| * | Celgene Corp. | 85,982 | 8,149 |
| McKesson Corp. | 41,300 | 8,040 | |
| * | Mallinckrodt plc | 78,001 | 7,032 |
| AmerisourceBergen Corp. | |||
| Class A | 89,570 | 6,924 | |
| * | CareFusion Corp. | 128,842 | 5,830 |
| Becton Dickinson and Co. | 47,482 | 5,404 | |
| CR Bard Inc. | 35,370 | 5,048 | |
| PerkinElmer Inc. | 97,950 | 4,271 | |
| * | HCA Holdings Inc. | 60,200 | 4,245 |
| Quest Diagnostics Inc. | 63,810 | 3,872 | |
| Agilent Technologies Inc. | 63,380 | 3,611 | |
| Stryker Corp. | 42,850 | 3,460 | |
| Baxter International Inc. | 46,888 | 3,365 | |
| * | Medivation Inc. | 32,400 | 3,203 |
| Medtronic Inc. | 44,158 | 2,736 | |
| Zoetis Inc. | 51,800 | 1,914 | |
| * | Health Net Inc. | 39,100 | 1,803 |
| Zimmer Holdings Inc. | 17,200 | 1,729 | |
| * | Hospira Inc. | 28,140 | 1,464 |
| Covidien plc | 13,900 | 1,203 | |
| * | VCA Inc. | 23,500 | 924 |
| * | Sarepta Therapeutics Inc. | 33,600 | 709 |
| * | Myriad Genetics Inc. | 17,981 | 694 |
| * | Dynavax | ||
| Technologies Corp. | 357,500 | 511 | |
| Universal Health | |||
| Services Inc. Class B | 3,800 | 397 | |
| * | Pain Therapeutics Inc. | 79,492 | 311 |
| * | Illumina Inc. | 1,800 | 295 |
| * | Neurocrine Biosciences Inc. | 18,700 | 293 |
| * | Catalent Inc. | 10,900 | 273 |
| * | XenoPort Inc. | 32,277 | 174 |
| * | Cytokinetics Inc. | 38,100 | 134 |
| Omnicare Inc. | 1,800 | 112 | |
| * | Allscripts Healthcare | ||
| Solutions Inc. | 8,100 | 109 |
| Market | |||
| Value | |||
| Shares | ($000) | ||
| * | Theravance Biopharma Inc. | 3,800 | 88 |
| * | Puma Biotechnology Inc. | 300 | 72 |
| * | Infinity Pharmaceuticals Inc. | 5,100 | 68 |
| * | Durect Corp. | 42,200 | 62 |
| * | Brookdale Senior Living Inc. | 1,800 | 58 |
| * | Bio-Rad Laboratories Inc. | ||
| Class A | 500 | 57 | |
| * | Genocea Biosciences Inc. | 5,929 | 54 |
| * | Triple-S Management Corp. | ||
| Class B | 2,518 | 50 | |
| * | Amicus Therapeutics Inc. | 8,300 | 49 |
| * | Medical Action Industries Inc. | 3,363 | 46 |
| Theravance Inc. | 2,501 | 43 | |
| * | ImmunoCellular | ||
| Therapeutics Ltd. | 47,092 | 42 | |
| * | Tenax Therapeutics Inc. | 9,036 | 36 |
| * | BioTelemetry Inc. | 5,282 | 35 |
| * | Alexion Pharmaceuticals Inc. | 200 | 33 |
| * | Rigel Pharmaceuticals Inc. | 16,979 | 33 |
| * | Alere Inc. | 800 | 31 |
| * | Vical Inc. | 25,242 | 28 |
| * | Targacept Inc. | 9,600 | 24 |
| * | Celsion Corp. | 7,500 | 22 |
| Transcept | |||
| Pharmaceuticals Inc. | 10,400 | 21 | |
| * | Zogenix Inc. | 17,800 | 21 |
| * | Eagle Pharmaceuticals Inc. | 1,579 | 20 |
| * | EPIRUS | ||
| Biopharmaceuticals Inc. | 2,710 | 20 | |
| * | BioCryst Pharmaceuticals Inc. | 1,900 | 19 |
| * | GlycoMimetics Inc. | 2,619 | 18 |
| * | Oncothyreon Inc. | 9,266 | 18 |
| * | KaloBios Pharmaceuticals Inc. | 10,972 | 17 |
| * | Arrowhead Research Corp. | 1,100 | 16 |
| * | Enzo Biochem Inc. | 3,057 | 16 |
| * | Assembly Biosciences Inc. | 1,380 | 11 |
| * | Repros Therapeutics Inc. | 1,127 | 11 |
| * | China Biologic Products Inc. | 200 | 11 |
| * | Cleveland Biolabs Inc. | 22,800 | 10 |
| * | Flexion Therapeutics Inc. | 453 | 8 |
| * | Neuralstem Inc. | 2,500 | 8 |
| * | Geron Corp. | 3,000 | 6 |
| * | ArQule Inc. | 5,100 | 6 |
| * | Biodel Inc. | 3,100 | 5 |
| POZEN Inc. | 700 | 5 | |
| * | Alimera Sciences Inc. | 900 | 5 |
| * | Discovery Laboratories Inc. | 2,300 | 4 |
| *,^ | GTx Inc. | 4,487 | 3 |
| * | Auspex Pharmaceuticals Inc. | 103 | 3 |
| * | Celladon Corp. | 200 | 2 |
| * | Stereotaxis Inc. | 600 | 1 |
| * | Omeros Corp. | 59 | 1 |
| * | Affymax Inc. | 4,600 | 1 |
| * | Baxano Surgical Inc. | 1,480 | — |
| 925,918 |
18
Growth and Income Fund
| Market | |||
| Value• | |||
| Shares | ($000) | ||
| Industrials (11.1%) | |||
| General Electric Co. | 4,106,490 | 105,208 | |
| General Dynamics Corp. | 438,530 | 55,733 | |
| Boeing Co. | 392,710 | 50,023 | |
| Union Pacific Corp. | 391,018 | 42,394 | |
| Illinois Tool Works Inc. | 330,700 | 27,918 | |
| Southwest Airlines Co. | 754,811 | 25,490 | |
| Tyco International Ltd. | 523,100 | 23,315 | |
| Northrop Grumman Corp. | 166,770 | 21,974 | |
| Pitney Bowes Inc. | 878,282 | 21,948 | |
| United Technologies Corp. | 207,210 | 21,881 | |
| Lockheed Martin Corp. | 114,054 | 20,847 | |
| Caterpillar Inc. | 204,476 | 20,249 | |
| FedEx Corp. | 125,329 | 20,234 | |
| Raytheon Co. | 189,550 | 19,262 | |
| Emerson Electric Co. | 215,549 | 13,489 | |
| Cintas Corp. | 158,200 | 11,167 | |
| Republic Services Inc. | |||
| Class A | 285,780 | 11,151 | |
| Delta Air Lines Inc. | 307,418 | 11,113 | |
| United Parcel Service Inc. | |||
| Class B | 113,039 | 11,111 | |
| 3M Co. | 74,940 | 10,617 | |
| ADT Corp. | 293,800 | 10,418 | |
| L-3 Communications | |||
| Holdings Inc. | 83,545 | 9,935 | |
| Snap-on Inc. | 80,200 | 9,711 | |
| Waste Management Inc. | 187,180 | 8,897 | |
| Stanley Black & Decker Inc. | 73,290 | 6,507 | |
| Honeywell International Inc. | 67,900 | 6,323 | |
| Ryder System Inc. | 51,395 | 4,624 | |
| CSX Corp. | 140,687 | 4,510 | |
| Deere & Co. | 53,332 | 4,373 | |
| * | Spirit AeroSystems | ||
| Holdings Inc. Class A | 113,800 | 4,331 | |
| Ingersoll-Rand plc | 75,260 | 4,242 | |
| Dun & Bradstreet Corp. | 33,330 | 3,915 | |
| CH Robinson Worldwide Inc. | 52,920 | 3,510 | |
| Nielsen NV | 71,600 | 3,174 | |
| Dover Corp. | 37,700 | 3,028 | |
| Norfolk Southern Corp. | 26,950 | 3,008 | |
| * | AerCap Holdings NV | 61,400 | 2,511 |
| Danaher Corp. | 28,248 | 2,146 | |
| * | Verisk Analytics Inc. | ||
| Class A | 31,800 | 1,936 | |
| Allison Transmission | |||
| Holdings Inc. | 59,200 | 1,687 | |
| Allegion plc | 27,600 | 1,315 | |
| Rockwell Automation Inc. | 8,735 | 960 | |
| Huntington Ingalls | |||
| Industries Inc. | 6,663 | 694 | |
| * | WABCO Holdings Inc. | 7,300 | 664 |
| Masco Corp. | 18,900 | 452 | |
| Babcock & Wilcox Co. | 15,200 | 421 | |
| KAR Auction Services Inc. | 13,300 | 381 | |
| * | MRC Global Inc. | 16,200 | 378 |
| Market | |||
| Value• | |||
| Shares | ($000) | ||
| * | Kirby Corp. | 2,800 | 330 |
| MFC Industrial Ltd. | 37,808 | 269 | |
| * | NOW Inc. | 7,322 | 223 |
| Expeditors International of | |||
| Washington Inc. | 4,275 | 173 | |
| Exelis Inc. | 10,197 | 169 | |
| * | Avis Budget Group Inc. | 2,900 | 159 |
| Alliant Techsystems Inc. | 918 | 117 | |
| PACCAR Inc. | 2,000 | 114 | |
| Civeo Corp. | 9,300 | 108 | |
| Triumph Group Inc. | 1,500 | 98 | |
| Pall Corp. | 1,100 | 92 | |
| * | Spirit Airlines Inc. | 1,260 | 87 |
| * | Quanta Services Inc. | 2,262 | 82 |
| Aegean Marine Petroleum | |||
| Network Inc. | 8,581 | 79 | |
| Rockwell Collins Inc. | 1,000 | 78 | |
| * | HD Supply Holdings Inc. | 2,800 | 76 |
| Heidrick & Struggles | |||
| International Inc. | 2,872 | 59 | |
| * | RPX Corp. | 4,018 | 55 |
| Argan Inc. | 1,513 | 51 | |
| * | Blount International Inc. | 3,200 | 48 |
| * | Norcraft Cos. Inc. | 2,800 | 45 |
| * | Costamare Inc. | 1,500 | 33 |
| * | Swift Transportation Co. | 1,200 | 25 |
| * | Jacobs Engineering | ||
| Group Inc. | 500 | 24 | |
| * | Box Ships Inc. | 18,631 | 23 |
| Hillenbrand Inc. | 700 | 22 | |
| Seaspan Corp. Class A | 1,000 | 22 | |
| * | Meritor Inc. | 1,800 | 20 |
| * | United Continental | ||
| Holdings Inc. | 400 | 19 | |
| * | ARC Document | ||
| Solutions Inc. | 2,239 | 18 | |
| Owens Corning | 500 | 16 | |
| Robert Half | |||
| International Inc. | 300 | 15 | |
| * | Old Dominion Freight | ||
| Line Inc. | 200 | 14 | |
| * | Air Transport Services | ||
| Group Inc. | 1,924 | 14 | |
| * | Genco Shipping & | ||
| Trading Ltd. Warrants | 2,303 | 13 | |
| Eaton Corp. plc | 200 | 13 | |
| Intersections Inc. | 2,940 | 11 | |
| * | Vectrus Inc. | 566 | 11 |
| AMETEK Inc. | 188 | 9 | |
| AAR Corp. | 200 | 5 | |
| Hardinge Inc. | 401 | 4 | |
| * | Hexcel Corp. | 99 | 4 |
| Iron Mountain Inc. | 20 | 1 | |
| 652,023 |
19
Growth and Income Fund
| Market | |||
| Value | |||
| Shares | ($000) | ||
| Information Technology (18.5%) | |||
| Apple Inc. | 2,192,181 | 220,862 | |
| Microsoft Corp. | 2,126,894 | 98,603 | |
| International Business | |||
| Machines Corp. | 353,754 | 67,153 | |
| Hewlett-Packard Co. | 1,842,800 | 65,364 | |
| Intel Corp. | 1,397,009 | 48,644 | |
| * | Google Inc. Class A | 77,544 | 45,628 |
| Cisco Systems Inc. | 1,490,994 | 37,528 | |
| Texas Instruments Inc. | 725,672 | 34,607 | |
| * | Facebook Inc. Class A | 401,810 | 31,759 |
| Computer Sciences Corp. | 488,340 | 29,862 | |
| * | eBay Inc. | 517,460 | 29,304 |
| Oracle Corp. | 738,315 | 28,263 | |
| * | Micron Technology Inc. | 789,110 | 27,035 |
| * | Google Inc. Class C | 43,546 | 25,142 |
| Fidelity National Information | |||
| Services Inc. | 367,404 | 20,685 | |
| Symantec Corp. | 814,986 | 19,160 | |
| Xerox Corp. | 1,344,720 | 17,791 | |
| Accenture plc Class A | 205,390 | 16,702 | |
| Western Digital Corp. | 168,105 | 16,360 | |
| MasterCard Inc. Class A | 218,060 | 16,119 | |
| Seagate Technology plc | 258,146 | 14,784 | |
| * | Cognizant Technology | ||
| Solutions Corp. Class A | 328,100 | 14,689 | |
| Harris Corp. | 216,710 | 14,390 | |
| Intuit Inc. | 150,000 | 13,147 | |
| QUALCOMM Inc. | 166,350 | 12,438 | |
| Western Union Co. | 766,112 | 12,288 | |
| * | VeriSign Inc. | 222,300 | 12,253 |
| Visa Inc. Class A | 57,020 | 12,166 | |
| * | Electronic Arts Inc. | 341,400 | 12,157 |
| * | Fiserv Inc. | 101,575 | 6,565 |
| CA Inc. | 231,310 | 6,463 | |
| Corning Inc. | 302,275 | 5,846 | |
| NVIDIA Corp. | 313,520 | 5,784 | |
| * | Citrix Systems Inc. | 73,530 | 5,246 |
| * | Adobe Systems Inc. | 72,400 | 5,009 |
| Broadcom Corp. Class A | 101,240 | 4,092 | |
| Total System Services Inc. | 125,610 | 3,889 | |
| Juniper Networks Inc. | 158,498 | 3,511 | |
| Motorola Solutions Inc. | 55,430 | 3,508 | |
| Lam Research Corp. | 44,353 | 3,313 | |
| TE Connectivity Ltd. | 45,900 | 2,538 | |
| NetApp Inc. | 55,950 | 2,404 | |
| EMC Corp. | 67,650 | 1,979 | |
| * | F5 Networks Inc. | 16,300 | 1,935 |
| Paychex Inc. | 43,700 | 1,932 | |
| * | CoreLogic Inc. | 55,600 | 1,505 |
| * | AOL Inc. | 23,800 | 1,070 |
| Xilinx Inc. | 22,130 | 937 | |
| * | EchoStar Corp. Class A | 18,400 | 897 |
| Marvell Technology | |||
| Group Ltd. | 58,847 | 793 | |
| Market | |||
| Value | |||
| Shares | ($000) | ||
| * | Red Hat Inc. | 12,000 | 674 |
| Analog Devices Inc. | 13,439 | 665 | |
| FLIR Systems Inc. | 17,308 | 542 | |
| * | FleetCor Technologies Inc. | 2,921 | 415 |
| * | CommScope | ||
| Holding Co. Inc. | 11,800 | 282 | |
| * | Zebra Technologies Corp. | 3,300 | 234 |
| * | Take-Two Interactive | ||
| Software Inc. | 9,400 | 217 | |
| Applied Materials Inc. | 9,500 | 205 | |
| * | WebMD Health Corp. | 3,600 | 150 |
| * | Blackhawk Network | ||
| Holdings Inc. Class B | 4,564 | 147 | |
| * | Sonus Networks Inc. | 40,812 | 140 |
| * | Vistaprint NV | 2,500 | 137 |
| * | Autodesk Inc. | 2,300 | 127 |
| * | Genpact Ltd. | 6,379 | 104 |
| * | Flextronics International Ltd. | 8,200 | 85 |
| PC-Tel Inc. | 9,160 | 70 | |
| * | Polycom Inc. | 4,700 | 58 |
| United Online Inc. | 4,263 | 47 | |
| * | TeleCommunication | ||
| Systems Inc. Class A | 16,000 | 45 | |
| * | Zynga Inc. Class A | 15,300 | 41 |
| * | Informatica Corp. | 1,100 | 38 |
| * | Quantum Corp. | 31,324 | 36 |
| * | Global Cash Access | ||
| Holdings Inc. | 4,859 | 33 | |
| * | QLogic Corp. | 3,500 | 32 |
| * | NCI Inc. Class A | 3,044 | 29 |
| * | BlackBerry Ltd. | 2,600 | 26 |
| * | Tremor Video Inc. | 10,100 | 24 |
| * | Progress Software Corp. | 900 | 22 |
| Brooks Automation Inc. | 1,700 | 18 | |
| * | Eastman Kodak Co. | 800 | 18 |
| AVX Corp. | 1,200 | 16 | |
| KLA-Tencor Corp. | 200 | 16 | |
| * | Ciber Inc. | 4,300 | 15 |
| * | TriQuint Semiconductor Inc. | 600 | 11 |
| * | Silicon Image Inc. | 2,125 | 11 |
| * | Agilysys Inc. | 791 | 9 |
| * | Fairchild Semiconductor | ||
| International Inc. Class A | 414 | 6 | |
| * | Trimble Navigation Ltd. | 200 | 6 |
| * | ClickSoftware | ||
| Technologies Ltd. | 730 | 6 | |
| * | Freescale | ||
| Semiconductor Ltd. | 300 | 6 | |
| * | Sigma Designs Inc. | 1,345 | 6 |
| * | Amtech Systems Inc. | 500 | 5 |
| * | Net 1 UEPS Technologies Inc. | 321 | 4 |
| * | Canadian Solar Inc. | 100 | 4 |
| * | RF Micro Devices Inc. | 200 | 2 |
| EVERTEC Inc. | 78 | 2 | |
| Daktronics Inc. | 99 | 1 |
20
Growth and Income Fund
| Market | |||
| Value• | |||
| Shares | ($000) | ||
| * | Smith Micro Software Inc. | 969 | 1 |
| * | Mattson Technology Inc. | 300 | 1 |
| * | Novatel Wireless Inc. | 100 | — |
| 1,088,888 | |||
| Materials (3.7%) | |||
| LyondellBasell Industries | |||
| NV Class A | 396,500 | 43,084 | |
| Monsanto Co. | 250,900 | 28,229 | |
| Sealed Air Corp. | 636,202 | 22,191 | |
| Ball Corp. | 332,416 | 21,032 | |
| Alcoa Inc. | 937,844 | 15,090 | |
| CF Industries Holdings Inc. | 45,210 | 12,624 | |
| PPG Industries Inc. | 63,155 | 12,425 | |
| Dow Chemical Co. | 230,905 | 12,109 | |
| United States Steel Corp. | 253,700 | 9,937 | |
| Mosaic Co. | 179,480 | 7,971 | |
| Eastman Chemical Co. | 88,390 | 7,150 | |
| * | Owens-Illinois Inc. | 246,432 | 6,420 |
| Avery Dennison Corp. | 98,700 | 4,407 | |
| Bemis Co. Inc. | 105,940 | 4,028 | |
| Sherwin-Williams Co. | 11,485 | 2,515 | |
| EI du Pont | |||
| de Nemours & Co. | 27,956 | 2,006 | |
| Valspar Corp. | 24,600 | 1,943 | |
| Nucor Corp. | 34,880 | 1,893 | |
| * | Platform Specialty | ||
| Products Corp. | 22,821 | 571 | |
| Rockwood Holdings Inc. | 6,900 | 527 | |
| * | Constellium NV Class A | 18,100 | 445 |
| Mesabi Trust | 17,278 | 330 | |
| * | Mercer International Inc. | 33,700 | 329 |
| Air Products & Chemicals Inc. | 2,300 | 299 | |
| International Paper Co. | 3,650 | 174 | |
| * | Berry Plastics Group Inc. | 5,800 | 146 |
| Allegheny Technologies Inc. | 3,701 | 137 | |
| * | Novagold Resources Inc. | 30,800 | 93 |
| Tronox Ltd. Class A | 2,601 | 68 | |
| * | Vista Gold Corp. | 112,900 | 46 |
| FMC Corp. | 710 | 41 | |
| * | Resolute Forest | ||
| Products Inc. | 1,400 | 22 | |
| * | Rare Element | ||
| Resources Ltd. | 33,288 | 22 | |
| * | Ryerson Holding Corp. | 1,300 | 17 |
| * | Orion Engineered | ||
| Carbons SA | 500 | 9 | |
| * | Thompson Creek | ||
| Metals Co. Inc. | 3,700 | 8 | |
| * | Golden Star Resources Ltd. | 13,173 | 5 |
| Steel Dynamics Inc. | 200 | 4 | |
| * | Tanzanian Royalty | ||
| Exploration Corp. | 8 | — | |
| 218,347 | |||
| Market | |||
| Value• | |||
| Shares | ($000) | ||
| Other (0.2%) | |||
| SPDR S&P 500 ETF Trust | 49,500 | 9,753 | |
| Telecommunication Services (3.0%) | |||
| AT&T Inc. | 2,329,758 | 82,101 | |
| Verizon | |||
| Communications Inc. | 1,047,912 | 52,385 | |
| CenturyLink Inc. | 630,772 | 25,792 | |
| Frontier | |||
| Communications Corp. | 1,782,000 | 11,601 | |
| Windstream Holdings Inc. | 524,000 | 5,649 | |
| * | Intelsat SA | 20,600 | 353 |
| * | tw telecom Inc. Class A | 6,800 | 283 |
| * | Level 3 | ||
| Communications Inc. | 4,600 | 210 | |
| Cellcom Israel Ltd. | 3,000 | 33 | |
| * | Globalstar Inc. | 6,100 | 22 |
| * | Alaska Communications | ||
| Systems Group Inc. | 12,500 | 20 | |
| 178,449 | |||
| Utilities (2.7%) | |||
| Exelon Corp. | 698,830 | 23,823 | |
| Edison International | 386,186 | 21,596 | |
| AES Corp. | 1,349,418 | 19,135 | |
| American Electric | |||
| Power Co. Inc. | 331,741 | 17,320 | |
| Entergy Corp. | 149,700 | 11,576 | |
| Ameren Corp. | 289,960 | 11,114 | |
| AGL Resources Inc. | 197,400 | 10,134 | |
| PG&E Corp. | 211,500 | 9,526 | |
| Duke Energy Corp. | 106,950 | 7,997 | |
| FirstEnergy Corp. | 203,820 | 6,842 | |
| Dominion Resources Inc. | 81,974 | 5,664 | |
| Sempra Energy | 44,079 | 4,645 | |
| Southern Co. | 59,730 | 2,607 | |
| Pinnacle West Capital Corp. | 42,200 | 2,306 | |
| PPL Corp. | 48,097 | 1,579 | |
| CenterPoint Energy Inc. | 40,028 | 979 | |
| NextEra Energy Inc. | 10,200 | 958 | |
| * | Calpine Corp. | 44,000 | 955 |
| * | Dynegy Inc. Class A | 26,800 | 773 |
| TECO Energy Inc. | 44,440 | 772 | |
| OGE Energy Corp. | 14,300 | 531 | |
| Northeast Utilities | 8,058 | 357 | |
| Questar Corp. | 3,500 | 78 | |
| NorthWestern Corp. | 500 | 23 | |
| Consolidated Edison Inc. | 280 | 16 | |
| NiSource Inc. | 189 | 8 | |
| 161,314 | |||
| Total Common Stocks | |||
| (Cost $4,799,758) | 5,771,724 | ||
21
Growth and Income Fund
| Market | |||
| Value• | |||
| Shares | ($000) | ||
| Temporary Cash Investments (2.2%)1 | |||
| Money Market Fund (2.1%) | |||
| 2,3 | Vanguard Market | ||
| Liquidity Fund, | |||
| 0.109% | 126,294,475 | 126,294 | |
| Face | |||
| Amount | |||
| ($000) | |||
| U.S. Government and Agency Obligations (0.1%) | |||
| 4,5 | Fannie Mae Discount | ||
| Notes, 0.080%, 10/6/14 | 200 | 200 | |
| 5,6 | Federal Home Loan | ||
| Bank Discount Notes, | |||
| 0.080%, 10/8/14 | 4,900 | 4,900 | |
| 5,6 | Federal Home Loan | ||
| Bank Discount Notes, | |||
| 0.072%, 11/21/14 | 500 | 500 | |
| 6 | Federal Home Loan | ||
| Bank Discount Notes, | |||
| 0.055%, 12/3/14 | 1,000 | 1,000 | |
| 5,6 | Federal Home Loan | ||
| Bank Discount Notes, | |||
| 0.033%, 12/19/14 | 100 | 100 | |
| 6,700 | |||
| Total Temporary Cash Investments | |||
| (Cost $132,994) | 132,994 | ||
| Total Investments (100.1%) | |||
| (Cost $4,932,752) | 5,904,718 | ||
| Other Assets and Liabilities (-0.1%) | |||
| Other Assets | 82,965 | ||
| Liabilities2 | (91,248) | ||
| (8,283) | |||
| Net Assets (100%) | 5,896,435 | ||
| At September 30, 2014, net assets consisted of: | |
| Amount | |
| ($000) | |
| Paid-in Capital | 4,579,240 |
| Undistributed Net Investment Income | 14,924 |
| Accumulated Net Realized Gains | 331,198 |
| Unrealized Appreciation (Depreciation) | |
| Investment Securities | 971,966 |
| Futures Contracts | (893) |
| Net Assets | 5,896,435 |
| Investor Shares—Net Assets | |
| Applicable to 69,790,297 outstanding | |
| $.001 par value shares of beneficial | |
| interest (unlimited authorization) | 2,979,379 |
| Net Asset Value Per Share— | |
| Investor Shares | $42.69 |
| Admiral Shares—Net Assets | |
| Applicable to 41,847,961 outstanding | |
| $.001 par value shares of beneficial | |
| interest (unlimited authorization) | 2,917,056 |
| Net Asset Value Per Share— | |
| Admiral Shares | $69.71 |
• See Note A in Notes to Financial Statements.
* Non-income-producing security.
^ Includes partial security positions on loan to broker-dealers. The total value of securities on loan is $909,000.
1 The fund invests a portion of its cash reserves in equity markets through the use of index futures contracts. After giving effect to futures investments, the fund’s effective common stock and temporary cash investment positions represent 99.8% and 0.3%, respectively, of net assets.
2 Includes $984,000 of collateral received for securities on loan.
3 Affiliated money market fund available only to Vanguard funds and certain trusts and accounts managed by Vanguard. Rate shown is the 7-day yield.
4 The issuer was placed under federal conservatorship in September 2008; since that time, its daily operations have been managed by the Federal Housing Finance Agency and it receives capital from the U.S. Treasury, as needed to maintain a positive net worth, in exchange for senior preferred stock.
5 Securities with a value of $5,300,000 have been segregated as initial margin for open futures contracts.
6 The issuer operates under a congressional charter; its securities are generally neither guaranteed by the U.S. Treasury nor backed by the full faith and credit of the U.S. government.
REIT—Real Estate Investment Trust.
See accompanying Notes, which are an integral part of the Financial Statements.
22
Growth and Income Fund
Statement of Operations
| Year Ended | |
| September 30, 2014 | |
| ($000) | |
| Investment Income | |
| Income | |
| Dividends1 | 113,177 |
| Interest2 | 168 |
| Securities Lending | 145 |
| Total Income | 113,490 |
| Expenses | |
| Investment Advisory Fees—Note B | |
| Basic Fee | 5,869 |
| Performance Adjustment | 981 |
| The Vanguard Group—Note C | |
| Management and Administrative—Investor Shares | 6,675 |
| Management and Administrative—Admiral Shares | 3,048 |
| Marketing and Distribution—Investor Shares | 450 |
| Marketing and Distribution—Admiral Shares | 346 |
| Custodian Fees | 196 |
| Auditing Fees | 32 |
| Shareholders’ Reports—Investor Shares | 71 |
| Shareholders’ Reports—Admiral Shares | 14 |
| Trustees’ Fees and Expenses | 11 |
| Total Expenses | 17,693 |
| Net Investment Income | 95,797 |
| Realized Net Gain (Loss) | |
| Investment Securities Sold | 639,736 |
| Futures Contracts | 20,873 |
| Realized Net Gain (Loss) | 660,609 |
| Change in Unrealized Appreciation (Depreciation) | |
| Investment Securities | 260,237 |
| Futures Contracts | (79) |
| Change in Unrealized Appreciation (Depreciation) | 260,158 |
| Net Increase (Decrease) in Net Assets Resulting from Operations | 1,016,564 |
| 1 Dividends are net of foreign withholding taxes of $13,000. 2 Interest income from an affiliated company of the fund was $163,000. | |
See accompanying Notes, which are an integral part of the Financial Statements.
23
Growth and Income Fund
Statement of Changes in Net Assets
| Year Ended September 30, | ||
| 2014 | 2013 | |
| ($000) | ($000) | |
| Increase (Decrease) in Net Assets | ||
| Operations | ||
| Net Investment Income | 95,797 | 90,414 |
| Realized Net Gain (Loss) | 660,609 | 617,757 |
| Change in Unrealized Appreciation (Depreciation) | 260,158 | 125,858 |
| Net Increase (Decrease) in Net Assets Resulting from Operations | 1,016,564 | 834,029 |
| Distributions | ||
| Net Investment Income | ||
| Investor Shares | (47,416) | (53,617) |
| Admiral Shares | (43,820) | (36,430) |
| Realized Capital Gain | ||
| Investor Shares | — | — |
| Admiral Shares | — | — |
| Total Distributions | (91,236) | (90,047) |
| Capital Share Transactions | ||
| Investor Shares | (393,996) | (383,262) |
| Admiral Shares | 338,592 | 276,911 |
| Net Increase (Decrease) from Capital Share Transactions | (55,404) | (106,351) |
| Total Increase (Decrease) | 869,924 | 637,631 |
| Net Assets | ||
| Beginning of Period | 5,026,511 | 4,388,880 |
| End of Period1 | 5,896,435 | 5,026,511 |
| 1 Net Assets—End of Period includes undistributed (overdistributed) net investment income of $14,924,000 and $10,362,000. | ||
See accompanying Notes, which are an integral part of the Financial Statements.
24
Growth and Income Fund
Financial Highlights
| Investor Shares | |||||
| For a Share Outstanding | Year Ended September 30, | ||||
| Throughout Each Period | 2014 | 2013 | 2012 | 2011 | 2010 |
| Net Asset Value, Beginning of Period | $36.02 | $30.73 | $23.86 | $23.98 | $22.34 |
| Investment Operations | |||||
| Net Investment Income | . 671 | .631 | .549 | .482 | .418 |
| Net Realized and Unrealized Gain (Loss) | |||||
| on Investments | 6.639 | 5.288 | 6.846 | (.124) | 1.630 |
| Total from Investment Operations | 7.310 | 5.919 | 7.395 | .358 | 2.048 |
| Distributions | |||||
| Dividends from Net Investment Income | (. 640) | (. 629) | (. 525) | (. 478) | (.408) |
| Distributions from Realized Capital Gains | — | — | — | — | — |
| Total Distributions | (. 640) | (. 629) | (. 525) | (. 478) | (.408) |
| Net Asset Value, End of Period | $42.69 | $36.02 | $30.73 | $23.86 | $23.98 |
| Total Return1 | 20.42% | 19.54% | 31.27% | 1.28% | 9.24% |
| Ratios/Supplemental Data | |||||
| Net Assets, End of Period (Millions) | $2,979 | $2,869 | $2,798 | $2,548 | $3,020 |
| Ratio of Total Expenses to Average Net Assets2 | 0.37% | 0.36% | 0.36% | 0.32% | 0.32% |
| Ratio of Net Investment Income to | |||||
| Average Net Assets | 1.67% | 1.90% | 1.94% | 1.78% | 1.74% |
| Portfolio Turnover Rate | 133% | 109% | 102% | 120% | 94% |
| 1 Total returns do not include account service fees that may have applied in the periods shown. Fund prospectuses provide information about any applicable account service fees. 2 Includes performance-based investment advisory fee increases (decreases) of 0.02%, 0.01%, 0.01%, (0.04%), and (0.04%). | |||||
See accompanying Notes, which are an integral part of the Financial Statements.
25
Growth and Income Fund
Financial Highlights
| Admiral Shares | |||||
| For a Share Outstanding | Year Ended September 30, | ||||
| Throughout Each Period | 2014 | 2013 | 2012 | 2011 | 2010 |
| Net Asset Value, Beginning of Period | $58.82 | $50.18 | $38.97 | $39.15 | $36.48 |
| Investment Operations | |||||
| Net Investment Income | 1.176 | 1.097 | .952 | .832 | .722 |
| Net Realized and Unrealized Gain (Loss) | |||||
| on Investments | 10.833 | 8.633 | 11.168 | (.199) | 2.666 |
| Total from Investment Operations | 12.009 | 9.730 | 12.120 | .633 | 3.388 |
| Distributions | |||||
| Dividends from Net Investment Income | (1.119) | (1.090) | (.910) | (.813) | (.718) |
| Distributions from Realized Capital Gains | — | — | — | — | — |
| Total Distributions | (1.119) | (1.090) | (.910) | (.813) | (.718) |
| Net Asset Value, End of Period | $69.71 | $58.82 | $50.18 | $38.97 | $39.15 |
| Total Return | 20.55% | 19.69% | 31.40% | 1.39% | 9.37% |
| Ratios/Supplemental Data | |||||
| Net Assets, End of Period (Millions) | $2,917 | $2,157 | $1,591 | $1,131 | $1,199 |
| Ratio of Total Expenses to Average Net Assets1 | 0.26% | 0.26% | 0.25% | 0.21% | 0.21% |
| Ratio of Net Investment Income to | |||||
| Average Net Assets | 1.78% | 2.00% | 2.05% | 1.89% | 1.85% |
| Portfolio Turnover Rate | 133% | 109% | 102% | 120% | 94% |
| 1 Includes performance-based investment advisory fee increases (decreases) of 0.02%, 0.01%, 0.01%, (0.04%), and (0.04%). | |||||
See accompanying Notes, which are an integral part of the Financial Statements.
26
Growth and Income Fund
Notes to Financial Statements
Vanguard Growth and Income Fund is registered under the Investment Company Act of 1940 as an open-end investment company, or mutual fund. The fund offers two classes of shares: Investor Shares and Admiral Shares. Investor Shares are available to any investor who meets the fund’s minimum purchase requirements. Admiral Shares are designed for investors who meet certain administrative, service, and account-size criteria.
A. The following significant accounting policies conform to generally accepted accounting principles for U.S. investment companies. The fund consistently follows such policies in preparing its financial statements.
1. Security Valuation: Securities are valued as of the close of trading on the New York Stock Exchange (generally 4 p.m., Eastern time) on the valuation date. Equity securities are valued at the latest quoted sales prices or official closing prices taken from the primary market in which each security trades; such securities not traded on the valuation date are valued at the mean of the latest quoted bid and asked prices. Securities for which market quotations are not readily available, or whose values have been materially affected by events occurring before the fund’s pricing time but after the close of the securities’ primary markets, are valued by methods deemed by the board of trustees to represent fair value. Investments in Vanguard Market Liquidity Fund are valued at that fund’s net asset value. Temporary cash investments acquired over 60 days to maturity are valued using the latest bid prices or using valuations based on a matrix system (which considers such factors as security prices, yields, maturities, and ratings), both as furnished by independent pricing services. Other temporary cash investments are valued at amortized cost, which approximates market value.
2. Futures Contracts: The fund uses index futures contracts to a limited extent, with the objective of maintaining full exposure to the stock market while maintaining liquidity. The fund may purchase or sell futures contracts to achieve a desired level of investment, whether to accommodate portfolio turnover or cash flows from capital share transactions. The primary risks associated with the use of futures contracts are imperfect correlation between changes in market values of stocks held by the fund and the prices of futures contracts, and the possibility of an illiquid market. Counterparty risk involving futures is mitigated because a regulated clearinghouse is the counterparty instead of the clearing broker. To further mitigate counterparty risk, the fund trades futures contracts on an exchange, monitors the financial strength of its clearing brokers and clearinghouse, and has entered into clearing agreements with its clearing brokers. The clearinghouse imposes initial margin requirements to secure the fund’s performance and requires daily settlement of variation margin representing changes in the market value of each contract.
Futures contracts are valued at their quoted daily settlement prices. The aggregate settlement values of the contracts are not recorded in the Statement of Net Assets. Fluctuations in the value of the contracts are recorded in the Statement of Net Assets as an asset (liability) and in the Statement of Operations as unrealized appreciation (depreciation) until the contracts are closed, when they are recorded as realized futures gains (losses).
During the year ended September 30, 2014, the fund’s average investments in long and short futures contracts represented 2% and 0% of net assets, respectively, based on the average of aggregate settlement values at each quarter-end during the period.
3. Federal Income Taxes: The fund intends to continue to qualify as a regulated investment company and distribute all of its taxable income. Management has analyzed the fund’s tax positions taken for all open federal income tax years (September 30, 2011–2014), and has concluded that no provision for federal income tax is required in the fund’s financial statements.
27
Growth and Income Fund
4. Distributions: Distributions to shareholders are recorded on the ex-dividend date.
5. Securities Lending: To earn additional income, the fund lends its securities to qualified institutional borrowers. Security loans are required to be secured at all times by collateral in an amount at least equal to the market value of securities loaned. Daily market fluctuations could cause the value of loaned securities to be more or less than the value of the collateral received. When this occurs, the collateral is adjusted and settled on the next business day. The fund further mitigates its counterparty risk by entering into securities lending transactions only with a diverse group of prequalified counterparties, monitoring their financial strength, and entering into master securities lending agreements with its counterparties. The master securities lending agreements provide that, in the event of a counterparty’s default (including bankruptcy), the fund may terminate any loans with that borrower, determine the net amount owed, and sell or retain the collateral up to the net amount owed to the fund; however, such actions may be subject to legal proceedings. While collateral mitigates counterparty risk, in the absence of a default the fund may experience delays and costs in recovering the securities loaned. The fund invests cash collateral received in Vanguard Market Liquidity Fund, and records a liability in the Statement of Net Assets for the return of the collateral, during the period the securities are on loan. Securities lending income represents fees charged to borrowers plus income earned on invested cash collateral, less expenses associated with the loan.
6. Credit Facility: The fund and certain other funds managed by The Vanguard Group participate in a $2.89 billion committed credit facility provided by a syndicate of lenders pursuant to a credit agreement that may be renewed annually; each fund is individually liable for its borrowings, if any, under the credit facility. Borrowings may be utilized for temporary and emergency purposes, and are subject to the fund’s regulatory and contractual borrowing restrictions. The participating funds are charged administrative fees and an annual commitment fee of 0.06% of the undrawn amount of the facility; these fees are allocated to the funds based on a method approved by the fund’s board of trustees and included in Management and Administrative expenses on the fund’s Statement of Operations. Any borrowings under this facility bear interest at a rate equal to the higher of the federal funds rate or LIBOR reference rate plus an agreed-upon spread.
The fund had no borrowings outstanding at September 30, 2014, or at any time during the period then ended.
7. Other: Dividend income is recorded on the ex-dividend date. Interest income includes income distributions received from Vanguard Market Liquidity Fund and is accrued daily. Premiums and discounts on debt securities purchased are amortized and accreted, respectively, to interest income over the lives of the respective securities. Security transactions are accounted for on the date securities are bought or sold. Costs used to determine realized gains (losses) on the sale of investment securities are those of the specific securities sold.
Each class of shares has equal rights as to assets and earnings, except that each class separately bears certain class-specific expenses related to maintenance of shareholder accounts (included in Management and Administrative expenses) and shareholder reporting. Marketing and distribution expenses are allocated to each class of shares based on a method approved by the board of trustees. Income, other non-class-specific expenses, and gains and losses on investments are allocated to each class of shares based on its relative net assets.
28
Growth and Income Fund
B. D. E. Shaw Investment Management, L.L.C., and Los Angeles Capital Management and Equity Research, Inc., each provide investment advisory services to a portion of the fund for a fee calculated at an annual percentage rate of average net assets managed by the advisor. The basic fee of D. E. Shaw Investment Management, L.L.C., is subject to quarterly adjustments based on performance for the preceding three years relative to the S&P 500 Index. The basic fee of Los Angeles Capital Management and Equity Research, Inc., is subject to quarterly adjustments based on performance since September 30, 2011, relative to the S&P 500 Index.
The Vanguard Group provides investment advisory services to a portion of the fund on an at-cost basis; the fund paid Vanguard advisory fees of $760,000 for the year ended September 30, 2014.
For the year ended September 30, 2014, the aggregate investment advisory fee represented an effective annual basic rate of 0.11% of the fund’s average net assets, before an increase of $981,000 (0.02%) based on performance.
C. The Vanguard Group furnishes at cost corporate management, administrative, marketing, and distribution services. The costs of such services are allocated to the fund based on methods approved by the board of trustees. The fund has committed to invest up to 0.40% of its net assets in Vanguard. At September 30, 2014, the fund had contributed capital of $588,000 to Vanguard (included in Other Assets), representing 0.01% of the fund’s net assets and 0.24% of Vanguard’s capitalization. The fund’s trustees and officers are also directors and officers of Vanguard.
D. Various inputs may be used to determine the value of the fund’s investments. These inputs are summarized in three broad levels for financial statement purposes. The inputs or methodologies used to value securities are not necessarily an indication of the risk associated with investing in those securities.
Level 1—Quoted prices in active markets for identical securities.
Level 2—Other significant observable inputs (including quoted prices for similar securities, interest rates, prepayment speeds, credit risk, etc.).
Level 3—Significant unobservable inputs (including the fund’s own assumptions used to determine the fair value of investments).
The following table summarizes the market value of the fund’s investments as of September 30, 2014, based on the inputs used to value them:
| Level 1 | Level 2 | Level 3 | |
| Investments | ($000) | ($000) | ($000) |
| Common Stocks | 5,771,724 | — | — |
| Temporary Cash Investments | 126,294 | 6,700 | — |
| Futures Contracts—Liabilities1 | (229) | — | — |
| Total | 5,897,789 | 6,700 | — |
| 1 Represents variation margin on the last day of the reporting period. | |||
29
Growth and Income Fund
E. At September 30, 2014, the aggregate settlement value of open futures contracts and the related unrealized appreciation (depreciation) were:
| ($000) | ||||
| Aggregate | ||||
| Number of | Settlement | Unrealized | ||
| Long (Short) | Value | Appreciation | ||
| Futures Contracts | Expiration | Contracts | Long (Short) | (Depreciation) |
| S&P 500 Index | December 2014 | 218 | 107,120 | (876) |
| E-mini S&P 500 Index | December 2014 | 55 | 5,405 | (17) |
| (893) |
Unrealized appreciation (depreciation) on open futures contracts is required to be treated as realized gain (loss) for tax purposes.
F. Distributions are determined on a tax basis and may differ from net investment income and realized capital gains for financial reporting purposes. Differences may be permanent or temporary. Permanent differences are reclassified among capital accounts in the financial statements to reflect their tax character. Temporary differences arise when certain items of income, expense, gain, or loss are recognized in different periods for financial statement and tax purposes. These differences will reverse at some time in the future. Differences in classification may also result from the treatment of short-term gains as ordinary income for tax purposes.
The fund used a tax accounting practice to treat a portion of the price of capital shares redeemed during the year as distributions from realized capital gains. Accordingly, the fund has reclassified $10,604,000 from accumulated net realized gains to paid-in capital.
The fund used capital loss carryforwards of $318,390,000 to offset taxable capital gains realized during the year ended September 30, 2014, reducing the amount of capital gains that would otherwise be available to distribute to shareholders. For tax purposes, at September 30, 2014, the fund had $27,467,000 of ordinary income and $339,558,000 of long-term capital gains available for distribution.
At September 30, 2014, the cost of investment securities for tax purposes was $4,942,594,000. Net unrealized appreciation of investment securities for tax purposes was $962,124,000, consisting of unrealized gains of $1,022,864,000 on securities that had risen in value since their purchase and $60,740,000 in unrealized losses on securities that had fallen in value since their purchase.
G. During the year ended September 30, 2014, the fund purchased $7,232,775,000 of investment securities and sold $7,266,753,000 of investment securities, other than temporary cash investments.
30
Growth and Income Fund
H. Capital share transactions for each class of shares were:
| Year Ended September 30, | ||||
| 2014 | 2013 | |||
| Amount | Shares | Amount | Shares | |
| ($000) | (000) | ($000) | (000) | |
| Investor Shares | ||||
| Issued | 208,737 | 5,202 | 212,836 | 6,415 |
| Issued in Lieu of Cash Distributions | 46,158 | 1,157 | 52,142 | 1,640 |
| Redeemed | (648,891) | (16,224) | (648,240) | (19,450) |
| Net Increase (Decrease)—Investor Shares | (393,996) | (9,865) | (383,262) | (11,395) |
| Admiral Shares | ||||
| Issued | 536,136 | 8,191 | 485,483 | 8,814 |
| Issued in Lieu of Cash Distributions | 40,816 | 624 | 33,824 | 649 |
| Redeemed | (238,360) | (3,640) | (242,396) | (4,496) |
| Net Increase (Decrease) —Admiral Shares | 338,592 | 5,175 | 276,911 | 4,967 |
I. Management has determined that no material events or transactions occurred subsequent to September 30, 2014, that would require recognition or disclosure in these financial statements.
31
Report of Independent Registered
Public Accounting Firm
To the Board of Trustees of Vanguard Quantitative Funds and the Shareholders of Vanguard Growth and Income Fund:
In our opinion, the accompanying statement of net assets and the related statements of operations and of changes in net assets and the financial highlights present fairly, in all material respects, the financial position of Vanguard Growth and Income Fund (constituting a separate portfolio of Vanguard Quantitative Funds, hereafter referred to as the “Fund”) at September 30, 2014, the results of its operations for the year then ended, the changes in its net assets for each of the two years in the period then ended, and the financial highlights for each of the five years in the period then ended, in conformity with accounting principles generally accepted in the United States of America. These financial statements and financial highlights (hereafter referred to as “financial statements”) are the responsibility of the Fund’s management. Our responsibility is to express an opinion on these financial statements based on our audits. We conducted our audits of these financial statements in accordance with the standards of the Public Company Accounting Oversight Board (United States). Those standards require that we plan and perform the audit to obtain reasonable assurance about whether the financial statements are free of material misstatement. An audit includes examining, on a test basis, evidence supporting the amounts and disclosures in the financial statements, assessing the accounting principles used and significant estimates made by management, and evaluating the overall financial statement presentation. We believe that our audits, which included confirmation of securities at September 30, 2014 by correspondence with the custodian and broker and by agreement to the underlying ownership records of the transfer agent, provide a reasonable basis for our opinion.
/s/PricewaterhouseCoopers LLP
Philadelphia, Pennsylvania
November 10, 2014
| Special 2014 tax information (unaudited) for Vanguard Growth and Income Fund |
This information for the fiscal year ended September 30, 2014, is included pursuant to provisions of the Internal Revenue Code.
The fund distributed $10,604,000 as capital gain dividends (from net long-term capital gains) to shareholders during the fiscal year.
The fund distributed $91,236,000 of qualified dividend income to shareholders during the fiscal year.
For corporate shareholders, 100% of investment income (dividend income plus short-term gains, if any) qualifies for the dividends-received deduction.
32
Your Fund’s After-Tax Returns
This table presents returns for your fund both before and after taxes. The after-tax returns are shown in two ways: (1) assuming that an investor owned the fund during the entire period and paid taxes on the fund’s distributions, and (2) assuming that an investor paid taxes on the fund’s distributions and sold all shares at the end of each period.
Calculations are based on the highest individual federal income tax and capital gains tax rates in effect at the times of the distributions and the hypothetical sales. State and local taxes were not considered. After-tax returns reflect any qualified dividend income, using actual prior-year figures and estimates for 2014. (In the example, returns after the sale of fund shares may be higher than those assuming no sale. This occurs when the sale would have produced a capital loss. The calculation assumes that the investor received a tax deduction for the loss.)
The table shows returns for Investor Shares only; returns for other share classes will differ. Please note that your actual after-tax returns will depend on your tax situation and may differ from those shown. Also note that if you own the fund in a tax-deferred account, such as an individual retirement account or a 401(k) plan, this information does not apply to you. Such accounts are not subject to current taxes.
Finally, keep in mind that a fund’s performance—whether before or after taxes—does not guarantee future results.
Average Annual Total Returns: Growth and Income Fund Investor Shares
Periods Ended September 30, 2014
| One | Five | Ten | |
| Year | Years | Years | |
| Returns Before Taxes | 20.42% | 15.89% | 7.37% |
| Returns After Taxes on Distributions | 19.97 | 15.53 | 6.85 |
| Returns After Taxes on Distributions and Sale of Fund Shares | 11.89 | 12.85 | 5.99 |
33
About Your Fund’s Expenses
As a shareholder of the fund, you incur ongoing costs, which include costs for portfolio management, administrative services, and shareholder reports (like this one), among others. Operating expenses, which are deducted from a fund’s gross income, directly reduce the investment return of the fund.
A fund’s expenses are expressed as a percentage of its average net assets. This figure is known as the expense ratio. The following examples are intended to help you understand the ongoing costs (in dollars) of investing in your fund and to compare these costs with those of other mutual funds. The examples are based on an investment of $1,000 made at the beginning of the period shown and held for the entire period.
The accompanying table illustrates your fund’s costs in two ways:
• Based on actual fund return. This section helps you to estimate the actual expenses that you paid over the period. The ”Ending Account Value“ shown is derived from the fund‘s actual return, and the third column shows the dollar amount that would have been paid by an investor who started with $1,000 in the fund. You may use the information here, together with the amount you invested, to estimate the expenses that you paid over the period.
To do so, simply divide your account value by $1,000 (for example, an $8,600 account value divided by $1,000 = 8.6), then multiply the result by the number given for your fund under the heading ”Expenses Paid During Period.“
• Based on hypothetical 5% yearly return. This section is intended to help you compare your fund‘s costs with those of other mutual funds. It assumes that the fund had a yearly return of 5% before expenses, but that the expense ratio is unchanged. In this case—because the return used is not the fund’s actual return—the results do not apply to your investment. The example is useful in making comparisons because the Securities and Exchange Commission requires all mutual funds to calculate expenses based on a 5% return. You can assess your fund’s costs by comparing this hypothetical example with the hypothetical examples that appear in shareholder reports of other funds.
Note that the expenses shown in the table are meant to highlight and help you compare ongoing costs only and do not reflect transaction costs incurred by the fund for buying and selling securities. Further, the expenses do not include any purchase, redemption, or account service fees described in the fund prospectus. If such fees were applied to your account, your costs would be higher. Your fund does not carry a “sales load.”
The calculations assume no shares were bought or sold during the period. Your actual costs may have been higher or lower, depending on the amount of your investment and the timing of any purchases or redemptions.
You can find more information about the fund’s expenses, including annual expense ratios, in the Financial Statements section of this report. For additional information on operating expenses and other shareholder costs, please refer to your fund’s current prospectus.
34
| Six Months Ended September 30, 2014 | |||
| Beginning | Ending | Expenses | |
| Account Value | Account Value | Paid During | |
| Growth and Income Fund | 3/31/2014 | 9/30/2014 | Period |
| Based on Actual Fund Return | |||
| Investor Shares | $1,000.00 | $1,069.68 | $1.92 |
| Admiral Shares | 1,000.00 | 1,070.31 | 1.35 |
| Based on Hypothetical 5% Yearly Return | |||
| Investor Shares | $1,000.00 | $1,023.21 | $1.88 |
| Admiral Shares | 1,000.00 | 1,023.76 | 1.32 |
The calculations are based on expenses incurred in the most recent six-month period. The fund’s annualized six-month expense ratios for that period are 0.37% for Investor Shares and 0.26% for Admiral Shares. The dollar amounts shown as “Expenses Paid” are equal to the annualized expense ratio multiplied by the average account value over the period, multiplied by the number of days in the most recent six-month period, then divided by the number of days in the most recent 12-month period.
35
Trustees Approve Advisory Arrangements
The board of trustees of Vanguard Growth and Income Fund has renewed the fund’s investment advisory arrangements with D. E. Shaw Investment Management, L.L.C. (DESIM), Los Angeles Capital Management and Equity Research, Inc. (LA Capital), and The Vanguard Group, Inc. (Vanguard), through its Quantitative Equity Group. The board determined that renewing the fund’s advisory arrangements was in the best interest of the fund and its shareholders.
The board based its decision upon an evaluation of each advisor’s investment staff, portfolio management process, and performance. The trustees considered the factors discussed below, among others. However, no single factor determined whether the board approved the arrangements. Rather, it was the totality of the circumstances that drove the board’s decision.
Nature, extent, and quality of services
The board considered the quality of each advisor’s investment management services provided to the fund since 2011, and took into account the organizational depth and stability of each advisor. The board noted the following:
DESIM. Founded in 2005, DESIM is a global investment management and technology development firm. The firm employs quantitative models that seek to capture predominantly “bottom-up” stock-specific return opportunities while aiming to control overall portfolio risk and characteristics, such as size, sector weights, and style, to be similar to those of the benchmark. DESIM has managed a portion of the fund since 2011.
LA Capital. LA Capital was formed in 2002 from the equity portion of Wilshire Asset Management. The firm employs a controlled, dynamic investment model, gradually assigning new prices to key equity risks as market conditions change. The price of factor risk evolves over time in a way that can be captured in a model akin to changes in cost of capital. The model uses more than 50 factors to actively weight stocks, including value, momentum, quality, sector, and market capitalization. LA Capital has managed a portion of the fund since 2011.
Vanguard. Vanguard has been managing investments for more than three decades. The Quantitative Equity Group adheres to a sound, disciplined investment management process; the team has considerable experience, stability, and depth. Vanguard has managed a portion of the fund since 2011.
The board concluded that each advisor’s experience, stability, depth, and performance, among other factors, warranted continuation of the advisory arrangements.
Investment performance
The board considered the fund’s investment performance since each advisor began managing the fund in 2011, including any periods of outperformance or underperformance relative to a benchmark index and peer group. The board concluded that the performance was such that the advisory arrangements should continue. Information about the fund’s most recent performance can be found in the Performance Summary section of this report.
Cost
The board concluded that the fund’s expense ratio was well below the average expense ratio charged by funds in its peer group and that the fund’s advisory fee rate was also well below its peer-group average. Information about the fund’s expense ratio appears in the About Your Fund’s Expenses section of this report as well as in the Financial Statements section, which also includes information about the fund’s advisory fee rate.
36
The board did not consider profitability of DESIM and LA Capital in determining whether to approve the advisory fees, because the firms are independent of Vanguard, and the advisory fees are the result of arm’s-length negotiations. The board does not conduct a profitability analysis of Vanguard, because of Vanguard’s unique “at-cost” structure. Unlike most other mutual fund management companies, Vanguard is owned by the funds it oversees, and produces “profits” only in the form of reduced expenses for fund shareholders.
The benefit of economies of scale
The board concluded that the fund’s shareholders benefit from economies of scale because of breakpoints in the advisory fee schedules for DESIM and LA Capital. The breakpoints reduce the effective rate of the fee as the fund’s assets managed by each advisor increase. The board also concluded that the fund’s at-cost arrangement with Vanguard ensures that the fund will realize economies of scale as it grows, with the cost to shareholders declining as the fund’s assets managed by Vanguard increase.
The board will consider whether to renew the advisory arrangements again after a one-year period.
37
Glossary
30-Day SEC Yield. A fund’s 30-day SEC yield is derived using a formula specified by the U.S. Securities and Exchange Commission. Under the formula, data related to the fund’s security holdings in the previous 30 days are used to calculate the fund’s hypothetical net income for that period, which is then annualized and divided by the fund’s estimated average net assets over the calculation period. For the purposes of this calculation, a security’s income is based on its current market yield to maturity (for bonds), its actual income (for asset-backed securities), or its projected dividend yield (for stocks). Because the SEC yield represents hypothetical annualized income, it will differ—at times significantly—from the fund’s actual experience. As a result, the fund’s income distributions may be higher or lower than implied by the SEC yield.
Beta. A measure of the magnitude of a fund’s past share-price fluctuations in relation to the ups and downs of a given market index. The index is assigned a beta of 1.00. Compared with a given index, a fund with a beta of 1.20 typically would have seen its share price rise or fall by 12% when the index rose or fell by 10%. For this report, beta is based on returns over the past 36 months for both the fund and the index. Note that a fund’s beta should be reviewed in conjunction with its R-squared (see definition). The lower the R-squared, the less correlation there is between the fund and the index, and the less reliable beta is as an indicator of volatility.
Dividend Yield. Dividend income earned by stocks, expressed as a percentage of the aggregate market value (or of net asset value, for a fund). The yield is determined by dividing the amount of the annual dividends by the aggregate value (or net asset value) at the end of the period. For a fund, the dividend yield is based solely on stock holdings and does not include any income produced by other investments.
Earnings Growth Rate. The average annual rate of growth in earnings over the past five years for the stocks now in a fund.
Equity Exposure. A measure that reflects a fund’s investments in stocks and stock futures. Any holdings in short-term reserves are excluded.
Expense Ratio. A fund’s total annual operating expenses expressed as a percentage of the fund’s average net assets. The expense ratio includes management and administrative expenses, but does not include the transaction costs of buying and selling portfolio securities.
Foreign Holdings. The percentage of a fund represented by securities or depositary receipts of companies based outside the United States.
Inception Date. The date on which the assets of a fund (or one of its share classes) are first invested in accordance with the fund’s investment objective. For funds with a subscription period, the inception date is the day after that period ends. Investment performance is measured from the inception date.
Median Market Cap. An indicator of the size of companies in which a fund invests; the midpoint of market capitalization (market price x shares outstanding) of a fund’s stocks, weighted by the proportion of the fund’s assets invested in each stock. Stocks representing half of the fund’s assets have market capitalizations above the median, and the rest are below it.
Price/Book Ratio. The share price of a stock divided by its net worth, or book value, per share. For a fund, the weighted average price/book ratio of the stocks it holds.
38
Price/Earnings Ratio. The ratio of a stock’s current price to its per-share earnings over the past year. For a fund, the weighted average P/E of the stocks it holds. P/E is an indicator of market expectations about corporate prospects; the higher the P/E, the greater the expectations for a company’s future growth.
R-Squared. A measure of how much of a fund’s past returns can be explained by the returns from the market in general, as measured by a given index. If a fund’s total returns were precisely synchronized with an index’s returns, its R-squared would be 1.00. If the fund’s returns bore no relationship to the index’s returns, its R-squared would be 0. For this report, R-squared is based on returns over the past 36 months for both the fund and the index.
Return on Equity. The annual average rate of return generated by a company during the past five years for each dollar of shareholder’s equity (net income divided by shareholder’s equity). For a fund, the weighted average return on equity for the companies whose stocks it holds.
Short-Term Reserves. The percentage of a fund invested in highly liquid, short-term securities that can be readily converted to cash.
Turnover Rate. An indication of the fund’s trading activity. Funds with high turnover rates incur higher transaction costs and may be more likely to distribute capital gains (which may be taxable to investors). The turnover rate excludes in-kind transactions, which have minimal impact on costs.
39
The People Who Govern Your Fund
The trustees of your mutual fund are there to see that the fund is operated and managed in your best interests since, as a shareholder, you are a part owner of the fund. Your fund’s trustees also serve on the board of directors of The Vanguard Group, Inc., which is owned by the Vanguard funds and provides services to them on an at-cost basis.
A majority of Vanguard’s board members are independent, meaning that they have no affiliation with Vanguard or the funds they oversee, apart from the sizable personal investments they have made as private individuals. The independent board members have distinguished backgrounds in business, academia, and public service. Each of the trustees and executive officers oversees 177 Vanguard funds.
The following table provides information for each trustee and executive officer of the fund. More information about the trustees is in the Statement of Additional Information, which can be obtained, without charge, by contacting Vanguard at 800-662-7447, or online at vanguard.com.
| InterestedTrustee1 | and Delphi Automotive LLP (automotive components); |
| Senior Advisor at New Mountain Capital. | |
| F. William McNabb III | |
| Born 1957. Trustee Since July 2009. Chairman of the | Amy Gutmann |
| Board. Principal Occupation(s) During the Past Five | Born 1949. Trustee Since June 2006. Principal |
| Years: Chairman of the Board of The Vanguard Group, | Occupation(s) During the Past Five Years: President of |
| Inc., and of each of the investment companies served | the University of Pennsylvania; Christopher H. Browne |
| by The Vanguard Group, since January 2010; Director | Distinguished Professor of Political Science, School of |
| of The Vanguard Group since 2008; Chief Executive | Arts and Sciences, and Professor of Communication, |
| Officer and President of The Vanguard Group, and of | Annenberg School for Communication, with secondary |
| each of the investment companies served by The | faculty appointments in the Department of Philosophy, |
| Vanguard Group, since 2008; Director of Vanguard | School of Arts and Sciences, and at the Graduate |
| Marketing Corporation; Managing Director of The | School of Education, University of Pennsylvania; |
| Vanguard Group (1995–2008). | Trustee of the National Constitution Center; Chair |
| of the Presidential Commission for the Study of | |
| IndependentTrustees | Bioethical Issues. |
| Emerson U. Fullwood | |
| Born 1948. Trustee Since January 2008. Principal | JoAnn Heffernan Heisen |
| Occupation(s) During the Past Five Years: Executive | Born 1950. Trustee Since July 1998. Principal |
| Chief Staff and Marketing Officer for North America | Occupation(s) During the Past Five Years: Corporate |
| and Corporate Vice President (retired 2008) of Xerox | Vice President and Chief Global Diversity Officer |
| Corporation (document management products and | (retired 2008) and Member of the Executive |
| services); Executive in Residence and 2009–2010 | Committee (1997–2008) of Johnson & Johnson |
| Distinguished Minett Professor at the Rochester | (pharmaceuticals/medical devices/consumer |
| Institute of Technology; Director of SPX Corporation | products); Director of Skytop Lodge Corporation |
| (multi-industry manufacturing), the United Way of | (hotels), the University Medical Center at Princeton, |
| Rochester, Amerigroup Corporation (managed health | the Robert Wood Johnson Foundation, and the Center |
| care), the University of Rochester Medical Center, | for Talent Innovation; Member of the Advisory Board |
| Monroe Community College Foundation, and North | of the Maxwell School of Citizenship and Public Affairs |
| Carolina A&T University. | at Syracuse University. |
| Rajiv L. Gupta | F. Joseph Loughrey |
| Born 1945. Trustee Since December 2001.2 | Born 1949. Trustee Since October 2009. Principal |
| Principal Occupation(s) During the Past Five Years: | Occupation(s) During the Past Five Years: President |
| Chairman and Chief Executive Officer (retired 2009) | and Chief Operating Officer (retired 2009) of Cummins |
| and President (2006–2008) of Rohm and Haas Co. | Inc. (industrial machinery); Chairman of the Board |
| (chemicals); Director of Tyco International, Ltd. | of Hillenbrand, Inc. (specialized consumer services), |
| (diversified manufacturing and services), Hewlett- | and of Oxfam America; Director of SKF AB (industrial |
| Packard Co. (electronic computer manufacturing), | machinery), Hyster-Yale Materials Handling, Inc. |
| (forklift trucks), the Lumina Foundation for Education, | |
| and the V Foundation for Cancer Research; Member | Executive Officers | |
| of the Advisory Council for the College of Arts and | ||
| Letters and of the Advisory Board to the Kellogg | Glenn Booraem | |
| Institute for International Studies, both at the | Born 1967. Controller Since July 2010. Principal | |
| University of Notre Dame. | Occupation(s) During the Past Five Years: Principal | |
| of The Vanguard Group, Inc.; Controller of each of | ||
| Mark Loughridge | the investment companies served by The Vanguard | |
| Born 1953. Trustee Since March 2012. Principal | Group; Assistant Controller of each of the investment | |
| Occupation(s) During the Past Five Years: Senior Vice | companies served by The Vanguard Group (2001–2010). | |
| President and Chief Financial Officer (retired 2013) | ||
| at IBM (information technology services); Fiduciary | Thomas J. Higgins | |
| Member of IBM’s Retirement Plan Committee (2004– | Born 1957. Chief Financial Officer Since September | |
| 2013); Member of the Council on Chicago Booth. | 2008. Principal Occupation(s) During the Past Five | |
| Years: Principal of The Vanguard Group, Inc.; Chief | ||
| Scott C. Malpass | Financial Officer of each of the investment companies | |
| Born 1962. Trustee Since March 2012. Principal | served by The Vanguard Group; Treasurer of each of | |
| Occupation(s) During the Past Five Years: Chief | the investment companies served by The Vanguard | |
| Investment Officer and Vice President at the University | Group (1998–2008). | |
| of Notre Dame; Assistant Professor of Finance at the | ||
| Mendoza College of Business at Notre Dame; Member | Kathryn J. Hyatt | |
| of the Notre Dame 403(b) Investment Committee; | Born 1955. Treasurer Since November 2008. Principal | |
| Board Member of TIFF Advisory Services, Inc. | Occupation(s) During the Past Five Years: Principal of | |
| (investment advisor); Member of the Investment | The Vanguard Group, Inc.; Treasurer of each of the | |
| Advisory Committees of the Financial Industry | investment companies served by The Vanguard | |
| Regulatory Authority (FINRA) and of Major League | Group; Assistant Treasurer of each of the investment | |
| Baseball. | companies served by The Vanguard Group (1988–2008). | |
| André F. Perold | Heidi Stam | |
| Born 1952. Trustee Since December 2004. Principal | Born 1956. Secretary Since July 2005. Principal | |
| Occupation(s) During the Past Five Years: George | Occupation(s) During the Past Five Years: Managing | |
| Gund Professor of Finance and Banking, Emeritus | Director of The Vanguard Group, Inc.; General Counsel | |
| at the Harvard Business School (retired 2011); | of The Vanguard Group; Secretary of The Vanguard | |
| Chief Investment Officer and Managing Partner of | Group and of each of the investment companies | |
| HighVista Strategies LLC (private investment firm); | served by The Vanguard Group; Director and Senior | |
| Director of Rand Merchant Bank; Overseer of the | Vice President of Vanguard Marketing Corporation. | |
| Museum of Fine Arts Boston. | ||
| Vanguard Senior ManagementTeam | ||
| Alfred M. Rankin, Jr. | ||
| Born 1941. Trustee Since January 1993. Principal | Mortimer J. Buckley | Chris D. McIsaac |
| Occupation(s) During the Past Five Years: Chairman, | Kathleen C. Gubanich | Michael S. Miller |
| President, and Chief Executive Officer of NACCO | Paul A. Heller | James M. Norris |
| Industries, Inc. (housewares/lignite), and of Hyster- | Martha G. King | Glenn W. Reed |
| Yale Materials Handling, Inc. (forklift trucks); Chairman | John T. Marcante | |
| of the Board of University Hospitals of Cleveland. | ||
| Chairman Emeritus and Senior Advisor | ||
| Peter F. Volanakis | ||
| Born 1955. Trustee Since July 2009. Principal | John J. Brennan | |
| Occupation(s) During the Past Five Years: President | Chairman, 1996–2009 | |
| and Chief Operating Officer (retired 2010) of Corning | Chief Executive Officer and President, 1996–2008 | |
| Incorporated (communications equipment); Trustee of | ||
| Colby-Sawyer College; Member of the Advisory Board | Founder | |
| of the Norris Cotton Cancer Center and of the Advisory | ||
| Board of the Parthenon Group (strategy consulting). | John C. Bogle | |
| Chairman and Chief Executive Officer, 1974–1996 | ||
1 Mr. McNabb is considered an “interested person,” as defined in the Investment Company Act of 1940, because he is an officer of the Vanguard funds.
2 December 2002 for Vanguard Equity Income Fund, the Vanguard Municipal Bond Funds, and the Vanguard State Tax-Exempt Funds.
 | |
| P.O. Box 2600 | |
| Valley Forge, PA 19482-2600 | |
| Connect with Vanguard® > vanguard.com | |
| Fund Information > 800-662-7447 | CFA® is a registered trademark owned by CFA Institute. |
| Direct Investor Account Services > 800-662-2739 | |
| Institutional Investor Services > 800-523-1036 | |
| Text Telephone for People | |
| Who Are Deaf or Hard of Hearing> 800-749-7273 | |
| This material may be used in conjunction | |
| with the offering of shares of any Vanguard | |
| fund only if preceded or accompanied by | |
| the fund’s current prospectus. | |
| All comparative mutual fund data are from Lipper, a | |
| Thomson Reuters Company, or Morningstar, Inc., unless | |
| otherwise noted. | |
| You can obtain a free copy of Vanguard’s proxy voting | |
| guidelines by visiting vanguard.com/proxyreporting or by | |
| calling Vanguard at 800-662-2739. The guidelines are | |
| also available from the SEC’s website, sec.gov. In | |
| addition, you may obtain a free report on how your fund | |
| voted the proxies for securities it owned during the 12 | |
| months ended June 30. To get the report, visit either | |
| vanguard.com/proxyreporting or sec.gov. | |
| You can review and copy information about your fund at | |
| the SEC’s Public Reference Room in Washington, D.C. To | |
| find out more about this public service, call the SEC at | |
| 202-551-8090. Information about your fund is also | |
| available on the SEC’s website, and you can receive | |
| copies of this information, for a fee, by sending a | |
| request in either of two ways: via e-mail addressed to | |
| publicinfo@sec.gov or via regular mail addressed to the | |
| Public Reference Section, Securities and Exchange | |
| Commission, Washington, DC 20549-1520. | |
| © 2014 The Vanguard Group, Inc. | |
| All rights reserved. | |
| Vanguard Marketing Corporation, Distributor. | |
| Q930 112014 | |
Annual Report | September 30, 2014
Vanguard Structured Equity Funds
Vanguard Structured Large-Cap Equity Fund
Vanguard Structured Broad Market Fund
The mission continues
On May 1, 1975, Vanguard began operations, a fledgling company based on the simple but revolutionary idea that a mutual fund company should be managed solely in the interest of its investors.
Four decades later, that revolutionary spirit continues to animate the enterprise. Vanguard remains on a mission to give investors the best chance of investment success.
As we mark our 40th anniversary, we thank you for entrusting your assets to Vanguard and giving us the opportunity to help you reach your financial goals in the decades to come.
| Contents | |
| Your Fund’s Total Returns. | 1 |
| Chairman’s Letter. | 2 |
| Advisor’s Report. | 8 |
| Structured Large-Cap Equity Fund. | 10 |
| Structured Broad Market Fund. | 24 |
| About Your Fund’s Expenses. | 41 |
| Glossary. | 43 |
Please note: The opinions expressed in this report are just that—informed opinions. They should not be considered promises or advice.
Also, please keep in mind that the information and opinions cover the period through the date on the front of this report. Of course, the risks of investing in your fund are spelled out in the prospectus.
See the Glossary for definitions of investment terms used in this report.
About the cover: Since our founding, Vanguard has drawn inspiration from the enterprise and valor demonstrated by British naval hero Horatio Nelson and his command at the Battle of the Nile in 1798. The photograph displays a replica of a merchant ship from the same era as Nelson’s flagship, the HMS Vanguard.
Your Fund’s Total Returns
| Fiscal Year Ended September 30, 2014 | |
| Total | |
| Returns | |
| Vanguard Structured Large-Cap Equity Fund | |
| Institutional Shares | 22.08% |
| Institutional Plus Shares | 22.17 |
| S&P 500 Index | 19.73 |
| Large-Cap Core Funds Average | 17.40 |
| Large-Cap Core Funds Average: Derived from data provided by Lipper, a Thomson Reuters Company. | |
| Vanguard Structured Broad Market Fund | |
| Institutional Shares | 21.10% |
| Institutional Plus Shares | 21.16 |
| Russell 3000 Index | 17.76 |
| Multi-Cap Core Funds Average | 14.62 |
| Multi-Cap Core Funds Average: Derived from data provided by Lipper, a Thomson Reuters Company. | |
| Institutional Shares and Institutional Plus Shares are available to certain institutional investors who meet specific administrative, service, and account-size criteria. | |
| Your Fund’s Performance at a Glance | ||||
| September 30, 2013, Through September 30, 2014 | ||||
| Distributions Per Share | ||||
| Starting | Ending | |||
| Share | Share | Income | Capital | |
| Price | Price | Dividends | Gains | |
| Vanguard Structured Large-Cap Equity Fund | ||||
| Institutional Shares | $32.42 | $38.88 | $0.613 | $0.000 |
| Institutional Plus Shares | 64.10 | 76.94 | 1.201 | 0.000 |
| Vanguard Structured Broad Market Fund | ||||
| Institutional Shares | $32.59 | $37.28 | $0.564 | $1.374 |
| Institutional Plus Shares | 65.15 | 74.52 | 1.169 | 2.745 |
1

Chairman’s Letter
Dear Shareholder,
U.S. stocks climbed to record highs during the 12 months ended September 30, 2014, despite occasional reversals because of concerns about the pace of economic growth, the prospect of rising interest rates, and bouts of instability abroad.
Contributing to the strong performance were generally solid corporate earnings, robust mergers and acquisitions, an improving labor market, and the Federal Reserve’s still accommodative monetary policy. Institutional Shares of Vanguard Structured Large-Cap Equity Fund returned 22.08% for the fiscal year, about 2 percentage points better than the result for its benchmark, the Standard & Poor’s 500 Index, and more than 4 percentage points better than the average return of peer funds. The return for Institutional Plus Shares was 22.17%.
With mid- and small-capitalization stocks not returning as much as their large-cap counterparts, Institutional Shares of Vanguard Structured Broad Market Fund returned 21.10% for the 12 months, and Institutional Plus Shares returned 21.16%. The relative performance of this fund, however, was even stronger than for the large-cap fund. It beat the return of its benchmark, the Russell 3000 Index, by more than 3 percentage points and the average return of peer funds by more than 6 percentage points.
2
All ten market sectors produced double-digit returns for the benchmark indexes of both funds. More than half of the sectors contributed to the funds’ outperformance of their benchmarks.
Please note that as of September 30, 2014, the Structured Broad Market Fund had realized short-term capital gains equal to about 3% of fund assets and long-term capital gains equal to about 8% of fund assets. Gains will be distributed in December.
Despite patchiness of late, stocks posted solid returns
The broad U.S. stock market managed a robust return of nearly 18% for the 12 months ended September 30, despite stumbling in two of the final three months.
Healthy corporate profits and progress in the U.S. economy carried the markets through most of the period. High stock valuations, international tensions, the unsettled global economy, and the Federal Reserve’s gradual reduction of its bond purchases weighed on more recent results.
Over the period’s final months, the performance gap between U.S. stocks and their international counterparts widened amid tensions in the Middle East and Ukraine, coupled with China’s slower growth and Europe’s slumping economy. International stocks returned about 5%. Emerging markets and the developed markets of Europe and the Pacific region all recorded single-digit returns.
| Market Barometer | |||
| Average Annual Total Returns | |||
| Periods Ended September 30, 2014 | |||
| One | Three | Five | |
| Year | Years | Years | |
| Stocks | |||
| Russell 1000 Index (Large-caps) | 19.01% | 23.23% | 15.90% |
| Russell 2000 Index (Small-caps) | 3.93 | 21.26 | 14.29 |
| Russell 3000 Index (Broad U.S. market) | 17.76 | 23.08 | 15.78 |
| FTSE All-World ex US Index (International) | 5.11 | 12.12 | 6.31 |
| Bonds | |||
| Barclays U.S. Aggregate Bond Index (Broad taxable market) | 3.96% | 2.43% | 4.12% |
| Barclays Municipal Bond Index (Broad tax-exempt market) | 7.93 | 4.56 | 4.67 |
| Citigroup Three-Month U.S. Treasury Bill Index | 0.04 | 0.04 | 0.06 |
| CPI | |||
| Consumer Price Index | 1.66% | 1.61% | 1.96% |
3
Bonds bounced back strongly, even given their recent pause
Bond returns, which were surprisingly robust through most of the fiscal year, also met resistance late in the period. Still, the broad U.S. taxable bond market returned 3.96%, a significant recovery from its negative outcome a year ago.
Since January, the Fed has pared back its bond-buying program, with the aim of ending it in October. Until recently, interest rates did not rise as analysts had predicted. The yield of the 10-year U.S. Treasury note ended September at 2.48%, down from 2.63% a year earlier. (Bond prices and yields move in opposite directions.)
Municipal bonds, which returned 7.93%, benefited from the broad market rally and a limited supply of new issues.
Following this advance for U.S. taxable and tax-exempt bonds, it’s worth remembering that the current low yields imply lower future returns: As yields drop, the scope for further declines—and increases in prices—diminishes.
International bond markets (as measured by the Barclays Global Aggregate Index ex USD) returned –0.81% after sinking in September.
Money market funds and savings accounts posted negligible returns, as the Fed kept its target for short-term interest rates at 0%–0.25%.
Stock selection among industrials fueled the funds’ outperformance
Vanguard Equity Investment Group, through its Quantitative Equity Group, was successful over the 12 months in using its proprietary computer models to identify high-quality stocks that were available at good prices and have the potential to grow faster than their peers. The funds met their objective of producing benchmark-beating returns without taking on significantly more risk through sector or market-capitalization tilts. (For more information on the funds’ quantitative approach to active management, please see the text box on page 6.)
The steadier earnings and higher yields of companies with larger market capitalizations held more allure for investors, especially in the second half of the fiscal year as prospects for economic growth cooled. These companies’ more attractive valuations played a role as well, given the strong run small-caps have had since the financial crisis. These factors gave the Structured Large-Cap Equity Fund a boost over the Structured Broad Market Fund, which invests across the market-capitalization spectrum.
The industrial stocks held by the funds accounted for roughly one-third of the Large-Cap Fund’s relative outperformance and about one-half of the Broad Market Fund’s. The advisor’s outsized positions in aerospace and defense stocks climbed amid increased turmoil in the Middle East, which led to expectations of greater
4
demand for military equipment. The funds benefited, too, from holdings in the commercial airline industry, where consolidation, improved pricing dynamics, and more efficient use of seating capacity have led to higher earnings. A third area of strength was railroad stocks, as the boom in the oil and gas industry has contributed to a surge in rail traffic.
There were other pockets of outperformance as well, including internet-related and computer hardware stocks in the information technology sector, as well as food producers and food and drug retailers in consumer staples.
There were a few missteps, notably among financials, where the funds largely missed out on the strong performances of some big banks. The Broad Market Fund’s return was also dampened by some consumer finance stocks in its portfolio.
For more information about the advisor’s approach and the funds’ positioning during the year, please see the Advisor’s Report that follows this letter.
The funds’ long-term returns have topped those of their benchmarks
The advisor’s disciplined, quantitative strategy has produced strong relative returns in recent years when fundamental stock analysis has paid off, but that same strategy was less successful right after the financial crisis when stocks were rebounding in lockstep with one another.
| |
| Total Returns | |
| Ten Years Ended September 30, 2014 | |
| Average | |
| Annual Return | |
| Structured Large-Cap Equity Fund Institutional Plus Shares (Returns since inception: 5/15/2006) | 7.65% |
| S&P 500 Index | 7.42 |
| Large-Cap Core Funds Average | 6.23 |
| Large-Cap Core Funds Average: Derived from data provided by Lipper, a Thomson Reuters Company. | |
| Structured Broad Market Fund Institutional Plus Shares | 8.76% |
| Russell 3000 Index | 8.44 |
| Multi-Cap Core Funds Average | 7.29 |
| Multi-Cap Core Funds Average: Derived from data provided by Lipper, a Thomson Reuters Company. | |
The figures shown represent past performance, which is not a guarantee of future results. (Current performance may be lower or higher than the performance data cited. For performance data current to the most recent month-end, visit our website at vanguard.com/performance.) Note, too, that both investment returns and principal value can fluctuate widely, so an investor’s shares, when sold, could be worth more or less than their original cost.
5
So while the funds have gone through periods of under- and outperformance over relatively short stretches of time, it is pleasing to note that the investment process practiced by your fund’s advisor has met its objective of producing benchmark-beating results over the long term.
The Broad Market Fund’s Institutional Plus Shares, which have been around the longest, have produced an average annual return of 8.76% over the last decade, outpacing the fund’s benchmark, the Russell 3000 Index (8.44%), and its peers (7.29%).
The Large-Cap Fund’s Institutional Plus Shares, launched in 2006, posted an average annual return of 7.65% since their inception a little more than eight years ago. That put the fund ahead of its benchmark, the S&P 500 Index (7.42%), and peer funds (6.23%).
High costs don’t equal strong fund performance
The adage “You get what you pay for” doesn’t apply to mutual funds. In fact, the reverse is true: Research suggests that higher costs are consistent with weaker returns. (See, for example, Shopping for Alpha: You Get What You Don’t Pay For, at vanguard.com/research.)
| Quant funds: Active management with more risk control |
| Index fund managers seek to closely match the risks and returns of an index. Traditional active |
| fund managers seek to outperform, typically without much regard to close index tracking. |
| Quantitative investing has features of both strategies. As with indexing, quantitative fund |
| managers rely on sophisticated computer models to build risk-controlled portfolios. And like |
| traditional active managers, quants seek to outperform an index—but they impose more |
| risk controls. |
| Vanguard’s Quantitative Equity Group (QEG) seeks to build a portfolio that focuses on paying |
| a reasonable price for future earnings growth. In doing so, it analyzes the same types of |
| fundamental data, such as earnings growth prospects and balance-sheet quality, that other |
| active managers do. The difference is that QEG uses a proprietary computer model to |
| systematically evaluate thousands of companies very quickly and efficiently, without the |
| human emotion that can cloud decision-making. |
| That still leaves room for good judgment, though. Each day, as they seek to beat the |
| benchmark, the managers consider making small adjustments to their holdings, subject to |
| minimizing turnover costs and meeting strict, internally set risk targets. Those targets include |
| closely matching the index’s sector weights, an area where QEG believes that the risk of |
| deviating from the benchmark isn’t justified by the rewards. It’s a fine balance between trying |
| to outperform and controlling risk. |
6
Wouldn’t paying the highest fees allow you to purchase the services of the greatest talents, and therefore get you the best returns? As it turns out, the data don’t support that argument. The explanation is simple: Every dollar paid for management fees is a dollar less earning potential return. Keeping expenses down can help narrow the gap between what the markets return and what investors actually earn.
That’s why Vanguard always seeks to minimize costs. Indexing, of course, is the purest form of low-cost investing. And we negotiate low fees for our actively managed funds, which are run by world-class advisors. It’s a strategy that reflects decades of experience and research, boiled down to one tenet: The less you pay, the more you keep.
As always, thank you for investing with Vanguard.
Sincerely,

F. William McNabb III
Chairman and Chief Executive Officer
October 17, 2014
7
Advisor’s Report
For the fiscal year ended September 30, 2014, Vanguard Structured Large-Cap Equity Fund returned 22.08% for Institutional Shares and 22.17% for Institutional Plus Shares, outpacing the return of 19.73% for its benchmark, the S&P 500 Index. Vanguard Structured Broad Market Fund returned 21.10% for Institutional Shares and 21.16% for Institutional Plus Shares, beating the return of 17.76% for its benchmark, the Russell 3000 Index.
Over the 12 months, equities provided investors with above-average returns, but results were buoyed by a strong first half of the fiscal year. For example, the Russell 3000 Index returned 12.28% for the first six months, compared with 4.88% for the last six. Large- and mid-capitalization stocks outperformed smaller-cap equities in the United States. Globally, the U.S. equity market continued to outpace other developed markets and emerging markets.
Performances for all ten sectors within the broad market were positive. Results were best among health care, information technology, and materials companies. Telecommunication services, energy, and consumer discretionary companies were the laggards for the period, although they too produced double-digit returns.
Part of the ongoing strength in the U.S. equity markets can be attributed to the continued accommodative policies of central banks around the world and a lower volatility environment across financial markets. In the beginning of July, the Chicago Board Options Exchange Volatility Index (VIX) registered its lowest level, 10.3, in the last five years. Volatility began to trend back up in August and September, but still finished the period at levels below the index’s long-term average.
The labor market continued to recover, as the unemployment rate fell to 5.9% at the end of the period, a level not seen since July 2008. In addition, personal income levels have risen and savings rates have dropped slightly, indicating possible spending increases by consumers. GDP recovered from a disappointing first quarter, and both manufacturing and non-manufacturing activity indexes were moving higher.
That being said, there are still many factors that can affect the markets in the coming months: the uncertainty of midterm elections in the United States, the impact of the Federal Reserve’s winding down of its bond-purchase program at the end of October, speculation as to when interest rates will rise, and geopolitical uncertainties across the globe.
Although it’s important to understand how overall portfolio performance is affected by the macroeconomic factors described above, our approach to investing emphasizes specific stock fundamentals. We employ a process that compares stocks in our investment universe within the same industry groups in order to identify those with characteristics that we believe will enable them to outperform over the long run. This strict quantitative process is based on a combination of valuation and other factors that are focused
8
on fundamental growth. We use the results of our model to construct our portfolio, with the goal of maximizing expected return and minimizing exposure to risks that our research indicates do not improve returns, such as deviations from market capitalization and sector weightings relative to our benchmark.
The model’s effectiveness over the period was strong across sectors. The Structured Large-Cap Equity Fund produced positive stock selection results in six of the ten sectors in the benchmark, with the strongest results in industrials, information technology, and consumer staples. We underperformed in financials, and to a lesser extent in health care, telecommunication services, and energy. The Structured Broad Market Equity Fund produced positive stock selection results in seven of the ten sectors in the benchmark, benefiting the most from strong selection in industrials and information technology. We underperformed slightly in financials and telecommunication services and were on par with the benchmark for utilities.
Structured Large-Cap Equity Fund
At the individual stock level, the largest contributions to the fund’s return came from overweight positions in Hewlett-Packard (+72%), Southwest Airlines (+89%), and Western Digital (+55%). In addition, when comparing the portfolio’s performance to that of its benchmark, we benefited from underweighting or avoiding poorly performing stocks such as eBay (+2%) and General Motors (–9%).
Unfortunately, we were not able to avoid all bad performers. Overweight positions in Chesapeake Energy (–5%) and Best Buy (–11%) directly hindered performance. Also, underweighting companies that were not positively identified by the fundamentals in our model, like Bank of America (+24%) and Intel (+57%), hurt our overall performance relative to the fund’s benchmark.
Structured Broad Market Equity Fund
At the individual stock level, the largest contributions to the fund’s return came from overweight positions in Facebook (+66%), Pilgrim’s Pride (+82%), and Delta Air Lines (+72%). Relative to the benchmark, we benefited from underweighting or avoiding poorly performing stocks such as Ford (–10%) and United Technologies (0%).
Overweight positions in Portfolio Recovery Associates (–15%) and Covance (–9%) directly hindered performance. Here, too, underweighting Bank of America (+24%) and Intel (+57%) hurt our overall performance relative to the fund’s benchmark.
We thank you for your investment and look forward to the coming fiscal year.
Portfolio Managers:
James P. Stetler, Principal
James D. Troyer, CFA, Principal
Michael R. Roach, CFA
Vanguard Equity Investment Group
October 21, 2014
9
Structured Large-Cap Equity Fund
Fund Profile
As of September 30, 2014
| Share-Class Characteristics | ||
| Institutional | Institutional | |
| Shares | Plus Shares | |
| Ticker Symbol | VSLIX | VSLPX |
| Expense Ratio1 | 0.24% | 0.17% |
| 30-Day SEC Yield | 1.79% | 1.86% |
| Portfolio Characteristics | |||
| DJ | |||
| U.S. | |||
| Total | |||
| Market | |||
| S&P 500 | FA | ||
| Fund | Index | Index | |
| Number of Stocks | 167 | 502 | 3,768 |
| Median Market Cap | $58.0B | $75.5B | $51.1B |
| Price/Earnings Ratio | 17.7x | 19.1x | 20.5x |
| Price/Book Ratio | 2.7x | 2.7x | 2.6x |
| Return on Equity | 19.2% | 19.1% | 17.8% |
| Earnings Growth | |||
| Rate | 17.1% | 15.2% | 15.2% |
| Dividend Yield | 2.0% | 2.0% | 1.9% |
| Foreign Holdings | 0.0% | 0.0% | 0.0% |
| Turnover Rate | 68% | — | — |
| Short-Term Reserves | 0.0% | — | — |
| Sector Diversification (% of equity exposure) | |||
| DJ | |||
| U.S. Total | |||
| S&P 500 | Market | ||
| Fund | Index | FA Index | |
| Consumer | |||
| Discretionary | 12.3% | 11.7% | 12.5% |
| Consumer Staples | 8.8 | 9.5 | 8.3 |
| Energy | 9.2 | 9.7 | 9.1 |
| Financials | 15.4 | 16.3 | 17.4 |
| Health Care | 14.8 | 13.9 | 13.5 |
| Industrials | 10.7 | 10.3 | 11.2 |
| Information | |||
| Technology | 18.7 | 19.7 | 19.0 |
| Materials | 4.0 | 3.5 | 3.8 |
| Telecommunication | |||
| Services | 2.9 | 2.4 | 2.2 |
| Utilities | 3.2 | 3.0 | 3.0 |
| Volatility Measures | ||
| DJ | ||
| U.S. Total | ||
| S&P 500 | Market | |
| Index | FA Index | |
| R-Squared | 0.99 | 0.98 |
| Beta | 1.03 | 0.98 |
| These measures show the degree and timing of the fund’s fluctuations compared with the indexes over 36 months. | ||
| Ten Largest Holdings (% of total net assets) | ||
| Apple Inc. | Computer Hardware | 3.4% |
| Johnson & Johnson | Pharmaceuticals | 2.3 |
| Exxon Mobil Corp. | Integrated Oil & Gas | 2.0 |
| Wells Fargo & Co. | Diversified Banks | 1.9 |
| Microsoft Corp. | Systems Software | 1.9 |
| General Electric Co. | Industrial | |
| Conglomerates | 1.8 | |
| Verizon Communications | Integrated | |
| Inc. | Telecommunication | |
| Services | 1.7 | |
| International Business | IT Consulting & | |
| Machines Corp. | Other Services | 1.5 |
| Google Inc. | Internet Software & | |
| Services | 1.5 | |
| Merck & Co. Inc. | Pharmaceuticals | 1.5 |
| Top Ten | 19.5% | |
| The holdings listed exclude any temporary cash investments and equity index products. | ||
Investment Focus

1 The expense ratios shown are from the prospectus dated January 27, 2014. For the fiscal year ended September 30, 2014, the expense ratios were 0.24% for Institutional Shares and 0.17% for Institutional Plus Shares.
10
Structured Large-Cap Equity Fund
Performance Summary
All of the returns in this report represent past performance, which is not a guarantee of future results that may be achieved by the fund. (Current performance may be lower or higher than the performance data cited. For performance data current to the most recent month-end, visit our website at vanguard.com/performance.) Note, too, that both investment returns and principal value can fluctuate widely, so an investor’s shares, when sold, could be worth more or less than their original cost. The returns shown do not reflect taxes that a shareholder would pay on fund distributions or on the sale of fund shares.
Cumulative Performance: May 16, 2006, Through September 30, 2014
Initial Investment of $5,000,000

| Average Annual Total Returns | |||||
| Periods Ended September 30, 2014 | |||||
| Since | Final Value | ||||
| One | Five | Inception | of a $5,000,000 | ||
| Year | Years | (5/16/2006) | Investment | ||
| Structured Large-Cap Equity | |||||
| Fund*Institutional Shares | 22.08% | 17.02% | 7.59% | $9,224,709 | |
| •••••••• | S&P 500 Index | 19.73 | 15.70 | 7.45 | 9,127,616 |
| – – – – | Large-Cap Core Funds Average | 17.40 | 13.80 | 6.25 | 8,308,853 |
| Dow Jones U.S. Total Stock Market | |||||
| Float Adjusted Index | 17.69 | 15.84 | 7.65 | 9,268,434 | |
| Large-Cap Core Funds Average: Derived from data provided by Lipper, a Thomson Reuters Company. "Since Inception" performance is calculated from the Institutional Shares’ inception date for both the fund and its comparative standards. | |||||
| Since | Final Value | |||
| One | Five | Inception | of a $200,000,000 | |
| Year | Years | (5/15/2006) | Investment | |
| Structured Large-Cap Equity Fund Institutional | ||||
| Plus Shares | 22.17% | 17.10% | 7.65% | $370,809,151 |
| S&P 500 Index | 19.73 | 15.70 | 7.42 | 331,822,341 |
| Dow Jones U.S. Total Stock Market Float | ||||
| Adjusted Index | 17.69 | 15.84 | 7.63 | 370,177,045 |
| "Since Inception" performance is calculated from the Institutional Plus Shares’ inception date for both the fund and its comparative standards. | ||||
See Financial Highlights for dividend and capital gains information
11
Structured Large-Cap Equity Fund
Fiscal-Year Total Returns (%): May 16, 2006, Through September 30, 2014
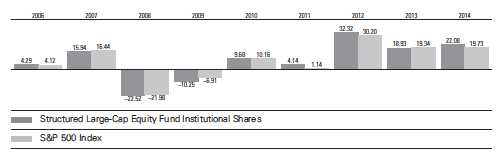
Structured Large-Cap Equity Fund
Financial Statements
Statement of Net Assets
As of September 30, 2014
The fund reports a complete list of its holdings in regulatory filings four times in each fiscal year, at the quarter-ends. For the second and fourth fiscal quarters, the lists appear in the fund’s semiannual and annual reports to shareholders. For the first and third fiscal quarters, the fund files the lists with the Securities and Exchange Commission on Form N-Q. Shareholders can look up the fund’s Forms N-Q on the SEC’s website at sec.gov. Forms N-Q may also be reviewed and copied at the SEC’s Public Reference Room (see the back cover of this report for further information).
| Market | |||
| Value | |||
| Shares | ($000) | ||
| Common Stocks (99.8%)1 | |||
| Consumer Discretionary (12.3%) | |||
| Walt Disney Co. | 112,579 | 10,023 | |
| Home Depot Inc. | 101,875 | 9,346 | |
| Comcast Corp. Class A | 170,800 | 9,186 | |
| Lowe’s Cos. Inc. | 112,850 | 5,972 | |
| Marriott International Inc. | |||
| Class A | 67,800 | 4,739 | |
| Macy’s Inc. | 78,700 | 4,579 | |
| Wyndham Worldwide Corp. | 55,800 | 4,534 | |
| * | O’Reilly Automotive Inc. | 28,300 | 4,255 |
| Newell Rubbermaid Inc. | 121,500 | 4,181 | |
| Expedia Inc. | 46,500 | 4,074 | |
| Delphi Automotive plc | 66,100 | 4,055 | |
| * | AutoZone Inc. | 7,700 | 3,924 |
| H&R Block Inc. | 122,800 | 3,808 | |
| Cablevision Systems Corp. | |||
| Class A | 211,200 | 3,698 | |
| Time Warner Inc. | 38,300 | 2,881 | |
| * | Chipotle Mexican Grill Inc. | ||
| Class A | 4,000 | 2,666 | |
| NIKE Inc. Class B | 26,600 | 2,373 | |
| * | DIRECTV | 19,500 | 1,687 |
| Time Warner Cable Inc. | 11,200 | 1,607 | |
| * | Amazon.com Inc. | 4,100 | 1,322 |
| Best Buy Co. Inc. | 39,300 | 1,320 | |
| Comcast Corp. | 10,525 | 563 | |
| McDonald’s Corp. | 1,447 | 137 | |
| Johnson Controls Inc. | 1,700 | 75 | |
| 91,005 | |||
| Consumer Staples (8.7%) | |||
| PepsiCo Inc. | 106,892 | 9,951 | |
| CVS Health Corp. | 99,800 | 7,943 | |
| Procter & Gamble Co. | 80,594 | 6,749 | |
| Kimberly-Clark Corp. | 52,300 | 5,626 | |
| Archer-Daniels-Midland Co. | 109,600 | 5,600 | |
| Kroger Co. | 100,300 | 5,216 | |
| Dr Pepper Snapple | |||
| Group Inc. | 72,800 | 4,682 | |
| Market | |||
| Value | |||
| Shares | ($000) | ||
| Molson Coors Brewing Co. | |||
| Class B | 61,900 | 4,608 | |
| Tyson Foods Inc. Class A | 112,900 | 4,445 | |
| Coca-Cola Co. | 67,580 | 2,883 | |
| Wal-Mart Stores Inc. | 26,946 | 2,060 | |
| Philip Morris | |||
| International Inc. | 22,336 | 1,863 | |
| Mondelez International Inc. | |||
| Class A | 49,100 | 1,682 | |
| * | Monster Beverage Corp. | 9,000 | 825 |
| Keurig Green Mountain Inc. | 2,000 | 260 | |
| Costco Wholesale Corp. | 900 | 113 | |
| 64,506 | |||
| Energy (9.2%) | |||
| Exxon Mobil Corp. | 154,239 | 14,506 | |
| ConocoPhillips | 97,859 | 7,488 | |
| Occidental Petroleum Corp. | 72,000 | 6,923 | |
| Chevron Corp. | 51,956 | 6,199 | |
| EOG Resources Inc. | 57,500 | 5,694 | |
| Anadarko Petroleum Corp. | 54,600 | 5,539 | |
| Valero Energy Corp. | 99,500 | 4,604 | |
| Chesapeake Energy Corp. | 158,200 | 3,637 | |
| * | Newfield Exploration Co. | 94,300 | 3,496 |
| Nabors Industries Ltd. | 152,000 | 3,460 | |
| Marathon Oil Corp. | 67,500 | 2,537 | |
| Schlumberger Ltd. | 20,125 | 2,046 | |
| * | FMC Technologies Inc. | 13,200 | 717 |
| Phillips 66 | 6,979 | 567 | |
| * | Southwestern Energy Co. | 15,900 | 556 |
| 67,969 | |||
| Financials (15.4%) | |||
| Wells Fargo & Co. | 277,435 | 14,390 | |
| Goldman Sachs Group Inc. | 40,100 | 7,361 | |
| American Express Co. | 77,000 | 6,741 | |
| JPMorgan Chase & Co. | 100,379 | 6,047 | |
| Capital One Financial Corp. | 69,100 | 5,640 | |
| Travelers Cos. Inc. | 57,900 | 5,439 | |
| Discover Financial Services | 78,950 | 5,084 | |
| Ameriprise Financial Inc. | 40,500 | 4,997 | |
| Lincoln National Corp. | 85,100 | 4,560 | |
13
Structured Large-Cap Equity Fund
| Market | |||
| Value | |||
| Shares | ($000) | ||
| Regions Financial Corp. | 428,300 | 4,300 | |
| KeyCorp | 318,900 | 4,251 | |
| * | Berkshire Hathaway Inc. | ||
| Class B | 29,705 | 4,103 | |
| Assurant Inc. | 62,700 | 4,032 | |
| Simon Property Group Inc. | 21,700 | 3,568 | |
| Bank of America Corp. | 202,153 | 3,447 | |
| Unum Group | 89,200 | 3,067 | |
| BlackRock Inc. | 9,200 | 3,020 | |
| Citigroup Inc. | 53,025 | 2,748 | |
| Fifth Third Bancorp | 133,100 | 2,665 | |
| Host Hotels & Resorts Inc. | 119,300 | 2,545 | |
| * | Berkshire Hathaway Inc. | ||
| Class A | 11 | 2,276 | |
| General Growth | |||
| Properties Inc. | 83,900 | 1,976 | |
| Ventas Inc. | 30,800 | 1,908 | |
| Navient Corp. | 80,200 | 1,420 | |
| PNC Financial Services | |||
| Group Inc. | 15,000 | 1,284 | |
| Kimco Realty Corp. | 57,200 | 1,253 | |
| Legg Mason Inc. | 21,800 | 1,115 | |
| SunTrust Banks Inc. | 27,700 | 1,053 | |
| Public Storage | 5,300 | 879 | |
| Prologis Inc. | 20,400 | 769 | |
| US Bancorp | 9,600 | 401 | |
| Comerica Inc. | 7,700 | 384 | |
| Huntington Bancshares Inc. | 39,000 | 379 | |
| Health Care REIT Inc. | 3,200 | 200 | |
| 113,302 | |||
| Health Care (14.7%) | |||
| Johnson & Johnson | 157,046 | 16,739 | |
| Merck & Co. Inc. | 186,044 | 11,029 | |
| * | Gilead Sciences Inc. | 101,900 | 10,847 |
| AbbVie Inc. | 139,368 | 8,050 | |
| Eli Lilly & Co. | 100,687 | 6,530 | |
| Allergan Inc. | 34,900 | 6,219 | |
| Pfizer Inc. | 202,175 | 5,978 | |
| * | Express Scripts Holding Co. | 83,000 | 5,862 |
| WellPoint Inc. | 46,600 | 5,574 | |
| Cardinal Health Inc. | 69,400 | 5,199 | |
| Aetna Inc. | 59,700 | 4,836 | |
| Cigna Corp. | 52,900 | 4,797 | |
| * | Edwards Lifesciences Corp. | 42,900 | 4,382 |
| * | Boston Scientific Corp. | 358,100 | 4,229 |
| Zoetis Inc. | 110,600 | 4,087 | |
| * | Biogen Idec Inc. | 8,200 | 2,713 |
| * | Hospira Inc. | 10,700 | 557 |
| Humana Inc. | 3,300 | 430 | |
| Amgen Inc. | 2,200 | 309 | |
| Bristol-Myers Squibb Co. | 4,000 | 205 | |
| UnitedHealth Group Inc. | 1,900 | 164 | |
| 108,736 | |||
| Industrials (10.7%) | |||
| General Electric Co. | 522,122 | 13,377 | |
| Boeing Co. | 58,900 | 7,503 | |
| Market | |||
| Value | |||
| Shares | ($000) | ||
| Caterpillar Inc. | 64,000 | 6,338 | |
| Lockheed Martin Corp. | 34,400 | 6,288 | |
| General Dynamics Corp. | 46,500 | 5,910 | |
| Northrop Grumman Corp. | 40,416 | 5,325 | |
| Southwest Airlines Co. | 154,900 | 5,231 | |
| Illinois Tool Works Inc. | 59,200 | 4,998 | |
| Union Pacific Corp. | 43,100 | 4,673 | |
| L-3 Communications | |||
| Holdings Inc. | 36,700 | 4,364 | |
| Cintas Corp. | 60,400 | 4,264 | |
| Pitney Bowes Inc. | 151,400 | 3,783 | |
| Raytheon Co. | 31,900 | 3,242 | |
| 3M Co. | 14,000 | 1,983 | |
| Delta Air Lines Inc. | 48,700 | 1,760 | |
| United Technologies Corp. | 1,186 | 125 | |
| 79,164 | |||
| Information Technology (18.7%) | |||
| Apple Inc. | 250,574 | 25,245 | |
| Microsoft Corp. | 307,741 | 14,267 | |
| International Business | |||
| Machines Corp. | 60,240 | 11,435 | |
| * | Facebook Inc. Class A | 125,300 | 9,904 |
| Intel Corp. | 222,153 | 7,735 | |
| Hewlett-Packard Co. | 186,150 | 6,603 | |
| * | Google Inc. Class A | 10,505 | 6,181 |
| Texas Instruments Inc. | 129,200 | 6,162 | |
| Accenture plc Class A | 72,300 | 5,880 | |
| Intuit Inc. | 60,400 | 5,294 | |
| * | Google Inc. Class C | 8,705 | 5,026 |
| Western Digital Corp. | 47,500 | 4,623 | |
| Seagate Technology plc | 80,200 | 4,593 | |
| Computer Sciences Corp. | 70,800 | 4,329 | |
| * | Electronic Arts Inc. | 121,400 | 4,323 |
| Harris Corp. | 56,000 | 3,718 | |
| MasterCard Inc. Class A | 45,000 | 3,326 | |
| Oracle Corp. | 51,988 | 1,990 | |
| QUALCOMM Inc. | 24,057 | 1,799 | |
| Cisco Systems Inc. | 66,015 | 1,662 | |
| NVIDIA Corp. | 56,000 | 1,033 | |
| Visa Inc. Class A | 4,400 | 939 | |
| * | F5 Networks Inc. | 7,700 | 914 |
| * | Cognizant Technology | ||
| Solutions Corp. Class A | 9,600 | 430 | |
| Symantec Corp. | 16,300 | 383 | |
| 137,794 | |||
| Materials (4.0%) | |||
| LyondellBasell Industries | |||
| NV Class A | 53,400 | 5,803 | |
| CF Industries Holdings Inc. | 17,700 | 4,942 | |
| PPG Industries Inc. | 23,814 | 4,685 | |
| Alcoa Inc. | 269,300 | 4,333 | |
| Ball Corp. | 67,900 | 4,296 | |
| Avery Dennison Corp. | 70,400 | 3,144 | |
| United States Steel Corp. | 57,400 | 2,248 | |
| 29,451 | |||
14
Structured Large-Cap Equity Fund
| Market | |||
| Value | |||
| Shares | ($000) | ||
| Telecommunication Services (2.9%) | |||
| Verizon | |||
| Communications Inc. | 249,996 | 12,497 | |
| AT&T Inc. | 194,135 | 6,841 | |
| Frontier | |||
| Communications Corp. | 320,100 | 2,084 | |
| 21,422 | |||
| Utilities (3.2%) | |||
| Exelon Corp. | 150,500 | 5,131 | |
| American Electric | |||
| Power Co. Inc. | 95,000 | 4,960 | |
| Entergy Corp. | 60,300 | 4,663 | |
| Edison International | 76,500 | 4,278 | |
| AGL Resources Inc. | 77,200 | 3,963 | |
| Consolidated Edison Inc. | 8,300 | 470 | |
| 23,465 | |||
| Total Common Stocks | |||
| (Cost $577,094) | 736,814 | ||
| Temporary Cash Investments (0.2%)1 | |||
| Money Market Fund (0.1%) | |||
| 2 | Vanguard Market | ||
| Liquidity Fund, 0.109% | 1,255,797 | 1,256 | |
| Face | |||
| Amount | |||
| ($000) | |||
| U.S. Government and Agency Obligations (0.1%) | |||
| 3 | Federal Home Loan | ||
| Bank Discount Notes, | |||
| 0.078%, 10/1/14 | 200 | 200 | |
| 3,4 | Federal Home Loan | ||
| Bank Discount Notes, | |||
| 0.070%, 3/27/15 | 200 | 200 | |
| 400 | |||
| Total Temporary Cash Investments | |||
| (Cost $1,656) | 1,656 | ||
| Total Investments (100.0%) | |||
| (Cost $578,750) | 738,470 | ||
| Market | |
| Value | |
| ($000) | |
| Other Assets and Liabilities (0.0%) | |
| Other Assets | 818 |
| Liabilities | (1,079) |
| (261) | |
| Net Assets (100%) | 738,209 |
| At September 30, 2014, net assets consisted of: | |
| Amount | |
| ($000) | |
| Paid-in Capital | 588,413 |
| Undistributed Net Investment Income | 10,044 |
| Accumulated Net Realized Losses | (19,951) |
| Unrealized Appreciation (Depreciation) | |
| Investment Securities | 159,720 |
| Futures Contracts | (17) |
| Net Assets | 738,209 |
| Institutional Shares—Net Assets | |
| Applicable to 1,495,494 outstanding | |
| $.001 par value shares of beneficial | |
| interest (unlimited authorization) | 58,151 |
| Net Asset Value Per Share— | |
| Institutional Shares | $38.88 |
| Institutional Plus Shares—Net Assets | |
| Applicable to 8,838,386 outstanding | |
| $.001 par value shares of beneficial | |
| interest (unlimited authorization) | 680,058 |
| Net Asset Value Per Share— | |
| Institutional Plus Shares | $76.94 |
See Note A in Notes to Financial Statements.
* Non-income-producing security.
1 The fund invests a portion of its cash reserves in equity markets through the use of index futures contracts. After giving effect to futures investments, the fund’s effective common stock and temporary cash investment positions represent 100.0% and 0.0%, respectively, of net assets.
2 Affiliated money market fund available only to Vanguard funds and certain trusts and accounts managed by Vanguard. Rate shown is the 7-day yield.
3 The issuer operates under a congressional charter; its securities are generally neither guaranteed by the U.S. Treasury nor backed by the full faith and credit of the U.S. government.
4 Securities with a value of $200,000 have been segregated as initial margin for open futures contracts.
REIT—Real Estate Investment Trust.
See accompanying Notes, which are an integral part of the Financial Statements.
15
Structured Large-Cap Equity Fund
Statement of Operations
| Year Ended | |
| September 30, 2014 | |
| ($000) | |
| Investment Income | |
| Income | |
| Dividends | 15,460 |
| Interest1 | 3 |
| Total Income | 15,463 |
| Expenses | |
| The Vanguard Group—Note B | |
| Investment Advisory Services | 641 |
| Management and Administrative—Institutional Shares | 69 |
| Management and Administrative—Institutional Plus Shares | 428 |
| Marketing and Distribution—Institutional Shares | 12 |
| Marketing and Distribution—Institutional Plus Shares | 91 |
| Custodian Fees | 12 |
| Auditing Fees | 34 |
| Shareholders’ Reports—Institutional Shares | 1 |
| Shareholders’ Reports—Institutional Plus Shares | — |
| Total Expenses | 1,288 |
| Net Investment Income | 14,175 |
| Realized Net Gain (Loss) | |
| Investment Securities Sold | 100,580 |
| Futures Contracts | 450 |
| Realized Net Gain (Loss) | 101,030 |
| Change in Unrealized Appreciation (Depreciation) | |
| Investment Securities | 30,281 |
| Futures Contracts | 3 |
| Change in Unrealized Appreciation (Depreciation) | 30,284 |
| Net Increase (Decrease) in Net Assets Resulting from Operations | 145,489 |
| 1 Interest income from an affiliated company of the fund was $2,000. | |
See accompanying Notes, which are an integral part of the Financial Statements.
16
Structured Large-Cap Equity Fund
Statement of Changes in Net Assets
| Year Ended September 30, | ||
| 2014 | 2013 | |
| ($000) | ($000) | |
| Increase (Decrease) in Net Assets | ||
| Operations | ||
| Net Investment Income | 14,175 | 12,100 |
| Realized Net Gain (Loss) | 101,030 | 62,931 |
| Change in Unrealized Appreciation (Depreciation) | 30,284 | 21,069 |
| Net Increase (Decrease) in Net Assets Resulting from Operations | 145,489 | 96,100 |
| Distributions | ||
| Net Investment Income | ||
| Institutional Shares | (930) | (313) |
| Institutional Plus Shares | (11,472) | (10,525) |
| Realized Capital Gain | ||
| Institutional Shares | — | — |
| Institutional Plus Shares | — | — |
| Total Distributions | (12,402) | (10,838) |
| Capital Share Transactions | ||
| Institutional Shares | (4,066) | 34,877 |
| Institutional Plus Shares | (55,209) | 31,530 |
| Net Increase (Decrease) from Capital Share Transactions | (59,275) | 66,407 |
| Total Increase (Decrease) | 73,812 | 151,669 |
| Net Assets | ||
| Beginning of Period | 664,397 | 512,728 |
| End of Period1 | 738,209 | 664,397 |
| 1 Net Assets—End of Period includes undistributed (overdistributed) net investment income of $10,044,000 and $8,271,000. | ||
See accompanying Notes, which are an integral part of the Financial Statements.
17
Structured Large-Cap Equity Fund
Financial Highlights
| Institutional Shares | |||||
| For a Share Outstanding | Year Ended September 30, | ||||
| Throughout Each Period | 2014 | 2013 | 2012 | 2011 | 2010 |
| Net Asset Value, Beginning of Period | $32.42 | $27.83 | $21.49 | $20.97 | $19.47 |
| Investment Operations | |||||
| Net Investment Income | .710 | .618 | .531 | .4281 | .366 |
| Net Realized and Unrealized Gain (Loss) | |||||
| on Investments | 6.363 | 4.542 | 6.306 | .458 | 1.505 |
| Total from Investment Operations | 7.073 | 5.160 | 6.837 | .886 | 1.871 |
| Distributions | |||||
| Dividends from Net Investment Income | (.613) | (.570) | (.497) | (.366) | (.371) |
| Distributions from Realized Capital Gains | — | — | — | — | — |
| Total Distributions | (.613) | (.570) | (.497) | (.366) | (.371) |
| Net Asset Value, End of Period | $38.88 | $32.42 | $27.83 | $21.49 | $20.97 |
| Total Return | 22.08% | 18.93% | 32.32% | 4.14% | 9.68% |
| Ratios/Supplemental Data | |||||
| Net Assets, End of Period (Millions) | $58 | $52 | $15 | $12 | $95 |
| Ratio of Total Expenses to | |||||
| Average Net Assets | 0.24% | 0.24% | 0.24% | 0.24% | 0.24% |
| Ratio of Net Investment Income to | |||||
| Average Net Assets | 1.86% | 2.09% | 2.10% | 1.95% | 1.86% |
| Portfolio Turnover Rate | 68% | 62% | 64% | 67% | 61% |
| 1 Calculated based on average shares outstanding. | |||||
See accompanying Notes, which are an integral part of the Financial Statements.
18
Structured Large-Cap Equity Fund
Financial Highlights
| Institutional Plus Shares | |||||
| For a Share Outstanding | Year Ended September 30, | ||||
| Throughout Each Period | 2014 | 2013 | 2012 | 2011 | 2010 |
| Net Asset Value, Beginning of Period | $64.10 | $55.02 | $42.48 | $41.98 | $38.97 |
| Investment Operations | |||||
| Net Investment Income | 1.455 | 1.207 | 1.084 | .9101 | .768 |
| Net Realized and Unrealized Gain (Loss) | |||||
| on Investments | 12.586 | 9.037 | 12.466 | .906 | 3.014 |
| Total from Investment Operations | 14.041 | 10.244 | 13.550 | 1.816 | 3.782 |
| Distributions | |||||
| Dividends from Net Investment Income | (1.201) | (1.164) | (1.010) | (1.316) | (.772) |
| Distributions from Realized Capital Gains | — | — | — | — | — |
| Total Distributions | (1.201) | (1.164) | (1.010) | (1.316) | (.772) |
| Net Asset Value, End of Period | $76.94 | $64.10 | $55.02 | $42.48 | $41.98 |
| Total Return | 22.17% | 19.02% | 32.42% | 4.18% | 9.78% |
| Ratios/Supplemental Data | |||||
| Net Assets, End of Period (Millions) | $680 | $612 | $497 | $379 | $570 |
| Ratio of Total Expenses to | |||||
| Average Net Assets | 0.17% | 0.17% | 0.17% | 0.17% | 0.17% |
| Ratio of Net Investment Income to | |||||
| Average Net Assets | 1.93% | 2.16% | 2.17% | 2.02% | 1.93% |
| Portfolio Turnover Rate | 68% | 62% | 64% | 67% | 61% |
| 1 Calculated based on average shares outstanding. | |||||
See accompanying Notes, which are an integral part of the Financial Statements.
19
Structured Large-Cap Equity Fund
Notes to Financial Statements
Vanguard Structured Large-Cap Equity Fund is registered under the Investment Company Act of 1940 as an open-end investment company, or mutual fund. The fund offers two classes of shares: Institutional Shares and Institutional Plus Shares. Institutional Shares and Institutional Plus Shares are designed for investors who meet certain administrative, service, and account-size criteria.
A. The following significant accounting policies conform to generally accepted accounting principles for U.S. investment companies. The fund consistently follows such policies in preparing its financial statements.
1. Security Valuation: Securities are valued as of the close of trading on the New York Stock Exchange (generally 4 p.m., Eastern time) on the valuation date. Equity securities are valued at the latest quoted sales prices or official closing prices taken from the primary market in which each security trades; such securities not traded on the valuation date are valued at the mean of the latest quoted bid and asked prices. Securities for which market quotations are not readily available, or whose values have been materially affected by events occurring before the fund’s pricing time but after the close of the securities’ primary markets, are valued by methods deemed by the board of trustees to represent fair value. Investments in Vanguard Market Liquidity Fund are valued at that fund’s net asset value. Temporary cash investments acquired over 60 days to maturity are valued using the latest bid prices or using valuations based on a matrix system (which considers such factors as security prices, yields, maturities, and ratings), both as furnished by independent pricing services. Other temporary cash investments are valued at amortized cost, which approximates market value.
2. Futures Contracts: The fund uses index futures contracts to a limited extent, with the objective of maintaining full exposure to the stock market while maintaining liquidity. The fund may purchase or sell futures contracts to achieve a desired level of investment, whether to accommodate portfolio turnover or cash flows from capital share transactions. The primary risks associated with the use of futures contracts are imperfect correlation between changes in market values of stocks held by the fund and the prices of futures contracts, and the possibility of an illiquid market. Counterparty risk involving futures is mitigated because a regulated clearinghouse is the counterparty instead of the clearing broker. To further mitigate counterparty risk, the fund trades futures contracts on an exchange, monitors the financial strength of its clearing brokers and clearinghouse, and has entered into clearing agreements with its clearing brokers. The clearinghouse imposes initial margin requirements to secure the fund’s performance and requires daily settlement of variation margin representing changes in the market value of each contract.
Futures contracts are valued at their quoted daily settlement prices. The aggregate settlement values of the contracts are not recorded in the Statement of Net Assets. Fluctuations in the value of the contracts are recorded in the Statement of Net Assets as an asset (liability) and in the Statement of Operations as unrealized appreciation (depreciation) until the contracts are closed, when they are recorded as realized futures gains (losses).
During the year ended September 30, 2014, the fund’s average investments in long and short futures contracts represented less than 1% and 0% of net assets, respectively, based on the average of aggregate settlement values at each quarter-end during the period.
3. Federal Income Taxes: The fund intends to continue to qualify as a regulated investment company and distribute all of its taxable income. Management has analyzed the fund’s tax positions taken for all open federal income tax years (September 30, 2011–2014), and has concluded that no provision for federal income tax is required in the fund’s financial statements.
20
Structured Large-Cap Equity Fund
4. Distributions: Distributions to shareholders are recorded on the ex-dividend date.
5. Credit Facility: The fund and certain other funds managed by The Vanguard Group participate in a $2.89 billion committed credit facility provided by a syndicate of lenders pursuant to a credit agreement that may be renewed annually; each fund is individually liable for its borrowings, if any, under the credit facility. Borrowings may be utilized for temporary and emergency purposes, and are subject to the fund’s regulatory and contractual borrowing restrictions. The participating funds are charged administrative fees and an annual commitment fee of 0.06% of the undrawn amount of the facility; these fees are allocated to the funds based on a method approved by the fund’s board of trustees and included in Management and Administrative expenses on the fund’s Statement of Operations. Any borrowings under this facility bear interest at a rate equal to the higher of the federal funds rate or LIBOR reference rate plus an agreed-upon spread.
The fund had no borrowings outstanding at September 30, 2014, or at any time during the period then ended.
6. Other: Dividend income is recorded on the ex-dividend date. Interest income includes income distributions received from Vanguard Market Liquidity Fund and is accrued daily. Premiums and discounts on debt securities purchased are amortized and accreted, respectively, to interest income over the lives of the respective securities. Security transactions are accounted for on the date securities are bought or sold. Costs used to determine realized gains (losses) on the sale of investment securities are those of the specific securities sold.
Each class of shares has equal rights as to assets and earnings, except that each class separately bears certain class-specific expenses related to maintenance of shareholder accounts (included in Management and Administrative expenses) and shareholder reporting. Marketing and distribution expenses are allocated to each class of shares based on a method approved by the board of trustees. Income, other non-class-specific expenses, and gains and losses on investments are allocated to each class of shares based on its relative net assets.
B. The Vanguard Group furnishes at cost investment advisory, corporate management, administrative, marketing, and distribution services. The costs of such services are allocated to the fund based on methods approved by the board of trustees. The fund has committed to invest up to 0.40% of its net assets in Vanguard. At September 30, 2014, the fund had contributed capital of $74,000 to Vanguard (included in Other Assets), representing 0.01% of the fund’s net assets and 0.03% of Vanguard’s capitalization. The fund’s trustees and officers are also directors and officers of Vanguard.
C. Various inputs may be used to determine the value of the fund’s investments. These inputs are summarized in three broad levels for financial statement purposes. The inputs or methodologies used to value securities are not necessarily an indication of the risk associated with investing in those securities.
Level 1—Quoted prices in active markets for identical securities.
Level 2—Other significant observable inputs (including quoted prices for similar securities, interest rates, prepayment speeds, credit risk, etc.).
Level 3—Significant unobservable inputs (including the fund’s own assumptions used to determine the fair value of investments).
21
Structured Large-Cap Equity Fund
The following table summarizes the market value of the fund’s investments as of September 30, 2014, based on the inputs used to value them:
| Level 1 | Level 2 | Level 3 | |
| Investments | ($000) | ($000) | ($000) |
| Common Stocks | 736,814 | — | — |
| Temporary Cash Investments | 1,256 | 400 | — |
| Futures Contracts—Liabilities1 | (3) | — | — |
| Total | 738,067 | 400 | — |
| 1 Represents variation margin on the last day of the reporting period. | |||
D. At September 30, 2014, the aggregate settlement value of open futures contracts and the related unrealized appreciation (depreciation) were:
| ($000) | ||||
| Aggregate | ||||
| Number of | Settlement | Unrealized | ||
| Long (Short) | Value | Appreciation | ||
| Futures Contracts | Expiration | Contracts | Long (Short) | (Depreciation) |
| E-mini S&P 500 Index | December 2014 | 10 | 983 | (14) |
| S&P 500 Index | December 2014 | 1 | 491 | (3) |
| (17) |
Unrealized appreciation (depreciation) on open futures contracts is required to be treated as realized gain (loss) for tax purposes.
E. Distributions are determined on a tax basis and may differ from net investment income and realized capital gains for financial reporting purposes. Differences may be permanent or temporary. Permanent differences are reclassified among capital accounts in the financial statements to reflect their tax character. Temporary differences arise when certain items of income, expense, gain, or loss are recognized in different periods for financial statement and tax purposes. These differences will reverse at some time in the future. Differences in classification may also result from the treatment of short-term gains as ordinary income for tax purposes.
For tax purposes, at September 30, 2014, the fund had $10,554,000 of ordinary income available for distribution. The fund used capital loss carryforwards of $101,034,000 to offset taxable capital gains realized during the year ended September 30, 2014. At September 30, 2014, the fund had available capital losses totaling $19,976,000 to offset future net capital gains through September 30, 2018.
At September 30, 2014, the cost of investment securities for tax purposes was $578,750,000. Net unrealized appreciation of investment securities for tax purposes was $159,720,000, consisting of unrealized gains of $165,191,000 on securities that had risen in value since their purchase and $5,471,000 in unrealized losses on securities that had fallen in value since their purchase.
F. During the year ended September 30, 2014, the fund purchased $492,235,000 of investment securities and sold $548,027,000 of investment securities, other than temporary cash investments.
22
Structured Large-Cap Equity Fund
G. Capital share transactions for each class of shares were:
| Year Ended September 30, | ||||
| 2014 | 2013 | |||
| Amount | Shares | Amount | Shares | |
| ($000) | (000) | ($000) | (000) | |
| Institutional Shares | ||||
| Issued | 5,401 | 150 | 38,717 | 1,188 |
| Issued in Lieu of Cash Distributions | 696 | 20 | — | — |
| Redeemed | (10,163) | (283) | (3,840) | (129) |
| Net Increase (Decrease)—Institutional Shares | (4,066) | (113) | 34,877 | 1,059 |
| Institutional Plus Shares | ||||
| Issued | 533 | 8 | 27,997 | 444 |
| Issued in Lieu of Cash Distributions | 4,258 | 63 | 3,533 | 66 |
| Redeemed | (60,000) | (784) | — | — |
| Net Increase (Decrease)—Institutional Plus Shares | (55,209) | (713) | 31,530 | 510 |
At September 30, 2014, two shareholders were each a record or beneficial owner of 29% or more of the fund’s net assets, with a combined ownership of 92%. If one of these shareholders were to redeem its investment in the fund, the redemption might result in an increase in the fund’s expense ratio, cause the fund to incur higher transaction costs, or lead to the realization of taxable capital gains. See Note H.
H. Subsequent to the report date, notice was received that one shareholder intends to redeem approximately 30% of the fund’s net assets. Management has determined that no other material events or transactions occurred subsequent to September 30, 2014, that would require recognition or disclosure in these financial statements.
23
Structured Broad Market Fund
Fund Profile
As of September 30, 2014
| Share-Class Characteristics | ||
| Institutional | Institutional | |
| Shares | Plus Shares | |
| Ticker Symbol | VSBMX | VSBPX |
| Expense Ratio1 | 0.25% | 0.18% |
| 30-Day SEC Yield | 1.58% | 1.65% |
| Portfolio Characteristics | |||
| DJ | |||
| U.S. | |||
| Total | |||
| Russell | Market | ||
| 3000 | FA | ||
| Fund | Index | Index | |
| Number of Stocks | 200 | 2,983 | 3,768 |
| Median Market Cap | $40.5B | $51.2B | $51.1B |
| Price/Earnings Ratio | 16.8x | 20.5x | 20.5x |
| Price/Book Ratio | 2.7x | 2.6x | 2.6x |
| Return on Equity | 18.1% | 18.0% | 17.8% |
| Earnings Growth | |||
| Rate | 18.4% | 15.2% | 15.2% |
| Dividend Yield | 1.8% | 1.9% | 1.9% |
| Foreign Holdings | 0.0% | 0.0% | 0.0% |
| Turnover Rate | 60% | — | — |
| Short-Term Reserves | 0.2% | — | — |
| Sector Diversification (% of equity exposure) | |||
| DJ | |||
| Russell | U.S. Total | ||
| 3000 | Market | ||
| Fund | Index | FA Index | |
| Consumer | |||
| Discretionary | 12.2% | 12.4% | 12.5% |
| Consumer Staples | 8.3 | 8.3 | 8.3 |
| Energy | 8.6 | 8.9 | 9.1 |
| Financials | 17.7 | 17.4 | 17.4 |
| Health Care | 14.2 | 13.6 | 13.5 |
| Industrials | 11.1 | 11.3 | 11.2 |
| Information | |||
| Technology | 18.0 | 19.0 | 19.0 |
| Materials | 4.3 | 3.9 | 3.8 |
| Telecommunication | |||
| Services | 2.8 | 2.2 | 2.2 |
| Utilities | 2.8 | 3.0 | 3.0 |
| Volatility Measures | ||
| DJ | ||
| Russell | U.S. Total | |
| 3000 | Market | |
| Index | FA Index | |
| R-Squared | 0.99 | 0.99 |
| Beta | 1.07 | 1.07 |
| These measures show the degree and timing of the fund’s fluctuations compared with the indexes over 36 months. | ||
| Ten Largest Holdings (% of total net assets) | ||
| Apple Inc. | Computer Hardware | 2.6% |
| Johnson & Johnson | Pharmaceuticals | 2.0 |
| Wells Fargo & Co. | Diversified Banks | 1.7 |
| Exxon Mobil Corp. | Integrated Oil & Gas | 1.5 |
| Verizon Communications | Integrated | |
| Inc. | Telecommunication | |
| Services | 1.5 | |
| Gilead Sciences Inc. | Biotechnology | 1.3 |
| Pfizer Inc. | Pharmaceuticals | 1.3 |
| Facebook Inc. | Internet Software & | |
| Services | 1.3 | |
| Microsoft Corp. | Systems Software | 1.3 |
| AT&T Inc. | Integrated | |
| Telecommunication | ||
| Services | 1.2 | |
| Top Ten | 15.7% | |
| The holdings listed exclude any temporary cash investments and equity index products. | ||
Investment Focus
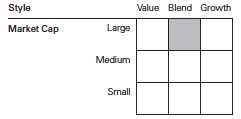
1 The expense ratios shown are from the prospectus dated January 27, 2014. For the fiscal year ended September 30, 2014, the expense ratios were 0.24% for Institutional Shares and 0.17% for Institutional Plus Shares.
24
Structured Broad Market Fund
Performance Summary
All of the returns in this report represent past performance, which is not a guarantee of future results that may be achieved by the fund. (Current performance may be lower or higher than the performance data cited. For performance data current to the most recent month-end, visit our website at vanguard.com/performance.) Note, too, that both investment returns and principal value can fluctuate widely, so an investor’s shares, when sold, could be worth more or less than their original cost. The returns shown do not reflect taxes that a shareholder would pay on fund distributions or on the sale of fund shares.
Cumulative Performance: November 30, 2006, Through September 30, 2014
Initial Investment of $5,000,000
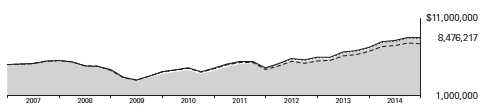
| Average Annual Total Returns | |||||
| Periods Ended September 30, 2014 | |||||
| Since | Final Value | ||||
| One | Five | Inception | of a $5,000,000 | ||
| Year | Years | (11/30/2006) | Investment | ||
| Structured Broad Market | |||||
| Fund*Institutional Shares | 21.10% | 17.52% | 6.97% | $8,476,217 | |
| •••••••• | Russell 3000 Index | 17.76 | 15.78 | 6.86 | 8,408,194 |
| – – – – | Multi-Cap Core Funds Average | 14.62 | 13.58 | 5.64 | 7,684,190 |
| Dow Jones U.S. Total Stock Market | |||||
| Float Adjusted Index | 17.69 | 15.84 | 7.01 | 8,500,709 | |
| Multi-Cap Core Funds Average: Derived from data provided by Lipper, a Thomson Reuters Company. "Since Inception" performance is calculated from the Institutional Shares’ inception date for both the fund and its comparative standards. | |||||
| Final Value | ||||
| One | Five | Ten | of a $200,000,000 | |
| Year | Years | Years | Investment | |
| Structured Broad Market Fund Institutional | ||||
| Plus Shares | 21.16% | 17.60% | 8.76% | $463,292,806 |
| Russell 3000 Index | 17.76 | 15.78 | 8.44 | 404,278,703 |
| Dow Jones U.S. Total Stock Market Float | ||||
| Adjusted Index | 17.69 | 15.84 | 8.59 | 456,095,085 |
| The fund commenced operations as a registered investment company on October 3, 2006. The fund's performance includes the performance of a predecessor trust, Vanguard Fiduciary Trust Company Structured Broad Market Trust, from September 30, 2004, to October 3, 2006. | ||||
See Financial Highlights for dividend and capital gains information.
25
Structured Broad Market Fund
Fiscal-Year Total Returns (%): November 30, 2006, Through September 30, 2014
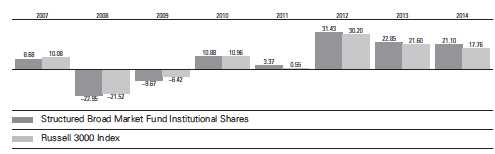
Structured Broad Market Fund
Financial Statements
Statement of Net Assets
As of September 30, 2014
The fund reports a complete list of its holdings in regulatory filings four times in each fiscal year, at the quarter-ends. For the second and fourth fiscal quarters, the lists appear in the fund’s semiannual and annual reports to shareholders. For the first and third fiscal quarters, the fund files the lists with the Securities and Exchange Commission on Form N-Q. Shareholders can look up the fund’s Forms N-Q on the SEC’s website at sec.gov. Forms N-Q may also be reviewed and copied at the SEC’s Public Reference Room (see the back cover of this report for further information).
| Market | |||
| Value | |||
| Shares | ($000) | ||
| Common Stocks (99.5%)1 | |||
| Consumer Discretionary (12.2%) | |||
| Walt Disney Co. | 70,200 | 6,250 | |
| Home Depot Inc. | 67,900 | 6,229 | |
| Comcast Corp. Class A | 91,891 | 4,942 | |
| Lowe’s Cos. Inc. | 82,200 | 4,350 | |
| NIKE Inc. Class B | 40,600 | 3,621 | |
| Marriott International Inc. | |||
| Class A | 49,300 | 3,446 | |
| Macy’s Inc. | 58,900 | 3,427 | |
| Best Buy Co. Inc. | 99,800 | 3,352 | |
| * | O’Reilly Automotive Inc. | 21,900 | 3,293 |
| * | Murphy USA Inc. | 56,800 | 3,014 |
| * | Strayer Education Inc. | 48,900 | 2,928 |
| Cablevision Systems Corp. | |||
| Class A | 163,200 | 2,858 | |
| * | Visteon Corp. | 28,000 | 2,723 |
| Hanesbrands Inc. | 22,700 | 2,439 | |
| Las Vegas Sands Corp. | 38,500 | 2,395 | |
| * | Tower International Inc. | 82,300 | 2,073 |
| Royal Caribbean | |||
| Cruises Ltd. | 27,100 | 1,824 | |
| TJX Cos. Inc. | 29,000 | 1,716 | |
| * | Skechers U.S.A. Inc. | ||
| Class A | 32,000 | 1,706 | |
| * | DIRECTV | 11,500 | 995 |
| Time Warner Cable Inc. | 6,800 | 976 | |
| * | Buffalo Wild Wings Inc. | 4,700 | 631 |
| * | Amazon.com Inc. | 800 | 258 |
| Gap Inc. | 6,100 | 254 | |
| Twenty-First Century | |||
| Fox Inc. Class A | 6,800 | 233 | |
| 65,933 | |||
| Consumer Staples (8.2%) | |||
| CVS Health Corp. | 65,000 | 5,173 | |
| PepsiCo Inc. | 43,600 | 4,059 | |
| Archer-Daniels-Midland Co. | 77,000 | 3,935 | |
| Kimberly-Clark Corp. | 35,500 | 3,819 | |
| Kroger Co. | 72,700 | 3,780 | |
| Market | |||
| Value | |||
| Shares | ($000) | ||
| Dr Pepper Snapple | |||
| Group Inc. | 54,300 | 3,492 | |
| Tyson Foods Inc. Class A | 81,900 | 3,224 | |
| * | Pilgrim’s Pride Corp. | 101,350 | 3,097 |
| Procter & Gamble Co. | 35,651 | 2,986 | |
| Sanderson Farms Inc. | 30,800 | 2,709 | |
| Altria Group Inc. | 51,800 | 2,380 | |
| Bunge Ltd. | 24,200 | 2,038 | |
| Coca-Cola Co. | 31,780 | 1,356 | |
| ^ | Herbalife Ltd. | 19,300 | 844 |
| Wal-Mart Stores Inc. | 8,465 | 647 | |
| Philip Morris | |||
| International Inc. | 6,650 | 555 | |
| Molson Coors Brewing Co. | |||
| Class B | 6,900 | 514 | |
| 44,608 | |||
| Energy (8.6%) | |||
| Exxon Mobil Corp. | 89,320 | 8,401 | |
| ConocoPhillips | 68,240 | 5,222 | |
| EOG Resources Inc. | 42,400 | 4,198 | |
| Hess Corp. | 38,000 | 3,584 | |
| Devon Energy Corp. | 51,600 | 3,518 | |
| Chevron Corp. | 26,565 | 3,170 | |
| Chesapeake Energy Corp. | 120,000 | 2,759 | |
| * | Kosmos Energy Ltd. | 270,800 | 2,697 |
| Green Plains Inc. | 70,800 | 2,647 | |
| Occidental Petroleum Corp. | 20,200 | 1,942 | |
| * | REX American | ||
| Resources Corp. | 26,100 | 1,902 | |
| SM Energy Co. | 21,200 | 1,654 | |
| Nabors Industries Ltd. | 54,000 | 1,229 | |
| Phillips 66 | 13,870 | 1,128 | |
| Cimarex Energy Co. | 7,600 | 962 | |
| Schlumberger Ltd. | 8,310 | 845 | |
| Valero Energy Corp. | 11,700 | 541 | |
| 46,399 | |||
| Financials (17.6%) | |||
| Wells Fargo & Co. | 178,370 | 9,252 | |
| Goldman Sachs Group Inc. | 27,200 | 4,993 | |
27
Structured Broad Market Fund
| Market | |||
| Value | |||
| Shares | ($000) | ||
| American Express Co. | 54,100 | 4,736 | |
| Capital One Financial Corp. | 50,700 | 4,138 | |
| PNC Financial Services | |||
| Group Inc. | 46,600 | 3,988 | |
| Travelers Cos. Inc. | 38,500 | 3,617 | |
| Ameriprise Financial Inc. | 28,700 | 3,541 | |
| Allstate Corp. | 56,800 | 3,486 | |
| * | Berkshire Hathaway Inc. | ||
| Class B | 23,500 | 3,246 | |
| Everest Re Group Ltd. | 19,700 | 3,192 | |
| JPMorgan Chase & Co. | 50,136 | 3,020 | |
| KeyCorp | 225,300 | 3,003 | |
| Voya Financial Inc. | 76,600 | 2,995 | |
| Fifth Third Bancorp | 147,700 | 2,957 | |
| Discover Financial | |||
| Services | 45,400 | 2,923 | |
| PartnerRe Ltd. | 25,300 | 2,780 | |
| Lincoln National Corp. | 49,900 | 2,674 | |
| RenaissanceRe | |||
| Holdings Ltd. | 24,900 | 2,490 | |
| Simon Property Group Inc. | 14,700 | 2,417 | |
| Regions Financial Corp. | 229,400 | 2,303 | |
| US Bancorp | 40,250 | 1,684 | |
| Bank of America Corp. | 91,200 | 1,555 | |
| Host Hotels & Resorts Inc. | 71,400 | 1,523 | |
| General Growth | |||
| Properties Inc. | 62,100 | 1,462 | |
| * | Howard Hughes Corp. | 8,800 | 1,320 |
| RLJ Lodging Trust | 46,000 | 1,310 | |
| ^ | Ryman Hospitality | ||
| Properties Inc. | 25,300 | 1,197 | |
| Omega Healthcare | |||
| Investors Inc. | 34,900 | 1,193 | |
| Ventas Inc. | 19,000 | 1,177 | |
| Columbia Property Trust Inc. | 48,200 | 1,150 | |
| Citigroup Inc. | 21,900 | 1,135 | |
| Hospitality Properties Trust | 41,100 | 1,104 | |
| Geo Group Inc. | 28,500 | 1,089 | |
| Weingarten Realty | |||
| Investors | 31,500 | 992 | |
| Retail Properties | |||
| of America Inc. | 66,900 | 979 | |
| * | World Acceptance Corp. | 11,256 | 760 |
| Kimco Realty Corp. | 26,500 | 581 | |
| Montpelier Re Holdings Ltd. | 17,100 | 532 | |
| DuPont Fabros | |||
| Technology Inc. | 18,800 | 508 | |
| Assurant Inc. | 6,100 | 392 | |
| * | Opus Bank | 11,700 | 358 |
| Lazard Ltd. Class A | 6,600 | 335 | |
| Brandywine Realty Trust | 21,600 | 304 | |
| * | Piper Jaffray Cos. | 5,000 | 261 |
| MidSouth Bancorp Inc. | 12,900 | 241 | |
| International | |||
| Bancshares Corp. | 8,000 | 197 |
| Market | |||
| Value | |||
| Shares | ($000) | ||
| Reinsurance Group | |||
| of America Inc. Class A | 1,300 | 104 | |
| Astoria Financial Corp. | 8,400 | 104 | |
| 95,298 | |||
| Health Care (14.1%) | |||
| Johnson & Johnson | 99,907 | 10,649 | |
| * | Gilead Sciences Inc. | 66,900 | 7,122 |
| Pfizer Inc. | 238,258 | 7,045 | |
| AbbVie Inc. | 93,600 | 5,406 | |
| * | Celgene Corp. | 53,100 | 5,033 |
| Eli Lilly & Co. | 71,920 | 4,664 | |
| Merck & Co. Inc. | 74,183 | 4,398 | |
| * | Express Scripts Holding Co. | 55,900 | 3,948 |
| WellPoint Inc. | 32,000 | 3,828 | |
| Cardinal Health Inc. | 49,400 | 3,701 | |
| Cigna Corp. | 39,000 | 3,537 | |
| * | Edwards Lifesciences Corp. | 32,300 | 3,299 |
| CR Bard Inc. | 21,200 | 3,025 | |
| * | Charles River Laboratories | ||
| International Inc. | 42,600 | 2,545 | |
| * | Covance Inc. | 26,200 | 2,062 |
| Omnicare Inc. | 25,500 | 1,588 | |
| Abbott Laboratories | 38,000 | 1,580 | |
| McKesson Corp. | 7,600 | 1,479 | |
| * | Boston Scientific Corp. | 81,100 | 958 |
| * | Quintiles Transnational | ||
| Holdings Inc. | 10,500 | 586 | |
| * | Alliance HealthCare | ||
| Services Inc. | 12,600 | 285 | |
| 76,738 | |||
| Industrials (11.1%) | |||
| General Electric Co. | 251,380 | 6,440 | |
| Boeing Co. | 39,950 | 5,089 | |
| Union Pacific Corp. | 43,800 | 4,749 | |
| Lockheed Martin Corp. | 24,300 | 4,441 | |
| General Dynamics Corp. | 31,700 | 4,029 | |
| Northrop Grumman Corp. | 29,630 | 3,904 | |
| Southwest Airlines Co. | 110,800 | 3,742 | |
| Illinois Tool Works Inc. | 39,700 | 3,351 | |
| * | United Rentals Inc. | 28,800 | 3,200 |
| Trinity Industries Inc. | 68,100 | 3,182 | |
| * | Spirit AeroSystems | ||
| Holdings Inc. Class A | 82,400 | 3,136 | |
| Greenbrier Cos. Inc. | 42,700 | 3,133 | |
| Pitney Bowes Inc. | 115,300 | 2,881 | |
| Alaska Air Group Inc. | 64,600 | 2,813 | |
| Huntington Ingalls | |||
| Industries Inc. | 26,100 | 2,720 | |
| Caterpillar Inc. | 22,900 | 2,268 | |
| L-3 Communications | |||
| Holdings Inc. | 5,500 | 654 | |
| Kimball International Inc. | |||
| Class B | 19,700 | 296 | |
| 60,028 | |||
28
Structured Broad Market Fund
| Market | |||
| Value | |||
| Shares | ($000) | ||
| Information Technology (17.9%) | |||
| Apple Inc. | 138,740 | 13,978 | |
| * | Facebook Inc. Class A | 88,300 | 6,979 |
| Microsoft Corp. | 147,397 | 6,833 | |
| International Business | |||
| Machines Corp. | 34,042 | 6,462 | |
| Hewlett-Packard Co. | 130,700 | 4,636 | |
| Texas Instruments Inc. | 83,100 | 3,963 | |
| MasterCard Inc. Class A | 53,000 | 3,918 | |
| Western Digital Corp. | 36,100 | 3,513 | |
| * | Electronic Arts Inc. | 89,700 | 3,194 |
| Computer Sciences Corp. | 50,800 | 3,106 | |
| * | Take-Two Interactive | ||
| Software Inc. | 134,400 | 3,101 | |
| Booz Allen Hamilton | |||
| Holding Corp. Class A | 119,400 | 2,794 | |
| * | ARRIS Group Inc. | 96,900 | 2,748 |
| * | Google Inc. Class C | 4,680 | 2,702 |
| * | Aspen Technology Inc. | 71,400 | 2,693 |
| * | Google Inc. Class A | 4,480 | 2,636 |
| * | Advanced Micro | ||
| Devices Inc. | 730,200 | 2,490 | |
| Heartland Payment | |||
| Systems Inc. | 50,900 | 2,429 | |
| Anixter International Inc. | 27,400 | 2,325 | |
| * | Manhattan Associates Inc. | 66,400 | 2,219 |
| * | Freescale | ||
| Semiconductor Ltd. | 110,900 | 2,166 | |
| CDW Corp. | 66,600 | 2,068 | |
| *,^ | Glu Mobile Inc. | 359,400 | 1,858 |
| Intuit Inc. | 15,000 | 1,315 | |
| Harris Corp. | 19,000 | 1,262 | |
| Intel Corp. | 35,990 | 1,253 | |
| Broadridge Financial | |||
| Solutions Inc. | 24,500 | 1,020 | |
| Oracle Corp. | 15,448 | 591 | |
| * | Alliance Data Systems Corp. | 2,300 | 571 |
| QUALCOMM Inc. | 7,300 | 546 | |
| Marvell Technology | |||
| Group Ltd. | 35,000 | 472 | |
| Lexmark International Inc. | |||
| Class A | 10,200 | 433 | |
| Cisco Systems Inc. | 15,450 | 389 | |
| * | Gartner Inc. | 3,100 | 228 |
| DST Systems Inc. | 2,590 | 217 | |
| Skyworks Solutions Inc. | 3,200 | 186 | |
| 97,294 | |||
| Materials (4.3%) | |||
| LyondellBasell Industries | |||
| NV Class A | 37,500 | 4,075 | |
| PPG Industries Inc. | 18,550 | 3,650 | |
| CF Industries Holdings Inc. | 12,400 | 3,462 | |
| Ball Corp. | 48,800 | 3,088 | |
| * | Stillwater Mining Co. | 149,200 | 2,242 |
| Sherwin-Williams Co. | 9,900 | 2,168 | |
| Market | |||
| Value | |||
| Shares | ($000) | ||
| Westlake Chemical Corp. | 17,600 | 1,524 | |
| Avery Dennison Corp. | 29,100 | 1,299 | |
| NewMarket Corp. | 2,800 | 1,067 | |
| Dow Chemical Co. | 15,600 | 818 | |
| 23,393 | |||
| Telecommunication Services (2.8%) | |||
| Verizon | |||
| Communications Inc. | 165,557 | 8,276 | |
| AT&T Inc. | 190,629 | 6,718 | |
| 14,994 | |||
| Utilities (2.7%) | |||
| Exelon Corp. | 106,700 | 3,637 | |
| Edison International | 61,300 | 3,428 | |
| American Electric | |||
| Power Co. Inc. | 65,500 | 3,420 | |
| Entergy Corp. | 42,300 | 3,271 | |
| Avista Corp. | 26,300 | 803 | |
| AGL Resources Inc. | 6,600 | 339 | |
| 14,898 | |||
| Total Common Stocks | |||
| (Cost $412,163) | 539,583 | ||
| Temporary Cash Investments (0.7%)1 | |||
| Money Market Fund (0.6%) | |||
| 2,3 | Vanguard Market | ||
| Liquidity Fund, 0.109% | 3,348,734 | 3,349 | |
| Face | |||
| Amount | |||
| ($000) | |||
| U.S. Government and Agency Obligations (0.1%) | |||
| 4,5 | Fannie Mae Discount Notes, | ||
| 0.075%, 10/15/14 | 100 | 100 | |
| 5,6 | Federal Home Loan Bank | ||
| Discount Notes, 0.074%, | |||
| 12/5/14 | 100 | 100 | |
| 200 | |||
| Total Temporary Cash Investments | |||
| (Cost $3,549) | 3,549 | ||
| Total Investments (100.2%) | |||
| (Cost $415,712) | 543,132 | ||
| Other Assets and Liabilities (-0.2%) | |||
| Other Assets | 1,062 | ||
| Liabilities3 | (2,007) | ||
| (945) | |||
| Net Assets (100%) | 542,187 | ||
29
Structured Broad Market Fund
| At September 30, 2014, net assets consisted of: | |
| Amount | |
| ($000) | |
| Paid-in Capital | 349,532 |
| Undistributed Net Investment Income | 6,740 |
| Accumulated Net Realized Gains | 58,512 |
| Unrealized Appreciation (Depreciation) | |
| Investment Securities | 127,420 |
| Futures Contracts | (17) |
| Net Assets | 542,187 |
| Institutional Shares—Net Assets | |
| Applicable to 689,138 outstanding | |
| $.001 par value shares of beneficial | |
| interest (unlimited authorization) | 25,692 |
| Net Asset Value Per Share— | |
| Institutional Shares | $37.28 |
| Institutional Plus Shares—Net Assets | |
| Applicable to 6,930,503 outstanding | |
| $.001 par value shares of beneficial | |
| interest (unlimited authorization) | 516,495 |
| Net Asset Value Per Share— | |
| Institutional Plus Shares | $74.52 |
See Note A in Notes to Financial Statements.
* Non-income-producing security.
^ Includes partial security positions on loan to broker-dealers. The total value of securities on loan is $809,000.
1 The fund invests a portion of its cash reserves in equity markets through the use of index futures contracts. After giving effect to futures investments, the fund’s effective common stock and temporary cash investment positions represent 100.0% and 0.2%, respectively, of net assets.
2 Affiliated money market fund available only to Vanguard funds and certain trusts and accounts managed by Vanguard. Rate shown is the 7-day yield.
3 Includes $902,000 of collateral received for securities on loan.
4 The issuer was placed under federal conservatorship in September 2008; since that time, its daily operations have been managed by the Federal Housing Finance Agency and it receives capital from the U.S. Treasury, as needed to maintain a positive net worth, in exchange for senior preferred stock.
5 Securities with a value of $200,000 have been segregated as initial margin for open futures contracts.
6 The issuer operates under a congressional charter; its securities are generally neither guaranteed by the U.S. Treasury nor backed by the full faith and credit of the U.S. government.
See accompanying Notes, which are an integral part of the Financial Statements.
30
Structured Broad Market Fund
Statement of Operations
| Year Ended | |
| September 30, 2014 | |
| ($000) | |
| Investment Income | |
| Income | |
| Dividends | 10,308 |
| Interest1 | 4 |
| Securities Lending | 6 |
| Total Income | 10,318 |
| Expenses | |
| The Vanguard Group—Note B | |
| Investment Advisory Services | 543 |
| Management and Administrative—Institutional Shares | 28 |
| Management and Administrative—Institutional Plus Shares | 252 |
| Marketing and Distribution—Institutional Shares | 2 |
| Marketing and Distribution—Institutional Plus Shares | 67 |
| Custodian Fees | 9 |
| Auditing Fees | 32 |
| Total Expenses | 933 |
| Net Investment Income | 9,385 |
| Realized Net Gain (Loss) | |
| Investment Securities Sold | 63,106 |
| Futures Contracts | 485 |
| Realized Net Gain (Loss) | 63,591 |
| Change in Unrealized Appreciation (Depreciation) | |
| Investment Securities | 28,703 |
| Futures Contracts | 9 |
| Change in Unrealized Appreciation (Depreciation) | 28,712 |
| Net Increase (Decrease) in Net Assets Resulting from Operations | 101,688 |
| 1 Interest income from an affiliated company of the fund was $3,000. | |
See accompanying Notes, which are an integral part of the Financial Statements.
31
Structured Broad Market Fund
Statement of Changes in Net Assets
| Year Ended September 30, | ||
| 2014 | 2013 | |
| ($000) | ($000) | |
| Increase (Decrease) in Net Assets | ||
| Operations | ||
| Net Investment Income | 9,385 | 8,642 |
| Realized Net Gain (Loss) | 63,591 | 52,044 |
| Change in Unrealized Appreciation (Depreciation) | 28,712 | 28,374 |
| Net Increase (Decrease) in Net Assets Resulting from Operations | 101,688 | 89,060 |
| Distributions | ||
| Net Investment Income | ||
| Institutional Shares | (270) | (156) |
| Institutional Plus Shares | (8,224) | (8,303) |
| Realized Capital Gain1 | ||
| Institutional Shares | (657) | — |
| Institutional Plus Shares | (19,311) | — |
| Total Distributions | (28,462) | (8,459) |
| Capital Share Transactions | ||
| Institutional Shares | 7,179 | 5,441 |
| Institutional Plus Shares | (18,827) | 7,941 |
| Net Increase (Decrease) from Capital Share Transactions | (11,648) | 13,382 |
| Total Increase (Decrease) | 61,578 | 93,983 |
| Net Assets | ||
| Beginning of Period | 480,609 | 386,626 |
| End of Period2 | 542,187 | 480,609 |
| 1 Includes fiscal 2014 short-term gain distributions totaling $1,585,000. Short-term gain distributions are treated as ordinary income dividends for tax purposes. 2 Net Assets—End of Period includes undistributed (overdistributed) net investment income of $6,740,000 and $5,849,000. | ||
See accompanying Notes, which are an integral part of the Financial Statements.
32
Structured Broad Market Fund
Financial Highlights
| Institutional Shares | |||||
| For a Share Outstanding | Year Ended September 30, | ||||
| Throughout Each Period | 2014 | 2013 | 2012 | 2011 | 2010 |
| Net Asset Value, Beginning of Period | $32.59 | $27.10 | $21.03 | $20.70 | $18.99 |
| Investment Operations | |||||
| Net Investment Income | .632 | .573 | .544 | .3851 | .376 |
| Net Realized and Unrealized Gain (Loss) | |||||
| on Investments | 5.996 | 5.492 | 5.973 | .338 | 1.672 |
| Total from Investment Operations | 6.628 | 6.065 | 6.517 | .723 | 2.048 |
| Distributions | |||||
| Dividends from Net Investment Income | (.564) | (.575) | (.447) | (.393) | (.338) |
| Distributions from Realized Capital Gains | (1.374) | — | — | — | — |
| Total Distributions | (1.938) | (.575) | (.447) | (.393) | (.338) |
| Net Asset Value, End of Period | $37.28 | $32.59 | $27.10 | $21.03 | $20.70 |
| Total Return | 21.10% | 22.85% | 31.43% | 3.37% | 10.88% |
| Ratios/Supplemental Data | |||||
| Net Assets, End of Period (Millions) | $26 | $16 | $7 | $6 | $5 |
| Ratio of Total Expenses to | |||||
| Average Net Assets | 0.24% | 0.24% | 0.24% | 0.24% | 0.24% |
| Ratio of Net Investment Income to | |||||
| Average Net Assets | 1.67% | 1.94% | 2.19% | 1.64% | 1.91% |
| Portfolio Turnover Rate | 60% | 63% | 58% | 56% | 52% |
| 1 Calculated based on average shares outstanding. | |||||
See accompanying Notes, which are an integral part of the Financial Statements.
33
Structured Broad Market Fund
Financial Highlights
| Institutional Plus Shares | |||||
| For a Share Outstanding | Year Ended September 30, | ||||
| Throughout Each Period | 2014 | 2013 | 2012 | 2011 | 2010 |
| Net Asset Value, Beginning of Period | $65.15 | $54.17 | $42.02 | $41.36 | $37.94 |
| Investment Operations | |||||
| Net Investment Income | 1.303 | 1.186 | 1.122 | .7961 | .778 |
| Net Realized and Unrealized Gain (Loss) | |||||
| on Investments | 11.981 | 10.980 | 11.951 | .672 | 3.343 |
| Total from Investment Operations | 13.284 | 12.166 | 13.073 | 1.468 | 4.121 |
| Distributions | |||||
| Dividends from Net Investment Income | (1.169) | (1.186) | (.923) | (.808) | (.701) |
| Distributions from Realized Capital Gains | (2.745) | — | — | — | — |
| Total Distributions | (3.914) | (1.186) | (.923) | (.808) | (.701) |
| Net Asset Value, End of Period | $74.52 | $65.15 | $54.17 | $42.02 | $41.36 |
| Total Return | 21.16% | 22.95% | 31.56% | 3.43% | 10.96% |
| Ratios/Supplemental Data | |||||
| Net Assets, End of Period (Millions) | $516 | $465 | $379 | $290 | $304 |
| Ratio of Total Expenses to | |||||
| Average Net Assets | 0.17% | 0.17% | 0.17% | 0.17% | 0.17% |
| Ratio of Net Investment Income to | |||||
| Average Net Assets | 1.74% | 2.01% | 2.26% | 1.71% | 1.98% |
| Portfolio Turnover Rate | 60% | 63% | 58% | 56% | 52% |
| 1 Calculated based on average shares outstanding. | |||||
See accompanying Notes, which are an integral part of the Financial Statements.
34
Structured Broad Market Fund
Notes to Financial Statements
Vanguard Structured Broad Market Fund is registered under the Investment Company Act of 1940 as an open-end investment company, or mutual fund. The fund offers two classes of shares: Institutional Shares and Institutional Plus Shares. Institutional Shares and Institutional Plus Shares are designed for investors who meet certain administrative, service, and account-size criteria.
A. The following significant accounting policies conform to generally accepted accounting principles for U.S. investment companies. The fund consistently follows such policies in preparing its financial statements.
1. Security Valuation: Securities are valued as of the close of trading on the New York Stock Exchange (generally 4 p.m., Eastern time) on the valuation date. Equity securities are valued at the latest quoted sales prices or official closing prices taken from the primary market in which each security trades; such securities not traded on the valuation date are valued at the mean of the latest quoted bid and asked prices. Securities for which market quotations are not readily available, or whose values have been materially affected by events occurring before the fund’s pricing time but after the close of the securities’ primary markets, are valued by methods deemed by the board of trustees to represent fair value. Investments in Vanguard Market Liquidity Fund are valued at that fund’s net asset value. Temporary cash investments acquired over 60 days to maturity are valued using the latest bid prices or using valuations based on a matrix system (which considers such factors as security prices, yields, maturities, and ratings), both as furnished by independent pricing services. Other temporary cash investments are valued at amortized cost, which approximates market value.
2. Futures Contracts: The fund uses index futures contracts to a limited extent, with the objective of maintaining full exposure to the stock market while maintaining liquidity. The fund may purchase or sell futures contracts to achieve a desired level of investment, whether to accommodate portfolio turnover or cash flows from capital share transactions. The primary risks associated with the use of futures contracts are imperfect correlation between changes in market values of stocks held by the fund and the prices of futures contracts, and the possibility of an illiquid market. Counterparty risk involving futures is mitigated because a regulated clearinghouse is the counterparty instead of the clearing broker. To further mitigate counterparty risk, the fund trades futures contracts on an exchange, monitors the financial strength of its clearing brokers and clearinghouse, and has entered into clearing agreements with its clearing brokers. The clearinghouse imposes initial margin requirements to secure the fund’s performance and requires daily settlement of variation margin representing changes in the market value of each contract.
Futures contracts are valued at their quoted daily settlement prices. The aggregate settlement values of the contracts are not recorded in the Statement of Net Assets. Fluctuations in the value of the contracts are recorded in the Statement of Net Assets as an asset (liability) and in the Statement of Operations as unrealized appreciation (depreciation) until the contracts are closed, when they are recorded as realized futures gains (losses).
During the year ended September 30, 2014, the fund’s average investments in long and short futures contracts represented less than 1% and 0% of net assets, respectively, based on the average of aggregate settlement values at each quarter-end during the period
3. Federal Income Taxes: The fund intends to continue to qualify as a regulated investment company and distribute all of its taxable income. Management has analyzed the fund’s tax positions taken for all open federal income tax years (September 30, 2011–2014), and has concluded that no provision for federal income tax is required in the fund’s financial statements.
35
Structured Broad Market Fund
4. Distributions: Distributions to shareholders are recorded on the ex-dividend date.
5. Securities Lending: To earn additional income, the fund lends its securities to qualified institutional borrowers. Security loans are required to be secured at all times by collateral in an amount at least equal to the market value of securities loaned. Daily market fluctuations could cause the value of loaned securities to be more or less than the value of the collateral received. When this occurs, the collateral is adjusted and settled on the next business day. The fund further mitigates its counterparty risk by entering into securities lending transactions only with a diverse group of prequalified counter-parties, monitoring their financial strength, and entering into master securities lending agreements with its counterparties. The master securities lending agreements provide that, in the event of a counterparty’s default (including bankruptcy), the fund may terminate any loans with that borrower, determine the net amount owed, and sell or retain the collateral up to the net amount owed to the fund; however, such actions may be subject to legal proceedings. While collateral mitigates counter-party risk, in the absence of a default the fund may experience delays and costs in recovering the securities loaned. The fund invests cash collateral received in Vanguard Market Liquidity Fund, and records a liability in the Statement of Net Assets for the return of the collateral, during the period the securities are on loan. Securities lending income represents fees charged to borrowers plus income earned on invested cash collateral, less expenses associated with the loan.
6. Credit Facility: The fund and certain other funds managed by The Vanguard Group participate in a $2.89 billion committed credit facility provided by a syndicate of lenders pursuant to a credit agreement that may be renewed annually; each fund is individually liable for its borrowings, if any, under the credit facility. Borrowings may be utilized for temporary and emergency purposes, and are subject to the fund’s regulatory and contractual borrowing restrictions. The participating funds are charged administrative fees and an annual commitment fee of 0.06% of the undrawn amount of the facility; these fees are allocated to the funds based on a method approved by the fund’s board of trustees and included in Management and Administrative expenses on the fund’s Statement of Operations. Any borrowings under this facility bear interest at a rate equal to the higher of the federal funds rate or LIBOR reference rate plus an agreed-upon spread.
The fund had no borrowings outstanding at September 30, 2014, or at any time during the period then ended.
7. Other: Dividend income is recorded on the ex-dividend date. Interest income includes income distributions received from Vanguard Market Liquidity Fund and is accrued daily. Premiums and discounts on debt securities purchased are amortized and accreted, respectively, to interest income over the lives of the respective securities. Security transactions are accounted for on the date securities are bought or sold. Costs used to determine realized gains (losses) on the sale of investment securities are those of the specific securities sold.
Each class of shares has equal rights as to assets and earnings, except that each class separately bears certain class-specific expenses related to maintenance of shareholder accounts (included in Management and Administrative expenses) and shareholder reporting. Marketing and distribution expenses are allocated to each class of shares based on a method approved by the board of trustees. Income, other non-class-specific expenses, and gains and losses on investments are allocated to each class of shares based on its relative net assets.
36
Structured Broad Market Fund
B. The Vanguard Group furnishes at cost investment advisory, corporate management, administrative, marketing, and distribution services. The costs of such services are allocated to the fund based on methods approved by the board of trustees. The fund has committed to invest up to 0.40% of its net assets in Vanguard. At September 30, 2014, the fund had contributed capital of $54,000 to Vanguard (included in Other Assets), representing 0.01% of the fund’s net assets and 0.02% of Vanguard’s capitalization. The fund’s trustees and officers are also directors and officers of Vanguard.
C. Various inputs may be used to determine the value of the fund’s investments. These inputs are summarized in three broad levels for financial statement purposes. The inputs or methodologies used to value securities are not necessarily an indication of the risk associated with investing in those securities.
Level 1—Quoted prices in active markets for identical securities.
Level 2—Other significant observable inputs (including quoted prices for similar securities, interest rates, prepayment speeds, credit risk, etc.).
Level 3—Significant unobservable inputs (including the fund’s own assumptions used to determine the fair value of investments).
| The following table summarizes the market value of the fund’s investments as of September 30, 2014, based on the inputs used to value them: | |||
| Level 1 | Level 2 | Level 3 | |
| Investments | ($000) | ($000) | ($000) |
| Common Stocks | 539,583 | — | — |
| Temporary Cash Investments | 3,349 | 200 | — |
| Futures Contracts—Liabilities1 | (5) | — | — |
| Total | 542,927 | 200 | — |
| 1 Represents variation margin on the last day of the reporting period. | |||
D. At September 30, 2014, the aggregate settlement value of open futures contracts and the related unrealized appreciation (depreciation) were:
| ($000) | ||||
| Aggregate | ||||
| Number of | Settlement | Unrealized | ||
| Long (Short) | Value | Appreciation | ||
| Futures Contracts | Expiration | Contracts | Long (Short) | (Depreciation) |
| S&P 500 Index | December 2014 | 5 | 2,457 | (17) |
| E-mini S&P 500 Index | December 2014 | 1 | 98 | — |
| (17) |
Unrealized appreciation (depreciation) on open futures contracts is required to be treated as realized gain (loss) for tax purposes.
37
Structured Broad Market Fund
E. Distributions are determined on a tax basis and may differ from net investment income and realized capital gains for financial reporting purposes. Differences may be permanent or temporary. Permanent differences are reclassified among capital accounts in the financial statements to reflect their tax character. Temporary differences arise when certain items of income, expense, gain, or loss are recognized in different periods for financial statement and tax purposes. These differences will reverse at some time in the future. Differences in classification may also result from the treatment of short-term gains as ordinary income for tax purposes.
For tax purposes, at September 30, 2014, the fund had $23,662,000 of ordinary income and $41,852,000 of long-term capital gains available for distribution.
At September 30, 2014, the cost of investment securities for tax purposes was $415,712,000.
Net unrealized appreciation of investment securities for tax purposes was $127,420,000, consisting of unrealized gains of $133,154,000 on securities that had risen in value since their purchase and $5,734,000 in unrealized losses on securities that had fallen in value since their purchase.
F. During the year ended September 30, 2014, the fund purchased $320,396,000 of investment securities and sold $350,576,000 of investment securities, other than temporary cash investments.
G. Capital share transactions for each class of shares were:
| Year Ended September 30, | ||||
| 2014 | 2013 | |||
| Amount | Shares | Amount | Shares | |
| ($000) | (000) | ($000) | (000) | |
| Institutional Shares | ||||
| Issued | 6,643 | 195 | 5,285 | 201 |
| Issued in Lieu of Cash Distributions | 536 | 16 | 156 | 6 |
| Redeemed | — | — | — | — |
| Net Increase (Decrease) —Institutional Shares | 7,179 | 211 | 5,441 | 207 |
| Institutional Plus Shares | ||||
| Issued | 7,200 | 110 | 74,668 | 1,229 |
| Issued in Lieu of Cash Distributions | 20,486 | 310 | 2,609 | 49 |
| Redeemed | (46,513) | (627) | (69,336) | (1,141) |
| Net Increase (Decrease) —Institutional Plus Shares | (18,827) | (207) | 7,941 | 137 |
At September 30, 2014, one shareholder was the record or beneficial owner of 95% of the fund’s net assets. If the shareholder were to redeem its investment in the fund, the redemption might result in an increase in the fund’s expense ratio, cause the fund to incur higher transaction costs, or lead to the realization of taxable capital gains.
H. Management has determined that no material events or transactions occurred subsequent to September 30, 2014, that would require recognition or disclosure in these financial statements.
38
Report of Independent Registered
Public Accounting Firm
To the Board of Trustees of Vanguard Quantitative Funds and the Shareholders of Vanguard Structured Large-Cap Equity Fund and Vanguard Structured Broad Market Fund:
In our opinion, the accompanying statements of net assets and the related statements of operations and of changes in net assets and the financial highlights present fairly, in all material respects, the financial position of Vanguard Structured Large-Cap Equity Fund and Vanguard Structured Broad Market Fund (constituting separate portfolios of Vanguard Quantitative Funds, hereafter referred to as the “Funds”) at September 30, 2014, the results of each of their operations for the year ended, the changes in each of their net assets for each of the two years in the period then ended, and the financial highlights for each of the five years in the period then ended, in conformity with accounting principles generally accepted in the United States of America. These financial statements and financial highlights (hereafter referred to as “financial statements”) are the responsibility of the Funds’ management. Our responsibility is to express an opinion on these financial statements based on our audits. We conducted our audits of these financial statements in accordance with the standards of the Public Company Accounting Oversight Board (United States). Those standards require that we plan and perform the audit to obtain reasonable assurance about whether the financial statements are free of material misstatement. An audit includes examining, on a test basis, evidence supporting the amounts and disclosures in the financial statements, assessing the accounting principles used and significant estimates made by management, and evaluating the overall financial statement presentation. We believe that our audits, which included confirmation of securities at September 30, 2014 by correspondence with the custodian and broker and by agreement to the underlying ownership records of the transfer agent, provide a reasonable basis for our opinion.
/s/PricewaterhouseCoopers LLP
Philadelphia, Pennsylvania
November 14, 2014
39
| Special 2014 tax information (unaudited) for Vanguard Structured Equity Funds |
This information for the fiscal year ended September 30, 2014, is included pursuant to provisions of the Internal Revenue Code.
For non-resident alien shareholders, 100% of short-term capital gain dividends distributed by the Structured Broad Market Fund are qualified short-term capital gains.
The funds distributed capital gain dividends (from net long-term capital gains) to shareholders during the fiscal year as follows:
| Fund | ($000) |
| Structured Large-Cap Equity Fund | — |
| Structured Broad Market Fund | 18,383 |
The funds distributed qualified dividend income to shareholders during the fiscal year as follows:
| Fund | ($000) |
| Structured Large-Cap Equity Fund | 12,402 |
| Structured Broad Market Fund | 8,494 |
For corporate shareholders, the percentage of investment income (dividend income plus short-term gains, if any) that qualifies for the dividends-received deduction is as follows:
| Fund | Percentage |
| Structured Large-Cap Equity Fund | 100.0% |
| Structured Broad Market Fund | 34.4 |
40
About Your Fund’s Expenses
As a shareholder of the fund, you incur ongoing costs, which include costs for portfolio management, administrative services, and shareholder reports (like this one), among others. Operating expenses, which are deducted from a fund’s gross income, directly reduce the investment return of the fund.
A fund’s expenses are expressed as a percentage of its average net assets. This figure is known as the expense ratio. The following examples are intended to help you understand the ongoing costs (in dollars) of investing in your fund and to compare these costs with those of other mutual funds. The examples are based on an investment of $1,000 made at the beginning of the period shown and held for the entire period.
The accompanying table illustrates your fund’s costs in two ways:
• Based on actual fund return. This section helps you to estimate the actual expenses that you paid over the period. The ”Ending Account Value“ shown is derived from the fund‘s actual return, and the third column shows the dollar amount that would have been paid by an investor who started with $1,000 in the fund. You may use the information here, together with the amount you invested, to estimate the expenses that you paid over the period.
To do so, simply divide your account value by $1,000 (for example, an $8,600 account value divided by $1,000 = 8.6), then multiply the result by the number given for your fund under the heading ”Expenses Paid During Period.“
• Based on hypothetical 5% yearly return. This section is intended to help you compare your fund‘s costs with those of other mutual funds. It assumes that the fund had a yearly return of 5% before expenses, but that the expense ratio is unchanged. In this case—because the return used is not the fund’s actual return—the results do not apply to your investment. The example is useful in making comparisons because the Securities and Exchange Commission requires all mutual funds to calculate expenses based on a 5% return. You can assess your fund’s costs by comparing this hypothetical example with the hypothetical examples that appear in shareholder reports of other funds.
Note that the expenses shown in the table are meant to highlight and help you compare ongoing costs only and do not reflect transaction costs incurred by the fund for buying and selling securities. Further, the expenses do not include any purchase, redemption, or account service fees described in the fund prospectus. If such fees were applied to your account, your costs would be higher. Your fund does not carry a “sales load.”
The calculations assume no shares were bought or sold during the period. Your actual costs may have been higher or lower, depending on the amount of your investment and the timing of any purchases or redemptions.
You can find more information about the fund’s expenses, including annual expense ratios, in the Financial Statements section of this report. For additional information on operating expenses and other shareholder costs, please refer to your fund’s current prospectus.
41
| Six Months Ended September 30, 2014 | |||
| Beginning | Ending | Expenses | |
| Account Value | Account Value | Paid During | |
| 3/31/2014 | 9/30/2014 | Period | |
| Based on Actual Fund Return | |||
| Structured Large-Cap Equity Fund | |||
| Institutional Shares | $1,000.00 | $1,069.60 | $1.25 |
| Institutional Plus Shares | 1,000.00 | 1,070.10 | 0.88 |
| Structured Broad Market Fund | |||
| Institutional Shares | $1,000.00 | $1,052.22 | $1.23 |
| Institutional Plus Shares | 1,000.00 | 1,052.69 | 0.87 |
| Based on Hypothetical 5% Yearly Return | |||
| Structured Large-Cap Equity Fund | |||
| Institutional Shares | $1,000.00 | $1,023.87 | $1.22 |
| Institutional Plus Shares | 1,000.00 | 1,024.22 | 0.86 |
| Structured Broad Market Fund | |||
| Institutional Shares | $1,000.00 | $1,023.87 | $1.22 |
| Institutional Plus Shares | 1,000.00 | 1,024.22 | 0.86 |
| The calculations are based on expenses incurred in the most recent six-month period. The funds’ annualized six-month expense ratios for that period are: for the Structured Large-Cap Equity Fund, 0.24% for Institutional Shares and 0.17% for Institutional Plus Shares; for the Structured Broad Market Fund, 0.24% for Institutional Shares and 0.17% for Institutional Plus Shares. The dollar amounts shown as “Expenses Paid” are equal to the annualized expense ratio multiplied by the average account value over the period, multiplied by the number of days in the most recent six-month period, then divided by the number of days in the most recent 12-month period. | |||
42
Glossary
30-Day SEC Yield. A fund’s 30-day SEC yield is derived using a formula specified by the U.S. Securities and Exchange Commission. Under the formula, data related to the fund’s security holdings in the previous 30 days are used to calculate the fund’s hypothetical net income for that period, which is then annualized and divided by the fund’s estimated average net assets over the calculation period. For the purposes of this calculation, a security’s income is based on its current market yield to maturity (for bonds), its actual income (for asset-backed securities), or its projected dividend yield (for stocks). Because the SEC yield represents hypothetical annualized income, it will differ—at times significantly—from the fund’s actual experience. As a result, the fund’s income distributions may be higher or lower than implied by the SEC yield.
Beta. A measure of the magnitude of a fund’s past share-price fluctuations in relation to the ups and downs of a given market index. The index is assigned a beta of 1.00. Compared with a given index, a fund with a beta of 1.20 typically would have seen its share price rise or fall by 12% when the index rose or fell by 10%. For this report, beta is based on returns over the past 36 months for both the fund and the index. Note that a fund’s beta should be reviewed in conjunction with its R-squared (see definition). The lower the R-squared, the less correlation there is between the fund and the index, and the less reliable beta is as an indicator of volatility.
Dividend Yield. Dividend income earned by stocks, expressed as a percentage of the aggregate market value (or of net asset value, for a fund). The yield is determined by dividing the amount of the annual dividends by the aggregate value (or net asset value) at the end of the period. For a fund, the dividend yield is based solely on stock holdings and does not include any income produced by other investments.
Earnings Growth Rate. The average annual rate of growth in earnings over the past five years for the stocks now in a fund.
Equity Exposure. A measure that reflects a fund’s investments in stocks and stock futures. Any holdings in short-term reserves are excluded.
Expense Ratio. A fund’s total annual operating expenses expressed as a percentage of the fund’s average net assets. The expense ratio includes management and administrative expenses, but does not include the transaction costs of buying and selling portfolio securities.
Foreign Holdings. The percentage of a fund represented by securities or depositary receipts of companies based outside the United States.
Median Market Cap. An indicator of the size of companies in which a fund invests; the midpoint of market capitalization (market price x shares outstanding) of a fund’s stocks, weighted by the proportion of the fund’s assets invested in each stock. Stocks representing half of the fund’s assets have market capitalizations above the median, and the rest are below it.
Price/Book Ratio. The share price of a stock divided by its net worth, or book value, per share. For a fund, the weighted average price/book ratio of the stocks it holds.
Price/Earnings Ratio. The ratio of a stock’s current price to its per-share earnings over the past year. For a fund, the weighted average P/E of the stocks it holds. P/E is an indicator of market expectations about corporate prospects; the higher the P/E, the greater the expectations for a company’s future growth.
43
R-Squared. A measure of how much of a fund’s past returns can be explained by the returns from the market in general, as measured by a given index. If a fund’s total returns were precisely synchronized with an index’s returns, its R-squared would be 1.00. If the fund’s returns bore no relationship to the index’s returns, its R-squared would be 0. For this report, R-squared is based on returns over the past 36 months for both the fund and the index.
Return on Equity. The annual average rate of return generated by a company during the past five years for each dollar of shareholder’s equity (net income divided by shareholder’s equity). For a fund, the weighted average return on equity for the companies whose stocks it holds.
Short-Term Reserves. The percentage of a fund invested in highly liquid, short-term securities that can be readily converted to cash.
Turnover Rate. An indication of the fund’s trading activity. Funds with high turnover rates incur higher transaction costs and may be more likely to distribute capital gains (which may be taxable to investors). The turnover rate excludes in-kind transactions, which have minimal impact on costs.
44
This page intentionally left blank.
This page intentionally left blank.
This page intentionally left blank.
The People Who Govern Your Fund
The trustees of your mutual fund are there to see that the fund is operated and managed in your best interests since, as a shareholder, you are a part owner of the fund. Your fund’s trustees also serve on the board of directors of The Vanguard Group, Inc., which is owned by the Vanguard funds and provides services to them on an at-cost basis.
A majority of Vanguard’s board members are independent, meaning that they have no affiliation with Vanguard or the funds they oversee, apart from the sizable personal investments they have made as private individuals. The independent board members have distinguished backgrounds in business, academia, and public service. Each of the trustees and executive officers oversees 177 Vanguard funds.
The following table provides information for each trustee and executive officer of the fund. More information about the trustees is in the Statement of Additional Information, which can be obtained, without charge, by contacting Vanguard at 800-662-7447, or online at vanguard.com.
| InterestedTrustee1 | and Delphi Automotive LLP (automotive components); |
| Senior Advisor at New Mountain Capital. | |
| F. William McNabb III | |
| Born 1957. Trustee Since July 2009. Chairman of the | Amy Gutmann |
| Board. Principal Occupation(s) During the Past Five | Born 1949. Trustee Since June 2006. Principal |
| Years: Chairman of the Board of The Vanguard Group, | Occupation(s) During the Past Five Years: President of |
| Inc., and of each of the investment companies served | the University of Pennsylvania; Christopher H. Browne |
| by The Vanguard Group, since January 2010; Director | Distinguished Professor of Political Science, School of |
| of The Vanguard Group since 2008; Chief Executive | Arts and Sciences, and Professor of Communication, |
| Officer and President of The Vanguard Group, and of | Annenberg School for Communication, with secondary |
| each of the investment companies served by The | faculty appointments in the Department of Philosophy, |
| Vanguard Group, since 2008; Director of Vanguard | School of Arts and Sciences, and at the Graduate |
| Marketing Corporation; Managing Director of The | School of Education, University of Pennsylvania; |
| Vanguard Group (1995–2008). | Trustee of the National Constitution Center; Chair |
| of the Presidential Commission for the Study of | |
| IndependentTrustees | Bioethical Issues. |
| Emerson U. Fullwood | JoAnn Heffernan Heisen |
| Born 1948. Trustee Since January 2008. Principal | Born 1950. Trustee Since July 1998. Principal |
| Occupation(s) During the Past Five Years: Executive | Occupation(s) During the Past Five Years: Corporate |
| Chief Staff and Marketing Officer for North America | Vice President and Chief Global Diversity Officer |
| and Corporate Vice President (retired 2008) of Xerox | (retired 2008) and Member of the Executive |
| Corporation (document management products and | Committee (1997–2008) of Johnson & Johnson |
| services); Executive in Residence and 2009–2010 | (pharmaceuticals/medical devices/consumer |
| Distinguished Minett Professor at the Rochester | products); Director of Skytop Lodge Corporation |
| Institute of Technology; Director of SPX Corporation | (hotels), the University Medical Center at Princeton, |
| (multi-industry manufacturing), the United Way of | the Robert Wood Johnson Foundation, and the Center |
| Rochester, Amerigroup Corporation (managed health | for Talent Innovation; Member of the Advisory Board |
| care), the University of Rochester Medical Center, | of the Maxwell School of Citizenship and Public Affairs |
| Monroe Community College Foundation, and North | at Syracuse University. |
| Carolina A&T University. | |
| F. Joseph Loughrey | |
| Rajiv L. Gupta | Born 1949. Trustee Since October 2009. Principal |
| Born 1945. Trustee Since December 2001.2 | Occupation(s) During the Past Five Years: President |
| Principal Occupation(s) During the Past Five Years: | and Chief Operating Officer (retired 2009) of Cummins |
| Chairman and Chief Executive Officer (retired 2009) | Inc. (industrial machinery); Chairman of the Board |
| and President (2006–2008) of Rohm and Haas Co. | of Hillenbrand, Inc. (specialized consumer services), |
| (chemicals); Director of Tyco International, Ltd. | and of Oxfam America; Director of SKF AB (industrial |
| (diversified manufacturing and services), Hewlett- | machinery), Hyster-Yale Materials Handling, Inc. |
| Packard Co. (electronic computer manufacturing), | (forklift trucks), the Lumina Foundation for Education, |
| and the V Foundation for Cancer Research; Member | Executive Officers | |
| of the Advisory Council for the College of Arts and | ||
| Letters and of the Advisory Board to the Kellogg | Glenn Booraem | |
| Institute for International Studies, both at the | Born 1967. Controller Since July 2010. Principal | |
| University of Notre Dame. | Occupation(s) During the Past Five Years: Principal | |
| of The Vanguard Group, Inc.; Controller of each of | ||
| Mark Loughridge | the investment companies served by The Vanguard | |
| Born 1953. Trustee Since March 2012. Principal | Group; Assistant Controller of each of the investment | |
| Occupation(s) During the Past Five Years: Senior Vice | companies served by The Vanguard Group (2001–2010). | |
| President and Chief Financial Officer (retired 2013) | ||
| at IBM (information technology services); Fiduciary | Thomas J. Higgins | |
| Member of IBM’s Retirement Plan Committee (2004– | Born 1957. Chief Financial Officer Since September | |
| 2013); Member of the Council on Chicago Booth. | 2008. Principal Occupation(s) During the Past Five | |
| Years: Principal of The Vanguard Group, Inc.; Chief | ||
| Scott C. Malpass | Financial Officer of each of the investment companies | |
| Born 1962. Trustee Since March 2012. Principal | served by The Vanguard Group; Treasurer of each of | |
| Occupation(s) During the Past Five Years: Chief | the investment companies served by The Vanguard | |
| Investment Officer and Vice President at the University | Group (1998–2008). | |
| of Notre Dame; Assistant Professor of Finance at the | ||
| Mendoza College of Business at Notre Dame; Member | Kathryn J. Hyatt | |
| of the Notre Dame 403(b) Investment Committee; | Born 1955. Treasurer Since November 2008. Principal | |
| Board Member of TIFF Advisory Services, Inc. | Occupation(s) During the Past Five Years: Principal of | |
| (investment advisor); Member of the Investment | The Vanguard Group, Inc.; Treasurer of each of the | |
| Advisory Committees of the Financial Industry | investment companies served by The Vanguard | |
| Regulatory Authority (FINRA) and of Major League | Group; Assistant Treasurer of each of the investment | |
| Baseball. | companies served by The Vanguard Group (1988–2008). | |
| André F. Perold | Heidi Stam | |
| Born 1952. Trustee Since December 2004. Principal | Born 1956. Secretary Since July 2005. Principal | |
| Occupation(s) During the Past Five Years: George | Occupation(s) During the Past Five Years: Managing | |
| Gund Professor of Finance and Banking, Emeritus | Director of The Vanguard Group, Inc.; General Counsel | |
| at the Harvard Business School (retired 2011); | of The Vanguard Group; Secretary of The Vanguard | |
| Chief Investment Officer and Managing Partner of | Group and of each of the investment companies | |
| HighVista Strategies LLC (private investment firm); | served by The Vanguard Group; Director and Senior | |
| Director of Rand Merchant Bank; Overseer of the | Vice President of Vanguard Marketing Corporation. | |
| Museum of Fine Arts Boston. | ||
| Vanguard Senior ManagementTeam | ||
| Alfred M. Rankin, Jr. | ||
| Born 1941. Trustee Since January 1993. Principal | Mortimer J. Buckley | Chris D. McIsaac |
| Occupation(s) During the Past Five Years: Chairman, | Kathleen C. Gubanich | Michael S. Miller |
| President, and Chief Executive Officer of NACCO | Paul A. Heller | James M. Norris |
| Industries, Inc. (housewares/lignite), and of Hyster- | Martha G. King | Glenn W. Reed |
| Yale Materials Handling, Inc. (forklift trucks); Chairman | John T. Marcante | |
| of the Board of University Hospitals of Cleveland. | ||
| Chairman Emeritus and Senior Advisor | ||
| Peter F. Volanakis | ||
| Born 1955. Trustee Since July 2009. Principal | John J. Brennan | |
| Occupation(s) During the Past Five Years: President | Chairman, 1996–2009 | |
| and Chief Operating Officer (retired 2010) of Corning | Chief Executive Officer and President, 1996–2008 | |
| Incorporated (communications equipment); Trustee of | ||
| Colby-Sawyer College; Member of the Advisory Board | Founder | |
| of the Norris Cotton Cancer Center and of the Advisory | ||
| Board of the Parthenon Group (strategy consulting). | John C. Bogle | |
| Chairman and Chief Executive Officer, 1974–1996 | ||
1 Mr. McNabb is considered an “interested person,” as defined in the Investment Company Act of 1940, because he is an officer of the Vanguard funds.
2 December 2002 for Vanguard Equity Income Fund, the Vanguard Municipal Bond Funds, and the Vanguard State Tax-Exempt Funds.
 | |
| P.O. Box 2600 | |
| Valley Forge, PA 19482-2600 | |
| Connect with Vanguard® > vanguard.com | |
| Fund Information > 800-662-7447 | CFA® is a registered trademark owned by CFA Institute. |
| Direct Investor Account Services > 800-662-2739 | |
| Institutional Investor Services > 800-523-1036 | |
| Text Telephone for People | |
| Who Are Deaf or Hard of Hearing> 800-749-7273 | |
| This material may be used in conjunction | |
| with the offering of shares of any Vanguard | |
| fund only if preceded or accompanied by | |
| the fund’s current prospectus. | |
| All comparative mutual fund data are from Lipper, a | |
| Thomson Reuters Company, or Morningstar, Inc., unless | |
| otherwise noted. | |
| You can obtain a free copy of Vanguard’s proxy voting | |
| guidelines by visiting vanguard.com/proxyreporting or by | |
| calling Vanguard at 800-662-2739. The guidelines are | |
| also available from the SEC’s website, sec.gov. In | |
| addition, you may obtain a free report on how your fund | |
| voted the proxies for securities it owned during the 12 | |
| months ended June 30. To get the report, visit either | |
| vanguard.com/proxyreporting or sec.gov. | |
| You can review and copy information about your fund at | |
| the SEC’s Public Reference Room in Washington, D.C. To | |
| find out more about this public service, call the SEC at | |
| 202-551-8090. Information about your fund is also | |
| available on the SEC’s website, and you can receive | |
| copies of this information, for a fee, by sending a | |
| request in either of two ways: via e-mail addressed to | |
| publicinfo@sec.gov or via regular mail addressed to the | |
| Public Reference Section, Securities and Exchange | |
| Commission, Washington, DC 20549-1520. | |
| © 2014 The Vanguard Group, Inc. | |
| All rights reserved. | |
| Vanguard Marketing Corporation, Distributor. | |
| Q08700 112014 | |
Item 2: Code of Ethics. The Registrant has adopted a code of ethics that applies to the Registrant’s principal executive officer, principal financial officer, principal accounting officer or controller or persons performing similar functions. The Code of Ethics was amended during the reporting period covered by this report to make certain technical, non-material changes.
Item 3: Audit Committee Financial Expert. The following members of the Audit Committee have been determined by the Registrant’s Board of Trustees to be Audit Committee Financial Experts serving on its Audit Committee, and to be independent: Rajiv L. Gupta, Amy Gutmann, JoAnn Heffernan Heisen, F. Joseph Loughrey, Mark Loughridge, Scott C. Malpass, André F. Perold, and Alfred M. Rankin, Jr.
Item 4: Principal Accountant Fees and Services.
(a) Audit Fees.
Audit Fees of the Registrant
Fiscal Year Ended September 30, 2014: $98,000
Fiscal Year Ended September 30, 2013: $86,000
Aggregate Audit Fees of Registered Investment Companies in the Vanguard Group.
Fiscal Year Ended September 30, 2014: $6,605,127
Fiscal Year Ended September 30, 2013: $5,714,113
Includes fees billed in connection with audits of the Registrant, other registered investment companies in the Vanguard complex, The Vanguard Group, Inc. and Vanguard Marketing Corporation.
(b) Audit-Related Fees.
Fiscal Year Ended September 30, 2014: $2,176,479
Fiscal Year Ended September 30, 2013: $1,552,950
Includes fees billed in connection with assurance and related services provided to the Registrant, other registered investment companies in the Vanguard complex, The Vanguard Group, Inc., and Vanguard Marketing Corporation.
(c) Tax Fees.
Fiscal Year Ended September 30, 2014: $316,869
Fiscal Year Ended September 30, 2013: $110,000
Includes fees billed in connection with tax compliance, planning, and advice services provided to the Registrant, other registered investment companies in the Vanguard complex, The Vanguard Group, Inc., and Vanguard Marketing Corporation.
(d) All Other Fees.
Fiscal Year Ended September 30, 2014: $198,163
Fiscal Year Ended September 30, 2013: $132,000
Includes fees billed for services related to tax reported information provided to the Registrant, other registered investment companies in the Vanguard complex, The Vanguard Group, Inc., and Vanguard Marketing Corporation.
(e) (1) Pre-Approval Policies. The policy of the Registrant’s Audit Committee is to consider and, if appropriate, approve before the principal accountant is engaged for such services, all specific audit and non-audit services provided to: the Registrant, other registered investment companies in the Vanguard complex, The Vanguard Group, Inc., and entities controlled by The Vanguard Group, Inc. that provide ongoing services to the Registrant. In making a determination, the Audit Committee considers whether the services are consistent with maintaining the principal accountant’s independence.
In the event of a contingency situation in which the principal accountant is needed to provide services in between scheduled Audit Committee meetings, the Chairman of the Audit Committee would be called on to consider and, if appropriate, pre-approve audit or permitted non-audit services in an amount sufficient to complete services through the next Audit Committee meeting, and to determine if such services would be consistent with maintaining the accountant’s independence. At the next scheduled Audit Committee meeting, services and fees would be presented to the Audit Committee for formal consideration, and, if appropriate, approval by the entire Audit Committee. The Audit Committee would again consider whether such services and fees are consistent with maintaining the principal accountant’s independence.
The Registrant’s Audit Committee is informed at least annually of all audit and non-audit services provided by the principal accountant to the Vanguard complex, whether such services are provided to: the Registrant, other registered investment companies in the Vanguard complex, The Vanguard Group, Inc., or other entities controlled by The Vanguard Group, Inc. that provide ongoing services to the Registrant.
(2) No percentage of the principal accountant’s fees or services were approved pursuant to the waiver provision of paragraph (c)(7)(i)(C) of Rule 2-01 of Regulation S-X.
(f) For the most recent fiscal year, over 50% of the hours worked under the principal accountant’s engagement were not performed by persons other than full-time, permanent employees of the principal accountant.
(g) Aggregate Non-Audit Fees.
Fiscal Year Ended September 30, 2014: $515,032
Fiscal Year Ended September 30, 2013: $242,000
Includes fees billed for non-audit services provided to the Registrant, other registered investment companies in the Vanguard complex, The Vanguard Group, Inc., and Vanguard Marketing Corporation.
(h) For the most recent fiscal year, the Audit Committee has determined that the provision of all non-audit services was consistent with maintaining the principal accountant’s independence.
Item 5: Audit Committee of Listed Registrants.
Not Applicable.
Item 6: Investments.
Not Applicable.
Item 7: Disclosure of Proxy Voting Policies and Procedures for Closed-End Management
Investment Companies.
Not Applicable.
Item 8: Portfolio Managers of Closed-End Management Investment Companies.
Not Applicable.
Item 9: Purchase of Equity Securities by Closed-End Management Investment Company and
Affiliated Purchasers.
Not Applicable.
Item 10: Submission of Matters to a Vote of Security Holders.
Not Applicable.
Item 11: Controls and Procedures.
(a) Disclosure Controls and Procedures. The Principal Executive and Financial Officers concluded that the Registrant’s Disclosure Controls and Procedures are effective based on their evaluation of the Disclosure Controls and Procedures as of a date within 90 days of the filing date of this report.
(b) Internal Control Over Financial Reporting. There were no significant changes in Registrant’s Internal Control Over Financial Reporting or in other factors that could significantly affect this control subsequent to the date of the evaluation, including any corrective actions with regard to significant deficiencies and material weaknesses.
Item 12: Exhibits.
(a) Code of Ethics.
(b) Certifications.
Pursuant to the requirements of the Securities Exchange Act of 1934 and the Investment Company Act of 1940, the registrant has duly caused this report to be signed on its behalf by the undersigned, thereunto duly authorized.
| VANGUARD QUANTITATIVE FUNDS | |
| BY: | /s/ F. WILLIAM MCNABB III* |
| F. WILLIAM MCNABB III | |
| CHIEF EXECUTIVE OFFICER | |
| Date: November 19, 2014 | |
Pursuant to the requirements of the Securities Exchange Act of 1934 and the Investment Company Act of 1940, this report has been signed below by the following persons on behalf of the registrant and in the capacities and on the dates indicated.
| VANGUARD QUANTITATIVE FUNDS | |
BY: | /s/ F. WILLIAM MCNABB III* |
| F. WILLIAM MCNABB III | |
| CHIEF EXECUTIVE OFFICER | |
Date: November 19, 2014 | |
| VANGUARD QUANTITATIVE FUNDS |
BY: | /s/ THOMAS J. HIGGINS* |
| THOMAS J. HIGGINS | |
| CHIEF FINANCIAL OFFICER | |
| Date: November 19, 2014 | |
* By: /s/ Heidi Stam
Heidi Stam, pursuant to a Power of Attorney filed on April 22, 2014 see file Number
2-17620, Incorporated by Reference.