UNITED STATES
SECURITIES AND EXCHANGE COMMISSION
Washington, D.C. 20549
FORM N-CSR
CERTIFIED SHAREHOLDER REPORT
OF
REGISTERED MANAGEMENT INVESTMENT COMPANIES
| Investment Company Act file number: | 811-04526 | |
Name of Registrant: | Vanguard Quantitative Funds | |
Address of Registrant: | P.O. Box 2600 | |
| Valley Forge, PA 19482 | ||
Name and address of agent for service: | Heidi Stam, Esquire | |
| P.O. Box 876 | ||
| Valley Forge, PA 19482 | ||
Registrant’s telephone number, including area code: (610) 669-1000 | ||
Date of fiscal year end: September 30 | ||
Date of reporting period: October 1, 2014 – September 30, 2015 | ||
Item 1: Reports to Shareholders | ||
Annual Report | September 30, 2015
Vanguard Growth and Income Fund
Vanguard’s Principles for Investing Success
We want to give you the best chance of investment success. These principles, grounded in Vanguard’s research and experience, can put you on the right path.
Goals. Create clear, appropriate investment goals.
Balance. Develop a suitable asset allocation using broadly diversified funds. Cost. Minimize cost.
Discipline. Maintain perspective and long-term discipline.
A single theme unites these principles: Focus on the things you can control.
We believe there is no wiser course for any investor.
| Contents | |
| Your Fund’s Total Returns. | 1 |
| Chairman’s Letter. | 2 |
| Advisors’ Report. | 8 |
| Fund Profile. | 13 |
| Performance Summary. | 15 |
| Financial Statements. | 17 |
| Your Fund’s After-Tax Returns. | 37 |
| About Your Fund’s Expenses. | 38 |
| Trustees Approve Advisory Arrangements. | 40 |
| Glossary. | 42 |
Please note: The opinions expressed in this report are just that—informed opinions. They should not be considered promises or advice.
Also, please keep in mind that the information and opinions cover the period through the date on the front of this report. Of course, the
risks of investing in your fund are spelled out in the prospectus.
See the Glossary for definitions of investment terms used in this report.
About the cover: Pictured is a sailing block on the Brilliant, a 1932 schooner docked in Mystic, Connecticut. A type of pulley, the
sailing block helps coordinate the setting of the sails. At Vanguard, the intricate coordination of technology and people allows
us to help millions of clients around the world reach their financial goals.
Your Fund’s Total Returns
| Fiscal Year Ended September 30, 2015 | |
| Total | |
| Returns | |
| Vanguard Growth and Income Fund | |
| Investor Shares | 0.22% |
| Admiral™ Shares | 0.31 |
| S&P 500 Index | -0.61 |
| Large-Cap Core Funds Average | -2.30 |
| Large-Cap Core Funds Average: Derived from data provided by Lipper, a Thomson Reuters Company. | |
| Admiral Shares carry lower expenses and are available to investors who meet certain account-balance requirements. | |
Your Fund’s Performance at a Glance
September 30, 2014, Through September 30, 2015
| Distributions Per Share | ||||
| Starting | Ending | |||
| Share | Share | Income | Capital | |
| Price | Price | Dividends | Gains | |
| Vanguard Growth and Income Fund | ||||
| Investor Shares | $42.69 | $39.55 | $0.724 | $2.604 |
| Admiral Shares | 69.71 | 64.57 | 1.264 | 4.251 |
1

Chairman’s Letter
Dear Shareholder,
After posting a decent advance in the first six months, the broad U.S. stock market retreated and finished in slightly negative territory for the 12 months ended September 30, 2015. Investors worried about a slowdown across most regions of the world, accompanied by a steep drop in commodity prices.
Vanguard Growth and Income Fund returned less than 1% for the fiscal year, besting its benchmark, the Standard & Poor’s 500 Index, which returned –0.61%. The average return of its large-capitalization core fund peers was even lower, at –2.30%.
Of the fund’s ten industry sectors, six recorded gains. Consumer-related and health care companies fared well; energy and materials companies were notable detractors.
If you own shares of the fund in a taxable account, you may wish to review information on the fund’s after-tax returns that appears later in this report. Please note that as of September 30, 2015, the Growth and Income Fund had realized short-term capital gains equal to about 1% of fund assets and long-term capital gains equal to about 4% of fund assets. Gains will be distributed in December.
China’s economic woes weighed on U.S. stocks
The broad U.S. stock market returned –0.49% for the 12 months. The final two months were especially rocky as investors
2
worried in particular about the global ripple effects of slower economic growth in China.
For much of the fiscal year, investors were preoccupied with the possibility of an increase in short-term interest rates. On September 17, the Federal Reserve announced that it would hold rates steady for the time being, a decision that to some investors indicated that the Fed was concerned about the fragility of global markets.
International stocks returned about –11%, as the dollar’s strength against many foreign currencies weighed on results. Returns for emerging markets, which were especially hard hit by concerns about China, trailed those of the developed markets of the Pacific region and Europe.
Taxable bonds recorded gains as investors searched for safety
The broad U.S. taxable bond market returned 2.94%, as investors gravitated toward safe-haven assets amid global stock market turmoil. Stimulative monetary policies from the world’s central banks, declining inflation expectations, and global investors’ search for higher yields also helped lift U.S. bonds.
The yield of the 10-year Treasury note ended September at 2.05%, down from 2.48% a year earlier. (Bond prices and yields move in opposite directions.)
| Market Barometer | |||
| Average Annual Total Returns | |||
| Periods Ended September 30, 2015 | |||
| One | Three | Five | |
| Year | Years | Years | |
| Stocks | |||
| Russell 1000 Index (Large-caps) | -0.61% | 12.66% | 13.42% |
| Russell 2000 Index (Small-caps) | 1.25 | 11.02 | 11.73 |
| Russell 3000 Index (Broad U.S. market) | -0.49 | 12.53 | 13.28 |
| FTSE All-World ex US Index (International) | -11.34 | 2.87 | 2.19 |
| Bonds | |||
| Barclays U.S. Aggregate Bond Index (Broad taxable market) | 2.94% | 1.71% | 3.10% |
| Barclays Municipal Bond Index (Broad tax-exempt market) | 3.16 | 2.88 | 4.14 |
| Citigroup Three-Month U.S. Treasury Bill Index | 0.02 | 0.02 | 0.04 |
| CPI | |||
| Consumer Price Index | -0.04% | 0.93% | 1.73% |
3
International bond markets (as measured by the Barclays Global Aggregate Index ex USD) returned –7.67%, hurt by the dollar’s strength. Without this currency effect, international bonds advanced modestly.
The Fed’s 0%–0.25% target for short-term interest rates continued to limit returns for money market funds and savings accounts.
Consumer stocks did well, but energy weighed heavily
The Growth and Income Fund invests in a diversified portfolio of hundreds of large-cap stocks that, while similar in composition to the S&P 500 Index, has the potential to outperform it. The fund’s three advisors rely on sophisticated computer models to identify the stocks that offer the best prospects.
The two consumer-oriented sectors, consumer discretionary (+15%) and consumer staples (+7%), advanced notably as retail spending rose. Strong auto sales were reflected in auto component stocks, and returns from internet retailers were particularly robust. Gains also came from the subsectors associated with the housing market’s rebound.
Health care stocks also contributed, generating returns of about 7%. The industry has benefited from several trends, including an aging U.S. population that requires more health care and the broader availability of insurance coverage through the Affordable Care Act. Health care services and medical equipment companies stood out. The picture was far different for the pharmaceutical and biotechnology
| Expense Ratios | |||
| Your Fund Compared With Its Peer Group | |||
| Investor | Admiral | Peer Group | |
| Shares | Shares | Average | |
| Growth and Income Fund | 0.37% | 0.26% | 1.12% |
The fund expense ratios shown are from the prospectus dated January 26, 2015, and represent estimated costs for the current fiscal year. For
the fiscal year ended September 30, 2015, the fund’s expense ratios were 0.34% for Investor Shares and 0.23% for Admiral Shares. The
peer-group expense ratio is derived from data provided by Lipper, a Thomson Reuters Company, and captures information through year-end
2014.
Peer group: Large-Cap Core Funds.
4
subsectors: They were strong performers in the first half of the period, but their 12-month return was near zero.
Information technology, the largest sector, posted a tepid 2% return. Internet-based services enjoyed strong returns as investors were optimistic about the subsector’s growth prospects.
Financial stocks, which made up the third-largest portion of the fund on average, returned –2%. Although health care real estate investment trusts benefited from the trends helping the health care industry, banks, asset managers, and consumer credit stocks retreated in the face of continuing low interest rates, crimping profit margins from loans.
The two sectors that weighed most heavily on the fund were energy (–24%) and materials (–14%). Both were hit hard by the big decline in commodity prices. Oil prices plunged about 50% over the 12-month period, and natural gas fell about 40% as a global glut of supply and slowing demand from developing nations cut profits dramatically.
For more about the advisors’ strategy and the fund’s positioning during the 12 months, please see the Advisors’ Report that follows this letter.
The fund’s three advisors have seen success over time
Over the past ten years, Investor Shares of the Growth and Income Fund returned an annual average of 6.16%, close to that
| Total Returns | |
| Ten Years Ended September 30, 2015 | |
| Average | |
| Annual Return | |
| Growth and Income Fund Investor Shares | 6.16% |
| S&P 500 Index | 6.80 |
| Large-Cap Core Funds Average | 5.52 |
| Large-Cap Core Funds Average: Derived from data provided by Lipper, a Thomson Reuters Company. |
The figures shown represent past performance, which is not a guarantee of future results. (Current performance may be
lower or higher than the performance data cited. For performance data current to the most recent month-end, visit our
website at vanguard.com/performance.) Note, too, that both investment returns and principal value can fluctuate widely, so
an investor’s shares, when sold, could be worth more or less than their original cost.
5
Staying the course can help you stay closer to your fund’s return
When stock markets are highly volatile, as in recent months, it’s tempting to run for cover. But the price of panic can be high.
A rough measure of what can be lost from attempts to time the market is the difference between the returns produced by a fund and the returns earned by the fund’s investors.
The results shown in the Performance Summary later in this report are your fund’s time-weighted returns—the average annual returns investors would have earned if they had invested a lump sum in the fund at the start of the period and reinvested any distributions they received. Their actual returns, however, depend on whether they subsequently bought or sold any shares. There’s often a gap between this dollar-weighted return for investors and the fund’s time-weighted return, as shown below.
Many sensible investment behaviors can contribute to the difference in returns, but industry cash flow data suggest that one important factor is the generally counterproductive effort to buy and sell at the “right” time. Keeping your emotions in check can help narrow the gap.
Mutual fund returns and investor returns over the last decade
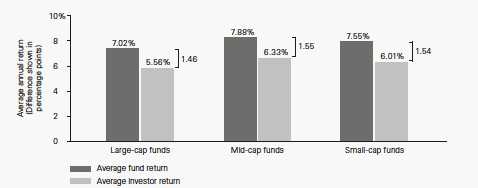
Notes: Data are as of December 31, 2014. The average fund returns and average investor returns are from Morningstar. The average
fund returns are the average of the funds’ time-weighted returns in each category. The average investor returns assume that the growth
of a fund’s total net assets for a given period is driven by market returns and investor cash ow. To calculate investor return, a fund’s
change in assets for the period is discounted by the return of the fund to isolate how much of the asset growth was driven by cash ow.
A model, similar to an internal rate-of-return calculation, is then used to calculate a constant growth rate that links the beginning total
net assets and periodic cash ows to the ending total net assets.
Sources: Vanguard and Morningstar, Inc.
6
of the benchmark and ahead of the average return of peer funds. The decade can be divided into two distinct halves. In the first five years, the fund trailed the S&P 500 Index in each fiscal year as extraordinary volatility made it especially difficult for computer-reliant stock-selection approaches.
But in each of the last five years, the fund outdistanced the index. The fund’s three advisors use complementary quantitative strategies that have worked well in outperforming the benchmark without taking on undue risk. We expect this multimanager approach will continue to provide competitive returns over the long term.
A dose of discipline is crucial when markets become volatile
Although the broad U.S. stock market has posted gains for six straight calendar years—from 2009 to 2014—that streak may not last a seventh. Stocks tumbled in August and swung up and down in September.
Nobody can control the direction of the markets or predict where they’ll go in the short term. However, investors can control how they react to unstable and turbulent markets.
During periods of market adversity, it’s more important than ever to keep sight of one of Vanguard’s key principles: Maintain perspective and long-term discipline. Whether you’re investing for yourself or on behalf of clients, your success is affected greatly by how you respond—or don’t respond—during turbulent markets. (You can read Vanguard’s Principles for Investing Success at vanguard.com/research.)
As I’ve written in the past, the best course for long-term investors is generally to ignore daily market moves and not make decisions based on emotion. (See the box on page 6 for more discussion on the benefit of staying the course.) This is also a good time to evaluate your portfolio and make sure your asset allocation is aligned with your time horizon, goals, and risk tolerance.
The markets are unpredictable and often confounding. Keeping long-term plans clearly in focus can help you weather these periodic storms.
As always, thank you for investing with Vanguard.
Sincerely,

F. William McNabb III
Chairman and Chief Executive Officer
October 12, 2015
7
Advisors’ Report
Vanguard Growth and Income Fund’s Investor Shares returned 0.22% for the 12 months ended September 30, 2015. The Admiral Shares returned 0.31%. The Standard & Poor’s 500 Index returned –0.61%, and the average return of large-capitalization core funds was –2.30%.
Your fund is managed by three independent advisors, a strategy that enhances the fund’s diversification by providing exposure to distinct yet complementary investment approaches. It is not uncommon for different advisors to have different views about individual securities or the broader investment environment.
The advisors, the percentage of fund assets each manages, and brief descriptions of their investment strategies are presented in the table below. The advisors have also prepared a discussion of the investment environment that existed during the fiscal year and of how the portfolio’s positioning reflects this assessment. (Please note that Los Angeles Capital’s discussion refers to industry sectors as defined by Russell classifications, rather than by the Global Industry Classification Standard used elsewhere in this report.) These comments were prepared on October 16, 2015.
| Vanguard Growth and Income Fund Investment Advisors | |||
| Fund Assets Managed | |||
| Investment Advisor | % | $ Million | Investment Strategy |
| Vanguard Quantitative | 33 | 1,928 | Employs a quantitative fundamental management |
| Equity Group | approach, using models that assess valuation, growth | ||
| prospects, management decisions, market sentiment, | |||
| and earnings and balance-sheet quality of companies | |||
| as compared with their peers. | |||
| D. E. Shaw Investment | 32 | 1,905 | Employs quantitative models that seek to capture |
| Management, L.L.C. | predominantly “bottom up” stock-specific return | ||
| opportunities while aiming to keep the portfolio’s | |||
| sector weights, size, and style characteristics similar to | |||
| the benchmark. | |||
| Los Angeles Capital | 32 | 1,902 | Employs a quantitative model that emphasizes stocks |
| with characteristics investors are currently seeking and | |||
| underweights stocks with characteristics investors are | |||
| currently avoiding. The portfolio’s sector weights, size, | |||
| and style characteristics may differ modestly from the | |||
| benchmark in a risk-controlled manner. | |||
| Cash Investments | 3 | 133 | These short-term reserves are invested by Vanguard in |
| equity index products to simulate investments in | |||
| stocks. Each advisor also may maintain a modest cash | |||
| position. | |||
8
Vanguard Quantitative Equity Group
Portfolio Managers:
James D. Troyer, CFA, Principal
James P. Stetler, Principal
Michael R. Roach, CFA
For the fiscal year ended September 30, 2015, performance in U.S. equities was slightly negative. The broad U.S. equity market as measured by the Russell 3000 Index returned –0.49%. The Russell 1000 Index of large-capitalization stocks was down 0.61%, while the Russell 2000 Index of small-cap stocks was up 1.25%. Growth-oriented equities, as measured by the Russell 3000 Growth Index, returned 3.21%, while value-oriented equities, as measured by the Russell 3000 Value Index, returned –4.22%.
Globally, the U.S. equity market outperformed as countries outside the United States, as measured by the MSCI EAFE Index, were down 8.66%. Emerging markets, which returned –19.28% as measured by the MSCI Emerging Markets Index, were a large contributor to this underperformance as they continued to lag. Performance within the benchmark was mixed as five of the ten sectors posted negative returns. Results were best in consumer discretionary, consumer staples, and health care. Energy, materials, and industrial stocks were all negative for the fiscal year.
After six straight years of positive performance, the U.S. stock market declined slightly for the period. The Federal Reserve held off on raising interest rates until it sees further progress toward its employment and inflation targets. Real GDP in the second quarter increased at an annual rate of 3.9%, compared with a 0.6% increase in the first quarter. The second-quarter increase reflected contributions from exports, acceleration in personal consumption expenditures, and an increase in state and local government spending. The unemployment rate has continued to decline over the past year. U.S. nonfarm payroll employment rose by 142,000 in September, and the unemployment rate fell to 5.1% from 5.9% a year ago.
The economic slowdown overseas, especially in emerging markets, continued to contribute to the recent volatility. Emerging-market currencies have lost value against the U.S. dollar. The possibility that the Fed might raise interest rates by the end of 2015 is pushing the dollar up and driving capital outflows from these countries. Many emerging economies also have been affected by weak commodity prices that have contributed to lower export growth. China’s continuing slowdown still represents significant downside risk to overall emerging-market performance.
It’s important to understand how portfolio performance is affected by the macroeconomic factors listed above, but it is
9
also important to focus on our approach, which emphasizes specific stock fundamentals. We compare stocks in the same industry groups to identify those with characteristics that will help them outperform in the long term. Our strict quantitative process concentrates on a combination of valuation and other factors focused on fundamental growth. We use the results of our model to construct our portfolio, with the goal of maximizing expected return and minimizing exposure to risks that our research indicates do not improve returns, such as market capitalization and other risks relative to our benchmark.
The model’s effectiveness across sectors was promising; we were able to produce positive stock selection results in seven of the ten sectors over the period. Our strongest results were in consumer discretionary, energy, and information technology. We underperformed in financials, telecommunication services, and utilities.
At the individual stock level, the largest contributions came from overweight positions in Cablevision Systems, O’Reilly Automotive, and Expedia. In addition, when comparing the portfolio’s performance with its benchmark’s, we benefited from underweighting or avoiding poorly performing stocks such as 21st Century Fox and Viacom.
Unfortunately, we were not able to avoid all bad performers. Overweight positions in Navient, Legg Mason, and Discover Financial Services directly lowered performance. Also, underweighting companies that were not positively identified by the fundamentals in our model, such as Citigroup and Public Storage, hurt our overall outperformance relative to the benchmark.
D. E. Shaw Investment
Management, L.L.C.
Portfolio Managers:
Anne Dinning, Ph.D., Managing Director
and Chief Investment Officer
Philip Kearns, Ph.D., Managing Director
During the reporting period, global equity markets appeared to be particularly sensitive to developments in China’s stock and currency markets. In August, the Chinese central bank devalued the yuan, resulting in a 3.5% depreciation of China’s currency against the U.S. dollar. In the next two weeks, the Shanghai Stock Exchange Composite Index dropped more than 20%; equity markets around the world also fell significantly. Although the roughly 40% fall in mainland Chinese equities from their June peak through August garnered much attention, Chinese stocks returned more than 30% during the reporting period, highlighting that market’s considerable volatility.
10
Earlier in the fiscal year, the price of crude oil tumbled, losing half its value between October and January. Although there was a brief recovery in prices during the second quarter of 2015, oil finished the reporting period down about 50%. The decline in oil prices contributed to low U.S. consumer inflation, which may help explain why the Federal Reserve has maintained its near-zero interest rate policy.
Although we actively monitor such market activity, we generally do not make portfolio decisions based on a subjective analysis of the investment environment, except for attempting to identify and mitigate new risk factors. There were no such occurrences during the period.
Our quantitative equity investment process deploys models that seek to forecast individual stock returns as it works to mitigate active exposures to industries, sectors, and common risk factors. However, in constructing our equity portfolios from the bottom up, our process may result in small to moderate exposures to certain industries, sectors, and risk factors. Therefore, we generally attribute our portfolio performance to three major sources: bottom-up stock selection; exposure to risk factors such as value, growth, and market capitalization; and exposure to industry groups.
Based on our analysis, our portfolio’s outperformance during the reporting period was driven mostly by certain risk factors, with stock selection a close second. Among fundamental risk factors, the three largest contributors to relative performance were underweight exposures to high-dividend-yield stocks, stocks with low price/book ratios, and large-capitalization stocks.
Several technical risk factors also had an impact: Overweight exposure to stocks with low trading volume contributed to relative performance, while overweight exposure to high-volatility stocks detracted.
The three largest single-stock contributions came from overweight positions in Constellation Brands and Amazon.com (which shifted from under-to overweight) and an underweight position in ConocoPhillips. The three largest single-stock detractors were overweight positions in Micron Technology, Netflix, and Anadarko Petroleum.
We believe that China’s continuing economic weakness, falling oil prices, and uncertainty about the timing of a Fed rate hike are significant risks in the current market and could contribute to ongoing equity market volatility.
11
Los Angeles Capital
Portfolio Managers:
Thomas D. Stevens, CFA,
Chairman and Principal
Hal W. Reynolds, CFA,
Chief Investment Officer and Principal
The S&P 500 Index was down 0.61% for the fiscal year, with losses especially significant in the commodity-linked energy and materials sectors. Despite two consecutive quarters of declining earnings, U.S. economic activity remains strong relative to the global economy. With 70% of their revenues derived from U.S. sales, large-capitalization companies in the United States represent a haven for global equity investors. Even after the August volatility spike, when the VIX index climbed to its highest level since the peak of the European financial crisis in 2011, the forward-looking price/earnings ratio for the S&P 500 Index was around 15, above its ten-year historical average of 14.1.
An analysis of equity factors over the past year shows that higher-quality stocks with strong analyst estimates and some exposure to leverage outperformed, while globally integrated stocks with large foreign revenues underperformed given the relative strength of the U.S. economy and the U.S. dollar. Amid global economic concerns, investors continue to favor higher-quality securities with sustainable growth over securities with risky balance sheets. Growth assets were stronger than value assets as investors penalized distressed companies with high price/book valuations.
Growth-oriented sectors generally outperformed, led by retail, health care, and consumer discretionary. Energy and materials were the weakest as prices continued to fall on expanded supply and reduced demand from China and other economies. The S&P GSCI Index, which tracks commodity prices, ended down 42% for the fiscal year.
Over the 12-month period, our portfolio shifted out of energy and technology and into retail and financials. The portfolio decreased its exposure to value factors in favor of companies with above-average earnings growth expectations. It is positioned away from companies with large foreign revenues, given the appreciation of the dollar and declining growth expectations for foreign economies. In addition, the portfolio increased its quality positioning and is tilted toward stocks with low volatility and high earnings quality.
12
Growth and Income Fund
Fund Profile
As of September 30, 2015
| Share-Class Characteristics | ||
| Investor | Admiral | |
| Shares | Shares | |
| Ticker Symbol | VQNPX | VGIAX |
| Expense Ratio1 | 0.37% | 0.26% |
| 30-Day SEC Yield | 1.86% | 1.97% |
| Portfolio Characteristics | |||
| DJ | |||
| U.S. | |||
| Total | |||
| Market | |||
| S&P 500 | FA | ||
| Fund | Index | Index | |
| Number of Stocks | 780 | 505 | 4,000 |
| Median Market Cap | $50.2B | $75.8B | $46.5B |
| Price/Earnings Ratio | 19.2x | 18.9x | 20.2x |
| Price/Book Ratio | 2.7x | 2.6x | 2.5x |
| Return on Equity | 18.0% | 18.2% | 17.2% |
| Earnings Growth | |||
| Rate | 10.4% | 9.8% | 10.1% |
| Dividend Yield | 2.2% | 2.3% | 2.1% |
| Foreign Holdings | 0.2% | 0.0% | 0.0% |
| Turnover Rate | 116% | — | — |
| Short-Term Reserves | 0.4% | — | — |
| Volatility Measures | ||
| DJ | ||
| U.S. Total | ||
| S&P 500 | Market | |
| Index | FA Index | |
| R-Squared | 0.99 | 0.98 |
| Beta | 0.98 | 0.95 |
| These measures show the degree and timing of the fund’s | ||
| fluctuations compared with the indexes over 36 months. | ||
| Ten Largest Holdings (% of total net assets) | ||
| Apple Inc. | Technology | |
| Hardware, Storage & | ||
| Peripherals | 3.3% | |
| Exxon Mobil Corp. | Integrated Oil & Gas | 1.6 |
| Johnson & Johnson | Pharmaceuticals | 1.6 |
| JPMorgan Chase & Co. | Diversified Banks | 1.5 |
| Google Inc. | Internet Software & | |
| Services | 1.4 | |
| Wells Fargo & Co. | Diversified Banks | 1.3 |
| Microsoft Corp. | Systems Software | 1.3 |
| Gilead Sciences Inc. | Biotechnology | 1.1 |
| AT&T Inc. | Integrated | |
| Telecommunication | ||
| Services | 1.1 | |
| Pfizer Inc. | Pharmaceuticals | 1.1 |
| Top Ten | 15.3% | |
| The holdings listed exclude any temporary cash investments and equity index products. | ||
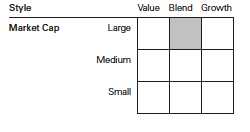
Investment Focus
1 The expense ratios shown are from the prospectus dated January 26, 2015, and represent estimated costs for the current fiscal year. For the fiscal
year ended September 30, 2015, the expense ratios were 0.34% for Investor Shares and 0.23% for Admiral Shares.
13
Growth and Income Fund
| Sector Diversification (% of equity exposure) | |||
| DJ | |||
| U.S. Total | |||
| S&P 500 | Market | ||
| Fund | Index FA Index | ||
| Consumer | |||
| Discretionary | 13.9% | 13.1% | 13.7% |
| Consumer Staples | 10.9 | 9.9 | 8.7 |
| Energy | 5.9 | 6.9 | 6.3 |
| Financials | 15.8 | 16.5 | 18.3 |
| Health Care | 15.7 | 14.7 | 14.4 |
| Industrials | 11.2 | 10.1 | 10.6 |
| Information | |||
| Technology | 17.8 | 20.4 | 19.6 |
| Materials | 3.8 | 2.8 | 3.1 |
| Telecommunication | |||
| Services | 2.3 | 2.4 | 2.1 |
| Utilities | 2.7 | 3.2 | 3.2 |
14
Growth and Income Fund
Performance Summary
All of the returns in this report represent past performance, which is not a guarantee of future results that may be achieved by the fund. (Current performance may be lower or higher than the performance data cited. For performance data current to the most recent month-end, visit our website at vanguard.com/performance.) Note, too, that both investment returns and principal value can fluctuate widely, so an investor’s shares, when sold, could be worth more or less than their original cost. The returns shown do not reflect taxes that a shareholder would pay on fund distributions or on the sale of fund shares.
Cumulative Performance: September 30, 2005, Through September 30, 2015
Initial Investment of $10,000

| Average Annual Total Returns | |||||
| Periods Ended September 30, 2015 | |||||
| Final Value | |||||
| One | Five | Ten | of a $10,000 | ||
| Year | Years | Years | Investment | ||
| Growth and Income Fund*Investor | |||||
| Shares | 0.22% | 13.91% | 6.16% | $18,188 | |
| •••••••• | S&P 500 Index | -0.61 | 13.34 | 6.80 | 19,305 |
| – – – – | Dow Large-Cap Jones Core U.S. Funds Total Stock Average Market | -2.30 | 11.57 | 5.52 | 17,120 |
| Float Adjusted Index | -0.55 | 13.26 | 7.06 | 19,778 | |
| Large-Cap Core Funds Average: Derived from data provided by Lipper, a Thomson Reuters Company. | |||||
| Final Value | ||||
| One | Five | Ten | of a $50,000 | |
| Year | Years | Years | Investment | |
| Growth and Income Fund Admiral Shares | 0.31% | 14.03% | 6.30% | $92,089 |
| S&P 500 Index | -0.61 | 13.34 | 6.80 | 96,526 |
| Dow Jones U.S. Total Stock Market Float | ||||
| Adjusted Index | -0.55 | 13.26 | 7.06 | 98,892 |
See Financial Highlights for dividend and capital gains information.
15
Growth and Income Fund
Fiscal-Year Total Returns (%): September 30, 2005, Through September 30, 2015
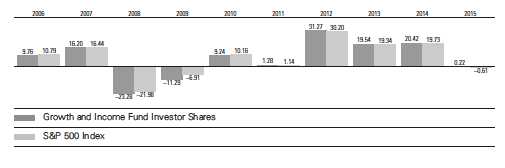
16
Growth and Income Fund
Financial Statements
Statement of Net Assets
As of September 30, 2015
The fund reports a complete list of its holdings in regulatory filings four times in each fiscal year, at the quarter-ends. For the second and fourth fiscal quarters, the lists appear in the fund’s semiannual and annual reports to shareholders. For the first and third fiscal quarters, the fund files the lists with the Securities and Exchange Commission on Form N-Q. Shareholders can look up the fund’s Forms N-Q on the SEC’s website at sec.gov. Forms N-Q may also be reviewed and copied at the SEC’s Public Reference Room (see the back cover of this report for further information).
| Market | |||
| Value | |||
| Shares | ($000) | ||
| Common Stocks (97.4%)1 | |||
| Consumer Discretionary (13.5%) | |||
| Home Depot Inc. | 531,208 | 61,349 | |
| Walt Disney Co. | 595,075 | 60,817 | |
| * | Amazon.com Inc. | 115,192 | 58,966 |
| Comcast Corp. Class A | 975,100 | 55,464 | |
| Lowe’s Cos. Inc. | 703,243 | 48,467 | |
| NIKE Inc. Class B | 382,700 | 47,061 | |
| Target Corp. | 387,630 | 30,491 | |
| Darden Restaurants Inc. | 334,223 | 22,908 | |
| * | O’Reilly Automotive Inc. | 88,560 | 22,140 |
| Time Warner Inc. | 271,915 | 18,694 | |
| Time Warner Cable Inc. | 103,866 | 18,630 | |
| Expedia Inc. | 157,697 | 18,558 | |
| Wyndham | |||
| Worldwide Corp. | 256,150 | 18,417 | |
| L Brands Inc. | 198,180 | 17,862 | |
| Leggett & Platt Inc. | 430,240 | 17,747 | |
| Interpublic Group | |||
| of Cos. Inc. | 783,645 | 14,991 | |
| Delphi Automotive plc | 188,750 | 14,353 | |
| Goodyear Tire | |||
| & Rubber Co. | 472,520 | 13,859 | |
| * | Priceline Group Inc. | 10,900 | 13,482 |
| Carnival Corp. | 258,500 | 12,847 | |
| McDonald’s Corp. | 126,620 | 12,476 | |
| * | Netflix Inc. | 111,650 | 11,529 |
| Marriott International Inc. | |||
| Class A | 161,100 | 10,987 | |
| General Motors Co. | 352,750 | 10,590 | |
| Hasbro Inc. | 140,027 | 10,102 | |
| TJX Cos. Inc. | 129,120 | 9,222 | |
| * | AutoZone Inc. | 12,018 | 8,699 |
| Best Buy Co. Inc. | 232,970 | 8,648 | |
| Johnson Controls Inc. | 183,998 | 7,610 | |
| Genuine Parts Co. | 90,345 | 7,489 | |
| Ross Stores Inc. | 146,025 | 7,078 | |
| VF Corp. | 96,640 | 6,592 | |
| Kohl’s Corp. | 123,270 | 5,709 | |
| Omnicom Group Inc. | 82,513 | 5,438 | |
| Newell Rubbermaid Inc. | 114,880 | 4,562 | |
| Signet Jewelers Ltd. | 32,600 | 4,438 | |
| * | Bed Bath & Beyond Inc. | 73,490 | 4,190 |
| * | Liberty Global plc | 100,850 | 4,137 |
| Gap Inc. | 142,366 | 4,057 | |
| * | AutoNation Inc. | 68,060 | 3,960 |
| Tractor Supply Co. | 43,780 | 3,691 | |
| * | Ulta Salon Cosmetics | ||
| & Fragrance Inc. | 19,600 | 3,202 | |
| * | CarMax Inc. | 53,420 | 3,169 |
| Staples Inc. | 252,402 | 2,961 | |
| Ford Motor Co. | 214,310 | 2,908 | |
| PVH Corp. | 28,400 | 2,895 | |
| * | NVR Inc. | 1,850 | 2,822 |
| Nordstrom Inc. | 38,890 | 2,789 | |
| Starbucks Corp. | 48,980 | 2,784 | |
| Whirlpool Corp. | 17,755 | 2,615 | |
| TEGNA Inc. | 108,430 | 2,428 | |
| Macy’s Inc. | 46,301 | 2,376 | |
| CBS Corp. Class B | 55,640 | 2,220 | |
| Advance Auto Parts Inc. | 10,700 | 2,028 | |
| Coach Inc. | 68,400 | 1,979 | |
| ^ | GameStop Corp. Class A | 46,400 | 1,912 |
| * | Mohawk Industries Inc. | 10,430 | 1,896 |
| * | Sally Beauty Holdings Inc. | 74,200 | 1,762 |
| Graham Holdings Co. | |||
| Class B | 2,842 | 1,640 | |
| * | Liberty Ventures Class A | 27,700 | 1,118 |
| * | Cable One Inc. | 2,655 | 1,114 |
| Hilton Worldwide | |||
| Holdings Inc. | 47,600 | 1,092 | |
| Royal Caribbean Cruises Ltd. | 9,714 | 865 | |
| Gannett Co. Inc. | 54,215 | 799 | |
| * | Fossil Group Inc. | 12,600 | 704 |
| Dollar General Corp. | 7,830 | 567 | |
| * | Michaels Cos. Inc. | 21,700 | 501 |
| Hanesbrands Inc. | 14,900 | 431 | |
| Time Inc. | 18,721 | 357 | |
| * | Liberty Media Corp. | 9,700 | 334 |
17
Growth and Income Fund
| Market | |||
| Value | |||
| Shares | ($000) | ||
| Gentex Corp. | 21,500 | 333 | |
| * | DISH Network Corp. Class A | 5,400 | 315 |
| DR Horton Inc. | 9,900 | 291 | |
| ^ | Restaurant Brands | ||
| International Inc. | 5,600 | 201 | |
| PulteGroup Inc. | 8,650 | 163 | |
| * | Houghton Mifflin | ||
| Harcourt Co. | 7,613 | 155 | |
| * | Liberty Broadband Corp. | 3,000 | 153 |
| ^,* | Sears Holdings Corp. | 5,900 | 133 |
| * | Vista Outdoor Inc. | 2,700 | 120 |
| * | Liberty Interactive Corp. | ||
| QVC Group Class A | 4,200 | 110 | |
| * | Liberty Global PLC LiLAC | 3,200 | 110 |
| SeaWorld Entertainment Inc. | 6,100 | 109 | |
| BorgWarner Inc. | 2,434 | 101 | |
| Libbey Inc. | 3,100 | 101 | |
| Churchill Downs Inc. | 682 | 91 | |
| Bloomin’ Brands Inc. | 4,700 | 85 | |
| International Game | |||
| Technology plc | 5,500 | 84 | |
| * | Murphy USA Inc. | 1,500 | 82 |
| * | Liberty TripAdvisor | ||
| Holdings Inc. Class A | 3,700 | 82 | |
| * | Mattress Firm Holding Corp. | 1,800 | 75 |
| Aramark | 2,400 | 71 | |
| * | Denny’s Corp. | 4,506 | 50 |
| Rent-A-Center Inc. | 2,000 | 48 | |
| * | New York & Co. Inc. | 19,273 | 48 |
| DineEquity Inc. | 500 | 46 | |
| HSN Inc. | 800 | 46 | |
| * | Lee Enterprises Inc. | 20,312 | 42 |
| Marriott Vacations | |||
| Worldwide Corp. | 619 | 42 | |
| * | Townsquare Media Inc. | ||
| Class A | 4,102 | 40 | |
| * | MakeMyTrip Ltd. | 2,800 | 38 |
| Journal Media Group Inc. | 4,200 | 31 | |
| CST Brands Inc. | 700 | 24 | |
| * | ServiceMaster Global | ||
| Holdings Inc. | 600 | 20 | |
| * | Regis Corp. | 1,493 | 20 |
| La-Z-Boy Inc. | 700 | 19 | |
| * | Vince Holding Corp. | 5,400 | 18 |
| * | Isle of Capri Casinos Inc. | 1,000 | 17 |
| * | Liberty Broadband Corp. | ||
| Class A | 300 | 15 | |
| Haverty Furniture Cos. Inc. | 600 | 14 | |
| DeVry Education Group Inc. | 500 | 14 | |
| * | Biglari Holdings Inc. | 34 | 12 |
| Nutrisystem Inc. | 435 | 11 | |
| Aaron’s Inc. | 300 | 11 | |
| * | Tumi Holdings Inc. | 600 | 11 |
| * | TopBuild Corp. | 300 | 9 |
| * | Nautilus Inc. | 600 | 9 |
| Big 5 Sporting Goods Corp. | 799 | 8 | |
| * | J Alexander’s Holdings Inc. | 725 | 7 |
| * | Nord Anglia Education Inc. | 339 | 7 |
| * | Dollar Tree Inc. | 100 | 7 |
| * | Sirius XM Holdings Inc. | 1,600 | 6 |
| * | Clear Channel Outdoor | ||
| Holdings Inc. Class A | 509 | 4 | |
| Universal Technical | |||
| Institute Inc. | 500 | 2 | |
| 794,236 | |||
| Consumer Staples (10.7%) | |||
| Procter & Gamble Co. | 873,950 | 62,872 | |
| Coca-Cola Co. | 1,334,242 | 53,530 | |
| Altria Group Inc. | 911,048 | 49,561 | |
| PepsiCo Inc. | 507,296 | 47,838 | |
| CVS Health Corp. | 457,050 | 44,096 | |
| Costco Wholesale Corp. | 257,396 | 37,212 | |
| Kroger Co. | 991,503 | 35,763 | |
| Wal-Mart Stores Inc. | 495,849 | 32,151 | |
| Constellation Brands Inc. | |||
| Class A | 235,367 | 29,470 | |
| Dr Pepper Snapple | |||
| Group Inc. | 347,920 | 27,503 | |
| Reynolds American Inc. | 529,360 | 23,435 | |
| Clorox Co. | 197,837 | 22,856 | |
| Mondelez International Inc. | |||
| Class A | 431,120 | 18,051 | |
| Archer-Daniels-Midland Co. | 430,730 | 17,854 | |
| Campbell Soup Co. | 324,800 | 16,461 | |
| ConAgra Foods Inc. | 377,130 | 15,278 | |
| Colgate-Palmolive Co. | 190,890 | 12,114 | |
| Walgreens Boots | |||
| Alliance Inc. | 134,300 | 11,160 | |
| Philip Morris | |||
| International Inc. | 125,714 | 9,973 | |
| General Mills Inc. | 168,320 | 9,448 | |
| Kellogg Co. | 127,910 | 8,512 | |
| Hormel Foods Corp. | 115,365 | 7,304 | |
| Kraft Heinz Co. | 100,900 | 7,122 | |
| Tyson Foods Inc. Class A | 143,876 | 6,201 | |
| Kimberly-Clark Corp. | 56,701 | 6,183 | |
| Hershey Co. | 53,255 | 4,893 | |
| Estee Lauder Cos. Inc. | |||
| Class A | 32,800 | 2,646 | |
| Coca-Cola Enterprises Inc. | 44,300 | 2,142 | |
| JM Smucker Co. | 18,049 | 2,059 | |
| Sysco Corp. | 51,938 | 2,024 | |
| Bunge Ltd. | 17,100 | 1,253 | |
| ^ | Pilgrim’s Pride Corp. | 40,800 | 848 |
| Whole Foods Market Inc. | 6,838 | 216 | |
| McCormick & Co. Inc. | 1,390 | 114 | |
| Brown-Forman Corp. | |||
| Class B | 800 | 77 | |
| * | Adecoagro SA | 6,100 | 49 |
18
Growth and Income Fund
| Market | ||||
| Value | ||||
| Shares | ($000) | |||
| Spectrum Brands | ||||
| Holdings Inc. | 500 | 46 | ||
| * | Rite Aid Corp. | 4,500 | 27 | |
| Cott Corp. | 1,300 | 14 | ||
| 628,356 | ||||
| Energy (5.6%) | ||||
| Exxon Mobil Corp. | 1,294,784 | 96,267 | ||
| Schlumberger Ltd. | 609,750 | 42,054 | ||
| Tesoro Corp. | 304,290 | 29,589 | ||
| Valero Energy Corp. | 410,180 | 24,652 | ||
| Marathon Petroleum Corp. | 471,630 | 21,851 | ||
| Phillips 66 | 192,040 | 14,756 | ||
| Chevron Corp. | 154,526 | 12,189 | ||
| * | FMC Technologies Inc. | 324,500 | 10,060 | |
| ^ | Transocean Ltd. | 732,700 | 9,466 | |
| EOG Resources Inc. | 129,000 | 9,391 | ||
| Ensco plc Class A | 661,600 | 9,315 | ||
| Anadarko Petroleum Corp. | 145,500 | 8,787 | ||
| Noble Corp. plc | 774,400 | 8,449 | ||
| Occidental Petroleum Corp. | 114,400 | 7,568 | ||
| Williams Cos. Inc. | 203,600 | 7,503 | ||
| Kinder Morgan Inc. | 243,300 | 6,735 | ||
| Devon Energy Corp. | 102,600 | 3,805 | ||
| * | Cameron International Corp. | 41,500 | 2,545 | |
| Columbia Pipeline | ||||
| Group Inc. | 81,200 | 1,485 | ||
| Murphy Oil Corp. | 58,900 | 1,425 | ||
| Cimarex Energy Co. | 8,200 | 840 | ||
| ^ | Cameco Corp. | 45,600 | 555 | |
| EnLink Midstream LLC | 22,467 | 411 | ||
| * | Cheniere Energy Inc. | 8,300 | 401 | |
| Cabot Oil & Gas Corp. | 16,100 | 352 | ||
| Plains GP Holdings LP | ||||
| Class A | 19,600 | 343 | ||
| Euronav NV | 12,700 | 177 | ||
| * | Harvest Natural | |||
| Resources Inc. | 82,231 | 114 | ||
| US Silica Holdings Inc. | 7,600 | 107 | ||
| * | Southwestern Energy Co. | 6,800 | 86 | |
| Frank’s International NV | 4,900 | 75 | ||
| Teekay Corp. | 2,400 | 71 | ||
| * | Memorial Resource | |||
| Development Corp. | 3,400 | 60 | ||
| * | Kosmos Energy Ltd. | 7,900 | 44 | |
| SemGroup Corp. Class A | 1,000 | 43 | ||
| * | TransAtlantic Petroleum Ltd. | 8,887 | 23 | |
| * | Fairmount Santrol | |||
| Holdings Inc. | 8,200 | 22 | ||
| Aegean Marine Petroleum | ||||
| Network Inc. | 3,260 | 22 | ||
| California Resources Corp. | 6,619 | 17 | ||
| * | Pacific Drilling SA | 12,700 | 16 | |
| World Fuel Services Corp. | 400 | 14 | ||
| Noble Energy Inc. | 459 | 14 | ||
| * | Westmoreland Coal Co. | 400 | 6 | |
| * | Unit Corp. | 500 | 6 |
| * | Willbros Group Inc. | 2,547 | 3 |
| * | Triangle Petroleum Corp. | 1,749 | 2 |
| * | PetroQuest Energy Inc. | 2,100 | 2 |
| * | Swift Energy Co. | 4,543 | 2 |
| 331,720 | |||
| Financials (15.4%) | |||
| JPMorgan Chase & Co. | 1,429,808 | 87,175 | |
| Wells Fargo & Co. | 1,507,116 | 77,390 | |
| Citigroup Inc. | 1,168,124 | 57,951 | |
| Bank of America Corp. | 2,577,380 | 40,156 | |
| * | Berkshire Hathaway Inc. | ||
| Class B | 298,252 | 38,892 | |
| Hartford Financial | |||
| Services Group Inc. | 758,205 | 34,711 | |
| Bank of New York | |||
| Mellon Corp. | 787,135 | 30,816 | |
| Travelers Cos. Inc. | 268,822 | 26,756 | |
| Morgan Stanley | 755,450 | 23,797 | |
| Assurant Inc. | 265,486 | 20,976 | |
| Cincinnati Financial Corp. | 329,890 | 17,748 | |
| Simon Property Group Inc. | 94,587 | 17,378 | |
| Progressive Corp. | 566,634 | 17,362 | |
| Weyerhaeuser Co. | 602,335 | 16,468 | |
| Prudential Financial Inc. | 215,961 | 16,458 | |
| Northern Trust Corp. | 239,780 | 16,343 | |
| Huntington | |||
| Bancshares Inc. | 1,509,277 | 15,998 | |
| Legg Mason Inc. | 380,876 | 15,848 | |
| McGraw Hill Financial Inc. | 179,046 | 15,487 | |
| Moody’s Corp. | 155,580 | 15,278 | |
| Aon plc | 168,260 | 14,910 | |
| American Express Co. | 189,030 | 14,013 | |
| Crown Castle | |||
| International Corp. | 171,650 | 13,538 | |
| Nasdaq Inc. | 242,560 | 12,936 | |
| PNC Financial Services | |||
| Group Inc. | 138,100 | 12,319 | |
| People’s United | |||
| Financial Inc. | 769,502 | 12,104 | |
| Prologis Inc. | 289,300 | 11,254 | |
| * | E*TRADE Financial Corp. | 418,700 | 11,024 |
| SunTrust Banks Inc. | 287,260 | 10,985 | |
| ACE Ltd. | 105,330 | 10,891 | |
| Plum Creek Timber Co. Inc. 267,862 | 10,583 | ||
| Ameriprise Financial Inc. | 95,364 | 10,407 | |
| Allstate Corp. | 177,268 | 10,324 | |
| Navient Corp. | 897,100 | 10,083 | |
| Goldman Sachs Group Inc. | 50,734 | 8,816 | |
| Capital One Financial Corp. | 120,400 | 8,731 | |
| AvalonBay | |||
| Communities Inc. | 49,185 | 8,599 | |
| Equinix Inc. | 30,700 | 8,393 | |
| CME Group Inc. | 88,700 | 8,226 | |
| BlackRock Inc. | 26,280 | 7,818 | |
19
Growth and Income Fund
| Market | |||
| Value | |||
| Shares | ($000) | ||
| Marsh & McLennan | |||
| Cos. Inc. | 131,681 | 6,876 | |
| Welltower Inc. | 101,200 | 6,853 | |
| General Growth | |||
| Properties Inc. | 244,020 | 6,337 | |
| Intercontinental | |||
| Exchange Inc. | 26,400 | 6,204 | |
| Lincoln National Corp. | 102,010 | 4,841 | |
| US Bancorp | 91,594 | 3,756 | |
| First Horizon National Corp. | 252,670 | 3,583 | |
| Public Storage | 15,797 | 3,343 | |
| Equity LifeStyle | |||
| Properties Inc. | 54,400 | 3,186 | |
| * | CBRE Group Inc. Class A | 96,971 | 3,103 |
| Voya Financial Inc. | 79,200 | 3,071 | |
| Principal Financial | |||
| Group Inc. | 64,730 | 3,064 | |
| * | Realogy Holdings Corp. | 55,800 | 2,100 |
| Torchmark Corp. | 35,720 | 2,015 | |
| Franklin Resources Inc. | 51,700 | 1,926 | |
| Apartment Investment | |||
| & Management Co. | 45,320 | 1,678 | |
| Equity Residential | 21,290 | 1,599 | |
| American International | |||
| Group Inc. | 24,650 | 1,401 | |
| Charles Schwab Corp. | 45,467 | 1,299 | |
| Essex Property Trust Inc. | 5,800 | 1,296 | |
| * | Affiliated Managers | ||
| Group Inc. | 7,500 | 1,282 | |
| Vornado Realty Trust | 12,063 | 1,091 | |
| XL Group plc Class A | 28,540 | 1,037 | |
| Fifth Third Bancorp | 54,710 | 1,035 | |
| Kimco Realty Corp. | 40,000 | 977 | |
| * | Signature Bank | 7,000 | 963 |
| UBS Group AG | 49,170 | 911 | |
| BankUnited Inc. | 22,400 | 801 | |
| Comerica Inc. | 17,592 | 723 | |
| * | Genworth Financial Inc. | ||
| Class A | 153,100 | 707 | |
| Synovus Financial Corp. | 21,800 | 645 | |
| Realty Income Corp. | 11,490 | 545 | |
| Invesco Ltd. | 14,426 | 451 | |
| * | MGIC Investment Corp. | 47,800 | 443 |
| Ventas Inc. | 7,130 | 400 | |
| KeyCorp | 30,430 | 396 | |
| First Republic Bank | 5,900 | 370 | |
| East West Bancorp Inc. | 9,579 | 368 | |
| United Bankshares Inc. | 8,800 | 334 | |
| * | Forest City Enterprises Inc. | ||
| Class A | 15,300 | 308 | |
| Discover Financial Services | 5,488 | 285 | |
| Credicorp Ltd. | 2,400 | 255 | |
| FNF Group | 7,100 | 252 | |
| Investors Bancorp Inc. | 19,600 | 242 | |
| * | Beneficial Bancorp Inc. | 16,200 | 215 |
| Blackstone Mortgage | |||
| Trust Inc. Class A | 7,200 | 198 | |
| TD Ameritrade Holding Corp. | 6,000 | 191 | |
| National Health Investors Inc. | 3,300 | 190 | |
| Host Hotels & Resorts Inc. | 11,888 | 188 | |
| Brown & Brown Inc. | 5,600 | 173 | |
| * | Santander Consumer | ||
| USA Holdings Inc. | 6,271 | 128 | |
| M&T Bank Corp. | 1,000 | 122 | |
| Raymond James | |||
| Financial Inc. | 2,400 | 119 | |
| Ryman Hospitality | |||
| Properties Inc. | 2,400 | 118 | |
| State Street Corp. | 1,580 | 106 | |
| Retail Properties | |||
| of America Inc. | 6,620 | 93 | |
| Brookline Bancorp Inc. | 9,100 | 92 | |
| * | Flagstar Bancorp Inc. | 4,300 | 88 |
| Columbia Banking | |||
| System Inc. | 2,800 | 87 | |
| * | Essent Group Ltd. | 3,400 | 85 |
| * | Springleaf Holdings Inc. | ||
| Class A | 1,900 | 83 | |
| Old National Bancorp | 5,900 | 82 | |
| Assured Guaranty Ltd. | 3,000 | 75 | |
| Erie Indemnity Co. Class A | 900 | 75 | |
| Ladder Capital Corp. | 4,900 | 70 | |
| BancorpSouth Inc. | 2,900 | 69 | |
| Validus Holdings Ltd. | 1,374 | 62 | |
| Old Republic | |||
| International Corp. | 3,799 | 59 | |
| Wilshire Bancorp Inc. | 5,500 | 58 | |
| MVC Capital Inc. | 6,700 | 55 | |
| * | FNFV Group | 4,200 | 49 |
| * | Western Alliance Bancorp | 1,600 | 49 |
| Leucadia National Corp. | 2,400 | 49 | |
| * | NewStar Financial Inc. | 5,604 | 46 |
| Meridian Bancorp Inc. | 3,100 | 42 | |
| * | Credit Acceptance Corp. | 200 | 39 |
| Reinsurance Group of | |||
| America Inc. Class A | 428 | 39 | |
| Cathay General Bancorp | 1,200 | 36 | |
| AG Mortgage Investment | |||
| Trust Inc. | 2,159 | 33 | |
| * | Third Point Reinsurance Ltd. | 2,400 | 32 |
| Apple Hospitality REIT Inc. | 1,700 | 32 | |
| Sterling Bancorp | 1,900 | 28 | |
| Armada Hoffler Properties Inc. | 2,800 | 27 | |
| Southwest Bancorp Inc. | 1,600 | 26 | |
| Aflac Inc. | 447 | 26 | |
| Columbia Property Trust Inc. | 1,100 | 26 | |
| * | Stifel Financial Corp. | 600 | 25 |
| Fulton Financial Corp. | 2,000 | 24 | |
| * | PHH Corp. | 1,700 | 24 |
| First Commonwealth | |||
| Financial Corp. | 2,546 | 23 |
20
Growth and Income Fund
| Market | ||||
| Value | ||||
| Shares | ($000) | |||
| Banner Corp. | 466 | 22 | ||
| * | Arch Capital Group Ltd. | 300 | 22 | |
| GAIN Capital Holdings Inc. | 3,000 | 22 | ||
| Argo Group International | ||||
| Holdings Ltd. | 379 | 21 | ||
| FelCor Lodging Trust Inc. | 2,900 | 21 | ||
| HFF Inc. Class A | 600 | 20 | ||
| * | Green Dot Corp. Class A | 1,100 | 19 | |
| Allied World Assurance Co. | ||||
| Holdings AG | 500 | 19 | ||
| Brixmor Property Group Inc. | 800 | 19 | ||
| State Bank Financial Corp. | 888 | 18 | ||
| Arbor Realty Trust Inc. | 2,800 | 18 | ||
| * | Cascade Bancorp | 2,222 | 12 | |
| Citizens & Northern Corp. | 490 | 10 | ||
| * | KCG Holdings Inc. Class A | 800 | 9 | |
| Arthur J Gallagher & Co. | 200 | 8 | ||
| Alexander & Baldwin Inc. | 200 | 7 | ||
| West Bancorporation Inc. | 352 | 7 | ||
| United Community Banks Inc. | 310 | 6 | ||
| Sierra Bancorp | 386 | 6 | ||
| Lamar Advertising Co. Class A | 100 | 5 | ||
| TPG Specialty Lending Inc. | 300 | 5 | ||
| Flushing Financial Corp. | 245 | 5 | ||
| Parkway Properties Inc. | 315 | 5 | ||
| * | eHealth Inc. | 381 | 5 | |
| Primerica Inc. | 100 | 5 | ||
| Starwood Property Trust Inc. | 200 | 4 | ||
| * | SLM Corp. | 500 | 4 | |
| Physicians Realty Trust | 231 | 4 | ||
| Washington Federal Inc. | 150 | 3 | ||
| Suffolk Bancorp | 100 | 3 | ||
| FNB Corp. | 200 | 3 | ||
| Ares Commercial | ||||
| Real Estate Corp. | 172 | 2 | ||
| Chimera Investment Corp. | 100 | 1 | ||
| 905,190 | ||||
| Health Care (15.3%) | ||||
| Johnson & Johnson | 1,013,136 | 94,576 | ||
| Gilead Sciences Inc. | 676,577 | 66,433 | ||
| Pfizer Inc. | 2,112,160 | 66,343 | ||
| Merck & Co. Inc. | 1,175,476 | 58,057 | ||
| Eli Lilly & Co. | 550,255 | 46,051 | ||
| Anthem Inc. | 299,110 | 41,875 | ||
| Bristol-Myers Squibb Co. | 704,596 | 41,712 | ||
| * | Express Scripts | |||
| Holding Co. | 496,289 | 40,180 | ||
| UnitedHealth Group Inc. | 323,328 | 37,509 | ||
| Cardinal Health Inc. | 467,580 | 35,919 | ||
| Amgen Inc. | 246,280 | 34,065 | ||
| * | HCA Holdings Inc. | 374,220 | 28,950 | |
| AbbVie Inc. | 516,063 | 28,079 | ||
| AmerisourceBergen Corp. | ||||
| Class A | 235,782 | 22,397 | ||
| * | Boston Scientific Corp. | 1,333,139 | 21,877 | |
| Abbott Laboratories | 436,113 | 17,540 | |
| Aetna Inc. | 154,830 | 16,940 | |
| * | Biogen Inc. | 57,850 | 16,881 |
| McKesson Corp. | 86,100 | 15,931 | |
| Zoetis Inc. | 365,010 | 15,031 | |
| Cigna Corp. | 109,850 | 14,832 | |
| Baxalta Inc. | 381,328 | 12,016 | |
| * | Laboratory Corp. of | ||
| America Holdings | 105,920 | 11,489 | |
| Thermo Fisher | |||
| Scientific Inc. | 83,910 | 10,261 | |
| * | Regeneron | ||
| Pharmaceuticals Inc. | 20,392 | 9,485 | |
| Stryker Corp. | 94,250 | 8,869 | |
| * | DaVita HealthCare | ||
| Partners Inc. | 115,290 | 8,339 | |
| Patterson Cos. Inc. | 150,672 | 6,517 | |
| CR Bard Inc. | 30,391 | 5,662 | |
| Zimmer Biomet | |||
| Holdings Inc. | 59,952 | 5,631 | |
| Agilent Technologies Inc. | 161,100 | 5,531 | |
| * | Mylan NV | 102,800 | 4,139 |
| * | Allergan plc | 14,582 | 3,964 |
| Quest Diagnostics Inc. | 63,810 | 3,922 | |
| Becton Dickinson and Co. | 27,882 | 3,699 | |
| Humana Inc. | 18,410 | 3,295 | |
| * | Celgene Corp. | 28,600 | 3,094 |
| * | Mallinckrodt plc | 44,100 | 2,820 |
| * | Valeant Pharmaceuticals | ||
| International Inc. | 14,625 | 2,609 | |
| * | Medivation Inc. | 61,200 | 2,601 |
| Perrigo Co. plc | 14,900 | 2,343 | |
| PerkinElmer Inc. | 49,910 | 2,294 | |
| * | Intuitive Surgical Inc. | 4,564 | 2,098 |
| Medtronic plc | 26,300 | 1,761 | |
| * | Vertex Pharmaceuticals Inc. | 13,004 | 1,354 |
| Universal Health | |||
| Services Inc. Class B | 10,380 | 1,296 | |
| * | Neurocrine Biosciences Inc. | 28,300 | 1,126 |
| * | Endo International plc | 16,190 | 1,122 |
| * | VCA Inc. | 19,652 | 1,035 |
| * | United Therapeutics Corp. | 7,700 | 1,011 |
| * | Varian Medical Systems Inc. | 12,000 | 885 |
| * | Cerner Corp. | 10,330 | 619 |
| * | Dyax Corp. | 23,100 | 441 |
| * | Health Net Inc. | 6,400 | 385 |
| * | Illumina Inc. | 1,700 | 299 |
| * | Hologic Inc. | 7,200 | 282 |
| * | TESARO Inc. | 5,429 | 218 |
| * | FibroGen Inc. | 6,300 | 138 |
| * | BioMarin Pharmaceutical Inc. | 1,300 | 137 |
| * | Alere Inc. | 2,800 | 135 |
| * | Sangamo BioSciences Inc. | 21,700 | 122 |
| * | Pain Therapeutics Inc. | 66,692 | 122 |
| * | Geron Corp. | 43,200 | 119 |
| * | Rigel Pharmaceuticals Inc. | 42,894 | 106 |
21
Growth and Income Fund
| Market | |||||
| Value | |||||
| Shares | ($000) | ||||
| * | BioTelemetry Inc. | 7,500 | 92 | ||
| * | OPKO Health Inc. | 10,400 | 87 | ||
| * | IMS Health Holdings Inc. | 2,600 | 76 | ||
| * | Sirona Dental Systems Inc. | 800 | 75 | ||
| * | Waters Corp. | 620 | 73 | ||
| * | Quintiles Transnational | ||||
| Holdings Inc. | 620 | 43 | |||
| * | Merit Medical Systems Inc. | 1,800 | 43 | ||
| * | VWR Corp. | 1,600 | 41 | ||
| * | Imprivata Inc. | 2,200 | 39 | ||
| St. Jude Medical Inc. | 600 | 38 | |||
| * | Corcept Therapeutics Inc. | 8,400 | 32 | ||
| * | Omeros Corp. | 2,800 | 31 | ||
| * | Vitae Pharmaceuticals Inc. | 2,400 | 26 | ||
| * | Cardiovascular Systems Inc. | 1,632 | 26 | ||
| * | Cytokinetics Inc. | 3,500 | 23 | ||
| * | Puma Biotechnology Inc. | 300 | 23 | ||
| * | Oncothyreon Inc. | 8,056 | 22 | ||
| * | XenoPort Inc. | 5,571 | 19 | ||
| Theravance Inc. | 2,400 | 17 | |||
| * | ArQule Inc. | 8,649 | 16 | ||
| * | OvaScience Inc. | 1,800 | 15 | ||
| * | Genocea Biosciences Inc. | 1,723 | 12 | ||
| * | Myriad Genetics Inc. | 300 | 11 | ||
| * | Incyte Corp. | 100 | 11 | ||
| * | Triple-S Management Corp. | ||||
| Class B | 600 | 11 | |||
| * | Syneron Medical Ltd. | 1,400 | 10 | ||
| * | Amicus Therapeutics Inc. | 700 | 10 | ||
| * | SciClone Pharmaceuticals Inc. | 1,400 | 10 | ||
| * | Catalent Inc. | 300 | 7 | ||
| * | Pernix Therapeutics | ||||
| Holdings Inc. | 2,300 | 7 | |||
| * | Radius Health Inc. | 100 | 7 | ||
| * | Alnylam Pharmaceuticals Inc. | 76 | 6 | ||
| * | Momenta Pharmaceuticals Inc. | 269 | 4 | ||
| * | GTx Inc. | 4,487 | 3 | ||
| * | Zeltiq Aesthetics Inc. | 100 | 3 | ||
| * | Cross Country Healthcare Inc. | 200 | 3 | ||
| * | RTI Surgical Inc. | 400 | 2 | ||
| * | Catalyst Biosciences Inc. | 450 | 2 | ||
| 895,545 | |||||
| Industrials (11.0%) | |||||
| General Electric Co. | 2,103,330 | 53,046 | |||
| General Dynamics Corp. | 373,230 | 51,487 | |||
| Northrop Grumman Corp. | 222,440 | 36,914 | |||
| Boeing Co. | 280,400 | 36,718 | |||
| Lockheed Martin Corp. | 169,034 | 35,042 | |||
| Cintas Corp. | 370,884 | 31,803 | |||
| 3M Co. | 210,493 | 29,842 | |||
| Southwest Airlines Co. | 703,330 | 26,755 | |||
| FedEx Corp. | 178,150 | 25,650 | |||
| United Parcel Service Inc. | |||||
| Class B | 242,787 | 23,961 | |||
| Pitney Bowes Inc. | 833,571 | 16,546 | |||
| Honeywell International Inc. | 169,336 | 16,034 | |
| Delta Air Lines Inc. | 320,390 | 14,376 | |
| ADT Corp. | 433,856 | 12,972 | |
| Stanley Black | |||
| & Decker Inc. | 131,590 | 12,762 | |
| * | Spirit AeroSystems | ||
| Holdings Inc. Class A | 257,000 | 12,423 | |
| Republic Services Inc. | |||
| Class A | 289,629 | 11,933 | |
| PACCAR Inc. | 213,100 | 11,117 | |
| Equifax Inc. | 111,160 | 10,803 | |
| Robert Half International Inc. | 197,673 | 10,113 | |
| Rockwell Automation Inc. | 98,600 | 10,005 | |
| Union Pacific Corp. | 111,200 | 9,831 | |
| United Technologies Corp. | 106,970 | 9,519 | |
| Waste Management Inc. | 187,180 | 9,323 | |
| * | United Rentals Inc. | 144,400 | 8,671 |
| * | Stericycle Inc. | 54,320 | 7,567 |
| Raytheon Co. | 68,027 | 7,433 | |
| Snap-on Inc. | 49,000 | 7,396 | |
| Allison Transmission | |||
| Holdings Inc. | 272,700 | 7,278 | |
| Danaher Corp. | 82,400 | 7,021 | |
| Deere & Co. | 94,691 | 7,007 | |
| Expeditors International | |||
| of Washington Inc. | 137,980 | 6,492 | |
| Ingersoll-Rand plc | 125,762 | 6,385 | |
| Ryder System Inc. | 83,700 | 6,197 | |
| Allegion plc | 99,300 | 5,726 | |
| Tyco International plc | 163,800 | 5,481 | |
| * | AerCap Holdings NV | 126,500 | 4,837 |
| * | United Continental | ||
| Holdings Inc. | 89,700 | 4,759 | |
| L-3 Communications | |||
| Holdings Inc. | 42,825 | 4,476 | |
| AMETEK Inc. | 72,547 | 3,796 | |
| Dun & Bradstreet Corp. | 33,330 | 3,500 | |
| KAR Auction Services Inc. | 97,000 | 3,444 | |
| * | Nielsen Holdings plc | 63,770 | 2,836 |
| Illinois Tool Works Inc. | 25,350 | 2,087 | |
| Textron Inc. | 44,800 | 1,686 | |
| Rockwell Collins Inc. | 20,000 | 1,637 | |
| Xylem Inc. | 49,300 | 1,620 | |
| Roper Technologies Inc. | 8,400 | 1,316 | |
| Pentair plc | 16,100 | 822 | |
| * | RPX Corp. | 44,000 | 604 |
| Huntington Ingalls | |||
| Industries Inc. | 5,603 | 600 | |
| * | Verisk Analytics Inc. Class A | 6,576 | 486 |
| BWX Technologies Inc. | 18,100 | 477 | |
| Eaton Corp. plc | 6,900 | 354 | |
| Greenbrier Cos. Inc. | 8,700 | 279 | |
| * | Quanta Services Inc. | 11,500 | 278 |
| Canadian Pacific Railway Ltd. | 1,800 | 258 | |
| * | Sensata Technologies | ||
| Holding NV | 5,300 | 235 |
22
Growth and Income Fund
| Market | ||||
| Value | ||||
| Shares | ($000) | |||
| * | HD Supply Holdings Inc. | 7,900 | 226 | |
| Fluor Corp. | 4,200 | 178 | ||
| Air Lease Corp. Class A | 5,500 | 170 | ||
| * | Kirby Corp. | 2,500 | 155 | |
| West Corp. | 4,800 | 108 | ||
| * | Rexnord Corp. | 4,700 | 80 | |
| Seaspan Corp. Class A | 5,100 | 78 | ||
| Matson Inc. | 2,000 | 77 | ||
| * | Continental Building | |||
| Products Inc. | 3,700 | 76 | ||
| * | Babcock & Wilcox | |||
| Enterprises Inc. | 3,900 | 66 | ||
| * | SPX FLOW Inc. | 1,900 | 65 | |
| * | Navigant Consulting Inc. | 3,972 | 63 | |
| * | NCI Building Systems Inc. | 5,400 | 57 | |
| MFC Industrial Ltd. | 19,512 | 56 | ||
| * | ARC Document | |||
| Solutions Inc. | 8,239 | 49 | ||
| Insperity Inc. | 1,100 | 48 | ||
| * | IHS Inc. Class A | 400 | 46 | |
| * | DigitalGlobe Inc. | 2,100 | 40 | |
| Knoll Inc. | 1,400 | 31 | ||
| Cubic Corp. | 600 | 25 | ||
| * | USG Corp. | 900 | 24 | |
| Universal Forest Products Inc. | 374 | 22 | ||
| * | WABCO Holdings Inc. | 200 | 21 | |
| John Bean Technologies Corp. | 500 | 19 | ||
| * | TransUnion | 600 | 15 | |
| SPX Corp. | 1,255 | 15 | ||
| Curtiss-Wright Corp. | 172 | 11 | ||
| Hillenbrand Inc. | 400 | 10 | ||
| H&E Equipment Services Inc. | 500 | 8 | ||
| Alaska Air Group Inc. | 100 | 8 | ||
| Heartland Express Inc. | 300 | 6 | ||
| * | CAI International Inc. | 573 | 6 | |
| * | Blount International Inc. | 1,012 | 6 | |
| Textainer Group Holdings Ltd. | 330 | 5 | ||
| * | Great Lakes Dredge | |||
| & Dock Corp. | 1,004 | 5 | ||
| * | MasTec Inc. | 300 | 5 | |
| Costamare Inc. | 300 | 4 | ||
| * | MRC Global Inc. | 316 | 4 | |
| Trinity Industries Inc. | 66 | 2 | ||
| 643,906 | ||||
| Information Technology (17.2%) | ||||
| Apple Inc. | 1,773,101 | 195,573 | ||
| Microsoft Corp. | 1,710,570 | 75,710 | ||
| * | Google Inc. Class C | 71,269 | 43,359 | |
| * | Facebook Inc. Class A | 456,690 | 41,056 | |
| * | Google Inc. Class A | 63,471 | 40,518 | |
| Intel Corp. | 1,174,829 | 35,409 | ||
| Cisco Systems Inc. | 1,144,417 | 30,041 | ||
| International Business | ||||
| Machines Corp. | 205,874 | 29,846 | ||
| Visa Inc. Class A | 414,420 | 28,868 | ||
| Hewlett-Packard Co. | 1,082,454 | 27,722 | |
| Computer Sciences Corp. | 447,840 | 27,488 | |
| Accenture plc Class A | 274,480 | 26,970 | |
| Total System Services Inc. | 479,830 | 21,799 | |
| * | Fiserv Inc. | 246,015 | 21,307 |
| Western Union Co. | 1,157,272 | 21,248 | |
| Texas Instruments Inc. | 410,802 | 20,343 | |
| Intuit Inc. | 225,170 | 19,984 | |
| MasterCard Inc. Class A | 209,640 | 18,893 | |
| * | Electronic Arts Inc. | 266,430 | 18,051 |
| Avago Technologies Ltd. | |||
| Class A | 131,600 | 16,451 | |
| QUALCOMM Inc. | 287,800 | 15,463 | |
| * | F5 Networks Inc. | 131,800 | 15,262 |
| Juniper Networks Inc. | 587,918 | 15,115 | |
| Xerox Corp. | 1,352,400 | 13,159 | |
| Fidelity National | |||
| Information Services Inc. | 195,380 | 13,106 | |
| Paychex Inc. | 274,467 | 13,073 | |
| Oracle Corp. | 356,403 | 12,873 | |
| * | VeriSign Inc. | 175,255 | 12,366 |
| Skyworks Solutions Inc. | 145,400 | 12,244 | |
| Symantec Corp. | 560,336 | 10,910 | |
| * | PayPal Holdings Inc. | 345,360 | 10,720 |
| * | Cognizant Technology | ||
| Solutions Corp. Class A | 168,910 | 10,575 | |
| TE Connectivity Ltd. | 140,900 | 8,439 | |
| Seagate Technology plc | 185,460 | 8,309 | |
| Motorola Solutions Inc. | 113,591 | 7,767 | |
| Corning Inc. | 449,028 | 7,687 | |
| * | Adobe Systems Inc. | 93,300 | 7,671 |
| Harris Corp. | 95,305 | 6,972 | |
| Automatic Data | |||
| Processing Inc. | 59,800 | 4,806 | |
| * | Citrix Systems Inc. | 60,562 | 4,196 |
| CA Inc. | 122,810 | 3,353 | |
| * | salesforce.com inc | 42,710 | 2,965 |
| Broadcom Corp. Class A | 55,536 | 2,856 | |
| Xilinx Inc. | 66,873 | 2,835 | |
| * | Micron Technology Inc. | 181,439 | 2,718 |
| * | Autodesk Inc. | 56,900 | 2,512 |
| Amphenol Corp. Class A | 40,000 | 2,038 | |
| * | Red Hat Inc. | 24,860 | 1,787 |
| NVIDIA Corp. | 71,950 | 1,774 | |
| * | Yahoo! Inc. | 47,544 | 1,374 |
| ^ | King Digital | ||
| Entertainment plc | 81,700 | 1,106 | |
| Western Digital Corp. | 13,200 | 1,049 | |
| Marvell Technology | |||
| Group Ltd. | 95,600 | 865 | |
| Applied Materials Inc. | 58,402 | 858 | |
| * | CoreLogic Inc. | 22,000 | 819 |
| * | Trimble Navigation Ltd. | 39,700 | 652 |
| * | SolarWinds Inc. | 15,571 | 611 |
| Analog Devices Inc. | 10,700 | 604 | |
| * | CommScope Holding Co. Inc. 19,000 | 571 | |
23
Growth and Income Fund
| Market | |||
| Value | |||
| Shares | ($000) | ||
| * | ON Semiconductor Corp. | 58,152 | 547 |
| InterDigital Inc. | 10,499 | 531 | |
| Lam Research Corp. | 8,100 | 529 | |
| * | EchoStar Corp. Class A | 11,038 | 475 |
| * | Polycom Inc. | 39,200 | 411 |
| Maxim Integrated | |||
| Products Inc. | 11,900 | 397 | |
| Linear Technology Corp. | 8,900 | 359 | |
| Amdocs Ltd. | 5,700 | 324 | |
| Teradyne Inc. | 15,900 | 286 | |
| * | Take-Two Interactive | ||
| Software Inc. | 9,700 | 279 | |
| * | Genpact Ltd. | 11,500 | 272 |
| * | Zebra Technologies Corp. | 3,400 | 260 |
| * | BlackBerry Ltd. | 40,400 | 248 |
| IAC/InterActiveCorp | 3,700 | 241 | |
| * | Blackhawk Network | ||
| Holdings Inc. | 4,564 | 193 | |
| Brocade Communications | |||
| Systems Inc. | 17,100 | 177 | |
| * | Glu Mobile Inc. | 32,300 | 141 |
| * | ShoreTel Inc. | 18,784 | 140 |
| Global Payments Inc. | 1,200 | 138 | |
| FLIR Systems Inc. | 4,700 | 132 | |
| Belden Inc. | 2,800 | 131 | |
| KLA-Tencor Corp. | 2,400 | 120 | |
| * | Zynga Inc. Class A | 50,484 | 115 |
| * | Flextronics International Ltd. | 9,700 | 102 |
| * | WebMD Health Corp. | 1,900 | 76 |
| Tessera Technologies Inc. | 2,300 | 75 | |
| * | Silicon Laboratories Inc. | 1,600 | 66 |
| * | Cabot Microelectronics Corp. | 1,676 | 65 |
| Logitech International SA | 4,491 | 59 | |
| * | Pandora Media Inc. | 2,700 | 58 |
| * | SunEdison | ||
| Semiconductor Ltd. | 5,400 | 57 | |
| * | QLogic Corp. | 5,300 | 54 |
| * | Verint Systems Inc. | 1,200 | 52 |
| * | Cimpress NV | 600 | 46 |
| * | Monster Worldwide Inc. | 6,862 | 44 |
| * | TeleCommunication | ||
| Systems Inc. Class A | 12,500 | 43 | |
| * | Blucora Inc. | 2,856 | 39 |
| * | TechTarget Inc. | 4,300 | 37 |
| * | Fabrinet | 1,800 | 33 |
| * | ARRIS Group Inc. | 1,200 | 31 |
| * | Photronics Inc. | 3,152 | 29 |
| * | Keysight Technologies Inc. | 900 | 28 |
| Microchip Technology Inc. | 623 | 27 | |
| * | Synopsys Inc. | 500 | 23 |
| NVE Corp. | 430 | 21 | |
| * | Ixia | 1,400 | 20 |
| * | XO Group Inc. | 1,300 | 18 |
| NIC Inc. | 1,000 | 18 | |
| * | Lionbridge Technologies Inc. | 3,500 | 17 |
| Sabre Corp. | 600 | 16 |
| * | United Online Inc. | 1,500 | 15 |
| * | Microsemi Corp. | 400 | 13 |
| * | Amkor Technology Inc. | 2,873 | 13 |
| * | PMC-Sierra Inc. | 1,900 | 13 |
| * | Avid Technology Inc. | 1,500 | 12 |
| * | Ciber Inc. | 2,844 | 9 |
| * | NCR Corp. | 364 | 8 |
| * | Millennial Media Inc. | 4,662 | 8 |
| * | Entegris Inc. | 600 | 8 |
| * | CommVault Systems Inc. | 200 | 7 |
| * | MoneyGram International Inc. 825 | 7 | |
| * | Sigma Designs Inc. | 600 | 4 |
| * | RealD Inc. | 400 | 4 |
| * | Care.com Inc. | 600 | 3 |
| * | Kemet Corp. | 1,643 | 3 |
| Atmel Corp. | 357 | 3 | |
| * | Progress Software Corp. | 100 | 3 |
| * | Ultra Clean Holdings Inc. | 300 | 2 |
| 1,010,431 | |||
| Materials (3.6%) | |||
| Air Products | |||
| & Chemicals Inc. | 259,394 | 33,094 | |
| Sherwin-Williams Co. | 132,940 | 29,616 | |
| Sealed Air Corp. | 512,280 | 24,016 | |
| International Paper Co. | 587,274 | 22,193 | |
| LyondellBasell Industries | |||
| NV Class A | 216,700 | 18,064 | |
| Avery Dennison Corp. | 283,620 | 16,044 | |
| Monsanto Co. | 157,000 | 13,398 | |
| ^ | Dow Chemical Co. | 308,093 | 13,063 |
| Ball Corp. | 160,106 | 9,959 | |
| Vulcan Materials Co. | 97,419 | 8,690 | |
| Eastman Chemical Co. | 116,721 | 7,554 | |
| PPG Industries Inc. | 59,800 | 5,244 | |
| Bemis Co. Inc. | 89,170 | 3,528 | |
| Ecolab Inc. | 28,600 | 3,138 | |
| Mosaic Co. | 62,553 | 1,946 | |
| * | Berry Plastics Group Inc. | 21,900 | 659 |
| Potash Corp. of | |||
| Saskatchewan Inc. | 14,474 | 297 | |
| * | Turquoise Hill | ||
| Resources Ltd. | 105,800 | 270 | |
| Graphic Packaging | |||
| Holding Co. | 20,900 | 267 | |
| * | Constellium NV Class A | 36,100 | 219 |
| Reliance Steel | |||
| & Aluminum Co. | 3,919 | 212 | |
| Nucor Corp. | 5,600 | 210 | |
| International Flavors | |||
| & Fragrances Inc. | 2,000 | 207 | |
| Valspar Corp. | 2,649 | 190 | |
| Southern Copper Corp. | 6,000 | 160 | |
| CF Industries Holdings Inc. | 3,300 | 148 | |
| Globe Specialty Metals Inc. | 10,900 | 132 | |
| ^ | Mesabi Trust | 9,982 | 119 |
24
Growth and Income Fund
| Market | ||||
| Value | ||||
| Shares | ($000) | |||
| * | Novagold Resources Inc. | 27,900 | 101 | |
| Sonoco Products Co. | 2,650 | 100 | ||
| Materion Corp. | 2,700 | 81 | ||
| Orion Engineered | ||||
| Carbons SA | 4,738 | 68 | ||
| * | Headwaters Inc. | 2,500 | 47 | |
| SunCoke Energy Inc. | 5,900 | 46 | ||
| * | Ferro Corp. | 3,500 | 38 | |
| TimkenSteel Corp. | 3,400 | 34 | ||
| Chemours Co. | 5,205 | 34 | ||
| Allegheny Technologies Inc. | 2,300 | 33 | ||
| Mercer International Inc. | 2,000 | 20 | ||
| * | Axalta Coating Systems Ltd. | 500 | 13 | |
| * | Louisiana-Pacific Corp. | 600 | 9 | |
| * | AM Castle & Co. | 809 | 2 | |
| 213,263 | ||||
| Other (0.2%) | ||||
| ^ | SPDR S&P 500 ETF Trust | 51,572 | 9,883 | |
| * | Safeway Inc. CVR (Casa Ley) | |||
| Exp. 01/30/2018 | 75,810 | 10 | ||
| * | Safeway Inc. CVR (PDC) | |||
| Exp. 01/30/2017 | 75,810 | 3 | ||
| * | Biosante | |||
| Pharmaceutical Inc. CVR | 4,189 | — | ||
| 9,896 | ||||
| Telecommunication Services (2.2%) | ||||
| AT&T Inc. | 2,037,696 | 66,388 | ||
| Verizon | ||||
| Communications Inc. | 836,799 | 36,409 | ||
| CenturyLink Inc. | 778,441 | 19,555 | ||
| * | Level 3 | |||
| Communications Inc. | 115,400 | 5,042 | ||
| Frontier | ||||
| Communications Corp. | 331,200 | 1,573 | ||
| * | T-Mobile US Inc. | 2,600 | 104 | |
| * | Globalstar Inc. | 11,500 | 18 | |
| * | Zayo Group Holdings Inc. | 600 | 15 | |
| * | General Communication Inc. | |||
| Class A | 700 | 12 | ||
| 129,116 | ||||
| Utilities (2.7%) | ||||
| Edison International | 253,950 | 16,017 | ||
| FirstEnergy Corp. | 460,700 | 14,424 | ||
| Public Service Enterprise | ||||
| Group Inc. | 327,730 | 13,817 | ||
| Ameren Corp. | 321,523 | 13,591 | ||
| Duke Energy Corp. | 180,090 | 12,956 | ||
| Exelon Corp. | 418,500 | 12,429 | ||
| Southern Co. | 254,930 | 11,395 | ||
| NextEra Energy Inc. | 110,770 | 10,806 | ||
| Consolidated Edison Inc. | 158,500 | 10,596 | ||
| American Electric | ||||
| Power Co. Inc. | 180,160 | 10,244 | ||
| Sempra Energy | 93,910 | 9,083 | ||
| Dominion Resources Inc. | 74,984 | 5,277 | ||
| CenterPoint Energy Inc. | 187,610 | 3,384 | ||
| Eversource Energy | 53,093 | 2,688 | ||
| Xcel Energy Inc. | 73,360 | 2,598 | ||
| DTE Energy Co. | 26,590 | 2,137 | ||
| Pinnacle West Capital Corp. | 26,690 | 1,712 | ||
| * | Dynegy Inc. | 76,600 | 1,583 | |
| TECO Energy Inc. | 44,970 | 1,181 | ||
| SCANA Corp. | 9,400 | 529 | ||
| AES Corp. | 35,300 | 346 | ||
| ^ | Atlantic Power Corp. | 110,311 | 205 | |
| Entergy Corp. | 2,170 | 141 | ||
| PG&E Corp. | 2,590 | 137 | ||
| WGL Holdings Inc. | 453 | 26 | ||
| Questar Corp. | 400 | 8 | ||
| ITC Holdings Corp. | 100 | 3 | ||
| 157,313 | ||||
| Total Common Stocks | ||||
| (Cost $5,183,663) | 5,718,972 | |||
| Temporary Cash Investments (2.9%)1 | ||||
| Money Market Fund (2.7%) | ||||
| 2,3 | Vanguard Market | |||
| Liquidity Fund, | ||||
| 0.189% | 160,437,772 | 160,438 | ||
| Face | ||||
| Amount | ||||
| ($000) | ||||
| U.S. Government and Agency Obligations (0.2%) | ||||
| 4,5 | Federal Home Loan Bank | |||
| Discount Notes, | ||||
| 0.100%, 10/23/15 | 4,000 | 4,000 | ||
| 4,5 | Federal Home Loan Bank | |||
| Discount Notes, | ||||
| 0.114%, 10/28/15 | 100 | 100 | ||
| 4,5 | Federal Home Loan Bank | |||
| Discount Notes, | ||||
| 0.180%, 11/4/15 | 3,000 | 2,999 | ||
| 4 | Federal Home Loan Bank | |||
| Discount Notes, | ||||
| 0.145%, 12/11/15 | 200 | 200 | ||
| 5,6 | Freddie Mac Discount Notes, | |||
| 0.125%, 10/30/15 | 800 | 800 | ||
| 8,099 | ||||
| Total Temporary Cash Investments | ||||
| (Cost $168,537) | 168,537 | |||
| Total Investments (100.3%) | ||||
| (Cost $5,352,200) | 5,887,509 | |||
25
Growth and Income Fund
| Amount | |
| ($000) | |
| Other Assets | |
| Investment in VGI | 545 |
| Receivables for Investment Securities Sold 69,569 | |
| Receivables for Accrued Income | 9,035 |
| Receivables for Capital Shares Issued | 19,379 |
| Total Other Assets | 98,528 |
| Liabilities | |
| Payables for Investment Securities | |
| Purchased | (68,344) |
| Collateral for Securities on Loan | (14,297) |
| Payables to Investment Advisor | (1,477) |
| Payables for Capital Shares Redeemed | (22,522) |
| Payables to Vanguard | (11,788) |
| Other Liabilities | (102) |
| Total Liabilities | (118,530) |
| Other Assets and Liabilities (-0.3%) | |
| Net Assets (100%) | 5,867,507 |
| At September 30, 2015, net assets consisted of: | |
| Amount | |
| ($000) | |
| Paid-in Capital | 5,026,718 |
| Undistributed Net Investment Income | 16,881 |
| Accumulated Net Realized Gains | 291,027 |
| Unrealized Appreciation (Depreciation) | |
| Investment Securities | 535,309 |
| Futures Contracts | (2,428) |
| Net Assets | 5,867,507 |
| Investor Shares—Net Assets | |
| Applicable to 68,030,653 outstanding | |
| $.001 par value shares of beneficial | |
| interest (unlimited authorization) | 2,690,599 |
| Net Asset Value Per Share— | |
| Investor Shares | $39.55 |
| Admiral Shares—Net Assets | |
| Applicable to 49,198,122 outstanding | |
| $.001 par value shares of beneficial | |
| interest (unlimited authorization) | 3,176,908 |
| Net Asset Value Per Share— | |
| Admiral Shares | $64.57 |
• See Note A in Notes to Financial Statements.
^ Includes partial security positions on loan to broker-dealers. The total value of securities on loan is $14,176,000.
* Non-income-producing security.
1 The fund invests a portion of its cash reserves in equity markets through the use of index futures contracts. After giving effect to futures
investments, the fund’s effective common stock and temporary cash investment positions represent 99.8% and 0.5%, respectively,
of net assets.
2 Includes $14,297,000 of collateral received for securities on loan.
3 Affiliated money market fund available only to Vanguard funds and certain trusts and accounts managed by Vanguard. Rate shown is the
7-day yield.
4 The issuer operates under a congressional charter; its securities are generally neither guaranteed by the U.S. Treasury nor backed by the
full faith and credit of the U.S. government.
5 Securities with a value of $7,099,000 have been segregated as initial margin for open futures contracts.
6 The issuer was placed under federal conservatorship in September 2008; since that time, its daily operations have been managed by the
Federal Housing Finance Agency and it receives capital from the U.S. Treasury, as needed to maintain a positive net worth, in exchange
for senior preferred stock.
REIT—Real Estate Investment Trust.
See accompanying Notes, which are an integral part of the Financial Statements.
26
Growth and Income Fund
Statement of Operations
| Year Ended | |
| September 30, 2015 | |
| ($000) | |
| Investment Income | |
| Income | |
| Dividends1 | 126,551 |
| Interest2 | 242 |
| Securities Lending | 192 |
| Total Income | 126,985 |
| Expenses | |
| Investment Advisory Fees—Note B | |
| Basic Fee | 6,334 |
| Performance Adjustment | 55 |
| The Vanguard Group—Note C | |
| Management and Administrative—Investor Shares | 6,428 |
| Management and Administrative—Admiral Shares | 3,548 |
| Marketing and Distribution—Investor Shares | 442 |
| Marketing and Distribution—Admiral Shares | 332 |
| Custodian Fees | 243 |
| Auditing Fees | 33 |
| Shareholders’ Reports—Investor Shares | 71 |
| Shareholders’ Reports—Admiral Shares | 18 |
| Trustees’ Fees and Expenses | 12 |
| Total Expenses | 17,516 |
| Net Investment Income | 109,469 |
| Realized Net Gain (Loss) | |
| Investment Securities Sold | 343,059 |
| Futures Contracts | 5,108 |
| Realized Net Gain (Loss) | 348,167 |
| Change in Unrealized Appreciation (Depreciation) | |
| Investment Securities | (436,657) |
| Futures Contracts | (1,535) |
| Change in Unrealized Appreciation (Depreciation) | (438,192) |
| Net Increase (Decrease) in Net Assets Resulting from Operations | 19,444 |
| 1 Dividends are net of foreign withholding taxes of $13,000. | |
| 2 Interest income from an affiliated company of the fund was $233,000. | |
See accompanying Notes, which are an integral part of the Financial Statements.
27
Growth and Income Fund
Statement of Changes in Net Assets
| Year Ended September 30, | ||
| 2015 | 2014 | |
| ($000) | ($000) | |
| Increase (Decrease) in Net Assets | ||
| Operations | ||
| Net Investment Income | 109,469 | 95,797 |
| Realized Net Gain (Loss) | 348,167 | 660,609 |
| Change in Unrealized Appreciation (Depreciation) | (438,192) | 260,158 |
| Net Increase (Decrease) in Net Assets Resulting from Operations | 19,444 | 1,016,564 |
| Distributions | ||
| Net Investment Income | ||
| Investor Shares | (50,108) | (47,416) |
| Admiral Shares | (57,404) | (43,820) |
| Realized Capital Gain1 | ||
| Investor Shares | (180,933) | — |
| Admiral Shares | (179,399) | — |
| Total Distributions | (467,844) | (91,236) |
| Capital Share Transactions | ||
| Investor Shares | (82,169) | (393,996) |
| Admiral Shares | 501,641 | 338,592 |
| Net Increase (Decrease) from Capital Share Transactions | 419,472 | (55,404) |
| Total Increase (Decrease) | (28,928) | 869,924 |
| Net Assets | ||
| Beginning of Period | 5,896,435 | 5,026,511 |
| End of Period2 | 5,867,507 | 5,896,435 |
| 1 Includes fiscal 2015 short-term gain distributions totaling $830,000. Short-term gain distributions are treated as ordinary income dividends for tax purposes. | ||
| 2 Net Assets—End of Period includes undistributed (overdistributed) net investment income of $16,881,000 and $14,924,000. | ||
See accompanying Notes, which are an integral part of the Financial Statements.
28
Growth and Income Fund
Financial Highlights
| Investor Shares | |||||
| For a Share Outstanding | Year Ended September 30, | ||||
| Throughout Each Period | 2015 | 2014 | 2013 | 2012 | 2011 |
| Net Asset Value, Beginning of Period | $42.69 | $36.02 | $30.73 | $23.86 | $23.98 |
| Investment Operations | |||||
| Net Investment Income | .729 | .671 | .631 | .549 | .482 |
| Net Realized and Unrealized Gain (Loss) | |||||
| on Investments | (.541) | 6.639 | 5.288 | 6.846 | (.124) |
| Total from Investment Operations | .188 | 7.310 | 5.919 | 7.395 | .358 |
| Distributions | |||||
| Dividends from Net Investment Income | (.724) | (.640) | (. 629) | (. 525) | (. 478) |
| Distributions from Realized Capital Gains | (2.604) | — | — | — | — |
| Total Distributions | (3.328) | (.640) | (. 629) | (. 525) | (. 478) |
| Net Asset Value, End of Period | $39.55 | $42.69 | $36.02 | $30.73 | $23.86 |
| Total Return1 | 0.22% | 20.42% | 19.54% | 31.27% | 1.28% |
| Ratios/Supplemental Data | |||||
| Net Assets, End of Period (Millions) | $2,691 | $2,979 | $2,869 | $2,798 | $2,548 |
| Ratio of Total Expenses to | |||||
| Average Net Assets2 | 0.34% | 0.37% | 0.36% | 0.36% | 0.32% |
| Ratio of Net Investment Income to | |||||
| Average Net Assets | 1.70% | 1.67% | 1.90% | 1.94% | 1.78% |
| Portfolio Turnover Rate | 116% | 133% | 109% | 102% | 120% |
1 Total returns do not include account service fees that may have applied in the periods shown. Fund prospectuses provide information about any applicable account service fees.
2 Includes performance-based investment advisory fee increases (decreases) of 0.00%, 0.02%, 0.01%, 0.01%, and (0.04%).
See accompanying Notes, which are an integral part of the Financial Statements.
29
Growth and Income Fund
Financial Highlights
| Admiral Shares | |||||
| For a Share Outstanding | Year Ended September 30, | ||||
| Throughout Each Period | 2015 | 2014 | 2013 | 2012 | 2011 |
| Net Asset Value, Beginning of Period | $69.71 | $58.82 | $50.18 | $38.97 | $39.15 |
| Investment Operations | |||||
| Net Investment Income | 1.272 | 1.176 | 1.097 | .952 | .832 |
| Net Realized and Unrealized Gain (Loss) | |||||
| on Investments | (. 897) | 10.833 | 8.633 | 11.168 | (.199) |
| Total from Investment Operations | .375 | 12.009 | 9.730 | 12.120 | .633 |
| Distributions | |||||
| Dividends from Net Investment Income | (1.264) | (1.119) | (1.090) | (.910) | (.813) |
| Distributions from Realized Capital Gains | (4.251) | — | — | — | — |
| Total Distributions | (5.515) | (1.119) | (1.090) | (.910) | (.813) |
| Net Asset Value, End of Period | $64.57 | $69.71 | $58.82 | $50.18 | $38.97 |
| Total Return1 | 0.31% | 20.55% | 19.69% | 31.40% | 1.39% |
| Ratios/Supplemental Data | |||||
| Net Assets, End of Period (Millions) | $3,177 | $2,917 | $2,157 | $1,591 | $1,131 |
| Ratio of Total Expenses to | |||||
| Average Net Assets2 | 0.23% | 0.26% | 0.26% | 0.25% | 0.21% |
| Ratio of Net Investment Income to | |||||
| Average Net Assets | 1.81% | 1.78% | 2.00% | 2.05% | 1.89% |
| Portfolio Turnover Rate | 116% | 133% | 109% | 102% | 120% |
1 Total returns do not include account service fees that may have applied in the periods shown. Fund prospectuses provide information about any applicable account service fees.
2 Includes performance-based investment advisory fee increases (decreases) of 0.00%, 0.02%, 0.01%, 0.01%, and (0.04%).
See accompanying Notes, which are an integral part of the Financial Statements.
30
Growth and Income Fund
Notes to Financial Statements
Vanguard Growth and Income Fund is registered under the Investment Company Act of 1940 as an open-end investment company, or mutual fund. The fund offers two classes of shares: Investor Shares and Admiral Shares. Investor Shares are available to any investor who meets the fund’s minimum purchase requirements. Admiral Shares are designed for investors who meet certain administrative, service, and account-size criteria.
A. The following significant accounting policies conform to generally accepted accounting principles for U.S. investment companies. The fund consistently follows such policies in preparing its financial statements.
1. Security Valuation: Securities are valued as of the close of trading on the New York Stock Exchange (generally 4 p.m., Eastern time) on the valuation date. Equity securities are valued at the latest quoted sales prices or official closing prices taken from the primary market in which each security trades; such securities not traded on the valuation date are valued at the mean of the latest quoted bid and asked prices. Securities for which market quotations are not readily available, or whose values have been materially affected by events occurring before the fund’s pricing time but after the close of the securities’ primary markets, are valued by methods deemed by the board of trustees to represent fair value. Investments in Vanguard Market Liquidity Fund are valued at that fund’s net asset value. Temporary cash investments acquired over 60 days to maturity are valued using the latest bid prices or using valuations based on a matrix system (which considers such factors as security prices, yields, maturities, and ratings), both as furnished by independent pricing services. Other temporary cash investments are valued at amortized cost, which approximates market value.
2. Futures Contracts: The fund uses index futures contracts to a limited extent, with the objective of maintaining full exposure to the stock market while maintaining liquidity. The fund may purchase or sell futures contracts to achieve a desired level of investment, whether to accommodate portfolio turnover or cash flows from capital share transactions. The primary risks associated with the use of futures contracts are imperfect correlation between changes in market values of stocks held by the fund and the prices of futures contracts, and the possibility of an illiquid market. Counterparty risk involving futures is mitigated because a regulated clearinghouse is the counterparty instead of the clearing broker. To further mitigate counterparty risk, the fund trades futures contracts on an exchange, monitors the financial strength of its clearing brokers and clearinghouse, and has entered into clearing agreements with its clearing brokers. The clearinghouse imposes initial margin requirements to secure the fund’s performance and requires daily settlement of variation margin representing changes in the market value of each contract.
Futures contracts are valued at their quoted daily settlement prices. The aggregate settlement values of the contracts are not recorded in the Statement of Net Assets. Fluctuations in the value of the contracts are recorded in the Statement of Net Assets as an asset (liability) and in the Statement of Operations as unrealized appreciation (depreciation) until the contracts are closed, when they are recorded as realized futures gains (losses).
During the year ended September 30, 2015, the fund’s average investments in long and short futures contracts represented 2% and 0% of net assets, respectively, based on the average of aggregate settlement values at each quarter-end during the period.
31
Growth and Income Fund
3. Federal Income Taxes: The fund intends to continue to qualify as a regulated investment company and distribute all of its taxable income. Management has analyzed the fund’s tax positions taken for all open federal income tax years (September 30, 2012–2015), and has concluded that no provision for federal income tax is required in the fund’s financial statements.
4. Distributions: Distributions to shareholders are recorded on the ex-dividend date.
5. Securities Lending: To earn additional income, the fund lends its securities to qualified institutional borrowers. Security loans are required to be secured at all times by collateral in an amount at least equal to the market value of securities loaned. Daily market fluctuations could cause the value of loaned securities to be more or less than the value of the collateral received. When this occurs, the collateral is adjusted and settled on the next business day. The fund further mitigates its counterparty risk by entering into securities lending transactions only with a diverse group of prequalified counter-parties, monitoring their financial strength, and entering into master securities lending agreements with its counterparties. The master securities lending agreements provide that, in the event of a counterparty’s default (including bankruptcy), the fund may terminate any loans with that borrower, determine the net amount owed, and sell or retain the collateral up to the net amount owed to the fund; however, such actions may be subject to legal proceedings. While collateral mitigates counter-party risk, in the absence of a default the fund may experience delays and costs in recovering the securities loaned. The fund invests cash collateral received in Vanguard Market Liquidity Fund, and records a liability in the Statement of Net Assets for the return of the collateral, during the period the securities are on loan. Securities lending income represents fees charged to borrowers plus income earned on invested cash collateral, less expenses associated with the loan.
6. Credit Facility: The fund and certain other funds managed by The Vanguard Group (“Vanguard”) participate in a $3 billion committed credit facility provided by a syndicate of lenders pursuant to a credit agreement that may be renewed annually; each fund is individually liable for its borrowings, if any, under the credit facility. Borrowings may be utilized for temporary and emergency purposes, and are subject to the fund’s regulatory and contractual borrowing restrictions. The participating funds are charged administrative fees and an annual commitment fee of 0.06% of the undrawn amount of the facility; these fees are allocated to the funds based on a method approved by the fund’s board of trustees and included in Management and Administrative expenses on the fund’s Statement of Operations. Any borrowings under this facility bear interest at a rate equal to the higher of the federal funds rate or LIBOR reference rate plus an agreed-upon spread.
The fund had no borrowings outstanding at September 30, 2015, or at any time during the period then ended.
7. Other: Dividend income is recorded on the ex-dividend date. Interest income includes income distributions received from Vanguard Market Liquidity Fund and is accrued daily. Premiums and discounts on debt securities purchased are amortized and accreted, respectively, to interest income over the lives of the respective securities. Security transactions are accounted for on the date securities are bought or sold. Costs used to determine realized gains (losses) on the sale of investment securities are those of the specific securities sold.
32
Growth and Income Fund
Each class of shares has equal rights as to assets and earnings, except that each class separately bears certain class-specific expenses related to maintenance of shareholder accounts (included in Management and Administrative expenses) and shareholder reporting. Marketing and distribution expenses are allocated to each class of shares based on a method approved by the board of trustees. Income, other non-class-specific expenses, and gains and losses on investments are allocated to each class of shares based on its relative net assets.
B. The investment advisory firms D. E. Shaw Investment Management, L.L.C., and Los Angeles Capital Management and Equity Research, Inc., each provide investment advisory services to a portion of the fund for a fee calculated at an annual percentage rate of average net assets managed by the advisor. The basic fee of D. E. Shaw Investment Management, L.L.C., is subject to quarterly adjustments based on performance relative to the S&P 500 Index for the preceding three years. The basic fee of Los Angeles Capital Management and Equity Research, Inc., is subject to quarterly adjustments based on performance relative to the S&P 500 Index for the preceding three years.
Vanguard provides investment advisory services to a portion of the fund as described below; the fund paid Vanguard advisory fees of $737,000 for the year ended September 30, 2015.
For the year ended September 30, 2015, the aggregate investment advisory fee paid to all advisors represented an effective annual basic rate of 0.10% of the fund’s average net assets, before a net increase of $55,000 (0.00%) based on performance.
C. In accordance with the terms of a Funds’ Service Agreement (the “FSA”) between Vanguard and the fund, Vanguard furnishes to the fund investment advisory, corporate management, administrative, marketing, and distribution services at Vanguard’s cost of operations (as defined by the FSA). These costs of operations are allocated to the fund based on methods and guidelines approved by the board of trustees. Vanguard does not require reimbursement in the current period for certain costs of operations (such as deferred compensation/benefits and risk/insurance costs); the fund’s liability for these costs of operations is included in Payables to Vanguard on the Statement of Net Assets.
Upon the request of Vanguard, the fund may invest up to 0.40% of its net assets as capital in Vanguard. At September 30, 2015, the fund had contributed capital to Vanguard in the amount of $545,000, representing 0.01% of the fund’s net assets and 0.22% of Vanguard’s capitalization. The fund’s trustees and officers are also directors and employees, respectively, of Vanguard.
D. Various inputs may be used to determine the value of the fund’s investments. These inputs are summarized in three broad levels for financial statement purposes. The inputs or methodologies used to value securities are not necessarily an indication of the risk associated with investing in those securities.
Level 1—Quoted prices in active markets for identical securities.
Level 2—Other significant observable inputs (including quoted prices for similar securities, interest rates, prepayment speeds, credit risk, etc.).
Level 3—Significant unobservable inputs (including the fund’s own assumptions used to determine the fair value of investments).
33
Growth and Income Fund
The following table summarizes the market value of the fund’s investments as of September 30, 2015, based on the inputs used to value them:
| Level 1 | Level 2 | Level 3 | |
| Investments | ($000) | ($000) | ($000) |
| Common Stocks | 5,718,958 | — | 14 |
| Temporary Cash Investments | 160,438 | 8,099 | — |
| Futures Contracts—Assets1 | 2,619 | — | — |
| Futures Contracts—Liabilities1 | (94) | — | — |
| Total | 5,881,921 | 8,099 | 14 |
| 1 Represents variation margin on the last day of the reporting period. | |||
E. At September 30, 2015, the aggregate settlement value of open futures contracts and the related unrealized appreciation (depreciation) were:
| ($000) | ||||
| Aggregate | ||||
| Number of | Settlement | Unrealized | ||
| Long (Short) | Value | Appreciation | ||
| Futures Contracts | Expiration | Contracts | Long (Short) | (Depreciation) |
| S&P 500 Index | December 2015 | 278 | 132,655 | (2,460) |
| E-mini S&P 500 Index | December 2015 | 46 | 4,390 | 32 |
| (2,428) | ||||
Unrealized appreciation (depreciation) on open futures contracts is required to be treated as realized gain (loss) for tax purposes.
F. Distributions are determined on a tax basis and may differ from net investment income and realized capital gains for financial reporting purposes. Differences may be permanent or temporary. Permanent differences are reclassified among capital accounts in the financial statements to reflect their tax character. Temporary differences arise when certain items of income, expense, gain, or loss are recognized in different periods for financial statement and tax purposes. These differences will reverse at some time in the future. Differences in classification may also result from the treatment of short-term gains as ordinary income for tax purposes.
The fund used a tax accounting practice to treat a portion of the price of capital shares redeemed during the year as distributions from realized capital gains. Accordingly, the fund has reclassified $28,006,000 from accumulated net realized gains to paid-in capital.
For tax purposes, at September 30, 2015, the fund had $91,810,000 of ordinary income and $236,695,000 of long-term capital gains available for distribution.
34
Growth and Income Fund
At September 30, 2015, the cost of investment securities for tax purposes was $5,363,714,000. Net unrealized appreciation of investment securities for tax purposes was $523,795,000, consisting of unrealized gains of $800,719,000 on securities that had risen in value since their purchase and $276,924,000 in unrealized losses on securities that had fallen in value since their purchase.
G. During the year ended September 30, 2015, the fund purchased $7,027,277,000 of investment securities and sold $6,981,490,000 of investment securities, other than temporary cash investments.
H. Capital share transactions for each class of shares were:
| Year Ended September 30, | ||||
| 2015 | 2014 | |||
| Amount | Shares | Amount | Shares | |
| ($000) | (000) | ($000) | (000) | |
| Investor Shares | ||||
| Issued | 316,336 | 7,469 | 208,737 | 5,202 |
| Issued in Lieu of Cash Distributions | 225,186 | 5,491 | 46,158 | 1,157 |
| Redeemed | (623,691) | (14,720) | (648,891) | (16,224) |
| Net Increase (Decrease)—Investor Shares | (82,169) | (1,760) | (393,996) | (9,865) |
| Admiral Shares | ||||
| Issued | 646,610 | 9,344 | 536,136 | 8,191 |
| Issued in Lieu of Cash Distributions | 221,904 | 3,311 | 40,816 | 624 |
| Redeemed | (366,873) | (5,305) | (238,360) | (3,640) |
| Net Increase (Decrease) —Admiral Shares | 501,641 | 7,350 | 338,592 | 5,175 |
I. Management has determined that no material events or transactions occurred subsequent to September 30, 2015, that would require recognition or disclosure in these financial statements.
35
Report of Independent Registered
Public Accounting Firm
To the Board of Trustees of Vanguard Quantitative Funds and the Shareholders of Vanguard Growth and Income Fund:
In our opinion, the accompanying statement of net assets and the related statements of operations and of changes in net assets and the financial highlights present fairly, in all material respects, the financial position of Vanguard Growth and Income Fund (constituting a separate portfolio of Vanguard Quantitative Funds, hereafter referred to as the “Fund”) at September 30, 2015, the results of its operations for the year then ended, the changes in its net assets for each of the two years in the period then ended, and the financial highlights for each of the five years in the period then ended, in conformity with accounting principles generally accepted in the United States of America. These financial statements and financial highlights (hereafter referred to as “financial statements”) are the responsibility of the Fund’s management. Our responsibility is to express an opinion on these financial statements based on our audits. We conducted our audits of these financial statements in accordance with the standards of the Public Company Accounting Oversight Board (United States). Those standards require that we plan and perform the audit to obtain reasonable assurance about whether the financial statements are free of material misstatement. An audit includes examining, on a test basis, evidence supporting the amounts and disclosures in the financial statements, assessing the accounting principles used and significant estimates made by management, and evaluating the overall financial statement presentation. We believe that our audits, which included confirmation of securities at September 30, 2015 by correspondence with the custodian and brokers, by agreement to the underlying ownership records of the transfer agent and the application of alternative auditing procedures where securities purchased had not been received, provide a reasonable basis for our opinion.
/s/PricewaterhouseCoopers LLP
Philadelphia, Pennsylvania
November 10, 2015

This information for the fiscal year ended September 30, 2015, is included pursuant to provisions
of the Internal Revenue Code.
The fund distributed $381,941,000 as capital gain dividends (20% rate gain distributions) to
shareholders during the fiscal year.
The fund distributed $108,342,000 of qualified dividend income to shareholders during the fiscal year.
For corporate shareholders, 64.7% of investment income (dividend income plus short-term gains,
if any) qualifies for the dividends-received deduction.
36
Your Fund’s After-Tax Returns
This table presents returns for your fund both before and after taxes. The after-tax returns are shown in two ways: (1) assuming that an investor owned the fund during the entire period and paid taxes on the fund’s distributions, and (2) assuming that an investor paid taxes on the fund’s distributions and sold all shares at the end of each period.
Calculations are based on the highest individual federal income tax and capital gains tax rates in effect at the times of the distributions and the hypothetical sales. State and local taxes were not considered. After-tax returns reflect any qualified dividend income, using actual prior-year figures and estimates for 2015. (In the example, returns after the sale of fund shares may be higher than those assuming no sale. This occurs when the sale would have produced a capital loss. The calculation assumes that the investor received a tax deduction for the loss.)
The table shows returns for Investor Shares only; returns for other share classes will differ. Please note that your actual after-tax returns will depend on your tax situation and may differ from those shown. Also note that if you own the fund in a tax-deferred account, such as an individual retirement account or a 401(k) plan, this information does not apply to you. Such accounts are not subject to current taxes.
Finally, keep in mind that a fund’s performance—whether before or after taxes—does not guarantee future results.
Average Annual Total Returns: Growth and Income Fund Investor Shares
Periods Ended September 30, 2015
| One | Five | Ten | |
| Year | Years | Years | |
| Returns Before Taxes | 0.22% | 13.91% | 6.16% |
| Returns After Taxes on Distributions | -1.60 | 13.20 | 5.49 |
| Returns After Taxes on Distributions and Sale of Fund Shares | 1.69 | 11.20 | 4.97 |
37
About Your Fund’s Expenses
As a shareholder of the fund, you incur ongoing costs, which include costs for portfolio management, administrative services, and shareholder reports (like this one), among others. Operating expenses, which are deducted from a fund’s gross income, directly reduce the investment return of the fund.
A fund’s expenses are expressed as a percentage of its average net assets. This figure is known as the expense ratio. The following examples are intended to help you understand the ongoing costs (in dollars) of investing in your fund and to compare these costs with those of other mutual funds. The examples are based on an investment of $1,000 made at the beginning of the period shown and held for the entire period.
The accompanying table illustrates your fund’s costs in two ways:
• Based on actual fund return. This section helps you to estimate the actual expenses that you paid over the period. The ”Ending Account Value“ shown is derived from the fund‘s actual return, and the third column shows the dollar amount that would have been paid by an investor who started with $1,000 in the fund. You may use the information here, together with the amount you invested, to estimate the expenses that you paid over the period.
To do so, simply divide your account value by $1,000 (for example, an $8,600 account value divided by $1,000 = 8.6), then multiply the result by the number given for your fund under the heading ”Expenses Paid During Period.“
• Based on hypothetical 5% yearly return. This section is intended to help you compare your fund‘s costs with those of other mutual funds. It assumes that the fund had a yearly return of 5% before expenses, but that the expense ratio is unchanged. In this case—because the return used is not the fund’s actual return—the results do not apply to your investment. The example is useful in making comparisons because the Securities and Exchange Commission requires all mutual funds to calculate expenses based on a 5% return. You can assess your fund’s costs by comparing this hypothetical example with the hypothetical examples that appear in shareholder reports of other funds.
Note that the expenses shown in the table are meant to highlight and help you compare ongoing costs only and do not reflect transaction costs incurred by the fund for buying and selling securities. Further, the expenses do not include any purchase, redemption, or account service fees described in the fund prospectus. If such fees were applied to your account, your costs would be higher. Your fund does not carry a “sales load.”
The calculations assume no shares were bought or sold during the period. Your actual costs may have been higher or lower, depending on the amount of your investment and the timing of any purchases or redemptions.
You can find more information about the fund’s expenses, including annual expense ratios, in the Financial Statements section of this report. For additional information on operating expenses and other shareholder costs, please refer to your fund’s current prospectus.
38
| Six Months Ended September 30, 2015 | |||
| Beginning | Ending | Expenses | |
| Account Value | Account Value | Paid During | |
| Growth and Income Fund | 3/31/2015 | 9/30/2015 | Period |
| Based on Actual Fund Return | |||
| Investor Shares | $1,000.00 | $941.76 | $1.61 |
| Admiral Shares | 1,000.00 | 942.26 | 1.07 |
| Based on Hypothetical 5% Yearly Return | |||
| Investor Shares | $1,000.00 | $1,023.41 | $1.67 |
| Admiral Shares | 1,000.00 | 1,023.97 | 1.12 |
The calculations are based on expenses incurred in the most recent six-month period. The fund’s annualized six-month expense ratios for that
period are 0.33% for Investor Shares and 0.22% for Admiral Shares. The dollar amounts shown as “Expenses Paid” are equal to the
annualized expense ratio multiplied by the average account value over the period, multiplied by the number of days in the most recent
six-month period, then divided by the number of days in the most recent 12-month period (183/365).
39
Trustees Approve Advisory Arrangements
The board of trustees of Vanguard Growth and Income Fund has renewed the fund’s investment advisory arrangements with D. E. Shaw Investment Management, L.L.C. (DESIM), Los Angeles Capital Management and Equity Research, Inc. (LA Capital), and The Vanguard Group, Inc. (Vanguard), through its Quantitative Equity Group. The board determined that renewing the fund’s advisory arrangements was in the best interest of the fund and its shareholders.
The board based its decision upon an evaluation of each advisor’s investment staff, portfolio management process, and performance. The trustees considered the factors discussed below, among others. However, no single factor determined whether the board approved the arrangements. Rather, it was the totality of the circumstances that drove the board’s decision.
Nature, extent, and quality of services
The board reviewed the quality of each advisor’s investment management services provided to the fund since 2011, and took into account the organizational depth and stability of each advisor. The board considered the following:
DESIM. Founded in 2005, DESIM is a global investment management and technology development firm. The firm employs quantitative models that seek to capture predominantly “bottom-up” stock-specific return opportunities while aiming to control overall portfolio risk and characteristics, such as size, sector weights, and style, to be similar to those of the benchmark. The firm focuses on return drivers that it considers “idiosyncratic” or those that other quantitative managers tend to overlook and de-emphasizes the use of traditional factors such as value, growth, and momentum, as these factors are more subject to crowding from other quantitative managers. DESIM has managed a portion of the fund since 2011.
LA Capital. LA Capital was formed in 2002 from the equity portion of Wilshire Asset Management. The firm employs a controlled, dynamic investment model, gradually assigning new prices to key equity risks as market conditions evolve and investor preferences shift. The price of factor risk evolves over time in a way that can be captured in a model akin to changes in cost of capital. The model uses more than 50 factors to actively weight stocks, including value, momentum, quality, sector, and market capitalization. The team applies statistical techniques to reduce noise in the factor returns and it looks for velocity and acceleration of the cleansed factor performance over the prior six months.
LA Capital has managed a portion of the fund since 2011.
Vanguard. Vanguard has been managing investments for more than three decades. The Quantitative Equity Group adheres to a sound, disciplined investment management process; the team has considerable experience, stability, and depth. Vanguard has managed a portion of the fund since 2011.
The board concluded that each advisor’s experience, stability, depth, and performance, among other factors, warranted continuation of the advisory arrangements.
Investment performance
The board considered the fund’s investment performance since each advisor began managing the fund in 2011, including any periods of outperformance or underperformance relative to a benchmark index and peer group. The board concluded that the performance was such that the advisory arrangements should continue. Information about the fund’s most recent performance can be found in the Performance Summary section of this report.
40
Cost
The board concluded that the fund’s expense ratio was well below the average expense ratio charged by funds in its peer group and that the fund’s advisory fee rate was also well below its peer-group average. Information about the fund’s expense ratio appears in the About Your Fund’s Expenses section of this report as well as in the Financial Statements section, which also includes information about the fund’s advisory fee rate.
The board did not consider profitability of DESIM and LA Capital in determining whether to approve the advisory fees, because the firms are independent of Vanguard, and the advisory fees are the result of arm’s-length negotiations. The board does not conduct a profitability analysis of Vanguard because of Vanguard’s unique “at-cost” structure. Unlike most other mutual fund management companies, Vanguard is owned by the funds it oversees and produces “profits” only in the form of reduced expenses for fund shareholders.
The benefit of economies of scale
The board concluded that the fund’s shareholders benefit from economies of scale because of breakpoints in the advisory fee schedules for DESIM and LA Capital. The breakpoints reduce the effective rate of the fee as the fund’s assets managed by each advisor increase. The board also concluded that the fund’s at-cost arrangement with Vanguard ensures that the fund will realize economies of scale as it grows, with the cost to shareholders declining as the fund’s assets managed by Vanguard increase.
The board will consider whether to renew the advisory arrangements again after a one-year period.
41
Glossary
30-Day SEC Yield. A fund’s 30-day SEC yield is derived using a formula specified by the U.S. Securities and Exchange Commission. Under the formula, data related to the fund’s security holdings in the previous 30 days are used to calculate the fund’s hypothetical net income for that period, which is then annualized and divided by the fund’s estimated average net assets over the calculation period. For the purposes of this calculation, a security’s income is based on its current market yield to maturity (for bonds), its actual income (for asset-backed securities), or its projected dividend yield (for stocks). Because the SEC yield represents hypothetical annualized income, it will differ—at times significantly—from the fund’s actual experience. As a result, the fund’s income distributions may be higher or lower than implied by the SEC yield.
Beta. A measure of the magnitude of a fund’s past share-price fluctuations in relation to the ups and downs of a given market index. The index is assigned a beta of 1.00. Compared with a given index, a fund with a beta of 1.20 typically would have seen its share price rise or fall by 12% when the index rose or fell by 10%. For this report, beta is based on returns over the past 36 months for both the fund and the index. Note that a fund’s beta should be reviewed in conjunction with its R-squared (see definition). The lower the R-squared, the less correlation there is between the fund and the index, and the less reliable beta is as an indicator of volatility.
Dividend Yield. Dividend income earned by stocks, expressed as a percentage of the aggregate market value (or of net asset value, for a fund). The yield is determined by dividing the amount of the annual dividends by the aggregate value (or net asset value) at the end of the period. For a fund, the dividend yield is based solely on stock holdings and does not include any income produced by other investments.
Earnings Growth Rate. The average annual rate of growth in earnings over the past five years for the stocks now in a fund.
Equity Exposure. A measure that reflects a fund’s investments in stocks and stock futures. Any holdings in short-term reserves are excluded.
Expense Ratio. A fund’s total annual operating expenses expressed as a percentage of the fund’s average net assets. The expense ratio includes management and administrative expenses, but does not include the transaction costs of buying and selling portfolio securities.
Foreign Holdings. The percentage of a fund represented by securities or depositary receipts of companies based outside the United States.
Inception Date. The date on which the assets of a fund (or one of its share classes) are first invested in accordance with the fund’s investment objective. For funds with a subscription period, the inception date is the day after that period ends. Investment performance is measured from the inception date.
Median Market Cap. An indicator of the size of companies in which a fund invests; the midpoint of market capitalization (market price x shares outstanding) of a fund’s stocks, weighted by the proportion of the fund’s assets invested in each stock. Stocks representing half of the fund’s assets have market capitalizations above the median, and the rest are below it.
Price/Book Ratio. The share price of a stock divided by its net worth, or book value, per share. For a fund, the weighted average price/book ratio of the stocks it holds.
42
Price/Earnings Ratio. The ratio of a stock’s current price to its per-share earnings over the past year. For a fund, the weighted average P/E of the stocks it holds. P/E is an indicator of market expectations about corporate prospects; the higher the P/E, the greater the expectations for a company’s future growth.
R-Squared. A measure of how much of a fund’s past returns can be explained by the returns from the market in general, as measured by a given index. If a fund’s total returns were precisely synchronized with an index’s returns, its R-squared would be 1.00. If the fund’s returns bore no relationship to the index’s returns, its R-squared would be 0. For this report, R-squared is based on returns over the past 36 months for both the fund and the index.
Return on Equity. The annual average rate of return generated by a company during the past five years for each dollar of shareholder’s equity (net income divided by shareholder’s equity). For a fund, the weighted average return on equity for the companies whose stocks it holds.
Short-Term Reserves. The percentage of a fund invested in highly liquid, short-term securities that can be readily converted to cash.
Turnover Rate. An indication of the fund’s trading activity. Funds with high turnover rates incur higher transaction costs and may be more likely to distribute capital gains (which may be taxable to investors). The turnover rate excludes in-kind transactions, which have minimal impact on costs.
43
The People Who Govern Your Fund
The trustees of your mutual fund are there to see that the fund is operated and managed in your best interests since, as a shareholder, you are a part owner of the fund. Your fund’s trustees also serve on the board of directors of The Vanguard Group, Inc., which is owned by the Vanguard funds and provides services to them on an at-cost basis.
A majority of Vanguard’s board members are independent, meaning that they have no affiliation with Vanguard or the funds they oversee, apart from the sizable personal investments they have made as private individuals. The independent board members have distinguished backgrounds in business, academia, and public service. Each of the trustees and executive officers oversees 194 Vanguard funds.
The following table provides information for each trustee and executive officer of the fund. More information about the trustees is in the Statement of Additional Information, which can be obtained, without charge, by contacting Vanguard at 800-662-7447, or online at vanguard.com.
| InterestedTrustee1 | Rajiv L. Gupta |
| Born 1945. Trustee Since December 2001.2 Principal | |
| F. William McNabb III | Occupation(s) During the Past Five Years and Other |
| Born 1957. Trustee Since July 2009. Chairman of | Experience: Chairman and Chief Executive Officer |
| the Board. Principal Occupation(s) During the Past | (retired 2009) and President (2006–2008) of |
| Five Years and Other Experience: Chairman of the | Rohm and Haas Co. (chemicals); Director of Tyco |
| Board of The Vanguard Group, Inc., and of each of | International PLC (diversified manufacturing and |
| the investment companies served by The Vanguard | services), Hewlett-Packard Co. (electronic computer |
| Group, since January 2010; Director of The Vanguard | manufacturing), and Delphi Automotive PLC |
| Group since 2008; Chief Executive Officer and | (automotive components); Senior Advisor at New |
| President of The Vanguard Group, and of each of | Mountain Capital. |
| the investment companies served by The Vanguard | |
| Group, since 2008; Director of Vanguard Marketing | Amy Gutmann |
| Corporation; Managing Director of The Vanguard | Born 1949. Trustee Since June 2006. Principal |
| Group (1995–2008). | Occupation(s) During the Past Five Years and |
| Other Experience: President of the University of | |
| IndependentTrustees | Pennsylvania; Christopher H. Browne Distinguished |
| Professor of Political Science, School of Arts and | |
| Emerson U. Fullwood | Sciences, and Professor of Communication, Annenberg |
| Born 1948. Trustee Since January 2008. Principal | School for Communication, with secondary faculty |
| Occupation(s) During the Past Five Years and | appointments in the Department of Philosophy, School |
| Other Experience: Executive Chief Staff and | of Arts and Sciences, and at the Graduate School of |
| Marketing Officer for North America and Corporate | Education, University of Pennsylvania; Trustee of the |
| Vice President (retired 2008) of Xerox Corporation | National Constitution Center; Chair of the Presidential |
| (document management products and services); | Commission for the Study of Bioethical Issues. |
| Executive in Residence and 2009–2010 Distinguished | |
| Minett Professor at the Rochester Institute of | JoAnn Heffernan Heisen |
| Technology; Director of SPX Corporation (multi-industry | Born 1950. Trustee Since July 1998. Principal |
| manufacturing), the United Way of Rochester, | Occupation(s) During the Past Five Years and Other |
| Amerigroup Corporation (managed health care), the | Experience: Corporate Vice President and Chief |
| University of Rochester Medical Center, Monroe | Global Diversity Officer (retired 2008) and Member |
| Community College Foundation, and North Carolina | of the Executive Committee (1997–2008) of Johnson |
| A&T University. | & Johnson (pharmaceuticals/medical devices/ |
| consumer products); Director of Skytop Lodge | |
| Corporation (hotels), the University Medical Center | |
| at Princeton, the Robert Wood Johnson Foundation, | |
| and the Center for Talent Innovation; Member of | |
| the Advisory Board of the Institute for Women’s | |
| Leadership at Rutgers University. |
| F. Joseph Loughrey | Executive Officers | |
| Born 1949. Trustee Since October 2009. Principal | ||
| Occupation(s) During the Past Five Years and Other | Glenn Booraem | |
| Experience: President and Chief Operating Officer | Born 1967. Treasurer Since May 2015. Principal | |
| (retired 2009) of Cummins Inc. (industrial machinery); | Occupation(s) During the Past Five Years and | |
| Chairman of the Board of Hillenbrand, Inc. (specialized | Other Experience: Principal of The Vanguard Group, | |
| consumer services), and of Oxfam America; Director | Inc.; Treasurer of each of the investment companies | |
| of SKF AB (industrial machinery), Hyster-Yale Materials | served by The Vanguard Group; Controller of each of | |
| Handling, Inc. (forklift trucks), the Lumina Foundation | the investment companies served by The Vanguard | |
| for Education, and the V Foundation for Cancer | Group (2010–2015); Assistant Controller of each of | |
| Research; Member of the Advisory Council for the | the investment companies served by The Vanguard | |
| College of Arts and Letters and of the Advisory Board | Group (2001–2010). | |
| to the Kellogg Institute for International Studies, both | ||
| at the University of Notre Dame. | Thomas J. Higgins | |
| Born 1957. Chief Financial Officer Since September | ||
| Mark Loughridge | 2008. Principal Occupation(s) During the Past Five | |
| Born 1953. Trustee Since March 2012. Principal | Years and Other Experience: Principal of The Vanguard | |
| Occupation(s) During the Past Five Years and Other | Group, Inc.; Chief Financial Officer of each of the | |
| Experience: Senior Vice President and Chief Financial | investment companies served by The Vanguard Group; | |
| Officer (retired 2013) at IBM (information technology | Treasurer of each of the investment companies served | |
| services); Fiduciary Member of IBM’s Retirement Plan | by The Vanguard Group (1998–2008). | |
| Committee (2004–2013); Director of the Dow Chemical | ||
| Company; Member of the Council on Chicago Booth. | Peter Mahoney | |
| Born 1974. Controller Since May 2015. Principal | ||
| Scott C. Malpass | Occupation(s) During the Past Five Years and | |
| Born 1962. Trustee Since March 2012. Principal | Other Experience: Head of Global Fund Accounting | |
| Occupation(s) During the Past Five Years and Other | at The Vanguard Group, Inc.; Controller of each of the | |
| Experience: Chief Investment Officer and Vice | investment companies served by The Vanguard Group; | |
| President at the University of Notre Dame; Assistant | Head of International Fund Services at The Vanguard | |
| Professor of Finance at the Mendoza College of | Group (2008–2014). | |
| Business at Notre Dame; Member of the Notre Dame | ||
| 403(b) Investment Committee; Board Member of | Heidi Stam | |
| TIFF Advisory Services, Inc., and Catholic Investment | Born 1956. Secretary Since July 2005. Principal | |
| Services, Inc. (investment advisors); Member of | Occupation(s) During the Past Five Years and Other | |
| the Investment Advisory Committee of Major | Experience: Managing Director of The Vanguard | |
| League Baseball. | Group, Inc.; General Counsel of The Vanguard Group; | |
| Secretary of The Vanguard Group and of each of the | ||
| André F. Perold | investment companies served by The Vanguard Group; | |
| Born 1952. Trustee Since December 2004. Principal | Director and Senior Vice President of Vanguard | |
| Occupation(s) During the Past Five Years and Other | Marketing Corporation. | |
| Experience: George Gund Professor of Finance and | ||
| Banking, Emeritus at the Harvard Business School | Vanguard Senior ManagementTeam | |
| (retired 2011); Chief Investment Officer and Managing | Mortimer J. Buckley | Chris D. McIsaac |
| Partner of HighVista Strategies LLC (private investment | Kathleen C. Gubanich | James M. Norris |
| firm); Director of Rand Merchant Bank; Overseer of | Paul A. Heller | Thomas M. Rampulla |
| the Museum of Fine Arts Boston. | Martha G. King | Glenn W. Reed |
| John T. Marcante | Karin A. Risi | |
| Peter F. Volanakis | ||
| Born 1955. Trustee Since July 2009. Principal | ||
| Occupation(s) During the Past Five Years and Other | Chairman Emeritus and Senior Advisor | |
| Experience: President and Chief Operating Officer | ||
| (retired 2010) of Corning Incorporated (communications | John J. Brennan | |
| equipment); Trustee of Colby-Sawyer College; | ||
| Member of the Advisory Board of the Norris Cotton | Chairman, 1996–2009 | |
| Cancer Center and of the Advisory Board of the | ||
| Parthenon Group (strategy consulting). | Chief Executive Officer and President, 1996–2008 | |
| Founder | ||
| John C. Bogle | ||
| Chairman and Chief Executive Officer, 1974–1996 | ||
1 Mr. McNabb is considered an “interested person,” as defined in the Investment Company Act of 1940, because he is an officer of the
Vanguard funds.
2 December 2002 for Vanguard Equity Income Fund, the Vanguard Municipal Bond Funds, and the Vanguard State Tax-Exempt Funds.
 | |
| P.O. Box 2600 | |
| Valley Forge, PA 19482-2600 | |
| Connect with Vanguard® > vanguard.com | |
| Fund Information > 800-662-7447 | CFA® is a registered trademark owned by CFA Institute. |
| Direct Investor Account Services > 800-662-2739 | |
| Institutional Investor Services > 800-523-1036 | |
| Text Telephone for People | |
| Who Are Deaf or Hard of Hearing> 800-749-7273 | |
| This material may be used in conjunction | |
| with the offering of shares of any Vanguard | |
| fund only if preceded or accompanied by | |
| the fund’s current prospectus. | |
| All comparative mutual fund data are from Lipper, a | |
| Thomson Reuters Company, or Morningstar, Inc., unless | |
| otherwise noted. | |
| You can obtain a free copy of Vanguard’s proxy voting | |
| guidelines by visiting vanguard.com/proxyreporting or by | |
| calling Vanguard at 800-662-2739. The guidelines are | |
| also available from the SEC’s website, sec.gov. In | |
| addition, you may obtain a free report on how your fund | |
| voted the proxies for securities it owned during the 12 | |
| months ended June 30. To get the report, visit either | |
| vanguard.com/proxyreporting or sec.gov. | |
| You can review and copy information about your fund at | |
| the SEC’s Public Reference Room in Washington, D.C. To | |
| find out more about this public service, call the SEC at | |
| 202-551-8090. Information about your fund is also | |
| available on the SEC’s website, and you can receive | |
| copies of this information, for a fee, by sending a | |
| request in either of two ways: via email addressed to | |
| publicinfo@sec.gov or via regular mail addressed to the | |
| Public Reference Section, Securities and Exchange | |
| Commission, Washington, DC 20549-1520. | |
| © 2015 The Vanguard Group, Inc. | |
| All rights reserved. | |
| Vanguard Marketing Corporation, Distributor. | |
| Q930 112015 | |
Annual Report | September 30, 2015
Vanguard Structured Equity Funds
Vanguard Structured Large-Cap Equity Fund
Vanguard Structured Broad Market Fund
Vanguard’s Principles for Investing Success
We want to give you the best chance of investment success. These principles, grounded in Vanguard’s research and experience, can put you on the right path.
Goals. Create clear, appropriate investment goals.
Balance. Develop a suitable asset allocation using broadly diversified funds. Cost. Minimize cost.
Discipline. Maintain perspective and long-term discipline.
A single theme unites these principles: Focus on the things you can control.
We believe there is no wiser course for any investor.
| Contents | |
| Your Fund’s Total Returns. | 1 |
| Chairman’s Letter. | 2 |
| Advisor’s Report. | 8 |
| Structured Large-Cap Equity Fund. | 10 |
| Structured Broad Market Fund. | 26 |
| About Your Fund’s Expenses. | 44 |
| Glossary. | 46 |
Please note: The opinions expressed in this report are just that—informed opinions. They should not be considered promises or advice.
Also, please keep in mind that the information and opinions cover the period through the date on the front of this report. Of course, the
risks of investing in your fund are spelled out in the prospectus.
See the Glossary for definitions of investment terms used in this report.
About the cover: Pictured is a sailing block on the Brilliant, a 1932 schooner docked in Mystic, Connecticut. A type of pulley, the
sailing block helps coordinate the setting of the sails. At Vanguard, the intricate coordination of technology and people allows
us to help millions of clients around the world reach their financial goals.
Your Fund’s Total Returns
| Fiscal Year Ended September 30, 2015 | |
| Total | |
| Returns | |
| Vanguard Structured Large-Cap Equity Fund | |
| Institutional Shares | 1.03% |
| Institutional Plus Shares | 1.05 |
| S&P 500 Index | -0.61 |
| Large-Cap Core Funds Average | -2.30 |
| Large-Cap Core Funds Average: Derived from data provided by Lipper, a Thomson Reuters Company. | |
| Vanguard Structured Broad Market Fund | |
| Institutional Shares | 2.80% |
| Institutional Plus Shares | 2.84 |
| Russell 3000 Index | -0.49 |
| Multi-Cap Core Funds Average | -2.37 |
Multi-Cap Core Funds Average: Derived from data provided by Lipper, a Thomson Reuters Company.
Institutional Shares and Institutional Plus Shares are available to certain institutional investors who meet specific administrative, service, and
account-size criteria.
Your Fund’s Performance at a Glance
September 30, 2014, Through September 30, 2015
| Distributions Per Share | ||||
| Starting | Ending | |||
| Share | Share | Income | Capital | |
| Price | Price | Dividends | Gains | |
| Vanguard Structured Large-Cap Equity Fund | ||||
| Institutional Shares | $38.88 | $38.29 | $1.008 | $0.000 |
| Institutional Plus Shares | 76.94 | 75.80 | 1.987 | 0.000 |
| Vanguard Structured Broad Market Fund | ||||
| Institutional Shares | $37.28 | $33.24 | $0.630 | $4.466 |
| Institutional Plus Shares | 74.52 | 66.43 | 1.302 | 8.924 |
1

Chairman’s Letter
Dear Shareholder,
The fiscal year ended September 30, 2015, was a volatile one for financial markets. Initially, stock prices headed higher amid largely positive developments regarding the domestic economy. As the period progressed, however, the ride got bumpier. A number of concerns affected investor sentiment, including the pace of growth at home and abroad and the fall in the price of oil and other commodities. The prospect of a Federal Reserve rate hike, the impact of a strong U.S. dollar on corporate profits, and seemingly lofty stock market valuations also weighed on returns.
For the 12-month period, Vanguard Structured Large-Cap Equity Fund returned 1.03% for Institutional Shares and a little more, 1.05%, for Institutional Plus Shares, which have a lower expense ratio. It surpassed the slightly negative result of its benchmark, the S&P 500 Index, by more than 1 percentage point and the average return of its peers by more than 3 percentage points.
Mid- and small-capitalization stocks performed a little better than large-caps. Institutional Shares of Vanguard Structured Broad Market Fund returned 2.80% and Institutional Plus Shares 2.84%. This fund outpaced its comparative standards by wider margins than its large-cap counterpart. It beat its benchmark, the Russell 3000 Index, by more than 3 percentage points and the average return of its peers by more than 5 percentage points.
2
Results by sector varied widely. For both funds, however, consumer discretionary and energy were among the biggest relative contributors, helping to offset subpar performances in other sectors including telecommunications and financials.
Please note: At the end of the reporting period, we estimated that the Structured Broad Market Fund would distribute capital gains equal to 7.6% of net assets in mid-December. The distribution will be almost all long-term gains.
China’s economic woes weighed on global stocks
The broad U.S. stock market returned –0.49% for the 12 months. The final two months were rocky as investors worried in particular about the global ripple effects of slower economic growth in China.
For much of the fiscal year, investors were preoccupied with the possibility of an increase in short-term interest rates. On September 17, the Federal Reserve announced that it would hold rates steady for the time being, a decision that to some investors indicated the Fed’s concern about the fragility of global markets.
International stocks returned about –11% as the dollar’s strength against many foreign currencies weighed on results. Returns for emerging markets, which were especially hard hit by concerns about China, trailed those of the developed markets of the Pacific region and Europe.
Taxable bonds recorded gains as investors searched for safety
The broad U.S. taxable bond market returned 2.94% as investors gravitated toward safe-haven assets amid global
| Market Barometer | |||
| Average Annual Total Returns | |||
| Periods Ended September 30, 2015 | |||
| One | Three | Five | |
| Year | Years | Years | |
| Stocks | |||
| Russell 1000 Index (Large-caps) | -0.61% | 12.66% | 13.42% |
| Russell 2000 Index (Small-caps) | 1.25 | 11.02 | 11.73 |
| Russell 3000 Index (Broad U.S. market) | -0.49 | 12.53 | 13.28 |
| FTSE All-World ex US Index (International) | -11.34 | 2.87 | 2.19 |
| Bonds | |||
| Barclays U.S. Aggregate Bond Index (Broad taxable market) | 2.94% | 1.71% | 3.10% |
| Barclays Municipal Bond Index (Broad tax-exempt market) | 3.16 | 2.88 | 4.14 |
| Citigroup Three-Month U.S. Treasury Bill Index | 0.02 | 0.02 | 0.04 |
| CPI | |||
| Consumer Price Index | -0.04% | 0.93% | 1.73% |
3
stock market turmoil. Stimulative monetary policies from the world’s central banks, declining inflation expectations, and global investors’ search for higher yields also helped lift U.S. bonds.
The yield of the 10-year Treasury note ended September at 2.05%, down from 2.48% a year earlier. (Bond prices and yields move in opposite directions.)
International bond markets (as measured by the Barclays Global Aggregate Index ex USD) returned –7.67%; the dollar’s strength was a significant factor here as well. Without this currency effect, international bonds advanced modestly.
The Fed’s 0%–0.25% target for short-term interest rates continued to limit returns for money market funds and savings accounts.
The funds’ quantitative screening produced benchmarkbeating results
The funds’ advisor, Vanguard Quantitative Equity Group, seeks to construct portfolios whose characteristics—stock market capitalization, sector allocation, and risk profile—closely match those of each fund’s benchmark. The advisor selects a subset of the stocks in the benchmarks using computer-driven quantitative models that consider criteria such as valuations, earnings growth potential, and market sentiment.
This screening process met with success in a majority of the sectors in both funds. Outperformance was especially strong among holdings in the media, home improvement, and automotive retailing segments of the consumer discretionary sector. For the broad market fund, the apparel segment was a bright spot as well.
The energy sector continued to suffer from the sharp drop in the price of oil and returned roughly –30% in each of the benchmarks. The funds were able to produce better returns, however, by holding oil and gas stocks that held up better than the sector as a whole. The broad market fund also benefited from underweighting the oil and gas equipment and services segment.
Another area of strength for the broad market fund was the information technology sector, where its holdings in software stocks produced double-digit returns.
The funds underperformed their benchmarks in a few sectors. In financials, outsized holdings in consumer finance hurt both funds. Regional banks were a weak spot for the broad market fund. And both funds disappointed in telecommunication services.
For more information about the advisor’s approach and the funds’ positioning during the year, please see the Advisor’s Report that follows this letter.
The funds have weathered ups and downs in the market
The Institutional Shares of both funds have been around for close to a decade, so their advisor has navigated them through the 2008–2009 financial crisis as well as some
4
heady times in the markets before and after that. Although the funds haven’t bested their benchmarks every fiscal year, they have outperformed over the longer term through good markets and bad. This is a testament to the good stewardship of the funds’ advisor as well as the merit of our low-cost structure.
The large-cap fund’s Institutional Shares have produced an average annual return of 6.87% since their launch in May 2006, while the benchmark returned 6.56%. The Broad Market Fund’s Institutional Shares have returned a little less than that, 6.49%, since their launch in November 2006, compared with 6.00% for the benchmark.
Both funds outpaced the average return of their peers by even wider margins over the same periods.
A dose of discipline is crucial when markets become volatile
Although the broad U.S. stock market has posted gains for six straight calendar years—from 2009 to 2014—that streak may not last a seventh. Stocks tumbled in August and swung up and down in September.
Nobody can control the direction of the markets or reliably predict where they’ll go in the short term. However, investors can control how they react to volatility.
| Total Returns | |
| Inception Through September 30, 2015 | |
| Average | |
| Annual Return | |
| Structured Large-Cap Equity Fund Institutional Shares (Returns since inception: 5/16/2006) | 6.87% |
| S&P 500 Index | 6.56 |
| Large-Cap Core Funds Average | 5.30 |
| Large-Cap Core Funds Average: Derived from data provided by Lipper, a Thomson Reuters Company. | |
| Structured Broad Market Fund Institutional Shares (Returns since inception: 11/30/2006) | 6.49% |
| Russell 3000 Index | 6.00 |
| Multi-Cap Core Funds Average | 4.70 |
| Multi-Cap Core Funds Average: Derived from data provided by Lipper, a Thomson Reuters Company. | |
The figures shown represent past performance, which is not a guarantee of future results. (Current performance may be
lower or higher than the performance data cited. For performance data current to the most recent month-end, visit our
website at vanguard.com/performance.) Note, too, that both investment returns and principal value can fluctuate widely, so
an investor’s shares, when sold, could be worth more or less than their original cost.
5
Staying the course can help you stay closer to your fund’s return
When stock markets are highly volatile, as in recent months, it’s tempting to run for cover. But the price of panic can be high.
A rough measure of what can be lost from attempts to time the market is the difference between the returns produced by a fund and the returns earned by the fund’s investors.
The results shown in the Performance Summary later in this report are your fund’s time-weighted returns—the average annual returns investors would have earned if they had invested a lump sum in the fund at the start of the period and reinvested any distributions they received. Their actual returns, however, depend on whether they subsequently bought or sold any shares. There’s often a gap between this dollar-weighted return for investors and the fund’s time-weighted return, as shown below.
Many sensible investment behaviors can contribute to the difference in returns, but industry cash flow data suggest that one important factor is the generally counterproductive effort to buy and sell at the “right” time. Keeping your emotions in check can help narrow the gap.
Mutual fund returns and investor returns over the last decade
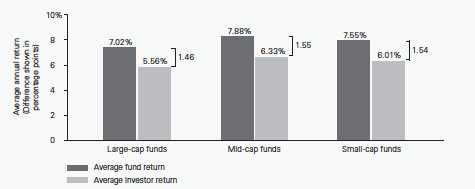
fund returns are the average of the funds’ time-weighted returns in each category. The average investor returns assume that the growth
of a fund’s total net assets for a given period is driven by market returns and investor cash ow. To calculate investor return, a fund’s
change in assets for the period is discounted by the return of the fund to isolate how much of the asset growth was driven by cash ow.
A model, similar to an internal rate-of-return calculation, is then used to calculate a constant growth rate that links the beginning total
net assets and periodic cash ows to the ending total net assets.
Sources: Vanguard and Morningstar, Inc.
6
During periods of market adversity, it’s more important than ever to keep sight of one of Vanguard’s key principles: Maintain perspective and long-term discipline. Whether you’re investing for yourself or on behalf of clients, your success is affected greatly by how you respond—or don’t respond—during turbulent markets. (You can read Vanguard’s Principles for Investing Success at vanguard.com/research.)
As I’ve written in the past, the best course for long-term investors is generally to ignore daily market moves and not make decisions based on emotion. (See the box on page 6 for more discussion on the benefit of staying the course.) This is also a good time to evaluate your portfolio and make sure your asset allocation is aligned with your time horizon, goals, and risk tolerance.
The markets are unpredictable and often confounding. Keeping our long-term plans clearly in focus can be crucial as we weather these periodic storms.
As always, thank you for investing with Vanguard.
Sincerely,

F. William McNabb III
Chairman and Chief Executive Officer
October 13, 2015
7
Advisor’s Report
For the fiscal year ended September 30, 2015, Vanguard Structured Large-Cap Equity Fund returned 1.03% for Institutional Shares and 1.05% for Institutional Plus Shares, outpacing the –0.61% return of its benchmark, the S&P 500 Index. Vanguard Structured Broad Market Fund returned 2.80% for Institutional Shares and 2.84% for Institutional Plus Shares, surpassing the –0.49% return of its benchmark, the Russell 3000 Index.
U.S. equities ended relatively flat after giving up most of their gains in late August. Small-capitalization stocks outperformed large-caps. The U.S. equity market remained ahead of international markets, although developed markets proved more resilient than emerging markets.
Sector performance was mixed; six out of ten generated positive returns. Results were best in consumer discretionary, health care, and consumer staples; energy, materials, and industrials lagged.
After six straight years of gains, the U.S. stock market declined slightly. The Federal Reserve held off on raising interest rates in order to facilitate further progress toward its employment and inflation targets. Second-quarter real GDP increased at an annual rate of 3.9% compared with an increase of 0.6% in the first quarter. This growth reflected positive contributions from exports, an acceleration in personal consumption expenditures, and an increase in state and local government spending. The unemployment rate has continued to improve. The U.S. nonfarm payroll rose by 142,000 in September, and the unemployment rate declined to 5.1% from 5.9% a year ago.
The economic slowdown overseas, especially in emerging markets, added to recent market volatility. Emerging-market currencies have lost value against the U.S. dollar. The possibility that the Fed might raise interest rates by the end of 2015 has pushed the dollar up and spurred capital outflows from these countries. Many emerging economies have also been affected by weak commodity prices that have contributed to lower export growth. China’s ongoing slowdown still represents significant downside risk to overall emerging-market performance.
Although we seek to understand the impact of macro factors on fund performance, our investment process is focused on specific stock fundamentals. We compare stocks within industry groups to identify those with characteristics that we believe will help them outperform over the long run. Our strict quantitative model analyzes valuation and other factors centered on fundamental growth, and we use the results to construct our portfolio. Our goal is to maximize expected return and minimize exposure to risks that our research indicates do not improve returns, such as deviations from market-capitalization and sector weightings relative to the benchmark.
The growth and management decisions components of our model produced superior relative results for both the
8
Structured Large-Cap Equity Fund and the Structured Broad Market Fund. However, the valuation component did not perform as expected.
The model’s overall effectiveness during the period was mixed. Stock selection was helpful in six out of ten sectors for the Structured Large-Cap Equity Fund, particularly in consumer discretionary, energy, and health care. We underperformed slightly in industrials, financials, telecommunications, and utilities. Stock picks boosted returns in seven out of ten sectors for the Structured Broad Market Fund; the strongest results came from consumer discretionary, information technology, and energy. However, our choices lagged slightly in financials, consumer staples, and telecommunications.
Structured LargeCap Equity Fund
At the individual stock level, the largest contributions came from overweighted positions in Electronic Arts (+90%), O’Reilly Automotive (+66%), and Tesoro (+53%). Relative to its benchmark, the portfolio benefited from underweighting or avoiding poor performers such as Chevron Corporation (–31%) and Qualcomm (–26%).
Unfortunately, we were not able to avoid all detractors. Overweighted positions in United Rentals (–42%) and National Oilwell Varco (–46%) directly lowered returns. And underweighting companies that our model did not pick, such as Amazon (+59%) and Visa (+32%), hurt relative performance.
Structured Broad Market Fund
At the individual stock level, the largest contributions came from overweighted positions in Skechers (+152%), Manhattan Associates (+86%), and Cablevision (+91%). Relative performance benefited from underweighting or avoiding stocks including Halliburton (–44%) and Micron Technology (–56%).
Overweighted positions in Century Aluminum (–21%) and Greenbrier Companies (–38%) reduced portfolio results. Underweighting companies not selected by our model, such as Walgreens Boots Alliance (+43%) and Facebook (+14%), restrained relative performance.
We believe that the Structured Large-Cap Equity and Structured Broad Market Funds offer a strong mix of stocks with attractive valuations and growth characteristics relative to their benchmarks. We recognize that risk can reward or punish us in the near term. However, we continue to believe that constructing a portfolio that focuses on the fundamentals described above will benefit investors over the long term.
We thank you for your investment and look forward to the coming fiscal year.
Portfolio Managers:
James P. Stetler, Principal
James D. Troyer, CFA, Principal
Michael R. Roach, CFA
Vanguard Quantitative Equity Group
October 15, 2015
9
Structured Large-Cap Equity Fund
Fund Profile
As of September 30, 2015
| Share-Class Characteristics | ||
| Institutional | Institutional | |
| Shares | Plus Shares | |
| Ticker Symbol | VSLIX | VSLPX |
| Expense Ratio1 | 0.24% | 0.17% |
| 30-Day SEC Yield | 2.09% | 2.13% |
| Portfolio Characteristics | |||
| DJ | |||
| U.S. | |||
| Total | |||
| Market | |||
| S&P 500 | FA | ||
| Fund | Index | Index | |
| Number of Stocks | 176 | 505 | 4,000 |
| Median Market Cap | $50.2B | $75.8B | $46.5B |
| Price/Earnings Ratio | 18.9x | 18.9x | 20.2x |
| Price/Book Ratio | 2.7x | 2.6x | 2.5x |
| Return on Equity | 18.5% | 18.2% | 17.2% |
| Earnings Growth | |||
| Rate | 11.3% | 9.8% | 10.1% |
| Dividend Yield | 2.3% | 2.3% | 2.1% |
| Foreign Holdings | 0.0% | 0.0% | 0.0% |
| Turnover Rate | 73% | — | — |
| Short-Term | |||
| Reserves | 0.0% | — | — |
| Volatility Measures | ||
| DJ | ||
| U.S. Total | ||
| S&P 500 | Market | |
| Index | FA Index | |
| R-Squared | 0.98 | 0.97 |
| Beta | 0.98 | 0.95 |
| These measures show the degree and timing of the fund’s | ||
| fluctuations compared with the indexes over 36 months. | ||
| Ten Largest Holdings (% of total net assets) | ||
| Apple Inc. | Technology | |
| Hardware, Storage & | ||
| Peripherals | 4.2% | |
| Johnson & Johnson | Pharmaceuticals | 1.9 |
| JPMorgan Chase & Co. | Diversified Banks | 1.8 |
| Google Inc. | Internet Software & | |
| Services | 1.6 | |
| Microsoft Corp. | Systems Software | 1.5 |
| Verizon Communications Integrated | ||
| Inc. | Telecommunication | |
| Services | 1.4 | |
| Home Depot Inc. | Home Improvement | |
| Retail | 1.4 | |
| Citigroup Inc. | Diversified Banks | 1.4 |
| Gilead Sciences Inc. | Biotechnology | 1.3 |
| Exxon Mobil Corp. | Integrated Oil & Gas | 1.3 |
| Top Ten | 17.8% | |
| The holdings listed exclude any temporary cash investments and equity index products. | ||
Investment Focus
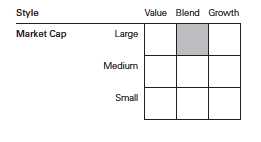
1 The expense ratios shown are from the prospectus dated January 26, 2015. For the fiscal year ended September 30, 2015, the expense ratios were
0.20% for Institutional Shares and 0.16% for Institutional Plus Shares.
10
Structured Large-Cap Equity Fund
| Sector Diversification (% of equity exposure) | |||
| DJ | |||
| U.S. Total | |||
| S&P 500 | Market | ||
| Fund | Index FA Index | ||
| Consumer | |||
| Discretionary | 13.7% | 13.1% | 13.7% |
| Consumer Staples | 9.1 | 9.9 | 8.7 |
| Energy | 6.4 | 6.9 | 6.3 |
| Financials | 16.5 | 16.5 | 18.3 |
| Health Care | 15.4 | 14.7 | 14.4 |
| Industrials | 10.8 | 10.1 | 10.6 |
| Information | |||
| Technology | 19.5 | 20.4 | 19.6 |
| Materials | 3.3 | 2.8 | 3.1 |
| Telecommunication | |||
| Services | 2.1 | 2.4 | 2.1 |
| Utilities | 3.2 | 3.2 | 3.2 |
11
Structured Large-Cap Equity Fund
Performance Summary
All of the returns in this report represent past performance, which is not a guarantee of future results that may be achieved by the fund. (Current performance may be lower or higher than the performance data cited. For performance data current to the most recent month-end, visit our website at vanguard.com/performance.) Note, too, that both investment returns and principal value can fluctuate widely, so an investor’s shares, when sold, could be worth more or less than their original cost. The returns shown do not reflect taxes that a shareholder would pay on fund distributions or on the sale of fund shares.
Cumulative Performance: May 16, 2006, Through September 30, 2015
Initial Investment of $5,000,000
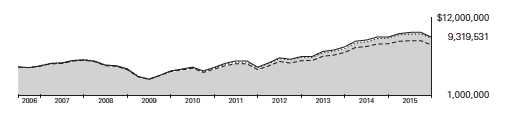
| Average Annual Total Returns | |||||
| Periods Ended September 30, 2015 | |||||
| Since | Final Value | ||||
| One | Five | Inception | of a $5,000,000 | ||
| Year | Years | (5/16/2006) | Investment | ||
| Structured Large-Cap Equity | |||||
| Fund*Institutional Shares | 1.03% | 15.11% | 6.87% | $9,319,531 | |
| •••••••• | S&P 500 Index | -0.61 | 13.34 | 6.56 | 9,071,525 |
| – – – – | Large-Cap Core Funds Average | -2.30 | 11.57 | 5.30 | 8,117,336 |
| Dow Jones U.S. Total Stock Market | |||||
| Float Adjusted Index | -0.55 | 13.26 | 6.74 | 9,217,911 | |
Large-Cap Core Funds Average: Derived from data provided by Lipper, a Thomson Reuters Company.
"Since Inception" performance is calculated from the Institutional Shares’ inception date for both the fund and its comparative standards.
| Since | Final Value | |||
| One | Five | Inception | of a $200,000,000 | |
| Year | Years | (5/15/2006) | Investment | |
| Structured Large-Cap Equity Fund Institutional | ||||
| Plus Shares | 1.05% | 15.18% | 6.92% | $374,718,788 |
| S&P 500 Index | -0.61 | 13.34 | 6.54 | 324,173,929 |
| Dow Jones U.S. Total Stock Market Float | ||||
| Adjusted Index | -0.55 | 13.26 | 6.72 | 368,159,218 |
"Since Inception" performance is calculated from the Institutional Plus Shares’ inception date for both the fund and its comparative standards.
See Financial Highlights for dividend and capital gains information.
12
Structured Large-Cap Equity Fund
Fiscal-Year Total Returns (%): May 16, 2006, Through September 30, 2015
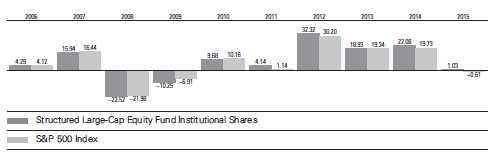
13
Structured Large-Cap Equity Fund
Financial Statements
Statement of Net Assets
As of September 30, 2015
The fund reports a complete list of its holdings in regulatory filings four times in each fiscal year, at the quarter-ends. For the second and fourth fiscal quarters, the lists appear in the fund’s semiannual and annual reports to shareholders. For the first and third fiscal quarters, the fund files the lists with the Securities and Exchange Commission on Form N-Q. Shareholders can look up the fund’s Forms N-Q on the SEC’s website at sec.gov. Forms N-Q may also be reviewed and copied at the SEC’s Public Reference Room (see the back cover of this report for further information).
| Market | |||
| Value• | |||
| Shares | ($000) | ||
| Common Stocks (99.9%)1 | |||
| Consumer Discretionary (13.7%) | |||
| Home Depot Inc. | 67,075 | 7,747 | |
| Walt Disney Co. | 65,779 | 6,723 | |
| * | Amazon.com Inc. | 11,907 | 6,095 |
| NIKE Inc. Class B | 45,200 | 5,558 | |
| Comcast Corp. Class A | 91,457 | 5,202 | |
| Target Corp. | 57,100 | 4,491 | |
| * | O’Reilly Automotive Inc. | 15,500 | 3,875 |
| Lowe’s Cos. Inc. | 55,926 | 3,854 | |
| Carnival Corp. | 73,100 | 3,633 | |
| Delphi Automotive plc | 46,600 | 3,543 | |
| Expedia Inc. | 27,300 | 3,213 | |
| Darden Restaurants Inc. | 46,300 | 3,173 | |
| Goodyear Tire | |||
| & Rubber Co. | 106,700 | 3,130 | |
| Marriott International Inc. | |||
| Class A | 45,350 | 3,093 | |
| Leggett & Platt Inc. | 68,300 | 2,817 | |
| Best Buy Co. Inc. | 71,220 | 2,644 | |
| Interpublic Group | |||
| of Cos. Inc. | 130,857 | 2,503 | |
| Hasbro Inc. | 28,800 | 2,078 | |
| GameStop Corp. Class A | 13,200 | 544 | |
| Comcast Corp. Special | |||
| Class A | 9,268 | 531 | |
| DR Horton Inc. | 7,400 | 217 | |
| 74,664 | |||
| Consumer Staples (9.1%) | |||
| PepsiCo Inc. | 75,192 | 7,091 | |
| Costco Wholesale Corp. | 34,500 | 4,988 | |
| Reynolds American Inc. | 96,600 | 4,276 | |
| Kroger Co. | 111,700 | 4,029 | |
| Clorox Co. | 30,700 | 3,547 | |
| Dr Pepper Snapple | |||
| Group Inc. | 43,800 | 3,462 | |
| Procter & Gamble Co. | 46,794 | 3,366 | |
| Archer-Daniels-Midland Co. | 80,300 | 3,328 | |
| ConAgra Foods Inc. | 80,000 | 3,241 | |
| Campbell Soup Co. | 61,800 | 3,132 | |
| Altria Group Inc. | 49,500 | 2,693 | |
| Coca-Cola Co. | 50,380 | 2,021 | |
| Wal-Mart Stores Inc. | 16,746 | 1,086 | |
| Philip Morris | |||
| International Inc. | 12,236 | 971 | |
| CVS Health Corp. | 9,500 | 917 | |
| Hormel Foods Corp. | 10,000 | 633 | |
| Colgate-Palmolive Co. | 9,200 | 584 | |
| Coca-Cola Enterprises Inc. | 2,700 | 130 | |
| 49,495 | |||
| Energy (6.4%) | |||
| Exxon Mobil Corp. | 96,439 | 7,170 | |
| Valero Energy Corp. | 63,000 | 3,786 | |
| Marathon Petroleum Corp. | 77,800 | 3,604 | |
| Tesoro Corp. | 34,500 | 3,355 | |
| ^ | Transocean Ltd. | 207,200 | 2,677 |
| Spectra Energy Corp. | 101,700 | 2,672 | |
| Ensco plc Class A | 187,700 | 2,643 | |
| * | FMC Technologies Inc. | 81,400 | 2,523 |
| Noble Corp. plc | 217,100 | 2,369 | |
| Chevron Corp. | 22,856 | 1,803 | |
| Schlumberger Ltd. | 25,325 | 1,747 | |
| * | Cameron International Corp. | 6,100 | 374 |
| Phillips 66 | 1,800 | 138 | |
| 34,861 | |||
| Financials (16.4%) | |||
| JPMorgan Chase & Co. | 161,479 | 9,845 | |
| Citigroup Inc. | 152,125 | 7,547 | |
| Wells Fargo & Co. | 135,235 | 6,944 | |
| Bank of America Corp. | 444,653 | 6,928 | |
| Bank of New York | |||
| Mellon Corp. | 104,200 | 4,079 | |
14
Structured Large-Cap Equity Fund
| Market | |||
| Value• | |||
| Shares | ($000) | ||
| PNC Financial Services | |||
| Group Inc. | 45,200 | 4,032 | |
| Travelers Cos. Inc. | 38,000 | 3,782 | |
| Progressive Corp. | 116,200 | 3,560 | |
| Hartford Financial | |||
| Services Group Inc. | 75,300 | 3,447 | |
| Northern Trust Corp. | 47,100 | 3,210 | |
| * | E*TRADE Financial Corp. | 119,000 | 3,133 |
| Cincinnati Financial Corp. | 57,300 | 3,083 | |
| * | Berkshire Hathaway Inc. | ||
| Class B | 20,105 | 2,622 | |
| Legg Mason Inc. | 60,000 | 2,497 | |
| Nasdaq Inc. | 45,400 | 2,421 | |
| Moody’s Corp. | 23,400 | 2,298 | |
| AvalonBay | |||
| Communities Inc. | 12,600 | 2,203 | |
| * | Berkshire Hathaway Inc. | ||
| Class A | 11 | 2,148 | |
| Equinix Inc. | 7,200 | 1,969 | |
| Prudential Financial Inc. | 23,400 | 1,783 | |
| Weyerhaeuser Co. | 61,400 | 1,679 | |
| Kimco Realty Corp. | 68,500 | 1,673 | |
| Apartment Investment | |||
| & Management Co. | 42,400 | 1,570 | |
| Navient Corp. | 131,500 | 1,478 | |
| CME Group Inc. | 9,100 | 844 | |
| HCP Inc. | 21,500 | 801 | |
| Public Storage | 3,600 | 762 | |
| General Growth | |||
| Properties Inc. | 25,700 | 667 | |
| Prologis Inc. | 16,700 | 650 | |
| KeyCorp | 35,000 | 455 | |
| Welltower Inc. | 5,800 | 393 | |
| Essex Property Trust Inc. | 1,700 | 380 | |
| Simon Property Group Inc. | 2,000 | 367 | |
| Realty Income Corp. | 3,600 | 171 | |
| SunTrust Banks Inc. | 2,900 | 111 | |
| 89,532 | |||
| Health Care (15.4%) | |||
| Johnson & Johnson | 112,046 | 10,460 | |
| Gilead Sciences Inc. | 73,100 | 7,178 | |
| Bristol-Myers Squibb Co. | 94,800 | 5,612 | |
| Eli Lilly & Co. | 65,887 | 5,514 | |
| AbbVie Inc. | 95,968 | 5,222 | |
| * | Biogen Inc. | 14,600 | 4,260 |
| * | Express Scripts Holding Co. | 52,400 | 4,242 |
| UnitedHealth Group Inc. | 35,800 | 4,153 | |
| Aetna Inc. | 37,000 | 4,048 | |
| Anthem Inc. | 27,300 | 3,822 | |
| Amgen Inc. | 26,700 | 3,693 | |
| Cardinal Health Inc. | 45,100 | 3,465 | |
| Pfizer Inc. | 106,575 | 3,348 | |
| * | HCA Holdings Inc. | 43,000 | 3,326 |
| AmerisourceBergen Corp. | |||
| Class A | 34,500 | 3,277 | |
| Zoetis Inc. | 75,500 | 3,109 | |
| Baxalta Inc. | 96,700 | 3,047 | |
| Merck & Co. Inc. | 39,844 | 1,968 | |
| Abbott Laboratories | 22,900 | 921 | |
| * | Regeneron | ||
| Pharmaceuticals Inc. | 1,800 | 837 | |
| * | Allergan plc | 2,777 | 755 |
| CR Bard Inc. | 3,900 | 727 | |
| Cigna Corp. | 3,100 | 419 | |
| Medtronic plc | 5,400 | 361 | |
| * | Celgene Corp. | 2,200 | 238 |
| 84,002 | |||
| Industrials (10.8%) | |||
| 3M Co. | 38,000 | 5,387 | |
| Boeing Co. | 41,100 | 5,382 | |
| General Electric Co. | 203,122 | 5,123 | |
| United Parcel Service Inc. | |||
| Class B | 50,300 | 4,964 | |
| Lockheed Martin Corp. | 23,000 | 4,768 | |
| General Dynamics Corp. | 30,600 | 4,221 | |
| Northrop Grumman Corp. | 24,100 | 4,000 | |
| Southwest Airlines Co. | 98,600 | 3,751 | |
| PACCAR Inc. | 59,400 | 3,099 | |
| Pitney Bowes Inc. | 145,300 | 2,884 | |
| Cintas Corp. | 33,600 | 2,881 | |
| Ryder System Inc. | 31,500 | 2,332 | |
| * | United Continental | ||
| Holdings Inc. | 43,700 | 2,318 | |
| Rockwell Automation Inc. | 17,200 | 1,745 | |
| Delta Air Lines Inc. | 32,100 | 1,440 | |
| * | United Rentals Inc. | 22,500 | 1,351 |
| Honeywell International Inc. | 12,000 | 1,136 | |
| Rockwell Collins Inc. | 11,100 | 909 | |
| Illinois Tool Works Inc. | 6,000 | 494 | |
| Equifax Inc. | 4,700 | 457 | |
| Masco Corp. | 9,600 | 242 | |
| 58,884 | |||
| Information Technology (19.5%) | |||
| Apple Inc. | 205,774 | 22,697 | |
| Microsoft Corp. | 189,641 | 8,394 | |
| International Business | |||
| Machines Corp. | 45,240 | 6,558 | |
| Accenture plc Class A | 50,500 | 4,962 | |
| * | Google Inc. Class A | 7,605 | 4,855 |
| Avago Technologies Ltd. | |||
| Class A | 31,900 | 3,988 | |
| * | Google Inc. Class C | 6,430 | 3,912 |
| * | Facebook Inc. Class A | 40,350 | 3,627 |
| * | Electronic Arts Inc. | 53,300 | 3,611 |
15
Structured Large-Cap Equity Fund
| Market | |||
| Value• | |||
| Shares | ($000) | ||
| * | Fiserv Inc. | 40,150 | 3,477 |
| Hewlett-Packard Co. | 133,750 | 3,425 | |
| Skyworks Solutions Inc. | 39,400 | 3,318 | |
| Total System Services Inc. | 70,400 | 3,198 | |
| Western Union Co. | 171,500 | 3,149 | |
| Juniper Networks Inc. | 120,600 | 3,101 | |
| Computer Sciences Corp. | 50,400 | 3,094 | |
| * | F5 Networks Inc. | 26,200 | 3,034 |
| Intuit Inc. | 31,700 | 2,813 | |
| * | Red Hat Inc. | 37,500 | 2,696 |
| MasterCard Inc. Class A | 28,900 | 2,605 | |
| Intel Corp. | 63,253 | 1,906 | |
| Seagate Technology plc | 38,000 | 1,702 | |
| NVIDIA Corp. | 57,900 | 1,427 | |
| Cisco Systems Inc. | 51,515 | 1,352 | |
| Visa Inc. Class A | 19,100 | 1,331 | |
| Oracle Corp. | 25,588 | 924 | |
| * | Citrix Systems Inc. | 9,700 | 672 |
| Paychex Inc. | 4,700 | 224 | |
| QUALCOMM Inc. | 2,057 | 111 | |
| 106,163 | |||
| Materials (3.3%) | |||
| LyondellBasell Industries | |||
| NV Class A | 46,200 | 3,851 | |
| ^ | Dow Chemical Co. | 77,700 | 3,295 |
| Sealed Air Corp. | 64,000 | 3,000 | |
| Avery Dennison Corp. | 52,700 | 2,981 | |
| Sherwin-Williams Co. | 12,900 | 2,874 | |
| International Paper Co. | 48,700 | 1,841 | |
| 17,842 | |||
| Telecommunication Services (2.1%) | |||
| Verizon | |||
| Communications Inc. | 178,096 | 7,749 | |
| AT&T Inc. | 104,804 | 3,414 | |
| 11,163 | |||
| Utilities (3.2%) | |||
| Public Service Enterprise | |||
| Group Inc. | 87,700 | 3,697 | |
| Edison International | 58,400 | 3,683 | |
| Exelon Corp. | 118,300 | 3,514 | |
| FirstEnergy Corp. | 102,800 | 3,219 | |
| Consolidated Edison Inc. | 28,200 | 1,885 | |
| American Electric | |||
| Power Co. Inc. | 26,600 | 1,513 | |
| 17,511 | |||
| Total Common Stocks | |||
| (Cost $484,859) | 544,117 | ||
| Market | ||
| Value• | ||
| Shares | ($000) | |
| Temporary Cash Investments (0.3%)1 | ||
| Money Market Fund (0.3%) | ||
| 2,3 Vanguard Market | ||
| Liquidity Fund, 0.189% | 1,450,318 | 1,450 |
| Face | ||
| Amount | ||
| ($000) | ||
| U.S. Government and Agency Obligations (0.0%) | ||
| 4,5 Federal Home Loan | ||
| Bank Discount Notes, | ||
| 0.150%, 11/13/15 | 200 | 200 |
| Total Temporary Cash Investments | ||
| (Cost $1,650) | 1,650 | |
| Total Investments (100.2%) | ||
| (Cost $486,509) | 545,767 | |
| Amount | ||
| ($000) | ||
| Other Assets and Liabilities (-0.2%) | ||
| Other Assets | ||
| Investments in Vanguard | 50 | |
| Receivables for Accrued Income | 505 | |
| Receivables for Capital Shares Issued | 3 | |
| Total Other Assets | 558 | |
| Liabilities | ||
| Collateral for Securities on Loan | (1,046) | |
| Payables to Vanguard | (483) | |
| Total Liabilities | (1,529) | |
| Net Assets (100%) | 544,796 | |
16
Structured Large-Cap Equity Fund
| At September 30, 2015, net assets consisted of: | |
| Amount | |
| ($000) | |
| Paid-in Capital | 461,137 |
| Undistributed Net Investment Income | 7,832 |
| Accumulated Net Realized Gains | 16,585 |
| Unrealized Appreciation (Depreciation) | |
| Investment Securities | 59,258 |
| Futures Contracts | (16) |
| Net Assets | 544,796 |
| Institutional Shares—Net Assets | |
| Applicable to 2,268,106 outstanding | |
| $.001 par value shares of beneficial | |
| interest (unlimited authorization) | 86,839 |
| Net Asset Value Per Share— | |
| Institutional Shares | $38.29 |
| Institutional Plus Shares—Net Assets | |
| Applicable to 6,041,335 outstanding | |
| $.001 par value shares of beneficial | |
| interest (unlimited authorization) | 457,957 |
| Net Asset Value Per Share— | |
| Institutional Plus Shares | $75.80 |
• See Note A in Notes to Financial Statements.
* Non-income-producing security.
^ Includes partial security positions on loan to broker-dealers. The total value of securities on loan is $1,043,000.
1 The fund invests a portion of its cash reserves in equity markets through the use of index futures contracts. After giving effect to futures
investments, the fund’s effective common stock and temporary cash investment positions represent 100.0% and 0.2%, respectively,
of net assets.
2 Affiliated money market fund available only to Vanguard funds and certain trusts and accounts managed by Vanguard. Rate shown is
the 7-day yield.
3 Includes $1,046,000 of collateral received for securities on loan.
4 Securities with a value of $200,000 have been segregated as initial margin for open futures contracts.
5 The issuer operates under a congressional charter; its securities are generally neither guaranteed by the U.S. Treasury nor backed by the
full faith and credit of the U.S. government.
See accompanying Notes, which are an integral part of the Financial Statements.
17
Structured Large-Cap Equity Fund
Statement of Operations
| Year Ended | |
| September 30, 2015 | |
| ($000) | |
| Investment Income | |
| Income | |
| Dividends | 12,488 |
| Interest1 | 3 |
| Securities Lending | 5 |
| Total Income | 12,496 |
| Expenses | |
| The Vanguard Group—Note B | |
| Investment Advisory Services | 548 |
| Management and Administrative—Institutional Shares | 68 |
| Management and Administrative—Institutional Plus Shares | 235 |
| Marketing and Distribution—Institutional Shares | 9 |
| Marketing and Distribution—Institutional Plus Shares | 49 |
| Custodian Fees | 14 |
| Auditing Fees | 35 |
| Shareholders’ Reports—Institutional Shares | 2 |
| Shareholders’ Reports—Institutional Plus Shares | 1 |
| Total Expenses | 961 |
| Net Investment Income | 11,535 |
| Realized Net Gain (Loss) | |
| Investment Securities Sold | 101,979 |
| Futures Contracts | (207) |
| Realized Net Gain (Loss) | 101,772 |
| Change in Unrealized Appreciation (Depreciation) | |
| Investment Securities | (100,462) |
| Futures Contracts | 1 |
| Change in Unrealized Appreciation (Depreciation) | (100,461) |
| Net Increase (Decrease) in Net Assets Resulting from Operations | 12,846 |
| 1 Interest income from an affiliated company of the fund was $2,000. | |
See accompanying Notes, which are an integral part of the Financial Statements.
18
Structured Large-Cap Equity Fund
Statement of Changes in Net Assets
| Year Ended September 30, | ||
| 2015 | 2014 | |
| ($000) | ($000) | |
| Increase (Decrease) in Net Assets | ||
| Operations | ||
| Net Investment Income | 11,535 | 14,175 |
| Realized Net Gain (Loss) | 101,772 | 101,030 |
| Change in Unrealized Appreciation (Depreciation) | (100,461) | 30,284 |
| Net Increase (Decrease) in Net Assets Resulting from Operations | 12,846 | 145,489 |
| Distributions | ||
| Net Investment Income | ||
| Institutional Shares | (1,797) | (930) |
| Institutional Plus Shares | (11,950) | (11,472) |
| Realized Capital Gain | ||
| Institutional Shares | — | — |
| Institutional Plus Shares | — | — |
| Total Distributions | (13,747) | (12,402) |
| Capital Share Transactions | ||
| Institutional Shares | 31,286 | (4,066) |
| Institutional Plus Shares | (223,798) | (55,209) |
| Net Increase (Decrease) from Capital Share Transactions | (192,512) | (59,275) |
| Total Increase (Decrease) | (193,413) | 73,812 |
| Net Assets | ||
| Beginning of Period | 738,209 | 664,397 |
| End of Period1 | 544,796 | 738,209 |
| 1 Net Assets—End of Period includes undistributed (overdistributed) net investment income of $7,832,000 and $10,044,000. | ||
See accompanying Notes, which are an integral part of the Financial Statements.
19
Structured Large-Cap Equity Fund
Financial Highlights
| Institutional Shares | |||||
| For a Share Outstanding | Year Ended September 30, | ||||
| Throughout Each Period | 2015 | 2014 | 2013 | 2012 | 2011 |
| Net Asset Value, Beginning of Period | $38.88 | $32.42 | $27.83 | $21.49 | $20.97 |
| Investment Operations | |||||
| Net Investment Income | .7731 | .710 | .618 | .531 | . 4281 |
| Net Realized and Unrealized Gain (Loss) | |||||
| on Investments | (.355) | 6.363 | 4.542 | 6.306 | .458 |
| Total from Investment Operations | .418 | 7.073 | 5.160 | 6.837 | .886 |
| Distributions | |||||
| Dividends from Net Investment Income | (1.008) | (. 613) | (. 570) | (.497) | (.366) |
| Distributions from Realized Capital Gains | — | — | — | — | — |
| Total Distributions | (1.008) | (. 613) | (. 570) | (.497) | (.366) |
| Net Asset Value, End of Period | $38.29 | $38.88 | $32.42 | $27.83 | $21.49 |
| Total Return | 1.03% | 22.08% | 18.93% | 32.32% | 4.14% |
| Ratios/Supplemental Data | |||||
| Net Assets, End of Period (Millions) | $87 | $58 | $52 | $15 | $12 |
| Ratio of Total Expenses to | |||||
| Average Net Assets | 0.20% | 0.24% | 0.24% | 0.24% | 0.24% |
| Ratio of Net Investment Income to | |||||
| Average Net Assets | 1.93% | 1.86% | 2.09% | 2.10% | 1.95% |
| Portfolio Turnover Rate | 73% | 68% | 62% | 64% | 67% |
| 1 Calculated based on average shares outstanding. | |||||
See accompanying Notes, which are an integral part of the Financial Statements.
20
Structured Large-Cap Equity Fund
Financial Highlights
| Institutional Plus Shares | |||||
| For a Share Outstanding | Year Ended September 30, | ||||
| Throughout Each Period | 2015 | 2014 | 2013 | 2012 | 2011 |
| Net Asset Value, Beginning of Period | $76.94 | $64.10 | $55.02 | $42.48 | $41.98 |
| Investment Operations | |||||
| Net Investment Income | 1.5501 | 1.455 | 1.207 | 1.084 | .9101 |
| Net Realized and Unrealized Gain (Loss) | |||||
| on Investments | (.703) | 12.586 | 9.037 | 12.466 | .906 |
| Total from Investment Operations | .847 | 14.041 | 10.244 | 13.550 | 1.816 |
| Distributions | |||||
| Dividends from Net Investment Income | (1.987) | (1.201) | (1.164) | (1.010) | (1.316) |
| Distributions from Realized Capital Gains | — | — | — | — | — |
| Total Distributions | (1.987) | (1.201) | (1.164) | (1.010) | (1.316) |
| Net Asset Value, End of Period | $75.80 | $76.94 | $64.10 | $55.02 | $42.48 |
| Total Return | 1.05% | 22.17% | 19.02% | 32.42% | 4.18% |
| Ratios/Supplemental Data | |||||
| Net Assets, End of Period (Millions) | $458 | $680 | $612 | $497 | $379 |
| Ratio of Total Expenses to | |||||
| Average Net Assets | 0.16% | 0.17% | 0.17% | 0.17% | 0.17% |
| Ratio of Net Investment Income to | |||||
| Average Net Assets | 1.97% | 1.93% | 2.16% | 2.17% | 2.02% |
| Portfolio Turnover Rate | 73% | 68% | 62% | 64% | 67% |
| 1 Calculated based on average shares outstanding. | |||||
See accompanying Notes, which are an integral part of the Financial Statements.
21
Structured Large-Cap Equity Fund
Notes to Financial Statements
Vanguard Structured Large-Cap Equity Fund is registered under the Investment Company Act of 1940 as an open-end investment company, or mutual fund. The fund offers two classes of shares: Institutional Shares and Institutional Plus Shares. Institutional Shares and Institutional Plus Shares are designed for investors who meet certain administrative, service, and account-size criteria.
A. The following significant accounting policies conform to generally accepted accounting principles for U.S. investment companies. The fund consistently follows such policies in preparing its financial statements.
1. Security Valuation: Securities are valued as of the close of trading on the New York Stock Exchange (generally 4 p.m., Eastern time) on the valuation date. Equity securities are valued at the latest quoted sales prices or official closing prices taken from the primary market in which each security trades; such securities not traded on the valuation date are valued at the mean of the latest quoted bid and asked prices. Securities for which market quotations are not readily available, or whose values have been materially affected by events occurring before the fund’s pricing time but after the close of the securities’ primary markets, are valued by methods deemed by the board of trustees to represent fair value. Investments in Vanguard Market Liquidity Fund are valued at that fund’s net asset value. Temporary cash investments acquired over 60 days to maturity are valued using the latest bid prices or using valuations based on a matrix system (which considers such factors as security prices, yields, maturities, and ratings), both as furnished by independent pricing services. Other temporary cash investments are valued at amortized cost, which approximates market value.
2. Futures Contracts: The fund uses index futures contracts to a limited extent, with the objective of maintaining full exposure to the stock market while maintaining liquidity. The fund may purchase or sell futures contracts to achieve a desired level of investment, whether to accommodate portfolio turnover or cash flows from capital share transactions. The primary risks associated with the use of futures contracts are imperfect correlation between changes in market values of stocks held by the fund and the prices of futures contracts, and the possibility of an illiquid market. Counterparty risk involving futures is mitigated because a regulated clearinghouse is the counterparty instead of the clearing broker. To further mitigate counterparty risk, the fund trades futures contracts on an exchange, monitors the financial strength of its clearing brokers and clearinghouse, and has entered into clearing agreements with its clearing brokers. The clearinghouse imposes initial margin requirements to secure the fund’s performance and requires daily settlement of variation margin representing changes in the market value of each contract.
Futures contracts are valued at their quoted daily settlement prices. The aggregate settlement values of the contracts are not recorded in the Statement of Net Assets. Fluctuations in the value of the contracts are recorded in the Statement of Net Assets as an asset (liability) and in the Statement of Operations as unrealized appreciation (depreciation) until the contracts are closed, when they are recorded as realized futures gains (losses).
During the year ended September 30, 2015, the fund’s average investments in long and short futures contracts represented less than 1% and 0% of net assets, respectively, based on the average of aggregate settlement values at each quarter-end during the period.
3. Federal Income Taxes: The fund intends to continue to qualify as a regulated investment company and distribute all of its taxable income. Management has analyzed the fund’s tax positions taken for all open federal income tax years (September 30, 2012–2015), and has concluded that no provision for federal income tax is required in the fund’s financial statements.
4. Distributions: Distributions to shareholders are recorded on the ex-dividend date.
22
Structured Large-Cap Equity Fund
5. Securities Lending: To earn additional income, the fund lends its securities to qualified institutional borrowers. Security loans are required to be secured at all times by collateral in an amount at least equal to the market value of securities loaned. Daily market fluctuations could cause the value of loaned securities to be more or less than the value of the collateral received. When this occurs, the collateral is adjusted and settled on the next business day. The fund further mitigates its counterparty risk by entering into securities lending transactions only with a diverse group of prequalified counterparties, monitoring their financial strength, and entering into master securities lending agreements with its counterparties. The master securities lending agreements provide that, in the event of a counterparty’s default (including bankruptcy), the fund may terminate any loans with that borrower, determine the net amount owed, and sell or retain the collateral up to the net amount owed to the fund; however, such actions may be subject to legal proceedings. While collateral mitigates counterparty risk, in the absence of a default the fund may experience delays and costs in recovering the securities loaned. The fund invests cash collateral received in Vanguard Market Liquidity Fund, and records a liability in the Statement of Net Assets for the return of the collateral, during the period the securities are on loan. Securities lending income represents fees charged to borrowers plus income earned on invested cash collateral, less expenses associated with the loan.
6. Credit Facility: The fund and certain other funds managed by The Vanguard Group (“Vanguard”) participate in a $3 billion committed credit facility provided by a syndicate of lenders pursuant to a credit agreement that may be renewed annually; each fund is individually liable for its borrowings, if any, under the credit facility. Borrowings may be utilized for temporary and emergency purposes, and are subject to the fund’s regulatory and contractual borrowing restrictions. The participating funds are charged administrative fees and an annual commitment fee of 0.06% of the undrawn amount of the facility; these fees are allocated to the funds based on a method approved by the fund’s board of trustees and included in Management and Administrative expenses on the fund’s Statement of Operations. Any borrowings under this facility bear interest at a rate equal to the higher of the federal funds rate or LIBOR reference rate plus an agreedupon spread.
The fund had no borrowings outstanding at September 30, 2015, or at any time during the period then ended.
7. Other: Dividend income is recorded on the exdividend date. Interest income includes income distributions received from Vanguard Market Liquidity Fund and is accrued daily. Premiums and discounts on debt securities purchased are amortized and accreted, respectively, to interest income over the lives of the respective securities. Security transactions are accounted for on the date securities are bought or sold. Costs used to determine realized gains (losses) on the sale of investment securities are those of the specific securities sold.
Each class of shares has equal rights as to assets and earnings, except that each class separately bears certain classspecific expenses related to maintenance of shareholder accounts (included in Management and Administrative expenses) and shareholder reporting. Marketing and distribution expenses are allocated to each class of shares based on a method approved by the board of trustees. Income, other nonclassspecific expenses, and gains and losses on investments are allocated to each class of shares based on its relative net assets.
B. In accordance with the terms of a Funds’ Service Agreement (the “FSA”) between Vanguard and the fund, Vanguard furnishes to the fund investment advisory, corporate management, administrative, marketing, and distribution services at Vanguard’s cost of operations (as defined by the FSA). These costs of operations are allocated to the fund based on methods and guidelines approved by the board
23
Structured Large-Cap Equity Fund
of trustees. Vanguard does not require reimbursement in the current period for certain costs of operations (such as deferred compensation/benefits and risk/insurance costs); the fund’s liability for these costs of operations is included in Payables to Vanguard on the Statement of Net Assets.
Upon the request of Vanguard, the fund may invest up to 0.40% of its net assets as capital in Vanguard. At September 30, 2015, the fund had contributed to Vanguard capital in the amount of $50,000, representing 0.01% of the fund’s net assets and 0.02% of Vanguard’s capitalization. The fund’s trustees and officers are also directors and employees, respectively, of Vanguard.
C. Various inputs may be used to determine the value of the fund’s investments. These inputs are summarized in three broad levels for financial statement purposes. The inputs or methodologies used to value securities are not necessarily an indication of the risk associated with investing in those securities.
Level 1—Quoted prices in active markets for identical securities.
Level 2—Other significant observable inputs (including quoted prices for similar securities, interest rates, prepayment speeds, credit risk, etc.).
Level 3—Significant unobservable inputs (including the fund’s own assumptions used to determine the fair value of investments).
The following table summarizes the market value of the fund’s investments as of September 30, 2015, based on the inputs used to value them:
| Level 1 | Level 2 | Level 3 | |
| Investments | ($000) | ($000) | ($000) |
| Common Stocks | 544,117 | — | — |
| Temporary Cash Investments | 1,450 | 200 | — |
| Futures Contracts—Assets1 | 12 | — | — |
| Total | 545,579 | 200 | — |
| 1 Represents variation margin on the last day of the reporting period. | |||
D. At September 30, 2015, the aggregate settlement value of open futures contracts and the related unrealized appreciation (depreciation) were:
| ($000) | ||||
| Aggregate | ||||
| Number of | Settlement | Unrealized | ||
| Long (Short) | Value | Appreciation | ||
| Futures Contracts | Expiration | Contracts | Long (Short) | (Depreciation) |
| S&P 500 Index | December 2015 | 1 | 477 | (9) |
| E-mini S&P 500 Index | December 2015 | 2 | 191 | (7) |
| (16) | ||||
Unrealized appreciation (depreciation) on open futures contracts is required to be treated as realized gain (loss) for tax purposes.
E. Distributions are determined on a tax basis and may differ from net investment income and realized capital gains for financial reporting purposes. Differences may be permanent or temporary. Permanent differences are reclassified among capital accounts in the financial statements to reflect their tax character. Temporary differences arise when certain items of income, expense, gain, or loss
24
Structured Large-Cap Equity Fund
are recognized in different periods for financial statement and tax purposes. These differences will reverse at some time in the future. Differences in classification may also result from the treatment of short-term gains as ordinary income for tax purposes.
During the year ended September 30, 2015, the fund realized $65,236,000 of net capital gains resulting from in-kind redemptions—in which shareholders exchanged fund shares for securities held by the fund rather than for cash. Because such gains are not taxable to the fund, and are not distributed to shareholders, they have been reclassified from accumulated net realized gains to paid-in capital.
The fund used a capital loss carryforward of $19,976,000 to offset taxable capital gains realized during the year ended September 30, 2015, reducing the amount of capital gains that would otherwise be available to distribute to shareholders. For tax purposes, at September 30, 2015, the fund had $8,302,000 of ordinary income and $16,563,000 of long-term capital gains available for distribution.
At September 30, 2015, the cost of investment securities for tax purposes was $486,509,000. Net unrealized appreciation of investment securities for tax purposes was $59,258,000, consisting of unrealized gains of $83,024,000 on securities that had risen in value since their purchase and $23,766,000 in unrealized losses on securities that had fallen in value since their purchase.
F. During the year ended September 30, 2015, the fund purchased $457,402,000 of investment securities and sold $651,209,000 of investment securities, other than temporary cash investments. Purchases and sales include $0 and $222,234,000, respectively, in connection with in-kind purchases and redemptions of the fund’s capital shares.
G. Capital share transactions for each class of shares were:
| Year Ended September 30, | ||||
| 2015 | 2014 | |||
| Amount | Shares | Amount | Shares | |
| ($000) | (000) | ($000) | (000) | |
| Institutional Shares | ||||
| Issued | 83,381 | 2,068 | 5,401 | 150 |
| Issued in Lieu of Cash Distributions | 1,272 | 33 | 696 | 20 |
| Redeemed | (53,367) | (1,328) | (10,163) | (283) |
| Net Increase (Decrease) —Institutional Shares | 31,286 | 773 | (4,066) | (113) |
| Institutional Plus Shares | ||||
| Issued | 2,279 | 28 | 533 | 8 |
| Issued in Lieu of Cash Distributions | — | — | 4,258 | 63 |
| Redeemed | (226,077) | (2,825) | (60,000) | (784) |
| Net Increase (Decrease) —Institutional Plus Shares | (223,798) | (2,797) | (55,209) | (713) |
At September 30, 2015, one shareholder was the record or beneficial owner of 84% of the fund’s net assets. If the shareholder were to redeem its investment in the fund, the redemption might result in an increase in the fund’s expense ratio, cause the fund to incur higher transaction costs, or lead to the realization of taxable capital gains.
H. Management has determined that no material events or transactions occurred subsequent to September 30, 2015, that would require recognition or disclosure in these financial statements.
25
Structured Broad Market Fund
Fund Profile
As of September 30, 2015
| Share-Class Characteristics | ||
| Institutional | Institutional | |
| Shares | Plus Shares | |
| Ticker Symbol | VSBMX | VSBPX |
| Expense Ratio1 | 0.24% | 0.17% |
| 30-Day SEC Yield | 1.93% | 1.97% |
| Portfolio Characteristics | |||
| DJ | |||
| U.S. | |||
| Total | |||
| Russell | Market | ||
| 3000 | FA | ||
| Fund | Index | Index | |
| Number of Stocks | 224 | 2,986 | 4,000 |
| Median Market Cap | $45.3B | $46.9B | $46.5B |
| Price/Earnings Ratio | 17.1x | 20.2x | 20.2x |
| Price/Book Ratio | 2.9x | 2.5x | 2.5x |
| Return on Equity | 18.1% | 17.3% | 17.2% |
| Earnings Growth | |||
| Rate | 12.5% | 10.1% | 10.1% |
| Dividend Yield | 2.1% | 2.1% | 2.1% |
| Foreign Holdings | 0.0% | 0.0% | 0.0% |
| Turnover Rate | 66% | — | — |
| Short-Term | |||
| Reserves | 0.1% | — | — |
| Volatility Measures | ||
| DJ | ||
| Russell | U.S. Total | |
| 3000 | Market | |
| Index | FA Index | |
| R-Squared | 0.97 | 0.97 |
| Beta | 0.99 | 0.99 |
| These measures show the degree and timing of the fund’s fluctuations compared with the indexes over 36 months. | ||
| Ten Largest Holdings (% of total net assets) | ||
| Apple Inc. | Technology | |
| Hardware, Storage & | ||
| Peripherals | 3.4% | |
| Wells Fargo & Co. | Diversified Banks | 1.6 |
| Johnson & Johnson | Pharmaceuticals | 1.6 |
| JPMorgan Chase & Co. | Diversified Banks | 1.5 |
| Exxon Mobil Corp. | Integrated Oil & Gas | 1.5 |
| Amazon.com Inc. | Internet Retail | 1.4 |
| Verizon Communications Integrated | ||
| Inc. | Telecommunication | |
| Services | 1.3 | |
| Walt Disney Co. | Movies & | |
| Entertainment | 1.3 | |
| Pfizer Inc. | Pharmaceuticals | 1.3 |
| Home Depot Inc. | Home Improvement | |
| Retail | 1.2 | |
| Top Ten | 16.1% | |
| The holdings listed exclude any temporary cash investments and equity index products. | ||
Investment Focus
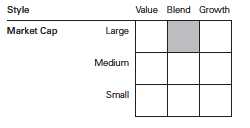
1 The expense ratios shown are from the prospectus dated January 26, 2015. For the fiscal year ended September 30, 2015, the expense ratios were
0.20% for Institutional Shares and 0.16% for Institutional Plus Shares.
26
Structured Broad Market Fund
| Sector Diversification (% of equity exposure) | |||
| DJ | |||
| Russell | U.S. Total | ||
| 3000 | Market | ||
| Fund | Index | FA Index | |
| Consumer | |||
| Discretionary | 14.2% | 13.7% | 13.7% |
| Consumer Staples | 8.6 | 8.7 | 8.7 |
| Energy | 6.9 | 6.4 | 6.3 |
| Financials | 17.7 | 18.2 | 18.3 |
| Health Care | 14.9 | 14.3 | 14.4 |
| Industrials | 10.5 | 10.7 | 10.6 |
| Information | |||
| Technology | 18.7 | 19.5 | 19.6 |
| Materials | 2.7 | 3.1 | 3.1 |
| Telecommunication | |||
| Services | 2.6 | 2.2 | 2.1 |
| Utilities | 3.2 | 3.2 | 3.2 |
27
Structured Broad Market Fund
Performance Summary
All of the returns in this report represent past performance, which is not a guarantee of future results that may be achieved by the fund. (Current performance may be lower or higher than the performance data cited. For performance data current to the most recent month-end, visit our website at vanguard.com/performance.) Note, too, that both investment returns and principal value can fluctuate widely, so an investor’s shares, when sold, could be worth more or less than their original cost. The returns shown do not reflect taxes that a shareholder would pay on fund distributions or on the sale of fund shares.
Cumulative Performance: November 30, 2006, Through September 30, 2015
Initial Investment of $5,000,000
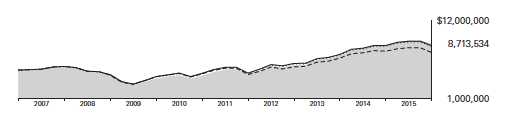
| Average Annual Total Returns | |||||
| Periods Ended September 30, 2015 | |||||
| Since | Final Value | ||||
| One | Five | Inception | of a $5,000,000 | ||
| Year | Years | (11/30/2006) | Investment | ||
| Structured Broad Market | |||||
| Fund*Institutional Shares | 2.80% | 15.75% | 6.49% | $8,713,534 | |
| •••••••• | Russell 3000 Index | -0.49 | 13.28 | 6.00 | 8,366,600 |
| – – – – | Multi-Cap Core Funds Average | -2.37 | 10.93 | 4.70 | 7,502,149 |
| Dow Jones U.S. Total Stock Market | |||||
| Float Adjusted Index | -0.55 | 13.26 | 6.13 | 8,454,372 | |
Multi-Cap Core Funds Average: Derived from data provided by Lipper, a Thomson Reuters Company.
"Since Inception" performance is calculated from the Institutional Shares’ inception date for both the fund and its comparative standards.
| Final Value | ||||
| One | Five | Ten | of a $200,000,000 | |
| Year | Years | Years | Investment | |
| Structured Broad Market Fund Institutional | ||||
| Plus Shares | 2.84% | 15.83% | 7.46% | $410,843,815 |
| Russell 3000 Index | -0.49 | 13.28 | 6.92 | 344,686,607 |
| Dow Jones U.S. Total Stock Market Float | ||||
| Adjusted Index | -0.55 | 13.26 | 7.06 | 395,568,342 |
The fund commenced operations as a registered investment company on October 3, 2006. The fund's performance includes the performance
of a predecessor trust, Vanguard Fiduciary Trust Company Structured Broad Market Trust, from September 30, 2005, to October 3, 2006.
See Financial Highlights for dividend and capital gains information.
28
Structured Broad Market Fund
Fiscal-Year Total Returns (%): November 30, 2006, Through September 30, 2015
29
Structured Broad Market Fund
Financial Statements
Statement of Net Assets
As of September 30, 2015
The fund reports a complete list of its holdings in regulatory filings four times in each fiscal year, at the quarter-ends. For the second and fourth fiscal quarters, the lists appear in the fund’s semiannual and annual reports to shareholders. For the first and third fiscal quarters, the fund files the lists with the Securities and Exchange Commission on Form N-Q. Shareholders can look up the fund’s Forms N-Q on the SEC’s website at sec.gov. Forms N-Q may also be reviewed and copied at the SEC’s Public Reference Room (see the back cover of this report for further information).
| Market | |||
| Value• | |||
| Shares | ($000) | ||
| Common Stocks (99.5%)1 | |||
| Consumer Discretionary (14.1%) | |||
| * | Amazon.com Inc. | 15,100 | 7,730 |
| Walt Disney Co. | 69,200 | 7,072 | |
| Home Depot Inc. | 59,100 | 6,826 | |
| NIKE Inc. Class B | 42,600 | 5,239 | |
| Comcast Corp. Class A | 85,091 | 4,840 | |
| Lowe’s Cos. Inc. | 67,400 | 4,645 | |
| Target Corp. | 52,700 | 4,145 | |
| * | O’Reilly Automotive Inc. | 15,200 | 3,800 |
| Carnival Corp. | 69,900 | 3,474 | |
| General Motors Co. | 109,100 | 3,275 | |
| * | DISH Network Corp. | ||
| Class A | 56,000 | 3,267 | |
| Cooper Tire & Rubber Co. | 76,500 | 3,023 | |
| Marriott International Inc. | |||
| Class A | 44,200 | 3,014 | |
| * | Skechers U.S.A. Inc. | ||
| Class A | 21,900 | 2,936 | |
| * | Madison Square | ||
| Garden Co. Class A | 39,300 | 2,835 | |
| * | Pinnacle Entertainment Inc. | 74,200 | 2,511 |
| ^ | Outerwall Inc. | 38,700 | 2,203 |
| * | Isle of Capri Casinos Inc. | 94,900 | 1,655 |
| * | American Axle | ||
| & Manufacturing | |||
| Holdings Inc. | 79,300 | 1,581 | |
| Comcast Corp. Special | |||
| Class A | 27,000 | 1,546 | |
| TJX Cos. Inc. | 15,500 | 1,107 | |
| * | Build-A-Bear Workshop Inc. | 36,100 | 682 |
| Jack in the Box Inc. | 2,000 | 154 | |
| Cablevision Systems Corp. | |||
| Class A | 3,800 | 123 | |
| 77,683 | |||
| Consumer Staples (8.6%) | |||
| Altria Group Inc. | 103,100 | 5,609 | |
| Costco Wholesale Corp. | 30,900 | 4,467 | |
| PepsiCo Inc. | 43,600 | 4,111 | |
| Kroger Co. | 108,200 | 3,903 | |
| Reynolds American Inc. | 87,600 | 3,878 | |
| Archer-Daniels-Midland Co. | 74,900 | 3,105 | |
| Dr Pepper Snapple | |||
| Group Inc. | 33,700 | 2,664 | |
| ^ | Pilgrim’s Pride Corp. | 126,350 | 2,626 |
| Bunge Ltd. | 35,600 | 2,609 | |
| Procter & Gamble Co. | 34,551 | 2,486 | |
| Dean Foods Co. | 130,500 | 2,156 | |
| Wal-Mart Stores Inc. | 23,065 | 1,495 | |
| Ingles Markets Inc. Class A | 28,000 | 1,339 | |
| * | USANA Health Sciences Inc. | 9,100 | 1,220 |
| Coca-Cola Co. | 27,880 | 1,118 | |
| Coty Inc. Class A | 40,000 | 1,082 | |
| Clorox Co. | 9,000 | 1,040 | |
| Cal-Maine Foods Inc. | 17,600 | 961 | |
| Colgate-Palmolive Co. | 7,100 | 451 | |
| Kimberly-Clark Corp. | 3,100 | 338 | |
| * | SUPERVALU Inc. | 28,800 | 207 |
| CVS Health Corp. | 2,000 | 193 | |
| Philip Morris | |||
| International Inc. | 1,950 | 155 | |
| 47,213 | |||
| Energy (6.8%) | |||
| Exxon Mobil Corp. | 108,220 | 8,046 | |
| Valero Energy Corp. | 60,700 | 3,648 | |
| Tesoro Corp. | 34,100 | 3,316 | |
| Marathon Petroleum Corp. | 68,600 | 3,178 | |
| Teekay Tankers Ltd. | |||
| Class A | 430,400 | 2,970 | |
| PBF Energy Inc. Class A | 97,200 | 2,744 | |
| Schlumberger Ltd. | 32,610 | 2,249 | |
| *,^ | Frontline Ltd. | 798,000 | 2,147 |
| Spectra Energy Corp. | 80,500 | 2,115 | |
| Chevron Corp. | 26,565 | 2,095 | |
| Nordic American | |||
| Tankers Ltd. | 106,400 | 1,617 | |
| Western Refining Inc. | 33,800 | 1,491 | |
| Ship Finance | |||
| International Ltd. | 67,900 | 1,103 | |
| Delek US Holdings Inc. | 31,900 | 884 | |
| 37,603 | |||
30
Structured Broad Market Fund
| Market | |||
| Value• | |||
| Shares | ($000) | ||
| Financials (17.7%) | |||
| Wells Fargo & Co. | 173,270 | 8,897 | |
| JPMorgan Chase & Co. | 139,736 | 8,520 | |
| Citigroup Inc. | 115,900 | 5,750 | |
| PNC Financial Services | |||
| Group Inc. | 45,400 | 4,050 | |
| Travelers Cos. Inc. | 37,500 | 3,732 | |
| Goldman Sachs Group Inc. | 21,000 | 3,649 | |
| Universal Insurance | |||
| Holdings Inc. | 111,400 | 3,291 | |
| * | Berkshire Hathaway Inc. | ||
| Class B | 25,100 | 3,273 | |
| Everest Re Group Ltd. | 18,400 | 3,189 | |
| Ameriprise Financial Inc. | 27,900 | 3,045 | |
| American Express Co. | 40,800 | 3,025 | |
| Simon Property Group Inc. | 15,700 | 2,884 | |
| First American | |||
| Financial Corp. | 73,700 | 2,879 | |
| Voya Financial Inc. | 73,000 | 2,830 | |
| * | MGIC Investment Corp. | 296,000 | 2,741 |
| * | Walker & Dunlop Inc. | 97,500 | 2,543 |
| * | Santander Consumer | ||
| USA Holdings Inc. | 120,600 | 2,463 | |
| Extra Space Storage Inc. | 21,800 | 1,682 | |
| Lazard Ltd. Class A | 38,800 | 1,680 | |
| US Bancorp | 40,250 | 1,651 | |
| * | Heritage Insurance | ||
| Holdings Inc. | 82,800 | 1,634 | |
| General Growth | |||
| Properties Inc. | 58,500 | 1,519 | |
| * | E*TRADE Financial Corp. | 57,100 | 1,503 |
| CoreSite Realty Corp. | 27,900 | 1,435 | |
| Bank of America Corp. | 91,200 | 1,421 | |
| * | Marcus & Millichap Inc. | 30,300 | 1,394 |
| Lamar Advertising Co. | |||
| Class A | 26,300 | 1,372 | |
| Summit Hotel | |||
| Properties Inc. | 115,700 | 1,350 | |
| Ryman Hospitality | |||
| Properties Inc. | 23,400 | 1,152 | |
| * | Cowen Group Inc. Class A | 234,400 | 1,069 |
| Hospitality Properties Trust | 41,100 | 1,051 | |
| Weingarten Realty Investors | 31,500 | 1,043 | |
| Chambers Street Properties | 156,500 | 1,016 | |
| CBL & Associates | |||
| Properties Inc. | 65,000 | 894 | |
| Bank of New York | |||
| Mellon Corp. | 22,400 | 877 | |
| CyrusOne Inc. | 24,000 | 784 | |
| Kimco Realty Corp. | 26,500 | 647 | |
| DuPont Fabros | |||
| Technology Inc. | 24,500 | 634 | |
| * | Credit Acceptance Corp. | 3,000 | 591 |
| RLJ Lodging Trust | 21,900 | 553 | |
| Ventas Inc. | 8,900 | 499 | |
| SunTrust Banks Inc. | 11,000 | 421 | |
| Digital Realty Trust Inc. | 6,200 | 405 | |
| LaSalle Hotel Properties | 13,500 | 383 | |
| Hartford Financial | |||
| Services Group Inc. | 8,100 | 371 | |
| Public Storage | 1,700 | 360 | |
| Welltower Inc. | 4,800 | 325 | |
| * | INTL. FCStone Inc. | 9,800 | 242 |
| OM Asset Management plc | 12,600 | 194 | |
| Care Capital Properties Inc. | 4,750 | 156 | |
| Hersha Hospitality | |||
| Trust Class A | 6,800 | 154 | |
| 97,223 | |||
| Health Care (14.8%) | |||
| Johnson & Johnson | 93,107 | 8,691 | |
| Pfizer Inc. | 221,558 | 6,959 | |
| Gilead Sciences Inc. | 64,000 | 6,284 | |
| UnitedHealth Group Inc. | 48,300 | 5,603 | |
| Merck & Co. Inc. | 105,483 | 5,210 | |
| Eli Lilly & Co. | 61,720 | 5,165 | |
| Bristol-Myers Squibb Co. | 85,200 | 5,044 | |
| AbbVie Inc. | 86,200 | 4,690 | |
| * | Express Scripts Holding Co. | 53,300 | 4,315 |
| Amgen Inc. | 29,900 | 4,136 | |
| Anthem Inc. | 25,900 | 3,626 | |
| Aetna Inc. | 30,800 | 3,370 | |
| AmerisourceBergen | |||
| Corp. Class A | 34,000 | 3,230 | |
| Cardinal Health Inc. | 41,500 | 3,188 | |
| * | Charles River Laboratories | ||
| International Inc. | 39,800 | 2,528 | |
| * | Centene Corp. | 43,900 | 2,381 |
| * | Infinity Pharmaceuticals Inc. 155,500 | 1,314 | |
| * | Quintiles Transnational | ||
| Holdings Inc. | 18,700 | 1,301 | |
| * | INC Research Holdings Inc. | ||
| Class A | 25,500 | 1,020 | |
| * | HCA Holdings Inc. | 12,400 | 959 |
| Cigna Corp. | 6,500 | 878 | |
| * | ICU Medical Inc. | 4,600 | 504 |
| Abbott Laboratories | 9,000 | 362 | |
| Phibro Animal Health Corp. | |||
| Class A | 8,600 | 272 | |
| * | Amedisys Inc. | 6,600 | 251 |
| * | Merrimack | ||
| Pharmaceuticals Inc. | 13,300 | 113 | |
| * | Allergan plc | 400 | 109 |
| 81,503 | |||
| Industrials (10.4%) | |||
| Boeing Co. | 39,150 | 5,127 | |
| 3M Co. | 33,200 | 4,707 | |
| Lockheed Martin Corp. | 21,700 | 4,498 | |
| General Dynamics Corp. | 28,400 | 3,918 | |
| Northrop Grumman Corp. | 23,230 | 3,855 | |
| General Electric Co. | 146,480 | 3,694 | |
| * | United Continental | ||
| Holdings Inc. | 62,400 | 3,310 | |
31
Structured Broad Market Fund
| Market | |||
| Value• | |||
| Shares | ($000) | ||
| Illinois Tool Works Inc. | 39,700 | 3,268 | |
| Cintas Corp. | 37,700 | 3,233 | |
| * | JetBlue Airways Corp. | 124,000 | 3,195 |
| * | Hawaiian Holdings Inc. | 125,600 | 3,100 |
| Southwest Airlines Co. | 78,000 | 2,967 | |
| PACCAR Inc. | 53,000 | 2,765 | |
| * | Spirit AeroSystems | ||
| Holdings Inc. Class A | 56,200 | 2,717 | |
| Alaska Air Group Inc. | 27,500 | 2,185 | |
| Aircastle Ltd. | 58,800 | 1,212 | |
| Comfort Systems USA Inc. | 32,900 | 897 | |
| Interface Inc. Class A | 29,400 | 660 | |
| * | Dycom Industries Inc. | 8,400 | 608 |
| Global Brass & Copper | |||
| Holdings Inc. | 29,100 | 597 | |
| * | Aerojet Rocketdyne | ||
| Holdings Inc. | 27,500 | 445 | |
| John Bean | |||
| Technologies Corp. | 5,600 | 214 | |
| * | PAM Transportation | ||
| Services Inc. | 4,800 | 158 | |
| SkyWest Inc. | 9,400 | 157 | |
| 57,487 | |||
| Information Technology (18.6%) | |||
| Apple Inc. | 171,540 | 18,921 | |
| Microsoft Corp. | 143,497 | 6,351 | |
| International Business | |||
| Machines Corp. | 32,142 | 4,660 | |
| Accenture plc Class A | 45,100 | 4,432 | |
| Texas Instruments Inc. | 81,100 | 4,016 | |
| MasterCard Inc. Class A | 41,700 | 3,758 | |
| * | Electronic Arts Inc. | 51,200 | 3,469 |
| * | Google Inc. Class A | 5,280 | 3,371 |
| CDW Corp. | 81,100 | 3,314 | |
| Hewlett-Packard Co. | 125,000 | 3,201 | |
| * | Manhattan Associates Inc. | 50,871 | 3,169 |
| * | Blackhawk Network | ||
| Holdings Inc. | 72,000 | 3,052 | |
| Computer Sciences Corp. | 49,200 | 3,020 | |
| Intel Corp. | 99,490 | 2,999 | |
| * | Google Inc. Class C | 4,792 | 2,916 |
| Booz Allen Hamilton | |||
| Holding Corp. Class A | 107,500 | 2,818 | |
| EarthLink Holdings Corp. | 360,000 | 2,801 | |
| * | Aspen Technology Inc. | 73,200 | 2,775 |
| * | Sykes Enterprises Inc. | 107,200 | 2,734 |
| MAXIMUS Inc. | 45,100 | 2,686 | |
| Broadridge Financial | |||
| Solutions Inc. | 42,700 | 2,363 | |
| * | Facebook Inc. Class A | 22,000 | 1,978 |
| *,^ | Ambarella Inc. | 27,100 | 1,566 |
| * | ARRIS Group Inc. | 48,480 | 1,259 |
| Science Applications | |||
| International Corp. | 30,600 | 1,230 | |
| Jabil Circuit Inc. | 50,800 | 1,136 | |
| * | Tech Data Corp. | 16,200 | 1,110 |
| Skyworks Solutions Inc. | 10,200 | 859 | |
| * | Ciena Corp. | 39,000 | 808 |
| * | Synaptics Inc. | 9,000 | 742 |
| * | Sigma Designs Inc. | 102,500 | 706 |
| CSG Systems | |||
| International Inc. | 18,000 | 554 | |
| Cisco Systems Inc. | 19,450 | 511 | |
| Visa Inc. Class A | 7,300 | 509 | |
| * | Gigamon Inc. | 20,100 | 402 |
| * | ePlus Inc. | 4,900 | 387 |
| DST Systems Inc. | 2,590 | 272 | |
| QAD Inc. Class A | 10,000 | 256 | |
| Oracle Corp. | 6,548 | 236 | |
| * | Cimpress NV | 2,900 | 221 |
| * | Avid Technology Inc. | 22,900 | 182 |
| Avago Technologies Ltd. | |||
| Class A | 1,400 | 175 | |
| * | Super Micro Computer Inc. | 5,800 | 158 |
| 102,083 | |||
| Materials (2.7%) | |||
| LyondellBasell Industries | |||
| NV Class A | 43,000 | 3,584 | |
| Sherwin-Williams Co. | 12,300 | 2,740 | |
| International Paper Co. | 67,200 | 2,540 | |
| *,^ | Trinseo SA | 91,500 | 2,310 |
| Avery Dennison Corp. | 32,700 | 1,850 | |
| Sealed Air Corp. | 27,500 | 1,289 | |
| * | AEP Industries Inc. | 7,500 | 430 |
| KMG Chemicals Inc. | 18,400 | 355 | |
| 15,098 | |||
| Telecommunication Services (2.6%) | |||
| Verizon | |||
| Communications Inc. | 164,357 | 7,151 | |
| AT&T Inc. | 185,787 | 6,053 | |
| CenturyLink Inc. | 34,300 | 862 | |
| 14,066 | |||
| Utilities (3.2%) | |||
| Public Service Enterprise | |||
| Group Inc. | 84,900 | 3,579 | |
| Edison International | 56,000 | 3,532 | |
| Exelon Corp. | 107,100 | 3,181 | |
| American Electric | |||
| Power Co. Inc. | 42,200 | 2,400 | |
| Vectren Corp. | 55,900 | 2,348 | |
| WGL Holdings Inc. | 30,700 | 1,770 | |
| FirstEnergy Corp. | 22,800 | 714 | |
| 17,524 | |||
| Total Common Stocks | |||
| (Cost $464,275) | 547,483 | ||
32
Structured Broad Market Fund
| Market | |||
| Value• | |||
| Shares | ($000) | ||
| Temporary Cash Investments (1.9%)1 | |||
| Money Market Fund (1.9%) | |||
| 2,3 | Vanguard Market | ||
| Liquidity Fund, 0.189% | 10,280,472 | 10,280 | |
| Face | |||
| Amount | |||
| ($000) | |||
| U.S. Government and Agency Obligations (0.0%) | |||
| 4,5 | Federal Home Loan Bank | ||
| Discount Notes, 0.090%, | |||
| 10/14/15 | 100 | 100 | |
| 4,5 | Federal Home Loan Bank | ||
| Discount Notes, 0.100%, | |||
| 10/23/15 | 100 | 100 | |
| 200 | |||
| Total Temporary Cash Investments | |||
| (Cost $10,480) | 10,480 | ||
| Total Investments (101.4%) | |||
| (Cost $474,755) | 557,963 | ||
| Amount | |||
| ($000) | |||
| Other Assets and Liabilities (-1.4%) | |||
| Other Assets | |||
| Investment in Vanguard | 51 | ||
| Receivables for Investment Securities Sold | 1,164 | ||
| Receivables for Accrued Income | 577 | ||
| Total Other Assets | 1,792 | ||
| Liabilities | |||
| Payables for Investment Securities | |||
| Purchased | (2,145) | ||
| Collateral for Securities on Loan | (6,872) | ||
| Payables to Vanguard | (297) | ||
| Other Liabilities | (25) | ||
| Total Liabilities | (9,339) | ||
| Net Assets (100%) | 550,416 | ||
| At September 30, 2015, net assets consisted of: | |
| Amount | |
| ($000) | |
| Paid-in Capital | 416,750 |
| Undistributed Net Investment Income | 8,121 |
| Accumulated Net Realized Gains | 42,384 |
| Unrealized Appreciation (Depreciation) | |
| Investment Securities | 83,208 |
| Futures Contracts | (47) |
| Net Assets | 550,416 |
| Institutional Shares—Net Assets | |
| Applicable to 738,427 outstanding | |
| $.001 par value shares of beneficial | |
| interest (unlimited authorization) | 24,544 |
| Net Asset Value Per Share— | |
| Institutional Shares | $33.24 |
| Institutional Plus Shares—Net Assets | |
| Applicable to 7,915,727 outstanding | |
| $.001 par value shares of beneficial | |
| interest (unlimited authorization) | 525,872 |
| Net Asset Value Per Share— | |
| Institutional Plus Shares | $66.43 |
• See Note A in Notes to Financial Statements.
* Non-income-producing security.
^ Includes partial security positions on loan to broker-dealers. The total value of securities on loan is $6,588,000.
1 The fund invests a portion of its cash reserves in equity markets through the use of index futures contracts. After giving effect to futures
investments, the fund’s effective common stock and temporary cash investment positions represent 100.0% and 1.4%, respectively,
of net assets.
2 Affiliated money market fund available only to Vanguard funds and certain trusts and accounts managed by Vanguard. Rate shown is
the 7-day yield.
3 Includes $6,872,000 of collateral received for securities on loan.
4 The issuer operates under a congressional charter; its securities are generally neither guaranteed by the U.S. Treasury nor backed by the
full faith and credit of the U.S. government.
5 Securities with a value of $200,000 have been segregated as initial margin for open futures contracts.
See accompanying Notes, which are an integral part of the Financial Statements.
33
Structured Broad Market Fund
Statement of Operations
| Year Ended | |
| September 30, 2015 | |
| ($000) | |
| Investment Income | |
| Income | |
| Dividends | 11,647 |
| Interest1 | 5 |
| Securities Lending | 93 |
| Total Income | 11,745 |
| Expenses | |
| The Vanguard Group—Note B | |
| Investment Advisory Services | 480 |
| Management and Administrative—Institutional Shares | 27 |
| Management and Administrative—Institutional Plus Shares | 311 |
| Marketing and Distribution—Institutional Shares | — |
| Marketing and Distribution—Institutional Plus Shares | 43 |
| Custodian Fees | 11 |
| Auditing Fees | 33 |
| Shareholders’ Reports—Institutional Shares | 1 |
| Shareholders’ Reports—Institutional Plus Shares | — |
| Total Expenses | 906 |
| Net Investment Income | 10,839 |
| Realized Net Gain (Loss) | |
| Investment Securities Sold | 48,749 |
| Futures Contracts | 49 |
| Realized Net Gain (Loss) | 48,798 |
| Change in Unrealized Appreciation (Depreciation) | |
| Investment Securities | (44,212) |
| Futures Contracts | (30) |
| Change in Unrealized Appreciation (Depreciation) | (44,242) |
| Net Increase (Decrease) in Net Assets Resulting from Operations | 15,395 |
| 1 Interest income from an affiliated company of the fund was $4,000. | |
See accompanying Notes, which are an integral part of the Financial Statements.
34
Structured Broad Market Fund
Statement of Changes in Net Assets
| Year Ended September 30, | ||
| 2015 | 2014 | |
| ($000) | ($000) | |
| Increase (Decrease) in Net Assets | ||
| Operations | ||
| Net Investment Income | 10,839 | 9,385 |
| Realized Net Gain (Loss) | 48,798 | 63,591 |
| Change in Unrealized Appreciation (Depreciation) | (44,242) | 28,712 |
| Net Increase (Decrease) in Net Assets Resulting from Operations | 15,395 | 101,688 |
| Distributions | ||
| Net Investment Income | ||
| Institutional Shares | (434) | (270) |
| Institutional Plus Shares | (9,024) | (8,224) |
| Realized Capital Gain1 | ||
| Institutional Shares | (3,078) | (657) |
| Institutional Plus Shares | (61,848) | (19,311) |
| Total Distributions | (74,384) | (28,462) |
| Capital Share Transactions | ||
| Institutional Shares | 1,642 | 7,179 |
| Institutional Plus Shares | 65,576 | (18,827) |
| Net Increase (Decrease) from Capital Share Transactions | 67,218 | (11,648) |
| Total Increase (Decrease) | 8,229 | 61,578 |
| Net Assets | ||
| Beginning of Period | 542,187 | 480,609 |
| End of Period2 | 550,416 | 542,187 |
1 Includes fiscal 2015 and 2014 short-term gain distributions totaling $16,777,000 and $1,585,000, respectively. Short-term gain distributions
are treated as ordinary income dividends for tax purposes.
2 Net Assets—End of Period includes undistributed (overdistributed) net investment income of $8,121,000 and $6,740,000.
See accompanying Notes, which are an integral part of the Financial Statements.
35
Structured Broad Market Fund
Financial Highlights
| Institutional Shares | |||||
| For a Share Outstanding | Year Ended September 30, | ||||
| Throughout Each Period | 2015 | 2014 | 2013 | 2012 | 2011 |
| Net Asset Value, Beginning of Period | $37.28 | $32.59 | $27.10 | $21.03 | $20.70 |
| Investment Operations | |||||
| Net Investment Income | . 662 | . 632 | . 573 | .544 | .3851 |
| Net Realized and Unrealized Gain (Loss) | |||||
| on Investments | .394 | 5.996 | 5.492 | 5.973 | .338 |
| Total from Investment Operations | 1.056 | 6.628 | 6.065 | 6.517 | .723 |
| Distributions | |||||
| Dividends from Net Investment Income | (.630) | (.564) | (.575) | (. 447) | (.393) |
| Distributions from Realized Capital Gains | (4.466) | (1.374) | — | — | — |
| Total Distributions | (5.096) | (1.938) | (.575) | (. 447) | (.393) |
| Net Asset Value, End of Period | $33.24 | $37.28 | $32.59 | $27.10 | $21.03 |
| Total Return | 2.80% | 21.10% | 22.85% | 31.43% | 3.37% |
| Ratios/Supplemental Data | |||||
| Net Assets, End of Period (Millions) | $25 | $26 | $16 | $7 | $6 |
| Ratio of Total Expenses to | |||||
| Average Net Assets | 0.20% | 0.24% | 0.24% | 0.24% | 0.24% |
| Ratio of Net Investment Income to | |||||
| Average Net Assets | 1.86% | 1.67% | 1.94% | 2.19% | 1.64% |
| Portfolio Turnover Rate | 66% | 60% | 63% | 58% | 56% |
| 1 Calculated based on average shares outstanding. | |||||
See accompanying Notes, which are an integral part of the Financial Statements.
36
Structured Broad Market Fund
Financial Highlights
| Institutional Plus Shares | |||||
| For a Share Outstanding | Year Ended September 30, | ||||
| Throughout Each Period | 2015 | 2014 | 2013 | 2012 | 2011 |
| Net Asset Value, Beginning of Period | $74.52 | $65.15 | $54.17 | $42.02 | $41.36 |
| Investment Operations | |||||
| Net Investment Income | 1.355 | 1.303 | 1.186 | 1.122 | .7961 |
| Net Realized and Unrealized Gain (Loss) | |||||
| on Investments | .781 | 11.981 | 10.980 | 11.951 | .672 |
| Total from Investment Operations | 2.136 | 13.284 | 12.166 | 13.073 | 1.468 |
| Distributions | |||||
| Dividends from Net Investment Income | (1.302) | (1.169) | (1.186) | (. 923) | (. 808) |
| Distributions from Realized Capital Gains | (8.924) | (2.745) | — | — | — |
| Total Distributions | (10.226) | (3.914) | (1.186) | (. 923) | (. 808) |
| Net Asset Value, End of Period | $66.43 | $74.52 | $65.15 | $54.17 | $42.02 |
| Total Return | 2.84% | 21.16% | 22.95% | 31.56% | 3.43% |
| Ratios/Supplemental Data | |||||
| Net Assets, End of Period (Millions) | $526 | $516 | $465 | $379 | $290 |
| Ratio of Total Expenses to | |||||
| Average Net Assets | 0.16% | 0.17% | 0.17% | 0.17% | 0.17% |
| Ratio of Net Investment Income to | |||||
| Average Net Assets | 1.90% | 1.74% | 2.01% | 2.26% | 1.71% |
| Portfolio Turnover Rate | 66% | 60% | 63% | 58% | 56% |
| 1 Calculated based on average shares outstanding. | |||||
See accompanying Notes, which are an integral part of the Financial Statements.
37
Structured Broad Market Fund
Notes to Financial Statements
Vanguard Structured Broad Market Fund is registered under the Investment Company Act of 1940 as an open-end investment company, or mutual fund. The fund offers two classes of shares: Institutional Shares and Institutional Plus Shares. Institutional Shares and Institutional Plus Shares are designed for investors who meet certain administrative, service, and account-size criteria.
A. The following significant accounting policies conform to generally accepted accounting principles for U.S. investment companies. The fund consistently follows such policies in preparing its financial statements.
1. Security Valuation: Securities are valued as of the close of trading on the New York Stock Exchange (generally 4 p.m., Eastern time) on the valuation date. Equity securities are valued at the latest quoted sales prices or official closing prices taken from the primary market in which each security trades; such securities not traded on the valuation date are valued at the mean of the latest quoted bid and asked prices. Securities for which market quotations are not readily available, or whose values have been materially affected by events occurring before the fund’s pricing time but after the close of the securities’ primary markets, are valued by methods deemed by the board of trustees to represent fair value. Investments in Vanguard Market Liquidity Fund are valued at that fund’s net asset value. Temporary cash investments acquired over 60 days to maturity are valued using the latest bid prices or using valuations based on a matrix system (which considers such factors as security prices, yields, maturities, and ratings), both as furnished by independent pricing services. Other temporary cash investments are valued at amortized cost, which approximates market value.
2. Futures Contracts: The fund uses index futures contracts to a limited extent, with the objective of maintaining full exposure to the stock market while maintaining liquidity. The fund may purchase or sell futures contracts to achieve a desired level of investment, whether to accommodate portfolio turnover or cash flows from capital share transactions. The primary risks associated with the use of futures contracts are imperfect correlation between changes in market values of stocks held by the fund and the prices of futures contracts, and the possibility of an illiquid market. Counterparty risk involving futures is mitigated because a regulated clearinghouse is the counterparty instead of the clearing broker. To further mitigate counterparty risk, the fund trades futures contracts on an exchange, monitors the financial strength of its clearing brokers and clearinghouse, and has entered into clearing agreements with its clearing brokers. The clearinghouse imposes initial margin requirements to secure the fund’s performance and requires daily settlement of variation margin representing changes in the market value of each contract.
Futures contracts are valued at their quoted daily settlement prices. The aggregate settlement values of the contracts are not recorded in the Statement of Net Assets. Fluctuations in the value of the contracts are recorded in the Statement of Net Assets as an asset (liability) and in the Statement of Operations as unrealized appreciation (depreciation) until the contracts are closed, when they are recorded as realized futures gains (losses).
During the year ended September 30, 2015, the fund’s average investments in long and short futures contracts represented less than 1% and 0% of net assets, respectively, based on the average of aggregate settlement values at each quarter-end during the period.
3. Federal Income Taxes: The fund intends to continue to qualify as a regulated investment company and distribute all of its taxable income. Management has analyzed the fund’s tax positions taken for all open federal income tax years (September 30, 2012–2015), and has concluded that no provision for federal income tax is required in the fund’s financial statements.
38
Structured Broad Market Fund
4. Distributions: Distributions to shareholders are recorded on the ex-dividend date.
5. Securities Lending: To earn additional income, the fund lends its securities to qualified institutional borrowers. Security loans are required to be secured at all times by collateral in an amount at least equal to the market value of securities loaned. Daily market fluctuations could cause the value of loaned securities to be more or less than the value of the collateral received. When this occurs, the collateral is adjusted and settled on the next business day. The fund further mitigates its counterparty risk by entering into securities lending transactions only with a diverse group of prequalified counter-parties, monitoring their financial strength, and entering into master securities lending agreements with its counterparties. The master securities lending agreements provide that, in the event of a counterparty’s default (including bankruptcy), the fund may terminate any loans with that borrower, determine the net amount owed, and sell or retain the collateral up to the net amount owed to the fund; however, such actions may be subject to legal proceedings. While collateral mitigates counter-party risk, in the absence of a default the fund may experience delays and costs in recovering the securities loaned. The fund invests cash collateral received in Vanguard Market Liquidity Fund, and records a liability in the Statement of Net Assets for the return of the collateral, during the period the securities are on loan. Securities lending income represents fees charged to borrowers plus income earned on invested cash collateral, less expenses associated with the loan.
6. Credit Facility: The fund and certain other funds managed by The Vanguard Group (“Vanguard”) participate in a $3 billion committed credit facility provided by a syndicate of lenders pursuant to a credit agreement that may be renewed annually; each fund is individually liable for its borrowings, if any, under the credit facility. Borrowings may be utilized for temporary and emergency purposes, and are subject to the fund’s regulatory and contractual borrowing restrictions. The participating funds are charged administrative fees and an annual commitment fee of 0.06% of the undrawn amount of the facility; these fees are allocated to the funds based on a method approved by the fund’s board of trustees and included in Management and Administrative expenses on the fund’s Statement of Operations. Any borrowings under this facility bear interest at a rate equal to the higher of the federal funds rate or LIBOR reference rate plus an agreed-upon spread.
The fund had no borrowings outstanding at September 30, 2015, or at any time during the period then ended.
7. Other: Dividend income is recorded on the ex-dividend date. Interest income includes income distributions received from Vanguard Market Liquidity Fund and is accrued daily. Premiums and discounts on debt securities purchased are amortized and accreted, respectively, to interest income over the lives of the respective securities. Security transactions are accounted for on the date securities are bought or sold. Costs used to determine realized gains (losses) on the sale of investment securities are those of the specific securities sold.
Each class of shares has equal rights as to assets and earnings, except that each class separately bears certain class-specific expenses related to maintenance of shareholder accounts (included in Management and Administrative expenses) and shareholder reporting. Marketing and distribution expenses are allocated to each class of shares based on a method approved by the board of trustees. Income, other non-class-specific expenses, and gains and losses on investments are allocated to each class of shares based on its relative net assets.
39
Structured Broad Market Fund
B. In accordance with the terms of a Funds’ Service Agreement (the “FSA”) between Vanguard and the fund, Vanguard furnishes to the fund investment advisory, corporate management, administrative, marketing, and distribution services at Vanguard’s cost of operations (as defined by the FSA). These costs of operations are allocated to the fund based on methods and guidelines approved by the board of trustees. Vanguard does not require reimbursement in the current period for certain costs of operations (such as deferred compensation/benefits and risk/insurance costs); the fund’s liability for these costs of operations is included in Payables to Vanguard on the Statement of Net Assets.
Upon the request of Vanguard, the fund may invest up to 0.40% of its net assets as capital in Vanguard. At September 30, 2015, the fund had contributed to Vanguard capital in the amount of $51,000, representing 0.01% of the fund’s net assets and 0.02% of Vanguard’s capitalization. The fund’s trustees and officers are also directors and employees, respectively, of Vanguard.
C. Various inputs may be used to determine the value of the fund’s investments. These inputs are summarized in three broad levels for financial statement purposes. The inputs or methodologies used to value securities are not necessarily an indication of the risk associated with investing in those securities.
Level 1—Quoted prices in active markets for identical securities.
Level 2—Other significant observable inputs (including quoted prices for similar securities, interest rates, prepayment speeds, credit risk, etc.).
Level 3—Significant unobservable inputs (including the fund’s own assumptions used to determine the fair value of investments).
The following table summarizes the market value of the fund’s investments as of September 30, 2015, based on the inputs used to value them:
| Level 1 | Level 2 | Level 3 | |
| Investments | ($000) | ($000) | ($000) |
| Common Stocks | 547,483 | — | — |
| Temporary Cash Investments | 10,280 | 200 | — |
| Futures Contracts—Assets1 | 51 | — | — |
| Total | 557,814 | 200 | — |
| 1 Represents variation margin on the last day of the reporting period. | |||
D. At September 30, 2015, the aggregate settlement value of open futures contracts and the related unrealized appreciation (depreciation) were:
| ($000) | ||||
| Aggregate | ||||
| Number of | Settlement | Unrealized | ||
| Long (Short) | Value | Appreciation | ||
| Futures Contracts | Expiration | Contracts | Long (Short) | (Depreciation) |
| S&P 500 Index | December 2015 | 5 | 2,386 | (44) |
| E-mini S&P 500 Index | December 2015 | 5 | 477 | (3) |
| (47) | ||||
Unrealized appreciation (depreciation) on open futures contracts is required to be treated as realized gain (loss) for tax purposes.
40
Structured Broad Market Fund
E. Distributions are determined on a tax basis and may differ from net investment income and realized capital gains for financial reporting purposes. Differences may be permanent or temporary. Permanent differences are reclassified among capital accounts in the financial statements to reflect their tax character. Temporary differences arise when certain items of income, expense, gain, or loss are recognized in different periods for financial statement and tax purposes. These differences will reverse at some time in the future. Differences in classification may also result from the treatment of short-term gains as ordinary income for tax purposes.
For tax purposes, at September 30, 2015, the fund had $8,654,000 of ordinary income and $42,082,000 of long-term capital gains available for distribution.
At September 30, 2015, the cost of investment securities for tax purposes was $474,758,000. Net unrealized appreciation of investment securities for tax purposes was $83,205,000, consisting of unrealized gains of $104,429,000 on securities that had risen in value since their purchase and $21,224,000 in unrealized losses on securities that had fallen in value since their purchase.
F. During the year ended September 30, 2015, the fund purchased $375,098,000 of investment securities and sold $371,485,000 of investment securities, other than temporary cash investments.
G. Capital share transactions for each class of shares were:
| Year Ended September 30, | ||||
| 2015 | 2014 | |||
| Amount | Shares | Amount | Shares | |
| ($000) | (000) | ($000) | (000) | |
| Institutional Shares | ||||
| Issued | — | — | 6,643 | 195 |
| Issued in Lieu of Cash Distributions | 1,642 | 49 | 536 | 16 |
| Redeemed | — | — | — | — |
| Net Increase (Decrease) —Institutional Shares | 1,642 | 49 | 7,179 | 211 |
| Institutional Plus Shares | ||||
| Issued | 3,000 | 45 | 7,200 | 110 |
| Issued in Lieu of Cash Distributions | 62,576 | 940 | 20,486 | 310 |
| Redeemed | — | — | (46,513) | (627) |
| Net Increase (Decrease) —Institutional Plus Shares | 65,576 | 985 | (18,827) | (207) |
At September 30, 2015, one shareholder was the record or beneficial owner of 95% of the fund’s net assets. If the shareholder were to redeem its investment in the fund, the redemption might result in an increase in the fund’s expense ratio, cause the fund to incur higher transaction costs, or lead to the realization of taxable capital gains.
H. Management has determined that no material events or transactions occurred subsequent to September 30, 2015, that would require recognition or disclosure in these financial statements.
41
Report of Independent Registered
Public Accounting Firm
To the Board of Trustees of Vanguard Quantitative Funds and the Shareholders of Vanguard Structured Large-Cap Equity Fund and Vanguard Structured Broad Market Fund:
In our opinion, the accompanying statements of net assets and the related statements of operations and of changes in net assets and the financial highlights present fairly, in all material respects, the financial position of Vanguard Structured Large-Cap Equity Fund and Vanguard Structured Broad Market Fund (constituting separate portfolios of Vanguard Quantitative Funds, hereafter referred to as the “Funds”) at September 30, 2015, the results of each of their operations for the year then ended, the changes in each of their net assets for each of the two years in the period then ended, and the financial highlights for each of the five years in the period then ended, in conformity with accounting principles generally accepted in the United States of America. These financial statements and financial highlights (hereafter referred to as “financial statements”) are the responsibility of the Funds’ management. Our responsibility is to express an opinion on these financial statements based on our audits. We conducted our audits of these financial statements in accordance with the standards of the Public Company Accounting Oversight Board (United States). Those standards require that we plan and perform the audit to obtain reasonable assurance about whether the financial statements are free of material misstatement. An audit includes examining, on a test basis, evidence supporting the amounts and disclosures in the financial statements, assessing the accounting principles used and significant estimates made by management, and evaluating the overall financial statement presentation. We believe that our audits, which included confirmation of securities at September 30, 2015 by correspondence with the custodian and brokers, by agreement to the underlying ownership records of the transfer agent and the application of alternative auditing procedures where securities purchased had not been received, provide a reasonable basis for our opinion.
/s/PricewaterhouseCoopers LLP
Philadelphia, Pennsylvania
November 10, 2015
42

This information for the fiscal year ended September 30, 2015, is included pursuant to provisions of the Internal Revenue Code.
For non-resident alien shareholders, 100% of short-term capital gain dividends distributed by the Structured Broad Market Fund are qualified short-term capital gains.
The funds distributed capital gain dividends (from net long-term capital gains) to shareholders during the fiscal year as follows:
| Fund | ($000) |
| Structured Large-Cap Equity Fund | — |
| Structured Broad Market Fund | 48,149 |
The funds distributed qualified dividend income to shareholders during the fiscal year as follows:
| Fund | ($000) |
| Structured Large-Cap Equity Fund | 13,746 |
| Structured Broad Market Fund | 9,458 |
For corporate shareholders, the percentage of investment income (dividend income plus short-term gains, if any) that qualifies for the dividends-received deduction is as follows:
| Fund | Percentage |
| Structured Large-Cap Equity Fund | 98.9% |
| Structured Broad Market Fund | 91.1 |
43
About Your Fund’s Expenses
As a shareholder of the fund, you incur ongoing costs, which include costs for portfolio management, administrative services, and shareholder reports (like this one), among others. Operating expenses, which are deducted from a fund’s gross income, directly reduce the investment return of the fund.
A fund’s expenses are expressed as a percentage of its average net assets. This figure is known as the expense ratio. The following examples are intended to help you understand the ongoing costs (in dollars) of investing in your fund and to compare these costs with those of other mutual funds. The examples are based on an investment of $1,000 made at the beginning of the period shown and held for the entire period.
The accompanying table illustrates your fund’s costs in two ways:
• Based on actual fund return. This section helps you to estimate the actual expenses that you paid over the period. The ”Ending Account Value“ shown is derived from the fund‘s actual return, and the third column shows the dollar amount that would have been paid by an investor who started with $1,000 in the fund. You may use the information here, together with the amount you invested, to estimate the expenses that you paid over the period.
To do so, simply divide your account value by $1,000 (for example, an $8,600 account value divided by $1,000 = 8.6), then multiply the result by the number given for your fund under the heading ”Expenses Paid During Period.“
• Based on hypothetical 5% yearly return. This section is intended to help you compare your fund‘s costs with those of other mutual funds. It assumes that the fund had a yearly return of 5% before expenses, but that the expense ratio is unchanged. In this case—because the return used is not the fund’s actual return—the results do not apply to your investment. The example is useful in making comparisons because the Securities and Exchange Commission requires all mutual funds to calculate expenses based on a 5% return. You can assess your fund’s costs by comparing this hypothetical example with the hypothetical examples that appear in shareholder reports of other funds.
Note that the expenses shown in the table are meant to highlight and help you compare ongoing costs only and do not reflect transaction costs incurred by the fund for buying and selling securities. Further, the expenses do not include any purchase, redemption, or account service fees described in the fund prospectus. If such fees were applied to your account, your costs would be higher. Your fund does not carry a “sales load.”
The calculations assume no shares were bought or sold during the period. Your actual costs may have been higher or lower, depending on the amount of your investment and the timing of any purchases or redemptions.
You can find more information about the fund’s expenses, including annual expense ratios, in the Financial Statements section of this report. For additional information on operating expenses and other shareholder costs, please refer to your fund’s current prospectus.
44
| Six Months Ended September 30, 2015 | |||
| Beginning | Ending | Expenses | |
| Account Value | Account Value | Paid During | |
| 3/31/2015 | 9/30/2015 | Period | |
| Based on Actual Fund Return | |||
| Structured Large-Cap Equity Fund | |||
| Institutional Shares | $1,000.00 | $946.83 | $0.88 |
| Institutional Plus Shares | 1,000.00 | 946.91 | 0.73 |
| Structured Broad Market Fund | |||
| Institutional Shares | $1,000.00 | $949.17 | $0.88 |
| Institutional Plus Shares | 1,000.00 | 949.27 | 0.73 |
| Based on Hypothetical 5% Yearly Return | |||
| Structured Large-Cap Equity Fund | |||
| Institutional Shares | $1,000.00 | $1,024.17 | $0.91 |
| Institutional Plus Shares | 1,000.00 | 1,024.32 | 0.76 |
| Structured Broad Market Fund | |||
| Institutional Shares | $1,000.00 | $1,024.17 | $0.91 |
| Institutional Plus Shares | 1,000.00 | 1,024.32 | 0.76 |
The calculations are based on expenses incurred in the most recent six-month period. The funds’ annualized six-month expense ratios for that
period are: for the Structured Large-Cap Equity Fund, 0.18% for Institutional Shares and 0.15% for Institutional Plus Shares; for the Structured
Broad Market Fund, 0.18% for Institutional Shares and 0.15% for Institutional Plus Shares. The dollar amounts shown as “Expenses Paid” are
equal to the annualized expense ratio multiplied by the average account value over the period, multiplied by the number of days in the most
recent six-month period, then divided by the number of days in the most recent 12-month period (183/365).
45
Glossary
30-Day SEC Yield. A fund’s 30-day SEC yield is derived using a formula specified by the U.S. Securities and Exchange Commission. Under the formula, data related to the fund’s security holdings in the previous 30 days are used to calculate the fund’s hypothetical net income for that period, which is then annualized and divided by the fund’s estimated average net assets over the calculation period. For the purposes of this calculation, a security’s income is based on its current market yield to maturity (for bonds), its actual income (for asset-backed securities), or its projected dividend yield (for stocks). Because the SEC yield represents hypothetical annualized income, it will differ—at times significantly—from the fund’s actual experience. As a result, the fund’s income distributions may be higher or lower than implied by the SEC yield.
Beta. A measure of the magnitude of a fund’s past share-price fluctuations in relation to the ups and downs of a given market index. The index is assigned a beta of 1.00. Compared with a given index, a fund with a beta of 1.20 typically would have seen its share price rise or fall by 12% when the index rose or fell by 10%. For this report, beta is based on returns over the past 36 months for both the fund and the index. Note that a fund’s beta should be reviewed in conjunction with its R-squared (see definition). The lower the R-squared, the less correlation there is between the fund and the index, and the less reliable beta is as an indicator of volatility.
Dividend Yield. Dividend income earned by stocks, expressed as a percentage of the aggregate market value (or of net asset value, for a fund). The yield is determined by dividing the amount of the annual dividends by the aggregate value (or net asset value) at the end of the period. For a fund, the dividend yield is based solely on stock holdings and does not include any income produced by other investments.
Earnings Growth Rate. The average annual rate of growth in earnings over the past five years for the stocks now in a fund.
Equity Exposure. A measure that reflects a fund’s investments in stocks and stock futures. Any holdings in short-term reserves are excluded.
Expense Ratio. A fund’s total annual operating expenses expressed as a percentage of the fund’s average net assets. The expense ratio includes management and administrative expenses, but does not include the transaction costs of buying and selling portfolio securities.
Foreign Holdings. The percentage of a fund represented by securities or depositary receipts of companies based outside the United States.
Median Market Cap. An indicator of the size of companies in which a fund invests; the midpoint of market capitalization (market price x shares outstanding) of a fund’s stocks, weighted by the proportion of the fund’s assets invested in each stock. Stocks representing half of the fund’s assets have market capitalizations above the median, and the rest are below it.
Price/Book Ratio. The share price of a stock divided by its net worth, or book value, per share. For a fund, the weighted average price/book ratio of the stocks it holds.
Price/Earnings Ratio. The ratio of a stock’s current price to its per-share earnings over the past year. For a fund, the weighted average P/E of the stocks it holds. P/E is an indicator of market expectations about corporate prospects; the higher the P/E, the greater the expectations for a company’s future growth.
46
R-Squared. A measure of how much of a fund’s past returns can be explained by the returns from the market in general, as measured by a given index. If a fund’s total returns were precisely synchronized with an index’s returns, its R-squared would be 1.00. If the fund’s returns bore no relationship to the index’s returns, its R-squared would be 0. For this report, R-squared is based on returns over the past 36 months for both the fund and the index.
Return on Equity. The annual average rate of return generated by a company during the past five years for each dollar of shareholder’s equity (net income divided by shareholder’s equity). For a fund, the weighted average return on equity for the companies whose stocks it holds.
Short-Term Reserves. The percentage of a fund invested in highly liquid, short-term securities that can be readily converted to cash.
Turnover Rate. An indication of the fund’s trading activity. Funds with high turnover rates incur higher transaction costs and may be more likely to distribute capital gains (which may be taxable to investors). The turnover rate excludes in-kind transactions, which have minimal impact on costs.
47
The People Who Govern Your Fund
The trustees of your mutual fund are there to see that the fund is operated and managed in your best interests since, as a shareholder, you are a part owner of the fund. Your fund’s trustees also serve on the board of directors of The Vanguard Group, Inc., which is owned by the Vanguard funds and provides services to them on an at-cost basis.
A majority of Vanguard’s board members are independent, meaning that they have no affiliation with Vanguard or the funds they oversee, apart from the sizable personal investments they have made as private individuals. The independent board members have distinguished backgrounds in business, academia, and public service. Each of the trustees and executive officers oversees 194 Vanguard funds.
The following table provides information for each trustee and executive officer of the fund. More information about the trustees is in the Statement of Additional Information, which can be obtained, without charge, by contacting Vanguard at 800-662-7447, or online at vanguard.com.
| InterestedTrustee1 | Rajiv L. Gupta |
| Born 1945. Trustee Since December 2001.2 Principal | |
| F. William McNabb III | Occupation(s) During the Past Five Years and Other |
| Born 1957. Trustee Since July 2009. Chairman of | Experience: Chairman and Chief Executive Officer |
| the Board. Principal Occupation(s) During the Past | (retired 2009) and President (2006–2008) of |
| Five Years and Other Experience: Chairman of the | Rohm and Haas Co. (chemicals); Director of Tyco |
| Board of The Vanguard Group, Inc., and of each of | International PLC (diversified manufacturing and |
| the investment companies served by The Vanguard | services), Hewlett-Packard Co. (electronic computer |
| Group, since January 2010; Director of The Vanguard | manufacturing), and Delphi Automotive PLC |
| Group since 2008; Chief Executive Officer and | (automotive components); Senior Advisor at New |
| President of The Vanguard Group, and of each of | Mountain Capital. |
| the investment companies served by The Vanguard | |
| Group, since 2008; Director of Vanguard Marketing | Amy Gutmann |
| Corporation; Managing Director of The Vanguard | Born 1949. Trustee Since June 2006. Principal |
| Group (1995–2008). | Occupation(s) During the Past Five Years and |
| Other Experience: President of the University of | |
| IndependentTrustees | Pennsylvania; Christopher H. Browne Distinguished |
| Professor of Political Science, School of Arts and | |
| Emerson U. Fullwood | Sciences, and Professor of Communication, Annenberg |
| Born 1948. Trustee Since January 2008. Principal | School for Communication, with secondary faculty |
| Occupation(s) During the Past Five Years and | appointments in the Department of Philosophy, School |
| Other Experience: Executive Chief Staff and | of Arts and Sciences, and at the Graduate School of |
| Marketing Officer for North America and Corporate | Education, University of Pennsylvania; Trustee of the |
| Vice President (retired 2008) of Xerox Corporation | National Constitution Center; Chair of the Presidential |
| (document management products and services); | Commission for the Study of Bioethical Issues. |
| Executive in Residence and 2009–2010 Distinguished | |
| Minett Professor at the Rochester Institute of | JoAnn Heffernan Heisen |
| Technology; Director of SPX Corporation (multi-industry | Born 1950. Trustee Since July 1998. Principal |
| manufacturing), the United Way of Rochester, | Occupation(s) During the Past Five Years and Other |
| Amerigroup Corporation (managed health care), the | Experience: Corporate Vice President and Chief |
| University of Rochester Medical Center, Monroe | Global Diversity Officer (retired 2008) and Member |
| Community College Foundation, and North Carolina | of the Executive Committee (1997–2008) of Johnson |
| A&T University. | & Johnson (pharmaceuticals/medical devices/ |
| consumer products); Director of Skytop Lodge | |
| Corporation (hotels), the University Medical Center | |
| at Princeton, the Robert Wood Johnson Foundation, | |
| and the Center for Talent Innovation; Member of | |
| the Advisory Board of the Institute for Women’s | |
| Leadership at Rutgers University. |
| F. Joseph Loughrey | Executive Officers | |
| Born 1949. Trustee Since October 2009. Principal | ||
| Occupation(s) During the Past Five Years and Other | Glenn Booraem | |
| Experience: President and Chief Operating Officer | Born 1967. Treasurer Since May 2015. Principal | |
| (retired 2009) of Cummins Inc. (industrial machinery); | Occupation(s) During the Past Five Years and | |
| Chairman of the Board of Hillenbrand, Inc. (specialized | Other Experience: Principal of The Vanguard Group, | |
| consumer services), and of Oxfam America; Director | Inc.; Treasurer of each of the investment companies | |
| of SKF AB (industrial machinery), Hyster-Yale Materials | served by The Vanguard Group; Controller of each of | |
| Handling, Inc. (forklift trucks), the Lumina Foundation | the investment companies served by The Vanguard | |
| for Education, and the V Foundation for Cancer | Group (2010–2015); Assistant Controller of each of | |
| Research; Member of the Advisory Council for the | the investment companies served by The Vanguard | |
| College of Arts and Letters and of the Advisory Board | Group (2001–2010). | |
| to the Kellogg Institute for International Studies, both | ||
| at the University of Notre Dame. | Thomas J. Higgins | |
| Born 1957. Chief Financial Officer Since September | ||
| Mark Loughridge | 2008. Principal Occupation(s) During the Past Five | |
| Born 1953. Trustee Since March 2012. Principal | Years and Other Experience: Principal of The Vanguard | |
| Occupation(s) During the Past Five Years and Other | Group, Inc.; Chief Financial Officer of each of the | |
| Experience: Senior Vice President and Chief Financial | investment companies served by The Vanguard Group; | |
| Officer (retired 2013) at IBM (information technology | Treasurer of each of the investment companies served | |
| services); Fiduciary Member of IBM’s Retirement Plan | by The Vanguard Group (1998–2008). | |
| Committee (2004–2013); Director of the Dow Chemical | ||
| Company; Member of the Council on Chicago Booth. | Peter Mahoney | |
| Born 1974. Controller Since May 2015. Principal | ||
| Scott C. Malpass | Occupation(s) During the Past Five Years and | |
| Born 1962. Trustee Since March 2012. Principal | Other Experience: Head of Global Fund Accounting | |
| Occupation(s) During the Past Five Years and Other | at The Vanguard Group, Inc.; Controller of each of the | |
| Experience: Chief Investment Officer and Vice | investment companies served by The Vanguard Group; | |
| President at the University of Notre Dame; Assistant | Head of International Fund Services at The Vanguard | |
| Professor of Finance at the Mendoza College of | Group (2008–2014). | |
| Business at Notre Dame; Member of the Notre Dame | ||
| 403(b) Investment Committee; Board Member of | Heidi Stam | |
| TIFF Advisory Services, Inc., and Catholic Investment | Born 1956. Secretary Since July 2005. Principal | |
| Services, Inc. (investment advisors); Member of | Occupation(s) During the Past Five Years and Other | |
| the Investment Advisory Committee of Major | Experience: Managing Director of The Vanguard | |
| League Baseball. | Group, Inc.; General Counsel of The Vanguard Group; | |
| Secretary of The Vanguard Group and of each of the | ||
| André F. Perold | investment companies served by The Vanguard Group; | |
| Born 1952. Trustee Since December 2004. Principal | Director and Senior Vice President of Vanguard | |
| Occupation(s) During the Past Five Years and Other | Marketing Corporation. | |
| Experience: George Gund Professor of Finance and | ||
| Banking, Emeritus at the Harvard Business School | Vanguard Senior ManagementTeam | |
| (retired 2011); Chief Investment Officer and Managing | Mortimer J. Buckley | Chris D. McIsaac |
| Partner of HighVista Strategies LLC (private investment | Kathleen C. Gubanich | James M. Norris |
| firm); Director of Rand Merchant Bank; Overseer of | Paul A. Heller | Thomas M. Rampulla |
| the Museum of Fine Arts Boston. | Martha G. King | Glenn W. Reed |
| John T. Marcante | Karin A. Risi | |
| Peter F. Volanakis | ||
| Born 1955. Trustee Since July 2009. Principal | ||
| Occupation(s) During the Past Five Years and Other | Chairman Emeritus and Senior Advisor | |
| Experience: President and Chief Operating Officer | ||
| (retired 2010) of Corning Incorporated (communications | John J. Brennan | |
| equipment); Trustee of Colby-Sawyer College; | ||
| Member of the Advisory Board of the Norris Cotton | Chairman, 1996–2009 | |
| Cancer Center and of the Advisory Board of the | ||
| Parthenon Group (strategy consulting). | Chief Executive Officer and President, 1996–2008 | |
| Founder | ||
| John C. Bogle | ||
| Chairman and Chief Executive Officer, 1974–1996 | ||
1 Mr. McNabb is considered an “interested person,” as defined in the Investment Company Act of 1940, because he is an officer of the Vanguard funds.
2 December 2002 for Vanguard Equity Income Fund, the Vanguard Municipal Bond Funds, and the Vanguard State Tax-Exempt Funds.
 | |
| P.O. Box 2600 | |
| Valley Forge, PA 19482-2600 | |
| Connect with Vanguard® > vanguard.com | |
| Fund Information > 800-662-7447 | CFA® is a registered trademark owned by CFA Institute. |
| Direct Investor Account Services > 800-662-2739 | |
| Institutional Investor Services > 800-523-1036 | |
| Text Telephone for People | |
| Who Are Deaf or Hard of Hearing> 800-749-7273 | |
| This material may be used in conjunction | |
| with the offering of shares of any Vanguard | |
| fund only if preceded or accompanied by | |
| the fund’s current prospectus. | |
| All comparative mutual fund data are from Lipper, a | |
| Thomson Reuters Company, or Morningstar, Inc., unless | |
| otherwise noted. | |
| You can obtain a free copy of Vanguard’s proxy voting | |
| guidelines by visiting vanguard.com/proxyreporting or by | |
| calling Vanguard at 800-662-2739. The guidelines are | |
| also available from the SEC’s website, sec.gov. In | |
| addition, you may obtain a free report on how your fund | |
| voted the proxies for securities it owned during the 12 | |
| months ended June 30. To get the report, visit either | |
| vanguard.com/proxyreporting or sec.gov. | |
| You can review and copy information about your fund at | |
| the SEC’s Public Reference Room in Washington, D.C. To | |
| find out more about this public service, call the SEC at | |
| 202-551-8090. Information about your fund is also | |
| available on the SEC’s website, and you can receive | |
| copies of this information, for a fee, by sending a | |
| request in either of two ways: via email addressed to | |
| publicinfo@sec.gov or via regular mail addressed to the | |
| Public Reference Section, Securities and Exchange | |
| Commission, Washington, DC 20549-1520. | |
| © 2015 The Vanguard Group, Inc. | |
| All rights reserved. | |
| Vanguard Marketing Corporation, Distributor. | |
| Q08700 112015 | |
Item 2: Code of Ethics. The Registrant has adopted a code of ethics that applies to the Registrant’s principal executive officer, principal financial officer, principal accounting officer or controller or persons performing similar functions. The Code of Ethics was amended during the reporting period covered by this report to make certain technical, non-material changes.
Item 3: Audit Committee Financial Expert. The following members of the Audit Committee have been determined by the Registrant’s Board of Trustees to be Audit Committee Financial Experts serving on its Audit Committee, and to be independent: Rajiv L. Gupta, Amy Gutmann, JoAnn Heffernan Heisen, F. Joseph Loughrey, Mark Loughridge, Scott C. Malpass, and André F. Perold.
Item 4: Principal Accountant Fees and Services.
(a) Audit Fees.
Audit Fees of the Registrant
Fiscal Year Ended September 30, 2015: $101,000
Fiscal Year Ended September 30, 2014: $98,000
Aggregate Audit Fees of Registered Investment Companies in the Vanguard Group.
Fiscal Year Ended September 30, 2015: $7,000,200
Fiscal Year Ended September 30, 2014: $6,605,127
Includes fees billed in connection with audits of the Registrant, other registered investment companies in the Vanguard complex, The Vanguard Group, Inc. and Vanguard Marketing Corporation.
(b) Audit-Related Fees.
Fiscal Year Ended September 30, 2015: $2,899,096
Fiscal Year Ended September 30, 2014: $2,176,479
Includes fees billed in connection with assurance and related services provided to the Registrant, other registered investment companies in the Vanguard complex, The Vanguard Group, Inc., and Vanguard Marketing Corporation.
(c) Tax Fees.
Fiscal Year Ended September 30, 2015: $353,389
Fiscal Year Ended September 30, 2014: $316,869
Includes fees billed in connection with tax compliance, planning, and advice services provided to the Registrant, other registered investment companies in the Vanguard complex, The Vanguard Group, Inc., and Vanguard Marketing Corporation.
(d) All Other Fees.
Fiscal Year Ended September 30, 2015: $202,313
Fiscal Year Ended September 30, 2014: $198,163
Includes fees billed for services related to tax reported information provided to the Registrant, other registered investment companies in the Vanguard complex, The Vanguard Group, Inc., and Vanguard Marketing Corporation.
(e) (1) Pre-Approval Policies. The policy of the Registrant’s Audit Committee is to consider and, if appropriate, approve before the principal accountant is engaged for such services, all specific audit and non-audit services provided to: the Registrant, other registered investment companies in the Vanguard complex, The Vanguard Group, Inc., and entities controlled by The Vanguard Group, Inc. that provide ongoing services to the Registrant. In making a determination, the Audit Committee considers whether the services are consistent with maintaining the principal accountant’s independence.
In the event of a contingency situation in which the principal accountant is needed to provide services in between scheduled Audit Committee meetings, the Chairman of the Audit Committee would be called on to consider and, if appropriate, pre-approve audit or permitted non-audit services in an amount sufficient to complete services through the next Audit Committee meeting, and to determine if such services would be consistent with maintaining the accountant’s independence. At the next scheduled Audit Committee meeting, services and fees would be presented to the Audit Committee for formal consideration, and, if appropriate, approval by the entire Audit Committee. The Audit Committee would again consider whether such services and fees are consistent with maintaining the principal accountant’s independence.
The Registrant’s Audit Committee is informed at least annually of all audit and non-audit services provided by the principal accountant to the Vanguard complex, whether such services are provided to: the Registrant, other registered investment companies in the Vanguard complex, The Vanguard Group, Inc., or other entities controlled by The Vanguard Group, Inc. that provide ongoing services to the Registrant.
(2) No percentage of the principal accountant’s fees or services were approved pursuant to the waiver provision of paragraph (c)(7)(i)(C) of Rule 2-01 of Regulation S-X.
(f) For the most recent fiscal year, over 50% of the hours worked under the principal accountant’s engagement were not performed by persons other than full-time, permanent employees of the principal accountant.
(g) Aggregate Non-Audit Fees.
Fiscal Year Ended September 30, 2015: $555,702
Fiscal Year Ended September 30, 2014: $515,032
Includes fees billed for non-audit services provided to the Registrant, other registered investment companies in the Vanguard complex, The Vanguard Group, Inc., and Vanguard Marketing Corporation.
(h) For the most recent fiscal year, the Audit Committee has determined that the provision of all non-audit services was consistent with maintaining the principal accountant’s independence.
Item 5: Audit Committee of Listed Registrants.
Not Applicable.
Item 6: Investments.
Not Applicable.
Item 7: Disclosure of Proxy Voting Policies and Procedures for Closed-End Management
Investment Companies.
Not Applicable.
Item 8: Portfolio Managers of Closed-End Management Investment Companies.
Not Applicable.
Item 9: Purchase of Equity Securities by Closed-End Management Investment Company and
Affiliated Purchasers.
Not Applicable.
Item 10: Submission of Matters to a Vote of Security Holders.
Not Applicable.
Item 11: Controls and Procedures.
(a) Disclosure Controls and Procedures. The Principal Executive and Financial Officers concluded that the Registrant’s Disclosure Controls and Procedures are effective based on their evaluation of the Disclosure Controls and Procedures as of a date within 90 days of the filing date of this report.
(b) Internal Control Over Financial Reporting. There were no significant changes in Registrant’s Internal Control Over Financial Reporting or in other factors that could significantly affect this control subsequent to the date of the evaluation, including any corrective actions with regard to significant deficiencies and material weaknesses.
Item 12: Exhibits.
(a) Code of Ethics.
(b) Certifications.
Pursuant to the requirements of the Securities Exchange Act of 1934 and the Investment Company Act of 1940, the registrant has duly caused this report to be signed on its behalf by the undersigned, thereunto duly authorized.
| VANGUARD QUANTITATIVE FUNDS | |
| BY: | /s/ F. WILLIAM MCNABB III* |
| F. WILLIAM MCNABB III | |
| CHIEF EXECUTIVE OFFICER | |
| Date: November 18, 2015 | |
Pursuant to the requirements of the Securities Exchange Act of 1934 and the Investment Company Act of 1940, this report has been signed below by the following persons on behalf of the registrant and in the capacities and on the dates indicated.
| VANGUARD QUANTITATIVE FUNDS | |
BY: | /s/ F. WILLIAM MCNABB III* |
| F. WILLIAM MCNABB III | |
| CHIEF EXECUTIVE OFFICER | |
Date: November 18, 2015 | |
| VANGUARD QUANTITATIVE FUNDS |
BY: | /s/ THOMAS J. HIGGINS* |
| THOMAS J. HIGGINS | |
| CHIEF FINANCIAL OFFICER | |
Date: November 18, 2015 | |
* By: /s/ Heidi Stam
Heidi Stam, pursuant to a Power of Attorney filed on April 22, 2014 see file Number2-17620, Incorporated by Reference.