| UNITED STATES SECURITIES AND EXCHANGE COMMISSION Washington, D.C. 20549 |
| FORM N-CSR |
| CERTIFIED SHAREHOLDER REPORT OF REGISTERED MANAGEMENT INVESTMENT COMPANIES |
| Investment Company Act file number | 811-04813 |
| Dreyfus Investment Funds (Exact name of Registrant as specified in charter) |
| c/o The Dreyfus Corporation 200 Park Avenue New York, New York 10166 (Address of principal executive offices) (Zip code) |
| Michael A. Rosenberg, Esq. 200 Park Avenue New York, New York 10166 (Name and address of agent for service) |
| Registrant's telephone number, including area code: | (212) 922-6000 |
| Date of fiscal year end: | 12/31 | |
| Date of reporting period: | 12/31/2008 |
The following N-CSR relates only to the Registrant’s series listed below and does not affect the other series of the Registrant, which have a different fiscal year end and, therefore, different N-CSR reporting requirements. Separate N-CSR Forms will be filed for those series, as appropriate.
| Dreyfus/Standish Fixed Income Fund Dreyfus/Standish Global Fixed Income Fund Dreyfus/Standish International Fixed Income Fund |
| FORM N-CSR |
| Item 1. | Reports to Stockholders. |
| Dreyfus/Standish Fixed Income Fund |
| ANNUAL REPORT December 31, 2008 |
The views expressed in this report reflect those of the portfolio manager only through the end of the period covered and do not necessarily represent the views of Dreyfus or any other person in the Dreyfus organization. Any such views are subject to change at any time based upon market or other conditions and Dreyfus disclaims any responsibility to update such views.These views may not be relied on as investment advice and, because investment decisions for a Dreyfus fund are based on numerous factors, may not be relied on as an indication of trading intent on behalf of any Dreyfus fund.

| Contents | ||
| THE FUND | ||
| 2 | A Letter from the CEO | |
| 3 | Discussion of Fund Performance | |
| 6 | Fund Performance | |
| 7 | Understanding Your Fund’s Expenses | |
| 7 | Comparing Your Fund’s Expenses | |
| With Those of Other Funds | ||
| 8 | Statement of Investments | |
| 28 | Statement of Financial Futures | |
| 28 | Statement of Options Written | |
| 29 | Statement of Assets and Liabilities | |
| 30 | Statement of Operations | |
| 31 | Statement of Changes in Net Assets | |
| 32 | Financial Highlights | |
| 33 | Notes to Financial Statements | |
| 50 | Report of Independent Registered | |
| Public Accounting Firm | ||
| 51 | Information About the Review | |
| and Approval of the Fund’s | ||
| Investment Advisory Agreement | ||
| 60 | Board Members Information | |
| 62 | Officers of the Fund | |
| FOR MORE INFORMATION | ||
| Back Cover | ||
| Dreyfus/Standish Fixed Income Fund |
| The Fund |

| A LETTER FROM THE CEO Dear Shareholder: |
We present to you this annual report for Dreyfus/Standish Fixed Income Fund, covering the 12-month period from January 1, 2008, through December 31, 2008.
2008 was the most difficult year in decades for the financial markets. A credit crunch that began in 2007 exploded in mid-2008 into a global financial crisis, resulting in the failures of major financial institutions, a deep and prolonged recession and lower investment values across a broad range of asset classes. Governments and regulators throughout the world moved aggressively to curtail the damage, implementing unprecedented reductions of short-term interest rates, massive injections of liquidity into the banking system, government bailouts of struggling companies and plans for massive economic stimulus programs. U.S. government securities generally fared well in the ensuing “flight to quality,” but riskier bond market sectors suffered sharp price declines.
Although we expect the U.S. and global economies to remain weak until longstanding imbalances have worked their way out of the system, the financial markets currently appear to have priced in investors’ generally low expectations. In previous recessions, however, the markets have tended to anticipate economic improvement before it occurs, potentially leading to major rallies when few expected them. That’s why it makes sense to remain disciplined, maintain a long-term perspective and adopt a consistent asset allocation strategy that reflects one’s future goals and attitudes toward risk. As always, we urge you to consult with your financial advisor, who can recommend the course of action that is right for you.
For information about how the fund performed during the reporting period, as well as market perspectives, we have provided a Discussion of Fund Performance given by the fund’s Portfolio Managers.
Thank you for your continued confidence and support.

| Jonathan R. Baum Chief Executive Officer The Dreyfus Corporation January 15, 2009 |
2

DISCUSSION OF FUND PERFORMANCE
For the period of January 1, 2008, through December 31, 2008, as provided by David R. Bowser, CFA, and Peter Vaream, Co-Portfolio Managers
Fund and Market Performance Overview
For the 12-month period ended December 31, 2008, Dreyfus/Standish Fixed Income Fund achieved a total return of –5.00% .1 In comparison, the Barclays Capital U.S.Aggregate Bond Index (the “Index”), the fund’s benchmark, achieved a total return of 5.24% for the same period.2
With the notable exception of U.S.Treasury securities,most sectors of the U.S. bond market suffered in 2008 as a financial crisis intensified, nearly leading to the collapse of the U.S. and global banking systems.The fund produced a lower return than its benchmark Index, due to its relative underweight position in U.S.Treasury securities and exposure to higher yielding bond market sectors that fared poorly in the downturn.
The Fund’s Investment Approach
The fund seeks to achieve a high level of current income, consistent with conserving principal and liquidity, and secondarily seeks capital appreciation when changes in interest rates or other economic conditions indicate that capital appreciation may be available without significant risk to principal.
To achieve this, the fund invests, under normal circumstances, at least 80% of net assets (including for this purpose borrowing for investment purposes) in fixed-income securities issued by U.S. and foreign governments and companies.The fund may invest up to 20% of assets in non-U.S. dollar-denominated securities of foreign issuers, including emerging-market issuers, and no more than 10% of assets in these foreign currency-denominated securities that have not been hedged back to the U.S. dollar. The fund may also invest in fixed-income futures contracts, options and swaps.
In terms of credit quality, the fund invests primarily in investment-grade securities, but may invest up to 15% of assets in below investment-grade securities, sometimes referred to as junk bonds.The fund will not invest in securities rated lower than B at the time of purchase. In this instance, we will attempt to select fixed-income securities that have the potential to be upgraded.
The Fund 3
| DISCUSSION OF FUND PERFORMANCE (continued) |
Global Financial Crisis Sparked Broad Declines
A credit crunch that began in the sub-prime mortgage market in 2007 developed into a full-blown global financial crisis over the summer of 2008, leading to the failures of several major financial institutions and sending repercussions throughout the world’s credit markets. As the crisis came close to spinning out of control in September, very difficult liquidity conditions in various markets, including the interbank lending market, nearly led to the collapse of the global banking system. Unprecedented interventions by government and monetary authorities, which pumped billions of dollars of liquidity into the system and rescued struggling corporations, helped thaw frozen credit markets by year-end.These efforts included approval of the Troubled Asset Relief Program (“TARP”) by the U.S. Congress and coordinated cuts of short-term interest rates by central banks, including the Federal Reserve Board, which reduced its target for the overnight federal funds rate to the unprecedented low level of 0% to 0.25% .
Meanwhile, slumping housing markets, rising unemployment and sharply lower consumer confidence exacerbated a downturn in the U.S. economy. Commodity prices that had soared over the first half of 2008 plummeted over the second half when demand abated for energy and construction materials worldwide. In November, the National Bureau of Economic Research officially declared that the U.S. economy has been mired in recession since late 2007.
As market conditions deteriorated, many highly leveraged institutional investors were forced to de-lever their portfolios, selling their more liquid investments to raise cash for margin calls and redemption requests. Consequently, selling pressure intensified even among fundamentally sound fixed-income securities, leading to broadly lower prices for corporate bonds, asset-backed securities, mortgage-backed securities and the sovereign debt of developing nations. Lower-rated bonds were particularly hard-hit. U.S.Treasury securities were a notable exception, gaining considerable value as risk-averse investors flocked to the relatively safe haven provided by U.S. government-backed investments.
Sector Allocation Strategies Weighed on Performance
The fund’s longstanding preference for higher yielding bond market sectors detracted from its relative performance in this challenging
4
environment. Relatively light exposure to U.S. Treasury securities, which we believe offered unappealing current yields, and an overweight position in investment-grade corporate bonds, commercial mortgage-backed securities and asset-backed securities with sound credit fundamentals weighed negatively on the fund’s total return performance despite generating high current yields.
On the other hand, the fund’s interest-rate strategies contributed positively to relative performance, as a “bulleted” emphasis on securities with three- to five-year maturities helped it benefit from widening yield differences along the bond market’s maturity range early in the year. Similarly, a modestly long average duration helped the portfolio participate more fully in the benefits of falling U.S. interest rates.
Anticipating a Return to Fundamentals
As of year-end, the financial crisis has persisted and the economic downturn has worsened. However, low expectations among investors for 2009 appear to have already been priced into bond prices, and unexpected good news could spark a market rally.Therefore, we have maintained the funds’s overweight exposure to market sectors that we believe have been punished too severely during the downturn.After extensive credit analysis, we have found what we believe to be particularly compelling values among certain commercial mortgage-backed securities and corporate bonds, which we expect to fare well in an eventual recovery.
January 15, 2009
| 1 | Total return includes reinvestment of dividends and any capital gains paid. Past performance is no guarantee of future results. Share price, yield and investment return fluctuate such that upon redemption, fund shares may be worth more or less than their original cost. Return figure provided reflects the absorption of certain fund expenses by The Dreyfus Corporation pursuant to a voluntary undertaking in effect, which may be extended, terminated or modified at any time. Had these expenses not been absorbed, the fund’s return would have been lower. |
| 2 | SOURCE: LIPPER INC. — Reflects reinvestment of dividends and, where applicable, capital gain distributions.The Barclays Capital U.S. Aggregate Bond Index is a widely accepted, unmanaged total return index of corporate, U.S. government and U.S. government agency debt instruments, mortgage-backed securities and asset-backed securities with an average maturity of 1-10 years.The Index does not include fees and expenses to which the fund is subject. |
The Fund 5
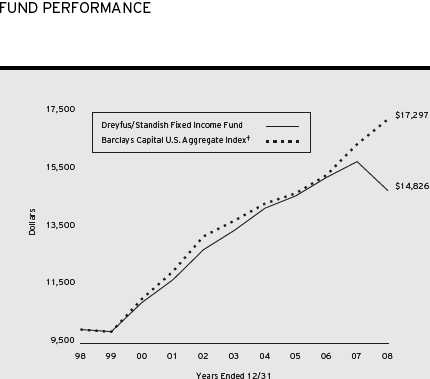
Comparison of change in value of $10,000 investment in Dreyfus/Standish Fixed Income Fund and the Barclays Capital U.S. Aggregate Index
| Average Annual Total Returns as of 12/31/08 | ||||||
| 1 Year | 5 Years | 10 Years | ||||
| Fund | (5.00)% | 2.28% | 4.17% |
† Source: Lipper Inc.
Past performance is not predictive of future performance.The fund’s performance shown in the graph and table does not reflect the deduction of taxes that a shareholder would pay on fund distributions or the redemption of fund shares.
The above graph compares a $10,000 investment made in Dreyfus/Standish Fixed Income Fund on 12/31/98 to a $10,000 investment made in the Barclays Capital U.S. Aggregate Index (the “Index”) on that date. All dividends and capital gain distributions are reinvested.
Effective 12/1/08,The Dreyfus Corporation became the fund’s investment adviser and the name of Mellon Institutional Funds Investment Trust was changed to Dreyfus Investment Funds.The fund’s name was changed to Dreyfus/Standish Fixed Income Fund.
The fund’s performance shown in the line graph takes into account all applicable fees and expenses.The Index is a widely accepted, unmanaged total return index of corporate, U.S. government and U.S. government agency debt instruments, mortgage-backed securities and asset-backed securities with an average of maturity of 1-10 years. Unlike a mutual fund, the Index is not subject to charges, fees and other expenses. Investors cannot invest directly in any index. These factors can contribute to the Index potentially outperforming the fund. Further information relating to fund performance, including expense reimbursements, if applicable, is contained in the Financial Highlights section of the prospectus and elsewhere in this report.
6
UNDERSTANDING YOUR FUND’S EXPENSES (Unaudited)
As a mutual fund investor, you pay ongoing expenses, such as management fees and other expenses. Using the information below, you can estimate how these expenses affect your investment and compare them with the expenses of other funds.You also may pay one-time transaction expenses, including sales charges (loads) and redemption fees, which are not shown in this section and would have resulted in higher total expenses. For more information, see your fund’s prospectus or talk to your financial adviser.
Review your fund’s expenses
The table below shows the expenses you would have paid on a $1,000 investment in Dreyfus/Standish Fixed Income Fund from July 1, 2008 to December 31, 2008. It also shows how much a $1,000 investment would be worth at the close of the period, assuming actual returns and expenses.
Expenses and Value of a $1,000 Investment assuming actual returns for the six months ended December 31, 2008
| Expenses paid per $1,000† | $ 2.31 | |
| Ending value (after expenses) | $953.70 |
COMPARING YOUR FUND’S EXPENSES WITH THOSE OF OTHER FUNDS (Unaudited)
Using the SEC’s method to compare expenses
The Securities and Exchange Commission (SEC) has established guidelines to help investors assess fund expenses. Per these guidelines, the table below shows your fund’s expenses based on a $1,000 investment, assuming a hypothetical 5% annualized return. You can use this information to compare the ongoing expenses (but not transaction expenses or total cost) of investing in the fund with those of other funds.All mutual fund shareholder reports will provide this information to help you make this comparison. Please note that you cannot use this information to estimate your actual ending account balance and expenses paid during the period.
Expenses and Value of a $1,000 Investment assuming a hypothetical 5% annualized return for the six months ended December 31, 2008
| Expenses paid per $1,000† | $ 2.39 | |
| Ending value (after expenses) | $1,022.77 |
| † Expenses are equal to the fund’s annualized expense ratio of .47%, multiplied by the average account value over the period, multiplied by 184/366 (to reflect the one-half year period). |
The Fund 7
| STATEMENT OF INVESTMENTS | ||||||||||
| December 31, 2008 | ||||||||||
| Coupon | Maturity | Principal | ||||||||
| Bonds and Notes—123.7% | Rate (%) | Date | Amount ($)f | Value ($) | ||||||
| Asset Backed—9.2% | ||||||||||
| American Express Credit Account | ||||||||||
| Master Trust, Ser. 2007-6, Cl. C | 1.59 | 1/15/13 | 3,975,000 | a,b | 2,592,757 | |||||
| American Express Credit Account | ||||||||||
| Master Trust, Ser. 2004-C, Cl. C | 1.70 | 2/15/12 | 168,618 | a,b | 145,542 | |||||
| American General Mortgage Loan | ||||||||||
| Trust, Ser. 2006-1, Cl. A1 | 5.75 | 12/25/35 | 851 | a,b,c | 846 | |||||
| AmeriCredit Automobile Receivables | ||||||||||
| Trust, Ser. 2008-AF, Cl. A2A | 4.47 | 1/12/12 | 1,390,000 | c | 1,314,367 | |||||
| AmeriCredit Automobile Receivables | ||||||||||
| Trust, Ser. 2005-DA, Cl. A3 | 4.87 | 12/6/10 | 124,461 | 121,858 | ||||||
| AmeriCredit Automobile Receivables | ||||||||||
| Trust, Ser. 2006-BG, Cl. A3 | 5.21 | 10/6/11 | 1,368,567 | c | 1,332,073 | |||||
| AmeriCredit Prime Automobile | ||||||||||
| Receivables, Ser. 2007-2M, | ||||||||||
| Cl. A2B | 2.26 | 11/8/10 | 205,222 | b | 201,547 | |||||
| AmeriCredit Prime Automobile | ||||||||||
| Receivables Trust, | ||||||||||
| Ser. 2007-1, Cl. E | 6.96 | 1/8/11 | 916,044 | a | 526,725 | |||||
| Bank of America Credit Card Trust, | ||||||||||
| Ser. 2007-B1, Cl. B1 | 1.28 | 6/15/12 | 2,480,000 | b,c | 2,190,944 | |||||
| Bayview Financial Acquisition | ||||||||||
| Trust, Ser. 2005-B, Cl. 1A6 | 5.21 | 4/28/39 | 163,902 | b | 122,542 | |||||
| Capital Auto Receivables Asset | ||||||||||
| Trust, Ser. 2005-1, Cl. C | 4.73 | 9/15/10 | 925,000 | c | 906,435 | |||||
| Capital Auto Receivables Asset | ||||||||||
| Trust, Ser. 2004-2, Cl. D | 5.82 | 5/15/12 | 1,805,000 | a | 1,768,631 | |||||
| Capital One Auto Finance Trust, | ||||||||||
| Ser. 2007-A, Cl. A3B | 1.20 | 8/15/11 | 939,630 | b | 892,280 | |||||
| Capital One Auto Finance Trust, | ||||||||||
| Ser. 2006-C, Cl. A3A | 5.07 | 7/15/11 | 970,345 | c | 941,025 | |||||
| Capital One Auto Finance Trust, | ||||||||||
| Ser. 2007-C, Cl. A3A | 5.13 | 4/16/12 | 2,530,000 | c | 2,310,669 | |||||
| Capital One Auto Finance Trust, | ||||||||||
| Ser. 2006-A, Cl. A3 | 5.33 | 11/15/10 | 70,061 | c | 69,824 | |||||
| ChaseFlex Trust, | ||||||||||
| Ser. 2006-2, Cl. A1A | 5.59 | 9/25/36 | 155,119 | b,c | 149,204 | |||||
| Citibank Credit Card Issuance | ||||||||||
| Trust, Ser. 2007-B1, Cl. B1 | 4.13 | 4/2/12 | 70,000 | b | 60,429 | |||||
| Citicorp Residential Mortgage | ||||||||||
| Securities, Ser. 2006-2, Cl. A2 | 5.56 | 9/25/36 | 2,400,000 | b,c | 2,296,752 | |||||
8
| Coupon | Maturity | Principal | ||||||||
| Bonds and Notes (continued) | Rate (%) | Date | Amount ($)f | Value ($) | ||||||
| Asset Backed (continued) | ||||||||||
| Citigroup Mortgage Loan Trust, | ||||||||||
| Ser. 2005-WF1, Cl. A5 | 5.01 | 2/25/35 | 140,615 | b | 98,633 | |||||
| Citigroup Mortgage Loan Trust, | ||||||||||
| Ser. 2005-WF2, Cl. AF7 | 5.25 | 8/25/35 | 1,780,404 | b | 1,135,066 | |||||
| CS First Boston Mortgage | ||||||||||
| Securities, Ser. 2002-HE4, | ||||||||||
| Cl. MF1 | 6.94 | 8/25/32 | 332,741 | b,c | 146,762 | |||||
| Ford Credit Auto Owner Trust, | ||||||||||
| Ser. 2005-C, Cl. C | 4.72 | 2/15/11 | 700,000 | c | 667,729 | |||||
| Ford Credit Auto Owner Trust, | ||||||||||
| Ser. 2006-C, Cl. C | 5.47 | 9/15/12 | 490,000 | 330,042 | ||||||
| Ford Credit Auto Owner Trust, | ||||||||||
| Ser. 2007-A, Cl. D | 7.05 | 12/15/13 | 600,000 | a | 372,399 | |||||
| Green Tree Financial, | ||||||||||
| Ser. 1994-7, Cl. M1 | 9.25 | 3/15/20 | 313,384 | c | 271,167 | |||||
| GSAA Home Equity Trust, | ||||||||||
| Ser. 2006-7, Cl. AV1 | 1.48 | 3/25/46 | 378,770 | b,c | 351,789 | |||||
| Honda Auto Receivables Owner | ||||||||||
| Trust, Ser. 2006-1, Cl. A3 | 5.07 | 2/18/10 | 116,957 | 116,828 | ||||||
| Hyundai Auto Receivables Trust, | ||||||||||
| Ser. 2004-A, Cl. B | 3.46 | 8/15/11 | 11,790 | 11,767 | ||||||
| Hyundai Auto Receivables Trust, | ||||||||||
| Ser. 2007-A, Cl. A3A | 5.04 | 1/17/12 | 845,000 | c | 831,044 | |||||
| Hyundai Auto Receivables Trust, | ||||||||||
| Ser. 2006-B, Cl. C | 5.25 | 5/15/13 | 10,000 | 9,085 | ||||||
| JP Morgan Mortgage Acquisition, | ||||||||||
| Ser. 2007-HE1, Cl. AF1 | 0.57 | 4/1/37 | 1,649,576 | b,c | 1,303,537 | |||||
| Mastr Asset Backed Securities | ||||||||||
| Trust, Ser. 2006-AM1, Cl. A2 | 1.53 | 1/25/36 | 413,194 | b | 385,169 | |||||
| Nomura Asset Acceptance, | ||||||||||
| Ser. 2005-AP1, Cl. 2A5 | 4.86 | 2/25/35 | 39,129 | b | 24,037 | |||||
| Nomura Asset Acceptance, | ||||||||||
| Ser. 2005-WF1, Cl. 2A5 | 5.16 | 3/25/35 | 925,987 | b | 689,713 | |||||
| Origen Manufactured Housing, | ||||||||||
| Ser. 2004-B, Cl. A2 | 3.79 | 12/15/17 | 7,946 | c | 7,770 | |||||
| Origen Manufactured Housing, | ||||||||||
| Ser. 2005-B, Cl. A2 | 5.25 | 12/15/18 | 146,718 | c | 139,687 | |||||
| Origen Manufactured Housing | ||||||||||
| Ser. 2005-B, Cl. A3 | 5.61 | 5/15/22 | 100,000 | 81,988 | ||||||
The Fund 9
| STATEMENT OF INVESTMENTS (continued) |
| Coupon | Maturity | Principal | ||||||||
| Bonds and Notes (continued) | Rate (%) | Date | Amount ($)f | Value ($) | ||||||
| Asset Backed (continued) | ||||||||||
| Residential Asset Mortgage | ||||||||||
| Products, Ser. 2004-RS12, | ||||||||||
| Cl. AI6 | 4.55 | 12/25/34 | 72,888 | 50,618 | ||||||
| Residential Funding Mortgage | ||||||||||
| Securities, Ser. 2005-HI3, | ||||||||||
| Cl. A4 | 5.49 | 9/25/35 | 100,000 | 94,861 | ||||||
| Specialty Underwriting & | ||||||||||
| Residential Finance, | ||||||||||
| Ser. 2006-BC2 Cl. A2B | 5.57 | 2/25/37 | 289,431 | b,c | 196,753 | |||||
| Terwin Mortgage Trust, | ||||||||||
| Ser. 2006-9HGA Cl. A1 | 0.55 | 10/25/37 | 148,932 | a,b | 135,800 | |||||
| Vanderbilt Mortgage Finance, | ||||||||||
| Ser. 1999-A, Cl. 1A6 | 6.75 | 3/7/29 | 1,030,000 | b | 828,211 | |||||
| Wachovia Auto Loan Owner Trust, | ||||||||||
| Ser. 2007-1, Cl. D | 5.65 | 2/20/13 | 1,725,000 | c | 821,548 | |||||
| Wells Fargo Mortgage Backed | ||||||||||
| Securities Trust, Ser. 2003-1, | ||||||||||
| Cl. 2A9 | 5.75 | 2/25/33 | 193,516 | c | 150,764 | |||||
| WFS Financial Owner Trust, | ||||||||||
| Ser. 2005-3, Cl. B | 4.50 | 5/17/13 | 580,000 | c | 556,446 | |||||
| WFS Financial Owner Trust, | ||||||||||
| Ser. 2005-2, Cl. B | 4.57 | 11/19/12 | 891,000 | c | 876,766 | |||||
| 28,630,429 | ||||||||||
| Banks—9.6% | ||||||||||
| Bank of America, | ||||||||||
| Jr. Sub. Bonds | 8.00 | 12/29/49 | 2,470,000 | b,e | 1,779,190 | |||||
| Barclays Bank, | ||||||||||
| Jr. Sub. Bonds | 5.93 | 12/15/49 | 1,300,000 | a,b | 478,598 | |||||
| Barclays Bank, | ||||||||||
| Sub. Bonds | 7.70 | 4/25/49 | 625,000 | a,b | 414,177 | |||||
| Capital One Financial, | ||||||||||
| Sr. Unscd. Notes | 2.47 | 9/10/09 | 2,425,000 | b | 2,310,278 | |||||
| Chevy Chase Bank, | ||||||||||
| Sub. Notes | 6.88 | 12/1/13 | 1,322,000 | 1,065,862 | ||||||
| Chuo Mitsui Trust & Banking, | ||||||||||
| Jr. Sub. Notes | 5.51 | 12/29/49 | 1,335,000 | a,b | 919,776 | |||||
| Citigroup, | ||||||||||
| Sr. Unscd. Notes | 5.50 | 4/11/13 | 4,865,000 | 4,741,400 | ||||||
| City National of Beverly Hills | ||||||||||
| California, Sr. Notes | 5.13 | 2/15/13 | 595,000 | 510,058 | ||||||
10
| Coupon | Maturity | Principal | ||||||||||
| Bonds and Notes (continued) | Rate (%) | Date | Amount ($)f | Value ($) | ||||||||
| Banks (continued) | ||||||||||||
| Colonial Bank, | ||||||||||||
| Sub. Notes | 6.38 | 12/1/15 | 1,100,000 | 734,478 | ||||||||
| HSBC Finance Capital Trust IX, | ||||||||||||
| Gtd. Notes | 5.91 | 11/30/35 | 3,135,000 | b | 1,313,164 | |||||||
| Industrial Bank of Korea, | ||||||||||||
| Sub. Notes | 4.00 | 5/19/14 | 280,000 | a,b | 257,534 | |||||||
| Manufacturers & Traders Trust, | ||||||||||||
| Sub. Notes | 5.59 | 12/28/20 | 625,000 | b | 449,045 | |||||||
| Marshall & Ilsley Bank, | ||||||||||||
| Sub. Notes, Ser. BN | 2.48 | 12/4/12 | 4,745,000 | b,c | 3,716,170 | |||||||
| MUFG Capital Finance I, | ||||||||||||
| Bank Gtd. Bonds | 6.35 | 7/29/49 | 710,000 | b | 495,345 | |||||||
| NB Capital Trust IV, | ||||||||||||
| Bank Gtd. Cap. Secs | 8.25 | 4/15/27 | 265,000 | 219,686 | ||||||||
| Royal Bank of Scotland Group, | ||||||||||||
| Jr. Sub. Bonds | 6.99 | 10/5/49 | 1,360,000 | a,b | 636,651 | |||||||
| Sovereign Bancorp, | ||||||||||||
| Sr. Unscd. Notes | 1.73 | 3/23/10 | 1,235,000 | b | 1,096,921 | |||||||
| Sovereign Bancorp, | ||||||||||||
| Sr. Unscd. Notes | 2.46 | 3/1/09 | 46,000 | b | 45,233 | |||||||
| Sovereign Bancorp, | ||||||||||||
| Sr. Unscd. Notes | 4.80 | 9/1/10 | 1,085,000 | 973,602 | ||||||||
| St. George Bank, | ||||||||||||
| Sub. Notes | 5.30 | 10/15/15 | 871,000 | a | 839,670 | |||||||
| Sumitomo Mitsui Banking, | ||||||||||||
| Sub. Notes | EUR | 4.38 | 7/15/49 | 550,000 | b | 442,890 | ||||||
| Sumitomo Mitsui Banking, | ||||||||||||
| Sub. Notes | �� | 5.63 | 7/29/49 | 845,000 | a,b | 626,601 | ||||||
| SunTrust Preferred Capital I, | ||||||||||||
| Bank, Gtd. Notes | 5.85 | 12/31/49 | 1,205,000 | b | 651,075 | |||||||
| Wachovia, | ||||||||||||
| Sub. Notes | 6.38 | 1/15/09 | 990,000 | 988,290 | ||||||||
| Wells Fargo & Co., | ||||||||||||
| Sub. Notes | 6.38 | 8/1/11 | 785,000 | 801,736 | ||||||||
| Wells Fargo Capital XIII, | ||||||||||||
| Bank Gtd. Secs | 7.70 | 12/29/49 | 3,035,000 | b | 2,506,946 | |||||||
| Western Financial Bank, | ||||||||||||
| Sub. Debs | 9.63 | 5/15/12 | 905,000 | 892,241 | ||||||||
| 29,906,617 | ||||||||||||
The Fund 11
| STATEMENT OF INVESTMENTS (continued) |
| Coupon | Maturity | Principal | ||||||||
| Bonds and Notes (continued) | Rate (%) | Date | Amount ($)f | Value ($) | ||||||
| Basic Materials—.5% | ||||||||||
| Alcoa, | ||||||||||
| Sr. Unscd. Notes | 6.00 | 7/15/13 | 345,000 | 312,242 | ||||||
| Cabot Finance, | ||||||||||
| Sr. Unscd. Notes | 5.25 | 9/1/13 | 890,000 | a | 938,366 | |||||
| Enterprise Products Operating, | ||||||||||
| Gtd. Notes, Ser. B | 4.63 | 10/15/09 | 230,000 | 222,806 | ||||||
| 1,473,414 | ||||||||||
| Collateralized Mortgage | ||||||||||
| Obligations—6.7% | ||||||||||
| Banc of America Mortgage | ||||||||||
| Securities, Ser. 2004-F, Cl. 2A7 | 4.15 | 7/25/34 | 22,349 | b,c | 21,535 | |||||
| Countrywide Home Loan Mortgage | ||||||||||
| Pass-Through Trust, | ||||||||||
| Ser. 2005-31, Cl. 2A1 | 5.47 | 1/25/36 | 2,536,621 | b,c | 1,822,116 | |||||
| Federal National Mortgage | ||||||||||
| Association, Grantor Trust, | ||||||||||
| Ser. 2001-T11, Cl. B | 5.50 | 9/25/11 | 20,000 | g | 21,442 | |||||
| Government National Mortgage | ||||||||||
| Association, Ser. 2004-57, Cl. A | 3.02 | 1/16/19 | 689,929 | c | 686,995 | |||||
| Government National Mortgage | ||||||||||
| Association, Ser. 2004-97, Cl. AB | 3.08 | 4/16/22 | 1,493,815 | c | 1,486,134 | |||||
| Government National Mortgage | ||||||||||
| Association, Ser. 2007-46, Cl. A | 3.14 | 11/16/29 | 1,117,936 | c | 1,114,883 | |||||
| Government National Mortgage | ||||||||||
| Association, Ser. 2004-25, Cl. AC | 3.38 | 1/16/23 | 488,997 | c | 488,306 | |||||
| Government National Mortgage | ||||||||||
| Association, Ser. 2004-77, Cl. A | 3.40 | 3/16/20 | 289,247 | c | 288,837 | |||||
| Government National Mortgage | ||||||||||
| Association, Ser. 2004-67, Cl. A | 3.65 | 9/16/17 | 222,915 | c | 222,744 | |||||
| Government National Mortgage | ||||||||||
| Association, Ser. 2005-90, Cl. A | 3.76 | 9/16/28 | 1,323,710 | c | 1,326,589 | |||||
| Government National Mortgage | ||||||||||
| Association, Ser. 2005-29, Cl. A | 4.02 | 7/16/27 | 935,041 | c | 940,356 | |||||
| Government National Mortgage | ||||||||||
| Association, Ser. 2005-9, Cl. A | 4.03 | 5/16/22 | 1,078,676 | c | 1,075,481 | |||||
| Government National Mortgage | ||||||||||
| Association, Ser. 2004-51, Cl. A | 4.15 | 2/16/18 | 1,032,410 | c | 1,036,792 | |||||
| Government National Mortgage | ||||||||||
| Association, Ser. 2006-9, Cl. A | 4.20 | 8/16/26 | 2,216,646 | c | 2,233,869 | |||||
12
| Coupon | Maturity | Principal | ||||||||
| Bonds and Notes (continued) | Rate (%) | Date | Amount ($)f | Value ($) | ||||||
| Collateralized Mortgage | ||||||||||
| Obligations (continued) | ||||||||||
| Government National Mortgage | ||||||||||
| Association, Ser. 2006-3, Cl. A | 4.21 | 1/16/28 | 1,654,042 | c | 1,667,663 | |||||
| Government National Mortgage | ||||||||||
| Association, Ser. 2006-55, Cl. A | 4.25 | 7/16/29 | 2,028,534 | c | 2,047,563 | |||||
| Government National Mortgage | ||||||||||
| Association, Ser. 2005-32, Cl. B | 4.39 | 8/16/30 | 1,230,540 | c | 1,242,015 | |||||
| Government National Mortgage | ||||||||||
| Association, Ser. 2005-87, Cl. A | 4.45 | 3/16/25 | 1,052,394 | c | 1,063,746 | |||||
| Structured Asset Mortgage | ||||||||||
| Investments, Ser. 1998-2, Cl. B | 5.63 | 4/30/30 | 30,005 | b,c | 23,689 | |||||
| WaMu Mortgage Pass Through | ||||||||||
| Certificates, Ser. 2004-AR7, | ||||||||||
| Cl. A6 | 3.94 | 7/25/34 | 241,000 | b,c | 236,266 | |||||
| WaMu Mortgage Pass Through | ||||||||||
| Certificates, Ser. 2004-AR9, | ||||||||||
| Cl. A7 | 4.14 | 8/25/34 | 1,342,000 | b,c | 1,290,430 | |||||
| WaMu Mortgage Pass-Through | ||||||||||
| Certificates, | ||||||||||
| Ser. 2005-AR4, Cl. A4B | 4.67 | 4/25/35 | 656,000 | b,c | 612,018 | |||||
| 20,949,469 | ||||||||||
| Commercial Mortgage | ||||||||||
| Pass-Through Ctfs.—8.8% | ||||||||||
| Banc of America Commercial | ||||||||||
| Mortgage, Ser. 2002-2, Cl. A3 | 5.12 | 7/11/43 | 560,000 | c | 520,565 | |||||
| Bayview Commercial Asset Trust, | ||||||||||
| Ser. 2004-1, Cl. A | 0.83 | 4/25/34 | 290,628 | a,b | 211,846 | |||||
| Bayview Commercial Asset Trust, | ||||||||||
| Ser. 2003-2, Cl. A | 1.05 | 12/25/33 | 283,858 | a,b | 235,997 | |||||
| Bayview Commercial Asset Trust, | ||||||||||
| Ser. 2005-3A, Cl. B1 | 1.57 | 11/25/35 | 115,364 | a,b | 61,120 | |||||
| Bayview Commercial Asset Trust, | ||||||||||
| Ser. 2006-SP1, Cl. A1 | 1.67 | 4/25/36 | 153,111 | a,b | 120,958 | |||||
| Bayview Commercial Asset Trust, | ||||||||||
| Ser. 2006-SP2, Cl. A | 1.68 | 1/25/37 | 1,010,897 | a,b | 774,650 | |||||
| Bayview Commercial Asset Trust, | ||||||||||
| Ser. 2006-2A, Cl. B2 | 2.87 | 7/25/36 | 345,105 | a,b | 173,898 | |||||
| Bayview Commercial Asset Trust, | ||||||||||
| Ser. 2006-1A, Cl. B2 | 3.10 | 4/25/36 | 181,887 | a,b | 87,142 | |||||
The Fund 13
| STATEMENT OF INVESTMENTS (continued) |
| Coupon | Maturity | Principal | ||||||||
| Bonds and Notes (continued) | Rate (%) | Date | Amount ($)f | Value ($) | ||||||
| Commercial Mortgage | ||||||||||
| Pass-Through Ctfs. (continued) | ||||||||||
| Bayview Commercial Asset Trust, | ||||||||||
| Ser. 2005-3A, Cl. B3 | 3.47 | 11/25/35 | 230,727 | a,b | 115,202 | |||||
| Bayview Commercial Asset Trust, | ||||||||||
| Ser. 2005-4A, Cl. B3 | 4.90 | 1/25/36 | 80,044 | a,b | 24,013 | |||||
| Bear Stearns Commercial Mortgage | ||||||||||
| Securities, Ser. 2003-T12, Cl. A3 | 4.24 | 4/13/12 | 2,073,000 | b,c | 2,017,718 | |||||
| Bear Stearns Commercial Mortgage | ||||||||||
| Securities, Ser. 2005-T18 Cl. A2 | 4.56 | 2/13/42 | 105,000 | b,c | 99,253 | |||||
| Bear Stearns Commercial Mortgage | ||||||||||
| Securities, Ser. 2006-PW12, | ||||||||||
| Cl. AAB | 5.69 | 9/11/38 | 875,000 | b | 716,529 | |||||
| Bear Stearns Commercial Mortgage | ||||||||||
| Securities, Ser. 1998-C1, Cl. A2 | 6.44 | 6/16/30 | 2,477 | c | 2,469 | |||||
| Credit Suisse Mortgage Capital | ||||||||||
| Certificate, Ser. 2006-C1, Cl. A2 | 5.51 | 2/15/39 | 45,000 | b | 40,332 | |||||
| Credit Suisse/Morgan Stanley | ||||||||||
| Commercial Mortgage Certificates, | ||||||||||
| Ser. 2006-HC1A, Cl. A1 | 1.39 | 5/15/23 | 1,121,936 | a,b,c | 900,216 | |||||
| Crown Castle Towers, | ||||||||||
| Ser. 2006-1A, Cl. AFX | 5.24 | 11/15/36 | 2,725,000 | a,c | 2,265,946 | |||||
| Crown Castle Towers, | ||||||||||
| Ser. 2006-1A, Cl. B | 5.36 | 11/15/36 | 620,000 | a,c | 452,600 | |||||
| Crown Castle Towers, | ||||||||||
| Ser. 2006-1A, Cl. C | 5.47 | 11/15/36 | 1,555,000 | a,c | 1,093,289 | |||||
| Crown Castle Towers, | ||||||||||
| Ser. 2005-1A, Cl. D | 5.61 | 6/15/35 | 610,000 | a,c | 428,879 | |||||
| Crown Castle Towers, | ||||||||||
| Ser. 2006-1A, Cl. D | 5.77 | 11/15/36 | 950,000 | a,c | 598,500 | |||||
| CS First Boston Mortgage | ||||||||||
| Securities, Ser. 2005-C4, Cl. AAB | 5.07 | 8/15/38 | 1,050,000 | b | 859,530 | |||||
| DLJ Commercial Mortgage | ||||||||||
| Ser. 1998-CF2, Cl. B1 | 7.02 | 11/12/31 | 224,885 | b,c | 224,345 | |||||
| Federal National Mortgage | ||||||||||
| Association, Grantor Trust, | ||||||||||
| Ser. 2002-T11, Cl. A | 4.77 | 4/25/12 | 16,472 | c,g | 16,821 | |||||
| Federal National Mortgage | ||||||||||
| Association, Grantor Trust, | ||||||||||
| Ser. 2002-T3, Cl. A | 5.14 | 12/25/11 | 491,138 | c,g | 510,893 | |||||
14
| Coupon | Maturity | Principal | ||||||||
| Bonds and Notes (continued) | Rate (%) | Date | Amount ($)f | Value ($) | ||||||
| Commercial Mortgage | ||||||||||
| Pass-Through Ctfs. (continued) | ||||||||||
| Federal National Mortage | ||||||||||
| Association, Grantor Trust, | ||||||||||
| Ser. 2001-T6, Cl. B, | 6.09 | 5/25/11 | 146,000 | c,g | 157,499 | |||||
| Global Signal Trust, | ||||||||||
| Ser. 2006-1, Cl. C | 5.71 | 2/15/36 | 875,000 | a,c | 656,250 | |||||
| Global Signal Trust, | ||||||||||
| Ser. 2006-1, Cl. D | 6.05 | 2/15/36 | 1,105,000 | a,c | 800,849 | |||||
| Global Signal Trust, | ||||||||||
| Ser. 2006-1, Cl. E | 6.50 | 2/15/36 | 425,000 | a | 290,292 | |||||
| GMAC Commercial Mortgage | ||||||||||
| Securities, Ser. 2003-C3, Cl. A2 | 4.22 | 4/10/40 | 78,130 | c | 75,427 | |||||
| Goldman Sachs Mortgage Securities | ||||||||||
| Corporation II, Ser. 2007-EOP, | ||||||||||
| Cl. B | 2.13 | 3/20/20 | 2,965,000 | a,b,c | 1,908,510 | |||||
| Goldman Sachs Mortgage Securities | ||||||||||
| Corporation II, Ser. 2007-EOP, | ||||||||||
| Cl. E�� | 2.32 | 3/20/20 | 1,120,000 | a,b,c | 720,546 | |||||
| Goldman Sachs Mortgage Securities | ||||||||||
| Corporation II, Ser. 2007-EOP, | ||||||||||
| Cl. F | 2.36 | 3/20/20 | 50,000 | a,b,c | 30,197 | |||||
| Goldman Sachs Mortgage Securities | ||||||||||
| Corporation II, Ser. 2007-EOP, | ||||||||||
| Cl. G | 2.40 | 3/20/20 | 25,000 | a,b,c | 15,094 | |||||
| Goldman Sachs Mortgage Securities | ||||||||||
| Corporation II, Ser. 2007-EOP, | ||||||||||
| Cl. K | 2.93 | 3/20/20 | 650,000 | a,b | 391,895 | |||||
| Goldman Sachs Mortgage Securities | ||||||||||
| Corporation II, Ser. 2007-EOP, | ||||||||||
| Cl. L | 3.18 | 3/20/20 | 35,000 | a,b | 21,000 | |||||
| Impac CMB Trust, | ||||||||||
| Ser. 2005-8, Cl. 2M2 | 1.22 | 2/25/36 | 111,208 | b,c | 55,815 | |||||
| Impac CMB Trust, | ||||||||||
| Ser. 2005-8, Cl. 2M3 | 1.97 | 2/25/36 | 88,199 | b,c | 35,774 | |||||
| Impac Secured Assets CMN Owner | ||||||||||
| Trust, Ser. 2006-1, Cl. 2A1 | 0.82 | 5/25/36 | 587,944 | b,c | 418,651 | |||||
| JP Morgan Chase Commercial | ||||||||||
| Mortgage Securities, | ||||||||||
| Ser. 2004-C1, Cl. A2 | 4.30 | 1/15/38 | 1,960,000 | c | 1,806,771 | |||||
The Fund 15
| STATEMENT OF INVESTMENTS (continued) |
| Coupon | Maturity | Principal | ||||||||
| Bonds and Notes (continued) | Rate (%) | Date | Amount ($)f | Value ($) | ||||||
| Commercial Mortgage | ||||||||||
| Pass-Through Ctfs. (continued) | ||||||||||
| JP Morgan Chase Commercial | ||||||||||
| Mortgage Securities, | ||||||||||
| Ser. 2005-LDP5, Cl. A2 | 5.20 | 12/15/44 | 1,485,000 | c | 1,332,494 | |||||
| LB Commercial Conduit Mortgage | ||||||||||
| Trust, Ser. 1999-C1, Cl. B | 6.93 | 6/15/31 | 62,000 | c | 61,758 | |||||
| Merrill Lynch Mortgage Trust, | ||||||||||
| Ser. 2005-CKI1, Cl. A2 | 5.22 | 11/12/37 | 350,000 | b,c | 316,733 | |||||
| Merrill Lynch Mortgage Trust, | ||||||||||
| Ser. 2002-MW1, Cl. A3 | 5.40 | 7/12/34 | 1,508,495 | c | 1,471,605 | |||||
| Morgan Stanley Capital I, | ||||||||||
| Ser. 2005-HQ5, Cl. A2 | 4.81 | 1/14/42 | 1,407,836 | c | 1,365,116 | |||||
| Morgan Stanley Dean Witter Capital | ||||||||||
| I, Ser. 2001-PPM, Cl. A2 | 6.40 | 2/15/31 | 16,427 | 16,202 | ||||||
| Morgan Stanley Dean Witter Capital | ||||||||||
| I, Ser. 2001-PPM, Cl. A3 | 6.54 | 2/15/31 | 20,065 | 19,825 | ||||||
| SBA CMBS Trust, | ||||||||||
| Ser. 2006-1A, Cl. D | 5.85 | 11/15/36 | 375,000 | a,c | 266,250 | |||||
| Sovereign Commercial Mortgage | ||||||||||
| Securities Trust, | ||||||||||
| Ser. 2007-C1, Cl. D | 5.78 | 7/22/30 | 780,000 | a,b | 82,305 | |||||
| TIAA Seasoned Commercial Mortgage | ||||||||||
| Trust, Ser. 2007-C4, Cl. A3 | 6.09 | 8/15/39 | 940,000 | b | 812,296 | |||||
| Wachovia Bank Commercial Mortgage | ||||||||||
| Trust, Ser. 2005-C16, Cl. A2 | 4.38 | 10/15/41 | 990,245 | c | 937,018 | |||||
| Wachovia Bank Commercial Mortgage | ||||||||||
| Trust, Ser. 2005-C19, Cl. A5 | 4.66 | 5/15/44 | 740,000 | 649,048 | ||||||
| 27,267,931 | ||||||||||
| Communications—4.0% | ||||||||||
| AT & T, | ||||||||||
| Sr. Unscd. Notes | 5.60 | 5/15/18 | 1,670,000 | 1,703,380 | ||||||
| AT & T, | ||||||||||
| Gtd. Notes | 7.30 | 11/15/11 | 975,000 | c | 1,013,642 | |||||
| Comcast, | ||||||||||
| Gtd. Notes | 5.50 | 3/15/11 | 335,000 | c | 328,077 | |||||
| Comcast, | ||||||||||
| Gtd. Notes | 6.30 | 11/15/17 | 1,265,000 | 1,233,526 | ||||||
| Cox Communications, | ||||||||||
| Notes | 6.25 | 6/1/18 | 1,125,000 | a | 1,000,246 | |||||
16
| Coupon | Maturity | Principal | ||||||||
| Bonds and Notes (continued) | Rate (%) | Date | Amount ($)f | Value ($) | ||||||
| Communications (continued) | ||||||||||
| News America, | ||||||||||
| Gtd. Notes | 6.15 | 3/1/37 | 1,385,000 | 1,296,395 | ||||||
| News America, | ||||||||||
| Gtd. Notes | 6.65 | 11/15/37 | 515,000 | 511,348 | ||||||
| News America Holdings, | ||||||||||
| Gtd. Notes | 7.70 | 10/30/25 | 945,000 | 905,146 | ||||||
| TCI Communications, | ||||||||||
| Sr. Unscd. Bonds | 7.88 | 2/15/26 | 765,000 | 795,684 | ||||||
| Time Warner, | ||||||||||
| Gtd. Notes | 5.88 | 11/15/16 | 2,590,000 | 2,325,431 | ||||||
| Time Warner Cable, | ||||||||||
| Gtd. Notes | 5.85 | 5/1/17 | 1,295,000 | 1,184,943 | ||||||
| 12,297,818 | ||||||||||
| Consumer Cyclical—.1% | ||||||||||
| Daimler Finance North America, | ||||||||||
| Gtd. Notes | 2.35 | 3/13/09 | 80,000 | b | 79,963 | |||||
| DaimlerChrysler North America, | ||||||||||
| Gtd. Notes | 2.43 | 3/13/09 | 150,000 | b | 144,631 | |||||
| Macy’s, | ||||||||||
| Gtd. Notes | 4.80 | 7/15/09 | 30,000 | 28,439 | ||||||
| 253,033 | ||||||||||
| Consumer Noncyclical—.8% | ||||||||||
| Kraft Foods, | ||||||||||
| Sr. Unscd. Notes | 6.00 | 2/11/13 | 285,000 | 289,885 | ||||||
| Kroger, | ||||||||||
| Gtd. Notes | 6.15 | 1/15/20 | 1,165,000 | 1,151,689 | ||||||
| Safeway, | ||||||||||
| Sr. Unscd. Notes | 6.35 | 8/15/17 | 1,165,000 | 1,153,710 | ||||||
| 2,595,284 | ||||||||||
| Energy—.4% | ||||||||||
| Amerada Hess, | ||||||||||
| Sr. Unscd. Notes | 6.65 | 8/15/11 | 1,025,000 | 1,025,199 | ||||||
| ANR Pipeline, | ||||||||||
| Sr. Unscd. Notes | 7.00 | 6/1/25 | 10,000 | 10,046 | ||||||
| Chesapeake Energy, | ||||||||||
| Gtd. Notes | 7.50 | 6/15/14 | 255,000 | 216,750 | ||||||
| 1,251,995 | ||||||||||
The Fund 17
| STATEMENT OF INVESTMENTS (continued) |
| Coupon | Maturity | Principal | ||||||||
| Bonds and Notes (continued) | Rate (%) | Date | Amount ($)f | Value ($) | ||||||
| Financials—13.4% | ||||||||||
| Ace INA Holdings, | ||||||||||
| Gtd. Notes | 5.80 | 3/15/18 | 745,000 | 671,618 | ||||||
| Allstate, | ||||||||||
| Jr. Sub. Debs | 6.50 | 5/15/57 | 510,000 | b | 287,399 | |||||
| American Express Credit, | ||||||||||
| Sr. Unscd. Notes | 1.93 | 11/9/09 | 990,000 | b,c | 920,822 | |||||
| Ameriprise Financial, | ||||||||||
| Jr. Sub. Notes | 7.52 | 6/1/66 | 610,000 | b | 330,710 | |||||
| Amvescap, | ||||||||||
| Gtd. Notes | 5.38 | 2/27/13 | 595,000 | 528,947 | ||||||
| Amvescap, | ||||||||||
| Gtd. Notes | 5.63 | 4/17/12 | 80,000 | 73,251 | ||||||
| Arden Realty, | ||||||||||
| Sr. Unscd. Notes | 5.20 | 9/1/11 | 760,000 | 730,064 | ||||||
| Boeing Capital, | ||||||||||
| Sr. Unscd. Notes | 7.38 | 9/27/10 | 975,000 | c | 1,018,149 | |||||
| Boston Properties, | ||||||||||
| Sr. Unscd. Notes | 5.63 | 4/15/15 | 645,000 | 430,067 | ||||||
| Capmark Financial Group, | ||||||||||
| Gtd. Notes | 5.88 | 5/10/12 | 1,665,000 | 568,080 | ||||||
| Commercial Net Realty, | ||||||||||
| Sr. Unscd. Notes | 6.15 | 12/15/15 | 565,000 | 416,817 | ||||||
| Countrywide Home Loans, | ||||||||||
| Gtd. Notes | 4.13 | 9/15/09 | 590,000 | 583,184 | ||||||
| Duke Realty, | ||||||||||
| Sr. Notes | 7.75 | 11/15/09 | 859,000 | 800,468 | ||||||
| ERAC USA Finance, | ||||||||||
| Notes | 3.72 | 4/30/09 | 320,000 | a,b,c | 305,290 | |||||
| ERAC USA Finance, | ||||||||||
| Gtd. Notes | 6.38 | 10/15/17 | 1,425,000 | a | 990,460 | |||||
| ERAC USA Finance, | ||||||||||
| Notes | 7.95 | 12/15/09 | 1,008,000 | a,c | 964,439 | |||||
| Federal Realty Investment Trust, | ||||||||||
| Sr. Unscd. Bonds | 5.65 | 6/1/16 | 705,000 | 463,955 | ||||||
| Federal Realty Investment Trust, | ||||||||||
| Sr. Unscd. Notes | 6.00 | 7/15/12 | 380,000 | 304,571 | ||||||
| General Electric Capital, | ||||||||||
| Sr. Unscd. Notes | 4.52 | 10/21/10 | 2,755,000 | b,c | 2,558,825 | |||||
| Goldman Sachs Capital II, | ||||||||||
| Gtd. Bonds | 5.79 | 5/8/49 | 945,000 | b | 363,502 | |||||
18
| Coupon | Maturity | Principal | ||||||||
| Bonds and Notes (continued) | Rate (%) | Date | Amount ($)f | Value ($) | ||||||
| Financials (continued) | ||||||||||
| Goldman Sachs Group, | ||||||||||
| Sub. Notes | 5.63 | 1/15/17 | 390,000 | 335,558 | ||||||
| Goldman Sachs Group, | ||||||||||
| Sub. Notes | 6.75 | 10/1/37 | 925,000 | 753,062 | ||||||
| HRPT Properties Trust, | ||||||||||
| Sr. Unscd. Notes | 2.52 | 3/16/11 | 541,000 | b,c | 397,491 | |||||
| International Lease Finance, | ||||||||||
| Sr. Unscd. Notes | 2.37 | 5/24/10 | 40,000 | b | 31,894 | |||||
| International Lease Finance, | ||||||||||
| Sr. Unscd. Notes | 6.38 | 3/25/13 | 895,000 | 608,481 | ||||||
| J.P. Morgan & Co., | ||||||||||
| Sub. Notes | 6.25 | 1/15/09 | 30,000 | 30,015 | ||||||
| Jackson National Life Global, | ||||||||||
| Sr. Scd. Notes | 5.38 | 5/8/13 | 785,000 | a | 710,083 | |||||
| Janus Capital Group, | ||||||||||
| Sr. Unscd. Notes | 6.25 | 6/15/12 | 1,045,000 | 837,356 | ||||||
| Jefferies Group, | ||||||||||
| Sr. Unscd. Notes | 7.75 | 3/15/12 | 1,890,000 | 1,583,325 | ||||||
| JPMorgan Chase & Co., | ||||||||||
| Sr. Unscd. Notes | 6.40 | 5/15/38 | 1,230,000 | 1,460,294 | ||||||
| Kingsway America, | ||||||||||
| Sr. Notes | 7.50 | 2/1/14 | 45,000 | a | 36,417 | |||||
| Leucadia National, | ||||||||||
| Sr. Unscd. Notes | 7.00 | 8/15/13 | 1,185,000 | 948,000 | ||||||
| Leucadia National, | ||||||||||
| Sr. Unscd. Notes | 7.13 | 3/15/17 | 950,000 | 710,125 | ||||||
| Liberty Property, | ||||||||||
| Sr. Unscd. Notes | 5.50 | 12/15/16 | 535,000 | 318,840 | ||||||
| Lincoln National, | ||||||||||
| Sr. Unscd. Notes | 2.18 | 3/12/10 | 1,285,000 | b,c | 1,128,894 | |||||
| Lincoln National, | ||||||||||
| Jr. Sub. Bonds | 6.05 | 4/20/67 | 2,870,000 | b | 1,149,415 | |||||
| Mack-Cali Realty, | ||||||||||
| Sr. Unscd. Notes | 5.05 | 4/15/10 | 485,000 | 427,807 | ||||||
| Mack-Cali Realty, | ||||||||||
| Sr. Unscd. Notes | 5.13 | 1/15/15 | 581,000 | 366,061 | ||||||
| Mack-Cali Realty, | ||||||||||
| Sr. Unscd. Notes | 5.25 | 1/15/12 | 830,000 | 644,826 | ||||||
| Mack-Cali Realty, | ||||||||||
| Sr. Unscd. Notes | 5.80 | 1/15/16 | 595,000 | e | 385,738 | |||||
The Fund 19
| STATEMENT OF INVESTMENTS (continued) |
| Coupon | Maturity | Principal | ||||||||||
| Bonds and Notes (continued) | Rate (%) | Date | Amount ($)f | Value ($) | ||||||||
| Financials (continued) | ||||||||||||
| MassMutual Global Funding II, | ||||||||||||
| Notes | 3.80 | 4/15/09 | 637,000 | a | 637,182 | |||||||
| MBNA, | ||||||||||||
| Sr. Unscd. Notes | 6.13 | 3/1/13 | 1,470,000 | 1,420,423 | ||||||||
| Merrill Lynch & Co., | ||||||||||||
| Sub. Notes | 5.70 | 5/2/17 | 1,970,000 | 1,748,123 | ||||||||
| Merrill Lynch & Co., | ||||||||||||
| Sr. Unscd. Notes | 6.05 | 8/15/12 | 1,700,000 | 1,678,524 | ||||||||
| MetLife, | ||||||||||||
| Sr. Unscd. Notes | 5.00 | 6/15/15 | 2,078,000 | 1,949,066 | ||||||||
| Morgan Stanley, | ||||||||||||
| Sr. Unscd. Notes | 5.75 | 8/31/12 | 680,000 | 634,549 | ||||||||
| Morgan Stanley, | ||||||||||||
| Sr. Unscd. Notes | 6.60 | 4/1/12 | 805,000 | 778,821 | ||||||||
| Nippon Life Insurance, | ||||||||||||
| Notes | 4.88 | 8/9/10 | 1,000,000 | a | 979,577 | |||||||
| NYSE Euronext, | ||||||||||||
| Sr. Unscd. Notes | 4.80 | 6/28/13 | 895,000 | 868,970 | ||||||||
| Pacific Life Global Funding, | ||||||||||||
| Notes | 3.75 | 1/15/09 | 40,000 | a | 40,006 | |||||||
| Regency Centers, | ||||||||||||
| Gtd. Notes | 5.25 | 8/1/15 | 409,000 | 271,402 | ||||||||
| Regency Centers, | ||||||||||||
| Gtd. Notes | 5.88 | 6/15/17 | 330,000 | 209,296 | ||||||||
| Simon Property Group, | ||||||||||||
| Sr. Unscd. Notes | 5.00 | 3/1/12 | 836,000 | 660,972 | ||||||||
| Simon Property Group, | ||||||||||||
| Sr. Unscd. Notes | 5.75 | 5/1/12 | 776,000 | 620,769 | ||||||||
| SLM, | ||||||||||||
| Sr. Unscd. Notes, Ser. A | 4.00 | 1/15/09 | 2,745,000 | 2,732,483 | ||||||||
| Willis North America, | ||||||||||||
| Gtd. Notes | 6.20 | 3/28/17 | 440,000 | 305,269 | ||||||||
| 41,709,732 | ||||||||||||
| Foreign/Governmental—.1% | ||||||||||||
| Brazilian Government, | ||||||||||||
| Unsub. Bonds | BRL | 12.50 | 1/5/16 | 1,000,000 | 451,329 | |||||||
20
| Coupon | Maturity | Principal | ||||||||
| Bonds and Notes (continued) | Rate (%) | Date | Amount ($)f | Value ($) | ||||||
| Health Care—.6% | ||||||||||
| Community Health Systems, | ||||||||||
| Gtd. Notes | 8.88 | 7/15/15 | 585,000 | 541,125 | ||||||
| Coventry Health Care, | ||||||||||
| Sr. Unscd. Notes | 5.88 | 1/15/12 | 450,000 | 330,660 | ||||||
| Coventry Health Care, | ||||||||||
| Sr. Unscd. Notes | 5.95 | 3/15/17 | 695,000 | 362,823 | ||||||
| Wellpoint, | ||||||||||
| Sr. Unscd. Notes | 5.88 | 6/15/17 | 715,000 | 651,796 | ||||||
| 1,886,404 | ||||||||||
| Industrials—5.8% | ||||||||||
| Atlas Copco, | ||||||||||
| Sr. Unscd. Bonds | 5.60 | 5/22/17 | 535,000 | a | 503,402 | |||||
| Ball, | ||||||||||
| Gtd. Notes | 6.88 | 12/15/12 | 305,000 | 303,475 | ||||||
| British Sky Broadcasting, | ||||||||||
| Gtd. Notes | 6.88 | 2/23/09 | 133,000 | c | 133,614 | |||||
| British Sky Broadcasting, | ||||||||||
| Sr. Notes | 8.20 | 7/15/09 | 975,000 | c | 991,257 | |||||
| BSKYB Finance UK, | ||||||||||
| Gtd. Notes | 6.50 | 10/15/35 | 1,250,000 | a | 920,549 | |||||
| Crown Americas, | ||||||||||
| Gtd. Notes | 7.63 | 11/15/13 | 720,000 | 716,400 | ||||||
| Healthcare Realty Trust, | ||||||||||
| Sr. Unscd. Notes | 8.13 | 5/1/11 | 575,000 | 453,945 | ||||||
| John Deere Capital, | ||||||||||
| Sr. Unscd. Notes | 2.24 | 9/1/09 | 657,000 | b,c | 640,210 | |||||
| KPN, | ||||||||||
| Sr. Unscd. Notes | 8.00 | 10/1/10 | 335,000 | c | 338,218 | |||||
| Lubrizol, | ||||||||||
| Gtd. Notes | 4.63 | 10/1/09 | 860,000 | 844,875 | ||||||
| Masco, | ||||||||||
| Sr. Unscd. Notes | 2.40 | 3/12/10 | 720,000 | b,c | 563,031 | |||||
| Mohawk Industries, | ||||||||||
| Sr. Unscd. Notes | 5.75 | 1/15/11 | 970,000 | 890,600 | ||||||
| Pearson Dollar Finance Two, | ||||||||||
| Gtd. Notes | 6.25 | 5/6/18 | 1,240,000 | a | 1,046,582 | |||||
The Fund 21
| STATEMENT OF INVESTMENTS (continued) |
| Coupon | Maturity | Principal | ||||||||
| Bonds and Notes (continued) | Rate (%) | Date | Amount ($)f | Value ($) | ||||||
| Industrials (continued) | ||||||||||
| Philip Morris International, | ||||||||||
| Sr. Unscd Notes | 5.65 | 5/16/18 | 1,615,000 | 1,603,881 | ||||||
| Prologis, | ||||||||||
| Sr. Unscd. Notes | 6.63 | 5/15/18 | 1,230,000 | 589,138 | ||||||
| Reed Elsevier Capital, | ||||||||||
| Gtd. Notes | 4.63 | 6/15/12 | 1,970,000 | 1,734,565 | ||||||
| Republic Service, | ||||||||||
| Sr. Unscd. Notes | 7.13 | 5/15/09 | 20,000 | 20,244 | ||||||
| Republic Services, | ||||||||||
| Sr. Unscd. Notes | 6.75 | 8/15/11 | 190,000 | c | 186,468 | |||||
| Telecom Italia Capital, | ||||||||||
| Gtd. Notes | 5.25 | 11/15/13 | 1,130,000 | 862,494 | ||||||
| Telecom Italia Capital, | ||||||||||
| Gtd. Notes | 7.72 | 6/4/38 | 880,000 | 724,525 | ||||||
| Telefonica Emisiones, | ||||||||||
| Gtd. Notes | 1.83 | 6/19/09 | 700,000 | b | 677,753 | |||||
| Union Pacific, | ||||||||||
| Sr. Unscd. Notes | 3.88 | 2/15/09 | 1,295,000 | c | 1,297,422 | |||||
| USA Waste Services, | ||||||||||
| Sr. Unscd. Notes | 7.00 | 7/15/28 | 596,000 | 495,557 | ||||||
| Waste Management, | ||||||||||
| Sr. Unscd. Notes | 7.38 | 8/1/10 | 260,000 | 263,578 | ||||||
| WEA Finance, | ||||||||||
| Sr. Notes | 7.13 | 4/15/18 | 1,225,000 | a | 870,322 | |||||
| Xerox, | ||||||||||
| Sr. Unscd. Notes | 5.50 | 5/15/12 | 235,000 | 197,085 | ||||||
| Xerox, | ||||||||||
| Sr. Unscd. Notes | 5.65 | 5/15/13 | 335,000 | 263,176 | ||||||
| 18,132,366 | ||||||||||
| Municipals—2.7% | ||||||||||
| Clark County, | ||||||||||
| GO (Bond Bank) | ||||||||||
| (Insured; MBIA, Inc.) | 5.25 | 6/1/20 | 310,000 | h | 347,637 | |||||
| Clark County School District, | ||||||||||
| Limited Tax GO (Insured; FSA) | 5.50 | 6/15/17 | 330,000 | h | 365,026 | |||||
| Clark County School District, | ||||||||||
| Limited Tax GO (Insured; FSA) | 5.50 | 6/15/18 | 220,000 | h | 243,351 | |||||
22
| Coupon | Maturity | Principal | ||||||||
| Bonds and Notes (continued) | Rate (%) | Date | Amount ($)f | Value ($) | ||||||
| Municipals (continued) | ||||||||||
| Cypress-Fairbanks Independent | ||||||||||
| School District, GO, Ser. A | ||||||||||
| (Schoolhouse) (Insured; PSF-GTD) | 5.25 | 2/15/22 | 280,000 | h | 292,667 | |||||
| Delaware Housing Authority, | ||||||||||
| Senior SFMR | 5.80 | 7/1/16 | 895,000 | 920,266 | ||||||
| Erie Tobacco Asset Securitization | ||||||||||
| Corporation, Tobacco | ||||||||||
| Settlement Asset-Backed Bonds | 6.00 | 6/1/28 | 925,000 | 649,766 | ||||||
| Michigan Tobacco Settlement | ||||||||||
| Finance Authority, Tobacco | ||||||||||
| Settlement Asset-Backed Bonds | 7.31 | 6/1/34 | 4,605,000 | 2,677,854 | ||||||
| Tobacco Settlement Authority of | ||||||||||
| Iowa, Tobacco Settlement | ||||||||||
| Asset-Backed Bonds | 6.50 | 6/1/23 | 3,073,000 | 2,223,899 | ||||||
| Williamson County, | ||||||||||
| Combination Tax and Revenue | ||||||||||
| Certificates of Obligation | ||||||||||
| (Insured; FSA) | 6.00 | 8/15/14 | 220,000 | h | 236,658 | |||||
| Wisconsin, | ||||||||||
| GO (Insured; MBIA, Inc.) | 5.00 | 5/1/15 | 380,000 | h | 426,269 | |||||
| 8,383,393 | ||||||||||
| Services—.8% | ||||||||||
| CVS Caremark, | ||||||||||
| Sr. Unscd. Notes | 5.75 | 8/15/11 | 400,000 | 401,623 | ||||||
| Donnelley (R.R.) and Sons, | ||||||||||
| Sr. Unscd. Notes | 5.63 | 1/15/12 | 1,280,000 | c | 1,139,119 | |||||
| Lowe’s Companies, | ||||||||||
| Sr. Unscd. Notes | 5.60 | 9/15/12 | 340,000 | 345,399 | ||||||
| Norfolk Southern, | ||||||||||
| Sr. Unscd. Notes | 6.75 | 2/15/11 | 312,000 | 315,776 | ||||||
| Ryder System, | ||||||||||
| Sr. Unscd. Notes | 3.50 | 3/15/09 | 145,000 | c | 144,024 | |||||
| 2,345,941 | ||||||||||
| Telecommunication Services—.2% | ||||||||||
| Verizon Communications, | ||||||||||
| Sr. Unscd. Notes | 8.95 | 3/1/39 | 500,000 | 647,840 | ||||||
The Fund 23
| STATEMENT OF INVESTMENTS (continued) |
| Principal | ||||
| Bonds and Notes (continued) | Amount ($)f | Value ($) | ||
| U.S. Government Agencies/ | ||||
| Mortgage-Backed—45.2% | ||||
| Federal Home Loan Mortgage Corp. | ||||
| 5.50% | 11,025,000 g,i | 11,313,503 | ||
| 6.00%, 1/15/29 | 9,140,000 g,i | 9,415,626 | ||
| 3.50%, 9/1/10 | 271,757 g | 269,313 | ||
| 4.00%, 10/1/09 | 305,150 g | 304,688 | ||
| 4.50%, 10/1/09—4/1/10 | 46,522 g | 46,795 | ||
| 5.00%, 12/1/35—6/1/37 | 7,148,637 g | 7,316,488 | ||
| 5.50%, 1/1/34—11/1/38 | 7,279,681 g | 7,460,424 | ||
| 6.00%, 6/1/22—11/1/37 | 413,537 g | 427,455 | ||
| 7.00%, 11/1/31 | 206,612 g | 217,194 | ||
| Federal National Mortgage Association | ||||
| 4.50% | 12,470,000 g,i | 12,532,350 | ||
| 5.00% | 14,335,000 g,i | 14,648,245 | ||
| 5.50%, 12/1/32 | 39,635,000 g,i | 40,632,058 | ||
| 6.00% | 8,080,000 g,i | 8,379,210 | ||
| 3.53%, 7/1/10 | 1,220,840 g | 1,221,121 | ||
| 4.00%, 5/1/10 | 1,046,336 g | 1,045,506 | ||
| 4.06%, 6/1/13 | 48,000 g | 47,609 | ||
| 4.50%, 11/1/14 | 13,773 g | 14,126 | ||
| 4.90%, 1/1/14 | 402,401 g | 410,969 | ||
| 5.00%, 10/1/11—1/1/36 | 3,608,004 g | 3,690,827 | ||
| 5.14%, 1/1/16 | 69,199 g | 71,290 | ||
| 5.50%, 11/1/24—6/1/38 | 13,559,539 g | 13,927,179 | ||
| 6.00%, 7/1/17—1/1/38 | 6,373,752 g | 6,569,901 | ||
| 6.50%, 12/1/15—11/1/37 | 173,898 g | 180,844 | ||
| 7.00%, 11/1/31—6/1/32 | 36,175 g | 38,290 | ||
| 7.50%, 2/1/29—11/1/29 | 8,084 g | 8,585 | ||
| 8.50%, 6/1/12 | 3,666 g | 3,911 | ||
| Government National Mortgage Association I | ||||
| 6.00%, 1/15/32 | 2,758 | 2,856 | ||
| 6.50%, 7/15/32 | 4,471 | 4,700 | ||
| 8.00%, 8/15/25—11/15/26 | 28,750 | 30,604 | ||
| 9.00%, 2/15/21 | 13,813 | 14,792 | ||
| 140,246,459 | ||||
| U.S. Government Securities—8.1% | ||||
| U.S. Treasury Bonds | ||||
| 5.00%, 5/15/37 | 2,975,000 | 4,311,427 | ||
| U.S. Treasury Notes | ||||
| 3.50%, 5/31/13 | 2,328,000 | 2,550,617 | ||
| 4.75%, 8/15/17 | 5,460,000 | 6,529,821 | ||
| 4.88%, 4/30/11 | 10,780,000 c | 11,821,790 | ||
| 25,213,655 |
24
| Coupon | Maturity | Principal | ||||||||
| Bonds and Notes (continued) | Rate (%) | Date | Amount ($)f | Value ($) | ||||||
| Utilities—6.4% | ||||||||||
| AES, | ||||||||||
| Sr. Unscd. Notes | 7.75 | 10/15/15 | 1,150,000 | 971,750 | ||||||
| Cleveland Electric Illumination, | ||||||||||
| Sr. Unscd. Notes | 5.70 | 4/1/17 | 1,390,000 | 1,128,695 | ||||||
| Consolidated Edison of NY, | ||||||||||
| Sr. Unscd. Debs., Ser. 06-D | 5.30 | 12/1/16 | 1,060,000 | 1,038,202 | ||||||
| Consolidated Edison of NY, | ||||||||||
| Sr. Unscd. Debs., Ser. 08-A | 5.85 | 4/1/18 | 720,000 | 726,313 | ||||||
| Consumers Energy, | ||||||||||
| First Mortgage Bonds, Ser. O | 5.00 | 2/15/12 | 70,000 | 68,478 | ||||||
| Consumers Energy, | ||||||||||
| First Mortgage Bonds, Ser. B | 5.38 | 4/15/13 | 1,065,000 | 1,049,082 | ||||||
| Enel Finance International, | ||||||||||
| Gtd. Notes | 5.70 | 1/15/13 | 550,000 | a | 506,784 | |||||
| Enel Finance International, | ||||||||||
| Gtd. Bonds | 6.25 | 9/15/17 | 1,825,000 | a | 1,543,589 | |||||
| Energy Future Holdings, | ||||||||||
| Gtd. Notes | 10.88 | 11/1/17 | 2,400,000 | a | 1,716,000 | |||||
| FirstEnergy, | ||||||||||
| Sr. Unscd. Notes, Ser. B | 6.45 | 11/15/11 | 1,090,000 | 1,030,984 | ||||||
| FPL Group Capital, | ||||||||||
| Gtd. Debs | 5.63 | 9/1/11 | 2,120,000 | c | 2,151,225 | |||||
| National Grid, | ||||||||||
| Unsub. Notes | 6.30 | 8/1/16 | 1,595,000 | 1,391,815 | ||||||
| Nevada Power, | ||||||||||
| Mortgage Notes | 6.50 | 8/1/18 | 775,000 | 749,516 | ||||||
| Nevada Power, | ||||||||||
| Mortgage Notes, Ser. R | 6.75 | 7/1/37 | 745,000 | 668,493 | ||||||
| NiSource Finance, | ||||||||||
| Gtd. Notes | 2.72 | 11/23/09 | 775,000 | b,c | 698,462 | |||||
| NiSource Finance, | ||||||||||
| Gtd. Notes | 5.25 | 9/15/17 | 760,000 | 461,401 | ||||||
| Pacific Gas & Electric, | ||||||||||
| Sr. Unscd. Bonds | 3.60 | 3/1/09 | 525,000 | c | 523,564 | |||||
| Pacific Gas & Electric, | ||||||||||
| Sr. Unscd. Notes | 6.35 | 2/15/38 | 760,000 | 834,111 | ||||||
| Pepco Holdings, | ||||||||||
| Sr. Unscd. Notes | 2.83 | 6/1/10 | 25,000 | b | 24,772 | |||||
| Sierra Pacific Power, | ||||||||||
| Mortgage Notes, Ser. P | 6.75 | 7/1/37 | 370,000 | 332,003 | ||||||
The Fund 25
| STATEMENT OF INVESTMENTS (continued) |
| Coupon | Maturity | Principal | ||||||||
| Bonds and Notes (continued) | Rate (%) | Date | Amount ($)f | Value ($) | ||||||
| Utilities (continued) | ||||||||||
| Southern Co., | ||||||||||
| Sr. Unscd. Notes, Ser. A | 5.30 | 1/15/12 | 825,000 | c | 833,653 | |||||
| Veolia Environnement, | ||||||||||
| Sr. Unscd. Notes | 5.25 | 6/3/13 | 1,220,000 | 1,132,487 | ||||||
| Windsor Financing, | ||||||||||
| Sr. Scd. Notes | 5.88 | 7/15/17 | 214,938 | a | 227,157 | |||||
| 19,808,536 | ||||||||||
| Yankee—.3% | ||||||||||
| Rio Tinto Finance, | ||||||||||
| Gtd. Notes | 5.88 | 7/15/13 | 945,000 | 753,410 | ||||||
| Shinsei Finance II, | ||||||||||
| Unscd. Bonds | 7.16 | 7/1/49 | 420,000 | a,b | 87,675 | |||||
| 841,085 | ||||||||||
| Total Bonds and Notes | ||||||||||
| (cost $422,469,242) | 384,292,730 | |||||||||
| Face Amount | ||||||||||
| Covered by | ||||||||||
| Options—.0% | Contracts ($) | Value ($) | ||||||||
| Call Options | ||||||||||
| 3-Month Floor USD Libor-BBA | ||||||||||
| Interest Rate, January 2009 @ 2.5 | ||||||||||
| (cost $66,912) | 26,250,000 j | 0 | ||||||||
| Principal | ||||||||||
| Short-Term Investments—2.1% | Amount ($) | Value ($) | ||||||||
| U.S. Government Agency—1.7% | ||||||||||
| Federal Home Loan Mortgage Corp, | ||||||||||
| 0.50%, 1/13/09 | 5,000,000 g | 5,000,040 | ||||||||
| U.S. Treasury Bills—.4% | ||||||||||
| 0.44%, 1/2/09 | 1,380,000 c | 1,380,000 | ||||||||
| Total Short-Term Investments | ||||||||||
| (cost $6,379,150) | 6,380,040 | |||||||||
| Other Investment—5.4% | Shares | Value ($) | ||||||||
| Registered Investment Company; | ||||||||||
| Dreyfus Institutional Preferred | ||||||||||
| Plus Money Market Fund | ||||||||||
| (cost $16,906,203) | 16,906,203 k | 16,906,203 | ||||||||
26
| Investment of Cash Collateral | ||||
| for Securities Loaned—.7% | Shares | Value ($) | ||
| BlackRock Cash Strategies L.L.C | 1,983,334 d,l | 1,983,334 | ||
| Registered Investment Company; | ||||
| Dreyfus Institutional Cash Advantage Fund | 240,666 k,l | 240,666 | ||
| Total Investment of Cash Collateral | ||||
| for Securities Loaned | ||||
| (cost $2,224,000) | 2,224,000 | |||
| Total Investments (cost $448,045,507) | 131.9% | 409,802,973 | ||
| Liabilities, Less Cash and Receivables | (31.9%) | (99,061,326) | ||
| Net Assets | 100.0% | 310,741,647 | ||
| FSA—Financial Security Assurance GO—General Obligation LIBOR-BBA—London Interbank Offered Rate British Bankers’ Association MBIA—Municipal Bond Investors Assurance Insurance Corporation PSF-GTD—Permanent School Fund Guaranteed SFMR—Single Family Mortgage Revenue |
| a | Securities exempt from registration under Rule 144A of the Securities Act of 1933.These securities may be resold in transactions exempt from registration, normally to qualified institutional buyers. At December 31, 2008, these securities amounted to $36,467,277 or 11.7% of net assets. |
| b | Variable rate security—interest rate subject to periodic change. |
| c | Denotes all or part of security segregated as collateral for delayed securities, futures and swap contracts. |
| d | Illiquid security. At the period end, the value of these securities amounted to $1,983,334 or 0.6% of net assets.The valuation of this security has been determined in good faith under the Board of Trustees. |
| e | All or a portion of these securities are on loan. At December 31, 2008, the total market value of the fund’s securities on loan is $2,121,710 and the total market value of the collateral held by the fund is $2,224,000. |
| f | Principal amount stated in U.S. Dollars unless otherwise noted. BRL—Brazilian Real EUR—Euro. |
| g | On September 7, 2008, the Federal Housing Finance Agency (FHFA) placed Federal National Mortgage Association and Federal Home Loan Mortgage Corporation into conservatorship with FHFA as the conservator. As such, the FHFA will oversee the continuing affairs of these companies. |
| h | These securities are prerefunded; the date shown represents the prerefunded date. Bonds which are prerefunded are collateralized by U.S. Government securities which are held in escrow and are used to pay principal and interest on the municipal issue and to retire the bonds in full at the earliest refunding date. |
| i | Purchased on a forward commitment basis. |
| j | Non-income producing security. |
| k | Investment in affiliated money market mutual fund. |
| l | Investment of security lending cash collateral. |
| Portfolio Summary (Unaudited)† | ||||||
| Value (%) | Value (%) | |||||
| U.S. Government & Agencies | 53.3 | Municipals | 2.7 | |||
| Corporate Bonds | 52.1 | Foreign/Governmental | .1 | |||
| Asset/Mortgage-Backed | 15.5 | Options | .0 | |||
| Short-Term/Money Market Investments | 8.2 | 131.9 | ||||
| † Based on net assets. | ||||||
| See notes to financial statements. | ||||||
The Fund 27
STATEMENT OF FINANCIAL FUTURES
December 31, 2008
| Unrealized | ||||||||
| Market Value | Appreciation | |||||||
| Covered by | (Depreciation) | |||||||
| Contracts | Contracts ($) | Expiration | at 12/31/2008 ($) | |||||
| Financial Futures Long | ||||||||
| 10 Year Long Gilt | 53 | 9,408,523 | March 2009 | 559,974 | ||||
| U.S. Long Bonds | 172 | 23,744,063 | March 2009 | 2,218,542 | ||||
| U.S. Treasury 5 Year Notes | 80 | 9,524,375 | March 2009 | 157,536 | ||||
| U.S. Treasury 10 Year Notes | 43 | 5,407,250 | March 2009 | 114,141 | ||||
| Financial Futures Short | ||||||||
| U.S. Treasury 2 Year Notes | 180 | (39,251,250) | March 2009 | (347,020) | ||||
| 2,703,173 | ||||||||
| See notes to financial statements. | ||||||||
STATEMENT OF OPTIONS WRITTEN
December 31, 2008
| Face Amount | ||||||
| Covered by | ||||||
| Contracts | Contracts ($) | Value ($) | ||||
| Call Options: | ||||||
| U.S. Treasury 5 Year Notes, | ||||||
| January 2009 @ 118.5 | 54 | 54,000 | (65,812) | |||
| U.S. Treasury 10 Year Notes, | ||||||
| January 2009 @ 127.5 | 28 | 28,000 | (24,938) | |||
| Put Options: | ||||||
| U.S. Treasury 5 Year Notes, | ||||||
| January 2009 @ 118.5 | 54 | 54,000 | (35,859) | |||
| U.S. Treasury 10 Year Notes, | ||||||
| January 2009 @ 127.5 | 28 | 28,000 | (73,938) | |||
| (Premiums received $237,699) | (200,547) |
| See notes to financial statements. |
28
STATEMENT OF ASSETS AND LIABILITIES
December 31, 2008
| Cost | Value | |||
| Assets ($): | ||||
| Investments in securities—See Statement of Investments (including | ||||
| securities on loan, valued at $2,121,710)—Note 1(c): | ||||
| Unaffiliated issuers | 430,898,638 | 392,656,104 | ||
| Affiliated issuers | 17,146,869 | 17,146,869 | ||
| Cash | 3,087,128 | |||
| Cash denominated in foreign currencies | 9 | 9 | ||
| Receivable for investment securities sold | 17,568,232 | |||
| Dividends and interest receivable | 3,130,501 | |||
| Unrealized appreciation on forward currency exchange contracts—Note 4 | 461,812 | |||
| Unrealized appreciation on swap contracts—Note 4 | 241,234 | |||
| Prepaid expenses | 1,291 | |||
| 434,293,180 | ||||
| Liabilities ($): | ||||
| Due to The Dreyfus Corporation and affiliates—Note 3(c) | 155,569 | |||
| Due to Administrator—Note 3(a) | 6,168 | |||
| Payable for investment securities purchased | 113,473,696 | |||
| Dividend payable | 4,500,000 | |||
| Liability for securities on loan—Note 1(c) | 2,224,000 | |||
| Payable for shares of Capital Stock redeemed | 1,230,246 | |||
| Other liabilities | 652,015 | |||
| Payable for futures variation margin—Note 4 | 639,598 | |||
| Unrealized depreciation on forward currency exchange contracts—Note 4 | 368,271 | |||
| Outstanding options written, at value (premiums received $237,699) | 200,547 | |||
| Accrued expenses | 101,423 | |||
| 123,551,533 | ||||
| Net Assets ($) | 310,741,647 | |||
| Composition of Net Assets ($): | ||||
| Paid-in capital | 398,099,136 | |||
| Accumulated undistributed investment income—net | 1,061,417 | |||
| Accumulated net realized gain (loss) on investments | (53,246,276) | |||
| Accumulated net unrealized appreciation (depreciation) on investments, | ||||
| options transactions, swap transactions and foreign currency transactions | ||||
| (including $2,703,173 net unrealized appreciation on financial futures) | (35,172,630) | |||
| Net Assets ($) | 310,741,647 | |||
| Shares Outstanding | ||||
| (unlimited number of $.001 par value shares of Beneficial Interest authorized) | 17,733,737 | |||
| Net Asset Value, offering and redemption price per share ($) | 17.52 | |||
| See notes to financial statements. | ||||
The Fund 29
| STATEMENT OF OPERATIONS | ||
| Year Ended December 31, 2008 | ||
| Investment Income ($): | ||
| Income: | ||
| Interest | 23,731,942 | |
| Dividends: | ||
| Unaffiliated issuers | 4,293 | |
| Affiliated issuers | 218,008 | |
| Income from securities lending | 287,750 | |
| Total Income | 24,241,993 | |
| Expenses: | ||
| Advisory fee—Note 3(a) | 1,746,896 | |
| Administration fee—Note 3(a) | 107,484 | |
| Custodian fees—Note 3(c) | 193,703 | |
| Professional fees | 160,658 | |
| Directors’ fees and expenses—Note 3(d) | 64,046 | |
| Shareholder servicing costs—Note 3(c) | 33,517 | |
| Administrative service fees— Note 3(b) | 14,917 | |
| Loan commitment fees—Note 2 | 6,945 | |
| Registration fees | 1,926 | |
| Miscellaneous | 88,411 | |
| Total Expenses | 2,418,503 | |
| Less—reduction in advisory fee | ||
| due to undertaking—Note 3(a) | (81,289) | |
| Less—reduction in fees due to earnings credits—Note 1(c) | (192) | |
| Net Expenses | 2,337,022 | |
| Investment Income—Net | 21,904,971 | |
| Realized and Unrealized Gain (Loss) on Investments—Note 4 ($): | ||
| Net realized gain (loss) on investments | (12,081,968) | |
| Net realized gain (loss) on options written transactions | (246,683) | |
| Net realized gain (loss) on financial futures | 480,175 | |
| Net realized gain (loss) on swap transactions | 762,264 | |
| Net realized gain (loss) on forward currency exchange contracts | (215,806) | |
| Net Realized Gain (Loss) | (11,302,018) | |
| Net unrealized appreciation (depreciation) on investments, options | ||
| transactions, swap transactions and foreign currency transactions | ||
| (including $2,398,116 net unrealized appreciation on financial futures) | (29,080,065) | |
| Net Realized and Unrealized Gain (Loss) on Investments | (40,382,083) | |
| Net (Decrease) in Net Assets Resulting from Operations | (18,477,112) | |
| See notes to financial statements. | ||
30
STATEMENT OF CHANGES IN NET ASSETS
| Year Ended December 31, | ||||
| 2008 | 2007 | |||
| Operations ($): | ||||
| Investment income—net | 21,904,971 | 28,004,037 | ||
| Net realized gain (loss) on investments | (11,302,018) | (3,472,829) | ||
| Net unrealized appreciation | ||||
| (depreciation) on investments | (29,080,065) | (4,425,132) | ||
| Net Increase (Decrease) in Net Assets | ||||
| Resulting from Operations | (18,477,112) | 20,106,076 | ||
| Dividends to Shareholders from ($): | ||||
| Investment income—net | (19,851,849) | (28,878,320) | ||
| Beneficial Interest Transactions ($): | ||||
| Net proceeds from shares sold | 23,413,889 | 125,494,967 | ||
| Dividends reinvested | 13,684,047 | 19,716,752 | ||
| Cost of shares redeemed | (253,599,379)a | (130,439,783) | ||
| Increase (Decrease) in Net Assets from | ||||
| Beneficial Interest Transactions | (216,501,443) | 14,771,936 | ||
| Total Increase (Decrease) in Net Assets | (254,830,404) | 5,999,692 | ||
| Net Assets ($): | ||||
| Beginning of Period | 565,572,051 | 559,572,359 | ||
| End of Period | 310,741,647 | 565,572,051 | ||
| Undistributed (Distributions in excess) | ||||
| investment income—net | 1,061,417 | (655,864) | ||
| Capital Share Transactions (shares): | ||||
| Shares sold | 1,228,451 | 6,411,187 | ||
| Shares issued for dividends reinvested | 735,348 | 1,016,283 | ||
| Shares redeemed | (13,516,112) | (6,670,212) | ||
| Net Increase (Decrease) in Shares Outstanding | (11,552,313) | 757,258 | ||
| a Includes redemption-in-kind amounting to $26,531,547. | ||||
| See notes to financial statements. | ||||
The Fund 31
FINANCIAL HIGHLIGHTS
The following table describes the performance for the fiscal periods indicated. Total return shows how much your investment in the fund would have increased (or decreased) during each period, assuming you had reinvested all dividends and distributions.These figures have been derived from the fund’s financial statements.
| Year Ended December 31, | ||||||||||
| 2008 | 2007 | 2006 | 2005 | 2004 | ||||||
| Per Share Data ($): | ||||||||||
| Net asset value, beginning of period | 19.31 | 19.61 | 19.66 | 20.08 | 20.08 | |||||
| Investment Operations: | ||||||||||
| Investment income—neta | .88 | .96 | .93 | .82 | .77 | |||||
| Net realized and unrealized | ||||||||||
| gain (loss) on investments | (1.81) | (.26) | (.10) | (.23) | .36 | |||||
| Total from Investment Operations | (.93) | .70 | .83 | .59 | 1.13 | |||||
| Distributions: | ||||||||||
| Dividends from investment income—net | (.86) | (1.00) | (.88) | (1.01) | (1.13) | |||||
| Net asset value, end of period | 17.52 | 19.31 | 19.61 | 19.66 | 20.08 | |||||
| Total Return (%) | (5.00) | 3.64 | 4.38 | 2.96 | 5.74 | |||||
| Ratios/Supplemental Data (%): | ||||||||||
| Ratio of total expenses | ||||||||||
| to average net assets | .52 | .51b | .50b | .49b | .48b | |||||
| Ratio of net expenses | ||||||||||
| to average net assets | .50 | .50 | .50 | .49 | .48 | |||||
| Ratio of net investment income | ||||||||||
| to average net assets | 4.72 | 4.93 | 4.75 | 4.09 | 3.77 | |||||
| Portfolio Turnover Ratec,d | 443 | 430 | 382 | 380 | 301 | |||||
| Net Assets, end of period ($ x 1,000) | 310,742 | 565,572 | 559,572 | 455,891 | 463,307 | |||||
| a | Based on average shares outstanding at each month end. |
| b | Includes the fund’s share of the The Standish Mellon Fixed Income Portfolio’s (the “Portfolio”) allocated expenses. |
| c | On October 25, 2007, the fund, which owned 100% of the Portfolio on such date, withdrew entirely from the Portfolio and received the Portfolio’s securties and cash in exchange for its interests in the Portfolio. Effective October 26, 2007, the fund began investing directly in the securities in which the Portfolio had invested. Portfolio turnover represents activity of both the fund and the Portfolio for the year.The amounts shown for 2004-2006 are ratios for the Portfolio. |
| d | The portfolio turnover rates excluding mortgage dollar roll transactions for the periods ended December 31, 2008, 2007, 2006, 2005 and 2004 were 72%, 166%, 139%, 106% and 98%, respectively. |
| See notes to financial statements. |
32
NOTES TO FINANCIAL STATEMENTS
NOTE 1—Significant Accounting Policies:
Dreyfus/Standish Fixed Income Fund (the “fund”) is a separate diversified series of Dreyfus Investment Funds (the “Trust”), which is registered under the Investment Company Act of 1940, as amended (the “Act”), as an open-end management investment company and operates as a series company currently offering fourteen series, including the fund.The fund’s investment objective is to achieve a high level of current income while preserving principal and maintaining liquidity. Prior to December 1, 2008, Standish Mellon Asset Management Company LLC, a wholly-owned subsidiary of The Bank of NewYork Mellon Corporation (“BNY Mellon”), served as the fund’s investment adviser. After December 1, 2008, The Dreyfus Corporation (the “Manager” or “Dreyfus”), a wholly-owned subsidiary of BNY Mellon, serves as the fund’s investment adviser. MBSC Securities Corporation (the “Distributor”), a wholly-owned subsidiary of the Manager, is the distributor of the fund’s shares, which are sold to the public without a sales charge.
At a meeting of the fund’s Board of Trustees held on August 27, 2008, the Board approved, effective December 1, 2008, a proposal to change the names of the Trust and the fund from “Mellon Institutional Funds Investment Trust” and “Standish Mellon Fixed Income Fund” to “Dreyfus Investment Funds” and “Dreyfus/Standish Fixed Income Fund,” respectively.
Effective July 1, 2008, BNY Mellon reorganized and consolidated a number of its banking and trust company subsidiaries.As a result of the reorganization, any services previously provided to the fund by Mellon Bank, N.A. or Mellon Trust of New England, N.A. are now provided by The Bank of NewYork Mellon (formerly,The Bank of NewYork).
The Trust accounts separately for the assets, liabilities and operations of each series. Expenses directly attributable to each series are charged to that series’ operations; expenses which are applicable to all series are allocated among them on a pro rata basis.
The Fund 33
| NOTES TO FINANCIAL STATEMENTS (continued) |
The fund’s financial statements are prepared in accordance with U.S. generally accepted accounting principles, which may require the use of management estimates and assumptions. Actual results could differ from those estimates.
The fund enters into contracts that contain a variety of indemnifica-tions.The fund’s maximum exposure, if any, under these arrangements is unknown.The fund does not anticipate recognizing any loss related to these arrangements.
(a) Portfolio valuation: Investments in securities excluding short-term investments, financial futures, options, swap transactions and forward currency exchange contracts are valued each business day by an independent pricing service (the “Service”) approved by the Board of Trustees. Investments for which quoted bid prices are readily available and are representative of the bid side of the market in the judgment of the Service are valued at the mean between the quoted bid prices (as obtained by the Service from dealers in such securities) and asked prices (as calculated by the Service based upon its evaluation of the market for such securities). Other investments (which constitute a majority of the portfolio securities) are valued as determined by the Service, based on methods which include consideration of: yields or prices of securities of comparable quality, coupon, maturity and type; indications as to values from dealers; and general market conditions. Prior to December 2, 2008, at which time the Board of Trustees amended the funds’ valuation policies for securities not listed on an exchange or securities for which there were no reported transactions, were valued at the last quoted bid price. Fixed income securities, for which market were readily available, were valued at their current market value on the basis of quotations which were provided by a pricing service or dealers in such securities. This change had no material impact on the financial statements.
Restricted securities, as well as securities or other assets for which recent market quotations are not readily available, that are not valued by a pricing service approved by the Board of Trustees, or are determined by the fund not to reflect accurately fair value, are valued at fair value as determined in good faith under the direction of the Board of Trustees. The factors that may be considered when fair valuing a security include
34
fundamental analytical data, the nature and duration of restrictions on disposition, an evaluation of the forces that influence the market in which the securities are purchased and sold and public trading in similar securities of the issuer or comparable issuers. Short-term investments, are carried at amortized cost, which approximates value. Registered investment companies that are not traded on an exchange are valued at their net asset value. Financial futures and options that are traded on an exchange are valued at the last sales price on the exchange on which such contracts are primarily traded or at the last sales price on the national securities market on each business day. Options traded over-the-counter are priced at the mean between the bid and the asked price. Investments in swap transactions are valued each business day by an independent pricing service approved by the Board of Trustees. Swaps are valued by the service by using a swap pricing model which incorporates among other factors, default probabilities, recovery rates, credit curves of the underlying issuer and swap spreads on interest rates. Investments denominated in foreign currencies are translated to U.S. dollars at the prevailing rates of exchange on the valuation date. Forward currency exchange contracts are valued at the forward rate.
Effective January 1, 2008, the fund adopted Statement of Financial Accounting Standards No. 157 “FairValue Measurements” (“FAS 157”). FAS 157 establishes an authoritative definition of fair value, sets out a framework for measuring fair value, and requires additional disclosures about fair value measurements.
Various inputs are used in determining the value of the fund’s investments relating to FAS 157. These inputs are summarized in the three broad levels listed below.
| Level 1—quoted prices in active markets for identical securities. Level 2—other significant observable inputs (including quoted prices for similar securities, interest rates, prepayment speeds, credit risk, etc.). Level 3—significant unobservable inputs (including the fund’s own assumptions in determining the fair value of investments). |
The Fund 35
| NOTES TO FINANCIAL STATEMENTS (continued) |
The inputs or methodology used for valuing securities are not necessarily an indication of the risk associated with investing in those securities.
The following is a summary of the inputs used as of December 31, 2008 in valuing the fund’s investments:
| Level 2—Other | Level 3— | |||||||
| Level 1— | Significant | Significant | ||||||
| Quoted | Observable Unobservable | |||||||
| Prices | Inputs | Inputs | Total | |||||
| Assets ($) | ||||||||
| Investment in | ||||||||
| Securities | 17,146,869 | 390,146,045 | 2,510,059 | 409,802,973 | ||||
| Other Financial | ||||||||
| Instruments† | 3,050,193 | 703,046 | — | 3,753,239 | ||||
| Liabilities ($) | ||||||||
| Other Financial | ||||||||
| Instruments† | (547,567) | (368,271) | — | (915,838) | ||||
| † Other financial instruments include derivative instruments, such as futures, forward currency exchange contracts and swap contracts, which are valued at the unrealized appreciation (depreciation) on the instrument. |
The following is a reconciliation of the change in value of Level 3 assets (for which significant unobservable inputs were used to determine fair value):
| Investments in | ||
| Securities ($) | ||
| Balance as of 12/31/2007 | 22,489,858 | |
| Realized gain (loss) | — | |
| Change in unrealized appreciation (depreciation) | — | |
| Net Purchases (Sales) | (20,506,524) | |
| Transfers in and/or out of Level 3 | 526,725 | |
| Balance as of 12/31/2008 | 2,510,059 |
(b) Foreign currency transactions: The fund does not isolate that portion of the results of operations resulting from changes in foreign exchange rates on investments from the fluctuations arising from changes in market prices of securities held. Such fluctuations are included with the net realized and unrealized gain or loss on investments.
36
Net realized foreign exchange gains or losses arise from sales of foreign currencies, currency gains or losses realized on securities transactions and the difference between the amounts of dividends, interest, and foreign withholding taxes recorded on the fund’s books and the U.S. dollar equivalent of the amounts actually received or paid. Net unrealized foreign exchange gains and losses arise from changes in the value of assets and liabilities other than investments, resulting from changes in exchange rates. Foreign currency gains and losses on investments are included with net realized and unrealized gain or loss on investments.
(c) Securities transactions and investment income: Securities transactions are recorded on a trade date basis. Realized gains and losses from securities transactions are recorded on the identified cost basis. Dividend income is recognized on the ex-dividend date and interest income, including, where applicable, accretion of discount and amortization of premium on investments, is recognized on the accrual basis.
The fund has arrangements with the custodian and cash management bank whereby the fund may receive earnings credits when positive cash balances are maintained, which are used to offset custody and cash management fees. For financial reporting purposes, the fund includes net earnings credits as an expense offset in the Statement of Operations.
Investing in foreign markets may involve special risks and considerations not typically associated with investing in the U.S. These risks include revaluation of currencies, high rates of inflation, repatriation restrictions on income and capital,and adverse political and economic developments. Moreover, securities issued in these markets may be less liquid, subject to government ownership controls, delayed settlements, and their prices may be more volatile than those of comparable securities in the U.S.
Pursuant to a securities lending agreement with The Bank of New York Mellon, a subsidiary of BNY Mellon and an affiliate of Dreyfus, the fund may lend securities to qualified institutions. It is the fund’s
The Fund 37
| NOTES TO FINANCIAL STATEMENTS (continued) |
policy, that at origination, all loans are secured by collateral of at least 102% of the value of U.S. securities loaned and 105% of the value of foreign securities loaned and that collateral equivalent to at least 100% of the market value of securities on loan is maintained at all times. Collateral is either in the form of cash, which can be invested in certain money market mutual funds managed by the Manager, U.S. Government and Agency securities or letters of credit. The fund is entitled to receive all income on securities loaned, in addition to income earned as a result of the lending transaction. Although each security loaned is fully collateralized, the fund bears the risk of delay in recovery of, or loss of rights in, the securities loaned should a borrower fail to return the securities in a timely manner. During the period ended December 31, 2008, The Bank of New York Mellon earned $154,942 from lending fund portfolio securities, pursuant to the securities lending agreement.
Until December 10, 2007, all cash collateral received by the fund and other series of the Trust in connection with the securities lending program was invested in the BlackRock Cash Strategies Fund LLC (the “BlackRock Fund”), a private investment fund not affiliated with the Trust or its investment adviser. On December 10, 2007, the BlackRock Fund announced that it was suspending investor withdrawal privileges due to conditions related to the credit markets and the adverse affect of such conditions on the liquidity of the BlackRock Fund’s portfolio holdings. Commencing on December 11, 2007, all new cash collateral received in connection with the securities lending activity of the fund and other series of the Trust was invested by the securities lending agent in the Dreyfus Institutional Cash Advantage Fund (the “Dreyfus Fund”), an affiliated money market fund registered as an investment company under the Investment Company Act of 1940, as amended.To the extent that the BlackRock Fund agreed to permit withdrawals during the period December 11, 2007 through December 31, 2008, the securities lending agent effected such withdrawals and the cash proceeds from such withdrawals by the fund were reinvested in the shares of the Dreyfus Fund. As of January 22, 2009, the final withdrawal was
38
reinvested in the Dreyfus Fund. Repayments of cash collateral during the period were made from the proceeds of redemptions of shares of the Dreyfus Fund. See Statement of Investments for further detail on the fund’s investment of cash collateral in the BlackRock Fund and the Dreyfus Fund as of December 31, 2008.
(d) Affiliated issuers: Investments in other investment companies advised by the Manager are defined as “affiliated” in the Act.
(e) Concentration of Risk: The fund invests primarily in debt securities. Failure of an issuer of the debt securities to make timely interest or principal payments, or a decline or the perception of a decline in the credit quality of a debt security, can cause the debt security’s price to fall, potentially lowering the fund’s share price. In addition, the value of debt securities may decline due to general market conditions that are not specifically related to a particular company, such as real or perceived adverse economic conditions, changes in outlook for corporate earnings, changes in interest or currency rates or adverse investor sentiment. They may also decline because of factors that affect a particular industry. The fund holds investments in the financial sector as well as in mortgage related or other asset backed securities. At December 31, 2008, the fund held investments in the financial sector of 13.4% and investments in mortgage related or other asset backed securities that are not guaranteed by the U.S. Government of 25%.
(f) Dividends to shareholders: Dividends are recorded on the ex-dividend date. Dividends from investment income-net are declared and paid quarterly. Dividends from net realized capital gains, if any, are normally declared and paid annually, but the fund may make distributions on a more frequent basis to comply with the distribution requirements of the Internal Revenue Code of 1986, as amended (the “Code”).To the extent that net realized capital gains can be offset by capital loss carryovers, it is the policy of the fund not to distribute such gains. Income and capital gain distributions are determined in accordance with income tax regulations, which may differ from U.S. generally accepted accounting principles.
The Fund 39
| NOTES TO FINANCIAL STATEMENTS (continued) |
On December 30, 2008, the Board of Directors declared a cash dividend of $.255 per share from undistributed investment income-net, payable on January 2, 2009 to shareholders of record as of the close of business on December 31, 2008 (ex-dividend date).
(g) Federal income taxes: It is the policy of the fund to continue to qualify as a regulated investment company, if such qualification is in the best interests of its shareholders, by complying with the applicable provisions of the Code, and to make distributions of taxable income sufficient to relieve it from substantially all federal income and excise taxes.
As of and during the period ended December 31, 2008, the fund did not have any liabilities for any uncertain tax positions.The fund recognizes interest and penalties, if any, related to uncertain tax positions as income tax expense in the Statement of Operations. During the period, the fund did not incur any interest or penalties.
Each of the tax years in the four-year period ended December 31, 2008 remains subject to examination by the Internal Revenue Service and state taxing authorities.
At December 31, 2008, the components of accumulated earnings on a tax basis were as follows: undistributed ordinary income $1,061,417, accumulated capital losses $50,840,869 and unrealized depreciation $38,467,591.
The accumulated capital loss carryover is available for federal income tax purposes to be applied against future net securities profits, if any realized subsequent to December 31, 2008. If not applied, $36,020,187 of the carryover expires in fiscal 2009, $963,957 expires in fiscal 2014, $3,009,464 expires in fiscal 2015 and $10,847,261 expires in fiscal 2016. It’s uncertain whether the fund will be able to realize the benefits of the remaining capital loss carryovers before they expire and the remaining capital loss carryovers could be subject to future limitations imposed by the internal revenue code related to share ownership activity.
The tax character of distributions paid to shareholders during the fiscal periods ended December 31, 2008 and December 31, 2007 were as follows: ordinary income $19,851,849 and $28,878,320, respectively.
40
During the period ended December 31, 2008, as a result of permanent book to tax differences, primarily due to the tax treatment for paydown gains and losses on mortgage-backed securities, foreign currency transactions and expiration of capital loss carryovers, the fund decreased accumulated undistributed investment income-net by $335,841 and increased accumulated net realized gain (loss) on investments by $119,053,975 and decreased paid-in capital by $118,718,134. Net assets and net asset value per share were not affected by this reclassification.
NOTE 2—Bank Lines of Credit:
The Trust entered into two separate agreements with The Bank of New York Mellon, an affiliate of the Manager, that enable the fund, and other funds in the Trust, to borrow, in the aggregate, (i) up to $35 million from a committed line of credit and (ii) up to $15 million from an uncommitted line of credit. Interest is charged to each participating fund based on its borrowings at a rate equal to the Federal Funds effective rate plus 1 / 2of 1%.The participating funds also pay an annual fee, computed at a rate of 0.020 of 1% of the committed and uncommitted amounts and allocated ratably to the participating funds. In addition, a facility fee, computed at an annual rate of 0.060 of 1% on the committed amount, is allocated ratably among the participating funds at the end of each quarter. During the period ended December 31, 2008, the fund did not borrow under the lines of credit. Loan commitment fees are shown in the Statement of Operations.
NOTE 3—Advisor Fee and Other Transactions With Affiliates:
(a) Pursuant to an advisory agreement (“Agreement”) with the Manager, the advisory fee is based on the value of the fund’s average daily net assets and is computed at the following annual rate: .40% of the first $250 million; .35% of the next $250 million and .30% in excess of $500 million.The Manager had undertaken from January 1, 2008 through December 31, 2008 to reduce the advisory fee paid by
The Fund 41
| NOTES TO FINANCIAL STATEMENTS (continued) |
the fund, to the extent that the fund’s aggregate annual expenses, exclusive of taxes, brokerage fees, interest on borrowings, commitment fees and extraordinary expenses, exceed an annual rate of .50% of the value of the fund’s average daily net assets.The reduction in the advisory fee, pursuant to the undertaking, amounted to $81,289 during the year ended December 31, 2008.
The Trust entered into an agreement with The Bank of New York Mellon, pursuant to which The Bank of New York Mellon provides administration and fund accounting services for the fund. For these services the fund pays The Bank of NewYork Mellon a fixed fee plus asset and transaction based fees, as well as out-of-pocket expenses. Pursuant to this agreement, the fund was charged $107,484 for the period ended December 31, 2008 for administration and fund accounting services.
The Trust has contracted BNY Mellon Shareowner Services, a wholly-owned subsidiary of The Bank of New York Mellon, to provide printing and fulfillment services for the Fund. Pursuant to this agreement, the fund was charged $24,879, which is included in miscellaneous expenses in the Statement of Operations for the period ended December 31, 2008.
(b) The fund may pay administrative service fees.These fees are paid to affiliated or unaffiliated retirement plans, omnibus accounts and platform administrators and other entities (“Plan Administrators”) that provide record keeping and/or other administrative support services to accounts, retirement plans and their participants.As compensation for such services, the fund may pay each Plan Administrator an administrative service fee in an amount of up to .15% (on an annualized basis) of the fund’s average daily net assets attributable to fund shares that are held in accounts serviced by such Plan Administrator. For the period ended December 31, 2008, the fund was charged $14,917. The fund’s adviser or its affiliates may pay additional compensation from their own resources to Plan Administrators and other entities for administrative services, as well as in consideration of marketing or other distribution-related services. These payments may provide an incentive for these entities to actively promote the fund or cooperate with the distributor’s promotional efforts.
42
(c) The fund compensates Dreyfus Transfer, Inc., a wholly-owned subsidiary of the Manager, under a transfer agency agreement for providing personnel and facilities to perform transfer agency services for the fund. During the period ended December 31, 2008 the fund was charged $33,517 pursuant to the transfer agency agreement.
The fund compensates The Bank of New York Mellon under cash management agreements for performing cash management services related to fund subscriptions and redemptions. During the period ended December 31, 2008, the fund was charged $192 pursuant to the cash management agreements.These fees were offset by earnings credits pursuant to the cash management agreements.
The fund compensates The Bank of New York Mellon under a custody agreement for providing custodial services for the fund. During the period ended December 31, 2008, the fund was charged $193,703 pursuant to the custody agreement.
During the period ended December 31, 2008, the fund was charged $5,887 for services performed by the Chief Compliance Officer. These charges appear under the Miscellaneous heading on the Statement of Operations.
The components of “Due to The Dreyfus Corporation and affiliates” in the Statement of Assets and Liabilities consist of: management fees $99,063, custodian fees $74,038, chief compliance officer fees $1,197 and transfer agency per account fees $14,828, which are offset against an expense reimbursement currently in effect in the amount of $33,557.
(d) Effective December 1, 2008, EachTrustee receives $45,000 per year, plus $6,000 for each joint Board meeting ofThe Dreyfus/Laurel Funds, Inc.,The Dreyfus /Laurel FundsTrust andThe Dreyfus/LaurelTax-Free Municipal Funds, (collectively, the “Dreyfus/Laurel Funds”) and the Trust attended, $2,000 for separate in-person committee meetings attended which are not held in conjunction with a regularly scheduled Board meeting and $1,500 for Board meetings and separate committee
The Fund 43
| NOTES TO FINANCIAL STATEMENTS (continued) |
meetings attended that are conducted by telephone and is reimbursed for travel and out-of-pocket expenses.With respect to Board meetings, the Chairman of the Board receives an additional 25% of such compensation (with the exception of reimbursable amounts).With respect to compensation committee meetings, the Chair of the compensation committee receives $900 per meeting. In the event that there is an in-person joint committee meeting of the Dreyfus/Laurel Funds, theTrust and Dreyfus High Yield Strategies Fund, the $2,000 or $1,500 fee, as applicable, will be allocated between the Dreyfus/Laurel Funds, the Trust and Dreyfus HighYield Strategies Fund.These fees and expenses are charged and allocated to each series based on net assets.
(e) Prior to December 1, 2008 at which time the fee was eliminated, a 2% redemption fee was charged and retained by the fund on certain shares redeemed within thirty days following the date of issuance, subject to exceptions, including redemptions made through the use of the fund’s exchange privilege. From January 1, 2008 to November 30, 2008, redemption fees charged and retained by the fund amounted to $12,751. The fund reserves the right to reimpose a redemption fee in the future.
NOTE 4—Securities Transactions:
The aggregate amount of purchases and sales (including paydowns) of investment securities, excluding short-term securities, option transactions, financial futures, forward currency exchange contracts and swap transactions, during the period ended December 31, 2008, amounted to $2,666,420,565 and $2,894,092,956, respectively, of which $2,232,208,379 in purchases and $2,288,761,020 in sales were from mortgage dollar roll transactions. Sales of investment securities include securities amounting to $26,531,547 delivered pursuant to a redemption-in-kind. The net realized loss of $3,348,227 of the redemption-in-kind will not be realized for tax purposes.
A mortgage dollar roll transaction involves a sale by the fund of mortgage related securities that it holds with an agreement by the fund to repurchase similar securities at an agreed upon price and date. The securities purchased will bear the same interest rate as those sold, but
44
generally will be collateralized by pools of mortgages with different prepayment histories than those securities sold. These forward commitments may be considered securities in themselves and involve the risk of loss if the value of the security to be purchased declines or if the value of the security sold increases prior to the settlement date, which is risk in addition to the risk of decline in value of the fund’s other assets.The use of the forward commitments may result in market risk to the fund that is greater than if the fund had engaged solely in transactions that settle in the customary time.
The fund may invest in financial futures contracts in order to gain exposure to or protect against changes in the market.The fund is exposed to market risk as a result of changes in the value of the underlying instru-ments.These investments require initial margin deposits with a broker, which consist of cash or cash equivalents.The amount of these deposits is determined by the exchange or Board ofTrade on which the contract is traded and is subject to change. Investments in financial futures require the fund to “mark to market” on a daily basis, which reflects the change in the market value of the contract at the close of each day’s trading. Accordingly variation margin payments are received or made to reflect daily unrealized gains or losses.When the contracts are closed, the fund recognizes a realized gain or loss. Contracts open at December 31, 2008 are set forth in the Statement of Financial Futures.
The fund may purchase and write (sell) put and call options in order to gain exposure to or to protect against changes in the market.
As a writer of call options, the fund receives a premium at the outset and then bears the market risk of unfavorable changes in the price of the financial instrument underlying the option. Generally, the fund would incur a gain, to the extent of the premium, if the price of the underlying financial instrument decreases between the date the option is written and the date on which the option is terminated. Generally, the fund would realize a loss, if the price of the financial instrument increases between those dates.
The Fund 45
| NOTES TO FINANCIAL STATEMENTS (continued) |
As a writer of put options, the fund receives a premium at the outset and then bears the market risk of unfavorable changes in the price of the financial instrument underlying the option. Generally, the fund would incur a gain, to the extent of the premium, if the price of the underlying financial instrument increases between the date the option is written and the date on which the option is terminated. Generally, the fund would realize a loss, if the price of the financial instrument decreases between those dates. The following summarizes the fund’s call/put options written for the period ended December 31, 2008:
| Face Amount | Options Terminated | |||||||
| Covered by | Premiums | Net Realized | ||||||
| Options Written: | Contracts ($) | Received ($) | Cost ($) | Gain (Loss) ($) | ||||
| Contracts outstanding | ||||||||
| December 31, 2007 | — | — | — | — | ||||
| Contracts written | 4,961,580 | 5,765,854 | — | — | ||||
| Contracts Terminated: | ||||||||
| Closed | 3,465,320 | 4,000,975 | 5,774,838 | (1,773,863) | ||||
| Expired | 1,332,260 | 1,527,180 | — | 1,527,180 | ||||
| Total contracts | ||||||||
| Terminated | 4,797,580 | 5,528,155 | 5,774,838 | (246,683) | ||||
| Contracts outstanding | ||||||||
| December 31, 2008 | 164,000 | 237,699 | — | — | ||||
The fund enters into forward currency exchange contracts in order to hedge its exposure to changes in foreign currency exchange rates on its foreign portfolio holdings and to settle foreign currency transactions. When executing forward currency exchange contracts, the fund is obligated to buy or sell a foreign currency at a specified rate on a certain date in the future. With respect to sales of forward currency exchange contracts, the fund would incur a loss if the value of the contract increases between the date the forward contract is opened and the date the forward contract is closed.The fund realizes a gain if the value of the contract decreases between those dates.With respect to purchases of forward currency exchange contracts, the fund would incur a loss if the value of the contract decreases between the date the forward contract is opened and the date the forward contract is closed. The fund realizes a gain if the value of the contract increases between those dates. The fund is also exposed to credit risk associated with counterparty
46
nonperformance on these forward currency exchange contracts which is typically limited to the unrealized gain on each open contract.The following summarizes open forward currency exchange contracts at December 31, 2008:
| Unrealized | ||||||||
| Foreign | Appreciation/ | |||||||
| Forward Currency | Currency | (Depreciation) | ||||||
| Exchange Contracts | Amounts | Cost ($) | Value ($) | at 12/31/2008 ($) | ||||
| Purchases: | ||||||||
| Chinese Renminbi, | ||||||||
| Expiring 3/26/2009 | 34,000,000 | 5,205,941 | 4,917,392 | (288,549) | ||||
| Sales: | ||||||||
| Brazilian Real, | ||||||||
| Expiring 1/16/2009 | 870,000 | 340,375 | 370,650 | (30,275) | ||||
| British Pound, | ||||||||
| Expiring 1/16/2009 | 140,000 | 207,017 | 201,183 | 5,834 | ||||
| Chinese Renminbi, | ||||||||
| Expiring 3/26/2009 | 34,000,000 | 5,373,370 | 4,917,392 | 455,978 | ||||
| Euro, | ||||||||
| Expiring 1/16/2009 | 490,000 | 631,145 | 680,592 | (49,447) | ||||
| Total | 93,541 |
The fund may enter into swap agreements to exchange the interest rate on, or return generated by, one nominal instrument for the return generated by another nominal instrument.
Risks may arise upon entering into these agreements from the potential inability of the counterparties to meet the terms of the agreement and are generally limited to the amount of net payments to be received, if any, at the date of default.
The fund accrues for the interim payments on swap contracts on a daily basis, with the net amount recorded within unrealized appreciation (depreciation) of swap contracts in the Statement of Assets and Liabilities. Once the interim payments are settled in cash, the net amount is recorded as realized gain (loss) on swaps, in addition to realized gain (loss) recorded upon the termination of swaps contracts in the Statement of Operations. Upfront payments made and/or received by the fund, are recorded as an asset and/or liability on the Statement
The Fund 47
| NOTES TO FINANCIAL STATEMENTS (continued) |
of Assets and Liabilities and are recorded as a realized gain or loss ratably over the contract’s term/event. Fluctuations in the value of swap contracts are recorded as a component of net change in unrealized appreciation (depreciation) on investments.
Credit default swaps involve commitments to pay a fixed interest rate in exchange for payment if a credit event affecting a third party (the referenced company) occurs. Credit events may include a failure to pay interest or principal, bankruptcy, or restructuring.The maximum pay-outs for these contracts are limited to the notional amount of each swap.The following summarizes open credit default swaps entered into by the fund at December 31, 2008:
| Unrealized | ||||||||||||
| Notional | Reference | Buy/Sell | (Pay)/Receive | Expiration | Appreciation | |||||||
| Amount ($) | Entity | Counterparty | Protection Fixed Rate (%) | Date | (Depreciation) ($) | |||||||
| 2,130,000 | Reed Elsevier | |||||||||||
| Capital, | ||||||||||||
| 4,625%, | Deutsche | |||||||||||
| 6/15/2012 | Bank | Buy | (0.96) 6/20/2012 | 167,139 | ||||||||
| 990,000 | R.R. Donnelley & | |||||||||||
| Sons, 4.95%, | Deutsche | |||||||||||
| 4/1/2014 | Bank | Buy | (1.60) 3/20/2012 | 54,995 | ||||||||
| 390,000 | R.R. Donnelley & | |||||||||||
| Sons, 4.95%, | JP Morgan | |||||||||||
| 4/1/2014 | Chase Bank | Buy | (1.70) 12/20/2011 | 19,100 | ||||||||
| 241,234 | ||||||||||||
Total return swaps involve commitments to pay interest in exchange for a market-linked return based on a national amount.To the extent the total return of the security or index underlying the transaction exceeds or falls short of the offsetting interest rate obligation, the fund will receive a payment from or make a payment to the counterparty, respec-tively.At December 31, 2008, the fund had no open total return swaps.
At December 31, 2008, the cost of investments for federal income tax purposes was $448,270,564; accordingly, accumulated net unrealized depreciation on investments was $38,467,591, consisting of $4,044,927 gross unrealized appreciation and $42,512,518 gross unrealized depreciation.
48
In March 2008, the Financial Accounting Standards Board (“FASB”) released Statement of Financial Accounting Standards No. 161, “Disclosures about Derivative Instruments and Hedging Activities” (“FAS 161”). FAS 161 requires qualitative disclosures about objectives and strategies for using derivatives, quantitative disclosures about fair value amounts of gains and losses on derivative instruments, and disclosures about credit-risk-related contingent features in derivative agree-ments.The application of FAS 161 is required for fiscal years and interim periods beginning after November 15, 2008. At this time, management is evaluating the implications of FAS 161 and its impact on the financial statements and the accompanying notes has not yet been determined.
During September, 2008 FASB Staff Position FAS 133-1 and FASB Interpretation 45-4, Disclosures about Credit Derivatives and Certain Guarantees: An Amendment of FASB Statement No. 133 and FASB Interpretation No. 45; and Clarification of the Effective Date of FASB Statement No. 161 (“Amendment”) was issued and is effective for annual and interim reporting periods ending after November 15, 2008. The Amendment requires enhanced disclosures regarding a fund’s credit derivatives holdings and hybrid financial instruments containing embedded credit derivatives. Since the fund was not selling credit protection at the end of the period, management believes FASB 133-1 does not currently impact the financial statements and the accompanying notes.
The Fund 49
| REPORT OF INDEPENDENT REGISTERED PUBLIC ACCOUNTING FIRM |
| To the Trustees of Dreyfus Investment Funds and Shareholders of Dreyfus/Standish Fixed Income Fund: |
In our opinion, the accompanying statement of assets and liabilities, including the statements of investments of financial futures, and of options written, and the related statements of operations and of changes in net assets and the financial highlights present fairly, in all material respects, the financial position of Dreyfus/Standish Fixed Income Fund (formerly, Standish Mellon Fixed Income Fund) (the “Fund”) at December 31, 2008, the results of its operations for the year then ended, the changes in its net assets for each of the two years in the period then ended and the financial highlights for each of the five years in the period then ended, in conformity with accounting principles generally accepted in the United States of America. These financial statements and financial highlights (hereafter referred to as “financial statements”) are the responsibility of the Fund’s management. Our responsibility is to express an opinion on these financial statements based on our audits.We conducted our audits of these financial statements in accordance with the standards of the Public Company Accounting Oversight Board (United States). Those standards require that we plan and perform the audit to obtain reasonable assurance about whether the financial statements are free of material misstate-ment.An audit includes examining, on a test basis, evidence supporting the amounts and disclosures in the financial statements, assessing the accounting principles used and significant estimates made by management, and evaluating the overall financial statement presentation. We believe that our audits, which included confirmation of securities at December 31, 2008 by correspondence with the custodian and brokers, provide a reasonable basis for our opinion.
| PricewaterhouseCoopers LLP New York, New York February 27, 2009 |
50
| INFORMATION ABOUT THE REVIEW AND APPROVAL OF THE FUND’S INVESTMENT ADVISORY AGREEMENT (Unaudited) |
Background and Summary
The 1940 Act requires that a majority of the Board of Trustees, including a majority of the Trustees who are not affiliated with Dreyfus/Standish Fixed Income Fund (formerly, Standish Mellon Fixed Income Fund) (the “Fund”), any investment adviser to the Fund or the Trust’s principal underwriter (the “Independent Trustees”), voting separately, approve the Fund’s advisory agreement and the related fees.
At their meeting held on August 27, 2008, the Board of Trustees and Independent Trustees, by majority vote, approved a new investment advisory agreement (the “New Advisory Agreement”) effective December 1, 2008, between Dreyfus Investment Funds (formerly, Mellon Institutional Funds Investment Trust) (the “Trust”), on behalf of the Fund, and a new adviser,The Dreyfus Corporation (“Dreyfus”), with respect to the Fund.This New Advisory Agreement replaces the investment advisory agreement between the Trust, on behalf of the Fund, and Standish Mellon Asset Management Company LLC (“Standish”) (such agreement, the “Current Advisory Agreement”).As discussed below, however, it is expected that the appointment of Dreyfus under the New Advisory Agreement will not result in any actual change in the investment management services provided to the Fund, the investment professionals who provide these services, or in the fees charged to the Fund for these services.
The New Advisory Agreement and the appointment of Dreyfus as the Fund’s investment adviser were proposed to the Trustees in the context of a larger proposed rebranding and consolidation of mutual fund businesses of The Bank of New York Mellon Corporation (“BNY Mellon”). Specifically, BNY Mellon proposed to consolidate substantially all of its mutual fund businesses, including the Fund and all of the other funds comprising the Trust, under the Dreyfus name, organization and infrastructure. Dreyfus is currently BNY Mellon’s primary mutual fund business unit, with approximately $340 billion in assets under management and approximately 180 mutual fund portfolios. The appointment of Dreyfus as investment adviser to all the Funds comprising the Trust consolidates the proprietary mutual fund invest-
The Fund 51
| INFORMATION ABOUT THE REVIEW AND APPROVAL OF THE FUND’S INVESTMENT ADVISORY AGREEMENT (Unaudited) (continued) |
ment management operations of two BNY Mellon advisory firms, Standish and The Boston Company Asset Management LLC, into a single BNY Mellon company, Dreyfus. Following completion of this consolidation, it is expected that the Trust and all of the Funds will be rebranded and marketed under the Dreyfus name.
In proposing the New Advisory Agreement and the appointment of Dreyfus as the Fund’s adviser, management provided the Board with written assurances that, if approved as to the Fund, this consolidation would not result in any change in the portfolio management of the Fund, the investment professionals who serve the Fund, or the fees charged for these services. Instead, the portfolio managers and research analysts who have provided services to the Fund in the past would continue to do so under the New Advisory Agreement using the same investment process they have used previously, only they would perform such services as personnel of Dreyfus, while also remaining personnel of their current firm.
Management proposed also to transfer simultaneously certain non-advisory functions and operations to corresponding units within Dreyfus and to combine certain of the Trust’s outside service provider relationships with those of the Dreyfus funds.
In connection with these changes, the current Board of Trustees also determined to recommend to shareholders of the Trust the election of six individuals, each of whom currently serves as independent trustee or director of funds managed by Dreyfus, to serve in their stead.
At the Board’s request, management provided information as to the combined financial impact of these changes on the Trust. This information indicated that the consolidation of the Trust’s Board, advisory functions, other operations of the Trust, and the service provider relationships would result in certain efficiencies and cost savings to the funds over time.
In determining to approve the New Advisory Agreement, the Board concluded, based on representations from management, that shareholders of the Fund would experience no actual change in the portfolio management of the Fund as a result of the new contractual
52
arrangement with Dreyfus and may over time experience efficiencies and cost savings. The Board noted also that the terms of the New Advisory Agreement were substantially identical to the terms of the Current Advisory Agreement between the Fund and Standish, and that the advisory fees to be paid to Dreyfus were identical to those currently paid to Standish.
The Board’s Deliberations
In determining whether to approve the New Advisory Agreement, the Independent Trustees received from Dreyfus a broad range of information in response to several written requests prepared on behalf of the Independent Trustees by their own legal counsel. The Independent Trustees met alone in private sessions with their legal counsel on several occasions, including at a special meeting devoted to these proposals on August 7, 2008, to review these materials and to discuss the New Advisory Agreement and other changes proposed by management. Representatives of management participated in portions of these sessions to provide an overview of Dreyfus’ organization, personnel, resources and strategic plans, and to respond to questions and comments arising from the Independent Trustees’ review of the materials and their delib-erations.These included discussions as to the impact on the Fund, if any, of the engagement of Dreyfus as the Fund’s investment adviser and the related consolidation of certain other operations of the Fund under the Dreyfus organization.
The information requested by the Independent Trustees and reviewed by the entire Board included:
| (i) | Financial and Economic Data: Dreyfus’ balance sheet and income statements, as well as an historical and pro forma profitability analy- sis of Dreyfus and of BNY Mellon with respect to the investment management services provided and to be provided, to the Fund, including profitability with respect to the custodian, transfer agent and securities lending services provided to the Fund by BNY |
| Mellon affiliates, as well as a separate presentation of profitability relative to that of several publicly traded investment advisers; | |
The Fund 53
| INFORMATION ABOUT THE REVIEW AND APPROVAL OF THE FUND’S INVESTMENT ADVISORY AGREEMENT (Unaudited) (continued) |
| (ii) | Management Teams and Operations: Dreyfus’ Form ADV, as well as information concerning Dreyfus’ executive management, portfolio management, client service personnel and overall organizational structure, assets under management, insurance coverage, brokerage and soft dollar policies and practices; |
| (iii) | Comparative Performance and Fees: Analyses prepared by Lipper Analytical Services (“Lipper”) regarding the Fund’s historical per- formance, management fee, and expense ratios compared to other funds, and Dreyfus’ separate account advisory fee schedules; |
| (iv) | Specific Facts Relating to the Fund: Standish’s commentary on the Fund’s performance and any material portfolio manager and strat- egy changes that may have affected the Fund in the prior year; and |
| (v) | Other Benefits: The benefits flowing to BNY Mellon and its affili- ates in the form of fees for transfer agency, custody, administration and securities lending services provided to the Funds by affiliates of BNY Mellon. |
In considering the approval of the Fund’s New Advisory Agreement, the Board of Trustees, including the Independent Trustees, did not identify any single factor as all-important or controlling, and individual Trustees did not necessarily attribute the same weight or importance to each fac-tor.The Trustees determined that the terms and conditions of the New Advisory Agreement and the compensation to Dreyfus provided therein were fair and reasonable in light of the services performed, expenses incurred and such other matters as the Trustees considered relevant in the exercise of their reasonable judgment.The following summary does not detail all the matters that were considered. Some of the factors that figured prominently in the Trustees’ determination are described below.
Nature, Extent and Quality of Services
The Board considered the nature, scope and quality of the overall services proposed to be provided to the Fund by Dreyfus. In their deliberations as to the approval of the New Advisory Agreement, the
54
Trustees were also mindful of the fact that, by choosing to invest in the Fund, the Fund’s shareholders have previously chosen to entrust Standish, the investment professionals of which would, under the proposal, also become associated with Dreyus to manage the portion of their assets invested in the Fund, under the supervision of the Board.
Among the specific factors the Board reviewed were the investment management, administrative, compliance and related services to be provided by Dreyfus. The Board determined that the services to be provided were of high quality and at least commensurate with industry standards. The Board also placed significant weight on assurances provided by management that there would be no material changes in the nature or quality of the services provided, including in the personnel or processes utilized in providing investment management services to the Fund as a result of the appointment of Dreyfus and that no such changes were currently contemplated by management in the future.
The Trustees reviewed the background and experience of the Fund’s portfolio managers then employed by Standish, who would become associated with Dreyfus. In previous meetings the Trustees had heard from senior management of Dreyfus an overview of its organization, personnel, resources and strategic plans. Among other things, the Trustees considered the size, education and experience of Dreyfus’ investment staff, technological infrastructure and overall responsiveness to changes in market conditions.
The Board determined that Dreyfus, using the same investment professionals and resources then supplied by Standish, had the expertise and resources to manage the Fund effectively on a day-to-day basis.
Investment Performance
The Board considered the historical investment performance of Standish in managing the Fund against a peer group of investment companies selected by Standish with input from the Trustees. The
| The Fund 55 |
| INFORMATION ABOUT THE REVIEW AND APPROVAL OF THE FUND’S INVESTMENT ADVISORY AGREEMENT (Unaudited) (continued) |
Board also compared the Fund’s investment performance against the average performance of a larger universe of funds regarded by Lipper as having similar investment objectives and considered the Fund’s performance rankings against that universe. In addition to the information received by the Board for the August 27, 2008 Board meeting, the Trustees had received similar detailed comparative performance information for the Fund at regular Board meetings during the year.
The Lipper materials provided to the Board at the August 27 meeting indicated that the performance of the Fund for the 1-, 3- and 5-year periods ended May 31, 2008 was 2.21%, 2.94% and 3.49%, respectively. The Board found that for the 1- and 3-year periods, the Fund had underperformed its peer group average returns of 3.09% and 3.16%, respectively, but outperformed its peer group average return of 3.40% for the 5-year period.
Advisory Fee and Other Expenses
The Board considered the advisory fee rate proposed to be paid by the Fund to Dreyfus which was identical to the fee then being paid together with written assurances that no increase in the fee payable by the Fund was contemplated. The Lipper data presenting the Fund’s “net management fees” included fees paid by the Fund, as calculated by Lipper, for administrative services provided by The Bank of New York Mellon, the Trust’s custodian. Such reporting was necessary, according to Lipper, to allow the Board to compare the Fund’s advisory fees to those peers that include administrative fees within a blended advisory fee.
The Fund’s contractual advisory fee was 0.371% (based on the following breakpoints: 0.40% of the first $250 million; 0.35% of the next $250 million; and 0.30% over $500 million), in the 1st quintile (best) of its peer group of funds, the median fee of which was 0.44% . The Fund’s net management fee, after giving effect to expense limitations, was 0.418% (which included administrative services fees under Lipper’s calculation methodology), slightly higher than the peer group median net management fee of 0.377% .
56
Based on the Lipper data, as well as other factors discussed at the August 27, 2008 Board meeting, the Board determined that the Fund’s proposed advisory fee under the New Advisory Agreement is reasonable relative to its peer group median and noted that it was identical to the advisory fee paid by the Fund under the Current Advisory Agreement.
The Board also compared the fees payable by the Fund relative to those payable by separate account clients of Dreyfus. Based on the additional scope and complexity of the services provided and responsibilities assumed by Dreyfus with respect to the Fund relative to these other types of clients, the Board concluded that the fees payable under the New Advisory Agreement were reasonable relative to the nature and quality of the services provided.
The Board also considered the Fund’s total expense ratio and compared it to that of its peer group of similar funds.They found that the actual net expense ratio of 0.498% (after giving effect to expense limitations) was slightly higher than the median net expense ratio of the peer group of 0.464%, largely due to the Fund’s small asset size compared to its peer group.
The Board noted that Standish had voluntarily agreed to limit its fees and/or reimburse the Fund’s expenses to the extent necessary to limit the Fund’s total expense ratio (excluding brokerage commissions, taxes, acquired fund fees and expenses and extraordinary expenses) to 0.50% and that, although this arrangement is temporary and may be changed at any time, Dreyfus had represented to the Board that no change in this voluntary expense limitation was contemplated.
Adviser’s Profitability
The Board considered Dreyfus’ projected 2008 pro forma profitability in managing the Fund and, the Mellon Institutional Funds as a group (assuming integration of the Trust’s operations with the Dreyfus Funds had already occurred), as well as the methodology used to compute such profitability, and the various direct and indirect expenses expected
The Fund 57
| INFORMATION ABOUT THE REVIEW AND APPROVAL OF THE FUND’S INVESTMENT ADVISORY AGREEMENT (Unaudited) (continued) |
to be incurred by Dreyfus.The IndependentTrustees had observed that, based on the pro forma profitability information submitted to them by Dreyfus, Dreyfus expected to incur losses in managing several of the funds in the Mellon Institutional Funds family of funds. The Board compared this pro forma profitability with Standish’s actual historical profitability in managing the Fund and also reviewed the methodologies used in computing the pro forma and actual historical profitability. The Trustees observed that Dreyfus’ pro forma information indicated that the Fund would have generated a profit for BNY Mellon for the twelve month period ended June 30, 2008, which profit the Board determined not to be excessive.The Board noted that the rebranding and marketing strategies that formed a part of the plan to consolidate the Fund under the Dreyfus mutual fund organization could be expected to have a positive effect on Dreyfus’ profitability in future years, but that these effects were not yet quantifiable.
Economies of Scale
The Board also considered the extent to which economies of scale might be realized as the Fund grows.As in the case of profitability, the Trustees noted that the Fund’s becoming part of the Dreyfus mutual fund operations was expected to produce future economies of scale relative to its historical advisory relationship with Standish, but that these could not be projected and quantified currently. The Board noted that the Fund’s fee schedule included breakpoints designed to address economies of scale and concluded that, at existing asset levels and considering current asset growth projections, further fee breakpoints or other fee reductions were not warranted at this time.
58
Other Benefits
The Board also considered the additional benefits, based on information provided by management, flowing to BNY Mellon as a result of its relationship with the Mellon Institutional Funds as a group, including revenues received by BNY Mellon affiliates in consideration of custodial, administrative, transfer agency and securities lending services provided by such affiliates to the Funds. In each case, such affiliates had been selected by the Board on the basis of a comparative analysis of their capabilities and fees relative to those of unaffiliated competitors.
The Board considered the fact that Dreyfus, Standish and BNY Mellon operate businesses other than the Mellon Institutional Funds, some of which businesses share personnel, office space and other resources and that these were a component of the profitability analysis provided.The Board also considered the intangible benefits that accrue to BNY Mellon and its affiliates by virtue of their relationships with the Funds and the Mellon Institutional Funds as a group.
| * * * |
The foregoing factors were among those weighed by the Trustees in determining that the terms and conditions of the Fund’s New Advisory Agreement and the compensation proposed to be paid to Dreyfus thereunder was fair and reasonable and, thus, voted to approve the New Advisory Agreement for up to one year from its effective date.
The Fund 59
60
The Fund 61
OFFICERS OF THE FUND (Unaudited)
62

The Fund 63
NOTES
For More Information
| Ticker Symbol: SDFIX |
Telephone Call your Financial Representative or 1-800-645-6561
Mail The Dreyfus Family of Funds, 144 Glenn Curtiss Boulevard, Uniondale, NY 11556-0144 E-mail Send your request to info@dreyfus.com Internet Information can be viewed online or downloaded at: http://www.dreyfus.com
The fund files its complete schedule of portfolio holdings with the Securities and Exchange Commission (“SEC”) for the first and third quarters of each fiscal year on Form N-Q. The fund’s Forms N-Q are available on the SEC’s website at http://www.sec.gov and may be reviewed and copied at the SEC’s Public Reference Room in Washington, DC. Information on the operation of the Public Reference Room may be obtained by calling 1-800-SEC-0330.
A description of the policies and procedures that the fund uses to determine how to vote proxies relating to portfolio securities, and information regarding how the fund voted these proxies for the 12-month period ended June 30, 2008, is available at http://www.dreyfus.com and on the SEC’s website at http://www.sec.gov. The description of the policies and procedures is also available without charge, upon request, by calling 1-800-645-6561.
© 2009 MBSC Securities Corporation

| Dreyfus/Standish Global Fixed Income Fund |
| ANNUAL REPORT December 31, 2008 |
The views expressed in this report reflect those of the portfolio manager only through the end of the period covered and do not necessarily represent the views of Dreyfus or any other person in the Dreyfus organization. Any such views are subject to change at any time based upon market or other conditions and Dreyfus disclaims any responsibility to update such views.These views may not be relied on as investment advice and, because investment decisions for a Dreyfus fund are based on numerous factors, may not be relied on as an indication of trading intent on behalf of any Dreyfus fund.
| Contents | ||
| THE FUND | ||
| 2 | A Letter from the CEO | |
| 3 | Discussion of Fund Performance | |
| 6 | Fund Performance | |
| 7 | Understanding Your Fund’s Expenses | |
| 7 | Comparing Your Fund’s Expenses | |
| With Those of Other Funds | ||
| 8 | Statement of Investments | |
| 19 | Statement of Financial Futures | |
| 20 | Statement of Assets and Liabilities | |
| 21 | Statement of Operations | |
| 22 | Statement of Changes in Net Assets | |
| 23 | Financial Highlights | |
| 24 | Notes to Financial Statements | |
| 42 | Report of Independent Registered | |
| Public Accounting Firm | ||
| 43 | Factors Considered by the | |
| Board in Approving the New | ||
| Investment Advisory Agreement | ||
| 52 | Board Members Information | |
| 54 | Officers of the Fund | |
| FOR MORE INFORMATION | ||
| Back Cover | ||
| Dreyfus/Standish Global Fixed Income Fund |
The Fund

A LETTER FROM THE CEO
Dear Shareholder:
We present to you this annual report for Dreyfus/Standish Global Fixed Income Fund, covering the 12-month period from January 1, 2008, through December 31, 2008.
2008 was the most difficult year in decades for the financial markets. A credit crunch that began in 2007 exploded in mid-2008 into a global financial crisis, resulting in the failures of major financial institutions, a deep and prolonged recession and lower investment values across a broad range of asset classes. Governments and regulators throughout the world moved aggressively to curtail the damage, implementing unprecedented reductions of short-term interest rates, massive injections of liquidity into the banking system, government bailouts of struggling companies and plans for massive economic stimulus programs. U.S. government securities generally fared well in the ensuing “flight to quality,” but riskier bond market sectors suffered sharp price declines.
Although we expect the U.S. and global economies to remain weak until longstanding imbalances have worked their way out of the system, the financial markets currently appear to have priced in investors’ generally low expectations. In previous recessions, however, the markets have tended to anticipate economic improvement before it occurs, potentially leading to major rallies when few expected them. That’s why it makes sense to remain disciplined, maintain a long-term perspective and adopt a consistent asset allocation strategy that reflects one’s future goals and attitudes toward risk. As always, we urge you to consult with your financial advisor, who can recommend the course of action that is right for you. For information about how the fund performed during the reporting period, as well as market perspectives, we have provided a Discussion of Fund Performance given by the fund’s Portfolio Managers.
Thank you for your continued confidence and support.

| Jonathan R. Baum Chief Executive Officer The Dreyfus Corporation January 15, 2009 |
2

DISCUSSION OF FUND PERFORMANCE
For the period of January 1, 2008, through December 31, 2008, as provided by David Leduc, CFA, and Thomas Fahey, Co-Portfolio Managers
Fund and Market Performance Overview
For the 12-month period ended December 31, 2008, Dreyfus/Standish Global Fixed Income Fund achieved a total return of 7.50% .1 In comparison, the Barclays Capital Global Aggregate Index (the “Index”), the fund’s benchmark, achieved a total return of 4.79% for the same period.2 Several factors accounted for our outperformance relative to the Index. We kept the fund’s duration longer than the benchmark level, which was beneficial when rates fell as the global recession worsened. Our positioning at the front end of the yield curve also helped performance, as did our currency positioning.
The Fund’s Investment Approach
The fund seeks to maximize total return while realizing a market level of income, consistent with preserving principal and liquidity, by investing primarily in a portfolio of investment grade fixed income securities of governments and companies denominated in foreign and U.S. currencies. These may include high-grade and medium-grade government, corporate, mortgage-backed, asset-backed, high yield and emerging market debt securities.To protect the U.S. dollar value of the fund’s assets, we hedge primarily 90% to 100% of the portfolio’s foreign currency exposure.
The fund emphasizes rotation among undervalued countries, sectors, securities and currencies. In particular, we focus on securities with the most potential for added value, i.e., those involving potential for credit upgrades and unique structural characteristics.To identify these securities, we use macroeconomic research and quantitative analysis to allocate assets among countries and currencies based on a comparative evaluation of interest and inflation rate trends, government fiscal/monetary policy, and credit quality of government debt.
Markets Withstood a Difficult Year
Following a downward trend established by the United States, most regions of the world suffered from slowing economic growth during 2008, fueling fears of a global recession. Meanwhile, the credit crunch
The Fund 3
| DISCUSSION OF FUND PERFORMANCE (continued) |
that began in the U.S. sub-prime mortgage market in 2007 developed into a global financial crisis during 2008, nearly leading to the collapse of the global banking system in September. Government and regulatory authorities intervened, pumping billions of dollars into the system to restore a degree of investor confidence. These efforts included an unprecedented, coordinated reduction of short-term interest rates by major central banks.
As market conditions deteriorated, many highly leveraged institutional investors were forced to sell their more liquid investments to raise cash for margin calls. Selling pressure led to broadly lower prices even among fundamentally sound bonds. Bonds from emerging markets were particularly hard-hit, while those from developed markets fared better. Economic conditions continued to worsen at a very rapid rate over the last quarter.The issue of global decoupling was laid to rest, as Japan and Europe headed strongly into a deep recession.The rate of deterioration was surprising, as the Federal Reserve Board and Central Banks around the world stepped in to aggressively cut interest rates and shore up their financial systems.
The United Kingdom became increasingly vulnerable because of its high levels of consumer debt, overvalued housing market, and overall credit crunch. Ireland and Spain also came under growing pressure. Even Germany, which had enjoyed some measure of stability, began to show signs of stress.
In Asia, Japan faced fierce headwinds.The global recession drove down demand for its exports, as did the strengthening yen, which made its products more expensive in foreign markets.
Our Approach to the Global Environment
The fund benefited from an emphasis on bonds from higher-quality, developed markets. In particular, the fund’s position in U.S. bonds helped drive the fund’s positive relative performance as investors flocked to traditional safe havens. In addition, the fund’s holdings of United Kingdom and New Zealand bonds fared relatively well in the flight to quality. The fund also achieved positive results from our interest rate strategies, which tended to favor bonds with maturities in the five-year range over longer-term maturities. However, we had longer duration relative to the Index.This strategy paid off when central banks eased short-term interest rates, and shorter maturity yields declined more steeply than yields of longer-term bonds.
4
On the other hand, the fund’s relative performance was hampered by its holdings among investment-grade and high-yield corporate bonds, which were hurt by economic and credit concerns.Although the fund held relatively few lower-rated credits, even this small allocation had a materially adverse effect on returns during the financial crisis.
Looking Ahead to Future Challenges
As of the year’s end, the global economic downturn and financial crisis have persisted. Therefore, we have maintained a cautious investment posture, including an emphasis on higher-quality, developed markets. However, we have found a number of attractively valued bonds in more speculative areas, and we may establish positions in such securities when we see evidence that the current downturn has bottomed.
Although we believe even lower economic growth is on the horizon, we are hopeful that at some point during the second half of 2009 we may begin to see signs of recovery, as the concerted efforts of world governments to help support economic growth begin to take root. That said, the continued deleveraging among global markets presents a serious headwind to that recovery.
In anticipation of economic improvement, we are increasing our allocation to corporate bonds. Because we believe default rates could still pick up this year, however, we are focusing on high-quality names.We believe they will be in the best position to benefit should a recovery take hold.
January 15, 2009
| The fund may use derivative instruments, such as options, futures and options on futures, forward contracts, swaps (including credit default swaps on corporate bonds and asset-backed securities), options on swaps, and other credit derivatives. A small investment in derivatives could have a potentially large impact on the fund’s performance.The use of derivatives involves risks different from, or possibly greater than, the risks associated with investing directly in the underlying assets. Credit default swaps and similar instruments involve greater risks than if the fund had invested in the reference obligation directly, since, in addition to general market risks, they are subject to illiquidity risk, counterparty risk and credit risks. | |
| 1 | Total return includes reinvestment of dividends and any capital gains paid. Past performance is no guarantee of future results. Share price and investment return fluctuate such that upon redemption, fund shares may be worth more or less than their original cost. Return figure provided reflects the absorption of certain fund expenses by The Dreyfus Corporation pursuant to an undertaking in effect that may be extended, terminated or modified at any time. Had these expenses not been absorbed, the fund’s return would have been lower. |
| 2 | SOURCE: Barclays Capital Inc. — Reflects reinvestment of dividends and, where applicable, capital gain distributions.The Barclays Capital Global Aggregate Index provides a broad-based measure of the global investment-grade fixed income markets.The three major components of this index are the U.S. Aggregate, the Pan-European Aggregate, and the Asian-Pacific Aggregate Indices.The index also includes Eurodollar and Euro-Yen corporate bonds, Canadian Government securities, and USD investment-grade 144A securities. Index returns do not reflect fees and expenses associated with operating a mutual fund. |
The Fund 5
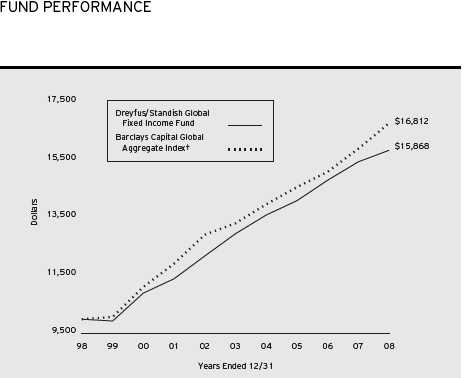
Comparison of change in value of $10,000 investment in Dreyfus/Standish Global Fixed Income Fund and the Barclays Capital Global Aggregate Index
| Average Annual Total Returns as of 12/31/08 | ||||||
| 1 Year | 5 Years | 10 Years | ||||
| Fund | 7.50% | 5.09% | 5.22% |
† Source: Barclays Capital Inc.
Past performance is not predictive of future performance.The fund’s performance shown in the graph and table does not reflect the deduction of taxes that a shareholder would pay on fund distributions or the redemption of fund shares.
The above graph compares a $10,000 investment made in Dreyfus/Standish Global Fixed Income Fund on 12/31/98 to a $10,000 investment made in the Barclays Capital Global Aggregate Index (the “Index”) on that date. All dividends and capital gain distributions are reinvested.
Effective 12/1/08,The Dreyfus Corporation became the fund’s investment adviser and the name of Mellon Institutional Funds Investment Trust was changed to Dreyfus Investment Funds.The fund’s name was changed to Dreyfus/Standish Global Fixed Income Fund.
The fund’s performance shown in the line graph takes into account all applicable fees and expenses.The Index provides a broad-based measure of the global investment-grade fixed income markets.The three major components of this index are the U.S. Aggregate, the Pan-European Aggregate, and the Asian-Pacific Aggregate Indices.The Index also includes Eurodollar and Euro-Yen corporate bonds, Canadian Government securities, and USD investment grade 144A securities. Unlike a mutual fund, the Index is not subject to charges, fees and other expenses. Investors cannot invest directly in any index.These factors can contribute to the Index potentially outperforming the fund. Further information relating to fund performance, including expense reimbursements, if applicable, is contained in the Financial Highlights section of the prospectus and elsewhere in this report.
6
UNDERSTANDING YOUR FUND’S EXPENSES (Unaudited)
As a mutual fund investor, you pay ongoing expenses, such as management fees and other expenses. Using the information below, you can estimate how these expenses affect your investment and compare them with the expenses of other funds.You also may pay one-time transaction expenses, including sales charges (loads) and redemption fees, which are not shown in this section and would have resulted in higher total expenses. For more information, see your fund’s prospectus or talk to your financial adviser.
Review your fund’s expenses
The table below shows the expenses you would have paid on a $1,000 investment in Dreyfus/Standish Global Fixed Income Fund from July 1, 2008 to December 31, 2008. It also shows how much a $1,000 investment would be worth at the close of the period, assuming actual returns and expenses.
Expenses and Value of a $1,000 Investment assuming actual returns for the six months ended December 31, 2008
| Expenses paid per $1,000† | $ 3.36 | |
| Ending value (after expenses) | $1,057.00 |
| COMPARING YOUR FUND’S EXPENSES WITH THOSE OF OTHER FUNDS (Unaudited) |
Using the SEC’s method to compare expenses
The Securities and Exchange Commission (SEC) has established guidelines to help investors assess fund expenses. Per these guidelines, the table below shows your fund’s expenses based on a $1,000 investment, assuming a hypothetical 5% annualized return. You can use this information to compare the ongoing expenses (but not transaction expenses or total cost) of investing in the fund with those of other funds.All mutual fund shareholder reports will provide this information to help you make this comparison. Please note that you cannot use this information to estimate your actual ending account balance and expenses paid during the period.
Expenses and Value of a $1,000 Investment assuming a hypothetical 5% annualized return for the six months ended December 31, 2008
| Expenses paid per $1,000† | $ 3.30 | |
| Ending value (after expenses) | $1,021.87 |
| † Expenses are equal to the fund’s annualized expense ratio of .65%, multiplied by the average account value over the period, multiplied by 184/366 (to reflect the one-half year period). |
The Fund 7
| STATEMENT OF INVESTMENTS | ||||||||||
| December 31, 2008 | ||||||||||
| Coupon | Maturity | Principal | ||||||||
| Bonds and Notes—95.1% | Rate (%) | Date | Amount ($)a | Value ($) | ||||||
| Brazil—0.7% | ||||||||||
| Brazilian Government, | ||||||||||
| Unsub. Bonds | BRL | 12.50 | 1/5/16 | 675,000 | 304,647 | |||||
| Canada—1.7% | ||||||||||
| Province of Ontario Canada, | ||||||||||
| Notes | CAD | 4.50 | 12/2/12 | 825,000 | 713,717 | |||||
| Rogers Wireless, | ||||||||||
| Sr. Unscd. Notes | 7.50 | 3/15/15 | 45,000 | 44,610 | ||||||
| 758,327 | ||||||||||
| France—1.3% | ||||||||||
| Carrefour SA, | ||||||||||
| Sr. Unscd. Notes | EUR | 5.13 | 10/10/14 | 50,000 | 69,426 | |||||
| GDF Suez, | ||||||||||
| Sr. Unscd. Notes | EUR | 6.25 | 1/24/14 | 75,000 | 110,104 | |||||
| Societe General, | ||||||||||
| Sr. Unscd. Notes | EUR | 5.25 | 3/28/13 | 100,000 | 141,811 | |||||
| Societe Generale, | ||||||||||
| Sub. Notes | EUR | 6.13 | 8/20/18 | 100,000 | 141,592 | |||||
| Veolia Environnement, | ||||||||||
| Sr. Unsub | EUR | 4.88 | 5/28/13 | 65,000 | 88,375 | |||||
| 551,308 | ||||||||||
| Germany—3.1% | ||||||||||
| Bundesobligation, | ||||||||||
| Bonds, Ser. 144 | EUR | 3.25 | 1/4/16 | 210,000 | 292,874 | |||||
| Bundesrepublik Deutschland, | ||||||||||
| Bonds, Ser. 99 | EUR | 3.75 | 1/4/09 | 530,000 | 736,725 | |||||
| Bundesrepublik Deutschland, | ||||||||||
| Bonds, Ser. 5 | EUR | 4.00 | 1/4/37 | 145,000 | 216,141 | |||||
| Bundesrepublik Deutschland, | ||||||||||
| Bonds, Ser. 3 | EUR | 4.25 | 1/4/14 | 70,000 | 105,963 | |||||
| 1,351,703 | ||||||||||
| Italy—4.2% | ||||||||||
| Atlantia, | ||||||||||
| Gtd. Notes | EUR | 4.01 | 6/9/11 | 300,000 b | 412,575 | |||||
| Buoni Poliennali del Tesoro, | ||||||||||
| Bonds | EUR | 0.95 | 9/15/10 | 276,430 | 372,297 | |||||
| Buoni Poliennali del Tesoro, | ||||||||||
| Bonds | EUR | 3.00 | 1/15/10 | 685,000 | 959,687 | |||||
| Finmeccanica, | ||||||||||
| Sr. Notes | EUR | 4.88 | 3/24/25 | 80,000 | 80,062 | |||||
| 1,824,621 | ||||||||||
8
| Coupon | Maturity | Principal | ||||||||
| Bonds and Notes (continued) | Rate (%) | Date | Amount ($)a | Value ($) | ||||||
| Japan—6.2% | ||||||||||
| Development | ||||||||||
| Bank of Japan, | ||||||||||
| Gov’t Gtd. Notes | JPY | 1.05 | 6/20/23 | 27,000,000 | 266,793 | |||||
| Japan Government, | ||||||||||
| Bonds | JPY | 1.00 | 6/10/16 | 45,000,000 | 442,700 | |||||
| Japan Government | ||||||||||
| Bonds, Ser. 275 | JPY | 1.40 | 12/20/15 | 16,000,000 | 184,199 | |||||
| Japan Government, | ||||||||||
| Bonds, Ser. 11 | JPY | 1.70 | 6/20/33 131,000,000 | 1,411,342 | ||||||
| Japan Government, | ||||||||||
| Bonds, Ser. 244 | JPY | 2.44 | 12/20/12 | 36,000,000 | 403,476 | |||||
| 2,708,510 | ||||||||||
| Luxembourg—0.7% | ||||||||||
| Enel Finance International, | ||||||||||
| Gtd. Notes | 5.70 | 1/15/13 | 100,000 c | 92,143 | ||||||
| Sogerim, | ||||||||||
| Gtd. Notes | EUR | 7.50 | 4/20/11 | 60,000 | 82,760 | |||||
| Telecom Italia Capital, | ||||||||||
| Gtd. Notes | 7.00 | 6/4/18 | 160,000 | 130,009 | ||||||
| 304,912 | ||||||||||
| Mexico—1.5% | ||||||||||
| Mexican Bonos, | ||||||||||
| Bonds, Ser. M10 | MXN | 7.75 | 12/14/17 | 8,900,000 | 635,214 | |||||
| Netherlands—4.2% | ||||||||||
| E.ON International Finance, | ||||||||||
| Gtd. Notes | EUR | 5.50 | 10/2/17 | 130,000 | 186,035 | |||||
| Koninklijke KPN NV, | ||||||||||
| Sr. Unscd. Notes | EUR | 4.75 | 1/17/17 | 75,000 | 93,116 | |||||
| KPN, | ||||||||||
| Sr. Unscd. Notes | 8.00 | 10/1/10 | 180,000 | 181,729 | ||||||
| Netherlands Government, | ||||||||||
| Bonds | EUR | 4.00 | 1/15/37 | 470,000 | 681,920 | |||||
| Repsol International | ||||||||||
| Finance, | ||||||||||
| Gtd. Notes | EUR | 4.63 | 10/8/14 | 100,000 | 124,382 | |||||
| Shell International Finance, | ||||||||||
| Sr. Notes | 6.38 | 12/15/38 | 420,000 | 474,175 | ||||||
| Telefonica Europ BV, | ||||||||||
| Gtd. Notes | EUR | 5.13 | 2/14/13 | 55,000 | 75,654 | |||||
| 1,817,011 | ||||||||||
The Fund 9
| STATEMENT OF INVESTMENTS (continued) |
| Coupon | Maturity | Principal | ||||||||||
| Bonds and Notes (continued) | Rate (%) | Date | Amount ($)a | Value ($) | ||||||||
| Norway—0.3% | ||||||||||||
| DNB Nor Bank, | ||||||||||||
| Sub. Notes | EUR | 4.59 | 5/30/17 | 100,000 | b | 117,883 | ||||||
| South Korea—0.3% | ||||||||||||
| Export-Import Bank of Korea, | ||||||||||||
| Sr. Unscd. Notes | EUR | 5.75 | 5/22/13 | 110,000 | 130,210 | |||||||
| Spain—0.8% | ||||||||||||
| Santander International, | ||||||||||||
| Gtd. Notes | EUR | 5.63 | 2/14/12 | 100,000 | 139,786 | |||||||
| Telefonica Emisiones, | ||||||||||||
| Gtd. Notes | 1.83 | 6/19/09 | 235,000 | b | 227,531 | |||||||
| 367,317 | ||||||||||||
| United Kingdom—10.8% | ||||||||||||
| BAT International Finance PLC, | ||||||||||||
| Gtd. Notes | EUR | 5.38 | 6/29/17 | 110,000 | 133,010 | |||||||
| BAT International Finance PLC, | ||||||||||||
| Gtd. Notes | GBP | 6.38 | 12/12/19 | 40,000 | 54,867 | |||||||
| BP Capital Markets, | ||||||||||||
| Sr. Unscd. Notes | 5.25 | 11/7/13 | 395,000 | 412,794 | ||||||||
| Diageo, | ||||||||||||
| Gtd. Notes | 7.38 | 1/15/14 | 345,000 | 367,898 | ||||||||
| HSBC Holdings, | ||||||||||||
| Sub. Notes | 6.80 | 6/1/38 | 255,000 | 270,351 | ||||||||
| National Grid, | ||||||||||||
| Unsub. Notes | 6.30 | 8/1/16 | 75,000 | 65,446 | ||||||||
| Northern Rock, | ||||||||||||
| Sub. Notes | GBP | 5.63 | 1/13/15 | 260,000 | b | 232,326 | ||||||
| Royal Bank of Scotland, | ||||||||||||
| Sr. Unscd. Notes | EUR | 5.25 | 5/15/13 | 125,000 | 174,229 | |||||||
| SABMiller, | ||||||||||||
| Gtd. Notes | 1.74 | 7/1/09 | 75,000 | b,c | 74,791 | |||||||
| United Kingdom Gilt, | ||||||||||||
| Bonds | GBP | 4.25 | 3/7/11 | 690,000 | 1,043,953 | |||||||
| United Kingdom Gilt, | ||||||||||||
| Bonds | GBP | 4.25 | 6/7/32 | 45,000 | 68,084 | |||||||
| United Kingdom Gilt, | ||||||||||||
| Bonds | GBP | 5.00 | 9/7/14 | 590,000 | 947,367 | |||||||
| United Kingdom Gilt, | ||||||||||||
| Bonds | GBP | 4.25 | 3/7/36 | 330,000 | 511,318 | |||||||
10
| Coupon | Maturity | Principal | ||||||||
| Bonds and Notes (continued) | Rate (%) | Date | Amount ($)a | Value ($) | ||||||
| United Kingdom (continued) | ||||||||||
| United Kingdom Gilt, | ||||||||||
| Bonds | GBP | 8.00 | 9/27/13 | 190,000 | 339,828 | |||||
| 4,696,262 | ||||||||||
| United States—59.3% | ||||||||||
| Appalachian Power, | ||||||||||
| Sr. Unscd. Notes | 7.00 | 4/1/38 | 165,000 | 163,717 | ||||||
| AT&T, | ||||||||||
| Sr. Unscd. Notes | 6.40 | 5/15/38 | 120,000 | 128,983 | ||||||
| AT&T, | ||||||||||
| Sr. Unscd. Notes | 6.70 | 11/15/13 | 195,000 | 206,782 | ||||||
| AT&T, | ||||||||||
| Sr. Unscd. Notes | EUR | 6.13 | 4/2/15 | 100,000 | 132,399 | |||||
| Baker Hughes, | ||||||||||
| Sr. Unscd. Notes | 7.50 | 11/15/18 | 260,000 | 288,762 | ||||||
| Bank of America, | ||||||||||
| Sr. Unscd. Notes | 4.90 | 5/1/13 | 225,000 | 223,078 | ||||||
| Bank of America, | ||||||||||
| Sub. Notes | EUR | 4.00 | 3/28/18 | 200,000 b | 221,791 | |||||
| Block Financial, | ||||||||||
| Gtd. Notes | 7.88 | 1/15/13 | 405,000 | 383,372 | ||||||
| Burlington North Santa Fe, | ||||||||||
| Sr. Unscd. Notes | 7.00 | 2/1/14 | 315,000 | 329,076 | ||||||
| Case New Holland, | ||||||||||
| Gtd. Notes | 7.13 | 3/1/14 | 197,000 | 140,855 | ||||||
| Caterpillar, | ||||||||||
| Notes | 7.90 | 12/15/18 | 150,000 | 172,978 | ||||||
| Chesapeake Energy, | ||||||||||
| Gtd. Notes | 7.50 | 9/15/13 | 100,000 | 86,500 | ||||||
| Chevy Chase Bank, | ||||||||||
| Sub. Notes | 6.88 | 12/1/13 | 90,000 | 72,562 | ||||||
| Citigroup, | ||||||||||
| Sr. Unscd. Notes | 5.30 | 10/17/12 | 135,000 | 130,212 | ||||||
| Citigroup, | ||||||||||
| Sr. Unscd. Notes | 5.50 | 4/11/13 | 225,000 | 219,284 | ||||||
| Citigroup, | ||||||||||
| Sr. Unscd. Notes | EUR | 6.40 | 3/27/13 | 160,000 | 215,795 | |||||
| Coca-Cola Enterprises, | ||||||||||
| Notes | 7.38 | 3/3/14 | 315,000 | 346,276 | ||||||
The Fund 11
| STATEMENT OF INVESTMENTS (continued) |
| Coupon | Maturity | Principal | ||||||||
| Bonds and Notes (continued) | Rate (%) | Date | Amount ($)a | Value ($) | ||||||
| United States (continued) | ||||||||||
| Columbus Southern Power, | ||||||||||
| Sr. Unscd. Notes | 6.05 | 5/1/18 | 70,000 | 67,935 | ||||||
| Community Health Systems, | ||||||||||
| Gtd. Notes | 8.88 | 7/15/15 | 100,000 | 92,500 | ||||||
| Consumers Energy, | ||||||||||
| First Mortgage Bonds, Ser. B | 5.38 | 4/15/13 | 140,000 | 137,908 | ||||||
| Countrywide Financial, | ||||||||||
| Gtd. Notes | 1.69 | 3/24/09 | 240,000 | b | 238,060 | |||||
| Coventry Health Care, | ||||||||||
| Sr. Unscd. Notes | 5.95 | 3/15/17 | 85,000 | 44,374 | ||||||
| Davita, | ||||||||||
| Gtd. Notes | 6.63 | 3/15/13 | 100,000 | 95,500 | ||||||
| Delhaize Group, | ||||||||||
| Sr. Unscd. Notes | 6.50 | 6/15/17 | 75,000 | 68,206 | ||||||
| E.I. Dupont De Nemours, | ||||||||||
| Notes | 5.88 | 1/15/14 | 215,000 | 221,597 | ||||||
| Echostar DBS, | ||||||||||
| Gtd. Notes | 7.13 | 2/1/16 | 105,000 | 88,200 | ||||||
| Entergy Gulf State Louisiana, | ||||||||||
| Sr. Scd. Notes | 6.00 | 5/1/18 | 125,000 | c | 109,134 | |||||
| Federal Home Loan | ||||||||||
| Mortgage Corp | 4.50 | 4/1/35 | 329,114 | d | 334,201 | |||||
| Federal Home Loan | ||||||||||
| Mortgage Corp | 5.00 | 6/1/37 | 635,617 | d | 650,406 | |||||
| Federal National | ||||||||||
| Mortgage Association | 4.50 | 1/1/37 | 713,298 | d | 724,241 | |||||
| Federal National | ||||||||||
| Mortgage Association | 4.50 | 3/1/38 | 695,745 | d | 706,488 | |||||
| Federal National | ||||||||||
| Mortgage Association | 4.50 | 5/1/38 | 791,070 | d | 803,206 | |||||
| Federal National | ||||||||||
| Mortgage Association | 4.50 | 3/12/39 | 1,330,000 | d,e | 1,336,650 | |||||
| Federal National | ||||||||||
| Mortgage Association | 5.00 | 1/1/34 | 630,000 | d,e | 643,289 | |||||
| Federal National | ||||||||||
| Mortgage Association | 5.00 | 1/1/37 | 699,626 | d | 715,288 | |||||
12
| Coupon | Maturity | Principal | ||||||||
| Bonds and Notes (continued) | Rate (%) | Date | Amount ($)a | Value ($) | ||||||
| United States (continued) | ||||||||||
| Federal National | ||||||||||
| Mortgage Association | 5.00 | 2/1/37 | 712,126 | d | 728,028 | |||||
| Federal National | ||||||||||
| Mortgage Association | 5.00 | 3/1/37 | 511,723 | d | 523,150 | |||||
| Federal National | ||||||||||
| Mortgage Association | 5.50 | 1/1/34 | 315,248 | d | 323,980 | |||||
| Federal National | ||||||||||
| Mortgage Association | 5.50 | 3/1/38 | 440,235 | d | 451,810 | |||||
| Federal National | ||||||||||
| Mortgage Association | 5.50 | 3/1/38 | 441,466 | d | 453,073 | |||||
| General Electric Capital, | ||||||||||
| Sr. Unscd. Notes | 5.88 | 1/14/38 | 675,000 | f | 662,999 | |||||
| Georgia Power, | ||||||||||
| Sr. Unscd. Notes | 6.00 | 11/1/13 | 135,000 | 142,052 | ||||||
| GMAC Commercial | ||||||||||
| Mortgage Securities, | ||||||||||
| Ser. 2002-C2, Cl. A2 | 5.90 | 10/15/38 | 184,425 | 178,207 | ||||||
| GMAC Commercial | ||||||||||
| Mortgage Securities, | ||||||||||
| Ser. 2003-C3, Cl. A2 | 4.22 | 4/10/40 | 105,853 | 102,192 | ||||||
| Goldman Sachs Mortgage | ||||||||||
| Securities Corporation II, | ||||||||||
| Ser. 2007-EOP, Cl. L | 3.18 | 3/20/20 | 140,000 | b,c | 84,000 | |||||
| Government National | ||||||||||
| Mortgage Association I | ||||||||||
| Ser. 2004-23, Cl. B | 2.95 | 3/16/19 | 211,822 | 210,793 | ||||||
| Ser. 2006-19, Cl. A | 3.39 | 6/16/30 | 208,471 | 208,020 | ||||||
| Ser. 2006-15, Cl. A | 3.73 | 3/16/27 | 287,164 | 287,660 | ||||||
| Ser. 2006-39, Cl. A | 3.77 | 6/16/25 | 288,864 | 289,575 | ||||||
| Ser. 2006-68, Cl. A | 3.89 | 7/16/26 | 225,991 | 226,907 | ||||||
| Ser. 2006-67, Cl. A | 3.95 | 11/16/30 | 443,180 | 445,309 | ||||||
| Ser. 2005-76, Cl. A | 3.96 | 5/16/30 | 265,084 | 266,322 | ||||||
| Ser. 2005-79, Cl. A | 4.00 | 10/16/33 | 211,029 | 212,053 | ||||||
| Ser. 2006-9, Cl. A | 4.20 | 8/16/26 | 574,994 | 579,462 | ||||||
| Ser. 2006-5, Cl. A | 4.24 | 7/16/29 | 224,956 | 227,020 | ||||||
| Ser. 2007-34, Cl. A | 4.27 | 11/16/26 | 167,029 | 168,320 | ||||||
The Fund 13
| STATEMENT OF INVESTMENTS (continued) |
| Coupon | Maturity | Principal | ||||||||||
| Bonds and Notes (continued) | Rate (%) | Date | Amount ($)a | Value ($) | ||||||||
| United States (continued) | ||||||||||||
| IBM, | ||||||||||||
| Notes | EUR | 6.63 | 1/30/14 | 350,000 | 514,293 | |||||||
| IBM, | ||||||||||||
| Notes | 8.00 | 10/15/38 | 100,000 | 133,572 | ||||||||
| Impac Secured Assets | ||||||||||||
| CMN Owner Trust, | ||||||||||||
| Ser. 2006-2, 2A1 | 1.75 | 8/25/36 | 298,826 | b | 158,776 | |||||||
| Ipalco Enterprises, | ||||||||||||
| Sr. Scd. Notes | 7.25 | 4/1/16 | 60,000 | c | 49,500 | |||||||
| JPMorgan Chase & Co., | ||||||||||||
| Sr. Unscd. Notes | EUR | 5.25 | 5/8/13 | 150,000 | 204,764 | |||||||
| JPMorgan Chase, | ||||||||||||
| Sr. Unscd. Notes | 4.75 | 5/1/13 | 225,000 | 222,237 | ||||||||
| Kentucky Power, | ||||||||||||
| Sr. Notes | 6.00 | 9/15/17 | 210,000 | c | 196,148 | |||||||
| Kraft Foods, | ||||||||||||
| Sr. Unscd. Notes | 6.88 | 2/1/38 | 115,000 | 115,280 | ||||||||
| Lamar Media, | ||||||||||||
| Gtd. Notes | 6.63 | 8/15/15 | 59,000 | 42,922 | ||||||||
| Merrill Lynch Mortgage Trust, | ||||||||||||
| Ser. 2005-CIP1, Cl. A2 | 4.96 | 8/12/10 | 200,000 | 182,617 | ||||||||
| Metropolitan Life | ||||||||||||
| Global Funding I, | ||||||||||||
| Sr. Scd. Notes | 5.13 | 4/10/13 | 100,000 | c | 93,263 | |||||||
| Michigan Tobacco Settlement | ||||||||||||
| Finance Authority, | ||||||||||||
| Settlement Asset-Backed Bonds | 7.31 | 6/1/34 | 190,000 | 110,487 | ||||||||
| Mohawk Industries, | ||||||||||||
| Sr. Unscd. Notes | 6.13 | 1/15/16 | 170,000 | 128,948 | ||||||||
| Morgan Stanley Capital I, | ||||||||||||
| Ser. 2006-IQ12, Cl. A1 | 5.26 | 12/15/43 | 103,930 | 98,122 | ||||||||
| Mosaic, | ||||||||||||
| Sr. Unscd. Notes | 7.38 | 12/1/14 | 130,000 | b,c | 106,720 | |||||||
| News America, | ||||||||||||
| Gtd. Notes | 6.15 | 3/1/37 | 210,000 | 196,565 | ||||||||
14
| Coupon | Maturity | Principal | ||||||||
| Bonds and Notes (continued) | Rate (%) | Date | Amount ($)a | Value ($) | ||||||
| United States (continued) | ||||||||||
| Nisource Finance, | ||||||||||
| Gtd. Notes | 6.40 | 3/15/18 | 120,000 | 75,002 | ||||||
| Nordic Telephone Holdings, | ||||||||||
| Sr. Scd. Bonds | 8.88 | 5/1/16 | 90,000 | c | 63,450 | |||||
| Norfolk Southern, | ||||||||||
| Sr. Unscd. Notes | 5.75 | 4/1/18 | 40,000 | 38,991 | ||||||
| NYSE Euronext, | ||||||||||
| Sr. Unscd. Notes | 4.80 | 6/28/13 | 170,000 | 165,056 | ||||||
| Occidental Petroleum, | ||||||||||
| Sr. Notes | 7.00 | 11/1/13 | 125,000 | 136,571 | ||||||
| Pacific Gas & Electric, | ||||||||||
| Sr. Unscd. Notes | 8.25 | 10/15/18 | 90,000 | 108,321 | ||||||
| Pacific Life Global Funding, | ||||||||||
| Notes | 5.15 | 4/15/13 | 155,000 | c | 145,768 | |||||
| Peabody Energy, | ||||||||||
| Gtd. Notes, Ser. B | 6.88 | 3/15/13 | 95,000 | 90,487 | ||||||
| Pepsico, | ||||||||||
| Sr. Unscd. Notes | 7.90 | 11/1/18 | 125,000 | 153,480 | ||||||
| Philip Morris International, | ||||||||||
| Sr. Unscd Notes | 5.65 | 5/16/18 | 125,000 | 124,139 | ||||||
| Philip Morris International, | ||||||||||
| Sr. Unscd. Notes | 6.88 | 3/17/14 | 415,000 | 436,593 | ||||||
| Potomac Electric Power, | ||||||||||
| Sr. Scd. Bonds | 6.50 | 11/15/37 | 150,000 | 146,887 | ||||||
| Pricoa Global Funding I, | ||||||||||
| Sr. Scd. Notes | 5.40 | 10/18/12 | 205,000 | c | 189,706 | |||||
| Prologis, | ||||||||||
| Sr. Unscd. Notes | 6.63 | 5/15/18 | 160,000 | 76,636 | ||||||
| PSEG Power, | ||||||||||
| Gtd. Notes | 7.75 | 4/15/11 | 90,000 | 89,943 | ||||||
| Qwest, | ||||||||||
| Sr. Unscd. Notes | 5.25 | 6/15/13 | 85,000 | b | 63,750 | |||||
| Reed Elsevier Capital, | ||||||||||
| Gtd. Notes | 4.63 | 6/15/12 | 320,000 | 281,757 | ||||||
The Fund 15
| STATEMENT OF INVESTMENTS (continued) |
| Coupon | Maturity | Principal | ||||||||||
| Bonds and Notes (continued) | Rate (%) | Date | Amount ($)a | Value ($) | ||||||||
| United States (continued) | ||||||||||||
| Residential Asset | ||||||||||||
| Mortgage Products, | ||||||||||||
| Ser. 2006-RS4, Cl. A2 | 1.51 | 7/25/36 | 125,000 | b | 115,784 | |||||||
| Schering-Plough, | ||||||||||||
| Sr. Unscd. Notes | EUR | 5.00 | 10/1/10 | 50,000 | 69,136 | |||||||
| Schering-Pough, | ||||||||||||
| Sr. Unscd. Notes | EUR | 5.38 | 10/1/14 | 140,000 | 181,893 | |||||||
| SLM, | ||||||||||||
| Sr. Unscd. Notes, Ser. A | 4.00 | 1/15/09 | 415,000 | 413,108 | ||||||||
| Sovereign Bancorp, | ||||||||||||
| Sr. Unscd. Notes | 1.73 | 3/23/10 | 75,000 | b | 66,615 | |||||||
| Sprint Capital, | ||||||||||||
| Gtd. Notes | 6.88 | 11/15/28 | 60,000 | 35,772 | ||||||||
| Steel Dynamics, | ||||||||||||
| Gtd. Notes | 7.38 | 11/1/12 | 60,000 | 44,100 | ||||||||
| Terex, | ||||||||||||
| Gtd. Notes | 7.38 | 1/15/14 | 105,000 | 91,875 | ||||||||
| Time Warner, | ||||||||||||
| Gtd. Notes | 2.41 | 11/13/09 | 55,000 | b | 52,950 | |||||||
| Time Warner Cable, | ||||||||||||
| Gtd. Notes | 8.75 | 2/14/19 | 350,000 | 381,215 | ||||||||
| U.S. Treasury, | ||||||||||||
| Bonds | 5.25 | 2/15/29 | 165,000 | 218,857 | ||||||||
| U.S. Treasury, | ||||||||||||
| Notes | 3.13 | 9/30/13 | 190,000 | f | 205,066 | |||||||
| Union Pacific, | ||||||||||||
| Notes | 7.88 | 1/15/19 | 125,000 | 143,058 | ||||||||
| Verizon Communications, | ||||||||||||
| Bonds | 6.90 | 4/15/38 | 45,000 | 50,806 | ||||||||
| Verizon Communications, | ||||||||||||
| Sr. Unscd. Notes | 6.10 | 4/15/18 | 30,000 | 29,944 | ||||||||
| Verizon Communications, | ||||||||||||
| Sr. Unscd. Notes | 8.75 | 11/1/18 | 100,000 | 117,523 | ||||||||
16
| Coupon | Maturity | Principal | ||||||
| Bonds and Notes (continued) | Rate (%) | Date | Amount ($)a | Value ($) | ||||
| United States (continued) | ||||||||
| Verizon Communications, | ||||||||
| Sr. Unscd. Notes | 8.95 | 3/1/39 | 100,000 | 129,568 | ||||
| Verizon Wireless, | ||||||||
| Sr. Unscd. Notes | 8.50 | 11/15/18 | 175,000 c | 205,398 | ||||
| Virginia Electric & Power, | ||||||||
| Sr. Notes | 8.88 | 11/15/38 | 165,000 | 209,456 | ||||
| Wachovia, | ||||||||
| Sr. Notes | 3.63 | 2/17/09 | 45,000 | 44,817 | ||||
| Wachovia, | ||||||||
| Sr. Unscd. Notes | 4.38 | 6/1/10 | 90,000 | 85,750 | ||||
| Wachovia Bank Commercial | ||||||||
| Mortgage Trust, | ||||||||
| Ser. 2005-C16, Cl. A2 | 4.38 | 10/15/41 | 212,762 | 201,326 | ||||
| Waste Management, | ||||||||
| Gtd. Notes | 6.88 | 5/15/09 | 100,000 | 99,544 | ||||
| Wells Fargo, | ||||||||
| Sr. Unscd. Notes | 4.38 | 1/31/13 | 225,000 | 220,526 | ||||
| Willis North America, | ||||||||
| Gtd. Notes | 6.20 | 3/28/17 | 100,000 | 69,379 | ||||
| 25,734,754 | ||||||||
| Total Bonds and Notes | ||||||||
| (cost $42,109,060) | 41,302,679 | |||||||
| Short-Term Investments—1.8% | ||||||||
| U.S. Treasury Bills | ||||||||
| 0.03%, 1/2/09 | ||||||||
| (cost $769,998) | 770,000 j | 770,000 | ||||||
| Other Investment—5.9% | Shares | Value ($) | ||||||
| Registered Investment Company; | ||||||||
| Dreyfus Institutional Preferred Plus Money Market Fund | ||||||||
| (cost $2,559,672) | 2,559,672 g | 2,559,672 | ||||||
The Fund 17
| STATEMENT OF INVESTMENTS (continued) |
| Investment of Cash Collateral | ||||
| for Securities Loaned—1.9% | Shares | Value ($) | ||
| BlackRock Cash Strategies L.L.C | 146,140 h,i | 146,140 | ||
| Registered Investment Company; | ||||
| Dreyfus Institutional Cash Advantage Fund | 654,916 g,i | 654,916 | ||
| Total Investment of Cash Collateral for Securities Loaned | ||||
| (cost $801,056) | 801,056 | |||
| Total Investments (cost $46,239,786) | 104.7% | 45,433,407 | ||
| Liabilities, Less Cash and Receivables | (4.7%) | (2,024,437) | ||
| Net Assets | 100.0% | 43,408,970 | ||
| a | Principal amount stated in U.S. Dollars unless otherwise noted. BRL—Brazilian Real CAD—Canadian Dollar EUR—Euro GBP—British Pound JPY—JapaneseYen MXN—Mexican New Peso |
| b | Variable rate security—interest rate subject to periodic change. |
| c | Securities exempt from registration under Rule 144A of the Securities Act of 1933.These securities may be resold in transactions exempt from registration, normally to qualified institutional buyers. At December 31, 2008, these securities amounted to $1,410,021 or 3.2% of net assets. |
| d | On September 7, 2008, the Federal Housing Finance Agency (FHFA) placed Federal National Mortgage Association and Federal Home Loan Mortgage Corporation into conservatorship with FHFA as the conservator. As such, the FHFA will oversee the continuing affairs of these companies. |
| e | Purchased on a delayed delivery basis. |
| f | All or a portion of these securities are on loan. At December 31, 2008, the total market value of the fund’s securities on loan is $765,532 and the total market value of the collateral held by the fund is $801,056. |
| g | Investment in affiliated money market mutual fund. |
| h | Illiquid security. At the period end, the value of this security amounted to $146,140 or 0.3% of net assets.The valuation of this security has been determined in good faith under the Board of Trustees. |
| i | Investment of security lending cash collateral. |
| j | Denotes all or part of security segregated as collateral for delayed securities, futures and swap contracts. |
| Portfolio Summary (Unaudited)† | ||||||
| Value (%) | Value (%) | |||||
| U.S. Government/Agency | 27.9 | Utilities | 2.9 | |||
| Foreign Government/Agency | 24.1 | Consumer Staples | 2.5 | |||
| Financials | 14.8 | Asset/Mortgage-Backed | 1.8 | |||
| Short-term/Money Market Investments | 9.6 | Energy | 0.7 | |||
| Industrials | 9.5 | Materials | 0.5 | |||
| Consumer Discretionary | 6.1 | Information Technology | 0.4 | |||
| Telecommunications Services | 3.9 | 104.7 | ||||
| † Based on net assets. | ||||||
| See notes to financial statements. | ||||||
18
STATEMENT OF FINANCIAL FUTURES
December 31, 2008
| Unrealized | ||||||||
| Market Value | Appreciation | |||||||
| Covered by | (Depreciation) | |||||||
| Contracts | Contracts ($) | Expiration | at 12/31/2008 ($) | |||||
| Financial Futures Short | ||||||||
| U.S. Treasury 10 Year Notes | 24 | (3,018,000) | March 2009 | (251,853) | ||||
| U.S. Treasury Long Bonds | 13 | (1,794,609) | March 2009 | (145,508) | ||||
| Financial Futures Long | ||||||||
| 10 Year Long Glit | 4 | 710,077 | March 2009 | 42,277 | ||||
| Australia 3 Year Bonds | 8 | 600,605 | March 2009 | 7,369 | ||||
| EURO—Bobl | 29 | 4,684,584 | March 2009 | 25,521 | ||||
| EURO—Bund | 19 | 3,297,136 | March 2009 | 5,752 | ||||
| EURO—Schatz | 4 | 597,554 | March 2009 | 1,603 | ||||
| U.S. Treasury 2 Year Notes | 4 | 872,250 | March 2009 | 7,741 | ||||
| U.S. Treasury 5 Year Notes | 2 | 238,109 | March 2009 | 2,036 | ||||
| (305,062) |
| See notes to financial statements. |
The Fund 19
| STATEMENT OF ASSETS AND LIABILITIES December 31, 2008 |
| Cost | Value | |||
| Assets ($): | ||||
| Investments in securities—See Statement of Investments (including | ||||
| securities on loan, valued at $765,532)—Note 1(c): | ||||
| Unaffiliated issuers | 43,025,198 | 42,218,819 | ||
| Affiliated issuers | 3,214,588 | 3,214,588 | ||
| Cash | 1,776,445 | |||
| Cash denominated in foreign currencies | 199,180 | 185,853 | ||
| Unrealized appreciation on swap contracts—Note 4 | 521,798 | |||
| Dividends and interest receivable | 499,524 | |||
| Unrealized appreciation on forward | ||||
| currency exchange contracts—Note 4 | 256,585 | |||
| Receivable for investment securities sold | 134,891 | |||
| Receivable for futures variation margin—Note 4 | 84,737 | |||
| Prepaid expenses | 3,054 | |||
| 48,896,294 | ||||
| Liabilities ($): | ||||
| Due to The Dreyfus Corporation and affiliates—Note 3(c) | 41,046 | |||
| Due to Administrator—Note 3(b) | 6,302 | |||
| Distributions payable | 2,000,000 | |||
| Payable for investment securities purchased | 2,136,841 | |||
| Liability for securities on loan—Note 1(c) | 801,056 | |||
| Unrealized depreciation on forward | ||||
| currency exchange contracts—Note 4 | 439,285 | |||
| Unrealized depreciation on swap contracts—Note 4 | 12,969 | |||
| Payable for shares of Beneficial Interest redeemed | 9,804 | |||
| Accrued expenses | 40,021 | |||
| 5,487,324 | ||||
| Net Assets ($) | 43,408,970 | |||
| Composition of Net Assets ($): | ||||
| Paid-in capital | 47,503,802 | |||
| Accumulated undistributed investment income—net | 1,144,083 | |||
| Accumulated net realized gain (loss) on investments | (4,427,968) | |||
| Accumulated net unrealized appreciation (depreciation) on investments, | ||||
| swap transactions and foreign currency transactions [including | ||||
| ($305,062) net unrealized depreciation on financial futures] | (810,947) | |||
| Net Assets ($) | 43,408,970 | |||
| Shares Outstanding | ||||
| (unlimited number of $.001 par value shares of Beneficial Interest authorized) | 2,343,037 | |||
| Net Asset Value, offering and redemption price per share ($) | 18.53 | |||
| See notes to financial statements. | ||||
20
| STATEMENT OF OPERATIONS | ||
| Year Ended December 31, 2008 | ||
| Investment Income ($): | ||
| Income: | ||
| Interest (net of $3,381 foreign taxes withheld at source): | 2,129,008 | |
| Dividends: | ||
| Unaffiliated issuers | 2,688 | |
| Affiliated issuers | 17,322 | |
| Income from securities lending | 20,901 | |
| Total Income | 2,169,919 | |
| Expenses: | ||
| Advisory fee—Note 3(a) | 168,123 | |
| Administration fee—Note 3(a) | 15,051 | |
| Professional fees | 112,773 | |
| Custodian fees—Note 3(c) | 83,319 | |
| Shareholder servicing costs—Note 3(c) | 8,426 | |
| Trustees’ fees and expenses—Note 3(d) | 3,720 | |
| Registration fees | 1,760 | |
| Administrative service fees— Note 3(b) | 1,361 | |
| Loan commitment fees—Note 2 | 491 | |
| Miscellaneous | 32,563 | |
| Total Expenses | 427,587 | |
| Less—reduction in advisory fee due to undertaking—Note 3(a) | (154,818) | |
| Less—reduction in fees due to earnings credits—Note 1(c) | (27) | |
| Net Expenses | 272,742 | |
| Investment Income—Net | 1,897,177 | |
| Realized and Unrealized Gain (Loss) on Investments—Note 4 ($): | ||
| Net realized gain (loss) on investments and foreign currency transactions | (1,042,637) | |
| Net realized gain (loss) on options written transactions | (10,254) | |
| Net realized gain (loss) on financial futures | 320,383 | |
| Net realized gain (loss) on swap transactions | 983,117 | |
| Net realized gain (loss) on forward currency exchange contracts | 2,640,399 | |
| Net Realized Gain (Loss) | 2,891,008 | |
| Net unrealized appreciation (depreciation) on investments, options | ||
| transactions, swap transactions and foreign currency transactions | ||
| [including ($209,472) net unrealized depreciation on financial futures] | (1,768,884) | |
| Net Realized and Unrealized Gain (Loss) on Investments | 1,122,124 | |
| Net Increase in Net Assets Resulting from Operations | 3,019,301 | |
| See notes to financial statements. | ||
The Fund 21
STATEMENT OF CHANGES IN NET ASSETS
| Year Ended December 31, | ||||
| 2008 | 2007 | |||
| Operations ($): | ||||
| Investment income—net | 1,897,177 | 1,833,680 | ||
| Net realized gain (loss) on investments | 2,891,008 | (267,185) | ||
| Net unrealized appreciation | ||||
| (depreciation) on investments | (1,768,884) | 144,713 | ||
| Net Increase (Decrease) in Net Assets | ||||
| Resulting from Operations | 3,019,301 | 1,711,208 | ||
| Dividends to Shareholders from ($): | ||||
| Investment income—net | (3,514,522) | (1,391,614) | ||
| Beneficial Interest Transactions ($): | ||||
| Net proceeds from shares sold | 1,999,500 | 1,458,439 | ||
| Dividends reinvested | 3,006,638 | 1,231,978 | ||
| Cost of shares redeemed | (1,934,700) | (3,837,183) | ||
| Increase (Decrease) in Net Assets from | ||||
| Beneficial Interest Transactions | 3,071,438 | (1,146,766) | ||
| Total Increase (Decrease) in Net Assets | 2,576,217 | (827,172) | ||
| Net Assets ($): | ||||
| Beginning of Period | 40,832,753 | 41,659,925 | ||
| End of Period | 43,408,970 | 40,832,753 | ||
| Accumulated (distributions in excess of) | ||||
| investment income—net | 1,144,083 | (54,167) | ||
| Capital Share Transactions (Shares): | ||||
| Shares sold | 104,148 | 77,048 | ||
| Shares issued for dividends reinvested | 161,964 | 66,120 | ||
| Shares redeemed | (102,881) | (203,625) | ||
| Net Increase (Decrease) in Shares Outstanding | 163,231 | (60,457) | ||
| See notes to financial statements. | ||||
22
FINANCIAL HIGHLIGHTS
The following table describes the performance for the fiscal periods indicated. Total return shows how much your investment in the fund would have increased (or decreased) during each period, assuming you had reinvested all dividends and distributions.These figures have been derived from the fund’s financial statements.
| Year Ended December 31, | ||||||||||
| 2008 | 2007 | 2006 | 2005 | 2004 | ||||||
| Per Share Data ($): | ||||||||||
| Net asset value, beginning of period | 18.73 | 18.60 | 18.28 | 19.64 | 20.67 | |||||
| Investment Operations: | ||||||||||
| Investment income—neta | .86 | .85 | .70 | .75 | .83 | |||||
| Net realized and unrealized | ||||||||||
| gain (loss) on investments | .53 | (.06)b | .22 | (.04) | .20 | |||||
| Total from Investment Operations | 1.39 | .79 | .92 | .71 | 1.03 | |||||
| Distributions: | ||||||||||
| Dividends from investment income—net | (1.59) | (.66) | (.60) | (2.07) | (2.06) | |||||
| Net asset value, end of period | 18.53 | 18.73 | 18.60 | 18.28 | 19.64 | |||||
| Total Return (%) | 7.50 | 4.30 | 5.09 | 3.64 | 4.98 | |||||
| Ratios/Supplemental Data (%): | ||||||||||
| Ratio of total expenses | ||||||||||
| to average net assets | 1.02 | .91 | .81 | .77 | .68 | |||||
| Ratio of net expenses | ||||||||||
| to average net assets | .65 | .65c | .65c | .65c | .65c | |||||
| Ratio of net investment income | ||||||||||
| to average net assets | 4.52 | 4.54 | 3.79 | 3.75 | 3.86 | |||||
| Portfolio Turnover Rated | 190 | 274e | 152e | 181e | 166e | |||||
| Net Assets, end of period ($ x 1,000) | 43,409 | 40,833 | 41,660 | 70,168 | 72,241 | |||||
a Based on average shares outstanding at each month end. b Amounts include litigation proceeds received by the fund of $.01 for the year ended December 31, 2007. c Includes the fund’s share of the The Standish Mellon Global Fixed Income Portfolio’s (the Portfolio) allocated expenses. d The portfolio turnover rates excluding mortgage dollar roll transactions for the periods ended December 31, 2008, 2007, 2006, 2005 and 2004 were 116%, 128%, 122%, 167% and 130%, respectively. e On October 25, 2007, the fund, which owned 100% of the Portfolio on such date, withdrew entirely from the Portfolio and received the Portfolio’s securties and cash in exchange for its interests in the Portfolio. Effective October 26, 2007, the fund began investing directly in the securities in which the Portfolio had invested. Portfolio turnover represents activity of both the fund and the Portfolio for the year.The amounts shown for 2004-2006 are ratios for the Portfolio.
See notes to financial statements.
The Fund 23
NOTES TO FINANCIAL STATEMENTS
NOTE 1—Significant Accounting Policies:
Dreyfus/Standish Global Fixed Income Fund (the “fund”) is a separate diversified series of Dreyfus Investment Funds (the“Trust”),which is registered under the Investment Company Act of 1940, as amended (the “Act”), as an open-end management investment company and operates as a series company currently offering fourteen series,including the fund. The fund’s investment objective is to seek to maximize total return while realizing a market level of income, consistent with the preservation of capital and the maintenance of liquidity. Prior to December 1, 2008, Standish Mellon Asset Management Company LLC, a wholly-owned subsidiary of The Bank of New York Mellon Corporation (“BNY Mellon”), served as the fund’s investment adviser. After December 1, 2008,The Dreyfus Corporation (the “Manager” or “Dreyfus”), a wholly-owned subsidiary of BNY Mellon,serves as the fund’s investment adviser. MBSC Securities Corporation (the “Distributor”), a wholly-owned subsidiary of the Manager, is the distributor of the fund’s shares, which are sold to the public without a sales charge.
At a meeting of the fund’s Board of Trustees held on August 27, 2008, the Board approved, effective December 1, 2008, a proposal to change the names of the Trust and the fund from “Mellon Institutional Funds Investment Trust” and “Standish Mellon Global Fixed Income Fund” to “Dreyfus Investment Funds” and “Dreyfus/Standish Global Fixed Income Fund,” respectively.
Effective July 1, 2008, BNY Mellon reorganized and consolidated a number of its banking and trust company subsidiaries.As a result of the reorganization, any services previously provided to the fund by Mellon Bank, N.A. or Mellon Trust of New England, N.A. are now provided by The Bank of NewYork Mellon (formerly,The Bank of NewYork).
The Trust accounts separately for the assets, liabilities and operations of each series. Expenses directly attributable to each series are charged to that series’ operations; expenses which are applicable to all series are allocated among them on a pro rata basis.
The fund’s financial statements are prepared in accordance with U.S. generally accepted accounting principles, which requires the use of
24
management estimates and assumptions. Actual results could differ from those estimates.
The fund enters into contracts that contain a variety of indemnifica-tions.The fund’s maximum exposure, if any, under these arrangements is unknown.The fund does not anticipate recognizing any loss related to these arrangements.
(a) Portfolio valuation: Investments in securities excluding short-term investments, financial futures, options, swap transactions and forward currency exchange contracts are valued each business day by an independent pricing service (the “Service”) approved by the Board of Trustees. Investments for which quoted bid prices are readily available and are representative of the bid side of the market in the judgment of the Service are valued at the mean between the quoted bid prices (as obtained by the Service from dealers in such securities) and asked prices (as calculated by the Service based upon its evaluation of the market for such securities). Other investments (which constitute a majority of the portfolio securities) are valued as determined by the Service, based on methods which include consideration of: yields or prices of securities of comparable quality, coupon, maturity and type; indications as to values from dealers; and general market conditions. Prior to December 2, 2008, at which time the Board of Trustees amended the funds’ valuation policies for securities not listed on an exchange or securities for which there were no reported transactions, were valued at the last quoted bid price. Fixed income securities, for which market prices were readily available, were valued at their current market value on the basis of quotations which were provided by a pricing service or dealers in such securities. This change had no material impact on the financial statements.
Restricted securities, as well as securities or other assets for which recent market quotations are not readily available, that are not valued by a pricing service approved by the Board of Trustees, or are determined by the fund not to reflect accurately fair value, are valued at fair value as determined in good faith under the direction of the Board of Trustees.The factors that may be considered when fair valuing a secu-
The Fund 25
| NOTES TO FINANCIAL STATEMENTS (continued) |
rity include fundamental analytical data, the nature and duration of restrictions on disposition, an evaluation of the forces that influence the market in which the securities are purchased and sold and public trading in similar securities of the issuer or comparable issuers. Short-term investments, are carried at amortized cost, which approximates value. Registered investment companies that are not traded on an exchange are valued at their net asset value. Financial futures and options that are traded on an exchange, are valued at the last sales price on the exchange on which such contracts are primarily traded or at the last sales price on the national securities market on each business day. Options traded over-the-counter are priced at the mean between the bid and the asked price. Investments in swap transactions are valued each business day by an independent pricing service approved by the Board of Trustees. Swaps are valued by the service by using a swap pricing model which incorporates among other factors, default probabilities, recovery rates, credit curves of the underlying issuer and swap spreads on interest rates. Investments denominated in foreign currencies are translated to U.S. dollars at the prevailing rates of exchange on the valuation date. Forward currency exchange contracts are valued at the forward rate.
Effective January 1, 2008, the fund adopted Statement of Financial Accounting Standards No. 157 “FairValue Measurements” (“FAS 157”). FAS 157 establishes an authoritative definition of fair value, sets out a framework for measuring fair value, and requires additional disclosures about fair value measurements.
Various inputs are used in determining the value of the fund’s investments relating to FAS 157.These inputs are summarized in the three broad levels listed below.
| Level 1—quoted prices in active markets for identical securities. Level 2—other significant observable inputs (including quoted prices for similar securities, interest rates, prepayment speeds, credit risk, etc.). Level 3—significant unobservable inputs (including the fund’s own assumptions in determining the fair value of investments). |
26
The inputs or methodology used for valuing securities are not necessarily an indication of the risk associated with investing in those securities.
The following is a summary of the inputs used as of December 31, 2008 in valuing the fund’s investments:
| Level 2—Other | Level 3— | |||||||
| Level 1— | Significant | Significant | ||||||
| Quoted | Observable Unobservable | |||||||
| Prices | Inputs | Inputs | Total | |||||
| Assets ($) | ||||||||
| Investment in | ||||||||
| Securities | 3,214,588 | 42,072,679 | 146,140 | 45,433,407 | ||||
| Other Financial | ||||||||
| Instruments† | 92,299 | 778,383 | — | 870,682 | ||||
| Liabilities ($) | ||||||||
| Other Financial | ||||||||
| Instruments† | (397,361) | (452,254) | — | (849,615) | ||||
| † Other financial instruments include derivative instruments, such as futures, forward currency exchange contracts and swap contracts, which are valued at the unrealized appreciation (depreciation) on the instrument and written options contracts which are shown at value. |
The following is a reconciliation of Level 3 assets for which significant unobservable inputs were used to determine fair value:
| Investments in | ||
| Securities ($) | ||
| Balance as of 12/31/2007 | 1,657,140 | |
| Realized gain (loss) | — | |
| Change in unrealized appreciation (depreciation) | — | |
| Net Purchases (sales) | (1,511,000) | |
| Transfers in and/or out of Level 3 | — | |
| Balance as of 12/31/2008 | 146,140 |
(b) Foreign currency transactions: The fund does not isolate that portion of the results of operations resulting from changes in foreign exchange rates on investments from the fluctuations arising from changes in market prices of securities held. Such fluctuations are included with the net realized and unrealized gain or loss on investments.
The Fund 27
| NOTES TO FINANCIAL STATEMENTS (continued) |
Net realized foreign exchange gains or losses arise from sales of foreign currencies, currency gains or losses realized on securities transactions and the difference between the amounts of dividends, interest, and foreign withholding taxes recorded on the fund’s books and the U.S. dollar equivalent of the amounts actually received or paid. Net unrealized foreign exchange gains and losses arise from changes in the value of assets and liabilities other than investments, resulting from changes in exchange rates. Foreign currency gains and losses on investments are included with net realized and unrealized gain or loss on investments.
(c) Securities transactions and investment income: Securities transactions are recorded on a trade date basis. Realized gains and losses from securities transactions are recorded on the identified cost basis. Dividend income is recognized on the ex-dividend date and interest income, including, where applicable, accretion of discount and amortization of premium on investments, is recognized on the accrual basis.
The fund has arrangements with the custodian and cash management bank whereby the fund may receive earnings credits when positive cash balances are maintained, which are used to offset custody and cash management fees. For financial reporting purposes, the fund includes net earnings credits as an expense offset in the Statement of Operations.
Investing in foreign markets may involve special risks and considerations not typically associated with investing in the U.S. These risks include revaluation of currencies, high rates of inflation, repatriation restrictions on income and capital, and adverse political and economic developments. Moreover, securities issued in these markets may be less liquid, subject to government ownership controls, delayed settlements, and their prices may be more volatile than those of comparable securities in the U.S.
Pursuant to a securities lending agreement with The Bank of New York Mellon, a subsidiary of BNY Mellon and an affiliate of Dreyfus, the fund may lend securities to qualified institutions. It is the fund’s policy that, at origination, all loans are secured by collateral of at least
28
102% of the value of U.S. securities loaned and 105% of the value of foreign securities loaned and that collateral equivalent to at least 100% of the market value of securities on loan is maintained at all times. Collateral is either in the form of cash, which can be invested in certain money market mutual funds managed by the Manager, U.S. Government and Agency securities or letters of credit. The fund is entitled to receive all income on securities loaned, in addition to income earned as a result of the lending transaction. Although each security loaned is fully collateralized, the fund bears the risk of delay in recovery of, or loss of rights in, the securities loaned should a borrower fail to return the securities in a timely manner. During the period ended December 31, 2008, The Bank of New York Mellon earned $8,958 from lending fund portfolio securities, pursuant to the securities lending agreement.
Until December 10, 2007, all cash collateral received by the fund and other series of the Trust in connection with the securities lending program was invested in the BlackRock Cash Strategies Fund LLC (the “BlackRock Fund”), a private investment fund not affiliated with the Trust or its investment adviser. On December 10, 2007, the BlackRock Fund announced that it was suspending investor withdrawal privileges due to conditions related to the credit markets and the adverse affect of such conditions on the liquidity of the BlackRock Fund’s portfolio holdings. Commencing on December 11, 2007, all new cash collateral received in connection with the securities lending activity of the fund and other series of the Trust was invested by the securities lending agent in the Dreyfus Institutional Cash Advantage Fund (the “Dreyfus Fund”), an affiliated money market fund registered as an investment company under the Investment Company Act of 1940, as amended.To the extent that the BlackRock Fund agreed to permit withdrawals during the period December 11, 2007 through December 31, 2008, the securities lending agent effected such withdrawals and the cash proceeds from such withdrawals by the fund were reinvested in the shares of the Dreyfus Fund. As of January 22, 2009, the final withdrawal was
The Fund 29
| NOTES TO FINANCIAL STATEMENTS (continued) |
reinvested in the shares of the Dreyfus Fund. Repayments of cash collateral during the period were made from the proceeds of redemptions of shares of the Dreyfus Fund. See Statement of Investments for further detail on the fund’s investment of cash collateral in the BlackRock Fund and the Dreyfus Fund as of December 31, 2008.
(d) Affiliated issuers: Investments in other investment companies advised by the Manager are defined as “affiliated” in the Act.
(e) Dividends to shareholders: Dividends are recorded on the ex-dividend date. Dividends from investment income-net are declared and paid quarterly. Dividends from net realized capital gains, if any, are normally declared and paid annually, but the fund may make distributions on a more frequent basis to comply with the distribution requirements of the Internal Revenue Code of 1986, as amended (the “Code”).To the extent that net realized capital gains can be offset by capital loss carryovers, it is the policy of the fund not to distribute such gains. Income and capital gain distributions are determined in accordance with income tax regulations, which may differ from U.S. generally accepted accounting principles.
On December 30, 2008, the Board ofTrustees declared a cash dividend of $.888 per share from undistributed investment income-net, payable on January 2, 2009 to shareholders of record as of the close of business on December 31, 2008 (ex-dividend date).
(f) Federal income taxes: It is the policy of the fund to continue to qualify as a regulated investment company, if such qualification is in the best interests of its shareholders, by complying with the applicable provisions of the Code, and to make distributions of taxable income sufficient to relieve it from substantially all federal income and excise taxes.
As of and during the period ended December 31, 2008, the fund did not have any liabilities for any uncertain tax positions.The fund recognizes interest and penalties, if any, related to uncertain tax positions as income tax expense in the Statement of Operations. During the period, the fund did not incur any interest or penalties.
30
Each of the tax years in the four-year period ended December 31, 2008 remains subject to examination by the Internal Revenue Service and state taxing authorities.
At December 31, 2008, the components of accumulated earnings on a tax basis were as follows: undistributed ordinary income $962,636, accumulated capital losses $4,230,252 and unrealized depreciation $861,673. In addition, the fund had $530,027 of capital losses realized after October 31, 2008, which were deferred for tax purposes to the first day of the following fiscal year.
The accumulated capital loss carryover is available for federal income tax purposes to be applied against future net securities profits, if any realized subsequent to December 31, 2008. If not applied, $408,689 of the carryover expires in fiscal 2009, $3,621,061 expires in fiscal 2010 and $200,502 expires in fiscal 2014. It’s uncertain whether the fund will be able to realize the benefits of the remaining capital loss carryovers before they expire and the remaining capital loss carryovers could be subject to future limitations imposed by the internal revenue code related to share ownership activity.
The tax character of distributions paid to shareholders during the fiscal periods ended December 31, 2008 and December 31, 2007 were as follows: ordinary income $3,514,522 and $1,391,614, respectively.
During the period ended December 31, 2008, as a result of permanent book to tax differences, primarily due to the tax treatment for pay-down gains and losses on mortgage-backed securities, foreign currency transactions and expiration of capital loss carryovers, the fund increased accumulated undistributed investment income-net by $2,815,595, decreased accumulated net realized gain (loss) on investments by $977,907 and decreased paid-in capital by $1,837,688. Net assets and net asset value per share were not affected by this reclassification.
The Fund 31
| NOTES TO FINANCIAL STATEMENTS (continued) |
NOTE 2—Bank Lines of Credit:
The Trust entered into two separate agreements with The Bank of New York Mellon, an affiliate of the Manager, that enable the fund, and other funds in the Trust, to borrow, in the aggregate, (i) up to $35 million from a committed line of credit and (ii) up to $15 million from an uncommitted line of credit. Interest is charged to each participating fund based on its borrowings at a rate equal to the federal funds effective rate plus 1 / 2of 1%.The participating funds also pay an annual fee, computed at a rate of .020 of 1% of the committed and uncommitted amounts and allocated ratably to the participating funds. In addition, a facility fee, computed at an annual rate of .060 of 1% on the committed amount, is allocated ratably among the participating funds at the end of each quarter. During the period ended December 31, 2008, the fund did not borrow under the line of credit. Loan commitment fees are shown in Statement of Operations.
NOTE 3—Advisor Fee and Other Transactions With Affiliates:
(a) Pursuant to an advisory agreement (“Agreement”) with the Manager, the advisory fee is computed at the annual rate of .40% of the value of the fund’s average daily net assets and is payable monthly. The Manager had undertaken from January 1, 2008 through December 31, 2008 to reduce the advisory fee paid by the fund, to the extent that the fund’s aggregate annual expenses, exclusive of taxes, brokerage fees, interest on borrowings, commitment fees and extraordinary expenses, exceed an annual rate of .65% of the value of the fund’s average daily net assets. The reduction in advisory fee, pursuant to the undertaking, amounted to $154,818 during the year ended December 31, 2008.
The Trust entered into an agreement with The Bank of New York Mellon, pursuant to which The Bank of NewYork Mellon provides administration and fund accounting services for the fund. For these services the fund pays The Bank of New York Mellon a fixed fee plus asset and transaction based fees, as well as out-of-pocket expenses. Pursuant to this agreement, the fund was charged $15,051
32
for the period ended December 31, 2008 for administration and fund accounting services.
The Trust has contracted BNY Mellon Shareowner Services, a wholly-owned subsidiary of The Bank of New York Mellon, to provide printing and fulfillment services for the fund. Pursuant to this agreement, the fund was charged $16,300, which is included in miscellaneous expenses in the Statement of Operations for the period ended December 31, 2008.
(b) The fund may pay administrative service fees. These fees are paid to affiliated or unaffiliated retirement plans, omnibus accounts and platform administrators and other entities (“Plan Administrators”) that provide record keeping and/or other administrative support services to accounts, retirement plans and their participants. As compensation for such services, the fund may pay each Plan Administrator an administrative service fee in an amount of up to 0.15% (on an annualized basis) of the fund’s average daily net assets attributable to fund shares that are held in accounts serviced by such Plan Administrator. For the period ended December 31, 2008, the fund was charged $1,361.The fund’s adviser or its affiliates may pay additional compensation from their own resources to Plan Administrators and other entities for administrative services, as well as in consideration of marketing or other distribution-related services. These payments may provide an incentive for these entities to actively promote the fund or cooperate with the distributor’s promotional efforts.
(c) The fund compensates Dreyfus Transfer, Inc., a wholly-owned subsidiary of the Manager, under a transfer agency agreement for providing personnel and facilities to perform transfer agency services for the fund. During the period ended December 31, 2008 the fund was charged $8,426 pursuant to the transfer agency agreement.
The fund compensates The Bank of New York Mellon under cash management agreements for performing cash management services related to fund subscriptions and redemptions. During the period
The Fund 33
| NOTES TO FINANCIAL STATEMENTS (continued) |
ended December 31, 2008, the fund was charged $27 pursuant to the cash management agreements.These fees were offset by earnings credits pursuant to the cash management agreements.
The fund compensates The Bank of New York Mellon under a custody agreements for providing custodial services for the fund. During the period ended December 31, 2008, the fund was charged $83,319 pursuant to the custody agreement.
During the period ended December 31, 2008, the fund was charged $5,403 for services performed by the Chief Compliance Officer.These charges appear under the Miscellaneous heading on the Statement of Operations.
The components of “Due to The Dreyfus Corporation and affiliates” in the Statement of Assets and Liabilities consist of: advisory fees $14,381, custodian fees $33,455, chief compliance officer fees $1,197 and transfer agency per account fees $3,871, which are offset against an expense reimbursement currently in effect in the amount of $11,858.
(d) Effective December 1, 2008, EachTrustee receives $45,000 per year, plus $6,000 for each joint Board meeting ofThe Dreyfus/Laurel Funds, Inc.,The Dreyfus /Laurel FundsTrust andThe Dreyfus/LaurelTax-Free Municipal Funds, (collectively, the “Dreyfus/Laurel Funds”) and the Trust attended, $2,000 for separate in-person committee meetings attended which are not held in conjunction with a regularly scheduled Board meeting and $1,500 for Board meetings and separate committee meetings attended that are conducted by telephone and is reimbursed for travel and out-of-pocket expenses.With respect to Board meetings, the Chairman of the Board receives an additional 25% of such compensation (with the exception of reimbursable amounts).With respect to compensation committee meetings, the Chair of the compensation committee receives $900 per meeting. In the event that there is an in-person joint committee meeting of the Dreyfus/Laurel Funds, theTrust and Dreyfus High Yield Strategies Fund, the $2,000 or $1,500 fee, as applicable, will be allocated between the Dreyfus/Laurel Funds, the Trust and Dreyfus HighYield Strategies Fund.These fees and expenses are charged and allocated to each series based on net assets.
34
(e) Prior to December 1, 2008 at which time the fee was eliminated, a 2% redemption fee was charged and retained by the fund on certain shares redeemed within thirty days following the date of issuance, subject to exceptions, including redemptions made through the use of the fund’s exchange privilege. From January 1, 2008 to November 30, 2008, there were no redemption fees charged and retained by the fund.The fund reserves the right to reimpose a redemption fee in the future.
NOTE 4—Securities Transactions:
The aggregate amount of purchases and sales (including paydowns) of investment securities, excluding short-term securities, option transactions, financial futures, forward currency exchange contracts and swap transactions, during the period ended December 31,2008, amounted to $79,871,378 and $75,214,464, respectively, of which $26,595,353 in purchases and $29,296,005 in sales were from mortgage dollar roll transactions.
A mortgage dollar roll transaction involves a sale by the fund of mortgage related securities that it holds with an agreement by the fund to repurchase similar securities at an agreed upon price and date. The securities purchased will bear the same interest rate as those sold, but generally will be collateralized by pools of mortgages with different prepayment histories than those securities sold.
The fund may invest in financial futures contracts in order to gain exposure to or protect against changes in the market.The fund is exposed to market risk as a result of changes in the value of the underlying instru-ments.These investments require initial margin deposits with a broker, which consist of cash or cash equivalents.The amount of these deposits is determined by the exchange or Board ofTrade on which the contract is traded and is subject to change. Investments in financial futures require the fund to “mark to market” on a daily basis, which reflects the change in the market value of the contract at the close of each day’s trading. Accordingly variation margin payments are received or made to reflect daily unrealized gains or losses.When the contracts are closed, the fund
The Fund 35
| NOTES TO FINANCIAL STATEMENTS (continued) |
recognizes a realized gain or loss. Contracts open at December 31, 2008 are set forth in the Statement of Financial Futures.
The fund may purchase and write (sell) put and call options in order to gain exposure to or to protect against changes in the market.
As a writer of call options, the fund receives a premium at the outset and then bears the market risk of unfavorable changes in the price of the financial instrument underlying the option. Generally, the fund would incur a gain, to the extent of the premium, if the price of the underlying financial instrument decreases between the date the option is written and the date on which the option is terminated. Generally, the fund would realize a loss, if the price of the financial instrument increases between those dates.
As a writer of put options, the fund receives a premium at the outset and then bears the market risk of unfavorable changes in the price of the financial instrument underlying the option. Generally, the fund would incur a gain, to the extent of the premium, if the price of the underlying financial instrument increases between the date the option is written and the date on which the option is terminated. Generally, the fund would realize a loss, if the price of the financial instrument decreases between those dates.
In addition, the following table summarizes the fund’s call/put options written during the period ended December 31, 2008:
| Face Amount | Options Terminated | |||||||
| Covered by | Premiums | Net Realized | ||||||
| Options Written: | Contracts ($) | Received ($) | Cost ($) | Gain (Loss) ($) | ||||
| Contracts outstanding | ||||||||
| December 31, 2007 | — | — | — | — | ||||
| Contracts written | 39,100 | 12,223 | — | — | ||||
| Contracts terminated: | ||||||||
| Closed | 21,100 | 8,343 | 22,477 | (14,134) | ||||
| Expired | 18,000 | 3,880 | — | 3,880 | ||||
| Total Contracts terminated: | 39,100 | 12,223 | 22,477 | (10,254) | ||||
| Contracts outstanding | ||||||||
| December 31, 2008 | — | — | — | — | ||||
The fund enters into forward currency exchange contracts in order to hedge its exposure to changes in foreign currency exchange rates on
36
its foreign portfolio holdings and to settle foreign currency transac-tions.When executing forward currency exchange contracts, the fund is obligated to buy or sell a foreign currency at a specified rate on a certain date in the future. With respect to sales of forward currency exchange contracts, the fund would incur a loss if the value of the contract increases between the date the forward contract is opened and the date the forward contract is closed. The fund realizes a gain if the value of the contract decreases between those dates. With respect to purchases of forward currency exchange contracts, the fund would incur a loss if the value of the contract decreases between the date the forward contract is opened and the date the forward contract is closed. The fund realizes a gain if the value of the contract increases between those dates. The fund is also exposed to credit risk associated with counterparty nonperformance on these forward currency exchange contracts which is typically limited to the unrealized gain on each open contract.The following summarizes open forward currency exchange contracts at December 31, 2008:
| Foreign | Unrealized | |||||||
| Forward Currency | Currency | Appreciation/ | ||||||
| Exchange Contracts | Amounts | Cost ($) | Value ($) (Depreciation) ($) | |||||
| Purchases: | ||||||||
| Euro, expiring 1/16/2009 | 625,000 | 828,319 | 868,102 | 39,783 | ||||
| Malaysian Ringgit, | ||||||||
| expiring 3/26/2009 | 1,320,000 | 414,118 | 380,797 | (33,321) | ||||
| Sales: | ||||||||
| Brazilian Real, | ||||||||
| expiring 1/16/2009 | 670,000 | 258,887 | 285,444 | (26,557) | ||||
| British Pounds, | ||||||||
| expiring 1/16/2009 | 1,685,000 | 2,491,593 | 2,421,380 | 70,213 | ||||
| British Pounds, | ||||||||
| expiring 1/16/2009 | 600,000 | 894,342 | 862,212 | 32,130 | ||||
| Canadian Dollar, | ||||||||
| expiring 1/16/2009 | 850,000 | 675,703 | 688,310 | (12,607) | ||||
| Euro, expiring | ||||||||
| 1/5/2009 | 530,000 | 752,666 | 736,725 | 15,941 | ||||
| Euro, expiring | ||||||||
| 1/16/2009 | 2,858,000 | 3,667,614 | 3,969,656 | (302,042) | ||||
| Euro, expiring | ||||||||
| 1/16/2009 | 220,000 | 283,307 | 305,572 | (22,265) | ||||
| Euro, expiring | ||||||||
| 1/16/2009 | 515,000 | 717,601 | 715,316 | 2,285 | ||||
The Fund 37
| NOTES TO FINANCIAL STATEMENTS (continued) |
| Foreign | Unrealized | |||||||
| Forward Currency | Currency | Appreciation/ | ||||||
| Exchange Contracts | Amounts | Cost ($) | Value ($) (Depreciation) ($) | |||||
| Sales (continued): | ||||||||
| Euro, expiring | ||||||||
| 1/16/2009 | 1,120,000 | 1,584,038 | 1,555,638 | 28,400 | ||||
| Japanese Yen, | ||||||||
| expiring 1/16/2009 | 31,980,000 | 346,007 | 352,911 | (6,904) | ||||
| Japanese Yen, | ||||||||
| expiring 1/16/2009 | 95,770,000 | 1,036,584 | 1,056,856 | (20,272) | ||||
| Japanese Yen, | ||||||||
| expiring 1/16/2009 | 26,770,000 | 289,355 | 295,416 | (6,061) | ||||
| Japanese Yen, | ||||||||
| expiring 1/16/2009 | 47,000,000 | 525,016 | 518,662 | 6,353 | ||||
| Japanese Yen, | ||||||||
| expiring 1/16/2009 | 39,900,000 | 444,543 | 440,310 | 4,233 | ||||
| Malaysian Ringgit, | ||||||||
| expiring 3/26/2009 | 1,320,000 | 422,062 | 380,796 | 41,266 | ||||
| Mexican New Peso, | ||||||||
| expiring 1/16/2009 | 8,420,000 | 620,486 | 604,505 | 15,981 | ||||
| Swedish Krona, | ||||||||
| expiring 1/16/2009 | 30,000 | 3,734 | 3,794 | (60) | ||||
| Thai Bhat, | ||||||||
| expiring 1/16/2009 | 14,070,000 | 394,339 | 403,536 | (9,196) | ||||
| Total | (182,700) | |||||||
The fund may enter into swap agreements to exchange the interest rate on, or return generated by, one nominal instrument for the return generated by another nominal instrument.
Risks may arise upon entering into these agreements from the potential inability of the counterparties to meet the terms of the agreement and are generally limited to the amount of net payments to be received, if any, at the date of default.
The fund accrues for the interim payments on swap contracts on a daily basis, with the net amount recorded within unrealized appreciation (depreciation) of swap contracts in the Statement of Assets and Liabilities. Once the interim payments are settled in cash, the net amount is recorded as realized gain (loss) on swaps, in addition to realized gain (loss) recorded upon the termination of swaps contracts in the Statement of Operations. Upfront payments made and/or received by the fund, are recorded as an asset and /or liability on the Statement
38
of Assets and Liabilities and are recorded as a realized gain or loss ratably over the contract’s term/event. Fluctuations in the value of swap contracts are recorded as a component of net change in unrealized appreciation (depreciation) on investments.
Credit default swaps involve commitments to pay a fixed interest rate in exchange for payment if a credit event affecting a third party (the referenced company) occurs. Credit events may include a failure to pay interest or principal, bankruptcy, or restructuring.The maximum pay-outs for these contracts are limited to the notional amount of each swap.The following summarizes open credit default swaps entered into by the fund at December 31, 2008:
| Unrealized | ||||||||||||||
| Notional | Reference | Buy/Sell (Pay)/Receive | Expiration | Appreciation | ||||||||||
| Amount ($) | Entity | Counterparty | Protection Fixed Rate (%) | Date | (Depreciation) ($) | |||||||||
| 320,000 | Reed Elsevier | |||||||||||||
| Capital, 4.625%, | Deutsche | |||||||||||||
| 6/15/2012 | Bank | Buy | (0.96) | 6/20/2012 | 25,110 | |||||||||
| 360,000 | Block Financial, | |||||||||||||
| 5.125%, | ||||||||||||||
| 10/30/2014 | JP Morgan | Buy | (1.90) | 9/20/2012 | (10,580) | |||||||||
| 10,000 | Block Financial, | |||||||||||||
| 5.125%, | ||||||||||||||
| 10/30/2014 | JP Morgan | Buy | (2.25) | 12/20/2012 | (455) | |||||||||
| 40,000 | Block Financial, | |||||||||||||
| 5.125%, | Morgan | |||||||||||||
| 10/30/2014 | Stanley | Buy | (2.33) | 12/20/2012 | (1,934) | |||||||||
| Total | 12,141 | |||||||||||||
The fund may enter into interest rate swaps, which involve the exchange of commitments to pay and receive interest based on a notional principal amount. The following summarizes open interest rate swaps entered into by the fund at December 31, 2008:
| Notional | Reference | (Pay)/Receive | Expiration | Unrealized | ||||||||
| Amount ($) | Entity | Counterparty | Fixed Rate (%) | Date | Appreciation($) | |||||||
| 1,225,000 | NZD—6 Month | |||||||||||
| Libor | Barclays | 7.58 | 5/1/2013 | 81,786 | ||||||||
| 1,570,000 | USD—3 Month | |||||||||||
| Libor | JP Morgan | 3.29 | 11/24/2018 | 100,442 | ||||||||
| 2,450,000 | AUD—6 Month | |||||||||||
| Libor | JP Morgan | 4.76 | 11/24/2013 | 40,068 | ||||||||
The Fund 39
| NOTES TO FINANCIAL STATEMENTS (continued) |
| Notional | Reference | (Pay)/Receive Expiration | Unrealized | |||||||
| Amount ($) | Entity | Counterparty | Fixed Rate (%) Date | Appreciation($) | ||||||
| 450,000 | GBP—6 Month | |||||||||
| Libor | JP Morgan | 5.03 | 4/4/2013 | 43,139 | ||||||
| 360,000 | GBP—6 Month | |||||||||
| Libor | JP Morgan | 6.30 | 6/18/2011 | 43,449 | ||||||
| 219,000,000 | JPY—6 Month | |||||||||
| Yenibor | JP Morgan | 1.36 | 1/19/2012 | 48,971 | ||||||
| 500,000 | NZD—3 Month | |||||||||
| Libor | JP Morgan | 8.05 | 6/21/2012 | 32,853 | ||||||
| 1,270,000 | NZD—3 Month | |||||||||
| Libor | JP Morgan | 5.54 | 11/24/2013 | 29,068 | ||||||
| 2,850,000 | NZD—3 Month | |||||||||
| Libor | JP Morgan | 7.88 | 5/18/2010 | 76,912 | ||||||
| Total | 496,688 | |||||||||
Total return swaps involve commitments to pay interest in exchange for a market-linked return based on a national amount.To the extent the total return of the security or index underlying the transaction exceeds or falls short of the offsetting interest rate obligation, the fund will receive a payment from or make a payment to the counterparty, respec-tively.At December 31, 2008, the fund had no open total return swaps.
At December 31, 2008, the cost of investments for federal income tax purposes was $46,295,080; accordingly, accumulated net unrealized depreciation on investments was $861,673,consisting of $1,804,960 gross unrealized appreciation and $2,666,633 gross unrealized depreciation.
In March 2008, the Financial Accounting Standards Board (“FASB”) released Statement of Financial Accounting Standards No. 161, “Disclosures about Derivative Instruments and Hedging Activities” (“FAS 161”). FAS 161 requires qualitative disclosures about objectives and strategies for using derivatives, quantitative disclosures about fair value amounts of gains and losses on derivative instruments, and disclosures about credit-risk-related contingent features in derivative agree-ments.The application of FAS 161 is required for fiscal years and interim periods beginning after November 15, 2008. At this time, management is evaluating the implications of FAS 161 and its impact on the financial statements and the accompanying notes has not yet been determined.
40
During September, 2008 FASB Staff Position FAS 133-1 and FASB Interpretation 45-4, Disclosures about Credit Derivatives and Certain Guarantees: An Amendment of FASB Statement No. 133 and FASB Interpretation No. 45; and Clarification of the Effective Date of FASB Statement No. 161 (“Amendment”) was issued and is effective for annual and interim reporting periods ending after November 15, 2008. The Amendment requires enhanced disclosures regarding a fund’s credit derivatives holdings and hybrid financial instruments containing embedded credit derivatives. Since the fund was not selling credit protection at the end of the period, management believes FASB 133-1 does not currently impact the financial statements and the accompanying notes.
The Fund 41
| REPORT OF INDEPENDENT REGISTERED PUBLIC ACCOUNTING FIRM |
To the Trustees of Dreyfus Investment Funds and Shareholders of Dreyfus/Standish Global Fixed Income Fund:
In our opinion, the accompanying statement of assets and liabilities, including the statements of investments and of financial futures, and the related statements of operations and of changes in net assets and the financial highlights present fairly, in all material respects, the financial position of Dreyfus/Standish Global Fixed Income Fund (formerly, Standish Mellon Global Fixed Income Fund) (the “Fund”) at December 31,2008,the results of its operations for the year then ended,the changes in its net assets for each of the two years in the period then ended and the financial highlights for each of the five years in the period then ended, in conformity with accounting principles generally accepted in the United States of America. These financial statements and financial highlights (hereafter referred to as “financial statements”) are the responsibility of the Fund’s management. Our responsibility is to express an opinion on these financial statements based on our audits.We conducted our audits of these financial statements in accordance with the standards of the Public Company Accounting Oversight Board (United States). Those standards require that we plan and perform the audit to obtain reasonable assurance about whether the financial statements are free of material misstatement. An audit includes examining, on a test basis, evidence supporting the amounts and disclosures in the financial statements, assessing the accounting principles used and significant estimates made by management, and evaluating the overall financial statement presentation.We believe that our audits, which included confirmation of securities at December 31, 2008 by correspondence with the custodian and brokers, provide a reasonable basis for our opinion.
| PricewaterhouseCoopers LLP New York, New York February 27, 2009 |
42
| FACTORS CONSIDERED BY THE BOARD IN APPROVING THE NEW INVESTMENT ADVISORY AGREEMENT (Unaudited) |
Background and Summary
The 1940 Act requires that a majority of the Board of Trustees, including a majority of the Trustees who are not affiliated with Dreyfus/Standish Global Fixed Income Fund (formerly, Standish Mellon Global Fixed Income Fund) (the “Fund”), any investment adviser to the Fund or the Trust’s principal underwriter (the “Independent Trustees”), voting separately, approve the Fund’s advisory agreement and the related fees.
At their meeting held on August 27, 2008, the Board of Trustees and Independent Trustees, by majority vote, approved a new investment advisory agreement (the “New Advisory Agreement”) effective December 1, 2008, between Dreyfus Investment Funds (formerly, Mellon Institutional Funds Investment Trust) (the “Trust”), on behalf of the Fund, and a new adviser,The Dreyfus Corporation (“Dreyfus”), with respect to the Fund.This New Advisory Agreement replaces the investment advisory agreement between the Trust, on behalf of the Fund, and Standish Mellon Asset Management Company LLC (“Standish”) (such agreement, the “Current Advisory Agreement”).As discussed below, however, it is expected that the appointment of Dreyfus under the New Advisory Agreement will not result in any actual change in the investment management services provided to the Fund, the investment professionals who provide these services, or in the fees charged to the Fund for these services.
The New Advisory Agreement and the appointment of Dreyfus as the Fund’s investment adviser were proposed to the Trustees in the context of a larger proposed rebranding and consolidation of mutual fund businesses of The Bank of New York Mellon Corporation (“BNY Mellon”). Specifically, BNY Mellon proposed to consolidate substantially all of its mutual fund businesses, including the Fund and all of the other funds comprising theTrust, under the Dreyfus name, organization and infrastructure. Dreyfus is currently BNY Mellon’s primary mutual fund business unit, with approximately $340 billion in assets under management and approximately 180 mutual fund portfolios. The appointment of Dreyfus as investment adviser to all the Funds com-
The Fund 43
| FACTORS CONSIDERED BY THE BOARD IN APPROVING THE NEW INVESTMENT ADVISORY AGREEMENT (Unaudited) (continued) |
prising the Trust consolidates the proprietary mutual fund investment management operations of two BNY Mellon advisory firms, Standish and The Boston Company Asset Management LLC, into a single BNY Mellon company, Dreyfus. Following completion of this consolidation, it is expected that the Trust and all of the Funds will be rebranded and marketed under the Dreyfus name.
In proposing the New Advisory Agreement and the appointment of Dreyfus as the Fund’s adviser, management provided the Board with written assurances that, if approved as to the Fund, this consolidation would not result in any change in the portfolio management of the Fund, the investment professionals who serve the Fund, or the fees charged for these services. Instead, the portfolio managers and research analysts who have provided services to the Fund in the past would continue to do so under the New Advisory Agreement using the same investment process they have used previously, only they would perform such services as personnel of Dreyfus, while also remaining personnel of their current firm.
Management proposed also to transfer simultaneously certain non-advisory functions and operations to corresponding units within Dreyfus and to combine certain of the Trust’s outside service provider relationships with those of the Dreyfus funds.
In connection with these changes, the current Board of Trustees also determined to recommend to shareholders of the Trust the election of six individuals, each of whom currently serves as independent trustee or director of funds managed by Dreyfus, to serve in their stead.
At the Board’s request, management provided information as to the combined financial impact of these changes on the Trust.This information indicated that the consolidation of the Trust’s Board, advisory functions, other operations of the Trust, and the service provider relationships would result in certain efficiencies and cost savings to the funds over time.
In determining to approve the New Advisory Agreement, the Board concluded, based on representations from management, that shareholders of the Fund would experience no actual change in the port-
44
folio management of the Fund as a result of the new contractual arrangement with Dreyfus and may over time experience efficiencies and cost savings. The Board noted also that the terms of the New Advisory Agreement were substantially identical to the terms of the Current Advisory Agreement between the Fund and Standish, and that the advisory fees to be paid to Dreyfus were identical to those currently paid to Standish.
The Board’s Deliberations
In determining whether to approve the New Advisory Agreement, the Independent Trustees received from Dreyfus a broad range of information in response to several written requests prepared on behalf of the Independent Trustees by their own legal counsel. The Independent Trustees met alone in private sessions with their legal counsel on several occasions, including at a special meeting devoted to these proposals on August 7, 2008, to review these materials and to discuss the New Advisory Agreement and other changes proposed by management. Representatives of management participated in portions of these sessions to provide an overview of Dreyfus’ organization, personnel, resources and strategic plans, and to respond to questions and comments arising from the Independent Trustees’ review of the materials and their delib-erations.These included discussions as to the impact on the Fund, if any, of the engagement of Dreyfus as the Fund’s investment adviser and the related consolidation of certain other operations of the Fund under the Dreyfus organization.
The information requested by the Independent Trustees and reviewed by the entire Board included:
| (i) | Financial and Economic Data: Dreyfus’ balance sheet and income statements, as well as an historical and pro forma profitability analy- sis of Dreyfus and of BNY Mellon with respect to the investment management services provided and to be provided, to the Fund, including profitability with respect to the custodian, transfer agent and securities lending services provided to the Fund by BNY |
| Mellon affiliates, as well as a separate presentation of profitability relative to that of several publicly traded investment advisers; | |
The Fund 45
| FACTORS CONSIDERED BY THE BOARD IN APPROVING THE NEW INVESTMENT ADVISORY AGREEMENT (Unaudited) (continued) |
| (ii) | Management Teams and Operations: Dreyfus’ Form ADV, as well as information concerning Dreyfus’ executive management, portfolio management, client service personnel and overall organizational structure, assets under management, insurance coverage, brokerage and soft dollar policies and practices; |
| (iii) | Comparative Performance and Fees: Analyses prepared by Lipper Analytical Services (“Lipper”) regarding the Fund’s historical per- formance, management fee, and expense ratios compared to other funds, and Dreyfus’ separate account advisory fee schedules; |
| (iv) | Specific Facts Relating to the Fund: Standish’s commentary on the Fund’s performance and any material portfolio manager and strat- egy changes that may have affected the Fund in the prior year; and |
| (v) | Other Benefits: The benefits flowing to BNY Mellon and its affili- ates in the form of fees for transfer agency, custody, administration and securities lending services provided to the Funds by affiliates of BNY Mellon. |
In considering the approval of the Fund’s New Advisory Agreement, the Board of Trustees, including the Independent Trustees, did not identify any single factor as all-important or controlling, and individual Trustees did not necessarily attribute the same weight or importance to each factor. The Trustees determined that the terms and conditions of the New Advisory Agreement and the compensation to Dreyfus provided therein were fair and reasonable in light of the services performed, expenses incurred and such other matters as the Trustees considered relevant in the exercise of their reasonable judgment.The following summary does not detail all the matters that were considered. Some of the factors that figured prominently in the Trustees’ determination are described below.
Nature, Extent and Quality of Services
The Board considered the nature, scope and quality of the overall services proposed to be provided to the Fund by Dreyfus. In their deliberations as to the approval of the New Advisory Agreement, the Trustees were also mindful of the fact that, by choosing to invest in the Fund, the
46
Fund’s shareholders have previously chosen to entrust Standish, the investment professionals of which would, under the proposal, also become associated with Dreyus to manage the portion of their assets invested in the Fund, under the supervision of the Board.
Among the specific factors the Board reviewed were the investment management, administrative, compliance and related services to be provided by Dreyfus. The Board determined that the services to be provided were of high quality and at least commensurate with industry standards. The Board also placed significant weight on assurances provided by management that there would be no material changes in the nature or quality of the services provided, including in the personnel or processes utilized in providing investment management services to the Fund as a result of the appointment of Dreyfus and that no such changes were currently contemplated by management in the future.
The Trustees reviewed the background and experience of the Fund’s portfolio managers then employed by Standish, who would become associated with Dreyfus. In previous meetings the Trustees had heard from senior management of Dreyfus an overview of its organization, personnel, resources and strategic plans. Among other things, the Trustees considered the size, education and experience of Dreyfus’ investment staff, technological infrastructure and overall responsiveness to changes in market conditions.
The Board determined that Dreyfus, using the same investment professionals and resources then supplied by Standish, had the expertise and resources to manage the Fund effectively on a day-to-day basis.
Investment Performance
The Board considered the historical investment performance of Standish in managing the Fund against a peer group of investment companies selected by Standish with input from the Trustees. The Board also compared the Fund’s investment performance against the average performance of a larger universe of funds regarded by Lipper as having similar investment objectives and considered the Fund’s perfor-
The Fund 47
| FACTORS CONSIDERED BY THE BOARD IN APPROVING THE NEW INVESTMENT ADVISORY AGREEMENT (Unaudited) (continued) |
mance rankings against that universe. In addition to the information received by the Board for the August 27, 2008 Board meeting, the Trustees had received similar detailed comparative performance information for the Fund at regular Board meetings during the year.
The Lipper materials provided to the Board at the August 27 meeting indicated that the performance of the Fund for the 1-, 3- and 5-year periods ended May 31, 2008 was 5.00%, 4.28% and 4.22%, respec-tively.The Board found that for the 1-, 3- and 5-year periods, the Fund had underperformed its peer group average returns of 8.93%, 4.81% and 5.01%, respectively.
Advisory Fee and Other Expenses
The Board considered the advisory fee rate proposed to be paid by the Fund to Dreyfus which was identical to the fee then being paid together with written assurances that no increase in the fee payable by the Fund was contemplated. The Lipper data presenting the Fund’s “net management fees” included fees paid by the Fund, as calculated by Lipper, for administrative services provided by The Bank of New York Mellon, the Trust’s custodian. Such reporting was necessary, according to Lipper, to allow the Board to compare the Fund’s advisory fees to those peers that include administrative fees within a blended advisory fee.
The Fund’s contractual advisory fee was 0.40%, in the 1st (best) quin-tile of its peer group of funds, the median fee of which was 0.61% .The Fund’s net management fee, after giving effect to expense limitations, was 0.14% (which included no administrative services fees under Lipper’s calculation methodology), well below the peer group median net management fee of 0.444% .
Based on the Lipper data, as well as other factors discussed at the August 27, 2008 Board meeting, the Board determined that the Fund’s proposed advisory fee under the New Advisory Agreement is reasonable relative to its peer group median and noted that it was identical to the advisory fee paid by the Fund under the Current Advisory Agreement.
48
The Board also compared the fees payable by the Fund relative to those payable by separate account clients of Dreyfus. Based on the additional scope and complexity of the services provided and responsibilities assumed by Dreyfus with respect to the Fund relative to these other types of clients, the Board concluded that the fees payable under the New Advisory Agreement were reasonable relative to the nature and quality of the services provided.
The Board also considered the Fund’s total expense ratio and compared it to that of its peer group of similar funds.They found that the actual net expense ratio of 0.653% (after giving effect to expense limitations) was well below the median net expense ratio of the peer group of 0.937%, notwithstanding the fact that most of the other funds in the peer group were larger than the Fund.
The Board noted that Standish had voluntarily agreed to limit its fees and/or reimburse the Fund’s expenses to the extent necessary to limit the Fund’s total expense ratio (excluding brokerage commissions, taxes, acquired fund fees and expenses and extraordinary expenses) to 0.65% and that, although this arrangement is temporary and may be changed at any time, Dreyfus had represented to the Board that no change in this voluntary expense limitation was contemplated.
Adviser’s Profitability
The Board considered Dreyfus’ projected 2008 pro forma profitability in managing the Fund and, the Mellon Institutional Funds as a group (assuming integration of the Trust’s operations with the Dreyfus Funds had already occurred), as well as the methodology used to compute such profitability, and the various direct and indirect expenses expected to be incurred by Dreyfus.The IndependentTrustees had observed that, based on the pro forma profitability information submitted to them by Dreyfus, Dreyfus expected to incur losses in managing several of the funds in the Mellon Institutional Funds family of funds. The Board compared this pro forma profitability with Standish’s actual historical
The Fund 49
| FACTORS CONSIDERED BY THE BOARD IN APPROVING THE NEW INVESTMENT ADVISORY AGREEMENT (Unaudited) (continued) |
profitability in managing the Fund and also reviewed the methodologies used in computing the pro forma and actual historical profitability. The Trustees observed that Dreyfus’ pro forma information indicated that the Fund would not have generated a profit for BNY Mellon for the twelve month period ended June 30, 2008.The Board noted that the rebranding and marketing strategies that formed a part of the plan to consolidate the Fund under the Dreyfus mutual fund organization could be expected to have a positive effect on Dreyfus’ profitability in future years, but that these effects may take time to be realized.
Economies of Scale
The Board also considered the extent to which economies of scale might be realized as the Fund grows.As in the case of profitability, the Trustees noted that the Fund’s becoming part of the Dreyfus mutual fund operations was expected to produce future economies of scale relative to its historical advisory relationship with Standish, but that these could not be projected and quantified currently.The Board concluded that, at existing asset levels and considering current asset growth projections, the implementation of fee breakpoints or other fee reductions was not necessary at this time.
Other Benefits
The Board also considered the additional benefits, based on information provided by management, flowing to BNY Mellon as a result of its relationship with the Mellon Institutional Funds as a group, including revenues received by BNY Mellon affiliates in consideration of custodial, administrative, transfer agency and securities lending services provided by such affiliates to the Funds. In each case, such affiliates had been selected by the Board on the basis of a comparative analysis of their capabilities and fees relative to those of unaffiliated competitors.
50
The Board considered the fact that Dreyfus, Standish and BNY Mellon operate businesses other than the Mellon Institutional Funds, some of which businesses share personnel, office space and other resources and that these were a component of the profitability analysis provided.The Board also considered the intangible benefits that accrue to BNY Mellon and its affiliates by virtue of their relationships with the Funds and the Mellon Institutional Funds as a group.
| * * * |
The foregoing factors were among those weighed by the Trustees in determining that the terms and conditions of the Fund’s New Advisory Agreement and the compensation proposed to be paid to Dreyfus thereunder was fair and reasonable and, thus, voted to approve the New Advisory Agreement for up to one year from its effective date.
The Fund 51
BOARD MEMBERS INFORMATION (Unaudited)

52
The Fund 53
OFFICERS OF THE FUND (Unaudited)
54
The Fund 55
NOTES
For More Information
| Ticker Symbol: SDGIX |
Telephone Call your Financial Representative or 1-800-645-6561
Mail The Dreyfus Family of Funds, 144 Glenn Curtiss Boulevard, Uniondale, NY 11556-0144 E-mail Send your request to info@dreyfus.com Internet Information can be viewed online or downloaded at: http://www.dreyfus.com
The fund files its complete schedule of portfolio holdings with the Securities and Exchange Commission (“SEC”) for the first and third quarters of each fiscal year on Form N-Q. The fund’s Forms N-Q are available on the SEC’s website at http://www.sec.gov and may be reviewed and copied at the SEC’s Public Reference Room in Washington, DC. Information on the operation of the Public Reference Room may be obtained by calling 1-800-SEC-0330.
A description of the policies and procedures that the fund uses to determine how to vote proxies relating to portfolio securities, and information regarding how the fund voted these proxies for the 12-month period ended June 30, 2008, is available at http://www.dreyfus.com and on the SEC’s website at http://www.sec.gov. The description of the policies and procedures is also available without charge, upon request, by calling 1-800-645-6561.
© 2009 MBSC Securities Corporation

| Dreyfus/Standish International Fixed Income Fund |
| ANNUAL REPORT December 31, 2008 |
The views expressed in this report reflect those of the portfolio manager only through the end of the period covered and do not necessarily represent the views of Dreyfus or any other person in the Dreyfus organization. Any such views are subject to change at any time based upon market or other conditions and Dreyfus disclaims any responsibility to update such views.These views may not be relied on as investment advice and, because investment decisions for a Dreyfus fund are based on numerous factors, may not be relied on as an indication of trading intent on behalf of any Dreyfus fund.

| Contents | ||
| THE FUND | ||
| 2 | A Letter from the CEO | |
| 3 | Discussion of Fund Performance | |
| 6 | Fund Performance | |
| 7 | Understanding Your Fund’s Expenses | |
| 7 | Comparing Your Fund’s Expenses | |
| With Those of Other Funds | ||
| 8 | Statement of Investments | |
| 16 | Statement of Financial Futures | |
| 17 | Statement of Assets and Liabilities | |
| 18 | Statement of Operations | |
| 19 | Statement of Changes in Net Assets | |
| 20 | Financial Highlights | |
| 21 | Notes to Financial Statements | |
| 39 | Report of Independent Registered | |
| Public Accounting Firm | ||
| 40 | Information About the Review | |
| and Approval of the Fund’s | ||
| Investment Advisory Agreement | ||
| 49 | Board Members Information | |
| 51 | Officers of the Fund | |
| FOR MORE INFORMATION | ||
| Back Cover | ||
| Dreyfus/Standish International Fixed Income Fund |
The Fund

A LETTER FROM THE CEO
Dear Shareholder:
We present to you this annual report for Dreyfus/Standish International Fixed Income Fund, covering the 12-month period from January 1, 2008, through December 31, 2008.
2008 was the most difficult year in decades for the financial markets. A credit crunch that began in 2007 exploded in mid-2008 into a global financial crisis, resulting in the failures of major financial institutions, a deep and prolonged recession and lower investment values across a broad range of asset classes. Governments and regulators throughout the world moved aggressively to curtail the damage, implementing unprecedented reductions of short-term interest rates, massive injections of liquidity into the banking system, government bailouts of struggling companies and plans for massive economic stimulus programs. U.S. government securities generally fared well in the ensuing “flight to quality,” but riskier bond market sectors suffered sharp price declines.
Although we expect the U.S. and global economies to remain weak until longstanding imbalances have worked their way out of the system, the financial markets currently appear to have priced in investors’ generally low expectations. In previous recessions, however, the markets have tended to anticipate economic improvement before it occurs, potentially leading to major rallies when few expected them. That’s why it makes sense to remain disciplined, maintain a long-term perspective and adopt a consistent asset allocation strategy that reflects one’s future goals and attitudes toward risk. As always, we urge you to consult with your financial advisor, who can recommend the course of action that is right for you. For information about how the fund performed during the reporting period, as well as market perspectives, we have provided a Discussion of Fund Performance given by the fund’s Portfolio Managers.
Thank you for your continued confidence and support.
| Jonathan R. Baum Chief Executive Officer The Dreyfus Corporation January 15, 2009 |
2

DISCUSSION OF FUND PERFORMANCE
For the period of January 1, 2008, through December 31, 2008, as provided by David Leduc, CFA, and Thomas Fahey, Co-Portfolio Managers
Fund and Market Performance Overview
For the 12-month period ended December 31, 2008, Dreyfus/Standish International Fixed Income Fund achieved a total return of 8.08% .1 In comparison, the J.P. Morgan Non-U.S. Government Bond Index (Hedged) (the “Index”), the fund’s benchmark, achieved a total return of 7.98% for the same period.2 Several factors accounted for our outperformance relative to the Index. We kept the fund’s duration longer than the benchmark level, which was beneficial when rates fell as the global recession worsened. Our positioning at the front end of the yield curve also helped performance, as did our currency positioning.
The Fund’s Investment Approach
The fund seeks to maximize total return while realizing a market level of income, consistent with preserving principal and liquidity, by investing primarily in a diversified portfolio of investment grade fixed income securities denominated in foreign currencies. These may include non-U.S. high-grade and medium-grade government, corporate, mortgage-backed, asset-backed, high yield and emerging market debt securities.To protect the U.S. dollar value of the fund’s assets, we hedge primarily 90% to 100% of the portfolio’s foreign currency exposure.
The fund emphasizes rotation among undervalued countries, sectors, securities and currencies. In particular, we focus on securities with the most potential for added value, i.e., those involving potential for credit upgrades and unique structural characteristics.To identify these securities, we use macroeconomic research and quantitative analysis to allocate assets among countries and currencies based on a comparative evaluation of interest and inflation rate trends, government fiscal/monetary policy, and credit quality of government debt.
Markets Withstood a Difficult Year
Following a downward trend established by the United States, most regions of the world suffered from slowing economic growth during 2008, fueling fears of a global recession. Meanwhile, a credit crunch
The Fund 3
| DISCUSSION OF FUND PERFORMANCE (continued) |
that began in the U.S. sub-prime mortgage market in 2007 developed into a global financial crisis over the past year, nearly leading to the collapse of the global banking system in September 2008. Government and regulatory authorities intervened, pumping billions of dollars into the system to restore a degree of investor confidence. These efforts included an unprecedented, coordinated reduction of short-term interest rates by major central banks.
As market conditions deteriorated, many highly leveraged institutional investors were forced to sell their more liquid investments to raise cash for margin calls. Selling pressure led to broadly lower prices even among fundamentally sound bonds. Bonds from emerging markets were particularly hard-hit, while those from developed markets fared better. Economic conditions continued to worsen at a very rapid rate over the last quarter.The issue of global decoupling was laid to rest, as Japan and Europe headed strongly into a deep recession.The rate of deterioration was surprising, as the Federal Reserve Board and Central Banks around the world stepped in to aggressively cut interest rates and shore up their financial systems.
The United Kingdom became increasingly vulnerable because of its high levels of consumer debt, overvalued housing market, and overall credit crunch. Ireland and Spain also came under growing pressure. Even Germany, which had enjoyed some measure of stability, began to show signs of stress.
In Asia, Japan faced fierce headwinds.The global recession drove down demand for its exports, as did the strengthening Yen, which made its products more expensive in foreign markets.
Our Approach to the Global Environment
The fund benefited from an emphasis on bonds from higher-quality, developed markets. In particular, the fund’s holdings of United Kingdom and New Zealand bonds fared relatively well in the flight to quality. The fund also achieved positive results from our interest rate strategies, which tended to favor bonds with maturities in the five-year range over longer-term maturities. However, we had a longer duration relative to the Index.This strategy paid off when central banks eased short-term interest rates, and shorter maturity yields declined more steeply than yields of longer-term bonds.
On the other hand, the fund’s relative performance was hampered by its holdings among investment-grade and high-yield corporate bonds,
4
which were hurt by economic and credit concerns.Although the fund held relatively few lower-rated credits, even this small allocation had a materially adverse effect on returns during the financial crisis.
Looking Ahead to Future Challenges
As of the year’s end, the global economic downturn and financial crisis have persisted. Therefore, we have maintained a cautious investment posture, including an emphasis on higher-quality, developed markets. However, we have found a number of attractively valued bonds in more speculative areas, and we may establish positions in such securities when we see evidence that the current downturn has bottomed.
Although we believe even lower economic growth is on the horizon, we are hopeful that at some point in the second half of 2009 we may begin to see signs of recovery, as the concerted efforts of world governments to help support economic growth begin to take root.That said, the continued deleveraging among global markets presents a serious headwind to that recovery.
In anticipation of economic improvement, we are increasing our allocation to corporate bonds. Because we believe default rates could still pick up this year, however, we are focusing on high-quality names.We believe they will be in the best position to benefit should a recovery take hold.
January 15, 2009
The fund may use derivative instruments, such as options, futures and options on futures, forward contracts, swaps (including credit default swaps on corporate bonds and asset-backed securities), options on swaps, and other credit derivatives.A small investment in derivatives could have a potentially large impact on the fund’s performance.The use of derivatives involves risks different from, or possibly greater than, the risks associated with investing directly in the underlying assets. Credit default swaps and similar instruments involve greater risks than if the fund had invested in the reference obligation directly, since, in addition to general market risks, they are subject to illiquidity risk, counterparty risk and credit risks.
| 1 | Total return includes reinvestment of dividends and any capital gains paid. Past performance is no guarantee of future results. Share price and investment return fluctuate such that upon redemption, fund shares may be worth more or less than their original cost. Return figure provided reflects the absorption of certain fund expenses by The Dreyfus Corporation pursuant to an undertaking in effect that may be extended, terminated or modified at any time. Had these expenses not been absorbed, the fund’s return would have been lower. |
| 2 | SOURCE: Bloomberg L.P. — Reflects reinvestment of dividends and, where applicable, capital gain distributions.The J.P. Morgan Global Government Bond Index, Excluding U.S. (Hedged) is a widely used benchmark for measuring performance and quantifying risk across international fixed-income bond markets.The Index measures the total, principal, and interest returns in each market. Index returns do not reflect fees and expenses associated with operating a mutual fund. |
The Fund 5
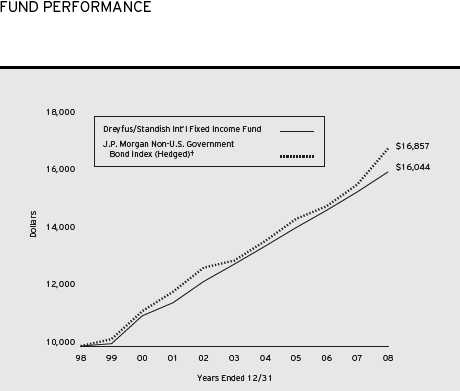
Comparison of change in value of $10,000 investment in Dreyfus/Standish International Fixed Income Fund and the J.P. Morgan Non-U.S. Government Bond Index (Hedged)
| Average Annual Total Returns as of 12/31/08 | ||||||
| 1 Year | 5 Years | 10 Years | ||||
| Fund | 8.08% | 5.25% | 5.19% |
† Source: Bloomberg L.P.
Past performance is not predictive of future performance.The fund’s performance shown in the graph and table does not reflect the deduction of taxes that a shareholder would pay on fund distributions or the redemption of fund shares. The above graph compares a $10,000 investment made in Dreyfus/Standish International Fixed Income Fund on 12/31/98 to a $10,000 investment made in the J.P. Morgan Non-U.S. Government Bond Index (Hedged) (the “Index”) on that date.All dividends and capital gain distributions are reinvested.
Effective 12/1/08,The Dreyfus Corporation became the fund’s investment adviser and the name of Mellon Institutional Funds Investment Trust was changed to Dreyfus Investment Funds.The fund’s name was changed to Dreyfus/Standish International Fixed Income Fund.
The fund’s performance shown in the line graph takes into account all applicable fees and expenses.The Index is an unmanaged broad based index of non-U.S. government bonds with maturities of one year or more that are currency-hedged into U.S. dollars. Unlike a mutual fund, the Index is not subject to charges, fees and other expenses. Investors cannot invest directly in any index.These factors can contribute to the Index potentially outperforming the fund. Further information relating to fund performance, including expense reimbursements, if applicable, is contained in the Financial Highlights section of the prospectus and elsewhere in this report.
6
UNDERSTANDING YOUR FUND’S EXPENSES (Unaudited)
As a mutual fund investor, you pay ongoing expenses, such as management fees and other expenses. Using the information below, you can estimate how these expenses affect your investment and compare them with the expenses of other funds.You also may pay one-time transaction expenses, including sales charges (loads) and redemption fees, which are not shown in this section and would have resulted in higher total expenses. For more information, see your fund’s prospectus or talk to your financial adviser.
Review your fund’s expenses
The table below shows the expenses you would have paid on a $1,000 investment in Dreyfus/Standish International Fixed Income Fund from July 1,2008 to December 31,2008. It also shows how much a $1,000 investment would be worth at the close of the period, assuming actual returns and expenses.
| Expenses and Value of a $1,000 Investment assuming actual returns for the six months ended December 31, 2008 |
| Expenses paid per $1,000† | $ 4.17 | |
| Ending value (after expenses) | $1,073.70 |
| COMPARING YOUR FUND’S EXPENSES WITH THOSE OF OTHER FUNDS (Unaudited) |
Using the SEC’s method to compare expenses
The Securities and Exchange Commission (SEC) has established guidelines to help investors assess fund expenses. Per these guidelines, the table below shows your fund’s expenses based on a $1,000 investment, assuming a hypothetical 5% annualized return. You can use this information to compare the ongoing expenses (but not transaction expenses or total cost) of investing in the fund with those of other funds.All mutual fund shareholder reports will provide this information to help you make this comparison. Please note that you cannot use this information to estimate your actual ending account balance and expenses paid during the period.
Expenses and Value of a $1,000 Investment assuming a hypothetical 5% annualized return for the six months ended December 31, 2008
| Expenses paid per $1,000† | $ 4.06 | |
| Ending value (after expenses) | $1,021.11 |
| † Expenses are equal to the fund’s annualized expense ratio of .80%, multiplied by the average account value over the period, multiplied by 184/366 (to reflect the one-half year period). |
The Fund 7
| STATEMENT OF INVESTMENTS | ||||||||||
| December 31, 2008 | ||||||||||
| Coupon | Maturity | Principal | ||||||||
| Bonds and Notes—84.5% | Rate (%) | Date | Amount ($) a | Value ($) | ||||||
| Brazil—.6% | ||||||||||
| Brazilian Government, | ||||||||||
| Unsub. Bonds | BRL | 12.50 | 1/5/16 | 800,000 | 361,063 | |||||
| Canada—2.6% | ||||||||||
| Province of Ontario Canada, | ||||||||||
| Notes | CAD | 4.50 | 12/2/12 | 1,670,000 | 1,444,736 | |||||
| Rogers Wireless, | ||||||||||
| Sr. Unscd. Notes | 7.50 | 3/15/15 | 135,000 | 133,830 | ||||||
| 1,578,566 | ||||||||||
| France—1.1% | ||||||||||
| Carrefour SA, | ||||||||||
| Sr. Unscd. Notes | EUR | 5.13 | 10/10/14 | 100,000 | 138,851 | |||||
| GDF Suez, | ||||||||||
| Sr. Unscd. Notes | EUR | 6.25 | 1/24/14 | 95,000 | 139,465 | |||||
| Societe General, | ||||||||||
| Sr. Unscd. Notes | EUR | 5.25 | 3/28/13 | 150,000 | 212,717 | |||||
| Societe Generale, | ||||||||||
| Sub. Notes | EUR | 6.13 | 8/20/18 | 150,000 | 212,388 | |||||
| 703,421 | ||||||||||
| Germany—22.8% | ||||||||||
| Bundesrepublik Deutschland, | ||||||||||
| Bonds | EUR | 3.25 | 4/9/10 | 800,000 | 1,131,526 | |||||
| Bundesrepublik Deutschland, | ||||||||||
| Bonds | EUR | 4.50 | 1/4/13 | 95,000 | 142,735 | |||||
| Bundesrepublik Deutschland, | ||||||||||
| Bonds, Ser. 06 | EUR | 4.00 | 7/4/16 | 1,030,000 | 1,543,323 | |||||
| Bundesrepublik Deutschland, | ||||||||||
| Bonds, Ser. 03 | EUR | 4.25 | 1/4/14 | 2,945,000 | 4,458,011 | |||||
| Bundesrepulbik Deutschland, | ||||||||||
| Bonds, Ser. 07 | EUR | 4.25 | 7/4/17 | 770,000 | 1,176,047 | |||||
| Bundesrepublik Deutschland, | ||||||||||
| Bonds, Ser. 05 | EUR | 5.00 | 7/4/11 | 3,640,000 | 5,435,243 | |||||
| 13,886,885 | ||||||||||
| Italy—3.1% | ||||||||||
| Atlantia, | ||||||||||
| Gtd. Notes | EUR | 4.01 | 6/9/11 | 300,000 b | 412,575 | |||||
| Buoni Poliennali del Tesoro, | ||||||||||
| Bonds | EUR | 0.95 | 9/15/10 | 668,961 | 900,958 | |||||
| Buoni Poliennali del Tesoro, | ||||||||||
| Bonds | EUR | 3.00 | 1/15/10 | 400,000 | 560,401 | |||||
| 1,873,934 | ||||||||||
8
| Coupon | Maturity | Principal | ||||||||||
| Bonds and Notes (continued) | Rate (%) | Date | Amount ($) | a | Value ($) | |||||||
| Japan—11.0% | ||||||||||||
| Development Bank of Japan, | ||||||||||||
| Gov’t Gtd. Notes | JPY | 1.05 | 6/20/23 | 34,000,000 | 335,962 | |||||||
| Development Bank of Japan, | ||||||||||||
| Gov’t Gtd. Notes | JPY | 1.70 | 9/20/22 | 263,000,000 | 2,963,832 | |||||||
| Japan Finance for | ||||||||||||
| Municipal Enterprises, | ||||||||||||
| Gov’t Gtd. Notes | JPY | 1.35 | 11/26/13 | 37,000,000 | 416,459 | |||||||
| Japan Government, | ||||||||||||
| Bonds | JPY | 1.00 | 6/10/16 | 65,000,000 | 639,456 | |||||||
| Japan Government, | ||||||||||||
| Bonds, Ser. 275 | JPY | 1.40 | 12/20/15 | 48,000,000 | 552,596 | |||||||
| Japan Government, | ||||||||||||
| Bonds, Ser. 64 | JPY | 1.90 | 9/20/23 | 155,000,000 | 1,785,393 | |||||||
| 6,693,698 | ||||||||||||
| Luxembourg—.5% | ||||||||||||
| Sogerim, | ||||||||||||
| Gtd. Notes | EUR | 7.50 | 4/20/11 | 105,000 | 144,830 | |||||||
| Telecom Italia Capital, | ||||||||||||
| Gtd. Notes | 7.00 | 6/4/18 | 195,000 | 158,448 | ||||||||
| 303,278 | ||||||||||||
| Mexico—1.3% | ||||||||||||
| Mexican Bonos, | ||||||||||||
| Bonds, Ser. M10 | MXN | 7.75 | 12/14/17 | 10,805,000 | 771,178 | |||||||
| Netherlands—8.1% | ||||||||||||
| E.ON International Finance, | ||||||||||||
| Gtd. Notes | EUR | 5.50 | 10/2/17 | 175,000 | 250,431 | |||||||
| Koninklijke KPN NV, | ||||||||||||
| Sr. Unscd. Notes | EUR | 4.75 | 1/17/17 | 75,000 | 93,116 | |||||||
| Netherlands Government, | ||||||||||||
| Bonds | EUR | 4.00 | 1/15/37 | 2,550,000 | 3,699,779 | |||||||
| Repsol International Finance, | ||||||||||||
| Gtd. Notes | EUR | 4.63 | 10/8/14 | 135,000 | 167,915 | |||||||
| Shell International Finance, | ||||||||||||
| Sr. Notes | 6.38 | 12/15/38 | 560,000 | 632,233 | ||||||||
| Telefonica Europ BV, | ||||||||||||
| Gtd. Notes | EUR | 5.13 | 2/14/13 | 75,000 | 103,165 | |||||||
| 4,946,639 | ||||||||||||
| Norway—.3% | ||||||||||||
| DNB Nor Bank, | ||||||||||||
| Sub. Notes | EUR | 4.10 | 5/30/17 | 150,000 | b | 176,824 | ||||||
The Fund 9
| STATEMENT OF INVESTMENTS (continued) |
| Coupon | Maturity | Principal | ||||||||||
| Bonds and Notes (continued) | Rate (%) | Date | Amount ($) | a | Value ($) | |||||||
| South Korea—.3% | ||||||||||||
| Export-Import Bank of Korea, | ||||||||||||
| Sr. Unscd. Notes | EUR | 5.75 | 5/22/13 | 155,000 | 183,478 | |||||||
| Spain—.6% | ||||||||||||
| Santander International, | ||||||||||||
| Gtd. Notes | EUR | 5.63 | 2/14/12 | 100,000 | 139,786 | |||||||
| Telefonica Emisiones, | ||||||||||||
| Gtd. Notes | 1.83 | 6/19/09 | 260,000 b | 251,737 | ||||||||
| 391,523 | ||||||||||||
| Supranational—2.7% | ||||||||||||
| European Investment Bank, | ||||||||||||
| Sr. Unscd. Notes | JPY | 1.40 | 6/20/17 | 97,900,000 | 1,054,777 | |||||||
| European Investment Bank, | ||||||||||||
| Sr. Unscd. Notes | JPY | 1.90 | 1/26/26 | 58,000,000 | 600,948 | |||||||
| 1,655,725 | ||||||||||||
| Sweden—2.3% | ||||||||||||
| Swedish Government, | ||||||||||||
| Bonds, Ser. 1045 | SEK | 5.25 | 3/15/11 | 10,385,000 | 1,419,344 | |||||||
| United Kingdom—4.7% | ||||||||||||
| BAT International Finance PLC, | ||||||||||||
| Gtd. Notes | EUR | 5.38 | 6/29/17 | 140,000 | 169,286 | |||||||
| BAT International Finance PLC, | ||||||||||||
| Gtd. Notes | GBP | 6.38 | 12/12/19 | 80,000 | 109,735 | |||||||
| Diageo, | ||||||||||||
| Gtd. Notes | 7.38 | 1/15/14 | 175,000 | 186,615 | ||||||||
| National Grid Gas PLC, | ||||||||||||
| Gtd. Notes | GBP | 7.00 | 12/16/24 | 75,000 | 109,436 | |||||||
| National Grid, | ||||||||||||
| Sr. Unsub. Notes | 6.30 | 8/1/16 | 105,000 | 91,624 | ||||||||
| Northern Rock, | ||||||||||||
| Sub. Notes | GBP | 5.63 | 1/13/15 | 335,000 | b | 299,344 | ||||||
| Royal Bank of Scotland, | ||||||||||||
| Sr. Unscd. Notes | EUR | 5.25 | 5/15/13 | 140,000 | 195,136 | |||||||
| SABMiller, | ||||||||||||
| Gtd. Notes | 4.18 | 7/1/09 | 105,000 | b,c | 104,707 | |||||||
| United Kingdom Gilt, | ||||||||||||
| Bonds | GBP | 4.25 | 6/7/32 | 650,000 | 983,430 | |||||||
| United Kingdom Gilt, | ||||||||||||
| Bonds | GBP | 4.25 | 3/7/36 | 390,000 | 604,285 | |||||||
| 2,853,598 | ||||||||||||
10
| Coupon | Maturity | Principal | ||||||||||
| Bonds and Notes (continued) | Rate (%) | Date | Amount ($) | a | Value ($) | |||||||
| United States—22.5% | ||||||||||||
| Appalachian Power, | ||||||||||||
| Sr. Unscd. Notes | 7.00 | 4/1/38 | 210,000 | 208,367 | ||||||||
| AT&T, | ||||||||||||
| Sr. Unscd. Notes, | EUR | 6.13 | 4/2/15 | 100,000 | 132,399 | |||||||
| AT&T, | ||||||||||||
| Sr. Unscd. Notes | 6.40 | 5/15/38 | 150,000 | 161,228 | ||||||||
| Bank of America, | ||||||||||||
| Sr. Unscd. Notes | 4.90 | 5/1/13 | 280,000 | 277,608 | ||||||||
| Block Financial, | ||||||||||||
| Gtd. Notes | 7.88 | 1/15/13 | 525,000 | 496,964 | ||||||||
| Burlington North Santa Fe, | ||||||||||||
| Sr. Unscd. Notes | 7.00 | 2/1/14 | 415,000 | 433,545 | ||||||||
| Case New Holland, | ||||||||||||
| Gtd. Notes | 7.13 | 3/1/14 | 135,000 | 96,525 | ||||||||
| Chesapeake Energy, | ||||||||||||
| Gtd. Notes | 7.50 | 9/15/13 | 130,000 | 112,450 | ||||||||
| Chevy Chase Bank, | ||||||||||||
| Sub. Notes | 6.88 | 12/1/13 | 55,000 | 44,344 | ||||||||
| Citigroup, | ||||||||||||
| Sr. Notes | EUR | 3.97 | 6/3/11 | 355,000 | b | 435,492 | ||||||
| Citigroup, | ||||||||||||
| Sr. Unscd. Notes | 5.30 | 10/17/12 | 180,000 | 173,617 | ||||||||
| Citigroup, | ||||||||||||
| Sr. Unscd. Notes | 5.50 | 4/11/13 | 280,000 | 272,886 | ||||||||
| Community Health Systems, | ||||||||||||
| Gtd. Notes | 8.88 | 7/15/15 | 125,000 | 115,625 | ||||||||
| Coventry Health Care, | ||||||||||||
| Sr. Unscd. Notes | 5.95 | 3/15/17 | 105,000 | 54,815 | ||||||||
| Davita, | ||||||||||||
| Gtd. Notes | 6.63 | 3/15/13 | 125,000 | 119,375 | ||||||||
| Delhaize Group, | ||||||||||||
| Sr. Unscd. Notes | 6.50 | 6/15/17 | 105,000 | 95,489 | ||||||||
| E.I. Dupont De Nemours, | ||||||||||||
| Notes | 5.88 | 1/15/14 | 280,000 | 288,592 | ||||||||
| Echostar DBS, | ||||||||||||
| Gtd. Notes | 7.13 | 2/1/16 | 135,000 | 113,400 | ||||||||
| Entergy Gulf State Louisiana, | ||||||||||||
| Sr. Scd. Notes | 6.00 | 5/1/18 | 160,000 | c | 139,691 | |||||||
The Fund 11
| STATEMENT OF INVESTMENTS (continued) |
| Coupon | Maturity | Principal | ||||||||||
| Bonds and Notes (continued) | Rate (%) | Date | Amount ($) a | Value ($) | ||||||||
| United States (continued) | ||||||||||||
| General Electric Capital, | ||||||||||||
| Sr. Unscd. Notes | 5.88 | 1/14/38 | 810,000 | d | 795,599 | |||||||
| Georgia Power, | ||||||||||||
| Sr. Unscd. Notes | 6.00 | 11/1/13 | 180,000 | 189,403 | ||||||||
| Government National | ||||||||||||
| Mortgage Association I | ||||||||||||
| Ser. 2004-23, Cl. B | 2.95 | 3/16/19 | 222,413 | 221,332 | ||||||||
| Ser. 2006-68, Cl. A | 3.89 | 7/16/26 | 240,115 | 241,089 | ||||||||
| Ser. 2006-67, Cl. A | 3.95 | 10/6/11 | 456,747 | 458,941 | ||||||||
| Ser. 2005-76, Cl. A | 3.96 | 5/16/30 | 283,686 | 285,011 | ||||||||
| Ser. 2005-79, Cl. A | 4.00 | 10/16/33 | 225,838 | 226,934 | ||||||||
| Ser. 2007-34, Cl. A | 4.27 | 11/16/26 | 200,434 | 201,984 | ||||||||
| GMAC Commercial | ||||||||||||
| Mortgage Securities, | ||||||||||||
| Ser. 2003-C3, Cl. A2 | 4.22 | 4/10/40 | 133,577 | 128,957 | ||||||||
| GMAC Commercial | ||||||||||||
| Mortgage Securities, | ||||||||||||
| Ser. 2002-C2, Cl. A2 | 5.39 | 10/15/38 | 230,532 | 222,759 | ||||||||
| Goldman Sachs Mortgage | ||||||||||||
| Securities Corporation II, | ||||||||||||
| Ser. 2007-EOP, Cl. L | 3.18 | 3/20/20 | 185,000 | b,c | 111,000 | |||||||
| IBM, | ||||||||||||
| Notes | EUR | 6.63 | 1/30/14 | 450,000 | 661,234 | |||||||
| IBM, | ||||||||||||
| Notes | 8.00 | 10/15/38 | 120,000 | 160,287 | ||||||||
| Ipalco Enterprises, | ||||||||||||
| Sr. Scd. Notes | 7.25 | 4/1/16 | 75,000 | c | 61,875 | |||||||
| JPMorgan Chase, | ||||||||||||
| Sr. Unscd. Notes | 4.75 | 5/1/13 | 280,000 | 276,562 | ||||||||
| Kraft Foods, | ||||||||||||
| Sr. Unscd. Notes | 6.88 | 2/1/38 | 150,000 | 150,366 | ||||||||
| Lamar Media, | ||||||||||||
| Gtd. Notes | 6.63 | 8/15/15 | 74,000 | 53,835 | ||||||||
| Merrill Lynch Mortgage Trust, | ||||||||||||
| Ser. 2005-CIP1, Cl. A2 | 4.96 | 8/12/10 | 250,000 | 228,271 | ||||||||
| Metropolitan Life Global Funding I, | ||||||||||||
| Sr. Scd. Notes | 5.13 | 4/10/13 | 200,000 | c | 186,526 | |||||||
| Morgan Stanley Capital I, | ||||||||||||
| Ser. 2006-IQ12, Cl. A1 | 5.26 | 12/15/43 | 111,098 | 104,889 | ||||||||
| Mosaic, | ||||||||||||
| Sr. Unscd. Notes | 7.38 | 12/1/14 | 160,000 | b,c | 131,348 | |||||||
12
| Coupon | Maturity | Principal | ||||||||||
| Bonds and Notes (continued) | Rate (%) | Date | Amount ($) a | Value ($) | ||||||||
| United States (continued) | ||||||||||||
| News America, | ||||||||||||
| Gtd. Notes | 6.15 | 3/1/37 | 140,000 | 131,044 | ||||||||
| NiSource Finance, | ||||||||||||
| Gtd. Notes | 2.72 | 11/23/09 | 105,000 | b | 94,630 | |||||||
| Nordic Telephone Holdings, | ||||||||||||
| Sr. Scd. Bonds | 8.88 | 5/1/16 | 135,000 | c | 95,175 | |||||||
| Norfolk Southern, | ||||||||||||
| Sr. Unscd. Notes | 5.75 | 4/1/18 | 50,000 | 48,738 | ||||||||
| NYSE Euronext, | ||||||||||||
| Sr. Unscd. Notes | 4.80 | 6/28/13 | 210,000 | 203,892 | ||||||||
| Pacific Gas & Electric, | ||||||||||||
| Sr. Unscd. Notes | 8.25 | 10/15/18 | 120,000 | 144,427 | ||||||||
| Pacific Life Global Funding, | ||||||||||||
| Notes | 5.15 | 4/15/13 | 195,000 | c | 183,386 | |||||||
| Peabody Energy, | ||||||||||||
| Gtd. Notes, Ser. B | 6.88 | 3/15/13 | 120,000 | 114,300 | ||||||||
| Pepsico, | ||||||||||||
| Sr. Unscd. Notes | 7.90 | 11/1/18 | 160,000 | 196,454 | ||||||||
| Philip Morris International, | ||||||||||||
| Sr. Unscd Notes | 5.65 | 5/16/18 | 150,000 | 148,967 | ||||||||
| Philip Morris International, | ||||||||||||
| Sr. Unscd. Notes | 6.88 | 3/17/14 | 545,000 | 573,357 | ||||||||
| Pricoa Global Funding I, | ||||||||||||
| Sr. Scd. Notes | 5.40 | 10/18/12 | 315,000 | c | 291,500 | |||||||
| Prologis, | ||||||||||||
| Sr. Unscd. Notes | 6.63 | 6/15/18 | 70,000 | 33,528 | ||||||||
| Qwest, | ||||||||||||
| Sr. Unscd. Notes | 5.25 | 6/15/13 | 90,000 | b | 67,500 | |||||||
| Reed Elsevier Capital, | ||||||||||||
| Gtd. Notes | 4.63 | 6/15/12 | 405,000 | 356,598 | ||||||||
| Residential Asset | ||||||||||||
| Mortgage Products, | ||||||||||||
| Ser. 2006-RS4, Cl. A2 | 1.51 | 7/25/36 | 125,000 | b | 115,784 | |||||||
| Schering-Plough, | ||||||||||||
| Sr. Unscd. Notes | EUR | 5.00 | 10/1/10 | 85,000 | 117,531 | |||||||
| Schering-Pough, | ||||||||||||
| Sr. Unscd. Notes | EUR | 5.38 | 10/1/14 | 200,000 | 259,847 | |||||||
| Sovereign Bancorp, | ||||||||||||
| Sr. Unscd. Notes | 1.73 | 3/23/10 | 105,000 | b | 93,261 | |||||||
The Fund 13
| STATEMENT OF INVESTMENTS (continued) |
| Coupon | Maturity | Principal | ||||||
| Bonds and Notes (continued) | Rate (%) | Date | Amount ($) a | Value ($) | ||||
| United States (continued) | ||||||||
| Sprint Capital, | ||||||||
| Gtd. Notes | 6.88 | 11/15/28 | 75,000 | 44,716 | ||||
| Steel Dynamics, | ||||||||
| Gtd. Notes | 7.38 | 11/1/12 | 80,000 | 58,800 | ||||
| Terex, | ||||||||
| Gtd. Notes | 7.38 | 1/15/14 | 130,000 | 113,750 | ||||
| U.S. Treasury, | ||||||||
| Notes | 3.13 | 9/30/13 | 120,000 | 129,516 | ||||
| Union Pacific, | ||||||||
| Notes | 7.88 | 1/15/19 | 150,000 | 171,669 | ||||
| Verizon Communications, | ||||||||
| Sr. Unscd. Notes | 6.10 | 4/15/18 | 40,000 | 39,926 | ||||
| Verizon Communications, | ||||||||
| Bonds | 6.90 | 4/15/38 | 50,000 | 56,451 | ||||
| Wachovia, | ||||||||
| Sr. Unscd. Notes | 4.38 | 6/1/10 | 110,000 | 104,805 | ||||
| Wachovia Bank Commercial | ||||||||
| Mortgage Trust, | ||||||||
| Ser. 2005-C16, Cl. A2 | 4.38 | 10/15/41 | 263,051 | 248,912 | ||||
| Wachovia Mortgage FSB, | ||||||||
| Sr. Unscd. Notes | 4.13 | 12/15/09 | 250,000 | 244,600 | ||||
| Wells Fargo, | ||||||||
| Sr. Unscd. Notes | 4.38 | 1/31/13 | 280,000 | 274,432 | ||||
| Willis North America, | ||||||||
| Gtd. Notes | 6.20 | 3/28/17 | 125,000 | 86,724 | ||||
| 13,714,834 | ||||||||
| Total Bonds and Notes | ||||||||
| (cost $49,962,512) | 51,513,988 | |||||||
| Short-Term Investments—3.2% | ||||||||
| U.S. Treasury Bills | ||||||||
| 0.03%, 1/2/09 | ||||||||
| (cost $1,934,997) | 1,935,000 h | 1,935,000 | ||||||
| Other Investment—9.3% | Shares | Value ($) | ||||||
| Registered Investment Company; | ||||||||
| Dreyfus Institutional Preferred Plus Money Market Fund | ||||||||
| (cost $5,694,807) | 5,694,807 f | 5,694,807 | ||||||
14
| Investment of Cash Collateral | ||||
| for Securities Loaned—.7% | Shares | Value ($) | ||
| BlackRock Cash Strategies L.L.C | 64,706 e,g | 64,706 | ||
| Registered Investment Company; | ||||
| Dreyfus Institutional Cash Advantage Fund | 347,294 f,g | 347,294 | ||
| Total Investment of Cash Collateral | ||||
| for Securities Loaned | ||||
| (cost $412,000) | 412,000 | |||
| Total Investments (cost $58,004,316) | 97.7% | 59,555,795 | ||
| Cash and Receivables (Net) | 2.3% | 1,388,830 | ||
| Net Assets | 100.0% | 60,944,625 | ||
| a | Principal amount stated in U.S. Dollars unless otherwise noted: BRL—Brazilian Real CAD—Canadian Dollar EUR—Euro GBP—British Pound JPY—JapaneseYen MXN—Mexican New Peso SEK—Swedish Krona |
| b | Variable rate security—interest rate subject to periodic change. |
| c | Securities exempt from registration under Rule 144A of the Securities Act of 1933.These securities may be resold in transactions exempt from registration, normally to qualified institutional buyers.At December 31, 2008, these securities amounted to $1,305,208 or 2.1% of net assets. |
| d | All or a portion of these securities are on loan.At December 31, 2008, the total market value of the fund’s securities on loan is $392,888 and the total market value of the collateral held by the fund is $412,000 |
| e | Illiquid security.At the period end, the value of these securities amounted to $64,706 or 0.1% of net assets.The valuation of this secuity has been determined in good faith under the Board of Trustees. |
| f | Investment in affiliated money market mutual fund. |
| g | Investment of security lending cash collateral. |
| h | Denotes all or part of security segregated as collateral for delayed securities, futures and swap contracts. |
| Portfolio Summary (Unaudited)† | ||||||
| Value (%) | Value (%) | |||||
| Foreign Government/Agency | 46.0 | Telecommunications Services | 1.4 | |||
| Financials | 18.2 | Consumer Discretionary | 0.8 | |||
| Short-term/Money Market Investments | 13.2 | Industrials | 0.7 | |||
| Asset/Mortgage-Backed | 4.6 | Others | 0.6 | |||
| Information Technology | 2.9 | Health Care | 0.5 | |||
| Consumer Staples | 2.6 | Materials | 0.5 | |||
| Utilities | 2.2 | U.S. Government/Agency | 0.2 | |||
| Transportation | 1.7 | |||||
| Energy | 1.6 | 97.7 | ||||
| † Based on net assets. | ||||||
| See notes to financial statements. | ||||||
The Fund 15
| STATEMENT OF FINANCIAL FUTURES December 31, 2008 |
| Unrealized | ||||||||
| Market Value | Appreciation | |||||||
| Covered by | (Depreciation) | |||||||
| Contracts | Contracts ($) | Expiration | at 12/31/2008 ($) | |||||
| Financial Futures Long | ||||||||
| 10 Year Long Gilt | 5 | 887,597 | March 2009 | 52,841 | ||||
| Australia Treasury 3 Year Notes | 18 | 1,351,361 | March 2009 | 16,581 | ||||
| Euro—Bobl | 31 | 5,007,659 | March 2009 | 25,382 | ||||
| Euro—Schatz | 28 | 4,182,875 | March 2009 | 11,221 | ||||
| U.S. Treasury 5 Year Notes | 45 | 5,357,461 | March 2009 | 141,739 | ||||
| Financial Futures Short | ||||||||
| U.S. Treasury 2 Year Notes | 20 | (4,361,250) | March 2009 | (38,563) | ||||
| U.S. Treasury 10 Year Notes | 22 | (2,766,500) | March 2009 | (231,668) | ||||
| U.S. Long Bond | 38 | (5,245,781) | March 2009 | (469,043) | ||||
| (491,510) | ||||||||
| See notes to financial statements. |
16
| STATEMENT OF ASSETS AND LIABILITIES December 31, 2008 |
| Cost | Value | |||
| Assets ($): | ||||
| Investments in securities—See Statement of Investments (including | ||||
| securities on loan, valued at $392,888)—Note 1(c): | ||||
| Unaffiliated issuers | 51,962,215 | 53,513,694 | ||
| Affiliated issuers | 6,042,101 | 6,042,101 | ||
| Cash | 2,183,516 | |||
| Cash denominated in foreign currencies | 105,619 | 100,345 | ||
| Receivable for investment securities sold | 3,883,982 | |||
| Unrealized appreciation on swap contracts—Note 4 | 1,503,514 | |||
| Dividends and interest receivable | 930,810 | |||
| Receivable for shares of Beneficial Interest subscribed | 697,275 | |||
| Unrealized appreciation on forward currency | ||||
| exchange contracts—Note 4 | 347,324 | |||
| Receivable from broker for swap transactions—Note 4 | 262,142 | |||
| Receivable for futures variation margin—Note 4 | 147,457 | |||
| Prepaid expenses | 8,826 | |||
| 69,620,986 | ||||
| Liabilities ($): | ||||
| Due to The Dreyfus Corporation and affiliates—Note 3(c) | 61,036 | |||
| Payable for investment securities purchased | 4,346,433 | |||
| Distributions payable | 2,000,000 | |||
| Unrealized depreciation on forward currency | ||||
| exchange contracts—Note 4 | 1,635,335 | |||
| Liability for securities on loan—Note 1(c) | 412,000 | |||
| Payable for shares of Beneficial Interest redeemed | 110,771 | |||
| Unrealized depreciation on swap contracts—Note 4 | 32,688 | |||
| Accrued expenses | 78,098 | |||
| 8,676,361 | ||||
| Net Assets ($) | 60,944,625 | |||
| Composition of Net Assets ($): | ||||
| Paid-in capital | 60,247,417 | |||
| Accumulated undistributions Investment income—net | 5,018,818 | |||
| Accumulated net realized gain (loss) on investments | (5,557,191) | |||
| options transactions, swap transactions and foreign currency transactions | ||||
| [including ($491,510) net unrealized (depreciation) on financial futures] | 1,235,581 | |||
| Net Assets ($) | 60,944,625 | |||
| Shares Outstanding | ||||
| (unlimited number of $.01 par value shares of Beneficial Interest authorized) | 3,216,355 | |||
| Net Asset Value, offering and redemption price per share ($) | 18.95 | |||
| See notes to financial statements. | ||||
The Fund 17
| STATEMENT OF OPERATIONS Year Ended December 31, 2008 |
| Investment Income ($): | ||
| Income: | ||
| Interest (net of $4,644 foreign taxes withheld at source) | 4,033,253 | |
| Cash dividends; | ||
| Affiliated issuers | 39,733 | |
| Income from securities lending | 30,302 | |
| Total Income | 4,103,288 | |
| Expenses: | ||
| Advisory fee—Note 3(a) | 357,227 | |
| Administration fee—Note 3(a) | 14,917 | |
| Custodian fees—Note 3(c) | 101,370 | |
| Professional fees | 118,750 | |
| Administrative service fees—Note 3(b) | 30,859 | |
| Trustees’ fees and expenses—Note 3(d) | 20,566 | |
| Registration fees | 19,592 | |
| Shareholder servicing costs—Note 3(c) | 12,868 | |
| Loan commitment fees—Note 2 | 1,863 | |
| Miscellaneous | 30,824 | |
| Total Expenses | 708,836 | |
| Less—reduction in advisory fee | ||
| due to undertaking—Note 3(a) | (17,229) | |
| Less—reduction in fees due to earnings credits—Note 1(c) | (409) | |
| Net Expenses | 691,198 | |
| Investment Income—Net | 3,412,090 | |
| Realized and Unrealized Gain (Loss) on Investments—Note 4 ($): | ||
| Net realized gain (loss) on investments and foreign currency transactions | (851,942) | |
| Net realized gain (loss) on options written transactions | (21,813) | |
| Net realized gain (loss) on financial futures | (183,388) | |
| Net realized gain (loss) on swap transactions | 2,343,446 | |
| Net realized gain (loss) on forward currency exchange contracts | 5,943,573 | |
| Net Realized Gain (Loss) | 7,229,876 | |
| Net change in unrealized appreciation (depreciation) on investments, options | ||
| trasactions, swap transactions and foreign currency transactions | ||
| [including ($240,772) net unrealized (depreciation) on financial futures] | (3,632,115) | |
| Net Realized and Unrealized Gain (Loss) on Investments | 3,597,761 | |
| Net Increase in Net Assets Resulting from Operations | 7,009,851 | |
| See notes to financial statements. | ||
18
STATEMENT OF CHANGES IN NET ASSETS
| Year Ended December 31, | ||||
| 2008 | 2007 | |||
| Operations ($): | ||||
| Investment income—net | 3,412,090 | 3,681,667 | ||
| Net realized gain (loss) on investments | 7,229,876 | (1,700,036) | ||
| Net change in unrealized appreciation | ||||
| (depreciation) on investments | (3,632,115) | 2,291,751 | ||
| Net Increase (Decrease) in Net Assets | ||||
| Resulting from Operations | 7,009,851 | 4,273,382 | ||
| Dividends to Shareholders from ($): | ||||
| Investment income—net | (4,312,893) | (1,884,405) | ||
| Beneficial Interest Transactions ($): | ||||
| Net proceeds from shares sold | 29,147,476 | 35,367,635 | ||
| Dividends reinvested | 3,819,217 | 1,735,508 | ||
| Cost of shares redeemed | (74,595,538)a | (32,960,098) | ||
| Increase (Decrease) in Net Assets | ||||
| from Beneficial Interest Transactions | (41,628,845) | 4,143,045 | ||
| Total Increase (Decrease) in Net Assets | (38,931,887) | 6,532,022 | ||
| Net Assets ($): | ||||
| Beginning of Period | 99,876,512 | 93,344,490 | ||
| End of Period | 60,944,625 | 99,876,512 | ||
| Accumulated (distributions in excess of) | ||||
| investment income—net | 5,018,818 | (168,544) | ||
| Capital Share Transactions (Shares): | ||||
| Shares sold | 1,538,887 | 1,931,769 | ||
| Shares issued for dividends reinvested | 203,271 | 93,535 | ||
| Shares redeemed | (3,905,356) | (1,792,271) | ||
| Net Increase (Decrease) in Shares Outstanding | (2,163,198) | 233,033 | ||
| a Includes redemption-in-kind amounting to $25,283,970. | ||||
| See notes to financial statements. | ||||
The Fund 19
FINANCIAL HIGHLIGHTS
The following table describes the performance for the fiscal periods indicated. Total return shows how much your investment in the fund would have increased (or decreased) during each period, assuming you had reinvested all dividends and distributions.These figures have been derived from the fund’s financial statements.
| Year Ended December 31, | ||||||||||
| 2008 | 2007 | 2006 | 2005 | 2004 | ||||||
| Per Share Data ($): | ||||||||||
| Net asset value, beginning of period | 18.57 | 18.14 | 17.55 | 21.35 | 21.02 | |||||
| Investment Operations: | ||||||||||
| Investment income—neta | .72 | .69 | .53 | .75 | .75 | |||||
| Net realized and unrealized | ||||||||||
| gain (loss) on investments | .75 | .10 | .21 | .23 | .27 | |||||
| Total from Investment Operations | 1.47 | .79 | .74 | .98 | 1.02 | |||||
| Distributions: | ||||||||||
| Dividends from investment income—net | (1.09) | (.36) | (.15) | (4.78) | (.69) | |||||
| Net asset value, end of period | 18.95 | 18.57 | 18.14 | 17.55 | 21.35 | |||||
| Total Return (%) | 8.08 | 4.35 | 4.27 | 4.72 | 4.90 | |||||
| Ratios/Supplemental Data (%): | ||||||||||
| Ratio of total expenses | ||||||||||
| to average net assets | .80 | .70 | .68 | .58 | .57 | |||||
| Ratio of net expenses | ||||||||||
| to average net assets | .78 | .70 | .68 | .58 | .57 | |||||
| Ratio of net investment income | ||||||||||
| to average net assets | 3.84 | 3.73 | 3.01 | 3.49 | 3.43 | |||||
| Portfolio Turnover Rate | 158b | 168b | 89 | 168 | 170 | |||||
| Net Assets, end of period ($ x 1,000) | 60,945 | 99,877 | 93,344 | 122,721 | 302,406 | |||||
| a Based on average shares outstanding at each month end. b The portfolio turnover rates excluding mortgage dollar roll transactions for the periods ended December 31, 2008 and 2007 were 144% and 140%, respectively. See notes to financial statements. |
20
NOTES TO FINANCIAL STATEMENTS
NOTE 1—Significant Accounting Policies:
Dreyfus/Standish International Fixed Income Fund (the “fund”) is a separate diversified series of Dreyfus Investment Funds (the “Trust”), which is registered under the Investment Company Act of 1940, as amended (the “Act”), as an open-end management investment company and operates as a series company currently offering fourteen series, including the fund.The fund’s investment objective is to seek to maximize total return while realizing a market level of income, consistent with the preservation of capital and the maintenance of liquidity. Prior to December 1, 2008, Standish Mellon Asset Management Company LLC, a wholly-owned subsidiary of The Bank of New York Mellon Corporation (“BNY Mellon”), served as the fund’s investment adviser. After December 1, 2008, The Dreyfus Corporation (the “Manager” or “Dreyfus”), a wholly-owned subsidiary of BNY Mellon, serves as the fund’s investment adviser. MBSC Securities Corporation (the “Distributor”), a wholly-owned subsidiary of the Manager, is the distributor of the fund’s shares, which are sold to the public without a sales charge.
At a meeting of the fund’s Board of Trustees held on August 27, 2008, the Board approved, effective December 1, 2008, a proposal to change the names of the Trust and the fund from “Mellon Institutional Funds Investment Trust” and “Standish Mellon International Fixed Income Fund” to “Dreyfus Investment Funds” and “Dreyfus/Standish International Fixed Income Fund,” respectively.
Effective July 1, 2008, BNY Mellon reorganized and consolidated a number of its banking and trust company subsidiaries.As a result of the reorganization, any services previously provided to the fund by Mellon Bank, N.A. or Mellon Trust of New England, N.A. are now provided by The Bank of NewYork Mellon (formerly,The Bank of NewYork).
The Trust accounts separately for the assets, liabilities and operations of each series. Expenses directly attributable to each series are charged to that series’ operations; expenses which are applicable to all series are allocated among them on a pro rata basis.
The Fund 21
| NOTES TO FINANCIAL STATEMENTS (continued) |
The fund’s financial statements are prepared in accordance with U.S. generally accepted accounting principles, which requires the use of management estimates and assumptions. Actual results could differ from those estimates.
The fund enters into contracts that contain a variety of indemnifica-tions.The fund’s maximum exposure, if any, under these arrangements is unknown.The fund does not anticipate recognizing any loss related to these arrangements.
(a) Portfolio valuation: Investments in securities excluding short-term investments, financial futures, options, swap transactions and forward currency exchange contracts are valued each business day by an independent pricing service (the “Service”) approved by the Board of Trustees. Investments for which quoted bid prices are readily available and are representative of the bid side of the market in the judgment of the Service are valued at the mean between the quoted bid prices (as obtained by the Service from dealers in such securities) and asked prices (as calculated by the Service based upon its evaluation of the market for such securities). Other investments (which constitute a majority of the portfolio securities) are valued as determined by the Service, based on methods which include consideration of:yields or prices of securities of comparable quality, coupon, maturity and type; indications as to values from dealers; and general market conditions. Prior to December 2, 2008, at which time the Board of Trustees amended the funds’ valuation policies for securities not listed on an exchange or securities for which there were no reported transactions, were valued at the last quoted bid price. Fixed income securities, for which market prices were readily available, were valued at their current market value on the basis of quotations which were provided by a pricing service or dealers in such securities.This change had no material impact on the financial statements.
Restricted securities, as well as securities or other assets for which recent market quotations are not readily available, that are not valued by a pricing service approved by the Board of Trustees, or are determined by the fund not to reflect accurately fair value, are valued at fair value as determined in good faith under the direction of the Board of Trustees.The
22
factors that may be considered when fair valuing a security include fundamental analytical data, the nature and duration of restrictions on disposition, an evaluation of the forces that influence the market in which the securities are purchased and sold and public trading in similar securities of the issuer or comparable issuers. Short-term investments are carried at amortized cost, which approximates value. Registered investment companies that are not traded on an exchange are valued at their net asset value. Financial futures and options that are traded on an exchange, are valued at the last sales price on the exchange on which such contracts are primarily traded or at the last sales price on the national securities market on each business day. Options traded over-the-counter are priced at the mean between the bid and the asked price. Investments in swap transactions are valued each business day by an independent pricing service approved by the Board of Trustees. Swaps are valued by the service by using a swap pricing model which incorporates among other factors, default probabilities, recovery rates, credit curves of the underlying issuer and swap spreads on interest rates. Investments denominated in foreign currencies are translated to U.S. dollars at the prevailing rates of exchange on the valuation date. Forward currency exchange contracts are valued at the forward rate.
Effective January 1, 2008, the fund adopted Statement of Financial Accounting Standards No. 157 “FairValue Measurements” (“FAS 157”). FAS 157 establishes an authoritative definition of fair value, sets out a framework for measuring fair value, and requires additional disclosures about fair value measurements.
Various inputs are used in determining the value of the fund’s investments relating to FAS 157.These inputs are summarized in the three broad levels listed below.
| Level 1—quoted prices in active markets for identical securities. Level 2—other significant observable inputs (including quoted prices for similar securities, interest rates, prepayment speeds, credit risk, etc.). Level 3—significant unobservable inputs (including the fund’s own assumptions in determining the fair value of investments). |
The Fund 23
| NOTES TO FINANCIAL STATEMENTS (continued) |
The inputs or methodology used for valuing securities are not necessarily an indication of the risk associated with investing in those securities.
The following is a summary of the inputs used as of December 31, 2008 in valuing the fund’s investments:
| Level 2—Other | Level 3— | |||||||
| Level 1— | Significant | Significant | ||||||
| Quoted | Observable Unobservable | |||||||
| Prices | Inputs | Inputs | Total | |||||
| Assets ($) | ||||||||
| Investment in | ||||||||
| Securities | 6,042,101 | 53,448,988 | 64,706 | 59,555,795 | ||||
| Other Financial | ||||||||
| Instruments† | 247,764 | 1,850,838 | — | 2,098,602 | ||||
| Liabilities ($) | ||||||||
| Other Financial | ||||||||
| Instruments† | (739,274) | (1,668,023) | — | (2,407,297) | ||||
| † Other financial instruments include derivative instruments such as futures, forward currency exchange contracts and swap contracts, which are valued at the unrealized appreciation (depreciation) on the instrument and written options contracts which are shown at value. |
The following is a reconciliation of the change in value of Level 3 assets (for which significant unobservable inputs were used to determine fair value):
| Investments in | ||
| Securities ($) | ||
| Balance as of 12/31/2007 | 733,732 | |
| Realized gain (loss) | — | |
| Change in unrealized appreciation (depreciation) | — | |
| Net Purchases (Sales) | (669,026) | |
| Transfers in and/or out of Level 3 | — | |
| Balance as of 12/31/2008 | 64,706 |
(b) Foreign currency transactions: The fund does not isolate that portion of the results of operations resulting from changes in foreign exchange rates on investments from the fluctuations arising from changes in market prices of securities held. Such fluctuations are included with the net realized and unrealized gain or loss on investments.
Net realized foreign exchange gains or losses arise from sales of foreign currencies, currency gains or losses realized on securities transactions
24
and the difference between the amounts of dividends, interest, and foreign withholding taxes recorded on the fund’s books and the U.S. dollar equivalent of the amounts actually received or paid. Net unrealized foreign exchange gains and losses arise from changes in the value of assets and liabilities other than investments, resulting from changes in exchange rates. Foreign currency gains and losses on investments are included with net realized and unrealized gain or loss on investments.
(c) Securities transactions and investment income: Securities transactions are recorded on a trade date basis. Realized gains and losses from securities transactions are recorded on the identified cost basis. Dividend income is recognized on the ex-dividend date and interest income, including, where applicable, accretion of discount and amortization of premium on investments, is recognized on the accrual basis.
The fund has arrangements with the custodian and cash management bank whereby the fund may receive earnings credits when positive cash balances are maintained, which are used to offset custody and cash management fees. For financial reporting purposes, the fund includes net earnings credits as an expense offset in the Statement of Operations.
Investing in foreign markets may involve special risks and considerations not typically associated with investing in the U.S. These risks include revaluation of currencies, high rates of inflation, repatriation restrictions on income and capital, and adverse political and economic developments. Moreover, securities issued in these markets may be less liquid, subject to government ownership controls, delayed settlements, and their prices may be more volatile than those of comparable securities in the U.S.
Pursuant to a securities lending agreement with The Bank of New York Mellon, a subsidiary of BNY Mellon and an affiliate of Dreyfus, the fund may lend securities to qualified institutions. It is the fund’s policy that, at origination, all loans are secured by collateral of at least 102% of the value of U.S. securities loaned and 105% of the value of foreign securities loaned and that collateral equivalent to at least 100%
The Fund 25
| NOTES TO FINANCIAL STATEMENTS (continued) |
of the market value of securities on loan is maintained at all times. Collateral is either in the form of cash, which can be invested in certain money market mutual funds managed by the Manager, U.S. Government and Agency securities or letters of credit. The fund is entitled to receive all income on securities loaned, in addition to income earned as a result of the lending transaction. Although each security loaned is fully collateralized, the fund bears the risk of delay in recovery of, or loss of rights in, the securities loaned should a borrower fail to return the securities in a timely manner. During the period ended December 31, 2008, The Bank of New York Mellon earned $12,987 from lending fund portfolio securities, pursuant to the securities lending agreement.
Until December 10, 2007, all cash collateral received by the fund and other series of the Trust in connection with the securities lending program was invested in the BlackRock Cash Strategies Fund LLC (the “BlackRock Fund”), a private investment fund not affiliated with the Trust or its investment adviser. On December 10, 2007, the BlackRock Fund announced that it was suspending investor withdrawal privileges due to conditions related to the credit markets and the adverse affect of such conditions on the liquidity of the BlackRock Fund’s portfolio holdings. Commencing on December 11, 2007, all new cash collateral received in connection with the securities lending activity of the fund and other series of the Trust was invested by the securities lending agent in the Dreyfus Institutional Cash Advantage Fund (the “Dreyfus Fund”), an affiliated money market fund registered as an investment company under the Investment Company Act of 1940, as amended.To the extent that the BlackRock Fund agreed to permit withdrawals during the period December 11, 2007 through December 31, 2008, the securities lending agent effected such withdrawals and the cash proceeds from such withdrawals by the fund were reinvested in the shares of the Dreyfus Fund. As of January 22, 2009, the final withdrawal was reinvested in the shares of the Dreyfus Fund. Repayments of cash collateral during the period were made from the proceeds of redemptions of
26
shares of the Dreyfus Fund. See Statement of Investments for further detail on the fund’s investment of cash collateral in the BlackRock Fund and the Dreyfus Fund as of December 31, 2008.
(d) Affiliated issuers: Investments in other investment companies advised by the Manager are defined as “affiliated” in the Act.
(e) Dividends to shareholders: Dividends are recorded on the ex-dividend date. Dividends from investment income-net are declared and paid quarterly. Dividends from net realized capital gains, if any, are normally declared and paid annually, but the fund may make distributions on a more frequent basis to comply with the distribution requirements of the Internal Revenue Code of 1986, as amended (the “Code”).To the extent that net realized capital gains can be offset by capital loss carryovers, it is the policy of the fund not to distribute such gains. Income and capital gain distributions are determined in accordance with income tax regulations, which may differ from U.S. generally accepted accounting principles.
On December 30, 2008, the Board ofTrustees declared a cash dividend of $.646 per share from undistributed investment income-net, payable on January 2, 2009 to shareholders of record as of the close of business on December 31, 2008 (ex-dividend date).
(f) Federal income taxes: It is the policy of the fund to continue to qualify as a regulated investment company, if such qualification is in the best interests of its shareholders, by complying with the applicable provisions of the Code, and to make distributions of taxable income sufficient to relieve it from substantially all federal income and excise taxes.
As of and during the period ended December 31, 2008, the fund did not have any liabilities for any uncertain tax positions.The fund recognizes interest and penalties, if any, related to uncertain tax positions as income tax expense in the Statement of Operations. During the period, the fund did not incur any interest or penalties.
The Fund 27
| NOTES TO FINANCIAL STATEMENTS (continued) |
Each of the tax years in the four-year period ended December 31, 2008 remains subject to examination by the Internal Revenue Service and state taxing authorities.
At December 31, 2008, the components of accumulated earnings on a tax basis were as follows: undistributed ordinary income $3,723,416, accumulated capital losses $5,079,874 and unrealized depreciation $1,066,844. In addition, the fund had $590,277 of capital losses realized after October 31, 2008, which were deferred for tax purposes to the first day of the following fiscal year.
The accumulated capital loss carryover is available for federal income tax purposes to be applied against future net securities profits, if any realized subsequent to December 31, 2008. If not applied, $2,667,241 of the carryover expires in fiscal 2009 and $2,412,633 expires in fiscal 2010. Its uncertain whether the fund will be able to realize the benefits of the remaining capital loss carryovers before they expire and the remaining capital loss carryovers could be subject to future limitations imposed by the internal revenue code related to share ownership activity.
The tax character of distributions paid to shareholders during the fiscal periods ended December 31, 2008 and December 31, 2007 were as follows: ordinary income $4,312,893 and $1,884,405, respectively.
During the period ended December 31, 2008, as a result of permanent book to tax differences, primarily due to the tax treatment for pay-down gains and losses on mortgage-backed securities, foreign currency transactions and expiration of capital loss carryovers, the fund increased accumulated undistributed investment income-net by $6,088,165 and increased accumulated net realized gain (loss) on investments $2,380,131 and decreased paid-in capital by $8,468,296. Net assets and net asset value per share were not affected by this reclassification.
NOTE 2—Bank Lines of Credit:
The Trust entered into two separate agreements with The Bank of New York, an affiliate of the Manager, that enable the fund, and other
28
funds in the Trust, to borrow, in the aggregate, (i) up to $35 million from a committed line of credit and (ii) up to $15 million from an uncommitted line of credit. Interest is charged to each participating fund based on its borrowings at a rate equal to the federal funds effective rate plus 1 / 2of 1%.The participating funds also pay an annual fee, computed at a rate of .020 of 1% of the committed and uncommitted amounts and allocated ratably to the participating funds. In addition, a facility fee, computed at an annual rate of .060 of 1% on the committed amount, is allocated ratably among the participating funds at the end of each quarter. During the period ended December 31, 2008, the fund did not borrow under the line of credit. Loan commitment fees are shown in the Statement of Operations
NOTE 3—Advisor Fee and Other Transactions With Affiliates:
(a) Pursuant to a management agreement (“Agreement”) with the Manager, the advisory fee is computed at the annual rate of .40% of the value of the fund’s average daily net assets and is payable monthly. The Manager had undertaken from January 1, 2008 through December 31, 2008 to reduce the advisory fee paid by the fund, to the extent that the fund’s aggregate annual expenses, exclusive of taxes, brokerage fees, interest on borrowings, commitment fees and extraordinary expenses, exceed an annual rate of .80% of the value of the fund’s average daily net assets. The reduction in advisory fee, pursuant to the undertaking, amounted to $17,229 during the year ended December 31, 2008.
The Trust entered into an agreement with The Bank of New York Mellon, pursuant to which The Bank of New York Mellon provides administration and fund accounting services for the Fund. For these services the fund pays The Bank of New York Mellon a fixed fee plus asset and transaction based fees, as well as out-of-pocket expenses. Pursuant to this agreement, the fund was charged $14,917 for the period ended December 31, 2008 for administration and fund accounting services.
The Fund 29
| NOTES TO FINANCIAL STATEMENTS (continued) |
The Trust has contracted BNY Mellon Shareowner Services, a wholly-owned subsidiary of The Bank of New York Mellon, to provide printing and fulfillment services for the fund. Pursuant to this agreement, the fund was charged $4,307, which is included in miscellaneous expenses in the Statement of Operations for the period ended December 31, 2008.
(b) The fund may pay administrative service fees. These fees are paid to affiliated or unaffiliated retirement plans, omnibus accounts and platform administrators and other entities (“Plan Administrators”) that provide record keeping and/or other administrative support services to accounts, retirement plans and their participants. As compensation for such services, the fund may pay each Plan Administrator an administrative service fee in an amount of up to .15% (on an annualized basis) of the fund’s average daily net assets attributable to fund shares that are held in accounts serviced by such Plan Administrator. For the period ended December 31, 2008, the fund was charged $30,859. The fund’s adviser or its affiliates may pay additional compensation from their own resources to Plan Administrators and other entities for administrative services, as well as in consideration of marketing or other distribution-related services. These payments may provide an incentive for these entities to actively promote the fund or cooperate with the distributor’s promotional efforts.
(c) The fund compensates Dreyfus Transfer, Inc., a wholly-owned subsidiary of the Manager, under a transfer agency agreement for providing personnel and facilities to perform transfer agency services for the fund. During the period ended December 31, 2008 the fund was charged $12,868 pursuant to the transfer agency agreement.
The fund compensates The Bank of New York Mellon under cash management agreements for performing cash management services related to fund subscriptions and redemptions. During the period ended December 31, 2008, the fund was charged $409 pursuant to the cash management agreements.These fees were offset by earnings credits pursuant to the cash management agreements.
30
The fund compensates The Bank of New York Mellon under a custody agreement for providing custodial services for the fund. During the period ended December 31, 2008, the fund was charged $101,370 pursuant to the custody agreement.
During the period ended December 31, 2008, the fund was charged $5,403 for services performed by the Chief Compliance Officer. These charges appear under the miscellaneous heading on the Statement of Operations.
The components of “Due to The Dreyfus Corporation and affiliates” in the Statement of Assets and Liabilities consist of:investment advisory fees $19,281, custodian fees $42,951, chief compliance officer fees $1,197 and transfer agency per account fees $5,698, which are offset against an expense reimbursement currently in effect in the amount of $8,091.
(d) Effective December 1, 2008, EachTrustee receives $45,000 per year, plus $6,000 for each joint Board meeting ofThe Dreyfus/Laurel Funds, Inc.,The Dreyfus /Laurel FundsTrust andThe Dreyfus/LaurelTax-Free Municipal Funds, (collectively, the “Dreyfus/Laurel Funds”) and the Trust attended, $2,000 for separate in-person committee meetings attended which are not held in conjunction with a regularly scheduled Board meeting and $1,500 for Board meetings and separate committee meetings attended that are conducted by telephone and is reimbursed for travel and out-of-pocket expenses.With respect to Board meetings, the Chairman of the Board receives an additional 25% of such compensation (with the exception of reimbursable amounts).With respect to compensation committee meetings, the Chair of the compensation committee receives $900 per meeting. In the event that there is an in-person joint committee meeting of the Dreyfus/Laurel Funds, theTrust and Dreyfus High Yield Strategies Fund, the $2,000 or $1,500 fee, as applicable, will be allocated between the Dreyfus/Laurel Funds, the Trust and Dreyfus HighYield Strategies Fund.These fees and expenses are charged and allocated to each series based on net assets.
The Fund 31
| NOTES TO FINANCIAL STATEMENTS (continued) |
(e) Prior to December 1, 2008, at which time the fee was eliminated, a 2% redemption fee was charged and retained by the fund on certain shares redeemed within thirty days following the date of issuance, subject to exceptions, including redemptions made through the use of the fund’s exchange privilege. From January 1, 2008 to November 30, 2008, redemption fees charged and retained by the fund amounted to $2,657. The fund reserves the right to reimpose a redemption fee in the future.
NOTE 4—Securities Transactions:
The aggregate amount of purchases and sales (including paydowns) of investment securities, excluding short-term securities, option transactions, financial futures, forward currency exchange contracts and swap transactions, during the period ended December 31,2008, amounted to $132,814,519 and $169,762,192, respectively, of which $11,800,301 in purchases and $15,224,519 in sales were from mortgage dollar roll transactions. Sales of investment securities include securities amounting to $25,283,970 delivered pursuant to a redemption-in-kind. The net realized loss of $1,558,395 on the redemption-in-kind will not be realized for tax purposes.
A mortgage dollar roll transaction involves a sale by the fund of mortgage related securities that it holds with an agreement by the fund to repurchase similar securities at an agreed upon price and date. The securities purchased will bear the same interest rate as those sold, but generally will be collateralized by pools of mortgages with different prepayment histories than those securities sold.
The fund may invest in financial futures contracts in order to gain exposure to or protect against changes in the market. The fund is exposed to market risk as a result of changes in the value of the underlying instruments. These investments require initial margin deposits with a broker, which consist of cash or cash equivalents.The amount of these deposits is determined by the exchange or Board of Trade on which the contract is traded and is subject to change. Investments in financial futures require the fund to “mark to market” on a daily basis, which reflects the change in the market value of the contract at the close of each day’s trading.Accordingly variation margin payments are
32
received or made to reflect daily unrealized gains or losses.When the contracts are closed, the fund recognizes a realized gain or loss. Contracts open at December 31,2008 are set forth in the Statement of Financial Futures.
The fund may purchase and write (sell) put and call options in order to gain exposure to or to protect against changes in the market.
As a writer of call options, the fund receives a premium at the outset and then bears the market risk of unfavorable changes in the price of the financial instrument underlying the option. Generally, the fund would incur a gain, to the extent of the premium, if the price of the underlying financial instrument decreases between the date the option is written and the date on which the option is terminated. Generally, the fund would realize a loss, if the price of the financial instrument increases between those dates.
As a writer of put options, the fund receives a premium at the outset and then bears the market risk of unfavorable changes in the price of the financial instrument underlying the option. Generally, the fund would incur a gain, to the extent of the premium, if the price of the underlying financial instrument increases between the date the option is written and the date on which the option is terminated. Generally, the fund would realize a loss, if the price of the financial instrument decreases between those dates.
The following summarizes the fund’s call/put options written for the period ended December 31, 2008:
| Face Amount | Options Terminated | |||||||
| Covered by | Premiums | Net Realized | ||||||
| Options Written: | Contracts ($) | Received ($) | Cost ($) | Gain (Loss) ($) | ||||
| Contracts outstanding | ||||||||
| December 31, 2007 | — | — | — | — | ||||
| Contracts written | 90,700 | 27,948 | — | — | ||||
| Contracts terminated: | ||||||||
| Closed | 46,700 | 18,462 | 49,761 | (31,299) | ||||
| Expired | 44,000 | 9,486 | — | 9,486 | ||||
| Total Contracts terminated: | 90,700 | 27,948 | 49,761 | (21,813) | ||||
| Contracts outstanding | ||||||||
| December 31, 2008 | — | — | — | — | ||||
The Fund 33
| NOTES TO FINANCIAL STATEMENTS (continued) |
The fund enters into forward currency exchange contracts in order to hedge its exposure to changes in foreign currency exchange rates on its foreign portfolio holdings and to settle foreign currency transac-tions.When executing forward currency exchange contracts, the fund is obligated to buy or sell a foreign currency at a specified rate on a certain date in the future. With respect to sales of forward currency exchange contracts, the fund would incur a loss if the value of the contract increases between the date the forward contract is opened and the date the forward contract is closed.The fund realizes a gain if the value of the contract decreases between those dates. With respect to purchases of forward currency exchange contracts, the fund would incur a loss if the value of the contract decreases between the date the forward contract is opened and the date the forward contract is closed. The fund realizes a gain if the value of the contract increases between those dates. The fund is also exposed to credit risk associated with counterparty nonperformance on these forward currency exchange contracts which is typically limited to the unrealized gain on each open contract. The following summarizes open forward currency exchange contracts at December 31, 2008:
| Foreign | Unrealized | |||||||
| Forward Currency | Currency | Appreciation | ||||||
| Exchange Contracts | Amounts | Cost ($) | Value ($) (Depreciation)($) | |||||
| Purchases: | ||||||||
| Euro, expiring | ||||||||
| 1/2/2009 | 85,385 | 120,529 | 118,689 | (1,840) | ||||
| Euro, expiring | ||||||||
| 1/16/2009 | 865,000 | 1,146,393 | 1,201,453 | 55,060 | ||||
| Malaysian Ringgit, | ||||||||
| expiring 3/26/2009 | 3,170,000 | 994,510 | 914,489 | (80,021) | ||||
| Sales: | ||||||||
| Brazilian Real, | ||||||||
| expiring 1/16/2009 | 790,000 | 305,255 | 336,567 | (31,312) | ||||
| Canadian Dollar, | ||||||||
| expiring 1/16/2009 | 1,680,000 | 1,335,506 | 1,360,424 | (24,918) | ||||
| Euro, expiring | ||||||||
| 1/16/2009 | 880,000 | 1,138,183 | 1,222,287 | (84,104) | ||||
| Euro, expiring | ||||||||
| 1/16/2009 | 9,470,000 | 12,152,662 | 13,153,480 | (1,000,818) | ||||
| Euro, expiring | ||||||||
| 1/16/2009 | 800,000 | 1,030,208 | 1,111,170 | (80,962) | ||||
| Euro, expiring | ||||||||
| 1/16/2009 | 20,000 | 25,761 | 27,779 | (2,018) | ||||
34
| Foreign | Unrealized | |||||||
| Forward Currency | Currency | Appreciation | ||||||
| Exchange Contracts | Amounts | Cost ($) | Value ($) (Depreciation)($) | |||||
| Sales (continued): | ||||||||
| Euro, expiring | ||||||||
| 1/16/2009 | 730,000 | 940,276 | 1,013,942 | (73,666) | ||||
| Euro, expiring | ||||||||
| 1/16/2009 | 850,000 | 1,100,382 | 1,180,619 | (80,237) | ||||
| Euro, expiring | ||||||||
| 1/16/2009 | 1,560,000 | 2,173,704 | 2,166,782 | 6,922 | ||||
| Euro, expiring | ||||||||
| 1/16/2009 | 2,695,000 | 3,811,592 | 3,743,255 | 68,337 | ||||
| British Pounds, | ||||||||
| expiring 1/16/2009 | 140,000 | 207,017 | 201,183 | 5,834 | ||||
| British Pounds, | ||||||||
| expiring 1/16/2009 | 760,000 | 1,123,804 | 1,092,136 | 31,668 | ||||
| British Pounds, | ||||||||
| expiring 1/16/2009 | 820,000 | 1,222,267 | 1,178,357 | 43,910 | ||||
| Japanese Yen, | ||||||||
| expiring 1/16/2009 | 109,850,000 | 1,187,118 | 1,212,234 | (25,116) | ||||
| Japanese Yen, | ||||||||
| expiring 1/16/2009 | 369,640,000 | 4,000,866 | 4,079,109 | (78,243) | ||||
| Japanese Yen, | ||||||||
| expiring 1/16/2009 | 174,780,000 | 1,889,187 | 1,928,760 | (39,573) | ||||
| Japanese Yen, | ||||||||
| expiring 1/16/2009 | 90,000,000 | 1,005,351 | 993,182 | 12,169 | ||||
| Japanese Yen, | ||||||||
| expiring 1/16/2009 | 47,710,000 | 531,558 | 526,497 | 5,061 | ||||
| Mexican New Peso, | ||||||||
| expiring 1/16/2009 | 10,150,000 | 747,973 | 728,710 | 19,263 | ||||
| Malaysian Ringgit, | ||||||||
| expiring 3/26/2009 | 3,170,000 | 1,013,589 | 914,489 | 99,100 | ||||
| Swedish Krona, | ||||||||
| expiring 1/16/2009 | 10,640,000 | 1,324,273 | 1,345,091 | (20,818) | ||||
| Thai Bhat, expiring | ||||||||
| 1/16/2009 | 17,880,000 | 501,120 | 512,809 | (11,689) | ||||
| Total | (1,288,011) | |||||||
The fund may enter into swap agreements to exchange the interest rate on, or return generated by, one nominal instrument for the return generated by another nominal instrument.
Risks may arise upon entering into these agreements from the potential inability of the counterparties to meet the terms of the agreement and are generally limited to the amount of net payments to be received, if any, at the date of default.
The Fund 35
| NOTES TO FINANCIAL STATEMENTS (continued) |
The fund accrues for the interim payments on swap contracts on a daily basis, with the net amount recorded within unrealized appreciation (depreciation) of swap contracts in the Statement of Assets and Liabilities. Once the interim payments are settled in cash, the net amount is recorded as realized gain (loss) on swaps, in addition to realized gain (loss) recorded upon the termination of swaps contracts in the Statement of Operations. Upfront payments made and/or received by the fund, are recorded as an asset and/or liability on the Statement of Assets and Liabilities and are recorded as a realized gain or loss ratably over the contract’s term/event. Fluctuations in the value of swap contracts are recorded as a component of net change in unrealized appreciation (depreciation) on investments.
Credit default swaps involve commitments to pay a fixed interest rate in exchange for payment if a credit event affecting a third party (the referenced company) occurs. Credit events may include a failure to pay interest or principal, bankruptcy, or restructuring.The maximum pay-outs for these contracts are limited to the notional amount of each swap.The following summarizes open credit default swaps entered into by the fund at December 31, 2008:
| Unrealized | ||||||||||||||
| Notional | Reference | Buy/Sell (Pay)/Receive | Expiration | Appreciation | ||||||||||
| Amount ($) | Entity | Counterparty | Protection Fixed Rate (%) | Date | (Depreciation) ($) | |||||||||
| 15,000 | Block Financial, | |||||||||||||
| 5.125%, | ||||||||||||||
| 10/30/2014 | Barclays | Buy | (2.30) | 12/20/2012 | (711) | |||||||||
| 60,000 | Block Financial, | |||||||||||||
| 5.125%, | Morgan | |||||||||||||
| 10/30/2014 | Stanley | Buy | (2.33) | 12/20/2012 | (2,901) | |||||||||
| 940,000 | Block Financial, | |||||||||||||
| 5.125%, | ||||||||||||||
| 10/30/2014 | JP Morgan | Buy | (1.90) | 9/20/2012 | (27,627) | |||||||||
| 10,000 | Block Financial, | |||||||||||||
| 5.125%, | ||||||||||||||
| 10/30/2014 | JP Morgan | Buy | (2.25) | 12/20/2012 | (455) | |||||||||
| 15,000 | Block Financial, | |||||||||||||
| 5.125%, | ||||||||||||||
| 10/30/2014 | JP Morgan | Buy | (2.80) | 12/20/2012 | (994) | |||||||||
| 770,000 | Reed Elsevier | |||||||||||||
| Capital, 4.625%, | Deutsche | |||||||||||||
| 6/15/2012 | Bank | Buy | (0.96) | 6/20/2012 | 60,421 | |||||||||
| 27,733 | ||||||||||||||
36
The fund may enter into interest rate swaps, which involve the exchange of commitments to pay and receive interest based on a notional principal amount. The following summarizes open interest rate swaps entered into by the fund at December 31, 2008:
| Notional | Reference | (Pay)/Receive Expiration | Unrealized | |||||||
| Amount ($) | Entity | Counterparty | Fixed Rate (%) Date | Appreciation ($) | ||||||
| 2,250,000 | USD - 3 Month | |||||||||
| Libor | JP Morgan | 3.29 | 11/24/2018 | 143,945 | ||||||
| 2,625,000 | AUD - 6 Month | |||||||||
| Libor | JP Morgan | 4.76 | 11/24/2013 | 42,930 | ||||||
| 2,460,000 | GBP - 6 Month | |||||||||
| Libor | JP Morgan | 5.03 | 4/4/2013 | 235,824 | ||||||
| 1,080,000 | GBP - 6 Month | |||||||||
| Libor | JP Morgan | 6.30 | 6/18/2011 | 130,348 | ||||||
| 595,000,000 | JPY - 6 Month | |||||||||
| Yenibor | JP Morgan | 1.36 | 1/19/2012 | 133,048 | ||||||
| 304,000,000 | JPY - 6 Month | |||||||||
| Yenibor | JP Morgan | 2.08 | 7/28/2016 | 258,948 | ||||||
| 5,900,000 | NZD - 3 Month | |||||||||
| Libor | JP Morgan | 7.88 | 5/18/2010 | 159,223 | ||||||
| 2,210,000 | NZD - 3 Month | |||||||||
| Libor | JP Morgan | 8.05 | 6/21/2012 | 145,210 | ||||||
| 2,900,000 | NZD - 6 Month | |||||||||
| Libor | Barclays | 7.58 | 5/1/2013 | 193,617 | ||||||
| 1,443,093 | ||||||||||
Total return swaps involve commitments to pay interest in exchange for a market-linked return based on a national amount.To the extent the total return of the security or index underlying the transaction exceeds or falls short of the offsetting interest rate obligation, the fund will receive a payment from or make a payment to the counterparty, respec-tively.At December 31, 2008, the fund had no open total return swaps.
At December 31, 2008, the cost of investments for federal income tax purposes was $58,488,951; accordingly, accumulated net unrealized appreciation on investments was $1,066,844, consisting of $3,672,411 gross unrealized appreciation and $2,605,567 gross unrealized depreciation.
In March 2008, the Financial Accounting Standards Board (“FASB”) released Statement of Financial Accounting Standards No. 161,
The Fund 37
| NOTES TO FINANCIAL STATEMENTS (continued) |
“Disclosures about Derivative Instruments and Hedging Activities” (“FAS 161”). FAS 161 requires qualitative disclosures about objectives and strategies for using derivatives, quantitative disclosures about fair value amounts of gains and losses on derivative instruments, and disclosures about credit-risk-related contingent features in derivative agree-ments.The application of FAS 161 is required for fiscal years and interim periods beginning after November 15, 2008. At this time, management is evaluating the implications of FAS 161 and its impact on the financial statements and the accompanying notes has not yet been determined.
During September, 2008 FASB Staff Position FAS 133-1 and FASB Interpretation 45-4, Disclosures about Credit Derivatives and Certain Guarantees: An Amendment of FASB Statement No. 133 and FASB Interpretation No. 45; and Clarification of Effective Date of FASB Statement No. 161 (“Amendment”) was issued and is effective for annual and interim reporting periods ending after November 15, 2008. The Amendment requires enhanced disclosures regarding a fund’s credit derivatives holdings and hybrid financial instruments containing embedded credit derivatives. Since the fund was not selling credit protection at the end of the period, management believes FASB 133-1 does not currently impact the financial statements and the accompaning notes
38
| REPORT OF INDEPENDENT REGISTERED PUBLIC ACCOUNTING FIRM |
To the Trustees of Dreyfus Investment Funds and Shareholders of Dreyfus/Standish International Fixed Income Fund:
In our opinion, the accompanying statement of assets and liabilities, including the statements of investments and of financial futures, and the related statements of operations and of changes in net assets and the financial highlights present fairly, in all material respects, the financial position of Dreyfus/Standish International Fixed Income Fund (formerly, Standish Mellon International Fixed Income Fund) (the “Fund”) at December 31, 2008, the results of its operations for the year then ended, the changes in its net assets for each of the two years in the period then ended and the financial highlights for each of the five years in the period then ended, in conformity with accounting principles generally accepted in the United States of America.These financial statements and financial highlights (hereafter referred to as “financial statements”) are the responsibility of the Fund’s management. Our responsibility is to express an opinion on these financial statements based on our audits. We conducted our audits of these financial statements in accordance with the standards of the Public Company Accounting Oversight Board (United States). Those standards require that we plan and perform the audit to obtain reasonable assurance about whether the financial statements are free of material misstatement.An audit includes examining,on a test basis, evidence supporting the amounts and disclosures in the financial statements, assessing the accounting principles used and significant estimates made by management, and evaluating the overall financial statement presentation.We believe that our audits, which included confirmation of securities at December 31, 2008 by correspondence with the custodian and brokers, provide a reasonable basis for our opinion.
| PricewaterhouseCoopers LLP New York, New York February 27, 2009 |
The Fund 39
| INFORMATION ABOUT THE REVIEW AND APPROVAL OF THE FUND’S INVESTMENT ADVISORY AGREEMENT (Unaudited) |
Background and Summary
The 1940 Act requires that a majority of the Board of Trustees, including a majority of the Trustees who are not affiliated with Dreyfus/Standish International Fixed Income Fund (formerly, Standish Mellon International Fixed Income Fund) (the “Fund”), any investment adviser to the Fund or the Trust’s principal underwriter (the “Independent Trustees”), voting separately, approve the Fund’s advisory agreement and the related fees.
At their meeting held on August 27, 2008, the Board of Trustees and Independent Trustees, by majority vote, approved a new investment advisory agreement (the “New Advisory Agreement”) effective December 1, 2008, between Dreyfus Investment Funds (formerly Mellon Institutional Funds InvestmentTrust) (the “Trust”), on behalf of the Fund, and a new adviser, The Dreyfus Corporation (“Dreyfus”), with respect to the Fund.This New Advisory Agreement replaces the investment advisory agreement between the Trust, on behalf of the Fund, and Standish Mellon Asset Management Company LLC (“Standish”) (such agreement, the “Current Advisory Agreement”). As discussed below, however, it is expected that the appointment of Dreyfus under the New Advisory Agreement will not result in any actual change in the investment management services provided to the Fund, the investment professionals who provide these services, or in the fees charged to the Fund for these services.
The New Advisory Agreement and the appointment of Dreyfus as the Fund’s investment adviser were proposed to the Trustees in the context of a larger proposed rebranding and consolidation of mutual fund businesses of The Bank of New York Mellon Corporation (“BNY Mellon”). Specifically, BNY Mellon proposed to consolidate substantially all of its mutual fund businesses, including the Fund and all of the other funds comprising theTrust, under the Dreyfus name, organization and infrastructure. Dreyfus is currently BNY Mellon’s primary mutual fund business unit, with approximately $340 billion in assets under management and approximately 180 mutual fund portfolios. The
40
appointment of Dreyfus as investment adviser to all the Funds comprising the Trust consolidates the proprietary mutual fund investment management operations of two BNY Mellon advisory firms, Standish and The Boston Company Asset Management LLC into a single BNY Mellon company, Dreyfus. Following completion of this consolidation, it is expected that the Trust and all of the Funds will be rebranded and marketed under the Dreyfus name.
In proposing the New Advisory Agreement and the appointment of Dreyfus as the Fund’s adviser, management provided the Board with written assurances that, if approved as to the Fund, this consolidation would not result in any change in the portfolio management of the Fund, the investment professionals who serve the Fund, or the fees charged for these services. Instead, the portfolio managers and research analysts who have provided services to the Fund in the past would continue to do so under the New Advisory Agreement using the same investment process they have used previously, only they would perform such services as personnel of Dreyfus, while also remaining personnel of their current firm.
Management proposed also to transfer simultaneously certain non-advisory functions and operations to corresponding units within Dreyfus and to combine certain of the Trust’s outside service provider relationships with those of the Dreyfus funds.
In connection with these changes, the current Board of Trustees also determined to recommend to shareholders of the Trust the election of six individuals, each of whom currently serves as independent trustee or director of funds managed by Dreyfus, to serve in their stead.
At the Board’s request, management provided information as to the combined financial impact of these changes on the Trust.This information indicated that the consolidation of the Trust’s Board, advisory functions, other operations of the Trust, and the service provider relationships would result in certain efficiencies and cost savings to the funds over time.
The Fund 41
| INFORMATION ABOUT THE REVIEW AND APPROVAL OF THE FUND’S INVESTMENT ADVISORY AGREEMENT (Unaudited) (continued) |
In determining to approve the New Advisory Agreement, the Board concluded, based on representations from management, that shareholders of the Fund would experience no actual change in the portfolio management of the Fund as a result of the new contractual arrangement with Dreyfus and may over time experience efficiencies and cost savings. The Board noted also that the terms of the New Advisory Agreement were substantially identical to the terms of the Current Advisory Agreement between the Fund and Standish, and that the advisory fees to be paid to Dreyfus were identical to those currently paid to Standish.
The Board’s Deliberations
In determining whether to approve the New Advisory Agreement, the Independent Trustees received from Dreyfus a broad range of information in response to several written requests prepared on behalf of the Independent Trustees by their own legal counsel. The Independent Trustees met alone in private sessions with their legal counsel on several occasions, including at a special meeting devoted to these proposals on August 7, 2008, to review these materials and to discuss the New Advisory Agreement and other changes proposed by management. Representatives of management participated in portions of these sessions to provide an overview of Dreyfus’ organization, personnel, resources and strategic plans, and to respond to questions and comments arising from the Independent Trustees’ review of the materials and their deliberations.These included discussions as to the impact on the Fund, if any, of the engagement of Dreyfus as the Fund’s investment adviser and the related consolidation of certain other operations of the Fund under the Dreyfus organization.
The information requested by the Independent Trustees and reviewed by the entire Board included:
| (i) | Financial and Economic Data: Dreyfus’ balance sheet and income statements, as well as an historical and pro forma profitability analy- sis of Dreyfus and of BNY Mellon with respect to the investment management services provided and to be provided, to the Fund, |
42
| including profitability with respect to the custodian, transfer agent and securities lending services provided to the Fund by BNY Mellon affiliates, as well as a separate presentation of profitability relative to that of several publicly traded investment advisers; | |
| (ii) | Management Teams and Operations: Dreyfus’ Form ADV, as well as information concerning Dreyfus’ executive management, portfolio management, client service personnel and overall organizational structure, assets under management, insurance coverage, brokerage and soft dollar policies and practices; |
| (iii) | Comparative Performance and Fees: Analyses prepared by Lipper Analytical Services (“Lipper”) regarding the Fund’s historical per- formance, management fee, and expense ratios compared to other funds, and Dreyfus’ separate account advisory fee schedules; |
| (iv) | Specific Facts Relating to the Fund: Standish’s commentary on the Fund’s performance and any material portfolio manager and strat- egy changes that may have affected the Fund in the prior year; and |
| (v) | Other Benefits: The benefits flowing to BNY Mellon and its affili- ates in the form of fees for transfer agency, custody, administration and securities lending services provided to the Funds by affiliates of BNY Mellon. |
In considering the approval of the Fund’s New Advisory Agreement, the Board of Trustees, including the Independent Trustees, did not identify any single factor as all-important or controlling, and individual Trustees did not necessarily attribute the same weight or importance to each factor.The Trustees determined that the terms and conditions of the New Advisory Agreement and the compensation to Dreyfus provided therein were fair and reasonable in light of the services performed, expenses incurred and such other matters as the Trustees considered relevant in the exercise of their reasonable judg-ment.The following summary does not detail all the matters that were considered. Some of the factors that figured prominently in the Trustees’ determination are described below.
The Fund 43
| INFORMATION ABOUT THE REVIEW AND APPROVAL OF THE FUND’S INVESTMENT ADVISORY AGREEMENT (Unaudited) (continued) |
Nature, Extent and Quality of Services
The Board considered the nature, scope and quality of the overall services proposed to be provided to the Fund by Dreyfus. In their deliberations as to the approval of the New Advisory Agreement, the Trustees were also mindful of the fact that, by choosing to invest in the Fund, the Fund’s shareholders have previously chosen to entrust Standish, the investment professionals of which would, under the proposal, also become associated with Dreyus to manage the portion of their assets invested in the Fund, under the supervision of the Board.
Among the specific factors the Board reviewed were the investment management, administrative, compliance and related services to be provided by Dreyfus. The Board determined that the services to be provided were of high quality and at least commensurate with industry standards. The Board also placed significant weight on assurances provided by management that there would be no material changes in the nature or quality of the services provided, including in the personnel or processes utilized in providing investment management services to the Fund as a result of the appointment of Dreyfus and that no such changes were currently contemplated by management in the future.
The Trustees reviewed the background and experience of the Fund’s portfolio managers then employed by Standish, who would become associated with Dreyfus. In previous meetings the Trustees had heard from senior management of Dreyfus an overview of its organization, personnel, resources and strategic plans. Among other things, the Trustees considered the size, education and experience of Dreyfus’ investment staff, technological infrastructure and overall responsiveness to changes in market conditions.
The Board determined that Dreyfus, using the same investment professionals and resources then supplied by Standish, had the expertise and resources to manage the Fund effectively on a day-to-day basis.
44
Investment Performance
The Board considered the historical investment performance of Standish in managing the Fund against a peer group of investment companies selected by Standish with input from the Trustees. The Board also compared the Fund’s investment performance against the average performance of a larger universe of funds regarded by Lipper as having similar investment objectives and considered the Fund’s performance rankings against that universe. In addition to the information received by the Board for the August 27, 2008 Board meeting, the Trustees had received similar detailed comparative performance information for the Fund at regular Board meetings during the year.
The Lipper materials provided to the Board at the August 27 meeting indicated that the performance of the Fund for the 1-, 3- and 5-year periods ended May 31, 2008 was 4.61%, 4.00% and 3.89%, respectively. The Board found that for the 1- and 5-year periods, the Fund had underperformed its peer group average returns of 7.04% and 4.61%, respectively, but outperformed its peer group average return of 3.81% for the 3-year period.
Advisory Fee and Other Expenses
The Board considered the advisory fee rate proposed to be paid by the Fund to Dreyfus which was identical to the fee then being paid together with written assurances that no increase in the fee payable by the Fund was contemplated.The Lipper data presenting the Fund’s “net management fees” included fees paid by the Fund, as calculated by Lipper, for administrative services provided by The Bank of NewYork Mellon, the Trust’s custodian. Such reporting was necessary, according to Lipper, to allow the Board to compare the Fund’s advisory fees to those peers that include administrative fees within a blended advisory fee.
The Fund 45
| INFORMATION ABOUT THE REVIEW AND APPROVAL OF THE FUND’S INVESTMENT ADVISORY AGREEMENT (Unaudited) (continued) |
The Fund’s contractual advisory fee was 0.40%, in the 1st (best) quin-tile of its peer group of funds, the median fee of which was 0.535% . The Fund’s net management fee was 0.524% (which included 0.124% in administrative services fees under Lipper’s calculation methodology), higher than the peer group median net management fee of 0.465% .
Based on the Lipper data, as well as other factors discussed at the August 27, 2008 Board meeting, the Board determined that the Fund’s proposed advisory fee under the New Advisory Agreement is reasonable relative to its peer group median and noted that it was identical to the advisory fee paid by the Fund under the Current Advisory Agreement.
The Board also compared the fees payable by the Fund relative to those payable by separate account clients of Dreyfus. Based on the additional scope and complexity of the services provided and responsibilities assumed by Dreyfus with respect to the Fund relative to these other types of clients, the Board concluded that the fees payable under the New Advisory Agreement were reasonable relative to the nature and quality of the services provided.
The Board also considered the Fund’s total expense ratio and compared it to that of its peer group of similar funds.They found that the actual expense ratio of 0.703% was below the median net expense ratio of the peer group of 0.759%, notwithstanding the fact that most of the other funds in the peer group were larger than the Fund.
The Board noted that Standish had voluntarily agreed to limit its fees and/or reimburse the Fund’s expenses to the extent necessary to limit the Fund’s total expense ratio (excluding brokerage commissions, taxes, acquired fund fees and expenses and extraordinary expenses) to 0.80% and that, although this arrangement is temporary and may be changed at any time, Dreyfus had represented to the Board that no change in this voluntary expense limitation was contemplated.
Adviser’s Profitability
The Board considered Dreyfus’ projected 2008 pro forma profitability in managing the Fund and, the Mellon Institutional Funds as a group
46
(assuming integration of the Trust’s operations with the Dreyfus Funds had already occurred), as well as the methodology used to compute such profitability, and the various direct and indirect expenses expected to be incurred by Dreyfus.The IndependentTrustees had observed that, based on the pro forma profitability information submitted to them by Dreyfus, Dreyfus expected to incur losses in managing several of the funds in the Mellon Institutional Funds family of funds. The Board compared this pro forma profitability with Standish’s actual historical profitability in managing the Fund and also reviewed the methodologies used in computing the pro forma and actual historical profitability. The Trustees observed that Dreyfus’ pro forma information indicated that the Fund would have generated a profit for BNY Mellon for the twelve month period ended June 30, 2008, which profit the Board determined not to be excessive.The Board noted that the rebranding and marketing strategies that formed a part of the plan to consolidate the Fund under the Dreyfus mutual fund organization could be expected to have a positive effect on Dreyfus’ profitability in future years, but that these effects were not yet quantifiable
Economies of Scale
Board also considered the extent to which economies of scale might be realized as the Fund grows. As in the case of profitability, the Trustees noted that the Fund’s becoming part of the Dreyfus mutual fund operations was expected to produce future economies of scale relative to its historical advisory relationship with Standish, but that these could not be projected and quantified currently.The Board concluded that, at existing asset levels and considering current asset growth projections, the implementation of fee breakpoints or other fee reductions was not necessary at this time.
Other Benefits
The Board also considered the additional benefits, based on information provided by management, flowing to BNY Mellon as a result of its relationship with the Mellon Institutional Funds as a group, includ-
The Fund 47
| INFORMATION ABOUT THE REVIEW AND APPROVAL OF THE FUND’S INVESTMENT ADVISORY AGREEMENT (Unaudited) (continued) |
ing revenues received by BNY Mellon affiliates in consideration of custodial, administrative, transfer agency and securities lending services provided by such affiliates to the Funds. In each case, such affiliates had been selected by the Board on the basis of a comparative analysis of their capabilities and fees relative to those of unaffiliated competitors.
The Board considered the fact that Dreyfus, Standish and BNY Mellon operate businesses other than the Mellon Institutional Funds, some of which businesses share personnel, office space and other resources and that these were a component of the profitability analysis provided. The Board also considered the intangible benefits that accrue to BNY Mellon and its affiliates by virtue of their relationships with the Funds and the Mellon Institutional Funds as a group.
| * * * |
The foregoing factors were among those weighed by the Trustees in determining that the terms and conditions of the Fund’s New Advisory Agreement and the compensation proposed to be paid to Dreyfus thereunder was fair and reasonable and, thus, voted to approve the New Advisory Agreement for up to one year from its effective date.
48
BOARD MEMBERS INFORMATION (Unaudited)
The Fund 49
BOARD MEMBERS INFORMATION (Unaudited) (continued)

50
OFFICERS OF THE FUND (Unaudited)

The Fund 51
OFFICERS OF THE FUND (Unaudited) (continued)
52
For More Information
Ticker Symbol: SDIFX
Telephone Call your Financial Representative or 1-800-645-6561
Mail The Dreyfus Family of Funds, 144 Glenn Curtiss Boulevard, Uniondale, NY 11556-0144 E-mail Send your request to info@dreyfus.com Internet Information can be viewed online or downloaded at: http://www.dreyfus.com
The fund files its complete schedule of portfolio holdings with the Securities and Exchange Commission (“SEC”) for the first and third quarters of each fiscal year on Form N-Q. The fund’s Forms N-Q are available on the SEC’s website at http://www.sec.gov and may be reviewed and copied at the SEC’s Public Reference Room in Washington, DC. Information on the operation of the Public Reference Room may be obtained by calling 1-800-SEC-0330.
A description of the policies and procedures that the fund uses to determine how to vote proxies relating to portfolio securities, and information regarding how the fund voted these proxies for the 12-month period ended June 30, 2008, is available at http://www.dreyfus.com and on the SEC’s website at http://www.sec.gov. The description of the policies and procedures is also available without charge, upon request, by calling 1-800-645-6561.
© 2009 MBSC Securities Corporation

| Item 2. | Code of Ethics. |
The Registrant has adopted a code of ethics that applies to the Registrant's principal executive officer, principal financial officer, principal accounting officer or controller, or persons performing similar functions. There have been no amendments to, or waivers in connection with, the Code of Ethics during the period covered by this Report.
| Item 3. | Audit Committee Financial Expert. |
| Item 4. | Principal Accountant Fees and Services. |
(a) Audit Fees. The aggregate fees billed for each of the last two fiscal years (the "Reporting Periods") for professional services rendered by the Registrant's principal accountant (the "Auditor") for the audit of the Registrant's annual financial statements, or services that are normally provided by the Auditor in connection with the statutory and regulatory filings or engagements for the Reporting Periods, were $240,774 in 2007 and $171,042 in 2008.
(b) Audit-Related Fees. The aggregate fees billed in the Reporting Periods for assurance and related services by the Auditor that are reasonably related to the performance of the audit of the Registrant's financial statements and are not reported under paragraph (a) of this Item 4 were $9,000 in 2007 and $9,855 in 2008. These services consisted of security counts required by Rule 17f-2 under the Investment Company Act of 1940, as amended.
The aggregate fees billed in the Reporting Periods for non-audit assurance and related services by the Auditor to the Registrant's investment adviser (not including any sub-investment adviser whose role is primarily portfolio management and is subcontracted with or overseen by another investment adviser), and any entity controlling, controlled by or under common control with the investment adviser that provides ongoing services to the Registrant ("Service Affiliates"), that were reasonably related to the performance of the annual audit of the Service Affiliate, which required pre-approval by the Audit Committee were $0 in 2007 and $0 in 2008.
Note: For the second paragraph in each of (b) through (d) of this Item 4, certain of such services were not pre-approved prior to May 6, 2003, when such services were required to be pre-approve .On and after May 6, 2003, 100% of all services provided by the Auditor were pre-approved as required. For comparative purposes, the fees shown assume that all such services were pre-approved, including services that were not pre-approved prior to the compliance date of the pre-approval requirement.
(c) Tax Fees. The aggregate fees billed in the Reporting Periods for professional services rendered by the Auditor for tax compliance, tax advice and tax planning ("Tax Services") were $46,137 in 2007 and $23,470 in 2008. These services consisted of (i) review or preparation of U.S. federal, state, local and excise tax returns; (ii) U.S. federal, state and local tax planning, advice and assistance regarding statutory, regulatory or administrative developments, (iii) tax advice regarding tax qualification matters and/or treatment of various financial instruments held or proposed to be acquired or held, and (iv) determination of Passive Foreign Investment Companies.
The aggregate fees billed in the Reporting Periods for Tax Services by the Auditor to Service Affiliates which required pre-approval by the Audit Committee were $0 in 2007 and $0 in 2008.
(d) All Other Fees. The aggregate fees billed in the Reporting Periods for products and services provided by the Auditor, other than the services reported in paragraphs (a) through (c) of this Item, were $0 in 2007 and $0 in 2008.
The aggregate fees billed in the Reporting Periods for Non-Audit Services by the Auditor to Service Affiliates, other than the services reported in paragraphs (b) through (c) of this Item, which required pre-approval by the Audit Committee were $0 in 2007 and $0 in 2008.
Audit Committee Pre-Approval Policies and Procedures. The Registrant's Audit Committee has established policies and procedures (the "Policy") for pre-approval (within specified fee limits) of the Auditor's engagements for non-audit services to the Registrant and Service Affiliates without specific case-by-case consideration. Pre-approval considerations include whether the proposed services are compatible with maintaining the Auditor's independence. Pre-approvals pursuant to the Policy are considered annually.
Non-Audit Fees. The aggregate non-audit fees billed by the Auditor for services rendered to the Registrant, and rendered to Service Affiliates, for the Reporting Periods were $98,628 in 2007 and $100,000 in 2008.
Auditor Independence. The Registrant's Audit Committee has considered whether the provision of non-audit services that were rendered to Service Affiliates which were not pre-approved (not requiring pre-approval) is compatible with maintaining the Auditor's independence.
| Item 5. | Audit Committee of Listed Registrants. | |
| Not applicable. | ||
| Item 6. | Schedule of Investments. | |
| (a) | Not applicable. | |
| Item 7. | Disclosure of Proxy Voting Policies and Procedures for Closed-End Management | |
| Investment Companies. | ||
| Not applicable. | ||
| Item 8. | Portfolio Managers of Closed-End Management Investment Companies. | |
| Not applicable | ||
| Item 9. | Purchases of Equity Securities by Closed-End Management Investment Companies and | |
| Affiliated Purchasers. | ||
| Not applicable. | ||
| Item 10. | Submission of Matters to a Vote of Security Holders. |
The Registrant has a Nominating Committee (the "Committee"), which is responsible for selecting and nominating persons for election or appointment by the Registrant's Board as Board members. The Committee has adopted a Nominating Committee Charter (the "Charter"). Pursuant to the Charter, the Committee will consider recommendations for nominees from shareholders submitted to the Secretary of the Registrant, c/o The Dreyfus Corporation Legal Department, 200 Park Avenue, 8th Floor East, New York, New York 10166. A nomination submission must include information regarding the recommended nominee as specified in the Charter. This information includes all information relating to a recommended nominee that is required to be disclosed in solicitations or proxy statements for the election of Board members, as well as information
sufficient to evaluate the factors to be considered by the Committee, including character and integrity, business and professional experience, and whether the person has the ability to apply sound and independent business judgment and would act in the interests of the Registrant and its shareholders. Nomination submissions are required to be accompanied by a written consent of the individual to stand for election if nominated by the Board and to serve if elected by the shareholders, and such additional information must be provided regarding the recommended nominee as reasonably requested by the Committee.
| Item 11. | Controls and Procedures. |
(a) The Registrant's principal executive and principal financial officers have concluded, based on their evaluation of the Registrant's disclosure controls and procedures as of a date within 90 days of the filing date of this report, that the Registrant's disclosure controls and procedures are reasonably designed to ensure that information required to be disclosed by the Registrant on Form N-CSR is recorded, processed, summarized and reported within the required time periods and that information required to be disclosed by the Registrant in the reports that it files or submits on Form N-CSR is accumulated and communicated to the Registrant's management, including its principal executive and principal financial officers, as appropriate to allow timely decisions regarding required disclosure.
(b) There were no changes to the Registrant's internal control over financial reporting that occurred during the second fiscal quarter of the period covered by this report that have materially affected, or are reasonably likely to materially affect, the Registrant's internal control over financial reporting.
| Item 12. | Exhibits. |
(a)(1) Code of ethics referred to in Item 2.
(a)(2) Certifications of principal executive and principal financial officers as required by Rule 30a-2(a) under the Investment Company Act of 1940.
(a)(3) Not applicable.
(b) Certification of principal executive and principal financial officers as required by Rule 30a-2(b) under the Investment Company Act of 1940.
| SIGNATURES |
Pursuant to the requirements of the Securities Exchange Act of 1934 and the Investment Company Act of 1940, the Registrant has duly caused this Report to be signed on its behalf by the undersigned, thereunto duly authorized.
Dreyfus Investment Funds
| By: | /s/ J. David Officer | |
| J. David Officer | ||
| President | ||
| Date: | February 23, 2009 | |
Pursuant to the requirements of the Securities Exchange Act of 1934 and the Investment Company Act of 1940, this Report has been signed below by the following persons on behalf of the Registrant and in the capacities and on the dates indicated.
| By: | /s/ J. David Officer | |
| J. David Officer | ||
| President | ||
| Date: | February 23, 2009 | |
| By: | /s/ James Windels | |
| James Windels | ||
| Treasurer | ||
| Date: | February 23, 2009 | |
| EXHIBIT INDEX |
(a)(1) Code of ethics referred to in Item 2.
(a)(2) Certifications of principal executive and principal financial officers as required by Rule 30a-2(a) under the Investment Company Act of 1940. (EX-99.CERT)
(b) Certification of principal executive and principal financial officers as required by Rule 30a-2(b) under the Investment Company Act of 1940. (EX-99.906CERT)