As filed with the Securities and Exchange Commission on January 9, 2007
UNITED STATES
SECURITIES AND EXCHANGE COMMISSION
Washington, D.C. 20549
FORM N-CSR
CERTIFIED SHAREHOLDER REPORT OF REGISTERED
MANAGEMENT INVESTMENT COMPANIES
Investment Company Act file number 811-4840
The Tocqueville Trust
(Exact name of registrant as specified in charter)
The Tocqueville Trust
40 W. 57th Street, 19th Floor
New York, NY 10019
(Address of principal executive offices) (Zip code)
Robert W. Kleinschmidt, President
The Tocqueville Trust
40 W. 57th Street, 19th Floor
New York, NY 10019
(Name and address of agent for service)
212-698-0800
Registrant’s telephone number, including area code
Date of fiscal year end: October 31
Date of reporting period: October 31, 2006
Item 1. Report to Stockholders.
Dear Fellow Shareholder,
By and large, the fiscal year ended October 31, 2006 has been more favorable for our Funds than I would have anticipated twelve months ago.
Periods like the present one, when liquidity and momentum drive markets, are not easy for our investment discipline. Typically, we make money, but less than benchmarks that are pushed ever higher by investors’ frantic search for short-term returns.
Values, across markets, were rare a year ago and are more so today; complacency seems to rule everywhere; and both good and bad news are seen as cause to continue enjoying the global bull market.
At a meeting shortly before our letters to shareholders were due, most of our managers found it difficult to offer any new pearls of wisdom: they would have been happy to reprint their comments of a year ago. The same pretty much applies to me.
Markets are driven in part by fundamentals and in part (perhaps a growing one) by crowd psychology. Though I am more concerned than most by the likelihood of economic or financial problems in the world’s two economic locomotives (the United States and China), I would be willing to rate the economic fundamentals as “neutral”.
The most myopic bulls see valuations that are down significantly from their recent bubble peaks. Historically, however, those remain fairly rich—especially if one takes into account today’s peak profit margins, which may not be sustainable through cycles.
Bear in mind that price/earnings ratios, which largely reflect investors’ expectations, historically have moved in long cycles of more than a decade’s duration. When they have been trending down, as has been the case since 2000, they seldom reversed until the investing public became totally disgusted with equities. This is hardly the case today and, if the start of a major new bull market for world equities is to be ruled out, one must wonder how much remains to be squeezed out of the current one.
Finally, many in the investing crowd expect the global stock market returns of recent years to be replicable ad infinitum. These, too have been above the historical norm and, for reasons that would be too long to document here, I am of the opinion that this expectation is unrealistic.
My only solace is that periods like the present one are not eternal: moods are cyclical and economic or financial parameters always wind up “reversing to the long-term mean”. When this inevitably happens, I believe a strong value-oriented, stock-picking discipline should both protect us on the downside and allow us to identify good contrarian opportunities for the longer term.
With my best wishes for a healthy, happy and financially secure New Year,
Respectfully,

François Sicart
Chairman
The Tocqueville Fund
Dear Fellow Shareholder,
For the fiscal year ended October 31, 2006, the Tocqueville Fund generated a return of 20.50% compared with a 16.34% return for the S&P 500, the index against which we are most often compared.
This represents the seventh consecutive fiscal year in which the Fund has outperformed its benchmark. That record, though gratifying, could be an accident of the calendar. Far more important is the cumulative record over this period. Over the past seven years, the Fund has returned 85.11% while the overall market, as measured by the S&P 500 has gained 13.06%. Of course, in the two year period just before the new millennium, when our style was not in favor, the Fund substantially underperformed its benchmark, 12.42% versus 55.64% and underperformance could return should the market turn against us. Since October 31, 1996, which includes periods of both superior and inferior relative performance, our return is 168.68% compared with 129.03% for the S&P 500.
Outperforming a benchmark is not our primary investment objective. Capital appreciation is, and we try to accomplish this by limiting our exposure to disappointments in the stocks that we own. It is our belief that purchasing and holding the shares of good quality companies when we believe them to be out of favor and depressed in price can be a rewarding long term investment strategy and one that should minimize, to the extent possible, downside risk and nerve wracking volatility. This type of investing, which we call contrarian value requires not only patience, but a willingness to lean against the comfortable consensus.
Longtime shareholders will recognize the tendency of the Fund to be most heavily positioned in shares which defy the conventional wisdom and underrepresented, if invested at all, in companies where everyone knows the outlook is favorable. Thus, earlier this year we added to our underperforming technology and healthcare positions, while trimming or eliminating basic material shares which have driven our performance over the past several years and which have become media and Wall Street darlings.
Notwithstanding the rally in the markets over the past several months, we continue to expect a stock-picker’s market for the foreseeable future. We believe valuations are not low enough, nor are interest rates high enough and economic activity subdued enough to ignite a major bull market with their reversal. On the contrary, we would not be surprised to witness a sluggish market environment over the next couple of years. If so, we believe our approach will continue to add value to client portfolios. If we are wrong, however, and the market is off to the races, we will most likely underperform our benchmarks. Not making as much money as some others is a high class problem and a risk we are willing to take.
As a major investor in the Fund, as well as its manager, I thank you for your support and loyalty to the Tocqueville Fund.
Sincerely,

Robert W. Kleinschmidt
Portfolio Manager
The Tocqueville Fund
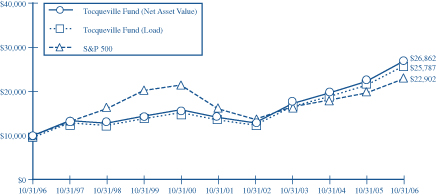
This chart assumes an initial gross investment of $10,000 made on 10/31/96. Returns shown do not reflect the deduction of taxes that a shareholder would pay on fund distributions or the redemption of fund shares. Performance reflects fee waivers in effect. In the absence of fee waivers, total return would be reduced. Returns shown include the reinvestment of all dividends and other distributions. Past performance is not predictive of future performance. Investment return and principal value will fluctuate, so that your shares, when redeemed, may be worth more or less than their original cost.
The Standard & Poor’s 500 Stock Index (S&P 500) is a capital-weighted index, representing the aggregate market value of the common equity of 500 stocks primarily traded on the New York Stock Exchange.
AVERAGE ANNUAL RATE OF RETURN (%)
FOR PERIODS ENDED OCTOBER 31, 2006
| | | | | | | | |
| | | 1 Year | | 3 Year | | 5 Year | | 10 Year |
Tocqueville Fund—Net Asset Value | | 20.50% | | 15.81% | | 13.66% | | 10.39% |
Tocqueville Fund—Load* | | 20.50% | | 15.81% | | 13.66% | | 9.94% |
Standard & Poor’s 500 Stock Index | | 16.34% | | 11.44% | | 7.26% | | 8.64% |
| * | Effective February 1, 2000, the Fund eliminated its sales load. |
The Tocqueville Small Cap Value Fund
Dear Fellow Shareholder,
We are pleased to report that the Tocqueville Small Cap Value Fund finished its fiscal year, ended October 31, 2006 with an 8.81% increase in Net Asset Value to $18.04 per share. While this represents improvement over the 6.79% reported last year, our returns lagged the 19.98% return of our benchmark Russell 2000 Index. As indicated in the past, our goal is not to outperform any index over short-term periods, but rather it is to achieve long-term capital appreciation. Our average annual return since inception in 1994 is 13.29%, and the Fund closed the fiscal year near its all-time high.
Record Long-term Capital Gains Realized
As the year progressed we took advantage of what we believed to be overly optimistic valuations, and substantially reduced our portfolio exposure and concentration in some of our most appreciated energy related, computer software, and other technology investments. As a result of these and other changes, the Fund distributed long-term capital gains of $2.175 per share or 12%.
Cautious Optimism Maintained
In retrospect, the flat performance of the Fund during the first three quarters of the fiscal year mirrored the flat performance of most stocks. Lack of economic progress and fears of deterioration in sectors sensitive to rising energy costs and interest rates were at work. Fortunately, these negative perceptions lessened during the fourth quarter, and the general outlook appears to be improving as of this writing.
Two factors benefited our results last year. Foremost was the unprecedented price volatility of small stocks in general. In addition, we had ample opportunities to balance market risks with continually changing economic and geopolitical perceptions. These two factors enabled us to realize gains and make timely new investments in attractive new sectors.
We made no strategic changes as the year progressed, and concentrated instead on tactical issues. We increased our exposure to small out-of-favor healthcare and technology companies. These two sectors seemed to present us with the most attractive buying opportunities. While some of these investments still carry a level of business risk normally attached to small companies, overall long-term market risk seemed pretty much deflated by the recent poundings these stocks underwent before we bought them. We also diversified our risk exposure by adding what we believed to be promising new stocks to our list.
We eliminated eleven stocks from the Fund for valuation and other reasons, and we added fourteen new ones. Seven of these additions are technology/electronics related and five are small healthcare companies. As of October 31, 2006, we held 43 stocks, up from 40 stocks as of October 31, 2005. We reduced our concentration in our top ten holdings from 40% to 38% of assets. Eight of our top ten stocks are new to that list, and our three largest holdings are computer software companies with attractive long-term growth profiles.
We believe the fourteen additions to the Fund have a number of attractive common features. Most are small companies in emerging industries or market segments. Most are in the process of introducing costs-reducing new products or services which greatly enhance their solid long-term potential. Most fit well with our long practice of seeking to buy good businesses with decent finances that just happen to be undervalued. We believe most were suffering from deflated short-term expectations at their time of purchase, mitigated somewhat by likely prospects for improvement due to new products, pricing flexibility, increasing unit sales over the longer term, and solid relationships with their customers:
Datascope Corp. manufactures and sells catheter-based products used during cardiovascular and vascular surgery procedures; Dendrite Int’l designs and sells computer software that empowers drug industry reps in marketing products to doctors, and in clinical and regulatory compliance tracking; Keithley Instruments designs, manufactures and sells electrical test and measurement instruments used by scientists and engineers in the worldwide electronics industry; Mentor Graphics Corp. designs, sells and services Electronic Design Automation software to the worldwide electronics industry. International Rectifier, FEI Corp., Insight Enterprises designs, manufactures and sells devices and subsystems used to test electronic devices; Pharmion Corp. is a biotechnology company engaged in the licensing, development and commercialization of innovative hematology and oncology products.; Salix Pharmaceuticals develops and markets prescription pharmaceuticals for the treatment of gastrointestinal diseases; Synovis Life Technology Inc. designs, manufactures and markets implantable biomaterial products as well as conductor components used for cardiac rhythm management; Wright Medical Group., Inc. designs, manufactures and sells reconstructive joint devices and bio-orthopedic materials used in knee, hip and other joints replacement surgery. Following is a listing of our ten largest positions by sectors:
| | |
Agile Software (4.6%) | | PLM Software |
Dendrite Int. (4.2%) | | Healthcare Software |
Informatica Inc. (4.1%) | | Database software |
Hercules Inc. (4.0%) | | Chemicals |
Sensient Tech. (3.9%) | | Food ingredients |
3Com Corp. (3.7%) | | Routers |
Ceridian Corp. (3.4%) | | Financial Services |
Wright Medical (3.3%) | | Pharmaceuticals |
ABM Ind. (3.2%) | | Building maintenance |
Mentor Graphics (3.2%) | | Test instruments |
In closing, let me express my gratitude for your selection of the Tocqueville Small Cap Value Fund to achieve your long-term investment goals.
Sincerely,

Jean-Pierre Conreur
Portfolio Manager
The Tocqueville Small Cap Value Fund
This chart assumes an initial gross investment of $10,000 made on 10/31/96. Returns shown do not reflect the deduction of taxes that a shareholder would pay on fund distributions or the redemption of fund shares. Performance reflects fee waivers in effect. In the absence of fee waivers, total return would be reduced. Returns shown include the reinvestment of all dividends and other distributions. Past performance is not predictive of future performance. Investment return and principal value will fluctuate, so that your shares, when redeemed, may be worth more or less than their original cost.
The Russell 2000 Index is an unmanaged index which measures the performance of the 2,000 smallest companies in the Russell 3000 Index, which represents approximately 8% of the total market capitalization of the Russell 3000 Index.
AVERAGE ANNUAL RATE OF RETURN (%)
FOR PERIODS ENDED OCTOBER 31, 2006
| | | | | | | | |
| | | 1 Year | | 3 Year | | 5 Year | | 10 Year |
Tocqueville Small Cap Value Fund—Net Asset Value | | 8.81% | | 4.79% | | 9.45% | | 12.20% |
Tocqueville Small Cap Value Fund—Load* | | 8.81% | | 4.79% | | 9.45% | | 11.74% |
Russell 2000 Index | | 19.98% | | 14.53% | | 13.76% | | 9.84% |
| * | Effective February 1, 2000, the Fund eliminated its sales load. |
The Tocqueville International Value Fund
Dear Fellow Shareholder,
For the twelve months ended October 31, 2006, the Tocqueville International Value Fund’s total U.S. dollar return was 17.39%. In the same period, the Morgan Stanley EAFE Index had a total U.S. dollar return of 28.04%.
For the 5 year period ended October 31, 2006, the Tocqueville International Value Fund’s total U.S. dollar return was 163.08%. In the same period, the Morgan Stanley EAFE Index had a total U.S. dollar return of 101.16%. According to Bloomberg, our 5-year return positions the Fund in the top decile of funds that have a strategy of investing in non-U.S. equities.
Many of the currents of the last few years continued into 2006. Global economic growth continued at a healthy pace and commodity prices remained at lofty levels. In spite of this, inflation and interest rates remained stubbornly low, as low cost emerging markets production relieved cost pressures and burgeoning global liquidity chased bond yields down. Corporate earnings grew at a strong clip, abetted by corporate restructuring, particularly in Europe. Perceived risk, as measured by credit spreads on fixed income securities, remained low, and capital poured into risky assets, like emerging markets. Mergers and acquisitions activity accelerated and overcapitalized private equity firms searched the world for undervalued assets, propelling value realization among publicly traded equities. Risk appetite had a short-lived correction mid-year due to the conflict in Lebanon, rising oil prices, and concerns about a housing and consumer led economic slowdown in the U.S. But that quickly reversed as the Lebanon conflict eased in intensity, oil prices declined, and investor conviction grew that the U.S. Federal Reserve had finished its tightening for this cycle.
During the year, the European BE 500 index increased by 24.72% in local currency terms, the Japanese Nikkei 225 increased by 21.63% in local currency terms, the Morgan Stanley Far East increased by 20.97%. The Euro increased by 6.4% against the U.S. dollar as economic growth there accelerated and interested rates rose, while the Japanese Yen decreased by 0.5%, as markets overlooked Japan’s improving economic fundamentals and leveraged investors borrowed Yen to buy securities elsewhere in the world. Most other currencies increased in value against the U.S. dollar. Underscoring the extent of global risk appetite, yields on long term U.S. dollar-denominated bonds in the Brazil and the Philippines, for example, ended the year at around 6%, and among the best performing stock markets for the year were Vietnam, Venezuela, Botswana and Russia.
During the year, we had gains across geographies and industries, with notable contributions from Dutch animal feed producer Nutreco, Italian clothing maker Benetton, and Korean conglomerate Doosan, all restructuring stories, as well as Japanese game maker Nintendo and Finnish paper producer UPM, both cyclical recovery theses. We sold several positions that met our valuation targets, like Doosan, French aerial platform maker Pinguely-Haulotte, Japanese industrial chain maker Tsubakimoto Chain, Dutch chemical company Akzo Nobel, and French water company Veolia. In terms of geographic exposure, Europe increased from 38% to 40%, largely through price appreciation, Asia increased from 16% to 20% as we added new positions, and Japan was flat at 23%. We maintained small and decreasing exposures to Latin American and Canadian materials companies, and our overall exposure to emerging markets continued to be limited.
Thematically, new investments were concentrated in the areas of media and technology, which have been out of favor with the traditional growth investor constituency and offer compelling individual stock values. In media, we invested in French media conglomerate Vivendi Universal and Thai TV broadcaster BEC World, which are characterized by overcapitalized balance sheets, strong free cash flow, and improving business fundamentals. In technology, we took positions in Japanese software companies Capcom and Square Enix, which are characterized by low valuation multiples of down cycle cash flow, and stand to benefit from the new gaming console product cycle. Otherwise, our new investments have been focused on special situations, like UK nuclear company British Energy and French aerospace propulsion company Safran.
Our investment philosophy is long-term capital appreciation consistent with preservation of capital and our discipline is contrarian, value oriented stock picking. We are focused on positive absolute, rather than relative returns and we do not
pay heed to indices as part of our investment selection process. There are periods when our approach may achieve adequate absolute returns, and yet our returns may lag the benchmark against which we are typically compared. The last 12 months have been such a period. There are two principal reasons for this, both deriving from our investment discipline. First, before and during this fiscal year, we exited several positions, in areas like industrial metals and machinery, where we had made large gains over the last several years and which had become fully valued in our judgment. These same areas continued to produce strong returns during 2006, while the areas where we have been finding value and making new investments, like media and technology, did not. Second, we have had negligible exposure to financial, utility and telecom stocks in Europe, which do not meet our investment criteria for a mix of qualitative and quantitative reasons. These areas represent a large portion of the indices and produced strong returns during 2006. While our discipline led to some missed opportunities in 2006, we believe based on decades of experience that our approach is the best way to achieve the goal of capital appreciation consistent with preservation of capital.
Today, investors are pricing minimal risk into equity securities. To be sure, there are many reasons to be optimistic. Large emerging countries like India and China are fueling global growth, inflation is low for now, economic reform continues to occur in Europe, Japan and most other nations, and despite political posturing, international trade continues to expand. Rogue leaders like Venezuela’s Chavez and North Korea’s Kim have been marginalized or reengaged. Growth is improving living standards in the emerging world, and there has been progress in alleviating health and poverty problems and raising awareness regarding the environment. Corporate balance sheets are strong and equity valuations, while not cheap, are not exceedingly expensive. But when equities ignore risk, the balance tips in favor of negative surprises. And these could come in the form of rising oil prices, further economic slowdown in the U.S., instability in Pakistan or Iran, corporate profit margins deteriorating from current high levels, to name a few. With this potential reality in clear view, we continue to focus our efforts on uncovering individual stock ideas where we expect that internal fundamentals will drive value creation independent of the movements of equity markets.
We continue to hold a structurally bearish view regarding the U.S. dollar. And we expect the non-U.S. markets to benefit from improving corporate governance and management practices, the development of local equity cultures, and positive capital flows. Against this background, inefficient pricing of equities can provide exceptional opportunities. We continue to employ our investment discipline, seeking to discover fundamentally attractive companies that are out of favor and undervalued, and to provide our shareholders with above average returns with below average risk.
Sincerely,
| | |
| | |
| James Hunt | | Francois Sicart |
| Portfolio Manager | | Portfolio Manager |
The Tocqueville International Value Fund
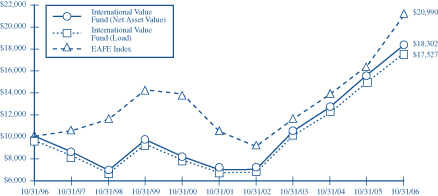
This chart assumes an initial gross investment of $10,000 made on 10/31/96. Returns shown do not reflect the deduction of taxes that a shareholder would pay on fund distributions or the redemption of fund shares. Performance reflects fee waivers in effect. In the absence of fee waivers, total return would be reduced. Returns shown include the reinvestment of all dividends and other distributions. Past performance is not predictive of future performance. Investment return and principal value will fluctuate, so that your shares, when redeemed, may be worth more or less than their original cost.
The Morgan Stanley EAFE Index is an unmanaged market-capitalization-weighted index composed of companies representative of the market structure of 20 Developed Market Countries in Europe, Australia, Asia and the Far East.
AVERAGE ANNUAL RATE OF RETURN (%)
FOR PERIODS ENDED OCTOBER 31, 2006
| | | | | | | | |
| | | 1 Year | | 3 Year | | 5 Year | | 10 Year |
Tocqueville International Value Fund—Net Asset Value | | 17.39% | | 20.41% | | 21.34% | | 6.23% |
Tocqueville International Value Fund—Load* | | 17.39% | | 20.41% | | 21.34% | | 5.80% |
Morgan Stanley EAFE Index | | 28.04% | | 21.89% | | 15.00% | | 7.70% |
| * | Effective February 1, 2000, the Fund eliminated its sales load. |
The Tocqueville Gold Fund
Dear Fellow Shareholder,
For the 2006 fiscal year ending October 31st, the Tocqueville Gold Fund produced a return of 52.54% vs. 30.53% for the XAU (Philadelphia Stock Exchange Gold and Silver Index) and 16.34% for the S&P 500. This marked a continuation of the upward trend in the gold price that has been in place since August of 1999. The prior bull market in gold lasted from 1968 to 1982, or 15 years. By that measure, we believe the current bull market has considerably more time to run.
The current dollar, based on official inflation statistics, is worth approximately half of what it was worth in 1980 when gold topped $800. Making the adjustment for the dollar’s loss of value since then, the current gold price is barely above $300. In other words, we see gold as having the potential to continue to climb and possibly reach its previous bull market high. Our belief is that the government’s official inflation numbers are overstating the effects of inflation and this, if correct, only reinforces our argument.
Despite these considerations, many question whether the best days for gold are behind it. A new investment commitment to gold after a seven year run might seem too late in the game. Capital market flows into the gold sector continue to be hesitant in nature and small in scale. Over the past year, gold has been seen by many as just another hard asset, a subset of tangible assets. The rise in price has mostly been attributed to the China story, i.e., the growing demand for hard assets in emerging market economies, while we believe little thought has been given to gold’s role as an alternative to monetary assets.
In our view, failure to comprehend gold’s monetary nature has resulted in a confusion with other commodities. Signs are encouraging that this is changing. The recently popular notion that the prices of gold and oil are inextricably linked is, in our opinion, all but dead. Since September 30, gold is up 5.47% and oil is down 3.78%, while the Reuters/Jefferies Commodity Research Bureau Index (“CRB”) is up 0.37%. Since the beginning of 2006, oil is down 0.82% and gold is up 22.48%, while the CRB is down 7.57%. In our recent web site article, Trivial Pursuit, we suggested that the next powerful leg of the gold market would be triggered by a separation of gold from other commodities. We appear to be in the early stages of that separation.
Gold may be a commodity, but it is the only significant one with monetary characteristics. A widening spread between gold and other commodities may signal trouble ahead for financial assets. For example, during the period June 1999 to December 2002, gold outperformed the CRB by 45% (+32% vs. +22%) and the S&P 500 declined 36%. The logic is that during periods of severe underperformance of financial assets, gold’s safe haven aspects become more highly valued than in more halcyon times. On a year to date basis, gold has outperformed the CRB by a significant percentage as already noted. However, the S&P 500 is also up so far this calendar year, by 12.06%. Is gold’s behavior relative to other commodities a danger signal, as it was seven years ago, or a false alarm?
Only time will tell, but today’s compressed credit spreads suggest that investors are reaching for yield. Reckless disregard for risk was, we believe, the precursor to the dot com bust. Is today’s environment any different? Italy borrows for 23 bps more than Germany. Sub prime borrowers get 30 year mortgages at a few basis points more than sovereign debt. Financial engineers repackage risk in collateralized debt obligations, instruments that are all but incomprehensible to external analysis. The next leg in the gold price will likely say more about the under pricing of risk than the traditional drivers of the metal such as inflation, deflation, or geopolitical events. We believe that gold rising against economically sensitive commodities will signify that a general reappraisal of risk is underway.
We believe the idea that all “hard” assets provide a safe haven from depreciating currencies is a dangerous one. It might seem valid for a while based upon the power of common belief to generate capital flows, but it will inevitably fall apart during periods of severe economic distortion caused by monetary imbalances. It appears to us that efforts to trivialize gold’s monetary significance are a key to the present day money illusion, that more paper equals more prosperity. It is far more palatable to the political and economic establishment to explain away the strength in the price of gold as a consequence of growing Asian prosperity or the reflection of an extreme fringe of investment thought (as suggested by Greenspan) than to read it as a reflection of flawed economic policies, archaic conventions, and corrupt institutions. A rise in the price of gold is equivalent to a fall in the value of financial assets. It is our view that the strength in the metal is a sign of distrust in the ability of present day financial instruments, including paper currencies, to preserve
capital over time. The global bid for physical gold is potentially immense. We believe it will be generated not by ephemeral and flaky speculative interests seeking instant gratification, but rather by the considered actions of capital interests with a long term perspective driven primarily by the desire to convey present day wealth to future generations.
In our view, we are still in the very early stages of a bull market in gold. When it has completed its course, we believe the duration and magnitude will exceed any historical precedent.
Sincerely,

John C. Hathaway
Portfolio Manager
The Tocqueville Gold Fund
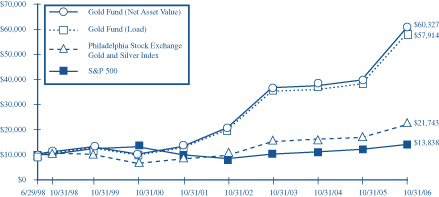
This chart assumes an initial gross investment of $10,000 made on 6/29/98 (commencement of operations). Returns shown do not reflect the deduction of taxes that a shareholder would pay on fund distributions or the redemption of fund shares. Performance reflects fee waivers in effect. In the absence of fee waivers, total return would be reduced. Returns shown include the reinvestment of all dividends and other distributions. Past performance is not predictive of future performance. Investment return and principal value will fluctuate, so that your shares, when redeemed, may be worth more or less than their original cost.
In 2003 and 2006, the performance of The Tocqueville Gold Fund was achieved during a period of unusually favorable market conditions. Such performance may not be sustainable.
The Philadelphia Stock Exchange Gold and Silver Index is an unmanaged capitalization-weighted index which includes the leading companies involved in the mining of gold and silver.
The Standard & Poor’s 500 Stock Index (S&P 500) is a capital-weighted index, representing the aggregate market value of the common equity of 500 stocks primarily traded on the New York Stock Exchange.
AVERAGE ANNUAL RATE OF RETURN (%)
FOR PERIODS ENDED OCTOBER 31, 2006
| | | | | | | | |
| | | 1 Year | | 3 Year | | 5 Year | | Since inception 6/29/1998 |
Tocqueville Gold Fund—Net Asset Value | | 52.54% | | 18.24% | | 35.69% | | 24.05% |
Tocqueville Gold Fund—Load* | | 52.54% | | 18.24% | | 35.69% | | 23.42% |
Philadelphia Stock Exchange Gold and Silver Index | | 30.53% | | 13.15% | | 21.91% | | 9.76% |
Standard & Poor’s 500 Stock Index | | 16.34% | | 11.44% | | 7.26% | | 3.92% |
| * | Effective February 1, 2000, the Fund eliminated its sales load. |
Legend Related to Shareholder Letters
Past performance does not guarantee future results. The investment returns and principal value will fluctuate and the investor’s share, when redeemed, may be worth more or less than their original cost. You should consider the investment objectives, risks, charges and expenses of each Fund before investing. The Prospectus contains this and other information about The Tocqueville Trust and you should read it carefully before investing.
Each Fund’s holdings are also subject to change without notice. The mention of specific securities is not a recommendation or solicitation for any person to buy, sell or hold any mentioned security. The securities mentioned in the articles are not representative of each Fund’s entire portfolio.
There are special risks associated with investing in small cap and mid cap stocks, including: small and mid cap companies rely on limited product lines, financial resources and business activities that may make them more susceptible than larger companies to setbacks or downturns; and small and mid cap companies are less liquid and more thinly traded which make them more volatile than stocks of larger companies.
There are special risks associated with investing in foreign securities, including: the value of foreign currencies may decline relative to the US dollar; a foreign government may expropriate a Fund’s assets; and political, social or economic instability in a foreign country in which a Fund invests may cause the value of the Fund’s investments to decline.
The Tocqueville Gold Fund is subject to special risks associated with investing in gold and other precious metals, including: the price of gold/precious metals may be subject to wide fluctuations; the market for gold/precious metals is relatively limited; the sources of gold/precious metals are concentrated in countries that have the potential for instability; and the market for gold/precious metals is unregulated.
This commentary is not an advertisement or solicitation to subscribe to The Tocqueville Trust, which may only be made by Prospectus. This material must be preceded or accompanied by the Trust’s Prospectus.
The Tocqueville Trust Mutual Funds are distributed by Lepercq, de Neuflize/Tocqueville Securities L.P.
Expense Example—October 31, 2006
As a shareholder of The Tocqueville Trust (the “Funds”), you incur ongoing costs, including management fees; distribution fees; and other Fund expenses. This example is intended to help you understand your ongoing costs (in dollars) of investing in the Funds and to compare costs with the ongoing costs of investing in other mutual funds.
The Example is based on an investment of $1,000 invested at the beginning of the period and held the entire period (May 1, 2006-October 31, 2006).
Actual Expenses
The first line of the table below provides information about actual account values and actual expenses. You may use the information in this line, together with the amount you invested, to estimate the expenses that you paid over the period. Simply divide your account value by $1,000 (for example, an $8,600 account value divided by $1,000 = 8.6), then multiply the result by the number in the first line under the heading entitled “Expenses Paid During Period” to estimate the expenses you paid on your account during this period.
Hypothetical Example for Comparison Purposes
The second line of the table below provides information about hypothetical account values and hypothetical expenses based on the Funds’ actual expense ratios and an assumed rate of return of 5% per year before expenses, which is not the Funds’ actual return. The hypothetical account values and expenses may not be used to estimate the actual ending account balance or expenses you paid for the period. You may use this information to compare the ongoing costs of investing in the Funds and other funds. To do so, compare this 5% hypothetical example with the 5% hypothetical examples that appear in the shareholder reports of the other funds.
Please note that the expenses shown in the table are meant to highlight your ongoing costs only and do not reflect any transactional costs, such as sales charges (loads), redemption fees, or exchange fees. Therefore, the second line of the table is useful in comparing ongoing costs only, and will not help you determine the relative costs of owning different funds. In addition, if these transactional costs were included, your costs would have been higher.
Expense Example Tables
The Tocqueville Fund
| | | | | | | | | |
| | | Beginning
Account Value
May 1, 2006 | | Ending Account Value
October 31, 2006 | | Expenses Paid During Period* May 1, 2006 -
October 31, 2006 |
Actual | | $ | 1,000.00 | | $ | 1,015.30 | | $ | 6.60 |
Hypothetical (5% return before expenses) | | | 1,000.00 | | | 1,018.65 | | | 6.61 |
| * | Expenses are equal to the Fund’s annualized expense ratio of 1.30%, mutiplied by the average account value over the period, muliplied by 184/365 to reflect the one-half year period. |
The Tocqueville Small Cap Value Fund
| | | | | | | | | |
| | | Beginning Account Value May 1, 2006 | | Ending Account Value
October 31, 2006 | | Expenses Paid
During Period* May 1, 2006 -
October 31, 2006 |
Actual | | $ | 1,000.00 | | $ | 968.30 | | $ | 6.65 |
Hypothetical (5% return before expenses) | | | 1,000.00 | | | 1,018.45 | | | 6.82 |
| * | Expenses are equal to the Fund’s annualized expense ratio of 1.34%, mutiplied by the average account value over the period, muliplied by 184/365 to reflect the one-half year period. |
The Tocqueville International Value Fund
| | | | | | | | | |
| | | Beginning Account Value
May 1, 2006 | | Ending Account Value
October 31, 2006 | | Expenses Paid
During Period* May 1, 2006 -
October 31, 2006 |
Actual | | $ | 1,000.00 | | $ | 969.80 | | $ | 7.99 |
Hypothetical (5% return before expenses) | | | 1,000.00 | | | 1,017.09 | | | 8.19 |
| * | Expenses are equal to the Fund’s annualized expense ratio of 1.61%, mutiplied by the average account value over the period, muliplied by 184/365 to reflect the one-half year period. |
The Tocqueville Gold Fund
| | | | | | | | | |
| | | Beginning Account Value
May 1, 2006 | | Ending Account Value
October 31, 2006 | | Expenses Paid
During Period* May 1, 2006 -
October 31, 2006 |
Actual | | $ | 1,000.00 | | $ | 913.80 | | $ | 7.24 |
Hypothetical (5% return before expenses) | | | 1,000.00 | | | 1,017.64 | | | 7.63 |
| * | Expenses are equal to the Fund’s annualized expense ratio of 1.50%, mutiplied by the average account value over the period, muliplied by 184/365 to reflect the one-half year period. |
The Tocqueville Fund
Financial Highlights
| | | | | | | | | | | | | | | | | | | | |
Per share operating performance
(For a share outstanding throughout the year) | | Years Ended October 31, | |
| | 2006 | | | 2005 | | | 2004 | | | 2003 | | | 2002 | |
Net asset value, beginning of year | | $ | 22.17 | | | $ | 20.43 | | | $ | 17.99 | | | $ | 13.42 | | | $ | 14.99 | |
| | | | | | | | | | | | | | | | | | | | |
Operations: | | | | | | | | | | | | | | | | | | | | |
Net investment income (loss) | | | 0.14 | | | | 0.15 | | | | 0.05 | | | | 0.02 | | | | (0.01 | ) |
Net realized and unrealized gain (loss) | | | 4.33 | | | | 2.53 | | | | 2.41 | | | | 4.55 | | | | (1.28 | ) |
| | | | | | | | | | | | | | | | | | | | |
Total from investment operations (1) | | | 4.47 | | | | 2.68 | | | | 2.46 | | | | 4.57 | | | | (1.29 | ) |
| | | | | | | | | | | | | | | | | | | | |
Dividends and distributions to shareholders: | | | | | | | | | | | | | | | | | | | | |
Dividends from net investment income | | | (0.22 | ) | | | (0.12 | ) | | | (0.02 | ) | | | — | | | | (0.01 | ) |
Distributions from net realized gains | | | (2.17 | ) | | | (0.82 | ) | | | — | | | | — | | | | (0.27 | ) |
| | | | | | | | | | | | | | | | | | | | |
Total dividends and distributions | | | (2.39 | ) | | | (0.94 | ) | | | (0.02 | ) | | | — | | | | (0.28 | ) |
| | | | | | | | | | | | | | | | | | | | |
Change in net asset value for the year | | | 2.08 | | | | 1.74 | | | | 2.44 | | | | 4.57 | | | | (1.57 | ) |
| | | | | | | | | | | | | | | | | | | | |
Net asset value, end of year | | $ | 24.25 | | | $ | 22.17 | | | $ | 20.43 | | | $ | 17.99 | | | $ | 13.42 | |
| | | | | | | | | | | | | | | | | | | | |
Total return | | | 20.5 | % | | | 13.4 | % | | | 13.7 | % | | | 34.1 | % | | | (8.9 | )% |
Ratios/supplemental data | | | | | | | | | | | | | | | | | | | | |
Net assets, end of year (000) | | $ | 392,495 | | | $ | 175,791 | | | $ | 145,435 | | | $ | 149,497 | | | $ | 70,134 | |
Ratio to average net assets: | | | | | | | | | | | | | | | | | | | | |
Expenses (2) | | | 1.30 | % | | | 1.34 | % | | | 1.34 | % | | | 1.40 | % | | | 1.40 | % |
Net investment income (loss) (2) | | | 0.68 | % | | | 0.68 | % | | | 0.25 | % | | | 0.17 | % | | | (0.06 | %) |
Portfolio turnover rate | | | 32 | % | | | 45 | % | | | 40 | % | | | 32 | % | | | 62 | % |
| (1) | Total from investment operations per share includes redemption fees of $0.002, $0.003, $0.001 and $0.000 per share for the years ended October 31, 2006, 2005, 2004 and 2003, respectively. |
| (2) | Net of fees waived amounting to 0.07%, 0.01% and 0.06% of average net assets for the years ended October 31, 2003, 2002 and 2001, respectively. |
The accompanying notes are an integral part of these financial statements.
The Tocqueville Small Cap Value Fund
Financial Highlights
| | | | | | | | | | | | | | | | | | | | |
Per share operating performance (For a share outstanding throughout the year) | | Years Ended October 31, | |
| | 2006 | | | 2005 | | | 2004 | | | 2003 | | | 2002 | |
Net asset value, beginning of year | | $ | 16.58 | | | $ | 16.11 | | | $ | 18.83 | | | $ | 12.18 | | | $ | 15.09 | |
| | | | | | | | | | | | | | | | | | | | |
Operations: | | | | | | | | | | | | | | | | | | | | |
Net investment loss | | | (0.07 | ) | | | (0.13 | ) | | | (0.11 | ) | | | (0.08 | ) | | | (0.08 | ) |
Net realized and unrealized gain (loss) | | | 1.53 | | | | 1.26 | | | | 0.21 | | | | 6.73 | | | | (1.45 | ) |
| | | | | | | | | | | | | | | | | | | | |
Total from investment operations (1) | | | 1.46 | | | | 1.13 | | | | 0.10 | | | | 6.65 | | | | (1.53 | ) |
| | | | | | | | | | | | | | | | | | | | |
Distributions to shareholders: | | | | | | | | | | | | | | | | | | | | |
Distributions from net realized gains | | | — | | | | (0.66 | ) | | | (2.82 | ) | | | — | | | | (1.38 | ) |
| | | | | | | | | | | | | | | | | | | | |
Total distributions | | | — | | | | (0.66 | ) | | | (2.82 | ) | | | — | | | | (1.38 | ) |
| | | | | | | | | | | | | | | | | | | | |
Change in net asset value for the year | | | 1.46 | | | | 0.47 | | | | (2.72 | ) | | | 6.65 | | | | (2.91 | ) |
| | | | | | | | | | | | | | | | | | | | |
Net asset value, end of year | | $ | 18.04 | | | $ | 16.58 | | | $ | 16.11 | | | $ | 18.83 | | | $ | 12.18 | |
| | | | | | | | | | | | | | | | | | | | |
Total return | | | 8.8 | % | | | 6.8 | % | | | (1.0 | )% | | | 54.6 | % | | | (11.7 | )% |
Ratios/supplemental data | | | | | | | | | | | | | | | | | | | | |
Net assets, end of year (000) | | $ | 52,701 | | | $ | 57,576 | | | $ | 75,005 | | | $ | 73,518 | | | $ | 50,879 | |
Ratio to average net assets: | | | | | | | | | | | | | | | | | | | | |
Expenses | | | 1.34 | % | | | 1.39 | % | | | 1.41 | % | | | 1.36 | % | | | 1.44 | % |
Net investment loss | | | (0.38 | )% | | | (0.67 | )% | | | (0.61 | )% | | | (0.48 | )% | | | (0.62 | )% |
Portfolio turnover rate | | | 45 | % | | | 30 | % | | | 19 | % | | | 65 | % | | | 25 | % |
| (1) | Total from investment operations per share includes redemption fees of $0.015, $0.006, $0.02 and $0.03 per share for the years ended October 31, 2006, 2005, 2004 and 2003, respectively. |
The accompanying notes are an integral part of these financial statements.
The Tocqueville International Value Fund
Financial Highlights
| | | | | | | | | | | | | | | | | | | | |
Per share operating performance (For a share outstanding throughout the year) | | Years Ended October 31, | |
| | 2006 | | | 2005 | | | 2004 | | | 2003 | | | 2002 | |
Net asset value, beginning of year | | $ | 16.06 | | | $ | 13.10 | | | $ | 10.90 | | | $ | 7.27 | | | $ | 7.24 | |
| | | | | | | | | | | | | | | | | | | | |
Operations: | | | | | | | | | | | | | | | | | | | | |
Net investment income | | | 0.27 | | | | 0.04 | | | | 0.09 | | | | 0.06 | | | | 0.01 | |
Net realized and unrealized gain | | | 2.30 | | | | 3.00 | | | | 2.15 | | | | 3.58 | | | | 0.02 | |
| | | | | | | | | | | | | | | | | | | | |
Total from investment operations (1) | | | 2.57 | | | | 3.04 | | | | 2.24 | | | | 3.64 | | | | 0.03 | |
| | | | | | | | | | | | | | | | | | | | |
Dividends and distributions to shareholders: | | | | | | | | | | | | | | | | | | | | |
Dividends from net investment income | | | (0.05 | ) | | | (0.08 | ) | | | (0.04 | ) | | | (0.01 | ) | | | — | |
Distributions from net realized gains | | | (1.86 | ) | | | — | | | | — | | | | — | | | | — | |
| | | | | | | | | | | | | | | | | | | | |
Total dividends and distributions | | | (1.91 | ) | | | (0.08 | ) | | | (0.04 | ) | | | (0.01 | ) | | | — | |
| | | | | | | | | | | | | | | | | | | | |
Change in net asset value for the year | | | 0.66 | | | | 2.96 | | | | 2.20 | | | | 3.63 | | | | 0.03 | |
| | | | | | | | | | | | | | | | | | | | |
Net asset value, end of year | | $ | 16.72 | | | $ | 16.06 | | | $ | 13.10 | | | $ | 10.90 | | | $ | 7.27 | |
| | | | | | | | | | | | | | | | | | | | |
Total return | | | 17.4 | % | | | 23.3 | % | | | 20.6 | % | | | 50.1 | % | | | 0.4 | % |
Ratios/supplemental data | | | | | | | | | | | | | �� | | | | | | | |
Net assets, end of year (000) | | $ | 225,234 | | | $ | 215,711 | | | $ | 196,424 | | | $ | 129,875 | | | $ | 78,951 | |
Ratio to average net assets: | | | | | | | | | | | | | | | | | | | | |
Expenses | | | 1.61 | % | | | 1.66 | % | | | 1.71 | % | | | 1.77 | % | | | 1.73 | % |
Net investment income | | | 1.49 | % | | | 0.29 | % | | | 0.85 | % | | | 0.72 | % | | | 0.16 | % |
Portfolio turnover rate | | | 39 | % | | | 35 | % | | | 43 | % | | | 55 | % | | | 61 | % |
| (1) | Total from investment operations per share includes redemption fees of $0.011, $0.003, $0.01, $0.005 and $0.03 per share for the years ended October 31, 2006, 2005, 2004, 2003 and 2002, respectively. |
The accompanying notes are an integral part of these financial statements.
The Tocqueville Gold Fund
Financial Highlights
| | | | | | | | | | | | | | | | | | | | |
Per share operating performance (For a share outstanding throughout the year) | | Years Ended October 31, | |
| | 2006 | | | 2005 | | | 2004 | | | 2003 | | | 2002 | |
Net asset value, beginning of year | | $ | 35.51 | | | $ | 34.84 | | | $ | 34.71 | | | $ | 20.49 | | | $ | 13.10 | |
| | | | | | | | | | | | | | | | | | | | |
Operations: | | | | | | | | | | | | | | | | | | | | |
Net investment loss | | | (0.22 | ) | | | (0.33 | ) | | | (0.33 | ) | | | (0.14 | ) | | | (0.08 | ) |
Net realized and unrealized gain (1) | | | 18.21 | | | | 2.36 | | | | 1.04 | | | | 15.41 | | | | 7.53 | |
| | | | | | | | | | | | | | | | | | | | |
Total from investment operations (2) | | | 17.99 | | | | 2.03 | | | | 0.71 | | | | 15.27 | | | | 7.45 | |
| | | | | | | | | | | | | | | | | | | | |
Dividends and distributions to shareholders: | | | | | | | | | | | | | | | | | | | | |
Dividends from net investment income | | | — | | | | — | | | | (0.03 | ) | | | — | | | | — | |
Dividends from net realized gains | | | (2.09 | ) | | | (1.36 | ) | | | (0.55 | ) | | | (1.05 | ) | | | (0.06 | ) |
| | | | | | | | | | | | | | | | | | | | |
Total distributions | | | (2.09 | ) | | | (1.36 | ) | | | (0.58 | ) | | | (1.05 | ) | | | (0.06 | ) |
| | | | | | | | | | | | | | | | | | | | |
Change in net asset value for the year | | | 15.90 | | | | 0.67 | | | | 0.13 | | | | 14.22 | | | | 7.39 | |
| | | | | | | | | | | | | | | | | | | | |
Net asset value, end of year | | $ | 51.41 | | | $ | 35.51 | | | $ | 34.84 | | | $ | 34.71 | | | $ | 20.49 | |
| | | | | | | | | | | | | | | | | | | | |
Total return | | | 52.5 | % | | | 6.2 | % | | | 2.0 | % | | | 77.3 | % | | | 57.2 | % |
Ratios/supplemental data | | | | | | | | | | | | | | | | | | | | |
Net assets, end of year (000) | | $ | 833,254 | | | $ | 538,492 | | | $ | 539,190 | | | $ | 433,554 | | | $ | 137,210 | |
Ratios to average net assets: | | | | | | | | | | | | | | | | | | | | |
Expenses | | | 1.50 | % | | | 1.59 | % | | | 1.58 | % | | | 1.68 | % | | | 1.68 | % |
Net investment income (loss) | | | (0.51 | )% | | | (0.97 | )% | | | (1.11 | )% | | | (0.77 | )% | | | (0.61 | )% |
Portfolio turnover rate | | | 30 | % | | | 27 | % | | | 24 | % | | | 40 | % | | | 72 | % |
| (1) | As described in Note 4 to the financial statements , during the year ended October 31, 2004, the Fund incurred certain losses as a result of a pricing error. The Investment Adviser reimbursed the Fund for the amount of the loss which had a per share impact of $0.004. |
| (2) | Total from investment operations per share includes redemption fees of $0.06, $0.02, $0.09, $0.05 and $0.09 per share for the years ended October 31, 2006, 2005, 2004, 2003 and 2002, respectively. |
The accompanying notes are an integral part of these financial statements.
The Tocqueville Fund
Schedule of Investments as of October 31, 2006
| | | | | |
| Common Stocks—90.4% | | Shares | | Value |
Aerospace & Defense—1.1% | | | | | |
Boeing Co. | | 50,000 | | $ | 3,993,000 |
Ladish, Inc.(a) | | 9,000 | | | 280,980 |
| | | | | | 4,273,980 |
Airlines—0.8% | | | | | |
SkyWest, Inc. | | 112,000 | | | 2,985,920 |
Automobiles—0.8% | | | | | |
Tata Motors Ltd. ADR(b) | | 170,000 | | | 3,090,600 |
Beverages—2.7% | | | | | |
Anheuser-Busch Companies, Inc. | | 90,000 | | | 4,267,800 |
The Coca-Cola Co. | | 100,000 | | | 4,672,000 |
Koninklijke Grolsch N.V.(b) | | 41,500 | | | 1,483,070 |
| | | | | | 10,422,870 |
Biotechnology—1.2% | | | | | |
Kendle International, Inc.(a) | | 7,000 | | | 242,340 |
Pharmion Corp.(a) | | 190,000 | | | 4,645,500 |
| | | | | | 4,887,840 |
Building Products—0.2% | | | | | |
Masco Corp. | | 30,000 | | | 829,500 |
Capital Markets—0.9% | | | | | |
The Bank of New York Co., Inc. | | 100,000 | | | 3,437,000 |
Chemicals—2.6% | | | | | |
EI Du Pont de Nemours & Co. | | 150,000 | | | 6,870,000 |
W.R. Grace & Co.(a) | | 250,000 | | | 3,350,000 |
| | | | | | 10,220,000 |
Commercial Banks—4.3% | | | | | |
East West Bancorp, Inc. | | 50,000 | | | 1,825,500 |
First Midwest Bancorp Inc/IL | | 41,200 | | | 1,566,836 |
HSBC Holdings PLC ADR(b) | | 24,538 | | | 2,342,642 |
M&T Bank Corp. | | 10,000 | | | 1,218,100 |
Marshall & Ilsley Corp. | | 35,000 | | | 1,677,900 |
Mitsubishi Ufj Financial Group, Inc. ADR(b) | | 519,000 | | | 6,617,250 |
Wilmington Trust Corp. | | 40,000 | | | 1,663,200 |
| | | | | | 16,911,428 |
Commercial Physical And Biological Research—0.1% | | | |
Essex Corp.(a) | | 13,000 | | | 255,840 |
Commercial Services & Supplies—2.8% | | | |
Avery Dennison Corp. | | 70,000 | | | 4,419,800 |
DeVry, Inc.(a) | | 115,000 | | | 2,800,250 |
Pico Holdings, Inc.(a) | | 9,500 | | | 307,135 |
Steelcase, Inc. | | 214,000 | | | 3,545,980 |
| | | | | | 11,073,165 |
Communications Equipment—5.6% | | | |
Cisco Systems, Inc.(a) | | 475,000 | | | 11,461,750 |
Juniper Networks, Inc.(a) | | 200,000 | | | 3,444,000 |
| | | | | |
| Common Stocks (continued) | | Shares | | Value |
Nokia Oyj ADR(b) | | 250,000 | | $ | 4,970,000 |
Nortel Networks Corp.(a)(b) | | 1,000,000 | | | 2,230,000 |
| | | | | | 22,105,750 |
Computers & Peripherals—1.7% | | | | | |
Apple Computer, Inc.(a) | | 2,000 | | | 162,160 |
Dell, Inc.(a) | | 155,000 | | | 3,771,150 |
EMC Corp.(a) | | 200,000 | | | 2,450,000 |
Key Tronics Corp.(a) | | 50,562 | | | 291,237 |
| | | | | | 6,674,547 |
Construction & Engineering—0.6% | | | |
Chicago Bridge & Iron Co., N.V. ADR(b) | | 100,000 | | | 2,456,000 |
Construction Materials—0.9% | | | | | |
Cemex S.A. de C.V. ADR(a)(b) | | 112,832 | | | 3,468,456 |
Containers & Packaging—0.7% | | | | | |
Sonoco Products Co. | | 75,000 | | | 2,661,000 |
Discount—0.0% | | | | | |
Home Depot, Inc. | | 4,000 | | | 149,320 |
Diversified Financial Services—1.2% | | | |
Citigroup, Inc. | | 90,000 | | | 4,514,400 |
Diversified Telecommunication
Services—4.1% | | | |
Alaska Communications Systems Group, Inc. | | 421,000 | | | 6,058,190 |
Chunghwa Telecom Company Ltd. ADR(b) | | 250,000 | | | 4,572,500 |
Verizon Communications, Inc. | | 150,000 | | | 5,550,000 |
| | | | | | 16,180,690 |
Electric Utilities—2.6% | | | | | |
FPL Group, Inc. | | 150,000 | | | 7,650,000 |
Korea Electric Power Corp. ADR(b) | | 120,000 | | | 2,373,600 |
| | | | | | 10,023,600 |
Electrical Appliances, Television And Radio Sets—0.8% | | | |
Samsung Electronics Co., Ltd. GDR(b) | | 9,300 | | | 3,015,442 |
Electrical Equipment—0.1% | | | | | |
The Lamson & Sessions Co.(a) | | 3,000 | | | 65,640 |
Regal-Beloit Corp. | | 5,500 | | | 271,975 |
| | | | | | 337,615 |
Electronic Equipment & Instruments—0.5% | | | |
Itron, Inc.(a) | | 3,000 | | | 163,320 |
Molex, Inc. | | 50,000 | | | 1,745,000 |
| | | | | | 1,908,320 |
Energy Equipment & Services—2.1% | | | |
Schlumberger Ltd. | | 128,500 | | | 8,105,780 |
The accompanying notes are an integral part of these financial statements.
The Tocqueville Fund
Schedule of Investments as of October 31, 2006
| | | | | |
| Common Stocks (continued) | | Shares | | Value |
Food & Staples Retailing—1.7% | | | | | |
Sysco Corp. | | 50,000 | | $ | 1,749,000 |
Wal-Mart Stores, Inc. | | 100,000 | | | 4,928,000 |
| | | | | | 6,677,000 |
Food Products—1.8% | | | | | |
China Green Holdings Ltd.(b) | | 402,000 | | | 175,227 |
Sara Lee Corp. | | 200,000 | | | 3,420,000 |
Unilever NV ADR(b) | | 150,000 | | | 3,630,000 |
| | | | | | 7,225,227 |
Health Care Equipment & Supplies—2.2% | | | |
Boston Scientific Corp.(a) | | 100,000 | | | 1,591,000 |
Medtronic, Inc. | | 40,000 | | | 1,947,200 |
Stryker Corp. | | 32,500 | | | 1,699,425 |
Thoratec Corp.(a) | | 220,000 | | | 3,465,000 |
| | | | | | 8,702,625 |
Health Care Providers & Services—1.1% | | | |
Aetna, Inc. | | 75,000 | | | 3,091,500 |
UnitedHealth Group, Inc. | | 25,000 | | | 1,219,500 |
| | | | | | 4,311,000 |
Household Durables—0.2% | | | | | |
Leggett & Platt, Inc. | | 40,000 | | | 934,000 |
Household Products—0.4% | | | |
Colgate-Palmolive Co. | | 15,000 | | | 959,550 |
Kimberly-Clark Corp. | | 12,000 | | | 798,240 |
| | | | | | 1,757,790 |
Industrial Conglomerates—3.6% | | | | | |
3M Co. | | 55,000 | | | 4,336,200 |
General Electric Co. | | 175,000 | | | 6,144,250 |
Tyco International Ltd.(b) | | 125,000 | | | 3,678,750 |
| | | | | | 14,159,200 |
Insurance—5.2% | | | |
The Allstate Corp. | | 50,000 | | | 3,068,000 |
American International Group, Inc. | | 100,000 | | | 6,717,000 |
Conseco, Inc.(a) | | 250,000 | | | 5,085,000 |
Hannover Rueckverscherung AG(a)(b) | | 60,000 | | | 2,546,234 |
IPC Holdings Ltd.(b) | | 100,000 | | | 3,004,000 |
| | | | | | 20,420,234 |
Internet Software & Services—1.6% | | | |
webMethods, Inc.(a) | | 310,000 | | | 2,331,200 |
Yahoo!, Inc.(a) | | 150,000 | | | 3,951,000 |
| | | | | | 6,282,200 |
IT Services—0.4% | | | |
Automatic Data Processing, Inc. | | 35,000 | | | 1,730,400 |
Machinery—2.6% | | | |
Cummins, Inc. | | 2,500 | | | 317,450 |
Illinois Tool Works, Inc. | | 40,000 | | | 1,917,200 |
| | | | | |
| Common Stocks (continued) | | Shares | | Value |
The Manitowoc Co., Inc. | | 81,000 | | $ | 4,445,280 |
Parker Hannifin Corp. | | 40,000 | | | 3,345,200 |
| | | | | | 10,025,130 |
Media—3.0% | | | |
Clear Channel Communications, Inc. | | 115,000 | | | 4,007,750 |
Dow Jones & Co, Inc. | | 140,000 | | | 4,912,600 |
Getty Images, Inc.(a) | | 30,000 | | | 1,299,300 |
John Wiley & Sons, Inc. | | 44,000 | | | 1,553,200 |
| | | | | | 11,772,850 |
Metals & Mining—4.7% | | | |
Alcoa, Inc. | | 225,000 | | | 6,504,750 |
Allegheny Technologies, Inc. | | 3,500 | | | 275,555 |
AM Castle & Co. | | 6,000 | | | 200,640 |
Cleveland-Cliffs, Inc. | | 113,500 | | | 4,799,915 |
Newmont Mining Corp. | | 150,000 | | | 6,790,500 |
| | | | | | 18,571,360 |
Multiline Retail—0.0% | | | |
Conn’s, Inc.(a) | | 7,000 | | | 168,140 |
Multi-Utilities & Unregulated Power—0.4% | | | |
Suez SA(b) | | 31,500 | | | 1,409,542 |
National Commercial Banks—0.2% | | | |
Hang Seng Bank Ltd. ADR(b) | | 75,000 | | | 955,305 |
Oil & Gas—3.3% | | | |
Murphy Oil Corp. | | 230,000 | | | 10,846,800 |
Total SA ADR(b) | | 30,000 | | | 2,044,200 |
Valero Energy Corp. | | 3,500 | | | 183,155 |
| | | | | | 13,074,155 |
Oil Drilling, Equipment & Services—1.2% | | | |
Devon Energy Corp. | | 71,880 | | | 4,804,459 |
Paper & Forest Products—1.9% | | | |
Weyerhaeuser Co. | | 114,500 | | | 7,281,055 |
Personal Products—0.2% | | | |
Avon Products, Inc. | | 30,000 | | | 912,300 |
Pharmaceuticals—4.5% | | | |
Bristol-Myers Squibb Co. | | 200,000 | | | 4,950,000 |
Johnson & Johnson | | 40,000 | | | 2,696,000 |
King Pharmaceuticals, Inc.(a) | | 19,500 | | | 326,235 |
Novartis AG ADR(b) | | 30,000 | | | 1,821,900 |
Pfizer, Inc. | | 260,000 | | | 6,929,000 |
Sepracor, Inc.(a) | | 20,000 | | | 1,035,200 |
| | | | | | 17,758,335 |
Prepackaged Software—0.8% | | | |
Bio-key International, Inc.(a)(c)(e)(f) | | 47,090 | | | — |
Bio-key International, Inc.(a) | | 32,783 | | | 15,736 |
Indus International, Inc.(a) | | 785,000 | | | 2,928,050 |
| | | | | | 2,943,786 |
The accompanying notes are an integral part of these financial statements.
The Tocqueville Fund
Schedule of Investments as of October 31, 2006
| | | | | | |
| Common Stocks (continued) | | Shares | | Value |
Real Estate Investment Trust—0.8% | | | |
General Growth Properties, Inc. | | | 60,000 | | $ | 3,114,000 |
Semiconductor & Semiconductor Equipment—4.5% | | | |
Applied Materials, Inc. | | | 289,000 | | | 5,025,710 |
Intel Corp. | | | 417,250 | | | 8,904,115 |
Nvidia Corp.(a) | | | 7,000 | | | 244,090 |
Standard Microsystems Corp.(a) | | | 9,000 | | | 277,470 |
Ultratech, Inc.(a) | | | 220,000 | | | 3,143,800 |
| | | | | | | 17,595,185 |
Semiconductor Equipment & Products—0.0% | | | |
Vitesse Semiconductor Corp.(a) | | | 480 | | | 562 |
Software—5.0% | | | |
Activision, Inc.(a) | | | 185,000 | | | 2,852,700 |
Electronic Arts, Inc.(a) | | | 17,500 | | | 925,575 |
Mentor Graphics Corp.(a) | | | 150,000 | | | 2,530,500 |
Microsoft Corp. | | | 348,000 | | | 9,991,080 |
Oracle Corp.(a) | | | 175,000 | | | 3,232,250 |
| | | | | | | 19,532,105 |
Specialty Retail—0.4% | | | |
Borders Group, Inc. | | | 70,000 | | | 1,441,300 |
Water Supply—0.2% | | | |
Purecycle Corp.(a) | | | 100,000 | | | 807,500 |
Wireless Telecommunication Services—0.1% | | | |
America Movil S.A. de C.V. ADR(b) | | | 8,000 | | | 342,960 |
Total Common Stocks (Cost $282,549,955) | | | 354,698,768 |
Exchange Traded Funds—2.5% | | | |
SPDR Trust Series 1 | | | 200,000 | | | 6,660,000 |
StreetTRACKS Gold Trust(a) | | | 50,000 | | | 3,012,000 |
Total Exchange Traded Funds
(Cost $8,885,640) | | | 9,672,000 |
Preferred Stock—0.2% | | | |
Biotechnology—0.2% | | | |
Zymequest, Inc.(a)(c)(e)(f) | | | 400,000 | | | 960,000 |
Total Preferred Stock (Cost $960,000) | | | 960,000 |
Warrants—0.0% | | | |
Bio-key Warrants , $1.35 strike price, expires 4/14/09(a)(e) | | | 262,500 | | | — |
Raytheon Co. Warrants, $37.50 strike price, expires 6/16/11(a) | | | 1,581 | | | 24,854 |
Total Warrants (Cost $0) | | | | | | 24,854 |
| U.S. Government Agency Bonds—1.0% | |
| Principal
Amount | | | |
Freddie Mac, 3.70%, 8/25/09(d) | | $ | 2,000,000 | | $ | 1,977,576 |
Freddie Mac, 3.90%, 8/27/09(d) | | | 2,000,000 | | | 1,974,214 |
Total U.S. Government Agency Bonds
(Cost $4,045,571) | | | 3,951,790 |
| | | | | | | |
Short-Term Investments—6.6% | | Principal
Amount | | Value | |
Repurchase Agreement—2.6% | | | | |
Repurchase Agreement with U.S. Bank, N.A., 5.00%, dated 10/31/06, due 11/1/06, collateralized by a Freddie Mac 15-Year Fixed (Pool # 1491) valued at $10,250,607. Repurchase proceeds of $10,050,396
(Cost $10,049,000) | | $ | 10,049,000 | | $ | 10,049,000 | |
U.S. Treasury Bills—4.0% | | | | |
4.780%, due 11/02/06 | | | 1,000,000 | | | 999,867 | |
4.815%, due 12/07/06 | | | 1,000,000 | | | 995,050 | |
4.915%, due 12/14/06 | | | 1,000,000 | | | 994,063 | |
4.150%, due 12/28/06 | | | 3,000,000 | | | 2,976,084 | |
4.820%, due 1/18/07 | | | 3,000,000 | | | 2,968,020 | |
4.975%, due 2/01/07 | | | 1,000,000 | | | 987,388 | |
4.820%, due 2/15/07 | | | 3,000,000 | | | 2,956,521 | |
4.820%, due 3/15/07 | | | 3,000,000 | | | 2,945,082 | |
Total U.S. Treasury Bills (Cost $15,824,059) | | | 15,822,075 | |
Total Short-Term Investments
(Cost $25,873,059) | | | 25,871,075 | |
Total Investments
(Cost $322,314,225)—100.7% | | | 395,178,487 | |
Liabilities in Excess of Other Assets—(0.7)% | | | (2,683,538 | ) |
Total Net Assets—100.0% | | | | | $ | 392,494,949 | |
| | | | | | | |
Percentages are stated as a percent of net assets.
ADR—American Depository Receipt
GDR—Gobal Depository Receipt
| (a) | Non-income producing security. |
| (b) | Foreign issued security. Foreign concentration was as follows: Bermuda 1.7%; Canada 0.6%; Finland 1.3%; France 0.9%; Germany 0.6%; Hong Kong 0.3%; India 0.8%; Japan 1.7%; Mexico 1.0%; Netherlands 1.9%; South Korea 1.4%; Switzerland 0.5%; Taiwan 1.2%; United Kingdom 0.6%. |
| (c) | Denotes security is fully or partially restricted as to resale. The aggregate value of restricted securities at October 31, 2006 was $960,000 which represented 0.2% of net assets. |
| (d) | Security is a “step-up” bond where the coupon rate increases or steps up at a predetermined rate. Rate shown reflects the original rate. |
| (e) | Fair valued security. The aggregate value of fair valued securities at October 31, 2006 was $960,000 which represents 0.2% of net assets. |
| (f) | Security is considered illiquid and may be difficult to sell. |
The accompanying notes are an integral part of these financial statements.
The Tocqueville Small Cap Value Fund
Schedule of Investments as of October 31, 2006
| | | | | |
| Common Stocks—99.3% | | Shares | | Value |
Aerospace & Defense—1.2% | | | | | |
Cubic Corp. | | 30,000 | | $ | 627,300 |
Biotechnology—3.0% | | | | | |
Pharmion Corp.(a) | | 65,000 | | | 1,589,250 |
Chemicals—17.2% | | | | | |
A. Schulman, Inc. | | 65,000 | | | 1,573,650 |
Arch Chemicals, Inc. | | 39,000 | | | 1,304,940 |
Cambrex Corp. | | 35,000 | | | 819,000 |
Hercules, Inc.(a) | | 115,200 | | | 2,096,640 |
Olin Corp. | | 70,000 | | | 1,211,000 |
Sensient Technologies Corp. | | 90,000 | | | 2,074,500 |
| | | | | | 9,079,730 |
Commercial Services & Supplies—3.9% | | | |
ABM Industries, Inc. | | 85,000 | | | 1,688,100 |
Educate, Inc.(a) | | 50,000 | | | 382,500 |
| | | | | | 2,070,600 |
Communications Equipment—9.5% | | | |
3Com Corp.(a) | | 400,000 | | | 1,944,000 |
Plantronics, Inc. | | 40,800 | | | 861,288 |
Powerwave Technologies, Inc.(a) | | 180,000 | | | 1,171,800 |
Westell Technologies, Inc.(a) | | 420,000 | | | 1,008,000 |
| | | | | | 4,985,088 |
Computers & Peripherals—2.2% | | | |
Intermec, Inc.(a) | | 50,500 | | | 1,141,300 |
Electrical Equipment—7.1% | | | |
Baldor Electric Co. | | 50,000 | | | 1,604,000 |
Power-One, Inc.(a) | | 170,200 | | | 1,164,168 |
Vicor Corp. | | 82,200 | | | 978,180 |
| | | | | | 3,746,348 |
Electronic Equipment & Instruments—0.7% | | | |
Avnet, Inc.(a) | | 10,000 | | | 236,800 |
Keithley Instruments, Inc. | | 10,000 | | | 136,000 |
| | | | | | 372,800 |
Energy Equipment & Services—5.3% | | | |
Global Industries Ltd.(a) | | 80,000 | | | 1,328,000 |
Input/Output, Inc.(a) | | 130,000 | | | 1,457,300 |
| | | | | | 2,785,300 |
Food Products—2.0% | | | |
Del Monte Foods Co. | | 100,000 | | | 1,079,000 |
Health Care Equipment & Supplies—5.7% | | | |
Datascope Corp. | | 35,000 | | | 1,255,450 |
Wright Medical Group, Inc.(a) | | 70,000 | | | 1,729,700 |
| | | | | | 2,985,150 |
Health Care Providers & Services—4.3% | | | |
Bioscrip, Inc.(a) | | 40,000 | | | 97,600 |
Dendrite International, Inc.(a) | | 210,000 | | | 2,194,500 |
| | | | | | 2,292,100 |
| | | | | | | |
| Common Stocks (continued) | | Shares | | Value | |
Hotels Restaurants & Leisure—2.9% | | | | |
Bob Evans Farms, Inc. | | | 45,000 | | $ | 1,525,950 | |
Internet & Catalog Retail—1.9% | | | | |
Insight Enterprises, Inc.(a) | | | 46,000 | | | 988,540 | |
IT Services—8.6% | | | | |
Ceridian Corp.(a) | | | 75,000 | | | 1,767,750 | |
Computer Horizons Corp.(a) | | | 180,000 | | | 806,400 | |
Convergys Corp.(a) | | | 70,000 | | | 1,484,700 | |
Keane, Inc.(a) | | | 40,000 | | | 463,600 | |
| | | | | | | 4,522,450 | |
Leisure Equipment & Products—2.5% | | | | |
Leapfrog Enterprises, Inc.(a) | | | 135,000 | | | 1,301,400 | |
Machinery—1.9% | | | | |
Federal Signal Corp. | | | 65,000 | | | 991,900 | |
Orthopedic, Prosthetic, And Surgical Appliances And Supplies—0.6% | | | | |
Synovis Life Technologies, Inc.(a) | | | 42,000 | | | 309,960 | |
Pharmaceuticals—4.2% | | | | |
Perrigo Co. | | | 80,000 | | | 1,431,200 | |
Salix Pharmaceuticals, Ltd.(a) | | | 60,000 | | | 799,800 | |
| | | | | | | 2,231,000 | |
Semiconductor & Semiconductor Equipment—2.7% | | | | |
FEI Co.(a) | | | 30,000 | | | 685,800 | |
International Rectifier Corp.(a) | | | 20,000 | | | 719,400 | |
| | | | | | | 1,405,200 | |
Software—11.9% | | | | |
Agile Software Corp.(a) | | | 360,000 | | | 2,426,400 | |
Informatica Corp.(a) | | | 175,000 | | | 2,168,250 | |
Mentor Graphics Corp.(a) | | | 100,000 | | | 1,687,000 | |
| | | | | | | 6,281,650 | |
Total Common Stocks (Cost $44,609,466) | | | 52,312,016 | |
| Short-Term Investments—0.8% | |
| Principal
Amount | | | | |
Repurchase Agreement with U.S. Bank, N.A., 5.00%, dated 10/31/06, due 11/1/06, collateralized by a Fannie Mae 15-Year Fixed
(Pool # 5616) valued at $460,101. Repurchase proceeds of $451,063 (Cost $451,000) | | $ | 451,000 | | | 451,000 | |
Total Short-Term Investments
(Cost $451,000) | | | 451,000 | |
Total Investments
(Cost $45,060,466)—100.1% | | | 52,763,016 | |
Liabilities in Excess of Other Assets—(0.1)% | | | (61,973 | ) |
Total Net Assets—100.0% | | | | | $ | 52,701,043 | |
| | | | | | | |
Percentages are stated as a percent of net assets.
The accompanying notes are an integral part of these financial statements.
The Tocqueville International Value Fund
Schedule of Investments as of October 31, 2006
| | | | | |
| Common Stocks—87.0% | | Shares | | Value |
Belgium—1.0% | | | |
Umicore | | 14,000 | | $ | 2,172,787 |
Canada—2.0% | | | |
Alcan, Inc. | | 96,208 | | | 4,531,341 |
Finland—5.4% | | | |
Nokia Oyj ADR | | 290,000 | | | 5,765,200 |
UPM-Kymmene Oyj | | 256,700 | | | 6,516,526 |
| | | | | | 12,281,726 |
France—7.2% | | | |
M6 Metropole Television | | 190,000 | | | 5,883,013 |
Sanofi-Aventis | | 65,000 | | | 5,525,137 |
Vivendi SA | | 125,000 | | | 4,733,507 |
| | | | | | 16,141,657 |
Germany—0.6% | | | |
Siemens AG | | 14,000 | | | 1,254,534 |
Greece—1.2% | | | |
Titan Cement Co., SA | | 50,000 | | | 2,624,089 |
Hong Kong—0.4% | | | |
Gold Peak Industries Holding Ltd. | | 6,926,700 | | | 899,548 |
Indonesia—1.3% | | | |
PT Tempo Scan Pacific Tbk | | 34,380,000 | | | 2,980,543 |
Italy—5.9% | | | |
Ansaldo STS SpA(a) | | 40,575 | | | 424,647 |
Benetton Group SpA | | 288,064 | | | 5,456,050 |
Interpump SpA | | 508,300 | | | 4,499,062 |
Sogefi SpA | | 409,500 | | | 2,801,394 |
| | | | | | 13,181,153 |
Japan—23.6% | | | |
Aderans Company Ltd. | | 183,000 | | | 4,240,349 |
Amano Corp. | | 330,000 | | | 4,441,195 |
Capcom Co., Ltd. | | 130,000 | | | 2,384,250 |
Fuji Photo Film Co., Ltd. | | 160,000 | | | 5,937,326 |
Matsushita Electric Industrial Co., Ltd. ADR | | 200,000 | | | 4,160,000 |
Mitsubishi Tokyo Financial Group, Inc. ADR | | 356,000 | | | 4,539,000 |
Nintendo Co., Ltd. | | 20,000 | | | 4,090,462 |
Nippon Tv Network | | 25,000 | | | 3,219,187 |
Omron Corp. | | 220,000 | | | 5,680,818 |
Secom Co., Ltd. | | 77,000 | | | 3,851,481 |
Square Enix Co., Ltd. | | 150,000 | | | 3,757,856 |
Tecmo Ltd. | | 443,100 | | | 3,368,098 |
Tokyo Broadcasting System, Inc. | | 150,000 | | | 3,450,045 |
| | | | | | 53,120,067 |
Malaysia—1.3% | | | |
KLCC Property Holdings Berhad | | 4,700,000 | | | 3,011,088 |
| | | | | |
| Common Stocks (continued) | | Shares | | Value |
Mexico—2.2% | | | |
Cemex S.A. de C.V. ADR | | 161,032 | | $ | 4,950,124 |
Netherlands—6.2% | | | |
CSM NV | | 150,000 | | | 5,213,080 |
Nutreco Holding NV | | 50,601 | | | 3,015,355 |
Unilever NV ADR | | 240,000 | | | 5,808,000 |
| | | | | | 14,036,435 |
Singapore—1.4% | | | |
Gp Industries | | 9,775,949 | | | 3,265,348 |
South Korea—6.3% | | | |
Halla Climate Control | | 385,000 | | | 4,453,701 |
Kook Soon Dang Brewery Co., Ltd. | | 275,000 | | | 1,803,662 |
Pulmuone Co., Ltd. | | 60,190 | | | 2,008,995 |
Samsung Electronics Co., Ltd. | | 12,000 | | | 5,820,111 |
| | | | | | 14,086,469 |
Switzerland—4.9% | | | |
Ciba Specialty Chemicals AG | | 100,800 | | | 6,170,105 |
Kudelski SA | | 156,000 | | | 4,808,971 |
| | | | | | 10,979,076 |
Taiwan—6.5% | | | |
AU Optronics Corp. ADR ADR | | 314,768 | | | 4,274,549 |
Chunghwa Telecom Co., Ltd. ADR | | 326,400 | | | 5,969,856 |
Merrill Taiwan Secom Co., Ltd. | | 2,859,977 | | | 4,505,608 |
| | | | | | 14,750,013 |
Thailand—2.3% | | | |
BEC World Pcl | | 10,287,200 | | | 5,103,292 |
United Kingdom—5.3% | | | |
British Energy Group(a) | | 175,000 | | | 1,403,726 |
Bodycote International | | 1,041,250 | | | 4,881,201 |
GlaxoSmithKline Plc ADR | | 107,100 | | | 5,703,075 |
| | | | | | 11,988,002 |
United States—2.0% | | | |
Freeport-McMoRan Copper & Gold, Inc. | | 76,200 | | | 4,608,576 |
Total Common Stocks (Cost $151,001,481) | | | 195,965,868 |
Warrants—0.9% | | | |
Pihsiang Machinery Warrants, $0.00 strike price, expires 12/10/09(a) | | 975,000 | | | 2,078,700 |
Total Warrants (Cost $1,912,432) | | | 2,078,700 |
The accompanying notes are an integral part of these financial statements.
The Tocqueville International Value Fund
Schedule of Investments as of October 31, 2006
| | | | | |
| Short-Term Investments—7.1% | | Shares | | Value |
Variable Rate Demand Notes—7.1% | | | |
JP Morgan Chase Demand Deposits, 2.00% | | 15,866,825 | | $ | 15,866,825 |
Total Short-Term Investments
(Cost $15,866,825) | | | 15,866,825 |
Total Investments
(Cost $168,780,738)—95.0% | | | 213,911,393 |
Other Assets in Excess of Liabilities—5.0% | | | 11,322,513 |
Total Net Assets—100.0% | | | | $ | 225,233,906 |
| | | | | |
Percentages are stated as a percent of net assets.
ADR—American Depository Receipt
| (a) | Non-income producing security. |
The accompanying notes are an integral part of these financial statements.
The Tocqueville Gold Fund
Schedule of Investments as of October 31, 2006
| | | | | |
| Common Stocks—89.0% | | Shares | | Value |
Gold & Gold Related—76.5% | | | | | |
Agnico-Eagle Mines Ltd.(b) | | 502,000 | | $ | 18,558,940 |
Alamos Gold, Inc.(a)(b) | | 2,615,100 | | | 21,098,719 |
Almaden Minerals Ltd.(a)(b) | | 800,000 | | | 1,959,126 |
Anatolia Minerals Development(a)(b) | | 350,000 | | | 997,373 |
Apollo Gold Corp.(a)(b) | | 733,000 | | | 267,626 |
Aquiline Resources, Inc.(a)(b) | | 1,333,333 | | | 5,639,905 |
Aurelian Resources, Inc.(a)(b) | | 189,000 | | | 6,345,162 |
Aurizon Mines Ltd.(a)(b) | | 600,000 | | | 1,656,352 |
Banro Corp.(a)(b) | | 631,400 | | | 7,961,729 |
Barrick Gold Corp.(b) | | 51,562 | | | 1,595,600 |
Barrick Gold Corp. | | 592,053 | | | 18,353,643 |
Cambior, Inc.(a)(b) | | 1,000,000 | | | 3,550,000 |
Chesapeake Gold Corp.(a)(b) | | 339,000 | | | 1,766,018 |
Cia de Minas Buenaventura SA ADR(b) | | 613,800 | | | 15,866,730 |
Cluff Gold Ltd.(a)(b) | | 1,650,000 | | | 1,880,616 |
Crystallex International Corp.(a)(b) | | 2,555,600 | | | 7,104,568 |
Dominion Mining Ltd.(a)(b) | | 1,428,571 | | | 1,670,378 |
Eldorado Gold Corp.(a)(b) | | 1,000,000 | | | 4,247,740 |
FNX Mining Co, Inc.(a)(b) | | 300,000 | | | 4,140,879 |
Fury Explorations Ltd.(a)(b) | | 1,500,000 | | | 801,460 |
Gabriel Resources Ltd.(a)(b) | | 3,300,000 | | | 13,459,192 |
Gammon Lake Resources, Inc.(a)(b) | | 2,042,100 | | | 26,823,078 |
Gold Fields Ltd.(b) | | 166,249 | | | 2,753,420 |
Gold Fields Ltd. ADR(b) | | 2,111,500 | | | 35,388,740 |
Goldcorp, Inc.(b) | | 1,693,950 | | | 44,517,006 |
Golden Star Resources Ltd.(a) | | 4,059,000 | | | 11,405,790 |
Golden Star Resources Ltd.(a)(b) | | 1,080,000 | | | 2,991,050 |
Harmony Gold Mining Co., Ltd.(b) | | 106,667 | | | 1,617,327 |
Harmony Gold Mining Co., Ltd. ADR(b) | | 784,400 | | | 12,189,576 |
Iamgold Corp.(b) | | 1,485,700 | | | 12,529,123 |
Ivanhoe Mines Ltd.(a)(b) | | 3,892,000 | | | 40,550,692 |
Lihir Gold Ltd.(a)(b) | | 3,325,000 | | | 7,080,439 |
Meridian Gold, Inc.(a) | | 540,200 | | | 13,672,462 |
Meridian Gold, Inc.(a)(b) | | 110,331 | | | 2,777,557 |
Minefinders Corp.(a)(b) | | 663,000 | | | 4,983,054 |
Miramar Mining Corp.(a)(b) | | 4,331,306 | | | 21,006,834 |
New Gold, Inc.(a)(b) | | 516,500 | | | 4,173,320 |
Newcrest Mining Ltd.(b) | | 956,561 | | | 17,665,952 |
Newmont Mining Corp. | | 469,800 | | | 21,267,847 |
Orezone Resources, Inc.(a)(b) | | 6,063,700 | | | 8,693,670 |
Osisko Exploration Ltd.(a)(b) | | 1,155,000 | | | 5,955,252 |
Oxiana Ltd.(a)(b) | | 5,000,000 | | | 12,815,450 |
Pacific Rim Mining Corp.(a)(b) | | 35,000 | | | 29,750 |
Polyus Gold ADR(a)(b) | | 851,616 | | | 40,196,275 |
Premier Gold Mines Ltd.(a)(b) | | 927,500 | | | 726,836 |
Radius Gold, Inc.(a)(b) | | 1,329,544 | | | 438,071 |
| | | | | |
| Common Stocks (continued) | | Shares | | Value |
Randgold Resources Ltd. ADR(a)(b) | | 1,663,200 | | $ | 37,704,744 |
Royal Gold, Inc. | | 247,765 | | | 7,294,202 |
Semafo, Inc.(a)(b) | | 4,900,000 | | | 7,810,677 |
Sino Gold Ltd.(a)(b) | | 2,941,500 | | | 11,160,940 |
SouthernEra Diamonds, Inc.(a)(b) | | 375,000 | | | 130,237 |
Strongbow Exploration, Inc.(a)(b) | | 1,800,000 | | | 721,314 |
Sunridge Gold Corp.(a)(b) | | 500,000 | | | 1,202,191 |
SXR Uranium One, Inc.(a)(b) | | 1,852,500 | | | 20,868,360 |
Troy Resources NL(b) | | 1,463,000 | | | 3,002,106 |
U.S. Gold Corp.(a)(b) | | 223,000 | | | 1,090,227 |
Wesdome Gold Mines Ltd(a)(b) | | 627,250 | | | 916,060 |
Wolfden Resources, Inc.(a)(b) | | 1,325,000 | | | 1,994,078 |
Yamana Gold, Inc.(b) | | 3,541,532 | | | 35,227,670 |
Zijin Mining Group Co., Ltd.(b) | | 30,000,000 | | | 17,435,581 |
| | | | | | 637,728,714 |
Precious Metals & Related—12.5% | | | |
Aber Diamond Corp.(b) | | 100,000 | | | 3,706,000 |
African Platinum Plc(a)(b) | | 15,000,000 | | | 7,224,882 |
Apex Silver Mines Ltd.(a) | | 1,111,800 | | | 17,566,440 |
Brilliant Mining Corp.(a)(b) | | 1,875,000 | | | 1,302,373 |
Cameco Corp.(b) | | 261,000 | | | 9,168,930 |
Impala Platinum Holdings Ltd.(b) | | 80,000 | | | 14,064,144 |
Impala Platinum Holdings Ltd. ADR(b) | | 225,000 | | | 9,867,555 |
Ivanhoe Nickel & Platinum Ltd.(a)(b)(c)(d)(e) | | 83,333 | | | 249,999 |
Mvelaphanda Resources Ltd.(a)(b) | | 350,000 | | | 1,532,326 |
Peru Copper, Inc.(a)(b) | | 1,365,000 | | | 5,214,702 |
Sabina Silver Corp.(a)(b) | | 900,000 | | | 1,041,899 |
Silver Standard Resources, Inc.(a)(b) | | 557,000 | | | 13,702,200 |
Silver Wheaton Corp.(a)(b) | | 1,387,400 | | | 15,295,438 |
Stornoway Diamond Corp.(a)(b) | | 1,950,000 | | | 1,632,308 |
Trade Winds Ventures, Inc.(a)(b) | | 1,100,000 | | | 421,212 |
Uramin, Inc.(a)(b) | | 1,350,000 | | | 1,854,148 |
| | | | | | 103,844,556 |
Total Common Stocks (Cost $437,417,718) | | | 741,573,270 |
| Gold Bullion—7.1% | | Ounces | | | |
Gold Bullion(a) | | 97,890 | | | 59,379,944 |
Total Gold Bullion (Cost $44,609,241) | | | 59,379,944 |
The accompanying notes are an integral part of these financial statements.
The Tocqueville Gold Fund
Schedule of Investments as of October 31, 2006
| | | | | | | |
| Warrants—0.6% | | Shares or
Principal
Amount | | Value | |
Gold & Gold Related—0.5% | | | | |
Anatolia Mineral Development Ltd.(a)(b)(d) | | $ | 175,000 | | $ | 70,907 | |
Nevsun Resources Ltd.(a)(b)(d) | | | 202,125 | | | — | |
Northern Orion Resources, Inc.(a)(b) | | | 1,005,000 | | | 2,863,885 | |
Novagold Resources, Inc.(a)(b) | | | 75,000 | | | 713,300 | |
Osisko Exploration(a)(b)(d) | | | 577,500 | | | 595,011 | |
U.S. Gold Corp.(a) | | | 111,500 | | | — | |
| | | | | | | 4,243,103 | |
Precious Metals & Related—0.1% | | | | |
Brilliant Mining(a)(b)(d) | | | 937,500 | | | — | |
PAN American Silver Corp.(a)(b) | | | 61,536 | | | 753,480 | |
| | | | | | | 753,480 | |
Total Warrants (Cost $86,900) | | | 4,996,583 | |
Corporate Bond—0.4% | | | | |
Gold & Gold Related—0.4% | | | | |
Crystallex Intl. Corp.
9.375%, due 12/30/11(b) | | | 4,100,000 | | | 3,013,500 | |
Total Corporate Bond (Cost $4,100,000) | | | 3,013,500 | |
Convertible Bond—0.7% | | | | |
Gold & Gold Related—0.7% | | | | |
Sino Gold Ltd.
5.75%, due 3/17/12(b) | | | 3,000,000 | | | 5,421,000 | |
Total Convertible Bond (Cost $3,000,000) | | | 5,421,000 | |
Exchange Traded Fund—1.9% | | | | |
iShares Silver Trust (a) | | | 131,000 | | | 16,071,080 | |
Total Exchange Traded Fund
(Cost $12,982,560) | | | 16,071,080 | |
Short-Term Investments—0.3% | | | | |
Repurchase Agreement—0.3% | | | | |
Repurchase Agreement with U.S. Bank, N.A., 5.00%, dated 10/31/06, due 11/1/06, collateralized by a Fannie Mae 15-Year Fixed (Pool # 5616) valued at $2,915,384. Repurchase proceeds of $2,858,397 (Cost $2,858,000) | | | 2,858,000 | | | 2,858,000 | |
Total Short-Term Investments
(Cost $2,858,000) | | | 2,858,000 | |
Total Investments
(Cost $505,054,419)—100.0% | | | 833,313,377 | |
Liabilities in Excess of Other Assets—0.0% | | | (58,897 | ) |
Total Net Assets—100.0% | | | | | $ | 833,254,480 | |
| | | | | | | |
Percentages are stated as a percent of net assets.
ADR—American Depository Receipt
| (a) | Non-income producing security. |
| (b) | Foreign issued security. Foreign concentration was as follows: Australia 6.2%; Canada 48.7%; China 2.1%; Peru 1.9%; New Guinea 0.8%; Russia 4.8%; South Africa 9.5%; United Kingdom 5.6%. |
| (c) | Denotes security is fully or partially restricted to resale. The aggregate value of restricted securities at October 31, 2006 was $249,999 which represented 0.0% of net assets. |
| (d) | Fair valued security. The aggregate value of fair valued securities at October 31, 2006 was $915,917 which represented 0.1% of net assets. |
| (e) | Security is considered illiquid and may be difficult to sell. |
The accompanying notes are an integral part of these financial statements.
Percent of Total Investments
The Tocqueville Fund
Allocation of Portfolio Holdings
October 31, 2006
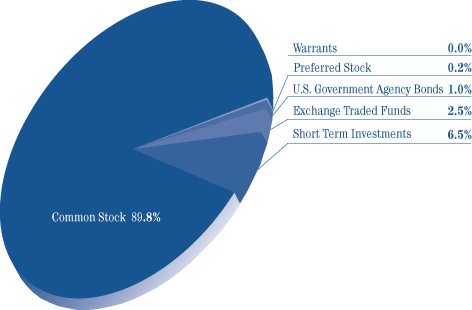
The Tocqueville Small Cap Value Fund
Allocation of Portfolio Holdings
October 31, 2006
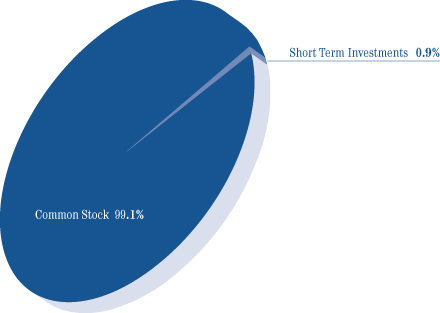
Percent of Total Investments
The Tocqueville International Value Fund
Allocation of Portfolio Holdings
October 31, 2006
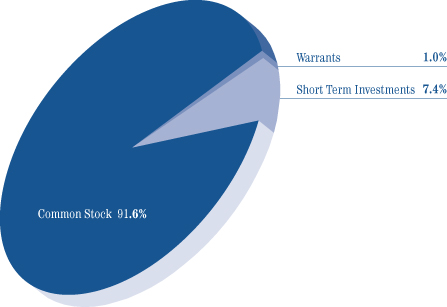
The Tocqueville Gold Fund
Allocation of Portfolio Holdings
October 31, 2006
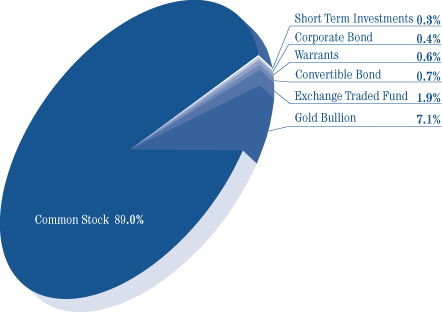
The Tocqueville Trust
Statements of Assets and Liabilities
October 31, 2006
| | | | | | | | | | | | | | |
| | | The
Tocqueville
Fund | | | Small Cap
Value
Fund | | International
Value Fund | | Gold Fund | |
Assets | | | | | | | | | | | | | | |
Investments, at value (1) | | $ | 395,178,487 | | | $ | 52,763,016 | | $ | 213,911,393 | | $ | 833,313,377 | |
Foreign currencies (2) | | | 1,590 | | | | — | | | 14,033,288 | | | — | |
Cash | | | — | | | | 262 | | | 461 | | | 288 | |
Receivable for investments sold | | | 318,408 | | | | — | | | 492,864 | | | — | |
Receivable for fund shares sold | | | 1,470,209 | | | | 1,270 | | | 200,960 | | | 1,481,806 | |
Dividends, interest and other receivables | | | 270,065 | | | | 22,288 | | | 387,306 | | | 135,691 | |
Prepaid assets | | | 30,206 | | | | 10,781 | | | 22,278 | | | 58,505 | |
| | | | | | | | | | | | | | |
Total Assets | | | 397,268,965 | | | | 52,797,617 | | | 229,048,550 | | | 834,989,667 | |
| | | | | | | | | | | | | | |
Liabilities | | | | | | | | | | | | | | |
Payable for investments purchased | | | 2,475,165 | | | | — | | | 3,226,696 | | | — | |
Payable for fund shares redeemed | | | 253,641 | | | | 19,187 | | | 195,151 | | | 609,053 | |
Payable to Adviser | | | 220,898 | | | | 33,089 | | | 191,437 | | | 597,771 | |
Due to custodian | | | 1,476,061 | | | | — | | | — | | | — | |
Accrued distribution fee | | | 53,595 | | | | 8,078 | | | 38,406 | | | 48,830 | |
Accrued expenses and other liabilities | | | 294,656 | | | | 36,220 | | | 162,954 | | | 479,533 | |
| | | | | | | | | | | | | | |
Total Liabilities | | | 4,774,016 | | | | 96,574 | | | 3,814,644 | | | 1,735,187 | |
| | | | | | | | | | | | | | |
Net Assets | | $ | 392,494,949 | | | $ | 52,701,043 | | $ | 225,233,906 | | $ | 833,254,480 | |
| | | | | | | | | | | | | | |
Net assets consist of: | | | | | | | | | | | | | | |
Paid in capital | | | 333,739,698 | | | | 38,895,188 | | | 146,077,842 | | | 430,357,755 | |
Accumulated net investment income (loss) | | | — | | | | — | | | 3,172,886 | | | (9,051,680 | ) |
Accumulated net realized gain (loss) | | | (14,109,474 | ) | | | 6,103,305 | | | 30,748,024 | | | 83,689,448 | |
Net unrealized appreciation on: | | | | | | | | | | | | | | |
Investments and foreign currency related items | | | 72,864,725 | | | | 7,702,550 | | | 45,235,154 | | | 328,258,957 | |
| | | | | | | | | | | | | | |
Net assets | | $ | 392,494,949 | | | $ | 52,701,043 | | $ | 225,233,906 | | $ | 833,254,480 | |
| | | | | | | | | | | | | | |
Shares of beneficial interest outstanding (unlimited shares of $0.01 par value authorized) | | | 16,182,128 | | | | 2,921,190 | | | 13,467,290 | | | 16,206,771 | |
Net asset value and redemption price per share | | $ | 24.25 | | | $ | 18.04 | | $ | 16.72 | | $ | 51.41 | |
| | | | | | | | | | | | | | |
Maximum offering price per share | | $ | 24.25 | | | $ | 18.04 | | $ | 16.72 | | $ | 51.41 | |
| | | | | | | | | | | | | | |
(1) Cost of Investments | | $ | 322,314,225 | | | $ | 45,060,466 | | $ | 168,780,738 | | $ | 505,054,419 | |
(2) Cost of Foreign Currencies | | $ | 1,516 | | | $ | — | | $ | 13,928,622 | | $ | — | |
The accompanying notes are an integral part of these financial statements.
The Tocqueville Trust
Statements of Operations
For the Year Ended October 31, 2006
| | | | | | | | | | | | | | | |
| | | The
Tocqueville
Fund | | | Small Cap
Value
Fund | | | International
Value
Fund | | Gold
Fund | |
Investment Income: | | | | | | | | | | | | | | | |
Dividends* | | $ | 3,866,327 | | | $ | 477,899 | | | $ | 6,948,669 | | $ | 5,471,953 | |
Interest | | | 761,288 | | | | 71,814 | | | | 600,908 | | | 2,114,622 | |
| | | | | | | | | | | | | | | |
| | | 4,627,615 | | | | 549,713 | | | | 7,549,577 | | | 7,586,575 | |
| | | | | | | | | | | | | | | |
Expenses: | | | | | | | | | | | | | | | |
Investment Adviser’s fee (See Note 4) | | | 1,751,251 | | | | 426,858 | | | | 2,440,572 | | | 7,004,727 | |
Distribution fees (See Note 4) | | | 583,750 | | | | 142,286 | | | | 610,143 | | | 1,918,335 | |
Administration fee (See Note 4) | | | 350,250 | | | | 85,372 | | | | 366,086 | | | 1,151,001 | |
Professional fees | | | 106,287 | | | | 32,089 | | | | 90,312 | | | 333,819 | |
Transfer agent and shareholder services fees | | | 78,039 | | | | 20,309 | | | | 86,738 | | | 377,770 | |
Registration fees | | | 32,144 | | | | 18,488 | | | | 29,328 | | | 61,546 | |
Fund accounting fees | | | 31,494 | | | | 7,972 | | | | 45,477 | | | 102,238 | |
Printing and mailing expense | | | 27,022 | | | | 10,900 | | | | 28,956 | | | 135,605 | |
Custody fees | | | 26,760 | | | | 7,827 | | | | 167,953 | | | 261,322 | |
Trustee fees and expenses | | | 25,259 | | | | 3,850 | | | | 22,550 | | | 70,370 | |
Insurance expense | | | 11,177 | | | | 3,510 | | | | 17,199 | | | 35,300 | |
Other expenses | | | 11,144 | | | | 3,787 | | | | 13,083 | | | 80,113 | |
| | | | | | | | | | | | | | | |
Total expenses | | | 3,034,577 | | | | 763,248 | | | | 3,918,397 | | | 11,532,146 | |
| | | | | | | | | | | | | | | |
Net Investment Income (Loss) | | | 1,593,038 | | | | (213,535 | ) | | | 3,631,180 | | | (3,945,571 | ) |
| | | | | | | | | | | | | | | |
Realized and Unrealized Gain (Loss): | | | | | | | | | | | | | | | |
Net realized gain (loss) on: | | | | | | | | | | | | | | | |
Investments | | | 26,825,923 | | | | 7,602,971 | | | | 30,747,974 | | | 84,704,568 | |
Foreign currency translation | | | (4,411 | ) | | | — | | | | 181,404 | | | (17,365 | ) |
| | | | | | | | | | | | | | | |
| | | 26,821,512 | | | | 7,602,971 | | | | 30,929,378 | | | 84,687,203 | |
Net change in unrealized appreciation (depreciation) on: | | | | | | | | | | | | | | | |
Investments | | | 34,201,839 | | | | (2,926,625 | ) | | | 2,488,130 | | | 201,528,868 | |
Foreign currency translation | | | 463 | | | | — | | | | 225,774 | | | — | |
| | | | | | | | | | | | | | | |
| | | 34,202,302 | | | | (2,926,625 | ) | | | 2,713,904 | | | 201,528,868 | |
Net gain on investments and foreign currency | | | 61,023,814 | | | | 4,676,346 | | | | 33,643,282 | | | 286,216,071 | |
| | | | | | | | | | | | | | | |
Net Increase in Net Assets Resulting
from Operations | | $ | 62,616,852 | | | $ | 4,462,811 | | | $ | 37,274,462 | | $ | 282,270,500 | |
| | | | | | | | | | | | | | | |
* Net of foreign taxes withheld | | $ | 49,183 | | | $ | — | | | $ | 913,456 | | $ | 224,735 | |
| | | | | | | | | | | | | | | |
The accompanying notes are an integral part of these financial statements.
[This page intentionally left blank]
The Tocqueville Trust
Statements of Changes in Net Assets
| | | | | | | | |
| | | The Tocqueville Fund | |
| | | For the Year
Ended
October 31,
2006 | | | For the Year
Ended
October 31,
2005 | |
Operations: | | | | | | | | |
Net investment income (loss) | | $ | 1,593,038 | | | $ | 1,111,868 | |
Net realized gain (loss) on investments and foreign currency | | | 26,821,512 | | | | 9,066,454 | |
Net change in unrealized appreciation/(depreciation) | | | 34,202,302 | | | | 9,388,494 | |
| | | | | | | | |
Net increase in net assets resulting from operations | | | 62,616,852 | | | | 19,566,816 | |
Dividends and distributions to shareholders: | | | | | | | | |
Net investment income | | | (2,189,946 | ) | | | (863,340 | ) |
Net realized gains | | | (23,608,046 | ) | | | (5,747,338 | ) |
| | | | | | | | |
Total dividends and distributions | | | (25,797,992 | ) | | | (6,610,678 | ) |
Fund share transactions: | | | | | | | | |
Shares sold | | | 115,739,773 | | | | 30,413,928 | |
Shares issued in merger (See Note 7) | | | 65,466,749 | | | | — | |
Shares issued to holders in reinvestment of dividends | | | 22,804,475 | | | | 5,266,557 | |
Shares redeemed* | | | (24,126,165 | ) | | | (18,280,792 | ) |
| | | | | | | | |
Net increase (decrease) | | | 179,884,832 | | | | 17,399,693 | |
| | | | | | | | |
Net increase (decrease) in net assets | | | 216,703,692 | | | | 30,355,831 | |
Net Assets: | | | | | | | | |
Beginning of year | | | 175,791,257 | | | | 145,435,426 | |
| | | | | | | | |
End of year** | | | 392,494,949 | | | | 175,791,257 | |
| | | | | | | | |
* Net of redemption fees of: | | $ | 21,410 | | | $ | 18,988 | |
| | | | | | | | |
** Including undistributed net investment income (loss) of: | | $ | — | | | $ | 587,541 | |
| | | | | | | | |
Change in shares outstanding: | | | | | | | | |
Shares sold | | | 4,749,006 | | | | 1,410,353 | |
Shares issued in Merger (See Note 7) | | | 3,528,649 | | | | — | |
Shares issued to holders in reinvestment of dividends | | | 949,648 | | | | 252,109 | |
Shares redeemed | | | (973,392 | ) | | | (853,030 | ) |
| | | | | | | | |
Net increase (decrease) | | | 8,253,911 | | | | 809,432 | |
| | | | �� | | | | |
The accompanying notes are an integral part of these financial statements.
The Tocqueville Trust
Statements of Changes in Net Assets
| | | | | | | | | | | | | | | | | | | | | | |
| Small Cap Value Fund | | | International Value Fund | | | Gold Fund | |
For the
Year Ended
October 31,
2006 | | | For the
Year Ended
October 31,
2005 | | | For the Year
Ended
October 31,
2006 | | | For the Year
Ended
October 31,
2005 | | | For the Year Ended
October 31,
2006 | | | For the Year Ended
October 31,
2005 | |
| | | | | | | | | | | | | | | | | | | | | | |
| $ | (213,535 | ) | | $ | (439,007 | ) | | $ | 3,631,180 | | | $ | 589,896 | | | $ | (3,945,571 | ) | | $ | (4,916,511 | ) |
| | 7,602,971 | | | | (1,499,666 | ) | | | 30,929,378 | | | | 32,064,097 | | | | 84,687,203 | | | | 31,305,039 | |
| | (2,926,625 | ) | | | 6,105,970 | | | | 2,713,904 | | | | 9,722,916 | | | | 201,528,868 | | | | 1,023,459 | |
| | | | | | | | | | | | | | | | | | | | | | | |
| | 4,462,811 | | | | 4,167,297 | | | | 37,274,462 | | | | 42,376,909 | | | | 282,270,500 | | | | 27,411,987 | |
| | | | | | | | | | | | | | | | | | | | | | |
| | — | | | | — | | | | (712,009 | ) | | | (1,164,107 | ) | | | — | | | | — | |
| | — | | | | (3,029,286 | ) | | | (25,434,697 | ) | | | — | | | | (31,702,831 | ) | | | (21,027,179 | ) |
| | | | | | | | | | | | | | | | | | | | | | | |
| | — | | | | (3,029,286 | ) | | | (26,146,706 | ) | | | (1,164,107 | ) | | | (31,702,831 | ) | | | (21,027,179 | ) |
| | | | | | | | | | | | | | | | | | | | | | |
| | 6,733,616 | | | | 10,195,998 | | | | 62,632,662 | | | | 42,081,069 | | | | 310,226,522 | | | | 158,391,876 | |
| | — | | | | — | | | | — | | | | — | | | | — | | | | — | |
| | — | | | | 2,803,582 | | | | 23,518,380 | | | | 893,120 | | | | 29,792,252 | | | | 19,721,437 | |
| | (16,071,514 | ) | | | (31,566,833 | ) | | | (87,755,792 | ) | | | (64,900,229 | ) | | | (295,823,614 | ) | | | (185,196,398 | ) |
| | | | | | | | | | | | | | | | | | | | | | | |
| | (9,337,898 | ) | | | (18,567,253 | ) | | | (1,604,750 | ) | | | (21,926,040 | ) | | | 44,195,160 | | | | (7,083,085 | ) |
| | | | | | | | | | | | | | | | | | | | | | | |
| | (4,875,087 | ) | | | (17,429,242 | ) | | | 9,523,006 | | | | 19,286,762 | | | | 294,762,829 | | | | (698,277 | ) |
| | | | | | | | | | | | | | | | | | | | | | |
| | 57,576,130 | | | | 75,005,372 | | | | 215,710,900 | | | | 196,424,138 | | | | 538,491,651 | | | | 539,189,928 | |
| | | | | | | | | | | | | | | | | | | | | | | |
| | 52,701,043 | | | | 57,576,130 | | | | 225,233,906 | | | | 215,710,900 | | | | 833,254,480 | | | | 538,491,651 | |
| | | | | | | | | | | | | | | | | | | | | | | |
| $ | 49,477 | | | $ | 24,651 | | | $ | 169,335 | | | $ | 45,552 | | | $ | 1,047,617 | | | $ | 372,142 | |
| | | | | | | | | | | | | | | | | | | | | | | |
| $ | — | | | $ | — | | | $ | 3,172,886 | | | $ | 72,311 | | | $ | (9,051,680 | ) | | $ | (5,085,204 | ) |
| | | | | | | | | | | | | | | | | | | | | | | |
| | | | | | | | | | | | | | | | | | | | | | |
| | 380,420 | | | | 623,305 | | | | 3,908,734 | | | | 2,831,694 | | | | 6,528,800 | | | | 4,698,499 | |
| | — | | | | — | | | | — | | | | — | | | | — | | | | — | |
| | — | | | | 159,295 | | | | 1,572,084 | | | | 64,860 | | | | 770,224 | | | | 604,952 | |
| | (931,299 | ) | | | (1,966,893 | ) | | | (5,447,837 | ) | | | (4,452,473 | ) | | | (6,256,718 | ) | | | (5,614,662 | ) |
| | | | | | | | | | | | | | | | | | | | | | | |
| | (550,879 | ) | | | (1,184,293 | ) | | | 32,981 | | | | (1,555,919 | ) | | | 1,042,306 | | | | (311,211 | ) |
| | | | | | | | | | | | | | | | | | | | | | | |
The accompanying notes are an integral part of these financial statements.
The Tocqueville Trust
The Tocqueville Fund
The Tocqueville Small Cap Value Fund
The Tocqueville International Value Fund
The Tocqueville Gold Fund
Notes to Financial Statements
1. ORGANIZATION
The Tocqueville Trust (the “Trust”) was organized as a Massachusetts business trust registered under the Investment Company Act of 1940, as amended (the “1940 Act”), as a diversified, open-end management investment company. The Trust consists of four separate funds: The Tocqueville Fund, The Tocqueville Small Cap Value Fund, The Tocqueville International Value Fund and The Tocqueville Gold Fund (individually referred to as the ‘‘Fund’’ and collectively referred to as the ‘‘Funds’’). The objective of The Tocqueville Fund is long-term capital appreciation. The Tocqueville Fund seeks to achieve its investment objective by investing primarily in securities of United States issuers. The objective of The Tocqueville Small Cap Value Fund is long-term capital appreciation. The Tocqueville Small Cap Value Fund seeks to achieve its investment objective by investing at least 80% of its net assets, plus borrowings for investment purposes, in common stocks of companies located in the United States that have market values of less than $3 billion. The objective of The Tocqueville International Value Fund is long-term capital appreciation consistent with preservation of capital. The Tocqueville International Value Fund seeks to achieve its investment objective by investing primarily in non-U.S. companies. The objective of The Tocqueville Gold Fund is to provide long-term capital appreciation. The Tocqueville Gold Fund seeks to achieve its investment objective by investing 80% of its net assets, plus borrowings for investment purposes, in gold and securities of companies located throughout the world that are engaged in mining or processing gold. The following is a summary of significant accounting principles followed by the Trust in the preparation of its financial statements.
2. SIGNIFICANT ACCOUNTING POLICIES
a) Security valuation
Investments in securities, including foreign securities, traded on an exchange or quoted on the over-the-counter market are valued at the last sale price or, if no sale occurred during the day, at the mean between closing bid and asked prices, as last reported by a pricing service approved by the Trustees. Securities that are principally traded on the National Association of Securities Dealers Automated Quotation (“NASDAQ”) National Market are generally valued at the NASDAQ Official Closing Price (“NOCP”). Investments in gold and silver will be valued on the basis of the respective closing spot prices of the New York Commodity Exchange. Investments in other precious metals will be valued at their respective market values determined on the basis of the mean between the last current bid and asked prices based on dealer or exchange quotations. When market quotations are not readily available, or when restricted securities or other assets are being valued, such assets are valued at fair value as determined in good faith by or under procedures approved by the Trustees. Short-term securities maturing within 60 days are valued on an amortized cost basis. Fixed income securities with maturities greater than 60 days are valued at market price.
Trading in securities on European and Far Eastern securities exchanges normally is completed before the calculation of the Funds’ net asset value. Trading on these foreign exchanges may not take place on all days on which there is regular trading on the New York Stock Exchange (“NYSE”), or may take place on days on which there is no regular trading on the NYSE. Similarly, the Funds may hold securities traded on domestic markets where the market may close early on a given day prior to calculation of the Funds’ net asset value. Events affecting the value of such securities held by the Funds that occur between the close of trading in the security and the close of trading on the NYSE normally will not be reflected in the Funds’ calculation of the net asset value. Significant events will be closely monitored, and where it is determined that an adjustment should be made to the security’s value because significant interim events may materially affect the value of the security, the security will be priced at its fair value in accordance with the procedures approved by the Trustees.
b) Restricted and Illiquid Securities
The Tocqueville Fund and The Tocqueville Gold Fund may invest in securities that are subject to legal or contractual restrictions on resale or are illiquid. A security may be considered illiquid if it lacks a readily available market or if its valuation has not changed for a certain period of time. Disposal of these securities may involve time consuming negotiations and expense, and prompt sale at the current valuation may be difficult.
c) Accounting pronouncements
On July 13, 2006, the Financial Accounting Standards Board (“FASB”) released FASB Interpretation No. 48 “Accounting for Uncertainty in Income Taxes” (“FIN 48”). FIN 48 provides guidance for how uncertain tax positions should be recognized, measured, presented and disclosed in the financial statements. FIN 48 requires the evaluation of tax positions taken or expected to be taken in the course of preparing the Tocqueville Trust’s tax returns to determine whether the tax positions are “more-likely-than-not” of being sustained by the applicable tax authority. Tax positions not deemed to meet the more-likely-than-not threshold would be recorded as a tax benefit or expense in the current year. Adoption of FIN 48 is required for fiscal years beginning after December 15, 2006 and is to be applied to all open tax years as of the effective date. At this time, management is evaluating the implications of FIN 48 and its impact in the financial statements has not yet been determined.
d) Federal income tax
Provision for federal income taxes or excise taxes has not been made since the Funds have elected to be taxed as “regulated investment companies” and intend to distribute substantially all taxable income to shareholders and otherwise comply with the provisions of the Internal Revenue Code applicable to regulated investment companies. Distributions from net realized gains for book purposes may include short-term capital gains which are included as ordinary income to shareholders for tax purposes. Accounting principles generally accepted in the United States of America (“GAAP”) requires that permanent differences between financial reporting and tax reporting be reclassified between various components of net assets.**
| ** | The reclassifications have no effect on net assets or net asset value per share. For the year ended October 31, 2006, the Tocqueville Fund had a decrease in undistributed net investment loss of $9,367, an increase in accumulated realized loss of $4,627,330 and an increase in paid-in capital of $4,617,963. The Small Cap Value Fund had a decrease in undistributed net investment loss of $213,535, a decrease in accumulated realized gains of $1, and a decrease in paid-in capital of $213,534. The International Value Fund had an increase in undistributed net investment of $181,404 and a decrease in accumulated realized gains of $181,404. The Gold Fund had an increase in undistributed net investment loss of $20,906 and an increase in accumulated realized gains of $20,907. |
At October 31, 2006 the cost of investments, gross unrealized appreciation and depreciation of investments and distributable income for tax purposes were as follows:
| | | | | | | | | | | | | | | | |
| | | The
Tocqueville Fund | | | Small Cap
Value
Fund | | | International Value Fund | | | Gold Fund | |
Cost of Investments | | $ | 322,697,913 | | | $ | 45,116,953 | | | $ | 182,709,360 | | | $ | 518,285,164 | |
| | | | | | | | | | | | | | | | |
Appreciation | | $ | 75,234,365 | | | $ | 10,794,398 | | | $ | 50,143,742 | | | $ | 343,476,404 | |
Depreciation | | | (2,751,812 | ) | | | (3,148,335 | ) | | | (4,908,588 | ) | | | (15,774,636 | ) |
| | | | | | | | | | | | | | | | |
Net unrealized appreciation (depreciation) on investments | | $ | 72,482,553 | | | $ | 7,646,063 | | | $ | 45,235,154 | | | $ | 327,701,768 | |
| | | | | | | | | | | | | | | | |
Undistributed ordinary income | | $ | — | | | $ | — | | | $ | 4,177,083 | | | $ | 22,329,847 | |
Undistributed long-term capital gain | | | — | | | | 6,159,792 | | | | 29,743,827 | | | | 65,538,666 | |
| | | | | | | | | | | | | | | | |
Distributable earnings | | $ | — | | | $ | 6,159,792 | | | $ | 33,920,910 | | | $ | 87,868,513 | |
| | | | | | | | | | | | | | | | |
Other net unrealized accumulated appreciation (depreciation) | | $ | (13,727,302 | ) | | $ | — | | | $ | — | | | $ | (12,673,556 | ) |
| | | | | | | | | | | | | | | | |
Total accumulated earnings (losses) | | $ | 58,755,251 | | | $ | 13,805,855 | | | $ | 79,156,064 | | | $ | 402,896,725 | |
| | | | | | | | | | | | | | | | |
Unrealized appreciation and depreciation differ for financial statement and tax purposes primarily due to the tax deferral of wash sale losses (The Tocqueville Gold Fund only) and realization for tax purposes of unrealized losses on passive foreign investment companies (The Tocqueville Gold Fund only).
The tax character of distributions paid during the years ended October 31, 2006 and 2005 was as follows:
| | | | | | | | | |
| | | October 31, 2006 |
| | | Ordinary
Income | | Long-term
Capital
Gain | | Total |
The Tocqueville Fund | | $ | 2,189,946 | | $ | 23,608,046 | | $ | 25,797,992 |
International Value Fund | | | 712,009 | | | 25,434,697 | | | 26,146,706 |
Gold Fund | | | — | | | 31,702,831 | | | 31,702,831 |
| | | | | | | | | |
| | | October 31, 2005 |
| | | Ordinary
Income | | Long-term
Capital
Gain | | Total |
The Tocqueville Fund | | $ | 863,340 | | $ | 5,747,338 | | $ | 6,610,678 |
Small Cap Value Fund | | | — | | | 3,029,286 | | | 3,029,286 |
International Value Fund | | | 1,164,107 | | | — | | | 1,164,107 |
Gold Fund | | | — | | | 21,027,179 | | | 21,027,179 |
At October 31, 2006, certain funds had tax basis capital losses which may be carried over to offset future capital gains as shown below.
| | | |
| | | The
Tocqueville
Fund |
Capital losses expiring in: | | | |
2010 | | $ | 11,333,200 |
2013 | | | 2,394,102 |
| | | |
| | $ | 13,727,302 |
| | | |
During the year ended October 31, 2006, The Tocqueville Fund and The Tocqueville Small Cap Value Fund utilized $8,209,337 and $1,499,666 of capital loss carryforwards, respectively.
e) Foreign currency translation
Investments and other assets and liabilities denominated in foreign currencies are translated to U.S. dollars at the prevailing rates of exchange, in accordance with the Trust’s Portfolio Securities Valuation and Foreign Exchange Contracts Procedures. The Tocqueville Fund, The Tocqueville International Value Fund and The Tocqueville Gold Fund, are engaged in transactions in securities denominated in foreign currencies and, as a result, enter into foreign exchange
contracts. These Funds are exposed to additional market risk as a result of changes in the value of the underlying currency in relation to the U.S. dollar. Risks include potential inability of counterparties to meet the terms of their contracts. The value of foreign currency contracts are marked-to-market on a daily basis, which reflects the changes in the market value of the contract at the close of each day’s trading, resulting in daily unrealized gains and/or losses. When the contracts are closed, the Funds recognize a realized gain or loss.
The Funds do not isolate that portion of the results of operations resulting from changes in foreign exchange rates on investments from the fluctuations arising from changes in market prices of securities held. Such fluctuations are included with the net realized and unrealized gain or loss from investments.
Reported net realized foreign exchange gains or losses arise from sales of foreign currencies, currency gains or losses realized between the trade and settlement dates on securities transactions, the differences between the amounts of dividends, interest, and foreign withholding taxes recorded on the Fund’s books, and the U.S. dollar equivalent of the amounts actually received or paid. Net unrealized foreign exchange gains and losses arise from changes in the value of assets and liabilities other than investments in securities at the end of the fiscal period, resulting from changes in the exchange rates.
f) Written option accounting
The Tocqueville International Value Fund and The Tocqueville Gold Fund may write (sell) covered call options to hedge portfolio investments. When the Funds write (sell) an option, an amount equal to the premium received by the Funds are included in the Statements of Assets and Liabilities as an asset and an equivalent liability. The amount of the liability is subsequently marked-to-market to reflect the current value of the option written. By writing an option, the Funds may become obligated during the term of the option to deliver or purchase the securities underlying the option at the exercise price if the option is exercised. Option contracts are valued at the last sales price reported on the date of
valuation. If no sale is reported, the option contract written is valued at the average of the current bid and asked price reported on the day of valuation. When an option expires on its stipulated expiration date or the Funds enter into a closing purchase transaction, the Funds realize a gain or loss if the cost of the closing purchase transaction differs from the premium received when the option was sold without regard to any unrealized gain or loss on the underlying security, and the liability related to such option is eliminated. When an option is exercised, the premium originally received decreases the cost basis of the security (or increases the proceeds on a sale of the security), and the Funds realize a gain or loss from the sale of the underlying security.
g) Futures Contracts
Futures contracts listed for trading on a securities exchange or board of trade shall be valued at the last quoted sales price, or in the absence of a sale, the mean of the last bid and asked prices. When a Fund enters into a futures contract, it makes an initial margin deposit in a segregated account, either in cash or liquid securities. Thereafter, the futures contract is marked to market and the Fund makes (or receives) additional cash payments daily to (or from) the broker. Changes in the value of the contract are recorded as unrealized appreciation (depreciation) until the contract is closed or settled, at which time a realized gain or loss is recognized.
h) Use of Estimates
The preparation of financial statements in conformity with accounting principles generally accepted in the United States of America requires management to make estimates and assumptions that affect the reported amounts of assets and
liabilities and disclosure of contingent assets and liabilities at the date of the financial statements and the reported amounts of increases and decreases in net assets from operations during the reporting period. Actual results could differ from those estimates.
i) Other
Investments and shareowner transactions are recorded on trade date. Dividend income is recorded on the ex-dividend date or for foreign securities for which timely information is not available, when the Funds first learn of the dividend, whichever is earlier. Interest income is recognized on the accrual basis and market discount is accounted for on a yield to maturity basis from settlement date. The Funds use the first-in, first-out method for determining realized gain or loss on investments sold for both financial reporting and federal tax purposes. The Funds may be subject to foreign taxes on income, gains on investments or currency repatriation, a portion of which may be recoverable. The Funds will accrue such taxes and recoveries as applicable, based upon their current interpretation of tax rules and regulations that exist in the markets in which it invests. Distributions to shareholders are recorded on the ex-dividend date. Expenses incurred by the Trust not specifically identified to a Fund are allocated on a basis relative to the size of each Fund’s daily net asset value.
j) Repurchase Agreements
The Funds may transfer uninvested cash balances into separate accounts, the daily balance of which is invested in repurchase agreements collateralized by U.S. Treasury or federal agency obligations. The Trust’s custodian takes possession of the collateral pledged for investments in repurchase agreements (“repo” or collectively “repos”). The underlying collateral is valued daily on a mark-to-market basis to ensure that the value, at the time the agreement is entered into, is equal to at least 102% of the repurchase price, including accrued interest. In the event of default of the obligation to repurchase, the Trust has the right to liquidate the collateral and apply the proceeds in satisfaction of the
obligation. If the seller defaults and the value of the collateral declines or if bankruptcy proceedings are commenced with respect to the seller of the security, realization of the collateral by the Trust may be delayed or limited.
3. FINANCIAL INSTRUMENTS
The Funds may trade financial instruments with off-balance sheet risk in the normal course of investing activities and to assist in managing exposure to market risks such as interest rates and foreign currency exchange rates. The financial instruments include written options, forward foreign currency exchange contracts and futures contracts. The notional or contractual amounts of these instruments represent the investment the Funds have in particular classes of financial instruments and do not necessarily represent the amounts potentially subject to risk. The measurement of the risks associated with these instruments is meaningful only when all related and offsetting transactions are considered. At October 31, 2006, the Funds did not hold any financial instruments with off-balance sheet risk.
4. INVESTMENT ADVISORY AND OTHER AGREEMENTS
Tocqueville Asset Management L.P. (“Tocqueville”), is the investment adviser (the “Adviser”), to the Trust under Investment Advisory Agreements approved by shareholders. For its services, Tocqueville receives fees from The Tocqueville Fund, calculated daily and payable monthly, at an annual rate of 0.75% on the first $1 billion of the average daily net assets of the Fund, and 0.65% of the average daily net assets in excess of $1 billion. Tocqueville receives fees from The Tocqueville Small Cap Value Fund, calculated daily and payable monthly, at an annual rate of 0.75% on the first $500 million of the average daily net assets of the Fund, and 0.65% of the average daily net assets in excess of $500 million. Tocqueville receives fees from the Tocqueville International Value Fund, calculated daily and payable monthly, at an annual rate of 1.00% on the first $1 billion of the average daily net assets of the Fund, and 0.75% of the average daily net assets in excess of $1 billion. Tocqueville receives fees from The Tocqueville Gold Fund, calculated daily and payable monthly, at an annual rate of 1.00% on the first $500 million of the average daily net assets of the Fund, 0.75% of the average daily net assets in excess of $500 million but not exceeding $1 billion, and 0.65% of the average daily net assets in excess of $1 billion.
With respect to The Tocqueville Fund, effective October 31, 2006, the Adviser has contractually agreed to waive its advisory fees and/or reimburse expenses in order to ensure that The Tocqueville Fund’s total annual operating expenses do not exceed 1.25% of its average daily net assets. The Expense Limitation Agreement will remain in effect until October 31, 2007.
Pursuant to an Administrative Services Agreement, each Fund pays to the Adviser a fee computed and paid monthly at an annual rate of 0.15% of the average daily net assets of the Fund. For the year ended October 31, 2006, the Adviser has made payments of $77,030, $18,753, $80,302 and $251,636 to U.S. Bancorp Fund Services, LLC for services provided under a Sub-Administration agreement for The Tocqueville Fund, The Tocqueville Small Cap Value Fund, The Tocqueville International Value Fund and The Tocqueville Gold Fund, respectively.
Lepercq, de Neuflize/Tocqueville Securities, L.P., an affiliate of Tocqueville, (the “Distributor”) acts as distributor for shares of the Trust. Each Fund adopted a distribution and service plan pursuant to Rule 12b-1 of the 1940 Act. Pursuant to the plans, each Fund pays to the Distributor distribution and service fees of 0.25% per annum of its average daily net assets.
Commissions earned by the Distributor for services rendered as a registered broker-dealer in securities transactions for The Tocqueville Fund, The Tocqueville Small Cap Value Fund, The Tocqueville International Value Fund and The Tocqueville Gold Fund for the year ended October 31, 2006, were $182,782, $130,296, $49,553 and $316,502, respectively.
During the year ended October 31, 2004, The Tocqueville Gold Fund received a reimbursement from Tocqueville related to certain losses incurred as a result of a pricing error. The amount of the loss and corresponding reimbursement was $60,626 or $0.004 per share based on average shares outstanding during the year ended October 31, 2004.
5. FUND SHARE TRANSACTIONS
The Funds currently offer only one class of shares of beneficial interest. A redemption fee of 2.00% is imposed on redemptions of shares held 120 days or less. This fee is retained by each Fund and is credited to paid in capital. Redemptions to which the fee applies include redemptions of shares resulting from an exchange made pursuant to the Exchange Privilege, as defined in the Trust’s Prospectus dated February 28, 2006. For a more detailed description of when the redemption fee does not apply, please see the Trust’s Prospectus. The Trust may waive the redemption fee when the Adviser determines that the imposition of the redemption fee is not necessary to protect a Fund from the effects of redemptions by investors who use the Fund as a short-term trading vehicle.
6. INVESTMENT TRANSACTIONS
Purchases and sales of investment securities (excluding short-term instruments) for the year ended October 31, 2006 are summarized below.
| | | | | | | | | | | | |
| | | The Tocqueville
Fund | | Small Cap
Value Fund | | International
Value Fund | | Gold Fund |
Purchases: | | $ | 149,947,191 | | $ | 24,879,159 | | $ | 81,569,444 | | $ | 260,213,495 |
| | | | | | | | | | | | |
Sales: | | $ | 72,894,491 | | $ | 32,959,490 | | $ | 94,781,538 | | $ | 222,155,058 |
| | | | | | | | | | | | |
7. MERGER INFORMATION
Effective October 31, 2006, The Tocqueville Fund acquired, through a non-taxable merger, substantially all of the net assets of The Tocqueville Genesis Fund, a series of the Tocqueville Trust. The Tocqueville Fund issued 628,166 shares (valued at $15,236,046) for the 1,528,711 shares outstanding of The Tocqueville Genesis Fund. The net assets of the Tocqueville Genesis Fund, $15,236,046, included net unrealized appreciation on investment of $1,464,099.
Effective October 31, 2006, The Tocqueville Fund acquired, through a non-taxable merger, substantially all of the net assets of The Tocqueville Alexis Fund, a single series. The Tocqueville Fund issued 2,900,483 shares (valued at $70,350,642) for the 5,366,305 shares outstanding of The Tocqueville Alexis Fund. The net assets of the Tocqueville Alexis Fund, $70,350,642, included net unrealized appreciation on investment of $18,655,613.
8. CHANGE IN INDEPENDENT REGISTERED PUBLIC ACCOUNTING FIRM
The Trust’s Board of Trustees and Audit Committee, effective October 16, 2006, dismissed PricewaterhouseCoopers LLP (“PwC”) as independent accountants to audit the Trust’s financial statements for the fiscal year ending October 31, 2006. PwC’s report on the Trust’s financial statements for each of the past two years did not include any adverse opinion or disclaimer of opinion and was not qualified or modified as to uncertainty, audit scope or accounting principles. During the Registrant’s two most recent fiscal years and any subsequent period through October 16, 2006, there were no disagreements or events of the type required to be reported in PwC’s opinions pursuant to paragraph (iv) or (v) of Item 304(a)(1) of Regulation S-K. The Board of Trustees and the Audit Committee of the Trust engaged Grant Thornton LLP as the new independent accountants.
The Tocqueville Trust
Report of Independent Registered Public Accounting Firm
To the Shareholders and Board of Trustees of
The Tocqueville Trust:
We have audited the accompanying statements of assets and liabilities of The Tocqueville Trust (comprising The Tocqueville Fund, The Tocqueville Small Cap Value Fund, The Tocqueville International Value Fund and The Tocqueville Gold Fund) (collectively, the “Funds”), including the schedules of investments, as of October 31, 2006, and the related statements of operations, change in net assets and financial highlights for the year then ended. These financial statements and financial highlights are the responsibility of the Funds’ management. Our responsibility is to express an opinion on these financial statements and financial highlights based on our audits. The statements of changes in net assets of the Funds for the year ended October 31, 2005 and the financial highlights of the Funds for each of four years in the period ended October 31, 2005 were audited by other auditors. Those auditors expressed an unqualified opinion on those financial statements and financial highlights in their report dated December 23, 2005.
We conducted our audits in accordance with the standards of the Public Company Accounting Oversight Board (United States). Those standards require that we plan and perform the audit to obtain reasonable assurance about whether the financial statements are free of material misstatement. The Funds were not required to have, nor were we engaged to perform an audit of its internal control over financial reporting. Our audit included consideration of internal control over financial reporting as a basis for designing audit procedures that are appropriate in the circumstances, but not for the purpose of expressing an opinion on the effectiveness of the Funds’ internal control over financial reporting. Accordingly, we express no such opinion. An audit also includes examining, on a test basis, evidence supporting the amounts and disclosures in the financial statements and financial highlights. Our procedures included confirmation of securities owned as of October 31, 2006 by correspondence with the custodians and brokers. An audit also includes assessing the accounting principles used and significant estimates made by management, as well as evaluating the overall financial statement presentation. We believe that our audits provide a reasonable basis for our opinion.
In our opinion, the financial statements and financial highlights referred to above present fairly, in all material respects, the financial position of each of the aforementioned Funds of The Tocqueville Trust as of October 31, 2006, the results of their operations, changes in their net assets and their financial highlights for the year then ended, in conformity with accounting principles generally accepted in the United States of America.
/s/ GRANT THORNTON LLP
Chicago, Illinois
December 8, 2006
ADDITIONAL INFORMATION (UNAUDITED)
1. ADDITIONAL DISCLOSURE REGARDING FUND TRUSTEES AND OFFICERS
Independent Trustees
| | | | | | | | | | |
Name, Age and Address | | Position(s) Held with the Trust | | Term of Office and Length of Time Served (1) | | Principal Occupation During Past Five Years | | # of Portfolios in Fund Complex Overseen By Trustee | | Other Directorships Held by Trustee |
| | | | | |
Inge Heckel (66) 40 W. 57th St., 19th Floor New York, NY 10019 | | Trustee | | Indefinite Term, 19 Years Served | | President, New York School of Interior Design, from July 1996 to present. | | 4 | | Member of the Advisory Council, the Institute of Classical Architecture; Member, Advisory Council Olana Preservation; Member, Horticultural Committee, Wave Hill |
| | | | | |
Lucille G. Bono (73) 40 W. 57th St., 19th Floor New York, NY 10019 | | Trustee | | Indefinite Term, 7 Years Served | | Retired. Tocqueville Trust Trustee. | | 4 | | None |
| | | | | |
Larry M. Senderhauf (57) 40 W. 57th St., 19th Floor New York, NY 10019 | | Trustee | | Indefinite Term, 7 Years Served | | Retired. Administrator and Trustee, LMS 33 Profit and Pension Sharing Fund from 1983 to present. | | 4 | | Advisory Board Member, Legacy Bank, Scottsdale, Arizona |
Independent Trustees
| | | | | | | | | | |
Name, Age and Address | | Position(s) Held with the Trust | | Term of Office and Length of Time Served (1) | | Principal Occupation During Past Five Years | | # of Portfolios in Fund Complex Overseen By Trustee | | Other Directorships Held by Trustee |
| | | | | |
Guy A. Main (70) 40 W. 57th St., 19th Floor New York, NY 10019 | | Trustee | | Indefinite Term, 5 Years Served | | Retired. Formerly, Executive Vice President, Amwest Insurance Group, Inc. from April 1996 to January 2001; Chairman, President and Chief Executive Officer, Condor Services Inc. from April 1989 to April 1996. | | 4 | | Director, Amwest Insurance Group, Inc. from April 1996 to January 2001; Chairman, Association of California Insurance Companies from January 1996 to January 1998; Director, Condor Services Inc. from April 1989 to April 1996. |
| | | | | |
Charles W. Caulkins (50) 40 W. 57th St., 19th Floor New York, NY 10019 | | Trustee | | Indefinite Term,
3 Years Served | | Founder and President, Arbor Marketing, Inc. from October 1994 to present. | | 4 | | Director, Phoenix House from January 2001 to present; Director, Bridges to Community from July 2002 to present. |
| | | | | |
James W. Gerard (45) 40 W. 57th St., 19th Floor New York, NY 10019 | | Trustee | | Indefinite Term, 4 Years Served | | Principal, Juniper Capital Group, LLC (formerly known as Argus Advisors International, LLC), from August 2003 to present; Managing Director, The Chart Group from January 2001 to present; Managing Principal, Ironbound Partners from October 1998 to December 2000. | | 4 | | Director, American Overseas Memorial Day Association, 1998 to present. |
Interested Trustees (and Officers)*
| | | | | | | | | | |
Name, Age and Address | | Position(s) Held with the Trust | | Term of Office and Length of Time Served (1) | | Principal Occupation During Past Five Years | | # of Portfolios in Fund Complex Overseen By Trustee | | Other Directorships Held by Trustee |
| | | | | |
Francois D. Sicart (63) 40 W. 57th St., 19th Floor New York, NY 10019 | | Chairman, Principal Executive Officer and Trustee | | Indefinite Term, 19 Years Served | | Chairman, Tocqueville Management Corporation, the General Partner of Tocqueville Asset Management L.P. and Lepercq, de Neuflize/Tocqueville Securities L.P. from January 1990 to present; Chairman and Founder, Tocqueville Asset Management Corp. from December 1985 to January 1990; Vice Chairman of Tucker Anthony Management Corporation from 1981 to October 1986; Vice President (formerly general partner) among other positions with Tucker Anthony, Inc. from 1969 to January 1990. | | 4 | | Chairman and Director, Tocqueville Management Corporation, the General Partner of Tocqueville Asset Management L.P. and Lepercq, de Neuflize/ Tocqueville Securities, L.P. from January 1990 to present. |
| | | | | |
Robert W. Kleinschmidt (57) 40 W. 57th St., 19th Floor New York, NY 10019 | | President, Principal Operating Officer, Principal Financial Officer, and Trustee | | Indefinite Term, 14 Years Served | | President, Chief Investment Officer and Director, Tocqueville Management Corporation, the General Partner of Tocqueville Asset Management L.P. and Lepercq, de Neuflize/Tocqueville Securities, L.P. from January 1994 to present; and Managing Director from July 1991 to January 1994; Partner, David J. Greene & Co. from May 1978 to July 1991. | | 4 | | President and Director, Tocqueville Management Corporation, the General Partner of Tocqueville Asset Management L.P. and Lepercq, de Neuflize/Tocqueville Securities, L.P. |
| * | “Interested person” of the Trust is defined in the 1940 Act. Mr. Sicart and Mr. Kleinschmidt are considered “interested persons” because of their affiliation with the Adviser. |
Interested Trustees (and Officers)*
| | | | | | | | | | |
Name, Age and Address | | Position(s) Held with the Trust | | Term of Office and Length of Time Served (1) | | Principal Occupation During Past Five Years | | # of Portfolios in Fund Complex Overseen By Trustee | | Other Directorships Held by Trustee |
| | | | | |
Steve Tyrrell (34) 40 W. 57th St., 19th Floor New York, NY 10019 | | Secretary, Treasurer | | Indefinite Term, less than 1 Year Served | | Director of Operations, Tocqueville Asset Management L.P. from 2004 to present; Assistant Director of Operations, 2002-2004; Assistant Operations Manager, Lepercq, de Neuflize & Co., Inc. 1998-2002 | | N/A | | N/A |
| | | | | |
Andrea Yermack (54) 40 W. 57th St., 19th Floor New York, NY 10019 | | Anti Money Laundering Compliance Officer | | Indefinite Term, less than 1 Year Served | | Director of Compliance (April 2006-present), Lepercq, de Neuflize/Tocqueville Securities and Tocqueville Asset Management L.P.; Vice President/Deputy Director of Compliance (June 1999-April 2006), Instinet Group, LLC | | N/A | | N/A |
| | | | | |
Thomas Pandick (59) 40 W. 57th St., 19th Floor New York, NY 10019 | | Chief Compliance Officer | | Indefinite Term, Since 2004 | | Chief Compliance Officer (October 2004-present), Tocqueville Asset Management L.P.; General Counsel (January-October 2004), Tocqueville Asset Management L.P.; Vice President, Kirkbride Asset Management, Inc. (2000-2004) | | N/A | | N/A |
| 1 | Each Trustee will hold office for an indefinite term until the earliest of (i) the next meeting of shareholders, if any, called for the purpose of considering the election or re-election of such Trustee and until the election and qualification of his or her successor, if any, elected at such meeting, or (ii) the date a Trustee resigns or retires, or a Trustee is removed by the Board of Trustees or shareholders, in accordance with the Trust’s By-Laws, as amended, and Agreement and Declaration of Trust, as amended. Each officer will hold office for an indefinite term until the date he or she resigns or retires or until his or her successor is elected and qualified. |
2. INVESTMENT ADVISORY AGREEMENT DISCLOSURE
In determining whether to approve the continuance of the Investment Advisory Agreements on behalf of the Funds, the Trustees, including the disinterested Trustees, considered the following information:
1) The nature, extent and quality of services provided by the Adviser.
The Trustees reviewed in detail the nature and extent of the services provided by the Adviser under the terms of the Funds’ Investment Advisory Agreements and the quality of those services over the past year. The Trustees noted that the services include managing the investment and reinvestment of the Funds’ assets; supervising and managing all aspects of the Funds’ operations; and providing the Board on a regular basis with financial reports and analyses on the Funds’ operations and the operations of comparable investment companies. The Trustees evaluated these factors based on their direct experience with the Adviser and in consultation with Trust counsel. The Trustees concluded that the nature and extent of the services provided under the Investment Advisory Agreements were reasonable and appropriate in relation to the advisory fee, that the level of services provided by the Adviser had not diminished over the past year and that the quality of services continues to be high. The Trustees reviewed the personnel responsible for providing advisory services to the Funds and concluded, based on their experience and interaction with the Adviser, that (i) the Adviser was able to retain quality portfolio managers and other personnel; (ii) the Adviser exhibited a high level of diligence and attention to detail in carrying out its advisory responsibilities under the Investment Advisory Agreements; (iii) the Adviser was responsive to requests of the Trustees; and (iv) the Adviser had kept the Trustees apprised of developments relating to the Funds and the industry in general. The Trustees also focused on the Adviser’s reputation and long-standing relationship with the Trust.
In connection with its assessment of the performance of the Adviser, the Trustees considered the Adviser’s financial condition and whether it has the resources necessary to continue to carry out its obligations under the Investment Advisory Agreements. The Trustees concluded that the Adviser has the financial resources necessary to continue to perform its obligations under the Investment Advisory Agreements and to continue to provide the high quality services that it has provided to the Funds to date.
2) The performance of the Funds and the Adviser.
The Trustees reviewed the investment performance of the Funds, both on an absolute basis and as compared to a peer group for each respective Fund for the one-year, three-year, five-year and ten-year periods, as applicable, ended July 31, 2006. The peer groups were comprised of other funds that had similar investment objectives and sales load structures, as determined by Lipper: The Lipper Multi-Cap Value Funds peer group, with average net assets between $225 million and $275 million, for The Tocqueville Fund; the Lipper Small-Cap Core Funds peer group, with average net assets between $55 million and $65 million, for The Tocqueville Small Cap Value Fund; The Lipper International Small/Mid Cap Growth Funds peer group, with average net assets between $175 million and $225 million, for The Tocqueville International Fund; The Lipper Gold Oriented Funds peer group, with average net assets between $400 million and $1,000 million, for The Tocqueville Gold Fund; and the Lipper Mid-Cap Core Funds peer group, with average net assets between $10 million and $30 million, for The Tocqueville Genesis Fund (the “Peer Groups”).
The Trustees also compared each Fund’s investment performance against its benchmark market indices: the S&P 500 Index for The Tocqueville Fund; The Russell 2000 Index for The Tocqueville Small Cap Value Fund; the Morgan Stanley EAFE Index for The Tocqueville International Value Fund; the S&P 500 Index and the Philadelphia Stock Exchange Gold/Silver Index for The Tocqueville Gold Fund; and the Wilshire 5000 Index for The Tocqueville Genesis Fund (the
“Indices”) for the most recent fiscal quarter ended July 31, 2006, and for the one-year, three-year, five-year and ten-year periods ended July 31, 2006. The Trustees considered the above information as helpful in their assessment of whether the Adviser was obtaining for the Funds’ shareholders the performance that was available in the marketplace given each Fund’s investment objectives, policies, strategies, limitations and restrictions. The Board concluded that the performance of the Funds against their respective Peer Groups was satisfactory. In particular, the Board noted that with the exception of this most recent fiscal quarter, during which time all the Funds performed poorly as compared to their benchmarks, The Tocqueville Fund had performed well as compared to its Index for all periods and generally outperformed the median of its Peer Group, only slightly behind the median of its Peer Group for its ten-year period. The Board noted that with respect to the Tocqueville Small Cap Value Fund that despite underperforming its Index and the median of its Peer Group at various time periods, the Fund had outperformed both its Index and the median of its Peer Group for its ten-year period. The Board observed that The Tocqueville Genesis Fund underperformed the median of its Peer Group and its Index for the one-year period ended July 31, 2006, but also noted that the Fund was still relatively new. The Board further noted that overall The Tocqueville International Value Fund and The Tocqueville Gold Fund generally seemed to be in line with their respective Indices and median Peer Groups.
3) The cost of the advisory services and the profits to the Adviser from the relationship with the Trust.
In connection with the Trustee’s consideration of the level of the advisory fees, the Trustees considered a number of factors. The Trustees compared the level of the advisory fees for each Fund against the advisory fees charged (i) by funds in their respective Peer Groups, (ii) other funds with an investment policy similar to the Funds’ that are advised or sub-advised by the Adviser (the Tocqueville Alexis Fund), and (iii) other types of accounts, such as institutional and pension accounts, with similar investment policies to the Funds’ that are advised or sub-advised by the Adviser, of which there were none. The Trustees also considered comparative total fund expenses of the Funds and the Peer Groups. The Trustees used this comparative fee information and total expense data as a guide to help assess the reasonableness of each Fund’s advisory fee, although they acknowledged that it was difficult to make precise comparisons with other funds since the exact nature of services provided under each Peer Group fund agreement is often not apparent. The Trustees also viewed the Peer Group fee information as a whole as useful in assessing whether the Adviser was providing services at a cost that was competitive with other, similar funds.
The Board noted that the contract rate advisory fee for each of the Funds was reasonable, but above average for the Tocqueville Fund, the Tocqueville Gold Fund and the Tocqueville Genesis Fund, when compared to their respective Peer Groups. The Board noted that the contract advisory fee for all the Funds was higher than the other fund advised by the Adviser. The Board further observed that the total expense ratios of the Funds were also reasonable. The Board noted that all the Funds, except for the Tocqueville Genesis Fund, were below average, when compared to their respective Peer Groups. The Board noted that the total expense ratios for all the Funds were higher than the other fund advised by the Adviser. The Board also noted that The Tocqueville Genesis Fund operates pursuant to an Expense Limitation Agreement whereby the Adviser has agreed to waive a portion of its fee necessary to limit the Fund’s total operating expenses to the level set forth in the Fund’s prospectus. In assessing this information, the Trustees considered both the comparative contract rate advisory fee as well as the level of advisory fee after waivers and/or reimbursement.
The Trustees also considered the profitability to the Adviser and its affiliate arising out of its relationship with the Trust. In this regard, the Trustees reviewed profitability data relating to the Adviser for the year October 31, 2005. The Trustees considered revenues received by the Adviser under the Investment Advisory Agreements and the Administration Agreement as well as revenues received by the Adviser’s affiliate under the 12b-1 plans and related agreements. The
Trustees also received a handout disclosing the Adviser’s financial statements and the Adviser provided an oral update on its profitability numbers since October 31, 2005. The Trustees concluded that the profitability of the Funds to the Adviser was not excessive.
4) The extent to which economies of scale will be realized as the Funds grow and whether fee levels reflect those economies of scale.
With respect to the Trustees’ consideration of economies of scale, the Trustees discussed with the Adviser whether economies of scale would be realized by it in its management of the Fund at higher asset levels. The Trustees also reviewed the Peer Group data to assess whether the Peer Group funds had advisory fee breakpoints and, if so, at what asset levels. The Trustees noted that the Funds currently have advisory fee breakpoints and that they were satisfied that the current breakpoints were appropriate when compared with each Fund’s respective Peer Group. In the event there were significant asset growth in the future, the Trustee’s determined to reassess whether the advisory fees, including the current breakpoint structure, appropriately took into account any economies of scale that had been realized as a result of that growth.
5) Other Factors.
The Board also discussed the Adviser’s practices regarding the selection and compensation of brokers and dealers that execute portfolio transactions for the Funds and the brokers’ and dealers’ provision of brokerage and research services to the Adviser. The Trustees further discussed the potential benefits the Adviser derived from the Funds’ soft dollar arrangements, whereby brokers provide research to the Funds or the Adviser in return for allocating fund brokerage, and other investment data concerning soft dollars.
Based on a consideration of all these factors in their totality, the Trustees, including all of the disinterested Trustees, determined that the Funds’ advisory fees were fair and reasonable with respect to the quality of services that the Adviser provides and in light of the other factors described above that the Trustees deemed relevant. The Trustees based their decision on evaluations of all these factors as a whole and did not consider any one factor as all-important or controlling.
3. PROXY VOTING POLICIES AND PROCEDURES
A description of the policies and procedures that The Tocqueville Trust uses to determine how to vote proxies relating to portfolio securities is available without charge upon request by calling 1-800-355-7307. Information regarding how The Tocqueville Trust voted proxies relating to portfolio securities during the most recent 12-month period ended June 30 is available by calling 1-800-355-7307 and it is also available on the SEC’s web site at http://www.sec.gov.
4. SHAREHOLDER REPORTS AND QUARTERLY PORTFOLIO DISCLOSURE
The Tocqueville Trust is required to file its complete schedule of portfolio holdings with the SEC for its first and third fiscal quarters on Form N-Q for fiscal quarters ending on or after July 9, 2004. Once filed, the Trust’s Form N-Q will be available without charge, upon request on the SEC’s website (http://www.sec.gov) and may be available by calling 1-800-697-3863. You can also obtain copies of Form N-Q by (i) visiting the SEC’s Public Reference Room in Washington, DC (information on the operation of the Public Reference Room may be obtained by calling 1-202-551-8090); (ii) sending your request and a duplicating fee to the SEC’s Public Reference Room, Washington, DC 20549-0102; or (iii) sending your request electronically to publicinfosec.gov. Quarterly portfolio holdings are also available on the website of The Tocqueville Funds, www.tocquevillefunds.com.
5. SHAREHOLDER NOTIFICATION OF FEDERAL TAX STATUS
The Funds designate the following percentages of ordinary dividends declared during the fiscal year ended October 31, 2006 as dividends qualifying for the dividends received deduction available to corporate shareholders:
| | | |
The Tocqueville Fund | | 100.00 | % |
International Value Fund | | 10.06 | % |
The Funds designate the following percentages of ordinary dividends declared from net investment income during the fiscal year ended October 31, 2006 as qualified income under the Jobs and Growth Tax Relief Reconciliation Act of 2003:
| | | |
The Tocqueville Fund | | 100.00 | % |
International Value Fund | | 100.00 | % |
For the year ended October 31, 2006, the funds designate the following percent of ordinary distributions paid as interest-related dividends under the Internal Revenue Code Section 871(k)(1)(c): The Tocqueville Fund—14.67%, International Value Fund—5.67%.
For the fiscal year ended October 31, 2006, the following percentages of its ordinary income distributions paid are designated as short-term capital gain distributions under the Internal Revenue Code Section 871(k)(2)(c): The Tocqueville Fund—0.00%, International Value Fund—0.00%.
6. FOREIGN TAX CREDIT
For the year ended October 31, 2006, the Tocqueville International Value Fund earned foreign source income and paid foreign taxes which they intend to pass through to their shareholders pursuant to Section 853 of the Internal Revenue Code as follows:
| | | | |
Country | | Gross Dividend
Per Share | | Taxes Withheld
Per Share |
Austria | | 0.003005 | | 0.000451 |
Belgium | | 0.005165 | | 0.000775 |
Brazil | | 0.000000 | | 0.000000 |
Canada | | 0.003329 | | 0.000543 |
China | | 0.031157 | | 0.006231 |
Finland | | 0.026404 | | 0.005236 |
France | | 0.035990 | | 0.005339 |
Greece | | 0.005123 | | 0.000000 |
Hong Kong | | 0.005737 | | 0.000000 |
Indonesia | | 0.008373 | | 0.001256 |
Italy | | 0.069221 | | 0.010383 |
Japan | | 0.048525 | | 0.003471 |
Malaysia | | 0.008065 | | 0.000000 |
Mexico | | 0.008872 | | 0.000000 |
Netherlands | | 0.127689 | | 0.019273 |
Singapore | | 0.069102 | | 0.000000 |
South Africa | | 0.000000 | | 0.000000 |
South Korea | | 0.021978 | | 0.003655 |
Sweden | | 0.000000 | | 0.000000 |
Switzerland | | 0.022985 | | 0.003448 |
Taiwan | | 0.022849 | | 0.005242 |
Thailand | | 0.011969 | | 0.001197 |
United Kingdom | | 0.025443 | | 0.000000 |
| | | | |
| | 0.560983 | | 0.066499 |
| | | | |
For the fiscal year ended October 31, 2006, the Tocqueville Gold Fund earned foreign source income and paid foreign taxes which they intend to pass through to their shareholders pursuant to Section 853 of the Internal Revenue Code as follows:
| | | | |
Country | | Gross Dividend
Per Share | | Taxes Withheld
Per Share |
Australia | | 0.0178 | | 0.0000 |
Canada | | 0.1265 | | 0.0076 |
Hong Kong | | 0.0093 | | 0.0000 |
Peru | | 0.0155 | | 0.0006 |
Russia | | 0.0247 | | 0.0039 |
South Africa | | 0.1439 | | 0.0006 |
| | | | |
| | 0.3376 | | 0.0127 |
| | | | |
Item 2. Code of Ethics.
The registrant has adopted a code of ethics that applies to the registrant’s Principal Executive Officer and Principal Financial Officer. The registrant has not made any amendments to its code of ethics during the period covered by this report. The registrant has not granted any waivers from any provisions of the code of ethics during the period covered by this report.
A copy of the registrant’s Code of Ethics is filed herewith.
Item 3. Audit Committee Financial Expert.
The registrant’s Board of Trustees has determined that there are three audit committee financial experts serving on its audit committee, James Gerard, Guy Main and Larry Senderhauf, who are “independent” as defined in Item 3 of Form N-CSR.
Item 4. Principal Accountant Fees and Services.
| | | | | | |
| | | FYE 10/31/06 | | FYE 10/31/05 |
4(a) Audit Fees | | $ | 80,000 | | $ | 88,000 |
4(b) Audit Related Fees | | $ | 0 | | $ | 0 |
4(c) Tax Fees | | $ | 12,600 | | $ | 33,500 |
4(d) All Other Fees | | $ | 0 | | $ | 0 |
“Tax Services” refer to professional services rendered by the principal accountant for tax compliance, tax advice, and tax planning.
4(e)(1) The registrant’s audit committee is required to pre-approve (i) all audit and non-audit services performed by the independent registered public accounting firm (“accountants”) for the registrant and (ii) any non-audit services performed by the accountants for the registrant’s investment adviser and control persons of the adviser that provide ongoing services to the registrant (“Service Affiliates”) if the services relate directly to the operations and financial reporting of the registrant. The audit committee has not presently established any pre-approval policies and procedures that permit the pre-approval of the above services other than by the full audit committee. Certain de minimis exceptions are allowed for non-audit services in accordance with Rule 2-01(c)(7)(i)(C) of Regulation S-X as set forth in the registrant’s audit committee charter.
4(e)(2) None.
4(f) Not applicable.
4(g) The amount of non-audit fees that were billed by the registrant’s accountant for services rendered to (i) the registrant, and (ii) the registrant’s investment adviser and any control person of the adviser that provides ongoing services to the registrant for the fiscal year ended October 31, 2006 were $0 and $0, respectively. The amount of non-audit fees that were billed by
1
the registrant’s accountant for services rendered to (i) the registrant, and (ii) the registrant’s investment adviser and any control person of the adviser that provides ongoing services to the registrant for the fiscal year ended October 31, 2005 were $0 and $40,000, respectively.
4(h) The registrant’s audit committee has considered whether its principal accountant’s provision of non-audit services that were rendered to the registrant’s investment adviser, and any control persons of the investment adviser that provides ongoing services to the registrant, that were not pre-approved pursuant to paragraph (c)(7)(ii) of Rule 2-01 of Regulation S-X, is compatible with maintaining the principal accountant’s independence.
Item 5. Audit Committee of Listed Registrants.
Not applicable to registrants who are not listed issuers (as defined in Rule 10A-3 under the Securities Exchange Act of 1934).
Item 6. Schedule of Investments.
Schedule of Investments is included as part of the report to shareholders filed under Item 1 of this Form.
Item 7. Disclosure of Proxy Voting Policies and Procedures for Closed-End Management Investment Companies.
Not applicable to open-end investment companies.
Item 8. Portfolio Managers of Closed-End Management Investment Companies.
Not applicable to open-end investment companies.
Item 9. Purchases of Equity Securities by Closed-End Management Investment Company and Affiliated Purchasers.
Not applicable to open-end investment companies.
Item 10. Submission of Matters to a Vote of Security Holders.
There were no material changes to the procedures by which shareholders may recommend nominees to the registrant’s Board of Trustees that were implemented after the registrant last provided disclosure in response to the requirements of Item 407(c)(2)(iv) of Regulation S-K (as required by Item 22(b)(15) of Schedule 14A), or this Item 10.
Item 11. Controls and Procedures.
| (a) | The registrant’s Principal Executive Officer and Principal Financial Officer have evaluated the design and operation of the registrant’s disclosure controls and procedures within 90 days of the filing and have concluded that the registrant’s disclosure controls and procedures were effective in ensuring that information required to be disclosed by the registrant in this Form N-CSR was recorded, processed, summarized and reported on a timely basis. |
2
| (b) | There were no changes in the registrant’s internal controls over financial reporting that occurred during the registrant’s fourth fiscal quarter of the period covered by this report that have materially affected, or are reasonably likely to materially affect, the registrant’s internal control over financial reporting. |
Item 12. Exhibits.
| (a) | (1) Any code of ethics or amendment thereto. Filed herewith. |
| | (2) | Certifications of Principal Executive Officer and Principal Financial Officer, under Rule 30a-2 of the Investment Company Act of 1940. Filed herewith. |
| | (3) | Not applicable to open-end investment companies. |
| (b) | Certifications of Principal Executive Officer and Principal Financial Officer, under Section 906 of the Sarbanes-Oxley Act of 2002 and 18 U.S.C. § 1350. Filed herewith. |
3
SIGNATURES
Pursuant to the requirements of the Securities Exchange Act of 1934 and the Investment Company Act of 1940, the registrant has duly caused this report to be signed on its behalf by the undersigned, thereunto duly authorized.
| | |
(Registrant) | | The Tocqueville Trust |
| | |
| By (Signature and Title) | | /s/ Robert W. Kleinschmidt |
| | Robert W. Kleinschmidt, President |
Date 1/8/07
Pursuant to the requirements of the Securities Exchange Act of 1934 and the Investment Company Act of 1940, this report has been signed below by the following persons on behalf of the registrant and in the capacities and on the dates indicated.
| | |
| By (Signature and Title) | | /s/ Robert W. Kleinschmidt |
| | Robert W. Kleinschmidt, President |
Date 1/8/07
| | |
| By (Signature and Title) | | /s/ Steven J. Tyrrell |
| | Steven J. Tyrrell, Treasurer |
Date 1/8/07
4