As filed with the Securities and Exchange Commission on January 11, 2010
UNITED STATES
SECURITIES AND EXCHANGE COMMISSION
Washington, D.C. 20549
FORM N-CSR
CERTIFIED SHAREHOLDER REPORT OF REGISTERED
MANAGEMENT INVESTMENT COMPANIES
Investment Company Act file number 811-4840
The Tocqueville Trust
(Exact name of registrant as specified in charter)
The Tocqueville Trust
40 W. 57th Street, 19th Floor
New York, NY 10019
(Address of principal executive offices) (Zip code)
Robert W. Kleinschmidt, President
The Tocqueville Trust
40 W. 57th Street, 19th Floor
New York, NY 10019
(Name and address of agent for service)
Registrant’s telephone number, including area code 212-698-0800
Date of fiscal year end: October 31
Date of reporting period: October 31, 2009
| Item 1. | Report to Stockholders. |
ANNUAL REPORT
October 31, 2009
The Tocqueville Trust
Mutual Funds
The Tocqueville Fund
The Tocqueville Small Cap Fund
The Tocqueville International Value Fund
The Tocqueville Gold Fund
The Delafield Fund
The Select Fund

This report is not authorized for distribution to prospective investors unless preceded or accompanied by a currently effective prospectus of The Tocqueville Trust. Please call 1-800-697-FUND (3863) for a free prospectus. Read it carefully before you invest.
You are invited to visit our website @ www.tocquevillefunds.com
Dear Fellow Shareholder,
As of this writing, most of the world’s stock market indices have experienced spectacular recoveries since their 2009 lows. However, they remain well below their 2007 highs, at the peak of the last bull market. For example, despite recovering almost 65% from its March 2009 low, the S&P 500 Index of U.S. stocks remains some 30% below its 2007 high. Interestingly, around 1100, the Index is almost exactly equidistant from this cycle high of 1576 and its low of 667.
By now, all but the most stubborn bears acknowledge that the main economies are in recovery modes and forecasts of corporate profits for 2009-2010 have been rising apace with the markets. Even so, valuations are less than compelling from a long-term perspective. In fact, various studies would indicate that, from current valuation levels (price/earnings ratios, etc.), stock market returns over the next several years could be distinctly sub-par.
In my view, the main problem is time. For valuations to be attractive again in a long-term perspective, markets have to either experience a large price decline or stall for several years while corporate profits continue to increase.
This second scenario would not be unprecedented. In fact, a recent study from Morgan Stanley’s London team observed such a pattern after many secular bear markets. After a sharp recovery from major lows, such as we just experienced, a significant but not record-breaking downward correction intervenes, which might coincide, for example, with the advent or the mere fear of a “W” economic scenario. Thereafter, for several years, stocks tend to oscillate in a broad but flattish horizontal channel.
One episode that fit this pattern would be the several years after the 1973-1974 bear market. In my recollection, despite the flattish performance of the stock markets, these years were rather favorable to bottom-up and value-style investors.
In the torment of the last few years, encompassing both the stock market decline and its emerging recovery, stocks’ behavior was dominated by macro-economic, macro-financial and liquidity considerations. This largely explains why both the decline and the recovery were unusually indiscriminate: good or bad quality, expensive or cheap, stocks moved more or less in tandem and stock selection turned out to be less useful to investment performance than usual.
In an economic and financial environment that is less-violently volatile and more in the process of normalizing, stock selection should regain its historic preeminence over macro considerations. This kind of environment should favor the fundamental, disciplined approach of our portfolio managers.
This, as well as good health, is my wish for the New Year to all of our fellow shareholders.
Respectfully,

François Sicart
Chairman
The Tocqueville Fund
Dear Fellow Shareholder,
The twelve months ended October 31, 2009 put the lie to the old Chinese greeting, “May you live in interesting times.” We just did and I am not so sure we need to live in quite such interesting times in the future. Fiscal 2009 started with the historic Presidential election, and almost as significantly, the establishment of control over both houses of Congress by the new President’s party. Partially out of fear of what the new party in power promised to do, coupled with disdain for what the old party in power had done and was doing, markets collapsed for most of the next four months, bottoming in early March. The rally that followed was nearly as historic as the decline that preceded it, taking most market participants totally by surprise. We ended the year pretty much where we started before the panic set in early September ‘08 with the nationalizations of Fannie Mae and Freddie Mac, and the subsequent collapse of Lehman Bros. What a long strange trip it’s been.
We began the year by adding to our positions in our commodity-oriented companies and in companies that would benefit from a weaker dollar which we felt was a near certain outcome of federal policies. We capitalized on depressed market conditions to take or increase positions in best in class technology companies, like Adobe Systems, and industrial companies, like Rockwell Automation, at a steep discount to cash flow based intrinsic value. We also reduced positions in our few remaining financial firms early in the period, although we did begin accumulating financials like American Express and Lazard in the first half of the fiscal year, and AFLAC and Fidelity National shortly thereafter, as we saw opportunity and excessive negative psychology in the group. We have not waded into positions in the large money center banks or investment houses, since we believe these to be either laboring under a government yoke or, possibly worse, competing against companies who are. We are unconvinced that banking, going forward, will be as profitable a business as it has been in the past, and were willing to eschew participation in the relief rally that has carried many of these firms higher recently. As the period drew to a close, we trimmed positions in the commodity area which had rallied mightily while adding internationally positioned consumer product names that we believe will benefit from global growth and a weaker dollar. We also added to our pharmaceutical and healthcare positions which, in our opinion, continue to be well out of favor, but with good value.
Over the period, The Tocqueville Fund generated a return of 14.80% compared with 9.80% for the S&P 500, the broad market measure against which we are most frequently compared. While that is a satisfying rate of return and a strong relative result, it is important to remind ourselves that both the markets, and your Fund, are still considerably lower than they were at the peak in October 2007. Indeed, over the three-year period ended October 2009, the Fund’s average annual returns have been a negative 5.51% compared with yearly negative returns of 7.02% for the broader market (S&P 500).
Why revisit this sad news? To put in perspective the recent rally and to reiterate the point that we are and have been in a bear market for some time, the recent rally notwithstanding. Our view of the future is that the markets will remain difficult once this rebound rally has run its course. Too many negative variables, like rising interest rates, higher inflation, more obstructive regulation, a weaker dollar, greater unionization, higher taxes (on everything), are likely to confront equities (and bonds) over the near term to expect broad market rallies. As a consequence, we are convinced that capital appreciation can only be the result of good stock-picking and strong fundamental research. This we are determined, and well positioned, to do. We believe our approach of bottom up, fundamental research combined with a contrarian spirit and a value oriented philosophy can prosper in difficult markets. Our longer term results are illustrative of this point. Over the ten-year period ended October 2009, a period that includes the dot.com bubble and collapse, the 9/11 market, and the housing bubble and subsequent panic, your Fund generated a positive return of 56.79% compared with a negative return of 9.10%, as measured by the S&P 500.
While global panics make profitable investing all but impossible, we do not believe (and our record shows) that merely difficult markets, like the kind we have experienced over the past ten years and which we expect in the foreseeable future, foreclose that possibility. Indeed, we have found that difficult markets create opportunities for those willing to look beyond the consensus.
As your fellow shareholder, as well as the manager of the Tocqueville Fund, let me take this opportunity to thank you for your loyalty and support, particularly over the extraordinary period we have all just experienced. May you live in profitable times.
Respectfully,

Robert W. Kleinschmidt
Portfolio Manager
The Tocqueville Fund
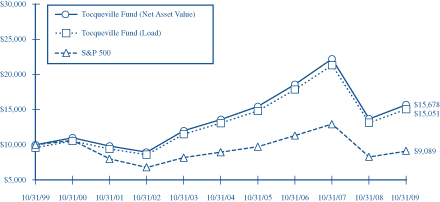
This chart assumes an initial gross investment of $10,000 made on 10/31/99. Returns shown do not reflect the deduction of taxes that a shareholder would pay on fund distributions or the redemption of fund shares. Performance reflects fee waivers in effect. In the absence of fee waivers, total return would be reduced. Returns shown include the reinvestment of all dividends and other distributions. Past performance is not predictive of future performance. Investment return and principal value will fluctuate so that your shares, when redeemed, may be worth more or less than their original cost.
The Standard & Poor’s 500 Stock Index (S&P 500) is a capital-weighted index, representing the aggregate market value of the common equity of 500 stocks primarily traded on the New York Stock Exchange. Returns assume the reinvestment of all dividends.
AVERAGE ANNUAL RATE OF RETURN (%)
FOR PERIODS ENDED OCTOBER 31, 2009
| | | | | | | | |
| | | 1 Year | | 3 Year | | 5 Year | | 10 Year |
Tocqueville Fund—Net Asset Value | | 14.80% | | -5.51% | | 2.88% | | 4.60% |
Tocqueville Fund—Load* | | 14.80% | | -5.51% | | 2.88% | | 4.17% |
Standard & Poor’s 500 Stock Index | | 9.80% | | -7.02% | | 0.33% | | -0.95% |
| * | Effective February 1, 2000, the Fund eliminated its sales load. |
The Tocqueville Small Cap Fund
Dear Fellow Shareholder,
For the fiscal year ending October 31, 2009, the Fund rose 11.68% versus a 6.46% gain for the Russell 2000 Index of small capitalization companies.
The year was anything but dull from the perspective of investors, the economy or political leaders. A worldwide economic contraction that was accelerating started the fiscal year and was rapidly followed by aggressive monetary and fiscal policy actions intended to blunt its momentum and plant the seeds of an economic recovery. Near the end of March, the market finally started to respond to those actions and with the end of an inventory liquidation cycle began its recovery. As the fiscal year ended, most signs pointed to the end of this recession and the start of another economic expansion despite the continued rise in unemployment and the continued distress in the consumer sector.
As contrarian investors, we viewed this past year’s volatility as an opportunity to upgrade the quality, diversification and potential of the portfolio. While our methodology is from a fundamental bottoms-up approach to individual companies, during the course of the year, the cumulative changes affected sector weightings within the portfolio. Energy was the sector that grew the most from just under 5% of the portfolio to 13.5% as the number of holdings in the sector increased 100%. Our consumer sector exposure also increased from 13.2% to 18.2% primarily from increases in consumer staples holdings. The Healthcare sector had the largest weighting at year-end. It was a large sector weighting all year but experienced significant changes in its composition as clinical trial results altered the mix of new product opportunities held in the portfolio.
The portfolio changes were made to take advantage of new opportunities but also to reposition the portfolio for an economic expansion that is not likely to mirror the last cycle. From 2003 through early 2007, the economic expansion was primarily based upon the consumer’s willingness and ability to borrow against home equity to fund current consumption or to buy a new home. We do not anticipate a repeat of those events as this cycle unfolds. Instead, we expect the areas that may lead this business expansion to include beneficiaries of the fiscal stimulus bills; business capital spending, particularly for information technology; expanding export opportunities; and, companies with innovative new products.
With the changes made over the course of the past year, we believe the portfolio is well positioned to take advantage of those investment themes and the anticipated business expansion.
The Tocqueville Small Cap Fund
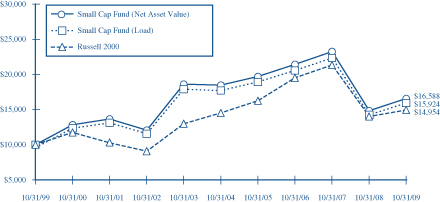
This chart assumes an initial gross investment of $10,000 made on 10/31/99. Returns shown do not reflect the deduction of taxes that a shareholder would pay on fund distributions or the redemption of fund shares. Performance reflects fee waivers in effect. In the absence of fee waivers, total return would be reduced. Returns shown include the reinvestment of all dividends and other distributions. Past performance is not predictive of future performance. Investment return and principal value will fluctuate so that your shares, when redeemed, may be worth more or less than their original cost.
The Russell 2000 Index is an unmanaged index that measures the performance of the 2,000 smallest companies in the Russell 3000 Index, which represents approximately 8% of the total market capitalization of the Russell 3000 Index. Returns assume the reinvestment of all dividends.
AVERAGE ANNUAL RATE OF RETURN (%)
FOR PERIODS ENDED OCTOBER 31, 2009
| | | | | | | | |
| | | 1 Year | | 3 Year | | 5 Year | | 10 Year |
Tocqueville Small Cap Fund—Net Asset Value | | 11.68% | | -8.22% | | -2.12% | | 5.19% |
Tocqueville Small Cap Fund—Load* | | 11.68% | | -8.22% | | -2.12% | | 4.76% |
Russell 2000 Total Return Index | | 6.46% | | -8.51% | | 0.59% | | 4.11% |
| * | Effective February 1, 2000, the Fund eliminated its sales load. |
The Tocqueville International Value Fund
Dear Fellow Shareholder,
For the fiscal year ended October 31, 2009, the Tocqueville International Value Fund’s total U.S. dollar return was 34.04%. In the same period, the Morgan Stanley EAFE Index, the index against which we are most often compared, had a total U.S. dollar return of 28.41 %.
At the outset of the fiscal year, the global financial crisis was in full swing. Financial institutions were effectively insolvent and credit markets were frozen. In the face of uncertainty, consumers and corporations cut spending, and economic activity declined sharply. With the financial system at risk and corporate earnings in an apparent free fall, investors shed risk and marked down the value of financial assets. Poor fundamentals were magnified in the markets as a liquidity squeeze led to forced selling by institutions of all stripes. By March, however, following a massive and concerted global program of monetary and fiscal stimulus and various initiatives aimed at repairing bank balance sheets, credit markets began to thaw and investor psychology began to improve. Global equity markets turned up and rallied nearly without pause through the end of the fiscal year, as corporate earnings exceeded low expectations, interest rates remained low, and skeptical investors edged back into stocks.
During the fiscal year, the European BE 500 Index increased by 9.48% in local currency terms, the Japanese Nikkei 225 increased by 18.93% in local currency terms, and the Morgan Stanley Far East increased by 10.70%. Commodity prices, which had collapsed during 2008 as speculative money fled the asset class, recovered considerable ground. Most currencies, which had weakened against the U.S. dollar when investors sought its safe haven status, then recovered sharply as risk tolerance returned to the markets and investors discounted the possible negative effects of U.S. indebtedness on the greenback. Over the twelve months, the Japanese Yen increased in value by 9.3% and the Euro by 15.7%, while commodity currencies Australian dollar and Brazilian Real increased by 34.7% and 22.7%, respectively. As the U.S. dollar declined, gold increased in price from $739 to $1,040 per ounce. In equities, the greatest gains were experienced in markets where economic activity proved most resilient, like China and India, and markets whose economies are linked with commodities, like Brazil and Indonesia. In terms of sectors, the greatest gains were experienced in metals and mining, machinery, precision equipment, and industrial products.
Our Fund held up comparatively well during the market decline due to our focus on companies with strong cash flow and limited debt, and because we had limited exposure to the hardest hit industries, like financials and real estate. We were able to capitalize on depressed market conditions to use our cash reserves and build positions in resource related shares when they were considered untouchable by most investors, such as Brazilian iron ore producer, Vale, and global copper and gold producer, Freeport McMoran. We were also able to build positions in economically sensitive companies that are leaders in niche markets at a substantial discount to intrinsic value, such as Belgian steel cord maker, Beckaert, and Belgian advanced materials producer, Umicore. During the market recovery, our Fund produced substantial absolute returns and comparatively strong results, in large part due to our positions in industrials and resource shares. We also had a significant contribution from stocks that were the subjects of takeover activity, including U.K. confectionery company, Cadbury, and Mexican beverage company, FEMSA. The largest contributors to our returns during the year were German steel distributor, Kloeckner, Cadbury, FEMSA, Italian holding company CIR, French building materials company St. Gobain, Irish fuel distributor DCC, Freeport McMoran, Brazilian oil producer Petrobras, and Japanese retailer Kyoto Kimono.
We remain cautious about the pace of a global economic recovery and the impact of excess government stimulus. On the other hand, the financial crisis has caused many businesses to operate more efficiently and has created opportunities for well-capitalized companies to improve their strategic positioning. With equity markets generally more fairly valued relative to normalized earnings, it has become a stock pickers’ market. We continue to seek and find exceptional values in companies with strong business franchises. We recently took a position in Hong Kong outdoor media company, Clear Media, and Hong Kong TV broadcaster, Television Broadcasts, both highly cash flow generative businesses with significant growth opportunities, that have thus far been overlooked by the recovery in equity valuations. We also took a position in Italian auto parts maker Sogefi, which is cheap on a cash flow basis and has substantial opportunities in growth
markets like Brazil. Finally, we took a position in Gold Fields, which is the cheapest of the major gold producers based on resources in the ground, in our judgment, and trades at a substantial discount to net asset value.
We continue to employ our investment discipline, seeking to discover fundamentally attractive companies that are out of favor and undervalued, and to provide our shareholders with above average returns with below average risk over the course of an economic cycle.
Respectfully,
| | | | |
| | |
 | | | | |
| | |
| James Hunt | | | | Francois Sicart |
| Portfolio Manager | | | | Portfolio Manager |
The Tocqueville International Value Fund
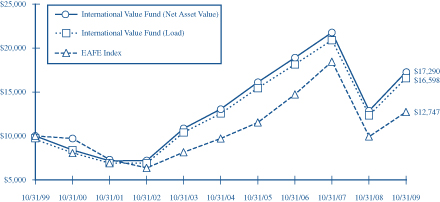
This chart assumes an initial gross investment of $10,000 made on 10/31/99. Returns shown do not reflect the deduction of taxes that a shareholder would pay on fund distributions or the redemption of fund shares. Performance reflects fee waivers in effect. In the absence of fee waivers, total return would be reduced. Returns shown include the reinvestment of all dividends and other distributions. Past performance is not predictive of future performance. Investment return and principal value will fluctuate so that your shares, when redeemed, may be worth more or less than their original cost.
The Morgan Stanley EAFE Index is an unmanaged market-capitalization-weighted index composed of companies representative of the market structure of 20 Developed Market Countries in Europe, Australia, Asia and the Far East.
AVERAGE ANNUAL RATE OF RETURN (%)
FOR PERIODS ENDED OCTOBER 31, 2009
| | | | | | | | |
| | | 1 Year | | 3 Year | | 5 Year | | 10 Year |
Tocqueville International Value Fund—Net Asset Value | | 34.04% | | -2.93% | | 5.77% | | 5.63% |
Tocqueville International Value Fund—Load* | | 34.04% | | -2.93% | | 5.77% | | 5.20% |
Morgan Stanley EAFE Index | | 28.41% | | -4.74% | | 5.59% | | 2.46% |
| * | Effective February 1, 2000, the Fund eliminated its sales load. |
The Tocqueville Gold Fund
Dear Fellow Shareholder,
For the fiscal year ended October 31, 2009, the Tocqueville Gold Fund’s total return was 135.22%. In the same period, the benchmark Philadelphia Gold/Silver Index gained 94.60%, gold bullion returned 44.28%, and the S&P 500 Index rose 9.80%.
Is gold a “bubble” because it has now become popular or is there still worthwhile upside? As contrarian investors, we find it to be more of a challenge to reconcile the metal’s recent popularity with the prospect of future rewards. Is the investment consensus always wrong, or can it be right for extended periods? Does the perceived flood of new investment mean the jig is up?
In our May 2009 website article: “A Surplus of Gullibility,” we concluded that “the bull market in gold is still young, but that it has(d) crossed an important threshold. No longer laughable and obscure, broader awareness and interest among a wider circle paves the way for capital inflows to come.” After backing and filling for most of the summer, the gold price broke through the $1000 ceiling which had held it in check for two years, and to the surprise of many, it has held this ground, even managing further gains.
The effect of four digit gold has been magical on investment psychology. Day after day, the financial media publishes glowing reports on the metal’s prospects while never failing to trash the beleaguered U.S. greenback. Major mining companies have been rushing to close out their hedge books. The Reserve Bank of India surprised the market when it bought 200 metric tons of gold from the International Monetary Fund. In so doing, it shattered the long held investment assumption that official sector selling would supply the market forever. A surfeit of low yielding dollars presents a problem for these institutions. We believe India, China, Japan and Brazil need to keep their currencies cheap in order to maintain viability for their export markets. In so doing, they will likely accumulate ever greater quantities of dollars. Therefore buying by central bank institutions underweighted in gold seems like a good bet.
In short, the world’s perception of gold has changed and the pace of the bull market has quickened. In our “Tocqueville Gold 2005 Year-End Review and Outlook” letter, dated January 26, 2006, we observed that bull markets can be measured in four stages: the beginning, the end of the beginning, the beginning of the end, and the end. At that time, we remarked that we believed the bull market had ended its first phase and entered into a second that would be marked by “noisy and dynamic behavior” that would attract new money flows. Gold was then trading around $550/ounce and we suggested that it would be more correctly priced at $1000. That was before the near death financial market experience of 2008. We believe that the crossing of $1000 marks the end of the second phase and that we have entered the third stage, or the beginning of the end. The first two stages took a full ten years. The latter two stages will likely take years, but we doubt a full decade.
We believe gold is a bubble only for those who maintain faith in the ability of politicians and financial authorities to swim against the tide of deflation. For the rest of us, it is protection against monetary damage still to come. We believe the bull market in gold still has much going for it, even if it is no longer a contrarian’s dream. It may be overbought, as bull markets often become, but we believe it is too soon to jump ship for the next great contrarian idea. The implications of gold’s continuing strength remain a mystery, even to most of those who have jumped aboard the bandwagon.
The post World War II economic model of economic growth based on secular credit expansion is broken. We believe the applicable model is a 1930’s style credit deflation. Asset prices are pressured by deleveraging. Uncertainty as to collateral values restricts credit despite available liquidity. The contraction of credit hurts economic activity, causing incomes to fall and asset values to fall further. A negative shift in expectations rapidly overtakes behavior. There is little government policy can do about this other than to devalue currency to lessen debt burdens. The Fed understands this and is acting accordingly. Keynesian stimulus packages at best mean that government spending replaces lost private sector activity to stabilize the economy. This is pretty much where things stand at the moment. It remains to be seen whether massive stimulus can offset the headwinds of a negative credit cycle. Since there is no way to know how these wild
experiments in monetary and fiscal stimulus will turn out, investors are gravitating to gold, knowing that the integrity of the currency is the last thing on the minds of policy makers.
Gold is a wager that these measures will not restore economic health over the longer term and that further currency debasement will be deemed necessary. Zero interest rates are designed to encourage a new carry trade. Free money is intended to inflate asset values in hopes of restarting the credit cycle. In other words, our “leaders” in Washington will solve the problem of too much debt with more debt. Decades of Keynesian policies have brought us to the brink of a credit collapse. Unfortunately, there is little to suggest introspection. Most expect and assume that government intervention will continue to work miracles.
The middle ground between deflation and inflation exists only in the imagination of policy makers and analysts who still believe that government is capable of creating wealth. Things should really get interesting for gold if government actions are seen to be impotent. Gold is a hedge against a world monetary order on its death bed. The drama may take a few more years to play out, but we believe it is almost certainly in its terminal stages. Gold and gold mining shares still seem likely to provide a superior refuge against this backdrop.
With best wishes for a prosperous 2010,
Sincerely,

John C. Hathaway
Portfolio Manager
The Tocqueville Gold Fund
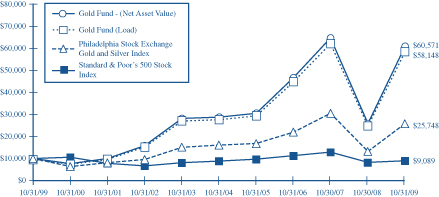
This chart assumes an initial gross investment of $10,000 made on 10/31/99. Returns shown do not reflect the deduction of taxes that a shareholder would pay on fund distributions or the redemption of fund shares. Performance reflects fee waivers in effect. In the absence of fee waivers, total return would be reduced. Returns shown include the reinvestment of all dividends and other distributions. Past performance is not predictive of future performance. Investment return and principal value will fluctuate so that your shares, when redeemed, may be worth more or less than their original cost.
In 2003, 2006 and 2009, the performance of The Tocqueville Gold Fund was achieved during a period of unusually favorable market conditions. Such performance may not be sustainable.
The Philadelphia Stock Exchange Gold and Silver Index is an unmanaged capitalization-weighted index which includes the leading companies involved in the mining of gold and silver.
The Standard & Poor’s 500 Stock Index (S&P 500) is a capital-weighted index, representing the aggregate market value of the common equity of 500 stocks primarily traded on the New York Stock Exchange. Returns include the reinvestment of all dividends.
AVERAGE ANNUAL RATE OF RETURN (%)
FOR PERIODS ENDED OCTOBER 31, 2009
| | | | | | | | |
| | | 1 Year | | 3 Year | | 5 Year | | 10 Year |
Tocqueville Gold Fund—Net Asset Value | | 135.22% | | 9.21% | | 16.11% | | 19.74% |
Tocqueville Gold Fund—Load* | | 135.22% | | 9.21% | | 16.11% | | 19.25% |
Philadelphia Stock Exchange Gold and Silver Index | | 94.60% | | 5.46% | | 9.78% | | 9.91% |
Standard & Poor’s 500 Stock Index | | 9.80% | | -7.02% | | 0.33% | | -0.95% |
| * | Effective February 1, 2000, the Fund eliminated its sales load. |
The Delafield Fund
Dear Fellow Shareholder,
For the twelve months ended October 31, 2009, the Fund’s net asset value increased 29.71% versus an increase of 9.80% for the Standard & Poor’s 500 Index (“S&P 500”) and 6.46% for the Russell 2000 Index (“Russell 2000”), each on a total return basis. The Fund’s net asset value as of October 31, 2009 was $21.35 per share. The net asset value amounted to $636,547,628 of which 72.6% was invested in equities, 3.6% in fixed income, and the balance held in reserve.1
The magnitude of the recovery in the stock market has astonished us. For perspective, through the three months ended January 31, 2009, the Fund’s net asset value had dropped 16.17% versus declines of 14.09% and 17.09% for the S&P 500 and the Russell 2000 respectively (each on a total return basis). Fortunately, we kept faith in our investments and have participated in the sustained rebound that began in March 2009. The largest contributors to our performance during the year were Flextronics International Ltd., MPS Group, Inc., and R.R. Donnelley & Sons Company.
As share prices have risen, we have taken the opportunity to further increase reserves. While the valuation of many of our investments now appear to anticipate a strong economic recovery, we are not sure how quickly or how robust the corporate profit improvement will actually be. While we expect to continue to participate in an ongoing market recovery, we believe we are positioned to be somewhat protected if a new decline occurs.
We think it would be a mistake to expect that the turbulence of the past two years is over and that a recovery will proceed along a smooth path. Unemployment continues to rise, albeit at a slower pace, and the welfare rolls are increasing. Government stimulus programs have already been or are being implemented around the world. However, their impact will vary with regard to speed and efficacy. While the liquidity of our banking system is slowly improving, many companies are finding their ability to borrow constrained by restrictive covenants due to decreased earnings and many banks’ focus on their own troubled loan portfolios. Fortunately, public debt markets have improved measurably and many companies have also been able to issue equity to relieve strained balance sheets.
Although consumer real disposable income has shown an increase in 2009, it has been buoyed in part by unemployment payments, tax rebates and other government programs. Consumer confidence is shaky and gasoline and other commodity prices have risen from earlier in the year. On the positive side, housing values may be stabilizing, and consumer net worth rose at the end of the second quarter for the first time in six quarters. We expect consumer demand to remain constrained and interest rates, in general, to remain moderate, which is allowing some improvement in mortgage refinancing activity.
In the meantime, corporate profitability is likely to be dampened by low operating rates, increasing raw material costs (partially a result of a weaker dollar) and sharply higher pension obligations. Finally, uncertainties remain on political fronts including labor policy, protectionism, regulation for financial institutions and changes in the tax code. We believe that all of the above create uncertainty which could stunt economic recovery.
It seems worth reiterating the strategy which we employ in attempting to protect your capital and to enhance its growth. This approach has resulted in above average returns for many years. We believe it is logical and we will continue to seek to provide attractive returns in the years ahead.
1. We search for companies that we believe are selling at prices which seem modest in relationship to the company’s intrinsic value.
| 1 | The performance information provided prior to September 28, 2009 is historical information for the Delafield Fund, Inc. (the “Predecessor Fund”), which was reorganized into The Delafield Fund on September 28, 2009. The Predecessor Fund was managed by Reich & Tang Asset Management, LLC and had the same portfolio managers, investment objectives and investment strategies as The Delafield Fund. |
2. We meet with management, visit plants, talk to their competitors, consider the makeup of the Board of Directors and make a judgment as to whether we wish to be in business with the management. In other words, we try to understand the business of the companies in which we invest and the individuals who direct the company’s future.
3. We search for companies wherein something may change which will alter that company’s future for the better. These can be simple matters ranging from a change in the management or management’s attitude toward how they run the business, to a change in control, to a change in business opportunity, or to a change in the dynamics of a company’s cash flow and its use.
4. If we perform our analysis correctly, the value added we bring to you is an earlier and better understanding of the companies in our portfolio than that of other investors. Then, if the companies begin to improve, their earnings should increase and they should be valued at a higher price earnings multiple.
5. We have never worried about the profits that we did not make. We worry much more about what we might lose. We believe that stock selection is much more relevant to successful investing than total commitment to equities. In the volatile markets which have developed over the last 15 to 20 years, we have come to believe that the long-term investors�� best hedge against volatility is to have cash with which to invest in companies when prices seem unduly depressed.
The extraordinary economic events of the past two years have been traumatic. We believe that they should not be forgotten and that the effects will have significant consequences for the intermediate future. We remain anxious, believing it is better, in this environment, to err on the side of caution.
Sincerely,
| | |
 | |  |
| |
| J. Dennis Delafield | | Vincent Sellecchia |
| Portfolio Manager | | Portfolio Manager |
The Delafield Fund
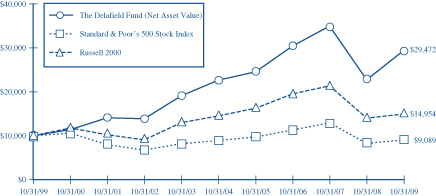
This chart assumes an initial gross investment of $10,000 made on 10/31/99. Since the Delafield Fund did not commence operations until 9/28/09, returns prior to that date are those of the Predecessor Fund. The Delafield Fund assumed the net asset value and performance history of the Predecessor Fund (See Footnote 1 to the Financial Statements). Returns shown does not reflect the deduction of taxes that a shareholder would pay on fund distributions or the redemption of fund shares. Performance reflects fee wiaviers in effect. In the absence of fee waivers, total return would be reduced. Returns shown include the reinvestment of all dividends and other distributions. Past performance is not predictive of future performance. Investment return and principal value will fluctuate so that your shares, when redeemed, may be worth more or less than their original cost.
The Standard & Poor’s 500 Stock Index (S&P 500) is a capital-weighted index, representing the aggregate market value of the common equity of 500 stocks primarily traded on the New York Stock Exchange.
The Russell 2000 Index is an unmanaged index that measures the performance of the 2,000 smallest companies in the Russell 3000 Index, which represent approximately 8% of the total market capitalization of the Russell 3000 Index. Returns include the reinvestment of all dividends.
AVERAGE ANNUAL RATE OF RETURN (%)
FOR PERIODS ENDED OCTOBER 31, 2009
| | | | | | | | |
| | | 1 Year | | 3 Year | | 5 Year | | 10 Year |
The Delafield Fund | | 29.71% | | -1.08% | | 5.42% | | 11.41% |
Standard & Poor’s 500 Stock Index | | 9.80% | | -7.02% | | 0.33% | | -0.95% |
Russell 2000 Total Return Index | | 6.46% | | -8.51% | | 0.59% | | 4.11% |
The Select Fund
Dear Fellow Shareholder,
For the twelve months ended October 31, 2009, the Fund’s net asset value increased 33.12% versus an increase of 13.26% for the Russell 2500 Index (“Russell 2500”), on a total return basis. The Fund’s net asset value as of October 31, 2009 was $8.46 per share. The net asset value amounted to $24,681,043 of which 85.8% was invested in equities and the balance held in reserve.1
The magnitude of the recovery in the stock market has astonished us. For perspective, through the three months ended January 31, 2009, the Fund’s net asset value had dropped 16.51% versus a decline 14.46% for the Russell 2500 respectively, on a total return basis. Fortunately, we kept faith in our investments and have participated in the sustained rebound that began in March 2009. The largest contributors to our performance during the year were Flextronics International Ltd., Ashland Inc., and Esterline Technologies Corporation.
As share prices have risen, we have taken the opportunity to increase reserves. While the valuation of many of our investments now appear to anticipate a strong economic recovery, we are not sure how quickly or how robust the corporate profit improvement will actually be. While we expect to continue to participate in an ongoing market recovery, we believe we are positioned to be somewhat protected if a new decline occurs.
We think it would be a mistake to expect that the turbulence of the past two years is over and that a recovery will proceed along a smooth path. Unemployment continues to rise, albeit at a slower pace, and the welfare rolls are increasing. Government stimulus programs have already been or are being implemented around the world. However, their impact will vary with regard to speed and efficacy. While the liquidity of our banking system is slowly improving, many companies are finding their ability to borrow constrained by restrictive covenants due to decreased earnings and many banks’ focus on their own troubled loan portfolios. Fortunately, public debt markets have improved measurably and many companies have also been able to issue equity to relieve strained balance sheets.
Although consumer real disposable income has shown an increase in 2009, it has been buoyed in part by unemployment payments, tax rebates and other government programs. Consumer confidence is shaky and gasoline and other commodity prices have risen from earlier in the year. On the positive side, housing values may be stabilizing, and consumer net worth rose at the end of the second quarter for the first time in six quarters. We expect consumer demand to remain constrained and interest rates, in general, to remain moderate, which is allowing some improvement in mortgage refinancing activity.
In the meantime, corporate profitability is likely to be dampened by low operating rates, increasing raw material costs (partially a result of a weaker dollar) and sharply higher pension obligations. Finally, uncertainties remain on political fronts including labor policy, protectionism, regulation for financial institutions and changes in the tax code. We believe that all of the above create uncertainty which could stunt economic recovery.
It seems worth reiterating the strategy which we employ in attempting to protect your capital and to enhance its growth. This approach has resulted in above average returns for many years. We believe it is logical and we will continue to seek to provide attractive returns in the years ahead.
1. We search for companies that we believe are selling at prices which seem modest in relationship to the company’s intrinsic value.
| 1 | The performance information provided prior to September 28, 2009 is historical information for the Delafield Select Fund’s Class Y shares (the “Predecessor Fund”), a series of Natixis Funds Trust II, which was reorganized into The Select Fund on September 28, 2009. The Predecessor Fund was managed by Reich & Tang Asset Management, LLC and had most of the same portfolio managers, as well as substantially identical investment objectives and investment strategies as The Select Fund. |
2. We meet with management, visit plants, talk to their competitors, consider the makeup of the Board of Directors and make a judgment as to whether we wish to be in business with the management. In other words, we try to understand the business of the companies in which we invest and the individuals who direct the company’s future.
3. We search for companies wherein something may change which will alter that company’s future for the better. These can be simple matters ranging from a change in the management or management’s attitude toward how they run the business, to a change in control, to a change in business opportunity, or to a change in the dynamics of a company’s cash flow and its use.
4. We will typically invest in a focused group of 12 to 25 common stocks issued primarily by small- to mid-sized domestic companies.
5. If we perform our analysis correctly, the value added we bring to you is an earlier and better understanding of the companies in our portfolio than that of other investors. Then, if the companies begin to improve, their earnings should increase and they should be valued at a higher price earnings multiple.
6. We have never worried about the profits that we did not make. We worry much more about what we might lose. We believe that stock selection is much more relevant to successful investing than total commitment to equities.
The extraordinary economic events of the past two years have been traumatic. We believe that they should not be forgotten and that the effects will have significant consequences for the intermediate future. We remain anxious, believing it is better, in this environment, to err on the side of caution.
| | | | |
| Sincerely, | | | | |
| | |
| | | |  |
| | |
| J. Dennis Delafield | | Vincent Sellecchia | | Donald Wang |
| Portfolio Manager | | Portfolio Manager | | Portfolio Manager |
The Select Fund
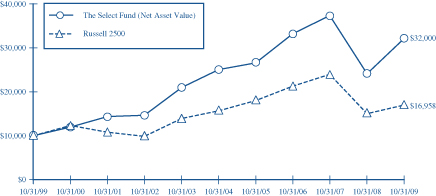
This chart assumes an initial gross investment of $10,000 made on 10/31/99. Since The Select Fund did not commence operations until 9/28/09, returns from the period from September 29, 2008 to September 27, 2009 are those of the Class Y Shares of the Predecessor Fund (See Footnote 1 to the Financial Statements). Prior to that period, returns shown are those of a limited partnership managed by the adviser. Returns shown do not reflect the deduction of taxes that a shareholder would pay on fund distributions or the redemption of fund shares. Performance reflects fee waivers in effect. In the absence of fee waivers, total return would be reduced. Returns shown include the reinvestment of all dividends and other distributions. Past performance is not predictive of future performance. Investment return and principal value will fluctuate so that your shares, when redeemed, may be worth more or less than their original cost.
The Russel 2500 Total Return Index is an unmanaged index that measures the performance of the 2,500 smallest companies in the Russell 3000 Index. Returns include the reinvestment of all dividends.
AVERAGE ANNUAL RATE OF RETURN (%)
FOR PERIODS ENDED OCTOBER 31, 2009
| | | | | | | | |
| | | 1 Year | | 3 Year | | 5 Year | | 10 Year |
The Select Fund | | 33.12% | | -1.04% | | 5.11% | | 12.33% |
Russell 2500 Total Return Index | | 13.26% | | -7.14% | | 1.61% | | 5.42% |
Expense Example—October 31, 2009
As a shareholder of The Tocqueville Trust (the “Funds”), you incur ongoing costs, including management fees; distribution fees; and other Fund expenses. This example is intended to help you understand your ongoing costs (in dollars) of investing in the Funds and to compare costs with the ongoing costs of investing in other mutual funds.
The Example is based on an investment of $1,000 invested at the beginning of the period and held the entire period (May 1, 2009-October 31, 2009).
Actual Expenses
The first line of the table below provides information about actual account values and actual expenses. You may use the information in this line, together with the amount you invested, to estimate the expenses that you paid over the period. Simply divide your account value by $1,000 (for example, an $8,600 account value divided by $1,000 = 8.6), then multiply the result by the number in the first line under the heading entitled “Expenses Paid During Period” to estimate the expenses you paid on your account during this period.
Hypothetical Example for Comparison Purposes
The second line of the table below provides information about hypothetical account values and hypothetical expenses based on the Funds’ actual expense ratios and an assumed rate of return of 5% per year before expenses, which is not the Funds’ actual return. The hypothetical account values and expenses may not be used to estimate the actual ending account balance or expenses you paid for the period. You may use this information to compare the ongoing costs of investing in the Funds and other funds. To do so, compare this 5% hypothetical example with the 5% hypothetical examples that appear in the shareholder reports of the other funds.
Please note that the expenses shown in the table are meant to highlight your ongoing costs only and do not reflect any transactional costs, such as sales charges (loads), redemption fees, or exchange fees. Therefore, the second line of the table is useful in comparing ongoing costs only, and will not help you determine the relative costs of owning different funds. In addition, if these transactional costs were included, your costs would have been higher.
Expense Example Tables
The Tocqueville Fund
| | | | | | | | | |
| | | Beginning
Account Value
May 1, 2009 | | Ending
Account Value
October 31, 2009 | | Expenses Paid
During Period*
May 1, 2009 -
October 31, 2009 |
Actual | | $ | 1,000.00 | | $ | 1,197.00 | | $ | 6.92 |
Hypothetical (5% return before expenses) | | | 1,000.00 | | | 1,018.90 | | | 6.36 |
| * | Expenses are equal to the Fund’s annualized expense ratio of 1.25%, multiplied by the average account value over the period, multiplied by 184/365 to reflect the one-half year period. |
The Tocqueville Small Cap Fund
| | | | | | | | | |
| | | Beginning
Account Value
May 1, 2009 | | Ending
Account Value
October 31, 2009 | | Expenses Paid
During Period*
May 1, 2009 -
October 31, 2009 |
Actual | | $ | 1,000.00 | | $ | 1,145.70 | | $ | 7.57 |
Hypothetical (5% return before expenses) | | | 1,000.00 | | | 1,018.15 | | | 7.12 |
| * | Expenses are equal to the Fund’s annualized expense ratio of 1.40%, multiplied by the average account value over the period, multiplied by 184/365 to reflect the one-half year period. |
The Tocqueville International Value Fund
| | | | | | | | | |
| | | Beginning
Account Value
May 1, 2009 | | Ending
Account Value
October 31, 2009 | | Expenses Paid
During Period*
May 1, 2009 -
October 31, 2009 |
Actual | | $ | 1,000.00 | | $ | 1,305.10 | | $ | 9.24 |
Hypothetical (5% return before expenses) | | | 1,000.00 | | | 1,017.19 | | | 8.08 |
| * | Expenses are equal to the Fund’s annualized expense ratio of 1.59%, multiplied by the average account value over the period, multiplied by 184/365 to reflect the one-half year period. |
The Tocqueville Gold Fund
| | | | | | | | | |
| | | Beginning
Account Value
May 1, 2009 | | Ending
Account Value
October 31, 2009 | | Expenses Paid
During Period*
May 1, 2009 -
October 31, 2009 |
Actual | | $ | 1,000.00 | | $ | 1,448.90 | | $ | 8.95 |
Hypothetical (5% return before expenses) | | | 1,000.00 | | | 1,017.90 | | | 7.37 |
| * | Expenses are equal to the Fund’s annualized expense ratio of 1.45%, multiplied by the average account value over the period, multiplied by 184/365 to reflect the one-half year period. |
The Delafield Fund
| | | | | | | | | |
| | | Beginning
Account Value
May 1, 2009 | | Ending
Account Value
October 31, 2009 | | Expenses Paid
During Period*
May 1, 2009 -
October 31, 2009 |
Actual | | $ | 1,000.00 | | $ | 1,272.80 | | $ | 7.85 |
Hypothetical (5% return before expenses) | | | 1,000.00 | | | 1,018.30 | | | 6.97 |
| * | Expense are equal to the Fund’s annualized expense ratio of 1.37%, multiplied by the average account value over the period, multiplied by 184/365 to reflect the one-half year period. |
The Select Fund
| | | | | | | | | |
| | | Beginning
Account Value
May 1, 2009 | | Ending
Account Value
October 31, 2009 | | Expenses Paid
During Period*
May 1, 2009 -
October 31, 2009 |
Actual | | $ | 1,000.00 | | $ | 1,276.50 | | $ | 7.34 |
Hypothetical (5% return before expenses) | | | 1,000.00 | | | 1,018.75 | | | 6.51 |
| * | Expense are equal to the Fund’s annualized expense ratio of 1.28%, multiplied by the average account value over the period, multiplied by 184/365 to reflect the one-half year period. |
The Tocqueville Fund
Financial Highlights
| | | | | | | | | | | | | | | | | | | | |
Per share operating performance
(For a share outstanding throughout the period) | | Years Ended October 31, | |
| | 2009 | | | 2008 | | | 2007 | | | 2006 | | | 2005 | |
Net asset value, beginning of period | | $ | 16.39 | | | $ | 28.93 | | | $ | 24.25 | | | $ | 22.17 | | | $ | 20.43 | |
| | | | | | | | | | | | | | | | | | | | |
Operations: | | | | | | | | | | | | | | | | | | | | |
Net investment income | | | 0.28 | | | | 0.24 | | | | 0.18 | | | | 0.14 | | | | 0.15 | |
Net realized and unrealized gain (loss) | | | 2.09 | | | | (10.56 | ) | | | 4.53 | | | | 4.33 | | | | 2.53 | |
| | | | | | | | | | | | | | | | | | | | |
Total from investment operations (1) | | | 2.37 | | | | (10.32 | ) | | | 4.71 | | | | 4.47 | | | | 2.68 | |
| | | | | | | | | | | | | | | | | | | | |
Dividends and distributions to shareholders: | | | | | | | | | | | | | | | | | | | | |
Dividends from net investment income | | | (0.29 | ) | | | (0.19 | ) | | | (0.03 | ) | | | (0.22 | ) | | | (0.12 | ) |
Distributions from net realized gains | | | — | | | | (2.03 | ) | | | — | | | | (2.17 | ) | | | (0.82 | ) |
| | | | | | | | | | | | | | | | | | | | |
Total dividends and distributions | | | (0.29 | ) | | | (2.22 | ) | | | (0.03 | ) | | | (2.39 | ) | | | (0.94 | ) |
| | | | | | | | | | | | | | | | | | | | |
Change in net asset value for the period | | | 2.08 | | | | (12.54 | ) | | | 4.68 | | | | 2.08 | | | | 1.74 | |
| | | | | | | | | | | | | | | | | | | | |
Net asset value, end of period | | $ | 18.47 | | | $ | 16.39 | | | $ | 28.93 | | | $ | 24.25 | | | $ | 22.17 | |
| | | | | | | | | | | | | | | | | | | | |
Total return | | | 14.8 | % | | | (38.5 | )% | | | 19.4 | % | | | 20.5 | % | | | 13.4 | % |
Ratios/supplemental data | | | | | | | | | | | | | | | | | | | | |
Net assets, end of period (000) | | $ | 383,470 | | | $ | 328,609 | | | $ | 523,878 | | | $ | 392,495 | | | $ | 175,791 | |
Ratio to average net assets: | | | | | | | | | | | | | | | | | | | | |
Expenses | | | 1.25 | %(2) | | | 1.25 | %(2) | | | 1.25 | %(2) | | | 1.30 | % | | | 1.34 | % |
Net investment income | | | 1.68 | %(2) | | | 0.94 | %(2) | | | 0.69 | %(2) | | | 0.68 | % | | | 0.68 | % |
Portfolio turnover rate | | | 32 | % | | | 51 | % | | | 39 | % | | | 32 | % | | | 45 | % |
| (1) | Total from investment operations per share includes redemption fees of $0.004, $0.009, $0.002, $0.002 and $0.003 per share for the five years ended October 31, 2009, 2008, 2007, 2006 and 2005, respectively. |
| (2) | Net of fees waived amounting to 0.08%, 0.04% and 0.01% of average net assets for the three years ended October 31, 2009, 2008 and 2007, respectively. |
The accompanying notes are an integral part of these financial statements.
The Tocqueville Small Cap Fund
Financial Highlights
| | | | | | | | | | | | | | | | | | | | |
Per share operating performance
(For a share outstanding throughout the period) | | Years Ended October 31, | |
| | 2009 | | | 2008 | | | 2007 | | | 2006 | | | 2005 | |
Net asset value, beginning of period | | $ | 9.77 | | | $ | 17.24 | | | $ | 18.04 | | | $ | 16.58 | | | $ | 16.11 | |
| | | | | | | | | | | | | | | | | | | | |
Operations: | | | | | | | | | | | | | | | | | | | | |
Net investment income (loss) | | | (0.11 | ) | | | 0.02 | | | | 0.11 | | | | (0.07 | ) | | | (0.13 | ) |
Net realized and unrealized gain (loss) | | | 1.23 | | | | (5.67 | ) | | | 1.26 | | | | 1.53 | | | | 1.26 | |
| | | | | | | | | | | | | | | | | | | | |
Total from investment operations (1) | | | 1.12 | | | | (5.65 | ) | | | 1.37 | | | | 1.46 | | | | 1.13 | |
| | | | | | | | | | | | | | | | | | | | |
Distributions to shareholders: | | | | | | | | | | | | | | | | | | | | |
Dividends from net investment income | | | (0.01 | ) | | | (0.12 | ) | | | — | | | | — | | | | — | |
Distributions from net realized gains | | | (0.10 | ) | | | (1.70 | ) | | | (2.17 | ) | | | — | | | | (0.66 | ) |
| | | | | | | | | | | | | | | | | | | | |
Total distributions | | | (0.11 | ) | | | (1.82 | ) | | | (2.17 | ) | | | — | | | | (0.66 | ) |
| | | | | | | | | | | | | | | | | | | | |
Change in net asset value for the period | | | 1.01 | | | | (7.47 | ) | | | (0.80 | ) | | | 1.46 | | | | 0.47 | |
| | | | | | | | | | | | | | | | | | | | |
Net asset value, end of period | | $ | 10.78 | | | $ | 9.77 | | | $ | 17.24 | | | $ | 18.04 | | | $ | 16.58 | |
| | | | | | | | | | | | | | | | | | | | |
Total return | | | 11.7 | % | | | (36.2 | )% | | | 8.4 | % | | | 8.8 | % | | | 6.8 | % |
Ratios/supplemental data | | | | | | | | | | | | | | | | | | | | |
Net assets, end of period (000) | | $ | 30,498 | | | $ | 36,429 | | | $ | 49,543 | | | $ | 52,701 | | | $ | 57,576 | |
Ratio to average net assets: | | | | | | | | | | | | | | | | | | | | |
Expenses | | | 1.41 | % | | | 1.35 | % | | | 1.32 | % | | | 1.34 | % | | | 1.39 | % |
Net investment income (loss) | | | (0.97 | )% | | | 0.12 | % | | | 0.63 | % | | | (0.38 | )% | | | (0.67 | )% |
Portfolio turnover rate | | | 62 | % | | | 169 | % | | | 90 | % | | | 45 | % | | | 30 | % |
| (1) | Total from investment operations per share includes redemption fees of $0.001, $0.005, $0.001, $0.015 and $0.006 per share for the five years ended October 31, 2009, 2008, 2007, 2006 and 2005 respectively. |
The accompanying notes are an integral part of these financial statements.
The Tocqueville International Value Fund
Financial Highlights
| | | | | | | | | | | | | | | | | | | | |
Per share operating performance
(For a share outstanding throughout the period) | | Years Ended October 31, | |
| | 2009 | | | 2008 | | | 2007 | | | 2006 | | | 2005 | |
Net asset value, beginning of period | | $ | 8.49 | | | $ | 16.48 | | | $ | 16.72 | | | $ | 16.06 | | | $ | 13.10 | |
| | | | | | | | | | | | | | | | | | | | |
Operations: | | | | | | | | | | | | | | | | | | | | |
Net investment income | | | 0.10 | | | | 0.13 | | | | 0.08 | | | | 0.27 | | | | 0.04 | |
Net realized and unrealized gain (loss) | | | 2.59 | | | | (6.09 | ) | | | 2.25 | | | | 2.30 | | | | 3.00 | |
| | | | | | | | | | | | | | | | | | | | |
Total from investment operations (1) | | | 2.69 | | | | (5.96 | ) | | | 2.33 | | | | 2.57 | | | | 3.04 | |
| | | | | | | | | | | | | | | | | | | | |
Dividends and distributions to shareholders: | | | | | | | | | | | | | | | | | | | | |
Dividends from net investment income | | | (0.20 | ) | | | (0.10 | ) | | | (0.27 | ) | | | (0.05 | ) | | | (0.08 | ) |
Distributions from net realized gains | | | (0.50 | ) | | | (1.93 | ) | | | (2.30 | ) | | | (1.86 | ) | | | — | |
| | | | | | | | | | | | | | | | | | | | |
Total dividends and distributions | | | (0.70 | ) | | | (2.03 | ) | | | (2.57 | ) | | | (1.91 | ) | | | (0.08 | ) |
| | | | | | | | | | | | | | | | | | | | |
Change in net asset value for the period | | | 1.99 | | | | (7.99 | ) | | | (0.24 | ) | | | 0.66 | | | | 2.96 | |
| | | | | | | | | | | | | | | | | | | | |
Net asset value, end of period | | $ | 10.48 | | | $ | 8.49 | | | $ | 16.48 | | | $ | 16.72 | | | $ | 16.06 | |
| | | | | | | | | | | | | | | | | | | | |
Total return | | | 34.0 | % | | | (40.8 | )% | | | 15.3 | % | | | 17.4 | % | | | 23.3 | % |
Ratios/supplemental data | | | | | | | | | | | | | | | | | | | | |
Net assets, end of period (000) | | $ | 131,613 | | | $ | 118,189 | | | $ | 219,220 | | | $ | 225,234 | | | $ | 215,711 | |
Ratio to average net assets: | | | | | | | | | | | | | | | | | | | | |
Expenses | | | 1.62 | % | | | 1.56 | % | | | 1.59 | % | | | 1.61 | % | | | 1.66 | % |
Net investment income | | | 0.96 | % | | | 1.07 | % | | | 0.49 | % | | | 1.49 | % | | | 0.29 | % |
Portfolio turnover rate | | | 27 | % | | | 63 | % | | | 49 | % | | | 39 | % | | | 35 | % |
| (1) | Total from investment operations per share includes redemption fees of $0.001, $0.001, $0.002, $0.011 and $0.003 per share for the five years ended October 31, 2009, 2008, 2007, 2006 and 2005, respectively. |
The accompanying notes are an integral part of these financial statements.
The Tocqueville Gold Fund
Financial Highlights
| | | | | | | | | | | | | | | | | | | | |
Per share operating performance
(For a share outstanding throughout the period) | | Years Ended October 31, | |
| | 2009 | | | 2008 | | | 2007 | | | 2006 | | | 2005 | |
Net asset value, beginning of period | | $ | 21.77 | | | $ | 64.36 | | | $ | 51.41 | | | $ | 35.51 | | | $ | 34.84 | |
| | | | | | | | | | | | | | | | | | | | |
Operations: | | | | | | | | | | | | | | | | | | | | |
Net investment loss | | | (0.45 | ) | | | (0.57 | ) | | | (0.30 | ) | | | (0.22 | ) | | | (0.33 | ) |
Net realized and unrealized gain (loss) | | | 29.28 | | | | (33.24 | ) | | | 18.52 | | | | 18.21 | | | | 2.36 | |
| | | | | | | | | | | | | | | | | | | | |
Total from investment operations (1) | | | 28.83 | | | | (33.81 | ) | | | 18.22 | | | | 17.99 | | | | 2.03 | |
| | | | | | | | | | | | | | | | | | | | |
Dividends and distributions to shareholders: | | | | | | | | | | | | | | | | | | | | |
Dividends from net investment income | | | — | | | | (0.46 | ) | | | (0.22 | ) | | | — | | | | — | |
Dividends from net realized gains | | | (0.89 | ) | | | (8.32 | ) | | | (5.05 | ) | | | (2.09 | ) | | | (1.36 | ) |
| | | | | | | | | | | | | | | | | | | | |
Total distributions | | | (0.89 | ) | | | (8.78 | ) | | | (5.27 | ) | | | (2.09 | ) | | | (1.36 | ) |
| | | | | | | | | | | | | | | | | | | | |
Change in net asset value for the period | | | 27.94 | | | | (42.59 | ) | | | 12.95 | | | | 15.90 | | | | 0.67 | |
| | | | | | | | | | | | | | | | | | | | |
Net asset value, end of period | | $ | 49.71 | | | $ | 21.77 | | | $ | 64.36 | | | $ | 51.41 | | | $ | 35.51 | |
| | | | | | | | | | | | | | | | | | | | |
Total return | | | 135.2 | % | | | (60.0 | )% | | | 38.4 | % | | | 52.5 | % | | | 6.2 | % |
Ratios/supplemental data | | | | | | | | | | | | | | | | | | | | |
Net assets, end of period (000) | | $ | 937,492 | | | $ | 410,857 | | | $ | 1,231,475 | | | $ | 833,254 | | | $ | 538,492 | |
Ratios to average net assets: | | | | | | | | | | | | | | | | | | | | |
Expenses | | | 1.50 | % | | | 1.43 | % | | | 1.42 | % | | | 1.50 | % | | | 1.59 | % |
Net investment loss | | | (1.25 | )% | | | (1.07 | )% | | | (0.81 | )% | | | (0.51 | )% | | | (0.97 | )% |
Portfolio turnover rate | | | 9 | % | | | 28 | % | | | 26 | % | | | 30 | % | | | 27 | % |
| (1) | Total from investment operations per share includes redemption fees of $0.025, $0.027, $0.028, $0.06 and $0.02 per share for the five years ended October 31, 2009, 2008, 2007, 2006 and 2005, respectively. |
The accompanying notes are an integral part of these financial statements.
The Delafield Fund
Financial Highlights
| | | | | | | | | | | | | | | | | | | | | | | | |
Per share operating performance
(For a share outstanding throughout the period) | | January 1,
2009
through
October 31,
2009 | | | Years Ended December 31, | |
| | | 2008 | | | 2007 | | | 2006 | | | 2005 | | | 2004 | |
Net asset value, beginning of period | | $ | 15.10 | | | $ | 24.33 | | | $ | 25.64 | | | $ | 23.63 | | | $ | 25.21 | | | $ | 23.17 | |
| | | | | | | | | | | | | | | | | | | | | | | | |
Operations: | | | | | | | | | | | | | | | | | | | | | | | | |
Net investment income (loss) | | | 0.03 | | | | 0.07 | | | | 0.17 | | | | 0.19 | | | | 0.03 | | | | (0.02 | ) |
Net realized and unrealized gain (loss) | | | 6.25 | | | | (9.23 | ) | | | 1.10 | | | | 4.64 | | | | 1.49 | | | | 4.84 | |
| | | | | | | | | | | | | | | | | | | | | | | | |
Total from investment operations (1) | | | 6.28 | | | | (9.16 | ) | | | 1.27 | | | | 4.83 | | | | 1.52 | | | | 4.82 | |
| | | | | | | | | | | | | | | | | | | | | | | | |
Dividends and distributions to shareholders: | | | | | | | | | | | | | | | | | | | | | | | | |
Dividends from net investment income | | | (0.03 | ) | | | (0.07 | ) | | | (0.16 | ) | | | (0.19 | ) | | | (0.03 | ) | | | — | |
Dividends from net realized gains | | | — | | | | (0.0 | )(2) | | | (2.42 | ) | | | (2.63 | ) | | | (3.07 | ) | | | (2.78 | ) |
| | | | | | | | | | | | | | | | | | | | | | | | |
Total distributions | | | (0.03 | ) | | | (0.07 | ) | | | (2.58 | ) | | | (2.82 | ) | | | (3.10 | ) | | | (2.78 | ) |
| | | | | | | | | | | | | | | | | | | | | | | | |
Change in net asset value for the period | | | 6.25 | | | | (9.23 | ) | | | (1.31 | ) | | | 2.01 | | | | (1.58 | ) | | | 2.06 | |
| | | | | | | | | | | | | | | | | | | | | | | | |
Net asset value, end of period | | $ | 21.35 | | | $ | 15.10 | | | $ | 24.33 | | | $ | 25.64 | | | $ | 23.63 | | | $ | 25.21 | |
| | | | | | | | | | | | | | | | | | | | | | | | |
Total return | | | 41.6 | %(3) | | | (37.6 | )% | | | 4.9 | % | | | 20.4 | % | | | 6.0 | % | | | 20.9 | % |
Ratios/supplemental data | | | | | | | | | | | | | | | | | | | | | | | | |
Net assets, end of period (000) | | $ | 636,548 | | | $ | 404,860 | | | $ | 656,999 | | | $ | 532,108 | | | $ | 372,467 | | | $ | 344,605 | |
Ratios to average net assets: | | | | | | | | | | | | | | | | | | | | | | | | |
Expenses | | | 1.38 | %(4) | | | 1.34 | %(5) | | | 1.28 | %(5) | | | 1.32 | %(5) | | | 1.33 | %(5) | | | 1.32 | %(5) |
Net investment income | | | 0.21 | %(4) | | | 0.35 | %(5) | | | 0.57 | %(5) | | | 0.82 | %(5) | | | 0.11 | %(5) | | | (0.10 | )%(5) |
Portfolio turnover rate | | | 46 | %(3) | | | 81 | % | | | 61 | % | | | 72 | % | | | 71 | % | | | 55 | % |
| (1) | Total from investment operations per share includes redemption fees of $0.008 per share for the period ended October 31, 2009, $0.01 per share for the fiscal year ended December 31, 2007 and less than $0.01 per share for the fiscal years ended December 31, 2008, 2006 and 2005. |
| (2) | Represents less than $0.01. |
| (5) | Net of fees waived amounting to 0.06%, 0.05%, 0.08%, 0.11% and 0.14% for the fiscal years ended December 31, 2008, 2007, 2006, 2005 and 2004 respectively. |
The accompanying notes are an integral part of these financial statements.
The Select Fund
Financial Highlights
| | | | | | | | |
Per share operating performance
(For a share outstanding throughout the period) | | January 1,
2009
through
October 31,
2009 | | | Period from
September 29,
2008 (1)
through
December 31,
2008 | |
Net asset value, beginning of period | | $ | 5.77 | | | $ | 8.74 | |
| | | | | | | | |
Operations: | | | | | | | | |
Net investment income (loss) | | | (0.00 | )(2) | | | 0.01 | |
Net realized and unrealized gain (loss) | | | 2.70 | | | | (2.97 | ) |
| | | | | | | | |
Total from investment operations | | | 2.70 | | | | (2.96 | ) |
| | | | | | | | |
Dividends and distributions to shareholders: | | | | | | | | |
Dividends from net investment income | | | (0.01 | ) | | | (0.01 | ) |
Dividends from net realized gains | | | — | | | | — | |
| | | | | | | | |
Total distributions | | | (0.01 | ) | | | (0.01 | ) |
| | | | | | | | |
Change in net asset value for the period | | | 2.69 | | | | (2.97 | ) |
| | | | | | | | |
Net asset value, end of period | | $ | 8.46 | | | $ | 5.77 | |
| | | | | | | | |
Total return | | | 46.7 | %(3) | | | (33.9 | )%(3) |
Ratios/supplemental data | | | | | | | | |
Net assets, end of period (000) | | $ | 24,681 | | | $ | 9,226 | |
Ratios to average net assets: | | | | | | | | |
Expenses | | | 1.26 | %(4)(5) | | | 1.15 | %(4)(5) |
Net investment income (loss) | | | (0.16 | )%(4)(5) | | | 0.29 | %(4)(5) |
Portfolio turnover rate | | | 24 | %(3) | | | 29 | %(3) |
| (2) | Represents less than $0.01 per share. |
| (5) | Net of fees waived amounting to 0.77% and 2.32% for the periods ended October 31, 2009 and December 31, 2008, respectively. |
The accompanying notes are an integral part of these financial statements.
The Tocqueville Fund
Schedule of Investments as of October 31, 2009
| | | | | |
| Common Stocks—95.5% | | Shares | | Value |
Beverage and Tobacco Product Manufacturing—2.1% | | | | | |
The Coca-Cola Co. | | 150,000 | | $ | 7,996,500 |
Building Material and Garden Equipment and Supplies Dealers—1.3% | | | | | |
Home Depot, Inc. | | 200,000 | | | 5,018,000 |
Chemical Manufacturing—12.0% | | | | | |
Bristol-Myers Squibb Co. | | 300,000 | | | 6,540,000 |
Colgate-Palmolive Co. | | 100,000 | | | 7,863,000 |
EI du Pont de Nemours & Co. | | 300,000 | | | 9,546,000 |
Isis Pharmaceuticals, Inc.(a) | | 250,000 | | | 3,167,500 |
Johnson & Johnson | | 150,000 | | | 8,857,500 |
Pfizer, Inc. | | 600,000 | | | 10,218,000 |
| | | | | | 46,192,000 |
Computer and Electronic Product Manufacturing—8.7% | | | | | |
Cisco Systems, Inc.(a) | | 500,000 | | | 11,425,000 |
Emcore Corp.(a)(c) | | 225,000 | | | 229,500 |
Intel Corp. | | 500,000 | | | 9,555,000 |
Nokia OYJ—ADR | | 300,000 | | | 3,783,000 |
St. Jude Medical, Inc.(a) | | 125,000 | | | 4,260,000 |
Tyco International Ltd.(b) | | 125,000 | | | 4,193,750 |
| | | | | | 33,446,250 |
Couriers and Messengers—1.8% | | | | | |
United Parcel Service, Inc. | | 125,000 | | | 6,710,000 |
Credit Intermediation and Related Activities—3.1% | | | |
The Bank of New York Mellon Corp. | | 150,000 | | | 3,999,000 |
East West Bancorp, Inc. | | 300,000 | | | 2,709,000 |
Mitsubishi UFJ Financial Group, Inc.—ADR | | 1,000,000 | | | 5,310,000 |
| | | | | | 12,018,000 |
Data Processing, Hosting and Related Services—2.4% | | | | | |
Automatic Data Processing, Inc. | | 150,000 | | | 5,970,000 |
IMS Health, Inc. | | 200,000 | | | 3,278,000 |
| | | | | | 9,248,000 |
Electrical Equipment, Appliance, and Component Manufacturing—1.9% | | | |
Corning, Inc. | | 500,000 | | | 7,305,000 |
Food Manufacturing—5.0% | | | | | |
Campbell Soup Co. | | 225,000 | | | 7,143,750 |
Kraft Foods, Inc. | | 300,000 | | | 8,256,000 |
Unilever NV—ADR | | 100,000 | | | 3,089,000 |
Zhongpin, Inc.(a)(b) | | 50,000 | | | 665,500 |
| | | | | | 19,154,250 |
| | | | | |
| Common Stocks (continued) | | Shares | | Value |
Food Services and Drinking Places—0.6% | | | |
Yum! Brands, Inc. | | 75,000 | | $ | 2,471,250 |
Forestry and Logging—0.9% | | | | | |
Weyerhaeuser Co. | | 100,000 | | | 3,634,000 |
Furniture and Related Product Manufacturing—2.4% | | | | | |
Masco Corp. | | 300,000 | | | 3,525,000 |
Steelcase, Inc. | | 1,000,000 | | | 5,770,000 |
| | | | | | 9,295,000 |
Insurance Carriers and Related Activities—1.9% | | | | | |
Aflac, Inc. | | 75,000 | | | 3,111,750 |
Fidelity National Financial, Inc. | | 300,000 | | | 4,071,000 |
| | | | | | 7,182,750 |
Machinery Manufacturing—6.8% | | | | | |
Applied Materials, Inc. | | 500,000 | | | 6,100,000 |
Canon, Inc.—ADR | | 60,000 | | | 2,259,600 |
General Electric Co. | | 600,000 | | | 8,556,000 |
Illinois Tool Works, Inc. | | 150,000 | | | 6,888,000 |
Smith International, Inc. | | 75,000 | | | 2,079,750 |
| | | | | | 25,883,350 |
Management of Companies and Enterprises—1.4% | | | | | |
American Express Co. | | 150,000 | | | 5,226,000 |
Mining (except Oil and Gas)—6.5% | | | |
BHP Billiton Ltd.—ADR | | 75,000 | | | 4,918,500 |
Cliffs Natural Resources, Inc. | | 200,000 | | | 7,114,000 |
Newmont Mining Corp. | | 300,000 | | | 13,038,000 |
| | | | | | 25,070,500 |
Miscellaneous Manufacturing—4.8% | | | |
3M Co. | | 100,000 | | | 7,357,000 |
Ceradyne, Inc.(a) | | 150,000 | | | 2,418,000 |
Rockwell Automation, Inc. | | 100,000 | | | 4,095,000 |
W.R. Grace & Co.(a) | | 200,000 | | | 4,378,000 |
| | | | | | 18,248,000 |
Nonstore Retailers—0.7% | | | | | |
eBay, Inc.(a) | | 125,000 | | | 2,783,750 |
Oil and Gas Extraction—2.2% | | | | | |
Anadarko Petroleum Corp. | | 75,000 | | | 4,569,750 |
Chesapeake Energy Corp. | | 150,000 | | | 3,675,000 |
| | | | | | 8,244,750 |
Other Information Services—2.1% | | | |
Google, Inc.(a) | | 15,000 | | | 8,041,800 |
Paper Manufacturing—3.8% | | | | | |
Kimberly-Clark Corp. | | 150,000 | | | 9,174,000 |
Sonoco Products Co. | | 200,000 | | | 5,350,000 |
| | | | | | 14,524,000 |
The accompanying notes are an integral part of these financial statements.
The Tocqueville Fund
Schedule of Investments as of October 31, 2009
| | | | | |
| Common Stocks (continued) | | Shares | | Value |
Petroleum and Coal Products Manufacturing—3.2% | | | | | |
Murphy Oil Corp. | | 200,000 | | $ | 12,228,000 |
Primary Metal Manufacturing—0.8% | | | |
Alcoa, Inc. | | 250,000 | | | 3,105,000 |
Publishing Industries (except Internet)—5.8% | | | |
Adobe Systems, Inc.(a) | | 150,000 | | | 4,941,000 |
Bio-key International, Inc.(a)(d)(e)(f) | | 47,090 | | | — |
Microsoft Corp. | | 500,000 | | | 13,865,000 |
Symantec Corp.(a) | | 200,000 | | | 3,516,000 |
| | | | | | 22,322,000 |
Securities, Commodity Contracts, and Other Financial Investments and Related Activities—1.0% | | | |
Lazard Ltd.(b) | | 100,000 | | | 3,775,000 |
Support Activities for Mining—2.4% | | | |
Schlumberger Ltd.(b) | | 150,000 | | | 9,330,000 |
Telecommunications—2.8% | | | | | |
Alaska Communications Systems Group, Inc.(c) | | 600,000 | | | 4,668,000 |
Verizon Communications, Inc. | | 200,000 | | | 5,918,000 |
| | | | | | 10,586,000 |
Transportation Equipment Manufacturing—3.7% | | | |
Autoliv, Inc.(b) | | 100,000 | | | 3,358,000 |
The Boeing Co. | | 100,000 | | | 4,780,000 |
Toyota Motor Corp.—ADR | | 75,000 | | | 5,916,750 |
| | | | | | 14,054,750 |
Utilities—3.4% | | | | | |
FPL Group, Inc. | | 225,000 | | | 11,047,500 |
PNM Resources, Inc. | | 200,000 | | | 2,144,000 |
| | | | | | 13,191,500 |
Total Common Stocks
(Cost $386,766,031) | | | | | 366,285,400 |
Warrants—0.0% | | | | | |
Emcore Corp. $15.06 exercise price, expires 2/19/13(a)(e) | | 39,375 | | | — |
Raytheon Co. $37.50 exercise price, expires 06/16/11(a) | | 1,581 | | | 14,909 |
Total Warrants
(Cost $0) | | | | | 14,909 |
| | | | | | |
| Corporate Bonds—1.4% | | Principal
Amount | | Value |
Forestry and Logging—0.8% | | | | | | |
Weyerhaeuser Co.
6.750%, 03/15/2012 | | $ | 3,000,000 | | $ | 3,145,512 |
Oil and Gas Extraction—0.6% | | | | | | |
Chesapeake Energy Corp.
9.500%, 02/15/2015 | | | 2,000,000 | | | 2,175,000 |
Total Corporate Bonds
(Cost $4,674,798) | | | | | | 5,320,512 |
Short-Term Investments—2.9% | | | |
Repurchase Agreement—2.9% | | | | | | |
Repurchase Agreement with U.S. Bank, N.A., 0.01% dated 10/30/09, due 11/2/2009, collateralized by: Freddie Mac Giant 15 Year Fixed (Pool #E01424) valued at $11,281,393. Repurchase proceeds of $11,060,009. (Cost $11,060,000) | | | 11,060,000 | | | 11,060,000 |
Total Short-Term Investments
(Cost $11,060,000) | | | | | | 11,060,000 |
Total Investments
(Cost $402,500,829)—99.8% | | | 382,680,821 |
Other Assets in Excess of Liabilities—0.2% | | | 788,909 |
Total Net Assets—100.0% | | $ | 383,469,730 |
| | | | | | |
Percentages are stated as a percent of net assets.
ADR American Depository Receipt
| (a) | Non-income producing security. |
| (b) | Foreign issued security. Foreign concentration was as follows: Australia 1.3%; Bermuda 1.0%; China 0.2%; Finland 1.0%; Japan 3.5%; Netherlands Antilles 2.4%; Netherlands 0.8%; Sweden 0.9%; Switzerland 1.1% |
| (c) | Affiliated company. See Footnote 9. |
| (d) | Denotes a security is either fully or partially restricted to resale. The aggregate value of restricted securities at October 31, 2009 was $0 which represented 0.0% of net assets. |
| (e) | Fair valued security. The aggregate value of fair valued securities as of October 31, 2009 was $0 which represented 0.0% of net assets. |
| (f) | Security is considered illiquid and may be difficult to sell. |
The accompanying notes are an integral part of these financial statements.
The Tocqueville Small Cap Fund
Schedule of Investments as of October 31, 2009
| | | | | |
| Common Stocks—96.4% | | Shares | | Value |
Administrative and Support Services—3.5% |
Websense, Inc.(a) | | 66,000 | | $ | 1,059,960 |
Amusement, Gambling, and Recreation Industries—1.0% | | | |
Global Payments, Inc. | | 6,300 | | | 310,149 |
Apparel Manufacturing—4.5% | | | | | |
Bebe Stores, Inc. | | 80,300 | | | 502,678 |
Columbia Sportswear Co. | | 22,900 | | | 871,345 |
| | | | | | 1,374,023 |
Chemical Manufacturing—15.9% | | | | | |
Alkermes, Inc.(a) | | 93,100 | | | 742,007 |
CARBO Ceramics, Inc. | | 12,200 | | | 712,358 |
Inspire Pharmaceuticals, Inc.(a) | | 60,500 | | | 270,435 |
King Pharmaceuticals, Inc.(a) | | 36,700 | | | 371,771 |
Landec Corp.(a)(b) | | 44,700 | | | 292,338 |
Perrigo Co. | | 8,800 | | | 327,272 |
Salix Pharmaceuticals Ltd.(b) | | 15,900 | | | 292,401 |
Tetra Technologies, Inc.(a) | | 83,100 | | | 786,126 |
WD-40 Co. | | 33,800 | | | 1,064,362 |
| | | | | | 4,859,070 |
Computer and Electronic Product Manufacturing—14.6% | | | |
Analogic Corp. | | 19,300 | | | 720,662 |
Brush Engineered Materials, Inc.(a) | | 33,800 | | | 623,610 |
FEI Co.(a) | | 25,700 | | | 611,917 |
Silicon Image, Inc.(a) | | 255,500 | | | 539,105 |
Thoratec Corp.(a) | | 28,600 | | | 751,036 |
Ultratech, Inc.(a)(b) | | 94,500 | | | 1,220,940 |
| | | | | | 4,467,270 |
Data Processing, Hosting and Related Services—2.9% | | | |
IMS Health, Inc. | | 54,500 | | | 893,255 |
Electrical Equipment, Appliance, and Component Manufacturing—2.5% | | | |
Greatbatch, Inc.(a) | | 38,100 | | | 749,427 |
Food Manufacturing—3.4% | | | | | |
The Hain Celestial Group, Inc.(a) | | 58,600 | | | 1,027,844 |
General Merchandise Stores—2.5% |
Tractor Supply Co.(a) | | 17,000 | | | 759,900 |
Heavy and Civil Engineering Construction—1.1% |
The St. Joe Co.(a) | | 14,200 | | | 339,948 |
Miscellaneous Manufacturing—3.8% |
Ceradyne, Inc.(a) | | 16,700 | | | 269,204 |
Wright Medical Group, Inc.(a) | | 54,500 | | | 885,625 |
| | | | | | 1,154,829 |
| | | | | |
| Common Stocks (continued) | | Shares | | Value |
Miscellaneous Store Retailers—1.3% |
1-800-Flowers.com, Inc.(a)(b) | | 102,500 | | $ | 393,600 |
Motion Picture and Sound Recording Industries—2.0% | | | |
Dreamworks Animation SKG, Inc.(a) | | 18,962 | | | 606,784 |
Oil and Gas Extraction—7.3% |
Bill Barrett Corp.(a) | | 20,100 | | | 622,698 |
Minerals Technologies, Inc. | | 13,600 | | | 669,936 |
Unit Corp.(a) | | 23,800 | | | 930,104 |
| | | | | | 2,222,738 |
Professional, Scientific, and Technical Services—12.2% | | | |
Allscripts- Misys Healthcare Solutions, Inc.(a) | | 55,300 | | | 1,078,350 |
Fair Isaac Corp. | | 45,200 | | | 918,916 |
Pharmaceutical Product Development, Inc. | | 28,500 | | | 614,175 |
TeleTech Holdings, Inc.(a) | | 26,400 | | | 472,296 |
Valueclick, Inc.(a) | | 65,000 | | | 639,600 |
| | | | | | 3,723,337 |
Publishing Industries (except Internet)—8.8% |
Aspen Technology, Inc.(a) | | 67,500 | | | 708,750 |
Parametric Technology Corp.(a) | | 44,700 | | | 666,477 |
TeleCommunication Systems, Inc.(a) | | 40,300 | | | 360,282 |
TIBCO Software, Inc.(a) | | 109,700 | | | 959,875 |
| | | | | | 2,695,384 |
Support Activities for Mining—3.5% |
Global Industries Ltd.(a) | | 65,000 | | | 473,850 |
Oceaneering International, Inc.(a) | | 11,400 | | | 582,540 |
| | | | | | 1,056,390 |
Truck Transportation—1.0% | | | | | |
Arkansas Best Corp. | | 12,200 | | | 315,004 |
Waste Management and Remediation Services—4.6% | | | |
Clean Harbors, Inc.(a) | | 5,400 | | | 304,830 |
EnergySolutions, Inc. | | 131,800 | | | 1,099,212 |
| | | | | | 1,404,042 |
Total Common Stocks
(Cost $29,837,802) | | | | | 29,412,954 |
The accompanying notes are an integral part of these financial statements.
The Tocqueville Small Cap Fund
Schedule of Investments as of October 31, 2009
| | | | | | |
| Short-Term Investments—1.2% | | Principal
Amount | | Value |
Repurchase Agreement—1.2% | | | | | | |
Repurchase Agreement with U.S. Bank, N.A., 0.01% dated 10/30/09, due 11/2/2009, collateralized by: Freddie Mac Giant 15 Year Fixed (Pool #G11440) valued at $351,146. Repurchase proceeds of $344,000. (Cost $344,000) | | $ | 344,000 | | $ | 344,000 |
Total Short-Term investments
(Cost $344,000) | | | | | | 344,000 |
Total Investments
(Cost $30,181,802)—97.6% | | | 29,756,954 |
Other Assets in Excess of Liabilities—2.4% | | | 740,694 |
Total Net Assets—100.0% | | | | | $ | 30,497,648 |
| | | | | | |
Percentages are stated as a percent of net assets.
| (a) | Non-income producing security. |
| (b) | Affiliated company. See Footnote 9. |
The accompanying notes are an integral part of these financial statements.
The Tocqueville International Value Fund
Schedule of Investments as of October 31, 2009
| | | | | |
| Common Stocks—89.9% | | Shares | | Value |
Australia—1.5% | | | | | |
BHP Billiton Ltd.—ADR | | 30,000 | | $ | 1,967,400 |
Belgium—3.6% | | | | | |
Bekaert SA | | 15,000 | | | 1,929,121 |
Sofina SA | | 1,250 | | | 116,930 |
Solvay SA | | 12,000 | | | 1,178,366 |
Umicore | | 50,000 | | | 1,518,669 |
| | | | | | 4,743,086 |
Brazil—4.2% | | | | | |
Petroleo Brasileiro SA—ADR | | 60,000 | | | 2,773,200 |
Vale SA—ADR | | 110,000 | | | 2,803,900 |
| | | | | | 5,577,100 |
Finland—1.6% | | | | | |
Nokia OYJ—ADR | | 170,000 | | | 2,143,700 |
France—14.9% |
Bollore | | 3,989 | | | 686,679 |
Cie de Saint-Gobain | | 55,927 | | | 2,725,328 |
JC Decaux SA(a) | | 69,000 | | | 1,395,059 |
M6-Metropole Television | | 120,000 | | | 2,890,444 |
Sanofi-Aventis SA | | 50,000 | | | 3,665,106 |
Total SA—ADR | | 51,200 | | | 3,075,584 |
Veolia Environnement—ADR | | 55,000 | | | 1,794,100 |
Vivendi SA | | 120,000 | | | 3,329,079 |
| | | | | | 19,561,379 |
Germany—3.2% | | | | | |
Siemens AG—ADR | | 22,800 | | | 2,052,456 |
Wacker Neuson SE | | 183,500 | | | 2,216,389 |
| | | | | | 4,268,845 |
Hong Kong—0.9% | | | | | |
Clear Media Ltd.(a) | | 1,192,000 | | | 528,378 |
PYI Corp.(a) | | 14,000,000 | | | 638,933 |
Television Broadcasts Ltd. | | 4,000 | | | 18,904 |
| | | | | | 1,186,215 |
Indonesia—1.5% | | | | | |
Telekomunikasi Indonesia Tbk PT—ADR | | 58,000 | | | 1,966,780 |
Ireland—3.1% |
DCC PLC | | 153,105 | | | 4,014,871 |
Italy—4.8% |
CIR—Compagnie Industriali Riunite SpA(a) | | 1,500,000 | | | 3,375,140 |
Interpump Group SpA(a) | | 386,828 | | | 2,360,729 |
Sogefi SpA(a) | | 273,000 | | | 605,554 |
| | | | | | 6,341,423 |
| | | | | |
| Common Stocks (continued) | | Shares | | Value |
Japan—20.5% | | | | | |
Amada Co., Ltd. | | 170,000 | | $ | 1,040,026 |
Bridgestone Corp. | | 90,000 | | | 1,484,164 |
Canon, Inc.—ADR | | 70,000 | | | 2,636,200 |
Capcom Co., Ltd. | | 60,000 | | | 1,008,466 |
Fanuc Ltd. | | 20,000 | | | 1,661,224 |
Kyoto Kimono Yuzen Co., Ltd. | | 350,500 | | | 3,473,222 |
MISUMI Group, Inc. | | 92,500 | | | 1,578,625 |
Mitsubishi UFJ Financial Group, Inc.—ADR | | 214,100 | | | 1,136,871 |
Nintendo Co., Ltd.—ADR(a) | | 33,000 | | | 1,036,530 |
Nippon Express Co., Ltd. | | 500,500 | | | 2,049,376 |
Omron Corp. | | 162,000 | | | 2,727,885 |
SMC Corp. | | 24,000 | | | 2,740,910 |
Takata Corp. | | 80,000 | | | 1,492,654 |
Toyota Motor Corp.—ADR | | 37,000 | | | 2,918,930 |
| | | | | | 26,985,083 |
Mexico—2.3% | | | | | |
Fomento Economico Mexicano S.A.B. de C.V.—ADR | | 70,000 | | | 3,031,700 |
Netherlands—4.6% |
Nutreco Holding NV | | 30,194 | | | 1,524,079 |
Unilever NV—ADR | | 147,500 | | | 4,556,275 |
| | | | | | 6,080,354 |
Singapore—1.1% | | | | | |
GP Industries Ltd. | | 6,389,241 | | | 1,481,576 |
South Africa—0.2% |
Gold Fields Ltd.—ADR | | 25,000 | | | 318,750 |
Spain—1.6% |
Sol Melia SA | | 245,000 | | | 2,171,206 |
Switzerland—5.2% |
Kudelski SA | | 150,000 | | | 3,060,612 |
Nestle SA | | 80,000 | | | 3,720,126 |
| | | | | | 6,780,738 |
Thailand—1.2% | | | | | |
BEC World PCL | | 2,365,100 | | | 1,574,257 |
United Kingdom—8.1% |
Bodycote PLC | | 1 | | | 2 |
BP PLC—ADR | | 40,000 | | | 2,264,800 |
Cadbury PLC—ADR | | 36,800 | | | 1,863,552 |
Cadbury PLC | | 707 | | | 8,938 |
Experian PLC | | 354,413 | | | 3,238,747 |
Invensys PLC | | 687,400 | | | 3,177,383 |
| | | | | | 10,553,422 |
The accompanying notes are an integral part of these financial statements.
The Tocqueville International Value Fund
Schedule of Investments as of October 31, 2009
| | | | | | |
| Common Stocks (continued) | | Shares | | Value |
United States—5.8% |
Freeport-McMoRan Copper & Gold, Inc. | | | 20,000 | | $ | 1,467,200 |
Newmont Mining Corp. | | | 70,000 | | | 3,042,200 |
Schlumberger Ltd. | | | 50,000 | | | 3,110,000 |
| | | | | | | 7,619,400 |
Total Common Stocks
(Cost $116,457,399) | | | | | | 118,367,285 |
| Convertible Bonds—3.5% | |
| Principal
Amount | | | |
Luxembourg—2.9% | | | | | | |
Kloeckner & Co Finance International SA
1.500%, 07/27/2012 | | $ | 3,050,000 | | | 3,877,326 |
United States—0.6% | | | | | | |
NII Holdings, Inc.
3.125%, 06/15/2012 | | | 825,000 | | | 735,281 |
Total Convertible Bonds
(Cost $3,228,845) | | | | | | 4,612,607 |
Short-Term Investments—5.1% | | | | | | |
Repurchase Agreement—5.1% | | | | | | |
Repurchase Agreement with U.S. Bank, N.A., 0.01% dated 10/30/09, due 11/2/2009, collateralized by: Freddie Mac Giant 15 Year Fixed (Pool #E01424) valued at $6,792,312. Repurchase proceeds of $6,659,006.
(Cost $6,659,000) | | | 6,659,000 | | | 6,659,000 |
Total Short-Term Investments (Cost $6,659,000) | | | | | | 6,659,000 |
Total Investments
(Cost $126,345,244)—98.5% | | | 129,638,892 |
Other Assets in Excess of Liabilities—1.5% | | | 1,974,473 |
Total Net Assets—100.0% | | | | | $ | 131,613,365 |
| | | | | | |
Percentages are stated as a percent of net assets.
ADR American Depository Receipt
| (a) | Non-income producing security. |
The accompanying notes are an integral part of these financial statements.
The Tocqueville Gold Fund
Schedule of Investments as of October 31, 2009
| | | | | |
| Common Stocks—85.7% | | Shares | | Value |
Gold & Gold Related—79.8% | | | | | |
Agnico-Eagle Mines Ltd.(a) | | 252,000 | | $ | 13,489,560 |
Alamos Gold, Inc.(a)(b) | | 2,615,100 | | | 20,881,165 |
Allied Nevada Gold Corp.(b) | | 1,129,848 | | | 10,790,048 |
Andean Resources Ltd.(a)(b) | | 15,771,500 | | | 31,516,594 |
AngloGold Ashanti Ltd.—ADR | | 200,000 | | | 7,508,000 |
Aquiline Resources, Inc.(a)(b) | | 1,333,333 | | | 7,233,182 |
Banro Corp.(a)(b) | | 4,631,400 | | | 9,801,678 |
Centamin Egypt Ltd.(a)(b) | | 9,830,000 | | | 19,638,902 |
Cia de Minas Buenaventura SA—ADR | | 853,600 | | | 28,655,352 |
Comaplex Minerals Corp.(a)(b)(c) | | 2,839,000 | | | 16,398,271 |
Detour Gold Corp.(a)(b) | | 280,000 | | | 3,454,554 |
Eldorado Gold Corp.(a)(b) | | 2,026,800 | | | 22,589,722 |
Electrum Ltd.(a)(b)(d)(e)(f) | | 2,095,552 | | | 11,735,091 |
European Goldfields Ltd.(a)(b) | | 4,035,500 | | | 22,749,919 |
Franco-Nevada Corp.(a) | | 1,435,900 | | | 35,696,789 |
Gold Fields Ltd.(a) | | 166,249 | | | 2,139,312 |
Gold Fields Ltd.—ADR | | 1,211,500 | | | 15,446,625 |
Gold Resource Corp.(b)(c) | | 2,300,797 | | | 18,268,328 |
Goldcorp, Inc.—ADR | | 1,168,050 | | | 42,949,199 |
Govi Ex IP Holdings, Inc.(b)(d)(e)(f) | | 1,750,000 | | | 71,225 |
Harmony Gold Mining Co. Ltd.(a) | | 1 | | | 10 |
IAMGOLD Corp.(a) | | 4,216,796 | | | 55,922,575 |
International Tower Hill Mines Ltd.(a)(b)(c) | | 1,993,100 | | | 9,301,932 |
Ivanhoe Australia Ltd.(a)(b) | | 6,464,000 | | | 21,179,516 |
Ivanhoe Mines Ltd.(a)(b) | | 4,467,000 | | | 48,135,687 |
Kinross Gold Corp.(a) | | 239,652 | | | 4,451,740 |
Kinross Gold Corp.—ADR | | 799,700 | | | 14,858,426 |
Minefinders Corp.(a)(b) | | 1,041,000 | | | 9,841,902 |
New Gold, Inc.(a)(b) | | 3,172,500 | | | 11,493,184 |
Newmont Mining Corp. | | 714,800 | | | 31,065,208 |
Orezone Gold Corp.(a)(b)(c) | | 2,145,463 | | | 1,169,838 |
Osisko Mining Corp.(a)(b) | | 6,625,000 | | | 44,695,254 |
Randgold Resources Ltd.—ADR | | 833,200 | | | 55,582,772 |
Red Back Mining, Inc.(a)(b) | | 1,245,000 | | | 16,131,325 |
Romarco Minerals, Inc.(a)(b) | | 15,387,800 | | | 17,065,163 |
Royal Gold, Inc. | | 691,765 | | | 30,555,260 |
SEMAFO, Inc.(a)(b) | | 4,900,000 | | | 14,853,288 |
Sino Gold Mining Ltd.(a)(b) | | 2,808,700 | | | 16,812,810 |
Witwatersrand Consolidated Gold Resources Ltd.(a)(b) | | 335,000 | | | 3,967,670 |
| | | | | | 748,097,076 |
| | | | | |
| Common Stocks (continued) | | Shares | | Value |
Precious Metals & Related—5.9% |
East Asia Minerals Corp.(a)(b) | | 1,681,000 | | $ | 2,951,712 |
GoviEx Uranium, Inc.(a)(b)(d)(e)(f) | | 1,750,000 | | | 3,428,775 |
Ivanhoe Nickel & Platinum Ltd.(a)(b)(d)(e)(f) | | 533,333 | | | 2,933,332 |
PAN American Silver Corp.(a)(b) | | 61,536 | | | 1,301,750 |
PAN American Silver Corp.—ADR(a)(b) | | 500,000 | | | 10,460,000 |
Panoramic Resources Ltd.(a) | | 153,656 | | | 326,419 |
Silver Wheaton Corp.(a)(b) | | 2,714,875 | | | 34,122,545 |
| | | | | | 55,524,533 |
Total Common Stocks
(Cost $509,955,972) | | | 803,621,609 |
| Gold Bullion—10.9% | | Ounces | | | |
Gold Bullion(a) | | 98,032 | | | 102,482,346 |
Total Gold Bullion
(Cost $44,609,241) | | | | | 102,482,346 |
| Warrants—0.3% | | Shares | | | |
Financial Services—0.1% | | | | | |
Endeavour Financial Corp.
Expires: 4/2/14, Excercise Price: $2.50(b) | | 1,000,000 | | | 674,645 |
Gold & Gold Related—0.2% | | | | | |
Kinross Gold Corp.
Expires: 9/13/13, Exercise
Price: CAD $32.00(a)(b) | | 108,032 | | | 385,383 |
Minefinders Corp.
Expires: 12/31/11, Exercise
Price: CAD $5.00(a)(b)(e) | | 125,000 | | | 390,462 |
Osisko Mining Corp.
Expires: 11/17/09, Exercise
Price: CAD $5.45(a)(b) | | 600,000 | | | 1,036,921 |
U.S. Gold Corp.
Expires: 2/22/11, Exercise
Price: $10.00(b) | | 111,500 | | | 26,019 |
Yukon-Nevada Gold Corp.
Expires: 5/30/12, Exercise
Price: CAD $3.00(a)(b)(c)(e) | | 4,175,000 | | | — |
| | | | | | 1,838,785 |
Total Warrants
(Cost $1,314,862) | | | | | 2,513,430 |
The accompanying notes are an integral part of these financial statements.
The Tocqueville Gold Fund
Schedule of Investments as of October 31, 2009
| | | | | | |
| Short-Term Investments—2.6% | | Principal
Amount | | Value |
Repurchase Agreement—2.6% |
Repurchase Agreement with U.S. Bank, N.A., 0.01% dated 10/30/09, due 11/2/2009, collateralized by: Freddie Mac Giant 15 Year Fixed (Pool #E01424) valued at $25,144,373. Repurchase proceeds of $24,651,021. (Cost $24,651,000) | | $ | 24,651,000 | | $ | 24,651,000 |
Total Short-Term Investments (Cost $24,651,000) | | | | | | 24,651,000 |
Total Investments
(Cost $580,531,075)—99.5% | | | 933,268,385 |
Other Assets in Excess of Liabilities—0.5% | | | 4,223,875 |
Total Net Assets—100.0% | | | | | $ | 937,492,260 |
| | | | | | |
Percentages are stated as a percent of net assets.
ADR American Depository Receipt
| (a) | Non-income producing security. |
| (b) | Foreign issued security. Foreign concentration was as follows: Australia 9.5%; Canada 53.0%; France 1.3%; Peru 3.1%; South Africa 3.1%; United Kingdom 5.9% |
| (c) | Affiliated company. See Footnote 9. |
| (d) | Denotes a security is either fully or partially restricted to resale. The aggregate value of restricted securities at October 31, 2009 was $18,168,423, which represented 1.9% of net assets. |
| (e) | Fair valued security. The aggregate value of fair valued securities as of October 31, 2009 was $18,558,886, which represented 1.9% of net assets. |
| (f) | Security is considered illiquid and may be difficult to sell. |
The accompanying notes are an integral part of these financial statements.
The Delafield Fund
Schedule of Investments as of October 31, 2009
| | | | | |
| Common Stocks—72.6% | | Shares | | Value |
Administrative and Support Services—1.8% |
Dun & Bradstreet Corp. | | 150,000 | | $ | 11,484,000 |
Building Material and Garden Equipment and Supplies Dealers—1.6% |
WESCO International, Inc.(a) | | 400,000 | | | 10,224,000 |
Chemical Manufacturing—5.8% |
Cytec Industries, Inc. | | 375,000 | | | 12,438,750 |
Eastman Chemical Co. | | 225,000 | | | 11,814,750 |
Ferro Corp. | | 681,000 | | | 4,174,530 |
Lubrizol Corp. | | 40,000 | | | 2,662,400 |
PolyOne Corp.(a) | | 600,000 | | | 3,348,000 |
Solutia, Inc.(a) | | 225,000 | | | 2,475,000 |
| | | | | | 36,913,430 |
Clothing and Clothing Accessories Stores—2.8% |
Collective Brands, Inc.(a) | | 600,000 | | | 11,130,000 |
Foot Locker, Inc. | | 625,000 | | | 6,550,000 |
| | | | | | 17,680,000 |
Computer and Electronic Product Manufacturing—15.6% | | | |
Checkpoint Systems, Inc.(a) | | 1,000,000 | | | 13,570,000 |
Diebold, Inc. | | 225,000 | | | 6,804,000 |
Fairchild Semiconductor International, Inc.(a) | | 650,000 | | | 4,862,000 |
Flextronics International Ltd.(a)(b) | | 4,600,000 | | | 29,808,000 |
Harris Corp. | | 225,000 | | | 9,387,000 |
Intermec, Inc.(a) | | 375,000 | | | 4,620,000 |
LeCroy Corp.(a) | | 450,000 | | | 1,683,000 |
Teradyne, Inc.(a)(b) | | 800,000 | | | 6,696,000 |
Tyco International Ltd.(b) | | 375,000 | | | 12,581,250 |
Vishay Intertechnology, Inc.(a) | | 1,550,000 | | | 9,656,500 |
| | | | | | 99,667,750 |
Electrical Equipment, Appliance, and Component Manufacturing—3.0% |
AMETEK Inc. | | 190,000 | | | 6,629,100 |
Belden, Inc. | | 200,000 | | | 4,590,000 |
Hubbell, Inc. | | 180,000 | | | 7,655,400 |
| | | | | | 18,874,500 |
Fabricated Metal Product Manufacturing—4.9% |
Crane Co. | | 375,000 | | | 10,443,750 |
Griffon Corp.(a) | | 675,000 | | | 5,919,750 |
The Stanley Works | | 325,000 | | | 14,699,750 |
| | | | | | 31,063,250 |
Furniture and Related Product Manufacturing—0.2% |
Ethan Allen Interiors, Inc. | | 100,000 | | | 1,246,000 |
Machinery Manufacturing—10.8% |
Barnes Group, Inc. | | 925,000 | | | 14,661,250 |
Esterline Technologies Corp.(a) | | 350,000 | | | 14,738,500 |
FMC Corp. | | 250,000 | | | 12,775,000 |
| | | | | |
| Common Stocks (continued) | | Shares | | Value |
IDEX Corp. | | 150,000 | | $ | 4,264,500 |
Ingersoll-Rand Plc(b) | | 220,000 | | | 6,949,800 |
Kennametal, Inc. | | 534,500 | | | 12,592,820 |
Lydall, Inc.(a) | | 587,500 | | | 2,937,500 |
Standex International Corp. | | 10,000 | | | 175,800 |
| | | | | | 69,095,170 |
Merchant Wholesalers, Nondurable Goods—2.0% |
Acuity Brands, Inc. | | 400,000 | | | 12,664,000 |
Miscellaneous Manufacturing—5.5% |
Brady Corp. | | 300,000 | | | 8,124,000 |
STERIS Corp. | | 275,000 | | | 8,046,500 |
Thermo Fisher Scientific, Inc.(a) | | 425,000 | | | 19,125,000 |
| | | | | | 35,295,500 |
Miscellaneous Store Retailers—1.0% |
Ashland, Inc. | | 180,000 | | | 6,217,200 |
Motor Vehicle and Parts Dealers—1.1% |
Rush Enterprises, Inc.(a) | | 635,000 | | | 6,934,200 |
Nonmetallic Mineral Product Manufacturing—0.8% |
Owens-Illinois, Inc.(a) | | 150,000 | | | 4,782,000 |
Paper Manufacturing—1.4% |
Sonoco Products Co. | | 325,000 | | | 8,693,750 |
Pipeline Transportation—1.8% |
Southern Union Co. | | 570,000 | | | 11,154,900 |
Plastics and Rubber Products Manufacturing—1.3% |
Carlisle Companies, Inc. | | 250,000 | | | 7,760,000 |
Spartech Corp.(a) | | 56,800 | | | 543,576 |
| | | | | | 8,303,576 |
Primary Metal Manufacturing—1.2% |
Commercial Metals Co. | | 150,000 | | | 2,226,000 |
Kaiser Aluminum Corp. | | 139,522 | | | 5,573,904 |
| | | | | | 7,799,904 |
Printing and Related Support Activities—2.1% |
RR Donnelley & Sons Co. | | 675,000 | | | 13,554,000 |
Professional, Scientific, and Technical Services—3.9% |
Charles River Laboratories International, Inc.(a) | | 175,000 | | | 6,391,000 |
MPS Group, Inc.(a) | | 1,010,000 | | | 13,655,200 |
Pharmaceutical Product Development, Inc. | | 225,000 | | | 4,848,750 |
| | | | | | 24,894,950 |
Textile Mills—2.2% |
Albany International Corp. | | 850,000 | | | 14,161,000 |
Transportation Equipment Manufacturing—1.8% |
Honeywell International, Inc. | | 325,000 | | | 11,664,250 |
Total Common Stocks
(Cost $459,287,150) | | | | | 462,367,330 |
The accompanying notes are an integral part of these financial statements.
The Delafield Fund
Schedule of Investments as of October 31, 2009
| | | | | | |
| Corporate Bonds—2.0% | | Principal
Amount | | Value |
Chemical Manufacturing—0.6% |
The Dow Chemical Co.
5.900%, 02/15/2015 | | $ | 1,000,000 | | $ | 1,035,665 |
The Dow Chemical Co.
7.600%, 05/15/2014 | | | 2,500,000 | | | 2,780,330 |
| | | | | | | 3,815,995 |
Computer and Electronic Product Manufacturing—0.2% |
St Jude Medical, Inc.
3.750%, 07/15/2014 | | | 1,000,000 | | | 1,019,623 |
Funds, Trusts, and Other Financial Vehicles—0.2% |
JP Morgan Chase & Co. 4.650%, 06/01/2014 | | | 1,000,000 | | | 1,055,956 |
Management of Companies and Enterprises—0.1% |
BAE Systems Holdings, Inc. 4.950%, 06/01/2014(b)(c)(d) | | | 500,000 | | | 519,347 |
Software & Services—0.1% |
Oracle Corp.
3.750%, 07/08/2014 | | | 1,000,000 | | | 1,040,682 |
Telecommunications—0.5% |
Deutsche Telekom International Finance B V
4.875%, 07/08/2014(b) | | | 3,000,000 | | | 3,167,940 |
Transportation Equipment Manufacturing—0.1% |
Honeywell International, Inc. 3.875%, 02/15/2014 | | | 1,000,000 | | | 1,044,488 |
Utilities—0.2% |
Duke Energy Corp.
3.950%, 09/15/2014 | | | 1,000,000 | | | 1,019,304 |
Total Corporate Bonds
(Cost $11,950,597) | | | 12,683,335 |
| | | Shares | | Value |
Real Estate Investment Trusts (REITs)—1.0% |
Kimco Realty Corp.(g) | | | 500,000 | | | 6,320,000 |
Total Real Estate Investment Trusts
(Cost $4,247,969) | | | 6,320,000 |
| | | Principal
Amount | | Value |
U.S. Treasury Obligations—1.6% | | | |
United States Treasury Notes—1.6% |
1.000%, 07/31/2011 | | $ | 10,000,000 | | | 10,050,790 |
Total U.S. Treasury Obligations
(Cost $9,948,860) | | | | | | 10,050,790 |
| | | | | |
| Warrants—0.0% | | Shares | | Value |
Transportation—0.0% | | | | | |
Clark Holdings, Inc.
Expiration: February, 2011, Excercise Price: $6.00(a) | | 410,000 | | $ | 4,100 |
Total Warrants
(Cost $465,970) | | | | | 4,100 |
Short-Term Investments—22.1% | | | |
Money Market Funds—22.1% | | | |
Daily Income Fund—U.S. Treasury Portfolio, 0.19%(c) | | 50,000,000 | | | 50,000,000 |
AIM STIT—Treasury Portfolio, 0.50%(c) | | 90,503,744 | | | 90,503,744 |
| | | | | | 140,503,744 |
Total Short-Term Investments (Cost $140,503,744) | | | | | 140,503,744 |
Total Investments
(Cost $626,404,290)—99.3% | | | 631,929,299 |
Other Assets in Excess of Liabilities—0.7% | | | 4,618,329 |
Total Net Assets—100.0% | | | | $ | 636,547,628 |
| | | | | |
Percentages are stated as a percent of net assets.
| (a) | Non-income producing security. |
| (b) | Foreign issued security. Foreign concentration was as follows: Ireland 1.1%; Netherlands 0.5% Singapore 4.7%; Switzerland 2.0% |
| (c) | Variable rate security. The rate listed is as of October 31, 2009. |
The accompanying notes are an integral part of these financial statements.
The Select Fund
Schedule of Investments as of October 31, 2009
| | | | | |
| Common Stocks—85.8% | | Shares | | Value |
Administrative and Support Services—3.4% | | | |
Dun & Bradstreet Corp. | | 11,000 | | $ | 842,160 |
Apparel Manufacturing—1.9% | | | |
Maidenform Brands, Inc.(a) | | 34,000 | | | 477,360 |
Building Material and Garden Equipment and Supplies Dealers—3.6% |
Wesco International, Inc.(a) | | 34,500 | | | 881,820 |
Chemical Manufacturing—3.1% | | | |
Cytec Industries, Inc. | | 23,500 | | | 779,495 |
Clothing and Clothing Accessories Stores—7.3% |
Collective Brands, Inc.(a) | | 61,000 | | | 1,131,550 |
Foot Locker, Inc. | | 63,000 | | | 660,240 |
| | | | | | 1,791,790 |
Computer and Electronic Product Manufacturing—11.3% |
Checkpoint Systems, Inc.(a) | | 61,000 | | | 827,770 |
Flextronics International Ltd.(a)(b) | | 178,000 | | | 1,153,440 |
Vishay Intertechnology, Inc.(a) | | 130,000 | | | 809,900 |
| | | | | | 2,791,110 |
Fabricated Metal Product Manufacturing—3.5% |
Crane Co. | | 31,500 | | | 877,275 |
Machinery Manufacturing—13.3% |
Barnes Group, Inc. | | 61,000 | | | 966,850 |
Esterline Technologies Corp.(a) | | 29,000 | | | 1,221,190 |
Kennametal, Inc. | | 46,000 | | | 1,083,760 |
| | | | | | 3,271,800 |
Merchant Wholesalers, Nondurable Goods—2.9% |
Acuity Brands, Inc. | | 22,500 | | | 712,350 |
Miscellaneous Manufacturing—6.3% |
STERIS Corp. | | 24,000 | | | 702,240 |
Thermo Fisher Scientific, Inc.(a) | | 19,000 | | | 855,000 |
| | | | | | 1,557,240 |
Miscellaneous Store Retailers—2.1% |
Ashland, Inc. | | 15,200 | | | 525,008 |
Paper Manufacturing—1.8% | | | | | |
KapStone Paper and Packaging Corp.(a) | | 62,700 | | | 435,138 |
Plastics and Rubber Products Manufacturing—2.6% |
Carlisle Companies, Inc. | | 21,000 | | | 651,840 |
Professional, Scientific, and Technical Services—12.2% |
Charles River Laboratories International, Inc.(a) | | 27,300 | | | 996,996 |
Cognizant Technology Solutions
Corp.(a) | | 17,300 | | | 668,645 |
Genpact Ltd.(a)(b) | | 51,000 | | | 607,410 |
Tier Technologies, Inc.(a) | | 90,000 | | | 736,200 |
| | | | | | 3,009,251 |
| | | | | | |
| Common Stocks—(continued) | | Shares | | Value | |
Telecommunications—4.0% | | | | |
j2 Global Communications, Inc.(a) | | 48,000 | | $ | 981,600 | |
Textile Mills—5.4% | | | | |
Albany International Corp. | | 80,000 | | | 1,332,800 | |
Transportation Equipment Manufacturing—1.1% | |
Federal Signal Corp. | | 43,000 | | | 264,020 | |
Total Common Stocks
(Cost $17,902,596) | | | | $ | 21,182,057 | |
Short-Term Investments—15.4% | | | | |
Money Market Funds—15.4% | | | | | | |
AIM STIT—Treasury Portfolio, 0.50%(c) | | 3,808,458 | | | 3,808,458 | |
Total Short-Term Investments
(Cost $3,808,458) | | | 3,808,458 | |
Total Investments
(Cost $21,711,054)—101.2% | | | | | 24,990,515 | |
Liabilities in Excess of Other Assets—(1.2)% | | | (309,472 | ) |
Total Net Assets—100.0% | | $ | 24,681,043 | |
| | | | | | |
Percentages are stated as a percent of net assets.
| (a) | Non-income producing security. |
| (b) | Foreign issued security. Foreign concentration was as follows: Bermuda 2.5%; Singapore 4.7%. |
| (c) | Variable rate security. The rate shown is as of October 31, 2009. |
The accompanying notes are an integral part of these financial statements.
Percent of Total Investments
The Tocqueville Fund
Allocation of Portfolio Holdings
October 31, 2009
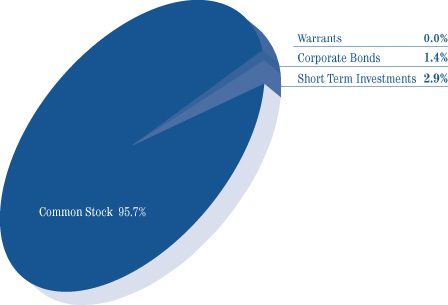
The Tocqueville Small Cap Fund
Allocation of Portfolio Holdings
October 31, 2009
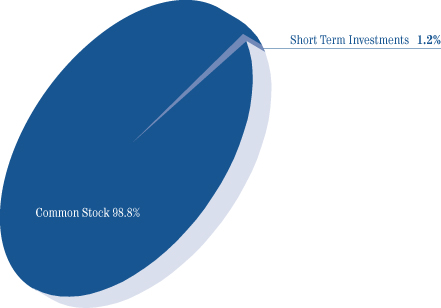
Percent of Total Investments
The Tocqueville International Value Fund
Allocation of Portfolio Holdings
October 31, 2009
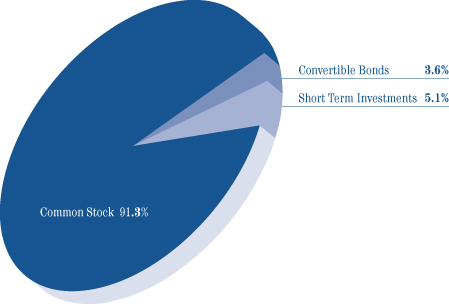
The Tocqueville Gold Fund
Allocation of Portfolio Holdings
October 31, 2009
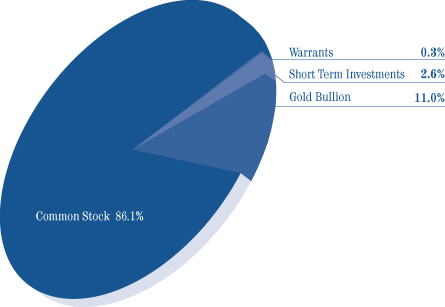
Percent of Total Investments
The Delafield Fund
Allocation of Portfolio Holdings
October 31, 2009
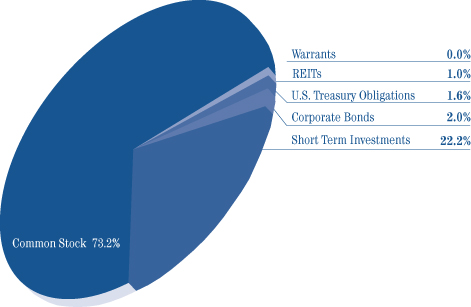
The Select Fund
Allocation of Portfolio Holdings
October 31, 2009
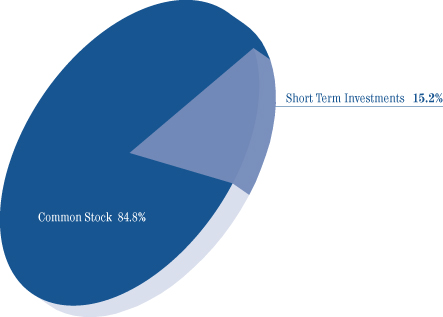
The Tocqueville Trust
Statements of Assets and Liabilities
October 31, 2009
| | | | | | | | | | | | | | | | | | | | | | | | |
| | | The
Tocqueville
Fund | | | Small Cap
Fund | | | International
Value
Fund | | | Gold
Fund | | | Delafield
Fund | | | Select
Fund | |
Assets | | | | | | | | | | | | | | | | | | | | | | | | |
Investments, at value (1) | | | | | | | | | | | | | | | | | | | | | | | | |
Unaffiliated issuers | | $ | 377,783,321 | | | $ | 27,557,675 | | | $ | 129,638,892 | | | $ | 888,130,016 | | | $ | 631,929,299 | | | $ | 24,990,515 | |
Affiliated issuers | | | 4,897,500 | | | | 2,199,279 | | | | — | | | | 45,138,369 | | | | — | | | | — | |
Foreign currencies (2) | | | — | | | | — | | | | 898,004 | | | | 478,131 | | | | — | | | | — | |
Cash | | | 8,675 | | | | 387 | | | | 777,908 | | | | 41 | | | | — | | | | 12,180 | |
Receivable for investments sold | | | — | | | | 1,242,881 | | | | 18,660 | | | | 3,195,556 | | | | 8,842,840 | | | | — | |
Receivable for fund shares sold | | | 1,042,837 | | | | 15,893 | | | | 166,682 | | | | 4,591,892 | | | | 1,391,715 | | | | 2,740 | |
Dividends, interest and other receivables | | | 518,451 | | | | 4,116 | | | | 404,212 | | | | 3,933 | | | | 418,978 | | | | 3,097 | |
Prepaid assets | | | 27,789 | | | | 9,288 | | | | 14,606 | | | | 53,673 | | | | 1,988 | | | | 6,071 | |
| | | | | | | | | | | | | | | | | | | | | | | | |
Total Assets | | | 384,278,573 | | | | 31,029,519 | | | | 131,918,964 | | | | 941,591,611 | | | | 642,584,820 | | | | 25,014,603 | |
| | | | | | | | | | | | | | | | | | | | | | | | |
Liabilities | | | | | | | | | | | | | | | | | | | | | | | | |
Payable for investments purchased | | | — | | | | 364,177 | | | | 18,563 | | | | — | | | | 3,752,756 | | | | — | |
Payable for fund shares redeemed | | | 290,388 | | | | 117,629 | | | | 48,551 | | | | 2,751,352 | | | | 1,362,208 | | | | 291,853 | |
Payable to Adviser | | | 231,959 | | | | 21,478 | | | | 115,782 | | | | 730,331 | | | | 429,172 | | | | 17,961 | |
Due to custodian | | | — | | | | — | | | | — | | | | — | | | | 936 | | | | — | |
Accrued distribution fee | | | 76,525 | | | | 7,076 | | | | 28,206 | | | | 192,579 | | | | 153,418 | | | | 6,106 | |
Accrued expenses and other liabilities | | | 209,971 | | | | 21,511 | | | | 94,497 | | | | 425,089 | | | | 338,702 | | | | 17,640 | |
| | | | | | | | | | | | | | | | | | | | | | | | |
Total Liabilities | | | 808,843 | | | | 531,871 | | | | 305,599 | | | | 4,099,351 | | | | 6,037,192 | | | | 333,560 | |
| | | | | | | | | | | | | | | | | | | | | | | | |
Net Assets | | $ | 383,469,730 | | | $ | 30,497,648 | | | $ | 131,613,365 | | | $ | 937,492,260 | | | $ | 636,547,628 | | | $ | 24,681,043 | |
| | | | | | | | | | | | | | | | | | | | | | | | |
Net assets consist of: | | | | | | | | | | | | | | | | | | | | | | | | |
Paid in capital | | $ | 463,923,967 | | | $ | 40,499,998 | | | $ | 140,470,670 | | | $ | 583,521,439 | | | $ | 674,210,749 | | | $ | 22,175,018 | |
Accumulated net investment income (loss) | | | 3,890,615 | | | | — | | | | 1,164,470 | | | | (393,813 | ) | | | — | | | | (8,797 | ) |
Accumulated net realized gain | | | (64,527,435 | ) | | | (9,577,500 | ) | | | (13,334,129 | ) | | | 1,803,081 | | | | (43,188,130 | ) | | | (764,639 | ) |
Net unrealized appreciation (depreciation) on: | | | | | | | | | | | | | | | | | | | | | | | | |
Investments and foreign currency related items | | | (19,817,417 | ) | | | (424,850 | ) | | | 3,312,354 | | | | 352,561,553 | | | | 5,525,009 | | | | 3,279,461 | |
| | | | | | | | | | | | | | | | | | | | | | | | |
Net assets | | $ | 383,469,730 | | | $ | 30,497,648 | | | $ | 131,613,365 | | | $ | 937,492,260 | | | $ | 636,547,628 | | | $ | 24,681,043 | |
| | | | | | | | | | | | | | | | | | | | | | | | |
Shares of beneficial interest outstanding (unlimited shares of $0.01 par value authorized) | | | 20,763,102 | | | | 2,830,368 | | | | 12,555,979 | | | | 18,859,695 | | | | 29,820,858 | | | | 2,917,549 | |
Net asset value and redemption price per share | | $ | 18.47 | | | $ | 10.78 | | | $ | 10.48 | | | $ | 49.71 | | | $ | 21.35 | | | $ | 8.46 | |
| | | | | | | | | | | | | | | | | | | | | | | | |
Maximum offering price per share | | $ | 18.47 | | | $ | 10.78 | | | $ | 10.48 | | | $ | 49.71 | | | $ | 21.35 | | | $ | 8.46 | |
| | | | | | | | | | | | | | | | | | | | | | | | |
(1) Cost of Investments | | | | | | | | | | | | | | | | | | | | | | | | |
Unaffiliated issuers | | $ | 394,060,022 | | | $ | 27,723,848 | | | $ | 126,345,244 | | | $ | 554,494,999 | | | $ | 626,404,290 | | | $ | 21,711,054 | |
Affiliated issuers | | $ | 8,440,807 | | | $ | 2,457,954 | | | $ | — | | | $ | 26,036,076 | | | $ | — | | | $ | — | |
(2) Cost of Foreign Currencies | | $ | — | | | $ | — | | | $ | 891,402 | | | $ | 479,950 | | | $ | — | | | $ | — | |
The accompanying notes are an integral part of these financial statements.
The Tocqueville Trust
Statements of Operations
For the Periods Ended October 31, 2009 (1)
| | | | | | | | | | | | | | | | | | | | | | | | |
| | | The
Tocqueville
Fund | | | Small Cap
Fund | | | International
Value
Fund | | | Gold
Fund | | | The
Delafield
Fund | | | The
Select
Fund | |
Investment Income: | | | | | | | | | | | | | | | | | | | | | | | | |
Dividends* | | | | | | | | | | | | | | | | | | | | | | | | |
Unaffiliated issuers | | $ | 8,294,196 | | | $ | 134,124 | | | $ | 2,431,532 | | | $ | 1,651,335 | | | $ | 5,467,751 | | | $ | 163,804 | |
Affiliated issuers | | | 592,024 | | | | — | | | | — | | | | — | | | | — | | | | — | |
Interest | | | 428,810 | | | | 1,097 | | | | 472,520 | | | | 9,032 | | | | 1,000,662 | | | | 306 | |
| | | | | | | | | | | | | | | | | | | | | | | | |
| | | 9,315,030 | | | | 135,221 | | | | 2,904,052 | | | | 1,660,367 | | | | 6,468,413 | | | | 164,110 | |
| | | | | | | | | | | | | | | | | | | | | | | | |
Expenses: | | | | | | | | | | | | | | | | | | | | | | | | |
Investment Adviser’s fee (See Note 5) | | | 2,386,544 | | | | 231,059 | | | | 1,126,577 | | | | 6,339,165 | | | | 3,149,102 | | | | 118,148 | |
Distribution fees (See Note 5) | | | 795,514 | | | | 77,020 | | | | 281,644 | | | | 1,704,870 | | | | 1,016,767 | | | | 17,192 | |
Administration fee (See Note 5) | | | 477,309 | | | | 46,212 | | | | 168,986 | | | | 1,022,922 | | | | 816,986 | | | | 77,113 | |
Transfer agent and shareholder services fees | | | 157,466 | | | | 12,439 | | | | 37,202 | | | | 347,830 | | | | 222,860 | | | | 7,385 | |
Professional fees | | | 138,074 | | | | 19,365 | | | | 54,196 | | | | 271,377 | | | | 95,130 | | | | 4,445 | |
Fund accounting fees | | | 43,455 | | | | 6,018 | | | | 35,889 | | | | 94,314 | | | | 63,846 | | | | 218 | |
Custody fees | | | 33,632 | | | | 11,056 | | | | 46,370 | | | | 38,580 | | | | 44,252 | | | | 12,062 | |
Registration fees | | | 30,365 | | | | 20,622 | | | | 20,140 | | | | 52,019 | | | | 35,723 | | | | 43,588 | |
Printing and mailing expense | | | 58,970 | | | | 4,047 | | | | 15,577 | | | | 119,854 | | | | 67,467 | | | | 6,960 | |
Trustee fees and expenses | | | 44,023 | | | | 3,258 | | | | 17,131 | | | | 102,906 | | | | 68,616 | | | | 10,889 | |
Insurance expense | | | 13,471 | | | | 1,364 | | | | 7,392 | | | | 37,844 | | | | 13,166 | | | | 11 | |
Other expenses | | | 53,821 | | | | 2,669 | | | | 8,924 | | | | 70,980 | | | | 19,092 | | | | 5,136 | |
| | | | | | | | | | | | | | | | | | | | | | | | |
Total expenses before waiver | | | 4,232,644 | | | | 435,129 | | | | 1,820,028 | | | | 10,202,661 | | | | 5,613,007 | | | | 303,147 | |
Less: Fees waived (See Note 5) | | | (255,071 | ) | | | — | | | | — | | | | — | | | | — | | | | (115,096 | ) |
| | | | | | | | | | | | | | | | | | | | | | | | |
Net expenses | | | 3,977,573 | | | | 435,129 | | | | 1,820,028 | | | | 10,202,661 | | | | 5,613,007 | | | | 188,051 | |
| | | | | | | | | | | | | | | | | | | | | | | | |
Net Investment Income (Loss) | | | 5,337,457 | | | | (299,908 | ) | | | 1,084,024 | | | | (8,542,294 | ) | | | 855,406 | | | | (23,941 | ) |
| | | | | | | | | | | | | | | | | | | | | | | | |
Realized and Unrealized Gain (Loss): | | | | | | | | | | | | | | | | | | | | | | | | |
Net realized gain (loss) on: | | | | | | | | | | | | | | | | | | | | | | | | |
Investments | | | | | | | | | | | | | | | | | | | | | | | | |
Unaffiliated issuers | | | (52,282,741 | ) | | | (6,673,449 | ) | | | (13,314,399 | ) | | | 21,073,622 | | | | (40,983,734 | ) | | | (536,620 | ) |
Affiliated issuers | | | (4,047,114 | ) | | | (2,574,869 | ) | | | — | | | | (19,270,262 | ) | | | — | | | | — | |
Foreign currency translation | | | 31 | | | | — | | | | 259,896 | | | | (164,646 | ) | | | — | | | | — | |
| | | | | | | | | | | | | | | | | | | | | | | | |
| | | (56,329,824 | ) | | | (9,248,318 | ) | | | (13,054,503 | ) | | | 1,638,714 | | | | (40,983,734 | ) | | | (536,620 | ) |
Net change in unrealized appreciation on: | | | | | | | | | | | | | | | | | | | | | | | | |
Investments | | | 96,418,009 | | | | 12,719,087 | | | | 36,633,040 | | | | 480,224,231 | | | | 210,086,644 | | | | 7,477,312 | |
Foreign currency translation | | | — | | | | — | | | | 9,225,118 | | | | 43,243,897 | | | | — | | | | — | |
| | | | | | | | | | | | | | | | | | | | | | | | |
| | | 96,418,009 | | | | 12,719,087 | | | | 45,858,158 | | | | 523,468,128 | | | | 210,086,644 | | | | 7,477,312 | |
Net gain on investments and foreign currency | | | 40,088,185 | | | | 3,470,769 | | | | 32,803,655 | | | | 525,106,842 | | | | 169,102,910 | | | | 6,940,692 | |
| | | | | | | | | | | | | | | | | | | | | | | | |
Net Increase in Net Assets Resulting from Operations | | $ | 45,425,642 | | | $ | 3,170,861 | | | $ | 33,887,679 | | | $ | 516,564,548 | | | $ | 169,958,316 | | | $ | 6,916,751 | |
| | | | | | | | | | | | | | | | | | | | | | | | |
* Net of foreign taxes withheld | | $ | 73,745 | | | $ | — | | | $ | 294,657 | | | $ | 142,808 | | | $ | — | | | $ | — | |
| | | | | | | | | | | | | | | | | | | | | | | | |
| (1) | The predecessor funds of The Delafield Fund and The Select Fund fiscal years began on January 1, 2009. See Footnote 1 to the financial statements. |
The accompanying notes are an integral part of these financial statements.
The Tocqueville Trust
Statements of Changes in Net Assets
| | | | | | | | | | | | | | | | |
| | | The Tocqueville Fund | | | Small Cap Fund | |
| | | For the
Year Ended
October 31,
2009 | | | For the
Year Ended
October 31,
2008 | | | For the
Year Ended
October 31,
2009 | | | For the
Year Ended
October 31,
2008 | |
Operations: | | | | | | | | | | | | | | | | |
Net investment income (loss) | | $ | 5,337,457 | | | $ | 4,739,815 | | | $ | (299,908 | ) | | $ | 48,407 | |
Net realized gain (loss) on investments and foreign currency | | | (56,329,824 | ) | | | 2,137,522 | | | | (9,248,318 | ) | | | 169,198 | |
Net change in unrealized appreciation/(depreciation) | | | 96,418,009 | | | | (227,748,077 | ) | | | 12,719,087 | | | | (19,843,665 | ) |
| | | | | | | | | | | | | | | | |
Net increase in net assets resulting from operations | | | 45,425,642 | | | | (220,870,740 | ) | | | 3,170,861 | | | | (19,626,060 | ) |
Dividends and distributions to shareholders: | | | | | | | | | | | | | | | | |
Net investment income | | | (5,443,841 | ) | | | (3,450,163 | ) | | | (38,161 | ) | | | (335,138 | ) |
Net realized gains | | | — | | | | (36,514,100 | ) | | | (387,146 | ) | | | (4,709,888 | ) |
| | | | | | | | | | | | | | | | |
Total dividends and distributions | | | (5,443,841 | ) | | | (39,964,263 | ) | | | (425,307 | ) | | | (5,045,026 | ) |
Fund share transactions: | | | | | | | | | | | | | | | | |
Net increase (decrease) in assets from capital share transactions (See Footnote 6)* | | | 14,878,679 | | | | 65,566,408 | | | | (8,677,015 | ) | | | 11,556,703 | |
| | | | | | | | | | | | | | | | |
Net increase (decrease) in net assets | | | 54,860,480 | | | | (195,268,595 | ) | | | (5,931,461 | ) | | | (13,114,383 | ) |
Net Assets: | | | | | | | | | | | | | | | | |
Beginning of period | | | 328,609,250 | | | | 523,877,845 | | | | 36,429,109 | | | | 49,543,492 | |
| | | | | | | | | | | | | | | | |
End of period** | | | 383,469,730 | | | | 328,609,250 | | | | 30,497,648 | | | | 36,429,109 | |
| | | | | | | | | | | | | | | | |
* Net of redemption fees of: | | $ | 77,031 | | | $ | 198,509 | | | $ | 4,390 | | | $ | 16,759 | |
| | | | | | | | | | | | | | | | |
** Including undistributed net investment income (loss) of: | | $ | 3,890,615 | | | $ | 3,921,863 | | | $ | — | | | $ | 38,161 | |
| | | | | | | | | | | | | | | | |
| (1) | The predecessor funds of The Delafield Fund and The Select Fund fiscal years began on January 1, 2009. See Footnote 1 to the financial statements. |
The accompanying notes are an integral part of these financial statements.
The Tocqueville Trust
Statements of Changes in Net Assets
| | | | | | | | | | | | | | | | | | | | | | | | | | | | | | |
| International Value Fund | | | Gold Fund | | | Delafield Fund (1) | | | Select Fund(1) | |
For the
Year Ended
October 31,
2009 | | | For the
Year Ended
October 31,
2008 | | | For the
Year Ended
October 31,
2009 | | | For the
Year Ended
October 31,
2008 | | | For the
Period Ended
October 31,
2009 | | | For the
Year Ended
December 31,
2008 | | | For the
Period Ended
October 31,
2009 | | | For the
Period Ended
December 31,
2008 | |
| | | | | | | | | | | | | | | | | | | | | | | | | | | | | | |
| $ | 1,084,024 | | | $ | 1,890,571 | | | $ | (8,542,294 | ) | | $ | (10,526,148 | ) | | $ | 855,406 | | | $ | 1,927,916 | | | $ | (23,941 | ) | | $ | 8,796 | |
| | | | | | | |
| | (13,054,503 | ) | | | 7,318,134 | | | | 1,638,714 | | | | 15,648,877 | | | | (40,983,734 | ) | | | (2,078,830 | ) | | | (536,620 | ) | | | (184,411 | ) |
| | 45,858,158 | | | | (92,861,385 | ) | | | 523,468,128 | | | | (677,969,427 | ) | | | 210,086,644 | | | | (246,145,771 | ) | | | 7,477,312 | | | | (5,078,100 | ) |
| | | | | | | | | | | | | | | | | | | | | | | | | | | | | | | |
| | 33,887,679 | | | | (83,652,680 | ) | | | 516,564,548 | | | | (672,846,698 | ) | | | 169,958,316 | | | | (246,296,685 | ) | | | 6,916,751 | | | | (5,253,715 | ) |
| | | | | | | | | | | | | | | | | | | | | | | | | | | | | | |
| | (2,581,608 | ) | | | (1,371,852 | ) | | | — | | | | (8,713,461 | ) | | | (991,318 | ) | | | (1,919,731 | ) | | | (10,819 | ) | | | (15,741 | ) |
| | (6,588,457 | ) | | | (25,545,236 | ) | | | (15,721,021 | ) | | | (158,099,409 | ) | | | — | | | | (21,924 | ) | | | — | | | | — | |
| | | | | | | | | | | | | | | | | | | | | | | | | | | | | | | |
| | (9,170,065 | ) | | | (26,917,088 | ) | | | (15,721,021 | ) | | | (166,812,870 | ) | | | (991,318 | ) | | | (1,941,655 | ) | | | (10,819 | ) | | | (15,741 | ) |
| | | | | | | | | | | | | | | | | | | | | | | | | | | | | | |
| | | | | | | |
| | (11,292,902 | ) | | | 9,537,983 | | | | 25,792,039 | | | | 19,041,739 | | | | 62,720,729 | | | | (3,901,128 | ) | | | 6,916,294 | | | | 16,128,273 | |
| | | | | | | | | | | | | | | | | | | | | | | | | | | | | | | |
| | 13,424,712 | | | | (101,031,785 | ) | | | 526,635,566 | | | | (820,617,829 | ) | | | 231,687,727 | | | | (252,139,468 | ) | | | 13,822,226 | | | | 10,858,817 | |
| | | | | | | | | | | | | | | | | | | | | | | | | | | | | | |
| | 118,188,653 | | | | 219,220,438 | | | | 410,856,694 | | | | 1,231,474,523 | | | | 404,859,901 | | | | 656,999,369 | | | | 10,858,817 | | | | — | |
| | | | | | | | | | | | | | | | | | | | | | | | | | | | | | | |
| | 131,613,365 | | | | 118,188,653 | | | | 937,492,260 | | | | 410,856,694 | | | | 636,547,628 | | | | 404,859,901 | | | | 24,681,043 | | | | 10,858,817 | |
| | | | | | | | | | | | | | | | | | | | | | | | | | | | | | | |
| $ | 18,461 | | | $ | 19,385 | | | $ | 463,326 | | | $ | 564,671 | | | $ | 227,715 | | | $ | 222,377 | | | $ | — | | | $ | — | |
| | | | | | | | | | | | | | | | | | | | | | | | | | | | | | | |
| | | | | | | |
| $ | 1,164,470 | | | $ | 2,402,161 | | | $ | (393,813 | ) | | $ | (70,469 | ) | | $ | — | | | $ | — | | | $ | (8,797 | ) | | $ | (1,863 | ) |
| | | | | | | | | | | | | | | | | | | | | | | | | | | | | | | |
The accompanying notes are an integral part of these financial statements.
The Tocqueville Trust
The Tocqueville Fund
The Tocqueville Small Cap Fund
The Tocqueville International Value Fund
The Tocqueville Gold Fund
The Delafield Fund
The Select Fund
Notes to Financial Statements
1. ORGANIZATION
The Tocqueville Trust (the “Trust”) is a Massachusetts business trust organized on September 17, 1986, currently consisting of six separate funds (each, a “Fund” or, collectively, the “Funds”). Each Fund is an open-end management investment company with a different investment objective. The Tocqueville Fund, The Tocqueville Small Cap Fund (the “Small Cap Fund”), The Tocqueville International Value Fund (the “International Fund”), and The Delafield Fund are classified as diversified investment companies. The Tocqueville Gold Fund (the “Gold Fund”) and The Select Fund are classified as non-diversified investment companies. The Tocqueville Fund’s investment objective is long-term capital appreciation which it seeks to achieve by investing primarily in securities of United States issuers. The Small Cap Fund’s investment objective is long-term capital appreciation which it seeks to achieve by investing primarily in securities of small-capitalization issuers located in the United States. The International Fund’s investment objective is long-term capital appreciation consistent with preservation of capital which it seeks to achieve by investing primarily in securities of non-U.S. issuers. The Gold Fund’s investment objective is long-term capital appreciation which it seeks to achieve by investing in gold, securities of companies located throughout the world that are engaged in mining or processing gold (“gold related securities”), other precious metals and securities of companies located throughout the world that are engaged in mining or processing such other precious metals (“other precious metal securities”). The Delafield Fund’s investment objectives are to seek long-term preservation of capital (sufficient growth to outpace inflation over an extended period of time) and growth of capital which it seeks to achieve by investing primarily in the equity securities of domestic companies. The Select Fund’s investment objective is to achieve long-term capital appreciation by investing in a focused group of common stocks issued primarily by small and mid-sized U.S. companies. Current income is a secondary objective for The Select Fund.
On June 22, 2009, the Board of Directors of Delafield Fund, Inc. approved an Agreement and Plan of Reorganization providing for, among other things, the transfer of the assets and liabilities of Delafield Fund, Inc. into The Delafield Fund, a series of The Tocqueville Trust. On September 24, 2009, the shareholders of Delafield Fund, Inc. approved the Agreement and Plan of Reorganization. On July 9, 2009, the Board of Trustees of Delafield Select Fund, a series of Natixis Funds Trust II, approved an Agreement and Plan of Reorganization providing for, among other things, the transfer of the assets and liabilities of Delafield Select Fund into the sole share class of The Select Fund, a series of The Tocqueville Trust. On September 24, 2009, the shareholders of Delafield Select Fund approved the Agreement and Plan of Reorganization. The effective date of both reorganizations was September 28, 2009. Transfers into The Delafield Fund and The Select Fund from their predecessor funds amounted to $649,892,191 and $25,888,388, respectively.
The Delafield Fund, a series of the Trust, commenced operations on September 28, 2009 as successor to Delafield Fund, Inc. The predecessor Delafield Fund, Inc. commenced operations on November 19, 1993.
The Select Fund, a series of the Trust, commenced operations on September 28, 2009 as successor to the Delafield Select Fund, a series of Natixis Funds Trust II. The predecessor Delafield Select Fund commenced operations on September 29, 2008 for Class A and Class C shares and on September 26, 2008 for Class Y shares. Prior to September 29, 2008, the predecessor Delafield Select Fund operated as a Delaware limited partnership using substantially the same investment objectives and investment policies as the predecessor fund. The limited partnership was incepted in July 1998.
The following is a summary of significant accounting principles followed by the Trust in the preparation of its financial statements.
2. SIGNIFICANT ACCOUNTING POLICIES
a) Security valuation
Investments in securities, including foreign securities, traded on an exchange or quoted on the over-the-counter market are valued at the last sale price or, if no sale occurred during the day, at the mean between closing bid and asked prices, as last reported by a pricing service approved by the Trustees. Securities that are principally traded on the National Association of Securities Dealers Automated Quotation National Market (“NASDAQ”) are generally valued at the NASDAQ Official Closing Price (“NOCP”). Investments in gold and silver are valued on the basis of the respective closing spot prices of the New York Commodity Exchange. Investments in other precious metals are valued at their respective market values determined on the basis of the mean between the last current bid and asked prices based on dealer or exchange quotations. When market quotations are not readily available, or when restricted securities or other assets are being valued, such assets are valued at fair value as determined in good faith by or under procedures approved by the Trustees. Short-term securities maturing within 60 days are valued on an amortized cost basis. Fixed income securities with maturities greater than 60 days are valued at market price.
Trading in securities on European and Far Eastern securities exchanges normally is completed before the calculation of the Funds’ net asset value. Trading on these foreign exchanges may not take place on all days on which there is regular trading on the New York Stock Exchange (“NYSE”), or may take place on days on which there is no regular trading on the NYSE. Similarly, the Funds may hold securities traded in domestic markets where the market may close early on a given day prior to calculation of the Funds’ net asset value. Events affecting the value of such securities held by the Funds that occur between the close of trading in the security and the close of trading on the NYSE normally will not be reflected in the Funds’ calculation of the net asset value. Significant events will be closely monitored, and where it is determined that an adjustment should be made to the security’s value because significant interim events may materially affect the value of the security, the security will be priced at its fair value in accordance with the procedures approved by the Trustees.
Investment and shareholder transactions are recorded on trade date. Dividend income is recognized on the ex-dividend date and interest income is recognized on an accrual basis.
b) Restricted and illiquid securities
The Funds may invest in securities that are subject to legal or contractual restrictions on resale or are illiquid. A security may be considered illiquid if it lacks a readily available market or if its valuation has not changed for a certain period of time. Disposal of these securities may involve time consuming negotiations and expense, and a prompt sale at the current valuation may be difficult.
c) Accounting pronouncements
There is no tax liability resulting from unrecognized tax benefits relating to uncertain income tax positions taken or expected to be taken on the tax return for the fiscal year-end October 31, 2009, or for any other tax years which are open for exam. As of October 31, 2009, open tax years include the tax years ended October 31, 2006 through 2009. The Trust is also not aware of any tax positions for which it is reasonably possible that the total amounts of unrecognized tax benefits will significantly change in the next six months. The Fund recognizes interest and penalties, if any, related to unrecognized tax benefits as income tax expense in the Statement of Operations. During the period, the Funds did not incur any interest or penalties.
The Trust has adopted authoritative fair valuation accounting standards, which establish an authoritative definition of fair value and set out a hierarchy for measuring fair value. These standards require additional disclosures about the various inputs and valuation techniques used to develop the measurements of fair value and a discussion in changes in valuation techniques and related inputs during the period. These inputs are summarized in the three broad levels listed below.
| | Level 1 - | Quoted prices in active markets for identical securities. |
| | Level 2 - | Other significant observable inputs (including quoted prices for similar securities, interest rates, prepayment speeds, credit risk, etc.). |
| | Level 3 - | Significant unobservable inputs (including the Fund’s own assumptions in determining the fair value of investments). |
The following is a summary of the inputs used, as of October 31, 2009, involving the Funds’ assets carried at value. The inputs of methodology used for valuing securities may not be an indication of the risk associated with investing in those securities.
| | | | | | | | | | | | |
| Description | | Level 1 | | Level 2 | | Level 3 | | Total |
| | | | |
| The Tocqueville Fund | | | | | | | | | | | | |
Total Common Stock | | $ | 366,285,400 | | $ | — | | $ | — | | $ | 366,285,400 |
Total Warrants | | | — | | | 14,909 | | | — | | | 14,909 |
Total Corporate Bonds | | | — | | | 5,320,512 | | | — | | | 5,320,512 |
Repurchase Agreement | | | — | | | 11,060,000 | | | — | | | 11,060,000 |
| | | | | | | | | | | | |
Total Fund | | $ | 366,285,400 | | $ | 16,395,421 | | $ | — | | $ | 382,680,821 |
| | | | | | | | | | | | |
| | | | |
| The Tocqueville Small Cap Fund | | Level 1 | | Level 2 | | Level 3 | | Total |
Total Common Stock | | $ | 29,412,954 | | $ | — | | $ | — | | $ | 29,412,954 |
Repurchase Agreement | | | — | | | 344,000 | | | — | | $ | 344,000 |
| | | | | | | | | | | | |
Total Fund | | $ | 29,412,954 | | $ | 344,000 | | $ | — | | $ | 29,756,954 |
| | | | | | | | | | | | |
| | | | |
| The Tocqueville International Value Fund | | Level 1 | | Level 2 | | Level 3 | | Total |
Common Stocks | | | | | | | | | | | | |
Australia | | $ | 1,967,400 | | $ | — | | $ | — | | $ | 1,967,400 |
Belgium | | | — | | | 4,743,086 | | | — | | | 4,743,086 |
Brazil | | | 5,577,100 | | | — | | | — | | | 5,577,100 |
Finland | | | 2,143,700 | | | — | | | — | | | 2,143,700 |
France | | | 4,869,684 | | | 14,691,695 | | | — | | | 19,561,379 |
Germany | | | 2,052,456 | | | 2,216,389 | | | — | | | 4,268,845 |
Hong Kong | | | — | | | 1,186,215 | | | — | | | 1,186,215 |
Indonesia | | | 1,966,780 | | | — | | | — | | | 1,966,780 |
Ireland | | | — | | | 4,014,871 | | | — | | | 4,014,871 |
| | | | | | | | | | | | |
| | | Level 1 | | Level 2 | | Level 3 | | Total |
Italy | | $ | — | | $ | 6,341,423 | | $ | — | | $ | 6,341,423 |
Japan | | | 7,728,531 | | | 19,256,552 | | | — | | | 26,985,083 |
Mexico | | | 3,031,700 | | | — | | | — | | | 3,031,700 |
Netherlands | | | 4,556,275 | | | 1,524,079 | | | — | | | 6,080,354 |
Singapore | | | — | | | 1,481,576 | | | — | | | 1,481,576 |
South Africa | | | 318,750 | | | — | | | — | | | 318,750 |
Spain | | | — | | | 2,171,206 | | | — | | | 2,171,206 |
Switzerland | | | — | | | 6,780,738 | | | — | | | 6,780,738 |
Thailand | | | — | | | 1,574,257 | | | — | | | 1,574,257 |
United Kingdom | | | 4,128,352 | | | 6,425,070 | | | — | | | 10,553,422 |
United States | | | 7,619,400 | | | — | | | — | | | 7,619,400 |
| | | | | | | | | | | | |
Total Common Stocks | | | 45,960,128 | | | 72,407,157 | | | — | | | 118,367,285 |
Total Convertible Bonds | | | — | | | 4,612,607 | | | — | | | 4,612,607 |
Repurchase Agreement | | | — | | | 6,659,000 | | | — | | | 6,659,000 |
| | | | | | | | | | | | |
Total Fund | | $ | 45,960,128 | | $ | 83,678,764 | | $ | — | | $ | 129,638,892 |
| | | | | | | | | | | | |
| | | | |
| The Tocqueville Gold Fund | | Level 1 | | Level 2 | | Level 3 | | Total |
Common Stock | | | | | | | | | | | | |
Gold | | $ | 557,656,001 | | $ | 178,634,759 | | $ | 11,806,316 | | $ | 748,097,076 |
Other Precious Metals | | | 10,786,419 | | | 38,376,007 | | | 6,362,107 | | | 55,524,533 |
| | | | | | | | | | | | |
Total Common Stock | | | 568,442,420 | | | 217,010,766 | | | 18,168,423 | | | 803,621,609 |
Total Warrants | | | — | | | 2,513,430 | | | — | | | 2,513,430 |
Gold Bullion | | | — | | | 102,482,346 | | | — | | | 102,482,346 |
Repurchase Agreement | | | — | | | 24,651,000 | | | — | | | 24,651,000 |
| | | | | | | | | | | | |
Total Fund | | $ | 568,442,420 | | $ | 346,657,542 | | $ | 18,168,423 | | $ | 933,268,385 |
| | | | | | | | | | | | |
| | | | |
| The Delafield Fund | | Level 1 | | Level 2 | | Level 3 | | Total |
Common Stock | | $ | 462,367,330 | | $ | — | | $ | — | | $ | 462,367,330 |
Corporate Bonds | | | — | | | 12,683,335 | | | — | | | 12,683,335 |
Real Estate Investment Trust (REIT) | | | 6,320,000 | | | — | | | — | | | 6,320,000 |
Total Warrants | | | — | | | 4,100 | | | — | | | 4,100 |
U.S. Treasury Notes | | | — | | | 10,050,790 | | | — | | | 10,050,790 |
Money Market Funds | | | 140,503,744 | | | — | | | — | | | 140,503,744 |
| | | | | | | | | | | | |
Total Fund | | $ | 609,191,074 | | $ | 22,738,225 | | $ | — | | $ | 631,929,299 |
| | | | | | | | | | | | |
| | | | |
| The Select Fund | | Level 1 | | Level 2 | | Level 3 | | Total |
Common Stock | | $ | 21,182,057 | | $ | — | | $ | — | | $ | 21,182,057 |
Money Market Funds | | | 3,808,458 | | | — | | | — | | | 3,808,458 |
| | | | | | | | | | | | |
Total Fund | | $ | 24,990,515 | | $ | — | | $ | — | | $ | 24,990,515 |
| | | | | | | | | | | | |
| * | For detailed industry descriptions, see the accompanying Schedules of Investments. |
Below is a reconciliation that details the activity of securities in Level 3 during the current fiscal period:
| | | | | | | | | | | | | | | | | | | |
| | | The
Tocqueville
Fund | | The
Tocqueville
Small Cap
Fund | | The
Tocqueville
International
Value Fund | | The
Tocqueville
Gold Fund | | | The
Delafield
Fund | | The
Select
Fund |
Beginning Balance—November 1, 2008 (January 1, 2009 for The Delafield Fund and The Select Fund) | | $ | — | | $ | — | | $ | — | | $ | 14,186,763 | | | $ | — | | $ | — |
Purchases | | | — | | | — | | | — | | | 5,867,546 | | | | — | | | — |
Sales | | | — | | | — | | | — | | | — | | | | — | | | — |
Realized gains/(losses) | | | — | | | — | | | — | | | — | | | | — | | | — |
Change in unrealized appreciation (depreciation) | | | — | | | — | | | — | | | (1,885,886 | ) | | | — | | | — |
Transfers in/(out) of level 3 | | | — | | | — | | | — | | | — | | | | — | | | — |
| | | | | | | | | | | | | | | | | | | |
Ending Balance—October 31, 2009 | | $ | — | | $ | — | | $ | — | | $ | 18,168,423 | | | $ | — | | $ | — |
| | | | | | | | | | | | | | | | | | | |
Subsequent Events Evaluation—In preparing these financial statements, the Trust has evaluated events and transactions for potential recognition or disclosure resulting from subsequent events through December 30, 2009, the date financial statements were available to be issued.
d) Foreign currency translation
Investments and other assets and liabilities denominated in foreign currencies are translated to U.S. dollars at the prevailing rates of exchange, in accordance with the Trust’s Portfolio Securities Valuation and Foreign Exchange Contracts Procedures. The Tocqueville Fund, The Tocqueville International Value Fund, The Tocqueville Gold Fund and The Delafield Fund are engaged in transactions in securities denominated in foreign currencies and, as a result, enter into foreign exchange contracts. These Funds are exposed to additional market risk as a result of changes in the value of the underlying currency in relation to the U.S. dollar. Risks include potential inability of counterparties to meet the terms of their contracts. The value of foreign currency contracts are marked-to-market on a daily basis, which reflects the changes in the market value of the contract at the close of each day’s trading, resulting in daily unrealized gains and/or losses. When the contracts are closed, the Funds recognize a realized gain or loss.
The Funds do not isolate that portion of the results of operations resulting from changes in foreign exchange rates on investments from the fluctuations arising from changes in market prices of securities held. Such fluctuations are included with the net realized and unrealized gain or loss from investments.
Reported net realized foreign exchange gains or losses arise from sales of foreign currencies, currency gains or losses realized between the trade and settlement dates on securities transactions, the differences between the amounts of dividends, interest, and foreign withholding taxes recorded on the Fund’s books, and the U.S. dollar equivalent of the amounts actually received or paid. Net unrealized foreign exchange gains and losses arise from changes in the value of assets and liabilities other than investments in securities at the end of the fiscal period, resulting from changes in the exchange rates.
e) Written option accounting
The Tocqueville International Value Fund, The Select Fund and The Tocqueville Gold Fund may write (sell) covered call options to hedge portfolio investments. When the Funds write (sell) an option, an amount equal to the premium received by the Funds is included in the Statements of Assets and Liabilities as an asset and an equivalent liability. The amount of the liability is subsequently marked-to-market to reflect the current value of the option written. By writing an option, the Funds may become obligated during the term of the option to deliver or purchase the securities underlying the option at the exercise price if the option is exercised. Option contracts are valued at the last sales price reported on the date of obligation. If the seller defaults and the value of the collateral declines or if bankruptcy proceedings are commenced with respect to the seller of the security, realization of the collateral by the Funds may be delayed or limited.
f) Dividends and distributions to Shareholders
Dividends to shareholders are recorded on the ex-dividend date. Dividends from net investment income are declared and paid annually by the Funds. Distributions of net realized capital gains, if any, will be declared and paid at least annually. Income and capital gain distributions are determined in accordance with income tax regulations which may differ from generally accepted accounting principles. Permanent differences between financial and tax reporting may result in reclassification to capital stock.
g) Use of estimates
The preparation of financial statements in conformity with accounting principles generally accepted in the United States of America requires management to make estimates and assumptions that affect the reported amounts of assets and liabilities and disclosure of contingent assets and liabilities at the date of the financial statements and the reported amounts of revenues and expenses during the reporting period. Actual results could differ from those estimates.
3. FEDERAL INCOME TAX
Provision for federal income taxes or excise taxes has not been made since the Funds have elected to be taxed as Regulated Investment Companies and intend to distribute substantially all taxable income to shareholders and otherwise comply with the provisions of the Internal Revenue Code applicable to Regulated Investment Companies. Distributions from net realized gains for book purposes may include short-term capital gains which are included as ordinary income to shareholders for tax purposes. Additionally, U.S. generally accepted accounting principles require that certain components of net assets relating to permanent differences be reclassified between financial and tax reporting. These reclassifications have no effect on net assets or net asset value per share. For the period ended October 31, 2009, the following table shows the reclassifications made:
| | | | | | | | | | | |
| | | Undistributed
Net Investment
Income/(Loss) | | Accumulated Net
Realized
Gain/(Loss) | | | Paid In Capital | |
The Tocqueville Fund | | $ | 75,136 | | $ | (75,136 | ) | | $ | — | |
Small Cap Fund | | | 299,908 | | | (292 | ) | | | (299,616 | ) |
International Value Fund | | | 259,893 | | | (259,892 | ) | | | (1 | ) |
Gold Fund | | | 8,218,950 | | | 164,647 | | | | (8,383,597 | ) |
Delafield Fund | | | 156,847 | | | 7,715 | | | | (164,562 | ) |
Select Fund | | | 27,826 | | | (3,780 | ) | | | (24,046 | ) |
The permanent differences primarily relate to net operating losses and foreign currency reclasses.
As of October 31, 2009, the components of accumulated earnings (losses) for income tax purposes were as follows:
| | | | | | | | | | | | | | | | | | | | | | | | |
| | | The Tocqueville
Fund | | | Small Cap
Fund | | | International
Value
Fund | | | Gold Fund | | | The
Delafield
Fund | | | The Select
Fund | |
Tax cost of investments | | $ | 402,616,897 | | | $ | 30,414,352 | | | $ | 126,345,244 | | | $ | 580,924,888 | | | $ | 627,928,737 | | | $ | 21,923,800 | |
| | | | | | | | | | | | | | | | | | | | | | | | |
Unrealized appreciation | | | 40,175,659 | | | | 4,151,451 | | | | 18,300,389 | | | | 382,197,617 | | | | 71,888,900 | | | | 4,768,845 | |
Unrealized depreciation | | | (60,109,144 | ) | | | (4,808,851 | ) | | | (14,988,035 | ) | | | (30,029,877 | ) | | | (67,888,338 | ) | | | (1,702,130 | ) |
| | | | | | | | | | | | | | | | | | | | | | | | |
Net unrealized appreciation (depreciation) | | | (19,933,485 | ) | | | (657,400 | ) | | | 3,312,354 | | | | 352,167,740 | | | | 4,000,562 | | | | 3,066,715 | |
| | | | | | | | | | | | | | | | | | | | | | | | |
Undistributed operating income | | | 3,890,615 | | | | — | | | | 1,164,470 | | | | — | | | | — | | | | — | |
Undistributed long-term gains | | | — | | | | — | | | | — | | | | 1,803,081 | | | | — | | | | — | |
| | | | | | | | | | | | | | | | | | | | | | | | |
Distributable earnings | | | 3,890,615 | | | | — | | | | 1,164,470 | | | | 1,803,081 | | | | — | | | | — | |
| | | | | | | | | | | | | | | | | | | | | | | | |
Other accumulated loss | | | (64,411,367 | ) | | | (9,344,950 | ) | | | (13,334,129 | ) | | | — | | | | (41,663,683 | ) | | | (560,690 | ) |
| | | | | | | | | | | | | | | | | | | | | | | | |
Total accumulated gain/(loss) | | $ | (80,454,237 | ) | | $ | (10,002,350 | ) | | $ | (8,857,305 | ) | | $ | 353,970,821 | | | $ | (37,663,121 | ) | | $ | 2,506,025 | |
| | | | | | | | | | | | | | | | | | | | | | | | |
The difference between book-basis and tax-basis unrealized appreciation is attributable primarily to capital loss carry overs.
The tax character of distributions paid during the periods ended October 31, 2009 and 2008 (October 31, 2009 and December 31, 2008 for The Delafield Fund and the Select Fund) was as follows:
| | | | | | | | | | | | |
| | | October 31, 2009 |
| | | Ordinary
Income | | Long Term
Capital
Gain | | Return of
Capital | | Total |
The Tocqueville Fund | | $ | 5,443,841 | | $ | — | | $ | — | | $ | 5,443,841 |
Small Cap Fund | | | 38,161 | | | 387,146 | | | — | | | 425,307 |
International Value Fund | | | 2,581,611 | | | 6,588,454 | | | — | | | 9,170,065 |
Gold Fund | | | — | | | 15,721,021 | | | — | | | 15,721,021 |
The Delafield Fund | | | 826,756 | | | — | | | 164,562 | | | 991,318 |
The Select Fund | | | 5,068 | | | — | | | 5,751 | | | 10,819 |
| | | | | | | | | | | | |
| | | October 31, 2008 and
December 31, 2008 |
| | | Ordinary
Income | | Long Term
Capital
Gain | | Return of
Capital | | Total |
The Tocqueville Fund | | $ | 7,473,581 | | $ | 32,490,682 | | $ | — | | $ | 39,964,263 |
Small Cap Fund | | | 371,265 | | | 4,673,761 | | | — | | | 5,045,026 |
International Value Fund | | | 1,371,852 | | | 25,545,236 | | | — | | | 26,917,088 |
Gold Fund | | | 12,357,089 | | | 154,455,781 | | | — | | | 166,812,870 |
The Delafield Fund | | | 1,927,916 | | | — | | | 13,739 | | | 1,941,655 |
The Select Fund | | | 15,741 | | | — | | | — | | | 15,741 |
The Fund designated as long-term capital gain dividend, pursuant to Internal Revenue Cose Section 852(b)(3), the amount necessary to reduce the earnings and profits of the Funds related to net capital gain to zero for the tax years ended October 31, 2009 and 2008 (October 31, 2009 and December 31, 2008 for The Delafield Fund and The Select Fund.
At October 31, 2009, certain Funds had tax basis capital losses which may be carried forward to offset future capital gains as shown below.
| | | | | | | | | | | | | | | | | | | | |
| | | The
Tocqueville
Fund | | | Small Cap
Fund | | | International
Value Fund | | | The
Delafield
Fund | | | The
Select
Fund | |
| Capital losses expiring on: | | | | | | | | | | | | | | | | | | | | |
10/31/2010 | | $ | (8,083,915 | ) | | $ | — | | | $ | — | | | $ | — | | | $ | — | |
12/31/2016 | | | — | | | | — | | | | — | | | | (2,065,749 | ) | | | — | |
10/31/2017 | | | (56,324,311 | ) | | | (9,344,950 | ) | | | (13,334,129 | ) | | | (39,597,934 | ) | | | (551,893 | ) |
4. FINANCIAL INSTRUMENTS
The Funds may trade financial instruments with off-balance sheet risk in the normal course of investing activities and to assist in managing exposure to market risks such as interest rates and foreign currency exchange rates. The financial instruments include written options, forward foreign currency exchange contracts and futures contracts. The contractual amounts of these instruments represent the investment the Funds have in particular classes of financial instruments and the amounts potentially subject to risk. The measurement of the risks associated with these instruments is meaningful only when all related and offsetting transactions are considered. At October 31, 2009, the Funds did not hold any financial instruments with off-balance sheet risk.
5. INVESTMENT ADVISORY AND OTHER AGREEMENTS
Tocqueville Asset Management L.P. (“Tocqueville”) is the investment adviser (the “Adviser”) to the Trust under Investment Advisory Agreements approved by shareholders. For its services, Tocqueville receives fees from The Tocqueville Fund, calculated daily and payable monthly, at an annual rate of 0.75% on the first $1 billion of the average
daily net assets of the Fund, and 0.65% of the average daily net assets in excess of $1 billion. Tocqueville receives fees from The Tocqueville Small Cap Fund, calculated daily and payable monthly, at an annual rate of 0.75% on the first $500 million of the average daily net assets of the Fund, and 0.65% of the average daily net assets in excess of $500 million. Tocqueville receives fees from the Tocqueville International Value Fund, calculated daily and payable monthly, at an annual rate of 1.00% on the first $1 billion of the average daily net assets of the Fund, and 0.75% of the average daily net assets in excess of $1 billion. Tocqueville receives fees from The Tocqueville Gold Fund, calculated daily and payable monthly, at an annual rate of 1.00% on the first $500 million of the average daily net assets of the Fund, 0.75% of the average daily net assets in excess of $500 million but not exceeding $1 billion, and 0.65% of the average daily net assets in excess of $1 billion. Tocqueville receives fees from The Delafield Fund, calculated daily and payable monthly, at an annual rate of 0.80% on the first $250 million of net assets of the Fund; 0.75% on the next $250 million of net assets of the Fund; 0.70% on the next $500 million of net assets of the Fund; and 0.65% on all net assets of the Fund over $1 billion. Tocqueville receives fees from The Select Fund, calculated daily and payable monthly, at an annual rate of 0.80% on all net assets of the Fund.
With respect to The Tocqueville Fund, effective October 31, 2009, the Adviser has contractually agreed to waive its advisory fees and/or reimburse expenses in order to ensure that The Tocqueville Fund’s total annual operating expenses do not exceed 1.25% of its average daily net assets. The Expense Limitation Agreement will remain in effect until October 31, 2010.
Pursuant to an Administrative Services Agreement, each Fund pays to the Adviser a fee computed and paid monthly at an annual rate of 0.15% of the average daily net assets of the Fund. For the year ended October 31, 2009, the Adviser has made payments of $112,170, $10,939, $39,807, $238,255, $16,625 and $662 to U.S. Bancorp Fund Services, LLC for services provided under a Sub-Administration Agreement for The Tocqueville Fund, The Tocqueville Small Cap Fund, The Tocqueville International Value Fund, The Tocqueville Gold Fund, The Delafield Fund and The Select Fund, respectively.
Tocqueville Securities, L.P. (the “Distributor”), an affiliate of Tocqueville, acts as distributor for shares of the Trust. Each Fund adopted a distribution and service plan pursuant to Rule 12b-1 of the 1940 Act. Pursuant to the plans, each Fund pays to the Distributor distribution and service fees of 0.25% per annum of its average daily net assets.
Commissions earned by the Distributor for services rendered as a registered broker-dealer in securities transactions for The Tocqueville Fund, The Tocqueville Small Cap Fund, The Tocqueville International Value Fund, The Tocqueville Gold Fund, The Delafield Fund and The Select Fund for the year (period) ended October 31, 2009, were $249,795, $24,546, $50,074, $136,458, $13,514 and $489, respectively.
6. CAPITAL SHARE TRANSACTIONS.
Transactions in capital shares for each Fund were as follows:
| | | | | | | | | | | | | | |
| | | For the Year
Ended
October 31, 2009 | | | For the Year
Ended
October 31, 2008 | |
| The Tocqueville Fund | | Shares | | | Dollar
Amount | | | Shares | | | Dollar
Amount | |
Shares sold | | 6,836,665 | | | $ | 110,323,953 | | | 9,218,902 | | | $ | 221,857,644 | |
Shares issued to holders in reinvestment of dividends | | 286,662 | | | | 4,443,262 | | | 1,316,286 | | | | 34,039,145 | |
Shares redeemed | | (6,403,983 | ) | | | (99,888,536 | ) | | (8,602,242 | ) | | | (190,330,381 | ) |
| | | | | | | | | | | | | | |
Net increase (decrease) | | 719,344 | | | $ | 14,878,679 | | | 1,932,946 | | | $ | 65,566,408 | |
| | |
| | | For the Year
Ended
October 31, 2009 | | | For the Year
Ended
October 31, 2008 | |
| The Tocqueville Small Cap Fund | | Shares | | | Dollar
Amount | | | Shares | | | Dollar
Amount | |
Shares sold | | 414,365 | | | $ | 3,491,896 | | | 1,569,321 | | | $ | 20,592,976 | |
Shares issued to holders in reinvestment of dividends | | 36,504 | | | | 317,949 | | | 303,367 | | | | 4,356,344 | |
Shares redeemed | | (1,347,737 | ) | | | (12,486,860 | ) | | (1,019,695 | ) | | | (13,392,617 | ) |
| | | | | | | | | | | | | | |
Net increase (decrease) | | (896,868 | ) | | $ | (8,677,015 | ) | | 852,993 | | | $ | 11,556,703 | |
| | |
| | | For the Year
Ended
October 31, 2009 | | | For the Year
Ended
October 31, 2008 | |
| The Tocqueville International Value Fund | | Shares | | | Dollar
Amount | | | Shares | | | Dollar
Amount | |
Shares sold | | 1,023,107 | | | $ | 9,171,246 | | | 1,090,157 | | | $ | 12,725,161 | |
Shares issued to holders in reinvestment of dividends | | 996,807 | | | | 8,163,847 | | | 1,694,701 | | | | 23,234,344 | |
Shares redeemed | | (3,387,189 | ) | | | (28,627,995 | ) | | (2,163,092 | ) | | | (26,421,522 | ) |
| | | | | | | | | | | | | | |
Net increase (decrease) | | (1,367,275 | ) | | $ | (11,292,902 | ) | | 621,766 | | | $ | 9,537,983 | |
| | |
| | | For the Year
Ended
October 31, 2009 | | | For the Year
Ended
October 31, 2008 | |
| The Tocqueville Gold Fund | | Shares | | | Dollar
Amount | | | Shares | | | Dollar
Amount | |
Shares sold | | 5,107,647 | | | $ | 207,301,579 | | | 4,864,962 | | | $ | 219,802,295 | |
Shares issued to holders in reinvestment of dividends | | 510,898 | | | | 15,061,134 | | | 3,330,644 | | | | 159,171,486 | |
Shares redeemed | | (5,632,933 | ) | | | (196,570,674 | ) | | (8,454,843 | ) | | | (359,932,042 | ) |
| | | | | | | | | | | | | | |
Net increase (decrease) | | (14,388 | ) | | $ | 25,792,039 | | | (259,237 | ) | | $ | 19,041,739 | |
| | | | | | | | | | | | | | |
| | |
| | | For the Ten-Month
Period Ended
October 31, 2009 | | | For the Year
Ended
December 31, 2009 | |
| The Delafield Fund (See Footnote 1) | | Shares | | | Dollar
Amount | | | Shares | | | Dollar
Amount | |
Shares sold | | 9,655,036 | | | $ | 167,437,687 | | | 9,089,307 | | | $ | 181,638,881 | |
Shares issued to holders in reinvestment of dividends | | 43,997 | | | | 944,184 | | | 128,804 | | | | 1,862,515 | |
Shares redeemed | | (6,690,659 | ) | | | (105,661,142 | ) | | (9,414,020 | ) | | | (187,402,524 | ) |
| | | | | | | | | | | | | | |
Net increase (decrease) | | 3,008,374 | | | $ | 62,720,729 | | | (195,909 | ) | | $ | (3,901,128 | ) |
| | |
| | | For the Ten-Month
Period Ended
October 31, 2009 | | | For the Period
Ended
December 31, 2008 | |
| The Select Fund (See Footnote 1) | | Shares | | | Dollar
Amount | | | Shares | | | Dollar
Amount | |
Shares sold | | 30,634 | | | $ | 270,523 | | | — | | | $ | — | |
Shares issued to holders in reinvestment of dividends | | — | | | | — | | | — | | | | — | |
Shares redeemed | | (42,404 | ) | | | (337,493 | ) | | | | | | | |
Transfers in | | | | | | | | | | | | | | |
From The Delafield Select Fund—Class A | | 1,272,151 | | | | 11,242,428 | | | — | | | | — | |
From The Delafield Select Fund—Class C | | 20,352 | | | | 179,855 | | | — | | | | — | |
From The Delafield Select Fund—Class Y | | 1,636,816 | | | | 14,466,105 | | | — | | | | — | |
| | | | | | | | | | | | | | |
Total transfers in | | 2,929,319 | | | | 25,888,388 | | | — | | | | — | |
| | | | | | | | | | | | | | |
Net increase (decrease) | | 2,917,549 | | | $ | 25,821,418 | | | — | | | $ | — | |
| | |
| | | For the Ten-Month
Period Ended
October 31, 2009 | | | For the Year
Ended
December 31, 2008 | |
| The Delafield Select Fund—Class A (See Footnote 1) | | Shares | | | Dollar
Amount | | | Shares | | | Dollar
Amount | |
Shares sold | | 1,237,383 | | | $ | 7,946,654 | | | 283,031 | | | $ | 1,725,474 | |
Shares issued to holders in reinvestment of dividends | | 262 | | | | 1,538 | | | 237 | | | | 1,360 | |
Shares redeemed | | (245,960 | ) | | | (1,231,673 | ) | | (1,209 | ) | | | (5,681 | ) |
Transfers out to The Select Fund | | (1,273,744 | ) | | | (11,242,428 | ) | | — | | | | — | |
| | | | | | | | | | | | | | |
Net increase (decrease) | | (282,059 | ) | | $ | (4,525,909 | ) | | 282,059 | | | $ | 1,721,153 | |
| | | | | | | | | | | | | | |
| | |
| | | For the Ten-Month
Period Ended
October 31, 2009 | | | For the Period
Ended
December 31, 2008 | |
| The Delafield Select Fund—Class C (See Footnote 1) | | Shares | | | Dollar
Amount | | | Shares | | | Dollar
Amount | |
Shares sold | | 23,853 | | | $ | 174,583 | | | 1,726 | | | $ | 10,166 | |
Shares issued to holders in reinvestment of dividends | | 1 | | | | 4 | | | 2 | | | | 10 | |
Shares redeemed | | (4,461 | ) | | | (28,330 | ) | | (550 | ) | | | (3,050 | ) |
Transfers out to The Select Fund | | (20,571 | ) | | | (179,855 | ) | | — | | | | — | |
| | | | | | | | | | | | | | |
Net increase (decrease) | | (1,178 | ) | | $ | (33,598 | ) | | 1,178 | | | $ | 7,126 | |
| | |
| | | For the Ten-Month
Period Ended
October 31, 2009 | | | For the Period
Ended
December 31, 2008 | |
| The Delafield Select Fund—Class Y (See Footnote 1) | | Shares | | | Dollar
Amount | | | Shares | | | Dollar
Amount | |
Shares sold | | 208,399 | | | $ | 1,561,596 | | | 12,121 | | | $ | 100,000 | |
Shares issued to holders in reinvestment of dividends | | 1,236 | | | | 9,277 | | | 2,495 | | | | 14,371 | |
Shares issued in connection with the acquisition of assets | | — | | | | — | | | 1,755,310 | | | | 15,341,407 | |
Shares redeemed | | (173,969 | ) | | | (1,450,385 | ) | | (170,589 | ) | | | (1,055,784 | ) |
Transfers out to The Select Fund | | (1,635,003 | ) | | | (14,466,105 | ) | | — | | | | — | |
| | | | | | | | | | | | | | |
Net increase (decrease) | | (1,599,337 | ) | | $ | (14,345,617 | ) | | 1,599,337 | | | $ | 14,399,994 | |
7. FUND SHARE TRANSACTIONS
The Funds currently offer only one class of shares of beneficial interest. A redemption fee of 2.00% is imposed on redemptions of shares held 120 days or fewer. This fee is retained by each Fund and is credited to paid in capital. Redemptions to which the fee applies include redemptions of shares resulting from an exchange made pursuant to the Exchange Privilege, as defined in the Trust’s Prospectus dated February 28, 2009 for The Tocqueville Fund, The Small Cap Fund, The International Value Fund and The Gold Fund, and dated September 29, 2009 for The Delafield Fund and The Select Fund. For a more detailed description of when the redemption fee does not apply, please see the Trust’s Prospectuses. The Trust may waive the redemption fee when the Adviser determines that the imposition of the redemption fee is not necessary to protect a Fund from the effects of redemptions by investors who use the Fund as a short-term trading vehicle.
8. INVESTMENT TRANSACTIONS
Purchases and sales of investment securities (excluding short-term instruments) for the period ended October 31, 2009 are summarized below.
| | | | | | | | | | | | | | | | | | |
| | | The
Tocqueville
Fund | | Small Cap
Fund | | International
Value Fund | | Gold
Fund | | Delafield
Fund | | The
Select
Fund |
Purchases: | | $ | 101,966,868 | | $ | 18,406,684 | | $ | 27,722,764 | | $ | 61,781,870 | | $ | 177,256,146 | | $ | 8,028,191 |
| | | | | | | | | | | | | | | | | | |
| | | | | | | | | | | | | | | | | | |
Sales: | | $ | 102,797,056 | | $ | 25,872,638 | | $ | 35,654,187 | | $ | 77,676,465 | | $ | 193,646,078 | | $ | 3,638,917 |
| | | | | | | | | | | | | | | | | | |
| | | | | | | | | | | | | | | | | | |
U.S. Government Security Purchases: | | $ | — | | $ | — | | $ | — | | $ | — | | $ | 9,942,406 | | $ | — |
| | | | | | | | | | | | | | | | | | |
U.S. Government Security Sales: | | $ | — | | $ | — | | $ | — | | $ | — | | $ | — | | $ | — |
| | | | | | | | | | | | | | | | | | |
9. TRANSACTIONS WITH AFFILIATES
The following issuers are affiliated with the Funds; that is, the Adviser had control of 5% or more of the outstanding voting securities during the period from November 1, 2008 through October 31, 2009. As defined in Section (2)(a)(3) of the Investment Company Act of 1940; such issues are:
| | | | | | | | | | | | | | | | | | | |
The Tocqueville Fund | | | | | | | | | | | | | | | |
Issuer Name | | Share Balance
at Nov. 1, 2008 | | Additions | | Reductions | | | Share Balance at
October 31, 2009 | | Dividend
Income | | Realized
Gain/(Loss) | | | Value at
October 31, 2009 |
Alaska Communication Systems Group, Inc. | | 750,000 | | — | | (150,000 | ) | | 600,000 | | $ | 592,024 | | $ | (273,569 | ) | | $ | 4,668,000 |
Emcore Corp. (a) | | 625,000 | | — | | (400,000 | ) | | 225,000 | | | — | | | (3,773,545 | ) | | | 229,500 |
Emcore Corp. Warrants (a) | | 39,375 | | — | | — | | | 39,375 | | | — | | | — | | | | — |
| | | | | | | | | | | | | | | | | | | |
| | | | | | | | | | | $ | 592,024 | | $ | (4,047,114 | ) | | $ | 4,897,500 |
| | | | | | | | | | | | | | | | | | | |
| | | | | |
The Tocqueville Small Cap Fund | | | | | | | | | | | | | | | |
Issuer Name | | Share Balance
at Nov. 1, 2008 | | Additions | | Reductions | | | Share Balance at
October 31, 2009 | | Dividend
Income | | Realized
Gain/(Loss) | | | Value at
October 31, 2009 |
1-800 Flowers.com, Inc. | | 157,800 | | 9,800 | | (65,100 | ) | | 102,500 | | $ | — | | $ | (326,805 | ) | | $ | 393,600 |
Emcore Corp. (a) | | 195,400 | | — | | (195,400 | ) | | — | | | — | | | (1,769,014 | ) | | | — |
Kopin Corp. | | 372,500 | | 23,300 | | (395,800 | ) | | — | | | — | | | (49,015 | ) | | | — |
Landec Corp. | | 57,800 | | — | | (13,100 | ) | | 44,700 | | | — | | | (30,157 | ) | | | 292,338 |
LionBridge Technologies, Inc. | | 266,100 | | 16,700 | | (282,800 | ) | | — | | | — | | | (355,263 | ) | | | — |
Salix Pharmaceuticals, Ltd. | | 170,100 | | 7,600 | | (161,800 | ) | | 15,900 | | | — | | | 106,626 | | | | 292,401 |
Symyx Technologies | | 61,900 | | 26,400 | | (88,300 | ) | | — | | | — | | | (104,423 | ) | | | — |
Ultratech, Inc. | | 95,700 | | 26,800 | | (28,000 | ) | | 94,500 | | | — | | | (46,818 | ) | | | 1,220,940 |
| | | | | | | | | | | | | | | | | | | |
| | | | | | | | | | | $ | — | | $ | (2,574,869 | ) | | $ | 2,199,279 |
| | | | | | | | | | | | | | | | | | | |
| | | | | | | | | | | | | | | | | | | |
The Tocqueville Gold Fund | | | | | | | | | | | | | | | |
Issuer Name | | Share Balance at
Nov. 1, 2008 | | Additions | | Reductions | | | Share Balance at
October 31, 2009 | | Dividend
Income | | Realized
Gain/(Loss) | | | Value at
October 31, 2009 |
Comaplex Minerals Corp. | | 2,839,000 | | — | | — | | | 2,839,000 | | $ | — | | $ | — | | | | 16,398,271 |
Euro Resources S.A. (a) | | 2,900,000 | | — | | (2,900,000 | ) | | — | | | — | | | 128,386 | | | | — |
Gold Resource Corp. | | 2,300,797 | | — | | — | | | 2,300,797 | | | — | | | — | | | | 18,268,328 |
International Tower Hill Mines Ltd. | | — | | 1,993,100 | | — | | | 1,993,100 | | | — | | | — | | | | 9,301,932 |
Nevada Copper Corp. | | 1,000,000 | | — | | (1,000,000 | ) | | — | | | — | | | (2,244,973 | ) | | | — |
Orezone Gold Corp. (b) | | — | | 2,145,463 | | — | | | 2,145,463 | | | — | | | — | | | | 1,169,838 |
Orezone Resources, Inc. (a)(b) | | 17,163,700 | | — | | (17,163,700 | ) | | — | | | — | | | — | | | | — |
Silverstone Resources Corp. (a)(c) | | 6,635,000 | | — | | (6,635,000 | ) | | — | | | — | | | — | | | | — |
Troy Resources Nl (a) | | 2,911,624 | | — | | (2,911,624 | ) | | — | | | — | | | (3,946,639 | ) | | | — |
Troy Resources Nl Npv (a) | | 100,000 | | 27,500 | | (127,500 | ) | | — | | | — | | | (210,697 | ) | | | — |
Yukon-Nevada Gold Corp. | | 8,350,000 | | — | | (8,350,000 | ) | | — | | | — | | | (12,996,339 | ) | | | — |
Yukon-Nevada Gold Corp. Warrants | | 4,175,000 | | — | | — | | | 4,175,000 | | | — | | | — | | | | — |
| | | | | | | | | | | | | | | | | | | |
| | | | | | | | | | | $ | — | | $ | (19,270,262 | ) | | $ | 45,138,369 |
| | | | | | | | | | | | | | | | | | | |
| (a) | Security is no longer an affiliated company at October 31, 2009. |
| (b) | On February 25, 2009, IAMGOLD acquired Orezone Resources, Inc. As part of the reorganization, shareholders received 0.125 shares of Orezone Gold Corp. for each share of Orezone Resources, Inc. |
| (c) | On May 26, 2009, Silver Wheaton Corp. acquired Silverstone Resources Corp. Shareholders of Silverstone Resources Corp. received 0.185 shares of Silver Wheaton Corp. for each share held. |
The Tocqueville Trust
Report of Independent Registered Public Accounting Firm
To the Shareholders and Board of Trustees of
The Tocqueville Trust:
We have audited the accompanying statements of assets and liabilities of The Tocqueville Trust, including The Tocqueville Fund, The Tocqueville Small Cap Fund, The Tocqueville International Value Fund, The Tocqueville Gold Fund, The Delafield Fund, and The Select Fund (collectively, the “Funds”), including the schedules of investments as of October 31, 2009 and the related statements of operations for the year then ended, changes in net assets for each of the two years in the period then ended, and the financial highlights for each of the four years in the period then ended for The Tocqueville Fund, The Tocqueville Small Cap Fund, The Tocqueville International Value Fund, and The Tocqueville Gold Fund; the related statements of operations, changes in net assets and financial highlights for the period from January 1, 2009 to October 31, 2009 for The Delafield Fund and The Select Fund. These financial statements and financial highlights are the responsibility of the Funds’ management. Our responsibility is to express an opinion on these financial statements and financial highlights based on our audits. The financial highlights presented for the year ended October 31, 2005 for The Tocqueville Fund, The Tocqueville Small Cap Fund, The Tocqueville International Value Fund, and The Tocqueville Gold Fund were audited by other auditors. Those auditors expressed an unqualified opinion on those financial highlights in their report dated December 23, 2005. The statement of changes in net assets for the year ended December 31, 2008 and the financial highlights for the four years in the period then ended for The Delafield Fund and the statement of changes in net assets and financial highlights for the period from September 29, 2008 (inception) to December 31, 2008 for the Delafield Select Fund were audited by other auditors. Those auditors expressed unqualified opinions on those statements and financial highlights in their reports dated February 24, 2009.
We conducted our audits in accordance with the standards of the Public Company Accounting Oversight Board (United States). Those standards require that we plan and perform the audit to obtain reasonable assurance about whether the financial statements and financial highlights are free of material misstatement. The Funds are not required to have, nor were we engaged to perform, an audit of their internal control over financial reporting. Our audits included consideration of internal control over financial reporting as a basis for designing audit procedures that are appropriate in the circumstances, but not for the purpose of expressing an opinion on the effectiveness of the Funds’ internal control over financial reporting. Accordingly, we express no such opinion. An audit also includes examining, on a test basis, evidence supporting the amounts and disclosures in the financial statements and financial highlights, assessing the accounting principles used and significant estimates made by management, as well as evaluating the overall financial statement presentation. Our procedures included confirmation of securities owned as of October 31, 2009, by correspondence with the custodian and brokers. We believe that our audits provide a reasonable basis for our opinion.
In our opinion, the financial statements and financial highlights referred to above present fairly, in all material respects, the financial position of each of the aforementioned Funds of The Tocqueville Trust as of October 31, 2009, and the results of operations for the year then ended, the changes in net assets for each of the two years in the period then ended, and the financial highlights for each of the four years in the period then ended for The Tocqueville Fund, The Tocqueville Small Cap Fund, The Tocqueville International Value Fund, and The Tocqueville Gold Fund; the results of operations, changes in net assets and financial highlights for the period from January 1, 2009 to October 31, 2009 for The Delafield Fund and The Select Fund, in conformity with accounting principles generally accepted in the United States of America.
/s/ GRANT THORNTON LLP
Chicago, Illinois
December 30, 2009
ADDITIONAL INFORMATION (UNAUDITED)
1. ADDITIONAL DISCLOSURE REGARDING FUND TRUSTEES AND OFFICERS
Independent Trustees
| | | | | | | | | | |
Name, Age and Address | | Position(s) Held with the Trust | | Term of Office and Length of Time Served (1) | | Principal Occupation During Past Five Years | | # of
Portfolios
in Fund
Complex
Overseen
By Trustee | | Other Directorships Held by Trustee |
| | | | | |
Larry M. Senderhauf (60) 40 W. 57th St., 19th Floor New York, NY 10019 | | Trustee | | 1998 to December 2008* | | Retired. Administrator and Trustee, LMS 33 Profit and Pension Sharing Fund from 1983 to present. | | 6 | | Advisory Board Member, Legacy Bank, Scottsdale, Arizona |
| | | | | |
Guy A. Main (73) 40 W. 57th St., 19th Floor New York, NY 10019 | | Trustee | | Indefinite Term, Since 2000 | | Retired. Formerly, Executive Vice President, Amwest Insurance Group, Inc. from April 1996 to January 2001; Chairman, President and Chief Executive Officer, Condor Services Inc. from April 1989 to April 1996. | | 6 | | Director, Amwest Insurance Group, Inc. from April 1996 to January 2001; Chairman, Association of California Insurance Companies from January 1996 to January 1998; Director, Condor Services Inc. from April 1989 to April 1996. |
| | | | | |
Charles W. Caulkins (53) 40 W. 57th St., 19th Floor New York, NY 10019 | | Trustee | | Indefinite Term, Since 2003 | | Marketing Manager, L.R. Global Partners from January 2008 to present; President, Arbor Marketing, Inc. from October 1994 to December 2007. | | 6 | | Director, Phoenix House from January 2001 to 2007; Director, Bridges to Community from July 2002 to 2006. |
| | | | | |
James W. Gerard (48) 40 W. 57th St., 19th Floor New York, NY 10019 | | Trustee | | Indefinite Term, Since 2001 | | Principal, Juniper Capital Group, LLC (formerly known as Argus Advisors International, LLC), from August 2003 to present; Managing Director, The Chart Group from January 2001 to present; Managing Principal, Ironbound Partners from October 1998 to December 2000. | | 6 | | Director, American Overseas Memorial Day Association, 1988 to present; Trustee, Salisbury School, 2005 to present; Director and Treasurer ASPCA, 1988 to 2008; |
Independent Trustees
| | | | | | | | | | |
Name, Age and Address | | Position(s) Held with the Trust | | Term of Office and Length of Time Served (1) | | Principal Occupation During Past Five Years | | # of
Portfolios
in Fund
Complex
Overseen
By Trustee | | Other Directorships Held by Trustee |
| | | | | |
William F. Indoe (66) 40 W. 57th St., 19th Floor New York, NY 10019 | | Trustee | | Indefinite Term, Since 2006 | | Partner, Sullivan & Cromwell LLP (attorneys-at-law). | | 6 | | Director, Rho Capital Partners, Inc. |
| | | | | |
William J. Nolan III (62) 40 W. 57th St., 19th Floor New York, NY 10019 | | Trustee | | Indefinite Term, Since 2006 | | Retired, Executive Vice President & Treasurer PaineWebber Inc. 1997-2001. | | 6 | | Trustee, Adirondock Museum, Blue Mt. Lake, NY 1996 to present (Treasurer, 2000 to present). |
Interested Trustees (and Officers)**
| | | | | | | | | | |
Name, Age and Address | | Position(s) Held with the Trust | | Term of Office and Length of Time Served (1) | | Principal Occupation During Past Five Years | | # of
Portfolios
in Fund
Complex
Overseen
By Trustee | | Other Directorships Held by Trustee |
| | | | | |
Francois D. Sicart (66) 40 W. 57th St., 19th Floor New York, NY 10019 | | Chairman and Trustee | | Indefinite Term, Since 1987 | | Chairman, Tocqueville Management Corporation, the General Partner of Tocqueville Asset Management L.P. and Tocqueville Securities, L.P. from January 1990 to present; Chairman and Founder, Tocqueville Asset Management Corp. from December 1985 to January 1990; Vice Chairman of Tucker Anthony Management Corporation from 1981 to October 1986; Vice President (formerly general partner) among other positions with Tucker Anthony, Inc. from 1969 to January 1990. | | 6 | | Chairman and Director, Tocqueville Management Corporation, the General Partner of Tocqueville Asset Management L.P. and Tocqueville Securities, L.P. from January 1990 to present.
|
Interested Trustees (and Officers)**
| | | | | | | | | | |
Name, Age and Address | | Position(s) Held with the Trust | | Term of Office and Length of Time Served (1) | | Principal Occupation During Past Five Years | | # of
Portfolios
in Fund
Complex
Overseen
By Trustee | | Other Directorships Held by Trustee |
| | | | | |
Robert W. Kleinschmidt (60) 40 W. 57th St., 19th Floor New York, NY 10019 | | President and Trustee | | Indefinite Term, Since 1991 | | President, Chief Investment Officer and Director, Tocqueville Management Corporation, the General Partner of Tocqueville Asset Management L.P. and Tocqueville Securities, L.P. from January 1994 to present; and Managing Director from July 1991 to January 1994; Partner, David J. Greene & Co. from May 1978 to July 1991. | | 6 | | President and Director, Tocqueville Management Corporation, the General Partner of Tocqueville Asset Management L.P. and Tocqueville Securities, L.P.
|
| | | | | |
Steven J. Tyrrell (37) 40 W. 57th St., 19th Floor New York, NY 10019
| | Secretary and Treasurer | | Indefinite Term, Since 2006 | | Director of Operations, Tocqueville Asset Management L.P. from 2004 to present; Assistant Director of Operations, 2002-2004; Assistant Operations Manager, Lepercq, de Neuflize & Co., Inc. 1998-2002 | | N/A | | N/A
|
| | | | | |
Elizabeth Bosco (61) 40 W. 57th St., 19th Floor
New York, NY 10019 | | Anti- Money Laundering Compliance Officer
| | Indefinite Term, Since 2009 | | Chief Compliance Officer (January 2009-present), Tocqueville Securities L.P.; Compliance Officer (January 1997-January 2009), Tocqueville Securities L.P. and Tocqueville Asset Management, L.P. | | N/A | | N/A
|
| * | Mr. Senderhauf resigned from the Board of Trustees on December 11, 2008. |
| ** | “Interested person” of the Trust is defined in the 1940 Act. Mr. Sicart and Mr. Kleinschmidt are considered “interested persons” because of their affiliation with the Adviser. |
Interested Trustees (and Officers)*
| | | | | | | | | | |
Name, Age and Address | | Position(s) Held with the Trust | | Term of Office and Length of Time Served (1) | | Principal Occupation During Past Five Years | | # of
Portfolios
in Fund
Complex
Overseen
By Trustee | | Other Directorships Held by Trustee |
| | | | | |
Thomas Pandick (62) 40 W. 57th St., 19th Floor New York, NY 10019
| | Chief Compliance Officer | | Indefinite Term, Since 2004 | | Chief Compliance Officer (October 2004-present), Tocqueville Asset Management L.P.; General Counsel (January-October 2004), Tocqueville Asset Management L.P.; Vice President, Kirkbride Asset Management, Inc. (2000-2004) | | N/A | | N/A
|
| 1 | Each Trustee will hold office for an indefinite term until the earliest of (i) the next meeting of shareholders, if any, called for the purpose of considering the election or re-election of such Trustee and until the election and qualification of his or her successor, if any, elected at such meeting, or (ii) the date a Trustee resigns or retires, or a Trustee is removed by the Board of Trustees or shareholders, in accordance with the Trust’s By-Laws, as amended, and Agreement and Declaration of Trust, as amended. Each officer will hold office for an indefinite term until the date he or she resigns or retires or until his or her successor is elected and qualified. |
2. INVESTMENT ADVISORY AGREEMENT DISCLOSURE
In determining whether to approve the continuance of the Investment Advisory Agreements (and initial approval of the Investment Advisory Agreements for The Delafield Fund and The Select Fund) and the Administration Agreement, the Trustees, including the Independent Trustees, considered the following information:
1) The nature, extent and quality of services provided by the Adviser.
The Trustees reviewed in detail the nature and extent of the services provided (or to be provided for The Delafield Fund and The Select Fund (the “New Funds”) by the Adviser under the terms of the Investment Advisory Agreements and the quality of those services provided to The Tocqueville Fund, The Tocqueville Small Cap Fund, The Tocqueville International Value Fund and The Tocqueville Gold Fund (the “Existing Funds” and together with the New Funds, the “Funds”) over the past year. The Trustees noted that the services include: managing the investment and reinvestment of the Funds’ assets; supervising and managing all aspects of the Funds’ operations; and providing the Board on a regular basis with financial reports and analyses on the Funds’ operations and the operations of comparable investment companies. The Trustees also observed that the Adviser provides various administrative services to the Funds pursuant to the terms of a separate Administration Agreement and considered the nature, extent and quality of services provided under that agreement as well. The Trustees evaluated these factors based on their direct experience with the Adviser and in consultation with counsel. The Trustees concluded that the nature and extent of the services provided (or to be provided for the New Funds) under the Investment Advisory Agreements were reasonable and appropriate in relation to the
advisory fee, that the level of services provided by the Adviser to the Existing Funds had not diminished over the past year and that the quality of services continues to be high. The Trustees observed that they expected the same level of service for the New Funds. The Trustees reviewed the personnel responsible for providing advisory services to the Funds and concluded, based on their experience and interaction with the Adviser, that (i) the Adviser was able to retain quality portfolio managers and other personnel; (ii) the Adviser exhibited a high level of diligence and attention to detail in carrying out its advisory responsibilities under the Investment Advisory Agreements for the Existing Funds; (iii)��the Adviser was responsive to requests of the Trustees; and (iv) the Adviser had kept the Trustees apprised of developments relating to the Funds and the industry in general. The Trustees also focused on the Adviser’s reputation and long-standing relationship with the Trust. The Trustees also noted the high quality of services provided by the Adviser under the Administration Agreement.
In connection with its assessment of the performance of the Adviser, the Trustees reviewed the Adviser’s financial statements and considered the Adviser’s financial condition and whether it has the resources necessary to continue to carry out its obligations under the Investment Advisory Agreements and the Administration Agreement. The Trustees concluded that the Adviser has the financial resources necessary to continue to perform its obligations under the Investment Advisory Agreements and the Administration Agreement and to continue to provide the high quality services that it has provided to the Funds to date.
2) The performance of the Funds and the Adviser.
The Trustees reviewed the investment performance of the Funds, both on an absolute basis and as compared to a peer group for each respective Fund for the one-year, three-year, five-year and ten-year periods, as applicable, ended July 31, 2009. The peer groups were comprised of other funds that had similar investment objectives and sales load structures, as determined by Lipper: The Lipper Multi-Cap Value Funds peer group, with average net assets between $240 million and $440 million, for The Tocqueville Fund; the Lipper Small-Cap Core Funds peer group, with average net assets between $40 million and $60 million, for The Tocqueville Small Cap Fund; the Lipper International Small/Mid Cap Value Funds peer group, with no discretion to average net assets, for The Tocqueville International Value Fund; the Lipper Gold Oriented Funds peer group, with average net assets between $700 million and $1,800 million, for The Tocqueville Gold Fund; the Lipper Mid-Cap Value Funds peer group, with average net assets between $350 million and $900 million, for The Delafield Fund; and the Lipper Mid-Cap Value Funds, with average net assets between $11 million and $16 million, for The Select Fund (the “Performance Peer Groups”). The Trustees considered that the performance information for the The Delafield Fund and The Select Fund reflects the performance information of their respective predecessor funds, which had different investment advisers, but the Trustees considered this information since the New Funds have substantially the same portfolio management team.
The Trustees also compared each Fund’s investment performance against its benchmark market indices: the S&P 500 Index for The Tocqueville Fund; the Russell 2000 Index for The Tocqueville Small Cap Fund; the Morgan Stanley EAFE Index for The Tocqueville International Value Fund; the S&P 500 Index and the Philadelphia Stock Exchange Gold & Silver Index for The Tocqueville Gold Fund; the Russell 2000 Index and the Russell 2500 Value Index for The Delafield Fund; and the Russell 2500 Index for The Select Fund (the “Indices”) for the most recent fiscal quarter ended July 31, 2009 for the Existing Funds, and for the one-year, three-year, five-year and ten-year periods ended July 31, 2009 for all the Funds. The Trustees considered the above information as helpful in their assessment of whether the Adviser was
obtaining for the Existing Funds’ shareholders the performance that was available in the marketplace given each Fund’s investment objectives, policies, strategies, limitations and restrictions. The Trustees also considered the performance information of the New Funds’ predecessor funds given that the New Funds have substantially the same portfolio management team. The Trustees concluded that the performance of the Funds against their respective Performance Peer Groups was satisfactory. In particular, the Trustees noted that The Tocqueville Fund had performed well as compared to its Index for all periods and outperformed or performed in line with the median of its Performance Peer Group for all periods. The Trustees noted that with respect to The Tocqueville Small Cap Fund that despite underperforming its Index and the median of its Performance Peer Group for most periods, the Fund had outperformed its Index and performed in line with the median of its Performance Peer Group for its ten-year period. The Trustees further noted that The Tocqueville International Value Fund was generally in line with its Index and median of its Peer Group except the one-year period, where it outperformed its Index. The Trustees noted that The Tocqueville Gold Fund outperformed its Indices for all periods and generally was in line with the median of its Performance Peer Group. The Trustees noted that the respective predecessor funds for The Delafield Fund and The Select Fund outperformed their respective Indices and the median of their Performance Peer Groups for all periods.
3) The cost of the advisory services and the profits to the Adviser from the relationship with the Trust.
In connection with the Trustee’s consideration of the level of the advisory fees, the Trustees considered a number of factors. The Trustees compared the level of the advisory fees for each Fund against the advisory fees charged by funds in their respective Performance Peer Groups and a larger universe of funds that included their Performance Peer Groups: the Lipper Multi-Cap Value Funds peer group, with average net assets between $100 million and $700 million, for The Tocqueville Fund; the Lipper Small-Cap Core Funds peer group, with average net assets between $0 and $100 million, for The Tocqueville Small Cap Fund; the Lipper International Small/Mid Cap Value and Growth Funds peer group, with no discretion to average net assets, for The Tocqueville International Value Fund; the Lipper Gold Oriented Funds peer group, with no discretion to average net assets, for The Tocqueville Gold Fund; the Lipper Multi-Cap Value Funds peer group, with average net assets between $300 million and $900 million, for The Delafield Fund; and the Lipper Multi-Cap Value Funds peer group, with average net assets between $10 million and $30 million, for The Select Fund (the “Expense Peer Groups” and together with the Performance Peer Groups, the “Peer Groups”). The Adviser noted that it does not advise or sub-advise other funds with an investment policy similar to the Funds’ or other types of accounts, such as institutional and pension accounts, with similar investment policies to the Funds’. The Trustees considered comparative total fund expenses of the Funds and the Peer Groups. The Trustees used this comparative fee information and total expense data as a guide to help assess the reasonableness of each Fund’s advisory fee, although they acknowledged that it was difficult to make precise comparisons with other funds since the exact nature of services provided under each Peer Group fund agreement is often not apparent. The Trustees also viewed the Peer Group fee information as a whole as useful in assessing whether the Adviser was providing services at a cost that was competitive with other, similar funds.
The Trustees noted that the contract rate advisory fee and administration fee for each of the Funds were reasonable, despite being above average for the Funds, when compared to their respective Expense Peer Groups. The Board further observed that the total expense ratios of the Funds were also reasonable. The Board noted that the total expense ratio for The Tocqueville Fund, The Tocqueville Gold Fund and The Delafield Fund were above average, when compared to their respective Expense Peer Groups and that the total expense ratio for The Tocqueville Small Cap Fund, The Tocqueville
International Value Fund and The Select Fund were below average, when compared to their respective Expense Peer Groups. The Board also noted that The Tocqueville Fund operates pursuant to an Expense Limitation Agreement whereby the Adviser has agreed to waive a portion of its fee necessary to limit the Fund’s total operating expenses to the level set forth in the Fund’s prospectus.
The Trustees also considered the profitability to the Adviser and its affiliate arising out of its relationship with the Trust. In this regard, the Trustees reviewed profitability data relating to the Adviser for the year October 31, 2008. The Trustees considered revenues received by the Adviser under the Investment Advisory Agreements and the Administration Agreement as well as revenues received by the Adviser’s affiliate, the Distributor, under the 12b-1 plans and Related Agreements and commissions received for effecting portfolio transactions. The Trustees also received and reviewed the Adviser’s financial statements and the Adviser provided an oral update on its profitability numbers since October 31, 2008. The Trustees concluded that the profitability of the Funds to the Adviser was not excessive.
4) The extent to which economies of scale will be realized as the Funds grow and whether fee levels reflect those economies of scale.
With respect to the Trustees’ consideration of economies of scale, the Trustees discussed with the Adviser whether economies of scale would be realized by it in its management of a Fund at higher asset levels. The Trustees also reviewed the Peer Group data to assess whether the Peer Group funds had advisory fee breakpoints and, if so, at what asset levels. The Trustees noted that the Funds, except for The Select Fund, currently have advisory fee breakpoints and that they were satisfied that the current breakpoints were appropriate when compared with each Fund’s respective Peer Group. The Trustees considered that breakpoints are not necessary at this time for The Select Fund, given the small size of the Delafield Select Fund, which is expected to be reorganized into The Select Fund. In the event there was significant asset growth in the future in a Fund, the Trustee’s determined to reassess whether the advisory fees, including the current breakpoint structure, appropriately took into account any economies of scale that had been realized as a result of that growth.
5) Other Factors.
The Trustees also discussed the Adviser’s practices regarding the selection and compensation of brokers and dealers that execute portfolio transactions for the Funds and the brokers’ and dealers’ provision of brokerage and research services to the Adviser. The Trustees further discussed the potential benefits the Adviser derived from the Funds’ soft dollar arrangements, whereby brokers provide research to the Funds or the Adviser in return for allocating fund brokerage, and other investment data concerning soft dollars. The Board also discussed the Adviser’s use of an affiliated broker to effect portfolio transactions, noting that in addition to paying a competitive rate on commissions, the Adviser believed the Funds received better execution on trades.
Based on a consideration of all these factors in their totality, the Trustees, including all of the Independent Trustees, determined that the Funds’ advisory fees and administration fees were fair and reasonable with respect to the quality of services that the Adviser provides and in light of the other factors described above that the Trustees deemed relevant. The Trustees based their decision on evaluations of all these factors as a whole and did not consider any one factor as all-important or controlling. The Independent Trustees were also assisted by the advice of independent counsel in making this determination.
3. PROXY VOTING POLICIES AND PROCEDURES
A description of the policies and procedures that The Tocqueville Trust uses to determine how to vote proxies relating to portfolio securities is available without charge upon request by calling 1-800-355-7307. Information regarding how The Tocqueville Trust voted proxies relating to portfolio securities during the most recent 12-month period ended June 30 is available by calling 1-800-355-7307 and it is also available on the SEC’s web site at http://www.sec.gov.
4. SHAREHOLDER REPORTS AND QUARTERLY PORTFOLIO DISCLOSURE
The Tocqueville Trust is required to file its complete schedule of portfolio holdings with the SEC for its first and third fiscal quarters on Form N-Q. The Trust’s Form N-Q will be available without charge, upon request on the SEC’s website (http://www.sec.gov) and may be available by calling 1-800-697-3863. You can also obtain copies of Form N-Q by (i) visiting the SEC’s Public Reference Room in Washington, DC (information on the operation of the Public Reference Room may be obtained by calling 1-202-551-8090); (ii) sending your request and a duplicating fee to the SEC’s Public Reference Room, Washington, DC 20549-1520; or (iii) sending your request electronically to publicinfosec.gov. Quarterly portfolio holdings are also available on the website of The Tocqueville Funds, www.tocquevillefunds.com.
5. SHAREHOLDER NOTIFICATION OF FEDERAL TAX STATUS
For the fiscal period ended October 31, 2009, certain dividends paid by the Funds may be subject to a maximum tax rate of 15%, as provided for by the Jobs and Growth Tax Relief Reconciliation Act of 2003. The percentage of dividends declared from ordinary income designated as qualified dividend income was as follows:
| | | |
Tocqueville Fund | | 100.00 | % |
Small Cap Fund | | 100.00 | % |
International Value Fund | | 100.00 | % |
Gold Fund | | 0.00 | % |
The Delafield Fund | | 100.00 | % |
The Select Fund | | 100.00 | % |
For corporate shareholders, the percent of ordinary income distributions qualifying for the corporate dividends received deduction for the fiscal period ended October 31, 2009 was as follows:
| | | |
Tocqueville Fund | | 100.00 | % |
Small Cap Fund | | 100.00 | % |
International Value Fund | | 1.43 | % |
Gold Fund | | 0.00 | % |
The Delafield Fund | | 100.00 | % |
The Select Fund | | 100.00 | % |
For the period ended October 31, 2009, the funds designate the following percent of ordinary distributions paid as interest-related dividends under the Internal Revenue Code Section 871(k)(1)(c):
| | | |
Tocqueville Fund | | 5.43 | % |
Small Cap Fund | | 0.00 | % |
International Value Fund | | 3.40 | % |
Gold Fund | | 0.00 | % |
The Delafield Fund | | 15.54 | % |
The Select Fund | | 0.00 | % |
The Percent age of taxable ordinary income distributions that are designated as short-term capital gain distributions under Internal Revenue Section 871(k)(2)(C) for each Fund were as follows.
| | | |
Tocqueville Fund | | 0.00 | % |
Small Cap Fund | | 0.00 | % |
International Value Fund | | 0.00 | % |
Gold Fund | | 0.00 | % |
The Delafield Fund | | 0.00 | % |
The Select Fund | | 100.00 | % |
6. FOREIGN TAX CREDIT
For the year ended October 31, 2009, the Tocqueville International Value Fund earned foreign source income and paid foreign taxes which they intend to pass through to their shareholders pursuant to Section 853 of the Internal Revenue Code as follows:
| | | | | | |
Country | | Gross Dividend
Per Share | | Taxes Withheld
Per Share |
Australia | | $ | 0.0039 | | $ | 0.0000 |
Belgium | | | 0.0147 | | | 0.0022 |
Brazil | | | 0.0088 | | | 0.0011 |
Finland | | | 0.0070 | | | 0.0011 |
France | | | 0.0786 | | | 0.0113 |
Germany | | | 0.0059 | | | 0.0016 |
Indonesia | | | -0.0020 | | | -0.0003 |
Ireland | | | 0.0098 | | | 0.0000 |
Japan | | | 0.0438 | | | 0.0032 |
Jersey | | | 0.0056 | | | 0.0000 |
Korea | | | 0.0011 | | | 0.0000 |
Luxembourg | | | 0.0031 | | | 0.0005 |
Mexico | | | 0.0022 | | | 0.0000 |
| | | | | | |
Country | | Gross Dividend
Per Share | | Taxes Withheld
Per Share |
Netherlands | | $ | 0.0039 | | $ | 0.0006 |
Netherlands Antilles | | | 0.0031 | | | 0.0000 |
Singapore | | | 0.0048 | | | 0.0000 |
Spain | | | 0.0017 | | | 0.0001 |
Switzerland | | | 0.0114 | | | 0.0014 |
Taiwan | | | -0.0004 | | | -0.0001 |
Thailand | | | 0.0068 | | | 0.0007 |
United Kingdom | | | 0.0147 | | | 0.0000 |
| | | | | | |
| | $ | 0.2284 | | $ | 0.0235 |
| | | | | | |
The Tocqueville Trust
Notice of Privacy Policy & Practices
The Tocqueville Trust recognizes and respects the privacy expectations of our customers1. We are providing this notice to you so that you will know what kinds of information we collect about our customers and the circumstances in which that information may be disclosed to third parties who are not affiliated with the Tocqueville Trust.
We collect nonpublic personal information about our customers from the following sources:
| | Ÿ | | Account Applications and other forms, which may include a customer’s name, address, social security number and information about a customer’s investment goals and risk tolerance; |
| | Ÿ | | Account History, including information about the transactions and balances in a customer’s accounts; and |
| | Ÿ | | Correspondence, written, telephone or electronic between a customer and the Tocqueville Trust or service providers to the Tocqueville Trust. |
We may disclose all of the information described above to certain third parties who are not affiliated with the Tocqueville Trust as permitted by law—for example sharing information with companies who maintain or service customer accounts for the Tocqueville Trust is permitted and is essential for us to provide shareholders with necessary or useful services with respect of their accounts. We may also share information with companies that perform marketing and or mailing services on our behalf or to other financial institutions with whom we have joint agreements.
We maintain, and require service providers to the Tocqueville Trust to maintain policies designed to assure only appropriate access to, and use of information about our customers. When information about the Tocqueville Trust’s customers is disclosed to nonaffiliated third parties, we require that the third party maintain the confidentiality of the information disclosed and limit the use of information by the third party solely to the purposes for which the information is disclosed or as otherwise permitted by law.
We will adhere to the policies and practices described in this notice regardless of whether you are a current or former shareholder of the Tocqueville Trust.
| 1 | For purposes of this notice, the terms “customer” or “customers” includes both shareholders of the Tocqueville Trust and individuals who provide nonpublic personal information to the Tocqueville Trust, but do not invest in shares of the Tocqueville Trust. |
Investment Adviser
Tocqueville Asset Management L.P.
40 W. 57th St., 19th Floor
New York, NY 10019
(212) 698-0800
www.tocqueville.com
Distributor
Tocqueville Securities, L.P.
40 W. 57th St., 19th Floor
New York, NY 10019
(212) 698-0800
Shareholders’ Servicing and Transfer Agent
U.S. Bancorp Fund Services, LLC
P.O. Box 701
Milwaukee, WI 53201-0701
(800) 697-3863
Custodian
U.S. Bank, N.A.
Custody Operations
1555 River Center Drive, Suite 302
Milwaukee, WI 53212
Board of Trustees
François D. Sicart—Chairman
Charles W. Caulkins
James W. Gerard
William F. Indoe
Robert W. Kleinschmidt
Guy A. Main
William J. Nolan III

Tocqueville Funds
c/o US Bancorp Fund Services, LLC
P.O. Box 701
Milwaukee, WI 53201-0701
www.tocquevillefunds.com
TQRPANNU 09
The registrant has adopted a code of ethics that applies to the registrant’s Principal Executive Officer and Principal Financial Officer. The registrant has not made any amendments to its code of ethics during the period covered by this report. The registrant has not granted any waivers from any provisions of the code of ethics during the period covered by this report.
Incorporated by reference to the registrant’s January 8, 2009 N-CSR filing.
| Item 3. | Audit Committee Financial Expert. |
The registrant’s Board of Trustees has determined that there are two audit committee financial experts serving on its audit committee, James Gerard and Guy Main, who are “independent” as defined in Item 3 of Form N-CSR.
| Item 4. | Principal Accountant Fees and Services. |
| | | | | | |
| | | FYE 10/31/09 | | FYE 10/31/08 |
4(a) Audit Fees | | $ | 130,000 | | $ | 90,000 |
4(b) Audit Related Fees | | $ | 0 | | $ | 0 |
4(c) Tax Fees | | $ | 19,000 | | $ | 12,000 |
4(d) All Other Fees | | $ | 0 | | $ | 0 |
“Tax Services” refer to professional services rendered by the principal accountant for tax compliance, tax advice, and tax planning.
4(e)(1) The registrant’s audit committee is required to pre-approve (i) all audit and non-audit services performed by the independent registered public accounting firm (“accountants”) for the registrant and (ii) any non-audit services performed by the accountants for the registrant’s investment adviser and control persons of the adviser that provide ongoing services to the registrant (“Service Affiliates”) if the services relate directly to the operations and financial reporting of the registrant. The audit committee has not presently established any pre-approval policies and procedures that permit the pre-approval of the above services other than by the full audit committee. Certain de minimis exceptions are allowed for non-audit services in accordance with Rule 2-01(c)(7)(i)(C) of Regulation S-X as set forth in the registrant’s audit committee charter.
4(e)(2) None.
4(f) Not applicable.
4(g) The amount of non-audit fees that were billed by the registrant’s accountant for services rendered to (i) the registrant, and (ii) the registrant’s investment adviser and any control person of the adviser that provides ongoing services to the registrant for the fiscal year ended October 31, 2009 were $19,000 and $0, respectively. The amount of non-audit fees that were billed by the registrant’s
accountant for services rendered to (i) the registrant, and (ii) the registrant’s investment adviser and any control person of the adviser that provides ongoing services to the registrant for the fiscal year ended October 31, 2008 were $12,000 and $0, respectively.
4(h) Not applicable.
| Item 5. | Audit Committee of Listed Registrants. |
Not applicable to registrants who are not listed issuers (as defined in Rule 10A-3 under the Securities Exchange Act of 1934).
| Item 6. | Schedule of Investments. |
Schedule of Investments is included as part of the report to shareholders filed under Item 1 of this Form.
| Item 7. | Disclosure of Proxy Voting Policies and Procedures for Closed-End Management Investment Companies. |
Not applicable to open-end investment companies.
| Item 8. | Portfolio Managers of Closed-End Management Investment Companies. |
Not applicable to open-end investment companies.
| Item 9. | Purchases of Equity Securities by Closed-End Management Investment Company and Affiliated Purchasers. |
Not applicable to open-end investment companies.
| Item 10. | Submission of Matters to a Vote of Security Holders. |
There were no material changes to the procedures by which shareholders may recommend nominees to the registrant’s Board of Trustees that were implemented after the registrant last provided disclosure in response to the requirements of Item 407(c)(2)(iv) of Regulation S-K (as required by Item 22(b)(15) of Schedule 14A), or this Item 10.
| Item 11. | Controls and Procedures. |
| (a) | The registrant’s Principal Executive Officer and Principal Financial Officer have evaluated the design and operation of the registrant’s disclosure controls and procedures within 90 days of the filing and have concluded that the registrant’s disclosure controls and procedures were effective in ensuring that information required to be disclosed by the registrant in this Form N-CSR was recorded, processed, summarized and reported on a timely basis. |
2
| (b) | There were no changes in the registrant’s internal controls over financial reporting that occurred during the period covered by this report that have materially affected, or are reasonably likely to materially affect, the registrant’s internal control over financial reporting. |
| (a) | (1) Any code of ethics or amendment thereto, that is subject of the disclosure required by Item 2, to the extent that the registrant intends to satisfy Item 2 requirements through filing an exhibit. Incorporated by reference to the Registrant’s January 8, 2009 N-CSR filing. |
| | (2) | Certifications pursuant to Section 302 of the Sarbanes-Oxley Act of 2002. Filed herewith. |
| | (3) | Not applicable to open-end investment companies. |
| (b) | Certifications of Principal Executive Officer and Principal Financial Officer, under Section 906 of the Sarbanes-Oxley Act of 2002 and 18 U.S.C. § 1350. Filed herewith. |
3
SIGNATURES
Pursuant to the requirements of the Securities Exchange Act of 1934 and the Investment Company Act of 1940, the registrant has duly caused this report to be signed on its behalf by the undersigned, thereunto duly authorized.
| | | | |
| (Registrant) The Tocqueville Trust |
| |
| By (Signature and Title)* | | /s/ ROBERT W. KLEINSCHMIDT |
| | | | Robert W. Kleinschmidt, President |
| |
| Date | | 1/8/2010 |
Pursuant to the requirements of the Securities Exchange Act of 1934 and the Investment Company Act of 1940, this report has been signed below by the following persons on behalf of the registrant and in the capacities and on the dates indicated.
| | | | |
| By (Signature and Title)* | | /s/ ROBERT W. KLEINSCHMIDT |
| | | | Robert W. Kleinschmidt, President |
| |
| Date | | 1/8/2010 |
| |
| By (Signature and Title)* | | /s/ STEVEN J. TYRRELL |
| | | | Steven J. Tyrrell, Treasurer |
| |
| Date | | 1/11/2010 |
* Print the name and title of each signing officer under his or her signature.
4