UNITED STATES
SECURITIES AND EXCHANGE COMMISSION
Washington, D.C. 20549
FORM N-CSR
CERTIFIED SHAREHOLDER REPORT OF REGISTERED
MANAGEMENT INVESTMENT COMPANIES
Investment Company Act file number 811-4840
The Tocqueville Trust
(Exact name of registrant as specified in charter)
The Tocqueville Trust
40 W. 57th Street, 19th Floor
New York, NY 10019
(Address of principal executive offices) (Zip code)
Robert W. Kleinschmidt, President
The Tocqueville Trust
40 W. 57th Street, 19th Floor
New York, NY 10019
(Name and address of agent for service)
212-698-0800
Registrant’s telephone number, including area code
Date of fiscal year end: October 31
Date of reporting period: October 31, 2011
Item 1. Report to Stockholders.
ANNUAL REPORT
October 31, 2011
The Tocqueville Trust
Mutual Funds
The Tocqueville Fund
The Tocqueville Opportunity Fund
The Tocqueville International Value Fund
The Tocqueville Gold Fund
The Delafield Fund
The Tocqueville Select Fund

This report is not authorized for distribution to prospective investors unless preceded or accompanied by a currently effective prospectus of The Tocqueville Trust. Please call 1-800-697-FUND (3863) for a free prospectus. Read it carefully before you invest.
You are invited to visit our website @ www.tocquevillefunds.com
Dear Fellow Shareholder,
The most striking aspect of the world stock markets’ behavior in the last couple of years is that they have held up so well in the face of almost unprecedented financial volatility and widespread predictions of “the end of the world as we know it.”
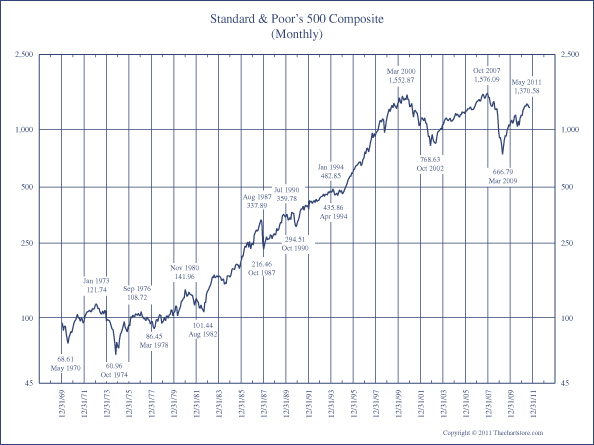
Between 1982 and 1999, a long bull market in stocks had allowed the S&P 500 Index, for example, to multiply by a factor of 15 in 17 years. This spectacular advance was only interrupted by the stock market crash of 1987 and the recession induced by the Kuwait-Iraq war of 1990 – two events that, however important, now look almost insignificant on a long-term chart such as the one above.
That long stock-market advance, reinforced by monetary policies that seemed to suppress the risk of investing, naturally led to speculative excesses, such as the technology and Internet bubble that peaked in early 2000, and the housing and subprime lending frenzy, which peaked in 2007. Both of these bubbles, once pierced, deflated violently and with worldwide consequences.
Yet, despite the traders’ increasingly volatile response to economic and political developments such as the apparently intractable problems of many sovereign debtors, the potential breakdown of the Euro, and the recent downgrading of the credit rating of the United States, the markets generally remain closer to their peaks of 2000 and 2007 than to their bottoms of 2002 and 2009.
Today, some of the more dire predictions for the financial system remain a possibility. But the main difference from three years ago is that they are largely incorporated into the expectations of investors and economic participants, whereas then, they came as a shock to a fairly complacent world.
Another difference has to do with valuations. As measured by price/earnings ratios, for example, stocks had reached record-high valuations at the peak of the high-tech/Internet bubble in early 2000. In 2007 they still were around sixteen.
Currently, most indices are selling at valuations that are much closer to their historical averages. This may not be low enough to qualify as the prelude to a major, secular bull market globally, but it leaves some room for positive investment returns over the next decade. In the case of a number of individual securities, sectors, or even countries, single-digit price/earnings ratios already discount an unexciting future and may be in a position to react very positively to the first inkling of good news.
In our modern media-governed world, we tend to overlook the real news that hides behind the obvious headlines. Currently, amid daily announcements of near-sovereign defaults, credit-rating downgrades, and apparently intractable systemic faults, the real debate has started on the fundamental economic and financial contradictions of the system we have lived under for six decades and more. The arguments remain far apart, and real progress may have to await the passage of elections in some major countries. But the debate, after being carefully avoided by successive governments and assemblies, is now taking shape. That is the real news behind the headlines.
In other words, the long period of adjustment that normally follows major financial crises is unfolding slowly but, one could say, more or less normally.
Respectfully,

François Sicart
Chairman
The Tocqueville Fund
Dear Fellow Shareholder,
The fiscal year ended October 31, 2011, was a volatile and difficult one for markets, investors, and shareholders of mutual funds. It was also a difficult year for investment managers, particularly for bottom-up stock pickers like Tocqueville. Big macroeconomic issues dominated the news and the markets, rendering careful security analysis and value discipline relatively moot. We do not believe this trend will continue indefinitely, but while it lasts, volatility and unprecedented correlation will continue to be center stage, while fundamental research will be waiting in the wings.
Although we fully expect that careful stock selection and in-depth research will reassert their importance in the investment process in the months and years ahead, we do not discount the enormous macro challenges the Western economies face. The welfare state as we have come to know it has been living on borrowed time and borrowed money for decades, and both the time and the money are getting short. The demographic shift of the baby boomers from payers for to consumers of the entitlement programs established by the Western democracies, long predicted but long ignored, is upon us. The first baby boomers, born in 1946, turned 65 in 2011, reaching the threshold age for some of the more-expensive entitlement programs. Wave after wave of new eligible recipients will flood these programs in the years ahead, even as the pool of workers available to pay for the programs shrinks or stagnates. This is not a problem that can be solved by higher levels of taxation, though surely that will be tried. The well-publicized problems of Greece and, indeed, the entire Eurozone, are but a manifestation of this dynamic.
For some time we have been both expecting and dreading these developments, the eventual denouement of which, we believe, will be much higher levels of inflation coupled with correspondingly higher bond yields, as governments are forced to print money to honor their obligations. The higher yields demanded by fixed-income investors will have a devastating effect on over-leveraged governments, particularly our own, which has benefited for so many years from depressed rates, and the foolish decision to fund long-term debts with short-term paper.
In times even as difficult and transformational as these, we remain optimistic about the prospects of well-chosen corporate equities. Indeed, equities strike us as one of the few asset classes, and the only really large one, that may protect investors from the ravages of a resurgent inflation and a deflating sovereign-debt market. Well-positioned companies, with solid finances and significant market shares, should be able to navigate these difficult times and prosper from them as weaker and more leveraged competitors struggle. Our research effort continues to be focused on finding companies that fit our criteria of quality, financial integrity, sound management, and good value. These troubled and transitional times have created a lot of values, and shares of many good-quality companies are out of favor and inexpensive. We own a fair number of them in our portfolio. For instance, AFLAC, an insurer, is out of favor and trading well below our target price because of concerns related to its exposure to European sovereign debt and lingering problems from the earthquake in Japan, where it does the majority of its business. Weyerhaeuser, a timber REIT, is trading below its intrinsic value due to lingering weakness in the U.S. housing market, despite its attractive yield and natural position as a long-term inflation hedge. Another example is Microsoft. It is unappreciated because of what we view as the misperception that it is a lumbering giant, out of step with industry trends toward cloud computing and tablet devices. In fact, it is highly cash generative, with what we believe to be a better competitive position than most realize and with several new products in the pipeline, as well as a propensity for returning cash to shareholders through both ordinary and special dividends.
Performance of the Tocqueville Fund for fiscal 2011 was a tepid 4.77%. This compares with 8.09% for the S&P 500 Index. While we are hardly thrilled with these results, neither are we overly disappointed. In tempestuous times like these, it is extremely important to avoid taking on large risks in order to seek outsized returns. (The recent collapse of MF Global, run by former New Jersey Senator and Governor Jon Corzine, is a case in point.) It is far more important to keep capital intact while waiting for the storm clouds to blow over. If temporary and modest underperformance in pursuit of risk control is the result, so be it.
As one of the largest individual shareholders of the Tocqueville Fund, as well as its portfolio manager, let me take this opportunity to thank you for your continued support of the fund and our efforts to preserve and grow your capital.
Respectfully,

Robert W. Kleinschmidt
Portfolio Manager
The Tocqueville Fund
(Unaudited)
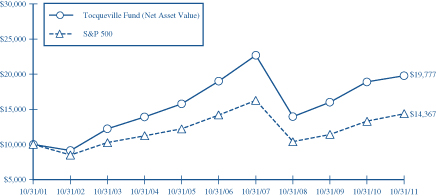
This chart assumes an initial gross investment of $10,000 made on 10/31/01. Returns shown do not reflect the deduction of taxes that a shareholder would pay on fund distributions or the redemption of fund shares. Performance reflects fee waivers in effect. In the absence of fee waivers, total return would be reduced. Returns shown include the reinvestment of all dividends and other distributions. Past performance is not predictive of future performance. Investment return and principal value will fluctuate so that your shares, when redeemed, may be worth more or less than their original cost. The Fund imposes a 2% redemption fee on shares held for 90 days or less.
The Standard & Poor’s 500 Stock Index (S&P 500) is a capital-weighted index, representing the aggregate market value of the common equity of 500 stocks primarily traded on the New York Stock Exchange. Returns assume the reinvestment of all dividends.
AVERAGE ANNUAL RATE OF RETURN (%)
FOR PERIODS ENDED OCTOBER 31, 2011
| | | | | | | | | | | | | | | | |
| | | 1 Year | | | 3 Year | | | 5 Year | | | 10 Year | |
Tocqueville Fund | | | 4.77% | | | | 12.36% | | | | 0.84% | | | | 7.06% | |
Standard & Poor’s 500 Stock Index | | | 8.09% | | | | 11.41% | | | | 0.25% | | | | 3.69% | |
The Tocqueville Opportunity Fund
Dear Fellow Shareholder,
We are pleased to provide this review of the Tocqueville Opportunity Fund’s investment performance and strategy for the fiscal year ended October 31, 2011. On October 12, 2010, the Fund’s name was changed to the Opportunity Fund (formerly the Small Cap Value Fund), and our new investment strategy became effective. During the fiscal year, Fund performance was +13.33%, which outperformed the Russell 2500 Growth Index and the Russell 2000 Index, which increased 11.91% and 6.71% respectively.
The Fund’s investment strategy is focused primarily on small and mid-capitalization issues that may fall within classifications of either growth or value stocks. The portfolio approach does not restrict the Fund from investing in large-capitalization issues, and the Fund has maintained holdings in certain issues as market capitalizations have risen above the SMID capitalization range at the time of initial purchase. Investment selection is driven by analysis of the persistency and level of growth rates, valuation, stability, and capital returns on investment. Our efforts to identify and remain invested in companies include meeting and speaking with the corporate management. Although the Fund’s holdings are predominantly invested in issues that have demonstrated steady and superior growth in earnings, we have also invested in numerous cyclical and economy-sensitive issues, including holdings in the energy, industrial, and material sectors. The investment selection criteria are geared to identify investments under a valuation discipline that we deem “growth at a reasonable price,” not “growth at any price.” While the selection approach is tilted toward historical growth and valuation parameters, the Fund holds, and will continue to invest in, new issues and certain industries where operating histories are short and the business model is not yet fully developed – our investments in certain Internet and healthcare issues fall into this realm.
The Fund seeks to invest for strategic purposes in companies that are positioned to gain market share in expanding industries and markets. We seek to identify companies on the cusp of innovation that can introduce new products and services, or approaches that can revolutionize business processes and consumer models of behavior. Standards that are critical to our evaluation of companies include the following:
| | • | | A differentiated and disruptive technology or solution, product, or service; |
| | • | | An innovative R&D platform; |
| | • | | A leadership position in a growth market; |
| | • | | A strong reinvestment rate in a high return on capital business; |
| | • | | Strong barriers to competition and an identifiable competitive advantage; |
| | • | | High inside ownership and a dedicated, visionary management. |
Over the past fiscal year, the Fund has significantly increased its diversification. We believe that diversification has provided two substantial benefits: 1) reduced risk to competitive threats or operating risks for any single issue; and 2) a disciplined method to initiate investments in new, emerging investment opportunities, which can be increased if there is evidence of success. We deem such investments as pawns in the game of chess, where a surviving pawn may advance from the weakest to the most powerful piece on the chessboard. “Pawns” represent a significant investment strategy of the Fund. Generally they have averaged less than 0.50% position weights in the Fund; but over the past fiscal year, the Fund has nearly doubled its commitment to investments in pawns to more than one-third of the Fund. The Fund’s investments in IPOs and recent issues generally fall within the “pawn” classification. In addition to providing diversification and investment benefits, pawns also have increased the Fund’s exposure to merger-and-acquisition activity. Over the past fiscal year, fourteen of the Fund’s holdings were taken over; all were originally pawns.
The technology, consumer discretionary, staples, and healthcare sectors constituted the Fund’s predominant investments at the fiscal year’s end: 22.3%, 24.8%, 6.1%, and 14.2% respectively. Over the past year the most significant increases in sector commitments were to the materials (+7.0%) and technology (+4.5%) sectors; and we reduced investment in the healthcare (-5.5%) sector. Although the energy sector weighting was reduced on an overall basis (-2.5%), the Fund had four takeovers of energy holdings: Brigham Exploration, Complete Production Services, Pride International, and Petrohawk Energy. While the level of commitment to the sector was reduced, we expanded the number
of issues in the sector by nearly 50 percent. Overall performance attribution during the year was led by investments in the consumer discretionary, staples, and energy sectors. Investments and an initial overweighting in the healthcare sector impacted performance most negatively.
Strong investment performance attribution was generated by a number of issues that nearly doubled during the period, including Deckers Outdoor, Herbalife, Alexion Pharmaceuticals, and Tempur-Pedic International. The Fund’s leading contributors were Tractor Supply, Lululemon Athletica, and TIBCO Software. Several investments in the healthcare sector proved disappointing and negatively impacted the Fund. Human Genomes Sciences and Dendreon both won FDA approvals of significant new therapies in lupus and prostate cancer, respectively, but subsequent product revenues missed expectations. The Fund also suffered a hit from an investment in a biotechnology company with a promising drug in cystic fibrosis that failed to meet a primary endpoint of efficacy. The company was later bought by Merck.
The past fiscal year has proven to be a very unsettled period during which business and investor confidence has been undermined. The Japan tsunami, the Arab Spring, and dysfunctional politics in Washington and Europe have pressured valuations and capital flows in global equity markets. Overarching issues of economic uncertainty and political inertia have worn down investor sentiment – policy uncertainty and its ensuing destructive economic yoke have been unanticipated and downright unimaginable. Against an eroded, unpredictable macroeconomic background, however, a majority of our company investments have consistently managed to exceed both revenue and earnings expectations on a quarterly basis. We cannot forecast global-policy outcomes with confidence, but we can invest in and monitor the performance of companies experiencing rapid growth even as the headline news is disconcerting.
Moreover, our confidence in the bright outlook for many of our companies has been boosted by a slew of “Merger Mondays” where investments in the Fund have been taken over! These events provide confirmation of our investment approach, and support the competitive advantage and significant undervaluation of companies in which we have invested. Unlike many of today’s in-and-out traders, corporate buyers are seizing the opportunity to establish a strategic and long-term advantage. Sideways, back-and-forth, and volatile daily price moves are evidence of anxious markets, but have provided frequent opportunities for the Fund to accumulate and increase its investments in the best-positioned companies at discounts to our future expected values for such investments. We remain optimistic that this period of uncertainty will pass and equity-market valuations will normalize, and we believe that investors who maintain longer-term investment horizons will be well rewarded for their perseverance and constancy.
As portfolio manager of the Tocqueville Opportunity Fund, I appreciate your confidence in our ongoing efforts and I look forward to the coming year.
Sincerely,

Thomas R. Vandeventer
Portfolio Manager
The Tocqueville Opportunity Fund
(Unaudited)
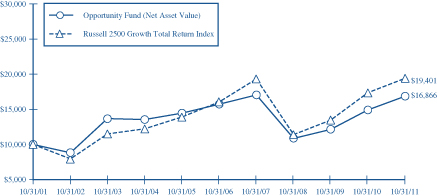
This chart assumes an initial gross investment of $10,000 made on 10/31/01. On July 1, 2010, a new portfolio management team assumed management of The Tocqueville Small Cap Fund and the Fund’s name and investment strategy changed as of October 12, 2010 (See Footnote 1 to the Financial Statements). Returns shown do not reflect the deduction of taxes that a shareholder would pay on fund distributions or the redemption of fund shares. Performance reflects fee waivers in effect. In the absence of fee waivers, total return would be reduced. Returns shown include the reinvestment of all dividends and other distributions. Past performance is not predictive of future performance. Investment return and principal value will fluctuate so that your shares, when redeemed, may be worth more or less than their original cost. The Fund imposes a 2% redemption fee on shares held for 90 days or less.
The Russell 2500 Growth Total Return Index is an unmanaged index that measures the performance of the small to mid-cap growth segment of the U.S. equity universe. It includes those Russell 2500 companies with higher price-to-book ratios and higher forcasted growth values. Returns assume the reinvestment of all dividends.
AVERAGE ANNUAL RATE OF RETURN (%)
FOR PERIODS ENDED OCTOBER 31, 2011
| | | | | | | | | | | | | | | | |
| | | 1 Year | | | 3 Year | | | 5 Year | | | 10 Year | |
Tocqueville Opportunity Fund | | | 13.33% | | | | 15.76% | | | | 1.43% | | | | 5.37% | |
Russell 2500 Growth Total Return Index | | | 11.91% | | | | 19.43% | | | | 3.88% | | | | 6.85% | |
The Tocqueville International Value Fund
Dear Fellow Shareholder,
For the fiscal year ended October 31, 2011, the Tocqueville International Value Fund’s total U.S. dollar return was a loss of 0.47%. In the same period, the Morgan Stanley EAFE Index, the index against which we are most often compared, had a total U.S. dollar loss of 3.64%. For the 10-year period ended October 31, 2011, the Fund’s total U.S. dollar cumulative return was 180.06%. In the same period, the Morgan Stanley EAFE Index had a total U.S. dollar cumulative return of 82.31%.
Performance data quoted represents past performance and does not guarantee future results. Investment returns and principal value will fluctuate, and when sold, may be worth more or less than their original cost. Performance current to the most recent month-end may be lower or higher than the performance quoted and can be obtained by calling 866-697-3863. The Fund imposes a 2% redemption fee on shares held less than 90 days. Performance data does not reflect the redemption fee. If it had, returns would be reduced.
During the first half of the 2011 fiscal year, global equity markets generally advanced in spite of geopolitical turmoil in the Middle East, fiscal problems in southern Europe, and natural disaster in Japan. Developed markets in the U.S., Europe, and Japan rose as corporate earnings continued to improve, interest rates remained low, and liquidity was abundant. Equity markets declined during the second half of the year, and sharply during the third quarter, as investors marked down valuations to reflect reduced economic growth expectations and the macroeconomic risks associated with the sovereign-debt crisis in Europe, the deficit problem in the U.S., and the seeming inability of governments to respond decisively and effectively to either.
Over the course of the fiscal year, on a total-return basis, the European BE 500 Index declined by 6.53% in local-currency terms, the Japanese Nikkei 225 Index declined by 0.44% in local-currency terms, and the MSCI Asia Pacific ex Japan Index declined by 8.83%. The Euro declined slightly against the U.S. dollar as shaky bank and sovereign finances undercut confidence in the currency, while the Japanese Yen strengthened slightly. Elsewhere, the currencies of commodity producers like Australia and Norway and perceived safe havens, like Switzerland and Uruguay, increased against the U.S. dollar, while currencies of indebted nations in Eastern Europe and elsewhere flagged.
The CRB RIND Index of commodities followed the movement of economic growth expectations and equity markets during the course of the year, finishing modestly higher. Gold continued its ascent as money-printing undercut the credibility of paper currencies and tepid economic performance in developed economies raised the specter of competitive devaluations. In equities, the greatest gains were experienced in commodity-dependent frontier markets like Mongolia and distressed emerging markets like Venezuela and Pakistan. In terms of sectors, gainers included traditionally defensive sectors like tobacco products, healthcare, and food, as well as computer software, while financials, steel, transportation, and leisure shares experienced substantial losses.
Our Fund produced a small loss during the fiscal year, which in light of our focus on positive absolute returns represents a disappointing outcome. We did, however, finish well ahead of the Fund’s benchmark and managed to avoid a meaningful loss. This was largely due to security selection in the areas of consumer staples, industrials, technology, and materials, as well as a low exposure to financials and companies with significant financial leverage. Standout contributors to profits during the year included UK managed-services concern Interserve, Japanese tire maker Bridgestone, Dutch consumer-products company Unilever, Mexican beverage producer FEMSA, supplementary-insurance provider Aflac, Japanese conglomerate Hitachi, Hong Kong electric utility Power Assets Holdings, and Belgian chemical producer Solvay. Our losses were concentrated in economically sensitive shares in Europe, which declined late in the year in the context of rising concerns about sovereign debt. These included Spain-based global hotel group Melia Holdings, French industrial-cable producer Nexans, German steel distributor Kloeckner, German truck-component maker SAF-Holland, and German compact-equipment maker Wacker Neuson. Losses in German shares were magnified by the fact that Germany is one of the few markets in Europe where short-selling is allowed, making it the preferred market for hedge funds making negative bets.
Our baseline view going into the 2011 fiscal year was that the global economy would continue along a path of uneven recovery, with developed markets working against the tide of deleveraging and emerging economies helping at the margin. We believed there was bound to be a soft patch during 2011, with several emerging economies having raised interest rates in late 2010 to combat inflation and stimulus packages in the U.S. and elsewhere coming to an end. But the lack of decisive and effective government response to the sovereign-debt issue in Europe, coupled with the fiscal debate
in the U.S., produced uncertainty. This in turn caused businesses and consumers to slow their spending, intensifying the slowdown in Europe and impeding a recovery in the U.S.
Currently it would appear that Europe is working its way toward a solution that will stave off a disorderly dissolution of the Eurozone, but not one that will encourage growth. And with an election year in the U.S., good economic decision-making will remain hostage to politics. In short, we do not expect much of an economic tailwind from the developed Western economies during the coming year. On the other hand, several emerging markets like China and Brazil that had raised rates last year have become more accommodative and growth-focused, with inflation apparently subdued.
During the fiscal year we exited our positions in Hong Kong electric utility Power Assets, Belgian chemical producer Solvay, Dutch animal-feed concern Nutreco, Belgian wire-cord producer Bekaert, French water utility Veolia Environnement, Brazilian iron-ore producer Vale, and global oil-services provider Schlumberger, as they reached our valuation objectives. We sold Telekom Indonesia, where our investment thesis was undercut by a change in competitive conditions that produced pricing and margin pressures; and Brazilian producer Petrobras, whose massive capital-expenditure plans could cause the company to consume cash for the foreseeable future. Our contrarian approach led us to look for ideas in discrete areas of the global economy that were out of favor at times during the year. In the wake of the tsunami in Japan, we capitalized on the market decline by adding to several existing positions there, including Takata, Hitachi, Bridgestone, Makita, and Canon. We responded to the sharp sell-off in Europe in late summer by focusing our research efforts on identifying economically sensitive businesses whose valuations were attractive, even assuming a recessionary economic scenario. As a result, we took a position in Akzo Nobel, a leading global producer of chemicals for paint and coatings, that has consistently earned returns in excess of its cost of capital over the last decade and was trading at a low multiple of free cash flow.
We also sought out companies whose shares had declined in sympathy with the decline in European bank shares, but that were not subject to the same balance-sheet risks. As a result, we took a position in Japanese supplemental-insurance provider Aflac, which had declined due to its relatively small exposure to European sovereign debt in its bond portfolio and was trading at a modest multiple of earnings.
During the fiscal year we also took new positions in Spanish information-technology concern Indra Systems, which was depressed due to concerns about its government contracts but had a high free cash-flow yield and growth opportunities in Latin America; in French pharmaceutical concern Ipsen, which traded at a discount to the net present value of cash flows from its existing portfolio of drugs and gave no value to its pipeline of new products; in Australian facilities-management and food-services concern Spotless Group, which has a strong market position, attractive cash-flow characteristics, and is restructuring certain underperforming assets to improve financial performance; in Belgian telecom services provider Mobistar, which has a double-digit free cash-flow yield and would represent an accretive acquisition for controlling shareholder France Telecom; in French wire and cable producer Nexans, which has implemented a meaningful cost-reduction program to enhance margins; in Japanese optics maker Hoya, a net cash company with leading positions in niche electronics markets and a growing healthcare business; and in Halfords, a UK auto retail/repair-shop chain, which generates ample free cash flow and strong returns on capital despite cyclically depressed consumer confidence.
With macro considerations dominating investor psychology over the last half year, market and security price movements have been highly correlated. We expect that as volatility subsides the importance of security selection will reassert itself.
We continue to employ our investment discipline, seeking to discover fundamentally attractive companies that are out of favor and undervalued, and to provide our shareholders with above-average returns with below-average risk over the course of an economic cycle.
Respectfully,
|
|
 |
|
James Hunt |
| Portfolio Manager |
The Tocqueville International Value Fund
(Unaudited)
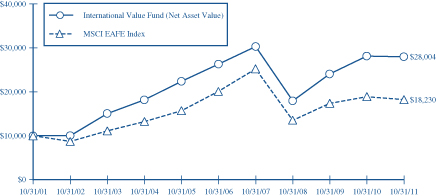
This chart assumes an initial gross investment of $10,000 made on 10/31/01. Returns shown do not reflect the deduction of taxes that a shareholder would pay on fund distributions or the redemption of fund shares. Performance reflects fee waivers in effect. In the absence of fee waivers, total return would be reduced. Returns shown include the reinvestment of all dividends and other distributions. Past performance is not predictive of future performance. Investment return and principal value will fluctuate so that your shares, when redeemed, may be worth more or less than their original cost. The Fund imposes a 2% redemption fee on shares held 90 days or less.
The MSCI EAFE Index is an unmanaged market-capitalization-weighted index composed of companies representative of the market structure of 20 Developed Market Countries in Europe, Australia, Asia and the Far East.
AVERAGE ANNUAL RATE OF RETURN (%)
FOR PERIODS ENDED OCTOBER 31, 2011
| | | | | | | | | | | | | | | | |
| | | 1 Year | | | 3 Year | | | 5 Year | | | 10 Year | |
Tocqueville International Value Fund | | | -0.47% | | | | 15.99% | | | | 1.26% | | | | 10.85% | |
MSCI EAFE Index | | | -3.64% | | | | 10.42% | | | | -1.95% | | | | 6.19% | |
The Tocqueville Gold Fund
Dear Fellow Shareholder,
During fiscal 2011 ending October 31, the Tocqueville Gold Fund returned 1.84%, compared to -0.05% for the PHLX Gold/Silver Sector Index (XAU) and 8.09% for the S&P 500 Index. The price of gold rose 26.15% during the period. The Fund’s position in physical gold is 6.3% of its net assets; the balance is in shares of companies whose principal business is gold production, mine development, or exploration. The Fund also holds equities of silver-mining companies.
Events over the past fiscal year have served as a tumultuous setting for gold’s record advance to slightly above $1900/oz. before settling back to close the Fund’s fiscal year at $1715/oz. Mounting geopolitical tensions in the Mideast and the natural disaster in Japan earlier in the year added yet more reasons to the list of why to own gold, as investors sought the refuge of a safe-haven asset. However, the ongoing financial crises on both sides of the Atlantic underpin gold’s continued prominence as an investment and the rational justification for ownership. In the U.S., failures to raise the debt ceiling and enact reasonable reductions to spending have kept the government on credit watch by the credit agencies. Across the Atlantic, what used to be a problem confined to the PIIGS seems to have spread to the core of the Eurozone.
Most investors expect economic growth to provide some resolution of these problems. However, the prospects for growth are undermined by the contentious political climate. Failing growth, the market seems to hope that another round of quantitative easing will provide the impetus to alleviate global catastrophe. The consequence of such an action would be inflationary, which should continue to drive the bid for gold.
Although gold has continued to perform well in this environment, gold-mining equities have not kept pace with bullion. Relative to mining equities, investment in the metal is straightforward and clear cut. There is no business risk. Investing in the business of mining gold demands more complex and specialized analysis. Given the flight to safety in capital markets, it is not surprising that investors flock first to bullion.
However, given the historically wide divergence in performance between the two, we believe gold-mining equities represent an extraordinary opportunity to participate in the bullish secular trend for gold. Mining shares can provide potential sources of additional return compared to bullion: dividends, addition of further ounces through exploration, and the prospect for accretive M&A. As the market normalizes the advances in the bullion price to some sustainable level, it will come to realize that the sector is producing strong and sustainable free cash flows, thus providing tremendous flexibility for the sector to increase its dividend payout ratios.
The Fund outperformed its benchmark for the fiscal year. The top contributors over this period included physical gold, Scorpio Mining, and Richfield Ventures, which appreciated 26.2%, 137.4%, and 243.7% respectively. Disappointments included Agnico-Eagle Mines, ATAC Resources, and Romarco Minerals, which declined by 43.7%, 46.1%, and 63.2% respectively. Despite the market volatility, we continue to stick by our strategy of investing in promising exploration companies that we see adding value through resource discovery and potentially M&A. During the period, Richfield Ventures was acquired by a producing company looking to bolster its development pipeline. It is merely one example over the years that continues to affirm our investment strategy. However, in recognition of the valuation gap between bullion and equities and the expectation of increased dividends in the sector, we have selectively increased positions of producing companies to the portfolio as well.
We believe that the current environment represents an excellent entry point for those investors who wish to protect capital from the monetary debasement that, in our view, almost certainly lies ahead.
Sincerely,

John C. Hathaway
Portfolio Manager
The Tocqueville Gold Fund
(Unaudited)
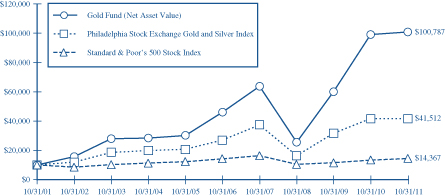
This chart assumes an initial gross investment of $10,000 made on 10/31/01. Returns shown do not reflect the deduction of taxes that a shareholder would pay on fund distributions or the redemption of fund shares. Performance reflects fee waivers in effect. In the absence of fee waivers, total return would be reduced. Returns shown include the reinvestment of all dividends and other distributions. Past performance is not predictive of future performance. Investment return and principal value will fluctuate so that your shares, when redeemed, may be worth more or less than their original cost. The Fund imposes a 2% redemption fee on shares held 90 days or less.
In 2003, 2006, 2009, and 2010 the performance of The Tocqueville Gold Fund was achieved during a period of unusually favorable market conditions. Such performance may not be sustainable.
The Philadelphia Stock Exchange Gold and Silver Index is an unmanaged capitalization-weighted index which includes the leading companies involved in the mining of gold and silver. Returns include the reinvestment of all dividends.
The Standard & Poor’s 500 Stock Index (S&P 500) is a capital-weighted index, representing the aggregate market value of the common equity of 500 stocks primarily traded on the New York Stock Exchange. Returns include the reinvestment of all dividends.
AVERAGE ANNUAL RATE OF RETURN (%)
FOR PERIODS ENDED OCTOBER 31, 2011
| | | | | | | | | | | | | | | | |
| | | 1 Year | | | 3 Year | | | 5 Year | | | 10 Year | |
Tocqueville Gold Fund | | | 1.84% | | | | 58.18% | | | | 16.99% | | | | 25.99% | |
Philadelphia Stock Exchange Gold and Silver Index | | | -0.05% | | | | 36.72% | | | | 9.03% | | | | 15.29% | |
Standard & Poor’s 500 Stock Index | | | 8.09% | | | | 11.41% | | | | 0.25% | | | | 3.69% | |
The Delafield Fund
Dear Fellow Shareholder,
For the 12 months ended October 31, 2011, the Fund’s net asset value increased 2.10%. This compares to an 8.09% increase in the Standard & Poor’s 500 Index (“S&P 500”) and an increase of 6.71% for the more-representative Russell 2000 Index (“Russell 2000”), both on a total-return basis. The Fund’s net asset value as of October 31, 2011, was $27.21 per share. The net asset value amounted to $1,262,875,778, of which 85.49% was invested in equities and the balance held in cash reserves.
The stock market and the Fund began the year with substantial increases driven by investors’ optimistic outlooks for continued global economic recovery. However, while second-quarter market and Fund returns remained solid, both foreign and domestic political and economic environments had already begun to destabilize. This was particularly apparent in the Middle East, where Egyptian President Hosni Mubarak was forced to resign amidst massive and sometimes violent public protests; and in Japan, where a massive earthquake caused a tsunami and a nuclear disaster in the northeast portion of the country. Through the first six months ending April 30, 2011, the Fund was up 20.49% versus total returns of 16.36% and 23.73% for the S&P 500 and Russell 2000, respectively.
In the second half of the fiscal year, a continuous barrage of bad news influenced investors, including stubbornly high unemployment in the U.S., the domestic budget deficit impasse, the still-unresolved sovereign-debt crisis in Europe, and slowing global economic growth, including in China. Additionally, market volatility was enormous during the second half of the year, which also likely contributed to selling pressure. The Fund declined 15.26% during the final six months of the fiscal year, while the S&P 500 lost 7.11% and the Russell 2000 declined 13.76%, both on a total-return basis.
Our performance in this generally challenging and volatile year was disappointing. Some of our largest holdings reported poor results, while others seemed to suffer disproportionately from the market’s volatility. In the second half of the fiscal year, cyclical stocks were especially hard-hit, which impacted the Fund negatively.
El Paso Corporation and Lubrizol Corporation were acquired at substantial premiums during the fiscal year, making them the largest contributors to our performance. Ferro Corporation, Checkpoint Systems, Inc., and Owens-Illinois, Inc. were the largest detractors, negatively impacting our return by more than 900 basis points in total. Ferro was penalized for its exposure to the solar industry and European end markets. Checkpoint’s earnings results were weak and its exposure to retail end markets was a negative, and shares in Owens-Illinois fell sharply on the heels of disappointing earnings and outlook.
We cannot forecast near-term market movements with any degree of certainty. Indeed, the market continues to experience unpredictable daily fluctuations, with fear and uncertainty driving stocks down one day, followed by optimistic and opportunistic buying the next. Therefore, we remain focused on what we do control, which is the strategy we employ to protect your capital and to enhance its growth. While this fiscal year has been a frustrating one, our approach has resulted in above-average returns for many years. We will seek to provide attractive returns in the years ahead by continuing to employ this logical approach:
1. We search for companies that we believe are selling at prices that seem modest in relationship to the company’s intrinsic value.
2. We meet with management, visit plants, talk to the company’s competitors, consider the makeup of the board of directors, and make a judgment as to whether we wish to be in business with the management. In other words, we try to understand the business of the companies in which we invest and the individuals who direct each company’s future.
3. We search for companies in which something may change that will alter that company’s future for the better. This can range from a change in the management or management’s attitude toward how they run the business, to a change in control, to a change in business opportunity, to a change in the dynamics of a company’s cash flow and its use.
4. If we perform our analysis correctly, the value-added we bring to you is an earlier and better understanding of the companies in our portfolio than that possessed by other investors. Then, if the companies begin to improve, their earnings should increase and they should be valued at a higher price-earnings multiple.
5. We have never worried about the profits that we did not make. We worry much more about what we might lose. We believe that stock selection is much more relevant to successful investing than total commitment to equities. In the volatile markets that have developed over the last 15 to 20 years, we have come to believe that the long-term investor’s best hedge against volatility is to have cash with which to invest in companies when prices seem unduly depressed.
We have lived through such extraordinary declining markets in the past. Our experience has been that such intense selling usually leads to attractive investment opportunities and, once the panic subsides, to significant gains. In fact, our focus on special-situations investments uncovered a number of opportunities in more cyclical stocks during the second half of the fiscal period, and we began to use excess cash to take advantage of the market dislocation by adding new names to the portfolio and buying more of our favorite holdings.
We are pleased with the current positioning of the portfolio. In general, our investments have solid balance sheets, strong free cash-flow generation, and excellent management teams; and we believe that they are well positioned to prosper and increase in value over time.
Sincerely,
| | |
 | |  |
| |
| J. Dennis Delafield | | Vincent Sellecchia |
| Portfolio Manager | | Portfolio Manager |
The Delafield Fund
(Unaudited)
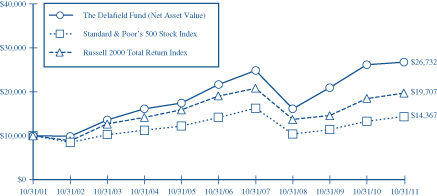
This chart assumes an initial gross investment of $10,000 made on 10/31/01. Since the Delafield Fund did not commence operations until 9/28/09, returns prior to that date are those of the Predecessor Fund. The Delafield Fund assumed the net asset value and performance history of the Predecessor Fund (See Footnote 1 to the Financial Statements). Returns shown does not reflect the deduction of taxes that a shareholder would pay on fund distributions or the redemption of fund shares. Performance reflects fee wiaviers in effect. In the absence of fee waivers, total return would be reduced. Returns shown include the reinvestment of all dividends and other distributions. Past performance is not predictive of future performance. Investment return and principal value will fluctuate so that your shares, when redeemed, may be worth more or less than their original cost. The Fund imposes a 2% redemption fee on shares held 90 days or less.
The Standard & Poor’s 500 Stock Index (S&P 500) is a capital-weighted index, representing the aggregate market value of the common equity of 500 stocks primarily traded on the New York Stock Exchange. Returns include the reinvestment of all dividends.
The Russell 2000 Total Return Index is an unmanaged index that measures the performance of the 2,000 smallest companies in the Russell 3000 Index, which represent approximately 8% of the total market capitalization of the Russell 3000 Index. Returns include the reinvestment of all dividends.
AVERAGE ANNUAL RATE OF RETURN (%)
FOR PERIODS ENDED OCTOBER 31, 2011
| | | | | | | | | | | | | | | | |
| | | 1 Year | | | 3 Year | | | 5 Year | | | 10 Year | |
The Delafield Fund | | | 2.10% | | | | 18.28% | | | | 4.31% | | | | 10.33% | |
Standard & Poor’s 500 Stock Index | | | 8.09% | | | | 11.41% | | | | 0.25% | | | | 3.69% | |
Russell 2000 Total Return Index | | | 6.71% | | | | 12.87% | | | | 0.68% | | | | 7.02% | |
The Tocqueville Select Fund
Dear Fellow Shareholder,
For the 12 months ended October 31, 2011, the Fund’s net asset value decreased 0.10% versus an increase of 7.97% for the Russell 2500 Index (“Russell 2500”) and 6.71% for the Russell 2000 Index (“Russell 2000”), each on a total-return basis. The Fund’s net asset value as of October 31, 2011, was $11.06 per share. The net asset value amounted to $71,553,741, of which 87.81% was invested in equities and the balance held in cash reserve.
The stock market and the Fund began the year with substantial increases driven by investors’ optimistic outlooks for continued global economic recovery. However, while second-quarter market and Fund returns remained solid, both foreign and domestic political and economic environments had already begun to destabilize. This was particularly apparent in the Middle East, where Egyptian President Hosni Mubarak was forced to resign amidst massive and sometimes violent public protests, and in Japan, where a massive earthquake caused a tsunami and a nuclear disaster in the northeast portion of the country. Through the first six months ending April 30, 2011, the Fund was up 19.69% versus total returns of 23.71% and 23.73% for the Russell 2500 and Russell 2000, respectively.
In the second half of the fiscal year, a continuous barrage of bad news influenced investors, including stubbornly high unemployment in the U.S., the domestic budget deficit impasse, the still-unresolved sovereign-debt crisis in Europe, and slowing global economic growth, including in China. Additionally, market volatility was enormous during the second half of the year, which also likely contributed to selling pressure. The Fund declined 16.53% during the final six months of the fiscal year, while the Russell 2500 lost 12.72% and the Russell 2000 declined 13.76%, both on a total-return basis.
Monotype Imaging Holdings returned more than 32% during the fiscal year as investors drove the shares higher on strong earnings; it was the largest positive contributor to performance. In contrast, our Checkpoint Systems, Inc. and Ferro Corporation holdings suffered substantial declines and were the largest detractors. Checkpoint’s results were weak and its exposure to retail end markets was a negative, while Ferro was penalized for its exposure to the solar industry and European end markets.
We cannot forecast near-term market movements with any degree of certainty. Indeed, the market continues to experience unpredictable daily fluctuations, with fear and uncertainty driving stocks down one day, followed by optimistic and opportunistic buying the next. Therefore, we remain focused on what we do control, which is the strategy we employ to protect your capital and to enhance its growth. While this fiscal year has been a frustrating one, our approach has resulted in above-average returns for many years. We will seek to provide attractive returns in the years ahead by continuing to employ this logical approach:
1. We search for companies that we believe are selling at prices that seem modest in relationship to the company’s intrinsic value.
2. We meet with management, visit plants, talk to the company’s competitors, consider the makeup of the board of directors, and make a judgment as to whether we wish to be in business with the management. In other words, we try to understand the business of the companies in which we invest and the individuals who direct each company’s future.
3. We search for companies in which something may change that will alter that company’s future for the better. This can range from a change in the management or management’s attitude toward how they run the business, to a change in control, to a change in business opportunity, to a change in the dynamics of a company’s cash flow and its use.
4. We will typically invest in a focused group of 25 to 35 common stocks issued primarily by small-to-mid-sized domestic companies.
5. If we perform our analysis correctly, the value-added we bring to you is an earlier and better understanding of the companies in our portfolio than that possessed by other investors. Then, if the companies begin to improve, their earnings should increase and they should be valued at a higher price-earnings multiple.
6. We have never worried about the profits that we did not make. We worry much more about what we might lose. We believe that stock selection is much more relevant to successful investing than total commitment to equities. In the volatile markets that have developed over the last 15 to 20 years, we have come to believe that the long-term investor’s best hedge against volatility is to have cash with which to invest in companies when prices seem unduly depressed.
We have lived through such extraordinary declining markets in the past. Our experience has been that such intense selling usually leads to attractive investment opportunities and, once the panic subsides, to significant gains. We are pleased with the current positioning of the portfolio. In general, our investments have solid balance sheets, strong free cash-flow generation, and excellent management teams; and we believe that they are well positioned to prosper and increase in value over time.
| | | | |
| Sincerely, | | | | |
| | |
| | | |  |
| | |
| J. Dennis Delafield | | Vincent Sellecchia | | Donald Wang |
| Portfolio Manager | | Portfolio Manager | | Portfolio Manager |
The Tocqueville Select Fund
(Unaudited)

This chart assumes an initial gross investment of $10,000 made on 10/31/01. Since The Tocqueville Select Fund did not commence operations until 9/28/09, returns from the period from September 29, 2008 to September 27, 2009 are those of the Class Y Shares of the Predecessor Fund (See Footnote 1 to the Financial Statements). Prior to that period, returns shown are those of a limited partnership managed by the adviser. Returns shown do not reflect the deduction of taxes that a shareholder would pay on fund distributions or the redemption of fund shares. Performance reflects fee waivers in effect. In the absence of fee waivers, total return would be reduced. Returns shown include the reinvestment of all dividends and other distributions. Past performance is not predictive of future performance. Investment return and principal value will fluctuate so that your shares, when redeemed, may be worth more or less than their original cost. The Fund imposes a 2% redemption fee on shares held 90 days or less.
The Russel 2500 Total Return Index is an unmanaged index that measures the performance of the 2,500 smallest companies in the Russell 3000 Index. Returns include the reinvestment of all dividends.
The Russell 2000 Total Return Index is an unmanaged index that measures the performance of the 2,000 smallest companies in the Russell 3000 Index, which represents approximately 8% of the total market capitalization of the Russell 3000 Index. Returns include the reinvestment of all dividends.
AVERAGE ANNUAL RATE OF RETURN (%)
FOR PERIODS ENDED OCTOBER 31, 2011
| | | | | | | | | | | | | | | | |
| | | 1 Year | | | 3 Year | | | 5 Year | | | 10 Year | |
The Tocqueville Select Fund | | | -0.10% | | | | 22.00% | | | | 5.74% | | | | 11.78% | |
Russell 2500 Total Return Index | | | 7.97% | | | | 16.04% | | | | 2.01% | | | | 8.01% | |
Russell 2000 Total Return Index | | | 6.71% | | | | 12.87% | | | | 0.68% | | | | 7.02% | |
Expense Example—October 31, 2011 (Unaudited)
As a shareholder of The Tocqueville Trust (the “Funds”), you incur ongoing costs, including management fees; distribution fees; and other Fund expenses. This example is intended to help you understand your ongoing costs (in dollars) of investing in the Funds and to compare costs with the ongoing costs of investing in other mutual funds.
The Example is based on an investment of $1,000 invested at the beginning of the period and held the entire period (May 1, 2011-October 31, 2011).
Actual Expenses
The first line of the table below provides information about actual account values and actual expenses. You may use the information in this line, together with the amount you invested, to estimate the expenses that you paid over the period. Simply divide your account value by $1,000 (for example, an $8,600 account value divided by $1,000 = 8.6), then multiply the result by the number in the first line under the heading entitled “Expenses Paid During Period” to estimate the expenses you paid on your account during this period.
Hypothetical Example for Comparison Purposes
The second line of the table below provides information about hypothetical account values and hypothetical expenses based on the Funds’ actual expense ratios and an assumed rate of return of 5% per year before expenses, which is not the Funds’ actual return. The hypothetical account values and expenses may not be used to estimate the actual ending account balance or expenses you paid for the period. You may use this information to compare the ongoing costs of investing in the Funds and other funds. To do so, compare this 5% hypothetical example with the 5% hypothetical examples that appear in the shareholder reports of the other funds.
Please note that the expenses shown in the table are meant to highlight your ongoing costs only and do not reflect any transactional costs, such as sales charges (loads), redemption fees, or exchange fees. Therefore, the second line of the table is useful in comparing ongoing costs only, and will not help you determine the relative costs of owning different funds. In addition, if these transactional costs were included, your costs would have been higher.
Expense Example Tables (Unaudited)
| | | | | | | | | | | | |
The Tocqueville Fund | | Beginning
Account Value
May 1, 2011 | | | Ending
Account Value
October 31, 2011 | | | Expenses Paid
During Period*
May 1, 2011 -
October 31, 2011 | |
Actual | | $ | 1,000.00 | | | $ | 913.30 | | | $ | 6.03 | |
Hypothetical (5% return before expenses) | | | 1,000.00 | | | | 1,018.90 | | | | 6.36 | |
| | | |
| The Tocqueville Opportunity Fund | | | | | | | | | | | | |
Actual | | $ | 1,000.00 | | | $ | 906.70 | | | $ | 6.68 | |
Hypothetical (5% return before expenses) | | | 1,000.00 | | | | 1,018.20 | | | | 7.07 | |
| | | |
| The Tocqueville International Value Fund | | | | | | | | | | | | |
Actual | | $ | 1,000.00 | | | $ | 854.70 | | | $ | 7.39 | |
Hypothetical (5% return before expenses) | | | 1,000.00 | | | | 1,017.24 | | | | 8.03 | |
| | | |
| The Tocqueville Gold Fund | | | | | | | | | | | | |
Actual | | $ | 1,000.00 | | | $ | 904.90 | | | $ | 6.10 | |
Hypothetical (5% return before expenses) | | | 1,000.00 | | | | 1,018.80 | | | | 6.46 | |
| | | |
| The Delafield Fund | | | | | | | | | | | | |
Actual | | $ | 1,000.00 | | | $ | 847.40 | | | $ | 5.82 | |
Hypothetical (5% return before expenses) | | | 1,000.00 | | | | 1,018.90 | | | | 6.36 | |
| | | |
| The Tocqueville Select Fund | | | | | | | | | | | | |
Actual | | $ | 1,000.00 | | | $ | 834.70 | | | $ | 6.43 | |
Hypothetical (5% return before expenses) | | | 1,000.00 | | | | 1,018.20 | | | | 7.07 | |
| * | Expenses are equal to the Fund’s annualized six-month expense ratio of 1.25%, 1.39%, 1.58%, 1.27%, 1.25% and 1.39% for The Tocqueville Fund, Opportunity Fund, International Value Fund, Gold Fund, Delafield Fund, and Select Fund, respectively, multiplied by the average account value over the period, multiplied by 184/365 to reflect the one-half year period. |
The Tocqueville Fund
Financial Highlights
| | | | | | | | | | | | | | | | | | | | |
Per share operating performance
(For a share outstanding throughout the year) | | Years Ended October 31, | |
| | 2011 | | | 2010 | | | 2009 | | | 2008 | | | 2007 | |
Net asset value, beginning of year | | $ | 21.53 | | | $ | 18.47 | | | $ | 16.39 | | | $ | 28.93 | | | $ | 24.25 | |
| | | | | | | | | | | | | | | | | | | | |
Operations: | | | | | | | | | | | | | | | | | | | | |
Net investment income | | | 0.23 | | | | 0.32 | | | | 0.28 | | | | 0.24 | | | | 0.18 | |
Net realized and unrealized gain (loss) | | | 0.80 | | | | 2.97 | | | | 2.09 | | | | (10.56 | ) | | | 4.53 | |
| | | | | | | | | | | | | | | | | | | | |
Total from investment operations (1) | | | 1.03 | | | | 3.29 | | | | 2.37 | | | | (10.32 | ) | | | 4.71 | |
| | | | | | | | | | | | | | | | | | | | |
Dividends and distributions to shareholders: | | | | | | | | | | | | | | | | | | | | |
Dividends from net investment income | | | (0.33 | ) | | | (0.23 | ) | | | (0.29 | ) | | | (0.19 | ) | | | (0.03 | ) |
Distributions from net realized gains | | | — | | | | — | | | | — | | | | (2.03 | ) | | | — | |
| | | | | | | | | | | | | | | | | | | | |
Total dividends and distributions | | | (0.33 | ) | | | (0.23 | ) | | | (0.29 | ) | | | (2.22 | ) | | | (0.03 | ) |
| | | | | | | | | | | | | | | | | | | | |
Change in net asset value for the year | | | 0.70 | | | | 3.06 | | | | 2.08 | | | | (12.54 | ) | | | 4.68 | |
| | | | | | | | | | | | | | | | | | | | |
Net asset value, end of year | | $ | 22.23 | | | $ | 21.53 | | | $ | 18.47 | | | $ | 16.39 | | | $ | 28.93 | |
| | | | | | | | | | | | | | | | | | | | |
Total return | | | 4.8 | % | | | 18.0 | % | | | 14.8 | % | | | (38.5 | )% | | | 19.4 | % |
Ratios/supplemental data | | | | | | | | | | | | | | | | | | | | |
Net assets, end of year (000) | | $ | 491,541 | | | $ | 489,670 | | | $ | 383,470 | | | $ | 328,609 | | | $ | 523,878 | |
Ratio to average net assets: | | | | | | | | | | | | | | | | | | | | |
Expenses | | | 1.25 | %(2) | | | 1.25 | %(2) | | | 1.25 | %(2) | | | 1.25 | %(2) | | | 1.25 | %(2) |
Net investment income | | | 0.98 | %(2) | | | 1.66 | %(2) | | | 1.68 | %(2) | | | 0.94 | %(2) | | | 0.69 | %(2) |
Portfolio turnover rate | | | 28 | % | | | 23 | % | | | 32 | % | | | 51 | % | | | 39 | % |
| (1) | Total from investment operations per share includes redemption fees of $0.002, $0.002, $0.004, $0.009 and $0.002 per share for the fiscal years ended October 31, 2011, 2010, 2009, 2008 and 2007, respectively. |
| (2) | Net of fees waived amounting to 0.01%, 0.01%, 0.08%, 0.04%, and 0.01% of average net assets for the fiscal years ended October 31, 2011, 2010, 2009, 2008 and 2007, respectively. |
The Accompanying Notes are an Integral Part of these Financial Statements.
The Tocqueville Opportunity Fund
Financial Highlights
| | | | | | | | | | | | | | | | | | | | |
Per share operating performance
(For a share outstanding throughout the year) | | Years Ended October 31, | |
| | 2011 | | | 2010 | | | 2009 | | | 2008 | | | 2007 | |
Net asset value, beginning of year | | $ | 13.20 | | | $ | 10.78 | | | $ | 9.77 | | | $ | 17.24 | | | $ | 18.04 | |
| | | | | | | | | | | | | | | | | | | | |
Operations: | | | | | | | | | | | | | | | | | | | | |
Net investment income (loss) | | | (0.13 | ) | | | (0.12 | ) | | | (0.11 | ) | | | 0.02 | | | | 0.11 | |
Net realized and unrealized gain (loss) | | | 1.89 | | | | 2.54 | | | | 1.23 | | | | (5.67 | ) | | | 1.26 | |
| | | | | | | | | | | | | | | | | | | | |
Total from investment operations (1) | | | 1.76 | | | | 2.42 | | | | 1.12 | | | | (5.65 | ) | | | 1.37 | |
| | | | | | | | | | | | | | | | | | | | |
Distributions to shareholders: | | | | | | | | | | | | | | | | | | | | |
Dividends from net investment income | | | — | | | | — | | | | (0.01 | ) | | | (0.12 | ) | | | — | |
Distributions from net realized gains | | | — | | | | — | | | | (0.10 | ) | | | (1.70 | ) | | | (2.17 | ) |
| | | | | | | | | | | | | | | | | | | | |
Total distributions | | | — | | | | — | | | | (0.11 | ) | | | (1.82 | ) | | | (2.17 | ) |
| | | | | | | | | | | | | | | | | | | | |
Change in net asset value for the year | | | 1.76 | | | | 2.42 | | | | 1.01 | | | | (7.47 | ) | | | (0.80 | ) |
| | | | | | | | | | | | | | | | | | | | |
Net asset value, end of year | | $ | 14.96 | | | $ | 13.20 | | | $ | 10.78 | | | $ | 9.77 | | | $ | 17.24 | |
| | | | | | | | | | | | | | | | | | | | |
Total return | | | 13.3 | % | | | 22.6 | % | | | 11.7 | % | | | (36.2 | )% | | | 8.4 | % |
Ratios/supplemental data | | | | | | | | | | | | | | | | | | | | |
Net assets, end of year (000) | | $ | 46,963 | | | $ | 32,863 | | | $ | 30,498 | | | $ | 36,429 | | | $ | 49,543 | |
Ratio to average net assets: | | | | | | | | | | | | | | | | | | | | |
Expenses | | | 1.36 | % | | | 1.41 | % | | | 1.41 | % | | | 1.35 | % | | | 1.32 | % |
Net investment income (loss) | | | (1.04 | )% | | | (1.08 | )% | | | (0.97 | %) | | | 0.12 | % | | | 0.63 | % |
Portfolio turnover rate | | | 110 | % | | | 104 | % | | | 62 | % | | | 169 | % | | | 90 | % |
| (1) | Total from investment operations per share includes redemption fees of less than $0.001 for the fiscal years ended October 31, 2011 and 2010, $0.001, $0.005 and $0.001 for the fiscal years ended October 31, 2009, 2008 and 2007, respectively. |
The Accompanying Notes are an Integral Part of these Financial Statements.
The Tocqueville International Value Fund
Financial Highlights
| | | | | | | | | | | | | | | | | | | | |
Per share operating performance
(For a share outstanding throughout the year) | | Years Ended October 31, | |
| | 2011 | | | 2010 | | | 2009 | | | 2008 | | | 2007 | |
Net asset value, beginning of year | | $ | 12.12 | | | $ | 10.48 | | | $ | 8.49 | | | $ | 16.48 | | | $ | 16.72 | |
| | | | | | | | | | | | | | | | | | | | |
Operations: | | | | | | | | | | | | | | | | | | | | |
Net investment income | | | 0.11 | | | | 0.11 | | | | 0.10 | | | | 0.13 | | | | 0.08 | |
Net realized and unrealized gain (loss) | | | (0.16 | ) | | | 1.65 | | | | 2.59 | | | | (6.09 | ) | | | 2.25 | |
| | | | | | | | | | | | | | | | | | | | |
Total from investment operations (1) | | | (0.05 | ) | | | 1.76 | | | | 2.69 | | | �� | (5.96 | ) | | | 2.33 | |
| | | | | | | | | | | | | | | | | | | | |
Dividends and distributions to shareholders: | | | | | | | | | | | | | | | | | | | | |
Dividends from net investment income | | | (0.07 | ) | | | (0.12 | ) | | | (0.20 | ) | | | (0.10 | ) | | | (0.27 | ) |
Distributions from net realized gains | | | — | | | | — | | | | (0.50 | ) | | | (1.93 | ) | | | (2.30 | ) |
| | | | | | | | | | | | | | | | | | | | |
Total dividends and distributions | | | (0.07 | ) | | | (0.12 | ) | | | (0.70 | ) | | | (2.03 | ) | | | (2.57 | ) |
| | | | | | | | | | | | | | | | | | | | |
Change in net asset value for the year | | | (0.12 | ) | | | 1.64 | | | | 1.99 | | | | (7.99 | ) | | | (0.24 | ) |
| | | | | | | | | | | | | | | | | | | | |
Net asset value, end of year | | $ | 12.00 | | | $ | 12.12 | | | $ | 10.48 | | | $ | 8.49 | | | $ | 16.48 | |
| | | | | | | | | | | | | | | | | | | | |
Total return | | | (0.5 | )% | | | 17.0 | % | | | 34.0 | % | | | (40.8 | )% | | | 15.3 | % |
Ratios/supplemental data | | | | | | | | | | | | | | | | | | | | |
Net assets, end of year (000) | | $ | 199,848 | | | $ | 150,103 | | | $ | 131,613 | | | $ | 118,189 | | | $ | 219,220 | |
Ratio to average net assets: | | | | | | | | | | | | | | | | | | | | |
Expenses | | | 1.56 | % | | | 1.56 | % | | | 1.62 | % | | | 1.56 | % | | | 1.59 | % |
Net investment income | | | 0.99 | % | | | 1.03 | % | | | 0.96 | % | | | 1.07 | % | | | 0.49 | % |
Portfolio turnover rate | | | 30 | % | | | 27 | % | | | 27 | % | | | 63 | % | | | 49 | % |
| (1) | Total from investment operations per share includes redemption fees of $0.010, $0.002, $0.001, $0.001 and $0.002 per share for the fiscal years ended October 31, 2011, 2010, 2009, 2008 and 2007, respectively. |
The Accompanying Notes are an Integral Part of these Financial Statements.
The Tocqueville Gold Fund
Financial Highlights
| | | | | | | | | | | | | | | | | | | | |
Per share operating performance
(For a share outstanding throughout the year) | | Years Ended October 31, | |
| | 2011 | | | 2010 | | | 2009 | | | 2008 | | | 2007 | |
Net asset value, beginning of year | | $ | 82.00 | | | $ | 49.71 | | | $ | 21.77 | | | $ | 64.36 | | | $ | 51.41 | |
| | | | | | | | | | | | | | | | | | | | |
Operations: | | | | | | | | | | | | | | | | | | | | |
Net investment loss | | | (0.67 | ) | | | (0.58 | ) | | | (0.45 | ) | | | (0.57 | ) | | | (0.30 | ) |
Net realized and unrealized gain (loss) | | | 2.25 | | | | 32.96 | | | | 29.28 | | | | (33.24 | ) | | | 18.52 | |
| | | | | | | | | | | | | | | | | | | | |
Total from investment operations (1) | | | 1.58 | | | | 32.38 | | | | 28.83 | | | | (33.81 | ) | | | 18.22 | |
| | | | | | | | | | | | | | | | | | | | |
Dividends and distributions to shareholders: | | | | | | | | | | | | | | | | | | | | |
Dividends from net investment income | | | — | | | | — | | | | — | | | | (0.46 | ) | | | (0.22 | ) |
Dividends from net realized gains | | | (1.61 | ) | | | (0.09 | ) | | | (0.89 | ) | | | (8.32 | ) | | | (5.05 | ) |
| | | | | | | | | | | | | | | | | | | | |
Total distributions | | | (1.61 | ) | | | (0.09 | ) | | | (0.89 | ) | | | (8.78 | ) | | | (5.27 | ) |
| | | | | | | | | | | | | | | | | | | | |
Change in net asset value for the year | | | (0.03 | ) | | | 32.29 | | | | 27.94 | | | | (42.59 | ) | | | 12.95 | |
| | | | | | | | | | | | | | | | | | | | |
Net asset value, end of year | | $ | 81.97 | | | $ | 82.00 | | | $ | 49.71 | | | $ | 21.77 | | | $ | 64.36 | |
| | | | | | | | | | | | | | | | | | | | |
Total return | | | 1.8 | % | | | 65.2 | % | | | 135.2 | % | | | (60.0 | )% | | | 38.4 | % |
Ratios/supplemental data | | | | | | | | | | | | | | | | | | | | |
Net assets, end of year (000) | | $ | 2,647,078 | | | $ | 2,199,603 | | | $ | 937,492 | | | $ | 410,857 | | | $ | 1,231,475 | |
Ratios to average net assets: | | | | | | | | | | | | | | | | | | | | |
Expenses | | | 1.25 | % | | | 1.34 | % | | | 1.50 | % | | | 1.43 | % | | | 1.42 | % |
Net investment income (loss) | | | (0.86 | )% | | | (1.11 | )% | | | (1.25 | )% | | | (1.07 | )% | | | (0.81 | )% |
Portfolio turnover rate | | | 3 | % | | | 9 | % | | | 9 | % | | | 28 | % | | | 26 | % |
| (1) | Total from investment operations per share includes redemption fees of $0.102, $0.056, $0.025, $0.027 and $0.028 per share for the fiscal years ended October 31, 2011, 2010, 2009, 2008 and 2007, respectively. |
The Accompanying Notes are an Integral Part of these Financial Statements.
The Delafield Fund
Financial Highlights
| | | | | | | | | | | | | | | | | | | | | | | | |
Per share operating performance
(For a share outstanding throughout
the period) | | Years Ended
October 31, | | | January 1,
2009
through
October 31, | | | Years Ended December 31, | |
| | 2011 | | | 2010 | | | 2009 | | | 2008 | | | 2007 | | | 2006 | |
Net asset value, beginning of period | | $ | 26.65 | | | $ | 21.35 | | | $ | 15.10 | | | $ | 24.33 | | | $ | 25.64 | | | $ | 23.63 | |
| | | | | | | | | | | | | | | | | | | | | | | | |
Operations: | | | | | | | | | | | | | | | | | | | | | | | | |
Net investment income (loss) | | | (0.08 | ) | | | (0.00 | )(2) | | | 0.03 | | | | 0.07 | | | | 0.17 | | | | 0.19 | |
Net realized and unrealized gain (loss) | | | 0.64 | | | | 5.32 | | | | 6.25 | | | | (9.23 | ) | | | 1.10 | | | | 4.64 | |
| | | | | | | | | | | | | | | | | | | | | | | | |
Total from investment operations (1) | | | 0.56 | | | | 5.32 | | | | 6.28 | | | | (9.16 | ) | | | 1.27 | | | | 4.83 | |
| | | | | | | | | | | | | | | | | | | | | | | | |
Dividends and distributions to shareholders: | | | | | | | | | | | | | | | | | | | | | | | | |
Dividends from net investment income | | | — | | | | — | | | | (0.03 | ) | | | (0.07 | ) | | | (0.16 | ) | | | (0.19 | ) |
Dividends from net realized gains | | | — | | | | — | | | | — | | | | (0.00 | )(2) | | | (2.42 | ) | | | (2.63 | ) |
Return of capital | | | — | | | | (0.02 | ) | | | (0.00 | )(2) | | | (0.00 | )(2) | | | — | | | | — | |
| | | | | | | | | | | | | | | | | | | | | | | | |
Total distributions | | | — | | | | (0.02 | ) | | | (0.03 | ) | | | (0.07 | ) | | | (2.58 | ) | | | (2.82 | ) |
| | | | | | | | | | | | | | | | | | | | | | | | |
Change in net asset value for the period | | | 0.56 | | | | 5.30 | | | | 6.25 | | | | (9.23 | ) | | | (1.31 | ) | | | 2.01 | |
| | | | | | | | | | | | | | | | | | | | | | | | |
Net asset value, end of period | | $ | 27.21 | | | $ | 26.65 | | | $ | 21.35 | | | $ | 15.10 | | | $ | 24.33 | | | $ | 25.64 | |
| | | | | | | | | | | | | | | | | | | | | | | | |
Total return | | | 2.1 | % | | | 25.0 | % | | | 41.6 | %(3) | | | (37.6 | )% | | | 4.9 | % | | | 20.4 | % |
Ratios/supplemental data | | | | | | | | | | | | | | | | | | | | | | | | |
Net assets, end of period (000) | | $ | 1,262,876 | | | $ | 933,674 | | | $ | 636,548 | | | $ | 404,860 | | | $ | 656,999 | | | $ | 532,108 | |
Ratios to average net assets: | | | | | | | | | | | | | | | | | | | | | | | | |
Expenses | | | 1.23 | % | | | 1.27 | % | | | 1.38 | %(4) | | | 1.34 | %(5) | | | 1.28 | %(5) | | | 1.32 | %(5) |
Net investment income (loss) | | | (0.30 | )% | | | (0.02 | )% | | | 0.21 | %(4) | | | 0.35 | %(5) | | | 0.57 | %(5) | | | 0.82 | %(5) |
Portfolio turnover rate | | | 38 | % | | | 30 | % | | | 46 | %(3) | | | 81 | % | | | 61 | % | | | 72 | % |
| (1) | Total from investment operations per share includes redemption fees of $0.006 per share for the fiscal years ended October 31, 2011 and 2010, $0.008 per share for the period ended October 31, 2009, $0.01 for the fiscal year ended December 31, 2007 and less than $0.01 per share for the fiscal years ended December 31, 2008 and 2006. |
| (2) | Represents less than $0.01. |
| (5) | Net of fees waived amounting to 0.06%, 0.05% and 0.08% for the fiscal years ended December 31, 2008, 2007, and 2006, respectively. |
The Accompanying Notes are an Integral Part of these Financial Statements.
The Tocqueville Select Fund
Financial Highlights
| | | | | | | | | | | | | | | | |
Per share operating performance
(For a share outstanding throughout the period) | | Years Ended
October 31, | | | January 1,
2009
through
October 31,
2009 | | | Period from
September 29,
2008 (2)
through
December 31,
2008 | |
| | 2011 | | | 2010 | | | |
Net asset value, beginning of period | | $ | 11.54 | | | $ | 8.46 | | | $ | 5.77 | | | $ | 8.74 | |
| | | | | | | | | | | | | | | | |
Operations: | | | | | | | | | | | | | | | | |
Net investment income (loss) | | | (0.07 | ) | | | (0.03 | ) | | | (0.00 | )(3) | | | 0.01 | |
Net realized and unrealized gain (loss) | | | 0.12 | | | | 3.12 | | | | 2.70 | | | | (2.97 | ) |
| | | | | | | | | | | | | | | | |
Total from investment operations (1) | | | 0.05 | | | | 3.09 | | | | 2.70 | | | | (2.96 | ) |
| | | | | | | | | | | | | | | | |
Dividends and distributions to shareholders: | | | | | | | | | | | | | | | | |
Dividends from net investment income | | | — | | | | (0.01 | ) | | | (0.00 | )(3) | | | (0.01 | ) |
Dividends from net realized gains | | | (0.53 | ) | | | — | | | | — | | | | — | |
Return of capital | | | — | | | | — | | | | (0.01 | ) | | | — | |
| | | | | | | | | | | | | | | | |
Total distributions | | | (0.53 | ) | | | (0.01 | ) | | | (0.01 | ) | | | (0.01 | ) |
| | | | | | | | | | | | | | | | |
Change in net asset value for the period | | | (0.48 | ) | | | 3.08 | | | | 2.69 | | | | (2.97 | ) |
| | | | | | | | | | | | | | | | |
Net asset value, end of period | | $ | 11.06 | | | $ | 11.54 | | | $ | 8.46 | | | $ | 5.77 | |
| | | | | | | | | | | | | | | | |
Total return | | | (0.1 | )% | | | 36.6 | % | | | 46.7 | %(4) | | | (33.9 | )%(4) |
Ratios/supplemental data | | | | | | | | | | | | | | | | |
Net assets, end of period (000) | | $ | 71,554 | | | $ | 41,788 | | | $ | 24,681 | | | $ | 9,226 | |
Ratios to average net assets: | | | | | | | | | | | | | | | | |
Expenses | | | 1.36 | % | | | 1.38 | % | | | 1.26 | %(5)(6) | | | 1.15 | %(5)(6) |
Net investment income (loss) | | | (0.67 | )% | | | (0.43 | )% | | | (0.16 | )%(5)(6) | | | 0.29 | %(5)(6) |
Portfolio turnover rate | | | 28 | % | | | 40 | % | | | 24 | %(4) | | | 29 | %(4) |
| (1) | Total from investment operations per share includes redemption fees of $0.008 and $0.007 per share for the fiscal years ended October 31, 2011 and 2010, respectively. |
| (3) | Represents less than $0.01 per share. |
| (6) | Net of fees waived amounting to 0.77% and 2.32% for the periods ended October 31, 2009 and December 31, 2008, respectively. |
The Accompanying Notes are an Integral Part of these Financial Statements.
The Tocqueville Fund
Schedule of Investments as of October 31, 2011
| | | | | | | | |
| Common Stocks—99.3% | | Shares | | | Value | |
Automobiles & Components—1.4% | |
Ford Motor Co.(a) | | | 600,000 | | | $ | 7,008,000 | |
Banks—2.7% | | | | | | | | |
Banco Santander SA—ADR | | | 500,000 | | | | 4,280,000 | |
East West Bancorp, Inc. | | | 250,000 | | | | 4,867,500 | |
Mitsubishi UFJ Financial Group, Inc.—ADR | | | 1,000,000 | | | | 4,330,000 | |
| | | | | | | | 13,477,500 | |
Capital Goods—8.3% | |
The Boeing Co. | | | 75,000 | | | | 4,934,250 | |
General Electric Co. | | | 1,000,000 | | | | 16,710,000 | |
Illinois Tool Works, Inc. | | | 150,000 | | | | 7,294,500 | |
ITT Corp. | | | 192,100 | | | | 8,759,760 | |
Masco Corp. | | | 295,800 | | | | 2,839,680 | |
| | | | | | | | 40,538,190 | |
Commercial & Professional Services—1.5% | |
Steelcase, Inc. | | | 1,000,000 | | | | 7,410,000 | |
Diversified Financials—1.3% | | | | | | | | |
The Bank of New York Mellon Corp. | | | 300,000 | | | | 6,384,000 | |
Energy—10.8% | | | | | | | | |
Cameco Corp.(b) | | | 200,000 | | | | 4,286,000 | |
CARBO Ceramics, Inc. | | | 20,000 | | | | 2,717,000 | |
Chesapeake Energy Corp. | | | 300,000 | | | | 8,436,000 | |
Exxon Mobil Corp. | | | 200,000 | | | | 15,618,000 | |
Murphy Oil Corp. | | | 200,000 | | | | 11,074,000 | |
Schlumberger Ltd.(b) | | | 150,000 | | | | 11,020,500 | |
| | | | | | | | 53,151,500 | |
Food & Staples Retailing—1.4% | |
Wal-Mart Stores, Inc. | | | 125,000 | | | | 7,090,000 | |
Food, Beverage & Tobacco—4.5% | |
Campbell Soup Co. | | | 250,000 | | | | 8,312,500 | |
The Coca-Cola Co. | | | 150,000 | | | | 10,248,000 | |
Unilever NV—ADR | | | 100,000 | | | | 3,453,000 | |
| | | | | | | | 22,013,500 | |
Health Care Equipment & Services—1.0% | |
St. Jude Medical, Inc. | | | 125,000 | | | | 4,875,000 | |
Household & Personal Products—4.0% | |
Colgate-Palmolive Co. | | | 100,000 | | | | 9,037,000 | |
Kimberly-Clark Corp. | | | 150,000 | | | | 10,456,500 | |
| | | | | | | | 19,493,500 | |
Insurance—2.6% | | | | | | | | |
Aflac, Inc. | | | 200,000 | | | | 9,018,000 | |
Fidelity National Financial, Inc. | | | 250,000 | | | | 3,860,000 | |
| | | | | | | | 12,878,000 | |
Materials—13.0% | | | | | | | | |
BHP Billiton Ltd.—ADR | | | 75,000 | | | $ | 5,856,000 | |
Cliffs Natural Resources, Inc. | | | 100,000 | | | | 6,822,000 | |
EI du Pont de Nemours & Co. | | | 300,000 | | | | 14,421,000 | |
Newmont Mining Corp. | | | 275,000 | | | | 18,378,250 | |
Owens-Illinois, Inc.(a) | | | 400,000 | | | | 8,032,000 | |
Sonoco Products Co. | | | 200,000 | | | | 6,278,000 | |
Vulcan Materials Co. | | | 125,000 | | | | 3,911,250 | |
| | | | | | | | 63,698,500 | |
Pharmaceuticals, Biotechnology & Life Sciences—10.2% | |
Alkermes PLC(a)(b) | | | 300,000 | | | | 5,247,000 | |
Forest Laboratories, Inc.(a) | | | 100,000 | | | | 3,130,000 | |
Johnson & Johnson | | | 175,000 | | | | 11,268,250 | |
Merck & Co., Inc. | | | 200,000 | | | | 6,900,000 | |
Myriad Genetics, Inc.(a) | | | 300,000 | | | | 6,384,000 | |
Pfizer, Inc. | | | 900,000 | | | | 17,334,000 | |
| | | | | | | | 50,263,250 | |
Real Estate—2.4% | | | | | | | | |
CBRE Group, Inc.(a) | | | 250,000 | | | | 4,445,000 | |
Weyerhaeuser Co. | | | 400,000 | | | | 7,192,000 | |
| | | | | | | | 11,637,000 | |
Retailing—2.4% | | | | | | | | |
The Home Depot, Inc. | | | 200,000 | | | | 7,160,000 | |
Staples, Inc. | | | 300,000 | | | | 4,488,000 | |
| | | | | | | | 11,648,000 | |
Semiconductors & Semiconductor Equipment—4.5% | |
Applied Materials, Inc. | | | 800,000 | | | | 9,856,000 | |
Intel Corp. | | | 500,000 | | | | 12,270,000 | |
| | | | | | | | 22,126,000 | |
Software & Services—14.3% | | | | | | | | |
Adobe Systems, Inc.(a) | | | 200,000 | | | | 5,882,000 | |
Akamai Technologies, Inc.(a) | | | 200,000 | | | | 5,388,000 | |
Automatic Data Processing, Inc. | | | 150,000 | | | | 7,849,500 | |
Bio-key International, Inc.(a)(c)(d)(e) | | | 47,090 | | | | — | |
Google, Inc.(a) | | | 20,000 | | | | 11,852,800 | |
Mastercard, Inc. | | | 40,000 | | | | 13,889,600 | |
Microsoft Corp. | | | 700,000 | | | | 18,641,000 | |
Symantec Corp.(a) | | | 402,400 | | | | 6,844,824 | |
| | | | | | | | 70,347,724 | |
Technology Hardware & Equipment—7.3% | |
Canon, Inc.—ADR | | | 60,000 | | | | 2,733,000 | |
Cisco Systems, Inc. | | | 700,000 | | | | 12,971,000 | |
Corning, Inc. | | | 400,000 | | | | 5,716,000 | |
Hitachi Ltd.—ADR | | | 200,000 | | | | 10,816,000 | |
Plexus Corp.(a) | | | 150,000 | | | | 3,855,000 | |
| | | | | | | | 36,091,000 | |
The Accompanying Footnotes are an Integral Part of these Financial Statements.
The Tocqueville Fund
Schedule of Investments as of October 31, 2011
| | | | | | | | |
| Common Stocks (continued) | | Shares | | | Value | |
Telecommunication Services—2.3% | |
Verizon Communications, Inc. | | | 150,000 | | | $ | 5,547,000 | |
Vodafone Group PLC—ADR | | | 200,000 | | | | 5,568,000 | |
| | | | | | | | 11,115,000 | |
Utilities—3.4% | | | | | | | | |
NextEra Energy, Inc. | | | 300,000 | | | | 16,920,000 | |
Total Common Stocks
(Cost $458,626,950) | | | | | | | 488,165,664 | |
Warrants—0.0% | | | | | | | | |
Capital Goods—0.0% | | | | | | | | |
EMCORE Corp.
Expiration: 02/19/13,
Exercise Price: $15.06(a)(c)(d)(e) | | | 39,375 | | | | 188 | |
Total Warrants
(Cost $0) | | | | | | | 188 | |
Total Investments
(Cost $458,626,950)—99.3% | | | | 488,165,852 | |
Other Assets in Excess of Liabilities—0.7% | | | | 3,375,488 | |
Total Net Assets—100.0% | | | | | | $ | 491,541,340 | |
| | | | | | | | |
Percentages are stated as a percent of net assets.
ADR—American Depository Receipt
| (a) | Non-income producing security. |
| (b) | Foreign issued security. Foreign concentration (including ADRs) was as follows: Australia 1.2%; Britian 1.1%; Canada 0.9%; Curacao 2.2%; Ireland 1.1%; Japan 3.7%; Netherlands 0.7%; Spain 0.9%; |
| (c) | Denotes a security is either fully or partially restricted to resale. The aggregate value of restricted securities at October 31, 2011 was $188 which represented 0.0% of net assets. |
| (d) | Fair valued security. The aggregate value of fair valued securities as of October 31, 2011 was $188 which represented 0.0% of net assets. |
| (e) | Security is considered illiquid and may be difficult to sell. |
The Global Industry Classification Standard (GICS®) was developed by and/or is the exclusive property of MSCI, Inc. and Standard & Poor Financial Services LLC (“S&P”). GICS is a service mark of MSCI and S&P and has been licensed for use by U.S. Bancorp Fund Services, LLC.
The Accompanying Footnotes are an Integral Part of these Financial Statements.
The Tocqueville Opportunity Fund
Schedule of Investments as of October 31, 2011
| | | | | | | | |
| Common Stocks—99.9% | | Shares | | | Value | |
Automobiles & Components—2.3% | |
BorgWarner, Inc.(a) | | | 7,900 | | | $ | 604,271 | |
Gentex Corp. | | | 16,200 | | | | 487,944 | |
| | | | | | | | 1,092,215 | |
Banks—1.3% | | | | | | | | |
BankUnited, Inc. | | | 5,400 | | | | 117,666 | |
Pinnacle Financial Partners, Inc.(a) | | | 11,100 | | | | 166,611 | |
Signature Bank(a) | | | 6,200 | | | | 345,650 | |
| | | | | | | | 629,927 | |
Capital Goods—5.4% | |
AO Smith Corp. | | | 7,900 | | | | 293,564 | |
AMETEK, Inc. | | | 7,200 | | | | 284,544 | |
Citrix Systems, Inc.(a) | | | 3,100 | | | | 225,773 | |
Dover Corp. | | | 2,800 | | | | 155,484 | |
Esterline Technologies Corp.(a) | | | 2,800 | | | | 156,520 | |
Gardner Denver, Inc. | | | 2,900 | | | | 224,257 | |
Joy Global, Inc. | | | 2,800 | | | | 244,160 | |
Polypore International, Inc.(a) | | | 6,000 | | | | 314,700 | |
RBC Bearings, Inc.(a) | | | 4,800 | | | | 194,400 | |
Valmont Industries, Inc. | | | 1,600 | | | | 137,200 | |
WABCO Holdings, Inc.(a) | | | 6,200 | | | | 311,302 | |
| | | | | | | | 2,541,904 | |
Commercial & Professional Services—1.2% | | | | | |
Acacia Research—Acacia Technologies(a) | | | 2,600 | | | | 103,584 | |
Clean Harbors, Inc.(a) | | | 5,200 | | | | 303,004 | |
Mistras Group, Inc.(a) | | | 7,000 | | | | 152,600 | |
| | | | | | | | 559,188 | |
Consumer Durables & Apparel—7.6% | |
Deckers Outdoor Corp.(a) | | | 4,900 | | | | 564,676 | |
Fossil, Inc.(a) | | | 4,100 | | | | 425,006 | |
Harman International Industries, Inc. | | | 3,500 | | | | 151,060 | |
Lululemon Athletica, Inc.(a) | | | 14,600 | | | | 824,608 | |
Polaris Industries, Inc. | | | 5,800 | | | | 367,372 | |
Ralph Lauren Corp. | | | 2,200 | | | | 349,338 | |
Tempur-Pedic International, Inc.(a) | | | 7,300 | | | | 496,838 | |
Tupperware Brands Corp. | | | 6,800 | | | | 384,472 | |
| | | | | | | | 3,563,370 | |
Consumer Services—4.7% | |
BJ’s Restaurants, Inc.(a) | | | 5,100 | | | | 269,943 | |
Chipotle Mexican Grill, Inc.(a) | | | 2,000 | | | | 672,240 | |
Hyatt Hotels Corp.(a) | | | 5,500 | | | | 204,545 | |
Intercontinental Hotels Group PLC—ADR | | | 10,000 | | | | 184,800 | |
Panera Bread Co.(a) | | | 2,600 | | | | 347,594 | |
Sotheby’s | | | 6,800 | | | | 239,496 | |
Wyndham Worldwide Corp. | | | 2,800 | | | | 94,276 | |
Wynn Resorts Ltd. | | | 1,500 | | | | 199,200 | |
| | | | | | | | 2,212,094 | |
Diversified Financials—4.6% | | | | | | | | |
Blackstone Group LP | | | 22,200 | | | $ | 326,562 | |
The Charles Schwab Corp. | | | 17,400 | | | | 213,672 | |
KKR & Co. LP | | | 23,300 | | | | 314,084 | |
Lazard Ltd.(b) | | | 8,800 | | | | 240,592 | |
MSCI, Inc.(a) | | | 12,700 | | | | 424,053 | |
Portfolio Recovery Associates, Inc.(a) | | | 5,400 | | | | 378,756 | |
T. Rowe Price Group, Inc. | | | 5,300 | | | | 280,052 | |
| | | | | | | | 2,177,771 | |
Energy—8.4% | | | | | | | | |
Cabot Oil & Gas Corp. | | | 3,300 | | | | 256,476 | |
Cameron International Corp.(a) | | | 3,300 | | | | 162,162 | |
CARBO Ceramics, Inc. | | | 3,600 | | | | 489,060 | |
Concho Resources, Inc.(a) | | | 2,200 | | | | 208,384 | |
Continental Resources, Inc.(a) | | | 2,200 | | | | 133,430 | |
Core Laboratories NV(b) | | | 4,900 | | | | 530,474 | |
Dril-Quip, Inc.(a) | | | 3,700 | | | | 240,870 | |
Energy XXI Bermuda Ltd.(a)(b) | | | 6,900 | | | | 202,653 | |
GeoResources, Inc.(a) | | | 8,700 | | | | 230,898 | |
Northern Oil and Gas, Inc.(a) | | | 5,500 | | | | 132,935 | |
Oceaneering International, Inc. | | | 4,200 | | | | 175,686 | |
Pioneer Natural Resources Co. | | | 2,000 | | | | 167,800 | |
Plains Exploration & Production Co.(a) | | | 4,600 | | | | 144,900 | |
Range Resource Corp. | | | 2,000 | | | | 137,680 | |
Rosetta Resources, Inc.(a) | | | 4,500 | | | | 199,530 | |
Rowan Companies, Inc.(a) | | | 5,100 | | | | 175,899 | |
SM Energy Co. | | | 4,500 | | | | 373,095 | |
| | | | | | | | 3,961,932 | |
Food & Staples Retailing—1.1% | | | | | | | | |
The Fresh Market, Inc.(a) | | | 12,700 | | | | 508,000 | |
Food Manufacturing—0.3% | | | | | | | | |
SodaStream International Ltd.(a)(b) | | | 3,700 | | | | 126,096 | |
Food, Beverage & Tobacco—3.7% | | | | | | | | |
Boston Beer Co., Inc.(a) | | | 4,300 | | | | 380,464 | |
Green Mountains Coffee Roasters, Inc.(a) | | | 7,300 | | | | 474,646 | |
The Hain Celestial Group, Inc.(a) | | | 13,800 | | | | 463,128 | |
Hansen Natural Corp.(a) | | | 4,500 | | | | 400,905 | |
| | | | | | | | 1,719,143 | |
Health Care Equipment & Services—6.6% | | | | | |
athenahealth, Inc.(a) | | | 4,300 | | | | 227,513 | |
Bio-Reference Labs, Inc.(a) | | | 7,800 | | | | 156,312 | |
Computer Programs & Systems, Inc. | | | 1,600 | | | | 81,712 | |
Gen-Probe, Inc.(a) | | | 3,200 | | | | 192,320 | |
HeartWare International, Inc.(a) | | | 3,500 | | | | 237,755 | |
HMS Holdings Corp.(a) | | | 9,000 | | | | 219,960 | |
IDEXX Laboratories, Inc.(a) | | | 4,100 | | | | 295,159 | |
Intuitive Surgical, Inc.(a) | | | 525 | | | | 227,777 | |
Magellan Health Services, Inc.(a) | | | 4,200 | | | | 216,174 | |
The Accompanying Footnotes are an Integral Part of these Financial Statements.
The Tocqueville Opportunity Fund
Schedule of Investments as of October 31, 2011
| | | | | | | | |
| Common Stocks (continued) | | Shares | | | Value | |
MAKO Surgical Corp.(a) | | | 8,800 | | | $ | 338,360 | |
Sirona Dental Systems, Inc.(a) | | | 9,500 | | | | 455,050 | |
Thoratec Corp.(a) | | | 5,500 | | | | 200,805 | |
Varian Medical Systems, Inc.(a) | | | 2,300 | | | | 135,056 | |
Zeltiq Aesthetics, Inc.(a) | | | 8,000 | | | | 114,000 | |
| | | | | | | | 3,097,953 | |
Household & Personal Products—2.4% | |
Church & Dwight Co., Inc. | | | 4,100 | | | | 181,138 | |
Herbalife Ltd.(b) | | | 15,500 | | | | 966,580 | |
| | | | | | | | 1,147,718 | |
Materials—6.5% | | | | | | | | |
Airgas, Inc. | | | 4,950 | | | | 341,303 | |
Albemarle Corp. | | | 7,700 | | | | 410,333 | |
Allied Nevada Gold Corp.(a) | | | 7,900 | | | | 300,042 | |
Aptargroup, Inc. | | | 3,200 | | | | 153,504 | |
Celanese Corp. | | | 1,900 | | | | 82,745 | |
Crown Holdings, Inc.(a) | | | 8,500 | | | | 287,215 | |
Ecolab, Inc. | | | 7,000 | | | | 376,880 | |
IAMGOLD Corp.(b) | | | 7,100 | | | | 152,650 | |
Materion Corp.(a) | | | 5,300 | | | | 140,132 | |
Minerals Technologies, Inc.(c) | | | 2,000 | | | | 109,680 | |
Molycorp, Inc.(a) | | | 3,300 | | | | 126,291 | |
Nalco Holding Co. | | | 3,500 | | | | 131,985 | |
Royal Gold, Inc. | | | 2,600 | | | | 186,108 | |
Silgan Holdings, Inc. | | | 6,500 | | | | 244,010 | |
| | | | | | | | 3,042,878 | |
Media—0.2% | | | | | | | | |
Imax Corp.(a)(b) | | | 3,600 | | | | 69,228 | |
Pharmaceuticals, Biotechnology & Life Sciences—7.5% | |
Aegerion Pharmaceuticals, Inc.(a) | | | 12,000 | | | | 157,080 | |
Alexion Pharmaceuticals, Inc.(a) | | | 10,700 | | | | 722,357 | |
Alkermes PLC(a)(b) | | | 7,400 | | | | 129,426 | |
Auxilium Pharmaceuticals, Inc.(a) | | | 8,300 | | | | 129,148 | |
BioMarin Pharmaceutical, Inc.(a) | | | 6,700 | | | | 228,537 | |
Cepheid(a) | | | 8,500 | | | | 304,980 | |
Covance, Inc.(a) | | | 3,400 | | | | 172,482 | |
Endo Pharmaceuticals Holdings, Inc.(a) | | | 6,000 | | | | 193,860 | |
Exact Sciences Corp.(a) | | | 12,800 | | | | 101,760 | |
Forest Laboratories, Inc.(a) | | | 4,700 | | | | 147,110 | |
Illumina, Inc.(a) | | | 2,100 | | | | 64,302 | |
Incyte Corp., Ltd.(a) | | | 22,100 | | | | 304,317 | |
Pharmasset, Inc.(a) | | | 5,200 | | | | 366,080 | |
Salix Pharmaceuticals Ltd.(a) | | | 3,600 | | | | 123,318 | |
Seattle Genetics, Inc.(a) | | | 6,800 | | | | 149,600 | |
United Therapeutics Corp.(a) | | | 4,700 | | | | 205,531 | |
| | | | | | | | 3,499,888 | |
Retailing—7.2% | | | | | | | | |
GNC Holdings, Inc.(a) | | | 4,500 | | | | 111,375 | |
Guess?, Inc. | | | 4,300 | | | | 141,857 | |
LKQ Corp.(a) | | | 9,300 | | | $ | 271,374 | |
PetSmart, Inc. | | | 8,400 | | | | 394,380 | |
priceline.com, Inc.(a) | | | 1,925 | | | | 977,361 | |
Tiffany & Co. | | | 1,500 | | | | 119,595 | |
Tractor Supply Co. | | | 12,200 | | | | 865,468 | |
Ulta Salon Cosmetics & Fragrance, Inc.(a) | | | 7,700 | | | | 518,133 | |
| | | | | | | | 3,399,543 | |
Semiconductors & Semiconductor Equipment—2.2% | |
Atmel Corp.(a) | | | 14,400 | | | | 152,064 | |
Broadcom Corp.(a) | | | 2,700 | | | | 97,443 | |
Cavium, Inc.(a) | | | 7,500 | | | | 245,175 | |
Cirrus Logic, Inc.(a) | | | 8,400 | | | | 139,776 | |
Cypress Semiconductor Corp.(a) | | | 10,900 | | | | 208,299 | |
Skyworks Solutions, Inc.(a) | | | 9,500 | | | | 188,195 | |
| | | | | | | | 1,030,952 | |
Software & Services—17.3% | | | | | | | | |
Ariba, Inc.(a) | | | 7,400 | | | | 234,432 | |
Baidu, Inc.—ADR(a) | | | 5,450 | | | | 763,981 | |
Check Point Software Technologies Ltd.(a)(b) | | | 2,700 | | | | 155,601 | |
comScore, Inc.(a) | | | 9,200 | | | | 194,212 | |
Concur Technologies, Inc.(a) | | | 5,900 | | | | 274,468 | |
Equinix, Inc.(a) | | | 2,900 | | | | 278,429 | |
Facebook, Inc.(a)(d)(e)(f) | | | 30,000 | | | | 810,000 | |
FactSet Research Systems, Inc. | | | 2,300 | | | | 228,666 | |
LinkedIn Corp.(a) | | | 1,800 | | | | 161,820 | |
MICROS Systems, Inc.(a) | | | 5,600 | | | | 275,632 | |
NetSuite, Inc.(a) | | | 8,700 | | | | 330,948 | |
Parametric Technology Corp.(a) | | | 20,000 | | | | 416,600 | |
RealD, Inc.(a) | | | 10,000 | | | | 111,700 | |
Red Hat, Inc.(a) | | | 5,400 | | | | 268,110 | |
Rovi Corp.(a) | | | 4,901 | | | | 242,795 | |
Salesforce.com, Inc.(a) | | | 4,300 | | | | 572,631 | |
Sapient Corp. | | | 16,500 | | | | 203,940 | |
Sina Corp.(a)(b) | | | 1,600 | | | | 130,064 | |
Solera Holdings, Inc. | | | 4,900 | | | | 267,687 | |
SuccessFactors, Inc.(a) | | | 9,900 | | | | 264,330 | |
Tencent Holdings Ltd.(b) | | | 8,900 | | | | 209,761 | |
TIBCO Software, Inc.(a) | | | 28,400 | | | | 820,476 | |
Ultimate Software Group, Inc.(a) | | | 5,600 | | | | 337,008 | |
VeriFone Systems, Inc.(a) | | | 4,500 | | | | 189,945 | |
VMware, Inc.(a) | | | 3,900 | | | | 381,225 | |
| | | | | | | | 8,124,461 | |
Technology Hardware & Equipment—7.3% | |
Acme Packet, Inc.(a) | | | 8,700 | | | | 315,027 | |
Apple, Inc.(a) | | | 2,275 | | | | 920,874 | |
Aruba Networks, Inc.(a) | | | 14,000 | | | | 331,660 | |
F5 Networks, Inc.(a) | | | 1,000 | | | | 103,950 | |
Finisar Corp.(a) | | | 4,900 | | | | 100,401 | |
The Accompanying Footnotes are an Integral Part of these Financial Statements.
The Tocqueville Opportunity Fund
Schedule of Investments as of October 31, 2011
| | | | | | | | |
| Common Stocks (continued) | | Shares | | | Value | |
Fusion-io, Inc.(a) | | | 9,700 | | | $ | 300,894 | |
Informatica Corp.(a) | | | 10,200 | | | | 464,100 | |
InterDigital, Inc. | | | 2,000 | | | | 86,900 | |
LogMein, Inc.(a) | | | 2,500 | | | | 101,675 | |
Measurement Specialties, Inc.(a) | | | 4,500 | | | | 140,445 | |
NetApp, Inc.(a) | | | 3,400 | | | | 139,264 | |
Riverbed Technology, Inc.(a) | | | 16,000 | | | | 441,280 | |
| | | | | | | | 3,446,470 | |
Telecommunication Services—0.4% | |
Cogent Communications Group, Inc.(a) | | | 6,000 | | | | 96,300 | |
Towerstream Corp.(a) | | | 34,000 | | | | 97,920 | |
| | | | | | | | 194,220 | |
Transportation—1.7% | | | | | | | | |
Hertz Global Holdings, Inc.(a) | | | 21,500 | | | | 249,400 | |
Kansas City Southern(a) | | | 8,600 | | | | 543,262 | |
| | | | | | | | 792,662 | |
Total Common Stocks
(Cost $40,690,298) | | | | 46,937,613 | |
| Short-Term Investments—0.1% | |
| Principal
Amount |
| | | | |
Repurchase Agreement—0.1% | | | | | | | | |
Repurchase Agreement with U.S. Bank, N.A., 0.01% dated 10/31/2011, due 11/01/2011, collateralized by: Freddie Mac Giant 15 Year Fixed (Pool #G11649) valued at $47,038. Repurchase proceeds of $46,000. | | $ | 46,000 | | | | 46,000 | |
Total Short-Term Investments
(Cost $46,000) | | | | 46,000 | |
Total Investments
(Cost $40,736,298)—100.0% | | | | 46,983,613 | |
Liabilities in Excess of Other Assets—0.0% | | | | (20,777 | ) |
Total Net Assets—100.0% | | | | | | $ | 46,962,836 | |
| | | | | | | | |
Percentages are stated as a percent of net assets.
ADR—American Depository Receipt
| (a) | Non-income producing security. |
| (b) | Foreign issued security. Foreign concentration (including ADRs) was as follows: Britain 0.4%; Bermuda 0.9%; Canada 0.5%; Cayman Islands 4.4%; Ireland 0.3%; Israel 0.6%; Netherlands 1.1% |
| (c) | Affiliated company. See Footnote 8. |
| (d) | Denotes a security is either fully or partially restricted to resale. The aggregate value of restricted securities at October 31, 2011 was $810,000 which represented 1.7% of net assets. |
| (e) | Fair valued security. The aggregate value of fair valued securities as of October 31, 2011 was $810,000 which represented 1.7% of net assets. |
| (f) | Security is considered illiquid and may be difficult to sell. |
The Accompanying Footnotes are an Integral Part of these Financial Statements.
The Tocqueville International Value Fund
Schedule of Investments as of October 31, 2011
| | | | | | | | |
| Common Stocks—95.4% | | Shares | | | Value | |
Australia—2.8% | | | | | | | | |
BHP Billiton Ltd.—ADR | | | 20,000 | | | $ | 1,561,600 | |
Spotless Group Ltd. | | | 1,900,000 | | | | 3,956,442 | |
| | | | | | | | 5,518,042 | |
Belgium—4.3% | | | | | | | | |
Groupe Bruxelles Lambert SA | | | 43,063 | | | | 3,310,107 | |
Mobistar SA | | | 55,000 | | | | 3,129,787 | |
Umicore SA | | | 50,000 | | | | 2,138,957 | |
| | | | | | | | 8,578,851 | |
Canada—1.4% | | | | | | | | |
Barrick Gold Corp. | | | 55,000 | | | | 2,722,500 | |
France—16.4% | | | | | | | | |
Bollore | | | 16,000 | | | | 3,678,951 | |
Cie de St-Gobain | | | 85,000 | | | | 3,928,488 | |
Haulotte Group SA(a) | | | 180,000 | | | | 2,009,400 | |
Ipsen SA | | | 120,000 | | | | 3,960,345 | |
Nexans SA | | | 50,000 | | | | 3,145,129 | |
Sanofi | | | 75,000 | | | | 5,365,428 | |
Total SA—ADR | | | 110,000 | | | | 5,753,000 | |
Vivendi SA | | | 225,000 | | | | 5,027,946 | |
| | | | | | | | 32,868,687 | |
Germany—5.2% | | | | | | | | |
Kloeckner & Co. SE | | | 260,000 | | | | 3,875,226 | |
Siemens AG—ADR | | | 36,000 | | | | 3,778,920 | |
Wacker Neuson SE | | | 220,000 | | | | 2,737,088 | |
| | | | | | | | 10,391,234 | |
Hong Kong—2.8% | | | | | | | | |
Clear Media Ltd.(a) | | | 3,800,000 | | | | 1,448,933 | |
PYI Corp., Ltd. | | | 45,000,000 | | | | 1,370,685 | |
Television Broadcasts Ltd. | | | 500,000 | | | | 2,881,203 | |
| | | | | | | | 5,700,821 | |
Ireland—2.8% | | | | | | | | |
DCC PLC | | | 200,000 | | | | 5,614,353 | |
Italy—3.3% | | | | | | | | |
Interpump Group SpA | | | 408,537 | | | | 2,619,787 | |
Sogefi SpA | | | 1,155,400 | | | | 4,000,402 | |
| | | | | | | | 6,620,189 | |
Japan—21.1% | | | | | | | | |
Bridgestone Corp. | | | 165,000 | | | | 3,868,771 | |
Canon, Inc.—ADR | | | 66,000 | | | | 3,006,300 | |
Hitachi Ltd. | | | 850,000 | | | | 4,554,544 | |
Horiba Ltd. | | | 65,000 | | | | 2,061,917 | |
Hoya Corp. | | | 200,000 | | | | 4,369,355 | |
Kyoto Kimono Yuzen Co., Ltd. | | | 299,500 | | | | 3,484,003 | |
Makita Corp. | | | 110,000 | | | | 4,106,691 | |
MISUMI Group, Inc. | | | 140,000 | | | | 2,913,023 | |
Omron Corp. | | | 200,000 | | | | 4,310,278 | |
SMC Corp. | | | 33,000 | | | $ | 5,132,877 | |
Takata Corp. | | | 180,000 | | | | 4,377,761 | |
| | | | | | | | 42,185,520 | |
Luxembourg—0.9% | | | | | | | | |
SAF-Holland SA(a) | | | 298,484 | | | | 1,840,655 | |
Mexico—1.4% | | | | | | | | |
Fomento Economico Mexicano S.A.B. de C.V.—ADR | | | 42,000 | | | | 2,816,100 | |
Netherlands—7.3% | | | | | | | | |
Akzo Nobel NV | | | 95,000 | | | | 4,995,295 | |
Koninklijke Philips Electronics
NV—ADR | | | 190,000 | | | | 3,961,500 | |
Unilever NV—ADR | | | 165,000 | | | | 5,697,450 | |
| | | | | | | | 14,654,245 | |
Norway—5.3% | | | | | | | | |
Orkla ASA | | | 600,000 | | | | 5,201,578 | |
Statoil ASA—ADR | | | 210,000 | | | | 5,340,300 | |
| | | | | | | | 10,541,878 | |
Spain—4.6% | | | | | | | | |
Banco Santander SA—ADR | | | 310,000 | | | | 2,653,600 | |
Indra Sistemas SA | | | 250,000 | | | | 4,189,071 | |
Melia Hotels International SA | | | 314,000 | | | | 2,302,022 | |
| | | | | | | | 9,144,693 | |
Switzerland—2.2% | | | | | | | | |
Nestle SA | | | 75,000 | | | | 4,337,827 | |
United Kingdom—8.4% | | | | | | | | |
Experian PLC | | | 250,000 | | | | 3,247,685 | |
Halfords Group PLC | | | 650,000 | | | | 3,408,682 | |
Interserve PLC | | | 650,000 | | | | 3,444,794 | |
Invensys PLC | | | 400,000 | | | | 1,447,109 | |
Vodafone Group PLC—ADR | | | 190,000 | | | | 5,289,600 | |
| | | | | | | | 16,837,870 | |
United States—5.2% | | | | | | | | |
Aflac, Inc. | | | 95,000 | | | | 4,283,550 | |
Newmont Mining Corp. | | | 90,000 | | | | 6,014,700 | |
| | | | | | | | 10,298,250 | |
Total Common Stocks
(Cost $183,200,366) | | | | | | | 190,671,715 | |
The Accompanying Footnotes are an Integral Part of these Financial Statements.
The Tocqueville International Value Fund
Schedule of Investments as of October 31, 2011
| | | | | | | | |
| Short-Term Investments—4.1% | | Principal
Amount | | | Value | |
Repurchase Agreement—4.1% | | | | | | | | |
Repurchase Agreement with U.S. Bank, N.A., 0.01% dated 10/31/2011, due 11/01/2011, collateralized by: Freddie Mac Giant 15 Year Fixed (Pool #G11440) valued at $8,278,402. Repurchase proceeds of $8,116,002. | | $ | 8,116,000 | | | $ | 8,116,000 | |
Total Short-Term Investments (Cost $8,116,000) | | | | | | | 8,116,000 | |
Total Investments
(Cost $191,316,366)—99.5% | | | | | | | 198,787,715 | |
Other Assets in Excess of Liabilities—0.5% | | | | 1,060,211 | |
Total Net Assets—100.0% | | | | | | $ | 199,847,926 | |
| | | | | | | | |
Percentages are stated as a percent of net assets.
ADR—American Depository Receipt
| (a) | Non-income producing security. |
Schedule of Open Forward Currency Contracts
| | | | | | | | | | | | | | | | | | | | |
| Forward Expiration Date | | Currency to be
Received | | | Currency to be
Delivered | | | Amount of
Currency to be
Delivered | | | Amount of
Currency to be
Received | | | Unrealized
Appreciation
(Depreciation) | |
11/17/2011 | | | U.S. Dollars | | | | Euro | | | | 7,000,000 | | | | 9,585,660 | | | $ | (98,533 | ) |
11/30/2011 | | | U.S. Dollars | | | | Euro | | | | 5,000,000 | | | | 7,069,150 | | | | 152,708 | |
11/30/2011 | | | U.S. Dollars | | | | Euro | | | | 3,000,000 | | | | 4,201,290 | | | | 51,424 | |
| | | | | | | | | | | | | | | | | | | | |
| | | | | | | | | | | | | | | | | | $ | 105,599 | |
| | | | | | | | | | | | | | | | | | | | |
The Accompanying Footnotes are an Integral Part of these Financial Statements.
The Tocqueville Gold Fund
Schedule of Investments as of October 31, 2011
| | | | | | | | |
| Common Stocks—86.5% | | Shares | | | Value | |
Gold Related Securities—79.7% | |
Australia—1.1% | |
Eldorado Gold Corp.(a)(g) | | | 1,544,785 | | | $ | 28,914,046 | |
Canada—55.3% | |
Agnico Eagle Mines Ltd. | | | 877,000 | | | | 38,053,030 | |
Agnico Eagle Mines Ltd.(g) | | | 210,837 | | | | 9,146,317 | |
Alacer Gold Corp.(a) | | | 4,626,800 | | | | 53,381,690 | |
Alamos Gold, Inc. | | | 3,395,200 | | | | 62,845,688 | |
Allied Gold Ltd.(a) | | | 3,976,667 | | | | 9,575,119 | |
Atac Resources Ltd.(a)(b) | | | 10,261,700 | | | | 43,239,669 | |
Banro Corp.(a) | | | 7,519,500 | | | | 31,986,637 | |
Barisan Gold Corp.(a) | | | 877,100 | | | | 391,582 | |
Barrick Gold Corp. | | | 1,207,300 | | | | 59,761,350 | |
Blue Gold Mining, Inc.(a)(b)(c)(d)(e) | | | 4,000,000 | | | | 4,011,437 | |
Brazilian Gold Corp.(a) | | | 4,285,800 | | | | 2,407,874 | |
Corvus Gold, Inc.(a)(b) | | | 2,079,901 | | | | 1,314,610 | |
Detour Gold Corp. | | | 1,890,600 | | | | 62,593,228 | |
East Asia Mineral Corp.(a) | | | 4,044,400 | | | | 3,570,677 | |
Eldorado Gold Corp. | | | 250,000 | | | | 4,717,500 | |
Eldorado Gold Corp.(a)(g) | | | 2,026,800 | | | | 38,085,742 | |
European Goldfields Ltd. | | | 4,255,200 | | | | 47,899,016 | |
Franco-Nevada Corp. | | | 1,635,900 | | | | 64,812,331 | |
Geomark Exploration Ltd.(a) | | | 1,337,800 | | | | 1,174,392 | |
Goldcorp, Inc. | | | 718,050 | | | | 35,069,562 | |
Goldcorp, Inc.(g) | | | 2,138,010 | | | | 104,031,588 | |
HudBay Minerals, Inc. | | | 378,700 | | | | 4,146,765 | |
IAMGOLD Corp. | | | 300,000 | | | | 6,450,000 | |
IAMGOLD Corp.(g) | | | 3,416,796 | | | | 73,460,686 | |
International Tower Hill Mines Ltd.(a)(b)(g) | | | 5,666,667 | | | | 28,539,422 | |
International Tower Hill Mines Ltd.(a)(b) | | | 2,493,136 | | | | 12,839,650 | |
Ivanhoe Mines Ltd.(a) | | | 5,137,050 | | | | 105,137,517 | |
Kinross Gold Corp. | | | 2,459,600 | | | | 35,295,260 | |
Minefinders Corp.(a) | | | 1,041,000 | | | | 14,757,291 | |
Nevsun Resources Ltd. | | | 1,441,400 | | | | 7,606,485 | |
New Gold, Inc.(a) | | | 1,589,100 | | | | 19,673,058 | |
New Gold, Inc.(a)(g) | | | 3,871,140 | | | | 47,964,464 | |
Novagold Resources, Inc.(a) | | | 500,000 | | | | 4,589,917 | |
Orezone Gold Corp.(a) | | | 2,145,462 | | | | 7,748,847 | |
Osisko Mining Corp.(a) | | | 8,684,500 | | | | 104,728,057 | |
Pan American Silver Corp. | | | 1,499,466 | | | | 41,925,069 | |
Pan American Silver Corp.(g) | | | 61,536 | | | | 1,719,366 | |
Premier Gold Mines Ltd.(a) | | | 986,000 | | | | 5,193,378 | |
Primero Mining Corp.(a) | | | 4,264,800 | | | | 11,980,376 | |
Rockhaven Resources Ltd.(a)(b) | | | 5,000,000 | | | | 2,508,151 | |
Romarco Minerals, Inc.(a) | | | 16,887,800 | | | | 16,604,007 | |
SEMAFO, Inc.(a) | | | 5,200,000 | | | | 39,909,707 | |
Silver Wheaton Corp. | | | 2,714,875 | | | $ | 93,750,687 | |
Strategic Metals Ltd.(a)(b) | | | 10,350,000 | | | | 14,329,571 | |
Torex Gold Resources, Inc.(a) | | | 11,267,400 | | | | 17,182,291 | |
Wesdome Gold Mines Ltd. | | | 1,469,700 | | | | 3,715,720 | |
Yamana Gold, Inc. | | | 4,317,500 | | | | 64,632,975 | |
| | | | | | | | 1,464,457,756 | |
Peru—1.5% | |
Cia de Minas Buenaventura SA—ADR | | | 953,600 | | | | 39,030,848 | |
South Africa—3.8% | | | | | | | | |
AngloGold Ashanti Ltd.—ADR | | | 824,300 | | | | 37,266,603 | |
Gold Fields Ltd.(g) | | | 166,249 | | | | 2,874,345 | |
Gold Fields Ltd. | | | 1,811,500 | | | | 31,574,445 | |
Harmony Gold Mining Co. Ltd.(g) | | | 1 | | | | 13 | |
Harmony Gold Mining Co. Ltd.—ADR | | | 2,027,900 | | | | 26,626,327 | |
Witwatersrand Consolidated Gold Resources Ltd.(a) | | | 335,000 | | | | 1,773,045 | |
| | | | | | | | 100,114,778 | |
United Kingdom—4.1% | |
Randgold Resources
Ltd.—ADR | | | 983,200 | | | | 107,729,224 | |
United States—13.9% | | | | | | | | |
Allied Nevada Gold Corp.(a) | | | 1,229,848 | | | | 46,709,627 | |
Electrum Ltd.(a)(c)(d)(e) | | | 2,127,287 | | | | 11,912,807 | |
Freeport-McMoRan Copper & Gold, Inc. | | | 600,000 | | | | 24,156,000 | |
Gold Resource Corp.(b) | | | 3,642,297 | | | | 81,951,682 | |
Newmont Mining Corp. | | | 1,814,800 | | | | 121,283,084 | |
Royal Gold, Inc. | | | 1,152,165 | | | | 82,471,971 | |
| | | | | | | | 368,485,171 | |
Total Gold Related | | | | | | | 2,108,731,823 | |
Other Precious Metals Related Securities—5.3% | |
Canada—3.9% | |
Scorpio Mining Corp.(a)(b) | | | 26,190,819 | | | | 53,077,948 | |
Silver Range Resources Ltd.(a)(b) | | | 3,450,000 | | | | 3,980,436 | |
Tahoe Resources, Inc.(a) | | | 2,406,600 | | | | 45,415,747 | |
| | | | | | | | 102,474,131 | |
South Africa—0.6% | |
Ivanplats(a)(c)(d)(e) | | | 4,989,165 | | | | 14,967,495 | |
United States—0.8% | |
Sunshine Silver Mines(a)(c)(d)(e) | | | 1,633,545 | | | | 22,583,760 | |
Total Other Precious Metals Related | | | | | | | 140,025,386 | |
The Accompanying Footnotes are an Integral Part of these Financial Statements.
The Tocqueville Gold Fund
Schedule of Investments as of October 31, 2011
| | | | | | | | |
| Common Stocks (continued) | | Shares | | | Value | |
Other Securities—1.5% | |
Australia—0.3% | |
Ivanhoe Australia Ltd.(a) | | | 6,464,000 | | | $ | 7,289,253 | |
Panoramic Resources Ltd. | | | 153,660 | | | | 224,289 | |
| | | | | | | | 7,513,542 | |
Canada—0.6% | | | | | | | | |
Cameco Corp. | | | 480,300 | | | | 10,292,829 | |
Trevali Mining Corp.(a)(b)(c)(d)(e) | | | 8,000,000 | | | | 7,079,007 | |
| | | | | | | | 17,371,836 | |
United Kingdom—0.2% | |
Copper Development Corp.(a) | | | 12,512,000 | | | | 4,627,144 | |
United States—0.4% | | | | | | | | |
Gold Bullion International LLC(c)(d)(e) | | | 5,000,000 | | | | 5,000,000 | |
GoviEx Uranium, Inc.(a)(c)(d)(e) | | | 1,750,000 | | | | 5,250,000 | |
I-Pulse, Inc.(c)(d)(e) | | | 74,532 | | | | 156,517 | |
| | | | | | | | 10,406,517 | |
Total Other | | | | | | | 39,919,039 | |
Total Common Stocks
(Cost $1,404,486,719) | | | | | | | 2,288,676,248 | |
Closed-End Mutual Fund—0.8% | |
Gold Related Securities—0.8% | |
Sprott Physical Gold Trust(a) | | | 1,400,000 | | | | 20,706,000 | |
Total Closed-End Mutual Fund
(Cost $14,500,000) | | | | 20,706,000 | |
| Gold Bullion—6.3% | | | Ounces | | | | | |
Gold Bullion(a) | | | 98,032 | | | | 168,109,671 | |
Total Gold Bullion
(Cost $44,609,241) | | | | 168,109,671 | |
| Warrants—0.2% | | | Shares | | | | | |
Gold Related—0.1% | |
Canada—0.1% | |
Blue Gold Mining, Inc. Expiration: 9/20/2013, Exercise Price:
CAD $1.50(a)(b)(c)(d)(e) | | | 2,000,000 | | | | 917 | |
Kinross Gold Corp. Expiration: 9/3/2013, Exercise Price:
CAD $32.00(a) | | | 108,032 | | | | 107,300 | |
Minefinders Corp. Expiration: 12/31/2011, Exercise Price:
CAD $5.00(a) | | | 125,000 | | | | 1,156,258 | |
Pan American Silver Corp. Expiration: 1/4/2015, Exercise Price:
CAD $35.00(a)(c)(d)(e) | | | 133,333 | | | | 785,122 | |
Primero Mining Corp. Expiration: 7/20/2015, Exercise Price:
CAD $8.00(a) | | | 1,848,400 | | | $ | 723,227 | |
Torex Gold Resources, Inc. Expiration: 11/12/2011, Exercise Price:
CAD $1.30(a) | | | 1,250,000 | | | | 294,708 | |
| | | | | | | | 3,067,532 | |
Cayman Islands—0.0% | |
Endeavour Mining Corp. Expiration: 1/30/2014, Exercise Price:
CAD $2.50(a) | | | 1,000,000 | | | | 591,924 | |
Total Gold Related Securities | | | | | | | 3,659,456 | |
Other Precious Metals Related—0.1% | |
Canada—0.1% | |
Silver Range Resources Ltd. Expiration: 2/10/2013, Exercise Price: $0.85(a) | | | 1,725,000 | | | | 865,312 | |
South Africa—0.0% | |
Ivanplats IPO Warrants Expiration:
12/31/2011(a)(c)(d)(e) | | | 487,500 | | | | — | |
Total Other Precious Metals
Related | | | | | | | 865,312 | |
Total Warrants
(Cost $1,314,861) | | | | | | | 4,524,768 | |
| Short-Term Investments—6.3% | |
| Principal
Amount |
| | | | |
U.S. Treasury Bills—4.9% | | | | | | | | |
United States Treasury Bills
0.015%, 12/08/2011(f) | | $ | 30,000,000 | | | | 29,999,923 | |
0.015%, 02/09/2012(f) | | | 50,000,000 | | | | 49,998,250 | |
0.005%, 03/08/2012(f) | | | 50,000,000 | | | | 49,996,000 | |
| | | | | | | | 129,994,173 | |
Repurchase Agreement—1.4% | |
Repurchase Agreement with U.S. Bank, N.A., 0.01% dated 10/31/2011, due 11/01/2011, collateralized by: Fannie Mae Conventional Level Pay 15 Year Fixed (Pool #555408) valued at $37,252,622. Repurchase proceeds of $36,522,010. | | | 36,522,000 | | | | 36,522,000 | |
Total Short-Term Investments
(Cost $166,519,076) | | | | | | | 166,516,173 | |
The Accompanying Footnotes are an Integral Part of these Financial Statements.
The Tocqueville Gold Fund
Schedule of Investments as of October 31, 2011
| | | | | | |
Repurchase Agreement
(continued) | | Principal
Amount | | Value | |
Total Investments
(Cost $1,631,429,897)—100.1% | | $ | 2,648,532,860 | |
Liabilities in Excess of Other Assets—(0.1)% | | | (1,454,939 | ) |
Total Net Assests—100.0% | | $ | 2,647,077,921 | |
| | | | | | |
Percentages are stated as a percent of net assets.
ADR—American Depository Reciept
| (a) | Non-income producing security. |
| (b) | Affiliated company. See Footnote 8. |
| (c) | Denotes a security is either fully or partially restricted to resale. The aggregate value of restricted securites at October 31, 2011 was $71,747,062, which represented 2.7% of net assets. |
| (d) | Fair valued security. The aggregate value of fair valued securities as of October 31, 2011 was $71,747,062, which represented 2.7% of net assets. |
| (e) | Security is considered illiquid an may be difficult to sell. |
| (f) | Rate shown is the effective yield based on purchase price. The calculation assumes the security is held to maturity. |
| (g) | Denotes an issue that is traded on a foreign exchange when a company is listed more than once. |
The Accompanying Footnotes are an Integral Part of these Financial Statements.
The Delafield Fund
Schedule of Investments as of October 31, 2011
| | | | | | | | |
| Common Stocks—84.7% | | Shares | | | Value | |
Aerospace & Defense—2.5% | |
Honeywell International, Inc. | | | 595,000 | | | $ | 31,178,000 | |
Building Products—2.2% | |
Griffon Corp.(a) | | | 1,550,000 | | | | 14,678,500 | |
NCI Building Systems, Inc.(a) | | | 500,000 | | | | 4,555,000 | |
Trex Co., Inc.(a) | | | 475,000 | | | | 8,778,000 | |
| | | | | | | | 28,011,500 | |
Chemicals—18.6% | |
A. Schulman, Inc. | | | 475,000 | | | | 10,027,250 | |
Ashland, Inc. | | | 500,000 | | | | 26,480,000 | |
Celanese Corp. | | | 825,000 | | �� | | 35,928,750 | |
Cytec Industries, Inc. | | | 375,000 | | | | 16,751,250 | |
Eastman Chemical Co. | | | 700,000 | | | | 27,503,000 | |
Ferro Corp.(a) | | | 2,400,000 | | | | 15,528,000 | |
FMC Corp. | | | 375,000 | | | | 29,583,750 | |
Minerals Technologies, Inc.(b) | | | 420,000 | | | | 23,032,800 | |
PolyOne Corp. | | | 1,700,000 | | | | 19,023,000 | |
Solutia, Inc.(a) | | | 1,150,000 | | | | 18,687,500 | |
Tronox, Inc.(a) | | | 100,000 | | | | 12,400,000 | |
| | | | | | | | 234,945,300 | |
Commercial Banks—0.8% | |
Hancock Holding Co. | | | 350,000 | | | | 10,605,000 | |
Commercial Services & Supplies—1.9% | |
Avery Dennison Corp. | | | 500,000 | | | | 13,300,000 | |
RR Donnelley & Sons Co. | | | 675,000 | | | | 11,002,500 | |
| | | | | | | | 24,302,500 | |
Communications Equipment—1.7% | |
Harris Corp. | | | 550,000 | | | | 20,762,500 | |
Computers & Peripherals—0.8% | |
Diebold, Inc. | | | 300,000 | | | | 9,684,000 | |
Construction & Engineering—0.8% | |
Aegion Corp.(a) | | | 700,000 | | | | 10,353,000 | |
Containers & Packaging—3.3% | |
Owens-Illinois, Inc.(a) | | | 750,000 | | | | 15,060,000 | |
Sealed Air Corp. | | | 600,000 | | | | 10,680,000 | |
Sonoco Products Co. | | | 500,000 | | | | 15,695,000 | |
| | | | | | | | 41,435,000 | |
Electrical Equipment—6.3% | |
Acuity Brands, Inc. | | | 375,000 | | | | 17,362,500 | |
AMETEK, Inc. | | | 275,000 | | | | 10,868,000 | |
Belden, Inc. | | | 275,000 | | | | 8,877,000 | |
Brady Corp. | | | 455,000 | | | | 13,977,600 | |
Cooper Industries PLC(c) | | | 150,000 | | | | 7,869,000 | |
Hubbell, Inc. | | | 350,000 | | | | 20,926,500 | |
| | | | | | | | 79,880,600 | |
Electronic Equipment, Instruments & Components—8.0% | |
Checkpoint Systems, Inc.(a)(b) | | | 2,150,000 | | | $ | 28,487,500 | |
Corning, Inc. | | | 1,000,000 | | | | 14,290,000 | |
Flextronics International Ltd.(a)(c) | | | 4,000,000 | | | | 26,260,000 | |
Ingram Micro, Inc.(a) | | | 850,000 | | | | 15,198,000 | |
Plexus Corp.(a) | | | 650,000 | | | | 16,705,000 | |
| | | | | | | | 100,940,500 | |
Health Care Equipment & Supplies—1.2% | |
Teleflex, Inc. | | | 250,000 | | | | 14,965,000 | |
Household Durables—2.9% | |
Ethan Allen Interiors, Inc. | | | 250,000 | | | | 4,950,000 | |
Stanley Black & Decker, Inc. | | | 490,000 | | | | 31,286,500 | |
| | | | | | | | 36,236,500 | |
Industrial Conglomerates—5.1% | |
Carlisle Companies, Inc. | | | 675,000 | | | | 28,161,000 | |
Tyco International Ltd.(c) | | | 800,000 | | | | 36,440,000 | |
| | | | | | | | 64,601,000 | |
Life Sciences Tools & Services—1.3% | |
Thermo Fisher Scientific, Inc.(a) | | | 325,000 | | | | 16,337,750 | |
Machinery—12.3% | |
Albany International Corp.(b) | | | 725,000 | | | | 16,377,750 | |
Crane Co. | | | 315,000 | | | | 13,894,650 | |
Dover Corp. | | | 700,000 | | | | 38,871,000 | |
Federal Signal Corp. | | | 1,900,000 | | | | 8,968,000 | |
IDEX Corp. | | | 350,000 | | | | 12,407,500 | |
Ingersoll-Rand PLC(c) | | | 650,000 | | | | 20,234,500 | |
Kennametal, Inc. | | | 900,000 | | | | 35,001,000 | |
Timken Co. | | | 225,000 | | | | 9,477,000 | |
| | | | | | | | 155,231,400 | |
Metals & Mining—0.7% | |
Universal Stainless & Alloy(a) | | | 234,000 | | | | 8,810,100 | |
Oil, Gas & Consumable Fuels—1.6% | |
El Paso Corp. | | | 825,000 | | | | 20,633,250 | |
Professional Services—1.5% | |
TrueBlue, Inc.(a) | | | 1,475,000 | | | | 19,499,500 | |
Semiconductors & Semiconductor Equipment—6.2% | |
Brooks Automation, Inc. | | | 1,150,000 | | | | 12,017,500 | |
Diodes, Inc.(a) | | | 550,000 | | | | 12,303,500 | |
Fairchild Semiconductor International, Inc.(a) | | | 1,300,000 | | | | 19,461,000 | |
Formfactor, Inc.(a) | | | 600,000 | | | | 3,588,000 | |
International Rectifier Corp.(a) | | | 30,000 | | | | 728,700 | |
LTX-Credence Corp.(a) | | | 2,000,000 | | | | 12,660,000 | |
Teradyne, Inc.(a) | | | 1,225,000 | | | | 17,542,000 | |
| | | | | | | | 78,300,700 | |
The Accompanying Footnotes are an Integral Part of these Financial Statements.
The Delafield Fund
Schedule of Investments as of October 31, 2011
| | | | | | | | |
| Common Stocks (continued) | | Shares | | | Value | |
Specialty Retail—2.2% | |
Collective Brands, Inc.(a) | | | 1,875,000 | | | $ | 27,393,750 | |
Trading Companies & Distributors—2.8% | |
Rush Enterprises, Inc.(a) | | | 625,000 | | | | 12,062,500 | |
WESCO International, Inc.(a) | | | 475,000 | | | | 23,018,500 | |
| | | | | | | | 35,081,000 | |
Total Common Stocks
(Cost $985,253,130) | | | | | | | 1,069,187,850 | |
Real Estate Investment Trust (REITs)—0.8% | |
Real Estate—0.8% | |
Kimco Realty Corp. | | | 600,000 | | | | 10,482,000 | |
Total Real Estate Investment Trust
(Cost $5,230,553) | | | | 10,482,000 | |
Short-Term Investments—12.7% | |
Money Market Fund—12.7% | |
AIM STIT-Treasury Portfolio,
0.02%(d) | | | 160,313,530 | | | | 160,313,530 | |
Total Short-Term Investments
(Cost $160,313,530) | | | | | | | 160,313,530 | |
Total Investments
(Cost $1,150,797,213)—98.2% | | | | 1,239,983,380 | |
Other Assets in Excess of Liabilities—1.8% | | | | 22,892,398 | |
Total Net Assets—100.0% | | | | | | $ | 1,262,875,778 | |
| | | | | | | | |
Percentages are stated as a percent of net assets.
| (a) | Non-income producing security. |
| (b) | Affiliated company. See Footnote 8. |
| (c) | Foreign issued security. Foreign concentration (including ADRs) was as follows: Ireland 2.2%; Singapore 2.1%; Switzerland 2.9%. |
| (d) | Variable rate security. The rate listed is as of October 31, 2011. |
The Accompanying Footnotes are an Integral Part of these Financial Statements.
The Tocqueville Select Fund
Schedule of Investments as of October 31, 2011
| | | | | | | | |
| Common Stocks—87.8% | | Shares | | | Value | |
Chemicals—13.9% | | | | | | | | |
Ashland, Inc. | | | 42,200 | | | $ | 2,234,912 | |
Celanese Corp. | | | 56,000 | | | | 2,438,800 | |
Cytec Industries, Inc. | | | 19,700 | | | | 879,999 | |
Minerals Technologies, Inc. (a) | | | 40,000 | | | | 2,193,600 | |
Solutia, Inc. (b) | | | 135,000 | | | | 2,193,750 | |
| | | | | | | | 9,941,061 | |
Communications Equipment—3.1% | | | | | |
Harris Corp. | | | 59,500 | | | | 2,246,125 | |
Containers & Packaging—3.4% | | | | | | | | |
Sonoco Products Co. | | | 77,400 | | | | 2,429,586 | |
Diversified Consumer Services—3.6% | | | | | |
Summer Infant, Inc. | | | 324,933 | | | | 2,540,976 | |
Electrical Equipment—2.4% | | | | | | | | |
Acuity Brands, Inc. | | | 36,500 | | | | 1,689,950 | |
Electronic Equipment, Instruments & Components—6.7% | |
Checkpoint Systems, Inc. (a)(b) | | | 173,000 | | | | 2,292,250 | |
Flextronics International Ltd. (b)(c) | | | 382,200 | | | | 2,509,143 | |
| | | | | | | | 4,801,393 | |
Household Durables—9.3% | | | | | | | | |
Ethan Allen Interiors, Inc. | | | 95,500 | | | | 1,890,900 | |
Stanley Black & Decker, Inc. | | | 28,200 | | | | 1,800,570 | |
Universal Electronics, Inc. (b) | | | 158,900 | | | | 2,953,951 | |
| | | | | | | | 6,645,421 | |
Industrial Conglomerates—3.4% | | | | | | | | |
Carlisle Companies, Inc. | | | 59,000 | | | | 2,461,480 | |
Internet Software & Services—3.8% | | | | | |
j2 Global Communications, Inc. | | | 88,300 | | | | 2,717,874 | |
Machinery—17.5% | | | | | | | | |
Albany International Corp. (a) | | | 119,500 | | | | 2,699,505 | |
Barnes Group, Inc. | | | 53,000 | | | | 1,233,310 | |
Ingersoll-Rand PLC (c) | | | 76,000 | | | | 2,365,880 | |
Kennametal, Inc. | | | 89,000 | | | | 3,461,210 | |
Trimas Corp. (b) | | | 140,400 | | | | 2,736,396 | |
| | | | | | | | 12,496,301 | |
Professional Services—4.1% | | | | | | | | |
Stantec, Inc. (b)(c) | | | 121,100 | | | | 2,969,372 | |
Semiconductors & Semiconductor Equipment—3.4% | |
Diodes, Inc. (b) | | | 108,000 | | | | 2,415,960 | |
Software—4.0% | | | | | | | | |
Monotype Imaging Holdings, Inc. (b) | | | 210,000 | | | | 2,849,700 | |
Specialty Retail—5.8% | | | | | | | | |
Collective Brands, Inc. (b) | | | 200,900 | | | | 2,935,149 | |
Foot Locker, Inc. | | | 56,000 | | | | 1,224,160 | |
| | | | | | | | 4,159,309 | |
Textiles, Apparel & Luxury Goods—3.4% | |
Maidenform Brands, Inc. (b) | | | 100,400 | | | $ | 2,467,832 | |
Total Common Stocks
(Cost $58,080,687) | | | | | | | 62,832,340 | |
Short-Term Investments—12.1% | | | | | | | | |
Money Market Fund—12.1% | | | | | | | | |
AIM STIT-Treasury Portfolio, 0.02% (d) | | | 8,636,297 | | | | 8,636,297 | |
Total Short-Term Investments
(Cost $8,636,296) | | | | | | | 8,636,297 | |
Total Investments
(Cost $66,716,983)—99.9% | | | | 71,468,637 | |
Other Assets in Excess of Liabilities—0.1% | | | | 85,112 | |
Total Net Assets—100.0% | | | | | | $ | 71,553,749 | |
| | | | | | | | |
Percentages are stated as a percent of net assets.
| (a) | Affiliated company. See Footnote 8. |
| (b) | Non-income producing security. |
| (c) | Foreign issued security. Foreign concentration was as follows: Canada 4.1%; Ireland 3.3%; Singapore 3.5%. |
| (d) | Variable rate security. The rate shown is as of October 31, 2011. |
The Accompanying Footnotes are an Integral Part of these Financial Statements.
Percent of Total Investments
The Tocqueville Fund
Allocation of Portfolio Holdings
October 31, 2011

The Tocqueville Opportunity Fund
Allocation of Portfolio Holdings
October 31, 2011
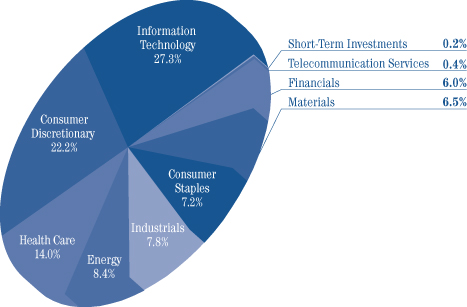
Percent of Total Investments
The Tocqueville International Value Fund
Allocation of Portfolio Holdings
October 31, 2011
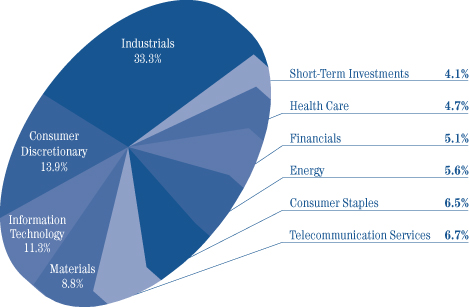
The Tocqueville Gold Fund
Allocation of Portfolio Holdings
October 31, 2011
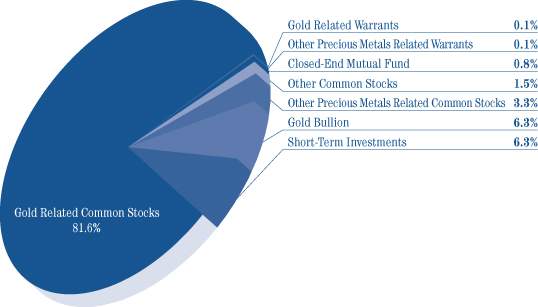
Percent of Total Investments
The Delafield Fund
Allocation of Portfolio Holdings
October 31, 2011
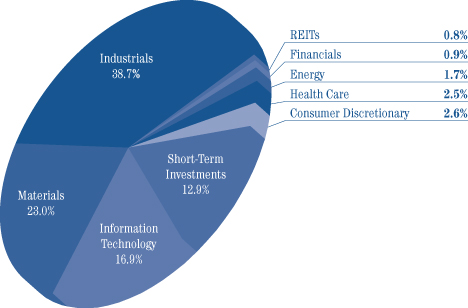
The Tocqueville Select Fund
Allocation of Portfolio Holdings
October 31, 2011
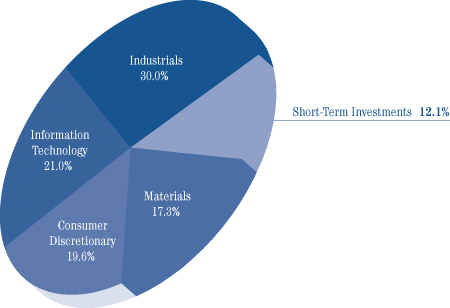
The Tocqueville Trust
Statements of Assets and Liabilities
October 31, 2011
| | | | | | | | | | | | | | | | | | | | | | | | |
| | | The
Tocqueville
Fund | | | Opportunity
Fund | | | International
Value
Fund | | | Gold
Fund | | | Delafield
Fund | | | Select
Fund | |
Assets | | | | | | | | | | | | | | | | | | | | | | | | |
Investments, at value (1) | | | | | | | | | | | | | | | | | | | | | | | | |
Unaffiliated issuers | | $ | 488,165,852 | | | $ | 46,873,933 | | | $ | 198,787,715 | | | $ | 2,316,889,114 | | | $ | 1,172,085,330 | | | $ | 64,283,282 | |
Affiliated issuers | | | — | | | | 109,680 | | | | — | | | | 331,643,746 | | | | 67,898,050 | | | | 7,185,355 | |
Foreign currencies (2) | | | — | | | | — | | | | — | | | | 885,440 | | | | — | | | | — | |
Cash | | | — | | | | 182 | | | | 479 | | | | 542 | | | | — | | | | — | |
Appreciation on forward currency contracts | | | — | | | | — | | | | 105,599 | | | | — | | | | — | | | | — | |
Receivable for investments sold | | | 4,174,538 | | | | 644,701 | | | | — | | | | — | | | | 21,855,085 | | | | — | |
Receivable for fund shares sold | | | 1,245,773 | | | | 5,846 | | | | 1,063,548 | | | | 10,739,892 | | | | 6,402,126 | | | | 180,777 | |
Dividends, interest and other receivables | | | 282,797 | | | | 7,344 | | | | 577,688 | | | | 150,163 | | | | 401,251 | | | | 8,262 | |
Prepaid assets | | | 22,527 | | | | 11,719 | | | | 21,979 | | | | 107,672 | | | | 49,744 | | | | 18,516 | |
| | | | | | | | | | | | | | | | | | | | | | | | |
Total Assets | | | 493,891,487 | | | | 47,653,405 | | | | 200,557,008 | | | | 2,660,416,569 | | | | 1,268,691,586 | | | | 71,676,192 | |
| | | | | | | | | | | | | | | | | | | | | | | | |
Liabilities | | | | | | | | | | | | | | | | | | | | | | | | |
Payable for investments purchased | | | — | | | | 625,250 | | | | 108,036 | | | | 4,829,323 | | | | — | | | | — | |
Payable for loans outstanding | | | 1,228,453 | | | | — | | | | — | | | | — | | | | — | | | | — | |
Payable for currencies purchased | | | — | | | | — | | | | — | | | | 848,361 | | | | — | | | | — | |
Payable for fund shares redeemed | | | 567,923 | | | | 1,734 | | | | 290,002 | | | | 4,691,543 | | | | 4,341,652 | | | | 26,090 | |
Payable to Adviser | | | 276,486 | | | | 27,978 | | | | 167,906 | | | | 1,566,276 | | | | 730,583 | | | | 45,879 | |
Payable to Administrator | | | 88,049 | | | | 7,669 | | | | 34,843 | | | | 466,597 | | | | 227,011 | | | | 13,043 | |
Accrued distribution fee | | | 42,373 | | | | 8,356 | | | | 29,571 | | | | 114,783 | | | | 104,964 | | | | 8,683 | |
Payable to Trustees | | | 12,983 | | | | 947 | | | | 4,660 | | | | 71,721 | | | | 28,926 | | | | 1,958 | |
Payable to Chief Compliance Officer | | | 1,015 | | | | 91 | | | | 463 | | | | 6,265 | | | | 2,518 | | | | 147 | |
Accrued expenses and other liabilities | | | 132,865 | | | | 18,544 | | | | 73,601 | | | | 743,779 | | | | 380,154 | | | | 26,643 | |
| | | | | | | | | | | | | | | | | | | | | | | | |
Total Liabilities | | | 2,350,147 | | | | 690,569 | | | | 709,082 | | | | 13,338,648 | | | | 5,815,808 | | | | 122,443 | |
| | | | | | | | | | | | | | | | | | | | | | | | |
Net Assets | | $ | 491,541,340 | | | $ | 46,962,836 | | | $ | 199,847,926 | | | $ | 2,647,077,921 | | | $ | 1,262,875,778 | | | $ | 71,553,749 | |
| | | | | | | | | | | | | | | | | | | | | | | | |
Net assets consist of: | | | | | | | | | | | | | | | | | | | | | | | | |
Paid in capital | | $ | 489,615,303 | | | $ | 45,901,536 | | | $ | 198,789,133 | | | $ | 1,614,678,730 | | | $ | 1,157,546,664 | | | $ | 66,284,048 | |
Accumulated net investment income (loss) | | | 4,136,952 | | | | — | | | | 1,155,644 | | | | (26,998,621 | ) | | | — | | | | (8,797 | ) |
Accumulated net realized gain (loss) | | | (31,749,817 | ) | | | (5,186,015 | ) | | | (7,683,136 | ) | | | 42,282,109 | | | | 16,142,947 | | | | 526,844 | |
Net unrealized appreciation on: | | | | | | | | | | | | | | | | | | | | | | | | |
Investments and foreign currency related items | | | 29,538,902 | | | | 6,247,315 | | | | 7,586,285 | | | | 1,017,115,703 | | | | 89,186,167 | | | | 4,751,654 | |
| | | | | | | | | | | | | | | | | | | | | | | | |
Net assets | | $ | 491,541,340 | | | $ | 46,962,836 | | | $ | 199,847,926 | | | $ | 2,647,077,921 | | | $ | 1,262,875,778 | | | $ | 71,553,749 | |
| | | | | | | | | | | | | | | | | | | | | | | | |
Shares of beneficial interest outstanding (unlimited shares of $0.01 par value authorized) | | | 22,113,930 | | | | 3,139,864 | | | | 16,653,810 | | | | 32,293,245 | | | | 46,405,927 | | | | 6,471,340 | |
Net asset value, offering and redemption price per share | | $ | 22.23 | | | $ | 14.96 | | | $ | 12.00 | | | $ | 81.97 | | | $ | 27.21 | | | $ | 11.06 | |
| | | | | | | | | | | | | | | | | | | | | | | | |
(1) Cost of Investments | | | | | | | | | | | | | | | | | | | | | | | | |
Unaffiliated issuers | | $ | 458,626,950 | | | $ | 40,633,424 | | | $ | 191,316,366 | | | $ | 1,383,235,640 | | | $ | 1,080,044,247 | | | $ | 59,609,942 | |
Affiliated issuers | | $ | — | | | $ | 102,874 | | | $ | — | | | $ | 248,194,257 | | | $ | 70,752,966 | | | $ | 7,107,041 | |
(2) Cost of Foreign Currencies | | $ | — | | | $ | — | | | $ | — | | | $ | 889,789 | | | $ | — | | | $ | — | |
The Accompanying Notes are an Integral Part of these Financial Statements.
The Tocqueville Trust
Statements of Operations
For the Year Ended October 31, 2011
| | | | | | | | | | | | | | | | | | | | | | | | |
| | | The
Tocqueville
Fund | | | Opportunity
Fund | | | International
Value
Fund | | | Gold
Fund | | | The
Delafield
Fund | | | The
Select
Fund | |
Investment Income: | | | | | | | | | | | | | | | | | | | | | | | | |
Dividends* | | | | | | | | | | | | | | | | | | | | | | | | |
Unaffiliated issuers | | $ | 11,422,797 | | | $ | 127,589 | | | $ | 4,753,446 | | | $ | 8,251,640 | | | $ | 10,392,611 | | | $ | 403,146 | |
Affiliated issuers | | | 107,500 | | | | 1,100 | | | | — | | | | 1,674,611 | | | | 489,677 | | | | 68,215 | |
Interest | | | 1,090 | | | | 6 | | | | 2,955 | | | | 208,452 | | | | 704,644 | | | | 3,015 | |
| | | | | | | | | | | | | | | | | | | | | | | | |
| | | 11,531,387 | | | | 128,695 | | | | 4,756,401 | | | | 10,134,703 | | | | 11,586,932 | | | | 474,376 | |
| | | | | | | | | | | | | | | | | | | | | | | | |
Expenses: | | | | | | | | | | | | | | | | | | | | | | | | |
Investment Adviser’s fee (See Note 4) | | | 3,876,416 | | | | 305,229 | | | | 1,861,864 | | | | 19,090,576 | | | | 8,966,106 | | | | 551,976 | |
Distribution fees (See Note 4) | | | 1,292,138 | | | | 101,743 | | | | 465,466 | | | | 6,477,145 | | | | 3,112,562 | | | | 172,493 | |
Administration fee (See Note 4) | | | 775,283 | | | | 61,046 | | | | 279,280 | | | | 3,886,287 | | | | 1,867,537 | | | | 103,495 | |
Transfer agent and shareholder services fees | | | 252,149 | | | | 10,297 | | | | 46,921 | | | | 1,236,646 | | | | 624,573 | | | | 33,861 | |
Printing and mailing expense | | | 57,827 | | | | 6,690 | | | | 13,200 | | | | 321,800 | | | | 173,804 | | | | 7,628 | |
Trustee fees and expenses | | | 50,727 | | | | 4,146 | | | | 17,085 | | | | 238,587 | | | | 115,034 | | | | 6,510 | |
Professional fees | | | 45,341 | | | | 7,765 | | | | 22,102 | | | | 274,087 | | | | 112,471 | | | | 9,924 | |
Fund accounting fees | | | 41,129 | | | | 13,199 | | | | 37,272 | | | | 196,093 | | | | 92,082 | | | | 6,867 | |
Registration fees | | | 40,082 | | | | 25,626 | | | | 32,572 | | | | 238,577 | | | | 110,500 | | | | 35,948 | |
Custody fees | | | 34,607 | | | | 14,093 | | | | 101,651 | | | | 350,175 | | | | 69,612 | | | | 5,057 | |
Other expenses (See Note 11) | | | 20,697 | | | | 2,884 | | | | 13,633 | | | | 101,396 | | | | 45,511 | | | | 2,206 | |
Insurance expense | | | 9,195 | | | | 819 | | | | 2,986 | | | | 42,236 | | | | 25,681 | | | | 1,152 | |
Excise tax | | | — | | | | — | | | | 10,517 | | | | — | | | | — | | | | — | |
| | | | | | | | | | | | | | | | | | | | | | | | |
Total expenses before waiver | | | 6,495,591 | | | | 553,537 | | | | 2,904,549 | | | | 32,453,605 | | | | 15,315,473 | | | | 937,117 | |
Less: Fees waived (See Note 4) | | | (43,826 | ) | | | — | | | | — | | | | — | | | | — | | | | — | |
| | | | | | | | | | | | | | | | | | | | | | | | |
Net expenses | | | 6,451,765 | | | | 553,537 | | | | 2,904,549 | | | | 32,453,605 | | | | 15,315,473 | | | | 937,117 | |
| | | | | | | | | | | | | | | | | | | | | | | | |
Net Investment Income (Loss) | | | 5,079,622 | | | | (424,842 | ) | | | 1,851,852 | | | | (22,318,902 | ) | | | (3,728,541 | ) | | | (462,741 | ) |
| | | | | | | | | | | | | | | | | | | | | | | | |
Realized and Unrealized Gain (Loss): | | | | | | | | | | | | | | | | | | | | | | | | |
Net realized gain (loss) on: | | | | | | | | | | | | | | | | | | | | | | | | |
Investments | | | | | | | | | | | | | | | | | | | | | | | | |
Unaffiliated issuers | | | 18,590,415 | | | | 2,596,341 | | | | 4,999,199 | | | | 39,657,771 | | | | 26,580,191 | | | | 835,151 | |
Affiliated issuers | | | (938,386 | ) | | | 446,288 | | | | — | | | | 2,885,975 | | | | (3,691,631 | ) | | | (70,958 | ) |
Forward currency contracts | | | — | | | | — | | | | (228,893 | ) | | | — | | | | — | | | | — | |
Foreign currency translation | | | 690 | | | | (765 | ) | | | (385,078 | ) | | | (735,289 | ) | | | — | | | | — | |
Written Options | | | — | | | | 250 | | | | — | | | | — | | | | — | | | | — | |
| | | | | | | | | | | | | | | | | | | | | | | | |
| | | 17,652,719 | | | | 3,042,114 | | | | 4,385,228 | | | | 41,808,457 | | | | 22,888,560 | | | | 764,193 | |
Net change in unrealized appreciation (depreciation) on: | | | | | | | | | | | | | | | | | | | | | | | | |
Investments | | | 207,732 | | | | 1,600,637 | | | | (15,372,777 | ) | | | (19,034,718 | ) | | | (40,431,393 | ) | | | (5,381,939 | ) |
Forward currency contracts | | | — | | | | — | | | | 105,599 | | | | — | | | | — | | | | — | |
Foreign currency translation | | | — | | | | 145 | | | | (539,850 | ) | | | 2,504,067 | | | | — | | | | — | |
| | | | | | | | | | | | | | | | | | | | | | | | |
| | | 207,732 | | | | 1,600,782 | | | | (15,807,028 | ) | | | (16,530,651 | ) | | | (40,431,393 | ) | | | (5,381,939 | ) |
Net gain (loss) on investments and foreign currency | | | 17,860,451 | | | | 4,642,896 | | | | (11,421,800 | ) | | | 25,277,806 | | | | (17,542,833 | ) | | | (4,617,746 | ) |
| | | | | | | | | | | | | | | | | | | | | | | | |
Net Increase (Decrease) in Net Assets Resulting from Operations | | $ | 22,940,073 | | | $ | 4,218,054 | | | $ | (9,569,948 | ) | | $ | 2,958,904 | | | $ | (21,271,374 | ) | | $ | (5,080,487 | ) |
| | | | | | | | | | | | | | | | | | | | | | | | |
* Net of foreign taxes withheld | | $ | 148,176 | | | $ | 578 | | | $ | 506,665 | | | $ | 811,258 | | | $ | — | | | $ | — | |
| | | | | | | | | | | | | | | | | | | | | | | | |
The Accompanying Notes are an Integral Part of these Financial Statements.
The Tocqueville Trust
Statements of Changes in Net Assets
| | | | | | | | | | | | | | | | |
| | | The Tocqueville Fund | | | Opportunity Fund | |
| | | For the
Year Ended
October 31,
2011 | | | For the Year
Ended
October 31,
2010 | | | For the
Year Ended
October 31,
2011 | | | For the
Year Ended
October 31,
2010 | |
Operations: | | | | | | | | | | | | | | | | |
Net investment income (loss) | | $ | 5,079,622 | | | $ | 7,384,106 | | | $ | (424,842 | ) | | $ | (308,155 | ) |
Net realized gain on investments and foreign currency | | | 17,652,719 | | | | 15,319,648 | | | | 3,042,114 | | | | 1,418,029 | |
Net change in unrealized appreciation (depreciation) | | | 207,732 | | | | 49,148,587 | | | | 1,600,782 | | | | 5,071,383 | |
| | | | | | | | | | | | | | | | |
Net increase (decrease) in net assets resulting from operations | | | 22,940,073 | | | | 71,852,341 | | | | 4,218,054 | | | | 6,181,257 | |
Dividends and distributions to shareholders: | | | | | | | | | | | | | | | | |
Net investment income | | | (7,457,179 | ) | | | (4,954,961 | ) | | | — | | | | — | |
Net realized gains | | | — | | | | — | | | | — | | | | — | |
Return of capital | | | — | | | | — | | | | — | | | | — | |
| | | | | | | | | | | | | | | | |
Total dividends and distributions | | | (7,457,179 | ) | | | (4,954,961 | ) | | | — | | | | — | |
Fund share transactions: | | | | | | | | | | | | | | | | |
Shares sold | | | 104,940,298 | | | | 142,456,732 | | | | 17,172,239 | | | | 5,812,777 | |
Shares issued to holders in reinvestment of dividends | | | 6,567,494 | | | | 4,041,138 | | | | — | | | | — | |
Shares redeemed* | | | (125,118,930 | ) | | | (107,195,396 | ) | | | (7,290,932 | ) | | | (9,628,207 | ) |
| | | | | | | | | | | | | | | | |
Net increase (decrease) | | | (13,611,138 | ) | | | 39,302,474 | | | | 9,881,307 | | | | (3,815,430 | ) |
| | | | | | | | | | | | | | | | |
Net increase (decrease) in net assets | | | 1,871,756 | | | | 106,199,854 | | | | 14,099,361 | | | | 2,365,827 | |
Net Assets: | | | | | | | | | | | | | | | | |
Beginning of period | | | 489,669,584 | | | | 383,469,730 | | | | 32,863,475 | | | | 30,497,648 | |
| | | | | | | | | | | | | | | | |
End of period** | | $ | 491,541,340 | | | $ | 489,669,584 | | | $ | 46,962,836 | | | $ | 32,863,475 | |
| | | | | | | | | | | | | | | | |
* Net of redemption fees of: | | $ | 54,120 | | | $ | 37,740 | | | $ | 2,364 | | | $ | 424 | |
| | | | | | | | | | | | | | | | |
** Including accumulated net investment income (loss) of: | | $ | 4,136,952 | | | $ | 6,319,760 | | | $ | — | | | $ | (4,413 | ) |
| | | | | | | | | | | | | | | | |
The Accompanying Notes are an Integral Part of these Financial Statements.
The Tocqueville Trust
Statements of Changes in Net Assets
| | | | | | | | | | | | | | | | | | | | | | | | | | | | | | |
| International Value Fund | | | Gold Fund | | | Delafield Fund | | | Select Fund | |
For the
Year Ended
October 31,
2011 | | | For the
Year Ended
October 31,
2010 | | | For the
Year Ended
October 31,
2011 | | | For the
Year Ended
October 31,
2010 | | | For the
Year Ended
October 31,
2011 | | | For the
Year Ended
October 31,
2010 | | | For the
Year Ended
October 31,
2011 | | | For the
Year Ended
October 31,
2010 | |
| | | | | | | | | | | | | | | | | | | | | | | | | | | | | | |
| $ | 1,851,852 | | | $ | 1,375,838 | | | $ | (22,318,902 | ) | | $ | (15,630,116 | ) | | $ | (3,728,541 | ) | | $ | (151,360 | ) | | $ | (462,741 | ) | | $ | (136,505 | ) |
| | 4,385,228 | | | | 395,547 | | | | 41,808,457 | | | | 49,553,458 | | | | 22,888,560 | | | | 36,471,167 | | | | 764,193 | | | | 2,803,415 | |
| | (15,807,028 | ) | | | 20,080,959 | | | | (16,530,651 | ) | | | 681,084,802 | | | | (40,431,393 | ) | | | 124,092,551 | | | | (5,381,939 | ) | | | 6,854,132 | |
| | | | | | | | | | | | | | | | | | | | | | | | | | | | | | |
| | | | | | | |
| | (9,569,948 | ) | | | 21,852,344 | | | | 2,958,904 | | | | 715,008,144 | | | | (21,271,374 | ) | | | 160,412,358 | | | | (5,080,487 | ) | | | 9,521,042 | |
| | | | | | | | | | | | | | | | | | | | | | | | | | | | | | |
| | (831,651 | ) | | | (1,534,647 | ) | | | — | | | | — | | | | — | | | | — | | | | — | | | | (27,613 | ) |
| | — | | | | — | | | | (46,368,277 | ) | | | (1,803,165 | ) | | | — | | | | — | | | | (2,112,007 | ) | | | — | |
| | — | | | | — | | | | — | | | | — | | | | — | | | | (719,160 | ) | | | — | | | | — | |
| | | | | | | | | | | | | | | | | | | | | | | | | | | | | | |
| | (831,651 | ) | | | (1,534,647 | ) | | | (46,368,277 | ) | | | (1,803,165 | ) | | | — | | | | (719,160 | ) | | | (2,112,007 | ) | | | (27,613 | ) |
| | | | | | | | | | | | | | | | | | | | | | | | | | | | | | |
| | 107,151,161 | | | | 15,384,677 | | | | 1,494,120,323 | | | | 936,511,037 | | | | 714,889,299 | | | | 354,831,009 | | | | 60,470,466 | | | | 14,517,906 | |
| | 615,614 | | | | 1,121,673 | | | | 42,874,881 | | | | 1,723,993 | | | | — | | | | 682,368 | | | | 2,067,329 | | | | 27,465 | |
| | (47,620,593 | ) | | | (18,334,069 | ) | | | (1,046,110,637 | ) | | | (389,329,542 | ) | | | (364,415,732 | ) | | | (218,080,618 | ) | | | (25,579,690 | ) | | | (6,931,705 | ) |
| | | | | | | | | | | | | | | | | | | | | | | | | | | | | | |
| | 60,146,182 | | | | (1,827,719 | ) | | | 490,884,567 | | | | 548,905,488 | | | | 350,473,567 | | | | 137,432,759 | | | | 36,958,105 | | | | 7,613,666 | |
| | | | | | | | | | | | | | | | | | | | | | | | | | | | | | |
| | 49,744,583 | | | | 18,489,978 | | | | 447,475,194 | | | | 1,262,110,467 | | | | 329,202,193 | | | | 297,125,957 | | | | 29,765,611 | | | | 17,107,095 | |
| | | | | | | | | | | | | | | | | | | | | | | | | | | | | | |
| | 150,103,343 | | | | 131,613,365 | | | | 2,199,602,727 | | | | 937,492,260 | | | | 933,673,585 | | | | 636,547,628 | | | | 41,788,138 | | | | 24,681,043 | |
| | | | | | | | | | | | | | | | | | | | | | | | | | | | | | |
| $ | 199,847,926 | | | $ | 150,103,343 | | | $ | 2,647,077,921 | | | $ | 2,199,602,727 | | | $ | 1,262,875,778 | | | $ | 933,673,585 | | | $ | 71,553,749 | | | $ | 41,788,138 | |
| | | | | | | | | | | | | | | | | | | | | | | | | | | | | | |
| $ | 153,900 | | | $ | 18,321 | | | $ | 3,132,177 | | | $ | 1,224,208 | | | $ | 277,875 | | | $ | 188,324 | | | $ | 48,586 | | | $ | 22,745 | |
| | | | | | | | | | | | | | | | | | | | | | | | | | | | | | |
| $ | 1,155,644 | | | $ | 717,508 | | | $ | (26,998,621 | ) | | $ | (4,206,068 | ) | | $ | — | | | $ | — | | | $ | (8,797 | ) | | $ | (8,797 | ) |
| | | | | | | | | | | | | | | | | | | | | | | | | | | | | | |
The Accompanying Notes are an Integral Part of these Financial Statements.
The Tocqueville Trust
The Tocqueville Fund
The Tocqueville Opportunity Fund
The Tocqueville International Value Fund
The Tocqueville Gold Fund
The Delafield Fund
The Tocqueville Select Fund
Notes to Financial Statements
1. ORGANIZATION
The Tocqueville Trust (the “Trust”) is a Massachusetts business trust organized on September 17, 1986, currently consisting of six separate funds (each, a “Fund” or, collectively, the “Funds”). Each Fund is an open-end management investment company with a different investment objective. The Tocqueville Fund, The Tocqueville Opportunity Fund (the “Opportunity Fund”), The Tocqueville International Value Fund (the “International Fund”), and The Delafield Fund are classified as diversified investment companies. The Tocqueville Gold Fund (the “Gold Fund”) and The Tocqueville Select Fund are classified as non-diversified investment companies. The Tocqueville Fund’s investment objective is long-term capital appreciation which it seeks to achieve by investing primarily in securities of United States issuers. The Opportunity Fund’s investment objective is to achieve long-term capital appreciation which it seeks to achieve by investing in the common stocks of small and mid cap companies which have the potential to deliver superior long term earnings growth. The International Fund’s investment objective is long-term capital appreciation consistent with preservation of capital which it seeks to achieve by investing primarily in securities of non-U.S. issuers. The Gold Fund’s investment objective is long-term capital appreciation which it seeks to achieve by investing in gold, securities of companies located throughout the world that are engaged in mining or processing gold (“gold related securities”), other precious metals and securities of companies located throughout the world that are engaged in mining or processing such other precious metals (“other precious metal securities”). The Delafield Fund’s investment objectives are to seek long-term preservation of capital (sufficient growth to outpace inflation over an extended period of time) and growth of capital which it seeks to achieve by investing primarily in the equity securities of domestic companies. The Tocqueville Select Fund’s investment objective is to achieve long-term capital appreciation by investing in a focused group of common stocks issued primarily by small and mid-sized U.S. companies. Current income is a secondary objective for The Tocqueville Select Fund.
On June 22, 2009, the Board of Directors of Delafield Fund, Inc. approved an Agreement and Plan of Reorganization providing for, among other things, the transfer of the assets and liabilities of Delafield Fund, Inc. into The Delafield Fund, a series of The Tocqueville Trust. On September 24, 2009, the shareholders of Delafield Fund, Inc. approved the Agreement and Plan of Reorganization. On July 9, 2009, the Board of Trustees of Delafield Select Fund, a series of Natixis Funds Trust II, approved an Agreement and Plan of Reorganization providing for, among other things, the transfer of the assets and liabilities of Delafield Select Fund into the sole share class of The Select Fund (now The Tocqueville Select Fund), a series of The Tocqueville Trust. On September 24, 2009, the shareholders of Delafield Select Fund approved the Agreement and Plan of Reorganization. The effective date of both reorganizations was September 28, 2009. Transfers into The Delafield Fund and The Select Fund from their predecessor funds amounted to $649,892,191 and $25,888,388, respectively.
The Delafield Fund, a series of the Trust, commenced operations on September 28, 2009 as successor to Delafield Fund, Inc. The predecessor Delafield Fund, Inc. commenced operations on November 19, 1993.
The Tocqueville Select Fund, a series of the Trust, commenced operations on September 28, 2009 as successor to the Delafield Select Fund, a series of Natixis Funds Trust II. The predecessor Delafield Select Fund commenced operations on September 29, 2008 for Class A and Class C shares and on September 26, 2008 for Class Y shares. Prior to September 29, 2008, the predecessor Delafield Select Fund operated as a Delaware limited partnership using substantially the same investment objectives and investment policies as the predecessor fund. The limited partnership was incepted in July 1998.
Effective October 12, 2010, the investment strategy of the Opportunity Fund was changed as described in the supplements dated August 12, 2010 to the Trust’s prospectus and statement of additional information. The Opportunity
Fund will invest primarily in stocks of small and mid capitalization companies, as measured at the time of initial purchase. The Fund seeks to invest in companies which management feels are market leaders in growth industries and have consistent growth in sales and earnings.
2. SIGNIFICANT ACCOUNTING POLICIES
The following is a summary of significant accounting principles followed by the Trust in the preparation of its financial statements.
a) Security valuation
Investments in securities, including foreign securities, traded on an exchange or quoted on the over-the-counter market are valued at the last sale price or, if no sale occurred during the day, at the mean between closing bid and asked prices, as last reported by a pricing service approved by the Trustees. Securities that are principally traded on the National Association of Securities Dealers Automated Quotation National Market (“NASDAQ”) are generally valued at the NASDAQ Official Closing Price (“NOCP”). Investments in gold and silver are valued on the basis of the respective closing spot prices of the New York Commodity Exchange. Investments in other precious metals are valued at their respective market values determined on the basis of the mean between the last current bid and asked prices based on dealer or exchange quotations. When market quotations are not readily available, or when restricted securities or other assets are being valued, such assets are valued at fair value as determined in good faith by or under procedures approved by the Trustees. Short-term securities maturing within 60 days are valued on an amortized cost basis. Fixed income securities with maturities greater than 60 days are valued at market price.
Trading in securities on European and Far Eastern securities exchanges normally is completed before the calculation of the Funds’ net asset value. Trading on these foreign exchanges may not take place on all days on which there is regular trading on the New York Stock Exchange (“NYSE”), or may take place on days on which there is no regular trading on the NYSE. Similarly, the Funds may hold securities traded in domestic markets where the market may close early on a given day prior to calculation of the Funds’ net asset value. Events affecting the value of such securities held by the Funds that occur between the close of trading in the security and the close of trading on the NYSE normally will not be reflected in the Funds’ calculation of the net asset value. Significant events will be closely monitored, and where it is determined that an adjustment should be made to the security’s value because significant interim events may materially affect the value of the security, the security will be priced at its fair value in accordance with the procedures approved by the Trustees.
Investment and shareholder transactions are recorded on trade date. Dividend income is recognized on the ex-dividend date and interest income is recognized on an accrual basis.
b) Repurchase agreements
The Funds may enter into repurchase agreements with institutions that the Adviser has determined are creditworthy. Each repurchase agreement is recorded at cost. Under the terms of a typical repurchase agreement, the Fund acquires a debt security subject to an obligation of the seller to repurchase, and of the Fund to resell, the security at an agreed-upon price and time, thereby determining the yield during the Fund’s holding period. When entering into repurchase agreements, it is the Fund’s policy that its custodian or a third party custodian, acting on the Fund’s behalf, take possession of the underlying collateral securities, the market value of which, at all times, at least equals the principal
amount of the repurchase transaction, including accrued interest. To the extent that any repurchase transaction maturity exceeds one business day, the value of the collateral is marked to market and measured against the value of the agreement in an effort to ensure the adequacy of the collateral. If the counterparty defaults, the Fund generally has the right to use the collateral to satisfy the terms of the repurchase transaction.
c) Restricted and illiquid securities
The Funds may invest in securities that are subject to legal or contractual restrictions on resale or are illiquid. A security may be considered illiquid if it lacks a readily available market or if its valuation has not changed for a certain period of time. Disposal of these securities may involve time consuming negotiations and expense, and a prompt sale at the current valuation may be difficult.
d) Fair valuation pricing inputs
The Trust has adopted authoritative fair valuation accounting standards which establish an authoritative definition of fair value and set out a hierarchy for measuring fair value. These standards require additional disclosures about the various inputs and valuation techniques used to develop the measurements of fair value and a discussion in changes in valuation techniques and related inputs during the period. These inputs are summarized in the three broad levels listed below.
| | Level 1 - | Quoted prices in active markets for identical securities. |
| | Level 2 - | Other significant observable inputs (including quoted prices for similar securities, interest rates, prepayment speeds, credit risk, etc.). |
| | Level 3 - | Significant unobservable inputs (including the Fund’s own assumptions in determining the fair value of investments). |
Equity investments, including common stocks, foreign issued common stocks, exchange-traded funds, closed end mutual funds and real estate investments trusts, which are traded on an exchange are valued at the last sale price reported by the exchange on which the securities are primarily traded on the day of valuation. If there are no sales on a given day for securities traded on an exchange, the mean between the latest bid and ask price will be used. If there is no Nasdaq Official Closing Price for a Nasdaq-listed security or sale price available for an over-the-counter security, the mean of the latest bid and asked quotations from Nasdaq will be used. When using the market quotations or closing price provided by the pricing service and when the market is considered active, the security will be classified as a Level 1 security.
Investment in mutual funds, including money market funds, are generally priced at the ending net asset value (NAV) provided by the service agent of the funds and will be classified as Level 1 securities.
Debt securities, such as corporate bonds, convertible bonds and U.S. government agency issues for which market quotations are not readily available may be valued based on information supplied by independent pricing services using matrix pricing formulas and/or independent broker bid quotations. Debt securities with remaining maturities of 60 days or less may be valued on an amortized cost basis, which involves valuing an instrument at its cost and thereafter assuming a constant amortization to maturity of any discount or premium, regardless of the impact of fluctuating rates on the fair value of the instrument. On days when the closing price of the S&P 500 moves more than 1% from its previous close, common stocks of the International Value Fund which are traded on non-North American exchanges may be valued using matrix pricing formulas provided by an independent pricing service. Warrants for which the underlying security is
registered and equities which are subject to a required holding period, but have a comparable public issue, are valued in good faith by the Advisor pursuant to procedures established under the general supervision and responsibility of the Funds’ Board of Trustees. These securities will generally be classified as Level 2 securities.
Any securities or other assets for which market quotations are not readily available are valued at fair value as determined in good faith by the Advisor pursuant to procedures established under the general supervision and responsibility of the Funds’ Board of Trustees and will be classified as Level 3 securities. In determining fair value, a Fund will seek to assign a value to the security which it believes represents the amount that the Fund could reasonably expect to receive upon its current sale. With respect to securities that are actively traded on U.S. exchanges, the Funds expect that market quotations will generally be available and that fair value might be used only in limited circumstances, such as when trading for a security is halted during the trading day.
For securities traded principally on foreign exchanges, the Funds may use fair value pricing if an event occurs after the close of trading of the principal foreign exchange on which a security is traded, but before calculation of a Fund’s NAV, which a Fund believes affects the value of the security since its last market quotation. Such events may involve situations relating to a single issuer (such as news related to the issuer announced after the close of the principal foreign exchange), or situations relating to sectors of the market or the markets in generals (such as significant fluctuations in the U.S. or foreign markets or significant changes in exchange rates, natural disasters, armed conflicts, or governmental actions).
In determining whether a significant event has occurred with respect to securities traded principally in foreign markets, the Funds may engage a third party fair value service provider to systematically recommend the adjustment of closing market prices of non-U.S. securities based upon changes in a designated U.S. securities market index occuring from the time of close of the relevant foreign market and the close of the NYSE. Fair value pricing may also be used to value restricted securities held by the Funds or securities with little or no trading activity for extended periods of time. Fair value pricing involves judgements that are inherently subjective and inexact and it is not possible to determine with certainty when, and to what extent, an event will affect a market price. As a result, there can be no assurance that fair value pricing will reflect actual market value and it is possible that the fair value determined for a security may differ materially from the value that could be realized upon the sale of the security.
The following is a summary of the inputs used, as of October 31, 2011, involving the Funds’ assets carried at fair value. The inputs of methodology used for valuing securities may not be an indication of the risk associated with investing in those securities.
| | | | | | | | | | | | | | | | |
| Description | | Level 1 | | | Level 2 | | | Level 3 | | | Total | |
The Tocqueville Fund | | | | | | | | | | | | | | | | |
Common Stocks* | | $ | 488,165,664 | | | $ | — | | | $ | — | | | $ | 488,165,664 | |
Warrants* | | | — | | | | 188 | | | | — | | | | 188 | |
| | | | | | | | | | | | | | | | |
Total Fund | | $ | 488,165,664 | | | $ | 188 | | | $ | — | | | $ | 488,165,852 | |
| | | | | | | | | | | | | | | | |
| | | | | | | | | | | | | | | | |
| The Tocqueville Opportunity Fund | | Level 1 | | | Level 2 | | | Level 3 | | | Total | |
Common Stocks | | | | | | | | | | | | | | | | |
Consumer Discretionary | | $ | 10,462,546 | | | $ | — | | | $ | — | | | $ | 10,462,546 | |
Consumer Staples | | | 3,374,861 | | | | — | | | | — | | | | 3,374,861 | |
Energy | | | 3,961,932 | | | | — | | | | — | | | | 3,961,932 | |
Financials | | | 2,807,698 | | | | — | | | | — | | | | 2,807,698 | |
Health Care | | | 6,597,841 | | | | — | | | | — | | | | 6,597,841 | |
Industrials | | | 3,667,981 | | | | — | | | | — | | | | 3,667,981 | |
Information Technology | | | 12,017,657 | | | | — | | | | 810,000 | | | | 12,827,657 | |
Materials | | | 3,042,877 | | | | — | | | | — | | | | 3,042,877 | |
Telecommunication Services | | | 194,220 | | | | — | | | | — | | | | 194,220 | |
| | | | | | | | | | | | | | | | |
Total Common Stocks | | | 46,127,613 | | | | — | | | | 810,000 | | | | 46,937,613 | |
Repurchase Agreement | | | — | | | | 46,000 | | | | — | | | | 46,000 | |
| | | | | | | | | | | | | | | | |
Total Fund | | $ | 46,127,613 | | | $ | 46,000 | | | $ | 810,000 | | | $ | 46,983,613 | |
| | | | | | | | | | | | | | | | |
| | | | |
| The Tocqueville International Value Fund | | Level 1 | | | Level 2 | | | Level 3 | | | Total | |
Common Stocks | | | | | | | | | | | | | | | | |
Australia | | $ | 1,561,600 | | | $ | 3,956,442 | | | $ | — | | | $ | 5,518,042 | |
Belgium | | | — | | | | 8,578,851 | | | | — | | | | 8,578,851 | |
Canada | | | 2,722,500 | | | | — | | | | — | | | | 2,722,500 | |
France | | | 5,753,000 | | | | 27,115,687 | | | | — | | | | 32,868,687 | |
Germany | | | 3,778,920 | | | | 6,612,314 | | | | — | | | | 10,391,234 | |
Hong Kong | | | — | | | | 5,700,821 | | | | — | | | | 5,700,821 | |
Ireland | | | — | | | | 5,614,353 | | | | — | | | | 5,614,353 | |
Italy | | | — | | | | 6,620,189 | | | | — | | | | 6,620,189 | |
Japan | | | 3,006,300 | | | | 39,179,220 | | | | — | | | | 42,185,520 | |
Luxembourg | | | — | | | | 1,840,655 | | | | — | | | | 1,840,655 | |
Mexico | | | 2,816,100 | | | | — | | | | — | | | | 2,816,100 | |
Netherlands | | | 9,658,950 | | | | 4,995,295 | | | | — | | | | 14,654,245 | |
Norway | | | 5,340,300 | | | | 5,201,578 | | | | — | | | | 10,541,878 | |
Spain | | | 2,653,600 | | | | 6,491,093 | | | | — | | | | 9,144,693 | |
Switzerland | | | — | | | | 4,337,827 | | | | — | | | | 4,337,827 | |
United Kingdom | | | 5,289,600 | | | | 11,548,270 | | | | — | | | | 16,837,870 | |
United States | | | 10,298,250 | | | | — | | | | — | | | | 10,298,250 | |
| | | | | | | | | | | | | | | | |
Total Common Stocks | | | 52,879,120 | | | | 137,792,595 | | | | — | | | | 190,671,715 | |
Repurchase Agreement | | | — | | | | 8,116,000 | | | | — | | | | 8,116,000 | |
| | | | | | | | | | | | | | | | |
Total Fund | | $ | 52,879,120 | | | $ | 145,908,595 | | | $ | — | | | $ | 198,787,715 | |
| | | | | | | | | | | | | | | | |
Other Financial Instruments** | | | | | | | | | | | | | | | | |
Total Forward Currency Contracts | | | — | | | $ | 105,599 | | | | — | | | $ | 105,599 | |
| | | | | | | | | | | | | | | | |
| | | | | | | | | | | | | | | | |
| The Tocqueville Gold Fund | | Level 1 | | | Level 2 | | | Level 3 | | | Total | |
Common Stocks | | | | | | | | | | | | | | | | |
Gold Related | | $ | 2,092,807,579 | | | $ | 4,011,437 | | | $ | 11,912,807 | | | $ | 2,108,731,823 | |
Other Precious Metals Related | | | 102,474,131 | | | | — | | | | 37,551,255 | | | | 140,025,386 | |
Other | | | 22,433,515 | | | | 7,079,007 | | | | 10,406,517 | | | | 39,919,039 | |
| | | | | | | | | | | | | | | | |
Total Common Stocks | | | 2,217,715,225 | | | | 11,090,444 | | | | 59,870,579 | | | | 2,288,676,248 | |
Closed End Mutual Fund* | | | 20,706,000 | | | | — | | | | — | | | | 20,706,000 | |
Warrants* | | | — | | | | 4,524,768 | | | | — | | | | 4,524,768 | |
Gold Bullion | | | — | | | | 168,109,671 | | | | — | | | | 168,109,671 | |
U.S. Treasury Bills | | | — | | | | 129,994,173 | | | | — | | | | 129,994,173 | |
Repurchase Agreement | | | — | | | | 36,522,000 | | | | — | | | | 36,522,000 | |
| | | | | | | | | | | | | | | | |
Total Fund | | $ | 2,238,421,225 | | | $ | 350,241,056 | | | $ | 59,870,579 | | | $ | 2,648,532,860 | |
| | | | | | | | | | | | | | | | |
| | | | |
| The Delafield Fund | | Level 1 | | | Level 2 | | | Level 3 | | | Total | |
Common Stocks* | | $ | 1,069,187,850 | | | $ | — | | | $ | — | | | $ | 1,069,187,850 | |
Real Estate Investment Trust (REIT) | | | 10,482,000 | | | | — | | | | — | | | | 10,482,000 | |
Money Market Fund | | | 160,313,530 | | | | — | | | | — | | | | 160,313,530 | |
| | | | | | | | | | | | | | | | |
Total Fund | | $ | 1,239,983,380 | | | $ | — | | | $ | — | | | $ | 1,239,983,380 | |
| | | | | | | | | | | | | | | | |
| | | | |
| The Tocqueville Select Fund | | Level 1 | | | Level 2 | | | Level 3 | | | Total | |
Common Stocks* | | $ | 62,832,340 | | | $ | — | | | $ | — | | | $ | 62,832,340 | |
Money Market Fund | | | 8,636,297 | | | | — | | | | — | | | | 8,636,297 | |
| | | | | | | | | | | | | | | | |
Total Fund | | $ | 71,468,637 | | | $ | — | | | $ | — | | | $ | 71,468,637 | |
| | | | | | | | | | | | | | | | |
| * | For further information regarding portfolio characteristics, please see the accompanying Schedules of Investments. |
| ** | Other financial instruments are derivative instruments not reflected in the Schedule of Investments, such as forward currency contracts, which are reflected at the unrealized appreciation (depreciation) on the instrument. |
Below is a reconciliation that details the transfer of securities between Level 1 and Level 2 during the reporting period.
| | | | | | | | | | | | | | | | | | | | | | | | |
| | | The
Tocqueville
Fund | | | The
Tocqueville
Opportunity
Fund | | | The
Tocqueville
International
Value Fund | | | The
Tocqueville
Gold Fund | | | The
Delafield
Fund | | | The
Tocqueville
Select Fund | |
Transfers Into Level 1 | | $ | — | | | $ | — | | | $ | — | | | $ | 48,079,571 | | | $ | — | | | $ | — | |
Transfers Out of Level 1 | | | — | | | | — | | | | (66,047,338 | ) | | | — | | | | — | | | | — | |
| | | | | | | | | | | | | | | | | | | | | | | | |
Net Transfers Into/(Out of ) Level 1 | | | — | | | | — | | | | (66,047,338 | ) | | | 48,079,571 | | | | — | | | | — | |
| | | | | | | | | | | | | | | | | | | | | | | | |
Transfers Into Level 2 | | | — | | | | — | | | | 66,047,338 | | | | — | | | | — | | | | — | |
Transfers Out of Level 2 | | | — | | | | — | | | | — | | | | (48,079,571 | ) | | | — | | | | — | |
| | | | | | | | | | | | | | | | | | | | | | | | |
Net Transfers Into/(Out of ) Level 2 | | $ | — | | | $ | — | | | $ | 66,047,338 | | | $ | (48,079,571 | ) | | $ | — | | | $ | — | |
| | | | | | | | | | | | | | | | | | | | | | | | |
The movement between Level 1 and Level 2 in the International Value Fund was due to non-North American traded securities being fair valued on October 31, 2011. The movement from Level 2 to Level 1 in the Gold Fund was due to the release of restrictions on the securities.
Transfers between levels are recognized at the end of the reporting period.
Below is a reconciliation that details the activity of securities in Level 3 during the current fiscal period:
| | | | | | | | | | | | | | | | | | | | | | | | |
| | | The
Tocqueville
Fund | | | The
Tocqueville
Opportunity
Fund | | | The
Tocqueville
International
Value Fund | | | The
Tocqueville
Gold Fund | | | The
Delafield
Fund | | | The
Tocqueville
Select
Fund | |
Beginning Balance—November 1, 2010 | | $ | — | | | $ | — | | | $ | — | | | $ | 30,842,633 | | | $ | — | | | $ | — | |
Purchases | | | — | | | | 974,300 | | | | — | | | | 18,635,167 | | | | — | | | | — | |
Sales | | | — | | | | — | | | | — | | | | — | | | | — | | | | — | |
Realized gains | | | — | | | | — | | | | — | | | | — | | | | — | | | | — | |
Realized losses | | | — | | | | — | | | | — | | | | — | | | | — | | | | — | |
Change in unrealized appreciation (depreciation) | | | — | | | | (164,300 | ) | | | — | | | | 10,392,779 | | | | — | | | | — | |
Transfers in/(out) of Level 3 | | | — | | | | — | | | | — | | | | — | | | | — | | | | — | |
| | | | | | | | | | | | | | | | | | | | | | | | |
Ending Balance—October 31, 2011 | | $ | — | | | $ | 810,000 | | | $ | — | | | $ | 59,870,579 | | | $ | — | | | $ | — | |
| | | | | | | | | | | | | | | | | | | | | | | | |
e) Derivative instruments and hedging activities
The Funds’ Adviser may use derivative instruments, such as purchased options, written options and forward currency contracts, as a means to manage exposure to different types of risk, including market risk and exchange rate risk. The Trust has adopted disclosure standards in order to enable the investor to understand how and why an entity used derivatives, how derivatives are accounted for, and how derivatives affect an entity’s results of operations and financial position.
In the Opportunity Fund, the Adviser used both written call options and purchased put options to temporarily hedge against market volatility. In the International Value Fund, the Adviser used forward currency contracts to adjust exposure to foreign exchange rate risk.
The Tocqueville Opportunity Fund
Balance Sheet—Values of Derivative Instruments as of October 31, 2011.
The Tocqueville Opportunity Fund does not hold any derivative instruments as of October 31, 2011.
The Effect of Derivative Instruments on the Statement of Operations for the year ended October 31, 2011
| | | | | | | | |
| | | Realized Gain (Loss) | |
| | | Purchased
Options | | | Written
Options | |
Equity Contracts | | $ | (3,840 | ) | | $ | 250 | |
| | | | | | | | |
Total | | $ | (3,840 | ) | | $ | 250 | |
| | | | | | | | |
The Tocqueville International Value Fund
Balance Sheet—Values of Derivative Instruments as of October 31, 2011.
| | | | | | | | | | | | |
| | | Asset Derivatives | | | Liability Derivatives | |
| Derivatives not accounted for as hedging instruments | | Balance Sheet
Location | | Value | | | Balance Sheet
Location | | Value | |
Foreign Currency Forward Contract | | Appreciation on
forward currency
contracts | | $ | 105,599 | | | | | $ | — | |
| | | | | | | | | | | | |
Total | | | | $ | 105,599 | | | | | $ | — | |
| | | | | | | | | | | | |
The Effect of Derivative Instruments on the Statement of Operations for the year ended October 31, 2011
| | | | | | | | |
| | | Net Realized
Loss on Forward
Currency Contracts | | | Net Change in
Unrealized
Appreciation on
Forward Currency
Contracts | |
Foreign Currency Forward Contract | | $ | (228,893 | ) | | $ | 105,599 | |
| | | | | | | | |
Total | | $ | (228,893 | ) | | $ | 105,599 | |
| | | | | | | | |
Derivatives Risk
The risks of using the types of derivatives in which the Funds may engage include the risk that movements in the value of the derivative may not fully offset or complement instruments currently held in the Funds in the manner intended by the Adviser; the risk that the counterparty to a derivative contract may fail to comply with their obligations to the Fund; the risk that the derivative may not possess a liquid secondary market at a time when the Fund would look to disengage the position; the risk that additional capital from the Fund may be called upon to fulfill the conditions of the derivative contract; and the risk that the cost of the derivative contracts may reduce the overall returns experienced by the Funds. The measurement of risks associated with these instruments is meaningful only when all related offsetting transactions are considered.
The average monthly market value of purchased and written options during the year ended October 31, 2011 were as follows:
| | | | |
| | | Opportunity
Fund | |
Purchased Options | | $ | 700 | |
Written Options | | | — | |
The average monthly notional amount of forward currency contracts during the year ended October 31, 2011 was as follows:
| | | | |
| | | International
Value Fund | |
Long Positions | | $ | — | |
Forward Currency Contracts | | | | |
Short Positions | | $ | 4,624,625 | |
Forward Currency Contracts | | | | |
f) Foreign currency translation
Investments and other assets and liabilities denominated in foreign currencies are translated to U.S. dollars at the prevailing rates of exchange, in accordance with the Trust’s Portfolio Securities Valuation and Foreign Exchange Contracts Procedures. The Tocqueville Fund, The Tocqueville International Value Fund, The Tocqueville Gold Fund and The Delafield Fund are engaged in transactions in securities denominated in foreign currencies and, as a result, entered into foreign exchange contracts. These Funds are exposed to additional market risk as a result of changes in the value of the underlying currency in relation to the U.S. dollar. Risks include potential inability of counterparties to meet the terms of their contracts. The value of foreign currency contracts are marked-to-market on a daily basis, which reflects the changes in the market value of the contract at the close of each day’s trading, resulting in daily unrealized gains and/or losses. When the contracts are closed, the Funds recognize a realized gain or loss.
The Funds do not isolate that portion of the results of operations resulting from changes in foreign exchange rates on investments from the fluctuations arising from changes in market prices of securities held. Such fluctuations are included with the net realized and unrealized gain or loss from investments.
Reported net realized foreign exchange gains or losses arise from sales of foreign currencies, currency gains or losses realized between the trade and settlement dates on securities transactions, the differences between the amounts of dividends, interest, and foreign withholding taxes recorded on the Fund’s books, and the U.S. dollar equivalent of the amounts actually received or paid. Net unrealized foreign exchange gains and losses arise from changes in the value of assets and liabilities other than investments in securities at the end of the fiscal period, resulting from changes in the exchange rates.
g) Written option accounting
The Tocqueville Opportunity Fund, The Tocqueville International Value Fund, The Tocqueville Select Fund and The Tocqueville Gold Fund may write (sell) covered call options to hedge portfolio investments. When the Funds write (sell) an option, an amount equal to the premium received by the Funds is included in the Statements of Assets and Liabilities as an asset and an equivalent liability. The amount of the liability is subsequently marked-to-market to reflect the current value of the option written. By writing an option, the Funds may become obligated during the term of the option to deliver or purchase the securities underlying the option at the exercise price if the option is exercised. Option contracts are valued at the last sales price reported on the date of obligation. If the seller defaults and the value of the collateral declines or if bankruptcy proceedings are commenced with respect to the seller of the security, realization of the collateral by the Funds may be delayed or limited.
h) Dividends and distributions to Shareholders
Dividends to shareholders are recorded on the ex-dividend date. Dividends from net investment income are declared and paid annually by the Funds. Distributions of net realized capital gains, if any, will be declared and paid at least annually. Income and capital gain distributions are determined in accordance with income tax regulations which may differ from generally accepted accounting principles. Permanent differences between financial and tax reporting may result in reclassification to capital stock.
i) Use of estimates
The preparation of financial statements in conformity with accounting principles generally accepted in the United States of America requires management to make estimates and assumptions that affect the reported amounts of assets and liabilities and disclosure of contingent assets and liabilities at the date of the financial statements and the reported amounts of revenues and expenses during the reporting period. Actual results could differ from those estimates.
j) Subsequent Events Evaluation
In preparing these financial statements, the Trust has evaluated events and transactions for potential recognition or disclosure resulting from subsequent events through the date financial statements were available to be issued.
3. FEDERAL INCOME TAX
There is no tax liability resulting from unrecognized tax benefits relating to uncertain income tax positions taken or expected to be taken on the tax return for the fiscal year-end October 31, 2011, or for any other tax years which are open for exam. As of October 31, 2011, open tax years include the tax years ended October 31, 2008 through 2011. The Trust is also not aware of any tax positions for which it is reasonably possible that the total amounts of unrecognized tax benefits will significantly change in the next six months. The Fund recognizes interest and penalties, if any, related to unrecognized tax benefits as income tax expense in the Statement of Operations. During the period, the Funds did not incur any interest or penalties.
Provision for federal income taxes or excise taxes has not been made since the Funds have elected to be taxed as Regulated Investment Companies and intend to distribute substantially all taxable income to shareholders and otherwise comply with the provisions of the Internal Revenue Code applicable to Regulated Investment Companies. Distributions from net realized gains for book purposes may include short-term capital gains which are included as ordinary income to shareholders for tax purposes. Additionally, U.S. generally accepted accounting principles require that certain components of net assets relating to permanent differences be reclassified between financial and tax reporting. These reclassifications have no effect on net assets or net asset value per share. For the period ended October 31, 2011, the following table shows the reclassifications made:
| | | | | | | | | | | | |
| | | Undistributed
Net Investment
Income/(Loss) | | | Accumulated Net
Realized
Gain/(Loss) | | | Paid In Capital | |
Tocqueville Fund | | $ | 194,749 | | | $ | (194,749 | ) | | $ | — | |
Opportunity Fund | | | 429,255 | | | | (68,658 | ) | | | (360,597 | ) |
International Value Fund | | | (582,065 | ) | | | 582,065 | | | | — | |
Gold Fund | | | (473,651 | ) | | | 468,798 | | | | 4,853 | |
Delafield Fund | | | 3,728,541 | | | | — | | | | (3,728,541 | ) |
Select Fund | | | 462,741 | | | | 1 | | | | (462,742 | ) |
The permanent differences primarily relate to net operating losses and foreign currency reclasses.
As of October 31, 2011, the components of accumulated earnings (losses) for income tax purposes were as follows:
| | | | | | | | | | | | | | | | | | | | | | | | |
| | | Tocqueville
Fund | | | Opportunity
Fund | | | International
Value
Fund | | | Gold Fund | | | Delafield
Fund | | | Select
Fund | |
Tax cost of investments | | $ | 458,734,358 | | | $ | 40,738,754 | | | $ | 191,744,902 | | | $ | 1,658,428,518 | | | $ | 1,151,191,764 | | | $ | 66,954,312 | |
| | | | | | | | | | | | | | | | | | | | | | | | |
| | | | | | | | | | | | | | | | | | | | | | | | |
Unrealized appreciation | | | 74,992,389 | | | | 8,282,070 | | | | 24,448,810 | | | | 1,126,526,760 | | | | 164,370,470 | | | | 9,554,381 | |
Unrealized depreciation | | | (45,560,895 | ) | | | (2,037,211 | ) | | | (17,405,997 | ) | | | (136,422,418 | ) | | | (75,578,854 | ) | | | (5,040,056 | ) |
| | | | | | | | | | | | | | | | | | | | | | | | |
Net unrealized appreciation | | | 29,431,494 | | | | 6,244,859 | | | | 7,042,813 | | | | 990,104,342 | | | | 88,791,616 | | | | 4,514,325 | |
| | | | | | | | | | | | | | | | | | | | | | | | |
Undistributed operating income | | | 4,136,952 | | | | — | | | | 1,261,244 | | | | 15,486,206 | | | | — | | | | — | |
Undistributed long-term gains | | | — | | | | — | | | | — | | | | 26,795,902 | | | | 16,537,498 | | | | 764,173 | |
| | | | | | | | | | | | | | | | | | | | | | | | |
Distributable earnings | | | 4,136,952 | | | | — | | | | 1,261,244 | | | | 42,282,108 | | | | 16,537,498 | | | | 764,173 | |
| | | | | | | | | | | | | | | | | | | | | | | | |
Other accumulated gain/(loss) | | | (31,642,409 | ) | | | (5,183,559 | ) | | | (7,245,264 | ) | | | 12,741 | | | | — | | | | (8,797 | ) |
| | | | | | | | | | | | | | | | | | | | | | | | |
Total accumulated gain/(loss) | | $ | 1,926,037 | | | $ | 1,061,300 | | | $ | 1,058,793 | | | $ | 1,032,399,191 | | | $ | 105,329,114 | | | $ | 5,269,701 | |
| | | | | | | | | | | | | | | | | | | | | | | | |
The difference between book-basis and tax-basis unrealized appreciation is attributable primarily to wash sale deferrals and passive foreign investment companies (PFIC’s).
The tax character of distributions paid during the periods ended October 31, 2011 and 2010 was as follows:
| | | | | | | | | | | | | | | | |
| | | October 31, 2011 | |
| | | Ordinary
Income | | | Long Term
Capital
Gain | | | Return of
Capital | | | Total | |
Tocqueville Fund | | $ | 7,457,179 | | | $ | — | | | $ | — | | | $ | 7,457,179 | |
Opportunity Fund | | | — | | | | — | | | | — | | | | — | |
International Value Fund | | | 831,651 | | | | — | | | | — | | | | 831,651 | |
Gold Fund | | | — | | | | 46,368,277 | | | | — | | | | 46,368,277 | |
Delafield Fund | | | — | | | | — | | | | — | | | | — | |
Select Fund | | | 282,014 | | | | 1,829,993 | | | | — | | | | 2,112,007 | |
| |
| | | October 31, 2010 | |
| | | Ordinary
Income | | | Long Term
Capital
Gain | | | Return of
Capital | | | Total | |
Tocqueville Fund | | $ | 4,954,961 | | | $ | — | | | $ | — | | | $ | 4,954,961 | |
Opportunity Fund | | | — | | | | — | | | | — | | | | — | |
International Value Fund | | | 1,534,647 | | | | — | | | | — | | | | 1,534,647 | |
Gold Fund | | | — | | | | 1,803,165 | | | | — | | | | 1,803,165 | |
Delafield Fund | | | — | | | | — | | | | 719,160 | | | | 719,160 | |
Select Fund | | | 27,613 | | | | — | | | | — | | | | 27,613 | |
The Fund designated as long-term capital gain dividend, pursuant to Internal Revenue Code Section 852(b)(3), the amount necessary to reduce the earnings and profits of the Funds related to net capital gain to zero for the tax years ended October 31, 2011 and 2010.
At October 31, 2011, certain Funds had tax basis capital losses which may be carried forward to offset future capital gains as shown below.
| | | | | | | | | | | | |
| | | Tocqueville
Fund | | | Opportunity
Fund | | | International
Value Fund | |
| Capital losses expiring on: | | | | | | | | | | | | |
10/31/2017 | | $ | 31,642,409 | | | $ | 5,183,559 | | | $ | 7,254,600 | |
4. INVESTMENT ADVISORY AND OTHER AGREEMENTS
Tocqueville Asset Management L.P. (“Tocqueville”) is the investment adviser (the “Adviser”) to the Trust under Investment Advisory Agreements approved by shareholders. For its services, Tocqueville receives fees from The Tocqueville Fund, calculated daily and payable monthly, at an annual rate of 0.75% on the first $1 billion of the average daily net assets of the Fund, and 0.65% of the average daily net assets in excess of $1 billion. Tocqueville receives fees from The Tocqueville Opportunity Fund, calculated daily and payable monthly, at an annual rate of 0.75% on the first $500 million of the average daily net assets of the Fund, and 0.65% of the average daily net assets in excess of $500 million. Tocqueville receives fees from The Tocqueville International Value Fund, calculated daily and payable monthly, at an annual rate of 1.00% on the first $1 billion of the average daily net assets of the Fund, and 0.75% of the average daily net assets in excess of $1 billion. Tocqueville receives fees from The Tocqueville Gold Fund, calculated daily and payable monthly, at an annual rate of 1.00% on the first $500 million of the average daily net assets of the Fund, 0.75% of the average daily net assets in excess of $500 million but not exceeding $1 billion, and 0.65% of the average daily net assets in excess of $1 billion. Tocqueville receives fees from The Delafield Fund, calculated daily and payable monthly, at an annual rate of 0.80% on the first $250 million of net assets of the Fund; 0.75% on the next $250 million of net assets of the Fund; 0.70% on the next $500 million of net assets of the Fund; and 0.65% on all net assets of the Fund over $1 billion. Tocqueville receives fees from The Tocqueville Select Fund, calculated daily and payable monthly, at an annual rate of 0.80% on all net assets of the Fund.
With respect to The Tocqueville Fund, effective October 31, 2010, the Adviser has contractually agreed to waive its advisory fees and/or reimburse expenses in order to ensure that The Tocqueville Fund’s total annual operating expenses do not exceed 1.25% of its average daily net assets. The Expense Limitation Agreement was renewed effective October 31, 2011 and will remain in effect until March 1, 2013. For the fiscal year ended October 31, 2011, the Adviser waived $43,826 of the advisory fee. Such amount is not subject to recoupment by the Adviser.
Pursuant to an Administrative Services Agreement, each Fund pays to the Adviser a fee computed and paid monthly at an annual rate of 0.15% of the average daily net assets of the Fund. For the year ended October 31, 2011, the Adviser has made payments of $123,473, $9,709, $ 44,403, $618,456, $297,098, and $16,444 to U.S. Bancorp Fund Services, LLC for services provided under a Sub-Administration Agreement for The Tocqueville Fund, The Tocqueville Opportunity Fund, The Tocqueville International Value Fund, The Tocqueville Gold Fund, The Delafield Fund and The Tocqueville Select Fund, respectively.
Tocqueville Securities, L.P. (the “Distributor”), an affiliate of Tocqueville, acts as distributor for shares of the Trust. Each Fund adopted a distribution and service plan pursuant to Rule 12b-1 of the 1940 Act. Pursuant to the plans, each Fund pays to the Distributor distribution and service fees of 0.25% per annum of its average daily net assets.
Commissions earned by the Distributor for services rendered as a registered broker-dealer in securities transactions for The Tocqueville Fund, The Tocqueville Opportunity Fund, The Tocqueville International Value Fund, The Tocqueville Gold Fund, The Delafield Fund and The Tocqueville Select Fund for the year ended October 31, 2011, were $201,667, $29,165, $24,765, $30,375, $54,106, and $14,695, respectively.
5. CAPITAL SHARE TRANSACTIONS.
Transactions in capital shares for each Fund were as follows:
| | | | | | | | |
| | | For the Year
Ended
October 31, 2011 | | | For the Year
Ended
October 31, 2010 | |
| The Tocqueville Fund | | Shares | | | Shares | |
Shares sold | | | 4,607,900 | | | | 7,015,241 | |
Shares issued to holders in reinvestment of dividends | | | 295,833 | | | | 203,892 | |
Shares redeemed | | | (5,531,619 | ) | | | (5,240,419 | ) |
| | | | | | | | |
Net increase (decrease) | | | (627,886 | ) | | | 1,978,714 | |
| | |
| The Tocqueville Opportunity Fund | | | | | | |
Shares sold | | | 1,140,439 | | | | 472,367 | |
Shares issued to holders in reinvestment of dividends | | | — | | | | — | |
Shares redeemed | | | (489,872 | ) | | | (813,438 | ) |
| | | | | | | | |
Net increase (decrease) | | | 650,567 | | | | (341,071 | ) |
| | |
| The Tocqueville International Value Fund | | | | | | |
Shares sold | | | 8,270,352 | | | | 1,398,815 | |
Shares issued to holders in reinvestment of dividends | | | 49,328 | | | | 102,342 | |
Shares redeemed | | | (4,051,383 | ) | | | (1,671,623 | ) |
| | | | | | | | |
Net increase (decrease) | | | 4,268,297 | | | | (170,466 | ) |
| | |
| The Tocqueville Gold Fund | | | | | | |
Shares sold | | | 17,575,521 | | | | 14,061,481 | |
Shares issued to holders in reinvestment of dividends | | | 498,255 | | | | 30,182 | |
Shares redeemed | | | (12,604,092 | ) | | | (6,127,797 | ) |
| | | | | | | | |
Net increase | | | 5,469,684 | | | | 7,963,866 | |
| | |
| The Delafield Fund | | | | | | |
Shares sold | | | 24,411,778 | | | | 14,274,437 | |
Shares issued to holders in reinvestment of dividends | | | — | | | | 29,759 | |
Shares redeemed | | | (13,045,815 | ) | | | (9,085,090 | ) |
| | | | | | | | |
Net increase | | | 11,365,963 | | | | 5,219,106 | |
| | |
| The Tocqueville Select Fund | | | | | | |
Shares sold | | | 4,890,152 | | | | 1,383,358 | |
Shares issued to holders in reinvestment of dividends | | | 166,855 | | | | 3,045 | |
Shares redeemed | | | (2,206,460 | ) | | | (683,159 | ) |
| | | | | | | | |
Net increase | | | 2,850,547 | | | | 703,244 | |
6. FUND SHARE TRANSACTIONS
The Funds currently offer only one class of shares of beneficial interest. A redemption fee of 2.00% is imposed on redemptions of shares held 90 days or fewer. This fee is retained by each Fund and is credited to paid in capital. Redemptions to which the fee applies include redemptions of shares resulting from an exchange made pursuant to the Exchange Privilege, as defined in the Trust’s Prospectus dated March 1, 2011, as supplemented. For a more detailed description of when the redemption fee does not apply, please see the Trust’s Prospectus.
7. INVESTMENT TRANSACTIONS
Purchases and sales of investment securities (excluding short-term instruments) for the period ended October 31, 2011 are summarized below.
| | | | | | | | | | | | | | | | | | | | | | | | |
| | | Tocqueville
Fund | | | Opportunity
Fund | | | International
Value Fund | | | Gold
Fund | | | Delafield
Fund | | | Select
Fund | |
Purchases: | | $ | 142,227,424 | | | $ | 54,427,397 | | | $ | 119,869,635 | | | $ | 689,337,357 | | | $ | 713,169,444 | | | $ | 49,596,118 | |
| | | | | | | | | | | | | | | | | | | | | | | | |
Sales: | | $ | 161,401,570 | | | $ | 44,875,304 | | | $ | 51,652,824 | | | $ | 70,663,104 | | | $ | 386,668,281 | | | $ | 16,234,836 | |
| | | | | | | | | | | | | | | | | | | | | | | | |
U.S. Government Security Purchases: | | $ | — | | | $ | — | | | $ | — | | | $ | — | | | $ | — | | | $ | — | |
| | | | | | | | | | | | | | | | | | | | | | | | |
U.S. Government Security Sales: | | $ | — | | | $ | — | | | $ | — | | | $ | — | | | $ | 10,000,000 | | | $ | — | |
| | | | | | | | | | | | | | | | | | | | | | | | |
8. TRANSACTIONS WITH AFFILIATES
The following issuers are affiliated with the Funds; that is, the Adviser had control of 5% or more of the outstanding voting securities during the period from November 1, 2010 through October 31, 2011. As defined in Section (2)(a)(3) of the Investment Company Act of 1940; such issues are:
The Tocqueville Fund
| | | | | | | | | | | | | | | | | | | | | | | | | | | | | | | | |
Issuer Name | | Share Balance
At Nov. 1,
2010 | | | Additions | | | Reductions | | | Share Balance
At October 31,
2011 | | | Dividend
Income | | | Realized
Gain/(Loss) | | | Value
At October 31,
2011 | | | Cost
At October 31,
2011 | |
Alaska Communication
Systems Group, Inc. (a) | | | 550,000 | | | | — | | | | (550,000 | ) | | | — | | | $ | 107,500 | | | $ | (938,386 | ) | | $ | — | | | $ | — | |
| | | | | | | | | | | | | | | | | | | | | | | | | | | | | | | | |
| | | | | | | | | | | | | | | | | | $ | 107,500 | | | $ | (938,386 | ) | | $ | — | | | $ | — | |
| | | | |
The Tocqueville Opportunity Fund | | | | | | | | | | | | | | | | | |
Issuer Name | | Share Balance
At Nov. 1,
2010 | | | Additions | | | Reductions | | | Share Balance
At October 31,
2011 | | | Dividend
Income | | | Realized
Gain/(Loss) | | | Value
At October 31,
2011 | | | Cost
At October 31,
2011 | |
1-800 Flowers.com, Inc. (a) | | | 50,000 | | | | — | | | | (50,000 | ) | | | — | | | $ | — | | | $ | (187,368 | ) | | $ | — | | | $ | — | |
Landec Corp. (a) | | | 15,000 | | | | — | | | | (15,000 | ) | | | — | | | | — | | | | (48,132 | ) | | | — | | | | — | |
| | | | | | | | | | | | | | | | | | | | | | | | | | | | | | | | |
Issuer Name | | Share Balance
At Nov. 1,
2010 | | | Additions | | | Reductions | | | Share Balance
At October 31,
2011 | | | Dividend
Income | | | Realized
Gain/(Loss) | | | Value
At October 31,
2011 | | | Cost
At October 31,
2011 | |
Minerals Technologies, Inc. | | | 13,000 | | | | — | | | | (11,000 | ) | | | 2,000 | | | $ | 1,100 | | | $ | 246,234 | | | $ | 109,680 | | | $ | 102,874 | |
Silicon Image, Inc. (a) | | | 75,000 | | | | — | | | | (75,000 | ) | | | — | | | | — | | | | 321,601 | | | | — | | | | — | |
TeleCommunication Systems, Inc. (a) | | | 30,000 | | | | — | | | | (30,000 | ) | | | — | | | | — | | | | (112,668 | ) | | | — | | | | — | |
Ultratech, Inc. (a) | | | 20,000 | | | | — | | | | (20,000 | ) | | | — | | | | — | | | | 226,621 | | | | — | | | | — | |
| | | | | | | | | | | | | | | | | | | | | | | | | | | | | | | | |
| | | | | | | | | | | | | | | | | | $ | 1,100 | | | $ | 446,288 | | | $ | 109,680 | | | $ | 102,874 | |
The Tocqueville Gold Fund | | | | | | | | | | | | | | | | | | | | | |
Atac Resources Ltd. | | | 7,000,000 | | | | 3,261,700 | | | | — | | | | 10,261,700 | | | $ | — | | | $ | — | | | $ | 43,239,669 | | | $ | 37,121,703 | |
Banro Corp. (a) | | | 5,181,100 | | | | 2,338,400 | | | | — | | | | 7,519,500 | | | | — | | | | — | | | | 31,986,637 | | | | 19,698,955 | |
Blue Gold Mining, Inc. | | | — | | | | 4,000,000 | | | | — | | | | 4,000,000 | | | | — | | | | — | | | | 4,011,437 | | | | 3,845,969 | |
Blue Gold Mining, Inc. Warrants | | | — | | | | 2,000,000 | | | | — | | | | 2,000,000 | | | | — | | | | — | | | | 917 | | | | — | |
Corvus Gold, Inc. | | | 2,079,902 | | | | — | | | | (1 | ) | | | 2,079,901 | | | | — | | | | (1 | ) | | | 1,314,610 | | | | 1,617,492 | |
Gold Resource Corp. | | | 3,800,797 | | | | 170,300 | | | | (328,800 | ) | | | 3,642,297 | | | | 1,674,611 | | | | 6,617,267 | | | | 81,951,682 | | | | 35,567,058 | |
International Tower Hill Mines Ltd. | | | 2,493,136 | | | | — | | | | — | | | | 2,493,136 | | | | — | | | | — | | | | 12,839,650 | | | | 5,978,092 | |
International Tower Hill Mines Ltd. | | | 1,666,667 | | | | 4,000,000 | | | | — | | | | 5,666,667 | | | | — | | | | — | | | | 28,539,422 | | | | 33,656,021 | |
Primero Mining Corp. (a) | | | 4,621,000 | | | | 1,766,800 | | | | (2,123,000 | ) | | | 4,264,800 | | | | — | | | | (3,731,291 | ) | | | 11,980,376 | | | | 21,505,060 | |
Primero Mining Corp. Warrants (a) | | | 1,848,400 | | | | — | | | | — | | | | 1,848,400 | | | $ | — | | | $ | — | | | $ | 723,227 | | | $ | — | |
Richfield Ventures Corp. (a)(b) | | | 2,800,000 | | | | 1,400,000 | | | | (4,200,000 | ) | | | — | | | | — | | | | — | | | | — | | | | — | |
Richfield Ventures Corp. Warrants (a)(b) | | | 1,400,000 | | | | — | | | | (1,400,000 | ) | | | — | | | | — | | | | — | | | | — | | | | — | |
Rockhaven Resources Ltd. | | | — | | | | 5,000,000 | | | | — | | | | 5,000,000 | | | | — | | | | — | | | | 2,508,151 | | | | 6,265,337 | |
Romarco Minerals (a) | | | 15,387,800 | | | | 1,500,000 | | | | — | | | | 16,887,800 | | | | — | | | | — | | | | 16,604,007 | | | | 14,230,595 | |
Scorpio Mining Corp. | | | 16,699,542 | | | | 9,491,277 | | | | — | | | | 26,190,819 | | | | — | | | | — | | | | 53,077,948 | | | | 24,959,758 | |
Silver Range Resources Ltd. (c) | | | — | | | | 3,450,000 | | | | — | | | | 3,450,000 | | | | — | | | | — | | | | 3,980,436 | | | | — | |
Strategic Metals Ltd. | | | 10,350,000 | | | | — | | | | — | | | | 10,350,000 | | | | — | | | | — | | | | 14,329,571 | | | | 14,840,544 | |
Torex Gold Resources, Inc. (a) | | | 5,000,000 | | | | 6,267,400 | | | | — | | | | 11,267,400 | | | | — | | | | — | | | | 17,182,291 | | | | 16,526,328 | |
Torex Gold Resources, Inc., Warrants (a) | | | 1,250,000 | | | | — | | | | — | | | | 1,250,000 | | | | — | | | | — | | | | 294,708 | | | | — | |
Trevali Mining Corp. | | | — | | | | 8,000,000 | | | | — | | | | 8,000,000 | | | | | | | | | | | | 7,079,007 | | | | 12,381,345 | |
| | | | | | | | | | | | | | | | | | | | | | | | | | | | | | | | |
| | | | | | | | | | | | | | | | | | $ | 1,674,611 | | | $ | 2,885,975 | | | $ | 331,643,746 | | | $ | 248,194,257 | |
| | | | |
The Delafield Fund | | | | | | | | | | | | | | | | | |
Albany International Corp. | | | 1,050,000 | | | | 25,000 | | | | (350,000 | ) | | | 725,000 | | | $ | 403,187 | | | $ | (2,726,310 | ) | | $ | 16,377,750 | | | $ | 11,373,437 | |
Checkpoint Systems, Inc. | | | 1,300,000 | | | | 850,000 | | | | — | | | | 2,150,000 | | | | — | | | | — | | | | 28,487,500 | | | | 36,419,006 | |
Minerals Technologies, Inc. | | | 334,800 | | | | 160,200 | | | | (75,000 | ) | | | 420,000 | | | | 86,490 | | | | (965,321 | ) | | | 23,032,800 | | | | 22,960,523 | |
| | | | | | | | | | | | | | | | | | | | | | | | | | | | | | | | |
| | | | | | | | | | | | | | | | | | $ | 489,677 | | | $ | (3,691,631 | ) | | $ | 67,898,050 | | | $ | 70,752,966 | |
| | | | | | | | | | | | | | | | | | | | | | | | | | | | | | | | |
Issuer Name | | Share Balance
At Nov. 1,
2010 | | | Additions | | | Reductions | | | Share Balance
At October 31,
2011 | | | Dividend
Income | | | Realized
Gain/(Loss) | | | Value
At October 31,
2011 | | | Cost
At October 31,
2011 | |
The Tocqueville Select Fund | | | | | | | | | | | | | | | | | |
Albany International Corp. | | | 108,000 | | | | 17,500 | | | | (6,000 | ) | | | 119,500 | | | $ | 59,690 | | | $ | (63,678 | ) | | $ | 2,699,505 | | | $ | 1,901,613 | |
Checkpoint Systems, Inc. | | | 79,000 | | | | 94,000 | | | | — | | | | 173,000 | | | | — | | | | — | | | | 2,292,250 | | | | 2,851,736 | |
Minerals Technologies, Inc. | | | 29,500 | | | | 22,000 | | | | (11,500 | ) | | | 40,000 | | | | 8,525 | | | | (7,280 | ) | | | 2,193,600 | | | | 2,353,692 | |
| | | | | | | | | | | | | | | | | | | | | | | | | | | | | | | | |
| | | | | | | | | | | | | | | | | | $ | 68,215 | | | $ | (70,958 | ) | | $ | 7,185,355 | | | $ | 7,107,041 | |
| (a) | Security is no longer an affiliated company at October 31, 2011. |
| (b) | Richfield Ventures was acquired in a stock-for-stock deal by New Gold, Inc. |
| (c) | Silver Range Resources was acquired in a spin-off from Strategic Metals Ltd. |
9. LINE OF CREDIT
The Tocqueville Fund, Opportunity Fund, International Value Fund, Gold Fund, Delafield Fund, and Select Fund each have a revolving secured credit facility with U.S. Bank, the Trust’s custodian, in the amounts of $40,000,000, $3,000,000, $10,000,000, $130,000,000, $40,000,000 and $9,500,000, respectively, for temporary emergency or extraordinary purposes, including the meeting of redemption requests that otherwise might require the untimely disposition of securities. Each Fund’s line of credit is secured by the respective fund’s assets. The lines of credit have a one year term and are reviewed annually by the Board of Trustees. The current agreements run through May 31, 2012. The interest rate as of October 31, 2011 was 2.75%. During the year ended October 31, 2011, the Tocqueville Fund’s maximum borrowing was $4,674,000 and average borrowing was $49,477, the Opportunity Fund’s maximum borrowing was $803,000 and average borrowing was $41,452, and the Gold Fund’s maximum borrowing was $21,854,000 and average borrowing was $341,800. This borrowing resulted in interest expenses of $1,209, $1,380 and $6,295, respectively. These amounts are included in Other Expenses on the Funds’ Statement of Operations. The International Value Fund, the Delafield Fund, and the Select Fund did not use their lines of credit. The Tocqueville Fund had an outstanding loan balance in the amount of $1,228,453 as of October 31, 2011.
10. NEW TAX LAW
On December 22, 2010, The Regulated Investment Company Modernization Act of 2010 (the “Modernization Act”) was signed into law. The Modernization Act is the first major piece of legislation affecting regulated investment companies (“RICs”) since 1986 and it modernizes several of the federal income and excise tax provisions related to RICs. Some highlights of the enacted provisions are as follows: New capital losses may now be carried forward indefinitely, and retain the character of the original loss. Under preenactment law, capital losses could be carried forward for eight years, and carried forward as short-term capital losses, irrespective of the character of the original loss.
The Modernization Act contains simplification provisions, which are aimed at preventing disqualification of a RIC for “inadvertent” failures of the asset diversification and/or qualifying income tests. Additionally, the Modernization Act exempts RICs from the preferential dividend rule, and repealed the 60-day designation requirement for certain types of paythrough income and gains.
Finally, the Modernization Act contains several provisions aimed at preserving the character of distributions made by a RIC during the portion of its taxable year ending after October 31 or December 31, reducing the circumstances under which a RIC might be required to file amended Forms 1099 to restate previously reported distributions. The provisions related to the RIC Modernization Act for qualification testing are effective for the October 31, 2011 taxable year. The effective date for changes in the treatment of capital losses is October 31, 2012 taxable year.
11. OTHER EXPENSES
Other expenses includes Chief Compliance Officer compensation. For the fiscal year ended October 31, 2011, compensation to the Trust’s Chief Compliance Officer from the Funds amounted to $10,693, $821, $4,403, $61,622, $28,238, and $1,344 for the Tocqueville Fund, Opportunity Fund, International Value Fund, Gold Fund, Delafield Fund, and Select Fund, respectively.
The Tocqueville Trust
Report of Independent Registered Public Accounting Firm
To the Shareholders and Board of Trustees of
The Tocqueville Trust:
We have audited the accompanying statements of assets and liabilities of The Tocqueville Trust, including The Tocqueville Fund, The Tocqueville Opportunity Fund, The Tocqueville International Value Fund, The Tocqueville Gold Fund, The Delafield Fund, and The Select Fund (collectively, the “Funds”), including the schedules of investments, as of October 31, 2011, and the related statements of operations for the year then ended, changes in net assets for each of the two years then ended, and the financial highlights for each of the five years then ended for The Tocqueville Fund, The Tocqueville Opportunity Fund, The Tocqueville International Value Fund, and The Tocqueville Gold Fund; the related statements of operations for the year then ended, changes in net assets and financial highlights for each of the two years then ended and for the period January 1, 2009 to October 31, 2009 for The Delafield Fund and The Tocqueville Select Fund. These financial statements and financial highlights are the responsibility of the Funds’ management. Our responsibility is to express an opinion on these financial statements and financial highlights based on our audits. The financial highlights for the three years in the period ended December 31, 2008 for The Delafield Fund and for the period September 28, 2008 (inception) through December 31, 2008 for The Select Fund was audited by other auditors. Those auditors expressed an unqualified opinion on those financial highlights in their report dated February 24, 2009.
We conducted our audits in accordance with the standards of the Public Company Accounting Oversight Board (United States). Those standards require that we plan and perform the audit to obtain reasonable assurance about whether the financial statements and financial highlights are free of material misstatement. The Funds are not required to have, nor were we engaged to perform, an audit of their internal control over financial reporting. Our audits included consideration of internal control over financial reporting as a basis for designing audit procedures that are appropriate in the circumstances, but not for the purpose of expressing an opinion on the effectiveness of the Funds’ internal control over financial reporting. Accordingly, we express no such opinion. An audit also includes examining, on a test basis, evidence supporting the amounts and disclosures in the financial statements and financial highlights, assessing the accounting principles used and significant estimates made by management, as well as evaluating the overall financial statement presentation. Our procedures included confirmation of the securities owned as of October 31, 2011, by correspondence with the custodian and brokers. We believe that our audits provide a reasonable basis for our opinion.
In our opinion, the financial statements and financial highlights referred to above present fairly, in all material respects, the financial position of each of the aforementioned Funds of The Tocqueville Trust as of October 31, 2011, and the results of their operations for the year then ended, the changes in net assets for each of the two years in the period ended, and the financial highlights for each of the five years in the period then ended for The Tocqueville Fund, The Tocqueville Opportunity Fund, The Tocqueville International Value Fund and The Tocqueville Gold Fund; the results of operations for the year then ended, changes in net assets and financial highlights for each of the two years then ended and for the period January 1, 2009 to October 31, 2009 for The Delafield Fund and The Tocqueville Select Fund, in conformity with accounting principles generally accepted in the United States of America.
/s/ GRANT THORNTON LLP
Chicago, Illinois
December 29, 2011
ADDITIONAL INFORMATION (UNAUDITED)
1. ADDITIONAL DISCLOSURE REGARDING FUND TRUSTEES AND OFFICERS
Independent Trustees
| | | | | | | | | | | | |
Name, Age and Address | | Position(s) Held with the Trust | | Term of Office and Length of Time Served (1) | | Principal Occupation During Past Five Years | | # of
Portfolios
in Fund
Complex
Overseen
By Trustee | | | Other Directorships Held by Trustee |
| | | | | |
Guy A. Main (75) 40 W. 57th St., 19th Floor New York, NY 10019 | | Trustee | | Indefinite Term, Since 2000 | | Retired. Formerly, Executive Vice President, Amwest Insurance Group, Inc. from April 1996 to January 2001; Chairman, President and Chief Executive Officer, Condor Services Inc. from April 1989 to April 1996. | | | 6 | | | Director, Amwest Insurance Group, Inc. from April 1996 to January 2001; Chairman, Association of California Insurance Companies from January 1996 to January 1998; Director, Condor Services Inc. from April 1989 to April 1996. |
| | | | | |
Charles W. Caulkins (55) 40 W. 57th St., 19th Floor New York, NY 10019 | | Trustee | | Indefinite Term, Since 2003 | | Partner, Chora Capital, LLC from June 2010 to present; Marketing Manager, L.R. Global Partners from January 2008 to May 2010; President, Arbor Marketing, Inc. from October 1994 to December 2007. | | | 6 | | | Director, Phoenix House from January 2001 to 2007; Director, Bridges to Community from July 2002 to 2006. |
| | | | | |
James W. Gerard (50) 40 W. 57th St., 19th Floor New York, NY 10019 | | Trustee | | Indefinite Term, Since 2001 | | Managing Director, North Sea Partners, January 2010 to present. Principal, Juniper Capital Group, LLC (formerly known as Argus Advisors International, LLC), from August 2003 to December 2009; Managing Director, The Chart Group from January 2001 to present; Managing Principal, Ironbound Partners from October 1998 to December 2000. | | | 6 | | | Director, American Overseas Memorial Day Association, 1988 to present; Trustee, Salisbury School, 2005 to present; Director, American Friends of Blerancourt, 1992-present; Director and Treasurer ASPCA, 1988 to 2008; |
Independent Trustees
| | | | | | | | | | | | |
Name, Age and Address | | Position(s) Held with the Trust | | Term of Office and Length of Time Served (1) | | Principal Occupation During Past Five Years | | # of
Portfolios
in Fund
Complex
Overseen
By Trustee | | | Other Directorships Held by Trustee |
| | | | | |
William F. Indoe (69) 40 W. 57th St., 19th Floor New York, NY 10019 | | Trustee | | Indefinite Term, Since 2006 | | Senior Counsel, Sullivan & Cromwell LLP (attorneys-at-law) 1990-present. | | | 6 | | | Director, Rho Capital Partners, Inc. |
| | | | | |
William J. Nolan III (64) 40 W. 57th St., 19th Floor New York, NY 10019 | | Trustee | | Indefinite Term, Since 2006 | | Retired, Executive Vice President & Treasurer PaineWebber Inc. 1997-2001. | | | 6 | | | Trustee, Adirondock Museum, Blue Mt. Lake, NY 1996 to present (Treasurer, 2000 to present). |
| | | | | |
Alexander Douglas (64) 40 W. 57th St., 19th Floor New York, NY 10019 | | Trustee | | Indefinite Term, Since 2010 | | President, CEO and owner of Spaulding Law Printing, Inc. | | | 6 | | | None |
Interested Trustees (and Officers)*
| | | | | | | | | | | | |
Name, Age and Address | | Position(s) Held with the Trust | | Term of Office and Length of Time Served (1) | | Principal Occupation During Past Five Years | | # of
Portfolios
in Fund
Complex
Overseen
By Trustee | | | Other Directorships Held by Trustee |
| | | | | |
Francois D. Sicart (68) 40 W. 57th St., 19th Floor New York, NY 10019 | | Chairman and Trustee | | Indefinite Term, Since 1987 | | Chairman, Tocqueville Management Corporation, the General Partner of Tocqueville Asset Management L.P. and Tocqueville Securities, L.P. from January 1990 to present; Chairman and Founder, Tocqueville Asset Management Corp. from December 1985 to January 1990; Vice Chairman of Tucker Anthony Management Corporation from 1981 to October 1986; Vice President (formerly general partner) among other positions with Tucker Anthony, Inc. from 1969 to January 1990. | | | 6 | | | Chairman and Director, Tocqueville Management Corporation, the General Partner of Tocqueville Asset Management L.P. and Tocqueville Securities, L.P. from January 1990 to present.
|
Interested Trustees (and Officers)*
| | | | | | | | | | | | |
Name, Age and Address | | Position(s) Held with the Trust | | Term of Office and Length of Time Served (1) | | Principal Occupation During Past Five Years | | # of
Portfolios
in Fund
Complex
Overseen
By Trustee | | | Other Directorships Held by Trustee |
| | | | | |
Robert W. Kleinschmidt (62) 40 W. 57th St., 19th Floor New York, NY 10019 | | President and Trustee | | Indefinite Term, Since 1991 | | President, Chief Investment Officer and Director, Tocqueville Management Corporation, the General Partner of Tocqueville Asset Management L.P. and Tocqueville Securities, L.P. from January 1994 to present; and Managing Director from July 1991 to January 1994; Partner, David J. Greene & Co. from May 1978 to July 1991. | | | 6 | | | President and Director, Tocqueville Management Corporation, the General Partner of Tocqueville Asset Management L.P. and Tocqueville Securities, L.P.
|
| | | | | |
Cleo Kotis (36) 40 W. 57th St., 19th Floor New York, NY 10019 | | Secretary | | Indefinite Term, Since 2010 | | Director of Operations, the Delafield Group of Tocqueville Asset Management L.P., 2009 to present; Vice President and Chief Operations Officer, the Delafield Fund, Inc. from 2005-2009; Vice President and Chief Operations Officer, Delafield Asset Management from 2005-2009; Vice President, Reich & Tang Asset Management, LLC from 2002-2009. | | | N/A | | | N/A |
| | | | | |
John Cassidy (68) 40 W. 57th St., 19th Floor New York, NY 10019 | | Treasurer | | Indefinite Term, Since 2010 | | Treasurer, Tocqueville Asset Management L.P., from May 2002 to present. | | | N/A | | | N/A |
| | | | | |
Elizabeth Bosco (63) 40 W. 57th St., 19th Floor
New York, NY 10019 | | Anti- Money Laundering Compliance Officer
| | Indefinite Term, Since 2009 | | Chief Compliance Officer (January 2009-present), Tocqueville Securities L.P.; Compliance Officer (January 1997-January 2009), Tocqueville Securities L.P. and Tocqueville Asset Management, L.P. | | | N/A | | | N/A
|
| * | “Interested person” of the Trust is defined in the 1940 Act. Mr. Sicart and Mr. Kleinschmidt are considered “interested persons” because of their affiliation with the Adviser. |
Interested Trustees (and Officers)*
| | | | | | | | | | | | |
Name, Age and Address | | Position(s) Held with the Trust | | Term of Office and Length of Time Served (1) | | Principal Occupation During Past Five Years | | # of
Portfolios
in Fund
Complex
Overseen
By Trustee | | | Other Directorships Held by Trustee |
| | | | | |
Thomas Pandick (64) 40 W. 57th St., 19th Floor New York, NY 10019
| | Chief Compliance Officer | | Indefinite Term, Since 2004 | | Chief Compliance Officer (October 2004-present), Tocqueville Asset Management L.P.; General Counsel (January-October 2004), Tocqueville Asset Management L.P. | | | N/A | | | N/A
|
| (1) | Each Trustee will hold office for an indefinite term until the earliest of (i) the next meeting of shareholders, if any, called for the purpose of considering the election or re-election of such Trustee and until the election and qualification of his or her successor, if any, elected at such meeting, or (ii) the date a Trustee resigns or retires, or a Trustee is removed by the Board of Trustees or shareholders, in accordance with the Trust’s By-Laws, as amended, and Agreement and Declaration of Trust, as amended. Each officer will hold office for an indefinite term until the date he or she resigns or retires or until his or her successor is elected and qualified. |
2. INVESTMENT ADVISORY AGREEMENT DISCLOSURE
In determining whether to approve the continuance of the Investment Advisory Agreements and the Administration Agreement, the Trustees, including the Independent Trustees, considered the following information:
1) The nature, extent and quality of services provided by the Adviser.
The Trustees reviewed in detail the nature and extent of the services provided by the Adviser under the terms of the Investment Advisory Agreements and the quality of those services provided to the Tocqueville Fund, the Tocqueville Opportunity Fund, the Tocqueville International Value Fund, the Tocqueville Gold Fund, the Delafield Fund and the Tocqueville Select Fund (the “Funds”) over the past year. The Trustees noted that the services include: managing the investment and reinvestment of the Funds’ assets; supervising and managing all aspects of the Funds’ operations; and providing the Board on a regular basis with financial reports and analyses on the Funds’ operations and the operations of comparable investment companies. The Trustees also observed that the Adviser provides various administrative services to the Funds pursuant to the terms of a separate Administration Agreement and considered the nature, extent and quality of services provided under that agreement as well. The Trustees evaluated these factors based on their direct experience with the Adviser and in consultation with counsel. The Trustees concluded that the nature and extent of the services provided under the Investment Advisory Agreements were reasonable and appropriate in relation to the advisory fee, that the level of services provided by the Adviser to the Funds had not diminished over the past year and that the quality of services continues to be high. The Trustees reviewed the personnel responsible for providing advisory services to the Funds and concluded, based on their experience and interaction with the Adviser, that (i) the Adviser was able to retain quality portfolio managers and other personnel; (ii) the Adviser exhibited a high level of diligence and attention to detail in carrying out its advisory responsibilities under the Investment Advisory Agreements for the Funds; (iii) the Adviser was responsive to requests of the Trustees; and (iv) the Adviser had kept the Trustees apprised of developments relating to the Funds and the industry in general. The Trustees also focused on the Adviser’s reputation and long-standing
relationship with the Trust. The Trustees also noted the high quality of services provided by the Adviser under the Administration Agreement.
In connection with its assessment of the performance of the Adviser, the Trustees reviewed the Adviser’s financial statements and considered the Adviser’s financial condition and whether it has the resources necessary to continue to carry out its obligations under the Investment Advisory Agreements and the Administration Agreement. The Trustees concluded that the Adviser has the financial resources necessary to continue to perform its obligations under the Investment Advisory Agreements and the Administration Agreement and to continue to provide the high quality services that it has provided to the Funds to date.
2) The performance of the Funds and the Adviser.
The Trustees reviewed the investment performance of the Funds, both on an absolute basis and as compared to a peer group for each respective Fund for the one-year, three-year, five-year and ten-year periods, as applicable, ended July 31, 2011. The peer groups were comprised of other funds that had similar investment objectives and sales load structures, as determined by Morningstar: The Morningstar Large Blend Funds peer group, with average net assets between $470 million and $575 million, for the Tocqueville Fund; the Morningstar Small Blend Funds peer group, with average net assets between $25 million and $60 million, for the Tocqueville Opportunity Fund; the Morningstar Foreign Small/Mid Value Funds peer group, with average net assets between $185 million and $345 million, for the Tocqueville International Value Fund; the Morningstar Precious Metals Funds peer group, with average net assets between $1.7 billion and $3.8 billion, for the Tocqueville Gold Fund; the Morningstar Mid-Cap Value Funds peer group, with average net assets between $925 million and $1.57 billion, for the Delafield Fund; and the Morningstar Small Value Funds peer group, with average net assets between $50 million and $100 million, for the Tocqueville Select Fund (the “Performance Peer Groups”). The Trustees considered that the performance information for the Delafield Fund and the Tocqueville Select Fund includes the performance information of their respective predecessor funds, which had different investment advisers, but the Trustees considered this information since these Funds have substantially the same portfolio management team.
The Trustees also compared each Fund’s investment performance against its benchmark market indices: the S&P 500 Index for the Tocqueville Fund; the Russell 2500 Index for the Tocqueville Opportunity Fund; the Morgan Stanley EAFE Index for the Tocqueville International Value Fund; the S&P 500 Index and the Philadelphia Stock Exchange Gold & Silver Index for the Tocqueville Gold Fund; the S&P 500 Index and the Russell 2000 Index for the Delafield Fund; and the Russell 2500 Index and the Russell 2000 Index for the Tocqueville Select Fund (the “Indices”) for the one-year, three-year, five-year and ten-year periods ended July 31, 2011 for all the Funds. The Trustees considered the above information as helpful in their assessment of whether the Adviser was obtaining for the Funds’ shareholders the performance that was available in the marketplace given each Fund’s investment objectives, policies, strategies, limitations and restrictions. The Trustees concluded that the performance of the Funds against their respective Performance Peer Groups was satisfactory. In particular, the Trustees noted that the Tocqueville Fund had outperformed as compared to its Index for the five-year and ten-year periods and underperformed for the one-year and three-year periods, and outperformed the median of its Performance Peer Group for all periods, except the one-year period. The Trustees noted that with respect to the Tocqueville Opportunity Fund that despite underperforming its Index for all time periods, except the one-year period, the Fund had outperformed the median of its Performance Peer Group for all periods except the ten-year period. The Trustees further noted that the Tocqueville International Value Fund outperformed its Index for all time periods and outperformed the median of its Performance Peer Group for the all periods except the five-year period. The Trustees noted that the Tocqueville Gold Fund outperformed its Indices and the median of its Performance Peer Group for all periods. The Trustees noted that the Delafield Fund outperformed its Indices for all time periods except the one-year period and
outperformed the median of its Performance Peer Group for all time periods except the one-year period. The Trustees noted that the Tocqueville Select Fund outperformed its Indices for all time periods except the one-year period and outperformed the median of its Performance Peer Group for all time periods except the one-year period.
3) The cost of the advisory services and the profits to the Adviser from the relationship with the Trust.
In connection with the Trustee’s consideration of the level of the advisory fees, the Trustees considered a number of factors. The Trustees compared the level of the advisory fees for each Fund against the advisory fees charged by funds in a universe of funds: the Morningstar Large Cap Blend Funds peer group, with average net assets between $350 million and $650 million, for the Tocqueville Fund; the Morningstar Small Blend Funds peer group, with average net assets between $20 million and $80 million, for the Tocqueville Opportunity Fund; the Morningstar Foreign Small/Mid Value Funds peer group, with average net assets between $50 million and $500 million, for the Tocqueville International Value Fund; the Morningstar Precious Metals Funds peer group, with average net assets above $500 million, for the Tocqueville Gold Fund; the Morningstar Mid-Cap Value Funds peer group, with average net assets between $750 million and $1.75 billion, for the Delafield Fund; and the Morningstar Small Value Funds peer group, with average net assets between $50 million and $150 million, for the Tocqueville Select Fund (the “Expense Peer Groups”). The Adviser noted that it does not advise or sub-advise other funds with an investment policy similar to the Funds’ or other types of accounts, such as institutional and pension accounts, with similar investment policies to the Funds’. The Trustees considered comparative total fund expenses of the Funds and the Expense Peer Groups. The Trustees used this comparative fee information and total expense data as a guide to help assess the reasonableness of each Fund’s advisory fee, although they acknowledged that it was difficult to make precise comparisons with other funds since the exact nature of services provided under each Expense Peer Group fund agreement is often not apparent. The Trustees also viewed the Expense Peer Group fee information as a whole as useful in assessing whether the Adviser was providing services at a cost that was competitive with other, similar funds.
The Trustees noted that the contract rate advisory fee and administration fee for each of the Funds were reasonable, despite the contractual advisory fee rate being above average for the Tocqueville Fund, the Tocqueville International Value Fund and the Tocqueville Gold Fund and the administration fee being above average for the Tocqueville International Value Fund, the Tocqueville Gold Fund, the Delafield Fund and the Tocqueville Select Fund, when compared to their respective Expense Peer Groups. The Board further observed that the total expense ratios of the Funds were also reasonable. The Board noted that the total expense ratio for the Tocqueville Fund, the Tocqueville International Value Fund, the Delafield Fund and the Tocqueville Select Fund were above average, when compared to their respective Expense Peer Groups and that the total expense ratio for the Tocqueville Opportunity Fund and the Tocqueville Gold Fund were below average, when compared to their respective Expense Peer Groups. The Board also noted that the Tocqueville Fund operates pursuant to an Expense Limitation Agreement whereby the Adviser has agreed to waive a portion of its fee necessary to limit the Fund’s total operating expenses to the level set forth in the Fund’s prospectus.
The Trustees also considered the profitability to the Adviser and its affiliate arising out of its relationship with the Trust. In this regard, the Trustees reviewed profitability data relating to the Adviser for the year October 31, 2010. The Trustees considered revenues received by the Adviser under the Investment Advisory Agreements and the Administration Agreement as well as revenues received by the Adviser’s affiliate, the Distributor, under the 12b-1 plans and Related Agreements and commissions received for effecting portfolio transactions. The Trustees also received and reviewed the Adviser’s financial statements and the Adviser provided an oral update on its profitability numbers since October 31, 2010. The Trustees concluded that the profitability of the Funds to the Adviser was not excessive.
4) The extent to which economies of scale will be realized as the Funds grow and whether fee levels reflect those economies of scale.
With respect to the Trustees’ consideration of economies of scale, the Trustees discussed with the Adviser whether economies of scale would be realized by it in its management of a Fund at higher asset levels. The Trustees also reviewed the Peer Group data to assess whether the Peer Group funds had advisory fee breakpoints and, if so, at what asset levels. The Trustees noted that the Funds, except for the Tocqueville Select Fund, currently have advisory fee breakpoints and that they were satisfied that the current breakpoints were appropriate when compared with each Fund’s respective Peer Group. The Trustees considered that breakpoints are not necessary at this time for the Tocqueville Select Fund, given the small size of the Tocqueville Select Fund. In the event there was significant asset growth in the future in a Fund, the Trustee’s determined to reassess whether the advisory fees, including the current breakpoint structure, appropriately took into account any economies of scale that had been realized as a result of that growth.
5) Other Factors.
The Trustees also discussed the Adviser’s practices regarding the selection and compensation of brokers and dealers that execute portfolio transactions for the Funds and the brokers’ and dealers’ provision of brokerage and research services to the Adviser. The Trustees further discussed the potential benefits the Adviser derived from the Funds’ soft dollar arrangements, whereby brokers provide research to the Funds or the Adviser in return for allocating fund brokerage, and other investment data concerning soft dollars. The Board also discussed the Adviser’s use of an affiliated broker to effect portfolio transactions, noting that in addition to paying a competitive rate on commissions, the Adviser believed the Funds received better execution on trades.
Based on a consideration of all these factors in their totality, the Trustees, including all of the Independent Trustees, determined that the Funds’ advisory fees and administration fees were fair and reasonable with respect to the quality of services that the Adviser provides and in light of the other factors described above that the Trustees deemed relevant. The Trustees based their decision on evaluations of all these factors as a whole and did not consider any one factor as all-important or controlling. The Independent Trustees were also assisted by the advice of independent counsel in making this determination.
3. PROXY VOTING POLICIES AND PROCEDURES
A description of the policies and procedures that The Tocqueville Trust uses to determine how to vote proxies relating to portfolio securities is available without charge upon request by calling 1-800-355-7307. Information regarding how The Tocqueville Trust voted proxies relating to portfolio securities during the most recent 12-month period ended June 30 is available by calling 1-800-355-7307 and it is also available on the SEC’s web site at http://www.sec.gov.
4. SHAREHOLDER REPORTS AND QUARTERLY PORTFOLIO DISCLOSURE
The Tocqueville Trust is required to file its complete schedule of portfolio holdings with the SEC for its first and third fiscal quarters on Form N-Q. The Trust’s Form N-Q will be available without charge, upon request on the SEC’s website (http://www.sec.gov) and may be available by calling 1-800-697-3863. You can also obtain copies of Form N-Q by (i) visiting the SEC’s Public Reference Room in Washington, DC (information on the operation of the Public Reference Room may be obtained by calling 1-202-551-8090); (ii) sending your request and a duplicating fee to the SEC’s Public Reference Room, Washington, DC 20549-1520; or (iii) sending your request electronically to
publicinfosec.gov. Quarterly portfolio holdings are also available on the website of The Tocqueville Funds, www.tocquevillefunds.com.
5. SHAREHOLDER NOTIFICATION OF FEDERAL TAX STATUS
For the fiscal period ended October 31, 2011, certain dividends paid by the Funds may be subject to a maximum tax rate of 15%, as provided for by the Jobs and Growth Tax Relief Reconciliation Act of 2003. The percentage of dividends declared from ordinary income designated as qualified dividend income was as follows:
| | | | |
Tocqueville Fund | | | 100.00 | % |
Opportunity Fund | | | 0.00 | % |
International Value Fund | | | 100.00 | % |
Gold Fund | | | 0.00 | % |
Delafield Fund | | | 0.00 | % |
Select Fund | | | 97.99 | % |
For corporate shareholders, the percent of ordinary income distributions qualifying for the corporate dividends received deduction for the fiscal period ended October 31, 2011 was as follows:
| | | | |
Tocqueville Fund | | | 100.00 | % |
Opportunity Fund | | | 0.00 | % |
International Value Fund | | | 2.35 | % |
Gold Fund | | | 0.00 | % |
Delafield Fund | | | 0.00 | % |
Select Fund | | | 96.61 | % |
For the period ended October 31, 2011, the funds designate the following percent of ordinary distributions paid as interest-related dividends under the Internal Revenue Code Section 871(k)(1)(c):
| | | | |
Tocqueville Fund | | | 1.42 | % |
Opportunity Fund | | | 0.00 | % |
International Value Fund | | | 0.86 | % |
Gold Fund | | | 0.00 | % |
Delafield Fund | | | 0.00 | % |
Select Fund | | | 0.27 | % |
The percentage of taxable ordinary income distributions that are designated as short-term capital gain distributions under Internal Revenue Section 871(k)(2)(C) for each Fund were as follows.
| | | | |
Tocqueville Fund | | | 0.00 | % |
Opportunity Fund | | | 0.00 | % |
International Value Fund | | | 0.00 | % |
Gold Fund | | | 0.00 | % |
Delafield Fund | | | 0.00 | % |
Select Fund | | | 100.00 | % |
6. FOREIGN TAX CREDIT
For the year ended October 31, 2011, the Tocqueville International Value Fund earned foreign source income and paid foreign taxes which they intend to pass through to their shareholders pursuant to Section 853 of the Internal Revenue Code as follows:
| | | | | | | | |
Country | | Gross Dividend
Per Share | | | Taxes Withheld
Per Share | |
Australia | | $ | 0.01374 | | | $ | 0.00024 | |
Belgium | | | 0.03435 | | | | 0.00515 | |
Brazil | | | 0.00601 | | | | 0.00081 | |
Canada | | | 0.00036 | | | | 0.00005 | |
Curacao | | | 0.00171 | | | | 0.00000 | |
Finland | | | 0.00000 | | | | 0.00000 | |
France | | | 0.06775 | | | | 0.00773 | |
Germany | | | 0.01178 | | | | 0.00177 | |
Greece | | | 0.00070 | | | | 0.00015 | |
Hong Kong | | | 0.02227 | | | | 0.00000 | |
Indonesia | | | 0.00000 | | | | 0.00000 | |
Ireland | | | 0.00862 | | | | 0.00114 | |
Italy | | | 0.01246 | | | | 0.00187 | |
Japan | | | 0.04606 | | | | 0.00322 | |
Jersey | | | 0.00455 | | | | 0.00000 | |
Mexico | | | 0.00358 | | | | 0.00000 | |
Netherlands | | | 0.01322 | | | | 0.00198 | |
Netherlands Antilles | | | 0.00000 | | | | 0.00000 | |
Singapore | | | 0.00000 | | | | 0.00000 | |
South Africa | | | 0.00059 | | | | 0.00000 | |
Spain | | | 0.02662 | | | | 0.00377 | |
Switzerland | | | 0.00848 | | | | 0.00127 | |
Thailand | | | 0.00000 | | | | 0.00000 | |
| | | | | | | | |
| | $ | 0.28285 | | | $ | 0.02915 | |
| | | | | | | | |
Investment Adviser
Tocqueville Asset Management L.P.
40 W. 57th St., 19th Floor
New York, NY 10019
(212) 698-0800
www.tocqueville.com
Distributor
Tocqueville Securities, L.P.
40 W. 57th St., 19th Floor
New York, NY 10019
(212) 698-0800
Shareholders’ Servicing and Transfer Agent
U.S. Bancorp Fund Services, LLC
P.O. Box 701
Milwaukee, WI 53201-0701
(800) 697-3863
Custodian
U.S. Bank, N.A.
Custody Operations
1555 River Center Drive, Suite 302
Milwaukee, WI 53212
Board of Trustees
François D. Sicart—Chairman
Charles W. Caulkins
Alexander Douglas
James W. Gerard
William F. Indoe
Robert W. Kleinschmidt
Guy A. Main
William J. Nolan III

Tocqueville Funds
c/o US Bancorp Fund Services, LLC
P.O. Box 701
Milwaukee, WI 53201-0701
www.tocquevillefunds.com
TQRPANNU 11
Item 2. Code of Ethics.
The registrant has adopted a code of ethics that applies to the registrant’s Principal Executive Officer and Principal Financial Officer. The registrant has not made any amendments to its code of ethics during the period covered by this report. The registrant has not granted any waivers from any provisions of the code of ethics during the period covered by this report.
Incorporated by reference to the Registrant’s Form N-CSR filed January 6, 2011.
Item 3. Audit Committee Financial Expert.
The registrant’s Board of Trustees has determined that there are three audit committee financial experts serving on its audit committee, James Gerard, William Nolan III, and Guy Main, who are “independent” as defined in Item 3 of Form N-CSR.
Item 4. Principal Accountant Fees and Services.
| | | | | | | | |
| | | FYE 10/31/11 | | | FYE 10/31/10 | |
4(a) Audit Fees | | $ | 142,000 | | | $ | 136,500 | |
4(b) Audit Related Fees | | $ | 0 | | | $ | 3,000 | |
4(c) Tax Fees | | $ | 19,200 | | | $ | 18,000 | |
4(d) All Other Fees | | $ | 0 | | | $ | 0 | |
“Tax Services” refer to professional services rendered by the principal accountant for tax compliance, tax advice, and tax planning.
4(e)(1) The registrant’s audit committee is required to pre-approve (i) all audit and non-audit services performed by the independent registered public accounting firm (“accountants”) for the registrant and (ii) any non-audit services performed by the accountants for the registrant’s investment adviser and control persons of the adviser that provide ongoing services to the registrant (“Service Affiliates”) if the services relate directly to the operations and financial reporting of the registrant. The audit committee has not presently established any pre-approval policies and procedures that permit the pre-approval of the above services other than by the full audit committee. Certain de minimis exceptions are allowed for non-audit services in accordance with Rule 2-01(c)(7)(i)(C) of Regulation S-X as set forth in the registrant’s audit committee charter.
4(e)(2) None.
4(f) Not applicable.
4(g) The amount of non-audit fees that were billed by the registrant’s accountant for services rendered to (i) the registrant, and (ii) the registrant’s investment adviser and any control person of the adviser that provides ongoing services to the registrant for the fiscal year ended
October 31, 2011 were $19,200 and $0, respectively. The amount of non-audit fees that were billed by the registrant’s accountant for services rendered to (i) the registrant, and (ii) the registrant’s investment adviser and any control person of the adviser that provides ongoing services to the registrant for the fiscal year ended October 31, 2010 were $18,900 and $0, respectively.
4(h) Not applicable.
Item 5. Audit Committee of Listed Registrants.
Not applicable to registrants who are not listed issuers (as defined in Rule 10A-3 under the Securities Exchange Act of 1934).
Item 6. Schedule of Investments.
Schedule of Investments is included as part of the report to shareholders filed under Item 1 of this Form.
Item 7. Disclosure of Proxy Voting Policies and Procedures for Closed-End Management Investment Companies.
Not applicable to open-end investment companies.
Item 8. Portfolio Managers of Closed-End Management Investment Companies.
Not applicable to open-end investment companies.
Item 9. Purchases of Equity Securities by Closed-End Management Investment Company and Affiliated Purchasers.
Not applicable to open-end investment companies.
Item 10. Submission of Matters to a Vote of Security Holders.
There were no material changes to the procedures by which shareholders may recommend nominees to the registrant’s Board of Trustees that were implemented after the registrant last provided disclosure in response to the requirements of Item 407(c)(2)(iv) of Regulation S-K (as required by Item 22(b)(15) of Schedule 14A), or this Item 10.
Item 11. Controls and Procedures.
| (a) | The registrant’s Principal Executive Officer and Principal Financial Officer have evaluated the design and operation of the registrant’s disclosure controls and procedures within 90 days of the filing and have concluded that the registrant’s disclosure controls and procedures were effective in ensuring that information required to be disclosed by the registrant in this Form N-CSR was recorded, processed, summarized and reported on a timely basis. |
2
| (b) | There were no changes in the registrant’s internal controls over financial reporting that occurred during the period covered by this report that have materially affected, or are reasonably likely to materially affect, the registrant’s internal control over financial reporting. |
Item 12. Exhibits.
| (a) | (1) Any code of ethics or amendment thereto, that is subject of the disclosure required by Item 2, to the extent that the registrant intends to satisfy Item 2 requirements through filing an exhibit. Incorporated by reference to the Registrant’s Form N-CSR filed January 6, 2011. |
(2) Certifications pursuant to Section 302 of the Sarbanes-Oxley Act of 2002. Filed herewith.
(3) Not applicable to open-end investment companies.
| (b) | Certifications of Principal Executive Officer and Principal Financial Officer, under Section 906 of the Sarbanes-Oxley Act of 2002 and 18 U.S.C. § 1350. Filed herewith. |
3
SIGNATURES
Pursuant to the requirements of the Securities Exchange Act of 1934 and the Investment Company Act of 1940, the registrant has duly caused this report to be signed on its behalf by the undersigned, thereunto duly authorized.
| | | | | | |
| | (Registrant) | | The Tocqueville Trust | | |
| | | |
| | By (Signature and Title)* | | /s/ Robert W. Kleinschmidt | | |
| | | | Robert W. Kleinschmidt, President | | |
| | | |
| | Date | | 1/6/2012 | | |
Pursuant to the requirements of the Securities Exchange Act of 1934 and the Investment Company Act of 1940, this report has been signed below by the following persons on behalf of the registrant and in the capacities and on the dates indicated.
| | | | | | |
| | | By (Signature and Title)* | | /s/ Robert W. Kleinschmidt | | |
| | | | Robert W. Kleinschmidt, President | | |
| | | |
| | Date | | 1/6/2012 | | |
| | | |
| | By (Signature and Title)* | | /s/ John Cassidy | | |
| | | | John Cassidy, Treasurer | | |
| | | |
| | Date | | 1/6/2012 | | |
| * | Print the name and title of each signing officer under his or her signature. |
1