UNITED STATES
SECURITIES AND EXCHANGE COMMISSION
Washington, D.C. 20549
FORM N-CSR
CERTIFIED SHAREHOLDER REPORT OF REGISTERED
MANAGEMENT INVESTMENT COMPANIES
Investment Company Act file number 811-4840
The Tocqueville Trust
(Exact name of registrant as specified in charter)
The Tocqueville Trust
40 W. 57th St., 19th Floor
New York, NY 10019
(Address of principal executive offices) (Zip code)
Robert W. Kleinschmidt
The Tocqueville Trust
40 W. 57th St., 19th Floor
New York, NY 10019
(Name and address of agent for service)
(212) 698-0800
Registrant’s telephone number, including area code
Date of fiscal year end: October 31
Date of reporting period: October 31, 2013
Item 1. Reports to Stockholders.
ANNUAL REPORT
October 31, 2013
The Tocqueville Trust
Mutual Funds
The Tocqueville Fund
The Tocqueville Opportunity Fund
The Tocqueville International Value Fund
The Tocqueville Gold Fund
The Delafield Fund
The Tocqueville Select Fund

This report is not authorized for distribution to prospective investors unless preceded or accompanied by a currently effective prospectus of The Tocqueville Trust. Please call 1-800-697-FUND (3863) for a free prospectus. Read it carefully before you invest.
You are invited to visit our website @ www.tocqueville.com/mutual-funds
Dear Fellow Shareholder,
In the last twenty years, we experienced two major stock market bubbles: the NASDAQ and Internet craze of the late 1990s and the sub-prime lending and real-estate folly of the mid-2000s. Each ended in a painful stock market crash of around 50%, accompanied by a severe recession. It is not surprising, therefore that investors have become accustomed to think of the stock market in terms of bubbles and crashes. Yet, bear markets in stocks and economic recessions, if not always as severe, have been a recurring feature of free economies ever since they have been in existence.
What has been different this time is the extent to which central banks—and principally the U.S. Federal Reserve—have taken center stage—both as saviors of last resort when these bubbles burst and as engineers of the following speculative bubble as a result of their rescue operations.
During the last two decades, it became an accepted view that fluctuations in the wealth of investors determined spending and saving trends in the economy. The Federal Reserve thus became concerned that any serious stock market decline might precipitate an economic recession, and it began to pour liquidity into the banking system as soon as a stock market decline threatened to gather momentum.
Naturally, investors tend to become addicted to a market that they “know” will be bailed out as soon as it threatens to decline and, in such a market, prices keep going up regardless of valuations—at least until some accident sends them back down to earth. This is what happened when the tech stock bubble burst in early 2000, and in the post-financial crisis bear market of 2007-2009.
Today, we are living through perhaps the greatest monetary policy experiment of modern times: having brought interest rates all the way down to near zero, the U.S. Federal Reserve has embarked onto “Quantitative Easing” by buying Treasury and related securities regardless of the impact on interest rates. Initially, this was a desperate effort by the United States to bail out its financial system and to drag the economy out of a deep and stubborn recession. Soon, the United Kingdom and Japan opted to follow a similar route and eventually so did the European Central Bank, albeit somewhat reluctantly.
The resulting torrent of liquidity produced powerful rallies in the global financial markets, including bounces back to historical highs in some instances, even though the real economies had only partially recovered. As a result, valuations could never reach the low levels that had characterized major market bottoms in the past.
To generalize, valuation measures today stand somewhere between those at major market bottoms of the past and the extreme highs reached during the last speculative bubble. Part of the investing crowd is busy trying to participate in what might be a major new (though ageing) bull market, while the rest spends its time worrying about when the speculative bubbles potentially created by the central banks’ lavish provision of liquidity will burst.
It could be argued that the major stock markets are not yet in bubble territory, since there remains a fair number of skeptics and worriers. But it also seems hard to envision major gains from here as many studies, including by Nobel Prize laureate Robert Shiller, indicate that 5-10 year returns from current stock market valuation levels tend to be very slim.
At the same time, a number of observers have pointed out that the distribution of P/E multiples among stocks in the S&P 500 stock market index has recently been the narrowest in about 25 years. Simply speaking, this means that the difference between the highest P/Es and the lowest P/Es among stocks in the index is historically very low. It also means, therefore, that companies with very different qualities and growth potentials may be selling at similar price/earnings ratios, which should translate in attractive opportunities for analysts capable to detect the anomalies.
Between the great financial crisis of 2007-2009 and the monetary-fueled recoveries that followed, the most important investment decisions have been of a macro nature: to be invested in the market or not or, in today’s fashionable lingo, “risk in or risk out”. Now is a good time to remember the fundamentals of stock selection.
Respectfully,

François Sicart
Chairman
The Tocqueville Fund
Dear Fellow Shareholder,
The fiscal year just completed was a remarkable one, and not just because of the stellar performance put in by the market and by the Fund. Economic, and, more strikingly, political, developments which one might have thought would have had profound negative influence on the market seemed not to have mattered to equity investors. At the same time, the market’s bull run seemed to have an equally unimpressive impact on the investing public, as fund flows, or more accurately, lack thereof, into equities demonstrated. What, exactly, is going on?
Fortunately, fund managers do not have to answer such questions. Their role, and particularly, as I see mine, is to purchase shares of good companies at bargain prices when they have fallen out of favor with the investing public, and hold them for as long as their prospects appear under appreciated by the markets. Though hardly a walk in the park, this is far easier to accomplish than to predict with any accuracy, and more importantly, with any consistency, the path of the overall market.
That said, we did predict, last year in this letter, a benign market environment. Our reasoning then was that the “fiscal cliff” would be the 21st Century equivalent of Y2K: To wit, much ado about nothing. Ditto, it turns out, for the sequester, and now, as recent data has shown, “la meme chose” for the government shutdown. These political hysterics may sell newspapers and win or lose votes, but they have had little effect, correctly, in my view, on the markets. Why? Well, in part, because, notwithstanding all the dire rhetoric that surrounded them, the numbers involved were tiny, on a relative basis, compared with the overall burden of public sector spending or when compared with the economy as a whole. The markets, it seemed, saw through the rhetoric and concluded, rightly, that the emperor wasn’t wearing any clothes.
This is not to say that there are not very large fiscal issues that must be addressed. The entire entitlement structure of the Federal government must be overhauled. At the state and local levels, public employees’ pension issues are overhanging most budgets. But these problems are far from unknown and the solutions to these issues are both simple and obvious, in spite of the political difficulty involved in getting to them. And, so, the markets seem to have concluded, they will be solved. I concur, but not without some drama and pain.
Beyond looking past political shenanigans, the markets also seemed indifferent to anemic economic growth in the U.S. and elsewhere. Now, markets are supposed to be discounting mechanisms and what they are supposed to discount is the future. They may be wrong about the future, in which case they must adjust and discount a new consensus future, but in no event are the markets expected to discount the present or the past. Consequently, one could conclude that the markets have discounted a brighter economic picture than the sluggish growth one which is currently in focus. If so, there is room for disappointment in the year ahead, and caution is warranted. True enough, but from our risk adverse, capital preservation orientation, caution is always warranted. So I can’t say much is new there.
That the investing public at large has not been lured back into the markets in droves after such an impressive uplift is by far the most interesting and telling development of the past year. What it signals to this long-time observer, is a sea change in public attitude regarding equities, coupled with a secular shift in demographics. While both factors are important, it is the latter, I suspect, which is the more profound and the longest lasting. First the former. After the collapse of the internet bubble in 2000 through 2002, and followed so closely by 2007 through 2009 meltdown, the bloom seems to have come off the rose of the equity markets for many erstwhile investors. Much like the wariness of generations after the 1929 collapse and the ensuing Depression, generations of investors who were raised on the notion that there was no alternative to equities have been badly burned by the markets and are in no hurry to reengage. Risk taking has lost its allure to many, and just as deleveraging is the strategy of choice for debtors, fixed income securities, as witnessed by the huge inflows into bond funds over the past few years, have become the investment vehicle of choice for many. That this has turned out to be precisely the wrong strategy is of no particular moment, and I suspect that it will take far more ebullience in the markets even than what we have seen this year to change that mindset.
As for the demographic shift, this is increasingly well documented, though, astonishingly, few were speaking of it only a few years ago. The implication for the markets, as well as for public policy and the national fiscal predicament, are profound. An aging population is a dissaving population, and the long standing zero interest rate policy of the central bank implies that retirees cannot count on their savings to provide them an income. This means, perforce, the need to “eat” their capital, and/or to continue working. But in either event, it does not mean reengaging with an equity market perceived as risky. So, for the foreseeable future, one should expect to see considerable flow out of the equity markets from this large group, as baby boomers cash in their IRAs, 401ks and other savings to pay for their living expenses.
Nor is this the only demographic change of note. The ethnic and cultural make-up of the nation is changing rapidly and it is not too much to speculate that the new America will have different attitudes about risk and entrepreneurship than the one it replaces. It certainly seems that the role that government is expected to play by the emerging majority will be different and larger than what was acceptable in the past. Whatever positive societal alterations may occur as a result of these changes, these developments are likely to have the same long term effects on equity markets that they have had in many other countries where these attitudes, expectations and policies prevail, i.e., not exactly salutary.
But there is little that an investor can do about these large changes, other than to be cognizant of them, so, I return to my earlier premise that fund managers should stick to their knitting and concentrate on finding and owning shares of good companies, at reasonable prices, and let the equity markets take care of themselves. In the most recent fiscal year, that is exactly what we have done and the results were most satisfactory, from both an absolute and relative perspective. The Tocqueville Fund registered a 29.04% return over the fiscal year, compared with a 27.18% for the overall market, as measured by the S&P 500, the index against which we are most commonly measured. With the exception of Newmont Mining, a gold mining company that had a miserable year, almost all the names in our portfolio generated a positive contribution to the results. In particular, large cap names like Ford, Xerox, Google, Du Pont, MasterCard, Applied Materials, Johnson and Johnson, and Boeing were significant contributors to our performance, but so too were Isis Pharmaceuticals, Alkermes, and Steelcase, smaller capitalization names. Combined, these names, which comprised the top ten performers during the past fiscal year, provide some insight into our eclectic, multicap, style agnostic approach to investing. It is an approach that has generated consistently satisfactory returns—at least from the perspective of this very large shareholder—over the long period I have been managing the Fund. And it is the approach we will continue to employ, with caution, in the years ahead.
Thank you for your continued support,
Sincerely,

Robert W. Kleinschmidt
Portfolio Manager
The Tocqueville Fund
(Unaudited)
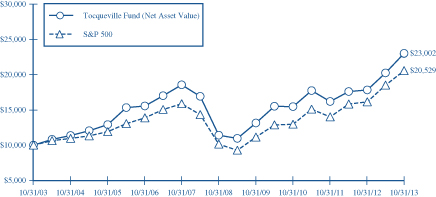
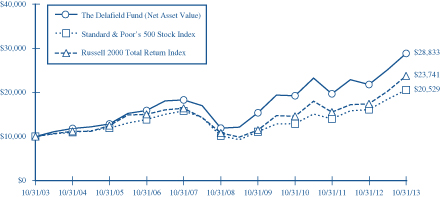
This chart assumes an initial gross investment of $10,000 made on 10/31/03. Returns shown do not reflect the deduction of taxes that a shareholder would pay on fund distributions or the redemption of fund shares. Performance reflects fee waivers in effect. In the absence of fee waivers, total return would be reduced. Returns shown include the reinvestment of all dividends and other distributions. Past performance is not predictive of future performance. Investment return and principal value will fluctuate so that your shares, when redeemed, may be worth more or less than their original cost. The Fund imposes a 2% redemption fee on shares held for 90 days or less.
The Standard & Poor’s 500 Stock Index (S&P 500) is a capital-weighted index, representing the aggregate market value of the common equity of 500 stocks primarily traded on the New York Stock Exchange. Returns assume the reinvestment of all dividends.
AVERAGE ANNUAL RATE OF RETURN (%)
FOR PERIODS ENDED OCTOBER 31, 2013
| | | | | | | | | | | | | | | | |
| | | 1 Year | | | 3 Year | | | 5 Year | | | 10 Year | |
The Tocqueville Fund | | | 29.04% | | | | 14.17% | | | | 15.04% | | | | 8.69% | |
Standard & Poor’s 500 Stock Index | | | 27.18% | | | | 16.56% | | | | 15.17% | | | | 7.46% | |
The Tocqueville Opportunity Fund
Dear Fellow Shareholder,
We are pleased to provide this review of the Tocqueville Opportunity Fund’s performance for the fiscal year ended October 31, 2013. The Fund performed slightly below the SMID cap (small/mid cap) growth benchmark (the Russell 2500 Growth Index) and gained 35.09% while the Index gained 37.60%. The performance of small and mid-capitalization issues was favored throughout the past fiscal year over larger capitalization issues. Longer term investors in the Fund will recall that the fiscal year commenced in the midst of a sell-off in equity markets post the 2012 Labor Day weekend precipitated by a combination of European Union related macro fears, the U.S. Presidential election, the expiration of fiscal stimulus at the end of 2012, and the probability of higher dividend and capital taxation in 2013. In retrospect the correction ran for about two months from mid-September 2012 through mid-November 2012; the correction in SMID cap growth issues was significant at 9.5%. The recovery from the lows was impressive, and equity indices have been marked since by a steady series of higher highs and higher lows. While SMID cap value issues led growth for most of the past fiscal year, growth issues usurped the lead in late June upon the conclusion of a mid-year correction which was brought on by fears of an imminent shift in policy away from quantitative easing due to an improved economic outlook.
Over the past year, there have been several noteworthy shifts in sector allocations which have resulted from both performance and investment strategy. At the fiscal year end, the Fund’s largest sector commitments were in the economy sensitive sectors: Basic Materials, Autos and Transportation, and Producer Durables. During the year, we increased the weightings in these more cyclical areas from about 17% to 27% of the Fund’s total investments as we gained increased confidence in the persistency of the economic recovery and passing threats of sequestration, the shut down, and QE tapering. Although Healthcare sector investments had comprised the largest share of the Fund’s capital at the start of the fiscal year, we continued to increase exposures and ended the period at more than 23% of the Fund’s investments. Healthcare issues provided leading performance, and throughout the period was a steady stream of new issue offerings and positive news supporting the sector—trial results and new drug approvals. We lowered investment allocations to the combined Consumer Staples/Consumer Discretionary sectors, but the group represented the third largest sector level commitment of the Fund at approximately 25%. Our bias toward the Consumer holdings has been to tilt holdings toward issues which stand to benefit the most from a recovery in discretionary spending, including: housing, leisure activities and travel. We have also continued to increase the Fund’s investments in Financial issues, and over the past year have moved from a significant underweight to an overweight on a relative basis. Financials generated the second best relative sector performance for the Fund over the past year, and the Fund’s holdings are characterized by a group of issues that has benefitted from consolidation, rapid loan and market share growth, and exceptional management and execution. The aforementioned increases in sector investments have essentially been funded from a dramatic reduction in the Technology sector—one year ago Technology investments were the Fund’s largest holdings but over the past year, we reduced Technology investments from approximately 23% to nearly 16%. While several of the Fund’s leading performers were Technology issues (LinkedIn, priceline.com), the overall sector was the worst performing for the Fund and the Fund’s holding in Apple was the single worst contributor to Fund performance. Apple’s share price declined nearly 25% during the period.
Healthcare issues powered the Fund’s performance during the past fiscal year. Eleven of the top 15 absolute performers were Healthcare issues, and all but one of these doubled in price during the period—the top five of these included: Aegerion Pharmaceuticals, Alnylam Pharmaceuticals, NPS Pharmaceuticals, Isis Pharmaceuticals and Incyte Pharmaceuticals. On a relative basis, Healthcare issues occupied seven of the top 15 contributors with the leading five including: Alnylam Pharmaceuticals, NPS Pharmaceuticals, Regeneron Pharmaceuticals, Pharmacyclics, and Vertex Pharmaceuticals. While we don’t regard “top ten” holdings as a statistically meaningful metric due to the Fund’s diversification strategies, Healthcare issues comprised six of the “top ten” issues at the end of the fiscal year versus two at the start. We have gained increased confidence over the past three years that the new era of medicine marked by targeted therapies against rare, orphan diseases and cancers, enabled by genetic identification and characterization, represents one of the most significant investment opportunities of a lifetime. Nevertheless, we recognize that Healthcare investments are inherently risky for reasons ranging from adverse events to the FDA approval process—the Fund’s Healthcare holdings are very diversified and the relative risk of any single holding is diligently monitored and controlled.
The combined Industrials names (Auto and Transportation, Durables and Materials) contributed positively to Fund performance during the fiscal year, even as we increased investments significantly. Outside of the dominant performance of Healthcare issues, contributions were varied but equally significant. Facebook was a top 5 issue in terms of absolute gains and turned in the second best relative contribution during the period. LinkedIn, a long term holding, was top 10 in absolute gains and top 5 in relative contribution. Other impressive absolute and/or relative contributors included: Tesla Motors, Boston Beer, Hanesbrands, Delta, and CaeserStone. Delta, Tesla, Priceline and Manhattan Associates were the only four non-Healthcare issues in the “top ten” list at the end of the fiscal year. The fiscal year was unique for the lack of takeovers of Fund investments in comparison with the two prior fiscal years when a steady stream of takeovers which benefitted performance. However, in a bit of a paradox, the Fund benefitted from positions in numerous “acquiring” companies whose share prices predominantly rose as acquisitions were driven by accretive and market share enhancing strategies. Names of issues involved in significant transactions included: Hanesbrands, Constellation Brands, Warner Chilcott, Actavis, Valeant Pharmaceuticals, First Financial Holdings, Middleby, Generac Holdings, Westinhouse Air Brake Technologies, Onyx Pharmaceuticals, Endo Health Solutions, and 3D Systems.
In closing we would like to reiterate our investment strategy—we employ fundamental research in a classic approach in order to identify and to invest in leading companies and companies which we expect to be market leaders. We focus upon those companies which are positioned to continually and successfully innovate, to gain market share, to expand in new markets and geographies, and most importantly to sustain competitive advantage and high returns on capital. Brand and patent and first to market advantages are naturally unique advantages which we search to identify—differentiation and barriers to entry are critical attributes. While we recognize that dividend yield and stock repurchases are attractive return opportunities, we prefer to be an owner in a business in which capital can be reinvested at very high and sustainable returns. Companies with pricing power are uniquely interesting, and we favor companies which are “category killers” and true “game changers”. Examples of such winning companies include numerous names which have been held in the Fund on a long term basis.
We appreciate your ongoing confidence in our efforts on behalf of the Opportunity Fund.
Sincerely,

Thomas R. Vandeventer
Portfolio Manager
The Tocqueville Opportunity Fund
(Unaudited)
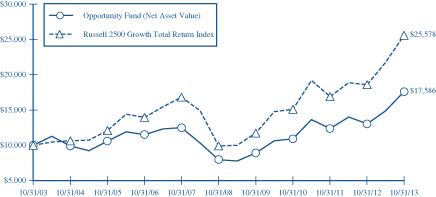
This chart assumes an initial gross investment of $10,000 made on 10/31/03. Returns shown do not reflect the deduction of taxes that a shareholder would pay on fund distributions or the redemption of fund shares. Performance reflects fee waivers in effect. In the absence of fee waivers, total return would be reduced. Returns shown include the reinvestment of all dividends and other distributions. Past performance is not predictive of future performance. Investment return and principal value will fluctuate so that your shares, when redeemed, may be worth more or less than their original cost. The Fund imposes a 2% redemption fee on shares held for 90 days or less.
The chart and table primarily reflect The Opportunity Fund’s performance achieved prior to the changed effected in 2010 to its investment strategy.
The Russell 2500 Growth Total Return Index is an unmanaged index that measures the performance of the small to mid-cap growth segment of the U.S. equity universe. It includes those Russell 2500 companies with higher price-to-book ratios and higher forcasted growth values. Returns assume the reinvestment of all dividends.
AVERAGE ANNUAL RATE OF RETURN (%)
FOR PERIODS ENDED OCTOBER 31, 2013
| | | | | | | | | | | | | | | | |
| | | 1 Year | | | 3 Year | | | 5 Year | | | 10 Year | |
The Tocqueville Opportunity Fund | | | 35.09% | | | | 17.27% | | | | 17.16% | | | | 5.81% | |
Russell 2500 Growth Total Return Index | | | 37.60% | | | | 19.24% | | | | 20.87% | | | | 9.85% | |
The Tocqueville International Value Fund
Dear Fellow Shareholder,
For the fiscal year ended October 31, 2013, the Tocqueville International Value Fund’s total U.S. dollar return was 27.75%. In the same period, the Morgan Stanley EAFE Index, the index against which we are most often compared, had a net total U.S. dollar gain of 27.40%. For the 10 year period ended October 31, 2013, the Tocqueville International Value Fund’s total U.S. dollar return was 133.58%. In the same period, the Morgan Stanley EAFE Index had a net total U.S. dollar return of 119.88%.
During the fiscal year, global equity markets advanced, driven by expansionary monetary policy and low interest rates, an improving global growth picture and a further improvement in investor perception regarding systemic risk. At the outset of the year, China’s once in a decade political transition passed without major disruption and Japan’s new government implemented policies designed to promote growth and weaken the Yen, a positive for corporate profits. By midyear, European policy makers began to move away from their insistence on fiscal austerity and toward a more growth oriented approach. Meanwhile, the U.S. Fed maintained its accommodative stance. Toward the end of the period, investors began to believe in the possibility of a synchronized global expansion. Among equity sectors, gains were led by financials, real estate, transportation, industrial products, media, paper, and auto related shares, while mining and oil & gas shares performed poorly.
The Fund had substantial gains in Italian auto parts maker Sogefi, French logistics-focused holding company Bollore, Japanese industrial automation and test equipment concern Omron, German truck parts producer SAF-Holland, French construction materials producer and distributor Saint-Gobain, Japanese tire maker Bridgestone, French broadcast television concern M6-Metropole, Japanese industrial conglomerate Hitachi, and Swiss drug maker Novartis. The Fund also had significant profits in Hong Kong financial and real estate conglomerate Guoco Group, subject of a going private offer by its controlling shareholder. The Fund had losses in the shares of mining companies IAMGold and Newmont Mining in connection with the decline in the price of gold. Relative to the EAFE Index, the Fund’s results were enhanced by the strong performance of our industrial and information technology shares, as well as our large exposure in those areas. This positive effect was partially offset by the low exposure to financials, a sector that performed very well again this year, the mining shares discussed above, and our cash reserve, which we maintain in order to capitalize on opportunities created by any unforeseen negative macro events.
From a portfolio standpoint, the major change that occurred during the year was a shift in exposure away from Japan and towards developed Europe, as we harvested positions in Japan and added to our European holdings when sentiment toward the region was negative around midyear.
During the period, the Fund exited its positions in Japanese companies Bridgestone, power tool maker Makita, office equipment and camera maker Canon, and chemical maker Asahi Kasei, as they approached our estimates of intrinsic value. The Fund also exited UK auto parts retailer Halfords, UK based telecom services provider Vodafone, French media conglomerate Vivendi Universal, and Swiss food company Nestle, for reasons of valuation.
During the year, the Fund took new positions in UK retailer Tesco, which is cash generative, rich in real estate, and where a new returns-oriented management team is in the process of divesting underperforming assets; in Japanese household products company Kao, a market leader with a substantial business in growth markets in Asia, that trades a single digit multiple of cash flow and a deep discount to its global peers; in UK emergency home repair insurer Homeserve, a cash generative business with operational challenges which we deem temporary; in Telecom Italia, which is depressed due to investor concerns about growth in its home market and generates a high teens percentage free cash flow yield and has the potential for a corporate event that would be value enhancing; in Dutch mail and logistics company TNT Express, when the price collapsed after a proposed acquisition by UPS was scuttled by anti-trust authorities, enabling us to pick up shares at a substantial discount to intrinsic value; in Norwegian chemical logistics company Stolt-Nielsen, where we believe we purchased the shares for less than the value of the liquids storage terminal and tank containers businesses, giving us a free option on a recovery in the tanker business; in global oil services concern Schlumberger, which was trading at a multi-year low multiple of cash flow due to misplaced investor concerns about demand for its
services; and in Dutch specialty textile and functional materials maker Ten Cate, which was out of favor due to its exposure to government spending on military defense and was trading a substantial discount to intrinsic value based on normalized cash flow margins. The Fund also added to positions in Infineon, Hitachi, Hoya, Akzo Nobel, Nexans, Freeport McMoran, Orkla, and Groupe Bruxelles Lambert.
With interest rates at multi-year lows, and aggressive monetary policy being pursued throughout the developed world, investors are taking on more risk. As the market becomes more complacent, we become more concerned about potential risks, including continued risk of volatility in the Middle East, growing tensions between China and Japan, the sustainability of historically high corporate profit margins, and the unknowable consequences of unprecedented expansionary monetary policy, to name a few. As evidenced above in the discussion of new positions, in Europe, we continue to find the most attractive opportunities in economically sensitive companies, and in “special situations”, where managements are creating shareholder value via restructuring and other means of self-improvement. In Japan, we continue to seek and find opportunities in companies that have good assets and management teams focused on improving corporate profitability and capital allocation from a relatively weak starting point. As we have noted, the poor performance of emerging markets during the last several quarters has brought them back into our research focus, and we expect the U.S. move toward tapering will create interesting opportunities for the Fund.
To protect and grow your capital, we continue to seek out companies that have defensible business franchises, pricing power, limited financial leverage and the ability to return cash to shareholders, and which trade at a discount to intrinsic value based on future cash flows in a conservative economic growth scenario.
Respectfully,
James Hunt
Portfolio Manager
The Tocqueville International Value Fund
(Unaudited)
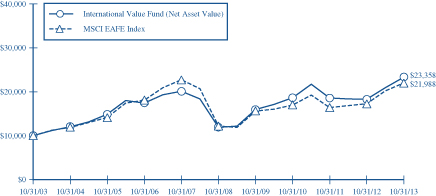
This chart assumes an initial gross investment of $10,000 made on 10/31/03. Returns shown do not reflect the deduction of taxes that a shareholder would pay on fund distributions or the redemption of fund shares. Performance reflects fee waivers in effect. In the absence of fee waivers, total return would be reduced. Returns shown include the reinvestment of all dividends and other distributions. Past performance is not predictive of future performance. Investment return and principal value will fluctuate so that your shares, when redeemed, may be worth more or less than their original cost. The Fund imposes a 2% redemption fee on shares held 90 days or less.
The MSCI EAFE Index is an unmanaged market-capitalization-weighted index composed of companies representative of the market structure of 21 Developed Market Countries in Europe, Australia, Asia and the Far East.
AVERAGE ANNUAL RATE OF RETURN (%)
FOR PERIODS ENDED OCTOBER 31, 2013
| | | | | | | | | | | | | | | | |
| | | 1 Year | | | 3 Year | | | 5 Year | | | 10 Year | |
The Tocqueville International Value Fund | | | 27.75% | | | | 7.75% | | | | 14.42% | | | | 8.85% | |
MSCI EAFE Index | | | 27.40% | | | | 8.88% | | | | 12.52% | | | | 8.20% | |
The Tocqueville Gold Fund
Dear Fellow Shareholder,
During the past fiscal year, the Tocqueville Gold Fund declined 46.44% compared to a decline of 23% for gold bullion and 48.34% for the Philadelphia Stock Exchange Gold/Silver Index (“XAU”), our benchmark index. The top three listed contributors to the Fund’s performance over this period included Tahoe Resources Inc., Alamos Gold Inc. and Franco-Nevada Corporation which depreciated by 5.8%, 17.8% and 20.7%, respectively. The bottom three performers were Banro Corporation, Sunward Resources Ltd. and International Tower Hill Mines Ltd. which declined by 82.2%, 80.1% and 78.6%, respectively.
The disappointing performance of gold and gold shares at a time when the macroeconomic fundamentals for gold, as we understand them, continued to strengthen is incongruous. The correction from the price peak of $1,921/oz in 2011 is now into its second year. Sentiment gauges and valuation benchmarks that we rely on continue to suggest that initiating or adding to a gold investment strategy both makes sense, and that the current entry point is low risk.
We do not think the Fed will be able to exit its policy of extreme monetary ease without causing considerable collateral damage in the equity and bond markets. Our view is obviously not shared by the investment consensus. It seems to us that in order to avoid adverse financial market consequences, the policy of quantitative easing will continue indefinitely and risk serious inflation. We have discussed this view in several of our quarterly commentaries over the past year. The decline in the price of gold does not, in our opinion, invalidate the investment premise for gold, which is that it will be difficult if not impossible for policy makers to avoid monetary debasement, whether inflation or some other form.
We believe that the incongruity between gold’s price behavior and compelling fundamentals is explained by physical flows of bullion. It has become apparent over the past year that there has been a significant drain of physical gold from depositories in the Western World to China, India, and other Asian destinations. Imports of gold into China over the past two years by themselves account for nearly all of the global mine production. The story is similar for India, where despite government attempts to discourage gold imports through higher import duties, flows remain strong.
The business of mining gold is either attractive or unattractive based on one’s expectation and eventual outcome for the gold price. Since we continue to expect higher gold prices in the future, we believe that investing in gold mining companies with quality assets, in attractive political jurisdictions, and with competent management teams offers the optimal exposure to that expectation. Since mining companies are leveraged to the gold price, their shares tend to rise or fall to a greater extent than the price of the metal itself. Since the launching of the Tocqueville Gold Fund in 1998, this strategy has served us well and we expect it to continue to do so.
There has been wholesale turnover in the executive ranks of the gold mining industry over the past year, in large part due to investor disenchantment. The result, we believe, will be greater attention by new management groups to cost containment, restrictions on capital expenditures, and greater inclination to increase dividend payouts. Over the intermediate term, it seems likely that the pipeline of new gold mining projects will dwindle and that future gold supply will be constrained and quite possibly decline.
Our research team continues to stay on top of specific company developments. We believe that our current holdings position the Fund quite favorably to upside movements in the gold price while protecting downside based on strong financials, quality assets, and good management. We appreciate your support over the past year and look forward to responding to any questions or comments that you may have.
Sincerely,
| | |
 | |  |
| John C. Hathaway | | Douglas B. Groh |
| Portfolio Manager | | Portfolio Manager |
The Tocqueville Gold Fund
(Unaudited)
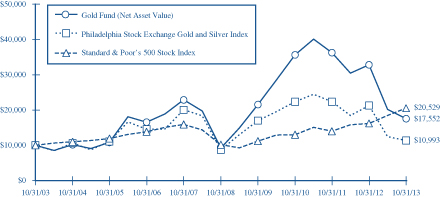
This chart assumes an initial gross investment of $10,000 made on 10/31/03. Returns shown do not reflect the deduction of taxes that a shareholder would pay on fund distributions or the redemption of fund shares. Performance reflects fee waivers in effect. In the absence of fee waivers, total return would be reduced. Returns shown include the reinvestment of all dividends and other distributions. Past performance is not predictive of future performance. Investment return and principal value will fluctuate so that your shares, when redeemed, may be worth more or less than their original cost. The Fund imposes a 2% redemption fee on shares held 90 days or less.
In 2006, 2009, and 2010 the performance of The Tocqueville Gold Fund was achieved during a period of unusually favorable market conditions. Such performance may not be sustainable.
The Philadelphia Stock Exchange Gold and Silver Index is an unmanaged capitalization-weighted index which includes the leading companies involved in the mining of gold and silver. Returns include the reinvestment of all dividends.
The Standard & Poor’s 500 Stock Index (S&P 500) is a capital-weighted index, representing the aggregate market value of the common equity of 500 stocks primarily traded on the New York Stock Exchange. Returns include the reinvestment of all dividends.
AVERAGE ANNUAL RATE OF RETURN (%)
FOR PERIODS ENDED OCTOBER 31, 2013
| | | | | | | | | | | | | | | | |
| | | 1 Year | | | 3 Year | | | 5 Year | | | 10 Year | |
The Tocqueville Gold Fund | | | -46.44% | | | | -20.98% | | | | 13.91% | | | | 5.79% | |
Philadelphia Stock Exchange Gold and Silver Index | | | -48.34% | | | | -21.03% | | | | 4.68% | | | | 0.95% | |
Standard & Poor’s 500 Stock Index | | | 27.18% | | | | 16.56% | | | | 15.17% | | | | 7.46% | |
The Delafield Fund
Dear Fellow Shareholder,
With the re-election of President Obama in early November 2012, the fiscal year began with at least the certainty of who would lead the U.S. for the next four years as well as the prospect that our partisan government could amicably resolve the various issues which we were facing. Unfortunately, we were quickly brought back to reality with the fiscal cliff debacle, which was not resolved until the very last moment (and even then only partially), with neither party able to claim an advantage and the reputation of both further tarnished by dysfunction. Political stalemate remained a theme through the balance of the fiscal year, with disagreements on managing our deficit, the fiscal budget, inflation and the debt ceiling dominating headlines and causing a two week government shutdown late in the fiscal year. Despite these conditions, which no doubt have stunted corporate hiring and spending, our economy continued to show modest improvement through the fiscal year. The U.S. housing market and consumer net worth exhibited substantial progress, and more recently, American manufacturing has experienced the start of a renaissance, aided in large part by historically low domestic natural gas prices. The international picture remained similarly mixed for much of the year. Growth in China slowed considerably earlier in the year, but continues to be robust in comparison to the rest of the world, while Europe experienced another banking crisis this past spring, this time in Cyprus, but generally appears stable now.
While we would have expected this backdrop to make for an unsettled outlook and cautious investment environment, domestic equity markets were blissfully unaware and rallied for virtually the entire fiscal year. For the twelve months ended October 31, 2013, the Standard & Poor’s 500 Index (“S&P 500”) increased 27.18%, while the Russell 2000 Index (“Russell 2000”) posted a 36.28% increase, both on a total return basis. During the same twelve months, the Delafield Fund’s (the “Fund”) net asset value increased 32.07% to $37.13 per share with dividends reinvested. The net asset value amounted to $1,759,341,275, of which 84.2% was invested in equities, and the balance held in cash and equivalents and fixed income securities. Overall, we were satisfied with the Fund’s progress during the fiscal year, though our performance was tempered by the size of our reserves. That said, we were and still are content to use the cash as a hedge against volatility in the near term and ultimately, we will employ these cash reserves to seize upon attractive and appropriately priced investment opportunities as we uncover them.
The Fund was heavily weighted towards the industrials and materials sectors during the year, as the inherent cyclicality of the companies in these areas presented a number of investment opportunities for us. On an absolute basis, holdings in these sectors contributed favorably to the Fund’s performance for the fiscal year. Relative to the more comparable Russell 2000, the Fund’s materials stocks were particularly strong, contributing about 300 basis points of relative outperformance, while in contrast, the Fund’s industrials names modestly underperformed. The Fund’s investments in the information technology sector also generated strong returns.
Dover Corporation was the largest contributor to the Fund’s performance during the year, with the shares showing steady gains on strong earnings and the announced spin-off of its mobile consumer electronics and specialty components businesses. Sealed Air Corporation was the next largest contributor during the fiscal year, benefiting from favorable senior management appointments and stabilized earnings trends. In contrast, Acco Brands Corp. and Molycorp, Inc. were the largest detractors, with the former continuing to experience earnings pressure, while the latter experienced startup delays at its Mountain Pass mine and was forced to raise capital to cover cost overruns.
In closing, we remain steadfast in our bottom-up investment philosophy and continue to believe that the portfolio is composed of companies where managements are taking actions to position their businesses for the long term. Over time, we expect that the market will accurately reflect the true value of these businesses and our focus remains on employing our long-standing strategy to protect your capital and to enhance its growth.
Sincerely,
| | |
 | |  |
| |
| J. Dennis Delafield | | Vincent Sellecchia |
| Portfolio Manager | | Portfolio Manager |
The Delafield Fund
(Unaudited)
This chart assumes an initial gross investment of $10,000 made on 10/31/03. Since the Delafield Fund did not commence operations until 9/28/09, returns prior to that date are those of the Predecessor Fund. The Delafield Fund assumed the net asset value and performance history of the Predecessor Fund (See Footnote 1 to the Financial Statements). Returns shown do not reflect the deduction of taxes that a shareholder would pay on fund distributions or the redemption of fund shares. Performance reflects fee waivers in effect. In the absence of fee waivers, total return would be reduced. Returns shown include the reinvestment of all dividends and other distributions. Past performance is not predictive of future performance. Investment return and principal value will fluctuate so that your shares, when redeemed, may be worth more or less than their original cost. The Fund imposes a 2% redemption fee on shares held 90 days or less.
The Standard & Poor’s 500 Stock Index (S&P 500) is a capital-weighted index, representing the aggregate market value of the common equity of 500 stocks primarily traded on the New York Stock Exchange. Returns include the reinvestment of all dividends.
The Russell 2000 Total Return Index is an unmanaged index that measures the performance of the 2,000 smallest companies in the Russell 3000 Index, which represent approximately 10% of the total market capitalization of the Russell 3000 Index. Returns include the reinvestment of all dividends.
AVERAGE ANNUAL RATE OF RETURN (%)
FOR PERIODS ENDED OCTOBER 31, 2013
| | | | | | | | | | | | | | | | |
| | | 1 Year | | | 3 Year | | | 5 Year | | | 10 Year | |
The Delafield Fund | | | 32.07% | | | | 14.38% | | | | 19.39% | | | | 11.17% | |
Standard & Poor’s 500 Stock Index | | | 27.18% | | | | 16.56% | | | | 15.17% | | | | 7.46% | |
Russell 2000 Total Return Index | | | 36.28% | | | | 17.69% | | | | 17.04% | | | | 9.03% | |
The Tocqueville Select Fund
Dear Fellow Shareholder,
With the re-election of President Obama in early November 2012, the fiscal year began with at least the certainty of who would lead the U.S. for the next four years as well as the prospect that our partisan government could amicably resolve the various issues which we were facing. Unfortunately, we were quickly brought back to reality with the fiscal cliff debacle, which was not resolved until the very last moment (and even then only partially), with neither party able to claim an advantage and the reputation of both further tarnished by dysfunction. Political stalemate remained a theme through the balance of the fiscal year, with disagreements on managing our deficit, the fiscal budget, inflation and the debt ceiling dominating headlines and causing a two week government shutdown late in the fiscal year. Despite these conditions, which no doubt have stunted corporate hiring and spending, our economy continued to show modest improvement through the fiscal year. The U.S. housing market and consumer net worth exhibited substantial progress, and more recently, American manufacturing has experienced the start of a renaissance, aided in large part by historically low domestic natural gas prices. The international picture remained similarly mixed for much of the year. Growth in China slowed considerably earlier in the year, but continues to be robust in comparison to the rest of the world, while Europe experienced another banking crisis this past spring, this time in Cyprus, but generally appears stable now.
While we would have expected this backdrop to make for an unsettled outlook and cautious investment environment, domestic equity markets were blissfully unaware and rallied for virtually the entire fiscal year. For the twelve months ended October 31, 2013, the Russell 2500 Index (“Russell 2500”) increased 35.41%, while the Russell 2000 Index (“Russell 2000”) posted a 36.28% increase, both on a total return basis. During the same twelve months, the Tocqueville Select Fund’s (the “Fund”) net asset value increased 43.15% to $15.57 per share with dividends reinvested. The net asset value amounted to $99,887,608, of which 84.3% was invested in equities and the balance held in cash reserves.
Stock selection was favorable to the Fund’s performance this year. Among the four sectors that comprised most of our equities exposure, our holdings in the information technology, consumer discretionary and materials areas all contributed strongly to both the Fund’s absolute and relative performance while the Fund’s positions in the industrials names generated a solid return, but underperformed the comparable Russell 2500 sector performance. While sector allocation is a by-product of our bottom-up investment style, we should also note that we had no exposure to either the financials or health care sectors during the year, which together represented about 34% of the Russell 2500. In the case of financials, this was beneficial to the Fund’s relative performance, while it was a negative with respect to the health care space, which was among the strongest performing sectors during the year. While we were satisfied with the Fund’s progress during the year, our sizeable cash position did temper our performance somewhat, though we were and still are content to use the cash as a hedge against volatility in the near term and ultimately, as dry powder for attractive investment opportunities as we uncover them. With respect to individual stocks, Universal Electronics, Stantec Inc. and Monotype Imaging Holdings were the largest positive contributor to the portfolio’s performance. In contrast, Acco Brands Corp. and Xerium Technologies Inc. were the largest detractors to our performance during period.
| | | | |
Sincerely, | | | | |
| | | |  |
| J. Dennis Delafield | | Vincent Sellecchia | | Donald Wang |
| Portfolio Manager | | Portfolio Manager | | Portfolio Manager |
The Tocqueville Select Fund
(Unaudited)
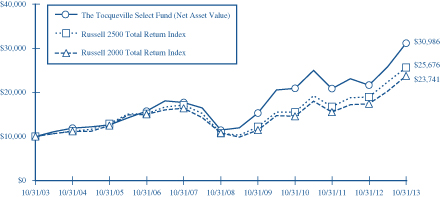
This chart assumes an initial gross investment of $10,000 made on 10/31/03. Since The Tocqueville Select Fund did not commence operations until 9/28/09, returns from the period from September 29, 2008 to September 27, 2009 are those of the Class Y Shares of the Predecessor Fund (See Footnote 1 to the Financial Statements). Prior to that period, returns shown are those of a limited partnership managed by the adviser. Returns shown do not reflect the deduction of taxes that a shareholder would pay on fund distributions or the redemption of fund shares. Performance reflects fee waivers in effect. In the absence of fee waivers, total return would be reduced. Returns shown include the reinvestment of all dividends and other distributions. Past performance is not predictive of future performance. Investment return and principal value will fluctuate so that your shares, when redeemed, may be worth more or less than their original cost. The Fund imposes a 2% redemption fee on shares held 90 days or less.
In 2013 the performance of The Tocqueville Select Fund was achieved during a period of unusually favorable market conditions. Such performance may not be sustainable.
The Russel 2500 Total Return Index is an unmanaged index that measures the performance of the 2,500 smallest companies in the Russell 3000 Index. Returns include the reinvestment of all dividends.
The Russell 2000 Total Return Index is an unmanaged index that measures the performance of the 2,000 smallest companies in the Russell 3000 Index, which represents approximately 8% of the total market capitalization of the Russell 3000 Index. Returns include the reinvestment of all dividends.
AVERAGE ANNUAL RATE OF RETURN (%)
FOR PERIODS ENDED OCTOBER 31, 2013
| | | | | | | | | | | | | | | | |
| | | 1 Year | | | 3 Year | | | 5 Year | | | 10 Year | |
The Tocqueville Select Fund | | | 43.15% | | | | 14.02% | | | | 21.93% | | | | 11.97% | |
Russell 2500 Total Return Index | | | 35.41% | | | | 18.21% | | | | 19.04% | | | | 9.89% | |
Russell 2000 Total Return Index | | | 36.28% | | | | 17.69% | | | | 17.04% | | | | 9.03% | |
Expense Example—October 31, 2013 (Unaudited)
As a shareholder of The Tocqueville Trust (the “Funds”), you incur ongoing costs, including management fees; distribution fees; and other Fund expenses. This example is intended to help you understand your ongoing costs (in dollars) of investing in the Funds and to compare costs with the ongoing costs of investing in other mutual funds.
The Example is based on an investment of $1,000 invested at the beginning of the period and held the entire period (May 1, 2013-October 31, 2013).
Actual Expenses
The first line of the table below provides information about actual account values and actual expenses. You may use the information in this line, together with the amount you invested, to estimate the expenses that you paid over the period. Simply divide your account value by $1,000 (for example, an $8,600 account value divided by $1,000 = 8.6), then multiply the result by the number in the first line under the heading entitled “Expenses Paid During Period” to estimate the expenses you paid on your account during this period.
Hypothetical Example for Comparison Purposes
The second line of the table below provides information about hypothetical account values and hypothetical expenses based on the Funds’ actual expense ratios and an assumed rate of return of 5% per year before expenses, which is not the Funds’ actual return. The hypothetical account values and expenses may not be used to estimate the actual ending account balance or expenses you paid for the period. You may use this information to compare the ongoing costs of investing in the Funds and other funds. To do so, compare this 5% hypothetical example with the 5% hypothetical examples that appear in the shareholder reports of the other funds.
Please note that the expenses shown in the table are meant to highlight your ongoing costs only and do not reflect any transactional costs, such as sales charges (loads), redemption fees, or exchange fees. Therefore, the second line of the table is useful in comparing ongoing costs only, and will not help you determine the relative costs of owning different funds. In addition, if these transactional costs were included, your costs would have been higher.
Expense Example Tables (Unaudited)
| | | | | | | | | | | | |
| The Tocqueville Fund | | Beginning
Account Value
May 1, 2013 | | | Ending
Account Value
October 31, 2013 | | | Expenses Paid
During Period*
May 1, 2013 -
October 31, 2013 | |
Actual | | $ | 1,000.00 | | | $ | 1,138.00 | | | $ | 6.74 | |
Hypothetical (5% return before expenses) | | | 1,000.00 | | | | 1,018.90 | | | | 6.36 | |
| | | |
| The Tocqueville Opportunity Fund | | | | | | | | | | | | |
Actual | | $ | 1,000.00 | | | $ | 1,185.40 | | | $ | 7.16 | |
Hypothetical (5% return before expenses) | | | 1,000.00 | | | | 1,018.65 | | | | 6.61 | |
| | | |
| The Tocqueville International Value Fund | | | | | | | | | | | | |
Actual | | $ | 1,000.00 | | �� | $ | 1,114.40 | | | $ | 6.66 | |
Hypothetical (5% return before expenses) | | | 1,000.00 | | | | 1,018.90 | | | | 6.36 | |
| | | |
| The Tocqueville Gold Fund | | | | | | | | | | | | |
Actual | | $ | 1,000.00 | | | $ | 869.60 | | | $ | 6.55 | |
Hypothetical (5% return before expenses) | | | 1,000.00 | | | | 1,018.20 | | | | 7.07 | |
| | | |
| The Delafield Fund | | | | | | | | | | | | |
Actual | | $ | 1,000.00 | | | $ | 1,146.00 | | | $ | 6.55 | |
Hypothetical (5% return before expenses) | | | 1,000.00 | | | | 1,019.11 | | | | 6.16 | |
| | | |
| The Tocqueville Select Fund | | | | | | | | | | | | |
Actual | | $ | 1,000.00 | | | $ | 1,199.50 | | | $ | 7.32 | |
Hypothetical (5% return before expenses) | | | 1,000.00 | | | | 1,018.55 | | | | 6.72 | |
| * | Expenses are equal to the Fund’s annualized six-month expense ratio (including extraordinary expenses) of 1.25%, 1.30%, 1.25%, 1.39%, 1.21% and 1.32% for The Tocqueville Fund, Opportunity Fund, International Value Fund, Gold Fund, Delafield Fund, and Select Fund, respectively, multiplied by the average account value over the period, multiplied by 184/365 to reflect the one-half year period. |
The Tocqueville Fund
Financial Highlights
| | | | | | | | | | | | | | | | | | | | |
Per share operating performance
(For a share outstanding throughout the year) | | Years Ended October 31, | |
| | 2013 | | | 2012 | | | 2011 | | | 2010 | | | 2009 | |
Net asset value, beginning of year | | $ | 24.11 | | | $ | 22.23 | | | $ | 21.53 | | | $ | 18.47 | | | $ | 16.39 | |
| | | | | | | | | | | | | | | | | | | | |
Operations: | | | | | | | | | | | | | | | | | | | | |
Net investment income (1) | | | 0.40 | | | | 0.40 | | | | 0.23 | | | | 0.32 | | | | 0.28 | |
Net realized and unrealized gain | | | 6.51 | | | | 1.81 | | | | 0.80 | | | | 2.97 | | | | 2.09 | |
| | | | | | | | | | | | | | | | | | | | |
Total from investment operations * | | | 6.91 | | | | 2.21 | | | | 1.03 | | | | 3.29 | | | | 2.37 | |
| | | | | | | | | | | | | | | | | | | | |
Distributions to shareholders: | | | | | | | | | | | | | | | | | | | | |
Dividends from net investment income | | | (0.35 | ) | | | (0.33 | ) | | | (0.33 | ) | | | (0.23 | ) | | | (0.29 | ) |
Distributions from net realized gains | | | — | | | | — | | | | — | | | | — | | | | — | |
| | | | | | | | | | | | | | | | | | | | |
Total distributions | | | (0.35 | ) | | | (0.33 | ) | | | (0.33 | ) | | | (0.23 | ) | | | (0.29 | ) |
| | | | | | | | | | | | | | | | | | | | |
Change in net asset value for the year | | | 6.56 | | | | 1.88 | | | | 0.70 | | | | 3.06 | | | | 2.08 | |
| | | | | | | | | | | | | | | | | | | | |
Net asset value, end of year | | $ | 30.67 | | | $ | 24.11 | | | $ | 22.23 | | | $ | 21.53 | | | $ | 18.47 | |
| | | | | | | | | | | | | | | | | | | | |
* Includes redemption fees per share of | | $ | 0.00 | (2) | | $ | 0.00 | (2) | | $ | 0.00 | (2) | | $ | 0.00 | (2) | | $ | 0.01 | |
Total Return | | | 29.0 | % | | | 10.1 | % | | | 4.8 | % | | | 18.0 | % | | | 14.8 | % |
Ratios/supplemental data | | | | | | | | | | | | | | | | | | | | |
Net assets, end of year (000) | | $ | 348,269 | | | $ | 366,025 | | | $ | 491,541 | | | $ | 489,670 | | | $ | 383,470 | |
Ratio to average net assets: | | | | | | | | | | | | | | | | | | | | |
Expenses before waiver/reimbursement | | | 1.28 | % | | | 1.29 | % | | | 1.26 | % | | | 1.26 | % | | | 1.33 | % |
Expenses after waiver/reimbursement | | | 1.26 | %(3) | | | 1.26 | %(3) | | | 1.25 | % | | | 1.25 | % | | | 1.25 | % |
Net investment income before waiver/reimbursement | | | 1.33 | % | | | 1.30 | % | | | 0.97 | % | | | 1.65 | % | | | 1.60 | % |
Net investment income after waiver/reimbursement | | | 1.35 | % | | | 1.33 | % | | | 0.98 | % | | | 1.66 | % | | | 1.68 | % |
Portfolio turnover rate | | | 16 | % | | | 17 | % | | | 28 | % | | | 23 | % | | | 32 | % |
| (1) | Net investment income per share is calculated using the ending balance prior to consideration or adjustment for permanent book-to-tax differences. |
| (2) | Represents less than $0.01. |
| (3) | Includes 0.01% of interest expense which is not included in the Fund’s operating expense cap. |
The Accompanying Notes are an Integral Part of these Financial Statements.
The Tocqueville Opportunity Fund
Financial Highlights
| | | | | | | | | | | | | | | | | | | | |
Per share operating performance
(For a share outstanding throughout the year) | | Years Ended October 31, | |
| | 2013 | | | 2012 | | | 2011 | | | 2010 | | | 2009 | |
Net asset value, beginning of year | | $ | 15.76 | | | $ | 14.96 | | | $ | 13.20 | | | $ | 10.78 | | | $ | 9.77 | |
| | | | | | | | | | | | | | | | | | | | |
Operations: | | | | | | | | | | | | | | | | | | | | |
Net investment loss (1) | | | (0.13 | ) | | | (0.11 | ) | | | (0.13 | ) | | | (0.12 | ) | | | (0.11 | ) |
Net realized and unrealized gain | | | 5.66 | | | | 0.91 | | | | 1.89 | | | | 2.54 | | | | 1.23 | |
| | | | | | | | | | | | | | | | | | | | |
Total from investment operations * | | | 5.53 | | | | 0.80 | | | | 1.76 | | | | 2.42 | | | | 1.12 | |
| | | | | | | | | | | | | | | | | | | | |
Distributions to shareholders: | | | | | | | | | | | | | | | | | | | | |
Dividends from net investment income | | | — | | | | — | | | | — | | | | — | | | | (0.01 | ) |
Distributions from net realized gains | | | — | | | | — | | | | — | | | | — | | | | (0.10 | ) |
| | | | | | | | | | | | | | | | | | | | |
Total distributions | | | — | | | | — | | | | — | | | | — | | | | (0.11 | ) |
| | | | | | | | | | | | | | | | | | | | |
Change in net asset value for the year | | | 5.53 | | | | 0.80 | | | | 1.76 | | | | 2.42 | | | | 1.01 | |
| | | | | | | | | | | | | | | | | | | | |
Net asset value, end of year | | $ | 21.29 | | | $ | 15.76 | | | $ | 14.96 | | | $ | 13.20 | | | $ | 10.78 | |
| | | | | | | | | | | | | | | | | | | | |
* Includes redemption fees per share of | | $ | 0.00 | (2) | | $ | 0.00 | (2) | | $ | 0.00 | (2) | | $ | 0.00 | (2) | | $ | 0.00 | (2) |
Total Return | | | 35.1 | % | | | 5.4 | % | | | 13.3 | % | | | 22.6 | % | | | 11.7 | % |
Ratios/supplemental data | | | | | | | | | | | | | | | | | | | | |
Net assets, end of year (000) | | $ | 80,609 | | | $ | 65,455 | | | $ | 46,963 | | | $ | 32,863 | | | $ | 30,498 | |
Ratio to average net assets: | | | | | | | | | | | | | | | | | | | | |
Expense | | | 1.30 | % | | | 1.32 | % | | | 1.36 | % | | | 1.41 | % | | | 1.41 | % |
Net investment loss | | | (0.64 | )% | | | (0.76 | )% | | | (1.04 | )% | | | (1.08 | )% | | | (0.97 | )% |
Portfolio turnover rate | | | 100 | % | | | 77 | % | | | 110 | % | | | 104 | % | | | 62 | % |
| (1) | Net investment loss per share is calculated using the ending balance prior to consideration or adjustment for permanent book-to-tax differences. |
| (2) | Represents less than $0.01. |
The Accompanying Notes are an Integral Part of these Financial Statements.
The Tocqueville International Value Fund
Financial Highlights
| | | | | | | | | | | | | | | | | | | | |
Per share operating performance
(For a share outstanding throughout the year) | | Years Ended October 31, | |
| | 2013 | | | 2012 | | | 2011 | | | 2010 | | | 2009 | |
Net asset value, beginning of year | | $ | 11.68 | | | $ | 12.00 | | | $ | 12.12 | | | $ | 10.48 | | | $ | 8.49 | |
| | | | | | | | | | | | | | | | | | | | |
Operations: | | | | | | | | | | | | | | | | | | | | |
Net investment income (1) | | | 0.24 | | | | 0.17 | | | | 0.11 | | | | 0.11 | | | | 0.10 | |
Net realized and unrealized gain (loss) | | | 2.97 | | | | (0.37 | ) | | | (0.16 | ) | | | 1.65 | | | | 2.59 | |
| | | | | | | | | | | | | | | | | | | | |
Total from investment operations * | | | 3.21 | | | | (0.20 | ) | | | (0.05 | ) | | | 1.76 | | | | 2.69 | |
| | | | | | | | | | | | | | | | | | | | |
Distributions to shareholders: | | | | | | | | | | | | | | | | | | | | |
Dividends from net investment income | | | (0.18 | ) | | | (0.12 | ) | | | (0.07 | ) | | | (0.12 | ) | | | (0.20 | ) |
Distributions from net realized gains | | | — | | | | — | | | | — | | | | — | | | | (0.50 | ) |
| | | | | | | | | | | | | | | | | | | | |
Total distributions | | | (0.18 | ) | | | (0.12 | ) | | | (0.07 | ) | | | (0.12 | ) | | | (0.70 | ) |
| | | | | | | | | | | | | | | | | | | | |
Change in net asset value for the year | | | 3.03 | | | | (0.32 | ) | | | (0.12 | ) | | | 1.64 | | | | 1.99 | |
| | | | | | | | | | | | | | | | | | | | |
Net asset value, end of year | | $ | 14.71 | | | $ | 11.68 | | | $ | 12.00 | | | $ | 12.12 | | | $ | 10.48 | |
| | | | | | | | | | | | | | | | | | | | |
* Includes redemption fees per share of | | $ | 0.00 | (2) | | $ | 0.00 | (2) | | $ | 0.01 | | | $ | 0.00 | (2) | | $ | 0.00 | (2) |
Total Return | | | 27.8 | % | | | (1.6 | )% | | | (0.5 | )% | | | 17.0 | % | | | 34.0 | % |
Ratios/supplemental data | | | | | | | | | | | | | | | | | | | | |
Net assets, end of year (000) | | $ | 262,981 | | | $ | 218,793 | | | $ | 199,848 | | | $ | 150,103 | | | $ | 131,613 | |
Ratio to average net assets: | | | | | | | | | | | | | | | | | | | | |
Expenses before waiver/reimbursement | | | 1.55 | % | | | 1.56 | % | | | 1.56 | % | | | 1.56 | % | | | 1.62 | % |
Expenses after waiver/reimbursement | | | 1.30 | %(3) | | | 1.56 | % | | | 1.56 | % | | | 1.56 | % | | | 1.62 | % |
Net investment income before waiver/reimbursement | | | 1.55 | % | | | 1.53 | % | | | 0.99 | % | | | 1.03 | % | | | 0.96 | % |
Net investment income after waiver/reimbursement | | | 1.80 | % | | | 1.53 | % | | | 0.99 | % | | | 1.03 | % | | | 0.96 | % |
Portfolio turnover rate | | | 37 | % | | | 38 | % | | | 30 | % | | | 27 | % | | | 27 | % |
| (1) | Net investment income per share is calculated using the ending balance prior to consideration or adjustment for permanent book-to-tax differences. |
| (2) | Represents less than $0.01. |
| (3) | Expense waiver of 1.25% was implemented on January 1, 2013. |
The Accompanying Notes are an Integral Part of these Financial Statements.
The Tocqueville Gold Fund
Financial Highlights
| | | | | | | | | | | | | | | | | | | | |
Per share operating performance
(For a share outstanding throughout the year) | | Years Ended October 31, | |
| | 2013 | | | 2012 | | | 2011 | | | 2010 | | | 2009 | |
Net asset value, beginning of year | | $ | 72.82 | | | $ | 81.97 | | | $ | 82.00 | | | $ | 49.71 | | | $ | 21.77 | |
| | | | | | | | | | | | | | | | | | | | |
Operations: | | | | | | | | | | | | | | | | | | | | |
Net investment loss (1) | | | (0.26 | ) | | | (0.35 | ) | | | (0.67 | ) | | | (0.58 | ) | | | (0.45 | ) |
Net realized and unrealized gain (loss) | | | (32.93 | ) | | | (7.47 | ) | | | 2.25 | | | | 32.96 | | | | 29.28 | |
| | | | | | | | | | | | | | | | | | | | |
Total from investment operations * | | | (33.19 | ) | | | (7.82 | ) | | | 1.58 | | | | 32.38 | | | | 28.83 | |
| | | | | | | | | | | | | | | | | | | | |
Distributions to shareholders: | | | | | | | | | | | | | | | | | | | | |
Dividends from net investment income | | | — | | | | — | | | | — | | | | — | | | | — | |
Distributions from net realized gains | | | (1.62 | ) | | | (1.33 | ) | | | (1.61 | ) | | | (0.09 | ) | | | (0.89 | ) |
| | | | | | | | | | | | | | | | | | | | |
Total distributions | | | (1.62 | ) | | | (1.33 | ) | | | (1.61 | ) | | | (0.09 | ) | | | (0.89 | ) |
| | | | | | | | | | | | | | | | | | | | |
Change in net asset value for the year | | | (34.81 | ) | | | (9.15 | ) | | | (0.03 | ) | | | 32.29 | | | | 27.94 | |
| | | | | | | | | | | | | | | | | | | | |
Net asset value, end of year | | $ | 38.01 | | | $ | 72.82 | | | $ | 81.97 | | | $ | 82.00 | | | $ | 49.71 | |
| | | | | | | | | | | | | | | | | | | | |
* Includes redemption fees per share of | | $ | 0.02 | | | $ | 0.02 | | | $ | 0.10 | | | $ | 0.06 | | | $ | 0.03 | |
Total Return | | | (46.4 | )% | | | (9.5 | )% | | | 1.8 | % | | | 65.2 | % | | | 135.2 | % |
Ratios/supplemental data | | | | | | | | | | | | | | | | | | | | |
Net assets, end of year (000) | | $ | 1,215,081 | | | $ | 2,445,913 | | | $ | 2,647,078 | | | $ | 2,199,603 | | | $ | 937,492 | |
Ratio to average net assets: | | | | | | | | | | | | | | | | | | | | |
Expense | | | 1.34 | % | | | 1.28 | % | | | 1.25 | % | | | 1.34 | % | | | 1.50 | % |
Net investment loss | | | (0.41 | )% | | | (0.56 | )% | | | (0.86 | )% | | | (1.11 | )% | | | (1.25 | )% |
Portfolio turnover rate | | | 14 | % | | | 11 | % | | | 3 | % | | | 9 | % | | | 9 | % |
| (1) | Net investment loss per share is calculated using the ending balance prior to consideration or adjustment for permanent book-to-tax differences. |
The Accompanying Notes are an Integral Part of these Financial Statements.
The Delafield Fund
Financial Highlights
| | | | | | | | | | | | | | | | | | | | | | | | |
Per share operating performance
(For a share outstanding throughout
the period) | | Years Ended October 31, | | | January 1,
2009
through
October 31,
2009 | | | Year Ended
December 31,
2008 | |
| | 2013 | | | 2012 | | | 2011 | | | 2010 | | | |
Net asset value, beginning of period | | $ | 29.79 | | | $ | 27.21 | | | $ | 26.65 | | | $ | 21.35 | | | $ | 15.10 | | | $ | 24.33 | |
| | | | | | | | | | | | | | | | | | | | | | | | |
Operations: | | | | | | | | | | | | | | | | | | | | | | | | |
Net investment income (loss) (1) | | | (0.05 | ) | | | (0.04 | ) | | | (0.08 | ) | | | (0.00 | )(2) | | | 0.03 | | | | 0.07 | |
Net realized and unrealized gain | | | 9.19 | | | | 2.99 | | | | 0.64 | | | | 5.32 | | | | 6.25 | | | | (9.23 | ) |
| | | | | | | | | | | | | | | | | | | | | | | | |
Total from investment operations * | | | 9.14 | | | | 2.95 | | | | 0.56 | | | | 5.32 | | | | 6.28 | | | | (9.16 | ) |
| | | | | | | | | | | | | | | | | | | | | | | | |
Distributions to shareholders: | | | | | | | | | | | | | | | | | | | | | | | | |
Dividends from net investment income | | | — | | | | — | | | | — | | | | — | | | | (0.03 | ) | | | (0.07 | ) |
Distributions from net realized gains | | | (1.80 | ) | | | (0.37 | ) | | | — | | | | — | | | | — | | | | (0.00 | )(2) |
Return of capital | | | — | | | | — | | | | — | | | | (0.02 | ) | | | (0.00 | )(2) | | | (0.00 | )(2) |
| | | | | | | | | | | | | | | | | | | | | | | | |
Total distributions | | | (1.80 | ) | | | (0.37 | ) | | | — | | | | (0.02 | ) | | | (0.03 | ) | | | (0.07 | ) |
| | | | | | | | | | | | | | | | | | | | | | | | |
Change in net asset value for the period | | | 7.34 | | | | 2.58 | | | | 0.56 | | | | 5.30 | | | | 6.25 | | | | (9.23 | ) |
| | | | | | | | | | | | | | | | | | | | | | | | |
Net asset value, end of period | | $ | 37.13 | | | $ | 29.79 | | | $ | 27.21 | | | $ | 26.65 | | | $ | 21.35 | | | $ | 15.10 | |
| | | | | | | | | | | | | | | | | | | | | | | | |
* Includes redemption fees per share of | | $ | 0.00 | (2) | | $ | 0.00 | (2) | | $ | 0.01 | | | $ | 0.01 | | | $ | 0.01 | | | $ | 0.00 | (2) |
Total Return | | | 32.1 | % | | | 11.0 | % | | | 2.1 | % | | | 25.0 | % | | | 41.6 | %(3) | | | (37.6 | )% |
Ratios/supplemental data | | | | | | | | | | | | | | | | | | | | | | | | |
Net assets, end of period (000) | | $ | 1,759,341 | | | $ | 1,346,273 | | | $ | 1,262,876 | | | $ | 933,674 | | | $ | 636,548 | | | $ | 404,860 | |
Ratio to average net assets: | | | | | | | | | | | | | | | | | | | | | | | | |
Expenses before waiver/reimbursement | | | 1.21 | % | | | 1.23 | % | | | 1.23 | % | | | 1.27 | % | | | 1.38 | %(4) | | | 1.40 | % |
Expenses after waiver/reimbursement | | | 1.21 | % | | | 1.23 | % | | | 1.23 | % | | | 1.27 | % | | | 1.38 | %(4) | | | 1.34 | % |
Net investment income (loss) before waiver/reimbursement | | | (0.15 | )% | | | (0.13 | )% | | | (0.30 | )% | | | (0.02 | )% | | | 0.21 | %(4) | | | 0.29 | % |
Net investment income (loss) after waiver/reimbursement | | | (0.15 | )% | | | (0.13 | )% | | | (0.30 | )% | | | (0.02 | )% | | | 0.21 | %(4) | | | 0.35 | % |
Portfolio turnover rate | | | 34 | % | | | 49 | % | | | 38 | % | | | 30 | % | | | 46 | %(3) | | | 81 | % |
| (1) | Net investment income (loss) per share is calculated using the ending balance prior to consideration or adjustment for permanent book-to-tax differences. |
| (2) | Represents less than $0.01. |
The Accompanying Notes are an Integral Part of these Financial Statements.
The Tocqueville Select Fund
Financial Highlights
| | | | | | | | | | | | | | | | | | | | | | | | |
Per share operating performance
(For a share outstanding throughout
the period) | | Years Ended October 31, | | | January 1,
2009
through
October 31,
2009 | | | Period from
September 28,
2008(2)
through
December 31,
2008 | |
| | 2013 | | | 2012 | | | 2011 | | | 2010 | | | |
Net asset value, beginning of period | | $ | 11.35 | | | $ | 11.06 | | | $ | 11.54 | | | $ | 8.46 | | | $ | 5.77 | | | $ | 8.74 | |
| | | | | | | | | | | | | | | | | | | | | | | | |
Operations: | | | | | | | | | | | | | | | | | | | | | | | | |
Net investment income (loss) (1) | | | (0.06 | ) | | | (0.04 | ) | | | (0.07 | ) | | | (0.03 | ) | | | (0.00 | )(4) | | | 0.01 | |
Net realized and unrealized gain | | | 4.79 | | | | 0.44 | | | | 0.12 | | | | 3.12 | | | | 2.70 | | | | (2.97 | ) |
| | | | | | | | | | | | | | | | | | | | | | | | |
Total from investment operations * | | | 4.73 | | | | 0.40 | | | | 0.05 | | | | 3.09 | | | | 2.70 | | | | (2.96 | ) |
| | | | | | | | | | | | | | | | | | | | | | | | |
Distributions to shareholders: | | | | | | | | | | | | | | | | | | | | | | | | |
Dividends from net investment income | | | — | | | | — | | | | — | | | | (0.01 | ) | | | (0.00 | )(4) | | | (0.01 | ) |
Distributions from net realized gains | | | (0.51 | ) | | | (0.11 | ) | | | (0.53 | ) | | | — | | | | — | | | | — | |
Return of capital | | | — | | | | — | | | | — | | | | — | | | | (0.01 | ) | | | — | |
| | | | | | | | | | | | | | | | | | | | | | | | |
Total distributions | | | (0.51 | ) | | | (0.11 | ) | | | (0.53 | ) | | | (0.01 | ) | | | (0.01 | ) | | | (0.01 | ) |
| | | | | | | | | | | | | | | | | | | | | | | | |
Change in net asset value for the period | | | 4.22 | | | | 0.29 | | | | (0.48 | ) | | | 3.08 | | | | 2.69 | | | | (2.97 | ) |
| | | | | | | | | | | | | | | | | | | | | | | | |
Net asset value, end of period | | $ | 15.57 | | | $ | 11.35 | | | $ | 11.06 | | | $ | 11.54 | | | $ | 8.46 | | | $ | 5.77 | |
| | | | | | | | | | | | | | | | | | | | | | | | |
* Includes redemption fees per share of | | $ | 0.00 | (3) | | $ | 0.00 | (3) | | $ | 0.01 | | | $ | 0.01 | | | $ | — | | | $ | — | |
Total Return | | | 43.2 | % | | | 3.7 | % | | | (0.1 | )% | | | 36.6 | % | | | 46.7 | %(4) | | | (33.9 | )%(4) |
Ratios/supplemental data | | | | | | | | | | | | | | | | | | | | | | | | |
Net assets, end of period (000) | | $ | 99,888 | | | $ | 84,549 | | | $ | 71,554 | | | $ | 41,788 | | | $ | 24,681 | | | $ | 9,226 | |
Ratio to average net assets: | | | | | | | | | | | | | | | | | | | | | | | | |
Expenses before waiver/reimbursement | | | 1.34 | % | | | 1.37 | % | | | 1.36 | % | | | 1.38 | % | | | 2.03 | %(5) | | | 3.47 | %(5) |
Expenses after waiver/reimbursement | | | 1.34 | % | | | 1.37 | % | | | 1.36 | % | | | 1.38 | % | | | 1.26 | %(5) | | | 1.15 | %(5) |
Net investment income (loss) before waiver/reimbursement | | | (0.39 | )% | | | (0.36 | )% | | | (0.67 | )% | | | (0.43 | )% | | | (0.93 | )%(5) | | | (2.03 | )%(5) |
Net investment income (loss) after waiver/reimbursement | | | (0.39 | )% | | | (0.36 | )% | | | (0.67 | )% | | | (0.43 | )% | | | (0.16 | )%(5) | | | 0.29 | %(5) |
Portfolio turnover rate | | | 28 | % | | | 31 | % | | | 28 | % | | | 40 | % | | | 24 | %(4) | | | 29 | %(4) |
| (1) | Net investment income (loss) per share is calculated using the ending balance prior to consideration or adjustment for permanent book-to-tax differences. |
| (3) | Represents less than $0.01. |
The Accompanying Notes are an Integral Part of these Financial Statements.
The Tocqueville Fund
Schedule of Investments as of October 31, 2013
| | | | | | | | |
| Common Stocks—96.6% | | Shares | | | Value | |
Automobiles & Components—2.0% | | | | | |
Ford Motor Co. | | | 400,000 | | | $ | 6,844,000 | |
Banks—1.6% | | | | | | | | |
M&T Bank Corp. | | | 20,000 | | | | 2,250,600 | |
Mitsubishi UFJ Financial Group, Inc.—ADR | | | 500,000 | | | | 3,200,000 | |
| | | | | | | | 5,450,600 | |
Capital Goods—6.8% | | | | | | | | |
General Electric Co. | | | 500,000 | | | | 13,070,000 | |
Illinois Tool Works, Inc. | | | 50,000 | | | | 3,939,500 | |
The Boeing Co. | | | 50,000 | | | | 6,525,000 | |
| | | | | | | | 23,534,500 | |
Commercial & Professional Services—2.9% | | | | | |
Pitney Bowes, Inc. | | | 250,000 | | | | 5,335,000 | |
Steelcase, Inc. | | | 300,000 | | | | 4,917,000 | |
| | | | | | | | 10,252,000 | |
Consumer Services—1.5% | | | | | | | | |
DeVry Education Group, Inc. | | | 150,000 | | | | 5,385,000 | |
Diversified Financials—3.4% | | | | | | | | |
Lazard Ltd.(a) | | | 100,000 | | | | 3,865,000 | |
The Bank of New York Mellon Corp. | | | 250,000 | | | | 7,950,000 | |
| | | | | | | | 11,815,000 | |
Energy—11.9% | | | | | |
Cameco Corp.(a) | | | 200,000 | | | | 3,800,000 | |
Chesapeake Energy Corp. | | | 200,000 | | | | 5,592,000 | |
Energen Corp. | | | 100,000 | | | | 7,832,000 | |
Exxon Mobil Corp. | | | 100,000 | | | | 8,962,000 | |
Murphy Oil Corp. | | | 100,000 | | | | 6,032,000 | |
Schlumberger Ltd.(a) | | | 100,000 | | | | 9,372,000 | |
| | | | | | | | 41,590,000 | |
Food & Staples Retailing—2.2% | | | | | |
Wal-Mart Stores, Inc. | | | 100,000 | | | | 7,675,000 | |
Food, Beverage & Tobacco—5.0% | | | | | |
Campbell Soup Co. | | | 125,000 | | | | 5,321,250 | |
PepsiCo, Inc. | | | 50,000 | | | | 4,204,500 | |
The Coca-Cola Co. | | | 200,000 | | | | 7,914,000 | |
| | | | | | | | 17,439,750 | |
Household & Personal Products—4.2% | | | | | |
Colgate-Palmolive Co. | | | 100,000 | | | | 6,473,000 | |
The Procter & Gamble Co. | | | 100,000 | | | | 8,075,000 | |
| | | | | | | | 14,548,000 | |
Insurance—3.2% | | | | | |
Aflac, Inc. | | | 100,000 | | | | 6,498,000 | |
XL Group PLC(a) | | | 150,000 | | | | 4,585,500 | |
| | | | | | | | 11,083,500 | |
Materials—7.8% | | | | | | | | |
BHP Billiton Ltd.—ADR | | | 75,000 | | | | 5,301,750 | |
EI du Pont de Nemours & Co. | | | 150,000 | | | | 9,180,000 | |
Goldcorp, Inc.(a) | | | 265,000 | | | | 6,738,950 | |
Sonoco Products Co. | | | 150,000 | | | | 6,096,000 | |
| | | | | | | | 27,316,700 | |
Pharmaceuticals, Biotechnology & Life Sciences—11.8% | |
Alkermes PLC(a)(b) | | | 200,000 | | | | 7,038,000 | |
Allergan, Inc. | | | 40,000 | | | | 3,624,400 | |
Isis Pharmaceuticals, Inc.(b) | | | 200,000 | | | | 6,654,000 | |
Johnson & Johnson | | | 100,000 | | | | 9,261,000 | |
Merck & Co., Inc. | | | 150,000 | | | | 6,763,500 | |
Pfizer, Inc. | | | 250,000 | | | | 7,670,000 | |
| | | | | | | | 41,010,900 | |
Retailing—1.4% | | | | | | | | |
Lowe’s Companies, Inc. | | | 100,000 | | | | 4,978,000 | |
Semiconductors & Semiconductor Equipment—4.9% | |
Applied Materials, Inc. | | | 400,000 | | | | 7,140,000 | |
Intel Corp. | | | 400,000 | | | | 9,772,000 | |
| | | | | | | | 16,912,000 | |
Software & Services—11.3% | | | | | | | | |
Automatic Data Processing, Inc. | | | 100,000 | | | | 7,497,000 | |
Facebook, Inc.(b) | | | 75,000 | | | | 3,769,500 | |
Google, Inc.(b) | | | 7,500 | | | | 7,729,350 | |
MasterCard, Inc. | | | 10,000 | | | | 7,171,000 | |
Microsoft Corp. | | | 300,000 | | | | 10,605,000 | |
Oracle Corp. | | | 75,000 | | | | 2,512,500 | |
| | | | | | | | 39,284,350 | |
Technology Hardware & Equipment—7.4% | | | | | |
Apple, Inc. | | | 10,000 | | | | 5,223,500 | |
Bio-key International, Inc.(b)(c)(d)(e)
(Acquired 4/16/05, Cost $0) | | | 47,090 | | | | — | |
Cisco Systems, Inc. | | | 250,000 | | | | 5,625,000 | |
EMC Corp. | | | 200,000 | | | | 4,814,000 | |
Xerox Corp. | | | 1,000,000 | | | | 9,940,000 | |
| | | | | | | | 25,602,500 | |
Telecommunication Services—1.4% | | | | | |
Verizon Communications, Inc. | | | 100,000 | | | | 5,051,000 | |
Transportation—3.5% | | | | | | | | |
CH Robinson Worldwide, Inc. | | | 50,000 | | | | 2,987,000 | |
Delta Air Lines, Inc. | | | 200,000 | | | | 5,276,000 | |
FedEx Corp. | | | 30,000 | | | | 3,930,000 | |
| | | | | | | | 12,193,000 | |
Utilities—2.4% | | | | | | | | |
NextEra Energy, Inc. | | | 100,000 | | | | 8,475,000 | |
Total Common Stocks (Cost $229,517,334) | | | | | | | 336,440,800 | |
The Accompanying Footnotes are an Integral Part of these Financial Statements.
The Tocqueville Fund
Schedule of Investments as of October 31, 2013
| | | | | | | | |
Real Estate Investment Trust
(REIT)—2.2% | | Shares | | | Value | |
Real Estate—2.2% | | | | | | | | |
Weyerhaeuser Co. | | | 250,000 | | | $ | 7,600,000 | |
Total Real Estate Investment Trust (Cost $4,426,162) | | | | | | | 7,600,000 | |
Short-Term Investment—0.6% | | | | | | | | |
Money Market Fund—0.6% | | | | | | | | |
STIT-Treasury Portfolio, 0.02%(f) | | | 2,068,456 | | | | 2,068,456 | |
Total Short-Term Investment (Cost $2,068,456) | | | | | | | 2,068,456 | |
Total Investments (Cost $236,011,952)—99.4% | | | | | | | 346,109,256 | |
Other Assets in Excess of Liabilities—0.6% | | | | 2,159,841 | |
Total Net Assets—100.0% | | | | | | $ | 348,269,097 | |
| | | | | | | | |
Percentages are stated as a percent of net assets.
ADR—American Depository Receipt
| (a) | Foreign issued security. Foreign concentration (including ADR’s) was as follows: Australia 1.5%; Bermuda 1.1%; Canada 3.0%; Curacao 2.7%; Ireland 3.3%; Japan 0.9%. |
| (b) | Non-income producing security. |
| (c) | Denotes a security is either fully or partially restricted to resale. The aggregate value of restricted securities at October 31, 2013 was $0 which represented 0.0% of net assets. |
| (d) | Security is fair valued using procedures approved by the Board of Trustees. The aggregate value of fair valued securities as of October 31, 2013 was $0 which represented 0.0% of net assets. |
| (e) | Security is considered illiquid and may be difficult to sell. |
| (f) | Rate listed is the 7-day effective yield. |
The Global Industry Classification Standard (GICS®) was developed by and/or is the exlusive property of MSCI, Inc. and Standard & Poor Financial Services LLC (“S&P”). GICS is a service mark of MSCI and S&P and has been licensed for use by U.S. Bancorp Fund Services, LLC.
The Accompanying Footnotes are an Integral Part of these Financial Statements.
The Tocqueville Opportunity Fund
Schedule of Investments as of October 31, 2013
| | | | | | | | |
| Common Stocks—99.5% | | Shares | | | Value | |
Automobiles & Components—3.4% | | | | | | | | |
BorgWarner, Inc. | | | 3,200 | | | $ | 330,016 | |
Delphi Automotive PLC(a) | | | 4,400 | | | | 251,680 | |
Gentex Corp. | | | 4,700 | | | | 138,368 | |
Standard Motor Products, Inc. | | | 3,100 | | | | 112,096 | |
Tenneco, Inc.(b) | | | 2,900 | | | | 153,903 | |
Tesla Motors, Inc.(b) | | | 4,925 | | | | 787,705 | |
The Goodyear Tire & Rubber Co. | | | 12,500 | | | | 262,250 | |
TRW Automotive Holdings Corp.(b) | | | 3,200 | | | | 240,352 | |
Visteon Corp.(b) | | | 2,300 | | | | 177,307 | |
Winnebago Industries, Inc.(b) | | | 10,100 | | | | 299,566 | |
| | | | | | | | 2,753,243 | |
Banks—4.4% | | | | | | | | |
Bank of the Ozarks, Inc. | | | 8,400 | | | | 415,632 | |
BankUnited, Inc. | | | 2,700 | | | | 83,079 | |
City National Corp. | | | 1,200 | | | | 86,532 | |
EverBank Financial Corp. | | | 10,000 | | | | 151,200 | |
First Financial Holdings, Inc. | | | 9,800 | | | | 587,314 | |
First Republic Bank | | | 4,900 | | | | 250,243 | |
Ocwen Financial Corp.(b) | | | 4,700 | | | | 264,281 | |
Pinnacle Financial Partners, Inc.(b) | | | 20,700 | | | | 641,700 | |
Regions Financial Corp. | | | 21,100 | | | | 203,193 | |
Signature Bank(b) | | | 3,400 | | | | 346,188 | |
Texas Capital Bancshares, Inc.(b) | | | 7,000 | | | | 364,350 | |
Umpqua Holdings Corp. | | | 9,500 | | | | 155,515 | |
| | | | | | | | 3,549,227 | |
Capital Goods—13.3% | | | | | | | | |
Acuity Brands, Inc. | | | 4,200 | | | | 422,142 | |
AMETEK, Inc. | | | 13,950 | | | | 667,228 | |
AO Smith Corp. | | | 11,000 | | | | 568,150 | |
B/E Aerospace, Inc.(b) | | | 6,000 | | | | 486,960 | |
Belden, Inc. | | | 2,800 | | | | 188,328 | |
Chicago Bridge & Iron Co. NV(a) | | | 4,500 | | | | 333,405 | |
Colfax Corp.(b) | | | 4,100 | | | | 229,436 | |
Donaldson Co., Inc. | | | 6,100 | | | | 241,621 | |
Fortune Brands Home & Security, Inc. | | | 7,600 | | | | 327,408 | |
Generac Holdings, Inc. | | | 10,600 | | | | 523,110 | |
Graco, Inc. | | | 2,900 | | | | 224,054 | |
HEICO Corp. | | | 4,000 | | | | 214,320 | |
Hexcel Corp.(b) | | | 8,000 | | | | 338,480 | |
Hubbell, Inc. | | | 3,700 | | | | 397,898 | |
IDEX Corp. | | | 3,200 | | | | 221,280 | |
Lennox International, Inc. | | | 2,800 | | | | 218,568 | |
Lincoln Electric Holdings, Inc. | | | 5,400 | | | | 373,896 | |
MasTec, Inc.(b) | | | 4,800 | | | | 153,456 | |
Nordson Corp. | | | 5,900 | | | | 425,331 | |
PGT, Inc.(b) | | | 44,200 | | | | 461,890 | |
Proto Labs, Inc.(b) | | | 2,750 | | | | 230,615 | |
Snap-on, Inc. | | | 1,200 | | | | 124,884 | |
The Middleby Corp.(b) | | | 1,500 | | | | 341,475 | |
The Toro Co. | | | 3,900 | | | | 229,866 | |
TransDigm Group, Inc. | | | 4,200 | | | $ | 610,722 | |
United Rentals, Inc.(b) | | | 7,000 | | | | 452,130 | |
USG Corp.(b) | | | 8,300 | | | | 226,673 | |
WABCO Holdings, Inc.(b) | | | 4,300 | | | | 368,424 | |
Wabtec Corp. | | | 6,800 | | | | 443,292 | |
Watsco, Inc. | | | 4,600 | | | | 438,334 | |
Woodward, Inc. | | | 5,100 | | | | 204,459 | |
| | | | | | | | 10,687,835 | |
Commercial & Professional Services—1.3% | |
Clean Harbors, Inc.(b) | | | 2,400 | | | | 148,200 | |
Copart, Inc.(b) | | | 5,700 | | | | 183,711 | |
Equifax, Inc. | | | 7,500 | | | | 485,025 | |
Robert Half International, Inc. | | | 5,100 | | | | 196,503 | |
| | | | | | | | 1,013,439 | |
Consumer Durables & Apparel—7.6% | |
Cie Financiere Richemont SA(a) | | | 3,200 | | | | 328,164 | |
Deckers Outdoor Corp.(b) | | | 1,900 | | | | 130,777 | |
Fossil Group, Inc.(b) | | | 3,000 | | | | 380,820 | |
Haier Electronics Group Co., Ltd.(a) | | | 91,000 | | | | 194,137 | |
Hanesbrands, Inc. | | | 9,300 | | | | 633,516 | |
Harman International Industries, Inc. | | | 2,200 | | | | 178,244 | |
Hermes International(a) | | | 1,100 | | | | 374,727 | |
Jarden Corp.(b) | | | 3,500 | | | | 193,760 | |
Meritage Homes Corp.(b) | | | 2,400 | | | | 108,936 | |
Michael Kors Holdings Ltd.(a)(b) | | | 8,100 | | | | 623,295 | |
Polaris Industries, Inc. | | | 4,900 | | | | 641,655 | |
Prada SpA(a) | | | 59,500 | | | | 580,188 | |
Ralph Lauren Corp. | | | 1,000 | | | | 165,640 | |
Taylor Morrison Home Corp.(b) | | | 4,200 | | | | 93,408 | |
Tempur Sealy International, Inc.(b) | | | 3,400 | | | | 130,390 | |
The Ryland Group, Inc. | | | 5,900 | | | | 237,180 | |
Tupperware Brands Corp. | | | 4,100 | | | | 367,565 | |
Under Armour, Inc.(b) | | | 4,300 | | | | 348,945 | |
Whirlpool Corp. | | | 2,900 | | | | 423,429 | |
| | | | | | | | 6,134,776 | |
Consumer Services—3.5% | | | | | | | | |
Bob Evans Farms, Inc. | | | 2,300 | | | | 131,307 | |
Domino’s Pizza, Inc. | | | 6,800 | | | | 456,008 | |
Dunkin’ Brands Group, Inc. | | | 10,900 | | | | 519,712 | |
Hillenbrand, Inc. | | | 9,900 | | | | 279,378 | |
Jack in the Box, Inc.(b) | | | 3,900 | | | | 158,652 | |
Panera Bread Co.(b) | | | 2,325 | | | | 367,164 | |
Starbucks Corp. | | | 3,300 | | | | 267,465 | |
Starwood Hotels & Resorts Worldwide, Inc. | | | 3,100 | | | | 228,222 | |
Wyndham Worldwide Corp. | | | 4,000 | | | | 265,600 | |
Wynn Resorts Ltd. | | | 900 | | | | 149,625 | |
| | | | | | | | 2,823,133 | |
The Accompanying Footnotes are an Integral Part of these Financial Statements.
The Tocqueville Opportunity Fund
Schedule of Investments as of October 31, 2013
| | | | | | | | |
| Common Stocks (continued) | | Shares | | | Value | |
Diversified Financials—3.7% | | | | | | | | |
Affiliated Managers Group, Inc.(b) | | | 1,900 | | | $ | 375,136 | |
Blackstone Group LP | | | 20,400 | | | | 536,112 | |
CBOE Holdings, Inc. | | | 3,400 | | | | 164,900 | |
KKR & Co. LP | | | 10,300 | | | | 226,085 | |
Lazard Ltd.(a) | | | 6,800 | | | | 262,820 | |
MSCI, Inc.(b) | | | 2,100 | | | | 85,617 | |
Portfolio Recovery Associates, Inc.(b) | | | 8,500 | | | | 505,325 | |
T. Rowe Price Group, Inc. | | | 3,200 | | | | 247,712 | |
The Charles Schwab Corp. | | | 11,600 | | | | 262,740 | |
Waddell & Reed Financial, Inc. | | | 4,600 | | | | 284,050 | |
| | | | | | | | 2,950,497 | |
Energy—3.2% | | | | | | | | |
Antero Resources Corp.(b) | | | 2,800 | | | | 158,172 | |
BPZ Resources, Inc.(b) | | | 50,400 | | | | 101,304 | |
Cheniere Energy, Inc.(b) | | | 13,700 | | | | 545,260 | |
Concho Resources, Inc.(b) | | | 800 | | | | 88,488 | |
Dresser-Rand Group, Inc.(b) | | | 3,900 | | | | 237,003 | |
Dril-Quip, Inc.(b) | | | 3,400 | | | | 399,228 | |
FMC Technologies, Inc.(b) | | | 1,425 | | | | 72,034 | |
Oceaneering International, Inc. | | | 7,100 | | | | 609,748 | |
Pioneer Natural Resources Co. | | | 600 | | | | 122,868 | |
SM Energy Co. | | | 2,900 | | | | 256,969 | |
| | | | | | | | 2,591,074 | |
Food & Staples Retailing—0.4% | | | | | | | | |
The Fresh Market, Inc.(b) | | | 5,900 | | | | 300,369 | |
Food, Beverage & Tobacco—2.1% | | | | | | | | |
Beam, Inc. | | | 3,000 | | | | 201,900 | |
Constellation Brands, Inc.(b) | | | 9,900 | | | | 646,470 | |
J&J Snack Foods Corp. | | | 2,000 | | | | 171,140 | |
The Boston Beer Co., Inc.(b) | | | 600 | | | | 137,754 | |
The Hain Celestial Group, Inc.(b) | | | 3,800 | | | | 316,274 | |
WhiteWave Foods Co.(b) | | | 11,000 | | | | 220,110 | |
| | | | | | | | 1,693,648 | |
Health Care Equipment & Services—5.1% | | | | | |
Align Technology, Inc.(b) | | | 4,900 | | | | 279,594 | |
athenahealth, Inc.(b) | | | 2,100 | | | | 280,371 | |
DexCom, Inc.(b) | | | 9,200 | | | | 264,316 | |
Health Management Associates, Inc.(b) | | | 11,400 | | | | 146,148 | |
HeartWare International, Inc.(b) | | | 3,300 | | | | 239,448 | |
HMS Holdings Corp.(b) | | | 4,600 | | | | 97,198 | |
IDEXX Laboratories, Inc.(b) | | | 4,600 | | | | 496,156 | |
Insulet Corp.(b) | | | 6,900 | | | | 269,238 | |
MWI Veterinary Supply, Inc.(b) | | | 2,300 | | | | 364,872 | |
ResMed, Inc. | | | 6,700 | | | | 346,658 | |
Sirona Dental Systems, Inc.(b) | | | 3,300 | | | | 238,425 | |
Teleflex, Inc. | | | 3,100 | | | | 285,758 | |
Tenet Healthcare Corp.(b) | | | 5,200 | | | | 245,388 | |
The Cooper Cos., Inc. | | | 1,300 | | | | 167,973 | |
Tornier NV(a)(b) | | | 8,200 | | | | 176,382 | |
Universal Health Services, Inc. | | | 2,900 | | | $ | 233,624 | |
| | | | | | | | 4,131,549 | |
Household & Personal Products—1.0% | | | | | |
Church & Dwight Co., Inc. | | | 2,800 | | | | 182,420 | |
Herbalife Ltd.(a) | | | 5,000 | | | | 324,100 | |
Nu Skin Enterprises, Inc. | | | 2,300 | | | | 268,939 | |
| | | | | | | | 775,459 | |
Insurance—0.5% | | | | | | | | |
Arthur J. Gallagher & Co. | | | 4,200 | | | | 199,290 | |
RenaissanceRe Holdings Ltd.(a) | | | 2,000 | | | | 187,420 | |
| | | | | | | | 386,710 | |
Materials—6.4% | | | | | | | | |
Airgas, Inc. | | | 1,500 | | | | 163,605 | |
Albemarle Corp. | | | 1,700 | | | | 112,523 | |
Aptargroup, Inc. | | | 2,600 | | | | 166,816 | |
Ball Corp. | | | 5,100 | | | | 249,339 | |
Caesarstone Sdot-Yam Ltd.(a)(b) | | | 14,700 | | | | 619,899 | |
Crown Holdings, Inc.(b) | | | 5,600 | | | | 244,160 | |
Eagle Materials, Inc. | | | 2,500 | | | | 187,525 | |
Eastman Chemical Co. | | | 3,400 | | | | 267,886 | |
Ecolab, Inc. | | | 2,600 | | | | 275,600 | |
HB Fuller Co. | | | 3,400 | | | | 162,758 | |
International Flavors & Fragrances, Inc. | | | 3,700 | | | | 305,805 | |
Owens-Illinois, Inc.(b) | | | 13,000 | | | | 413,270 | |
Packaging Corp. of America | | | 5,000 | | | | 311,400 | |
Rock Tenn Co. | | | 2,400 | | | | 256,824 | |
Schweitzer-Mauduit International, Inc. | | | 3,600 | | | | 222,768 | |
Silgan Holdings, Inc. | | | 2,500 | | | | 112,675 | |
The Sherwin-Williams Co. | | | 1,800 | | | | 338,400 | |
The Valspar Corp. | | | 4,200 | | | | 293,874 | |
WR Grace & Co.(b) | | | 4,700 | | | | 430,802 | |
| | | | | | | | 5,135,929 | |
Media—0.6% | | | | | | | | |
Cablevision Systems Corp. | | | 7,800 | | | | 121,290 | |
Morningstar, Inc. | | | 4,200 | | | | 337,218 | |
| | | | | | | | 458,508 | |
Pharmaceuticals, Biotechnology & Life Sciences—18.1% | |
Acceleron Pharma, Inc.(b) | | | 3,100 | | | | 69,874 | |
Actavis plc(a)(b) | | | 3,706 | | | | 572,873 | |
Aegerion Pharmaceuticals, Inc.(b) | | | 8,300 | | | | 687,406 | |
Alexion Pharmaceuticals, Inc.(b) | | | 1,800 | | | | 221,310 | |
Algeta ASA(a)(b) | | | 10,500 | | | | 417,139 | |
Alkermes PLC(a)(b) | | | 8,300 | | | | 292,077 | |
Alnylam Pharmaceuticals, Inc.(b) | | | 15,000 | | | | 864,150 | |
Auxilium Pharmaceuticals, Inc.(b) | | | 8,600 | | | | 148,006 | |
BioMarin Pharmaceutical, Inc.(b) | | | 6,500 | | | | 408,330 | |
Bluebird Bio, Inc.(b) | | | 1,700 | | | | 36,125 | |
Celldex Therapeutics, Inc.(b) | | | 11,800 | | | | 270,338 | |
Cepheid, Inc.(b) | | | 3,500 | | | | 142,520 | |
Clovis Oncology, Inc.(b) | | | 2,200 | | | | 112,442 | |
The Accompanying Footnotes are an Integral Part of these Financial Statements.
The Tocqueville Opportunity Fund
Schedule of Investments as of October 31, 2013
| | | | | | | | |
| Common Stocks (continued) | | Shares | | | Value | |
Cubist Pharmaceuticals, Inc.(b) | | | 4,300 | | | $ | 266,600 | |
Enanta Pharmaceuticals, Inc.(b) | | | 8,000 | | | | 159,680 | |
Endo Health Solutions, Inc.(b) | | | 4,500 | | | | 196,785 | |
Endocyte, Inc.(b) | | | 25,500 | | | | 265,965 | |
Forest Laboratories, Inc.(b) | | | 6,700 | | | | 315,101 | |
Genmab A/S(a)(b) | | | 8,500 | | | | 369,044 | |
Genomic Health, Inc.(b) | | | 3,400 | | | | 101,728 | |
Gilead Sciences, Inc.(b) | | | 7,000 | | | | 496,930 | |
Incyte Corp., Ltd.(b) | | | 10,300 | | | | 401,700 | |
Isis Pharmaceuticals, Inc.(b) | | | 6,200 | | | | 206,274 | |
KaloBios Pharmaceuticals, Inc.(b) | | | 17,000 | | | | 68,170 | |
KYTHERA Biopharmaceuticals, Inc.(b) | | | 2,000 | | | | 89,420 | |
Medivation, Inc.(b) | | | 12,800 | | | | 766,208 | |
Mettler-Toledo International, Inc.(b) | | | 1,350 | | | | 334,071 | |
NPS Pharmaceuticals, Inc.(b) | | | 25,000 | | | | 719,500 | |
OncoGenex Pharmaceutical, Inc.(b) | | | 12,100 | | | | 85,063 | |
OncoMed Pharmaceuticals, Inc.(b) | | | 7,100 | | | | 98,761 | |
Onconova Therapeutics, Inc.(b) | | | 11,400 | | | | 179,436 | |
Orexigen Therapeutics, Inc.(b) | | | 7,800 | | | | 38,064 | |
PAREXEL International Corp.(b) | | | 3,200 | | | | 146,272 | |
Pharmacyclics, Inc.(b) | | | 12,500 | | | | 1,483,000 | |
PTC Therapeutics, Inc.(b) | | | 9,300 | | | | 167,307 | |
Regeneron Pharmaceuticals, Inc.(b) | | | 2,900 | | | | 834,040 | |
Regulus Therapeutics, Inc.(b) | | | 4,000 | | | | 27,880 | |
Salix Pharmaceuticals Ltd.(b) | | | 3,200 | | | | 229,600 | |
Santarus, Inc.(b) | | | 5,200 | | | | 121,316 | |
Sarepta Therapeutics, Inc.(b) | | | 7,500 | | | | 292,050 | |
Seattle Genetics, Inc.(b) | | | 12,200 | | | | 471,286 | |
Swedish Orphan Biovitrum AB(a)(b) | | | 13,000 | | | | 124,382 | |
Synageva BioPharma Corp.(b) | | | 2,500 | | | | 127,000 | |
The Medicines Co.(b) | | | 5,500 | | | | 186,560 | |
United Therapeutics Corp.(b) | | | 2,200 | | | | 194,744 | |
Valeant Pharmaceuticals International, Inc.(a)(b) | | | 1,100 | | | | 116,292 | |
Vertex Pharmaceuticals, Inc.(b) | | | 5,000 | | | | 356,700 | |
ViroPharma, Inc.(b) | | | 8,600 | | | | 333,852 | |
| | | | | | | | 14,613,371 | |
Real Estate—0.3% | | | | | | | | |
Realogy Holdings Corp.(b) | | | 4,900 | | | | 201,586 | |
Retailing—6.3% | | | | | | | | |
Aeropostale, Inc.(b) | | | 10,000 | | | | 92,900 | |
American Eagle Outfitters, Inc. | | | 10,100 | | | | 156,449 | |
Dick’s Sporting Goods, Inc. | | | 5,300 | | | | 282,013 | |
Expedia, Inc. | | | 2,500 | | | | 147,200 | |
Francesca’s Holdings Corp.(b) | | | 4,200 | | | | 75,558 | |
GNC Holdings, Inc. | | | 8,600 | | | | 505,852 | |
Groupon, Inc.(b) | | | 41,000 | | | | 374,330 | |
L Brands, Inc. | | | 2,700 | | | | 169,047 | |
Lithia Motors, Inc. | | | 1,700 | | | | 106,845 | |
LKQ Corp.(b) | | | 17,000 | | | | 561,510 | |
L’Occitane International SA(a) | | | 30,500 | | | $ | 69,159 | |
Penske Automotive Group, Inc. | | | 2,800 | | | | 110,936 | |
PetSmart, Inc. | | | 4,700 | | | | 341,972 | |
priceline.com, Inc.(b) | | | 850 | | | | 895,756 | |
Sally Beauty Holdings, Inc.(b) | | | 8,000 | | | | 210,560 | |
Ulta Salon Cosmetics & Fragrance, Inc.(b) | | | 4,900 | | | | 631,365 | |
Urban Outfitters, Inc.(b) | | | 7,500 | | | | 284,100 | |
Williams-Sonoma, Inc. | | | 1,800 | | | | 94,392 | |
| | | | | | | | 5,109,944 | |
Semiconductors & Semiconductor Equipment—1.1% | |
Cavium, Inc.(b) | | | 5,700 | | | | 229,767 | |
Cirrus Logic, Inc.(b) | | | 5,000 | | | | 112,150 | |
Cree, Inc.(b) | | | 6,300 | | | | 382,725 | |
Skyworks Solutions, Inc.(b) | | | 8,000 | | | | 206,240 | |
| | | | | | | | 930,882 | |
Software & Services—12.1% | | | | | | | | |
Alliance Data Systems Corp.(b) | | | 700 | | | | 165,942 | |
ANSYS, Inc.(b) | | | 4,800 | | | | 419,760 | |
Aspen Technology, Inc.(b) | | | 11,700 | | | | 447,291 | |
Cadence Design Systems, Inc.(b) | | | 14,500 | | | | 188,065 | |
CommVault Systems, Inc.(b) | | | 4,700 | | | | 366,976 | |
Concur Technologies, Inc.(b) | | | 4,900 | | | | 512,540 | |
CoreLogic, Inc.(b) | | | 5,700 | | | | 189,639 | |
CoStar Group, Inc.(b) | | | 1,450 | | | | 256,635 | |
Equinix, Inc.(b) | | | 500 | | | | 80,740 | |
Facebook, Inc.(b) | | | 8,000 | | | | 402,080 | |
FactSet Research Systems, Inc. | | | 2,800 | | | | 305,032 | |
FleetCor Technologies, Inc.(b) | | | 2,900 | | | | 334,515 | |
Gartner, Inc.(b) | | | 5,200 | | | | 306,540 | |
IAC/InterActiveCorp | | | 4,500 | | | | 240,255 | |
Informatica Corp.(b) | | | 5,500 | | | | 212,300 | |
LinkedIn Corp.(b) | | | 1,800 | | | | 402,606 | |
Manhattan Associates, Inc.(b) | | | 6,500 | | | | 692,315 | |
NetSuite, Inc.(b) | | | 5,100 | | | | 514,488 | |
OpenTable, Inc.(b) | | | 2,500 | | | | 173,700 | |
PTC, Inc.(b) | | | 8,500 | | | | 235,620 | |
Qlik Technologies, Inc.(b) | | | 4,800 | | | | 121,632 | |
Rackspace Hosting, Inc.(b) | | | 6,400 | | | | 327,872 | |
ServiceNow, Inc.(b) | | | 5,700 | | | | 311,277 | |
SolarWinds, Inc.(b) | | | 3,300 | | | | 119,427 | |
Solera Holdings, Inc. | | | 7,400 | | | | 416,028 | |
Splunk, Inc.(b) | | | 5,400 | | | | 338,634 | |
SS&C Technologies Holdings, Inc.(b) | | | 3,200 | | | | 125,760 | |
Teradata Corp.(b) | | | 4,000 | | | | 176,280 | |
TIBCO Software, Inc.(b) | | | 6,800 | | | | 167,008 | |
The Ultimate Software Group, Inc.(b) | | | 3,800 | | | | 587,024 | |
Workday, Inc.(b) | | | 4,900 | | | | 366,863 | |
Yelp, Inc.(b) | | | 3,700 | | | | 250,675 | |
| | | | | | | | 9,755,519 | |
The Accompanying Footnotes are an Integral Part of these Financial Statements.
The Tocqueville Opportunity Fund
Schedule of Investments as of October 31, 2013
| | | | | | | | |
| Common Stocks (continued) | | Shares | | | Value | |
Technology Hardware & Equipment—2.1% | |
3D Systems Corp.(b) | | | 8,500 | | | $ | 529,040 | |
Aruba Networks, Inc.(b) | | | 5,400 | | | | 101,304 | |
FEI Co. | | | 2,300 | | | | 204,884 | |
FLIR Systems, Inc. | | | 5,200 | | | | 148,096 | |
IPG Photonics Corp. | | | 1,900 | | | | 125,913 | |
NCR Corp.(b) | | | 8,300 | | | | 303,365 | |
Trimble Navigation Ltd.(b) | | | 10,700 | | | | 305,699 | |
| | | | | | | | 1,718,301 | |
Transportation—3.0% | | | | | | | | |
Alaska Air Group, Inc. | | | 2,300 | | | | 162,518 | |
Delta Air Lines, Inc. | | | 45,500 | | | | 1,200,290 | |
Genesee & Wyoming, Inc.(b) | | | 1,300 | | | | 129,792 | |
Hertz Global Holdings, Inc.(b) | | | 1,500 | | | | 34,440 | |
Kansas City Southern | | | 400 | | | | 48,608 | |
Kirby Corp.(b) | | | 5,100 | | | | 451,299 | |
Spirit Airlines, Inc.(b) | | | 2,300 | | | | 99,245 | |
United Continental Holdings, Inc.(b) | | | 9,000 | | | | 305,550 | |
| | | | | | | | 2,431,742 | |
Total Common Stocks (Cost $59,248,378) | | | | | | | 80,146,741 | |
Real Estate Investment Trust (REIT)—0.2% | | | | | |
Real Estate—0.2% | | | | | | | | |
Extra Space Storage, Inc. | | | 4,050 | | | | 186,259 | |
Total Real Estate Investment Trust (Cost $172,908) | | | | | | | 186,259 | |
Consumer Durables & Apparel—0.1% | | | | | |
Ralph Lauren Corp. Expiration: April 2014, Exercise Price: $170.00(b) | | | 35 | | | $ | 33,950 | |
Diversified Financials—0.0% | | | | | | | | |
T. Rowe Price Group, Inc.
Expiration: January 2014, Exercise Price: $70.00(b) | | | 25 | | | | 19,875 | |
Food, Beverage & Tobacco—0.0% | | | | | | | | |
Beam, Inc.
Expiration: March 2014, Exercise Price: $70.00(b) | | | 30 | | | | 8,250 | |
Pharmaceuticals, Biotechnology & Life Sciences—0.3% | |
Gilead Sciences, Inc.
Expiration: January 2014, Exercise Price: $57.50(b) | | | 140 | | | | 207,200 | |
Medivation, Inc.
Expiration: March 2014, Exercise Price: $57.50(b) | | | 60 | | | | 54,900 | |
Vertex Pharmaceuticals, Inc. Expiration: January 2014, Exercise Price: $92.50(b) | | | 50 | | | | 2,625 | |
| | | | | | | | 264,725 | |
Total Purchased Call Options (Cost $208,253) | | | | | | | 326,800 | |
Total Investments (Cost $59,629,539)—100.1% | | | | | | | 80,659,800 | |
Liabilities in Excess of Other Assets—(0.1)% | | | | (50,830 | ) |
Total Net Assets—100.0% | | | | | | $ | 80,608,970 | |
| | | | | | | | |
Percentages are stated as a percent of net assets.
| (a) | Foreign issued security. Foreign concentration was as follows: Bermuda 0.8%; Canada 0.1%; Cayman Islands 0.4%; Denmark 0.5%; France 0.5%; Ireland 1.1%; Israel 0.8%; Italy 0.7%; Jersey 0.3%; Luxembourg 0.1%; Netherlands 0.6%, Norway 0.5%; Sweden 0.2%; Switzerland 0.4%; Virgin Islands 0.8%. |
| (b) | Non-income producing security. |
The Accompanying Footnotes are an Integral Part of these Financial Statements.
The Tocqueville International Value Fund
Schedule of Investments as of October 31, 2013
| | | | | | | | |
| Common Stocks—94.8% | | Shares | | | Value | |
Belgium—3.8% | | | | | | | | |
Groupe Bruxelles Lambert SA | | | 58,000 | | | $ | 5,179,373 | |
NV Bekaert SA | | | 112,800 | | | | 4,733,247 | |
| | | | | | | | 9,912,620 | |
Bermuda—0.5% | | | | | | | | |
Guoco Group Ltd. | | | 96,100 | | | | 1,189,939 | |
Brazil—1.6% | | | | | | | | |
Itau Unibanco Holding SA | | | 270,000 | | | | 4,160,700 | |
Canada—2.2% | | | | | | | | |
Agrium, Inc. | | | 29,200 | | | | 2,491,344 | |
Cameco Corp. | | | 167,100 | | | | 3,174,900 | |
| | | | | | | | 5,666,244 | |
China—1.0% | | | | | | | | |
China COSCO Holdings Co., Ltd.(a) | | | 5,435,000 | | | | 2,579,750 | |
France—11.4% | | | | | | | | |
Bollore SA | | | 10,420 | | | | 5,685,296 | |
Cie de St-Gobain | | | 129,700 | | | | 6,823,025 | |
Haulotte Group SA(a) | | | 120,850 | | | | 1,480,044 | |
Metropole Television SA | | | 199,800 | | | | 4,604,968 | |
Nexans SA | | | 105,000 | | | | 4,690,364 | |
Sanofi | | | 52,740 | | | | 5,624,091 | |
Vallourec SA | | | 20,000 | | | | 1,190,072 | |
| | | | | | | | 30,097,860 | |
Germany—6.5% | | | | | | | | |
Infineon Technologies AG | | | 590,000 | | | | 5,710,866 | |
LANXESS AG | | | 23,500 | | | | 1,654,071 | |
Siemens AG—ADR | | | 50,000 | | | | 6,400,500 | |
Wacker Neuson SE | | | 220,000 | | | | 3,387,327 | |
| | | | | | | | 17,152,764 | |
Hong Kong—4.8% | | | | | | | | |
Chow Tai Fook Jewellery Group Ltd. | | | 1,600,000 | | | | 2,653,940 | |
Clear Media Ltd. | | | 3,813,000 | | | | 2,936,104 | |
Hopewell Holdings Ltd. | | | 700,000 | | | | 2,356,507 | |
Television Broadcasts Ltd. | | | 800,000 | | | | 4,679,479 | |
| | | | | | | | 12,626,030 | |
Ireland—4.3% | | | | | | | | |
CRH PLC | | | 195,523 | | | | 4,751,954 | |
DCC PLC | | | 145,500 | | | | 6,529,968 | |
| | | | | | | | 11,281,922 | |
Italy—3.2% | | | | | | | | |
Sogefi SpA | | | 935,067 | | | | 5,332,285 | |
Telecom Italia SpA | | | 3,174,295 | | | | 3,092,364 | |
| | | | | | | | 8,424,649 | |
Japan—23.6% | | | | | | | | |
Asics Corp. | | | 138,400 | | | | 2,430,762 | |
Disco Corp. | | | 83,200 | | | | 5,237,547 | |
FUJIFILM Holdings Co. | | | 155,100 | | | | 3,774,579 | |
Hitachi Ltd. | | | 1,113,500 | | | $ | 7,757,017 | |
Horiba Ltd. | | | 112,300 | | | | 4,088,620 | |
Hoya Corp. | | | 276,000 | | | | 6,604,576 | |
Kao Corp. | | | 124,000 | | | | 4,117,360 | |
Kyoto Kimono Yuzen Co., Ltd. | | | 300,700 | | | | 3,158,986 | |
MISUMI Group, Inc. | | | 137,500 | | | | 4,011,873 | |
Mitsubishi UFJ Financial Group, Inc. | | | 850,000 | | | | 5,359,504 | |
Omron Corp. | | | 141,000 | | | | 5,362,962 | |
Shiseido Co., Ltd. | | | 291,000 | | | | 4,957,032 | |
SMC Corp. | | | 21,200 | | | | 4,911,380 | |
Ushio, Inc. | | | 26,000 | | | | 326,289 | |
| | | | | | | | 62,098,487 | |
Luxembourg—1.8% | | | | | | | | |
SAF-Holland SA(a) | | | 330,000 | | | | 4,702,380 | |
Netherlands—9.1% | | | | | | | | |
Akzo Nobel NV | | | 76,800 | | | | 5,584,999 | |
Fugro NV | | | 86,000 | | | | 5,381,203 | |
Koninklijke Ten Cate NV | | | 150,000 | | | | 4,560,020 | |
TNT Express NV | | | 400,000 | | | | 3,693,093 | |
Unilever NV—ADR | | | 121,600 | | | | 4,829,952 | |
| | | | | | | | 24,049,267 | |
Norway—5.6% | | | | | | | | |
Orkla ASA | | | 770,000 | | | | 6,240,919 | |
Statoil ASA—ADR | | | 225,000 | | | | 5,316,750 | |
Stolt-Nielsen Ltd. | | | 107,900 | | | | 3,054,090 | |
| | | | | | | | 14,611,759 | |
Singapore—1.7% | | | | | | | | |
Singapore Post Ltd. | | | 4,345,000 | | | | 4,582,153 | |
Sweden—1.0% | | | | | | | | |
Lindab International AB(a) | | | 269,274 | | | | 2,624,155 | |
Switzerland—2.5% | | | | | | | | |
Novartis AG—ADR | | | 85,000 | | | | 6,591,750 | |
United Kingdom—3.8% | | | | | | | | |
Homeserve PLC | | | 980,000 | | | | 3,683,230 | |
Stobart Group Ltd. | | | 464,789 | | | | 1,058,252 | |
Tesco PLC | | | 900,800 | | | | 5,260,336 | |
| | | | | | | | 10,001,818 | |
United States—6.4% | | | | | | | | |
Aflac, Inc. | | | 81,500 | | | | 5,295,870 | |
Freeport-McMoRan Copper & Gold, Inc. | | | 131,400 | | | | 4,830,264 | |
Schlumberger Ltd. | | | 72,000 | | | | 6,747,840 | |
| | | | | | | | 16,873,974 | |
Total Common Stocks
(Cost $197,197,083) | | | | | | | 249,228,221 | |
The Accompanying Footnotes are an Integral Part of these Financial Statements.
The Tocqueville International Value Fund
Schedule of Investments as of October 31, 2013
| | | | | | | | |
Short-Term Investment—4.4% | | Shares | | | Value | |
Money Market Fund—4.4% | | | | | | | | |
STIT-Treasury Portfolio, 0.02%(b) | | | 11,522,464 | | | $ | 11,522,464 | |
Total Short-Term Investment
(Cost $11,522,464) | | | | | | | 11,522,464 | |
Total Investments
(Cost $208,719,547)—99.2% | | | | 260,750,685 | |
Other Assets in Excess of Liabilities—0.8% | | | | 2,230,701 | |
Total Net Assets—100.0% | | | | | | $ | 262,981,386 | |
| | | | | | | | |
Percentages are stated as a percent of net assets.
ADR—American Depository Receipt
| (a) | Non-income producing security. |
| (b) | Rate listed is the 7-day effective yield. |
Schedule of Open Forward Currency Contracts
October 31, 2013
| | | | | | | | | | | | | | | | | | | | | | | | |
Counterparties of
Contracts | | Forward Expiration Date | | | Currency to be
Delivered | | | Currency to be
Received | | | Amount of
Currency to be
Delivered | | | Amount of
Currency to be
Received | | | Unrealized
Appreciation | |
U.S. Bank N.A. | | | 11/15/2013 | | | | Euro | | | | U.S. Dollars | | | | 9,750,000 | | | | 13,335,758 | | | $ | 97,191 | |
U.S. Bank N.A. | | | 11/15/2013 | | | | Yen | | | | U.S. Dollars | | | | 1,400,000,000 | | | | 14,301,329 | | | | 62,535 | |
| | | | | | | | | | | | | | | | | | | | | | | | |
| | | | | | | | | | | | | | | | | | | | | | $ | 159,726 | |
| | | | | | | | | | | | | | | | | | | | | | | | |
The Accompanying Footnotes are an Integral Part of these Financial Statements.
The Tocqueville Gold Fund
Schedule of Investments as of October 31, 2013
| | | | | | | | |
| Common Stocks—81.2% | | Shares | | | Value | |
Gold Related Securities—68.8% | |
Canada—55.9% | | | | | | | | |
Agnico Eagle Mines Ltd. | | | 893,000 | | | $ | 26,370,290 | |
Agnico Eagle Mines Ltd.(a) | | | 210,837 | | | | 6,260,503 | |
Alacer Gold Corp. | | | 2,626,800 | | | | 7,280,921 | |
Alamos Gold, Inc. | | | 2,596,400 | | | | 41,464,508 | |
Atac Resources Ltd.(b)(c) | | | 10,963,700 | | | | 7,781,266 | |
B2Gold Corp.(b) | | | 11,017,100 | | | | 27,212,237 | |
Banro Corp.(b) | | | 8,383,000 | | | | 6,952,022 | |
Barisan Gold Corp.(b) | | | 877,100 | | | | 75,710 | |
Braeval Mining Corp.(b) | | | 1,666,667 | | | | 107,898 | |
Brazilian Gold Corp.(b) | | | 1,176,700 | | | | 101,571 | |
Continental Gold Ltd.(b) | | | 1,569,900 | | | | 5,947,446 | |
Corvus Gold, Inc.(b)(c) | | | 2,079,901 | | | | 2,353,200 | |
Corvus Gold, Inc.(a)(b)(c) | | | 6,100,000 | | | | 6,962,068 | |
Dalradian Resources, Inc.(b) | | | 850,000 | | | | 611,423 | |
Detour Gold Corp.(b) | | | 3,704,200 | | | | 30,268,819 | |
East Asia Minerals Corp.(b)(c) | | | 10,544,400 | | | | 455,089 | |
Eldorado Gold Corp. | | | 8,189,885 | | | | 55,281,724 | |
Eldorado Gold Corp.(a) | | | 1,000,000 | | | | 6,742,435 | |
Franco-Nevada Corp. | | | 1,364,300 | | | | 61,381,397 | |
GoGold Resources, Inc.(b)(c) | | | 8,100,000 | | | | 7,768,666 | |
Goldcorp, Inc. | | | 518,050 | | | | 13,174,011 | |
Goldcorp, Inc.(a) | | | 2,138,010 | | | | 54,462,711 | |
IAMGOLD Corp. | | | 2,083,396 | | | | 10,625,320 | |
International Tower Hill Mines Ltd.(b)(c) | | | 5,738,836 | | | | 2,927,380 | |
International Tower Hill Mines Ltd.(a)(b)(c) | | | 7,589,744 | | | | 3,930,812 | |
New Gold, Inc.(b) | | | 5,931,640 | | | | 34,700,094 | |
Novagold Resources, Inc.(b) | | | 4,181,300 | | | | 9,073,421 | |
Osisko Mining Corp.(b) | | | 10,452,400 | | | | 51,026,439 | |
Pan American Silver Corp. | | | 2,248,098 | | | | 23,852,320 | |
Primero Mining Corp.(b)(c) | | | 4,840,700 | | | | 27,577,574 | |
Rockhaven Resources Ltd.(b)(c) | | | 5,000,000 | | | | 599,434 | |
Romarco Minerals, Inc.(b) | | | 10,887,800 | | | | 4,137,364 | |
SEMAFO, Inc. | | | 7,676,200 | | | | 20,917,645 | |
Silver Wheaton Corp. | | | 1,884,875 | | | | 42,730,116 | |
Strategic Metals Ltd.(b)(c) | | | 10,926,900 | | | | 3,772,776 | |
Sunward Resources Ltd.(b) | | | 660,800 | | | | 164,780 | |
Torex Gold Resources, Inc.(b)(c) | | | 25,260,500 | | | | 28,103,563 | |
Turquoise Hill Resources Ltd.(b) | | | 271,032 | | | | 1,306,374 | |
Turquoise Hill Resources Ltd.(a)(b) | | | 100,000 | | | | 482,425 | |
Yamana Gold, Inc. | | | 4,446,600 | | | | 44,154,738 | |
| | | | | | | | 679,098,490 | |
Peru—0.6% | | | | | | | | |
Cia de Minas Buenaventura SAA—ADR | | | 553,600 | | | | 8,027,200 | |
South Africa—1.1% | | | | | | | | |
Gold Fields Ltd.—ADR | | | 2,641,950 | | | | 12,152,970 | |
Gold Fields Ltd.(a) | | | 166,249 | | | | 780,010 | |
Harmony Gold Mining Co., Ltd. | | | 1 | | | | 3 | |
| | | | | | | | 12,932,983 | |
United Kingdom—4.0% | | | | | | | | |
Randgold Resources Ltd.—ADR | | | 652,900 | | | $ | 48,249,310 | |
United States—7.2% | | | | | | | | |
Electrum Ltd.(b)(d)(e)(f) (Originally acquired 12/21/07, Cost $13,065,361) | | | 2,127,287 | | | | 3,063,293 | |
Gold Resource Corp. | | | 1,017,847 | | | | 5,282,626 | |
Newmont Mining Corp. | | | 947,300 | | | | 25,823,398 | |
Royal Gold, Inc. | | | 1,118,965 | | | | 53,755,079 | |
| | | | | | | | 87,924,396 | |
Total Gold Related Securities | | | | | | | 836,232,379 | |
Other Precious Metals Related Securities—11.9% | |
Canada—10.1% | | | | | | | | |
Bear Creek Mining Corp.(b)(c) | | | 7,413,200 | | | | 18,485,896 | |
Ivanhoe Mines Ltd.—Class A(b) | | | 8,228,899 | | | | 20,598,884 | |
Ivanhoe Mines Ltd.—Class B(b)(d)(e)(f)(g) (Originally acquired 8/15/01, Cost $6,714,566) | | | 4,389,316 | | | | 10,438,123 | |
MAG Silver Corp.(b)(c) | | | 2,960,700 | | | | 16,875,990 | |
Plata Latina Minerals Corp.(b) | | | 2,000,000 | | | | 306,910 | |
Scorpio Mining Corp.(b)(c) | | | 25,668,419 | | | | 6,755,928 | |
Scorpio Mining Corp.(a)(b)(c) | | | 522,400 | | | | 137,784 | |
Silver Range Resources Ltd.(b)(c) | | | 3,450,000 | | | | 446,698 | |
Silvercrest Mines Inc.(b) | | | 755,600 | | | | 1,340,680 | |
Tahoe Resources, Inc.(b) | | | 2,474,100 | | | | 47,505,378 | |
| | | | | | | | 122,892,271 | |
United States—1.8% | | | | | | | | |
Stillwater Mining Co.(b) | | | 1,010,900 | | | | 11,028,919 | |
Sunshine Mining & Refining(b)(d)(e)(f) (Originally acquired 3/15/11, Cost $18,353,107) | | | 1,633,545 | | | | 10,536,366 | |
| | | | | | | | 21,565,285 | |
Total Other Precious Metals Related Securities | | | | | | | 144,457,556 | |
Other Securities—0.5% | | | | | | | | |
United States—0.5% | | | | | | | | |
Gold Bullion International LLC(b)(d)(e)(f) (Acquired 5/12/10, Cost $5,000,000) | | | 5,000,000 | | | | 5,837,000 | |
GoviEx Uranium Inc.(b)(d)(e)(f) (Acquired 10/01/07, Cost $3,428,821) | | | 1,750,000 | | | | 175,000 | |
I-Pulse, Inc.(b)(d)(e)(f) (Originally acquired 10/9/07, Cost $175,524) | | | 74,532 | | | | 237,757 | |
Total Other Securities | | | | | | | 6,249,757 | |
Total Common Stocks
(Cost $1,433,094,511) | | | | | | | 986,939,692 | |
The Accompanying Footnotes are an Integral Part of these Financial Statements.
The Tocqueville Gold Fund
Schedule of Investments as of October 31, 2013
| | | | | | | | |
Private Fund—1.5% | | Shares | | | Value | |
Gold Related Securities—1.5% | | | | | |
United States—1.5% | | | | | | | | |
Eidesis Special Opportunities II LP(b)(d)(e)(f) (Acquired 11/28/11, Cost $25,000,000) | | | 25,000 | | | $ | 18,033,715 | |
Total Private Fund
(Cost $25,000,000) | | | | | | | 18,033,715 | |
| Gold Bullion—10.9% | | | Ounces | | | | | |
Gold Bullion(b) | | | 99,643 | | | | 131,837,805 | |
Total Gold Bullion
(Cost $47,174,933) | | | | | | | 131,837,805 | |
Warrants—0.2% | | | | | | | | |
Gold Related Securities—0.2% | | | Shares | | | | | |
Canada—0.2% | | | | | | | | |
East Asia Minerals Corp. Expiration: 12/15/2013, Exercise Price: CAD $0.78(b)(c)(d)(e)(f) (Acquired 12/5/11, Cost $0) | | | 6,500,000 | | | | — | |
GoGold Resources, Inc.
Expiration: 01/24/2015, Exercise Price: CAD $1.50(b)(c)(d)(e)(f) (Acquired 5/9/12, Cost $0) | | | 4,050,000 | | | | 516,616 | |
Pan American Silver Corp. Expiration: 01/04/2015, Exercise Price: CAD $35.00(b)(d)(e)(f) (Acquired 4/14/10, Cost $0) | | | 133,333 | | | | 3,082 | |
Primero Mining Corp.
Expiration: 07/20/2015, Exercise Price: CAD $8.00(b)(c) | | | 1,848,400 | | | | 1,613,240 | |
Regulus Resources, Inc.
Expiration: 03/06/2014, Exercise Price: CAD $1.60(b)(d)(e)(f) (Acquired 5/23/12, Cost $0) | | | 1,304,500 | | | | — | |
| | | | | | | | 2,132,938 | |
Cayman Islands—0.0% | | | | | | | | |
Endeavour Mining Corp.
Expiration: 04/02/2014, Exercise Price: CAD $2.50(b) | | | 1,000,000 | | | | 7,193 | |
Total Gold Related Securities | | | | | | | 2,140,131 | |
Canada—0.0% | | | | | | | | |
Plata Latina Minerals Corp. Expiration: 02/12/2015, Exercise Price: CAD $0.65(b)(d)(e)(f) (Acquired 2/8/13, Cost $0) | | | 1,000,000 | | | $ | — | |
Total Other Precious Metals Related Securities | | | | | | | — | |
Total Warrants
(Cost $0) | | | | | | | 2,140,131 | |
Short-Term Investments—6.0% | | | | | |
Money Market Funds—6.0% | | | | | | | | |
First American Treasury Obligations Fund, 0.00%(h) | | | 16,461,332 | | | | 16,461,332 | |
STIT—Treasury Portfolio, 0.02%(h) | | | 56,766,158 | | | | 56,766,158 | |
Total Short-Term Investments (Cost $73,227,490) | | | | | | | 73,227,490 | |
Total Investments
(Cost $1,578,496,934)—99.8% | | | | 1,212,178,833 | |
Other Assets in Excess of Liabilities—0.2% | | | | 2,902,562 | |
Total Net Assets—100.0% | | | | | | $ | 1,215,081,395 | |
| | | | | | | | |
Precentages are stated as a percent of net assets.
ADR—American Depository Receipt
| (a) | Denotes an issue that is traded on a foreign exchange when a company is listed more than once. |
| (b) | Non-income producing security. |
| (c) | Affiliated company. See Footnote 8. |
| (d) | Denotes a security is either fully or partially restricted to resale. The aggregate value of restricted securities at October 31, 2013 was $48,840,952, which represented 4.0% of net assets. |
| (e) | Securities are fair value during procedures approved by the Board of Trustees. The aggregate value of fair valued securities as of October 31, 2013 was $48,840,952, which represented 4.0% of net assets. |
| (f) | Security is considered illiquid and may be difficult to sell. |
| (g) | Convertible into Ivanplats Ltd.—Class A shares. |
| (h) | Rate listed is the 7-day effective yield. |
The Accompanying Footnotes are an Integral Part of these Financial Statements.
The Delafield Fund
Schedule of Investments as of October 31, 2013
| | | | | | | | |
| Common Stocks—83.8% | | Shares | | | Value | |
Aerospace & Defense—2.7% | |
Honeywell International, Inc. | | | 550,000 | | | $ | 47,701,500 | |
Building Products—0.3% | |
Griffon Corp. | | | 400,000 | | | | 5,012,000 | |
Capital Markets—1.1% | |
The Bank of New York Mellon Corp. | | | 625,000 | | | | 19,875,000 | |
Chemicals—16.7% | | | | | | | | |
Ashland, Inc. | | | 325,000 | | | | 30,078,750 | |
Axiall Corp. | | | 225,000 | | | | 8,750,250 | |
Cabot Corp. | | | 850,000 | | | | 39,618,500 | |
Celanese Corp. | | | 350,000 | | | | 19,603,500 | |
Chemtura Corp.(a) | | | 1,000,000 | | | | 24,500,000 | |
Eastman Chemical Co. | | | 775,000 | | | | 61,062,250 | |
HB Fuller Co. | | | 425,000 | | | | 20,344,750 | |
LyondellBasell Industries NV(b) | | | 225,000 | | | | 16,785,000 | |
Minerals Technologies, Inc. | | | 570,000 | | | | 32,279,100 | |
PolyOne Corp. | | | 1,350,000 | | | | 40,905,000 | |
| | | | | | | | 293,927,100 | |
Commercial Services & Supplies—3.9% | |
ACCO Brands Corp.(a)(c) | | | 4,000,000 | | | | 23,400,000 | |
Avery Dennison Corp. | | | 750,000 | | | | 35,340,000 | |
Tyco International Ltd.(b) | | | 250,000 | | | | 9,137,500 | |
| | | | | | | | 67,877,500 | |
Communications Equipment—0.9% | |
Harris Corp. | | | 250,000 | | | | 15,490,000 | |
Computers & Peripherals—1.2% | | | | | |
Diebold, Inc. | | | 275,000 | | | | 8,239,000 | |
Hewlett-Packard Co. | | | 500,000 | | | | 12,185,000 | |
| | | | | | | | 20,424,000 | |
Construction & Engineering—0.3% | |
Aegion Corp.(a) | | | 299,900 | | | | 6,147,950 | |
Containers & Packaging—4.5% | | | | | | | | |
Owens-Illinois, Inc.(a) | | �� | 1,125,000 | | | | 35,763,750 | |
Sealed Air Corp. | | | 875,000 | | | | 26,407,500 | |
Sonoco Products Co. | | | 425,000 | | | | 17,272,000 | |
| | | | | | | | 79,443,250 | |
Electrical Equipment—2.6% | |
Acuity Brands, Inc. | | | 145,000 | | | | 14,573,950 | |
Brady Corp. | | | 575,000 | | | | 16,784,250 | |
Hubbell, Inc. | | | 135,000 | | | | 14,517,900 | |
| | | | | | | | 45,876,100 | |
Electronic Equipment, Instruments & Components—6.2% | |
Checkpoint Systems, Inc.(a) | | | 375,000 | | | | 6,382,500 | |
Flextronics International Ltd.(a)(b) | | | 4,250,000 | | | | 33,532,500 | |
Ingram Micro, Inc.(a) | | | 1,200,000 | | | | 27,804,000 | |
Kemet Corp.(a)(c) | | | 2,625,000 | | | | 14,883,750 | |
Plexus Corp.(a) | | | 675,000 | | | $ | 25,839,000 | |
| | | | | | | | 108,441,750 | |
Energy Equipment & Services—1.3% | |
Hercules Offshore, Inc.(a) | | | 1,500,000 | | | | 10,200,000 | |
McDermott International, Inc.(a)(b) | | | 1,850,000 | | | | 13,079,500 | |
| | | | | | | | 23,279,500 | |
Industrial Conglomerates—1.4% | |
Carlisle Cos., Inc. | | | 375,000 | | | | 27,255,000 | |
Insurance—1.3% | | | | | | | | |
XL Group PLC(b) | | | 725,000 | | | | 22,163,250 | |
Machinery—16.1% | | | | | | | | |
Albany International Corp. | | | 450,000 | | | | 16,564,500 | |
Crane Co. | | | 425,000 | | | | 26,987,500 | |
Dover Corp. | | | 750,000 | | | | 68,842,500 | |
Harsco Corp. | | | 700,000 | | | | 19,516,000 | |
IDEX Corp. | | | 275,000 | | | | 19,016,250 | |
Ingersoll-Rand PLC(b) | | | 250,000 | | | | 16,882,500 | |
Joy Global, Inc. | | | 175,000 | | | | 9,931,250 | |
Kennametal, Inc. | | | 975,000 | | | | 44,850,000 | |
Stanley Black & Decker, Inc. | | | 475,000 | | | | 37,567,750 | |
Timken Co. | | | 175,000 | | | | 9,241,750 | |
Titan International, Inc. | | | 500,000 | | | | 7,250,000 | |
Xerium Technologies, Inc.(a) | | | 600,000 | | | | 7,194,000 | |
| | | | | | | | 283,844,000 | |
Metals & Mining—6.3% | |
Allegheny Technologies, Inc. | | | 450,000 | | | | 14,895,000 | |
AM Castle & Co.(a) | | | 725,000 | | | | 10,374,750 | |
Carpenter Technology Corp. | | | 650,000 | | | | 38,564,500 | |
Horsehead Holding Corp.(a) | | | 1,185,000 | | | | 17,194,350 | |
Molycorp, Inc.(a) | | | 2,875,000 | | | | 14,576,250 | |
Universal Stainless & Alloy Products, Inc.(a)(c) | | | 451,000 | | | | 14,576,320 | |
| | | | | | | | 110,181,170 | |
Oil, Gas & Consumable Fuels—1.0% | |
CONSOL Energy, Inc. | | | 475,000 | | | | 17,337,500 | |
Professional Services—1.7% | | | | | | | | |
TrueBlue, Inc.(a) | | | 1,225,000 | | | | 30,257,500 | |
Semiconductors & Semiconductor Equipment—6.2% | |
Brooks Automation, Inc. | | | 1,000,000 | | | | 9,640,000 | |
Fairchild Semiconductor International, Inc.(a) | | | 3,250,000 | | | | 41,177,500 | |
Infineon Technologies AG(b) | | | 2,000,000 | | | | 19,358,868 | |
LTX-Credence Corp.(a)(c) | | | 2,000,000 | | | | 12,260,000 | |
Teradyne, Inc.(a) | | | 1,500,000 | | | | 26,235,000 | |
| | | | | | | | 108,671,368 | |
Specialty Retail—5.3% | |
Ascena Retail Group, Inc.(a) | | | 1,250,000 | | | | 24,737,500 | |
Staples, Inc. | | | 2,750,000 | | | | 44,330,000 | �� |
The Accompanying Footnotes are an Integral Part of these Financial Statements.
The Delafield Fund
Schedule of Investments as of October 31, 2013
| | | | | | | | |
| Common Stocks (continued) | | Shares | | | Value | |
The Finish Line, Inc. | | | 975,000 | | | $ | 24,414,000 | |
| | | | | | | | 93,481,500 | |
Trading Companies & Distributors—2.8% | |
Rush Enterprises, Inc.(a) | | | 500,000 | | | | 14,310,000 | |
WESCO International, Inc.(a) | | | 400,000 | | | | 34,184,000 | |
| | | | | | | | 48,494,000 | |
Total Common Stocks
(Cost $982,199,891) | | | | | | | 1,475,180,938 | |
Real Estate Investment Trust (REIT)—0.4% | |
| Real Estate—0.4% | | | | | | | | |
Kimco Realty Corp. | | | 300,000 | | | | 6,444,000 | |
Total Real Estate Investment Trust
(Cost $1,873,605) | | | | | | | 6,444,000 | |
| Corporate Bonds—2.7% | |
| Principal
Amount |
| | | | |
Commercial Banks—0.9% | |
BNP Paribas SA 1.144%, 01/10/2014(b)(d) | | $ | 10,000,000 | | | | 10,015,950 | |
Royal Bank of Canada 0.473%, 01/06/2015(b)(d) | | | 5,000,000 | | | | 5,011,895 | |
| | | | | | | | 15,027,845 | |
Diversified Financial Services—1.8% | |
Canadian Imperial Bank of Commerce 0.354%, 10/10/2014(d) | | | 5,000,000 | | | | 5,003,745 | |
General Electric Capital Corp. 0.623%, 01/09/2015(d) | | | 14,000,000 | | | | 14,053,564 | |
The Goldman Sachs Group, Inc.
1.238%, 02/07/2014(d) | | | 13,000,000 | | | | 13,025,922 | |
| | | | | | | | 32,083,231 | |
Total Corporate Bonds
(Cost $47,057,155) | | | | 47,111,076 | |
Money Market Fund—2.3% | |
STIT-Treasury
Portfolio, 0.02%(e) | | | 40,428,779 | | | $ | 40,428,779 | |
U.S. Treasury Bills—11.4% | |
| Principal
Amount |
| | | | |
0.020%, 11/21/2013(f) | | $ | 50,000,000 | | | | 49,999,457 | |
0.037%, 12/19/2013(f) | | | 75,000,000 | | | | 74,996,383 | |
0.010%, 01/16/2014(f) | | | 75,000,000 | | | | 74,996,026 | |
| | | | | | | | 199,991,866 | |
Total Short-Term Investments
(Cost $240,423,102) | | | | 240,420,645 | |
Total Investments
(Cost $1,271,553,753)—100.6% | | | | 1,769,156,659 | |
Liabilities in Excess of Other Assets—(0.6)% | | | | (9,815,384 | ) |
Total Net Assets—100.0% | | | | | | $ | 1,759,341,275 | |
| | | | | | | | |
Percentages are stated as a percent of net assets.
| (a) | Non-income producing security. |
| (b) | Foreign issued security. Foreign concentration was as follows: Bermuda 1.0%; Canada 0.3%; France 0.6%; Germany 1.1%; Ireland 1.3%; Netherlands 1.0%; Panama 0.7%; Singapore 1.9%; Switzerland 0.5%. |
| (c) | Affiliated company. See Footnote 8. |
| (d) | Variable rate security. The rate listed is as of 10/31/2013. |
| (e) | Rate listed is the 7-day effective yield. |
| (f) | Rate listed is the effective yield based on purchased price. The calculation assumes the security is held to maturity. |
The Accompanying Footnotes are an Integral Part of these Financial Statements.
The Tocqueville Select Fund
Schedule of Investments as of October 31, 2013
| | | | | | | | |
| Common Stocks—84.3% | | Shares | | | Value | |
Chemicals—9.0% | | | | | |
Ashland, Inc. | | | 33,600 | | | $ | 3,109,680 | |
Celanese Corp. | | | 43,000 | | | | 2,408,430 | |
Minerals Technologies, Inc. | | | 61,000 | | | | 3,454,430 | |
| | | | | 8,972,540 | |
Commercial Services & Supplies—6.3% | | | | | |
ACCO Brands Corp.(a)(b) | | | 524,500 | | | | 3,068,325 | |
Avery Dennison Corp. | | | 67,600 | | | | 3,185,312 | |
| | | | | 6,253,637 | |
Containers & Packaging—6.5% | | | | | |
Owens-Illinois, Inc.(a) | | | 107,000 | | | | 3,401,530 | |
Sonoco Products Co. | | | 77,400 | | | | 3,145,536 | |
| | | | | | | | 6,547,066 | |
Electrical Equipment—2.5% | | | | | | | | |
Acuity Brands, Inc. | | | 25,300 | | | | 2,542,903 | |
Electronic Equipment, Instruments & Components—5.6% | |
Checkpoint Systems, Inc.(a) | | | 109,000 | | | | 1,855,180 | |
Flextronics International Ltd.(a)(c) | | | 472,200 | | | | 3,725,658 | |
| | | | | | | | 5,580,838 | |
Energy Equipment & Services—1.9% | | | | | |
McDermott International, Inc.(a)(c) | | | 275,000 | | | | 1,944,250 | |
Household Durables—4.5% | | | | | |
Universal Electronics, Inc.(a) | | | 114,292 | | | | 4,447,102 | |
Industrial Conglomerates—2.4% | |
Carlisle Cos., Inc. | | | 33,500 | | | | 2,434,780 | |
Internet Software & Services—3.4% | |
j2 Global, Inc. | | | 61,400 | | | | 3,375,772 | |
IT Services—3.3% | |
EPAM Systems, Inc.(a) | | | 87,000 | | | | 3,259,890 | |
Leisure Equipment & Products—2.3% | |
Summer Infant, Inc.(a)(b) | | | 814,933 | | | | 2,314,410 | |
Machinery—12.0% | |
Albany International Corp. | | | 54,500 | | | | 2,006,145 | |
Kennametal, Inc. | | | 96,000 | | | | 4,416,000 | |
Stanley Black & Decker, Inc. | | | 39,900 | | | | 3,155,691 | |
Xerium Technologies, Inc.(a) | | | 200,000 | | | | 2,398,000 | |
| | | | | | | | 11,975,836 | |
Metals & Mining—3.6% | |
Carpenter Technology Corp. | | | 60,000 | | | | 3,559,800 | |
Professional Services—8.9% | |
RPX Corp.(a) | | | 205,000 | | | | 3,661,300 | |
Stantec, Inc.(c) | | | 87,600 | | | | 5,206,068 | |
| | | | | | | | 8,867,368 | |
Semiconductors & Semiconductor Equipment—3.4% | |
Fairchild Semiconductor International, Inc.(a) | | | 265,500 | | | | 3,363,885 | |
Software—1.4% | | | | | |
Monotype Imaging Holdings, Inc. | | | 51,500 | | | $ | 1,453,330 | |
Specialty Retail—7.3% | | | | | |
Ascena Retail Group, Inc.(a) | | | 168,000 | | | | 3,324,720 | |
Staples, Inc. | | | 247,000 | | | | 3,981,640 | |
| | | | | | | | 7,306,360 | |
Total Common Stocks
(Cost $58,771,311) | | | | | | | 84,199,767 | |
Short-Term Investments—16.0% | | | | | |
Money Market Funds—6.9% | | | | | |
First American Treasury Obligations Fund, 0.00%(d) | | | 2,272,358 | | | | 2,272,358 | |
STIT-Treasury Portfolio, 0.02%(d) | | | 4,623,372 | | | | 4,623,371 | |
| | | | | | | | 6,895,729 | |
| U.S. Treasury Bills—9.1% | |
| Principal
Amount |
| | | | |
0.034%, 11/07/2013(e) | | $ | 500,000 | | | | 499,997 | |
0.009%, 11/21/2013(e) | | | 2,000,000 | | | | 1,999,990 | |
0.023%, 12/05/2013(e) | | | 2,000,000 | | | | 1,999,957 | |
0.050%, 12/19/2013(e) | | | 1,600,000 | | | | 1,599,895 | |
0.012%, 01/09/2014(e) | | | 2,000,000 | | | | 1,999,900 | |
(0.015)%, 01/16/2014(e) | | | 1,000,000 | | | | 999,947 | |
| | | | | | | | 9,099,686 | |
Total Short-Term Investments
(Cost $15,995,553) | | | | 15,995,415 | |
Total Investments
(Cost $74,766,864)—100.3% | | | | | | | 100,195,182 | |
Liabilities in Excess of Other Assets—(0.3)% | | | | (307,574 | ) |
Total Net Assets—100.0% | | | | | | $ | 99,887,608 | |
| | | | | | | | |
Percentages are stated as a percent of net assets.
| (a) | Non-income producing security. |
| (b) | Affiliated company. See Footnote 8. |
| (c) | Foreign issued security. Foreign concentration was as follows: Canada 5.2%; Panama 1.9%; Singapore 3.7%. |
| (d) | Rate listed is the 7-day effective yield. |
| (e) | Rate listed is the effective yield based on purchase price. The calculation assumes the secuirty is held to maturity. |
The Accompanying Footnotes are an Integral Part of these Financial Statements.
Percent of Total Investments
The Tocqueville Fund
Allocation of Portfolio Holdings
October 31, 2013
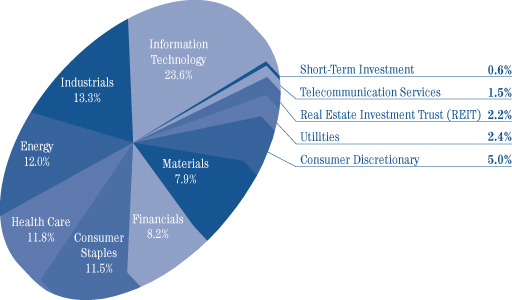
The Tocqueville Opportunity Fund
Allocation of Portfolio Holdings
October 31, 2013
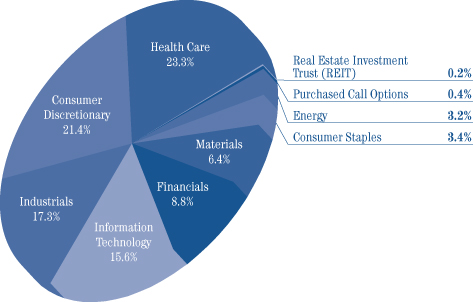
Percent of Total Investments
The Tocqueville International Value Fund
Allocation of Portfolio Holdings
October 31, 2013
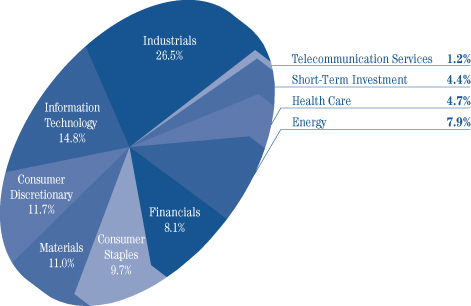
The Tocqueville Gold Fund
Allocation of Portfolio Holdings
October 31, 2013
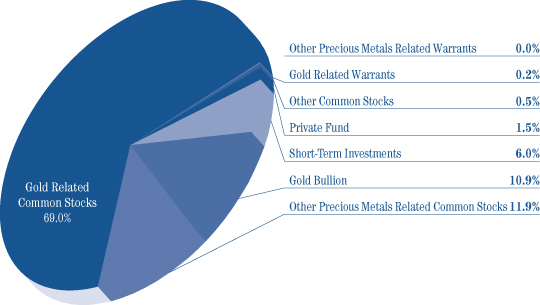
Percent of Total Investments
The Delafield Fund
Allocation of Portfolio Holdings
October 31, 2013
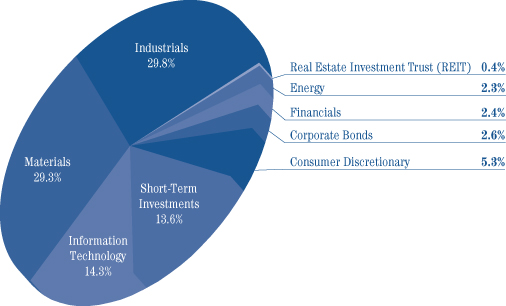
The Tocqueville Select Fund
Allocation of Portfolio Holdings
October 31, 2013
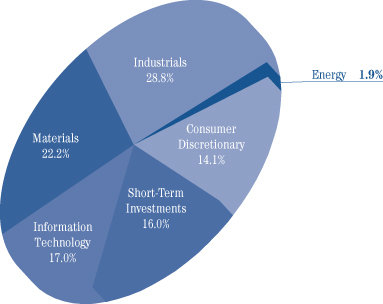
The Tocqueville Trust
Statements of Assets & Liabilities
October 31, 2013
| | | | | | | | | | | | | | | | | | | | | | | | |
| | | The
Tocqueville
Fund | | | The
Tocqueville
Opportunity
Fund | | | The
Tocqueville
International
Value Fund | | | The
Tocqueville
Gold Fund | | | The
Delafield
Fund | | | The
Tocqueville
Select Fund | |
Assets: | | | | | | | | | | | | | | | | | | | | | | | | |
Investments, at value (1) | | | | | | | | | | | | | | | | | | | | | | | | |
Unaffiliated issuers | | $ | 346,109,256 | | | $ | 80,659,800 | | | $ | 260,750,685 | | | $ | 1,035,042,526 | | | $ | 1,667,396,589 | | | $ | 92,957,267 | |
Affiliated issuers | | | — | | | | — | | | | — | | | | 177,136,307 | | | | 101,760,070 | | | | 7,237,915 | |
Foreign currencies, at value (2) | | | — | | | | — | | | | 832,411 | | | | 134,362 | | | | — | | | | — | |
Cash | | | — | | | | — | | | | — | | | | 290,273 | | | | — | | | | — | |
Unrealized appreciation on forward foreign currency contracts | | | — | | | | — | | | | 159,726 | | | | — | | | | — | | | | — | |
Receivable for investments sold | | | 2,171,692 | | | | 596,168 | | | | 1,670,395 | | | | — | | | | 2,262,543 | | | | — | |
Receivable for foreign currencies sold | | | — | | | | — | | | | 1,420 | | | | — | | | | — | | | | — | |
Receivable for fund shares sold | | | 177,677 | | | | 19,801 | | | | 590,073 | | | | 5,828,443 | | | | 975,512 | | | | 90,024 | |
Dividends, interest and other receivables | | | 328,669 | | | | 10,167 | | | | 1,434,465 | | | | 934 | | | | 601,654 | | | | 21,904 | |
Prepaid assets | | | 17,366 | | | | 11,638 | | | | 14,025 | | | | 45,324 | | | | 43,418 | | | | 11,819 | |
Return of capital receivable | | | — | | | | 7,061 | | | | — | | | | — | | | | — | | | | — | |
| | | | | | | | | | | | | | | | | | | | | | | | |
Total Assets | | | 348,804,660 | | | | 81,304,635 | | | | 265,453,200 | | | | 1,218,478,169 | | | | 1,773,039,786 | | | | 100,318,929 | |
| | | | | | | | | | | | | | | | | | | | | | | | |
Liabilities: | | | | | | | | | | | | | | | | | | | | | | | | |
Payable for investments purchased | | | — | | | | 517,830 | | | | 2,005,178 | | | | — | | | | 9,282,614 | | | | 306,193 | |
Payable for loans outstanding | | | — | | | | 13,000 | | | | — | | | | — | | | | — | | | | — | |
Due to Custodian | | | — | | | | 47,637 | | | | — | | | | — | | | | — | | | | — | |
Payable for fund shares redeemed | | | 123,546 | | | | 17,912 | | | | 181,039 | | | | 1,760,892 | | | | 2,567,887 | | | | 4,150 | |
Payable to Adviser | | | 215,403 | | | | 51,088 | | | | 147,956 | | | | 847,531 | | | | 1,040,990 | | | | 66,985 | |
Payable to Administrator | | | 48,963 | | | | 11,335 | | | | 34,428 | | | | 162,153 | | | | 259,546 | | | | 14,585 | |
Payable to Trustees | | | 12,784 | | | | 3,109 | | | | 7,539 | | | | 76,070 | | | | 50,532 | | | | 2,936 | |
Payable to Chief Compliance Officer | | | 1,177 | | | | 279 | | | | 842 | | | | 4,301 | | | | 5,965 | | | | 324 | |
Accrued distribution fee | | | 46,892 | | | | 14,358 | | | | 33,610 | | | | 40,392 | | | | 128,295 | | | | 12,222 | |
Accrued expenses and other liabilities | | | 86,798 | | | | 19,117 | | | | 61,222 | | | | 505,435 | | | | 362,682 | | | | 23,926 | |
| | | | | | | | | | | | | | | | | | | | | | | | |
Total Liabilities | | | 535,563 | | | | 695,665 | | | | 2,471,814 | | | | 3,396,774 | | | | 13,698,511 | | | | 431,321 | |
| | | | | | | | | | | | | | | | | | | | | | | | |
Net Assets | | $ | 348,269,097 | | | $ | 80,608,970 | | | $ | 262,981,386 | | | $ | 1,215,081,395 | | | $ | 1,759,341,275 | | | $ | 99,887,608 | |
| | | | | | | | | | | | | | | | | | | | | | | | |
Net assets consist of: | | | | | | | | | | | | | | | | | | | | | | | | |
Paid in capital | | $ | 232,672,972 | | | $ | 55,957,494 | | | $ | 213,248,951 | | | $ | 1,629,467,294 | | | $ | 1,200,701,250 | | | $ | 65,143,700 | |
Accumulated net investment income (loss) | | | 2,824,529 | | | | (427,298 | ) | | | 3,131,775 | | | | (42,539,011 | ) | | | — | | | | (387,335 | ) |
Accumulated net realized gain (loss) | | | 2,674,292 | | | | 4,048,496 | | | | (5,584,044 | ) | | | (5,528,133 | ) | | | 61,037,119 | | | | 9,702,925 | |
Net unrealized appreciation (depreciation) on: | | | | | | | | | | | | | | | | | | | | | | | | |
Investments and foreign currency related items | | | 110,097,304 | | | | 21,030,278 | | | | 52,184,704 | | | | (366,318,755 | ) | | | 497,602,906 | | | | 25,428,318 | |
| | | | | | | | | | | | | | | | | | | | | | | | |
Net assets | | $ | 348,269,097 | | | $ | 80,608,970 | | | $ | 262,981,386 | | | $ | 1,215,081,395 | | | $ | 1,759,341,275 | | | $ | 99,887,608 | |
| | | | | | | | | | | | | | | | | | | | | | | | |
Shares of beneficial interest outstanding (unlimited shares of $0.01 par value autorized) | | | 11,354,002 | | | | 3,786,932 | | | | 17,874,136 | | | | 31,967,230 | | | | 47,382,206 | | | | 6,417,324 | |
Net asset value, offering and redemption price per share | | $ | 30.67 | | | $ | 21.29 | | | $ | 14.71 | | | $ | 38.01 | | | $ | 37.13 | | | $ | 15.57 | |
| | | | | | | | | | | | | | | | | | | | | | | | |
(1) Cost of investments | | | | | | | | | | | | | | | | | | | | | | | | |
Unafilliated issuers | | $ | 236,011,952 | | | $ | 59,629,539 | | | $ | 208,719,547 | | | $ | 1,200,250,612 | | | $ | 1,179,460,692 | | | $ | 65,780,188 | |
Affiliated issuers | | $ | — | | | $ | — | | | $ | — | | | $ | 378,246,322 | | | $ | 92,093,061 | | | $ | 8,986,676 | |
(2) Cost of foreign currencies | | $ | — | | | $ | — | | | $ | 843,038 | | | $ | 135,016 | | | $ | — | | | $ | — | |
The Accompanying Notes are an Integral Part of these Financial Statements.
The Tocqueville Trust
Statements of Operations
For the Year Ended October 31, 2013
| | | | | | | | | | | | | | | | | | | | | | | | |
| | | The
Tocqueville
Fund | | | The
Tocqueville
Opportunity
Fund | | | The
Tocqueville
International
Value Fund | | | The
Tocqueville
Gold Fund | | | The
Delafield
Fund | | | The
Tocqueville
Select Fund | |
Investment Income: | | | | | | | | | | | | | | | | | | | | | | | | |
Dividends* | | | | | | | | | | | | | | | | | | | | | | | | |
Unaffiliated issuers | | | 9,237,461 | | | | 473,332 | | | | 7,313,656 | | | | 13,038,421 | | | | 16,292,913 | | | | 850,584 | |
Affiliated issuers | | | — | | | | — | | | | — | | | | 1,733,628 | | | | — | | | | — | |
Interest | | | 181 | | | | 13 | | | | 1,993 | | | | 5,719 | | | | 348,795 | | | | 3,717 | |
| | | | | | | | | | | | | | | | | | | | | | | | |
Total investment income | | | 9,237,642 | | | | 473,345 | | | | 7,315,649 | | | | 14,777,768 | | | | 16,641,708 | | | | 854,301 | |
| | | | | | | | | | | | | | | | | | | | | | | | |
Expenses: | | | | | | | | | | | | | | | | | | | | | | | | |
Investment Adviser’s fee (See Note 4) | | | 2,664,001 | | | | 538,378 | | | | 2,363,487 | | | | 12,558,849 | | | | 11,105,354 | | | | 717,707 | |
Distribution fees (See Note 4) | | | 888,000 | | | | 179,460 | | | | 590,872 | | | | 3,964,942 | | | | 3,934,752 | | | | 224,283 | |
Administration fees (See Note 4) | | | 532,800 | | | | 107,676 | | | | 354,523 | | | | 2,378,965 | | | | 2,360,851 | | | | 134,570 | |
Transfer agent and shareholder services fees | | | 185,126 | | | | 18,158 | | | | 81,913 | | | | 1,169,192 | | | | 722,330 | | | | 45,098 | |
Trustee fees and expenses | | | 48,203 | | | | 10,903 | | | | 32,424 | | | | 220,224 | | | | 220,737 | | | | 12,572 | |
Printing and mailing expense | | | 39,560 | | | | 7,713 | | | | 29,140 | | | | 205,907 | | | | 200,242 | | | | 9,606 | |
Other expenses (See Note 10) | | | 39,387 | | | | 6,258 | | | | 29,728 | | | | 90,041 | | | | 61,339 | | | | 4,711 | |
Professional fees | | | 36,617 | | | | 9,296 | | | | 27,240 | | | | 173,575 | | | | 167,925 | | | | 10,391 | |
Registration fees | | | 34,912 | | | | 22,377 | | | | 28,202 | | | | 120,907 | | | | 75,061 | | | | 26,068 | |
Fund accounting fees | | | 29,652 | | | | 20,617 | | | | 44,287 | | | | 126,442 | | | | 124,176 | | | | 8,670 | |
Custody fees | | | 18,576 | | | | 12,382 | | | | 67,097 | | | | 261,803 | | | | 100,110 | | | | 6,732 | |
Insurance expense | | | 9,705 | | | | 1,625 | | | | 5,249 | | | | 47,670 | | | | 31,328 | | | | 2,329 | |
| | | | | | | | | | | | | | | | | | | | | | | | |
Total expenses before waiver | | | 4,526,539 | | | | 934,843 | | | | 3,654,162 | | | | 21,318,517 | | | | 19,104,205 | | | | 1,202,737 | |
Less: Fees waived (See Note 4) | | | (67,616 | ) | | | — | | | | (588,968 | ) | | | — | | | | — | | | | — | |
| | | | | | | | | | | | | | | | | | | | | | | | |
Net expenses | | | 4,458,923 | | | | 934,843 | | | | 3,065,194 | | | | 21,318,517 | | | | 19,104,205 | | | | 1,202,737 | |
| | | | | | | | | | | | | | | | | | | | | | | | |
Net Investment Income (Loss) | | | 4,778,719 | | | | (461,498 | ) | | | 4,250,455 | | | | (6,540,749 | ) | | | (2,462,497 | ) | | | (348,436 | ) |
| | | | | | | | | | | | | | | | | | | | | | | | |
Realized and Unrealized Gain (Loss): | | | | | | | | | | | | | | | | | | | | | | | | |
Net realized gain (loss) on: | | | | | | | | | | | | | | | | | | | | | | | | |
Investments | | | | | | | | | | | | | | | | | | | | | | | | |
Unaffiliated issuers | | | 26,838,249 | | | | 9,383,419 | | | | 10,948,629 | | | | 540,155 | | | | 78,028,051 | | | | 11,106,030 | |
Affililiated issuers | | | — | | | | — | | | | — | | | | (25,249 | ) | | | (6,603,215 | ) | | | 4,127 | |
Forward currency contracts | | | — | | | | — | | | | (1,099,784 | ) | | | — | | | | — | | | | — | |
Foreign currency translation | | | (35 | ) | | | (2,877 | ) | | | 498,774 | | | | (126,119 | ) | | | (1,932 | ) | | | 78 | |
| | | | | | | | | | | | | | | | | | | | | | | | |
| | | 26,838,214 | | | | 9,380,542 | | | | 10,347,619 | | | | 388,787 | | | | 71,422,904 | | | | 11,110,235 | |
Net change in unrealized appreciation (depreciation) on: | | | | | | | | | | | | | | | | | | | | | | | | |
Investments | | | 58,949,325 | | | | 12,721,845 | | | | 49,286,882 | | | | (1,078,473,643 | ) | | | 356,476,015 | | | | 21,132,838 | |
Forward currency contracts | | | — | | | | — | | | | (21,005 | ) | | | — | | | | — | | | | — | |
Foreign currency translation | | | — | | | | 12,731 | | | | (5,797,629 | ) | | | (21,106,029 | ) | | | 675,654 | | | | — | |
| | | | | | | | | | | | | | | | | | | | | | | | |
| | | 58,949,325 | | | | 12,734,576 | | | | 43,468,248 | | | | (1,099,579,672 | ) | | | 357,151,669 | | | | 21,132,838 | |
Net gain (loss) on investments and foreign currency | | | 85,787,539 | | | | 22,115,118 | | | | 53,815,867 | | | | (1,099,190,885 | ) | | | 428,574,573 | | | | 32,243,073 | |
| | | | | | | | | | | | | | | | | | | | | | | | |
Net Increase (Decrease) in Net Assets Resulting from Operations | | $ | 90,566,258 | | | $ | 21,653,620 | | | $ | 58,066,322 | | | $ | (1,105,731,634 | ) | | $ | 426,112,076 | | | $ | 31,894,637 | |
| | | | | | | | | | | | | | | | | | | | | | | | |
* Net of foreign taxes withheld of: | | $ | 32,788 | | | $ | 3,404 | | | $ | 779,357 | | | $ | 1,660,815 | | | $ | 5,625 | | | $ | 8,491 | |
| | | | | | | | | | | | | | | | | | | | | | | | |
The Accompanying Notes are an Integral Part of these Financial Statements.
The Tocqueville Trust
Statements of Changes in Net Assets
| | | | | | | | | | | | | | | | |
| | | The Tocqueville Fund | | | The Tocqueville
Opportunity Fund | |
| | | For the
Year Ended
October 31,
2013 | | | For the
Year Ended
October 31,
2012 | | | For the
Year Ended
October 31,
2013 | | | For the
Year Ended
October 31,
2012 | |
Operations: | | | | | | | | | | | | | | | | |
Net investment income (loss) | | $ | 4,778,719 | | | $ | 5,182,520 | | | $ | (461,498 | ) | | $ | (476,649 | ) |
Net realized gain (loss) on sale of investments and foreign currency | | | 26,838,214 | | | | 7,286,414 | | | | 9,380,542 | | | | (3,282 | ) |
Net change in unrealized appreciation (depreciation) | | | 58,949,325 | | | | 21,609,077 | | | | 12,734,576 | | | | 2,048,387 | |
| | | | | | | | | | | | | | | | |
Net increase (decrease) in net assets resulting from operations | | | 90,566,258 | | | | 34,078,011 | | | | 21,653,620 | | | | 1,568,456 | |
| | | | | | | | | | | | | | | | |
Dividends and distributions to shareholders: | | | | | | | | | | | | | | | | |
Net investment income | | | (5,030,132 | ) | | | (5,526,502 | ) | | | — | | | | — | |
Net realized gains | | | — | | | | — | | | | — | | | | — | |
| | | | | | | | | | | | | | | | |
Total dividends and distributions | | | (5,030,132 | ) | | | (5,526,502 | ) | | | — | | | | — | |
Fund share transactions: | | | | | | | | | | | | | | | | |
Shares sold | | | 29,776,783 | | | | 56,283,828 | | | | 4,767,903 | | | | 29,832,239 | |
Shares issued to holders in reinvestment of dividends | | | 4,132,373 | | | | 4,694,231 | | | | — | | | | — | |
Shares redeemed* | | | (137,200,773 | ) | | | (215,046,320 | ) | | | (11,267,163 | ) | | | (12,908,921 | ) |
| | | | | | | | | | | | | | | | |
Net increase (decrease) | | | (103,291,617 | ) | | | (154,068,261 | ) | | | (6,499,260 | ) | | | 16,923,318 | |
| | | | | | | | | | | | | | | | |
Net increase (decrease) in net assets | | | (17,755,491 | ) | | | (125,516,752 | ) | | | 15,154,360 | | | | 18,491,774 | |
Net Assets: | | | | | | | | | | | | | | | | |
Beginning of period | | | 366,024,588 | | | | 491,541,340 | | | | 65,454,610 | | | | 46,962,836 | |
| | | | | | | | | | | | | | | | |
End of period** | | $ | 348,269,097 | | | $ | 366,024,588 | | | $ | 80,608,970 | | | $ | 65,454,610 | |
| | | | | | | | | | | | | | | | |
* Net of redemption fees of: | | $ | 22,305 | | | $ | 27,989 | | | $ | 931 | | | $ | 15,791 | |
| | | | | | | | | | | | | | | | |
** Including undistributed net investment income (loss) of: | | $ | 2,824,529 | | | $ | 3,422,977 | | | $ | (427,298 | ) | | $ | (413,759 | ) |
| | | | | | | | | | | | | | | | |
The Accompanying Notes are an Integral Part of these Financial Statements.
The Tocqueville Trust
Statements of Changes in Net Assets
| | | | | | | | | | | | | | | | | | | | | | | | | | | | | | |
The Tocqueville
International Value Fund | | | The Tocqueville Gold Fund | | | The Delafield Fund | | | The Tocqueville
Select Fund | |
For the
Year Ended
October 31,
2013 | | | For the
Year Ended
October 31,
2012 | | | For the
Year Ended
October 31,
2013 | | | For the
Year Ended
October 31,
2012 | | | For the
Year Ended
October 31,
2013 | | | For the
Year Ended
October 31,
2012 | | | For the
Year Ended
October 31,
2013 | | | For the
Year Ended
October 31,
2012 | |
| | | | | | | | | | | | | | | | | | | | | | | | | | | | | | |
| $ | 4,250,455 | | | $ | 3,195,774 | | | $ | (6,540,749 | ) | | $ | (12,910,775 | ) | | $ | (2,462,497 | ) | | $ | (1,702,775 | ) | | $ | (348,436 | ) | | $ | (310,262 | ) |
| 10,347,619 | | | | (8,353,588 | ) | | | 388,787 | | | | 47,601,049 | | | | 71,422,904 | | | | 80,464,787 | | | | 11,110,235 | | | | 3,393,207 | |
| | 43,468,248 | | | | 1,130,171 | | | | (1,099,579,672 | ) | | | (283,854,786 | ) | | | 357,151,669 | | | | 51,265,070 | | | | 21,132,838 | | | | (456,174 | ) |
| | | | | | | | | | | | | | | | | | | | | | | | | | | | | | |
| 58,066,322 | | | | (4,027,643 | ) | | | (1,105,731,634 | ) | | | (249,164,512 | ) | | | 426,112,076 | | | | 130,027,082 | | | | 31,894,637 | | | | 2,626,771 | |
| | | | | | | | | | | | | | | | | | | | | | | | | | | | | | |
| | | | | | | | | | | | | | | | | | | | | | | | | | | | | | |
| | (3,270,330 | ) | | | (2,105,224 | ) | | | — | | | | — | | | | — | | | | — | | | | — | | | | — | |
| | — | | | | — | | | | (53,161,749 | ) | | | (42,282,689 | ) | | | (80,537,788 | ) | | | (16,542,579 | ) | | | (3,451,599 | ) | | | (766,158 | ) |
| | | | | | | | | | | | | | | | | | | | | | | | | | | | | | |
| | (3,270,330 | ) | | | (2,105,224 | ) | | | (53,161,749 | ) | | | (42,282,689 | ) | | | (80,537,788 | ) | | | (16,542,579 | ) | | | (3,451,599 | ) | | | (766,158 | ) |
| | | | | | | | | | | | | | | | | | | | | | | | | | | | | | |
| | 41,933,095 | | | | 70,782,405 | | | | 689,958,884 | | | | 768,183,795 | | | | 424,376,572 | | | | 362,662,133 | | | | 13,020,097 | | | | 30,896,673 | |
| | 2,452,030 | | | | 1,547,905 | | | | 48,734,410 | | | | 39,153,702 | | | | 75,042,452 | | | | 15,316,165 | | | | 3,271,889 | | | | 675,793 | |
| | (54,992,275 | ) | | | (47,252,825 | ) | | | (810,631,326 | ) | | | (717,055,407 | ) | | | (431,925,473 | ) | | | (408,065,143 | ) | | | (29,395,929 | ) | | | (20,438,315 | ) |
| | | | | | | | | | | | | | | | | | | | | | | | | | | | | | |
| | (10,607,150 | ) | | | 25,077,485 | | | | (71,938,032 | ) | | | 90,282,090 | | | | 67,493,551 | | | | (30,086,845 | ) | | | (13,103,943 | ) | | | 11,134,151 | |
| | | | | | | | | | | | | | | | | | | | | | | | | | | | | | |
| | 44,188,842 | | | | 18,944,618 | | | | (1,230,831,415 | ) | | | (201,165,111 | ) | | | 413,067,839 | | | | 83,397,658 | | | | 15,339,095 | | | | 12,994,764 | |
| | | | | | | | | | | | | | | | | | | | | | | | | | | | | | |
| | 218,792,544 | | | | 199,847,926 | | | | 2,445,912,810 | | | | 2,647,077,921 | | | | 1,346,273,436 | | | | 1,262,875,778 | | | | 84,548,513 | | | | 71,553,749 | |
| | | | | | | | | | | | | | | | | | | | | | | | | | | | | | |
| $ | 262,981,386 | | | $ | 218,792,544 | | | $ | 1,215,081,395 | | | $ | 2,445,912,810 | | | $ | 1,759,341,275 | | | $ | 1,346,273,436 | | | $ | 99,887,608 | | | $ | 84,548,513 | |
| | | | | | | | | | | | | | | | | | | | | | | | | | | | | | |
| $ | 16,794 | | | $ | 27,394 | | | $ | 714,261 | | | $ | 698,471 | | | $ | 103,101 | | | $ | 155,189 | | | $ | 2,935 | | | $ | 15,430 | |
| | | | | | | | | | | | | | | | | | | | | | | | | | | | | | |
| $ | 3,131,775 | | | $ | 2,440,944 | | | $ | (42,539,011 | ) | | $ | (38,731,318 | ) | | $ | — | | | $ | (1,480,317 | ) | | $ | (387,335 | ) | | $ | (282,004 | ) |
| | | | | | | | | | | | | | | | | | | | | | | | | | | | | | |
The Accompanying Notes are an Integral Part of these Financial Statements.
The Tocqueville Trust
The Tocqueville Fund
The Tocqueville Opportunity Fund
The Tocqueville International Value Fund
The Tocqueville Gold Fund
The Delafield Fund
The Tocqueville Select Fund
Notes to Financial Statements
1. ORGANIZATION
The Tocqueville Trust (the “Trust”) is a Massachusetts business trust registered under the Investment Company Act of 1940 and organized on September 17, 1986, currently consisting of six separate funds (each, a “Fund” or, collectively, the “Funds”). Each Fund is an open-end management investment company with a different investment objective. The Tocqueville Fund, The Tocqueville Opportunity Fund (the “Opportunity Fund”), The Tocqueville International Value Fund (the “International Fund”), and The Delafield Fund are classified as diversified investment companies. The Tocqueville Gold Fund (the “Gold Fund”) and The Tocqueville Select Fund (the “Select Fund”) are classified as non-diversified investment companies. The Tocqueville Fund’s investment objective is long-term capital appreciation which it seeks to achieve by investing primarily in securities of United States issuers. The Opportunity Fund’s investment objective is to achieve long-term capital appreciation which it seeks to achieve by investing in the common stocks of small and mid cap companies which have the potential to deliver superior long term earnings growth. The International Fund’s investment objective is long-term capital appreciation consistent with preservation of capital which it seeks to achieve by investing primarily in securities of non-U.S. issuers. The Gold Fund’s investment objective is long-term capital appreciation which it seeks to achieve by investing in gold, securities of companies located throughout the world that are engaged in mining or processing gold (“gold related securities”), other precious metals and securities of companies located throughout the world that are engaged in mining or processing such other precious metals (“other precious metal securities”). The Delafield Fund’s investment objectives are to seek long-term preservation of capital (sufficient growth to outpace inflation over an extended period of time) and growth of capital which it seeks to achieve by investing primarily in the equity securities of domestic companies. The Tocqueville Select Fund’s investment objective is to achieve long-term capital appreciation by investing in a focused group of common stocks issued primarily by small and mid-sized U.S. companies. Current income is a secondary objective for The Tocqueville Select Fund.
On June 22, 2009, the Board of Directors of Delafield Fund, Inc. approved an Agreement and Plan of Reorganization providing for, among other things, the transfer of the assets and liabilities of Delafield Fund, Inc. into The Delafield Fund, a series of The Tocqueville Trust. On September 24, 2009, the shareholders of Delafield Fund, Inc. approved the Agreement and Plan of Reorganization. On July 9, 2009, the Board of Trustees of Delafield Select Fund, a series of Natixis Funds Trust II, approved an Agreement and Plan of Reorganization providing for, among other things, the transfer of the assets and liabilities of Delafield Select Fund into the sole share class of The Select Fund (now The Tocqueville Select Fund), a series of The Tocqueville Trust. On September 24, 2009, the shareholders of Delafield Select Fund approved the Agreement and Plan of Reorganization. The effective date of both reorganizations was September 28, 2009. Transfers into The Delafield Fund and The Select Fund from their predecessor funds amounted to $649,892,191 and $25,888,388, respectively.
The Delafield Fund, a series of the Trust, commenced operations on September 28, 2009 as successor to Delafield Fund, Inc. The predecessor Delafield Fund, Inc. commenced operations on November 19, 1993.
The Tocqueville Select Fund, a series of the Trust, commenced operations on September 28, 2009 as successor to the Delafield Select Fund, a series of Natixis Funds Trust II. The predecessor Delafield Select Fund commenced operations on September 29, 2008 for Class A and Class C shares and on September 26, 2008 for Class Y shares. Prior to September 29, 2008, the predecessor Delafield Select Fund operated as a Delaware limited partnership using substantially the same investment objectives and investment policies as the predecessor fund. The limited partnership was incepted in July 1998.
2. SIGNIFICANT ACCOUNTING POLICIES
The following is a summary of significant accounting principles followed by the Trust in the preparation of its financial statements.
a) Security valuation and security transactions
Investments in securities, including foreign securities, traded on an exchange or quoted on the over-the-counter market are valued at the last sale price or, if no sale occurred during the day, at the mean between closing bid and asked prices, as last reported by a pricing service approved by the Trustees. Securities that are principally traded on the National Association of Securities Dealers Automated Quotation National Market (“NASDAQ”) are generally valued at the NASDAQ Official Closing Price (“NOCP”). Investments in gold and silver are valued on the basis of the respective closing spot prices of the New York Commodity Exchange. Investments in other precious metals are valued at their respective market values determined on the basis of the mean between the last current bid and asked prices based on dealer or exchange quotations. When market quotations are not readily available, or when restricted securities or other assets are being valued, such assets are valued at fair value as determined in good faith by or under procedures approved by the Trustees. Short-term securities maturing within 60 days are valued on an amortized cost basis. Fixed income securities with maturities greater than 60 days are valued at market price. Debt securities, such as corporate bonds, convertible bonds and U.S. government agency issues for which market quotations are not readily available may be valued based on information supplied by independent pricing services using matrix pricing formulas and/or independent broker bid quotations. Debt securities with remaining maturities of 60 days or less may be valued on an amortized cost basis, which involves valuing an instrument at its cost and thereafter assuming a constant amortization to maturity of any discount or premium, regardless of the impact of fluctuating rates on the fair value of the instrument.
Trading in securities on European and Far Eastern securities exchanges normally is completed before the calculation of the Funds’ net asset value. Trading on these foreign exchanges may not take place on all days on which there is regular trading on the New York Stock Exchange (“NYSE”), or may take place on days on which there is no regular trading on the NYSE. Similarly, the Funds may hold securities traded in domestic markets where the market may close early on a given day prior to calculation of the Funds’ net asset value. Events affecting the value of such securities held by the Funds that occur between the close of trading in the security and the close of trading on the NYSE normally will not be reflected in the Funds’ calculation of the net asset value. Significant events will be closely monitored, and where it is determined that an adjustment should be made to the security’s value because significant interim events may materially affect the value of the security, the security will be priced at its fair value in accordance with the procedures approved by the Trustees.
Investment and shareholder transactions are recorded on trade date. Dividend income is recognized on the ex-dividend date. Interest income is recognized on an accrual basis and includes, where applicable, the amortization of premiums and accretion of discounts. Net realized gains and losses from sales of securities are determined on the specific identification cost method.
b) Repurchase agreements
The Funds may enter into repurchase agreements with institutions that the Adviser has determined are creditworthy. Each repurchase agreement is recorded at cost. Under the terms of a typical repurchase agreement, the Fund acquires a debt security subject to an obligation of the seller to repurchase, and of the Fund to resell, the security at an agreed-upon
price and time, thereby determining the yield during the Fund’s holding period. When entering into repurchase agreements, it is the Fund’s policy that its custodian or a third party custodian, acting on the Fund’s behalf, take possession of the underlying collateral securities, the market value of which, at all times, at least equals the principal amount of the repurchase transaction, including accrued interest. To the extent that any repurchase transaction maturity exceeds one business day, the value of the collateral is marked to market and measured against the value of the agreement in an effort to ensure the adequacy of the collateral. If the counterparty defaults, the Fund generally has the right to use the collateral to satisfy the terms of the repurchase transaction.
c) Restricted and illiquid securities
The Funds may invest in securities that are subject to legal or contractual restrictions on resale or are illiquid. A security may be considered illiquid if it lacks a readily available market or if its valuation has not changed for a certain period of time. Disposal of these securities may involve time consuming negotiations and expense, and a prompt sale at the current valuation may be difficult.
d) Fair valuation measurements
The Trust has adopted authoritative fair valuation accounting standards which establish an authoritative definition of fair value and set out a hierarchy for measuring fair value. These standards require additional disclosures about the various inputs and valuation techniques used to develop the measurements of fair value and a discussion in changes in valuation techniques and related inputs during the period. These inputs are summarized in the three broad levels listed below.
| | Level 1 - | Quoted prices in active markets for identical securities. |
| | Level 2 - | Other significant observable inputs (including quoted prices for similar securities, interest rates, prepayment speeds, credit risk, etc.). |
| | Level 3 - | Significant unobservable inputs (including the Fund’s own assumptions in determining the fair value of investments). |
Equity investments, including common stocks, foreign issued common stocks, exchange-traded funds, closed end mutual funds and real estate investments trusts, which are traded on an exchange are valued at the last sale price reported by the exchange on which the securities are primarily traded on the day of valuation. If there are no sales on a given day for securities traded on an exchange, the mean between the latest bid and ask price will be used. If there is no Nasdaq Official Closing Price for a Nasdaq-listed security or sale price available for an over-the-counter security, the mean of the latest bid and asked quotations from Nasdaq will be used. When using the market quotations or closing price provided by the pricing service and when the market is considered active, the security will be classified as a Level 1 security. When using the mean between the latest bid and ask price, the security will be classified as Level 2. On days when the closing price of the S&P 500 moves more than 1% from its previous close, common stocks of the International Value Fund which are traded on non-North American exchanges may be valued using matrix pricing formulas provided by an independent pricing service. These securities will generally be classified as Level 2 securities. Gold bullion is valued at the mean of the closing bid and ask prices from the New York Mercantile Exchange and is classified as a Level 1.
Investment in mutual funds, including money market funds, are generally priced at the ending net asset value (NAV) provided by the service agent of the funds and will be classified as Level 1 securities.
Debt securities, such as corporate bonds, convertible bonds and U.S. government agency issues for which market quotations are not readily available may be valued based on information supplied by independent pricing services using matrix pricing formulas and/or independent broker bid quotations and are classified as Level 2. Debt securities with remaining maturities of 60 days or less may be valued on an amortized cost basis, which involves valuing an instrument at its cost and thereafter assuming a constant amortization to maturity of any discount or premium, regardless of the impact of fluctuating rates on the fair value of the instrument and are classified as Level 2. Warrants for which the underlying security is registered and equities which are subject to a required holding period, but have a comparable public issue, are valued in good faith by the Advisor pursuant to procedures established under the general supervision and responsibility of the Funds’ Board of Trustees. These securities will generally be classified as Level 2 securities. Forward currency contracts derive their value from the underlying currency prices. These are valued by a pricing service using pricing models. The models use inputs that are observed from active markets, such as exchange rates. These contracts are classified as Level 2. Options can diverge from the prices of their underlying instruments. These are valued at the composite last price reported by the exchange on which the options are primarily traded on the day of the valuation. If there is no composite last price on a given day the mean between the latest bid and ask price will be used. These contracts are classified as Level 2.
Any securities or other assets for which market quotations are not readily available are valued at fair value as determined in good faith by the Advisor pursuant to procedures established under the general supervision and responsibility of the Funds’ Board of Trustees and will be classified as Level 3 securities. In determining fair value, a Fund will seek to assign a value to the security which it believes represents the amount that the Fund could reasonably expect to receive upon its current sale. With respect to securities that are actively traded on U.S. exchanges, the Funds expect that market quotations will generally be available and that fair value might be used only in limited circumstances, such as when trading for a security is halted during the trading day.
The Gold Fund currently invests in a private fund that primarily invests in physical gold and is subject to redemption restrictions. This private fund investment can only be disposed of on the last day of a given month with notice given 25 business days in advance of redemption. This investment is currently valued at $18,033,715 which represents 1.5% of the Gold Fund’s net assets and is classified as Level 3.
For securities traded principally on foreign exchanges, the Funds may use fair value pricing if an event occurs after the close of trading of the principal foreign exchange on which a security is traded, but before calculation of a Fund’s NAV, which a Fund believes affects the value of the security since its last market quotation. Such events may involve situations relating to a single issuer (such as news related to the issuer announced after the close of the principal foreign exchange), or situations relating to sectors of the market or the markets in general (such as significant fluctuations in the U.S. or foreign markets or significant changes in exchange rates, natural disasters, armed conflicts, or governmental actions).
In determining whether a significant event has occurred with respect to securities traded principally in foreign markets, the Funds may engage a third party fair value service provider to systematically recommend the adjustment of closing market prices of non-U.S. securities based upon changes in a designated U.S. securities market index occuring from the time of close of the relevant foreign market and the close of the NYSE. Fair value pricing may also be used to value restricted securities held by the Funds or securities with little or no trading activity for extended periods of time. Fair value pricing involves judgements that are inherently subjective and inexact and it is not possible to determine with certainty when, and to what extent, an event will affect a market price. As a result, there can be no assurance that fair value pricing will reflect actual market value and it is possible that the fair value determined for a security may differ materially from the value that could be realized upon the sale of the security.
The following is a summary of the inputs used, as of October 31, 2013, involving the Funds’ assets carried at fair value. The inputs of methodology used for valuing securities may not be an indication of the risk associated with investing in those securities.
| | | | | | | | | | | | | | | | |
| Description | | Level 1 | | | Level 2 | | | Level 3 | | | Total | |
The Tocqueville Fund | | | | | | | | | | | | | | | | |
Common Stocks* | | $ | 336,440,800 | | | $ | — | | | $ | — | | | $ | 336,440,800 | |
Real Estate Investment Trust (REIT) * | | | 7,600,000 | | | | — | | | | — | | | | 7,600,000 | |
Money Market Fund | | | 2,068,456 | | | | — | | | | — | | | | 2,068,456 | |
| | | | | | | | | | | | | | | | |
Total Fund | | $ | 346,109,256 | �� | | $ | — | | | $ | — | | | $ | 346,109,256 | |
| | | | | | | | | | | | | | | | |
| | | | |
| The Tocqueville Opportunity Fund | | Level 1 | | | Level 2 | | | Level 3 | | | Total | |
Common Stocks* | | $ | 80,146,741 | | | $ | — | | | $ | — | | | $ | 80,146,741 | |
Real Estate Investment Trust (REIT) * | | | 186,259 | | | | — | | | | — | | | | 186,259 | |
Purchased Call Options* | | | — | | | | 326,800 | | | | — | | | | 326,800 | |
| | | | | | | | | | | | | | | | |
Total Fund | | $ | 80,333,000 | | | $ | 326,800 | | | $ | — | | | $ | 80,659,800 | |
| | | | | | | | | | | | | | | | |
| | | | |
| The Tocqueville International Value Fund | | Level 1 | | | Level 2 | | | Level 3 | | | Total | |
Common Stocks* | | $ | 249,228,221 | | | $ | — | | | $ | — | | | $ | 249,228,221 | |
Money Market Fund | | | 11,522,464 | | | | — | | | | — | | | | 11,522,464 | |
| | | | | | | | | | | | | | | | |
Total Fund | | $ | 260,750,685 | | | $ | — | | | $ | — | | | $ | 260,750,685 | |
| | | | | | | | | | | | | | | | |
Other Financial Instruments** | | | | | | | | | | | | | | | | |
Total Forward Currency Contracts | | $ | — | | | $ | 159,726 | | | $ | — | | | $ | 159,726 | |
| | | | | | | | | | | | | | | | |
| | | | |
| The Tocqueville Gold Fund | | Level 1 | | | Level 2 | | | Level 3 | | | Total | |
Common Stocks | | | | | | | | | | | | | | | | |
Gold Related | | $ | 812,143,543 | | | $ | 21,025,543 | | | $ | 3,063,293 | | | $ | 836,232,379 | |
Other Precious Metals Related | | | 123,036,369 | | | | 10,884,821 | | | | 10,536,366 | | | | 144,457,556 | |
Other | | | — | | | | — | | | | 6,249,757 | | | | 6,249,757 | |
| | | | | | | | | | | | | | | | |
Total Common Stocks | | | 935,179,912 | | | | 31,910,364 | | | | 19,849,416 | | | | 986,939,692 | |
Private Fund* | | | — | | | | — | | | | 18,033,715 | | | | 18,033,715 | |
Warrants* | | | — | | | | 2,140,131 | | | | — | | | | 2,140,131 | |
Gold Bullion | | | 131,837,805 | | | | — | | | | — | | | | 131,837,805 | |
Money Market Funds | | | 73,227,490 | | | | — | | | | — | | | | 73,227,490 | |
| | | | | | | | | | | | | | | | |
Total Fund | | $ | 1,140,245,207 | | | $ | 34,050,495 | | | $ | 37,883,131 | | | $ | 1,212,178,833 | |
| | | | | | | | | | | | | | | | |
| | | | | | | | | | | | | | | | |
| The Delafield Fund | | Level 1 | | | Level 2 | | | Level 3 | | | Total | |
Common Stocks* | | $ | 1,475,180,938 | | | $ | — | | | $ | — | | | $ | 1,475,180,938 | |
Corporate Bonds* | | | — | | | | 47,111,076 | | | | — | | | | 47,111,076 | |
Real Estate Investment Trust (REIT) * | | | 6,444,000 | | | | — | | | | — | | | | 6,444,000 | |
Money Market Fund | | | 40,428,779 | | | | — | | | | — | | | | 40,428,779 | |
U.S. Treasury Bills | | | — | | | | 199,991,866 | | | | — | | | | 199,991,866 | |
| | | | | | | | | | | | | | | | |
Total Fund | | $ | 1,522,053,717 | | | $ | 247,102,942 | | | $ | — | | | $ | 1,769,156,659 | |
| | | | | | | | | | | | | | | | |
| | | | |
| The Tocqueville Select Fund | | Level 1 | | | Level 2 | | | Level 3 | | | Total | |
Common Stocks* | | $ | 84,199,767 | | | $ | — | | | $ | — | | | $ | 84,199,767 | |
Money Market Funds | | | 6,895,729 | | | | — | | | | — | | | | 6,895,729 | |
U.S. Treasury Bills | | | — | | | | 9,099,686 | | | | — | | | | 9,099,686 | |
| | | | | | | | | | | | | | | | |
Total Fund | | $ | 91,095,496 | | | $ | 9,099,686 | | | $ | — | | | $ | 100,195,182 | |
| | | | | | | | | | | | | | | | |
| * | For further information regarding portfolio characteristics, please see the accompanying Schedules of Investments. |
| ** | Other financial instruments are derivative instruments not reflected in the Schedule of Investments, such as forward currency contracts, which are reflected at the unrealized appreciation (depreciation) on the instrument. |
Below is a reconciliation that details the transfer of securities between Level 1 and Level 2 during the reporting period.
| | | | | | | | | | | | | | | | | | | | | | | | |
| | | The
Tocqueville
Fund | | | The
Tocqueville
Opportunity
Fund | | | The
Tocqueville
International
Value Fund | | | The
Tocqueville
Gold Fund | | | The
Delafield
Fund | | | The
Tocqueville
Select Fund | |
Transfers Into Level 1 | | $ | — | | | $ | — | | | $ | — | | | $ | 1,494,213 | | | $ | — | | | $ | — | |
Transfers Out of Level 1 | | | — | | | | — | | | | — | | | | (20,917,645 | ) | | | — | | | | — | |
| | | | | | | | | | | | | | | | | | | | | | | | |
Net Transfers Into/(Out of ) Level 1 | | | — | | | | — | | | | — | | | | (19,423,432 | ) | | | — | | | | — | |
| | | | | | | | | | | | | | | | | | | | | | | | |
Transfers Into Level 2 | | | — | | | | — | | | | — | | | | 20,917,645 | | | | — | | | | — | |
Transfers Out of Level 2 | | | — | | | | — | | | | — | | | | (1,494,213 | ) | | | — | | | | — | |
| | | | | | | | | | | | | | | | | | | | | | | | |
Net Transfers Into/(Out of ) Level 2 | | $ | — | | | $ | — | | | $ | — | | | $ | 19,423,432 | | | $ | — | | | $ | — | |
| | | | | | | | | | | | | | | | | | | | | | | | |
Below is a reconciliation that details the activity of securities in Level 3 during the current fiscal period:
| | | | | | | | | | | | | | | | | | | | | | | | |
| | | The
Tocqueville
Fund | | | The
Tocqueville
Opportunity
Fund | | | The
Tocqueville
International
Value Fund | | | The
Tocqueville
Gold Fund | | | The
Delafield
Fund | | | The
Tocqueville
Select Fund | |
Beginning Balance—November 1, 2012 | | $ | — | | | $ | — | | | $ | — | | | $ | 58,132,557 | | | $ | — | | | $ | — | |
Purchases | | | — | | | | — | | | | — | | | | — | | | | — | | | | — | |
Sales | | | — | | | | — | | | | — | | | | — | | | | — | | | | — | |
Realized gains | | | — | | | | — | | | | — | | | | — | | | | — | | | | — | |
Realized losses | | | — | | | | — | | | | — | | | | — | | | | — | | | | — | |
Change in unrealized depreciation | | | — | | | | — | | | | — | | | | (20,249,426 | ) | | | — | | | | — | |
Transfers in/(out) of Level 3 | | | — | | | | — | | | | — | | | | — | | | | — | | | | — | |
| | | | | | | | | | | | | | | | | | | | | | | | |
Ending Balance—October 31, 2013 | | $ | — | | | $ | — | | | $ | — | | | $ | 37,883,131 | | | $ | — | | | $ | — | |
| | | | | | | | | | | | | | | | | | | | | | | | |
The movement from Level 2 to Level 1 in the Gold Fund was due to the release of restrictions on securities and the conversion of warrants to common stock. The movement from Level 1 to Level 2 in the Gold Fund was from the securities being priced using the mean of the bid and ask price due to the lack of trading volume on October 31, 2013. Transfers between levels are recognized at the end of the reporting period.
The Tocqueville Gold Fund
| | | | | | | | | | |
Type of Security | | Industry | | Fair Value at 10/31/2013 | | Valuation Techniques | | Unobservable Inputs | | Range |
Common Stock | | | | | | | | | | |
| | Gold Related | | 3,063,293 | | Latest company financing price adjusted for comparable index fluctuations | | Financing prices
Discount to index | | N/A
45% |
| | Other Precious Metals Related | | 10,536,366 | | Discounted cash flow and net asset value of resources adjusted for comparable index fluctuations | | Discount to cash flows
Discount to market value of resource
Discount to index | | 5%
25%-65%
40% |
| | Other | | 412,757 | | Latest company financing price adjusted for comparable index fluctuations | | Financing prices
Discount to index | | N/A
33% |
| | | | 5,837,000 | | Latest company financing price | | Financing prices | | N/A |
Private Fund | | Gold Related | | 18,033,715 | | NAV from custodian discounted by advisor | | Illiquidity discount | | 2% |
The significant unobservable inputs used in the fair value measurement of the Trust’s common stocks are the most recent financing prices of the portfolio company, which approximates the companies’ value in the market place; net asset value of resources and the discounted cash flows from the sale of the mineral resources, which approximates what the company could receive selling its mineral deposits once mined. The significant unobservable inputs for the private fund is
the discount for illiquidity applied to the Net Asset Value per share determined by the private fund’s custodian. If comparable indices fluctuate significantly, additional discounts are applied.
Significant changes in the companies’ ability to receive financing for new projects in the future would be an indication of the companies’ financial position and market value. An increase in the discount applied to the value of resources, future expected cash flows, or to account for illiquidity would decrease the value of the portfolio security. If comparable indices fluctuate significantly and additional discounts are applied the value of the security would decrease.
Significant Unobservable Inputs for Level 3 Portfolio Company Securities
The Trust’s valuation procedures have been adopted by the Trust’s Board of Trustees, which has established a Valuation Committee to oversee the valuation process. The Valuation Committee meets on an as needed basis to evaluate changes in the valuation of portfolio securities. The full findings and valuations are then reviewed quarterly by the Independent Trustees.
e) Derivative Instruments and Hedging Activities
The Funds’ Adviser may use derivative instruments, such as purchased call options and forward currency contracts, as a means to manage exposure to different types of risk, including market risk and exchange rate risk, and to gain exposure to underlying securities. The Trust has adopted disclosure standards in order to enable the investor to understand how and why an entity used derivatives, how derivatives are accounted for, and how derivatives affect an entity’s results of operations and financial position.
In the Opportunity Fund, the Advisor used purchased call options to gain exposure to the underlying equity security. In the International Value Fund, the Advisor used forward currency contracts to adjust exposure to foreign exchange rate risk.
Balance Sheet—Values of Derivative Instruments as of October 31, 2013.
The Tocqueville Opportunity Fund
| | | | | | | | | | | | |
| | | Asset Derivatives | | | Liability Derivatives | |
| Derivatives not accounted for as hedging instruments | | Balance Sheet
Location | | Value | | | Balance Sheet
Location | | Value | |
Purchased Call Options | | Investments,
at Value | | $ | 326,800 | | | | | $ | — | |
| | | | | | | | | | | | |
Total | | | | $ | 326,800 | | | | | $ | — | |
| | | | | | | | | | | | |
The Tocqueville International Value Fund
| | | | | | | | | | | | |
| | | Asset Derivatives | | | Liability Derivatives | |
| Derivatives not accounted for as hedging instruments | | Balance Sheet
Location | | Value | | | Balance Sheet
Location | | Value | |
Forward Currency Contracts | | Appreciation
on forward
currency
contracts | | $ | 159,726 | | | | | $ | — | |
| | | | | | | | | | | | |
Total | | | | $ | 159,726 | | | | | $ | — | |
| | | | | | | | | | | | |
The Effect of Derivative Instruments on the Statement of Operations for the year ended October 31, 2013.
The Tocqueville Opportunity Fund
| | | | | | | | |
| | | Net Realized
Loss on Investments | | | Net Change in
Unrealized
Appreciation on
Investments | |
Purchased Call Options | | $ | 8,846 | | | $ | 118,547 | |
| | | | | | | | |
Total | | $ | 8,846 | | | $ | 118,547 | |
| | | | | | | | |
The Tocqueville International Value Fund
| | | | | | | | |
| | | Net Realized
Loss on Forward
Currency Contracts | | | Net Change in
Unrealized
Depreciation on
Forward Currency
Contracts | |
Foreign Currency Forward Contract | | $ | (1,099,784 | ) | | $ | (21,005 | ) |
| | | | | | | | |
Total | | $ | (1,099,784 | ) | | $ | (21,005 | ) |
| | | | | | | | |
Derivatives Risk
The risks of using the types of derivatives in which the Funds may engage include the risk that movements in the value of the derivative may not fully offset or complement instruments currently held in the Funds in the manner intended by the Adviser; the risk that the counterparty to a derivative contract may fail to comply with their obligations to the Fund; the risk that the derivative may not possess a liquid secondary market at a time when the Fund would look to disengage the position; the risk that additional capital from the Fund may be called upon to fulfill the conditions of the derivative contract; and the risk that the cost of the derivative contracts may reduce the overall returns experienced by the Funds. The measurement of risks associated with these instruments is meaningful only when all related offsetting transactions are considered. The use of purchased call options create leverage in the Fund. The use of forward currency contracts do not create leverage in the Funds.
The average monthly value of purchased call options in the Opportunity Fund during the period ended October 31, 2013 was $122,765.
Transactions in purchased options in the Opportunity Fund during the year ended October 31, 2013 were as follows:
| | | | | | | | |
| | | Notional
Amount | | | Contracts | |
Outstanding, beginning of year: | | $ | — | | | | — | |
Options purchased | | | 3,877,500 | | | | 710 | |
Options terminated in closing transactions | | | (180,000 | ) | | | (40 | ) |
Options exercised | | | (980,000 | ) | | | (280 | ) |
Options expired | | | (125,000 | ) | | | (50 | ) |
| | | | | | | | |
Outstanding, end of year: | | $ | 2,592,500 | | | | 340 | |
The average monthly notional amount of forward currency contracts during the year ended October 31, 2013 was as follows:
| | | | |
| | | International
Value Fund | |
Long Positions | | $ | 714,464 | |
Short Positions | | $ | 25,015,328 | |
f) Foreign currency translation
Investments and other assets and liabilities denominated in foreign currencies are translated to U.S. dollars at the prevailing rates of exchange, in accordance with the Trust’s Portfolio Securities Valuation and Foreign Exchange Contracts Procedures. The Tocqueville Fund, The Tocqueville Opportunity Fund, The Tocqueville International Value Fund, The Tocqueville Gold Fund, The Delafield Fund and The Tocqueville Select Fund have engaged in transactions in securities denominated in foreign currencies and, as a result, entered into foreign exchange contracts. These Funds are exposed to additional market risk as a result of changes in the value of the underlying currency in relation to the U.S. dollar. Risks include potential inability of counterparties to meet the terms of their contracts. The value of foreign currency contracts are marked-to-market on a daily basis, which reflects the changes in the market value of the contract at the close of each day’s trading, resulting in daily unrealized gains and/or losses. When the contracts are closed, the Funds recognize a realized gain or loss.
The Funds isolate that portion of the results of operations resulting from changes in foreign exchange rates on investments from the fluctuations arising from changes in market prices of securities held. Such fluctuations reflected as net realized and unrealized gain or loss on foreign currency translation.
Reported net realized foreign exchange gains or losses arise from sales of foreign currencies, currency gains or losses realized between the trade and settlement dates on securities transactions, the differences between the amounts of dividends, interest, and foreign withholding taxes recorded on the Fund’s books, and the U.S. dollar equivalent of the amounts actually received or paid. Net unrealized foreign exchange gains and losses arise from changes in the value of assets and liabilities other than investments in securities at the end of the fiscal period, resulting from changes in the exchange rates.
g) Written option accounting
The Tocqueville Opportunity Fund, The Tocqueville International Value Fund, The Tocqueville Select Fund and The Tocqueville Gold Fund may write (sell) covered call options to hedge portfolio investments. When the Funds write (sell) an option, an amount equal to the premium received by the Funds is included in the Statements of Assets and Liabilities as an asset and an equivalent liability. The amount of the liability is subsequently marked-to-market to reflect the current value of the option written. By writing an option, the Funds may become obligated during the term of the option to deliver or purchase the securities underlying the option at the exercise price if the option is exercised. Option contracts are valued at the last sales price reported on the date of obligation. If the seller defaults and the value of the collateral declines or if bankruptcy proceedings are commenced with respect to the seller of the security, realization of the collateral by the Funds may be delayed or limited.
h) Dividends and distributions to shareholders
Dividends to shareholders are recorded on the ex-dividend date. Dividends from net investment income are declared and paid annually by the Funds. Distributions of net realized capital gains, if any, will be declared and paid at least annually. Income and capital gain distributions are determined in accordance with income tax regulations which may differ from generally accepted accounting principles. Permanent differences between financial and tax reporting may result in reclassification to capital stock.
i) Use of estimates
The preparation of financial statements in conformity with accounting principles generally accepted in the United States of America requires management to make estimates and assumptions that affect the reported amounts of assets and liabilities and disclosure of contingent assets and liabilities at the date of the financial statements and the reported amounts of revenues and expenses during the reporting period. Actual results could differ from those estimates.
j) Indemnification
In the normal course of business the Funds enter into contracts that contain general indemnification clauses. The Funds’ maximum exposure under these arrangements is unknown, as this would involve future claims against a Fund that have not yet occurred. Based on experience, the Funds expect the risk of loss to be remote.
k) Subsequent events evaluation
In preparing these financial statements, the Trust has evaluated events and transactions for potential recognition or disclosure resulting from subsequent events through the date financial statements were available to be issued.
3. FEDERAL INCOME TAX
There is no tax liability resulting from unrecognized tax benefits relating to uncertain income tax positions taken or expected to be taken on the tax return for the fiscal year-end October 31, 2013, or for any other tax years which are open for exam. As of October 31, 2013, open tax years include the tax years ended October 31, 2010 through 2013. The Trust is also not aware of any tax positions for which it is reasonably possible that the total amounts of unrecognized tax benefits will significantly change in the next six months. The Funds recognize interest and penalties, if any, related to unrecognized tax benefits as income tax expense in the Statement of Operations. During the period, the Funds did not incur any interest or penalties.
Provision for federal income taxes or excise taxes has not been made since the Funds have elected to be taxed as Regulated Investment Companies and intend to distribute substantially all taxable income to shareholders and otherwise comply with the provisions of the Internal Revenue Code applicable to Regulated Investment Companies. Distributions from net realized gains for book purposes may include short-term capital gains which are included as ordinary income to shareholders for tax purposes. Additionally, U.S. generally accepted accounting principles require that certain components of net assets relating to permanent differences be reclassified between financial and tax reporting. These reclassifications have no effect on net assets or net asset value per share. For the period ended October 31, 2013, the following table shows the reclassifications made:
| | | | | | | | | | | | |
| | | Undistributed
Net Investment
Income/(Loss) | | | Accumulated Net
Realized
Gain/(Loss) | | | Paid In Capital | |
Tocqueville Fund | | $ | (347,035 | ) | | $ | (70,512 | ) | | $ | 417,547 | |
Opportunity Fund | | | 447,959 | | | | (142,391 | ) | | | (305,568 | ) |
International Value Fund | | | (289,294 | ) | | | 289,294 | | | | — | |
Gold Fund | | | 2,733,056 | | | | (822,023 | ) | | | (1,911,033 | ) |
Delafield Fund | | | 3,942,814 | | | | (9,686,332 | ) | | | 5,743,518 | |
Select Fund | | | 243,105 | | | | (1,108,752 | ) | | | 865,647 | |
The permanent differences primarily relate to net operating losses, foreign currency reclasses and usage of tax equalization.
As of October 31, 2013, the components of accumulated earnings (losses) for income tax purposes were as follows:
| | | | | | | | | | | | | | | | | | | | | | | | |
| | | Tocqueville
Fund | | | Opportunity
Fund | | | International
Value
Fund | | | Gold Fund | | | Delafield
Fund | | | Select
Fund | |
Tax cost of investments | | $ | 236,119,360 | | | $ | 59,713,015 | | | $ | 209,721,561 | | | $ | 1,578,496,934 | | | $ | 1,272,357,240 | | | $ | 74,996,723 | |
| | | | | | | | | | | | | | | | | | | | | | | | |
| | | | | | | | | | | | | | | | | | | | | | | | |
Unrealized appreciation | | | 114,574,385 | | | | 22,179,664 | | | | 54,723,247 | | | | 244,249,211 | | | | 517,467,741 | | | | 28,203,603 | |
Unrealized depreciation | | | (4,584,489 | ) | | | (1,232,879 | ) | | | (3,694,123 | ) | | | (610,567,312 | ) | | | (20,668,322 | ) | | | (3,005,144 | ) |
| | | | | | | | | | | | | | | | | | | | | | | | |
Net unrealized appreciation/(depreciation) | | | 109,989,896 | | | | 20,946,785 | | | | 51,029,124 | | | | (366,318,101 | ) | | | 496,799,419 | | | | 25,198,459 | |
| | | | | | | | | | | | | | | | | | | | | | | | |
Undistibuted operating income | | | 2,824,529 | | | | — | | | | 3,898,125 | | | | — | | | | 2,044,735 | | | | — | |
Undistibuted long-term gains/(loss) | | | 2,781,700 | | | | 4,131,972 | | | | — | | | | — | | | | 59,795,871 | | | | 9,932,784 | |
| | | | | | | | | | | | | | | | | | | | | | | | |
Distibutable earnings | | | 5,606,229 | | | | 4,131,972 | | | | 3,898,125 | | | | — | | | | 61,840,606 | | | | 9,932,784 | |
| | | | | | | | | | | | | | | | | | | | | | | | |
Other accumulated gain/(loss) | | | — | | | | (427,281 | ) | | | (5,194,814 | ) | | | (48,067,798 | ) | | | — | | | | (387,335 | ) |
| | | | | | | | | | | | | | | | | | | | | | | | |
Total accumulated gain/(loss) | | $ | 115,596,125 | | | $ | 24,651,476 | | | $ | 49,732,435 | | | $ | (414,385,899 | ) | | $ | 558,640,025 | | | $ | 34,743,908 | |
| | | | | | | | | | | | | | | | | | | | | | | | |
The difference between book-basis and tax-basis unrealized appreciation is attributable primarily to wash sale deferrals and passive foreign investment companies (PFIC’s).
The tax character of distributions paid during the periods ended October 31, 2013 and 2012 was as follows:
| | | | | | | | | | | | |
| | | October 31, 2013 | |
| | | Ordinary
Income | | | Long Term
Capital
Gain | | | Total | |
Tocqueville Fund | | $ | 5,030,132 | | | $ | — | | | $ | 5,030,132 | |
Opportunity Fund | | | — | | | | — | | | | — | |
International Value Fund | | | 3,270,330 | | | | — | | | | 3,270,330 | |
Gold Fund | | | — | | | | 53,161,749 | | | | 53,161,749 | |
Delafield Fund | | | — | | | | 80,537,788 | | | | 80,537,788 | |
Select Fund | | | — | | | | 3,451,599 | | | | 3,451,599 | |
| |
| | | October 31, 2012 | |
| | | Ordinary
Income | | | Long Term
Capital
Gain | | | Total | |
Tocqueville Fund | | $ | 5,526,502 | | | $ | — | | | $ | 5,526,502 | |
Opportunity Fund | | | — | | | | — | | | | — | |
International Value Fund | | | 2,105,224 | | | | — | | | | 2,105,224 | |
Gold Fund | | | 15,486,206 | | | | 26,796,483 | | | | 42,282,689 | |
Delafield Fund | | | — | | | | 16,542,579 | | | | 16,542,579 | |
Select Fund | | | — | | | | 766,158 | | | | 766,158 | |
The Fund designated as long-term capital gain dividend, pursuant to Internal Revenue Code Section 852(b)(3), the amount necessary to reduce the earnings and profits of the Funds related to net capital gain to zero for the tax years ended October 31, 2013 and 2012.
For the fiscal year ended October 31, 2013 the Opportunity Fund, Gold Fund, and Select Fund had late year losses of $427,298, $41,733,637, and $378,538, respectively.
At October 31, 2013 certain Funds had tax basis capital losses which may be carried forward to offset future capital gains as shown below.
| | | | | | | | | | | | |
| | | Capital losses Expiring | |
| | | 10/31/2017 | | | Indefinite ST | | | Indefinite LT | |
International Value Fund | | | 5,188,654 | | | | — | | | | — | |
Gold Fund | | | — | | | | 5,528,133 | | | | — | |
To the extent that Funds listed above may realize future net capital gains, those gains will be offset by any of their unused respective capital loss carryforwards
On December 22, 2010, the Regulated Investment Company Modernization Act of 2010 (the “Act”) was enacted, which changed various technical rules governing the tax treatment of RICs. The changes are generally effective for taxable years beginning after the date of enactment. One of the more prominent changes addresses capital loss carryforwards. Under the Act, each Fund will be permitted to carry forward capital losses incurred in taxable years beginning after the date of enactment for an unlimited period. However, any losses incurred during those future taxable years will be required to be utilized prior to the losses incurred in pre-enactment years, which carry an expiration date. As a result of this ordering rule, pre-enactment capital loss carryforwards may be more likely to expire unused. Additionally, post-enactment capital loss carryforwards will retain their character as either short-term or long-term capital losses rather than being considered all short-term as permitted under previous regulation.
4. INVESTMENT ADVISORY AND OTHER AGREEMENTS
Tocqueville Asset Management L.P. (“Tocqueville”) is the investment adviser (the “Adviser”) to the Trust under Investment Advisory Agreements approved by shareholders. For its services, Tocqueville receives fees from The Tocqueville Fund, calculated daily and payable monthly, at an annual rate of 0.75% on the first $1 billion of the average daily net assets of the Fund, and 0.65% of the average daily net assets in excess of $1 billion. Tocqueville receives fees from The Tocqueville Opportunity Fund, calculated daily and payable monthly, at an annual rate of 0.75% on the first $500 million of the average daily net assets of the Fund, and 0.65% of the average daily net assets in excess of $500 million. Tocqueville receives fees from The Tocqueville International Value Fund, calculated daily and payable monthly, at an annual rate of 1.00% on the first $1 billion of the average daily net assets of the Fund, and 0.75% of the average daily net assets in excess of $1 billion. Tocqueville receives fees from The Tocqueville Gold Fund, calculated daily and payable monthly, at an annual rate of 1.00% on the first $500 million of the average daily net assets of the Fund, 0.75% of the average daily net assets in excess of $500 million but not exceeding $1 billion, and 0.65% of the average daily net assets in excess of $1 billion. Tocqueville receives fees from The Delafield Fund, calculated daily and payable monthly, at an annual rate of 0.80% on the first $250 million of net assets of the Fund; 0.75% on the next $250 million of net assets of the Fund; 0.70% on the next $500 million of net assets of the Fund; and 0.65% on all net assets of the Fund over $1 billion. Tocqueville receives fees from The Tocqueville Select Fund, calculated daily and payable monthly, at an annual rate of 0.80% on all net assets of the Fund.
With respect to The Tocqueville Fund, effective March 1, 2013, the Adviser has contractually agreed to waive its advisory fees and/or reimburse expenses in order to ensure that The Tocqueville Fund’s total annual operating expenses do not exceed 1.25% of its average daily net assets (excluding taxes, interest expense, acquired fund fees and expenses, or extraordinary expenses such as litigation). The Expense Limitation Agreement will remain in effect until March 1, 2015. For the fiscal year ended October 31, 2013, the Adviser waived $67,616 of the advisory fee. Such amount is not subject to recoupment by the Adviser.
With respect to The Tocqueville International Value Fund, effective January 1, 2013, the Adviser has contractually agreed to waive its advisory fees and/or reimburse expenses in order to ensure that The Tocqueville International Value Fund’s total annual operating expenses do not exceed 1.25% of its average daily net assets (excluding taxes, interest expense, acquired fund fees and expenses, or extraordinary expenses such as litigation). The Expense Limitation Agreement will remain in effect until March 1, 2015. For the fiscal year ended October 31, 2013, the Adviser waived $588,968 of the advisory fee. Such amount is not subject to recoupment by the Adviser.
Pursuant to an Administrative Services Agreement, each Fund pays to the Adviser a fee computed and paid monthly at an annual rate of 0.15% of the average daily net assets of the Fund. For the fiscal year ended October 31, 2013, the
Adviser has made payments of $87,472, $17,681, $58,202, $389,759, $387,692, and $22,094 to U.S. Bancorp Fund Services, LLC for services provided under a Sub-Administration Agreement for The Tocqueville Fund, The Tocqueville Opportunity Fund, The Tocqueville International Value Fund, The Tocqueville Gold Fund, The Delafield Fund and The Tocqueville Select Fund, respectively.
Tocqueville Securities, L.P. (the “Distributor”), an affiliate of Tocqueville, acts as distributor for shares of the Trust. Each Fund adopted a distribution and service plan pursuant to Rule 12b-1 of the 1940 Act. Pursuant to the plans, each Fund pays to the Distributor distribution and service fees of 0.25% per annum of its average daily net assets.
Commissions earned by the Distributor for services rendered as a registered broker-dealer in securities transactions for The Tocqueville Fund, The Tocqueville Opportunity Fund, The Tocqueville International Value Fund, The
Tocqueville Gold Fund, The Delafield Fund and The Tocqueville Select Fund for the fiscal year ended October 31, 2013, were $145,218, $85,563, $9,058, $50,608, $15,675, and $32,616, respectively.
5. CAPITAL SHARE TRANSACTIONS.
Transactions in capital shares for each Fund were as follows:
| | | | | | | | |
| | | For the Year
Ended
October 31, 2013 | | | For the Year
Ended
October 31, 2012 | |
| The Tocqueville Fund | | Shares | | | Shares | |
Shares sold | | | 1,122,567 | | | | 2,417,617 | |
Shares issued to holders in reinvestment dividends | | | 171,255 | | | | 210,977 | |
Shares redeemed | | | (5,121,252 | ) | | | (9,561,092 | ) |
| | | | | | | | |
Net decrease | | | (3,827,430 | ) | | | (6,932,498 | ) |
| | |
| The Tocqueville Opportunity Fund | | | | | | |
Shares sold | | | 269,202 | | | | 1,838,335 | |
Shares issued to holders in reinvestment dividends | | | — | | | | — | |
Shares redeemed | | | (636,699 | ) | | | (823,770 | ) |
| | | | | | | | |
Net increase (decrease) | | | (367,497 | ) | | | 1,014,565 | |
| | |
| The Tocqueville International Value Fund | | | | | | |
Shares sold | | | 3,191,072 | | | | 6,098,494 | |
Shares issued to holders in reinvestment dividends | | | 197,585 | | | | 139,955 | |
Shares redeemed | | | (4,243,896 | ) | | | (4,162,884 | ) |
| | | | | | | | |
Net increase (decrease) | | | (855,239 | ) | | | 2,075,565 | |
| | |
| The Tocqueville Gold Fund | | | | | | |
Shares sold | | | 14,396,666 | | | | 10,956,862 | |
Shares issued to holders in reinvestment dividends | | | 783,134 | | | | 539,233 | |
Shares redeemed | | | (16,801,311 | ) | | | (10,200,599 | ) |
| | | | | | | | |
Net increase (decrease) | | | (1,621,511 | ) | | | 1,295,496 | |
| | | | | | | | |
| | | For the Year
Ended
October 31, 2013 | | | For the Year
Ended
October 31, 2012 | |
| The Delafield Fund | | Shares | | | Shares | |
Shares sold | | | 12,682,948 | | | | 12,276,891 | |
Shares issued to holders in reinvestment dividends | | | 2,479,103 | | | | 562,887 | |
Shares redeemed | | | (12,970,111 | ) | | | (14,055,439 | ) |
| | | | | | | | |
Net increase (decrease) | | | 2,191,940 | | | | (1,215,661 | ) |
| | |
| The Tocqueville Select Fund | | | | | | |
Shares sold | | | 975,053 | | | | 2,720,578 | |
Shares issued to holders in reinvestment dividends | | | 280,128 | | | | 62,056 | |
Shares redeemed | | | (2,288,027 | ) | | | (1,803,804 | ) |
| | | | | | | | |
Net increase (decrease) | | | (1,032,846 | ) | | | 978,830 | |
6. FUND SHARE TRANSACTIONS
The Funds currently offer only one class of shares of beneficial interest. A redemption fee of 2.00% is imposed on redemptions of shares held 90 days or fewer. This fee is retained by each Fund and is credited to paid in capital. Redemptions to which the fee applies include redemptions of shares resulting from an exchange made pursuant to the Exchange Privilege, as defined in the Trust’s Prospectus dated February 28, 2013. For a more detailed description of when the redemption fee does not apply, please see the Trust’s Prospectus.
7. INVESTMENT TRANSACTIONS
Purchases and sales of investment securities (excluding short-term instruments) for the year ended October 31, 2013 are summarized below.
| | | | | | | | | | | | | | | | | | | | | | | | |
| | | Tocqueville
Fund | | | Opportunity
Fund | | | International
Value Fund | | | Gold Fund | | | Delafield
Fund | | | Select
Fund | |
Purchases: | | $ | 56,037,034 | | | $ | 71,529,554 | | | $ | 91,352,386 | | | $ | 216,614,087 | | | $ | 479,540,469 | | | $ | 21,609,029 | |
| | | | | | | | | | | | | | | | | | | | | | | | |
Sales: | | $ | 161,288,691 | | | $ | 78,271,722 | | | $ | 99,014,706 | | | $ | 377,281,446 | | | $ | 448,553,168 | | | $ | 45,179,516 | |
| | | | | | | | | | | | | | | | | | | | | | | | |
U.S. Government Security Purchases: | | $ | — | | | $ | — | | | $ | — | | | $ | — | | | $ | — | | | $ | — | |
| | | | | | | | | | | | | | | | | | | | | | | | |
U.S. Government Security Sales: | | $ | — | | | $ | — | | | $ | — | | | $ | — | | | $ | — | | | $ | — | |
| | | | | | | | | | | | | | | | | | | | | | | | |
8. TRANSACTIONS WITH AFFILIATES
The following issuers are affiliated with the Funds; that is, the Adviser had control of 5% or more of the outstanding voting securities during the period from November 1, 2012 through October 31, 2013. As defined in Section (2)(a)(3) of the Investment Company Act of 1940; such issues are:
| | | | | | | | | | | | | | | | | | | | | | | | | | | | | | | | | | | | | | | | | | | | |
| | | November 1, 2012 | | | Additions | | | Reductions | | | Share
Balance at
October 31,
2013 | | | Dividend
Income | | | Realized
Gain/(Loss) | | | Value at
October 31,
2013 | | | Cost at
October 31,
2013 | |
Issuer Name | | Share
Balance | | | Cost | | | Shares | | | Cost | | | Shares | | | Cost | | | | | | |
The Tocqueville Gold Fund | | | | | | | | | | | | | | | | | | | | | | | | | | | | | | | | | | | | | |
Atac Resources Ltd. | | | 10,261,700 | | | $ | 37,121,703 | | | | 702,000 | | | $ | 1,968,031 | | | | — | | | $ | — | | | | 10,963,700 | | | $ | — | | | $ | — | | | $ | 7,781,266 | | | $ | 39,089,734 | |
Atac Resources Ltd. (a) | | | 702,000 | | | | 1,968,031 | | | | — | | | | — | | | | (702,000 | ) | | | (1,968,031 | ) | | | — | | | | — | | | | — | | | | — | | | | — | |
Atac Resources Ltd. Warrants | | | 351,000 | | | | — | | | | — | | | | — | | | | (351,000 | ) | | | — | | | | — | | | | — | | | | — | | | | — | | | | — | |
Barisan Gold Corp. (b) | | | 877,100 | | | | — | | | | — | | | | — | | | | — | | | | — | | | | 877,100 | | | | — | | | | — | | | | 75,710 | | | | — | |
Bear Creek Mining Corp. | | | 6,061,800 | | | | 23,977,515 | | | | 1,351,400 | | | | 4,783,666 | | | | — | | | | — | | | | 7,413,200 | | | | — | | | | — | | | | 18,485,896 | | | | 28,761,181 | |
Blue Gold Mining, Inc. (b)(c) | | | 4,000,000 | | | | 3,845,969 | | | | — | | | | — | | | | (4,000,000 | ) | | | (3,845,969 | ) | | | — | | | | — | | | | — | | | | — | | | | — | |
Blue Gold Mining, Inc. Warrants (b)(c) | | | 2,000,000 | | | | — | | | | — | | | | — | | | | (2,000,000 | ) | | | — | | | | — | | | | — | | | | — | | | | — | | | | — | |
Corvus Gold, Inc. | | | 2,079,901 | | | | 1,617,492 | | | | — | | | | — | | | | — | | | | — | | | | 2,079,901 | | | | — | | | | — | | | | 2,353,200 | | | | 1,617,492 | |
Corvus Gold, Inc. | | | 1,500,000 | | | | 1,002,144 | | | | 4,600,000 | | | | 3,937,233 | | | | — | | | | — | | | | 6,100,000 | | | | — | | | | — | | | | 6,962,068 | | | | 4,939,377 | |
Corvus Gold, Inc. | | | — | | | | — | | | | 4,600,000 | | | | 3,937,233 | | | | (4,600,000 | ) | | | (3,937,233 | ) | | | — | | | | — | | | | — | | | | — | | | | — | |
East Asia Minerals Corp. | | | 10,544,400 | | | | 21,793,116 | | | | — | | | | — | | | | — | | | | — | | | | 10,544,400 | | | | — | | | | — | | | | 455,089 | | | | 21,793,116 | |
East Asia Minerals Corp. Warrants | | | 6,500,000 | | | | — | | | | — | | | | — | | | | — | | | | — | | | | 6,500,000 | | | | — | | | | — | | | | — | | | | — | |
Eidesis Special Opportunities II LP (b) | | | 25,000 | | | | 25,000,000 | | | | — | | | | — | | | | — | | | | — | | | | 25,000 | | | | — | | | | — | | | | 18,033,715 | | | | 25,000,000 | |
GoGold Resources, Inc. | | | 8,100,000 | | | | 9,990,010 | | | | — | | | | — | | | | — | | | | — | | | | 8,100,000 | | | | — | | | | — | | | | 7,768,666 | | | | 9,990,010 | |
GoGold Resources, Inc. Warrants | | | 4,050,000 | | | | — | | | | — | | | | — | | | | — | | | | — | | | | 4,050,000 | | | | — | | | | — | | | | 516,616 | | | | — | |
Gold Bullion International LLC (b) | | | 5,000,000 | | | | 5,000,000 | | | | — | | | | — | | | | — | | | | — | | | | 5,000,000 | | | | — | | | | — | | | | 5,837,000 | | | | 5,000,000 | |
Gold Resource Corp. (b) | | | 3,655,997 | | | | 37,246,000 | | | | — | | | | — | | | | (2,638,150 | ) | | | (19,171,617 | ) | | | 1,017,847 | | | | 1,733,628 | | | | (25,249 | ) | | | 5,282,626 | | | | 18,074,383 | |
International Tower Hill Mines Ltd. | | | 5,738,836 | | | | 20,953,121 | | | | — | | | | — | | | | — | | | | — | | | | 5,738,836 | | | | — | | | | — | | | | 2,927,380 | | | | 20,953,121 | |
International Tower Hill Mines Ltd. | | | 5,666,667 | | | | 33,656,021 | | | | 1,923,077 | | | | 4,974,877 | | | | — | | | | — | | | | 7,589,744 | | | | — | | | | — | | | | 3,930,812 | | | | 38,630,898 | |
International Tower Hill Mines Ltd. (a) | | | 1,923,077 | | | | 4,974,877 | | | | — | | | | — | | | | (1,923,077 | ) | | | (4,974,877 | ) | | | — | | | | — | | | | — | | | | — | | | | — | |
MAG Silver Corp. | | | 1,218,000 | | | | 12,876,363 | | | | 1,742,700 | | | | 18,687,456 | | | | — | | | | — | | | | 2,960,700 | | | | — | | | | — | | | | 16,875,990 | | | | 31,563,819 | |
Plata Latina Minerals Corp. (b) | | | — | | | | — | | | | 2,000,000 | | | | 797,806 | | | | — | | | | — | | | | 2,000,000 | | | | — | | | | — | | | | 306,910 | | | | 797,806 | |
Plata Latina Minerals Corp. Warrants (b) | | | — | | | | — | | | | 1,000,000 | | | | — | | | | — | | | | — | | | | 1,000,000 | | | | — | | | | — | | | | — | | | | — | |
Primero Mining Corp. | | | 4,840,700 | | | | 24,573,319 | | | | — | | | | — | | | | — | | | | — | | | | 4,840,700 | | | | — | | | | — | | | | 27,577,574 | | | | 24,573,319 | |
Primero Mining Corp. Warrants | | | 1,848,400 | | | | — | | | | — | | | | — | | | | — | | | | — | | | | 1,848,400 | | | | — | | | | — | | | | 1,613,240 | | | | — | |
Rockhaven Resources Ltd. | | | 5,000,000 | | | | 6,265,337 | | | | — | | | | — | | | | — | | | | — | | | | 5,000,000 | | | | — | | | | — | | | | 599,434 | | | | 6,265,337 | |
Scorpio Mining Corp. | | | 25,668,419 | | | | 23,975,473 | | | | — | | | | — | | | | — | | | | — | | | | 25,668,419 | | | | — | | | | — | | | | 6,755,928 | | | | 23,975,473 | |
Scorpio Mining Corp. | | | 522,400 | | | | 984,285 | | | | — | | | | — | | | | — | | | | — | | | | 522,400 | | | | — | | | | — | | | | 137,784 | | | | 984,285 | |
Silver Range Resources Ltd. | | | 3,450,000 | | | | — | | | | — | | | | — | | | | — | | | | — | | | | 3,450,000 | | | | — | | | | — | | | | 446,698 | | | | — | |
Silver Range Resources Ltd. Warrants | | | 1,725,000 | | | | — | | | | — | | | | — | | | | (1,725,000 | ) | | | — | | | | — | | | | — | | | | — | | | | — | | | | — | |
Strategic Metals Ltd. | | | 10,926,900 | | | | 15,810,172 | | | | — | | | | — | | | | — | | | | — | | | | 10,926,900 | | | | — | | | | — | | | | 3,772,776 | | | | 15,810,172 | |
Sunshine Mining & Refining (b) | | | 1,633,545 | | | | 18,353,107 | | | | — | | | | — | | | | — | | | | — | | | | 1,633,545 | | | | — | | | | — | | | | 10,536,366 | | | | 18,353,107 | |
Torex Gold Mining | | | 25,250,600 | | | | 42,051,513 | | | | 9,900 | | | | 22,179 | | | | — | | | | — | | | | 25,260,500 | | | | — | | | | — | | | | 28,103,563 | | | | 42,073,692 | |
| | | | | | | | | | | | | | | | | | | | | | | | | | | | | | | | | | | | | | | | | | | | |
| | | | | | $ | 373,035,568 | | | | | | | $ | 39,108,481 | | | | | | | $ | (33,897,727 | ) | | | | | | $ | 1,733,628 | | | $ | (25,249 | ) | | $ | 177,136,307 | | | $ | 378,246,322 | |
| | | | | | | | | | | | | | | | | | | | | | | | | | | | | | | | | | | | | | | | | | | | |
| | | November 1, 2012 | | | Additions | | | Reductions | | | Share
Balance at
October 31,
2013 | | | Dividend
Income | | | Realized
Gain/(Loss) | | | Value at
October 31,
2013 | | | Cost at
October 31,
2013 | |
Issuer Name | | Share
Balance | | | Cost | | | Shares | | | Cost | | | Shares | | | Cost | | | | | | |
The Delafield Fund | | | | | | | | | | | | | | | | | | | | | | | | | | | | | | | | | | | | | |
ACCO Brands Corp. | | | 2,800,000 | | | $ | 27,193,413 | | | | 2,000,000 | | | $ | 13,515,558 | | | | (800,000 | ) | | $ | (8,773,872 | ) | | | 4,000,000 | | | $ | — | | | $ | (3,032,546 | ) | | $ | 23,400,000 | | | $ | 31,935,099 | |
Checkpoint Systems, Inc. (b) | | | 2,250,000 | | | | 34,749,063 | | | | — | | | | — | | | | (1,875,000 | ) | | | (31,503,794 | ) | | | 375,000 | | | | — | | | | (8,354,612 | ) | | | 6,382,500 | | | | 3,245,269 | |
Kemet Corp. | | | 2,000,000 | | | | 11,848,966 | | | | 950,000 | | | | 4,220,272 | | | | (325,000 | ) | | | (2,649,767 | ) | | | 2,625,000 | | | | — | | | | (612,589 | ) | | | 14,883,750 | | | | 13,419,471 | |
LTX-Credence Corp. | | | 2,150,000 | | | | 15,463,159 | | | | 50,000 | | | | 270,914 | | | | (200,000 | ) | | | (1,676,416 | ) | | | 2,000,000 | | | | — | | | | (281,156 | ) | | | 12,260,000 | | | | 14,057,657 | |
Maidenform Brands, Inc. (b) | | | 625,000 | | | | 11,372,034 | | | | — | | | | — | | | | (625,000 | ) | | | (11,372,034 | ) | | | — | | | | — | | | | 3,184,993 | | | | — | | | | — | |
TrueBlue, Inc. (b) | | | 1,550,000 | | | | 20,893,292 | | | | — | | | | — | | | | (325,000 | ) | | | (4,671,076 | ) | | | 1,225,000 | | | | — | | | | 2,534,597 | | | | 30,257,500 | | | | 16,222,216 | |
Universal Stainless & Alloy | | | 425,000 | | | | 12,856,365 | | | | 41,500 | | | | 971,657 | | | | (15,500 | ) | | | (614,673 | ) | | | 451,000 | | | | — | | | | (41,902 | ) | | | 14,576,320 | | | | 13,213,349 | |
| | | | | | | | | | | | | | | | | | | | | | | | | | | | | | | | | | | | | | | | | | | | |
| | | | | | $ | 134,376,292 | | | | | | | $ | 18,978,401 | | | | | | | $ | (61,261,632 | ) | | | | | | $ | — | | | $ | (6,603,215 | ) | | $ | 101,760,070 | | | $ | 92,093,061 | |
The Tocqueville Select Fund | | | | | | | | | | | | | | | | | | | | | | | | | | | | | | | | | | | | | |
ACCO Brands Corp. | | | 493,000 | | | $ | 4,129,638 | | | | 161,500 | | | $ | 1,056,352 | | | | (130,000 | ) | | $ | (1,227,785 | ) | | | 524,500 | | | $ | — | | | $ | (214,147 | ) | | $ | 3,068,325 | | | $ | 3,958,205 | |
Checkpoint Systems, Inc. (b) | | | 255,000 | | | | 3,303,378 | | | | — | | | | — | | | | (146,000 | ) | | | (2,246,348 | ) | | | 109,000 | | | | — | | | | (162,976 | ) | | | 1,855,180 | | | | 1,057,030 | |
Maidenform Brands, Inc. (b) | | | 160,400 | | | | 3,362,679 | | | | — | | | | — | | | | (160,400 | ) | | | (3,362,679 | ) | | | — | | | | — | | | | 381,250 | | | | — | | | | — | |
Summer Infant, Inc. | | | 739,933 | | | | 3,816,381 | | | | 75,000 | | | | 155,060 | | | | — | | | | — | | | | 814,933 | | | | — | | | | — | | | | 2,314,410 | | | | 3,971,441 | |
| | | | | | | | | | | | | | | | | | | | | | | | | | | | | | | | | | | | | | | | | | | | |
| | | | | | $ | 14,612,076 | | | | | | | $ | 1,211,412 | | | | | | | $ | (6,836,812 | ) | | | | | | $ | — | | | $ | 4,127 | | | $ | 7,237,915 | | | $ | 8,986,676 | |
| | | | | | | | | | | | | | | | | | | | | | | | | | | | | | | | | | | | | | | | | | | | |
| (a) | Private security restrictions lifted during period and combined with other non restricted securities. |
| (b) | Security is no longer an affiliated company at October 31, 2013. |
| (c) | Merger and name change to Riverstone Resources, Inc. |
9. LINE OF CREDIT
The Tocqueville Trust has a $300,000,000 line of credit (the “Line”), which is uncommitted, with U.S. Bank NA. The Line is for temporary emergency or extraordinary purposes, including the meeting of redemption requests that otherwise might require the untimely disposition of securities. The Line is secured by the Trust’s assets. The Line has a one year term and is reviewed annually by the Board of Trustees. The current agreement runs through May 31, 2014. The interest rate as of October 31, 2013 was 2.75%. During the year ended October 31, 2013, the Tocqueville Fund’s maximum borrowing was $18,738,000 and average borrowing was $844,429, the Opportunity Fund’s maximum borrowing was $1,745,000 and average borrowing was $63,647, the Gold Fund’s maximum borrowing was $18,790,000 and average borrowing was $1,004,548, and the Select Fund’s maximum borrowing was $426,000 and average borrowing was $1,690. This borrowing resulted in interest expenses of $25,618, $2,007, $29,710, and $33, respectively. These amounts are included in Other Expenses on the Funds’ Statement of Operations. The International Value Fund and the Delafield Fund did not use the Line of credit.
10. OTHER EXPENSES
Other expenses include reimbursement to the Adviser for compensation of the Trust’s Chief Compliance Officer. For the year ended October 31, 2013, reimbursement to the Adviser for compensation of the Trust’s Chief Compliance Officer from the Funds amounted to $13,689, $2,776, $9,126, $60,040, $60,901 and $3,468 for the Tocqueville Fund, Opportunity Fund, International Value Fund, Gold Fund, Delafield Fund, and Select Fund, respectively.
The Tocqueville Trust
Report of Independent Registered Public Accounting Firm
To the Shareholders and Board of Trustees of
The Tocqueville Trust:
We have audited the accompanying statements of assets and liabilities of The Tocqueville Trust, including The Tocqueville Fund, The Tocqueville Opportunity Fund, The Tocqueville International Value Fund, The Tocqueville Gold Fund, The Delafield Fund, and The Tocqueville Select Fund (collectively, the “Funds”), including the schedules of investments, as of October 31, 2013, and the related statements of operations for the year then ended, changes in net assets for each of the two years in the period then ended, and the financial highlights for each of the five years in the period then ended for The Tocqueville Fund, The Tocqueville Opportunity Fund, The Tocqueville International Value Fund, and The Tocqueville Gold Fund; the related statements of operations for the year then ended, changes in net assets for each of the two years in the period then ended and financial highlights for each of the four years in the period then ended and for the period January 1, 2009 to October 31, 2009 for The Delafield Fund and The Tocqueville Select Fund. These financial statements and financial highlights are the responsibility of the Funds’ management. Our responsibility is to express an opinion on these financial statements and financial highlights based on our audits. The financial highlights for the year ended December 31, 2008 for The Delafield Fund and for the period September 28, 2008 (inception) through December 31, 2008 for The Tocqueville Select Fund were audited by other auditors. Those auditors expressed an unqualified opinion on those financial highlights in their report dated February 24, 2009.
We conducted our audits in accordance with the standards of the Public Company Accounting Oversight Board (United States). Those standards require that we plan and perform the audit to obtain reasonable assurance about whether the financial statements and financial highlights are free of material misstatement. The Funds are not required to have, nor were we engaged to perform, an audit of their internal control over financial reporting. Our audits included consideration of internal control over financial reporting as a basis for designing audit procedures that are appropriate in the circumstances, but not for the purpose of expressing an opinion on the effectiveness of the Funds’ internal control over financial reporting. Accordingly, we express no such opinion. An audit also includes examining, on a test basis, evidence supporting the amounts and disclosures in the financial statements and financial highlights, assessing the accounting principles used and significant estimates made by management, as well as evaluating the overall financial statement presentation. Our procedures included confirmation of the securities owned as of October 31, 2013, by correspondence with the custodian and brokers. We believe that our audits provide a reasonable basis for our opinion.
In our opinion, the financial statements and financial highlights referred to above present fairly, in all material respects, the financial position of each of the aforementioned Funds of The Tocqueville Trust as of October 31, 2013, the results of their operations for the year then ended, the changes in net assets for each of the two years in the period then ended, and the financial highlights for each of the five years in the period then ended for The Tocqueville Fund, The Tocqueville Opportunity Fund, The Tocqueville International Value Fund and The Tocqueville Gold Fund; the results of operations for the year then ended, changes in net assets for each of the two years in the period then ended and financial highlights for each of the four years in the period then ended and for the period January 1, 2009 to October 31, 2009 for The Delafield Fund and The Tocqueville Select Fund, in conformity with accounting principles generally accepted in the United States of America.
/s/ GRANT THORNTON LLP
Chicago, Illinois
December 27, 2013
ADDITIONAL INFORMATION (UNAUDITED)
1. ADDITIONAL DISCLOSURE REGARDING FUND TRUSTEES AND OFFICERS
Independent Trustees
| | | | | | | | | | | | |
Name, Age and Address | | Position(s) Held with the Trust | | Term of Office and Length of Time Served (1) | | Principal Occupation During Past Five Years | | # of
Portfolios
in Fund
Complex
Overseen
By Trustee | | | Other Directorships Held by Trustee |
| | | | | |
Guy A. Main (77) 40 W. 57th St., 19th Floor New York, NY 10019 | | Trustee | | Indefinite Term, Since 2000 | | Retired. Formerly, Executive Vice President, Amwest Insurance Group, Inc. from April 1996 to January 2001; Chairman, President and Chief Executive Officer, Condor Services Inc. from April 1989 to April 1996. | | | 6 | | | Director, Amwest Insurance Group, Inc. from April 1996 to January 2001; Chairman, Association of California Insurance Companies from January 1996 to January 1998; Director, Condor Services Inc. from April 1989 to April 1996. |
| | | | | |
Charles W. Caulkins (57) 40 W. 57th St., 19th Floor New York, NY 10019 | | Trustee | | Indefinite Term, Since 2003 | | Partner, Chora Capital, LLC from June 2010 to present; Marketing Manager, L.R. Global Partners from January 2008 to May 2010; President, Arbor Marketing, Inc. from October 1994 to December 2007. | | | 6 | | | Director, Phoenix House from January 2001 to 2007; Director, Bridges to Community from July 2002 to 2006. |
| | | | | |
James W. Gerard (52) 40 W. 57th St., 19th Floor New York, NY 10019 | | Trustee | | Indefinite Term, Since 2001 | | Managing Director, North Sea Partners, January 2010 to present. Principal, Juniper Capital Group, LLC (formerly known as Argus Advisors International, LLC), from August 2003 to December 2009; Managing Director, The Chart Group from January 2001 to present; Managing Principal, Ironbound Partners from October 1998 to December 2000. | | | 6 | | | Director, American Overseas Memorial Day Association, 1988 to present; Trustee, Salisbury School, 2005 to present; Director, American Friends of Blerancourt, 1992-present; Director and Treasurer ASPCA, 1988 to 2008. |
Independent Trustees
| | | | | | | | | | | | |
Name, Age and Address | | Position(s) Held with the Trust | | Term of Office and Length of Time Served (1) | | Principal Occupation During Past Five Years | | # of
Portfolios
in Fund
Complex
Overseen
By Trustee | | | Other Directorships Held by Trustee |
| | | | | |
William F. Indoe (71) 40 W. 57th St., 19th Floor New York, NY 10019 | | Trustee | | Indefinite Term, Since 2006 | | Senior Counsel 2009-present, Partner 1976-1990, and Associate 1968-1976, Sullivan & Cromwell LLP (attorneys-at-law). | | | 6 | | | Director, Rho Capital Partners, Inc. |
| | | | | |
William J. Nolan III (66) 40 W. 57th St., 19th Floor New York, NY 10019 | | Trustee | | Indefinite Term, Since 2006 | | Retired, Executive Vice President & Treasurer PaineWebber Inc. 1997-2001. | | | 6 | | | Trustee, Adirondock Museum, Blue Mt. Lake, NY 1996 to present (Treasurer, 2000 to present). |
| | | | | |
Alexander Douglas (66) 40 W. 57th St., 19th Floor New York, NY 10019 | | Trustee | | Indefinite Term, Since 2010 | | President, CEO and owner of Spaulding Law Printing, Inc. | | | 6 | | | None |
Interested Trustees (and Officers)*
| | | | | | | | | | | | |
Name, Age and Address | | Position(s) Held with the Trust | | Term of Office and Length of Time Served (1) | | Principal Occupation During Past Five Years | | # of
Portfolios
in Fund
Complex
Overseen
By Trustee | | | Other Directorships Held by Trustee |
| | | | | |
Francois D. Sicart (70) 40 W. 57th St., 19th Floor New York, NY 10019 | | Chairman and Trustee | | Indefinite Term, Since 1987 | | Chairman, Tocqueville Management Corporation, the General Partner of Tocqueville Asset Management L.P. and Tocqueville Securities, L.P. from January 1990 to present; Chairman and Founder, Tocqueville Asset Management Corp. from December 1985 to January 1990; Vice Chairman of Tucker Anthony Management Corporation from 1981 to October 1986; Vice President (formerly general partner) among other positions with Tucker Anthony, Inc. from 1969 to January 1990. | | | 6 | | | Chairman and Director, Tocqueville Management Corporation, the General Partner of Tocqueville Asset Management L.P. and Tocqueville Securities, L.P. from January 1990 to present.
|
Interested Trustees (and Officers)*
| | | | | | | | | | | | |
Name, Age and Address | | Position(s) Held with the Trust | | Term of Office and Length of Time Served (1) | | Principal Occupation During Past Five Years | | # of
Portfolios
in Fund
Complex
Overseen
By Trustee | | | Other Directorships Held by Trustee |
| | | | | |
Robert W. Kleinschmidt (64) 40 W. 57th St., 19th Floor New York, NY 10019 | | President and Trustee | | Indefinite Term, Since 1991 | | President, Chief Investment Officer and Director, Tocqueville Management Corporation, the General Partner of Tocqueville Asset Management L.P. and Tocqueville Securities, L.P. from January 1994 to present; and Managing Director from July 1991 to January 1994; Partner, David J. Greene & Co. from May 1978 to July 1991. | | | 6 | | | President and Director, Tocqueville Management Corporation, the General Partner of Tocqueville Asset Management L.P. and Tocqueville Securities, L.P.
|
| | | | | |
Cleo Kotis (38) 40 W. 57th St., 19th Floor New York, NY 10019 | | Secretary | | Indefinite Term, Since 2010 | | Director of Operations, the Delafield Group of Tocqueville Asset Management L.P., 2009 to present; Vice President and Chief Operations Officer, the Delafield Fund, Inc. from 2005-2009; Vice President and Chief Operations Officer, Delafield Asset Management from 2005-2009; Vice President, Reich & Tang Asset Management, LLC from 2002-2009. | | | N/A | | | N/A |
| | | | | |
John Cassidy (70) 40 W. 57th St., 19th Floor New York, NY 10019 | | Treasurer | | Indefinite Term, Since 2010 | | Treasurer, Tocqueville Asset Management L.P., from May 2002 to present. | | | N/A | | | N/A |
| | | | | |
Elizabeth Bosco (65) 40 W. 57th St., 19th Floor
New York, NY 10019 | | Anti-Money Laundering Compliance Officer
| | Indefinite Term, Since 2009 | | Chief Compliance Officer (January 2009-present), Tocqueville Securities L.P.; Compliance Officer (January 1997-January 2009), Tocqueville Securities L.P. and Tocqueville Asset Management, L.P. | | | N/A | | | N/A
|
| * | “Interested person” of the Trust is defined in the 1940 Act. Mr. Sicart and Mr. Kleinschmidt are considered “interested persons” because of their affiliation with the Adviser. |
Interested Trustees (and Officers)*
| | | | | | | | | | | | |
Name, Age and Address | | Position(s) Held with the Trust | | Term of Office and Length of Time Served (1) | | Principal Occupation During Past Five Years | | # of
Portfolios
in Fund
Complex
Overseen
By Trustee | | | Other Directorships Held by Trustee |
| | | | | |
Thomas Pandick (66) 40 W. 57th St., 19th Floor New York, NY 10019
| | Chief Compliance Officer | | Indefinite Term, Since 2004 | | Chief Compliance Officer (October 2004-present), Tocqueville Asset Management L.P.; General Counsel (January-October 2004), Tocqueville Asset Management L.P. | | | N/A | | | N/A
|
| (1) | Each Trustee will hold office for an indefinite term until the earliest of (i) the next meeting of shareholders, if any, called for the purpose of considering the election or re-election of such Trustee and until the election and qualification of his or her successor, if any, elected at such meeting, or (ii) the date a Trustee resigns or retires, or a Trustee is removed by the Board of Trustees or shareholders, in accordance with the Trust’s By-Laws, as amended, and Agreement and Declaration of Trust, as amended. Each officer will hold office for an indefinite term until the date he or she resigns or retires or until his or her successor is elected and qualified. |
2. INVESTMENT ADVISORY AGREEMENT DISCLOSURE
In determining whether to approve the continuance of the Investment Advisory Agreements and the Administration Agreement, the Trustees, including the Independent Trustees, considered the following information:
1) The nature, extent and quality of services provided by the Adviser.
The Trustees reviewed in detail the nature and extent of the services provided by the Adviser under the terms of the Investment Advisory Agreements and the quality of those services provided to The Tocqueville Fund, The Tocqueville Opportunity Fund, The Tocqueville International Value Fund, The Tocqueville Gold Fund, The Delafield Fund and The Tocqueville Select Fund (the “Funds”) over the past year. The Trustees noted that the services under the Investment Advisory Agreements include: managing the investment and reinvestment of the Funds’ assets; supervising and managing all aspects of the Funds’ operations; and providing the Board on a regular basis with financial reports and analyses on the Funds’ operations and the operations of comparable investment companies. The Trustees also observed that the Adviser provides various administrative services to the Funds pursuant to the terms of the Administration Agreement and considered the nature, extent and quality of services provided under that agreement as well. The Trustees evaluated these factors based on their direct experience with the Adviser and in consultation with counsel. The Trustees concluded that the nature and extent of the services provided under the Investment Advisory Agreements and the Administration Agreement were reasonable and appropriate in relation to the advisory fee and administration fee, respectively, that the level of services provided by the Adviser to the Funds had not diminished over the past year and that the quality of services continues to be high. The Trustees reviewed the personnel responsible for providing advisory and administrative services to the Funds and concluded, based on their experience and interaction with the Adviser, that (i) the Adviser was able to retain quality portfolio managers and other personnel; (ii) the Adviser exhibited a high level of diligence and attention to detail in carrying out its advisory and administrative responsibilities under the Investment Advisory Agreements and Administration Agreement, respectively, for the Funds; (iii) the Adviser was responsive to requests of the
Trustees; and (iv) the Adviser had kept the Trustees apprised of developments relating to the Funds and the industry in general. The Trustees also focused on the Adviser’s reputation and long-standing relationship with the Trust.
In connection with its assessment of the performance of the Adviser, the Trustees reviewed the Adviser’s financial statements and considered the Adviser’s financial condition and whether it has the resources necessary to continue to carry out its obligations under the Investment Advisory Agreements and the Administration Agreement. The Trustees concluded that the Adviser has the financial resources necessary to continue to perform its obligations under the Investment Advisory Agreements and the Administration Agreement and to continue to provide the high quality services that it has provided to the Funds to date.
2) The performance of the Funds and the Adviser.
The Trustees reviewed the investment performance of the Funds, both on an absolute basis and as compared to a peer group for each respective Fund for the one-year, three-year, five-year and ten-year periods, ended July 31, 2013. The peer groups were comprised of other funds that had similar investment objectives and sales load structures, as determined by Morningstar: The Morningstar Large Blend Funds peer group, with average net assets between $301 million and $351 million, for The Tocqueville Fund; the Morningstar Mid-Cap Growth Funds peer group, with average net assets between $70 million and $97 million, for The Tocqueville Opportunity Fund; the Morningstar Foreign Large Value Funds peer group, with average net assets between $196 million and $338 million, for The Tocqueville International Value Fund; the Morningstar Precious Metals Funds peer group, with average net assets between $1.3 billion and $1.8 billion, for The Tocqueville Gold Fund; the Morningstar Mid-Cap Value Funds peer group, with average net assets between $1.5 billion and $2.2 billion, for The Delafield Fund; and the Morningstar Small Value Funds peer group, with average net assets between $65 million and $133 million, for The Tocqueville Select Fund (the “Performance Peer Groups”). The Trustees considered that the performance information for The Delafield Fund and The Tocqueville Select Fund includes the performance information of their respective predecessor funds, which had different investment advisers, but the Trustees considered this information since these Funds have substantially the same portfolio management team.
The Trustees also compared each Fund’s investment performance against its benchmark market indices: the S&P 500 Index for The Tocqueville Fund; the Russell 2500 Growth Index for The Tocqueville Opportunity Fund; the Morgan Stanley EAFE Index for The Tocqueville International Value Fund; the S&P 500 Index and the Philadelphia Stock Exchange Gold & Silver Index for The Tocqueville Gold Fund; the S&P 500 Index and the Russell 2000 Index for The Delafield Fund; and the Russell 2500 Index and the Russell 2000 Index for The Tocqueville Select Fund (the “Indices”) for the one-year, three-year, five-year and ten-year periods ended July 31, 2013 for all the Funds. The Trustees considered the above information as helpful in their assessment of whether the Adviser was obtaining for the Funds’ shareholders the performance that was available in the marketplace given each Fund’s investment objectives, policies, strategies, limitations and restrictions. The Trustees concluded that the performance of the Funds against their respective Performance Peer Groups was satisfactory. In particular, the Trustees noted that The Tocqueville Fund had outperformed as compared to its Index for the one-year and ten-year periods and underperformed for the three-year and five-year periods, and outperformed the median of its Performance Peer Group for the ten-year period and underperformed for the one-year, three-year and five-year periods. The Trustees noted that with respect to The Tocqueville Opportunity Fund that despite underperforming its Index for all time periods, the Fund had outperformed the median of its Performance Peer Group for all periods except the ten-year period. The Trustees further noted that The Tocqueville International Value Fund outperformed its Index for the five-year and ten-year periods and underperformed for the one-year and three-year periods, and outperformed the median of its Performance Peer Group for all periods except the one-year period. The Trustees noted that The Tocqueville Gold Fund outperformed both of its Indices for the ten-year period, underperformed
both its Indices for the one-year period, and outperformed the Philadelphia Stock Exchange Gold & Silver Index and underperformed the S&P 500 Index for the three-year and five-year periods, and outperformed the median of its Performance Peer Group for all periods. The Trustees noted that The Delafield Fund outperformed both of its Indices for the five-year and ten-year periods, underperformed both of its Indices for the three-year period and outperformed the S&P 500 Index and underperformed the Russell 2000 Index for the one-year period, and outperformed the median of its Performance Peer Group for the five-year and ten-year periods and underperformed for the one-year and three-year periods. The Trustees noted that The Tocqueville Select Fund outperformed both of its Indices for the one-year, five-year and ten-year periods, underperformed both of its Indices for the three-year period, and outperformed the median of its Performance Peer Group for all time periods except the three-year period.
3) The cost of the advisory services and the profits to the Adviser from the relationship with the Trust.
In connection with the Trustee’s consideration of the level of the advisory fees, the Trustees considered a number of factors. The Trustees compared the level of the advisory fees for each Fund against the advisory fees charged by funds in a universe of funds: the Morningstar Large Cap Blend Funds peer group, with average net assets between $200 million and $500 million, for The Tocqueville Fund; the Morningstar Mid-Cap Growth Funds peer group, with average net assets between $50 million and $100 million, for The Tocqueville Opportunity Fund; the Morningstar Foreign Large Value Funds peer group, with average net assets between $150 million and $350 million, for The Tocqueville International Value Fund; all funds in the Morningstar Equity Precious Metals Funds peer group, for The Tocqueville Gold Fund; the Morningstar Mid-Cap Value Funds peer group, with average net assets between $1.2 billion and $2.2 billion, for The Delafield Fund; and the Morningstar Small Value Funds peer group, with average net assets between $50 million and $150 million, for The Tocqueville Select Fund (the “Expense Peer Groups”). The Trustees considered comparative total fund expenses of the Funds and the Expense Peer Groups. The Trustees used this comparative fee information and total expense data as a guide to help assess the reasonableness of each Fund’s advisory fee, although they acknowledged that it was difficult to make precise comparisons with other funds since the exact nature of services provided under each Expense Peer Group fund agreement is often not apparent. The Trustees also viewed the Expense Peer Group fee information as a whole as useful in assessing whether the Adviser was providing services at a cost that was competitive with other, similar funds.
The Trustees noted that the contract rate advisory fee and administration fee for each of the Funds were reasonable, despite the contractual advisory fee rate being above average for The Tocqueville Fund, The Tocqueville International Value Fund and The Tocqueville Gold Fund and the administration fee being above average for The Tocqueville Fund, The Tocqueville Gold Fund and The Delafield Fund, when compared to their respective Expense Peer Groups. The Trustees also considered the combined contract rate advisory and administration fee as compared to their respective Expense Peer Group. The Board further observed that the total expense ratios of the Funds were also reasonable. The Board noted that the total expense ratio for The Tocqueville Fund, The Delafield Fund and The Tocqueville Select Fund were above average, when compared to their respective Expense Peer Groups and that the total expense ratio for The Tocqueville Opportunity Fund, The Tocqueville International Value Fund and The Tocqueville Gold Fund were below average, when compared to their respective Expense Peer Groups. The Board also noted that The Tocqueville Fund and The Tocqueville International Value Fund each operate pursuant to an Expense Limitation Agreement whereby the Adviser has agreed to waive a portion of its fee necessary to limit the Fund’s total operating expenses to the level set forth in the Fund’s prospectus.
The Trustees also considered the profitability to the Adviser and its affiliate arising out of its relationship with the Trust. In this regard, the Trustees reviewed profitability data relating to the Adviser for the year ended October 31, 2012. The Trustees considered revenues received by the Adviser under the Investment Advisory Agreements and the Administration Agreement as well as revenues received by the Adviser’s affiliate, the Distributor, under the 12b-1 plans and Related Agreements and commissions received for effecting portfolio transactions. The Trustees also received and reviewed the Adviser’s financial statements and the Adviser provided an oral update on its profitability numbers since October 31, 2012. The Trustees concluded that the profitability of the Funds to the Adviser was not excessive.
4) The extent to which economies of scale will be realized as the Funds grow and whether fee levels reflect those economies of scale.
With respect to the Trustees’ consideration of economies of scale, the Trustees discussed with the Adviser whether economies of scale would be realized by it in its management of a Fund at higher asset levels. The Trustees also reviewed the Peer Group data to assess whether the Peer Group funds had advisory fee breakpoints and, if so, at what asset levels. The Trustees noted that the Funds, except for The Tocqueville Select Fund, currently have advisory fee breakpoints and that they were satisfied that the current breakpoints were appropriate when compared with each Fund’s respective Peer Group. The Trustees considered that breakpoints are not necessary at this time for The Tocqueville Select Fund, given the small size of The Tocqueville Select Fund. The Trustees also noted that the administration fee for the Funds does not have a breakpoint and they concluded that breakpoints were not needed at this time. In the event there was significant asset growth in the future in a Fund, the Trustee’s determined to reassess whether the advisory fees and administration fee, including the current breakpoint structure, appropriately took into account any economies of scale that had been realized as a result of that growth.
5) Other Factors.
The Trustees also discussed the Adviser’s practices regarding the selection and compensation of brokers and dealers that execute portfolio transactions for the Funds and the brokers’ and dealers’ provision of brokerage and research services to the Adviser. The Trustees further discussed the potential benefits the Adviser derived from the Funds’ soft dollar arrangements, whereby brokers provide research to the Funds or the Adviser in return for allocating fund brokerage, and other investment data concerning soft dollars. The Board also discussed the Adviser’s use of an affiliated broker to effect portfolio transactions, noting that in addition to paying a competitive rate on commissions, the Adviser believed the Funds received better execution on trades.
Based on a consideration of all these factors in their totality, the Trustees, including all of the Independent Trustees, determined that the Funds’ advisory fees and administration fees were fair and reasonable with respect to the quality of services that the Adviser provides and in light of the other factors described above that the Trustees deemed relevant. The Trustees based their decision on evaluations of all these factors as a whole and did not consider any one factor as all-important or controlling. The Independent Trustees were also assisted by the advice of independent counsel in making this determination.
3. PROXY VOTING POLICIES AND PROCEDURES
A description of the policies and procedures that The Tocqueville Trust uses to determine how to vote proxies relating to portfolio securities is available without charge upon request by calling 1-800-355-7307. Information regarding how The Tocqueville Trust voted proxies relating to portfolio securities during the most recent 12-month period ended June 30 is available by calling 1-800-355-7307 and it is also available on the SEC’s web site at http://www.sec.gov.
4. SHAREHOLDER REPORTS AND QUARTERLY PORTFOLIO DISCLOSURE
The Tocqueville Trust is required to file its complete schedule of portfolio holdings with the SEC for its first and third fiscal quarters on Form N-Q. The Trust’s Form N-Q will be available without charge, upon request on the SEC’s website (http://www.sec.gov) and may be available by calling 1-800-697-3863. You can also obtain copies of Form N-Q by (i) visiting the SEC’s Public Reference Room in Washington, DC (information on the operation of the Public Reference Room may be obtained by calling 1-202-551-8090); (ii) sending your request and a duplicating fee to the SEC’s Public Reference Room, Washington, DC 20549-1520; or (iii) sending your request electronically to publicinfosec.gov. Quarterly portfolio holdings are also available on the website of The Tocqueville Funds, www.tocqueville.com/mutual-funds.
5. SHAREHOLDER NOTIFICATION OF FEDERAL TAX STATUS
For the fiscal period ended October 31, 2013, certain dividends paid by the Funds may be subject to a maximum tax rate of 15%, as provided for by the Jobs and Growth Tax Relief Reconciliation Act of 2003. The percentage of dividends declared from ordinary income designated as qualified dividend income was as follows:
| | | | |
Tocqueville Fund | | | 100.00 | % |
Opportunity Fund | | | 0.00 | % |
International Value Fund | | | 100.00 | % |
Gold Fund | | | 0.00 | % |
Delafield Fund | | | 0.00 | % |
Select Fund | | | 0.00 | % |
For corporate shareholders, the percent of ordinary income distributions qualifying for the corporate dividends received deduction for the fiscal period ended October 31, 2013 was as follows:
| | | | |
Tocqueville Fund | | | 100.00 | % |
Opportunity Fund | | | 0.00 | % |
International Value Fund | | | 5.65 | % |
Gold Fund | | | 0.00 | % |
Delafield Fund | | | 0.00 | % |
Select Fund | | | 0.00 | % |
For the period ended October 31, 2013, the funds designate the following percent of ordinary distributions paid as interest-related dividends under the Internal Revenue Code Section 871(k)(1)(c):
| | | | |
Tocqueville Fund | | | 0.00 | % |
Opportunity Fund | | | 0.00 | % |
International Value Fund | | | 0.02 | % |
Gold Fund | | | 0.00 | % |
Delafield Fund | | | 0.00 | % |
Select Fund | | | 0.00 | % |
The percentage of taxable ordinary income distributions that are designated as short-term capital gain distributions under Internal Revenue Section 871(k)(2)(C) for each Fund were as follows.
| | | | |
Tocqueville Fund | | | 0.00 | % |
Opportunity Fund | | | 0.00 | % |
International Value Fund | | | 0.00 | % |
Gold Fund | | | 0.00 | % |
Delafield Fund | | | 0.00 | % |
Select Fund | | | 0.00 | % |
6. FOREIGN TAX CREDIT
For the year ended October 31, 2013, the Tocqueville International Value Fund earned foreign source income and paid foreign taxes which they intend to pass through to their shareholders pursuant to Section 853 of the Internal Revenue Code as follows:
| | | | | | | | |
Country | | Gross Dividend
Per Share | | | Taxes Withheld
Per Share | |
Netherlands Antilles | | | 0.00155 | | | | 0.00000 | |
Belgium | | | 0.01820 | | | | 0.00273 | |
Bermuda | | | 0.00460 | | | | 0.00000 | |
Brazil | | | 0.00688 | | | | 0.00088 | |
Canada | | | 0.00500 | | | | 0.00075 | |
Switzerland | | | 0.02147 | | | | 0.00322 | |
Germany | | | 0.02055 | | | | 0.00352 | |
France | | | 0.07432 | | | | 0.01106 | |
Hong Kong | | | 0.05413 | | | | 0.00000 | |
Indonesia | | | 0.00343 | | | | 0.00054 | |
Ireland | | | 0.01217 | | | | 0.00193 | |
Italy | | | 0.02085 | | | | 0.00000 | |
Japan | | | 0.06441 | | | | 0.00460 | |
Netherlands | | | 0.03034 | | | | 0.00455 | |
Norway | | | 0.03089 | | | | 0.00604 | |
British Virgin Islands | | | 0.00008 | | | | 0.00000 | |
| | | | | | | | |
| | | 0.36886 | | | | 0.03981 | |
| | | | | | | | |
Investment Adviser
Tocqueville Asset Management L.P.
40 W. 57th St., 19th Floor
New York, NY 10019
(212) 698-0800
www.tocqueville.com
Distributor
Tocqueville Securities, L.P.
40 W. 57th St., 19th Floor
New York, NY 10019
(212) 698-0800
Shareholders’ Servicing and Transfer Agent
U.S. Bancorp Fund Services, LLC
P.O. Box 701
Milwaukee, WI 53201-0701
(800) 697-3863
Custodian
U.S. Bank, N.A.
Custody Operations
1555 River Center Drive, Suite 302
Milwaukee, WI 53212
Board of Trustees
François D. Sicart—Chairman
Charles W. Caulkins
Alexander Douglas
James W. Gerard
William F. Indoe
Robert W. Kleinschmidt
Guy A. Main
William J. Nolan III

Tocqueville Funds
c/o US Bancorp Fund Services, LLC
P.O. Box 701
Milwaukee, WI 53201-0701
www.tocqueville.com/mutual-funds
TQRPANNU 13
Item 2. Code of Ethics.
The registrant has adopted a code of ethics that applies to the registrant’s principal executive officer and principal financial officer. The registrant has not made any amendments to its code of ethics during the period covered by this report. The registrant has not granted any waivers from any provisions of the code of ethics during the period covered by this report.
Incorporated by reference to the Registrant’s Form N-CSR filed January 6, 2011.
Item 3. Audit Committee Financial Expert.
The registrant’s board of trustees has determined that there are three audit committee financial experts serving on its audit committee. James Gerard, William Nolan III, and Guy Main are the “audit committee financial expert” and are considered to be “independent” as each term is defined in Item 3 of Form N-CSR.
Item 4. Principal Accountant Fees and Services.
The registrant has engaged its principal accountant to perform audit services, audit-related services, tax services and other services during the past two fiscal years. “Audit services” refer to performing an audit of the registrant’s annual financial statements or services that are normally provided by the accountant in connection with statutory and regulatory filings or engagements for those fiscal years. “Audit-related services” refer to the assurance and related services by the principal accountant that are reasonably related to the performance of the audit. “Tax services” refer to professional services rendered by the principal accountant for tax compliance, tax advice, and tax planning. “Other services” were not provided by the principal accountant. The following table details the aggregate fees billed or expected to be billed for each of the last two fiscal years for audit fees, audit-related fees, tax fees and other fees by the principal accountant.
| | | | | | | | |
| | | FYE 10/31/2013 | | | FYE 10/31/2012 | |
Audit Fees | | | 156,000 | | | | 172,237 | |
Audit-Related Fees | | | 0 | | | | 0 | |
Tax Fees | | | 21,500 | | | | 20,790 | |
All Other Fees | | | 0 | | | | 0 | |
The audit committee has adopted pre-approval policies and procedures that require the audit committee to pre-approve all audit and non-audit services of the registrant, including services provided to any entity affiliated with the registrant.
The percentage of fees billed by Grant Thornton applicable to non-audit services pursuant to waiver of pre-approval requirement were as follows:
| | | | | | | | |
| | | FYE 10/31/2013 | | | FYE 10/31/2012 | |
Audit-Related Fees | | | 0 | % | | | 0 | % |
Tax Fees | | | 0 | % | | | 0 | % |
All Other Fees | | | 0 | % | | | 0 | % |
All of the principal accountant’s hours spent on auditing the registrant’s financial statements were attributed to work performed by full-time permanent employees of the principal accountant.
The following table indicates the non-audit fees billed or expected to be billed by the registrant’s accountant for services to the registrant and to the registrant’s investment adviser (and any other controlling entity, etc.—not sub-adviser) for the last two years. The audit committee of the board of trustees/directors has considered whether the provision of non-audit services that were rendered to the registrant’s investment adviser is compatible with maintaining the principal accountant’s independence and has concluded that the provision of such non-audit services by the accountant has not compromised the accountant’s independence.
| | | | | | | | |
Non-Audit Related Fees | | FYE 10/31/2013 | | | FYE 10/31/2012 | |
Registrant | | | 0 | | | | 0 | |
Registrant’s Investment Adviser | | | 0 | | | | 0 | |
Item 5. Audit Committee of Listed Registrants.
Not applicable to registrants who are not listed issuers (as defined in Rule 10A-3 under the Securities Exchange Act of 1934).
Item 6. Investments.
Schedule of Investments is included as part of the report to shareholders filed under Item 1 of this Form.
Item 7. Disclosure of Proxy Voting Policies and Procedures for Closed-End Management Investment Companies.
Not applicable to open-end investment companies.
Item 8. Portfolio Managers of Closed-End Management Investment Companies.
Not applicable to open-end investment companies.
Item 9. Purchases of Equity Securities by Closed-End Management Investment Company and Affiliated Purchasers.
Not applicable to open-end investment companies.
Item 10. Submission of Matters to a Vote of Security Holders.
There have been no material changes to the procedures by which shareholders may recommend nominees to the registrant’s board of trustees.
2
Item 11. Controls and Procedures.
| (a) | The Registrant’s President and Treasurer have reviewed the Registrant’s disclosure controls and procedures (as defined in Rule 30a-3(c) under the Investment Company Act of 1940 (the “Act”)) as of a date within 90 days of the filing of this report, as required by Rule 30a-3(b) under the Act and Rules 13a-15(b) or 15d-15(b) under the Securities Exchange Act of 1934. Based on their review, such officers have concluded that the disclosure controls and procedures are effective in ensuring that information required to be disclosed in this report is appropriately recorded, processed, summarized and reported and made known to them by others within the Registrant and by the Registrant’s service provider. |
| (b) | There were no changes in the Registrant’s internal control over financial reporting (as defined in Rule 30a-3(d) under the Act) that occurred during the second fiscal quarter of the period covered by this report that has materially affected, or is reasonably likely to materially affect, the Registrant’s internal control over financial reporting. |
Item 12. Exhibits.
| (a) | (1) Any code of ethics or amendment thereto, that is the subject of the disclosure required by Item 2, to the extent that the registrant intends to satisfy Item 2 requirements through filing an exhibit. Incorporated by reference to the Registrant’s Form N-CSR filed January 6, 2011. |
(2) A separate certification for each principal executive and principal financial officer pursuant to Section 302 of the Sarbanes-Oxley Act of 2002. Filed herewith.
(3) Any written solicitation to purchase securities under Rule 23c-1 under the Act sent or given during the period covered by the report by or on behalf of the registrant to 10 or more persons. Not applicable to open-end investment companies.
| (b) | Certifications pursuant to Section 906 of the Sarbanes-Oxley Act of 2002. Furnished herewith. |
3
SIGNATURES
Pursuant to the requirements of the Securities Exchange Act of 1934 and the Investment Company Act of 1940, the registrant has duly caused this report to be signed on its behalf by the undersigned, thereunto duly authorized.
|
| (Registrant) The Tocqueville Trust |
|
| By (Signature and Title)* /s/ ROBERT W. KLEINSCHMIDT |
| Robert W. Kleinschmidt, President |
|
| Date DECEMBER 31, 2013 |
Pursuant to the requirements of the Securities Exchange Act of 1934 and the Investment Company Act of 1940, this report has been signed below by the following persons on behalf of the registrant and in the capacities and on the dates indicated.
|
| By (Signature and Title)* /S/ ROBERT W. KLEINSCHMIDT |
| Robert W. Kleinschmidt, President |
|
| Date DECEMBER 31, 2013 |
|
| By (Signature and Title)* /s/ JOHN CASSIDY |
| John Cassidy, Treasurer |
|
| Date DECEMBER 31, 2013 |
| * | Print the name and title of each signing officer under his or her signature. |
4