UNITED STATES
SECURITIES AND EXCHANGE COMMISSION
Washington, D.C. 20549
FORM N-CSR
CERTIFIED SHAREHOLDER REPORT OF REGISTERED
MANAGEMENT INVESTMENT COMPANIES
Investment Company Act file number 811-4840
The Tocqueville Trust
(Exact name of registrant as specified in charter)
The Tocqueville Trust
40 W. 57th St., 19th Floor
New York, NY 10019
(Address of principal executive offices) (Zip code)
Robert W. Kleinschmidt
The Tocqueville Trust
40 W. 57th St., 19th Floor
New York, NY 10019
(Name and address of agent for service)
(212) 698-0800
Registrant’s telephone number, including area code
Date of fiscal year end: October 31
Date of reporting period: October 31, 2015
| Item 1. | Reports to Stockholders. |

The Tocqueville Trust
Mutual Funds
Annual Report
October 31, 2015
The Tocqueville Fund
The Tocqueville Opportunity Fund
The Tocqueville International Value Fund
The Tocqueville Gold Fund
The Delafield Fund
The Tocqueville Select Fund
The Tocqueville Alternative Strategies Fund

This report is not authorized for distribution to prospective investors unless preceded or accompanied by a currently effective prospectus of The Tocqueville Trust. Please call 1-800-697-FUND (3863) for a free prospectus. Read it carefully before you invest.
You are invited to visit our website @ www.tocqueville.com/mutual-funds
Chairman’s Letter
Dear Fellow Shareholder,
In our last report to you, (April 30, 2015), I worried that too much complacency prevailed in the investment community and that this, rather than any specific political or economic development, constituted the main investment danger.
Since then, additional sources of fundamental concern have surfaced. On the economic front, continued deceleration in China has weighed on the prices of industrial commodities, from oil to copper, steel and aluminum. Combined with the recent strength of the U.S. dollar, this constitutes a significant headwind for US industrial profits. On the political front, I hardly need to recite the litany of terrorist acts and the chaos that they have engineered both in human lives and in massive migrations.
In spite of this deterioration in the political and economic environment, however, popular stock market indices like the S&P 500 gained about 3% in the past fiscal year and are levitating close to their all-time highs. But this apparent strength may be misleading.
Internally, the US markets, along with a number of others, are giving some worrisome signals: The yield curve (long-term vs. short-term interest rates) is flattening, often a precursor of economic weakening. Meanwhile, high-yield (junk) credit is sending some distress signals—particularly but not only in energy and commodity-related industries. Indeed, corporate debt in general is now significantly higher than it was just before the onset of the 2007 financial crisis, as companies have massively borrowed money at record-low interest rates to fund increased dividends, share buybacks and acquisitions.
In the wake of all this, the “leadership” of the US stock market has narrowed steadily—usually a bad omen for overall stock prices. A leading newsletter recently pointed out that just nine stocks really have carried the S&P index since 2009—particularly since May 2015 when, in contrast, a growing number of component stocks have actually been in a declining trend.
Stock markets have been exhibiting a great deal of short-term volatility, often day-to-day. But there have not been significant corrections yet. My concern is that measuring and understanding current economic activity, always a challenge, has become even more complex.
China’s economy provides a very good example. Growth of the manufacturing and construction industries has fallen to the 1-3% range, as much of the early development catch up was completed. This slowdown has received a great deal of attention. But personal consumption and services, already around 40%-50% of the Chinese economy, have continued to grow at more than 10% per annum. The resulting growth rate of 5%-6% thus represents the average of two very different Chinese economies.
Globally, manufacturing and traditional activities have been sluggish, as reflected in the collapse of oil and other industrial metals, for example. But some other activities may not be accurately or entirely captured by existing statistics like the Gross Domestic Product. In particular, the so-called “circular” or “gig” economy is creating value and income by using previously unutilized capacity without requiring new investment or (sometimes) new full-time employment. This is the case for cars (Uber) or even apartments and houses (Airbnb), for example.
In a world in transition, trying to steer a large economy by using statistical averages or aggregates is tantamount to attempting to tune an auto carburetor while wearing boxing gloves. It is likely to result in our economic macro-managers doing too much or too little and the result should be increased cyclical volatility in the economy.
The new global concern with spreading terrorist activities and seemingly unstoppable flows of migrants is likely to tame or at least delay any central bank desire to curtail liquidity, whereas the increased spending on intelligence, security and military equipment, as well as the need to absorb and care for refugees does not bode well for developed countries’ budgetary rigor.
In this context, it is entirely possible that inflation, which has been taken for dead, may again raise its ugly head sooner than anticipated. Predictions are not very useful in investing, but it helps to be prepared.
Respectfully,

François Sicart
Chairman
The Tocqueville Fund
Dear Fellow Shareholder,
During the twelve month period ending October 31, 2015 growth stocks continued to outpace value names, a trend that has continued for more than the past five years. Slowly growing economies have tended to put a premium on companies that can demonstrate growth while the FED’s longstanding zero interest rate policy (“ZIRP”) has favored these same growth stocks with a lower discount rate by which to discount future growth and, hence, higher price earnings multiples. In this environment, value investors have had to run hard to keep pace, and most have fallen a step or two behind the markets whose indices are more heavily weighted by the large capitalization growth companies. (Small cap growth has also outperformed its small cap value peers during this time period). That said, classic value investors, among which we number ourselves, are driven by absolute, not relative returns, and here, over the past three and five years the news has been better. Double digit absolute returns over the three and five year periods may have moderately lagged the growth stock driven indices, but they have still added very substantially to portfolio values.
So, when does the worm turn? Growth versus value cycles tend to be long lasting, but this one is already fairly long in the tooth. Value investing substantially outperformed growth stock investing from 2000 through 2007, and the Fund benefitted handsomely as a result. Since then, the financial crisis, the historically weak economic recovery and ZIRP have combined to favor the growth names, most of which, by definition are too pricey to be owned by value contrarians. My best guess for when the pendulum starts to swing the other way is when interest rates begin to climb. Higher rates will compress price earnings ratios, particularly of high P/E growth stocks, and the higher rates themselves will likely be the result of better economic growth which will benefit cyclicals, materials producers and other traditional value names.
We need, however, to be very careful what we wish for. Higher rates may favor value over growth, but they may not generate better absolute returns than what we have enjoyed over the past several years, the current year notwithstanding. That said, the turn may well already be in process. The tumult in the markets since late August, particularly, suggests to this observer, that a sector rotation may be beginning. So be it, but, as bottom up, company specific, value investors, we do not focus on sector rotations. Rather, we look for solid companies at attractive valuations to buy and hold for the long term. Regardless of macro trends in the market, there will always be opportunities in these types of companies, albeit at some times more than others.
Performance of the Fund for the short-term twelve month period ended October 31, 2015 was an uninspiring 0.50%. This compares, and not favorably, to 5.20% for the market weighted S&P 500 Index, but in line with the 0.53% registered by the Russell 1000 Value Index, a measurement of large cap value names, over the same period.
Performance was most negatively impacted by our holdings in DeVry Education Group, a leader in an industry, for profit education, that the Obama administration seems determined to drive out of business. Our thesis, that the industry has a role to play in educating a segment of the population, and that the company is not only a survivor, but will likely flourish, particularly in its Brazilian operations, has not wavered. Indeed, as the Obama years draw to a close, we expect the pressure on the entire industry to subside. Lagging high quality technology companies, Qualcomm and Applied Materials, also detracted from our tepid results. More than these, however, it was Energy and commodity related companies, like Schlumberger, Energen, Noble Energy, Murphy Oil, Goldcorp, and BHP Billiton, which detracted significantly to returns. Despite the steep decline in commodity prices, a function, in part of slowing global growth in the period in general, and in China, in particular, we continue to believe that loose monetary policies around the globe will lead to higher levels of inflation and sharply higher commodity prices over our investment time horizon. What all these relatively poor performers have in common, however, is that they are high quality, companies trading at good value and with strong financials and ample staying power.
On the plus side, performance was buttressed by the strong performance of Amazon.com and Facebook, two growth names which we purchased earlier this year and last when they were deeply out of favor and much lower than today’s valuations. Biotech names, Alkermes, Allergan, the unfortunately named ISIS Pharmaceuticals, and Momenta Pharmaceuticals (also growth oriented companies purchased at bargain prices) were significant contributors, as were long-time holdings, General Electric and Microsoft, which came to life late in the year as a result of better earnings and well received structural changes in their business mix.
Looking out into the next twelve months, we expect the U.S. economy to continue to show moderate growth and interest rates to edge up moderately as well. This is not a bad environment for equites. That said, political developments will likely play a greater and greater role as the U.S. Presidential elections begin to hang over the market. Until the market decides what the new leadership will be, it would be reasonable to expect a desultory market. Of course, debate over FED policy will also influence the averages. Given the politicized nature of the FED, it would be very surprising indeed to see an aggressive policy of interest rate increases during an election year. Our take is that whoever is elected will be more business and tax friendly than the current administration, and, as a result, the U.S. economy, all other things being equal (which is never the case) should continue to grow, even at an accelerated pace, over the next twelve to twenty four months. If this is the environment, we would hope and expect our large cap value names to participate fully in the growth.
As one of the largest individual shareholders of the Fund, as well as its portfolio manager, let me take this opportunity to express my thanks for your continued interest and support of the Tocqueville Fund.
Sincerely,

Robert W. Kleinschmidt
Portfolio Manager
The Tocqueville Fund
(Unaudited)
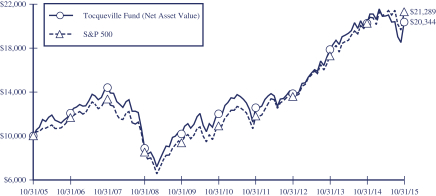
This chart assumes an initial gross investment of $10,000 made on 10/31/05. Returns shown do not reflect the deduction of taxes that a shareholder would pay on fund distributions or the redemption of fund shares. Performance reflects fee waivers in effect. In the absence of fee waivers, total return would be reduced. Returns shown include the reinvestment of all dividends and other distributions. Past performance is not predictive of future performance. Investment return and principal value will fluctuate so that your shares, when redeemed, may be worth more or less than their original cost.
The Standard & Poor’s 500 Stock Index (S&P 500) is a capital-weighted index, representing the aggregate market value of the common equity of 500 stocks primarily traded on the New York Stock Exchange. Returns assume the reinvestment of all dividends.
AVERAGE ANNUAL RATE OF RETURN (%)
FOR PERIODS ENDED OCTOBER 31, 2015
| | | | | | | | | | | | | | | | |
| | | 1 Year | | | 3 Year | | | 5 Year | | | 10 Year | |
The Tocqueville Fund | | | 0.50% | | | | 13.73% | | | | 11.15% | | | | 7.36% | |
Standard & Poor’s 500 Stock Index | | | 5.20% | | | | 16.20% | | | | 14.33% | | | | 7.85% | |
The Tocqueville Opportunity Fund
Dear Fellow Shareholder,
The Fund outperformed its SMID cap (Small/Midcap) growth benchmark index, the Russell 2500 Growth Index, for the fiscal year ended October 31, 2015, with an increase of 9.07% versus the benchmark’s increase of 4.17%. For the calendar year-to-date through October 31, 2015, the Fund also outperformed the Russell 2500 Growth Index 4.75% versus 1.18% respectively. During calendar year 2015, the Fund gained 19.67% from the start through a closing high on July 20, 2015. Prices of small, mid and large-cap issues then commenced a significant and dramatic decline which persisted into late September—at the close on September 29th, the Fund had declined 19.79% from its all-time historical peak just two months before. As we wrote in our fiscal 2014 letter, corrections of magnitude are nothing too unusual for SMID cap growth investors. Almost like clockworks, the corrections have been spaced into intervals about 7-8 months apart, have lasted 1-3 months, and the upward trajectory prices have quickly resumed. Since the closing low of the most recent correction on September 29th, the Fund appreciated 9.12% through the October fiscal end. There are plenty of explanations for this year’s turbulence, but most center on the same “growth scares” which have haunted financial markets since the recession of 2008 and the annual EU macro issues (Euro, Greece, Quantitative Easing). China’s slowdown this year threw an unexpected bucket of cold water on any optimism that global economies were improving. In addition, steady weakness in oil and commodity prices has not improved investors’ confidence in sustainable growth.
Ultimately, we still believe that intermittent corrections are driven far more by sentiment than by fundamentals. There is a positive case to be made for corrections and all investors should keep these reasons in mind: 1) shake out weak players, 2) compress speculation, 3) improve valuation, 4) provide opportunity to buy into or increase investment in winners and, 5) prove that markets and prices actually are frequently not efficient!
Over the past year, we have continued to increase investment in the Healthcare and Technology sectors to 35.6% and 24.2% respectively while maintaining investments in the Consumer sector at 19%, with holdings in both discretionary and staples issues. Increased investment has been funded predominantly with reductions in economy sensitive issues including Industrials (Durables, Materials and Transportation) and Financials. As the fiscal year concluded, the Fund held no direct investments in Energy sector holdings. Given the persistently weak and uncertain economic backdrop, we have reduced cyclical exposures on a continuing basis through the year—Industrials and Financials now account for just over 20% of the Fund’s fiscal year-end investments.
Healthcare, Technology and Consumer issues drove over 80% of the Fund’s fiscal year performance of 9.07%; with Healthcare issues alone accounting for nearly one-third of the Fund’s return. However, on a relative basis Consumer investments were the clear engine of excess performance and despite being 20% of investments, these issues provided more than 25% of the Fund’s return over the benchmark. Due to the significant underweighted exposure to cyclicals and energy, the Fund also gained relative performance in the Industrials, Materials, and Energy sectors—Energy sector investments (or the lack thereof) were the fourth leading relative performer. The Fund’s sector investments outperformed nine of the ten Sector classifications—the 10th, Telecommunications Services, underperformed by 1/100 of 1%.
The Fund continued to benefit significantly from merger activities over the past fiscal year. Having experienced twelve significant takeovers; ten in Healthcare issues, which drove nearly 4.5% of the Fund’s total return for the fiscal year. While takeovers provide surprisingly pleasant windfalls, losing an established and significant holding to a large-cap buyer requires that we restructure the portfolio empty space as soon as possible, but also without increased risk. During the course of the year we invested in a number of very interesting companies which are advancing new therapies against rare diseases and cancers. Often we are provided opportunities to continue to hold and to increase investments with the benefit of significant corporate investment which shores up the finances, the trials, the potential marketing and the FDA approval process—not as amazing as an outright takeover, but pretty darn good. Finally, there has recently been media and political
attention focused upon the Healthcare sector which we believe has had little impact to the fundamentals which are driving the current revolution in addressing diseases and genetically based disabilities.
Seven of the Fund’s top ten contributors were Healthcare issues, two were Technology issues and one was a Consumer investment. Pharmacyclics (#1), Auspex (#2) and Incyte (#4) were top five performers, and tech leaders also rounded out the best five—Manhattan Associates (#3) and Palo Alto Networks (#5). Despite the good successes, not all Healthcare investments turned to cream—Puma Biotechnology (lung cancer) dinged the Fund’s performance for approximately 0.5% and was its worst investment over the year. Investments in Atara Biotherapeutics, Intercept Pharmaceuticals and Agios Pharmaceuticals were hit hard during the 2015 correction and significantly impacted performance—on a relative basis, the aforementioned three were the worst performers relative to the benchmark as well.
As the year ended, the Top Ten holdings comprised nearly 16% of the Fund. Although most of the takeovers occurred in the Healthcare sector, the Fund actually increased the weighting in this sector with an increased number of smaller investments in mid stage to late stages of development—we believe that this significantly diversified approach will provide a lower risk profile with increased opportunities for wins. Although the Fund is diversified, we have continued to maintain a very active profile relative to the benchmark—of the top 50 positions, 83% of the investments are “active” versus the benchmark.
As we look toward the new fiscal year, we want to remain particularly focused on any sustained rebound in economic activity which would benefit cyclical issues which have faced many headwinds. We continue to apply a fundamental approach in a classic effort to identify and invest in companies with leading innovation, market share and vision. The goal is to own the companies which can sustain and bolster competitive advantage in order that they can continue to invest to grow. Finally, we greatly appreciate your ongoing confidence in our efforts on behalf of the Fund and its shareholders.
Sincerely,

Thomas R. Vandeventer
Portfolio Manager
The Tocqueville Opportunity Fund
(Unaudited)
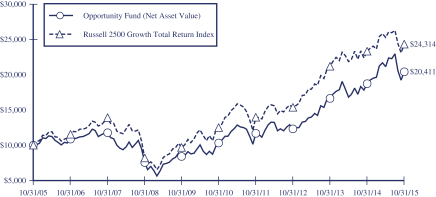
This chart assumes an initial gross investment of $10,000 made on 10/31/05. Returns shown do not reflect the deduction of taxes that a shareholder would pay on fund distributions or the redemption of fund shares. Returns shown include the reinvestment of all dividends and other distributions. Past performance is not predictive of future performance. Investment return and principal value will fluctuate so that your shares, when redeemed, may be worth more or less than their original cost.
The chart and table reflect The Opportunity Fund’s performance achieved prior to the changes effected in 2010 to its investment strategy.
The Russell 2500 Growth Total Return Index is an unmanaged index that measures the performance of the small to mid-cap growth segment of the U.S. equity universe. It includes those Russell 2500 companies with higher price-to-book ratios and higher forecasted growth values. Returns assume the reinvestment of all dividends.
AVERAGE ANNUAL RATE OF RETURN (%)
FOR PERIODS ENDED OCTOBER 31, 2015
| | | | | | | | | | | | | | | | |
| | | 1 Year | | | 3 Year | | | 5 Year | | | 10 Year | |
The Tocqueville Opportunity Fund | | | 9.07% | | | | 18.36% | | | | 14.64% | | | | 7.40% | |
Russell 2500 Growth Total Return Index | | | 4.17% | | | | 16.48% | | | | 14.25% | | | | 9.29% | |
The Tocqueville International Value Fund
Dear Fellow Shareholder,
For the fiscal year ended October 31, 2015, the Fund’s total U.S. dollar return was 7.15%. In the same period, the Morgan Stanley EAFE Index Net, the index against which the Fund is most often compared, had a net total U.S. dollar loss of 0.07%. For the 10-year period ended October 31, 2015, the Fund’s total U.S. dollar return was 68.25%. In the same period, the Morgan Stanley EAFE Index Net had a net total U.S. dollar return of 48.80%.
During the fiscal year, global equity markets were mixed. Developed markets made gains in local currency terms, supported by improving corporate earnings in Japan, mergers and acquisitions activity, the potential salutary effects of low oil prices, and lax monetary policy. This occurred despite periodic concerns about the integrity of the Eurozone, weak economic data and volatile markets in China, and the implications of weak commodity prices for commodity dependent emerging market economies. The U.S. dollar increased in value against most currencies, amplifying a decline in commodity prices, which led to declines in the currencies and equity markets of commodity producing nations, and led to negative returns in the Eurozone in U.S. dollar terms. Spreads on high yield debt, a measure of financial risk, widened substantially, and equity market volatility increased. Japan, Ireland and Denmark were among the best performing markets globally, while commodity dependent countries like Brazil, and emerging markets in Asia were among the worst. In terms of sectors, auto and auto related, paper and forest products, travel and leisure, transport and electricity were among the best performers, while oil and gas and mining stocks were among the worst.
The Fund’s portfolio benefitted from a low exposure to the commodity complex and emerging markets, as well as stock selection in the consumer, materials and information technology areas. Notable contributors to profits were French IT consulting and software concern Sopra Group, Ireland based fuel distribution company DCC, Japanese cosmetics makers Shiseido and Kao, Japanese semiconductor manufacturing toolmaker Disco, U.K. design software concern Aveva (subject of a strategic investment by Schneider Electric), Samsung Electronics, and Dutch specialty chemicals producer Royal Ten Cate (subject of a takeover offer). Meaningful losses were limited to global copper and energy concern FreeportMcMoRan, Japanese conglomerate Hitachi, French marketing research concern Ipsos, and Hong Kong based Television Broadcasts.
The Fund exited positions in Japanese imaging technology company Fujifilm, Swedish building products company Lindab, Japanese semiconductor equipment manufacturing toolmaker Disco, French wire and cable producer Nexans, Japanese Mitsubishi UFJ Financial, and German truck parts maker SAF Holland, as they approached our estimates of fair value. The Fund also exited Freeport McMoRan and Vallourec as our estimates of medium-term earnings power were undercut by the steep decline in oil prices, and the position in Norwegian chemical storage and transport concern Stolt Nielsen following a reduction of our estimate of the company’s intrinsic value.
Overall, there was a decrease in the Fund’s exposure to Japan and an increase in its exposure to Europe, where we have been finding the most attractive values. The fiscal year began with approximately 7% in cash reserves and finished with roughly 10% in cash reserves.
Our macro view, in short, is that the global economy will continue to grow at a modest pace. Europe should continue to show modest economic recovery with the help of a cheap currency and low interest rates, and corporate earnings should continue to improve. In Japan, the domestic economy is sluggish, but real wages are improving and corporate profit margins continue to expand. China has been the cause of much angst and confusion, which led to questions about global growth and also an increase in the risk premium attached to equities globally. As we have said in prior letters, China is decelerating as it seeks to affect a shift from industrial led growth to consumer and services led growth. This reality does have implications for the business fundamentals of individual companies, and even for individual countries, but it does not, in our view, represent a risk to the global economy at present.
Overall, we continue to believe that the backdrop for stock pickers is constructive and we aim to take advantage of increased volatility as misplaced fear creates mispricing opportunities. In this context, we continue to focus our research efforts on idiosyncratic situations. We continue to focus attention both in Europe and Japan on companies that have the opportunity to create value by improving profit margins and capital allocation practices. Finally, true to our contrarian bent, we continue to investigate companies that may be oversold because the market misapprehends the nature or degree of their exposure to emerging markets or commodities.
As always, we aim to protect and grow your capital, by identifying companies that have defensible business franchises, pricing power, limited financial leverage and the ability to return cash to shareholders, and which are misunderstood by the market causing them to trade at a discount to intrinsic value based on future cash flows in a conservative economic growth scenario.
Sincerely,

James Hunt
Portfolio Manager
The Tocqueville International Value Fund
(Unaudited)
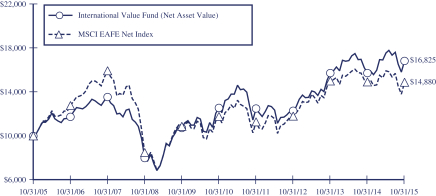
This chart assumes an initial gross investment of $10,000 made on 10/31/05. Returns shown do not reflect the deduction of taxes that a shareholder would pay on fund distributions or the redemption of fund shares. Performance reflects fee waivers in effect. In the absence of fee waivers, total return would be reduced. Returns shown include the reinvestment of all dividends and other distributions. Past performance is not predictive of future performance. Investment return and principal value will fluctuate so that your shares, when redeemed, may be worth more or less than their original cost.
The MSCI EAFE Index is an unmanaged market-capitalization-weighted index composed of companies representative of the market structure of 21 Developed Market Countries in Europe, Australia, Asia and the Far East.
AVERAGE ANNUAL RATE OF RETURN (%)
FOR PERIODS ENDED OCTOBER 31, 2015
| | | | | | | | | | | | | | | | |
| | | 1 Year | | | 3 Year | | | 5 Year | | | 10 Year | |
The Tocqueville International Value Fund | | | 7.15% | | | | 11.02% | | | | 6.03% | | | | 5.34% | |
MSCI EAFE Net Index | | | -0.07% | | | | 8.02% | | | | 4.81% | | | | 4.05% | |
The Tocqueville Gold Fund
Dear Fellow Shareholder,
It has been a very challenging market environment for the precious metals and commodity markets during the fiscal year ended October 31, 2015. During the period, gold declined 2.6%, finishing at US$1,141.40 per oz., while the Fund returned -14.29%, versus the S&P 500’s return of 5.20%, as investors dwelled on monetary policy and re-assessed the outlook for commodity and emerging markets. Comparatively, the Philadelphia Gold and Silver Index (XAU) declined 19.79%. Global investors have increasingly become more concerned over a slowdown in global growth as Chinese markets and economic fundamentals deteriorated. The markets’ assessment of the U.S. Federal Reserve’s interest rate posture during the period also weighed on gold prices and more so on gold equities. Gold recovered from its July low as the U.S. Federal Reserve left rates unchanged in September, while concern over global economic growth continued.
During the period, the Fund’s physical gold exposure helped reduce volatility in the Fund; while mergers and acquisition activity among portfolio holdings provided a positive contribution. In addition to the acquisition of holdings in Silvercrest, the position in Romarco was acquired. Another portfolio holding, Oceanagold, acquired Romarco which we view as a positive for both companies. Alamos Gold completed a merger during the year and we added to the position as the prospects for the company have improved and we feel the valuation is compelling. Exploration success at Mag Silver Corp. provided a positive contribution during the period. The same was true for Agnico-Eagle, which has also been successful at reducing operating costs and improving its production profile. Premier Gold is a position added to over the past year as we have become more enthusiastic with their strategy of pursuing joint ventures with some of the major companies. Exposure to Yamana Gold was eliminated as we believe their high debt levels at lower gold prices could be very challenging for the company. Positions in royalty companies Franco-Nevada, Royal Gold and Silver Wheaton were also trimmed. Royalty companies have come under valuation pressure as the royalty space has become more competitive and as investors reduced their exposure.
Gold mining companies’ reports over the past several quarters showed continued improvement in terms of operating costs from lower oil prices and for non-U.S. based operations that benefit from weak currencies. The discipline and focus the industry has shown is much improved compared to several years ago. We are encouraged by the fundamentals for the companies in the portfolio. They have sound balance sheets, with excellent assets, are well financed and they are demonstrating they can generate quality cash flow. These are the type of companies we will continue to seek out and emphasize. This will be important as a lack of investment in gold deposits and new mine development will present a much more constructive gold price which will benefit the stronger companies, such as the ones the Fund owns.
We believe a constructive environment for gold will develop as markets recognize monetary policy as faulty. Supporting a positive outlook is the consistent demand from Asian markets, which we think could lead to a short squeeze for gold trading intermediaries. Over the past few months, demand picked up in China on concerns regarding the volatility of its domestic stock market. Certainly on a psychological level, we believe gold should benefit when the historically reliable cycle of descent from euphoria and well-being to discomfort and malaise starts to kick in.
Sincerely,
| | |
 | |  |
| |
| John C. Hathaway | | Douglas B. Groh |
| Portfolio Manager | | Portfolio Manager |
The Tocqueville Gold Fund
(Unaudited)
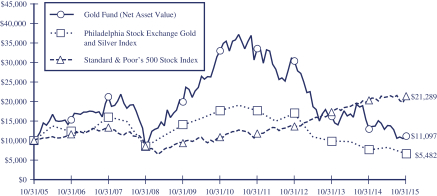
This chart assumes an initial gross investment of $10,000 made on 10/31/05. Returns shown do not reflect the deduction of taxes that a shareholder would pay on fund distributions or the redemption of fund shares. Returns shown include the reinvestment of all dividends and other distributions. Past performance is not predictive of future performance. Investment return and principal value will fluctuate so that your shares, when redeemed, may be worth more or less than their original cost. The Fund imposes a 2% redemption fee on shares held 90 days or less.
In 2006, 2009, and 2010 the performance of The Tocqueville Gold Fund was achieved during a period of unusually favorable market conditions. Such performance may not be sustainable.
The Philadelphia Stock Exchange Gold and Silver Index is an unmanaged capitalization-weighted index which includes the leading companies involved in the mining of gold and silver. Returns include the reinvestment of all dividends.
The Standard & Poor’s 500 Stock Index (S&P 500) is a capital-weighted index, representing the aggregate market value of the common equity of 500 stocks primarily traded on the New York Stock Exchange. Returns include the reinvestment of all dividends.
AVERAGE ANNUAL RATE OF RETURN (%)
FOR PERIODS ENDED OCTOBER 31, 2015
| | | | | | | | | | | | | | | | |
| | | 1 Year | | | 3 Year | | | 5 Year | | | 10 Year | |
The Tocqueville Gold Fund | | | -14.29% | | | | -28.41% | | | | -19.50% | | | | 1.05% | |
Philadelphia Stock Exchange Gold and Silver Index | | | -19.79% | | | | -34.08% | | | | -22.86% | | | | -5.82% | |
Standard & Poor’s 500 Stock Index | | | 5.20% | | | | 16.20% | | | | 14.33% | | | | 7.85% | |
The Delafield Fund
Dear Fellow Shareholder,
Stock markets experienced a fair bit of volatility during the latest fiscal year. Despite the Federal Reserve’s October 2014 decision to effectively end the Quantitative Easing program, investors were initially encouraged by continued signs of strength in the U.S. economy as well as solid third quarter earnings and drove gains in the major indices to start off the first fiscal quarter. Markets then experienced a new year’s hangover in January 2015, wiping out their earlier gains on a further drop in oil prices, the surge in the U.S. dollar and renewed worries about international economic activity, particularly in China. In the second fiscal quarter, generally benign international headlines, coupled with improved U.S. fundamental economic and corporate data helped fortify investors and indices rebounded to intra-quarter levels just shy of record highs. In aggregate, major indices posted low to mid-single digit returns for the first half of the fiscal year.
The troublesome worldwide issues which occasionally bubbled up in the first half were more pronounced during the latter six months of the fiscal year. The slowdown in China’s growth seemingly accelerated, energy prices remain subdued, the Russian economy slid into recession, and the situation in the Middle East became more explosive. On the domestic front, the interest rate situation remained in a state of flux, though interest rate concerns were somewhat mitigated by continued modest improvement in our economic data, including unemployment, wages, and housing and automotive markets. On account of this uncertainty, monthly market gyrations continued in the second half of the fiscal year, but the overall tone was decidedly more cautious, and overall, indices struggled to eke out gains, with several finishing in the red.
During this period of volatility, the operational performance of the Fund’s investments largely continued to track to our expectations, and yet, the Fund underperformed the market. For the twelve months ended October 31, 2015, the Fund’s net asset value decreased 12.27% to $28.64 per share. During the same period, on a total return basis, the Russell 2000 Index (“Russell 2000”) posted a 0.34% increase, while the Standard & Poor’s 500 Index (“S&P 500”) increased 5.20%. Owing to the smaller average market capitalization of companies in the Russell 2000, we view it as the more appropriately comparative index to the Fund.
The global instability described earlier presented a challenge to us, with investors choosing to avoid industrials and materials stocks, which were perceived to be vulnerable to the slowdown in China, the energy sector’s woes, and a strong dollar. Many of the portfolio’s holdings were (and remain) within these sectors and their market values have indeed declined, even while their operations have continued to be satisfactory and their respective paths to value creation continue to progress. While the materials stocks outperformed the comparable benchmark holdings, they experienced substantial declines, particularly those with metal exposure, including, Allegheny Technologies, Carpenter Technologies, Ryerson Holding Corporation, and Universal Stainless & Alloy Products, Inc. Owing to the large weighting of materials stocks in the portfolio, the sector detracted from the Fund’s relative performance by about 350 basis points. With respect to these metal oriented holdings, their more basic operations have been depressed as end users are reluctant to place orders while the prices of underlying commodities are weak. However, we believe that eventually destocking will come to an end, demand will improve and when this occurs, it is likely their share prices will rise to reflect the renewed outlook, so we continue to hold them.
The Fund’s exposure to the rapid decline in oil prices was also particularly painful on an absolute and relative basis. The direct energy sector holdings declined about 55% during the period, accounted for slightly more than 5% of our assets, and detracted from relative performance by close to 200 basis points. Further, the tangential exposure in the portfolio to energy was substantial, and the resulting consequences unanticipated. This was most evident in the industrials sector, where Dover Corporation and WESCO International, Inc. experienced declines related to energy prices as a result of end market exposure. In aggregate, we estimate that energy related weakness impacted relative performance by more than 400 basis points during the fiscal year.
Despite the challenges, the companies in the Fund’s portfolio, on the whole, are advancing on their internal initiatives, are generating free cash flow (our number one criteria for a successful company), are restructuring where required to improve return on invested capital and, due to the decline in commodity prices, seeing their cost of doing business improve. We believe that the divergence we have experienced between the performance of the portfolio and the actual operations of the underlying companies has enhanced the value opportunity of the holdings. To illustrate this point, consider that the average price-to-earnings multiple of the Fund has declined to below 14 times, and perhaps more importantly, the average free cash flow yield of our investments is now approaching 10%.
We recall Ben Graham’s doctrine that in the short term the market is a voting machine but in the long term it is a weighing machine. We believe that our companies are putting on weight and, as their profits and returns improve, they will become more valuable. Supportive of this, we are seeing increasing numbers of company executives and directors buying shares in the open market, usually a good sign of a market bottom. Still, for a strong long-term market to prevail, investors will have to regain confidence in the global economic and political outlook.
Sincerely,
| | |
 | |  |
| |
| J. Dennis Delafield | | Vincent Sellecchia |
| Portfolio Manager | | Portfolio Manager |
The Delafield Fund
(Unaudited)
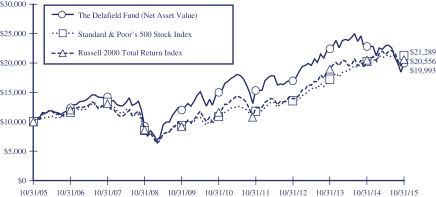
This chart assumes an initial gross investment of $10,000 made on 10/31/05. Since the Delafield Fund did not commence operations until 9/28/09, returns prior to that date are those of the Predecessor Fund. The Delafield Fund assumed the net asset value and performance history of the Predecessor Fund (See Footnote 1 to the Financial Statements). Returns shown do not reflect the deduction of taxes that a shareholder would pay on fund distributions or the redemption of fund shares. Performance reflects fee waivers in effect. In the absence of fee waivers, total return would be reduced. Returns shown include the reinvestment of all dividends and other distributions. Past performance is not predictive of future performance. Investment return and principal value will fluctuate so that your shares, when redeemed, may be worth more or less than their original cost.
The Standard & Poor’s 500 Stock Index (S&P 500) is a capital-weighted index, representing the aggregate market value of the common equity of 500 stocks primarily traded on the New York Stock Exchange. Returns include the reinvestment of all dividends.
The Russell 2000 Total Return Index is an unmanaged index that measures the performance of the 2,000 smallest companies in the Russell 3000 Index, which represent approximately 10% of the total market capitalization of the Russell 3000 Index. Returns include the reinvestment of all dividends.
AVERAGE ANNUAL RATE OF RETURN (%)
FOR PERIODS ENDED OCTOBER 31, 2015
| | | | | | | | | | | | | | | | |
| | | 1 Year | | | 3 Year | | | 5 Year | | | 10 Year | |
The Delafield Fund | | | -12.27% | | | | 5.58% | | | | 5.92% | | | | 7.17% | |
Standard & Poor’s 500 Stock Index | | | 5.20% | | | | 16.20% | | | | 14.33% | | | | 7.85% | |
Russell 2000 Total Return Index | | | 0.34% | | | | 13.90% | | | | 12.06% | | | | 7.47% | |
The Tocqueville Select Fund
Dear Fellow Shareholder,
For the twelve months ended October 31, 2015, the Fund’s net asset value decreased 7.96% to $12.08 per share. During the same twelve months, on a total return basis, the Russell 2500 Index (“Russell 2500” or “the Index”) posted a 1.50% increase, while the Russell 2000 Index (“Russell 2000”) increased 0.34%.
Stock markets experienced a fair bit of volatility during the latest fiscal year. Despite the Federal Reserve’s October 2014 decision to effectively end the Quantitative Easing program, investors were initially encouraged by continued signs of strength in the US economy as well as solid third quarter earnings and drove gains in the major indices to start off the first fiscal quarter. Markets then experienced a new year’s hangover in January 2015, wiping out their earlier gains on a further drop in oil prices, the surge in the U.S. dollar and renewed worries about international economic activity, particularly in China. In the second fiscal quarter, generally benign international headlines, coupled with improved U.S. fundamental economic and corporate data helped fortify investors and indices rebounded to intra-quarter levels just shy of record highs. In aggregate, major indices posted low to mid-single digit returns for the first half of the fiscal year.
The troublesome worldwide issues which occasionally bubbled up in the first half were more pronounced during the latter six months of the fiscal year. The slowdown in China’s growth seemingly accelerated, energy prices remain subdued, the Russian economy slid into recession, and the situation in the Middle East became more explosive. On the domestic front, the interest rate situation remained in a state of flux, though interest rate concerns were somewhat mitigated by continued modest improvement in our economic data, including unemployment, wages, and housing and automotive markets. On account of this uncertainty, monthly market gyrations continued in the second half of the fiscal year, but the overall tone was decidedly more cautious, and overall, indices struggled to eke out gains, with several finishing in the red.
The Fund’s performance during this volatile period was out of step with the market. The lack of exposure to the financials and health care sectors was a negative, as they were among the strongest in the Russell 2500 and represented close to 38% of the Index. In contrast, the Fund’s exposure to the rapid decline in oil prices was particularly painful on an absolute and relative basis. The direct energy sector holdings, which accounted for only a small weighting in the Fund, generated an outsized negative impact for the period. This was largely caused by the position in CONSOL Energy, Inc., which was the largest individual detractor to the performance of the Fund during the period. Consol was been buffeted by the decline in rival fuel prices, reduced demand for thermal coal, and an aggressive market sell-off of fossil fuel investments. In the meantime, the company is attempting to monetize its non-strategic natural resource assets, and is divesting other assets to help fund their developing natural gas operations, which, as they mature could be in position to be split from the coal business. We continue to believe the shares to be undervalued and have continued to hold the position. Further, the tangential exposure in the portfolio to energy was substantial, and the resulting consequences unanticipated. This was most evident in the industrials sector, where Dover Corporation and WESCO International, Inc. experienced declines related to energy prices as a result of end market exposure. In aggregate, we estimate that energy related weakness impacted relative performance by close to 500 basis points during the fiscal year.
The global instability described above also presented a challenge to us, with investors choosing to avoid industrials and materials stocks, which were perceived to be vulnerable to the slowdown in China, the energy sector’s woes, and a strong dollar. Many of the portfolio’s holdings were (and remain) within these sectors and their market values have indeed declined, even while their operations have continued to be satisfactory and their respective paths to value creation continue to progress. Among the materials stocks, Carpenter Technology Corporation was negatively impacted on account of its more basic commodity metal operations, which have been depressed as end users are reluctant to place orders while the prices of underlying commodities are weak. However, we believe that eventually destocking will come to an end, demand will improve and when this occurs, it is likely their share prices will rise to reflect the renewed outlook, so we continue to hold it as well.
Also impacting the materials sector, and the holdings in that space, was investor concern around economic conditions in China. This led, we’ve been told, to portfolio managers deciding to sell companies with measurable activities there. Several of the Fund’s materials holdings have exposure to China, albeit relatively modest in size with respect to sales and profits directly attributable to domestic Chinese consumption. These include two of our favorite holdings, Eastman Chemical Company, and Minerals Technologies Inc. which have 10% or less of their topline originating in Chinese markets. While their share prices were seemingly impacted by this exposure, these companies, for reasons unique to each one, are expected to show satisfactory profit growth in the region, and as this becomes evident, we believe their valuations will recover.
With respect to positive highlights for the year, the information technology sector holdings, which represented about 25% of the portfolio, strongly outperformed the comparable sector positioning in the Russell 2500. The information technology investments returned in excess of 24% for the fiscal year and contributed over 400 basis points to the relative return. Performance here was led by EPAM Systems, Inc. and j2 Global Inc. Electronic manufacturing service stocks also contributed favorably on the strength of solid earnings reports and improved outlooks.
Despite our challenges, the companies in the Fund’s portfolio, on the whole, are advancing on their internal initiatives, are generating free cash flow (our number one criteria for a successful company), are restructuring where required to improve return on invested capital and, due to the decline in commodity prices, seeing their cost of doing business improve. We believe that the divergence we have experienced between the performance of the portfolio and the actual operations of the underlying companies has enhanced the value opportunity of the holdings. We recall Ben Graham’s doctrine that in the short term the market is a voting machine but in the long term it is a weighing machine. We believe that our companies are putting on weight and, as their profits and returns improve, they will become more valuable.
Sincerely,
| | | | |
| | | |  |
| | |
| J. Dennis Delafield | | Vincent Sellecchia | | Donald Wang |
| Portfolio Manager | | Portfolio Manager | | Portfolio Manager |
The Tocqueville Select Fund
(Unaudited)
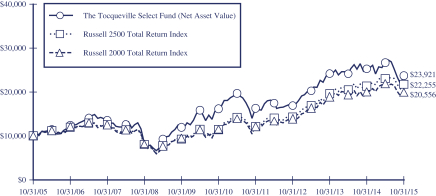
This chart assumes an initial gross investment of $10,000 made on 10/31/05. Since The Tocqueville Select Fund did not commence operations until 9/28/09, returns from the period from September 29, 2008 to September 27, 2009 are those of the Class Y Shares of the Predecessor Fund (See Footnote 1 to the Financial Statements). Prior to that period, returns shown are those of a limited partnership managed by the adviser. Returns shown do not reflect the deduction of taxes that a shareholder would pay on fund distributions or the redemption of fund shares. Performance reflects fee waivers in effect. In the absence of fee waivers, total return would be reduced. Returns shown include the reinvestment of all dividends and other distributions. Past performance is not predictive of future performance. Investment return and principal value will fluctuate so that your shares, when redeemed, may be worth more or less than their original cost.
In 2013 the performance of The Tocqueville Select Fund was achieved during a period of unusually favorable market conditions. Such performance may not be sustainable.
The Russell 2500 Total Return Index is an unmanaged index that measures the performance of the 2,500 smallest companies in the Russell 3000 Index. Returns include the reinvestment of all dividends.
The Russell 2000 Total Return Index is an unmanaged index that measures the performance of the 2,000 smallest companies in the Russell 3000 Index, which represents approximately 8% of the total market capitalization of the Russell 3000 Index. Returns include the reinvestment of all dividends.
AVERAGE ANNUAL RATE OF RETURN (%)
FOR PERIODS ENDED OCTOBER 31, 2015
| | | | | | | | | | | | | | | | |
| | | 1 Year | | | 3 Year | | | 5 Year | | | 10 Year | |
The Tocqueville Select Fund | | | -7.96% | | | | 11.83% | | | | 7.69% | | | | 9.11% | |
Russell 2500 Total Return Index | | | 1.50% | | | | 14.85% | | | | 13.07% | | | | 8.33% | |
Russell 2000 Total Return Index | | | 0.34% | | | | 13.90% | | | | 12.06% | | | | 7.47% | |
The Tocqueville Alternative Strategies Fund
Dear Fellow Shareholder,
The Fund continues to outperform the majority of its hedge fund and liquid alternative peers. Falling commodity prices, broken deals in the context of many large merger announcements, and increasing defaults in the lower part of the credit spectrum have been the primary headwinds for our peers. The Fund has not been immune to these headwinds, but we believe that our risk management has been good and we have maintained (and still maintain) a plentiful capital reserve to take advantage of opportunities as they have opened up.
During the fiscal year ended October 31, 2015, the most striking characteristic of the equity market has been the dominance of large capitalization technology stocks. Netflix and Amazon were up over 100% while Facebook and Google also posted very strong returns of 38% and 30%, respectively. To drive the point home, the NASDAQ 100 Index, which contains each of these names, was up +13.0%, in contrast to the flat Russell 2000 Index. Within the S&P 500 Index (“S&P 500”) itself, the total return of the equal-weighted S&P 500 was less than 1.0%, noticeably lower than the 5.2% return of the capitalization-weighted S&P 500. So, without exposure to large-cap technology, it was difficult to have done well in stocks.
Likewise, credit markets struggled except at the very top. The Barclay’s High Yield Index experienced spread widening of 145 basis point, which equates to a total return of -1.9% for the year. Pockets of credit, including energy, performed much worse, and hedging interest rate sensitivity (as we do) reduced the average total return more.
Over the twelve months ending October 31, 2015, the Fund was down 1.66% versus a total return of 5.20% for the S&P 500 and a loss of -3.46% for the HFRX North America Index (“HFRXNA”). Since the June 30, 2012, inception of the predecessor fund, the Fund has had an annualized return of 4.90% versus 15.92% for the S&P 500 and 3.19% for the HFRXNA. Although the Fund had positive contributions from its equity holdings and event driven strategies, the fixed income, convertible arbitrage and interest rate hedges were a significant drag, thanks to widening credit spreads and a dovish Fed.
Amazon stock was the largest positive contributor during the fiscal year. Amazon, which doubled from its lows, was the largest position during much of the fiscal year. When we bought the stock, we felt that it was trading on the value of its e-commerce business only, whereas there was perhaps more value in its cloud services business, Amazon Web Services; so we were not surprised the stock doubled, although we had not expected the rise to be so fast. Amazon made a more than two and a half percentage point contribution to the Fund’s performance.
The worst performing position was a corporate bond issued by W&T Offshore (Ticker: WTI), an oil and gas producer. We avoided energy equities throughout the fiscal year because of our negative view on oil prices. Nevertheless, we purchased W&T bonds at a discount because we felt, and still feel that the risk/reward relationship was and is (now) good. The market has been less sanguine, because the bonds have gone from 99 to 47 cents on the dollar. The Fund owned them at the beginning of the fiscal year and we bought more at 61 cents on the basis that the company had ready sources of liquidity and could cut capital expenditures dramatically. The company recently sold its onshore assets in the Permian Basin for approximately $375 million. The bonds are the dominant liability in WTI’s capital structure, are current pay, and are due in 2019. At the current price of 47 cents, these bonds carry a 35% yield to maturity (only if they mature). If the company is not eventually able to pay back the bonds, we nevertheless expect at least two more coupon payments and a recovery. Reflecting our strong risk management, this position, the biggest detractor from performance in the portfolio, accounted for less than ¾ of one percentage point of loss in the period and currently represents a manageable 77 basis points of Fund capital.
We are moving into fiscal 2016 with renewed optimism and enthusiasm for our endeavor as we deploy new ideas. In fact, we intend to capitalize on the stress in the capital markets, which we feel are overly negative in tone, particularly in certain sub-sectors such as health care and pharmaceuticals. We have added (or added to) quite a few health care names that have fallen sharply in market value over the last months, including Abbvie (ABBV), Allergan (AGN), Biogen (BIIB), Omeros (OMER) and PTC Therapeutics (PTCT). We have been net sellers of credit sensitive securities over the last few months, but we feel that prices are now more realistic, so we are looking to add to our credit exposure over the coming months.
In this context, let’s review our investment objectives: the Fund seeks higher returns and lower volatility than the S&P 500 Index over a three to five-year time horizon. Over shorter time periods, some Fund investors like to compare it to the HFRXNA. To be clear, we are not expecting to do better than the S&P 500 Index in every market condition or every part of the market cycle. Instead, through the use of the alternative strategies we deploy, the Fund seeks to generate absolute returns in a 1-2 year period with strategies that have modest, low or negative correlations to the broad indexes. We believe that the result will be an attractive return profile resulting in better risk-adjusted returns in aggregate than the S&P 500 Index over the entire cycle.
With the depth of Tocqueville research, our idea generation tools, an experienced team and the ability to go anywhere in the capital structure, we believe we have a sustainable process that will serve the Fund well in any market environment, including today’s. Thank you for investing with the Tocqueville Alternative Strategies Fund.
We hope to work for you for many years to come!
Sincerely,

Kenneth Lee
Portfolio Manager
| 1 | The performance information provided prior to June 30, 2014 is historical information for the Bridgehampton Value Strategies Fund (the “Predecessor Fund”), which was reorganized into the Tocqueville Alternative Strategies Fund on June 30, 2014. The Predecessor Fund was managed by Bridgehampton Capital Management LLC and has the same portfolio managers, investment objectives and investment strategies as the Tocqueville Alternative Strategies Fund. |
The Tocqueville Alternative Strategies Fund
(Unaudited)
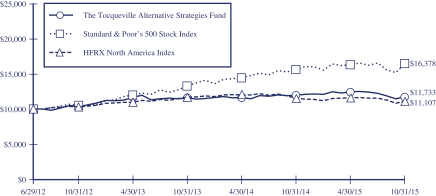
This chart assumes an initial gross investment of $10,000 made on June 29, 2012. Since the Tocqueville Alternative Strategies Fund did not commence operations until June 30, 2014, returns prior to that date are those of the Predecessor Fund (See Footnote 1 to the Financial Statements). Returns shown do not reflect the deduction of taxes that a shareholder would pay on fund distributions or the redemption of fund shares. Performance reflects fee waivers in effect. In the absence of fee waivers, total return would be reduced. Returns shown include the reinvestment of all dividends and other distributions. Past performance is not predictive of future performance. Investment return and principal value will fluctuate so that your shares, when redeemed, may be worth more or less than their original cost.
The Standard & Poor’s 500 Stock Index (S&P 500) is a capital-weighted index, representing the aggregate market value of the common equity of 500 stocks primarily traded on the New York Stock Exchange. Returns include the reinvestment of all dividends.
The HFRX North America Index is designed to reflect the performance of the North American region of the hedge fund universe. Regional Investment Focus is designed to reflect the primary focus of the Fund’s strategic exposure, over various market cycles, independent of the investment manager’s physical location or the domiciled registration location of the fund. Funds investing in North America typically have greater than 50% exposure in North America. Returns include the reinvestment of all dividends
AVERAGE ANNUAL RATE OF RETURN (%)
FOR PERIODS ENDED OCTOBER 31, 2015
| | | | | | | | | | | | |
| | | 1 Year | | | 3 Year | | | Inception(1) | |
The Tocqueville Alternative Strategies Fund | | | -1.66% | | | | 4.44% | | | | 4.90% | |
Standard & Poor’s 500 Stock Index | | | 5.20% | | | | 16.20% | | | | 15.92% | |
HFRX North America Index | | | -3.46% | | | | 2.50% | | | | 3.19% | |
| (1) | Inception of the Predecessor Fund was June 29, 2012. |
Expense Example—October 31, 2015 (Unaudited)
As a shareholder of The Tocqueville Trust (the “Funds”), you incur ongoing costs, including management fees; distribution fees; and other Fund expenses. This example is intended to help you understand your ongoing costs (in dollars) of investing in the Funds and to compare costs with the ongoing costs of investing in other mutual funds.
The Example is based on an investment of $1,000 invested at the beginning of the period and held the entire period (May 1, 2015-October 31, 2015).
Actual Expenses
The first line of the table below provides information about actual account values and actual expenses. You may use the information in this line, together with the amount you invested, to estimate the expenses that you paid over the period. Simply divide your account value by $1,000 (for example, an $8,600 account value divided by $1,000 = 8.6), then multiply the result by the number in the first line under the heading entitled “Expenses Paid During Period” to estimate the expenses you paid on your account during this period.
Hypothetical Example for Comparison Purposes
The second line of the table below provides information about hypothetical account values and hypothetical expenses based on the Funds’ actual expense ratios and an assumed rate of return of 5% per year before expenses, which is not the Funds’ actual return. The hypothetical account values and expenses may not be used to estimate the actual ending account balance or expenses you paid for the period. You may use this information to compare the ongoing costs of investing in the Funds and other funds. To do so, compare this 5% hypothetical example with the 5% hypothetical examples that appear in the shareholder reports of the other funds.
Please note that the expenses shown in the table are meant to highlight your ongoing costs only and do not reflect any transactional costs, such as sales charges (loads), redemption fees, or exchange fees. Therefore, the second line of the table is useful in comparing ongoing costs only, and will not help you determine the relative costs of owning different funds. In addition, if these transactional costs were included, your costs would have been higher.
Expense Example Tables (Unaudited)
The Tocqueville Fund
| | | | | | | | | | | | |
| | | Beginning
Account Value
May 1, 2015 | | | Ending
Account Value
October 31, 2015 | | | Expenses Paid
During Period*
May 1, 2015 -
October 31, 2015 | |
Actual | | $ | 1,000.00 | | | $ | 972.80 | | | $ | 6.27 | |
Hypothetical (5% return before expenses) | | | 1,000.00 | | | | 1,018.85 | | | | 6.41 | |
| * | Expenses are equal to the Fund’s annualized six-month expense ratio (including interest expense) of 1.26% for The Tocqueville Fund, multiplied by the average account value over the period, multiplied by 184/365 to reflect the one-half year period. |
The Tocqueville Opportunity Fund
| | | | | | | | | | | | |
| | | Beginning
Account Value
May 1, 2015 | | | Ending
Account Value
October 31, 2015 | | | Expenses Paid
During Period*
May 1, 2015 -
October 31, 2015 | |
Actual | | $ | 1,000.00 | | | $ | 965.30 | | | $ | 6.54 | |
Hypothetical (5% return before expenses) | | | 1,000.00 | | | | 1,018.55 | | | | 6.72 | |
| * | Expenses are equal to the Fund’s annualized six-month expense ratio (including interest expense) of 1.32% for The Tocqueville Opportunity Fund, multiplied by the average account value over the period, multiplied by 184/365 to reflect the one-half year period. |
The Tocqueville International Value Fund
| | | | | | | | | | | | |
| | | Beginning
Account Value
May 1, 2015 | | | Ending
Account Value
October 31, 2015 | | | Expenses Paid
During Period*
May 1, 2015 -
October 31, 2015 | |
Actual | | $ | 1,000.00 | | | $ | 959.90 | | | $ | 6.18 | |
Hypothetical (5% return before expenses) | | | 1,000.00 | | | | 1,018.90 | | | | 6.36 | |
| * | Expenses are equal to the Fund’s annualized six-month expense ratio of 1.25% for The Tocqueville International Value Fund, multiplied by the average account value over the period, multiplied by 184/365 to reflect the one-half year period. |
The Tocqueville Gold Fund
| | | | | | | | | | | | |
| | | Beginning
Account Value
May 1, 2015 | | | Ending
Account Value
October 31, 2015 | | | Expenses Paid
During Period*
May 1, 2015 -
October 31, 2015 | |
Actual | | $ | 1,000.00 | | | $ | 803.70 | | | $ | 6.73 | |
Hypothetical (5% return before expenses) | | | 1,000.00 | | | | 1,017.74 | | | | 7.53 | |
| * | Expenses are equal to the Fund’s annualized six-month expense ratio (including interest expense) of 1.48% for The Tocqueville Gold Fund, multiplied by the average account value over the period, multiplied by 184/365 to reflect the one-half year period. |
The Delafield Fund
| | | | | | | | | | | | |
| | | Beginning
Account Value
May 1, 2015 | | | Ending
Account Value
October 31, 2015 | | | Expenses Paid
During Period*
May 1, 2015 -
October 31, 2015 | |
Actual | | $ | 1,000.00 | | | $ | 872.40 | | | $ | 5.95 | |
Hypothetical (5% return before expenses) | | | 1,000.00 | | | | 1,018.85 | | | | 6.41 | |
| * | Expenses are equal to the Fund’s annualized six-month expense ratio of 1.26% for The Delafield Fund, multiplied by the average account value over the period, multiplied by 184/365 to reflect the one-half year period. |
The Tocqueville Select Fund
| | | | | | | | | | | | |
| | | Beginning
Account Value
May 1, 2015 | | | Ending
Account Value
October 31, 2015 | | | Expenses Paid
During Period*
May 1, 2015 -
October 31, 2015 | |
Actual | | $ | 1,000.00 | | | $ | 888.90 | | | $ | 6.57 | |
Hypothetical (5% return before expenses) | | | 1,000.00 | | | | 1,018.25 | | | | 7.02 | |
| * | Expenses are equal to the Fund’s annualized six-month expense ratio of 1.38% for The Tocqueville Select Fund, multiplied by the average account value over the period, multiplied by 184/365 to reflect the one-half year period. |
The Tocqueville Alternative Strategies Fund
| | | | | | | | | | | | |
| | | Beginning
Account Value
May 1, 2015 | | | Ending
Account Value
October 31, 2015 | | | Expenses Paid
During Period*
May 1, 2015 -
October 31, 2015 | |
Actual | | $ | 1,000.00 | | | $ | 943.50 | | | $ | 13.96 | |
Hypothetical (5% return before expenses) | | | 1,000.00 | | | | 1,010.84 | | | | 14.44 | |
| * | Expenses are equal to the Fund’s annualized six-month expense ratio (including interest expense and dividends and interest expense on short sales) of 2.85% for The Tocqueville Alternative Strategies Fund, multiplied by the average account value over the period, multiplied by 184/365 to reflect the one-half year period. |
The Tocqueville Fund
Financial Highlights
| | | | | | | | | | | | | | | | | | | | |
Per share operating performance
(For a share outstanding throughout
the year) | | Years Ended October 31, | |
| | 2015 | | | 2014 | | | 2013 | | | 2012 | | | 2011 | |
Net asset value, beginning of year | | $ | 34.18 | | | $ | 30.67 | | | $ | 24.11 | | | $ | 22.23 | | | $ | 21.53 | |
| | | | | | | | | | | | | | | | | | | | |
Operations: | | | | | | | | | | | | | | | | | | | | |
Net investment income (1) | | | 0.37 | | | | 0.28 | | | | 0.40 | | | | 0.40 | | | | 0.23 | |
Net realized and unrealized gain (loss) | | | (0.19 | ) | | | 3.78 | | | | 6.51 | | | | 1.81 | | | | 0.80 | |
| | | | | | | | | | | | | | | | | | | | |
Total from investment operations * | | | 0.18 | | | | 4.06 | | | | 6.91 | | | | 2.21 | | | | 1.03 | |
| | | | | | | | | | | | | | | | | | | | |
Distributions to shareholders: | | | | | | | | | | | | | | | | | | | | |
Dividends from net investment income | | | (0.25 | ) | | | (0.30 | ) | | | (0.35 | ) | | | (0.33 | ) | | | (0.33 | ) |
Distributions from net realized gains | | | (1.20 | ) | | | (0.25 | ) | | | — | | | | — | | | | — | |
| | | | | | | | | | | | | | | | | | | | |
Total distributions | | | (1.45 | ) | | | (0.55 | ) | | | (0.35 | ) | | | (0.33 | ) | | | (0.33 | ) |
| | | | | | | | | | | | | | | | | | | | |
Change in net asset value for the year | | | (1.27 | ) | | | 3.51 | | | | 6.56 | | | | 1.88 | | | | 0.70 | |
| | | | | | | | | | | | | | | | | | | | |
Net asset value, end of year | | $ | 32.91 | | | $ | 34.18 | | | $ | 30.67 | | | $ | 24.11 | | | $ | 22.23 | |
| | | | | | | | | | | | | | | | | | | | |
* Includes redemption fees per share of | | $ | 0.00 | (2) | | $ | 0.00 | (2) | | $ | 0.00 | (2) | | $ | 0.00 | (2) | | $ | 0.00 | (2) |
Total Return | | | 0.5 | % | | | 13.4 | % | | | 29.0 | % | | | 10.1 | % | | | 4.8 | % |
Ratios/supplemental data | | | | | | | | | | | | | | | | | | | | |
Net assets, end of year (000) | | $ | 309,267 | | | $ | 380,561 | | | $ | 348,269 | | | $ | 366,025 | | | $ | 491,541 | |
Ratio to average net assets: | | | | | | | | | | | | | | | | | | | | |
Expenses before waiver/reimbursement | | | 1.29 | % | | | 1.25 | % | | | 1.28 | % | | | 1.29 | % | | | 1.26 | % |
Expenses after waiver/reimbursement | | | 1.25 | % | | | 1.24 | % | | | 1.26 | %(3) | | | 1.26 | %(3) | | | 1.25 | % |
Net investment income before waiver/reimbursement | | | 0.91 | % | | | 0.84 | % | | | 1.33 | % | | | 1.30 | % | | | 0.97 | % |
Net investment income after waiver/reimbursement | | | 0.95 | % | | | 0.85 | % | | | 1.35 | % | | | 1.33 | % | | | 0.98 | % |
Portfolio turnover rate | | | 15 | % | | | 19 | % | | | 16 | % | | | 17 | % | | | 28 | % |
| (1) | Net investment income per share is calculated using the ending balance prior to consideration or adjustment for permanent book-to-tax differences. |
| (2) | Represents less than $0.01. |
| (3) | Includes 0.01% of interest expense which is not included in the Fund’s operating expense cap. |
The Accompanying Notes are an Integral Part of these Financial Statements.
The Tocqueville Opportunity Fund
Financial Highlights
| | | | | | | | | | | | | | | | | | | | |
Per share operating performance
(For a share outstanding throughout
the year) | | Years Ended October 31, | |
| | 2015 | | | 2014 | | | 2013 | | | 2012 | | | 2011 | |
Net asset value, beginning of year | | $ | 22.78 | | | $ | 21.29 | | | $ | 15.76 | | | $ | 14.96 | | | $ | 13.20 | |
| | | | | | | | | | | | | | | | | | | | |
Operations: | | | | | | | | | | | | | | | | | | | | |
Net investment loss (1) | | | (0.15 | ) | | | (0.22 | ) | | | (0.13 | ) | | | (0.11 | ) | | | (0.13 | ) |
Net realized and unrealized gain | | | 1.98 | | | | 2.80 | | | | 5.66 | | | | 0.91 | | | | 1.89 | |
| | | | | | | | | | | | | | | | | | | | |
Total from investment operations * | | | 1.83 | | | | 2.58 | | | | 5.53 | | | | 0.80 | | | | 1.76 | |
| | | | | | | | | | | | | | | | | | | | |
Distributions to shareholders: | | | | | | | | | | | | | | | | | | | | |
Dividends from net investment income | | | — | | | | — | | | | — | | | | — | | | | — | |
Distributions from net realized gains | | | (3.20 | ) | | | (1.09 | ) | | | — | | | | — | | | | — | |
| | | | | | | | | | | | | | | | | | | | |
Total distributions | | | (3.20 | ) | | | (1.09 | ) | | | — | | | | — | | | | — | |
| | | | | | | | | | | | | | | | | | | | |
Change in net asset value for the year | | | (1.37 | ) | | | 1.49 | | | | 5.53 | | | | 0.80 | | | | 1.76 | |
| | | | | | | | | | | | | | | | | | | | |
Net asset value, end of year | | $ | 21.41 | | | $ | 22.78 | | | $ | 21.29 | | | $ | 15.76 | | | $ | 14.96 | |
| | | | | | | | | | | | | | | | | | | | |
* Includes redemption fees per share of | | $ | 0.00 | (2) | | $ | 0.00 | (2) | | $ | 0.00 | (2) | | $ | 0.00 | (2) | | $ | 0.00 | (2) |
Total Return | | | 9.1 | % | | | 12.6 | % | | | 35.1 | % | | | 5.4 | % | | | 13.3 | % |
Ratios/supplemental data | | | | | | | | | | | | | | | | | | | | |
Net assets, end of year (000) | | $ | 153,456 | | | $ | 80,324 | | | $ | 80,609 | | | $ | 65,455 | | | $ | 46,963 | |
Ratio to average net assets: | | | | | | | | | | | | | | | | | | | | |
Expense | | | 1.31 | % | | | 1.30 | % | | | 1.30 | % | | | 1.32 | % | | | 1.36 | % |
Net investment loss | | | (0.95 | )% | | | (0.90 | )% | | | (0.64 | )% | | | (0.76 | )% | | | (1.04 | )% |
Portfolio turnover rate | | | 101 | % | | | 92 | % | | | 100 | % | | | 77 | % | | | 110 | % |
| (1) | Net investment loss per share is calculated using the ending balance prior to consideration or adjustment for permanent book-to-tax differences. |
| (2) | Represents less than $0.01. |
The Accompanying Notes are an Integral Part of these Financial Statements.
The Tocqueville International Value Fund
Financial Highlights
| | | | | | | | | | | | | | | | | | | | |
Per share operating performance
(For a share outstanding throughout
the year) | | Years Ended October 31, | |
| | 2015 | | | 2014 | | | 2013 | | | 2012 | | | 2011 | |
Net asset value, beginning of year | | $ | 14.48 | | | $ | 14.71 | | | $ | 11.68 | | | $ | 12.00 | | | $ | 12.12 | |
| | | | | | | | | | | | | | | | | | | | |
Operations: | | | | | | | | | | | | | | | | | | | | |
Net investment income (1) | | | 0.15 | | | | 0.15 | | | | 0.24 | | | | 0.17 | | | | 0.11 | |
Net realized and unrealized gain (loss) | | | 0.80 | | | | (0.15 | ) | | | 2.97 | | | | (0.37 | ) | | | (0.16 | ) |
| | | | | | | | | | | | | | | | | | | | |
Total from investment operations * | | | 0.95 | | | | — | | | | 3.21 | | | | (0.20 | ) | | | (0.05 | ) |
| | | | | | | | | | | | | | | | | | | | |
Distributions to shareholders: | | | | | | | | | | | | | | | | | | | | |
Dividends from net investment income | | | (0.32 | ) | | | (0.23 | ) | | | (0.18 | ) | | | (0.12 | ) | | | (0.07 | ) |
Distributions from net realized gains | | | (0.52 | ) | | | — | | | | — | | | | — | | | | — | |
| | | | | | | | | | | | | | | | | | | | |
Total distributions | | | (0.84 | ) | | | (0.23 | ) | | | (0.18 | ) | | | (0.12 | ) | | | (0.07 | ) |
| | | | | | | | | | | | | | | | | | | | |
Change in net asset value for the year | | | 0.11 | | | | (0.23 | ) | | | 3.03 | | | | (0.32 | ) | | | (0.12 | ) |
| | | | | | | | | | | | | | | | | | | | |
Net asset value, end of year | | $ | 14.59 | | | $ | 14.48 | | | $ | 14.71 | | | $ | 11.68 | | | $ | 12.00 | |
| | | | | | | | | | | | | | | | | | | | |
* Includes redemption fees per share of | | $ | 0.00 | (2) | | $ | 0.00 | (2) | | $ | 0.00 | (2) | | $ | 0.00 | (2) | | $ | 0.01 | |
Total Return | | | 7.2 | % | | | (0.0 | )% | | | 27.8 | % | | | (1.6 | )% | | | (0.5 | )% |
Ratios/supplemental data | | | | | | | | | | | | | | | | | | | | |
Net assets, end of year (000) | | $ | 333,762 | | | $ | 237,051 | | | $ | 262,981 | | | $ | 218,793 | | | $ | 199,848 | |
Ratio to average net assets: | | | | | | | | | | | | | | | | | | | | |
Expenses before waiver/reimbursement | | | 1.57 | % | | | 1.54 | % | | | 1.55 | % | | | 1.56 | % | | | 1.56 | % |
Expenses after waiver/reimbursement | | | 1.25 | % | | | 1.25 | % | | | 1.30 | %(3) | | | 1.56 | % | | | 1.56 | % |
Net investment income before waiver/reimbursement | | | 0.71 | % | | | 0.62 | % | | | 1.55 | % | | | 1.53 | % | | | 0.99 | % |
Net investment income after waiver/reimbursement | | | 1.03 | % | | | 0.91 | % | | | 1.80 | %(3) | | | 1.53 | % | | | 0.99 | % |
Portfolio turnover rate | | | 42 | % | | | 31 | % | | | 37 | % | | | 38 | % | | | 30 | % |
| (1) | Net investment income per share is calculated using the ending balance prior to consideration or adjustment for permanent book-to-tax differences. |
| (2) | Represents less than $0.01. |
| (3) | Expense cap of 1.25% was implemented on January 1, 2013. |
The Accompanying Notes are an Integral Part of these Financial Statements.
The Tocqueville Gold Fund
Financial Highlights
| | | | | | | | | | | | | | | | | | | | |
Per share operating performance
(For a share outstanding
throughout the year) | | Years Ended October 31, | |
| | 2015 | | | 2014 | | | 2013 | | | 2012 | | | 2011 | |
Net asset value, beginning of year | | $ | 30.38 | | | $ | 38.01 | | | $ | 72.82 | | | $ | 81.97 | | | $ | 82.00 | |
| | | | | | | | | | | | | | | | | | | | |
Operations: | | | | | | | | | | | | | | | | | | | | |
Net investment loss (1) | | | (0.27 | ) | | | (0.08 | ) | | | (0.26 | ) | | | (0.35 | ) | | | (0.67 | ) |
Net realized and unrealized gain (loss) | | | (4.07 | ) | | | (7.55 | ) | | | (32.93 | ) | | | (7.47 | ) | | | 2.25 | |
| | | | | | | | | | | | | | | | | | | | |
Total from investment operations * | | | (4.34 | ) | | | (7.63 | ) | | | (33.19 | ) | | | (7.82 | ) | | | 1.58 | |
| | | | | | | | | | | | | | | | | | | | |
Distributions to shareholders: | | | | | | | | | | | | | | | | | | | | |
Dividends from net investment income | | | — | | | | — | | | | — | | | | — | | | | — | |
Distributions from net realized gains | | | — | | | | — | | | | (1.62 | ) | | | (1.33 | ) | | | (1.61 | ) |
| | | | | | | | | | | | | | | | | | | | |
Total distributions | | | — | | | | — | | | | (1.62 | ) | | | (1.33 | ) | | | (1.61 | ) |
| | | | | | | | | | | | | | | | | | | | |
Change in net asset value for the year | | | (4.34 | ) | | | (7.63 | ) | | | (34.81 | ) | | | (9.15 | ) | | | (0.03 | ) |
| | | | | | | | | | | | | | | | | | | | |
Net asset value, end of year | | $ | 26.04 | | | $ | 30.38 | | | $ | 38.01 | | | $ | 72.82 | | | $ | 81.97 | |
| | | | | | | | | | | | | | | | | | | | |
* Includes redemption fees per share of | | $ | 0.01 | | | $ | 0.02 | | | $ | 0.02 | | | $ | 0.02 | | | $ | 0.10 | |
Total Return | | | (14.3 | )% | | | (20.1 | )% | | | (46.4 | )% | | | (9.5 | )% | | | 1.8 | % |
Ratios/supplemental data | | | | | | | | | | | | | | | | | | | | |
Net assets, end of year (000) | | $ | 947,367 | | | $ | 1,138,557 | | | $ | 1,215,081 | | | $ | 2,445,913 | | | $ | 2,647,078 | |
Ratio to average net assets: | | | | | | | | | | | | | | | | | | | | |
Expense | | | 1.43 | % | | | 1.36 | % | | | 1.34 | % | | | 1.28 | % | | | 1.25 | % |
Net investment loss | | | (0.84 | )% | | | (0.78 | )% | | | (0.41 | )% | | | (0.56 | )% | | | (0.86 | )% |
Portfolio turnover rate | | | 11 | % | | | 10 | % | | | 14 | % | | | 11 | % | | | 3 | % |
| (1) | Net investment loss per share is calculated using the ending balance prior to consideration or adjustment for permanent book-to-tax differences. |
The Accompanying Notes are an Integral Part of these Financial Statements.
The Delafield Fund
Financial Highlights
| | | | | | | | | | | | | | | | | | | | |
Per share operating performance
(For a share outstanding
throughout the year) | | Years Ended October 31, | |
| | 2015 | | | 2014 | | | 2013 | | | 2012 | | | 2011 | |
Net asset value, beginning of year | | $ | 36.40 | | | $ | 37.13 | | | $ | 29.79 | | | $ | 27.21 | | | $ | 26.65 | |
| | | | | | | | | | | | | | | | | | | | |
Operations: | | | | | | | | | | | | | | | | | | | | |
Net investment loss (1) | | | (0.14 | ) | | | (0.10 | ) | | | (0.05 | ) | | | (0.04 | ) | | | (0.08 | ) |
Net realized and unrealized gain (loss) | | | (3.99 | ) | | | 0.70 | | | | 9.19 | | | | 2.99 | | | | 0.64 | |
| | | | | | | | | | | | | | | | | | | | |
Total from investment operations * | | | (4.13 | ) | | | 0.60 | | | | 9.14 | | | | 2.95 | | | | 0.56 | |
| | | | | | | | | | | | | | | | | | | | |
Distributions to shareholders: | | | | | | | | | | | | | | | | | | | | |
Dividends from net investment income | | | — | | | | — | | | | — | | | | — | | | | — | |
Distributions from net realized gains | | | (3.63 | ) | | | (1.33 | ) | | | (1.80 | ) | | | (0.37 | ) | | | — | |
| | | | | | | | | | | | | | | | | | | | |
Total distributions | | | (3.63 | ) | | | (1.33 | ) | | | (1.80 | ) | | | (0.37 | ) | | | — | |
| | | | | | | | | | | | | | | | | | | | |
Change in net asset value for the year | | | (7.76 | ) | | | (0.73 | ) | | | 7.34 | | | | 2.58 | | | | 0.56 | |
| | | | | | | | | | | | | | | | | | | | |
Net asset value, end of year | | $ | 28.64 | | | $ | 36.40 | | | $ | 37.13 | | | $ | 29.79 | | | $ | 27.21 | |
| | | | | | | | | | | | | | | | | | | | |
* Includes redemption fees per share of | | $ | 0.00 | (2) | | $ | 0.00 | (2) | | $ | 0.00 | (2) | | $ | 0.00 | (2) | | $ | 0.01 | |
Total Return | | | (12.3 | )% | | | 1.6 | % | | | 32.1 | % | | | 11.0 | % | | | 2.1 | % |
Ratios/supplemental data | | | | | | | | | | | | | | | | | | | | |
Net assets, end of year (000) | | $ | 674,525 | | | $ | 1,475,139 | | | $ | 1,759,341 | | | $ | 1,346,273 | | | $ | 1,262,876 | |
Ratio to average net assets: | | | | | | | | | | | | | | | | | | | | |
Expense | | | 1.25 | % | | | 1.21 | % | | | 1.21 | % | | | 1.23 | % | | | 1.23 | % |
Net investment loss | | | (0.15 | )% | | | (0.24 | )% | | | (0.15 | )% | | | (0.13 | )% | | | (0.30 | )% |
Portfolio turnover rate | | | 19 | % | | | 34 | % | | | 34 | % | | | 49 | % | | | 38 | % |
| (1) | Net investment loss per share is calculated using the ending balance prior to consideration or adjustment for permanent book-to-tax differences. |
| (2) | Represents less than $0.01. |
The Accompanying Notes are an Integral Part of these Financial Statements.
The Tocqueville Select Fund
Financial Highlights
| | | | | | | | | | | | | | | | | | | | |
Per share operating performance
(For a share outstanding throughout the
year) | | Years Ended October 31, | |
| | 2015 | | | 2014 | | | 2013 | | | 2012 | | | 2011 | |
Net asset value, beginning of year | | $ | 14.90 | | | $ | 15.57 | | | $ | 11.35 | | | $ | 11.06 | | | $ | 11.54 | |
| | | | | | | | | | | | | | | | | | | | |
Operations: | | | | | | | | | | | | | | | | | | | | |
Net investment loss (1) | | | (0.08 | ) | | | (0.07 | ) | | | (0.06 | ) | | | (0.04 | ) | | | (0.07 | ) |
Net realized and unrealized gain (loss) | | | (1.00 | ) | | | 0.94 | | | | 4.79 | | | | 0.44 | | | | 0.12 | |
| | | | | | | | | | | | | | | | | | | | |
Total from investment operations * | | | (1.08 | ) | | | 0.87 | | | | 4.73 | | | | 0.40 | | | | 0.05 | |
| | | | | | | | | | | | | | | | | | | | |
Distributions to shareholders: | | | | | | | | | | | | | | | | | | | | |
Dividends from net investment income | | | — | | | | — | | | | — | | | | — | | | | — | |
Distributions from net realized gains | | | (1.74 | ) | | | (1.54 | ) | | | (0.51 | ) | | | (0.11 | ) | | | (0.53 | ) |
| | | | | | | | | | | | | | | | | | | | |
Total distributions | | | (1.74 | ) | | | (1.54 | ) | | | (0.51 | ) | | | (0.11 | ) | | | (0.53 | ) |
| | | | | | | | | | | | | | | | | | | | |
Change in net asset value for the year | | | (2.82 | ) | | | (0.67 | ) | | | 4.22 | | | | 0.29 | | | | (0.48 | ) |
| | | | | | | | | | | | | | | | | | | | |
Net asset value, end of year | | $ | 12.08 | | | $ | 14.90 | | | $ | 15.57 | | | $ | 11.35 | | | $ | 11.06 | |
| | | | | | | | | | | | | | | | | | | | |
* Includes redemption fees per share of | | $ | 0.00 | (2) | | $ | 0.00 | (2) | | $ | 0.00 | (2) | | $ | 0.00 | (2) | | $ | 0.01 | |
Total Return | | | (8.0 | )% | | | 6.1 | % | | | 43.2 | % | | | 3.7 | % | | | (0.1 | )% |
Ratios/supplemental data | | | | | | | | | | | | | | | | | | | | |
Net assets, end of year (000) | | $ | 81,813 | | | $ | 108,060 | | | $ | 99,888 | | | $ | 84,549 | | | $ | 71,554 | |
Ratio to average net assets: | | | | | | | | | | | | | | | | | | | | |
Expense | | | 1.36 | % | | | 1.32 | % | | | 1.34 | % | | | 1.37 | % | | | 1.36 | % |
Net investment loss | | | (0.52 | )% | | | (0.50 | )% | | | (0.39 | )% | | | (0.36 | )% | | | (0.67 | )% |
Portfolio turnover rate | | | 43 | % | | | 32 | % | | | 28 | % | | | 31 | % | | | 28 | % |
| (1) | Net investment loss per share is calculated using the ending balance prior to consideration or adjustment for permanent book-to-tax differences. |
| (2) | Represents less than $0.01. |
The Accompanying Notes are an Integral Part of these Financial Statements.
The Tocqueville Alternative Strategies Fund
Financial Highlights
| | | | | | | | | | | | | | | | |
Per share operating performance
(For a share outstanding throughout
the period) | | Year ended
October 31,
2015 | | | For the Period
January 1, 2014
to
October 31,
2014 | | | For the Period
June 1, 2013
to
December 31,
2013† | | | For the Period
June 29, 2012 (3)
to
May 31,
2013† | |
Net asset value, beginning of period | | $ | 27.26 | | | $ | 26.19 | | | $ | 29.06 | | | $ | 25.00 | |
| | | | | | | | | | | | | | | | |
Operations: | | | | | | | | | | | | | | | | |
Net investment income (loss) | | | 0.08 | (1) | | | (0.20 | )(1) | | | (0.15 | )(2) | | | (0.04 | )(2) |
Net realized and unrealized gain (loss) | | | (0.52 | ) | | | 1.27 | | | | (0.98 | ) | | | 4.75 | |
| | | | | | | | | | | | | | | | |
Total from investment operations * | | | (0.44 | ) | | | 1.07 | | | | (1.13 | ) | | | 4.71 | |
| | | | | | | | | | | | | | | | |
Distributions to shareholders: | | | | | | | | | | | | | | | | |
Dividends from net investment income | | | — | | | | — | | | | (0.11 | ) | | | (0.02 | ) |
Distributions from net realized gains | | | (0.58 | ) | | | — | | | | (1.63 | ) | | | (0.63 | ) |
| | | | | | | | | | | | | | | | |
Total distributions | | | (0.58 | ) | | | — | | | | (1.74 | ) | | | (0.65 | ) |
| | | | | | | | | | | | | | | | |
Change in net asset value for the period | | | (1.02 | ) | | | 1.07 | | | | (2.87 | ) | | | 4.06 | |
| | | | | | | | | | | | | | | | |
Net asset value, end of period | | $ | 26.24 | | | $ | 27.26 | | | $ | 26.19 | | | $ | 29.06 | |
| | | | | | | | | | | | | | | | |
* Includes redemption fees per share of | | $ | 0.00 | (4) | | $ | 0.00 | (4) | | $ | 0.00 | (4) | | $ | 0.00 | (4) |
Total Return | | | (1.7 | )% | | | 4.1 | %(5) | | | (3.8 | )%(5) | | | 19.2 | %(5) |
Ratios/supplemental data | | | | | | | | | | | | | | | | |
Net assets, end of period (000) | | $ | 44,735 | | | $ | 39,143 | | | $ | 36,594 | | | $ | 38,846 | |
Ratio to average net assets: | | | | | | | | | | | | | | | | |
Expenses before waiver/reimbursement | | | 2.98 | % | | | 3.31 | %(6) | | | 3.25 | %(6) | | | 3.21 | %(6) |
Expenses after waiver/reimbursement | | | 2.86 | % | | | 2.66 | %(6) | | | 2.86 | %(6) | | | 2.63 | %(6) |
Net investment income (loss) before waiver/reimbursement | | | 0.15 | % | | | (1.52 | )%(6) | | | (1.33 | )%(6) | | | (0.72 | )%(6) |
Net investment income (loss) after waiver/reimbursement | | | 0.27 | % | | | (0.87 | )%(6) | | | (0.94 | )%(6) | | | (0.14 | )%(6) |
Ratio to average net assets (excluding interest expense and dividends and interest expense on short sales): | | | | | | | | | | | | | | | | |
Expenses before waiver/reimbursement | | | 2.00 | % | | | 2.60 | %(6) | | | 2.38 | %(6) | | | 2.57 | %(6) |
Expenses after waiver/reimbursement | | | 1.88 | % | | | 1.96 | %(6) | | | 1.99 | %(6) | | | 1.99 | %(6) |
Net investment income (loss) before waiver/reimbursement | | | 1.12 | % | | | (0.81 | )%(6) | | | (0.46 | )%(6) | | | (0.08 | )%(6) |
Net investment income (loss) after waiver/reimbursement | | | 1.24 | % | | | (0.16 | )%(6) | | | (0.07 | )%(6) | | | 0.50 | %(6) |
Portfolio turnover rate | | | 72 | % | | | 99 | %(5) | | | 69 | %(5) | | | 91 | %(5) |
| † | Information shown is for Predecessor Fund—Class I |
| (1) | Net investment income (loss) per share is calculated using the ending balance prior to consideration or adjustment for permanent book-to-tax differences. |
| (2) | Net investment loss per share is calculated based on average shares outstanding during the period. |
| (3) | Inception of Predecessor Fund—Class I |
| (4) | Represents less than $0.01. |
The Accompanying Notes are an Integral Part of these Financial Statements.
The Tocqueville Fund
Schedule of Investments as of October 31, 2015
| | | | | | | | |
| Common Stocks—97.2% | | Shares | | | Value | |
Automobiles & Components—1.9% | |
Ford Motor Co. | | | 400,000 | | | $ | 5,924,000 | |
Banks—0.8% | | | | | | | | |
M&T Bank Corp. | | | 20,000 | | | | 2,397,000 | |
Capital Goods—8.2% | | | | | | | | |
Caterpillar, Inc. | | | 25,000 | | | | 1,824,750 | |
General Electric Co. | | | 400,000 | | | | 11,568,000 | |
Illinois Tool Works, Inc. | | | 50,000 | | | | 4,597,000 | |
The Boeing Co. | | | 50,000 | | | | 7,403,500 | |
| | | | | | | | 25,393,250 | |
Commercial & Professional Services—2.9% | |
Pitney Bowes, Inc. | | | 250,000 | | | | 5,162,500 | |
Steelcase, Inc.—Class A | | | 200,000 | | | | 3,882,000 | |
| | | | | | | | 9,044,500 | |
Consumer Services—1.5% | |
McDonald’s Corp. | | | 40,000 | | | | 4,490,000 | |
Diversified Financials—4.2% | |
Lazard Ltd.—Class A(a) | | | 100,000 | | | | 4,632,000 | |
The Bank of New York Mellon Corp. | | | 200,000 | | | | 8,330,000 | |
| | | | | | | | 12,962,000 | |
Energy—7.8% | | | | | | | | |
Energen Corp. | | | 100,000 | | | | 5,815,000 | |
Exxon Mobil Corp. | | | 150,000 | | | | 12,411,000 | |
Schlumberger Ltd.(a) | | | 75,000 | | | | 5,862,000 | |
| | | | | | | | 24,088,000 | |
Food & Staples Retailing—1.8% | |
Wal-Mart Stores, Inc. | | | 100,000 | | | | 5,724,000 | |
Food, Beverage & Tobacco—4.4% | �� |
Campbell Soup Co. | | | 100,000 | | | | 5,079,000 | |
The Coca-Cola Co. | | | 200,000 | | | | 8,470,000 | |
| | | | | | | | 13,549,000 | |
Health Care Equipment & Services—1.4% | |
Express Scripts Holding Co.(b) | | | 50,000 | | | | 4,319,000 | |
Household & Personal Products—4.6% | |
Colgate-Palmolive Co. | | | 100,000 | | | | 6,635,000 | |
The Procter & Gamble Co. | | | 100,000 | | | | 7,638,000 | |
| | | | | | | | 14,273,000 | |
Insurance—3.9% | | | | | | | | |
Aflac, Inc. | | | 100,000 | | | $ | 6,375,000 | |
XL Group PLC(a) | | | 150,000 | | | | 5,712,000 | |
| | | | | | | | 12,087,000 | |
Materials—4.5% | | | | | | | | |
EI du Pont de Nemours & Co. | | | 150,000 | | | | 9,510,000 | |
Sonoco Products Co. | | | 100,000 | | | | 4,269,000 | |
| | | | | | | | 13,779,000 | |
Pharmaceuticals, Biotechnology & Life Sciences—14.7% | |
Alkermes PLC(a)(b) | | | 120,000 | | | | 8,630,400 | |
Isis Pharmaceuticals, Inc.(b) | | | 120,000 | | | | 5,778,000 | |
Johnson & Johnson | | | 100,000 | | | | 10,103,000 | |
Merck & Co., Inc. | | | 150,000 | | | | 8,199,000 | |
Momenta Pharmaceuticals, Inc.(b) | | | 250,000 | | | | 4,102,500 | |
Omeros Corp.(b) | | | 150,000 | | | | 1,879,500 | |
Pfizer, Inc. | | | 200,000 | | | | 6,764,000 | |
| | | | | | | | 45,456,400 | |
Retailing—4.2% | | | | | | | | |
Amazon.com, Inc.(b) | | | 15,000 | | | | 9,388,500 | |
Target Corp. | | | 45,000 | | | | 3,473,100 | |
| | | | | | | | 12,861,600 | |
Semiconductors & Semiconductor Equipment—4.4% | |
Applied Materials, Inc. | | | 350,000 | | | | 5,869,500 | |
Intel Corp. | | | 225,000 | | | | 7,618,500 | |
| | | | | | | | 13,488,000 | |
Software & Services—13.4% | |
Alphabet, Inc.—Class A(b) | | | 7,000 | | | | 5,161,730 | |
Alphabet, Inc.—Class C(b) | | | 7,019 | | | | 4,989,175 | |
Automatic Data Processing, Inc. | | | 100,000 | | | | 8,699,000 | |
Facebook, Inc.—Class A(b) | | | 75,000 | | | | 7,647,750 | |
Microsoft Corp. | | | 200,000 | | | | 10,528,000 | |
Xerox Corp. | | | 500,000 | | | | 4,695,000 | |
| | | | | | | | 41,720,655 | |
The Accompanying Notes are an Integral Part of these Financial Statements.
The Tocqueville Fund
Schedule of Investments as of October 31, 2015
| | | | | | | | |
| Common Stocks—97.2% | | Shares | | | Value | |
Technology Hardware & Equipment—4.5% | |
Apple, Inc. | | | 50,000 | | | $ | 5,975,000 | |
Bio-key International, Inc.(b)(c)(d)(e)(Originally acquired 09/16/2005, Cost $0) | | | 23,545 | | | | — | |
EMC Corp. | | | 300,000 | | | | 7,866,000 | |
| | | | | | | | 13,841,000 | |
Telecommunication Services—1.5% | |
Verizon Communications, Inc. | | | 100,000 | | | | 4,688,000 | |
Transportation—3.3% | |
Delta Air Lines, Inc. | | | 200,000 | | | | 10,168,000 | |
Utilities—3.3% | |
NextEra Energy, Inc. | | | 100,000 | | | | 10,266,000 | |
Total Common Stocks
(Cost $175,477,576) | | | | | | | 300,519,405 | |
Real Estate Investment Trust (REIT)—2.4% | |
Real Estate—2.4% | | | | | | | | |
Weyerhaeuser Co. | | | 250,000 | | | | 7,332,500 | |
Total Real Estate Investment Trust
(Cost $4,426,162) | | | | 7,332,500 | |
Short-Term Investment—0.5% | |
Money Market Fund—0.5% | |
STIT-Treasury Portfolio— Institutional Class, 0.020%(f) | | | 1,618,231 | | | | 1,618,231 | |
Total Short-Term Investment
(Cost $1,618,231) | | | | 1,618,231 | |
Total Investments
(Cost $181,521,969)—100.1% | | | | 309,470,136 | |
Liabilities in Excess of Other Assets—(0.1)% | | | | (203,140 | ) |
Total Net Assets—100.0% | | | $ | 309,266,996 | |
| | | | | | | | |
Percentages are stated as a percent of net assets.
| (a) | Foreign issued security. Foreign concentration was as follows: Bermuda 1.5%; Curacao 1.9%; Ireland 4.6%. |
| (b) | Non-income producing security. |
| (c) | Denotes a security that is either fully or partially restricted to resale. The aggregate value of restricted securities as of October 31, 2015 was $0 which represented 0.0% of net assets. |
| (d) | Security is fair valued using procedures approved by the Board of Trustees. The aggregate value of fair valued securities as of October 31, 2015 was $0 which represented 0.0% of net assets. |
| (e) | Security is considered illiquid and may be difficult to sell. |
| (f) | Rate listed is the 7-day effective yield. |
The Global Industry Classification Standard (GICS®) was developed by and/or is the exclusive property of MSCI, Inc. and Standard & Poor Financial Services LLC (“S&P”). GICS is a service mark of MSCI and S&P and has been licensed for use by U.S. Bancorp Fund Services, LLC.
The Accompanying Notes are an Integral Part of these Financial Statements.
The Tocqueville Opportunity Fund
Schedule of Investments as of October 31, 2015
| | | | | | | | |
| Common Stocks—98.0% | | Shares | | | Value | |
Automobiles & Components—0.3% | |
Delphi Automotive PLC(a) | | | 1,500 | | | $ | 124,785 | |
Gentex Corp. | | | 2,000 | | | | 32,780 | |
Lear Corp. | | | 2,000 | | | | 250,120 | |
Tesla Motors, Inc.(b) | | | 200 | | | | 41,386 | |
| | | | | | | | 449,071 | |
Banks—5.9% | | | | | | | | |
Ameris Bancorp | | | 9,500 | | | | 299,250 | |
Bank of the Ozarks, Inc. | | | 41,500 | | | | 2,075,830 | |
Customers Bancorp, Inc.(b) | | | 8,500 | | | | 233,750 | |
East West Bancorp, Inc. | | | 5,500 | | | | 222,145 | |
EverBank Financial Corp. | | | 23,000 | | | | 396,980 | |
Home BancShares, Inc. | | | 14,000 | | | | 600,880 | |
Opus Bank | | | 12,000 | | | | 447,000 | |
Pinnacle Financial Partners, Inc. | | | 38,000 | | | | 1,999,560 | |
Signature Bank(b) | | | 13,500 | | | | 2,010,420 | |
South State Corp. | | | 3,000 | | | | 232,500 | |
SVB Financial Group(b) | | | 4,000 | | | | 488,280 | |
| | | | | | | | 9,006,595 | |
Capital Goods—6.6% | | | | | | | | |
Acuity Brands, Inc. | | | 5,000 | | | | 1,093,000 | |
AO Smith Corp. | | | 15,000 | | | | 1,152,300 | |
Armstrong World Industries, Inc.(b) | | | 500 | | | | 24,810 | |
Caesarstone Sdot-Yam Ltd.(a) | | | 1,000 | | | | 35,510 | |
Fortune Brands Home & Security, Inc. | | | 15,500 | | | | 811,115 | |
Graco, Inc. | | | 1,700 | | | | 124,780 | |
HD Supply Holdings, Inc.(b) | | | 14,000 | | | | 417,060 | |
HEICO Corp. | | | 1,500 | | | | 75,660 | |
Hexcel Corp. | | | 500 | | | | 23,160 | |
IDEX Corp. | | | 3,200 | | | | 245,632 | |
Lennox International, Inc. | | | 3,200 | | | | 424,992 | |
Lincoln Electric Holdings, Inc. | | | 500 | | | | 29,905 | |
Nordson Corp. | | | 4,000 | | | | 284,960 | |
PACCAR, Inc. | | | 500 | | | | 26,325 | |
RBC Bearings, Inc.(b) | | | 1,000 | | | | 68,390 | |
Snap-on, Inc. | | | 9,500 | | | | 1,575,955 | |
SolarCity Corp.(b) | | | 1,000 | | | | 29,650 | |
Spirit AeroSystems Holdings, Inc.—Class A(b) | | | 5,500 | | | | 290,070 | |
The Middleby Corp.(b) | | | 10,000 | | | | 1,169,400 | |
TransDigm Group, Inc.(b) | | | 3,600 | | | | 791,460 | |
WABCO Holdings, Inc.(b) | | | 4,000 | | | $ | 448,920 | |
Wabtec Corp. | | | 7,500 | | | | 621,525 | |
Watsco, Inc. | | | 2,500 | | | | 307,575 | |
Woodward, Inc. | | | 2,000 | | | | 91,000 | |
| | | | | | | | 10,163,154 | |
Commercial & Professional Services—0.9% | |
Cintas Corp. | | | 4,500 | | | | 418,905 | |
Copart, Inc.(b) | | | 3,500 | | | | 126,735 | |
Equifax, Inc. | | | 500 | | | | 53,285 | |
Knoll, Inc. | | | 15,000 | | | | 348,600 | |
Robert Half International, Inc. | | | 8,500 | | | | 447,610 | |
| | | | | | | | 1,395,135 | |
Commercial & Professional Services—0.2% | |
Multi-Color Corp. | | | 4,500 | | | | 350,280 | |
Consumer Durables & Apparel—3.9% | |
Fossil Group, Inc.(b) | | | 500 | | | | 27,205 | |
GoPro, Inc.—Class A(b) | | | 1,000 | | | | 25,000 | |
Hanesbrands, Inc. | | | 37,200 | | | | 1,188,168 | |
Harman International Industries, Inc. | | | 5,000 | | | | 549,800 | |
Helen of Troy Ltd.(a)(b) | | | 6,000 | | | | 595,260 | |
Jarden Corp.(b) | | | 1,000 | | | | 44,800 | |
Leggett & Platt, Inc. | | | 9,500 | | | | 427,785 | |
Mohawk Industries, Inc.(b) | | | 3,300 | | | | 645,150 | |
Polaris Industries, Inc. | | | 2,500 | | | | 280,850 | |
Skechers U.S.A., Inc.—Class A(b) | | | 1,000 | | | | 31,200 | |
Tempur Sealy International, Inc.(b) | | | 10,500 | | | | 817,320 | |
Under Armour, Inc.—Class A(b) | | | 9,000 | | | | 855,720 | |
Whirlpool Corp. | | | 3,000 | | | | 480,420 | |
| | | | | | | | 5,968,678 | |
Consumer Services—2.6% | | | | | | | | |
Bob Evans Farms, Inc. | | | 500 | | | | 21,635 | |
Buffalo Wild Wings, Inc.(b) | | | 2,300 | | | | 354,821 | |
Chipotle Mexican Grill, Inc.(b) | | | 800 | | | | 512,184 | |
Domino’s Pizza, Inc. | | | 6,000 | | | | 640,020 | |
Dunkin’ Brands Group, Inc. | | | 6,000 | | | | 248,460 | |
Fiesta Restaurant Group, Inc.(b) | | | 1,000 | | | | 35,360 | |
Jack in the Box, Inc. | | | 5,600 | | | | 417,368 | |
The Accompanying Notes are an Integral Part of these Financial Statements.
The Tocqueville Opportunity Fund
Schedule of Investments as of October 31, 2015
| | | | | | | | |
| Common Stocks—98.0% | | Shares | | | Value | |
Panera Bread Co.—Class A(b) | | | 2,000 | | | $ | 354,740 | |
Popeyes Louisiana Kitchen, Inc.(b) | | | 3,000 | | | | 169,320 | |
Restaurant Brands International LP(a) | | | 37 | | | | 1,467 | |
Starbucks Corp. | | | 14,000 | | | | 875,980 | |
Wyndham Worldwide Corp. | | | 3,500 | | | | 284,725 | |
Zoe’s Kitchen, Inc.(b) | | | 500 | | | | 17,215 | |
| | | | | | | | 3,933,295 | |
Diversified Financials—2.5% | | | | | | | | |
CBOE Holdings, Inc. | | | 7,000 | | | | 469,280 | |
Evercore Partners, Inc.—Class A | | | 5,500 | | | | 297,000 | |
Lazard Ltd.—Class A(a) | | | 9,000 | | | | 416,880 | |
MSCI, Inc. | | | 8,500 | | | | 569,500 | |
PJT Partners, Inc.—Class A(b) | | | 1 | | | | 11 | |
PRA Group, Inc.(b) | | | 6,500 | | | | 356,200 | |
SEI Investments Co. | | | 10,000 | | | | 518,200 | |
The Blackstone Group LP | | | 12,500 | | | | 413,250 | |
The Carlyle Group LP | | | 1,500 | | | | 28,110 | |
The Charles Schwab Corp. | | | 13,500 | | | | 412,020 | |
Waddell & Reed Financial, Inc.—Class A | | | 500 | | | | 18,470 | |
WisdomTree Investments, Inc. | | | 20,000 | | | | 384,600 | |
| | | | | | | | 3,883,521 | |
Food & Staples Retailing—0.1% | |
United Natural Foods, Inc.(b) | | | 4,000 | | | | 201,800 | |
Food, Beverage & Tobacco—3.6% | |
Constellation Brands, Inc.—Class A | | | 8,000 | | | | 1,078,400 | |
Monster Beverage Corp.(b) | | | 14,500 | | | | 1,976,640 | |
The Boston Beer Co., Inc.—Class A(b) | | | 2,750 | | | | 603,872 | |
The Hain Celestial Group, Inc.(b) | | | 14,200 | | | | 707,870 | |
The WhiteWave Foods Co.(b) | | | 24,500 | | | | 1,004,010 | |
Tyson Foods, Inc.—Class A | | | 3,000 | | | | 133,080 | |
| | | | | | | | 5,503,872 | |
Health Care Equipment & Services—4.9% | |
AAC Holdings, Inc.(b) | | | 1,000 | | | | 23,200 | |
ABIOMED, Inc.(b) | | | 2,500 | | | | 184,150 | |
Acadia Healthcare Co., Inc.(b) | | | 17,000 | | | | 1,043,970 | |
Align Technology, Inc.(b) | | | 5,000 | | | | 327,300 | |
athenahealth, Inc.(b) | | | 3,000 | | | $ | 457,350 | |
Brookdale Senior Living, Inc.(b) | | | 500 | | | | 10,455 | |
Centene Corp.(b) | | | 500 | | | | 29,740 | |
DexCom, Inc.(b) | | | 20,500 | | | | 1,708,060 | |
EndoChoice Holdings, Inc.(b) | | | 37,500 | | | | 387,000 | |
Envision Healthcare Holdings, Inc.(b) | | | 500 | | | | 14,100 | |
Hologic, Inc.(b) | | | 25,500 | | | | 990,930 | |
IDEXX Laboratories, Inc.(b) | | | 6,500 | | | | 446,030 | |
MEDNAX, Inc.(b) | | | 3,000 | | | | 211,410 | |
ResMed, Inc. | | | 500 | | | | 28,805 | |
Sirona Dental Systems, Inc.(b) | | | 4,500 | | | | 491,085 | |
Team Health Holdings, Inc.(b) | | | 5,500 | | | | 328,185 | |
Teleflex, Inc. | | | 2,100 | | | | 279,300 | |
Tenet Healthcare Corp.(b) | | | 500 | | | | 15,685 | |
Universal Health Services, Inc.—Class B | | | 1,700 | | | | 207,553 | |
VCA, Inc.(b) | | | 6,000 | | | | 328,620 | |
| | | | | | | | 7,512,928 | |
Household & Personal Products—0.2% | |
Church & Dwight Co., Inc. | | | 2,800 | | | | 241,052 | |
Herbalife Ltd.(a)(b) | | | 500 | | | | 28,020 | |
| | | | | | | | 269,072 | |
Materials—2.9% | |
AptarGroup, Inc. | | | 2,500 | | | | 183,900 | |
Axalta Coating Systems Ltd.(a)(b) | | | 6,000 | | | | 165,780 | |
Ball Corp. | | | 10,000 | | | | 685,000 | |
Crown Holdings, Inc.(b) | | | 2,000 | | | | 106,080 | |
Eagle Materials, Inc. | | | 2,000 | | | | 132,060 | |
Huntsman Corp. | | | 4,600 | | | | 60,582 | |
International Flavors & Fragrances, Inc. | | | 3,500 | | | | 406,210 | |
Martin Marietta Materials, Inc. | | | 3,000 | | | | 465,450 | |
Packaging Corp. of America | | | 6,000 | | | | 410,700 | |
PolyOne Corp. | | | 4,000 | | | | 133,760 | |
RPM International, Inc. | | | 500 | | | | 22,855 | |
Sealed Air Corp. | | | 17,000 | | | | 835,040 | |
The Sherwin-Williams Co. | | | 1,300 | | | | 346,879 | |
The Valspar Corp. | | | 3,500 | | | | 283,325 | |
WR Grace & Co.(b) | | | 2,500 | | | | 250,750 | |
| | | | | | | | 4,488,371 | |
The Accompanying Notes are an Integral Part of these Financial Statements.
The Tocqueville Opportunity Fund
Schedule of Investments as of October 31, 2015
| | | | | | | | |
| Common Stocks—98.0% | | Shares | | | Value | |
Media—0.5% | |
Morningstar, Inc. | | | 1,500 | | | $ | 123,165 | |
The Interpublic Group of Cos., Inc. | | | 20,000 | | | | 458,600 | |
The Madison Square Garden Co.(b) | | | 567 | | | | 101,150 | |
| | | | | | | | 682,915 | |
Pharmaceuticals, Biotechnology & Life Sciences—30.8% | |
ACADIA Pharmaceuticals, Inc.(b) | | | 15,500 | | | | 539,710 | |
Acceleron Pharma, Inc.(b) | | | 7,000 | | | | 218,470 | |
Advaxis, Inc.(b) | | | 40,000 | | | | 443,600 | |
Aerie Pharmaceuticals, Inc.(b) | | | 30,500 | | | | 695,705 | |
Affimed NV(a)(b) | | | 24,500 | | | | 155,330 | |
Agilent Technologies, Inc. | | | 1,500 | | | | 56,640 | |
Agios Pharmaceuticals, Inc.(b) | | | 12,500 | | | | 910,750 | |
Akorn, Inc.(b) | | | 500 | | | | 13,370 | |
Alder Biopharmaceuticals, Inc.(b) | | | 1,000 | | | | 31,980 | |
Alexion Pharmaceuticals, Inc.(b) | | | 7,000 | | | | 1,232,000 | |
Alkermes PLC(a)(b) | | | 9,000 | | | | 647,280 | |
Allergan plc(a)(b) | | | 1,700 | | | | 524,399 | |
Alnylam Pharmaceuticals, Inc.(b) | | | 26,500 | | | | 2,277,675 | |
Anacor Pharmaceuticals, Inc.(b) | | | 14,000 | | | | 1,573,740 | |
Applied Genetic Technologies Corp.(b) | | | 34,000 | | | | 408,000 | |
Aratana Therapeutics, Inc.(b) | | | 1,000 | | | | 6,990 | |
Atara Biotherapeutics, Inc.(b) | | | 24,000 | | | | 618,480 | |
Axovant Sciences Ltd.(a)(b) | | | 2,500 | | | | 30,475 | |
Bellicum Pharmaceuticals, Inc.(b) | | | 1,000 | | | | 12,510 | |
BioMarin Pharmaceutical, Inc.(b) | | | 12,000 | | | | 1,404,480 | |
Bluebird Bio, Inc.(b) | | | 23,000 | | | | 1,773,990 | |
Cancer Genetics, Inc.(b) | | | 42,500 | | | | 276,250 | |
Celldex Therapeutics, Inc.(b) | | | 6,500 | | | | 78,390 | |
Cellectis SA—ADR(a)(b) | | | 20,000 | | | | 529,000 | |
Cepheid(b) | | | 500 | | | | 16,700 | |
Chimerix, Inc.(b) | | | 18,000 | | | | 705,240 | |
Clovis Oncology, Inc.(b) | | | 13,000 | | | | 1,298,830 | |
DBV Technologies SA—ADR(a)(b) | | | 6,500 | | | | 225,355 | |
Dicerna Pharmaceuticals, Inc.(b) | | | 1,000 | | | $ | 10,020 | |
Eisai Co., Ltd.(a) | | | 3,000 | | | | 189,144 | |
Epizyme, Inc.(b) | | | 18,000 | | | | 235,620 | |
Fate Therapeutics, Inc.(b) | | | 30,000 | | | | 132,000 | |
Five Prime Therapeutics, Inc.(b) | | | 32,000 | | | | 1,028,800 | |
Forward Pharma A/S—ADR(a)(b) | | | 5,500 | | | | 138,380 | |
Genfit(a)(b) | | | 500 | | | | 22,477 | |
Genmab A/S(a)(b) | | | 8,500 | | | | 838,426 | |
GW Pharmaceuticals PLC—ADR(a)(b) | | | 8,000 | | | | 632,720 | |
Illumina, Inc.(b) | | | 500 | | | | 71,640 | |
Incyte Corp.(b) | | | 19,500 | | | | 2,291,835 | |
Innate Pharma SA(a)(b) | | | 10,000 | | | | 144,164 | |
Inovio Pharmaceuticals, Inc.(b) | | | 50,000 | | | | 316,500 | |
Intercept Pharmaceuticals, Inc.(b) | | | 900 | | | | 141,480 | |
Intra-Cellular Therapies, Inc.(b) | | | 54,000 | | | | 2,583,900 | |
Intrexon Corp.(b) | | | 12,500 | | | | 420,000 | |
Juno Therapeutics, Inc.(b) | | | 25,500 | | | | 1,319,880 | |
Karyopharm Therapeutics, Inc.(b) | | | 18,000 | | | | 240,300 | |
Kite Pharma, Inc.(b) | | | 13,000 | | | | 884,650 | |
La Jolla Pharmaceutical Co.(b) | | | 10,000 | | | | 249,900 | |
Medivation, Inc.(b) | | | 8,500 | | | | 357,510 | |
Mettler-Toledo International, Inc.(b) | | | 1,100 | | | | 342,089 | |
Mirati Therapeutics, Inc.(b) | | | 16,000 | | | | 566,080 | |
Neurocrine Biosciences, Inc.(b) | | | 19,000 | | | | 932,710 | |
NewLink Genetics Corp.(b) | | | 8,500 | | | | 325,295 | |
Northwest Biotherapeutics, Inc.(b) | | | 1,000 | | | | 4,880 | |
OncoMed Pharmaceuticals, Inc.(b) | | | 23,500 | | | | 470,235 | |
Ophthotech Corp.(b) | | | 23,500 | | | | 1,173,355 | |
OvaScience, Inc.(b) | | | 4,000 | | | | 51,880 | |
PAREXEL International Corp.(b) | | | 3,200 | | | | 201,984 | |
PerkinElmer, Inc. | | | 500 | | | | 25,820 | |
Portola Pharmaceuticals, Inc.(b) | | | 34,500 | | | | 1,642,545 | |
Prestige Brands Holdings, Inc.(b) | | | 1,000 | | | | 49,010 | |
ProQR Therapeutics NV(a)(b) | | | 19,000 | | | | 276,830 | |
PTC Therapeutics, Inc.(b) | | | 17,000 | | | | 422,790 | |
Puma Biotechnology, Inc.(b) | | | 1,500 | | | | 123,630 | |
The Accompanying Notes are an Integral Part of these Financial Statements.
The Tocqueville Opportunity Fund
Schedule of Investments as of October 31, 2015
| | | | | | | | |
| Common Stocks—98.0% | | Shares | | | Value | |
Quintiles Transnational Holdings, Inc.(b) | | | 3,500 | | | $ | 222,775 | |
Regeneron Pharmaceuticals, Inc.(b) | | | 5,100 | | | | 2,842,689 | |
Regulus Therapeutics, Inc.(b) | | | 20,000 | | | | 133,000 | |
Relypsa, Inc.(b) | | | 3,500 | | | | 55,965 | |
Sage Therapeutics, Inc.(b) | | | 27,000 | | | | 1,356,210 | |
Seattle Genetics, Inc.(b) | | | 11,500 | | | | 477,135 | |
Sorrento Therapeutics, Inc.(b) | | | 32,000 | | | | 276,480 | |
Spark Therapeutics, Inc.(b) | | | 30,000 | | | | 1,617,000 | |
Stemline Therapeutics, Inc.(b) | | | 500 | | | | 4,445 | |
TESARO, Inc.(b) | | | 10,000 | | | | 454,700 | |
Trevena, Inc.(b) | | | 32,000 | | | | 307,840 | |
Ultragenyx Pharmaceutical, Inc.(b) | | | 11,500 | | | | 1,142,525 | |
uniQure NV(a)(b) | | | 35,500 | | | | 629,415 | |
United Therapeutics Corp.(b) | | | 1,000 | | | | 146,630 | |
Vertex Pharmaceuticals, Inc.(b) | | | 14,500 | | | | 1,808,730 | |
ZIOPHARM Oncology, Inc.(b) | | | 25,284 | | | | 287,985 | |
| | | | | | | | 47,327,342 | |
Retailing—6.9% | |
Advance Auto Parts, Inc. | | | 1,500 | | | | 297,645 | |
Expedia, Inc. | | | 11,500 | | | | 1,567,450 | |
Foot Locker, Inc. | | | 14,000 | | | | 948,500 | |
GNC Holdings, Inc.—Class A | | | 10,500 | | | | 312,375 | |
L Brands, Inc. | | | 3,500 | | | | 335,930 | |
Liberty Ventures—Class A(b) | | | 6,500 | | | | 283,205 | |
Lithia Motors, Inc.—Class A | | | 8,000 | | | | 939,120 | |
LKQ Corp.(b) | | | 20,500 | | | | 607,005 | |
Netflix, Inc.(b) | | | 1,000 | | | | 108,380 | |
O’Reilly Automotive, Inc.(b) | | | 2,450 | | | | 676,837 | |
Restoration Hardware Holdings, Inc.(b) | | | 10,500 | | | | 1,082,445 | |
The Priceline Group, Inc.(b) | | | 900 | | | | 1,308,816 | |
Ulta Salon Cosmetics & Fragrance, Inc.(b) | | | 6,500 | | | | 1,130,740 | |
Wayfair, Inc.—Class A(b) | | | 8,000 | | | | 338,160 | |
Williams-Sonoma, Inc. | | | 9,000 | | | | 663,750 | |
| | | | | | | | 10,600,358 | |
Semiconductors & Semiconductor Equipment—2.0% | |
Ambarella, Inc.(a)(b) | | | 7,500 | | | | 370,800 | |
Cavium, Inc.(b) | | | 9,500 | | | | 674,025 | |
NXP Semiconductors NV(a)(b) | | | 4,500 | | | $ | 352,575 | |
Qorvo, Inc.(b) | | | 4,000 | | | | 175,720 | |
Skyworks Solutions, Inc. | | | 18,800 | | | | 1,452,112 | |
SunEdison, Inc.(b) | | | 1,000 | | | | 7,300 | |
| | | | | | | | 3,032,532 | |
Software & Services—20.0% | |
Alliance Data Systems Corp.(b) | | | 450 | | | | 133,789 | |
ANSYS, Inc.(b) | | | 1,000 | | | | 95,310 | |
Aspen Technology, Inc.(b) | | | 10,000 | | | | 413,900 | |
Broadridge Financial Solutions, Inc. | | | 5,500 | | | | 327,690 | |
Cadence Design Systems, Inc.(b) | | | 21,000 | | | | 466,620 | |
CoreLogic, Inc.(b) | | | 2,500 | | | | 97,450 | |
CoStar Group, Inc.(b) | | | 1,450 | | | | 294,452 | |
CyberArk Software Ltd.(a)(b) | | | 1,000 | | | | 49,640 | |
Demandware, Inc.(b) | | | 20,000 | | | | 1,134,000 | |
DST Systems, Inc. | | | 2,000 | | | | 244,300 | |
EPAM Systems, Inc.(b) | | | 8,500 | | | | 657,475 | |
Euronet Worldwide, Inc.(b) | | | 9,000 | | | | 722,160 | |
FactSet Research Systems, Inc. | | | 3,000 | | | | 525,360 | |
FireEye, Inc.(b) | | | 500 | | | | 13,075 | |
FleetCor Technologies, Inc.(b) | | | 4,300 | | | | 622,898 | |
Fleetmatics Group PLC(a)(b) | | | 32,000 | | | | 1,781,120 | |
Fortinet, Inc.(b) | | | 18,000 | | | | 618,480 | |
Gartner, Inc.(b) | | | 5,200 | | | | 471,484 | |
Global Payments, Inc. | | | 9,000 | | | | 1,227,690 | |
GrubHub, Inc.(b) | | | 1,000 | | | | 23,980 | |
Guidewire Software, Inc.(b) | | | 5,000 | | | | 291,150 | |
IAC/InterActiveCorp | | | 1,000 | | | | 67,010 | |
LinkedIn Corp.—Class A(b) | | | 1,000 | | | | 240,870 | |
Manhattan Associates, Inc.(b) | | | 44,000 | | | | 3,205,400 | |
Marketo, Inc.(b) | | | 5,000 | | | | 147,150 | |
Mobileye NV(a)(b) | | | 17,000 | | | | 773,840 | |
NetSuite, Inc.(b) | | | 8,300 | | | | 706,081 | |
Pandora Media, Inc.(b) | | | 500 | | | | 5,755 | |
Paycom Software, Inc.(b) | | | 67,500 | | | | 2,565,675 | |
PTC, Inc.(b) | | | 7,500 | | | | 265,800 | |
Qlik Technologies, Inc.(b) | | | 500 | | | | 15,685 | |
Rackspace Hosting, Inc.(b) | | | 9,000 | | | | 232,650 | |
Red Hat, Inc.(b) | | | 5,000 | | | | 395,550 | |
Sabre Corp. | | | 14,500 | | | | 425,140 | |
salesforce.com, inc.(b) | | | 11,000 | | | | 854,810 | |
ServiceNow, Inc.(b) | | | 23,500 | | | | 1,918,775 | |
Splunk, Inc.(b) | | | 34,000 | | | | 1,909,440 | |
The Accompanying Notes are an Integral Part of these Financial Statements.
The Tocqueville Opportunity Fund
Schedule of Investments as of October 31, 2015
| | | | | | | | |
| Common Stocks—98.0% | | Shares | | | Value | |
SS&C Technologies Holdings, Inc. | | | 8,000 | | | $ | 593,200 | |
Synchronoss Technologies, Inc.(b) | | | 500 | | | | 17,590 | |
Synopsys, Inc.(b) | | | 2,500 | | | | 124,950 | |
Tableau Software, Inc.—Class A(b) | | | 7,500 | | | | 629,700 | |
The Ultimate Software Group, Inc.(b) | | | 6,000 | | | | 1,226,100 | |
Total System Services, Inc. | | | 22,500 | | | | 1,180,125 | |
Tyler Technologies, Inc.(b) | | | 4,800 | | | | 817,728 | |
Vantiv, Inc.—Class A(b) | | | 12,000 | | | | 601,800 | |
Workday, Inc.—Class A(b) | | | 20,000 | | | | 1,579,400 | |
Zillow Group, Inc.—Class A(b) | | | 1 | | | | 31 | |
Zillow Group, Inc.—Class C(b) | | | 2 | | | | 55 | |
| | | | | | | | 30,712,333 | |
Technology Hardware & Equipment—2.0% | |
Belden, Inc. | | | 500 | | | | 32,015 | |
IPG Photonics Corp.(b) | | | 2,400 | | | | 198,288 | |
Palo Alto Networks, Inc.(b) | | | 17,500 | | | | 2,817,500 | |
| | | | | | | | 3,047,803 | |
Transportation—1.2% | |
Alaska Air Group, Inc. | | | 9,000 | | | | 686,250 | |
Delta Air Lines, Inc. | | | 8,500 | | | | 432,140 | |
Hawaiian Holdings, Inc.(b) | | | 20,500 | | | | 711,350 | |
Kansas City Southern | | | 500 | | | | 41,380 | |
Spirit Airlines, Inc.(b) | | | 1,000 | | | | 37,120 | |
| | | | | | | | 1,908,240 | |
Total Common Stocks
(Cost $132,917,540) | | | | | | | 150,437,295 | |
Real Estate Investment Trusts (REITs)—0.3% | |
Equinix, Inc. | | | 716 | | | | 212,423 | |
Extra Space Storage, Inc. | | | 2,000 | | | | 158,480 | |
| | | | | | | | 370,903 | |
Total Real Estate Investment Trusts
(Cost $180,567) | | | | 370,903 | |
Exchange-Traded Fund (ETF)—0.4% | |
Capital Markets—0.4% | | | | | | | | |
SPDR S&P Health Care Services ETF | | | 10,000 | | | | 573,920 | |
Total Exchange-Traded Fund
(Cost $561,775) | | | | 573,920 | |
Purchased Call
Options—2.1% | | Contracts | | | Value | |
Consumer Durables & Apparel—0.9% | |
NIKE, Inc.
Expiration: January 2016, Exercise Price $100.00(b) | | | 75 | | | $ | 235,500 | |
NIKE, Inc.
Expiration: January 2016, Exercise Price $110.00(b) | | | 525 | | | | 1,152,900 | |
| | | | | | | | 1,388,400 | |
Consumer Services—0.1% | |
Chipotle Mexican Grill, Inc.
Expiration: January 2016, Exercise Price $625.00(b) | | | 35 | | | | 115,675 | |
Pharmaceuticals, Biotechnology & Life Sciences—0.2% | |
Allergan plc
Expiration: February 2016, Exercise Price $295.00(a)(b) | | | 45 | | | | 130,950 | |
Gilead Sciences, Inc. Expiration: February 2016, Exercise Price $105.00(b) | | | 175 | | | | 150,850 | |
| | | | | | | | 281,800 | |
Retailing—0.2% | |
The Priceline Group, Inc. Expiration: January 2016, Exercise Price $1,200.00(b) | | | 15 | | | | 403,350 | |
Software & Services—0.6% | |
Facebook, Inc.
Expiration: January 2016, Exercise Price $85.00(b) | | | 475 | | | | 866,875 | |
Technology Hardware & Equipment—0.1% | |
Apple, Inc.
Expiration: January 2016, Exercise Price $115.00(b) | | | 275 | | | | 213,125 | |
Total Purchased Call Options
(Cost $1,755,827) | | | | 3,269,225 | |
The Accompanying Notes are an Integral Part of these Financial Statements.
The Tocqueville Opportunity Fund
Schedule of Investments as of October 31, 2015
| | | | | | | | |
| | | Contracts | | | Value | |
Purchased Put Option—0.0% | |
Transportation—0.0% | | | | | | | | |
Hawaiian Holdings, Inc. Expiration: December 2015, Exercise Price $32.00(b) | | | 200 | | | $ | 21,500 | |
Total Purchased Put Option
(Cost $25,808) | | | | 21,500 | |
Short-Term
Investment—0.0% | | Shares | | | | |
Money Market Fund—0.0% | |
STIT-Treasury Portfolio—Institutional Class, 0.020%(c) | | | 375 | | | | 375 | |
Total Short-Term Investment
(Cost $375) | | | | 375 | |
Total Investments
(Cost $135,441,892)—100.8% | | | | 154,673,218 | |
Liabilities in Excess of Other Assets—(0.8)% | | | | (1,217,231 | ) |
Total Net Assets—100.0% | | | $ | 153,455,987 | |
| | | | | | | | |
Percentages are stated as a percent of net assets.
ADR American Depository Receipt
| (a) | Foreign issued security. Foreign concentration (including ADR’s) was as follows: Bermuda 0.8%; Cayman Islands 0.3% Denmark 0.6%; France 0.6%; Ireland 1.9%; Israel 0.1%; Japan 0.1%; Jersey 0.1%; Netherlands 1.4%; United Kingdom 0.4%. |
| (b) | Non-income producing security. |
| (c) | Rate listed is the 7-day effective yield. |
The Accompanying Notes are an Integral Part of these Financial Statements.
The Tocqueville International Value Fund
Schedule of Investments as of October 31, 2015
| | | | | | | | |
| Common Stocks—85.9% | | Shares | | | Value | |
Australia—1.5% | | | | | | | | |
Incitec Pivot Ltd. | | | 1,845,905 | | | $ | 5,154,763 | |
Belgium—3.7% | | | | | | | | |
Bekaert SA | | | 163,594 | | | | 4,852,261 | |
Groupe Bruxelles Lambert SA | | | 93,250 | | | | 7,569,081 | |
| | | | | | | | 12,421,342 | |
Canada—1.3% | | | | | | | | |
Superior Plus Corp. | | | 535,400 | | | | 4,372,952 | |
Cayman Islands—1.5% | | | | | | | | |
Greatview Aseptic Packaging Co., Ltd. | | | 10,389,900 | | | | 4,877,623 | |
Denmark—2.1% | | | | | | | | |
ISS A/S | | | 200,689 | | | | 7,059,486 | |
France—16.0% | | | | | | | | |
Bollore SA | | | 1,328,475 | | | | 6,567,218 | |
Cie de Saint-Gobain | | | 157,456 | | | | 6,591,274 | |
Europcar Groupe SA(a) | | | 159,608 | | | | 2,177,471 | |
IPSOS | | | 323,290 | | | | 6,558,082 | |
Publicis Groupe SA | | | 119,275 | | | | 7,726,069 | |
Rexel SA | | | 411,200 | | | | 5,611,983 | |
Sanofi | | | 96,600 | | | | 9,744,611 | |
Sopra Steria Group | | | 73,351 | | | | 8,343,996 | |
| | | | | | | | 53,320,704 | |
Germany—4.9% | | | | | | | | |
Infineon Technologies AG | | | 487,915 | | | | 6,010,102 | |
Siemens AG—ADR | | | 64,675 | | | | 6,504,365 | |
Wacker Neuson SE | | | 271,561 | | | | 3,776,381 | |
| | | | | | | | 16,290,848 | |
Hong Kong—3.4% | | | | | | | | |
Clear Media Ltd. | | | 4,012,800 | | | | 4,030,971 | |
Hopewell Holdings Ltd. | | | 1,288,750 | | | | 4,650,262 | |
Television Broadcasts Ltd. | | | 764,250 | | | | 2,785,309 | |
| | | | | | | | 11,466,542 | |
Ireland—3.5% | | | | | | | | |
Allergan plc(a) | | | 13,500 | | | | 4,164,345 | |
CRH PLC | | | 276,963 | | | | 7,580,706 | |
| | | | | | | | 11,745,051 | |
Japan—18.6% | | | | | | | | |
Amano Corp. | | | 600,000 | | | | 7,793,206 | |
Anritsu Corp. | | | 155,600 | | | | 1,013,318 | |
Hitachi Ltd. | | | 1,320,640 | | | $ | 7,618,499 | |
Hoya Corp. | | | 146,900 | | | | 6,062,090 | |
Kao Corp. | | | 135,000 | | | | 6,930,813 | |
Makita Corp. | | | 120,000 | | | | 6,575,140 | |
MISUMI Group, Inc. | | | 368,000 | | | | 4,792,133 | |
Miura Co., Ltd. | | | 114,000 | | | | 1,360,250 | |
Shiseido Co., Ltd. | | | 283,075 | | | | 6,724,187 | |
SMC Corp. | | | 24,000 | | | | 6,173,809 | |
Toho Co., Ltd. | | | 212,800 | | | | 5,537,736 | |
Toyo Suisan Kaisha Ltd. | | | 41,400 | | | | 1,525,498 | |
| | | | | | | | 62,106,679 | |
Jersey—1.7% | | | | | | | | |
Shire PLC | | | 74,050 | | | | 5,607,843 | |
Netherlands—5.5% | | | | | | | | |
Akzo Nobel NV | | | 101,125 | | | | 7,152,612 | |
Koninklijke Ten Cate NV | | | 275,982 | | | | 7,465,595 | |
Unilever NV—ADR | | | 80,000 | | | | 3,598,400 | |
| | | | | | | | 18,216,607 | |
Norway—2.8% | | | | | | | | |
Orkla ASA | | | 699,600 | | | | 5,953,646 | |
Statoil ASA—ADR | | | 200,000 | | | | 3,232,000 | |
| | | | | | | | 9,185,646 | |
Singapore—1.1% | | | | | | | | |
Singapore Post Ltd. | | | 2,711,800 | | | | 3,660,512 | |
Spain—1.4% | | | | | | | | |
Applus Services SA | | | 520,655 | | | | 4,632,610 | |
Switzerland—3.3% | | | | | | | | |
Novartis AG—ADR | | | 63,825 | | | | 5,771,695 | |
Syngenta AG—ADR | | | 80,300 | | | | 5,403,387 | |
| | | | | | | | 11,175,082 | |
United Kingdom—11.1% | | | | | | | | |
AVEVA Group PLC | | | 161,323 | | | | 5,095,127 | |
DCC PLC | | | 93,575 | | | | 7,501,181 | |
Diageo PLC—ADR | | | 63,275 | | | | 7,281,687 | |
GlaxoSmithKline PLC—ADR | | | 153,400 | | | | 6,605,404 | |
Kingfisher PLC | | | 865,900 | | | | 4,706,812 | |
Smiths Group PLC | | | 401,125 | | | | 5,934,213 | |
| | | | | | | | 37,124,424 | |
The Accompanying Notes are an Integral Part of these Financial Statements.
The Tocqueville International Value Fund
Schedule of Investments as of October 31, 2015
| | | | | | | | |
| Common Stocks—85.9% | | Shares | | | Value | |
United States—2.5% | | | | | | | | |
Aflac, Inc. | | | 129,300 | | | $ | 8,242,875 | |
Total Common Stocks
(Cost $255,184,467) | | | | | | | 286,661,589 | |
Preferred Stocks—3.3% | | | | | | | | |
Germany—0.5% | | | | | | | | |
Volkswagen AG | | | 14,730 | | | | 1,768,117 | |
Republic of Korea—2.8% | | | | | | | | |
Samsung Electronics Co., Ltd. | | | 9,000 | | | | 9,400,317 | |
Total Preferred Stocks (Cost $9,567,325) | | | | | | | 11,168,434 | |
Short-Term
Investments—11.3% | | Shares | | | Value | |
Money Market Fund—4.9% | | | | | |
STIT-Treasury Portfolio—Institutional Class, 0.020%(b) | | | 16,440,398 | | | | 16,440,398 | |
Commercial
Paper—6.4% | | Principal
Amount | | | Value | |
U.S. Bank N.A.
0.020%, 11/02/2015 | | $ | 21,265,000 | | | $ | 21,265,000 | |
Total Short-Term Investments
(Cost $37,705,398) | | | | 37,705,398 | |
Total Investments
(Cost $302,457,190)—100.5% | | | | 335,535,421 | |
Liabilities in Excess of Other Assets—(0.5)% | | | | (1,773,659 | ) |
Total Net Assets—100.0% | | | $ | 333,761,762 | |
| | | | | | | | |
Percentages are stated as a percent of net assets.
ADR American Depository Receipt
| (a) | Non-income producing security. |
| (b) | Rate listed is the 7-day effective yield. |
Schedule of Open Forward Currency Contract
October 31, 2015
| | | | | | | | | | | | | | | | | | | | | | |
Counterparty of
Contract | | Forward
Settlement
Date | | | Currency to
be Received | | | Currency to
be Delivered | | Amount of
Currency to
be Delivered | | | Amount of
Currency to
be Received | | | Unrealized
Depreciation | |
U.S. Bank N.A. | | | 12/31/2015 | | | | U.S. Dollars | | | Euro | | | 12,775,000 | | | | 14,015,836 | | | $ | (48,730 | ) |
| | | | | | | | | | | | | | | | | | | | | | |
| | | | | | | | | | | | | | | | | | | | $ | (48,730 | ) |
| | | | | | | | | | | | | | | | | | | | | | |
The Accompanying Notes are an Integral Part of these Financial Statements.
The Tocqueville Gold Fund
Schedule of Investments as of October 31, 2015
| | | | | | | | |
| Common Stocks—83.2% | | Shares | | | Value | |
Gold Related Securities—76.4% | |
Australia—1.9% | | | | | | | | |
Evolution Mining Ltd. | | | 4,990,878 | | | $ | 5,000,380 | |
Newcrest Mining Ltd.(a) | | | 1,500,000 | | | | 13,167,371 | |
| | | | | | | | 18,167,751 | |
Canada—60.1% | | | | | | | | |
Agnico Eagle Mines Ltd. | | | 1,471,773 | | | | 41,636,458 | |
Agnico Eagle Mines Ltd.(b) | | | 526,485 | | | | 14,881,375 | |
Alacer Gold Corp.(a) | | | 4,126,800 | | | | 8,016,268 | |
Alamos Gold, Inc.—Class A | | | 4,895,000 | | | | 18,796,800 | |
Almaden Minerals Ltd.(a) | | | 2,066,667 | | | | 1,153,768 | |
Almadex Minerals Ltd.(a) | | | 1,240,000 | | | | 170,694 | |
Anthem United, Inc.(a)(c)(d)(e)(f) (Originally acquired 04/03/2014, Cost $1,779,257) | | | 8,075,000 | | | | 988,070 | |
Argonaut Gold, Inc.(a)(c) | | | 2,687,000 | | | | 2,774,128 | |
ATAC Resources Ltd.(a)(c) | | | 11,516,891 | | | | 3,523,062 | |
AuRico Metals, Inc.(a) | | | 1,411,437 | | | | 852,734 | |
B2Gold Corp.(a) | | | 13,927,100 | | | | 14,901,997 | |
Barisan Gold Corp.(a) | | | 877,100 | | | | 13,415 | |
Brazil Resources, Inc.(a) | | | 202,392 | | | | 85,130 | |
Continental Gold, Inc.(a) | | | 2,039,900 | | | | 2,542,855 | |
Corvus Gold, Inc.(a)(c) | | | 3,350,901 | | | | 1,573,583 | |
Corvus Gold, Inc.(a)(b)(c) | | | 10,630,000 | | | | 4,877,638 | |
Dalradian Resources, Inc.(a) | | | 1,750,000 | | | | 994,175 | |
Dalradian Resources, Inc.(a)(b) | | | 850,000 | | | | 481,034 | |
Detour Gold Corp.(a)(c) | | | 5,604,200 | | | | 62,316,510 | |
East Asia Minerals Corp.(a)(c) | | | 66,484,933 | | | | 508,450 | |
Eldorado Gold Corp. | | | 9,171,685 | | | | 32,100,897 | |
Eldorado Gold Corp.(b) | | | 1,000,000 | | | | 3,494,953 | |
Falco Resources Ltd.(a) | | | 2,222,300 | | | | 475,867 | |
Franco-Nevada Corp. | | | 1,127,700 | | | | 57,195,675 | |
GoGold Resources, Inc.(a)(c) | | | 20,670,300 | | | | 19,759,770 | |
Goldcorp, Inc. | | | 780,850 | | | | 10,010,497 | |
Goldcorp, Inc.(b) | | | 1,948,910 | | | | 24,935,198 | |
IAMGOLD Corp.(a) | | | 4,883,396 | | | | 8,790,113 | |
International Tower Hill Mines Ltd.(a)(c) | | | 5,738,836 | | | | 1,483,489 | |
International Tower Hill Mines Ltd.(a)(b)(c) | | | 11,289,744 | | | $ | 2,849,201 | |
Kinross Gold Corp.(a) | | | 2,002,000 | | | | 4,024,020 | |
Klondex Mines Ltd.(a) | | | 1,608,500 | | | | 3,948,673 | |
New Gold, Inc.(a) | | | 6,160,640 | | | | 15,093,568 | |
Novagold Resources, Inc.(a) | | | 4,181,300 | | | | 15,136,306 | |
OceanaGold Corp. | | | 4,431,459 | | | | 8,552,716 | |
OceanaGold Corp.(b) | | | 5,250,000 | | | | 10,037,473 | |
Osisko Gold Royalties Ltd.(c) | | | 3,114,140 | | | | 32,341,711 | |
Pan American Silver Corp. | | | 2,398,098 | | | | 18,153,602 | |
Premier Gold Mines Ltd.(a)(c) | | | 7,857,660 | | | | 14,422,135 | |
Pretium Resources, Inc.(a) | | | 100,000 | | | | 598,807 | |
Primero Mining Corp.(a)(c) | | | 6,909,800 | | | | 15,905,857 | |
Rockhaven Resources Ltd.(a)(c) | | | 6,400,000 | | | | 660,753 | |
Rubicon Minerals Corp.(a)(c) | | | 11,275,000 | | | | 5,001,147 | |
SEMAFO, Inc.(a)(c) | | | 10,285,200 | | | | 23,707,386 | |
Silver Wheaton Corp. | | | 1,779,575 | | | | 24,184,424 | |
Strategic Metals Ltd.(a)(c) | | | 10,926,900 | | | | 2,423,372 | |
Torex Gold Resources, Inc.(a)(c) | | | 34,615,500 | | | | 32,825,956 | |
| | | | | | | | 569,201,710 | |
Jersey—4.8% | | | | | | | | |
Randgold Resources Ltd.—ADR | | | 675,000 | | | | 45,137,250 | |
Peru—0.4% | | | | | | | | |
Cia de Minas Buenaventura SAA—ADR | | | 631,100 | | | | 4,045,351 | |
South Africa—1.7% | | | | | | | | |
Gold Fields Ltd.—ADR | | | 6,100,950 | | | | 15,435,403 | |
Gold Fields Ltd.(b) | | | 166,249 | | | | 441,601 | |
| | | | | | | | 15,877,004 | |
United Kingdom—1.9% | | | | | | | | |
Fresnillo PLC | | | 1,640,000 | | | | 18,455,941 | |
The Accompanying Notes are an Integral Part of these Financial Statements.
The Tocqueville Gold Fund
Schedule of Investments as of October 31, 2015
| | | | | | | | |
| Common Stocks—83.2% | | Shares | | | Value | |
United States—5.6% | | | | | | | | |
Electrum Ltd.(a)(d)(e)(f) (Originally acquired 12/21/2007, Cost $13,065,361) | | | 2,127,287 | | | $ | 829,642 | |
Newmont Mining Corp. | | | 1,095,100 | | | | 21,310,646 | |
Royal Gold, Inc. | | | 650,300 | | | | 31,110,352 | |
| | | | | | | | 53,250,640 | |
Total Gold Related Securities | | | | | | | 724,135,647 | |
Other Precious Metals Related Securities—6.0% | |
Canada—5.5% | | | | | | | | |
Americas Silver Corp.(a)(c) | | | 25,668,419 | | | | 2,872,296 | |
Americas Silver Corp.(a)(b)(c) | | | 522,400 | | | | 59,927 | |
Bear Creek Mining Corp.(a)(c) | | | 7,413,200 | | | | 4,025,215 | |
Ivanhoe Mines Ltd.—Class A(a) | | | 7,314,324 | | | | 3,915,591 | |
Ivanhoe Mines Ltd.—Class B(a)(d)(e)(f)(g) (Originally acquired 08/15/2001, Cost $872,469) | | | 568,055 | | | | 288,893 | |
MAG Silver Corp.(a)(c) | | | 2,951,400 | | | | 21,132,024 | |
Plata Latina Minerals Corp.(a) | | | 2,000,000 | | | | 22,943 | |
Silver Range Resources Ltd.(a)(c) | | | 3,450,000 | | | | 98,941 | |
SilverCrest Metals, Inc.(a) | | | 52,110 | | | | 6,576 | |
Tahoe Resources, Inc. | | | 2,315,100 | | | | 19,333,812 | |
| | | | | | | | 51,756,218 | |
United States—0.5% | | | | | | | | |
Sunshine Mining & Refining(a)(d)(e)(f) (Originally acquired 03/15/2011,
Cost $18,353,107) | | | 1,633,545 | | | | 4,900,635 | |
Total Other Precious Metals Related Securities | | | | 56,656,853 | |
Other Securities—0.8% | | | | | | | | |
Canada—0.0% | | | | | | | | |
Oban Mining(a) | | | 26,539 | | | | 23,340 | |
United States—0.8% | | | | | | | | |
Gold Bullion International LLC(a)(c)(d)(e)(f) (Originally acquired 05/12/2010,
Cost $5,000,000) | | | 5,000,000 | | | $ | 6,893,000 | |
I-Pulse, Inc.(a)(d)(e)(f) (Originally acquired 10/09/2007,
Cost $175,524) | | | 74,532 | | | | 640,975 | |
| | | | | | | | 7,533,975 | |
Total Other Securities | | | | | | | 7,557,315 | |
Total Common Stocks
(Cost $1,531,739,491) | | | | | | | 788,349,815 | |
Private Fund—1.6% | | | | | | | | |
Gold Related Securities—1.6% | | | | | |
United States—1.6% | | | | | | | | |
Tocqueville Bullion Reserve LP—Class G(a)(c)(d)(e)(f) (Originally acquired 11/28/2011,
Cost $25,000,000) | | | 13,806 | | | | 15,147,299 | |
Total Private Fund
(Cost $25,000,000) | | | | | | | 15,147,299 | |
| Gold Bullion—14.4% | | Ounces | | | | |
Gold Bullion(a) | | | 119,680 | | | | 136,693,185 | |
Total Gold Bullion
(Cost $70,975,249) | | | | | | | 136,693,185 | |
| Convertible Bond—0.8% | |
| Principal
Amount |
| | | | |
Gold Related Securities—0.8% | | | | | |
Canada—0.8% | | | | | | | | |
Jaguar Mining, Inc.
12.000%, 10/23/2018(d)(e)(f) (Originally acquired 10/20/2015,
Cost 7,500,000) | | $ | 7,500,000 | | | | 7,500,000 | |
Total Convertible Bond
(Cost $7,500,000) | | | | | | | 7,500,000 | |
The Accompanying Notes are an Integral Part of these Financial Statements.
The Tocqueville Gold Fund
Schedule of Investments as of October 31, 2015
| | | | | | | | |
| Warrants—0.1% | | Shares | | | Value | |
Gold Related Securities—0.1% | | | | | |
Canada—0.1% | | | | | | | | |
Almaden Minerals Ltd.
Expiration: 02/11/2016, Exercise Price: CAD $2.00(a)(d)(e)(f) (Originally acquired 02/03/2015, Cost $0) | | | 600,000 | | | $ | 413 | |
Almadex Minerals Ltd.
Expiration: 02/11/2016, Exercise Price: CAD $0.41(a)(d)(e)(f) (Originally acquired 02/03/2015, Cost $0) | | | 360,000 | | | | 1,817 | |
Anthem United, Inc.
Expiration: 03/31/2019, Exercise Price: CAD $0.35(a)(c)(d)(e)(f) (Originally acquired 04/03/2014, Cost $0) | | | 1,250,000 | | | | 27,627 | |
East Asia Minerals Corp.
Expiration: 12/15/2016, Exercise Price: CAD $0.78(a)(c)(d)(e)(f) (Originally acquired 12/05/2011, Cost $0) | | | 6,500,000 | | | | 42,253 | |
East Asia Minerals Corp.
Expiration: 12/05/2019, Exercise Price: CAD $0.10(a)(c)(d)(e)(f) (Originally acquired 12/05/2014, Cost $0) | | | 9,764,933 | | | | — | |
Osisko Gold Royalties Ltd.
Expiration: 02/18/2022, Exercise Price: CAD $36.50(a)(c) | | | 274,000 | | | | 379,275 | |
Total Gold Related Securities | | | | | | | 451,385 | |
Total Warrants (Cost $0) | | | | | | | 451,385 | |
Rights—0.0% | | | | | | | | |
Gold Related Securities—0.0% | | | | | |
Canada—0.0% | | | | | | | | |
Dalradian Resources, Inc.
Expiration: 07/31/2017, Exercise Price: CAD $1.50(a) | | | 875,000 | | | | 56,879 | |
East Asia Minerals Corp. Expiration: 03/05/2020, Exercise Price: CAD $0.10(a)(c)(d)(e)(f) (Originally acquired 03/04/2015, Cost $0) | | | 46,175,600 | | | $ | — | |
Total Rights (Cost $0) | | | | | | | 56,879 | |
Short-Term Investment—0.6% | |
Money Market Fund—0.6% | |
STIT-Treasury Portfolio—Institutional Class, 0.020%(h) | | | 6,020,587 | | | | 6,020,587 | |
Total Short-Term Investment
(Cost $6,020,587) | | | | 6,020,587 | |
Total Investments
(Cost $1,641,235,327)—100.7% | | | | 954,219,150 | |
Liabilities in Excess of Other Assets—(0.7)% | | | | (6,852,447 | ) |
Total Net Assets—100.0% | | | $ | 947,366,703 | |
| | | | | | | | |
Percentages are stated as a percent of net assets.
ADR American Depository Receipt
CAD Canadian Dollar
| (a) | Non-income producing security. |
| (b) | Denotes an issue that is traded on a foreign exchange when a company is listed more than once. |
| (c) | Affiliated company. See Footnote 8. |
| (d) | Denotes a security that is either fully or partially restricted to resale. The value of restricted securities as of October 31, 2015 was $37,260,624, which represented 3.9% of net assets. |
| (e) | Securities are fair valued using procedures approved by the Board of Trustees. The aggregate value of fair valued securities as of October 31, 2015 was $37,260,624, which represented 3.9% of net assets. |
| (f) | Security is considered illiquid and may be difficult to sell. |
| (g) | Convertible into Ivanplats Ltd.—Class A shares. |
| (h) | Rate listed is the 7-day effective yield. |
The Accompanying Notes are an Integral Part of these Financial Statements.
The Delafield Fund
Schedule of Investments as of October 31, 2015
| | | | | | | | |
| Common Stocks—87.5% | | Shares | | | Value | |
Aerospace & Defense—2.7% | |
Honeywell International, Inc. | | | 175,000 | | | $ | 18,074,000 | |
Auto Components—0.5% | | | | | | | | |
Horizon Global Corp.(a)(b) | | | 425,000 | | | | 3,735,750 | |
Chemicals—16.2% | | | | | | | | |
Eastman Chemical Co. | | | 435,000 | | | | 31,393,950 | |
HB Fuller Co. | | | 455,000 | | | | 17,285,450 | |
Minerals Technologies, Inc. | | | 515,000 | | | | 30,354,100 | |
PolyOne Corp. | | | 900,000 | | | | 30,096,000 | |
| | | | | | | | 109,129,500 | |
Commercial Services & Supplies—0.5% | |
ACCO Brands Corp.(a) | | | 400,000 | | | | 3,228,000 | |
Construction & Engineering—3.4% | |
Aegion Corp.(a) | | | 350,000 | | | | 6,751,500 | |
KBR, Inc. | | | 700,000 | | | | 12,908,000 | |
MasTec, Inc.(a) | | | 200,000 | | | | 3,354,000 | |
| | | | | | | | 23,013,500 | |
Containers & Packaging—3.4% | |
Avery Dennison Corp. | | | 170,000 | | | | 11,044,900 | |
Owens-Illinois, Inc.(a) | | | 550,000 | | | | 11,852,500 | |
| | | | | | | | 22,897,400 | |
Electronic Equipment, Instruments & Components—13.8% | |
Checkpoint Systems, Inc. | | | 275,254 | | | | 2,058,900 | |
Flextronics International Ltd.(a)(c) | | | 2,475,000 | | | | 28,190,250 | |
Ingram Micro, Inc.—Class A | | | 580,000 | | | | 17,272,400 | |
Jabil Circuit, Inc. | | | 525,000 | | | | 12,064,500 | |
Kemet Corp.(a)(b) | | | 2,850,000 | | | | 7,923,000 | |
Plexus Corp.(a) | | | 510,000 | | | | 17,656,200 | |
Zebra Technologies Corp.—Class A(a) | | | 100,000 | | | | 7,690,000 | |
| | | | | | | | 92,855,250 | |
Energy Equipment & Services—2.4% | |
Frank’s International NV(c) | | | 525,000 | | | | 9,009,000 | |
McDermott International, Inc.(a)(c) | | | 1,556,500 | | | $ | 7,175,465 | |
| | | | | | | | 16,184,465 | |
Industrial Conglomerates—1.6% | |
Carlisle Cos., Inc. | | | 125,000 | | | | 10,875,000 | |
Insurance—1.3% | | | | | | | | |
XL Group PLC(c) | | | 225,000 | | | | 8,568,000 | |
Machinery—15.8% | | | | | | | | |
Crane Co. | | | 325,000 | | | | 17,108,000 | |
Dover Corp. | | | 475,000 | | | | 30,604,250 | |
Harsco Corp. | | | 1,200,000 | | | | 12,876,000 | |
Kennametal, Inc. | | | 525,000 | | | | 14,763,000 | |
Stanley Black & Decker, Inc. | | | 175,000 | | | | 18,546,500 | |
Xerium Technologies, Inc.(a)(b) | | | 950,000 | | | | 12,825,000 | |
| | | | | | | | 106,722,750 | |
Metals & Mining—3.5% | | | | | | | | |
Allegheny Technologies, Inc. | | | 200,000 | | | | 2,940,000 | |
Carpenter Technology Corp. | | | 325,000 | | | | 10,825,750 | |
Ryerson Holding Corp.(a)(b) | | | 1,300,000 | | | | 7,605,000 | |
Universal Stainless & Alloy Products, Inc.(a) | | | 275,000 | | | | 2,392,500 | |
| | | | | | | | 23,763,250 | |
Oil, Gas & Consumable Fuels—4.1% | |
Boardwalk Pipeline Partners LP | | | 1,100,000 | | | | 14,102,000 | |
CNX Coal Resources LP(a) | | | 300,000 | | | | 3,882,000 | |
CONSOL Energy, Inc. | | | 1,500,000 | | | | 9,990,000 | |
| | | | | | | | 27,974,000 | |
Professional Services—4.2% | |
TrueBlue, Inc.(a) | | | 975,000 | | | | 28,245,750 | |
The Accompanying Notes are an Integral Part of these Financial Statements.
The Delafield Fund
Schedule of Investments as of October 31, 2015
| | | | | | | | |
| Common Stocks—87.5% | | Shares | | | Value | |
Semiconductors & Semiconductor Equipment—3.9% | |
Fairchild Semiconductor International, Inc.(a) | | | 625,000 | | | $ | 10,425,000 | |
Teradyne, Inc. | | | 825,000 | | | | 16,104,000 | |
| | | | | | | | 26,529,000 | |
Specialty Retail—3.2% | | | | | | | | |
Ascena Retail Group, Inc.(a) | | | 1,600,000 | | | | 21,312,000 | |
Technology Hardware, Storage & Peripherals—2.9% | |
Diebold, Inc. | | | 275,000 | | | | 10,139,250 | |
Hewlett-Packard Co. | | | 360,000 | | | | 9,705,600 | |
| | | | | | | | 19,844,850 | |
Trading Companies & Distributors—4.1% | |
Rush Enterprises, Inc.—Class A(a) | | | 425,000 | | | | 10,361,500 | |
WESCO International, Inc.(a) | | | 350,000 | | | | 17,125,500 | |
| | | | | | | | 27,487,000 | |
Total Common Stocks (Cost $436,126,653) | | | | | | | 590,439,465 | |
Short-Term Investments—12.9% | |
Money Market Fund—5.0% | | | | | |
STIT-Treasury Portfolio—Institutional Class, 0.020%(d) | | | 33,780,005 | | | | 33,780,005 | |
Commercial
Paper—7.9% | | Principal
Amount | | | | |
U.S. Bank N.A.
0.020%, 11/02/2015 | | $ | 53,063,000 | | | | 53,063,000 | |
Total Short-Term Investments
(Cost $86,843,005) | | | | 86,843,005 | |
Total Investments
(Cost $522,969,658)—100.4% | | | | 677,282,470 | |
Liabilities in Excess of Other Assets—(0.4)% | | | | (2,757,881 | ) |
Total Net Assets—100.0% | | | $ | 674,524,589 | |
| | | | | | | | |
Percentages are stated as a percent of net assets.
| (a) | Non-income producing security. |
| (b) | Affiliated company. See Footnote 8. |
| (c) | Foreign issued security. Foreign concentration was as follows: Ireland 1.3%; Netherlands 1.3%; Panama 1.1%; Singapore 4.2%. |
| (d) | Rate listed is the 7-day effective yield. |
The Accompanying Notes are an Integral Part of these Financial Statements.
The Tocqueville Select Fund
Schedule of Investments as of October 31, 2015
| | | | | | | | |
| Common Stocks—91.7% | | Shares | | | Value | |
Auto Components—3.5% | |
Horizon Global Corp.(a)(b) | | | 328,000 | | | $ | 2,883,120 | |
Chemicals—7.9% | | | | | | | | |
Eastman Chemical Co. | | | 35,000 | | | | 2,525,950 | |
Minerals Technologies, Inc. | | | 66,000 | | | | 3,890,040 | |
| | | | | | | | 6,415,990 | |
Commercial Services & Supplies—3.7% | |
ACCO Brands Corp.(a) | | | 370,600 | | | | 2,990,742 | |
Containers & Packaging—3.4% | |
Avery Dennison Corp. | | | 43,000 | | | | 2,793,710 | |
Electronic Equipment, Instruments & Components—7.0% | |
Flextronics International Ltd.(a)(c) | | | 291,200 | | | | 3,316,768 | |
Jabil Circuit, Inc. | | | 105,400 | | | | 2,422,092 | |
| | | | | | | | 5,738,860 | |
Industrial Conglomerates—3.0% | |
Carlisle Cos., Inc. | | | 28,500 | | | | 2,479,500 | |
Internet Software & Services—11.6% | |
j2 Global, Inc. | | | 54,100 | | | | 4,195,455 | |
Web.com Group, Inc.(a) | | | 226,000 | | | | 5,304,220 | |
| | | | | | | | 9,499,675 | |
IT Services—3.2% | |
EPAM Systems, Inc.(a) | | | 33,800 | | | | 2,614,430 | |
Leisure Products—1.4% | |
Summer Infant, Inc.(a)(b) | | | 674,016 | | | | 1,166,048 | |
Machinery—20.5% | | | | | | | | |
Dover Corp. | | | 57,400 | | | | 3,698,282 | |
Harsco Corp. | | | 255,000 | | | | 2,736,150 | |
Kennametal, Inc. | | | 104,000 | | | | 2,924,480 | |
Stanley Black & Decker, Inc. | | | 35,900 | | | | 3,804,682 | |
Xerium Technologies, Inc.(a)(b) | | | 265,000 | | | | 3,577,500 | |
| | | | | | | | 16,741,094 | |
Metals & Mining—5.8% | |
Carpenter Technology Corp. | | | 72,000 | | | | 2,398,320 | |
Real Industry, Inc.(a) | | | 249,333 | | | | 2,368,663 | |
| | | | | | | | 4,766,983 | |
Oil, Gas & Consumable Fuels—1.5% | |
CONSOL Energy, Inc. | | | 185,000 | | | $ | 1,232,100 | |
Professional Services—4.4% | |
RPX Corp.(a) | | | 97,000 | | | | 1,381,280 | |
Stantec, Inc.(c) | | | 89,000 | | | | 2,233,010 | |
| | | | | | | | 3,614,290 | |
Semiconductors & Semiconductor Equipment—2.9% | |
Fairchild Semiconductor International, Inc.(a) | | | 143,900 | | | | 2,400,252 | |
Specialty Retail—7.3% | |
Ascena Retail Group, Inc.(a) | | | 286,500 | | | | 3,816,180 | |
Pier 1 Imports, Inc. | | | 291,000 | | | | 2,159,220 | |
| | | | | | | | 5,975,400 | |
Trading Companies & Distributors—4.6% | |
MRC Global, Inc.(a) | | | 109,950 | | | | 1,308,405 | |
WESCO International, Inc.(a) | | | 49,500 | | | | 2,422,035 | |
| | | | | | | | 3,730,440 | |
Total Common Stocks
(Cost $67,300,922) | | | | 75,042,634 | |
Short-Term Investments—8.4% | |
Money Market Fund—5.0% | |
STIT-Treasury Portfolio—Institutional Class, 0.020%(d) | | | 4,084,844 | | | | 4,084,844 | |
| Commercial Paper—3.4% | | Principal
Amount | | | | |
U.S. Bank N.A.
0.020%, 11/02/2015 | | $ | 2,744,000 | | | | 2,744,000 | |
Total Short-Term Investments
(Cost $6,828,844) | | | | 6,828,844 | |
Total Investments
(Cost $74,129,766)—100.1% | | | | 81,871,478 | |
Liabilities in Excess of Other Assets—(0.1)% | | | | (58,650 | ) |
Total Net Assets—100.0% | | | $ | 81,812,828 | |
| | | | | | | | |
The Accompanying Notes are an Integral Part of these Financial Statements.
The Tocqueville Select Fund
Schedule of Investments as of October 31, 2015
Percentages are stated as a percent of net assets.
| (a) | Non-income producing security. |
| (b) | Affiliated company. See Footnote 8. |
| (c) | Foreign issued security. Foreign concentration was as follows: Canada 2.7%; Singapore 4.1%. |
| (d) | Rate listed is the 7-day effective yield. |
The Accompanying Notes are an Integral Part of these Financial Statements.
The Tocqueville Alternative Strategies Fund
Schedule of Investments as of October 31, 2015
| | | | | | | | |
| Common Stocks—43.1% | | Shares | | | Value | |
Airlines—1.2% | | | | | | | | |
Delta Air Lines, Inc. | | | 11,000 | | | $ | 559,240 | |
Biotechnology—8.8% | | | | | | | | |
AbbVie, Inc. | | | 18,500 | | | | 1,101,675 | |
Alkermes PLC(a)(b) | | | 8,000 | | | | 575,360 | |
Biogen, Inc.(a) | | | 2,100 | | | | 610,071 | |
Isis Pharmaceuticals, Inc.(a) | | | 6,000 | | | | 288,900 | |
Momenta Pharmaceuticals, Inc.(a) | | | 32,500 | | | | 533,325 | |
PTC Therapeutics, Inc.(a) | | | 32,600 | | | | 810,762 | |
| | | | | | | | 3,920,093 | |
Food Products—1.5% | |
Tyson Foods, Inc.—Class A | | | 15,000 | | | | 665,400 | |
Health Care Providers & Services—0.6% | |
Hanger, Inc.(a) | | | 20,000 | | | | 288,400 | |
Hotels, Restaurants & Leisure—2.9% | |
Bob Evans Farms, Inc. | | | 14,000 | | | | 605,780 | |
McDonald’s Corp. | | | 6,000 | | | | 673,500 | |
| | | | | | | | 1,279,280 | |
Internet & Catalog Retail—2.8% | |
Amazon.com, Inc.(a) | | | 2,000 | | | | 1,251,800 | |
Internet Software & Services—4.8% | |
Alphabet, Inc.—Class C(a) | | | 500 | | | | 355,405 | |
IAC/InterActiveCorp | | | 11,800 | | | | 790,718 | |
Inuvo, Inc.(a)(c) | | | 350,000 | | | | 1,004,500 | |
| | | | | | | | 2,150,623 | |
IT Services—0.4% | |
PayPal Holdings, Inc.(a) | | | 5,000 | | | | 180,050 | |
Media—1.0% | |
Discovery Communications, Inc.—Class C(a) | | | 17,000 | | | | 467,840 | |
Pharmaceuticals—6.8% | |
Allergan plc(a)(b) | | | 4,910 | | | | 1,514,587 | |
BioDelivery Sciences International, Inc.(a) | | | 50,000 | | | | 269,000 | |
Eisai Co., Ltd.—ADR(b) | | | 4,000 | | | | 253,920 | |
Eisai Co., Ltd.(b)(d) | | | 3,000 | | | | 189,144 | |
Omeros Corp.(a) | | | 65,000 | | | | 814,450 | |
| | | | | | | | 3,041,101 | |
Road & Rail—2.4% | |
Kansas City Southern | | | 4,500 | | | $ | 372,420 | |
Union Pacific Corp.* | | | 8,000 | | | | 714,800 | |
| | | | | | | | 1,087,220 | |
Semiconductors & Semiconductor Equipment—1.9% | |
Micron Technology, Inc.(a) | | | 52,350 | | | | 866,916 | |
Software—1.4% | |
Splunk, Inc.(a) | | | 11,000 | | | | 617,760 | |
Specialty Retail—1.6% | |
Dick’s Sporting Goods, Inc. | | | 8,000 | | | | 356,400 | |
Vitamin Shoppe, Inc.(a) | | | 12,000 | | | | 344,280 | |
| | | | | | | | 700,680 | |
Technology Hardware, Storage & Peripherals—5.0% | |
BlackBerry Ltd.(a)(b) | | | 104,000 | | | | 758,160 | |
Hewlett-Packard Co. | | | 40,000 | | | | 1,078,400 | |
Stratasys Ltd.(a)(b) | | | 15,000 | | | | 382,500 | |
| | | | | | | | 2,219,060 | |
Total Common Stocks
(Cost $17,749,448) | | | | 19,295,463 | |
| Convertible Bonds—33.1% | | Principal
Amount | | | | |
Air Freight & Logistics—1.1% | |
UTi Worldwide, Inc. 4.500%, 03/01/2019*(b) | | $ | 500,000 | | | | 498,125 | |
Automobiles—3.0% | | | | | | | | |
Tesla Motors, Inc.
1.250%, 03/01/2021* | | | 1,500,000 | | | | 1,318,125 | |
Biotechnology—2.2% | |
Acorda Therapeutics, Inc. 1.750%, 06/15/2021* | | | 900,000 | | | | 960,750 | |
Health Care Equipment & Supplies—1.9% | |
Insulet Corp.
2.000%, 06/15/2019(e) | | | 500,000 | | | | 480,625 | |
The Spectranetics Corp. 2.625%, 06/01/2034*(e) | | | 500,000 | | | | 385,938 | |
| | | | | | | | 866,563 | |
The Accompanying Notes are an Integral Part of these Financial Statements.
The Tocqueville Alternative Strategies Fund
Schedule of Investments as of October 31, 2015
| | | | | | | | |
| Convertible Bonds—33.1% | | Principal
Amount | | | Value | |
Internet Software & Services—3.5% | |
Twitter, Inc.
1.000%, 09/15/2021* | | $ | 500,000 | | | $ | 442,188 | |
Web.com Group, Inc.
1.000%, 08/15/2018 | | | 1,150,000 | | | | 1,129,156 | |
| | | | | | | | 1,571,344 | |
Life Sciences Tools & Services—0.9% | |
Fluidigm Corp.
2.750%, 02/01/2034(e) | | | 600,000 | | | | 399,375 | |
Machinery—3.5% | | | | | | | | |
Chart Industries, Inc.
2.000%, 08/01/2018* | | | 1,250,000 | | | | 1,096,875 | |
Navistar International Corp. 4.500%, 10/15/2018* | | | 650,000 | | | | 463,531 | |
| | | | | | | | 1,560,406 | |
Metals & Mining—7.0% | | | | | | | | |
B2Gold Corp.
3.250%, 10/01/2018*(b) | | | 1,600,000 | | | | 1,343,000 | |
RTI International Metals, Inc.
1.625%, 10/15/2019* | | | 1,000,000 | | | | 1,026,875 | |
Stillwater Mining Co. 1.750%, 10/15/2032*(e) | | | 750,000 | | | | 744,844 | |
| | | | | | | | 3,114,719 | |
Oil, Gas & Consumable Fuels—0.3% | |
Energy XXI Ltd.
3.000%, 12/15/2018*(b) | | | 900,000 | | | | 139,500 | |
Real Estate Investment Trusts (REIT)—2.2% | |
Starwood Property Trust, Inc.
3.750%, 10/15/2017* | | | 1,000,000 | | | | 996,875 | |
Semiconductors & Semiconductor Equipment—3.2% | |
Micron Technology, Inc.
3.000%, 11/15/2043*(e) | | | 500,000 | | | | 455,000 | |
SunEdison, Inc.
0.250%, 01/15/2020* | | | 1,000,000 | | | | 534,375 | |
SunPower Corp.
0.875%, 06/01/2021 | | | 500,000 | | | | 459,688 | |
| | | | | | | | 1,449,063 | |
Software—4.3% | | | | | | | | |
Nuance Communications, Inc.
2.750%, 11/01/2031*(e) | | $ | 1,250,000 | | | $ | 1,257,812 | |
TiVo, Inc.
2.000%, 10/01/2021 | | | 750,000 | | | | 664,687 | |
| | | | | | | | 1,922,499 | |
Total Convertible Bonds
(Cost $16,394,928) | | | | 14,797,344 | |
Corporate Bonds—13.1% | | | | | | | | |
Auto Components—1.8% | | | | | | | | |
The Goodyear Tire & Rubber Co.
8.250%, 08/15/2020(e) | | | 750,000 | | | | 787,313 | |
Banks—3.2% | | | | | | | | |
JPMorgan Chase & Co. 5.150%, 12/29/2049*(e)(f) | | | 1,000,000 | | | | 965,000 | |
Wachovia Capital Trust III 5.570%, 03/15/2042*(e)(f) | | | 500,000 | | | | 491,625 | |
| | | | | | | | 1,456,625 | |
Capital Markets—1.6% | | | | | | | | |
Goldman Sachs Capital II 4.000%, 06/01/2043*(e)(f) | | | 1,000,000 | | | | 722,500 | |
Insurance—1.2% | | | | | | | | |
XLIT Ltd. 6.500%, 12/29/2049(b)(e)(f) | | | 700,000 | | | | 560,140 | |
Food & Staples Retailing—1.1% | |
Bunge Ltd. Finance Corp. 4.100%, 03/15/2016* | | | 500,000 | | | | 505,020 | |
Insurance—0.6% | |
Prudential Financial, Inc. 5.625%, 06/15/2043*(e)(f) | | | 250,000 | | | | 262,250 | |
Metals & Mining—2.8% | |
IAMGOLD Corp.
6.750%, 10/01/2020(b)(e) | | | 1,500,000 | | | | 1,140,000 | |
Noranda Aluminum Acquisition Corp. 11.000%, 06/01/2019(e) | | | 425,000 | | | | 97,750 | |
| | | | | | | | 1,237,750 | |
The Accompanying Notes are an Integral Part of these Financial Statements.
The Tocqueville Alternative Strategies Fund
Schedule of Investments as of October 31, 2015
| | | | | | | | |
| Corporate Bonds—13.1% | | Principal
Amount | | | Value | |
Oil, Gas & Consumable Fuels—0.8% | | | | | |
W&T Offshore, Inc.
8.500%, 06/15/2019*(e) | | $ | 750,000 | | | $ | 341,250 | |
Total Corporate Bonds
(Cost $6,518,080) | | | | 5,872,848 | |
| Closed-End Funds—2.3% | | Shares | | | | |
Capital Markets—2.3% | | | | | |
BlackRock Debt Strategies Fund, Inc. | | | 110,496 | | | | 382,316 | |
Credit Suisse Asset Management Income Fund, Inc. | | | 120,000 | | | | 351,600 | |
Western Asset Income Fund | | | 23,000 | | | | 307,280 | |
| | | | | | | | 1,041,196 | |
Total Closed-End Funds
(Cost $1,139,263) | | | | 1,041,196 | |
Preferred Stocks—7.3% | | | | | | | | |
Banks—6.0% | | | | | | | | |
Bank of America Corp. 6.625%, 12/31/2049(e) | | | 11,500 | | | | 305,210 | |
Citigroup Capital XIII 7.875%, 12/31/2049(e)(f) | | | 30,000 | | | | 762,000 | |
Citigroup, Inc.
6.875%, 12/31/2049*(e)(f) | | | 15,000 | | | | 413,100 | |
HSBC USA, Inc.
3.500%, 12/31/2049*(e)(f) | | | 15,000 | | | | 328,800 | |
U.S. Bancorp
3.500%, 12/31/2049*(e)(f) | | | 1,125 | | | | 898,031 | |
| | | | | | | | 2,707,141 | |
Consumer Finance—1.3% | | | | | | | | |
SLM Corp.
2.037%, 12/31/2049*(e)(f) | | | 12,000 | | | | 564,000 | |
Total Preferred Stocks
(Cost $3,483,484) | | | | 3,271,141 | |
Purchased Call
Option—0.1% | | Contracts | | | Value | |
Biotechnology—0.1% | |
PTC Therapeutics, Inc. Expiration: March 2016, Exercise Price: $35.00(a) | | | 75 | | | $ | 34,875 | |
Total Purchased Call Option
(Cost $29,767) | | | | 34,875 | |
| Warrants—0.1% | | Shares | | | | |
Internet Software & Services—0.1% | |
Inuvo, Inc. Expiration: 06/21/16, Exercise Price: $2.20(a)(c)(g)(h)(i) (Originally acquired 06/21/2011, Cost $0) | | | 31,750 | | | | 31,496 | |
Oil, Gas & Consumable Fuels—0.0% | |
Magnum Hunter Resources Corp. Expiration: 04/15/16, Exercise Price: $8.50(a)(g)(h)(i) (Originally acquired 04/15/2013, Cost $0) | | | 4,000 | | | | 37 | |
Total Warrants
(Cost $0) | | | | 31,533 | |
Short-Term Investments—5.9% | |
Money Market Fund—3.2% | |
STIT-Treasury Portfolio—Institutional Class, 0.020%(j) | | | 1,440,558 | | | | 1,440,558 | |
| Commercial Paper—2.7% | | Principal
Amount | | | | |
U.S. Bank N.A.
0.020%, 11/02/2015 | | $ | 1,195,000 | | | | 1,195,000 | |
Total Short-Term Investments
(Cost $2,635,558) | | | | 2,635,558 | |
Total Investments
(Cost $47,950,528)—105.0% | | | | 46,979,958 | |
Liabilities in Excess of Other
Assets—(5.0)% | | | | (2,244,775 | ) |
Total Net Assets—100.0% | | | $ | 44,735,183 | |
| | | | | | | | |
The Accompanying Notes are an Integral Part of these Financial Statements.
The Tocqueville Alternative Strategies Fund
Schedule of Investments as of October 31, 2015
| | | | | | | | |
| Securities Sold Short | | Shares | | | Value | |
Common Stocks—(5.8)% | |
Air Freight & Logistics—(0.4)% | |
UTi Worldwide, Inc.(a)(b) | | | (23,000 | ) | | $ | (163,990 | ) |
Automobiles—(1.3)% | | | | | | | | |
Tesla Motors, Inc.(a) | | | (2,780 | ) | | | (575,265 | ) |
Biotechnology—(0.3)% | | | | | | | | |
Acorda Therapeutics, Inc.(a) | | | (3,850 | ) | | | (138,754 | ) |
Health Care Equipment & Supplies—(0.2)% | |
The Spectranetics Corp.(a) | | | (9,000 | ) | | | (109,980 | ) |
Internet Software & Services—(0.8)% | |
Alphabet, Inc.—Class A(a) | | | (500 | ) | | | (368,695 | ) |
Life Sciences Tools & Services—(0.1)% | |
Fluidigm Corp.(a) | | | (2,300 | ) | | | (24,863 | ) |
Machinery—(0.1)% | | | | | | | | |
Chart Industries, Inc.(a) | | | (3,600 | ) | | | (61,884 | ) |
Metals & Mining—(1.7)% | | | | | | | | |
Alcoa, Inc. | | | (40,000 | ) | | | (357,200 | ) |
Stillwater Mining Co.(a) | | | (42,500 | ) | | | (396,950 | ) |
| | | | | | | | (754,150 | ) |
Oil, Gas & Consumable Fuels—(0.3)% | |
Energy XXI Ltd.(b) | | | (90,000 | ) | | | (155,700 | ) |
Semiconductors & Semiconductor Equipment—(0.6)% | |
SunEdison, Inc.(a) | | | (24,900 | ) | | | (181,770 | ) |
SunPower Corp.(a) | | | (2,500 | ) | | | (67,100 | ) |
| | | | | | | | (248,870 | ) |
Total Common Stocks
(Proceeds $3,722,471) | | | | (2,602,151 | ) |
Exchange-Traded Funds (ETFs)—(12.8)% | |
Capital Markets—(12.8)% | | | | | | | | |
Health Care Select Sector SPDR Fund | | | (16,000 | ) | | | (1,141,440 | ) |
iShares Core S&P Small-Cap ETF | | | (3,500 | ) | | | (395,675 | ) |
iShares PHLX Semiconductor ETF | | | (4,100 | ) | | | (367,114 | ) |
iShares U.S. Energy ETF | | | (6,000 | ) | | | (229,860 | ) |
Market Vectors Biotech ETF(a) | | | (12,500 | ) | | | (1,547,375 | ) |
Exchange-Traded Funds
(ETFs)—(12.8)% | | Shares | | | Value | |
Technology Select Sector SPDR Fund | | | (15,700 | ) | | $ | (685,305 | ) |
Vanguard S&P 500 ETF | | | (7,100 | ) | | | (1,352,976 | ) |
| | | | | | | | (5,719,745 | ) |
Total Exchange-Traded Funds
(Proceeds $6,038,925) | | | | (5,719,745 | ) |
U.S. Treasury
Notes—(15.8)% | | Principal
Amount | | | | |
1.750%, 09/30/2019 | | $ | (1,000,000 | ) | | | (1,015,866 | ) |
2.125%, 09/30/2021 | | | (1,000,000 | ) | | | (1,021,289 | ) |
1.750%, 05/15/2022 | | | (1,000,000 | ) | | | (993,730 | ) |
2.000%, 02/15/2023 | | | (4,000,000 | ) | | | (4,023,048 | ) |
| | | | | | | | (7,053,933 | ) |
Total U.S. Treasury Notes
(Proceeds $7,097,110) | | | | (7,053,933 | ) |
Total Investments (Proceeds $16,858,506)—(34.4)% | | | $ | (15,375,829 | ) |
| | | | | | | | |
Percentages are stated as a percent of net assets.
ADR American Depository Receipt
| * | All or a portion of this security is segregated as collateral for securities sold short. |
| (a) | Non-income producing security. |
| (b) | Foreign issued security. Foreign concentration (including ADR’s) was as follows: Bermuda 0.3%; Canada 7.2%; Ireland 5.9%; Israel 0.9%; Japan 1.0%; Virgin Islands 1.1%. |
| (c) | Affiliated company. See Footnote 8. |
| (d) | Denotes an issue that is traded on a foreign exchange when a company is listed more than once. |
| (f) | Variable rate security. The rate shown is as of 10/31/2015. |
| (g) | Denotes a security is either fully or partially restricted to resale. The aggregate value of restricted securities as of October 31, 2015 was $31,533, which represented 0.1% of net assets. |
The Accompanying Notes are an Integral Part of these Financial Statements.
The Tocqueville Alternative Strategies Fund
Schedule of Investments as of October 31, 2015
| (h) | Securities are fair valued using procedures approved by the Board of Trustees. The aggregate value of fair valued securities as of October 31, 2015 was $31,533, which represented 0.1% of net assets. |
| (i) | Security is considered illiquid and may be difficult to sell. |
| (j) | Rate listed is the 7-day effective yield. |
The Accompanying Notes are an Integral Part of these Financial Statements.
Percent of Total Investments
The Tocqueville Fund
Allocation of Portfolio Holdings
October 31, 2015
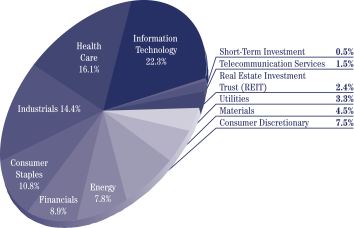
The Tocqueville Opportunity Fund
Allocation of Portfolio Holdings
October 31, 2015
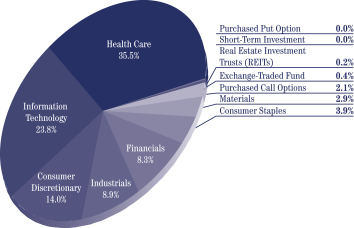
Percent of Total Investments
The Tocqueville International Value Fund
Allocation of Portfolio Holdings
October 31, 2015
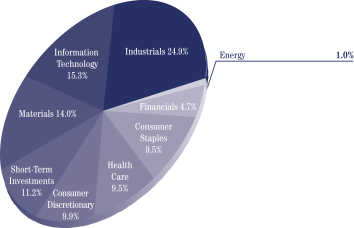
The Tocqueville Gold Fund
Allocation of Portfolio Holdings
October 31, 2015
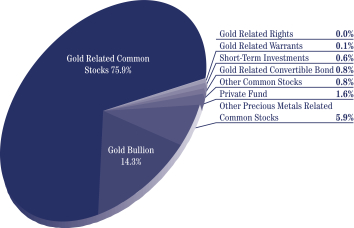
Percent of Total Investments
The Delafield Fund
Allocation of Portfolio Holdings
October 31, 2015
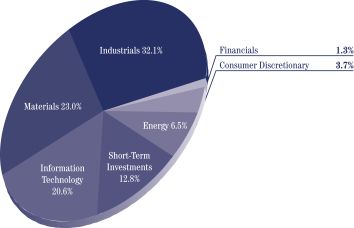
The Tocqueville Select Fund
Allocation of Portfolio Holdings
October 31, 2015
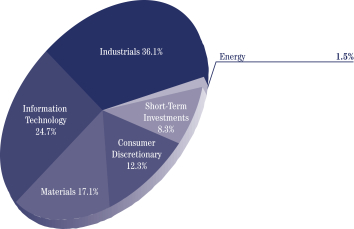
Percent of Total Investments
The Tocqueville Alternative Strategies Fund
Allocation of Portfolio Holdings
Long Positions
October 31, 2015
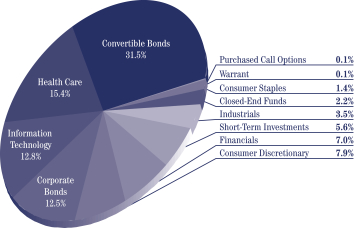
The Tocqueville Alternative Strategies Fund
Allocation of Portfolio Holdings
Short Positions
October 31, 2015
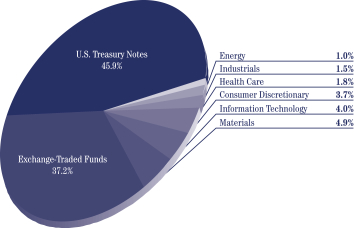
The Tocqueville Trust
Statements of Assets & Liabilities as of October 31, 2015
| | | | | | | | | | | | | | | | |
| | | The
Tocqueville
Fund | | | The
Tocqueville
Opportunity
Fund | | | The
Tocqueville
International
Value Fund | | | The
Tocqueville
Gold Fund | |
Assets: | | | | | | | | | | | | | | | | |
Investments, at value (1) | | | | | | | | | | | | | | | | |
Unaffiliated issuers | | $ | 309,470,136 | | | $ | 154,673,218 | | | $ | 335,535,421 | | | $ | 675,599,075 | |
Affiliated issuers | | | — | | | | — | | | | — | | | | 278,620,075 | |
Foreign currencies, at value (2) | | | — | | | | — | | | | — | | | | 2,542 | |
Segregated cash at broker | | | — | | | | — | | | | — | | | | — | |
Receivable for investments sold | | | — | | | | 3,119,259 | | | | 1,416,509 | | | | 4,275,302 | |
Receivable for Fund shares sold | | | 27,078 | | | | 217,208 | | | | 1,123,118 | | | | 1,440,108 | |
Dividends, interest and other receivables | | | 396,762 | | | | 18,726 | | | | 1,163,410 | | | | 76,949 | |
Prepaid assets | | | 14,504 | | | | 17,680 | | | | 20,381 | | | | 23,669 | |
Return of capital receivable | | | 35,000 | | | | 9,275 | | | | — | | | | — | |
| | | | | | | | | | | | | | | | |
Total Assets | | | 309,943,480 | | | | 158,055,366 | | | | 339,258,839 | | | | 960,037,720 | |
| | | | | | | | | | | | | | | | |
Liabilities: | | | | | | | | | | | | | | | | |
Securities sold short, at value (3) | | | — | | | | — | | | | — | | | | — | |
Unrealized depreciation on forward currency contracts | | | — | | | | — | | | | 48,730 | | | | — | |
Payable for investments purchased | | | — | | | | 473,326 | | | | 4,940,297 | | | | 2,159,931 | |
Payable for loans outstanding | | | — | | | | 2,340,000 | | | | — | | | | — | |
Due to custodian | | | — | | | | — | | | | 272 | | | | — | |
Payable for foreign currencies purchased | | | — | | | | — | | | | 3,334 | | | | 314 | |
Payable for Fund shares redeemed | | | 290,972 | | | | 1,596,782 | | | | 160,355 | | | | 8,914,244 | |
Payable to Adviser (see Note 10) | | | 155,839 | | | | 101,209 | | | | 148,274 | | | | 744,177 | |
Payable to Administrator | | | 51,585 | | | | 24,814 | | | | 50,978 | | | | 142,126 | |
Payable to Trustees | | | 17,416 | | | | 6,422 | | | | 13,249 | | | | 56,307 | |
Accrued distribution fee | | | 34,667 | | | | 13,192 | | | | 27,214 | | | | 51,934 | |
Accrued expenses and other liabilities | | | 126,005 | | | | 43,634 | | | | 104,374 | | | | 601,984 | |
| | | | | | | | | | | | | | | | |
Total Liabilities | | | 676,484 | | | | 4,599,379 | | | | 5,497,077 | | | | 12,671,017 | |
| | | | | | | | | | | | | | | | |
Net Assets | | $ | 309,266,996 | | | $ | 153,455,987 | | | $ | 333,761,762 | | | $ | 947,366,703 | |
| | | | | | | | | | | | | | | | |
The Accompanying Notes are an Integral Part of these Financial Statements.
The Tocqueville Trust
Statements of Assets & Liabilities as of October 31, 2015
| | | | | | | | | | | | | | | | |
| | | The
Tocqueville
Fund | | | The
Tocqueville
Opportunity
Fund | | | The
Tocqueville
International
Value Fund | | | The
Tocqueville
Gold Fund | |
Net assets consist of: | | | | | | | | | | | | | | | | |
Paid in capital | | $ | 175,603,264 | | | $ | 136,135,298 | | | $ | 291,190,988 | | | $ | 1,766,687,945 | |
Accumulated net investment income (loss) | | | 2,750,258 | | | | (964,098 | ) | | | 5,779,937 | | | | (8,758,830 | ) |
Accumulated net realized gain (loss) | | | 2,965,307 | | | | (946,465 | ) | | | 3,837,007 | | | | (123,524,021 | ) |
Net unrealized appreciation (depreciation) on: | | | | | | | | | | | | | | | | |
Investments and foreign currency related items | | | 127,948,167 | | | | 19,231,252 | | | | 32,953,830 | | | | (687,038,391 | ) |
| | | | | | | | | | | | | | | | |
Net Assets | | $ | 309,266,996 | | | $ | 153,455,987 | | | $ | 333,761,762 | | | $ | 947,366,703 | |
| | | | | | | | | | | | | | | | |
Shares of beneficial interest outstanding (unlimited shares of $0.01 par value authorized) | | | 9,398,701 | | | | 7,166,156 | | | | 22,883,417 | | | | 36,387,617 | |
Net asset value, offering and redemption price per share | | $ | 32.91 | | | $ | 21.41 | | | $ | 14.59 | | | $ | 26.04 | |
| | | | | | | | | | | | | | | | |
(1) Cost of investments | | | | | | | | | | | | | | | | |
Unaffiliated issuers | | $ | 181,521,969 | | | $ | 135,441,892 | | | $ | 302,457,190 | | | $ | 1,027,555,333 | |
Affiliated issuers | | $ | — | | | $ | — | | | $ | — | | | $ | 613,679,994 | |
(2) Cost of foreign currencies | | $ | — | | | $ | — | | | $ | — | | | $ | 2,573 | |
(3) Proceeds of securities sold short | | $ | — | | | $ | — | | | $ | — | | | $ | — | |
The Accompanying Notes are an Integral Part of these Financial Statements.
The Tocqueville Trust
Statements of Assets & Liabilities as of October 31, 2015
| | | | | | | | | | | | |
| | | The
Delafield Fund | | | The
Tocqueville
Select Fund | | | The
Tocqueville
Alternative
Strategies Fund | |
Assets: | | | | | | | | | | | | |
Investments, at value (1) | | | | | | | | | | | | |
Unaffiliated issuers | | $ | 645,193,720 | | | $ | 74,244,810 | | | $ | 45,943,962 | |
Affiliated issuers | | | 32,088,750 | | | | 7,626,668 | | | | 1,035,996 | |
Foreign currencies, at value (2) | | | — | | | | — | | | | — | |
Segregated cash at broker | | | — | | | | — | | | | 13,221,363 | |
Receivable for investments sold | | | 3,648,123 | | | | — | | | | 633,846 | |
Receivable for Fund shares sold | | | 85,641 | | | | 31,460 | | | | 52,306 | |
Dividends, interest and other receivables | | | 305,129 | | | | 89,173 | | | | 211,113 | |
Prepaid assets | | | 10,503 | | | | 12,756 | | | | 10,477 | |
Return of capital receivable | | | — | | | | — | | | | — | |
| | | | | | | | | | | | |
Total Assets | | | 681,331,866 | | | | 82,004,867 | | | | 61,109,063 | |
| | | | | | | | | | | | |
Liabilities: | | | | | | | | | | | | |
Securities sold short, at value (3) | | | — | | | | — | | | | 15,375,829 | |
Unrealized depreciation on forward currency contracts | | | — | | | | — | | | | — | |
Payable for investments purchased | | | 3,906,712 | | | | — | | | | 882,904 | |
Payable for loans outstanding | | | — | | | | — | | | | — | |
Due to custodian | | | — | | | | — | | | | — | |
Payable for foreign currencies purchased | | | — | | | | — | | | | — | |
Payable for Fund shares redeemed | | | 1,885,092 | | | | 70,266 | | | | — | |
Payable to Adviser (see Note 10) | | | 439,619 | | | | 55,610 | | | | 45,232 | |
Payable to Administrator | | | 114,998 | | | | 13,979 | | | | 6,123 | |
Payable to Trustees | | | 56,593 | | | | 4,674 | | | | 1,938 | |
Accrued distribution fee | | | 37,420 | | | | 9,744 | | | | 3,842 | |
Accrued expenses and other liabilities | | | 366,843 | | | | 37,766 | | | | 58,012 | |
| | | | | | | | | | | | |
Total Liabilities | | | 6,807,277 | | | | 192,039 | | | | 16,373,880 | |
| | | | | | | | | | | | |
Net Assets | | $ | 674,524,589 | | | $ | 81,812,828 | | | $ | 44,735,183 | |
| | | | | | | | | | | | |
The Accompanying Notes are an Integral Part of these Financial Statements.
The Tocqueville Trust
Statements of Assets & Liabilities as of October 31, 2015
| | | | | | | | | | | | |
| | | The
Delafield Fund | | | The
Tocqueville
Select Fund | | | The
Tocqueville
Alternative
Strategies Fund | |
Net assets consist of: | | | | | | | | | | | | |
Paid in capital | | $ | 459,367,280 | | | $ | 71,908,382 | | | $ | 44,257,199 | |
Accumulated net investment income (loss) | | | (1,818,953 | ) | | | (410,830 | ) | | | 114,238 | |
Accumulated net realized gain (loss) | | | 62,663,450 | | | | 2,573,564 | | | | (149,874 | ) |
Net unrealized appreciation (depreciation) on: | | | | | | | | | | | | |
Investments and foreign currency related items | | | 154,312,812 | | | | 7,741,712 | | | | 513,620 | |
| | | | | | | | | | | | |
Net Assets | | $ | 674,524,589 | | | $ | 81,812,828 | | | $ | 44,735,183 | |
| | | | | | | | | | | | |
Shares of beneficial interest outstanding (unlimited shares of $0.01 par value authorized) | | | 23,554,835 | | | | 6,774,685 | | | | 1,704,776 | |
Net asset value, offering and redemption price per share | | $ | 28.64 | | | $ | 12.08 | | | $ | 26.24 | |
| | | | | | | | | | | | |
(1) Cost of investments | | | | | | | | | | | | |
Unaffiliated issuers | | $ | 479,142,487 | | | $ | 63,789,039 | | | $ | 47,362,201 | |
Affiliated issuers | | $ | 43,827,171 | | | $ | 10,340,727 | | | $ | 588,327 | |
(2) Cost of foreign currencies | | $ | — | | | $ | — | | | $ | — | |
(3) Proceeds of securities sold short | | $ | — | | | $ | — | | | $ | (16,858,506 | ) |
The Accompanying Notes are an Integral Part of these Financial Statements.
The Tocqueville Trust
Statements of Operations as of October 31, 2015
| | | | | | | | | | | | | | | | |
| | | The
Tocqueville
Fund | | | The
Tocqueville
Opportunity
Fund | | | The
Tocqueville
International
Value Fund | | | The
Tocqueville
Gold Fund | |
Investment Income: | | | | | | | | | | | | | | | | |
Dividends* | | | | | | | | | | | | | | | | |
Unaffiliated issuers | | $ | 8,107,967 | | | $ | 415,922 | | | $ | 6,111,139 | | | $ | 6,389,219 | |
Affiliated issuers | | | — | | | | — | | | | — | | | | 293,370 | |
Interest | | | 195 | | | | 171 | | | | 4,691 | | | | 9,847 | |
| | | | | | | | | | | | | | | | |
Total investment income | | | 8,108,162 | | | | 416,093 | | | | 6,115,830 | | | | 6,692,436 | |
| | | | | | | | | | | | | | | | |
Expenses: | | | | | | | | | | | | | | | | |
Investment Adviser’s fee (See Note 4) | | | 2,758,683 | | | | 853,500 | | | | 2,678,218 | | | | 9,632,188 | |
Distribution fees (See Note 4) | | | 919,561 | | | | 284,500 | | | | 669,554 | | | | 2,845,636 | |
Administration fees (See Note 4) | | | 551,725 | | | | 170,700 | | | | 401,733 | | | | 1,544,259 | |
Transfer agent and shareholder services fees | | | 154,245 | | | | 26,066 | | | | 94,227 | | | | 870,071 | |
Trustee fees and expenses | | | 75,884 | | | | 23,182 | | | | 53,196 | | | | 235,826 | |
Printing and mailing expense | | | 62,065 | | | | 15,157 | | | | 46,515 | | | | 279,837 | |
Legal fees | | | 47,520 | | | | 14,962 | | | | 35,255 | | | | 201,529 | |
Fund accounting fees | | | 34,790 | | | | 27,252 | | | | 50,107 | | | | 99,423 | |
Audit fees | | | 32,911 | | | | 10,284 | | | | 21,405 | | | | 102,773 | |
Blue sky fees | | | 27,922 | | | | 24,503 | | | | 28,996 | | | | 60,397 | |
Other expenses (See Note 10) | | | 22,105 | | | | 9,112 | | | | 38,326 | | | | 61,755 | |
Custody fees | | | 19,058 | | | | 24,359 | | | | 83,024 | | | | 271,070 | |
Interest expense | | | 15,990 | | | | 5,463 | | | | — | | | | 10,590 | |
Insurance expense | | | 7,939 | | | | 1,632 | | | | 5,745 | | | | 37,371 | |
Registration fees | | | 1,450 | | | | 1,178 | | | | 1,366 | | | | 3,720 | |
Interest expense on securities sold short | | | — | | | | — | | | | — | | | | — | |
Dividends expense on securities sold short | | | — | | | | — | | | | — | | | | — | |
| | | | | | | | | | | | | | | | |
Total expenses before waiver | | | 4,731,848 | | | | 1,491,850 | | | | 4,207,667 | | | | 16,256,445 | |
Less: Fees waived (See Note 4) | | | (121,858 | ) | | | — | | | | (859,895 | ) | | | — | |
| | | | | | | | | | | | | | | | |
Net expenses | | | 4,609,990 | | | | 1,491,850 | | | | 3,347,772 | | | | 16,256,445 | |
| | | | | | | | | | | | | | | | |
Net Investment Income (Loss) | | | 3,498,172 | | | | (1,075,757 | ) | | | 2,768,058 | | | | (9,564,009 | ) |
| | | | | | | | | | | | | | | | |
The Accompanying Notes are an Integral Part of these Financial Statements.
The Tocqueville Trust
Statements of Operations as of October 31, 2015
| | | | | | | | | | | | | | | | |
| | | The
Tocqueville
Fund | | | The
Tocqueville
Opportunity
Fund | | | The
Tocqueville
International
Value Fund | | | The
Tocqueville
Gold Fund | |
Realized and Unrealized Gain (Loss): | | | | | | | | | | | | | | | | |
Net realized gain (loss) on: | | | | | | | | | | | | | | | | |
Investments | | | | | | | | | | | | | | | | |
Unaffiliated issuers | | | 6,216,705 | | | | 339,247 | | | | 6,220,140 | | | | (107,037,980 | ) |
Affiliated issuers | | | — | | | | — | | | | — | | | | (6,898,588 | ) |
Securities sold short | | | — | | | | — | | | | — | | | | — | |
Forward currency contracts | | | — | | | | — | | | | 4,251,437 | | | | — | |
Foreign currency translation | | | (4,677 | ) | | | (1,027 | ) | | | (291,213 | ) | | | 83,959 | |
| | | | | | | | | | | | | | | | |
| | | 6,212,028 | | | | 338,220 | | | | 10,180,364 | | | | (113,852,609 | ) |
Net change in unrealized appreciation (depreciation) on: | | | | | | | | | | | | | | | | |
Investments | | | (9,794,238 | ) | | | 322,922 | | | | 895,617 | | | | 30,433,967 | |
Securities sold short | | | — | | | | — | | | | — | | | | — | |
Forward currency contracts | | | — | | | | — | | | | (268,663 | ) | | | — | |
Foreign currency translation | | | — | | | | (20,449 | ) | | | (34,861 | ) | | | (76,830,709 | ) |
| | | | | | | | | | | | | | | | |
| | | (9,794,238 | ) | | | 302,473 | | | | 592,093 | | | | (46,396,742 | ) |
Net gain (loss) on investments and foreign currency | | | (3,582,210 | ) | | | 640,693 | | | | 10,772,457 | | | | (160,249,351 | ) |
| | | | | | | | | | | | | | | | |
Net Increase (Decrease) in Net Assets Resulting from Operations | | $ | (84,038 | ) | | $ | (435,064 | ) | | $ | 13,540,515 | | | $ | (169,813,360 | ) |
| | | | | | | | | | | | | | | | |
* Net of foreign taxes withheld of: | | $ | 33,666 | | | $ | 1,158 | | | $ | 628,731 | | | $ | 914,547 | |
| | | | | | | | | | | | | | | | |
The Accompanying Notes are an Integral Part of these Financial Statements.
The Tocqueville Trust
Statements of Operations as of October 31, 2015
| | | | | | | | | | | | |
| | | The
Delafield Fund | | | The
Tocqueville
Select
Fund | | | The
Tocqueville
Alternative
Strategies Fund | |
Investment Income: | | | | | | | | | | | | |
Dividends* | | | | | | | | | | | | |
Unaffiliated issuers | | $ | 10,983,419 | | | $ | 806,663 | | | $ | 340,699 | |
Affiliated issuers | | | — | | | | — | | | | — | |
Interest | | | 104,892 | | | | 1,708 | | | | 1,022,962 | |
| | | | | | | | | | | | |
Total investment income | | | 11,088,311 | | | | 808,371 | | | | 1,363,661 | |
| | | | | | | | | | | | |
Expenses: | | | | | | | | | | | | |
Investment Adviser’s fee (See Note 4) | | | 7,397,044 | | | | 772,768 | | | | 564,870 | |
Distribution fees (See Note 4) | | | 2,526,199 | | | | 241,490 | | | | 108,992 | |
Administration fees (See Note 4) | | | 1,383,361 | | | | 144,894 | | | | 65,396 | |
Transfer agent and shareholder services fees | | | 443,403 | | | | 40,684 | | | | 6,012 | |
Trustee fees and expenses | | | 205,566 | | | | 19,915 | | | | 8,510 | |
Printing and mailing expense | | | 183,345 | | | | 19,428 | | | | 6,386 | |
Legal fees | | | 127,004 | | | | 12,864 | | | | 38,420 | |
Fund accounting fees | | | 87,015 | | | | 9,716 | | | | 11,754 | |
Audit fees | | | 86,460 | | | | 9,388 | | | | 4,063 | |
Blue sky fees | | | 37,139 | | | | 23,410 | | | | 35,513 | |
Other expenses (See Note 10) | | | 59,464 | | | | 5,818 | | | | 8,330 | |
Custody fees | | | 69,522 | | | | 6,741 | | | | 6,122 | |
Interest expense | | | — | | | | — | | | | 215,596 | |
Insurance expense | | | 34,973 | | | | 2,839 | | | | 3,378 | |
Registration fees | | | 4,162 | | | | 2,015 | | | | 5,175 | |
Interest expense on securities sold short | | | — | | | | — | | | | 118,697 | |
Dividends expense on securities sold short | | | — | | | | — | | | | 90,777 | |
| | | | | | | | | | | | |
Total expenses before waiver | | | 12,644,657 | | | | 1,311,970 | | | | 1,297,991 | |
Less: Fees waived (See Note 4) | | | — | | | | — | | | | (51,526 | ) |
| | | | | | | | | | | | |
Net expenses | | | 12,644,657 | | | | 1,311,970 | | | | 1,246,465 | |
| | | | | | | | | | | | |
Net Investment Income (Loss) | | | (1,556,346 | ) | | | (503,599 | ) | | | 117,196 | |
| | | | | | | | | | | | |
The Accompanying Notes are an Integral Part of these Financial Statements.
The Tocqueville Trust
Statements of Operations as of October 31, 2015
| | | | | | | | | | | | |
| | | The
Delafield Fund | | | The
Tocqueville
Select Fund | | | The
Tocqueville
Alternative
Strategies Fund | |
Realized and Unrealized Gain (Loss): | | | | | | | | | | | | |
Net realized gain (loss) on: | | | | | | | | | | | | |
Investments | | | | | | | | | | | | |
Unaffiliated issuers | | | 110,781,692 | | | | 4,827,634 | | | | 1,015,378 | |
Affiliated issuers | | | (10,768,985 | ) | | | (991,295 | ) | | | — | |
Securities sold short | | | — | | | | — | | | | (1,026,285 | ) |
Forward currency contracts | | | — | | | | — | | | | — | |
Foreign currency translation | | | (5,950 | ) | | | (292 | ) | | | (1,888 | ) |
| | | | | | | | | | | | |
| | | 100,006,757 | | | | 3,836,047 | | | | (12,795 | ) |
Net change in unrealized appreciation (depreciation) on: | | | | | | | | | | | | |
Investments | | | (216,949,971 | ) | | | (10,827,711 | ) | | | (3,011,689 | ) |
Securities sold short | | | — | | | | — | | | | 1,870,834 | |
Forward currency contracts | | | — | | | | — | | | | — | |
Foreign currency translation | | | 61,363 | | | | — | | | | 9,277 | |
| | | | | | | | | | | | |
| | | (216,888,608 | ) | | | (10,827,711 | ) | | | (1,131,578 | ) |
Net gain (loss) on investments and foreign currency | | | (116,881,851 | ) | | | (6,991,664 | ) | | | (1,144,373 | ) |
| | | | | | | | | | | | |
Net Increase (Decrease) in Net Assets Resulting from Operations | | $ | (118,438,197 | ) | | $ | (7,495,263 | ) | | $ | (1,027,177 | ) |
| | | | | | | | | | | | |
* Net of foreign taxes withheld of: | | $ | 61,313 | | | $ | 5,899 | | | $ | 1,286 | |
| | | | | | | | | | | | |
The Accompanying Notes are an Integral Part of these Financial Statements.
The Tocqueville Trust
Statements of Changes in Net Assets
| | | | | | | | | | | | | | | | | | | | | | | | |
| | | The Tocqueville Fund | | | The Tocqueville
Opportunity Fund | | | The Tocqueville
International Value Fund | |
| | | For the
Year Ended
October 31,
2015 | | | For the
Year Ended
October 31,
2014 | | | For the
Year Ended
October 31,
2015 | | | For the
Year Ended
October 31,
2014 | | | For the
Year Ended
October 31,
2015 | | | For the
Year Ended
October 31,
2014 | |
Operations: | | | | | | | | | | | | | | | | | | | | | | | | |
Net investment income (loss) | | $ | 3,498,172 | | | $ | 3,147,289 | | | $ | (1,075,757 | ) | | $ | (753,596 | ) | | $ | 2,768,058 | | | $ | 2,435,541 | |
Net realized gain (loss) on sale of investments, foreign currency, and securities sold short | | | 6,212,028 | | | | 15,406,460 | | | | 338,220 | | | | 12,216,924 | | | | 10,180,364 | | | | 17,926,515 | |
Net change in unrealized appreciation (depreciation) | | | (9,794,238 | ) | | | 27,645,101 | | | | 302,473 | | | | (2,101,499 | ) | | | 592,093 | | | | (19,822,967 | ) |
| | | | | | | | | | | | | | | | | | | | | | | | |
Net increase (decrease) in net assets resulting from operations | | | (84,038 | ) | | | 46,198,850 | | | | (435,064 | ) | | | 9,361,829 | | | | 13,540,515 | | | | 539,089 | |
| | | | | | | | | | | | | | | | | | | | | | | | |
Dividends and distributions to shareholders: | | | | | | | | | | | | | | | | | | | | | | | | |
Net investment income | | | (2,801,877 | ) | | | (3,425,837 | ) | | | — | | | | — | | | | (5,099,005 | ) | | | (4,005,675 | ) |
Net realized gains | | | (13,296,075 | ) | | | (2,781,747 | ) | | | (10,178,189 | ) | | | (4,131,999 | ) | | | (8,275,518 | ) | | | — | |
| | | | | | | | | | | | | | | | | | | | | | | | |
Total dividends and distributions | | | (16,097,952 | ) | | | (6,207,584 | ) | | | (10,178,189 | ) | | | (4,131,999 | ) | | | (13,374,523 | ) | | | (4,005,675 | ) |
Fund share transactions: | | | | | | | | | | | | | | | | | | | | | | | | |
Shares sold | | | 37,315,146 | | | | 48,540,663 | | | | 114,212,927 | | | | 8,062,871 | | | | 156,381,171 | | | | 64,986,954 | |
Shares sold—Predecessor Fund Class I | | | — | | | | — | | | | — | | | | — | | | | — | | | | — | |
Shares sold—Predecessor Fund Class C | | | — | | | | — | | | | — | | | | — | | | | — | | | | — | |
Shares issued to holders in reinvestment of dividends | | | 15,075,202 | | | | 5,727,081 | | | | 9,830,855 | | | | 3,947,515 | | | | 12,789,709 | | | | 3,955,730 | |
Shares issued to holders in reinvestment of dividends—Predecessor Fund Class I | | | — | | | | — | | | | — | | | | — | | | | — | | | | — | |
Shares issued to holders in reinvestment of dividends—Predecessor Fund Class C | | | — | | | | — | | | | — | | | | — | | | | — | | | | — | |
Shares redeemed* | | | (107,502,725 | ) | | | (61,966,744 | ) | | | (40,298,704 | ) | | | (17,525,024 | ) | | | (72,625,881 | ) | | | (91,406,713 | ) |
The Accompanying Notes are an Integral Part of these Financial Statements.
The Tocqueville Trust
Statements of Changes in Net Assets
| | | | | | | | | | | | | | | | | | | | | | | | |
| | | The Tocqueville Fund | | | The Tocqueville
Opportunity Fund | | | The Tocqueville
International Value Fund | |
| | | For the
Year Ended
October 31,
2015 | | | For the
Year Ended
October 31,
2014 | | | For the
Year Ended
October 31,
2015 | | | For the
Year Ended
October 31,
2014 | | | For the
Year Ended
October 31,
2015 | | | For the
Year Ended
October 31,
2014 | |
Shares redeemed—Predecessor Fund Class I* | | | — | | | | — | | | | — | | | | — | | | | — | | | | — | |
Shares redeemed—Predecessor Fund Class C* | | | — | | | | — | | | | — | | | | — | | | | — | | | | — | |
Transfers into Fund from: | | | | | | | | | | | | | | | | | | | | | | | | |
Predecessor Fund —Class I | | | — | | | | — | | | | — | | | | — | | | | — | | | | — | |
Predecessor Fund —Class C | | | — | | | | — | | | | — | | | | — | | | | — | | | | — | |
Transfers out of Predecessor Fund—Class I into Fund | | | — | | | | — | | | | — | | | | — | | | | — | | | | — | |
Transfers out of Predecessor Fund—Class C into Fund | | | — | | | | — | | | | — | | | | — | | | | — | | | | — | |
| | | | | | | | | | | | | | | | | | | | | | | | |
Net increase (decrease) | | | (55,112,377 | ) | | | (7,699,000 | ) | | | 83,745,078 | | | | (5,514,638 | ) | | | 96,544,999 | | | | (22,464,029 | ) |
| | | | | | | | | | | | | | | | | | | | | | | | |
Net increase (decrease) in net assets | | | (71,294,367 | ) | | | 32,292,266 | | | | 73,131,825 | | | | (284,808 | ) | | | 96,710,991 | | | | (25,930,615 | ) |
Net Assets: | | | | | | | | | | | | | | | | | | | | | | | | |
Beginning of period | | | 380,561,363 | | | | 348,269,097 | | | | 80,324,162 | | | | 80,608,970 | | | | 237,050,771 | | | | 262,981,386 | |
| | | | | | | | | | | | | | | | | | | | | | | | |
End of period** | | $ | 309,266,996 | | | $ | 380,561,363 | | | $ | 153,455,987 | | | $ | 80,324,162 | | | $ | 333,761,762 | | | $ | 237,050,771 | |
| | | | | | | | | | | | | | | | | | | | | | | | |
* Net of redemption fees of: | | $ | 14,088 | | | $ | 6,837 | | | $ | 10,031 | | | $ | 4,879 | | | $ | 7,448 | | | $ | 16,383 | |
| | | | | | | | | | | | | | | | | | | | | | | | |
** Including undistributed net investment income (loss) of: | | $ | 2,750,258 | | | $ | 2,358,640 | | | $ | (964,098 | ) | | $ | — | | | $ | 5,779,937 | | | $ | 4,129,917 | |
| | | | | | | | | | | | | | | | | | | | | | | | |
| (1) | The predecessor fund of the Tocqueville Alternative Strategies Fund fiscal years began January 1, 2014 and June 1, 2013, respectively. |
The Accompanying Notes are an Integral Part of these Financial Statements.
The Tocqueville Trust
Statements of Changes in Net Assets
| | | | | | | | | | | | | | | | | | | | | | | | |
| | | The Tocqueville Gold Fund | | | The Delafield Fund | | | The Tocqueville Select Fund | |
| | | For the
Year Ended
October 31,
2015 | | | For the
Year Ended
October 31,
2014 | | | For the
Year Ended
October 31,
2015 | | | For the
Year Ended
October 31,
2014 | | | For the
Year Ended
October 31,
2015 | | | For the
Year Ended
October 31,
2014 | |
Operations: | | | | | | | | | | | | | | | | | | | | | | | | |
Net investment income (loss) | | $ | (9,564,009 | ) | | $ | (10,287,466 | ) | | $ | (1,556,346 | ) | | $ | (4,079,587 | ) | | $ | (503,599 | ) | | $ | (522,438 | ) |
Net realized gain (loss) on sale of investments, foreign currency, and securities sold short | | | (113,852,609 | ) | | | (4,221,429 | ) | | | 100,006,757 | | | | 166,547,066 | | | | 3,836,047 | | | | 13,674,117 | |
Net change in unrealized appreciation (depreciation) | | | (46,396,742 | ) | | | (274,322,894 | ) | | | (216,888,608 | ) | | | (126,401,486 | ) | | | (10,827,711 | ) | | | (6,858,895 | ) |
| | | | | | | | | | | | | | | | | | | | | | | | |
Net increase (decrease) in net assets resulting from operations | | | (169,813,360 | ) | | | (288,831,789 | ) | | | (118,438,197 | ) | | | 36,065,993 | | | | (7,495,263 | ) | | | 6,292,784 | |
| | | | | | | | | | | | | | | | | | | | | | | | |
Dividends and distributions to shareholders: | | | | | | | | | | | | | | | | | | | | | | | | |
Net investment income | | | — | | | | — | | | | — | | | | — | | | | — | | | | — | |
Net realized gains | | | — | | | | — | | | | (136,125,451 | ) | | | (61,841,266 | ) | | | (12,348,792 | ) | | | (9,932,816 | ) |
| | | | | | | | | | | | | | | | | | | | | | | | |
Total dividends and distributions | | | — | | | | — | | | | (136,125,451 | ) | | | (61,841,266 | ) | | | (12,348,792 | ) | | | (9,932,816 | ) |
Fund share transactions: | | | | | | | | | | | | | | | | | | | | | | | | |
Shares sold | | | 389,454,957 | | | | 662,295,777 | | | | 83,154,620 | | | | 200,760,342 | | | | 8,301,845 | | | | 16,655,565 | |
Shares sold—Predecessor Fund Class I | | | — | | | | — | | | | — | | | | — | | | | — | | | | — | |
Shares sold—Predecessor Fund Class C | | | — | | | | — | | | | — | | | | — | | | | — | | | | — | |
Shares issued to holders in reinvestment of dividends | | | — | | | | — | | | | 128,320,111 | | | | 58,365,398 | | | | 12,127,056 | | | | 9,680,740 | |
Shares issued to holders in reinvestment of dividends—Predecessor Fund Class I | | | — | | | | — | | | | — | | | | — | | | | — | | | | — | |
Shares issued to holders in reinvestment of dividends—Predecessor Fund Class C | | | — | | | | — | | | | — | | | | — | | | | — | | | | — | |
Shares redeemed* | | | (410,832,034 | ) | | | (449,988,243 | ) | | | (757,525,493 | ) | | | (517,552,743 | ) | | | (26,831,712 | ) | | | (14,524,187 | ) |
The Accompanying Notes are an Integral Part of these Financial Statements.
The Tocqueville Trust
Statements of Changes in Net Assets
| | | | | | | | | | | | | | | | | | | | | | | | |
| | | The Tocqueville Gold Fund | | | The Delafield Fund | | | The Tocqueville Select Fund | |
| | | For the
Year Ended
October 31,
2015 | | | For the
Year Ended
October 31,
2014 | | | For the
Year Ended
October 31,
2015 | | | For the
Year Ended
October 31,
2014 | | | For the
Year Ended
October 31,
2015 | | | For the
Year Ended
October 31,
2014 | |
Shares redeemed—Predecessor Fund Class I* | | | — | | | | — | | | | — | | | | — | | | | — | | | | — | |
Shares redeemed—Predecessor Fund Class C* | | | — | | | | — | | | | — | | | | — | | | | — | | | | — | |
Transfers into Fund from: | | | | | | | | | | | | | | | | | | | | | | | | |
Predecessor Fund —Class I | | | — | | | | — | | | | — | | | | — | | | | — | | | | — | |
Predecessor Fund —Class C | | | — | | | | — | | | | — | | | | — | | | | — | | | | — | |
Transfers out of Predecessor Fund—Class I into Fund | | | — | | | | — | | | | — | | | | — | | | | — | | | | — | |
Transfers out of Predecessor Fund—Class C into Fund | | | — | | | | — | | | | — | | | | — | | | | — | | | | — | |
| | | | | | | | | | | | | | | | | | | | | | | | |
Net increase (decrease) | | | (21,377,077 | ) | | | 212,307,534 | | | | (546,050,762 | ) | | | (258,427,003 | ) | | | (6,402,811 | ) | | | 11,812,118 | |
| | | | | | | | | | | | | | | | | | | | | | | | |
Net increase (decrease) in net assets | | | (191,190,437 | ) | | | (76,524,255 | ) | | | (800,614,410 | ) | | | (284,202,276 | ) | | | (26,246,866 | ) | | | 8,172,086 | |
Net Assets: | | | | | | | | | | | | | | | | | | | | | | | | |
Beginning of period | | | 1,138,557,140 | | | | 1,215,081,395 | | | | 1,475,138,999 | | | | 1,759,341,275 | | | | 108,059,694 | | | | 99,887,608 | |
| | | | | | | | | | | | | | | | | | | | | | | | |
End of period** | | $ | 947,366,703 | | | $ | 1,138,557,140 | | | $ | 674,524,589 | | | $ | 1,475,138,999 | | | $ | 81,812,828 | | | $ | 108,059,694 | |
| | | | | | | | | | | | | | | | | | | | | | | | |
* Net of redemption fees of: | | $ | 254,299 | | | $ | 610,399 | | | $ | 90,239 | | | $ | 50,053 | | | $ | 874 | | | $ | 1,184 | |
| | | | | | | | | | | | | | | | | | | | | | | | |
** Including undistributed net investment income (loss) of: | | $ | (8,758,830 | ) | | $ | (10,340,448 | ) | | $ | (1,818,953 | ) | | $ | (4,198,357 | ) | | $ | (410,830 | ) | | $ | (479,135 | ) |
| | | | | | | | | | | | | | | | | | | | | | | | |
| (1) | The predecessor fund of the Tocqueville Alternative Strategies Fund fiscal years began January 1, 2014 and June 1, 2013, respectively. |
The Accompanying Notes are an Integral Part of these Financial Statements.
The Tocqueville Trust
Statements of Changes in Net Assets
| | | | | | | | | | | | |
| | | The Tocqueville Alternative Strategies Fund | |
| | | For the
Year Ended
October 31,
2015 | | | For the Period
January 1,
2014 to
October 31,
2014 | | | For the Period
June 1. 2013 to
December 31,
2013(1) | |
Operations: | | | | | | | | | | | | |
Net investment income (loss) | | $ | 117,196 | | | $ | (291,198 | ) | | $ | (219,558 | ) |
Net realized gain (loss) on sale of investments, foreign currency, and securities sold short | | | (12,795 | ) | | | 508,454 | | | | 629,461 | |
Net change in unrealized appreciation (depreciation) | | | (1,131,578 | ) | | | 1,284,500 | | | | (1,950,488 | ) |
| | | | | | | | | | | | |
Net increase (decrease) in net assets resulting from operations | | | (1,027,177 | ) | | | 1,501,756 | | | | (1,540,585 | ) |
| | | | | | | | | | | | |
Dividends and distributions to shareholders: | | | | | | | | | | | | |
Net investment income | | | — | | | | — | | | | (151,536 | ) |
Net realized gains | | | (852,479 | ) | | | — | | | | (2,234,040 | ) |
| | | | | | | | | | | | |
Total dividends and distributions | | | (852,479 | ) | | | — | | | | (2,385,576 | ) |
Fund share transactions: | | | | | | | | | | | | |
Shares sold | | | 12,945,356 | | | | 6,810,152 | | | | — | |
Shares sold—Predecessor Fund Class I | | | — | | | | 6,305,831 | | | | 8,987,962 | |
Shares sold—Predecessor Fund Class C | | | — | | | | 102,500 | | | | 1,222,630 | |
Shares issued to holders in reinvestment of dividends | | | 845,263 | | | | — | | | | — | |
Shares issued to holders in reinvestment of dividends—Predecessor Fund Class I | | | — | | | | — | | | | 1,183,824 | |
Shares issued to holders in reinvestment of dividends—Predecessor Fund Class C | | | — | | | | — | | | | 67,455 | |
Shares redeemed* | | | (6,319,111 | ) | | | (8,344,933 | ) | | | — | |
The Accompanying Notes are an Integral Part of these Financial Statements.
The Tocqueville Trust
Statements of Changes in Net Assets
| | | | | | | | | | | | |
| | | The Tocqueville Alternative Strategies Fund | |
| | | For the
Year Ended
October 31,
2015 | | | For the Period
January 1,
2014 to
October 31,
2014 | | | For the Period
June 1, 2013 to
December 31,
2013(1) | |
Shares redeemed—Predecessor Fund Class I* | | | — | | | | (4,678,480 | ) | | | (8,580,347 | ) |
Shares redeemed—Predecessor Fund Class C* | | | — | | | | (354,715 | ) | | | — | |
Transfers into Fund from: | | | | | | | | | | | | |
Predecessor Fund —Class I | | | — | | | | 37,578,661 | | | | — | |
Predecessor Fund —Class C | | | — | | | | 1,035,984 | | | | — | |
Transfers out of Predecessor Fund—Class I into Fund | | | — | | | | (37,578,661 | ) | | | — | |
Transfers out of Predecessor Fund—Class C into Fund | | | — | | | | (1,035,984 | ) | | | — | |
| | | | | | | | | | | | |
Net increase (decrease) | | | 7,471,508 | | | | (159,645 | ) | | | 2,881,524 | |
| | | | | | | | | | | | |
Net increase (decrease) in net assets | | | 5,591,852 | | | | 1,342,111 | | | | (1,044,637 | ) |
Net Assets: | | | | | | | | | | | | |
Beginning of period | | | 39,143,331 | | | | 37,801,220 | | | | 38,845,857 | |
| | | | | | | | | | | | |
End of period** | | $ | 44,735,183 | | | $ | 39,143,331 | | | $ | 37,801,220 | |
| | | | | | | | | | | | |
* Net of redemption fees of: | | $ | 2,261 | | | $ | 2,575 | | | $ | 2,385 | |
| | | | | | | | | | | | |
** Including undistributed net investment income (loss) of: | | $ | 114,238 | | | $ | (74,713 | ) | | $ | (185,738 | ) |
| | | | | | | | | | | | |
| (1) | Results shown are those of the Predecessor Fund. See footnote 1. |
The Accompanying Notes are an Integral Part of these Financial Statements.
The Tocqueville Trust
Statements of Cash Flows
| | | | |
| | | The Tocqueville
Alternative
Strategies Fund | |
| | | For the
Year Ended
October 31,
2015 | |
Cash flows from operating activities | | | | |
Net decrease in net assets resulting from operations | | $ | (1,027,177 | ) |
Adjustments to reconcile net increase (decrease) in net assets resulting from operations to net cash provided by (used in) operating activities: | | | | |
Net realized gain on investments and foreign currency translation | | | (1,013,908 | ) |
Net realized loss on securities sold short | | | 1,026,285 | |
Net change in unrealized loss on investments and foreign currency translation | | | 3,002,412 | |
Net change in unrealized gain on securities sold short | | | (1,870,834 | ) |
Amortization and accretion of premium and discount | | | (192,648 | ) |
Changes in assets and liabilities: | | | | |
Due to custodian | | | (23,946 | ) |
Segregated cash at broker | | | (4,518,157 | ) |
Receivable from/Payable to Adviser | | | 71,020 | |
Dividends, interest and other receivables | | | 13,856 | |
Prepaid assets | | | 10,541 | |
Payable to Trustees | | | 79 | |
Accrued distribution fees | | | (1,464 | ) |
Accrued expenses and other liabilities | | | 2,597 | |
Purchases of investments | | | (37,031,925 | ) |
Proceeds from sale of investments | | | 33,517,130 | |
Net purchases and sales of short-term investments | | | 1,499,146 | |
Payments to close short transactions | | | (14,387,984 | ) |
Proceeds from securities sold short | | | 14,318,369 | |
| | | | |
Net cash used in operating activities | | | (6,606,608 | ) |
| | | | |
Cash flows from financing activities: | | | | |
Proceeds from shares issued | | | 12,926,934 | |
Payment on shares redeemed | | | (6,319,111 | ) |
Dividends paid to shareholders, net of reinvestments | | | (7,215 | ) |
| | | | |
Net cash provided by financing activities | | | 6,600,608 | |
| | | | |
Net decrease in cash | | | (6,000 | ) |
| | | | |
Cash, beginning of year | | | 6,000 | |
| | | | |
Cash, end of year | | $ | — | |
| | | | |
Non-cash financing activities | | | | |
Reinvested dividends | | $ | 845,263 | |
The Accompanying Notes are an Integral Part of these Financial Statements.
The Tocqueville Trust
Notes to Financial Statements
1. ORGANIZATION
The Tocqueville Trust (the “Trust”) is a Massachusetts business trust registered under the Investment Company Act of 1940 and organized on September 17, 1986, currently consisting of seven separate funds (each, a “Fund” or, collectively, the “Funds”). Each Fund is an open-end management investment company with a different investment objective. The Tocqueville Fund, The Tocqueville Opportunity Fund (the “Opportunity Fund”), The Tocqueville International Value Fund (the “International Fund”), and The Delafield Fund are classified as diversified investment companies. The Tocqueville Gold Fund (the “Gold Fund”), The Tocqueville Select Fund (the “Select Fund”) and The Tocqueville Alternative Strategies Fund (the “Alternative Strategies Fund”) are classified as non-diversified investment companies. The Tocqueville Fund’s investment objective is long-term capital appreciation which it seeks to achieve by investing primarily in securities of United States issuers. The Opportunity Fund’s investment objective is to achieve long-term capital appreciation which it seeks to achieve by investing in the common stocks of small and mid-cap companies which have the potential to deliver superior long term earnings growth. The International Fund’s investment objective is long-term capital appreciation consistent with preservation of capital which it seeks to achieve by investing primarily in securities of non-U.S. issuers. The Gold Fund’s investment objective is long-term capital appreciation which it seeks to achieve by investing in gold, securities of companies located throughout the world that are engaged in mining or processing gold (“gold related securities”), other precious metals and securities of companies located throughout the world that are engaged in mining or processing such other precious metals (“other precious metal securities”). The Delafield Fund’s investment objectives are to seek long-term preservation of capital (sufficient growth to outpace inflation over an extended period of time) and growth of capital which it seeks to achieve by investing primarily in the equity securities of domestic companies. The Tocqueville Select Fund’s investment objective is to achieve long-term capital appreciation by investing in a focused group of common stocks issued primarily by small and mid-sized U.S. companies. Current income is a secondary objective for The Tocqueville Select Fund. The Tocqueville Alternative Strategies Fund’s investment objective seeks higher returns and lower volatility than the Standard & Poor’s (“S&P”) 500 Index over a 3-5 year time horizon.
On June 22, 2009, the Board of Directors of Delafield Fund, Inc. approved an Agreement and Plan of Reorganization providing for, among other things, the transfer of the assets and liabilities of Delafield Fund, Inc. into The Delafield Fund, a series of The Tocqueville Trust. On September 24, 2009, the shareholders of Delafield Fund, Inc. approved the Agreement and Plan of Reorganization. On July 9, 2009, the Board of Trustees of Delafield Select Fund, a series of Natixis Funds Trust II, approved an Agreement and Plan of Reorganization providing for, among other things, the transfer of the assets and liabilities of Delafield Select Fund into the sole share class of The Select Fund (now The Tocqueville Select Fund), a series of The Tocqueville Trust. On September 24, 2009, the shareholders of Delafield Select Fund approved the Agreement and Plan of Reorganization. The effective date of both reorganizations was September 28, 2009. Transfers into The Delafield Fund and The Select Fund from their predecessor funds amounted to $649,892,191 and $25,888,388, respectively.
The Delafield Fund, a series of the Trust, commenced operations on September 28, 2009 as successor to Delafield Fund, Inc. The predecessor Delafield Fund, Inc. commenced operations on November 19, 1993.
The Tocqueville Select Fund, a series of the Trust, commenced operations on September 28, 2009 as successor to the Delafield Select Fund, a series of Natixis Funds Trust II. The predecessor Delafield Select Fund commenced operations on September 29, 2008 for Class A and Class C shares and on September 26, 2008 for Class Y shares. Prior to September 29, 2008, the predecessor Delafield Select Fund operated as a Delaware limited partnership using substantially the same investment objectives and investment policies as the predecessor fund. The limited partnership was incepted in July 1998.
On April 15, 2014, the Board of Trustees of the Bridgehampton Value Strategies Fund, a series of Investment Management Series Trust, approved an Agreement and Plan of Reorganization providing for, among other things, the transfer of the assets and liabilities of the Bridgehampton Value Strategies Fund into the sole share class of The Tocqueville Alternative Strategies Fund, a newly-created series of The Tocqueville Trust. On June 20, 2014, the shareholders of the Bridgehampton Value Strategies Fund approved the Agreement and Plan of Reorganization. The effective date of the reorganization was June 27, 2014. Transfers into the Tocqueville Alternative Strategies Fund from its predecessor fund amounted to $38,614,645.
The Tocqueville Alternative Strategies Fund, a series of the Trust, commenced operations at the close of business on June 27, 2014 as successor to the Bridgehampton Value Strategies Fund, a series of Investment Managers Series Trust. The predecessor Bridgehampton Value Strategies Fund commenced operations on June 3, 2013 for Class C shares and June 29, 2012 for Class I shares, after the conversion of a limited liability company account, Bridgehampton Multi-Strategy Fund LLC, which commenced operations October 1, 2006, into Class I shares of the Fund. From October 1, 2006 to May 7, 2010, the name of the predecessor account was Bridgehampton Arbitrage LLC.
2. SIGNIFICANT ACCOUNTING POLICIES
The following is a summary of significant accounting principles followed by the Trust in the preparation of its financial statements.
a) Security valuation and security transactions
Investments in securities, including foreign securities, traded on an exchange or quoted on the over-the-counter market are valued at the last sale price or, if no sale occurred during the day, at the mean between closing bid and asked prices, as last reported by a pricing service approved by the Trustees. Securities that are principally traded on the National Association of Securities Dealers Automated Quotation National Market (“NASDAQ”) are generally valued at the NASDAQ Official Closing Price (“NOCP”). If there is no Nasdaq Official Closing Price for a Nasdaq-listed security or sale price available for an over-the-counter security, the mean of the latest bid and asked quotations from Nasdaq will be used. Investments in gold will be valued at the spot price of gold determined based on the mean of the last bid and asked price at the close of the New York Commodity Exchange. When market quotations for securities are not readily available, or when restricted securities or other assets are being valued, such assets are valued at fair value as determined in good faith by or under procedures approved by the Trustees. Short-term securities are valued at market price. Fixed income securities are valued at market price. Debt securities, such as corporate bonds, convertible bonds and U.S. government agency issues for which market quotations are not readily available may be valued based on information supplied by independent pricing services using matrix pricing formulas and/or independent broker bid quotations.
Trading in securities on foreign securities exchanges normally is completed before the calculation of the Funds’ net asset value. Trading on these foreign exchanges may not take place on all days on which there is regular trading on the New York Stock Exchange (“NYSE”), or may take place on days on which there is no regular trading on the NYSE. Similarly, the Funds may hold securities traded in domestic markets where the market may close early on a given day prior to calculation of the Funds’ net asset value. Events affecting the value of such securities held by the Funds that occur between the close of trading in the security and the close of trading on the NYSE normally will not be reflected in the Funds’ calculation of the net asset value. However, significant events will be closely monitored, and where it is determined that an adjustment should be made to the security’s value because significant interim events may materially affect the value of the security, the security will be priced at its fair value in accordance with the procedures approved by the Trustees.
Investment and shareholder transactions are recorded on trade date. Dividend income is recognized on the ex-dividend date. Interest income is recognized on an accrual basis and includes, where applicable, the amortization of premiums and accretion of discounts. Net realized gains and losses from sales of securities are determined on the specific identification cost method.
b) Restricted and illiquid securities
The Funds may invest in securities that are subject to legal or contractual restrictions on resale or are illiquid. A security may be considered illiquid if it lacks a readily available market or if its valuation has not changed for a certain period of time. Disposal of these securities may involve time consuming negotiations and expense, and a prompt sale at the current valuation may be difficult.
c) Fair Valuation Measurements
The Trust has adopted authoritative fair valuation accounting standards which establish an authoritative definition of fair value and set out a hierarchy for measuring fair value. These standards require additional disclosures about the various inputs and valuation techniques used to develop the measurements of fair value and a discussion in changes in valuation techniques and related inputs during the period. These inputs are summarized in the three broad levels listed below.
| | Level 1 - | Quoted prices in active markets for identical securities. |
| | Level 2 - | Other significant observable inputs (including quoted prices for similar securities, interest rates, prepayment speeds, credit risk, etc.). |
| | Level 3 - | Significant unobservable inputs (including the Fund’s own assumptions in determining the fair value of investments). |
When using the market quotations or closing price provided by the pricing service for equity investments (including securities sold short), including common stocks, preferred stocks, foreign issued common stocks, exchange-traded funds, closed end mutual funds and real estate investment trusts, which are traded on an exchange are valued at the last sale price reported by the exchange on which the securities are primarily traded on the day of valuation and when the market is considered active, the security will be classified as a Level 1 security. When using the mean between the latest bid and ask price, the security will be classified as Level 2. Common stocks of the International Value Fund that are traded on non-North American exchanges may be valued using matrix pricing formulas provided by an independent pricing service. These securities will generally be classified as Level 2 securities. Gold bullion is valued at the mean of the closing bid and ask prices from the New York Mercantile Exchange and is classified as a Level 2.
Investment in mutual funds, including money market funds, are generally priced at the ending net asset value (NAV) provided by the service agent of the funds and will be classified as Level 1 securities.
Debt securities, such as corporate bonds, convertible bonds, commercial paper and U.S. government agency issues for which market quotations are not readily available may be valued based on information supplied by independent pricing services using matrix pricing formulas and/or independent broker bid quotations and are classified as Level 2. Warrants for which the underlying security is registered and equities which are subject to a required holding period, but have a comparable public issue, are valued in good faith by the adviser pursuant to procedures established under the general supervision and responsibility of the Funds’ Board of Trustees. These securities will generally be classified as Level 2 securities. Forward currency contracts derive their value from the underlying currency prices. These are valued by a pricing service using pricing models. The models use inputs that are observed from active markets, such as exchange rates. These contracts are classified as Level 2. Options can diverge from the prices of their underlying instruments. These are valued at the composite last price reported by the exchange on which the options are primarily traded on the day of the valuation and are classified as Level 1. If there is no composite last price on a given day the mean between the latest bid and ask price will be used. These contracts are classified as Level 2.
Any securities or other assets for which market quotations are not readily available are valued at fair value as determined in good faith by the Adviser pursuant to procedures established under the general supervision and responsibility of the Funds’ Board of Trustees and will be classified as Level 3 securities. In determining fair value, a Fund will seek to assign a value to the security which it believes represents the amount that the Fund could reasonably expect to receive upon its current sale. With respect to securities that are actively traded on
U.S. exchanges, the Funds expect that market quotations will generally be available and that fair value might be used only in limited circumstances, such as when trading for a security is halted during the trading day.
The Gold Fund currently invests in a private fund that primarily invests in physical gold and is subject to redemption restrictions. This private fund investment can only be disposed of with notice given 24 hours in advance of redemption. This investment is currently valued at $15,147,299 which represents 1.6% of the Gold Fund’s net assets and is classified as Level 3.
For securities traded principally on foreign exchanges, the Funds may use fair value pricing if an event occurs after the close of trading of the principal foreign exchange on which a security is traded, but before calculation of a Fund’s NAV, which a Fund believes affects the value of the security since its last market quotation. Such events may involve situations relating to a single issuer (such as news related to the issuer announced after the close of the principal foreign exchange), or situations relating to sectors of the market or the markets in general (such as significant fluctuations in the U.S. or foreign markets or significant changes in exchange rates, natural disasters, armed conflicts, or governmental actions).
In determining whether a significant event has occurred with respect to securities traded principally in foreign markets, the Funds may engage a third party fair value service provider to systematically recommend the adjustment of closing market prices of non-U.S. securities based upon changes in a designated U.S. securities market index occurring from the time of close of the relevant foreign market and the close of the NYSE. Fair value pricing may also be used to value restricted securities held by the Funds or securities with little or no trading activity for extended periods of time. Fair value pricing involves judgments that are inherently subjective and inexact and it is not possible to determine with certainty when, and to what extent, an event will affect a market price. As a result, there can be no assurance that fair value pricing will reflect actual market value and it is possible that the fair value determined for a security may differ materially from the value that could be realized upon the sale of the security.
The following is a summary of the inputs used, as of October 31, 2015, involving the Funds’ assets and liabilities carried at fair value. The inputs of methodology used for valuing securities may not be an indication of the risk associated with investing in those securities.
| | | | | | | | | | | | | | | | |
| Description | | Level 1 | | | Level 2 | | | Level 3 | | | Total | |
The Tocqueville Fund | | | | | | | | | | | | | | | | |
Assets | | | | | | | | | | | | | | | | |
Common Stocks* | | $ | 300,519,405 | | | $ | — | | | $ | — | | | $ | 300,519,405 | |
Real Estate Investment Trust (REIT)* | | | 7,332,500 | | | | — | | | | — | | | | 7,332,500 | |
Money Market Fund | | | 1,618,231 | | | | — | | | | — | | | | 1,618,231 | |
| | | | | | | | | | | | | | | | |
Total Assets | | $ | 309,470,136 | | | $ | — | | | $ | — | | | $ | 309,470,136 | |
| | | | | | | | | | | | | | | | |
| | | | | | | | | | | | | | | | |
| | | | |
| The Tocqueville Opportunity Fund | | Level 1 | | | Level 2 | | | Level 3 | | | Total | |
Assets | | | | | | | | | | | | | | | | |
Common Stocks* | | $ | 150,437,295 | | | $ | — | | | $ | — | | | $ | 150,437,295 | |
Real Estate Investment Trusts (REITs)* | | | 370,903 | | | | — | | | | — | | | | 370,903 | |
Exchange-Traded Fund (ETF)* | | | 573,920 | | | | — | | | | — | | | | 573,920 | |
Purchased Call Options | | | | | | | | | | | | | | | | |
Consumer Durables & Apparel | | | 1,152,900 | | | | 235,500 | | | | — | | | | 1,388,400 | |
Consumer Services | | | — | | | | 115,675 | | | | — | | | | 115,675 | |
Pharmaceuticals, Biotechnology & Life Sciences | | | 150,850 | | | | 130,950 | | | | — | | | | 281,800 | |
Retailing | | | 403,350 | | | | — | | | | — | | | | 403,350 | |
Software & Services | | | 866,875 | | | | — | | | | — | | | | 866,875 | |
Technology Hardware & Equipment | | | 213,125 | | | | — | | | | — | | | | 213,125 | |
Purchased Put Option* | | | — | | | | 21,500 | | | | — | | | | 21,500 | |
Money Market Fund | | | 375 | | | | — | | | | — | | | | 375 | |
| | | | | | | | | | | | | | | | |
Total Assets | | $ | 154,169,593 | | | $ | 503,625 | | | $ | — | | | $ | 154,673,218 | |
| | | | | | | | | | | | | | | | |
| | | | |
| The Tocqueville International Value Fund | | Level 1 | | | Level 2 | | | Level 3 | | | Total | |
Assets | | | | | | | | | | | | | | | | |
Common Stocks | | | | | | | | | | | | |
Australia | | $ | — | | | $ | 5,154,763 | | | $ | — | | | $ | 5,154,763 | |
Belgium | | | — | | | | 12,421,342 | | | | — | | | | 12,421,342 | |
Canada | | | 4,372,952 | | | | — | | | | — | | | | 4,372,952 | |
Cayman Islands | | | — | | | | 4,877,623 | | | | — | | | | 4,877,623 | |
Denmark | | | — | | | | 7,059,486 | | | | — | | | | 7,059,486 | |
France | | | — | | | | 53,320,704 | | | | — | | | | 53,320,704 | |
Germany | | | 6,504,365 | | | | 9,786,483 | | | | — | | | | 16,290,848 | |
Hong Kong | | | — | | | | 11,466,542 | | | | — | | | | 11,466,542 | |
Ireland | | | 4,164,345 | | | | 7,580,706 | | | | — | | | | 11,745,051 | |
Japan | | | — | | | | 62,106,679 | | | | — | | | | 62,106,679 | |
Jersey | | | — | | | | 5,607,843 | | | | — | | | | 5,607,843 | |
Netherlands | | | 3,598,400 | | | | 14,618,207 | | | | — | | | | 18,216,607 | |
Norway | | | 3,232,000 | | | | 5,953,646 | | | | — | | | | 9,185,646 | |
Singapore | | | — | | | | 3,660,512 | | | | — | | | | 3,660,512 | |
Spain | | | — | | | | 4,632,610 | | | | — | | | | 4,632,610 | |
Switzerland | | | 11,175,082 | | | | — | | | | — | | | | 11,175,082 | |
United Kingdom | | | 13,887,091 | | | | 23,237,333 | | | | — | | | | 37,124,424 | |
United States | | | 8,242,875 | | | | — | | | | — | | | | 8,242,875 | |
| | | | | | | | | | | | | | | | |
Total Common Stocks | | | 55,177,110 | | | | 231,484,479 | | | | — | | | | 286,661,589 | |
Preferred Stocks* | | | — | | | | 11,168,434 | | | | — | | | | 11,168,434 | |
Money Market Fund | | | 16,440,398 | | | | — | | | | — | | | | 16,440,398 | |
Commercial Paper | | | — | | | | 21,265,000 | | | | — | | | | 21,265,000 | |
| | | | | | | | | | | | | | | | |
Total Assets | | $ | 71,617,508 | | | $ | 263,917,913 | | | $ | — | | | $ | 335,535,421 | |
| | | | | | | | | | | | | | | | |
Liabilities | | | | | | | | | | | | |
Forward Currency Contract | | $ | — | | | $ | 48,730 | | | $ | — | | | $ | 48,730 | |
| | | | | | | | | | | | | | | | |
Total Liabilities | | $ | — | | | $ | 48,730 | | | $ | — | | | $ | 48,730 | |
| | | | | | | | | | | | | | | | |
| | | | | | | | | | | | | | | | |
| | | | |
| The Tocqueville Gold Fund | | Level 1 | | | Level 2 | | | Level 3 | | | Total | |
Assets | | | | | | | | | | | | | | | | |
Common Stocks | | | | | | | | | | | | |
Gold Related | | $ | 722,304,520 | | | $ | 1,001,485 | | | $ | 829,642 | | | $ | 724,135,647 | |
Other Precious Metals Related | | | 51,368,384 | | | | 387,834 | | | | 4,900,635 | | | | 56,656,853 | |
Other | | | 23,340 | | | | — | | | | 7,533,975 | | | | 7,557,315 | |
| | | | | | | | | | | | | | | | |
Total Common Stocks | | | 773,696,244 | | | | 1,389,319 | | | | 13,264,252 | | | | 788,349,815 | |
Private Fund* | | | — | | | | — | | | | 15,147,299 | | | | 15,147,299 | |
Gold Bullion | | | — | | | | 136,693,185 | | | | — | | | | 136,693,185 | |
Convertible Bond* | | | — | | | | — | | | | 7,500,000 | | | | 7,500,000 | |
Warrants | | | — | | | | 451,385 | | | | — | | | | 451,385 | |
Rights | | | — | | | | 56,879 | | | | — | | | | 56,879 | |
Money Market Fund | | | 6,020,587 | | | | — | | | | — | | | | 6,020,587 | |
| | | | | | | | | | | | | | | | |
Total Assets | | $ | 779,716,831 | | | $ | 138,590,768 | | | $ | 35,911,551 | | | $ | 954,219,150 | |
| | | | | | | | | | | | | | | | |
| | | | |
| The Delafield Fund | | Level 1 | | | Level 2 | | | Level 3 | | | Total | |
Assets | | | | | | | | | | | | | | | | |
Common Stocks* | | $ | 590,439,465 | | | $ | — | | | $ | — | | | $ | 590,439,465 | |
Money Market Fund | | | 33,780,005 | | | | — | | | | — | | | | 33,780,005 | |
Commercial Paper | | | — | | | | 53,063,000 | | | | — | | | | 53,063,000 | |
| | | | | | | | | | | | | | | | |
Total Assets | | $ | 624,219,470 | | | $ | 53,063,000 | | | $ | — | | | $ | 677,282,470 | |
| | | | | | | | | | | | | | | | |
| | | | |
| The Tocqueville Select Fund | | Level 1 | | | Level 2 | | | Level 3 | | | Total | |
Assets | | | | | | | | | | | | | | | | |
Common Stocks* | | $ | 75,042,634 | | | $ | — | | | $ | — | | | $ | 75,042,634 | |
Money Market Fund | | | 4,084,844 | | | | — | | | | — | | | | 4,084,844 | |
Commercial Paper | | | — | | | | 2,744,000 | | | | — | | | | 2,744,000 | |
| | | | | | | | | | | | | | | | |
Total Assets | | $ | 79,127,478 | | | $ | 2,744,000 | | | $ | — | | | $ | 81,871,478 | |
| | | | | | | | | | | | | | | | |
| | | | | | | | | | | | | | | | |
| | | | |
The Tocqueville Alternative Strategies
Fund | | Level 1 | | | Level 2 | | | Level 3 | | | Total | |
Assets | | | | | | | | | | | | | | | | |
Common Stocks* | | $ | 19,295,463 | | | $ | — | | | $ | — | | | $ | 19,295,463 | |
Convertible Bonds* | | | — | | | | 14,797,344 | | | | — | | | | 14,797,344 | |
Corporate Bonds* | | | — | | | | 5,872,848 | | | | — | | | | 5,872,848 | |
Closed-End Funds* | | | 1,041,196 | | | | — | | | | — | | | | 1,041,196 | |
Preferred Stocks | | | | | | | | | | | | |
Banks | | | 1,809,110 | | | | 898,031 | | | | — | | | | 2,707,141 | |
Consumer Finance | | | 564,000 | | | | — | | | | — | | | | 564,000 | |
| | | | | | | | | | | | | | | | |
Total Preferred Stocks | | | 2,373,110 | | | | 898,031 | | | | — | | | | 3,271,141 | |
Purchased Call Option* | | | — | | | | 34,875 | | | | — | | | | 34,875 | |
Warrants* | | | — | | | | 31,533 | | | | — | | | | 31,533 | |
Money Market Fund | | | 1,440,558 | | | | — | | | | — | | | | 1,440,558 | |
Commercial Paper | | | — | | | | 1,195,000 | | | | — | | | | 1,195,000 | |
| | | | | | | | | | | | | | | | |
Total Assets | | $ | 24,150,327 | | | $ | 22,829,631 | | | $ | — | | | $ | 46,979,958 | |
| | | | | | | | | | | | | | | | |
Liabilities | | | | | | | | | | | | |
Securities Sold Short | | | | | | | | | | | | |
Common Stocks* | | $ | 2,602,151 | | | $ | — | | | $ | — | | | $ | 2,602,151 | |
Exchange-Traded Funds* | | | 5,719,745 | | | | — | | | | — | | | | 5,719,745 | |
U.S. Treasury Notes | | | — | | | | 7,053,933 | | | | — | | | | 7,053,933 | |
| | | | | | | | | | | | | | | | |
Total Liabilities | | $ | 8,321,896 | | | $ | 7,053,933 | | | $ | — | | | $ | 15,375,829 | |
| | | | | | | | | | | | | | | | |
| * | For further information regarding portfolio characteristics, please see the accompanying Schedules of Investments. |
| ** | Other financial instruments are derivative instruments not reflected in the Schedule of Investments, such as forward currency contracts, which are reflected at the unrealized appreciation (depreciation) on the instrument. |
Below is a reconciliation that details the transfer of securities between Level 1 and Level 2 during the reporting year:
| | | | | | | | | | | | | | | | | | | | | | | | | | | | |
| | | The
Tocqueville
Fund | | | The
Tocqueville
Opportunity
Fund | | | The
Tocqueville
International
Value Fund | | | The
Tocqueville
Gold Fund | | | The
Delafield
Fund | | | The
Tocqueville
Select Fund | | | The
Tocqueville
Alternative
Strategies
Fund | |
Transfers Into Level 1 | | $ | — | | | $ | — | | | $ | — | | | $ | 959,706 | | | $ | — | | | $ | — | | | $ | — | |
Transfers Out of Level 1 | | | — | | | | — | | | | (121,268,925 | ) | | | (710,749 | ) | | | — | | | | — | | | | — | |
| | | | | | | | | | | | | | | | | | | | | | | | | | | | |
Net Transfers Into/(Out of ) Level 1 | | | — | | | | — | | | | (121,268,925 | ) | | | 248,957 | | | | — | | | | — | | | | — | |
| | | | | | | | | | | | | | | | | | | | | | | | | | | | |
Transfers Into Level 2 | | | — | | | | — | | | | 121,268,925 | | | | 710,749 | | | | — | | | | — | | | | — | |
Transfers Out of Level 2 | | | — | | | | — | | | | — | | | | (959,706 | ) | | | — | | | | — | | | | — | |
| | | | | | | | | | | | | | | | | | | | | | | | | | | | |
Net Transfers Into/(Out of ) Level 2 | | $ | — | | | $ | — | | | $ | 121,268,925 | | | $ | (248,957 | ) | | $ | — | | | $ | — | | | $ | — | |
| | | | | | | | | | | | | | | | | | | | | | | | | | | | |
Below is a reconciliation that details the activity of securities in Level 3 during the current fiscal year:
| | | | | | | | | | | | | | | | | | | | | | | | | | | | |
| | | The
Tocqueville
Fund | | | The
Tocqueville
Opportunity
Fund | | | The
Tocqueville
International
Value Fund | | | The
Tocqueville
Gold Fund | | | The
Delafield
Fund | | | The
Tocqueville
Select
Fund | | | The
Tocqueville
Alternative
Strategies
Fund | |
Beginning Balance—November 1, 2014 | | $ | — | | | $ | — | | | $ | — | | | $ | 31,803,883 | | | $ | — | | | $ | — | | | $ | — | |
Purchases | | | — | | | | — | | | | — | | | | 7,500,000 | | | | — | | | | — | | | | — | |
Sales | | | — | | | | — | | | | — | | | | — | | | | — | | | | — | | | | — | |
Realized gains | | | — | | | | — | | | | — | | | | — | | | | — | | | | — | | | | — | |
Realized losses | | | — | | | | — | | | | — | | | | — | | | | — | | | | — | | | | — | |
Change in unrealized depreciation | | | — | | | | — | | | | — | | | | (3,392,332 | ) | | | — | | | | — | | | | — | |
Transfers in/(out) of Level 3 | | | — | | | | — | | | | — | | | | — | | | | — | | | | — | | | | — | |
| | | | | | | | | | | | | | | | | | | | | | | | | | | | |
Ending Balance—October 31, 2015 | | $ | — | | | $ | — | | | $ | — | | | $ | 35,911,551 | | | $ | — | | | $ | — | | | $ | — | |
| | | | | | | | | | | | | | | | | | | | | | | | | | | | |
The movement from Level 1 to Level 2 in the International Value Fund was due to non-North American traded securities being fair valued on October 31, 2015. The movement from Level 2 to Level 1 in the Gold Fund was due to the use of market quotations or closing prices provided by the pricing service because the market was considered active. The movement from Level 1 to Level 2 in the Gold Fund was from the securities being priced using the mean of the bid and ask price due to the lack of trading volume on October 31, 2015. Transfers between levels are recognized at the end of the reporting year.
The Tocqueville Gold Fund
Significant Unobservable Inputs for Level 3 Portfolio Company Securities
| | | | | | | | | | | | |
Type of Security | | Industry | | Fair Value
at 10/31/2015 | | | Valuation
Techniques | | Unobservable Inputs | | Range |
Common Stock | | | | | | | | | | | | |
| | Gold Related | | | $ 829,642 | | | Latest company valuation | | Financing prices | | 0.39 |
| | Other Precious Metals Related | | | 4,900,635 | | | Latest company financing price | | Financing prices | | 3.00 |
| | Other | | | 7,533,975 | | | Latest company financing price | | Financing prices | | 1.38-8.60 |
Private Fund | | Gold Related | | | 15,147,299 | | | NAV from custodian discounted by adviser | | Illiquidity discount | | 2% |
Convertible Bond | | Gold Related | | | 7,500,000 | | | Latest company financing price | | Financing prices | | 1,000.00 |
The significant unobservable inputs used in the fair value measurement of the Gold Fund’s common stocks are the most recent financing prices of the portfolio company, which approximate the companies’ value in the market place. The significant unobservable inputs for the private fund is the discount for illiquidity applied to the net asset value per share determined by the private fund’s custodian.
Significant changes in the companies’ ability to receive financing for new projects in the future would be an indication of the companies’ financial position and market value. An increase in the discount applied to the value of resources, future expected cash flows, or to account for illiquidity would decrease the value of the portfolio security.
The Trust’s valuation procedures have been adopted by the Trust’s Board of Trustees, which has established a Valuation Committee to oversee the valuation process. The Valuation Committee meets on an as needed basis to evaluate changes in the valuation of portfolio securities. The full findings and valuations are then reviewed quarterly by the Independent Trustees.
d) Derivative Instruments and Hedging Activities
The Funds’ Adviser may use derivative instruments, such as options and forward currency contracts, as a means to manage exposure to different types of risk, including market risk and exchange rate risk, and to gain exposure to underlying securities. The Trust has adopted disclosure standards in order to enable the investor to understand how and why an entity used derivatives, how derivatives are accounted for, and how derivatives affect an entity’s results of operations and financial position.
In the Opportunity Fund and the Alternative Strategies Fund, the Adviser used options to gain exposure to the underlying equity security. In the International Value Fund, the Adviser used forward currency contracts to adjust exposure to foreign exchange rate risk.
Balance Sheet—Values of Derivative Instruments as of October 31, 2015.
The Tocqueville Opportunity Fund
| | | | | | | | | | | | |
| | | Asset Derivatives | | | Liability Derivatives | |
| Derivatives not accounted for as hedging instruments | | Balance Sheet
Location | | Value | | | Balance Sheet
Location | | Value | |
Purchased Options | | Investments,
at Value | | $ | 3,290,725 | | | | | $ | — | |
| | | | | | | | | | | | |
Total | | | | $ | 3,290,725 | | | | | $ | — | |
| | | | | | | | | | | | |
The Tocqueville Alternative Strategies Fund
| | | | | | | | | | | | |
| | | Asset Derivatives | | | Liability Derivatives | |
| Derivatives not accounted for as hedging instruments | | Balance Sheet
Location | | Value | | | Balance Sheet
Location | | Value | |
Purchased Options | | Investments,
at Value | | $ | 34,875 | | | | | $ | — | |
| | | | | | | | | | | | |
Total | | | | $ | 34,875 | | | | | $ | — | |
| | | | | | | | | | | | |
Offsetting on the Statement of Assets and Liabilities
For financial reporting purposes, the Fund offsets financial assets and financial liabilities that are subject to master netting arrangements or similar agreements within appreciation on forward currency contracts and depreciation on forward currency contracts on the Statement of Assets and Liabilities.
As of October 31, 2015, the gross amount of all derivative assets and liabilities were not offset for The Tocqueville Fund, Tocqueville Opportunity Fund, Tocqueville International Value Fund, Tocqueville Gold Fund, The Delafield Fund, Tocqueville Select Fund, and Tocqueville Alternative Strategies Fund and are presented gross on the Statement of Assets and Liabilities.
Tocqueville International Value Fund
| | | | | | | | | | | | |
| | | Asset Derivatives | | | Liability Derivatives | |
| | | Balance Sheet
Location | | Value | | | Balance Sheet
Location | | Value | |
Foreign Currency Forward Contract | | | | $ | — | | | Depreciation on
forward currency
contracts | | $ | (48,730 | ) |
| | | | | | | | | | | | |
Total | | | | $ | — | | | | | $ | (48,730 | ) |
| | | | | | | | | | | | |
| * | The counterparty for the contract is disclosed in the Open Forward Currency Contract detail within the Schedule of Investments. |
The Effect of Derivative Instruments on the Statement of Operations for the year ended October 31, 2015.
The Tocqueville Opportunity Fund
| | | | | | | | |
| | | Net Realized
Gain on Investments | | | Net Change in
Unrealized
Appreciation on
Investments | |
Purchased Options | | $ | 130,014 | | | $ | 1,431,495 | |
| | | | | | | | |
Total | | $ | 130,014 | | | $ | 1,431,495 | |
| | | | | | | | |
The Tocqueville Alternative Strategies Fund
| | | | | | | | |
| | | Net Realized
Gain on Investments | | | Net Change in
Unrealized
Appreciation on
Investments | |
Purchased Options | | $ | 7,851 | | | $ | 37,511 | |
| | | | | | | | |
Total | | $ | 7,851 | | | $ | 37,511 | |
| | | | | | | | |
The Tocqueville International Value Fund
| | | | | | | | |
| | | Net Realized
Gain on Forward
Currency Contracts | | | Net Change in
Unrealized
Depreciation on
Forward Currency
Contracts | |
Foreign Currency Forward Contract | | $ | 4,251,437 | | | $ | (268,663 | ) |
| | | | | | | | |
Total | | $ | 4,251,437 | | | $ | (268,663 | ) |
| | | | | | | | |
Derivatives Risk
The risks of using the types of derivatives in which the Funds may engage include the risk that movements in the value of the derivative may not fully offset or complement instruments currently held in the Funds in the manner intended by the Adviser; the risk that the counterparty to a derivative contract may fail to comply with their obligations to the Funds; the risk that the derivative may not possess a liquid secondary market at a time when the Funds would look to disengage the position; the risk that additional capital from the Funds may be called upon to fulfill the conditions of the derivative contract; and the risk that the cost of the derivative contracts may reduce the overall returns experienced by the Funds. The measurement of risks associated with these instruments is meaningful only when all related offsetting transactions are considered. The use of options and forward currency contracts do not create leverage in the Funds.
The average monthly value of call options in the Opportunity Fund during the year ended October 31, 2015 was $1,245,613.
Transactions in options in the Opportunity Fund during the year ended October 31, 2015 were as follows:
| | | | | | | | |
| | | Notional
Amount | | | Contracts | |
Outstanding, beginning of year: | | $ | 5,203,750 | | | | 685 | |
Options purchased | | | 50,092,500 | | | | 4,750 | |
Options terminated in closing transactions | | | (25,171,250 | ) | | | (2,225 | ) |
Options exercised | | | (4,112,500 | ) | | | (800 | ) |
Options expired | | | (4,495,000 | ) | | | (590 | ) |
| | | | | | | | |
Outstanding, end of year: | | $ | 21,517,500 | | | | 1,820 | |
The average monthly value of call options in the Alternative Strategies Fund during the year ended October 31, 2015 was $38,552.
Transactions in options in the Alternative Strategies Fund during the year ended October 31, 2015 were as follows:
| | | | | | | | |
| | | Notional
Amount | | | Contracts | |
Outstanding, beginning of year: | | $ | 1,780,000 | | | | 780 | |
Options purchased | | | 1,855,000 | | | | 800 | |
Options terminated in closing transactions | | | (2,242,500 | ) | | | (875 | ) |
Options exercised | | | — | | | | — | |
Options expired | | | (1,130,000 | ) | | | (630 | ) |
| | | | | | | | |
Outstanding, end of year: | | $ | 262,500 | | | | 75 | |
The average monthly notional amount of forward currency contracts during the year ended October 31, 2015 was as follows:
| | | | |
| | | International
Value Fund | |
Long Positions | | $ | — | |
Forward currency contracts | | | | |
Short Positions | | $ | 38,123,659 | |
Forward currency contracts | | | | |
e) Foreign currency translation
Investments and other assets and liabilities denominated in foreign currencies are translated to U.S. dollars at the prevailing rates of exchange, in accordance with the Trust’s Portfolio Securities Valuation and Foreign Exchange Contracts Procedures. The Tocqueville Fund, The Tocqueville Opportunity Fund, The Tocqueville International Value Fund, The Tocqueville Gold Fund, The Delafield Fund, The Tocqueville Select Fund and The Tocqueville Alternative Strategies Fund have engaged in transactions in securities denominated in foreign currencies and, as a result, entered into foreign exchange transactions. The Tocqueville International Value Fund has entered into forward contracts. These Funds are exposed to additional market risk as a result of changes in the value of the underlying currency in relation to the U.S. dollar. Risks include potential inability of counterparties to meet the terms of their obligations. The value of foreign currencies are marked-to-market on a daily basis, which reflects the changes in the market value of the contract at the close of each day’s trading, resulting in daily unrealized gains and/or losses. When the transactions are settled or the contracts are closed, the Funds recognize a realized gain or loss.
The Funds isolate that portion of the results of operations resulting from changes in foreign exchange rates on investments from the fluctuations arising from changes in market prices of securities held. Such fluctuations are reflected as net realized and unrealized gain or loss on foreign currency translation.
Reported net realized foreign exchange gains or losses arise from sales of foreign currencies, currency gains or losses realized between the trade and settlement dates on securities transactions, the differences between the amounts of dividends, interest, and foreign withholding taxes recorded on the Fund’s books, and the U.S. dollar equivalent of the amounts actually received or paid. Net unrealized foreign exchange gains and losses arise from changes in the value of assets and liabilities other than investments in securities at the end of the fiscal period, resulting from changes in the exchange rates.
f) Dividends and distributions to shareholders
Dividends to shareholders are recorded on the ex-dividend date. Dividends from net investment income are declared and paid annually by the Funds. Distributions of net realized capital gains, if any, will be declared and paid at least annually. Income and capital gain distributions are determined in accordance with income tax regulations which may differ from generally accepted accounting principles. Permanent differences between financial and tax reporting may result in reclassification to capital stock.
g) Use of estimates
The preparation of financial statements in conformity with accounting principles generally accepted in the United States of America requires management to make estimates and assumptions that affect the reported amounts of assets and liabilities and disclosure of contingent assets and liabilities at the date of the financial statements and the reported amounts of revenues and expenses during the reporting period. Actual results could differ from those estimates.
h) Indemnification
In the normal course of business the Funds enter into contracts that contain general indemnification clauses. The Funds’ maximum exposure under these arrangements is unknown, as this would involve future claims against a Fund that have not yet occurred. Based on experience, the Funds expect the risk of loss to be remote.
i) Short Sales
Short sales are transactions under which the Funds sell a security they do not own. To complete such a transaction, the Funds must borrow the security to make delivery to the buyer. The Funds then are obligated to replace the security borrowed by purchasing the security at the market price at the time of replacement. The price at such time may be more or less than the price at which the security was sold by the Funds. Until the security is replaced, the Funds are required to pay the lender amounts equal to dividend or interest that accrue during the period of the loan which is recorded as an expense on the Statements of Operations. To borrow the security, the Funds also may be required to pay a premium or an interest fee, which would decrease proceeds of the security sold. The proceeds of the short sale will be retained by the broker, to the extent necessary to meet margin requirements, until the short position is closed out. A gain, limited to the price at which the Funds sell the security short, or a loss, potentially unlimited in size, will be recognized upon the closing of a short sale. The Funds may not always be able to borrow a security or to close out a short position at a particular time or at an acceptable price. If the price of the borrowed security increases between the date of the short sale and the date on which the Funds replace the security, the Funds will experience a loss. The Funds’ loss on a short sale is limited only by the maximum attainable price of the security (which could be limitless) less the price the Funds received for the security at the time it was borrowed.
j) Subsequent events evaluation
In preparing these financial statements, the Trust has evaluated events and transactions for potential recognition or disclosure resulting from subsequent events through the date financial statements were available to be issued. This evaluation did not result in any subsequent events, other than those noted above, that necessitated disclosure and/or adjustments.
k) Recent Accounting Pronouncement
In May 2015, the Financial Accounting Standards Board (“FASB”) issued Accounting Standards Update (“ASU”) No. 2015-07 “Disclosure for Investments in Certain Entities that Calculate Net Asset Value per Share (or Its Equivalent)”. The amendments in ASU No. 2015-07 remove the requirement to categorize within the fair value hierarchy investments measured using the NAV practical expedient. The ASU also removes certain disclosure requirements for investments that qualify, but do not utilize, the NAV practical expedient. The amendments in the ASU are effective for fiscal years beginning after December 15, 2015, and interim periods within those fiscal years. Management is currently evaluating the impact these changes will have on the Fund’s financial statements and related disclosures.
3. FEDERAL INCOME TAX
There is no tax liability resulting from unrecognized tax benefits relating to uncertain income tax positions taken or expected to be taken on the tax return for the fiscal year-end October 31, 2015, or for any other tax years which are open for exam. As of October 31, 2015, open tax years include the tax years ended October 31, 2012 through 2015. The Trust is also not aware of any tax positions for which it is reasonably possible that the total amounts of unrecognized tax benefits will significantly change in the next six months. The Funds recognize interest and penalties, if any, related to unrecognized tax benefits as income tax expense in the Statement of Operations. During the period, the Funds did not incur any interest or penalties.
Provision for federal income taxes or excise taxes has not been made since the Funds have elected to be taxed as Regulated Investment Companies and intend to distribute substantially all taxable income to shareholders and otherwise comply with the provisions of the Internal Revenue Code applicable to Regulated Investment Companies. Distributions from net realized gains for book purposes may include short-term capital gains which are included as ordinary income to shareholders for tax purposes. Additionally, accounting principles generally accepted in the United States of America require that certain components of net assets relating to permanent differences be reclassified between financial and tax reporting. These reclassifications have no effect on net assets or net asset value per share. For the period ended October 31, 2015, the following table shows the reclassifications made:
| | | | | | | | | | | | |
| | | Undistributed
Net Investment
Income/(Loss) | | | Accumulated Net
Realized Loss | | | Paid In Capital | |
Tocqueville Fund | | $ | (304,677 | ) | | $ | (3,139,297 | ) | | $ | 3,443,974 | |
Opportunity Fund | | | 111,659 | | | | (661,942 | ) | | | 550,283 | |
International Value Fund | | | 3,980,967 | | | | (5,815,397 | ) | | | 1,834,430 | |
Gold Fund | | | 11,145,627 | | | | (83,959 | ) | | | (11,061,668 | ) |
Delafield Fund | | | 3,935,750 | | | | (36,558,029 | ) | | | 36,622,279 | |
Select Fund | | | 571,904 | | | | (1,092,556 | ) | | | 520,652 | |
Alternative Strategies Fund | | | 71,755 | | | | (68,089 | ) | | | (3,666 | ) |
The permanent differences primarily relate to net operating losses, foreign currency reclasses, the usage of tax equalization, Partnerships, and PFICs.
As of October 31, 2015, the components of accumulated earnings (losses) for income tax purposes were as follows:
| | | | | | | | | | | | | | | | | | | | | | | | | | | | |
| | | Tocqueville
Fund | | | Opportunity
Fund | | | International
Value Fund | | | Gold
Fund | | | Delafield Fund | | | Select Fund | | | Alternative
Strategies
Fund | |
Tax cost of Investments | | $ | 181,629,377 | | | $ | 136,403,897 | | | $ | 303,055,555 | | | $ | 1,641,235,348 | | | $ | 522,631,842 | | | $ | 74,138,563 | | | $ | 47,967,968 | |
| | | | | | | | | | | | | | | | | | | | | | | | | | | | |
Unrealized Appreciation | | | 127,952,792 | | | | 29,918,298 | | | | 48,232,356 | | | | 138,530,623 | | | | 209,481,378 | | | | 17,389,591 | | | | 4,331,810 | |
Unrealized Depreciation | | | (112,033 | ) | | | (11,648,977 | ) | | | (15,752,490 | ) | | | (825,546,821 | ) | | | (54,830,750 | ) | | | (9,656,676 | ) | | | (5,319,820 | ) |
| | | | | | | | | | | | | | | | | | | | | | | | | | | | |
Net unrealized appreciation (depreciation) | | | 127,840,759 | | | | 18,269,321 | | | | 32,479,866 | | | | (687,016,198 | ) | | | 154,650,628 | | | | 7,732,915 | | | | (988,010 | ) |
| | | | | | | | | | | | | | | | | | | | | | | | | | | | |
Undistributed operating income | | | 2,750,258 | | | | — | | | | 5,967,776 | | | | — | | | | — | | | | — | | | | 114,238 | |
Undistributed long-term gains | | | 3,072,715 | | | | — | | | | 4,247,533 | | | | — | | | | 62,260,802 | | | | 2,573,564 | | | | — | |
| | | | | | | | | | | | | | | | | | | | | | | | | | | | |
Distributable earnings | | | 5,822,973 | | | | — | | | | 10,215,309 | | | | — | | | | 62,260,802 | | | | 2,573,564 | | | | 114,238 | |
| | | | | | | | | | | | | | | | | | | | | | | | | | | | |
Other accumulated gain/(loss) | | | — | | | | (948,632 | ) | | | (124,401 | ) | | | (132,305,044 | ) | | | (1,754,121 | ) | | | (402,033 | ) | | | 1,351,756 | |
| | | | | | | | | | | | | | | | | | | | | | | | | | | | |
Total accumulated gain/(loss) | | $ | 133,663,732 | | | $ | 17,320,689 | | | $ | 42,570,774 | | | $ | (819,321,242 | ) | | $ | 215,157,309 | | | $ | 9,404,446 | | | $ | 477,984 | |
| | | | | | | | | | | | | | | | | | | | | | | | | | | | |
The difference between book-basis and tax-basis unrealized appreciation is attributable primarily to wash sale deferrals and passive foreign investment companies (PFIC’s).
The tax character of distributions paid during the periods ended October 31, 2015 and 2014 was as follows:
| | | | | | | | | | | | |
| | | October 31, 2015 | |
| | | Ordinary
Income | | | Long Term
Capital Gain | | | Total | |
Tocqueville Fund | | $ | 2,801,877 | | | $ | 13,296,075 | | | $ | 16,097,952 | |
Opportunity Fund | | | 787,557 | | | | 9,390,632 | | | | 10,178,189 | |
International Value Fund | | | 5,099,005 | | | | 8,275,518 | | | | 13,374,523 | |
Gold Fund | | | — | | | | — | | | | — | |
Delafield Fund | | | — | | | | 136,125,451 | | | | 136,125,451 | |
Select Fund | | | — | | | | 12,348,792 | | | | 12,348,792 | |
Alternative Strategies Fund | | | — | | | | 852,479 | | | | 852,479 | |
| |
| | | October 31, 2014 | |
| | | Ordinary
Income | | | Long Term
Capital Gain | | | Total | |
Tocqueville Fund | | $ | 3,425,837 | | | $ | 2,781,747 | | | $ | 6,207,584 | |
Opportunity Fund | | | — | | | | 4,131,999 | | | | 4,131,999 | |
International Value Fund | | | 4,005,675 | | | | — | | | | 4,005,675 | |
Gold Fund | | | — | | | | — | | | | — | |
Delafield Fund | | | 2,044,951 | | | | 59,796,315 | | | | 61,841,266 | |
Select Fund | | | — | | | | 9,932,816 | | | | 9,932,816 | |
The tax character of distributions paid during the seven months ended December 31, 2013 and during the period June 29, 2012 (commencement of operations) through May 31, 2013 for the predecessor fund of the Alternative Strategies Fund was as follows:
| | | | | | | | |
| | | For the Period
January 1, 2014
to October 31, 2014 | | | For the Period
June 1, 2013
to December 31, 2013 | |
Distributions paid from | | | | | | | | |
Ordinary income | | $ | 1,482,558 | | | $ | 187,454 | |
Net Long-term capital gains | | $ | 903,018 | | | $ | 482,735 | |
| | | | | | | | |
Total distributions paid | | $ | 2,385,576 | | | $ | 670,189 | |
The Fund designated as long-term capital gain dividend, pursuant to Internal Revenue Code Section 852(b)(3), the amount necessary to reduce the earnings and profits of the Funds related to net capital gain to zero for the tax years ended October 31, 2015 and 2014.
For the fiscal year ended October 31, 2015 the Opportunity Fund, Gold Fund, Delafield Fund, and Select Fund had late year losses of $948,558, $8,758,830, $1,754,121 and $402,033, respectively.
At October 31, 2015 certain Funds had tax basis capital losses which may be carried forward to offset future capital gains as shown below.
| | | | | | | | |
| | | Capital losses Expiring | |
| | | Indefinite ST | | | Indefinite LT | |
Gold Fund | | $ | 4,781,530 | | | $ | 118,742,470 | |
Alternative Strategies Fund | | | — | | | | 133,276 | |
To the extent that Funds listed above may realize future net capital gains, those gains will be offset by any of their unused respective capital loss carryforwards
4. INVESTMENT ADVISORY AND OTHER AGREEMENTS
Tocqueville Asset Management L.P. (“Tocqueville”) is the investment adviser (the “Adviser”) to the Trust under Investment Advisory Agreements approved by shareholders. For its services, Tocqueville receives fees from The Tocqueville Fund, calculated daily and payable monthly, at an annual rate of 0.75% on the first $1 billion of the average daily net assets of the Fund, and 0.65% of the average daily net assets in excess of $1 billion. Tocqueville receives fees from The Tocqueville Opportunity Fund, calculated daily and payable monthly, at an annual rate of 0.75% on the first $500 million of the average daily net assets of the Fund, and 0.65% of the average daily net assets in excess of $500 million. Tocqueville receives fees from The Tocqueville International Value Fund, calculated daily and payable monthly, at an annual rate of 1.00% on the first $1 billion of the average daily net assets of the Fund, and 0.75% of the average daily net assets in excess of $1 billion. Tocqueville receives fees from The Tocqueville Gold Fund, calculated daily and payable monthly, at an annual rate of 1.00% on the first $500 million of the average daily net assets of the Fund, 0.75% of the average daily net assets in excess of $500 million but not exceeding $1 billion, and 0.65% of the average daily net assets in excess of $1 billion. Tocqueville receives fees from The Delafield Fund, calculated daily and payable monthly, at an annual rate of 0.80% on the first $250 million of net assets of the Fund; 0.75% on the next $250 million of net assets of the Fund; 0.70% on the next $500 million of net assets of the Fund; and 0.65% on all net assets of the Fund over $1 billion. Tocqueville receives fees from The Tocqueville Select Fund, calculated daily and payable monthly, at an annual rate of 0.80% on all net assets of the Fund. Tocqueville receives fees from The Tocqueville Alternative Strategies Fund, calculated daily and payable monthly, at an annual rate of 1.25% on the first $1 billion of net assets of the Fund; and 1.00% on all net assets of the Fund over $1 billion. Prior to October 1, 2015 Tocqueville received fees from The Tocqueville Alternative Strategies Fund, calculated daily and payable monthly, at an annual rate of 1.30% on the first $500 million of net assets of the Fund; 1.25% on the next $500 million of net assets of the Fund; and 1.20% on all net assets of the Fund over $1 billion.
With respect to The Tocqueville Fund, the Adviser has contractually agreed to waive its advisory fees and/or reimburse expenses in order to ensure that The Tocqueville Fund’s total annual operating expenses do not exceed 1.25% of its average daily net assets (excluding taxes, interest expense, acquired fund fees and expenses, or extraordinary expenses such as litigation). The Expense Limitation Agreement will remain in effect until March 1, 2017. For the fiscal year ended October 31, 2015, the Adviser waived $121,858 of the advisory fee. Such amount is not subject to recoupment by the Adviser.
With respect to The Tocqueville International Value Fund, the Adviser has contractually agreed to waive its advisory fees and/or reimburse expenses in order to ensure that The Tocqueville International Value Fund’s total annual operating expenses do not exceed 1.25% of its average daily net assets (excluding taxes, interest expense, acquired fund fees and expenses, or extraordinary expenses such as litigation). The Expense Limitation Agreement will remain in effect until March 1, 2017. For the fiscal year ended October 31, 2015, the Adviser waived $859,895 of the advisory fee. Such amount is not subject to recoupment by the Adviser.
With respect to The Tocqueville Alternative Strategies Fund, the Adviser has contractually agreed to waive its advisory fees and/or reimburse expenses in order to ensure that The Tocqueville Alternative Strategies Fund’s total annual operating expenses do not exceed 1.90% of its average daily net assets (excluding taxes, dividends and interest expense on short sales, acquired fund fees and expenses, or extraordinary expenses such as litigation). The Expense Limitation Agreement will remain in effect until March 1, 2017. For the period ended October 31, 2015, the Adviser waived $51,526 of the advisory fee. Such amount is not subject to recoupment by the Advisor.
Pursuant to an Administrative Services Agreement, each Fund pays to the Adviser a fee computed and paid monthly at an annual rate of 0.15% on the first $400 million of the average daily net assets of each fund; 0.13% on the next $600 million of the average daily net assets of each fund; and 0.12% on all the average daily net assets of each fund over $1 billion. For the period ended October 31, 2015, the Adviser has made payments of $95,463, $29,728, $69,740, $295,323, $261,474, $25,063, $11,337 to U.S. Bancorp Fund Services, LLC for services provided under a Sub-Administration Agreement for The Tocqueville Fund, The Tocqueville Opportunity Fund, The Tocqueville International Value Fund, The Tocqueville Gold Fund, The Delafield Fund, The Tocqueville Select Fund and The Tocqueville Alternative Strategies Fund, respectively.
Tocqueville Securities, L.P. (the “Distributor”), an affiliate of Tocqueville, acts as distributor for shares of the Trust. Each Fund adopted a distribution and service plan pursuant to Rule 12b-1 of the 1940 Act. Pursuant to the plans, each Fund pays to the Distributor distribution and service fees of 0.25% per annum of its average daily net assets.
Commissions earned by the Distributor for services rendered as a registered broker-dealer in securities transactions for The Tocqueville Fund, The Tocqueville Opportunity Fund, The Tocqueville International Value Fund, The Tocqueville Gold Fund, The Delafield Fund, The Tocqueville Select Fund and The Tocqueville Alternative Strategies Fund for the period ended October 31, 2015, were $60,205, $36,372, $936, $150, $7,031, $22,557, $551, respectively.
5. CAPITAL SHARE TRANSACTIONS.
Transactions in capital shares for each Fund were as follows:
| | | | | | | | |
| | | For the Year
Ended
October 31, 2015 | | | For the Year
Ended
October 31, 2014 | |
| The Tocqueville Fund | | Shares | | | Shares | |
Shares sold | | | 1,103,428 | | | | 1,496,275 | |
Shares issued to holders in reinvestment dividends | | | 455,582 | | | | 185,944 | |
Shares redeemed | | | (3,295,867 | ) | | | (1,900,663 | ) |
| | | | | | | | |
Net decrease | | | (1,736,857 | ) | | | (218,444 | ) |
| | |
| The Tocqueville Opportunity Fund | | | | | | | | |
Shares sold | | | 4,986,584 | | | | 365,439 | |
Shares issued to holders in reinvestment dividends | | | 493,022 | | | | 188,786 | |
Shares redeemed | | | (1,839,479 | ) | | | (815,128 | ) |
| | | | | | | | |
Net increase (decrease) | | | 3,640,127 | | | | (260,903 | ) |
| | |
| The Tocqueville International Value Fund | | | | | | | | |
Shares sold | | | 10,658,518 | | | | 4,236,272 | |
Shares issued to holders in reinvestment dividends | | | 958,749 | | | | 272,246 | |
Shares redeemed | | | (5,103,371 | ) | | | (6,013,133 | ) |
| | | | | | | | |
Net increase (decrease) | | | 6,513,896 | | | | (1,504,615 | ) |
| | |
| The Tocqueville Gold Fund | | | | | | | | |
Shares sold | | | 12,786,647 | | | | 17,656,219 | |
Shares issued to holders in reinvestment dividends | | | — | | | | — | |
Shares redeemed | | | (13,881,041 | ) | | | (12,141,438 | ) |
| | | | | | | | |
Net increase (decrease) | | | (1,094,394 | ) | | | 5,514,781 | |
| | |
| The Delafield Fund | | | | | | | | |
Shares sold | | | 2,623,792 | | | | 5,318,910 | |
Shares issued to holders in reinvestment dividends | | | 4,059,478 | | | | 1,587,742 | |
Shares redeemed | | | (23,653,398 | ) | | | (13,763,895 | ) |
| | | | | | | | |
Net increase (decrease) | | | (16,970,128 | ) | | | (6,857,243 | ) |
| | |
| The Tocqueville Select Fund | | | | | | | | |
Shares sold | | | 639,547 | | | | 1,150,692 | |
Shares issued to holders in reinvestment dividends | | | 940,811 | | | | 684,635 | |
Shares redeemed | | | (2,055,672 | ) | | | (1,002,652 | ) |
| | | | | | | | |
Net increase (decrease) | | | (475,314 | ) | | | 832,675 | |
| | | | | | | | | | | | |
| | | For the Year
Ended
October 31, 2015 | | | For the Period
January 1, 2014 to
October 31, 2014 | | | For the Period
June 1, 2013 to
December 31, 2013 | |
The Tocqueville Alternative Strategies Fund
(See Footnote 1) | | Shares | | | Shares | | | Shares | |
Shares sold | | | 469,939 | | | | 250,099 | | | | — | |
Shares issued to holders in reinvestment dividends | | | 31,741 | | | | — | | | | — | |
Shares redeemed | | | (233,043 | ) | | | (308,999 | ) | | | — | |
Transfers in | | | | | | | | | | | — | |
From Predecessor Fund—Class I | | | — | | | | 1,458,541 | | | | — | |
From Predecessor Fund—Class M | | | — | | | | 36,498 | | | | — | |
| | | | | | | | | | | | |
Total Transfers in | | | — | | | | 1,495,039 | | | | — | |
| | | | | | | | | | | | |
Net increase | | | 268,637 | | | | 1,436,139 | | | | — | |
| | | |
Predecessor Fund—Class I
(See Footnote 1) | | | | | | | | | | | | |
Shares sold | | | — | | | | 237,764 | | | | 328,467 | |
Shares issued to holders in reinvestment of dividends | | | — | | | | — | | | | 45,690 | |
Shares redeemed | | | — | | | | (176,276 | ) | | | (313,717 | ) |
Transfers out to The Tocqueville Alternative Strategies Fund | | | — | | | | (1,458,541 | ) | | | — | |
Shares issued in connection with reorganization of a private fund | | | — | | | | — | | | | — | |
| | | | | | | | | | | | |
Net decrease | | | — | | | | (1,397,053 | ) | | | 60,440 | |
| | | |
Predecessor Fund—Class M
(See Footnote 1) | | | | | | | | | | | | |
Shares sold | | | — | | | | 3,855 | | | | 43,583 | |
Shares issued to holders in reinvestment of dividends | | | — | | | | — | | | | 2,606 | |
Shares redeemed | | | — | | | | (13,290 | ) | | | — | |
Transfers out to The Tocqueville Alternative Strategies Fund | | | — | | | | (36,754 | ) | | | — | |
| | | | | | | | | | | | |
Net decrease | | | — | | | | (46,189 | ) | | | 46,189 | |
6. FUND SHARE TRANSACTIONS
The Funds currently offer only one class of shares of beneficial interest. On June 18, 2015, the Board of Trustees of the Trust approved the elimination of the redemption fee for The Tocqueville Fund, The Tocqueville Opportunity Fund, The Tocqueville International Value Fund, The Delafield Fund, The Tocqueville Select Fund and The Tocqueville Alternative Strategies Fund effective July 1, 2015. A redemption fee of 2.00% is imposed on redemptions of shares held 90 days or fewer for The Tocqueville Gold Fund. This fee is retained by the Fund and is credited to paid in capital. Redemptions to which the fee applies include redemptions of shares resulting from an exchange made pursuant to the Exchange Privilege, as defined in the Trust’s Prospectus dated February 27, 2015. For a more detailed description of when the redemption fee does not apply, please see the Trust’s Prospectus.
7. INVESTMENT TRANSACTIONS
Purchases and sales of investment securities (excluding short-term instruments) for the period ended October 31, 2015 are summarized below.
| | | | | | | | | | | | | | | | | | | | | | | | | | | | |
| | | Tocqueville
Fund | | | Opportunity
Fund | | | International
Value Fund | | | Gold Fund | | | Delafield
Fund | | | Select
Fund | | | Alternative
Strategies
Fund | |
Purchases: | | $ | 52,904,390 | | | $ | 186,008,149 | | | $ | 171,684,920 | | | $ | 206,656,769 | | | $ | 173,435,353 | | | $ | 37,922,075 | | | $ | 37,146,726 | |
| | | | | | | | | | | | | | | | | | | | | | | | | | | | |
Sales: | | $ | 115,833,108 | | | $ | 113,584,077 | | | $ | 102,363,007 | | | $ | 122,765,213 | | | $ | 776,068,359 | | | $ | 51,218,357 | | | $ | 30,284,787 | |
| | | | | | | | | | | | | | | | | | | | | | | | | | | | |
U.S. Government Security Purchases: | | $ | — | | | $ | — | | | $ | — | | | $ | — | | | $ | — | | | $ | — | | | $ | — | |
| | | | | | | | | | | | | | | | | | | | | | | | | | | | |
U.S. Government Security Sales: | | $ | — | | | $ | — | | | $ | — | | | $ | — | | | $ | — | | | $ | — | | | $ | — | |
| | | | | | | | | | | | | | | | | | | | | | | | | | | | |
8. TRANSACTIONS WITH AFFILIATES
The following issuers are affiliated with the Funds; that is, the Adviser had control of 5% or more of the outstanding voting securities during the period from November 1, 2014 through October 31, 2015. As defined in Section (2)(a)(3) of the Investment Company Act of 1940; such issues are:
| | | | | | | | | | | | | | | | | | | | | | | | | | | | | | | | | | | | | | | | | | | | |
| | | November 1, 2014 | | | Additions | | | Reductions | | | October 31,
2015 | | | | | | | | | October 31, 2015 | |
Issuer Name | | Share
Balance | | | Cost | | | Share
Balance | | | Cost | | | Share
Balance | | | Cost | | | Share
Balance | | | Dividend
Income | | | Realized
Gain/(Loss) | | | Value | | | Cost | |
The Tocqueville Gold Fund | | | | | | | | | | | | | | | | | | | | | | | | | | | | | | | | | | | | | | | | | | | | |
Americas Silver Corp. | | | — | | | $ | — | | | | 25,688,419 | | | $ | 23,975,473 | | | | — | | | $ | — | | | | 25,688,419 | | | $ | — | | | $ | — | | | $ | 2,872,296 | | | $ | 23,975,473 | |
Americas Silver Corp. | | | — | | | | — | | | | 522,400 | | | | 984,285 | | | | — | | | | — | | | | 522,400 | | | | — | | | | — | | | | 59,927 | | | | 984,285 | |
Anthem United, Inc. | | | 5,000,000 | | | | 905,961 | | | | 3,075,000 | | | | 873,296 | | | | — | | | | — | | | | 8,075,000 | | | | — | | | | — | | | | 988,070 | | | | 1,779,257 | |
Anthem United, Inc. Warrants | | | 1,250,000 | | | | — | | | | — | | | | — | | | | — | | | | — | | | | 1,250,000 | | | | — | | | | — | | | | 27,627 | | | | — | |
Argonaut Gold, Inc. | | | 2,687,000 | | | | 12,286,127 | | | | �� | | | | — | | | | — | | | | — | | | | 2,687,000 | | | | — | | | | — | | | | 2,774,128 | | | | 12,286,127 | |
ATAC Resources Ltd. | | | 11,516,891 | | | | 39,793,482 | | | | — | | | | — | | | | — | | | | — | | | | 11,516,891 | | | | — | | | | — | | | | 3,523,062 | | | | 39,793,482 | |
ATAC Resources Ltd. Warrants(a) | | | 276,595 | | | | — | | | | — | | | | — | | | | (276,595 | ) | | | — | | | | — | | | | — | | | | — | | | | — | | | | — | |
Bear Creek Mining Corp. | | | 7,413,200 | | | | 28,761,181 | | | | — | | | | — | | | | — | | | | — | | | | 7,413,200 | | | | — | | | | — | | | | 4,025,215 | | | | 28,761,181 | |
Corvus Gold, Inc. | | | 2,079,901 | | | | 1,617,492 | | | | 1,271,000 | | | | 738,953 | | | | — | | | | — | | | | 3,350,901 | | | | — | | | | — | | | | 1,573,583 | | | | 2,356,445 | |
Corvus Gold, Inc. | | | 9,130,000 | | | | 8,120,992 | | | | 1,500,000 | | | | 1,199,904 | | | | — | | | | — | | | | 10,630,000 | | | | — | | | | — | | | | 4,877,638 | | | | 9,320,896 | |
Corvus Gold, Inc.(b) | | | — | | | | — | | | | 1,500,000 | | | | 1,199,904 | | | | (1,500,000 | ) | | | (1,199,904 | ) | | | — | | | | — | | | | — | | | | — | | | | — | |
Detour Gold Corp. | | | 5,296,600 | | | | 95,459,261 | | | | 575,000 | | | | 4,576,961 | | | | (267,400 | ) | | | (8,529,782 | ) | | | 5,604,200 | | | | — | | | | (5,444,381 | ) | | | 62,316,510 | | | | 91,506,440 | |
East Asia Minerals Corp. | | | 10,544,400 | | | | 21,793,116 | | | | 55,940,533 | | | | 502,905 | | | | — | | | | — | | | | 66,484,933 | | | | — | | | | — | | | | 508,450 | | | | 22,296,021 | |
East Asia Minerals Corp.(b) | | | — | | | | — | | | | 9,764,933 | | | | 128,126 | | | | (9,764,933 | ) | | | (128,126 | ) | | | — | | | | — | | | | — | | | | — | | | | — | |
East Asia Minerals Corp.(b) | | | — | | | | — | | | | 46,175,600 | | | | 374,778 | | | | (46,175,600 | ) | | | (374,778 | ) | | | — | | | | — | | | | — | | | | — | | | | — | |
East Asia Minerals Corp. Warrants | | | 6,500,000 | | | | — | | | | — | | | | — | | | | — | | | | — | | | | 6,500,000 | | | | — | | | | — | | | | 42,253 | | | | — | |
East Asia Minerals Corp. Warrants | | | — | | | | — | | | | 9,764,933 | | | | — | | | | — | | | | — | | | | 9,764,933 | | | | — | | | | — | | | | — | | | | — | |
East Asia Minerals Corp. Right | | | — | | | | — | | | | 46,175,600 | | | | — | | | | — | | | | — | | | | 46,175,600 | | | | — | | | | — | | | | — | | | | — | |
GoGold Resources, Inc. | | | 12,555,000 | | | | 15,654,082 | | | | 8,175,300 | | | | 10,123,442 | | | | (60,000 | ) | | | (74,000 | ) | | | 20,670,300 | | | | — | | | | (13,448 | ) | | | 19,759,770 | | | | 25,703,524 | |
Gold Bullion International LLC | | | 5,000,000 | | | | 5,000,000 | | | | — | | | | — | | | | — | | | | — | | | | 5,000,000 | | | | — | | | | — | | | | 6,893,000 | | | | 5,000,000 | |
International Tower Hill Mines Ltd. | | | 5,738,836 | | | | 20,953,121 | | | | — | | | | — | | | | — | | | | — | | | | 5,738,836 | | | | — | | | | — | | | | 1,483,489 | | | | 20,953,121 | |
International Tower Hill Mines Ltd. | | | 7,589,744 | | | | 38,630,898 | | | | 3,700,000 | | | | 1,482,514 | | | | — | | | | — | | | | 11,289,744 | | | | — | | | | — | | | | 2,849,201 | | | | 40,113,412 | |
International Tower Hill Mines Ltd.(b) | | | — | | | | — | | | | 3,700,000 | | | | 1,482,514 | | | | (3,700,000 | ) | | | (1,482,514 | ) | | | — | | | | — | | | | — | | | | — | | | | — | |
MAG Silver Corp. | | | 2,960,700 | | | | 31,563,819 | | | | — | | | | — | | | | (9,300 | ) | | | (82,270 | ) | | | 2,951,400 | | | | — | | | | (12,725 | ) | | | 21,132,024 | | | | 31,481,549 | |
Osisko Gold Royalties Ltd. | | | 2,549,540 | | | | 36,115,325 | | | | 648,000 | | | | 9,443,613 | | | | (83,400 | ) | | | (1,024,252 | ) | | | 3,114,140 | | | | 293,370 | | | | 44,141 | | | | 32,341,711 | | | | 44,534,686 | |
Osisko Gold Royalties Ltd. Warrants | | | — | | | | — | | | | 274,000 | | | | — | | | | — | | | | — | | | | 274,000 | | | | — | | | | — | | | | 379,275 | | | | — | |
Premier Gold Mines Ltd. | | | 700,000 | | | | 1,983,526 | | | | 7,157,660 | | | | 13,538,677 | | | | — | | | | — | | | | 7,857,660 | | | | — | | | | — | | | | 14,422,135 | | | | 15,522,203 | |
Primero Mining Corp. | | | 8,468,800 | | | | 50,943,246 | | | | — | | | | — | | | | (1,559,000 | ) | | | (6,440,003 | ) | | | 6,909,800 | | | | — | | | | (1,159,196 | ) | | | 15,905,857 | | | | 44,503,243 | |
Primero Mining Corp. Warrants(a) | | | 1,848,400 | | | | — | | | | — | | | | — | | | | (1,848,400 | ) | | | — | | | | — | | | | — | | | | — | | | | — | | | | — | |
Rockhaven Resources Ltd. | | | 6,400,000 | | | | 6,455,589 | | | | — | | | | — | | | | — | | | | — | | | | 6,400,000 | | | | — | | | | — | | | | 660,753 | | | | 6,455,589 | |
Rockhaven Resources Ltd. Warrants(a) | | | 700,000 | | | | — | | | | — | | | | — | | | | (700,000 | ) | | | — | | | | — | | | | — | | | | — | | | | — | | | | — | |
Rubicon Minerals Corp. | | | 11,230,000 | | | | 15,650,482 | | | | 500,000 | | | | 651,728 | | | | (455,000 | ) | | | (623,564 | ) | | | 11,275,000 | | | | — | | | | (247,206 | ) | | | 5,001,147 | | | | 15,678,646 | |
| | | | | | | | | | | | | | | | | | | | | | | | | | | | | | | | | | | | | | | | | | | | |
| | | November 1, 2014 | | | Additions | | | Reductions | | | October 31,
2015 | | | | | | | | | October 31, 2015 | |
Issuer Name | | Share
Balance | | | Cost | | | Share
Balance | | | Cost | | | Share
Balance | | | Cost | | | Share
Balance | | | Dividend
Income | | | Realized
Gain/(Loss) | | | Value | | | Cost | |
Rubicon Minerals Corp. Warrants | | | 3,064,000 | | | $ | — | | | | — | | | $ | — | | | | (3,064,000 | ) | | $ | — | | | | — | | | $ | — | | | $ | — | | | $ | — | | | $ | — | |
Scorpio Mining Corp.(a) | | | 25,668,419 | | | | 23,975,473 | | | | — | | | | — | | | | (25,668,419 | ) | | | (23,975,473 | ) | | | — | | | | — | | | | — | | | | — | | | | — | |
Scorpio Mining Corp.(a) | | | 522,400 | | | | 984,285 | | | | — | | | | — | | | | (522,400 | ) | | | (984,285 | ) | | | — | | | | — | | | | — | | | | — | | | | — | |
SEMAFO, Inc. | | | 8,814,200 | | | | 32,105,425 | | | | 1,500,000 | | | | 4,752,100 | | | | (29,000 | ) | | | (42,599 | ) | | | 10,285,200 | | | | — | | | | 25,257 | | | | 23,707,386 | | | | 36,814,926 | |
Silver Range Resources Ltd. | | | 3,450,000 | | | | — | | | | — | | | | — | | | | — | | | | — | | | | 3,450,000 | | | | — | | | | — | | | | 98,941 | | | | — | |
Strategic Metals Ltd. | | | 10,926,900 | | | | 15,810,172 | | | | — | | | | — | | | | — | | | | — | | | | 10,926,900 | | | | — | | | | — | | | | 2,423,372 | | | | 15,810,172 | |
Tocqueville Bullion Reserve LP—Class G(c) | | | 13,806 | | | | 25,000,000 | | | | — | | | | — | | | | — | | | | — | | | | 13,806 | | | | — | | | | — | | | | 15,147,299 | | | | 25,000,000 | |
Torex Gold Resources, Inc. | | | 34,685,500 | | | | 53,203,482 | | | | — | | | | — | | | | (70,000 | ) | | | (154,166 | ) | | | 34,615,500 | | | | — | | | | (91,030 | ) | | | 32,825,956 | | | | 53,049,316 | |
| | | | | | | | | | | | | | | | | | | | | | | | | | | | | | | | | | | | | | | | | | | | |
| | | | | | $ | 582,766,537 | | | | | | | $ | 76,029,173 | | | | | | | $ | (45,115,716 | ) | | | | | | $ | 293,370 | | | $ | (6,898,588 | ) | | $ | 278,620,075 | | | $ | 613,679,994 | |
The Delafield Fund | | | | | | | | | | | | | | | | | | | | | | | | | | | | | | | | | | | | | | | | | | | | |
AM Castle & Co.(a) | | | 1,200,000 | | | $ | 12,556,037 | | | | — | | | $ | — | | | | (1,200,000 | ) | | $ | (12,556,037 | ) | | | — | | | $ | — | | | $ | (7,152,096 | ) | | $ | — | | | $ | — | |
Horizon Global Corp. | | | — | | | | — | | | | 425,000 | | | | 5,335,877 | | | | — | | | | — | | | | 425,000 | | | | — | | | | — | | | | 3,735,750 | | | | 5,335,877 | |
Kemet Corp. | | | 2,600,000 | | | | 12,503,673 | | | | 250,000 | | | | 847,728 | | | | — | | | | — | | | | 2,850,000 | | | | — | | | | — | | | | 7,923,000 | | | | 13,351,401 | |
Ryerson Holding Corp. | | | 725,000 | | | | 8,236,736 | | | | 775,000 | | | | 6,592,541 | | | | (200,000 | ) | | | (2,358,577 | ) | | | 1,300,000 | | | | — | | | | (1,114,219 | ) | | | 7,605,000 | | | | 12,470,700 | |
Universal Stainless & Alloy Products, Inc.(a) | | | 400,000 | | | | 11,307,053 | | | | — | | | | — | | | | (125,000 | ) | | | (4,264,755 | ) | | | 275,000 | | | | — | | | | (2,502,670 | ) | | | 2,392,500 | | | | 7,042,298 | |
Xerium Technologies, Inc. | | | 750,000 | | | | 9,602,917 | | | | 200,000 | | | | 3,066,276 | | | | — | | | | — | | | | 950,000 | | | | — | | | | — | | | | 12,825,000 | | | | 12,669,193 | |
| | | | | | | | | | | | | | | | | | | | | | | | | | | | | | | | | | | | | | | | | | | | |
| | | | | | $ | 54,206,416 | | | | | | | $ | 15,842,422 | | | | | | | $ | (19,179,369 | ) | | | | | | $ | — | | | $ | (10,768,985 | ) | | $ | 34,481,250 | | | $ | 50,869,469 | |
The Tocqueville Select Fund | | | | | | | | | | | | | | | | | | | | | | | | | | | | | | | | | | | | | | | | | | | | |
Horizon Global Corp. | | | — | | | $ | — | | | | 353,000 | | | $ | 4,656,770 | | | | (25,000 | ) | | $ | (382,645 | ) | | | 328,000 | | | $ | — | | | $ | (155,412 | ) | | $ | 2,883,120 | | | $ | 4,274,125 | |
Summer Infant, Inc. | | | 814,933 | | | | 3,971,441 | | | | 53,000 | | | | 99,974 | | | | (193,917 | ) | | | (1,379,421 | ) | | | 674,016 | | | | — | | | | (991,295 | ) | | | 1,166,048 | | | | 2,691,994 | |
Xerium Technologies, Inc. | | | 265,000 | | | | 3,374,608 | | | | — | | | | — | | | | — | | | | — | | | | 265,000 | | | | — | | | | — | | | | 3,577,500 | | | | 3,374,608 | |
| | | | | | | | | | | | | | | | | | | | | | | | | | | | | | | | | | | | | | | | | | | | |
| | | | | | $ | 7,346,049 | | | | | | | $ | 4,756,744 | | | | | | | $ | (1,762,066 | ) | | | | | | $ | — | | | $ | (1,146,707 | ) | | $ | 7,626,668 | | | $ | 10,340,727 | |
The Tocqueville Alternative Strategies Fund | | | | | | | | | | | | | | | | | | | | | | | | | | | | | | | | | | | | | | | | | |
Inuvo, Inc. | | | 350,000 | | | $ | 588,327 | | | | — | | | $ | — | | | | — | | | $ | — | | | | 350,000 | | | $ | — | | | $ | — | | | $ | 1,004,500 | | | $ | 588,327 | |
Inuvo, Inc. Warrants | | | 31,750 | | | | — | | | | — | | | | — | | | | — | | | | — | | | | 31,750 | | | | — | | | | — | | | | 31,496 | | | | — | |
| | | | | | | | | | | | | | | | | | | | | | | | | | | | | | | | | | | | | | | | | | | | |
| | | | | | $ | 588,327 | | | | | | | $ | — | | | | | | | $ | — | | | | | | | $ | — | | | $ | — | | | $ | 1,035,996 | | | $ | 588,327 | |
| | | | | | | | | | | | | | | | | | | | | | | | | | | | | | | | | | | | | | | | | | | | |
| (a) | Security is no longer an affiliated company at October 31, 2015. |
| (b) | Private security restrictions lifted during period and combined with other non-restricted securities. |
| (c) | Tocqueville Bullion Reserve (“TBR”) is a Delaware Limited Partnership created for the purpose of owning physical gold. The General Partner of TBR is TERA Management LLC (“Tera”), a Delaware Limited Liability Company, which is equally owned and managed by Tocqueville Partners II LLC (“TP2”), a Delaware Limited Liability Company, and Eidesis Real Assets LLC (“Eidesis”), a Delaware Limited Liability Company. The Managing Member of TP2 is Robert Kleinschmidt, President of the Trust, who has a 51% participating percentage in TP2 and the sole Non-Managing Member is John Hathaway, co-portfolio manager of the Tocqueville Gold Fund, who has a 49% participating percentage. |
9. LINE OF CREDIT
The Tocqueville Trust has a $300,000,000 line of credit (the “Line”), which is uncommitted, with U.S. Bank NA. The Line is for temporary emergency or extraordinary purposes, including the meeting of redemption requests that otherwise might require the untimely disposition of securities. The Line is secured by the Trust’s assets. The Line has a one year term and is reviewed annually by the Board of Trustees. The current agreement runs through May 28, 2016. The interest rate as of October 31, 2015 was 2.75%. During the period ended October 31, 2015, the Tocqueville Fund’s maximum borrowing was $10,459,000 and average borrowing was $600,976, the Opportunity Fund’s maximum borrowing was $3,113,000 and average borrowing was $193,351 and the Gold Fund’s maximum borrowing was $9,233,000 and average borrowing was $351,526. This borrowing resulted in interest expenses of $15,990, $5,463 and $10,590, respectively. The International Value Fund, The Delafield Fund, The Select Fund and The Alternative Strategies Fund did not use the Line.
For the period ended October 31, 2015 the outstanding loan amounts for The Tocqueville Fund, The Tocqueville Opportunity Fund, The Tocqueville International Value Fund, The Tocqueville Gold Fund, The Delafield Fund, The Tocqueville Select Fund and The Tocqueville Alternative Strategies Fund were $0, $2,340,000, $0, $0, $0, $0, $0, respectively.
10. OTHER EXPENSES
Other expenses include reimbursement to the Adviser for compensation of the Trust’s Chief Compliance Officer. For the year ended October 31, 2015, reimbursement to the Adviser for compensation of the Trust’s Chief Compliance Officer from the Funds amounted to $18,214, $5,843, $13,517, $56,208, $49,255, $4,779, $2,184 for the Tocqueville Fund, Opportunity Fund, International Value Fund, Gold Fund, Delafield Fund, Select Fund and Alternative Strategies Fund, respectively.
The Tocqueville Trust
Report of Independent Registered Public Accounting Firm
To the Shareholders and Board of Trustees of
The Tocqueville Trust
We have audited the accompanying statements of assets and liabilities of The Tocqueville Trust, including The Tocqueville Fund, The Tocqueville Opportunity Fund, The Tocqueville International Value Fund, The Tocqueville Gold Fund, The Delafield Fund, The Tocqueville Select Fund, and The Tocqueville Alternative Strategies Fund (collectively, the Funds), including the schedules of investments, as of October 31, 2015, and the related statements of operations for the year then ended, changes in net assets for each of the two years in the period then ended, and the financial highlights for each of the five years then ended for The Tocqueville Fund, The Tocqueville Opportunity Fund, The Tocqueville International Value Fund, The Tocqueville Gold Fund, The Delafield Fund, and The Tocqueville Select Fund; the related statements of operations for the year then ended, changes in net assets for the year then ended and for the period January 1, 2014 through October 31, 2014, cash flows for the year ended October 31, 2015, and the financial highlights for the year ended October 31, 2015, and for the period January 1, 2014 through October 31, 2014 for the Tocqueville Alternative Strategies Fund. These financial statements and financial highlights are the responsibility of the Funds’ management. Our responsibility is to express an opinion on these financial statements and financial highlights based on our audits. The statement of changes in net assets for the period June 1, 2013 through December 31, 2013, and the financial highlights for the periods June, 1, 2013 through December 31, 2013 and June 29, 2012 (date of inception) through May 31, 2013, for The Tocqueville Alternative Strategies Fund were audited by other auditors. Those auditors expressed an unqualified opinion on this financial statement and these financial highlights in their report dated February 28, 2014.
We conducted our audits in accordance with the standards of the Public Company Accounting Oversight Board (United States). Those standards require that we plan and perform the audits to obtain reasonable assurance about whether the financial statements and financial highlights are free of material misstatement. We were not engaged to perform an audit of the Funds’ internal control over financial reporting. Our audits included consideration of internal control over financial reporting as a basis for designing audit procedures that are appropriate in the circumstances, but not for the purpose of expressing an opinion on the effectiveness of the Funds’ internal control over financial reporting. Accordingly, we express no such opinion. An audit also includes examining, on a test basis, evidence supporting the amounts and disclosures in the financial statements and financial highlights, assessing the accounting principles used and significant estimates made by management, as well as evaluating the overall financial statement presentation. Our procedures included confirmation of securities owned as of October 31, 2015, by correspondence with the custodians and brokers, or by other appropriate auditing procedures where replies from brokers were not received. We believe that our audits provide a reasonable basis for our opinion.
In our opinion, the financial statements and financial highlights referred to above present fairly, in all material respects, the financial position of each of the aforementioned Funds of The Tocqueville Trust as of October 31, 2015, and the results of their operations, the changes in their net assets, their cash flows as applicable, and financial highlights for the periods indicated above, in conformity with accounting principles generally accepted in the United States of America.
/s/ GRANT THORNTON LLP
Chicago, Illinois
December 28, 2015
ADDITIONAL INFORMATION (UNAUDITED)
1. ADDITIONAL DISCLOSURE REGARDING FUND TRUSTEES AND OFFICERS
Independent Trustees
| | | | | | | | | | | | |
Name and Age | | Position(s) Held
with the Trust | | Term of Office
and Length of Time Served (1) | | Principal Occupation(s)
During Past Five Years | | Number of Funds
in Fund Complex
Overseen By Trustee | | | Other Directorships
Held by Trustee |
| | | | | |
Charles W. Caulkins Year of Birth: 1956 | | Trustee; Member of Audit Committee; Member of Governance and Nominating Committee | | Indefinite Term, Since 2003 | | Private Investor from January 2012 – present; Partner, Chora Capital, LLC from June 2010 – December 2011; Director of Marketing, L.R. Global Partners from January 2008 – May 2010; President, Arbor Marketing, Inc. from October 1994 to December 2007. | | | 7 | | | Director, Stepping Stones from January 2012 – 2013; Director, Phoenix House from January 2001 to 2007. |
| | | | | |
Alexander Douglas Year of Birth: 1947 | | Trustee; Member of Audit Committee; Member of Governance and Nominating Committee | | Indefinite Term, Since 2010 | | Retired. Formerly, President, CEO and owner of Spaulding Law Printing, Inc. from 1992 to November 2014. | | | 7 | | | None |
| | | | | |
Charles F. Gauvin Year of Birth: 1956 | | Trustee; Member of Audit Committee; Member of Governance and Nominating Committee | | Indefinite Term, Since February 2015 | | Executive Director, Maine Audubon, from August 2014 – present; Chief Development Officer, Carnegie Endowment for International Peace, from September 2011 – May 2014; Partner, The Riparian Fund/Legacy Ranch Partners (private equity real estate fund), from February 2010 – December 2012; President and CEO, Trout Unlimited (fish and river conservation), from April 1991 – February 2010. | | | 7 | | | Director, Bioqual, Inc., July 1992 – present. |
ADDITIONAL INFORMATION (UNAUDITED)
Independent Trustees
| | | | | | | | | | | | |
Name and Age | | Position(s) Held
with the Trust | | Term of Office
and Length of Time Served (1) | | Principal Occupation(s)
During Past Five Years | | Number of Funds
in Fund Complex
Overseen By Trustee | | | Other Directorships
Held by Trustee |
| | | | | |
James W. Gerard Year of Birth: 1961 | | Trustee; Member of Audit Committee; Member of Governance and Nominating Committee | | Indefinite Term, Since 2001 | | Managing Director, Hycroft Advisors (formerly known as North Sea Partners), from January 2010 – present; Managing Director, de Visscher & Co., 2014 to present; Principal, Juniper Capital Group, LLC (formerly known as Argus Advisors International, LLC) from August 2003 to December 2009; Managing Director, The Chart Group from January 2001 to present. | | | 7 | | | President, American Overseas Memorial Day Association, 1998 to present; President, Little Baby Face Foundation, 2015 to present; Director and Treasurer ASPCA, 1998 to 2008; Trustee, Salisbury School, 2005 to present; Director, American Friends of Bleraucourt, 1992 to present. |
| | | | | |
William F. Indoe Year of Birth: 1942 | | Trustee; Member of Audit Committee; Member of Governance and Nominating Committee | | Indefinite Term, Since December 2006 | | Retired. Formerly, Sullivan & Cromwell LLP (attorneys-at-law). 1968 – 2011. | | | 7 | | | Director, Rho Capital Partners, Inc. |
| | | | | |
William J. Nolan III Year of Birth: 1947 | | Trustee; Chair of Audit Committee; Member of Governance and Nominating Committee | | Indefinite Term, Since December 2006 | | Retired. Executive Vice President & Treasurer PaineWebber, Inc. 1997 – 2001. | | | 7 | | | Trustee, Adirondack Museum, Blue Mt. Lake, NY 1996 to present (Treasurer, 2000 to 2013; Chair of the Investment Committee, 2009 – present). |
ADDITIONAL INFORMATION (UNAUDITED)
Interested Trustees2 (and Officers)
| | | | | | | | | | | | |
Name and Age | | Position(s) Held
with the Trust | | Term of Office
and Length of
Time Served (1) | | Principal Occupation(s)
During Past Five Years | | Number of Funds
in Fund Complex
Overseen By Trustee | | | Other Directorships
Held by Trustee |
| | | | | |
Helen Balk Year of Birth: 1972 | | Treasurer | | Indefinite Term, Since 2014 | | Controller/Treasurer of Tocqueville Asset Management from January 2014 to present; Manager/Staff Accountant at Pegg & Pegg LLP from August 1995 to January 2014. | | | N/A | | | N/A |
| | | | | |
Elizabeth Bosco Year of Birth: 1947 | | Anti-Money Laundering Compliance Officer | | Indefinite Term, Since 2009 | | Chief Compliance Officer of Tocqueville Securities, L.P. from January 2009 to present; Compliance Officer, Tocqueville Securities L.P. and Tocqueville Asset Management from January 1997 to January 2009. | | | N/A | | | N/A |
| | | | | |
Robert W. Kleinschmidt Year of Birth: 1949 | | President and Trustee | | Indefinite Term, Since 1991 | | President and Chief Investment Officer of Tocqueville Asset Management; Director, Tocqueville Management Corporation, the General Partner of Tocqueville Asset Management L.P. and Tocqueville Securities L.P. from January 1994 to present; and Managing Director from July 1991 to January 1994; Partner, David J. Greene & Co. from May 1978 to July 1991. | | | 7 | | | President and Director, Tocqueville Management Corporation, the General Partner of Tocqueville Asset Management L.P. and Tocqueville Securities L.P. |
| | | | | |
Cleo Kotis Year of Birth: 1975 | | Secretary | | Indefinite Term, Since 2010 | | Director of Operations, the Delafield Group of Tocqueville Asset Management L.P., 2009 to present; Vice President and Chief Operations Officer, the Delafield Fund, Inc. from 2005 – 2009; Vice President and Chief Operations Officer, Delafield Asset Management from 2005 – 2009; Vice President, Reich & Tang Asset Management, LLC from 2002 – 2009. | | | N/A | | | N/A |
ADDITIONAL INFORMATION (UNAUDITED)
Interested Trustees2 (and Officers)
| | | | | | | | | | | | |
Name and Age | | Position(s) Held
with the Trust | | Term of Office
and Length of
Time Served (1) | | Principal Occupation(s)
During Past Five Years | | Number of Funds
in Fund Complex
Overseen By Trustee | | | Other Directorships
Held by Trustee |
| | | | | |
Thomas Pandick Year of Birth: 1947 | | Chief Compliance Officer | | Indefinite Term, Since 2004 | | Chief Compliance Officer (October 2004 – present) Tocqueville Asset Management L.P. | | | N/A | | | N/A |
| | | | | |
François D. Sicart Year of Birth: 1943 | | Chairman and Trustee | | Indefinite Term, Since 1987 | | Chairman, Tocqueville Management Corporation, the General Partner of Tocqueville Asset Management L.P. and Tocqueville Securities L.P. from January 1990 to present; Chairman and Founder, Tocqueville Asset Management Corporation from December 1985 to January 1990; Vice Chairman of Tucker Anthony Management Corporation from 1981 to October 1986; Vice President (formerly general partner) among other positions with Tucker Anthony, Inc. from 1969 to January 1990. | | | 7 | | | Chairman and Director, Tocqueville Management Corporation, the General Partner of Tocqueville Asset Management L.P. and Tocqueville Securities L.P. from January 1990 to present. |
| 1 | Each Trustee will hold office for an indefinite term until the earliest of (i) the next meeting of shareholders, if any, called for the purpose of considering the election or re-election of such Trustee and until the election and qualification of his or her successor, if any, elected at such meeting, or (ii) the date a Trustee resigns or retires, or a Trustee is removed by the Board of Trustees or shareholders, in accordance with the Trust’s By-Laws, as amended, and Agreement and Declaration of Trust, as amended. Each officer will hold office for an indefinite term until the date he or she resigns or retires or until his or her successor is elected and qualifies. |
| 2 | “Interested person” of the Trust as defined in the 1940 Act. Mr. Sicart and Mr. Kleinschmidt are considered “interested persons” because of their affiliation with the Advisor. |
The Statement of Additional Information includes additional information about the Trustees and is available free of charge by calling the Funds toll free at 1-800-355-7307.
2. INVESTMENT ADVISORY AGREEMENT DISCLOSURE
In determining whether to approve the continuance of the Investment Advisory Agreement and the Administration Agreement with respect to the Tocqueville Fund, the Opportunity Fund, the International Value Fund, the Gold Fund, the Delafield Fund, the Select Fund and the Alternative Strategies Fund, the Trustees, including the Independent Trustees, considered the following information:
1) The nature, extent and quality of services provided by the Adviser.
The Trustees reviewed in detail the nature and extent of the services provided by the Adviser under the terms of the Investment Advisory Agreements and the quality of those services provided to The Tocqueville Fund, The Tocqueville Opportunity Fund, The Tocqueville International Value Fund, The Tocqueville Gold Fund, The Delafield Fund, The Tocqueville Select Fund and The Tocqueville Alternative Strategies Fund (the “Funds”) over the past year. The Trustees noted that the services under the Investment Advisory Agreements include: managing the investment and reinvestment of the Funds’ assets; supervising and managing all aspects of the Funds’ operations; and providing the Board on a regular basis with financial reports and analyses on the Funds’ operations and the operations of comparable investment companies. The Trustees also observed that the Adviser provides various administrative services to the Funds pursuant to the terms of the Administration Agreement and considered the nature, extent and quality of services provided under that agreement as well. The Trustees evaluated these factors based on their direct experience with the Adviser and in consultation with counsel. The Trustees concluded that the nature and extent of the services provided under the Investment Advisory Agreements and the Administration Agreement were reasonable and appropriate in relation to the advisory fee and administration fee, respectively, that the level of services provided by the Adviser to the Funds had not diminished over the past year and that the quality of services continues to be high. The Trustees reviewed the personnel responsible for providing advisory and administrative services to the Funds and concluded, based on their experience and interaction with the Adviser, that (i) the Adviser was able to retain quality portfolio managers and other personnel; (ii) the Adviser exhibited a high level of diligence and attention to detail in carrying out its advisory and administrative responsibilities under the Investment Advisory Agreements and Administration Agreement, respectively, for the Funds; (iii) the Adviser was responsive to requests of the Trustees; and (iv) the Adviser had kept the Trustees apprised of developments relating to the Funds and the industry in general. The Trustees also focused on the Adviser’s reputation and long-standing relationship with the Trust.
In connection with its assessment of the performance of the Adviser, the Trustees reviewed the Adviser’s financial statements and considered the Adviser’s financial condition and whether it has the resources necessary to continue to carry out its obligations under the Investment Advisory Agreements and the Administration Agreement. The Trustees concluded that the Adviser has the financial resources necessary to continue to perform its obligations under the Investment Advisory Agreements and the Administration Agreement and to continue to provide the high quality services that it has provided to the Funds to date.
2) The performance of the Funds and the Adviser.
The Trustees reviewed the investment performance of the Funds, both on an absolute basis and as compared to a peer group for each respective Fund for the one-year, three-year, five-year and ten-year periods, ended July 31, 2015. The peer groups were comprised of other funds that had similar investment objectives and sales load structures, as determined by Morningstar: The Morningstar Large Blend Funds peer group, with total net assets between $297 million and $395 million, for The Tocqueville Fund; the Morningstar Mid-Cap Growth Funds peer group, with total net assets between $143 million and $182 million, for The Tocqueville Opportunity Fund; the Morningstar Foreign Large Blend Funds peer group, with total net assets between $232 million and $359 million, for The Tocqueville International Value Fund; the Morningstar Precious Metals Funds peer group, with total net assets between $746 million and $1.7 billion, for The Tocqueville Gold Fund; the Morningstar Mid-Cap Value Funds peer group, with total net assets between $609 million and $863 million, for The Delafield Fund, the Morningstar Small Value Funds peer group, with total net assets between $67 million and $112 million, for The Tocqueville Select Fund; and the Morningstar Multialternative
Funds peer group, with total net assets between $27 million and $64 million (the “Performance Peer Groups”). The Trustees considered that the performance information for The Delafield Fund, The Tocqueville Select Fund and The Tocqueville Alternative Strategies Fund includes the performance information of their respective predecessor funds, which had different investment advisers, but the Trustees considered this information since these Funds have substantially the same portfolio management team.
The Trustees also compared each Fund’s investment performance against its benchmark market indices: the S&P 500 Index for The Tocqueville Fund; the Russell 2500 Growth Index for The Tocqueville Opportunity Fund; the Morgan Stanley EAFE Index for The Tocqueville International Value Fund; the S&P 500 Index and the Philadelphia Stock Exchange Gold & Silver Index for The Tocqueville Gold Fund; the S&P 500 Index and the Russell 2000 Index for The Delafield Fund, the Russell 2500 Index and the Russell 2000 Index for The Tocqueville Select Fund; and the S&P 500 Index and HFRX North America Index for The Tocqueville Alternative Strategies Fund (the “Indices”) for the one-year, three-year, five-year and ten-year periods ended July 31, 2015 for all the Funds (except for The Tocqueville Alternative Strategies Fund which only has one-year and three-year data). The Trustees considered the above information as helpful in their assessment of whether the Adviser was obtaining for the Funds’ shareholders the performance that was available in the marketplace given each Fund’s investment objectives, policies, strategies, limitations and restrictions. The Trustees concluded that the performance of the Funds against their respective Performance Peer Groups was satisfactory. In particular, the Trustees noted that The Tocqueville Fund had underperformed as compared to its Index for the one-year, three-year, five-year and ten-year periods, underperformed the median of its Performance Peer Group for the one-year, three-year and five-year periods and was equal to the median for the ten-year period. The Trustees noted that The Tocqueville Opportunity Fund outperformed its Index for the one-year, three-year and five-year periods and underperformed for the ten-year period and outperformed the median of its Performance Peer Group for all periods. The Trustees noted that The Tocqueville International Value Fund outperformed its Index for all periods and outperformed the median of its Performance Peer Group for all periods. The Trustees noted that The Tocqueville Gold Fund underperformed the S&P 500 Index for periods, outperformed the Philadelphia Stock Exchange Gold & Silver Index for all periods, underperformed the median of its Performance Peer Group for the one-year period and outperformed for the three-year, five-year and ten-year periods. The Trustees noted that The Delafield Fund underperformed both of its Indices for all periods and underperformed the median of its Performance Peer Group for all periods. The Trustees noted that The Tocqueville Select Fund underperformed both of its Indices for the one-year, three-year and five-year periods, outperformed both of its Indices for the ten-year period, underperformed the median of its Performance Peer Group for the one-year, three-year and five-year periods and outperformed the for the ten-year period. The Trustees noted that The Tocqueville Alternative Strategies Fund underperformed the S&P 500 Index for all periods, outperformed the HFRX North America Index for all periods, and outperformed the median of its Performance Peer Group for all periods. The Trustees questioned Mr. Kleinschmidt, in particular, about the underperformance of The Delafield Fund, The Tocqueville Select Fund and The Tocqueville Fund during certain relevant periods. He noted that these periods saw the value style of investing used by The Delafield Fund, The Tocqueville Select Fund and The Tocqueville Fund to be out of favor and trailing relevant indices. He added that he was highly confirmed that the Delafield team had a proven long-term record that would continue to serve Trust shareholders well. Finally, he noted that their underperformance in the most recent year had a significant impact on the performance of the other specified periods.
3) The cost of the advisory services and the profits to the Adviser from the relationship with the Trust.
In connection with the Trustee’s consideration of the level of the advisory fees, the Trustees considered a number of factors. The Trustees compared the level of the advisory fees for each Fund against the advisory fees charged by funds in a universe of funds: the Morningstar Large Cap Blend Funds peer group, with average net assets between $200 million and $500 million, for The Tocqueville Fund; the Morningstar Mid-Cap Growth Funds peer group, with average net assets between $100 million and $200 million, for The Tocqueville Opportunity Fund; the Morningstar Foreign Large Blend Funds peer group, with average net assets between $200 million and $400 million, for The Tocqueville International Value Fund; all funds in the Morningstar
Equity Precious Metals Funds peer group, for The Tocqueville Gold Fund; the Morningstar Mid-Cap Value Funds peer group, with average net assets between $600 million and $1 billion, for The Delafield Fund, the Morningstar Small Value Funds peer group, with average net assets between $50 million and $150 million, for The Tocqueville Select Fund; and the Morningstar Multialternative Funds peer group, with average net assets between $10 million and $100 million (the “Expense Peer Groups”). The Trustees considered comparative total fund expenses of the Funds and the Expense Peer Groups. The Trustees used this comparative fee information and total expense data as a guide to help assess the reasonableness of each Fund’s advisory fee, although they acknowledged that it was difficult to make precise comparisons with other funds since the exact nature of services provided under each Expense Peer Group fund agreement is often not apparent. The Trustees also viewed the Expense Peer Group fee information as a whole as useful in assessing whether the Adviser was providing services at a cost that was competitive with other, similar funds.
The Trustees noted that the contract rate advisory fee and administration fee for each of the Funds were reasonable, despite the contractual advisory fee rate being above average for The Tocqueville Fund, The Tocqueville International Value Fund, The Tocqueville Gold Fund and The Delafield Fund and the administration fee being above average for The Tocqueville Fund, The Tocqueville Opportunity Fund and The Tocqueville Alternative Strategies Fund, when compared to their respective Expense Peer Groups. The Trustees also considered the combined contract rate advisory and administration fee as compared to their respective Expense Peer Group. The Board further observed that the total expense ratios of the Funds were also reasonable. The Board noted that the total expense ratio for The Tocqueville Fund, The Tocqueville Opportunity Fund, The Tocqueville International Value Fund, The Delafield Fund, The Tocqueville Select Fund was above average, when compared to their respective Expense Peer Groups and that the total expense ratio for The Tocqueville Gold Fund and The Tocqueville Alternative Strategies Fund were below average, when compared to their respective Expense Peer Groups. The Board also noted that The Tocqueville Fund, The Tocqueville International Value Fund and The Tocqueville Alternative Strategies Fund each operate pursuant to an Expense Limitation Agreement whereby the Adviser has agreed to waive a portion of its fee necessary to limit the Fund’s total operating expenses to the level set forth in the Fund’s prospectus.
The Trustees also considered the profitability to the Adviser and its affiliate arising out of its relationship with the Trust. In this regard, the Trustees reviewed profitability data relating to the Adviser for the year ended October 31, 2014. The Trustees considered revenues received by the Adviser under the Investment Advisory Agreements and the Administration Agreement as well as revenues received by the Adviser’s affiliate, the Distributor, under the 12b-1 plans and Related Agreements and commissions received for effecting portfolio transactions. The Trustees also received and reviewed the Adviser’s financial statements and the Adviser provided an oral update on its profitability numbers since October 31, 2014. The Trustees concluded that the profitability of the Funds to the Adviser was not excessive.
4) The extent to which economies of scale will be realized as the Funds grow and whether fee levels reflect those economies of scale.
With respect to the Trustees’ consideration of economies of scale, the Trustees discussed with the Adviser whether economies of scale would be realized by it in its management of a Fund at higher asset levels. The Trustees also reviewed the Peer Group data to assess whether the Peer Group funds had advisory fee breakpoints and, if so, at what asset levels. The Trustees noted that all of the Funds, except for The Tocqueville Select Fund, currently have advisory fee breakpoints and that they were satisfied that the current breakpoints were appropriate when compared with each Fund’s respective Peer Group. The Trustees considered that breakpoints are not necessary at this time for The Tocqueville Select Fund, given the small size of The Tocqueville Select Fund. The Trustees also noted that the administration fee also has breakpoints. In the event there was significant asset growth in the future in a Fund, the Trustee’s determined to reassess whether the advisory fees and administration fee, including the current breakpoint structure, appropriately took into account any economies of scale that had been realized as a result of that growth.
5) Other Factors.
The Trustees also discussed the Adviser’s practices regarding the selection and compensation of brokers and dealers that execute portfolio transactions for the Funds and the brokers’ and dealers’ provision of brokerage and research services to the Adviser. The Trustees further discussed the potential benefits the Adviser derived from the Funds’ soft dollar arrangements, whereby brokers provide research to the Funds or the Adviser in return for allocating fund brokerage, and other investment data concerning soft dollars. The Board also discussed the Adviser’s use of an affiliated broker to effect portfolio transactions, noting that in addition to paying a competitive rate on commissions, the Adviser believed the Funds received better execution on trades.
Based on a consideration of all these factors in their totality, the Trustees, including all of the Independent Trustees, determined that the Funds’ advisory fees and administration fees were fair and reasonable with respect to the quality of services that the Adviser provides and in light of the other factors described above that the Trustees deemed relevant. The Trustees based their decision on evaluations of all these factors as a whole and did not consider any one factor as all-important or controlling.
3. PROXY VOTING POLICIES AND PROCEDURES
A description of the policies and procedures that The Tocqueville Trust uses to determine how to vote proxies relating to portfolio securities is available without charge upon request by calling 1-800-355-7307. Information regarding how The Tocqueville Trust voted proxies relating to portfolio securities during the most recent 12-month period ended June 30 is available by calling 1-800-355-7307 and it is also available on the SEC’s web site at http://www.sec.gov.
4. SHAREHOLDER REPORTS AND QUARTERLY PORTFOLIO DISCLOSURE
The Tocqueville Trust is required to file its complete schedule of portfolio holdings with the SEC for its first and third fiscal quarters on Form N-Q. The Trust’s Form N-Q will be available without charge, upon request on the SEC’s website (http://www.sec.gov) and may be available by calling 1-800-697-3863. You can also obtain copies of Form N-Q by (i) visiting the SEC’s Public Reference Room in Washington, DC (information on the operation of the Public Reference Room may be obtained by calling 1-202-551-8090); (ii) sending your request and a duplicating fee to the SEC’s Public Reference Room, Washington, DC 20549-1520; or (iii) sending your request electronically to publicinfosec.gov. Quarterly portfolio holdings are also available on the website of The Tocqueville Funds, www.tocqueville.com/mutual-funds.
5. SHAREHOLDER NOTIFICATION OF FEDERAL TAX STATUS
For the fiscal period ended October 31, 2015, certain dividends paid by the Funds may be subject to a maximum tax rate of 15%, as provided for by the Jobs and Growth Tax Relief Reconciliation Act of 2003. The percentage of dividends declared from ordinary income designated as qualified dividend income was as follows:
| | | | |
Tocqueville Fund | | | 100.00 | % |
Opportunity Fund | | | 0.00 | % |
International Value Fund | | | 91.80 | % |
Gold Fund | | | 0.00 | % |
Delafield Fund | | | 0.00 | % |
Select Fund | | | 0.00 | % |
Alternative Strategies Fund | | | 0.00 | % |
For corporate shareholders, the percent of ordinary income distributions qualifying for the corporate dividends received deduction for the fiscal period ended October 31, 2015 was as follows:
| | | | |
Tocqueville Fund | | | 47.28 | % |
Opportunity Fund | | | 0.00 | % |
International Value Fund | | | 5.20 | % |
Gold Fund | | | 0.00 | % |
Delafield Fund | | | 0.00 | % |
Select Fund | | | 0.00 | % |
Alternative Strategies Fund | | | 0.00 | % |
For the period ended October 31, 2015, the funds designate the following percent of ordinary distributions paid as interest-related dividends under the Internal Revenue Code Section 871(k)(1)(c):
| | | | |
Tocqueville Fund | | | 0.00 | % |
Opportunity Fund | | | 0.00 | % |
International Value Fund | | | 0.02 | % |
Gold Fund | | | 0.00 | % |
Delafield Fund | | | 0.00 | % |
Select Fund | | | 0.00 | % |
Alternative Strategies Fund | | | 0.00 | % |
The percentage of taxable ordinary income distributions that are designated as short-term capital gain distributions under Internal Revenue Section 871(k)(2)(C) for each Fund were as follows.
| | | | |
Tocqueville Fund | | | 0.00 | % |
Opportunity Fund | | | 100.00 | % |
International Value Fund | | | 0.00 | % |
Gold Fund | | | 0.00 | % |
Delafield Fund | | | 0.00 | % |
Select Fund | | | 0.00 | % |
Alternative Strategies Fund | | | 0.00 | % |
6. FOREIGN TAX CREDIT
For the year ended October 31, 2015, the Tocqueville International Value Fund earned foreign source income and paid foreign taxes which they intend to pass through to their shareholders pursuant to Section 853 of the Internal Revenue Code as follows:
| | | | | | | | |
Country | | Gross Dividend
Per Share | | | Taxes Withheld
Per Share | |
Australia | | | 0.0077 | | | | 0.0002 | |
Belgium | | | 0.0139 | | | | 0.0021 | |
Canada | | | 0.0080 | | | | 0.0012 | |
Switzerland | | | 0.0098 | | | | 0.0015 | |
Germany | | | 0.0132 | | | | 0.0014 | |
Denmark | | | 0.0051 | | | | 0.0008 | |
France | | | 0.0026 | | | | 0.0075 | |
Spain | | | 0.0497 | | | | 0.0005 | |
Hong Kong | | | 0.0431 | | | | 0.0000 | |
Ireland | | | 0.0072 | | | | 0.0000 | |
Jersey | | | 0.0004 | | | | 0.0000 | |
Japan | | | 0.0373 | | | | 0.0037 | |
South Korea | | | 0.0053 | | | | 0.0009 | |
Cayman Islands | | | 0.0108 | | | | 0.0000 | |
Luxembourg | | | 0.0024 | | | | 0.0004 | |
Netherlands | | | 0.0164 | | | | 0.0025 | |
Norway | | | 0.0220 | | | | 0.0028 | |
| | | | | | | | |
| | | 0.25466 | | | | 0.02541 | |
| | | | | | | | |
Investment Adviser
Tocqueville Asset Management L.P.
40 W. 57th St., 19th Floor
New York, NY 10019
(212) 698-0800
www.tocqueville.com
Distributor
Tocqueville Securities, L.P.
40 W. 57th St., 19th Floor
New York, NY 10019
(212) 698-0800
Shareholders’ Servicing and Transfer Agent
U.S. Bancorp Fund Services, LLC
P.O. Box 701
Milwaukee, WI 53201-0701
(800) 697-3863
Custodian
U.S. Bank, N.A.
Custody Operations
1555 River Center Drive, Suite 302
Milwaukee, WI 53212
Board of Trustees
François D. Sicart—Chairman
Charles W. Caulkins
Alexander Douglas
Charles F. Gauvin
James W. Gerard
William F. Indoe
Robert W. Kleinschmidt
William J. Nolan III
Tocqueville Funds
c/o US Bancorp Fund Services, LLC
P.O. Box 701
Milwaukee, WI 53201-0701
www.tocqueville.com/mutual-funds
TQ-ANNUAL 10/31/2015
The registrant has adopted a code of ethics that applies to the registrant’s principal executive officer and principal financial officer. The registrant has not made any substantive amendments to its code of ethics during the period covered by this report. The registrant has not granted any waivers from any provisions of the code of ethics during the period covered by this report.
A copy of the registrant’s Code of Ethics is filed herewith.
| Item 3. | Audit Committee Financial Expert. |
The registrant’s board of trustees has determined that there is at least one audit committee financial expert serving on its audit committee. James Gerard and William Nolan III are the “audit committee financial experts” and are considered to be “independent” as each term is defined in Item 3 of Form N-CSR.
| Item 4. | Principal Accountant Fees and Services. |
The registrant has engaged its principal accountant to perform audit services, audit-related services, tax services and other services during the past two fiscal years. “Audit services” refer to performing an audit of the registrant’s annual financial statements or services that are normally provided by the accountant in connection with statutory and regulatory filings or engagements for those fiscal years. “Audit-related services” refer to the assurance and related services by the principal accountant that are reasonably related to the performance of the audit. “Tax services” refer to professional services rendered by the principal accountant for tax compliance, tax advice, and tax planning. “Other services” were not provided by the principal accountant. The following table details the aggregate fees billed or expected to be billed for each of the last two fiscal years for audit fees, audit-related fees, tax fees and other fees by the principal accountant.
| | | | |
| | | FYE 10/31/2015 | | FYE 10/31/2014 |
Audit Fees | | 221,800 | | 206,000 |
Audit-Related Fees | | 0 | | 0 |
Tax Fees | | 29,000 | | 27,000 |
All Other Fees | | 0 | | 0 |
The audit committee has adopted pre-approval policies and procedures that require the audit committee to pre-approve all audit and non-audit services of the registrant, including services provided to any entity affiliated with the registrant.
The percentage of fees billed by Grant Thornton applicable to non-audit services pursuant to waiver of pre-approval requirement were as follows:
| | | | | | | | |
| | | FYE 10/31/2015 | | | FYE 10/31/2014 | |
Audit-Related Fees | | | 0 | % | | | 0 | % |
Tax Fees | | | 0 | % | | | 0 | % |
All Other Fees | | | 0 | % | | | 0 | % |
All of the principal accountant’s hours spent on auditing the registrant’s financial statements were attributed to work performed by full-time permanent employees of the principal accountant.
The following table indicates the non-audit fees billed or expected to be billed by the registrant’s accountant for services to the registrant and to the registrant’s investment adviser (and any other controlling entity, etc.—not sub-adviser) for the last two years. The audit committee of the board of trustees/directors has considered whether the provision of non-audit services that were rendered to the registrant’s investment adviser is compatible with maintaining the principal accountant’s independence and has concluded that the provision of such non-audit services by the accountant has not compromised the accountant’s independence.
| | | | |
Non-Audit Related Fees | | FYE 10/31/2015 | | FYE 10/31/2014 |
Registrant | | 0 | | 0 |
Registrant’s Investment Adviser | | 0 | | 0 |
| Item 5. | Audit Committee of Listed Registrants. |
Not applicable to registrants who are not listed issuers (as defined in Rule 10A-3 under the Securities Exchange Act of 1934).
Schedule of Investments is included as part of the report to shareholders filed under Item 1 of this Form.
| Item 7. | Disclosure of Proxy Voting Policies and Procedures for Closed-End Management Investment Companies. |
Not applicable to open-end investment companies.
| Item 8. | Portfolio Managers of Closed-End Management Investment Companies. |
Not applicable to open-end investment companies.
| Item 9. | Purchases of Equity Securities by Closed-End Management Investment Company and Affiliated Purchasers. |
Not applicable to open-end investment companies.
| Item 10. | Submission of Matters to a Vote of Security Holders. |
There have been no material changes to the procedures by which shareholders may recommend nominees to the registrant’s board of trustees.
| Item 11. | Controls and Procedures. |
| (a) | The Registrant’s President and Treasurer have reviewed the Registrant’s disclosure controls and procedures (as defined in Rule 30a-3(c) under the Investment Company Act of 1940 (the “Act”)) as of a date within 90 days of the filing of this report, as required by Rule 30a-3(b) under the Act and Rules 13a-15(b) or 15d-15(b) under the Securities Exchange Act of 1934. Based on their review, such officers have concluded that the disclosure controls and procedures are effective in ensuring that information required to be disclosed in this report is appropriately recorded, processed, summarized and reported and made known to them by others within the Registrant and by the Registrant’s service provider. |
| (b) | There were no changes in the Registrant’s internal control over financial reporting (as defined in Rule 30a-3(d) under the Act) that occurred during the second fiscal quarter of the period covered by this report that has materially affected, or is reasonably likely to materially affect, the Registrant’s internal control over financial reporting. |
| (a) | (1) Any code of ethics or amendment thereto, that is the subject of the disclosure required by Item 2, to the extent that the registrant intends to satisfy Item 2 requirements through filing an exhibit. |
Filed herewith.
(2) A separate certification for each principal executive officer and principal financial officer pursuant to Section 302 of the Sarbanes-Oxley Act of 2002. Filed herewith.
(3) Any written solicitation to purchase securities under Rule 23c-1 under the Act sent or given during the period covered by the report by or on behalf of the registrant to 10 or more persons. Not applicable to open-end investment companies.
| (b) | Certifications pursuant to Section 906 of the Sarbanes-Oxley Act of 2002. Furnished herewith. |
SIGNATURES
Pursuant to the requirements of the Securities Exchange Act of 1934 and the Investment Company Act of 1940, the registrant has duly caused this report to be signed on its behalf by the undersigned, thereunto duly authorized.
|
| (Registrant) The Tocqueville Trust |
|
| By (Signature and Title)* /s/ Robert W. Kleinschmidt |
| Robert W. Kleinschmidt, President |
|
| Date 12-22-2015 |
Pursuant to the requirements of the Securities Exchange Act of 1934 and the Investment Company Act of 1940, this report has been signed below by the following persons on behalf of the registrant and in the capacities and on the dates indicated.
|
| By (Signature and Title)* /s/ Robert W. Kleinschmidt |
| Robert W. Kleinschmidt, President |
|
| Date 12-22-2015 |
|
| By (Signature and Title)* /s/ Helen Balk |
| Helen Balk, Treasurer |
|
| Date 12-22-2015 |
| * | Print the name and title of each signing officer under his or her signature. |