UNITED STATES
SECURITIES AND EXCHANGE COMMISSION
Washington, D.C. 20549
FORM N-CSR
CERTIFIED SHAREHOLDER REPORT OF REGISTERED
MANAGEMENT INVESTMENT COMPANIES
Investment Company Act file number 811-04840
The Tocqueville Trust
(Exact name of registrant as specified in charter)
The Tocqueville Trust
40 W. 57th St., 19th Floor
New York, NY 10019
(Address of principal executive offices) (Zip code)
Robert W. Kleinschmidt
The Tocqueville Trust
40 W. 57th St., 19th Floor
New York, NY 10019
(Name and address of agent for service)
(212) 698-0800
Registrant’s telephone number, including area code
Date of fiscal year end: October 31, 2017
Date of reporting period: October 31, 2017
| Item 1. | Reports to Stockholders. |

The Tocqueville Trust
Mutual Funds
Annual Report
October 31, 2017
The Tocqueville Fund
The Tocqueville Opportunity Fund
The Tocqueville International Value Fund
The Tocqueville Gold Fund
The Delafield Fund
The Tocqueville Select Fund

This report is not authorized for distribution to prospective investors unless preceded or accompanied by a currently effective prospectus of The Tocqueville Trust. Please call 1-800-697-FUND (3863) for a free prospectus. Read it carefully before you invest.
You are invited to visit our website @ www.tocquevillefunds.com
Chairman’s Letter
Dear Fellow Shareholder,
The fiscal year ending October 31, 2017, included the extraordinary U.S. presidential election and the most unusual first ten months of the Trump Administration. If at the beginning of the fiscal year someone was able to predict the election results and the political chaos that was to unfold both in the U.S. and internationally over the next twelve months, they almost certainly would have been extremely bearish on the markets. But markets surprised and disappointed any such predications. Rather than collapsing, equity markets worldwide embarked on a long rally that continues to this day.
What is going on here?
The rally demonstrates, at least in part, the key role played by animal spirits. Not much has changed on the legislative front to date, and while regulatory change has been broad, there has been but little time to see the consequences of a more pro-growth regulatory environment. What has changed, along with steadily increasing corporate earnings, is the perception that the long regulatory and rhetorical war on business has come to a halt and that taxes, having risen to confiscatory levels, will be rolled back. While this perception is hardly an endorsement of the Trump Administration (far from it, based upon recent polls) it is, perhaps, an indication of the relief felt by the investment community at the passing of the previous administration, and the long period of exceptionally slow economic growth that accompanied it.
A return to historic post-war growth levels could support a long rally in the markets, notwithstanding a litany of worries worldwide. It was a previous President, John F. Kennedy, someone no one would confuse with the current occupant of the White House, who first said, “A rising tide lifts all boats.” The country and most of the worldwide economy had been in an ebb tide of sorts ever since the financial crisis, in part due to the hangover from that crisis and in part due to misguided economic policy. A return to normal is not an unrealistic hope.
Aside from animal spirits, however, it all comes down to earnings and how they are valued, with interest rates playing a determinant role. Interest rates, perhaps more than ever before, are key because the level of sovereign debt has never been higher, and the cost of servicing that debt at higher interest rates would be crippling to most of the major economies. Fortunately, rates remain low and inflationary expectations which strongly influence rates remain benign. As long as that remains the case, we believe the equity markets will be a rewarding place to invest.
Sincerely,

Robert W. Kleinschmidt
Chairman
The Tocqueville Fund
Dear Fellow Shareholder,
For the 12 months ended October 31, 2017, the Tocqueville Fund gained 20.88%, only modestly underperforming the Russell 3000 at 23.98% over the same period, and the S&P 500 at 23.63%. The S&P’s results were inflated by the so-called FANG stocks (Facebook, Amazon, Netflix and Google), as well as by tech titans Apple and Microsoft. Combined, these seven names contributed more than half of the S&P’s returns over the period. Fortunately, the Fund owns many of these equities, having purchased them at far lower prices, when they had been temporarily out of favor (as hard to believe as that is), but, having trimmed these positions as prices appreciated. As a result, our weighting in these names is far below that of the S&P 500. The FANG stocks are not the only story, however. For the seventh straight year, growth stocks have generally far outpaced value stocks. For example, the Russell 1000 Growth Index gained 29.71% over the twelve-month period, compared with 17.78% for the Russel 1000 Value Index. Our investment orientation is value driven, so we are pleased to have generated such strong absolute returns in a market so comparatively difficult for our investment style.
While all sectors of the market generated positive returns for the Fund, Information Technology was by far the strongest. Financials were also a significant contributor to the overall market, as interest rates generally started to rise and investors hope that the Fed will slowly continue to increase them. The Technology names performed generally in line with the applicable benchmarks. Applied Materials was the strongest performer for the second year in a row, and we also had meaningful contributions from Microsoft and Amazon. Outside of Technology, the Fund had strong contributions from Boeing, which is benefitting from a long commercial and defense aerospace cycle, as well as Ionis Pharmaceuticals, which continued to show success with its anti-sense drug discovery platform and rebounded from particularly negative sentiment for the biotechnology sector last year.
The weakest sector in the overall market was Energy, and the sector, as well as the stocks we hold in the sector, was a net drag on overall performance. The two main detractors related to Energy were Schlumberger and Noble Energy, as both companies are exposed to deep water drilling projects and have generally not participated in the shale led production recovery. However, for the year, GE was the single biggest drag on overall Fund performance, which has considerable energy exposure, and also faces potential secular challenges with its turbine based power business. GE also struggled with operational performance, particularly cash flow conversion, and is embarking on a major restructuring. The sector with the biggest factor in relative performance was the Financials sector, where the Fund was underweight, which we generally tend to be for structural and transparency reasons, not to mention risk considerations. Other names that reduced the Fund’s returns included QUALCOMM, which has been embroiled in licensing disputes
with major customers (but has recently been the recipient of an unsolicited takeover offer) and Pitney Bowes, which has been struggling to offset its legacy business with new revenue streams.
We initiated or added to a variety of positions throughout the year during periods of market uncertainty or when opportunities presented themselves. Positions were sold or reduced when valuation objectives were met, better ideas arose, circumstances changed that impacted our investment thesis or in response to needs for investor liquidity. Portfolio turnover for the period was 9.8% which is consistent with our long-term approach.
We purchased Brighthouse Financial, the annuity business that was spun-off from Metlife. Brighthouse is poised to benefit from a rising interest rate environment, if it ever comes, and in the meantime, we believe is trading at an attractive discount to book value, while generating cash returns in the low double digits.
We also purchased Fannie Mae 8.25% Series S Preferred shares. Fannie Mae, a government sponsored enterprise (GSE), is a critical player in the mortgage finance market and was in essence nationalized during the financial crisis. We believe that the Fannie Mae 8.25% Series S Preferred shares are out of favor due to the complexity of the legal situation and requirement for a successful outcome both in the courts and in raising private capital. Our view is that reforming the GSEs is a legislative priority of the Trump Administration and the Fannie Preferred shares are a potential beneficiary of such reform, as we believe they may be structurally entitled to reinstatement of their dividend and repayment of prior accruals.
Another purchase was Synchrony Financial, a provider of private label credit cards that was previously spun off from GE Capital. The shares had become out of favor as expectations for rising interest rates had been momentarily tempered, concerns that consumer credit quality may have peaked and that retail, which is a large customer and marketing partner, has been weak. Our view is that the company was overcapitalized, that consumer credit and spending will either improve as wages move up, or at least not deteriorate and the shares were trading below our assessment of intrinsic value given its return profile.
We also purchased Potash, the Canadian fertilizer producer, whose shares had been depressed due to declines in corn prices and weakened farm economy that has had knock-on effects on fertilizer pricing. Our assessment showed the shares were trading at a significant discount to what we considered intrinsic value based on mid-cycle free cash flow. However, our interest in the company was based on its pending merger with Agrium, where, in our opinion, substantial operating synergies may be achieved. We were also attracted to the company because of the support for its solid dividend, stability in diversification into retail distribution and nitrogen, as well as the company’s ability to monetize some large minority interests. Moreover, the fertilizer industry has consolidated recently, thus improving its prospects for returns through the cycle, and with the price of fertilizer at or below marginal cost of production for much of the industry, we believe the potential for upside is there.
JD.com is another recent purchase. JD is the second largest ecommerce business in China. While it is not a traditional value stock, our analysis showed that it was being valued in the market at similar levels to what Amazon was when we successfully purchased it several years ago, at a similar moment of temporary fears about competition and profitability. While there is no guarantee that JD will turn out as successfully as our investment in Amazon, we believe the growth runway for its business is significant and when we analyzed what its cash flows might look like as a mature business (as we did for Amazon several years ago) we concluded that it was trading at significant discount to intrinsic value. Our thesis was also supported by the fact that Wal-Mart is a significant shareholder and that JD generally owns all of its own distribution assets, giving it a competitive advantage.
During the period, we purchased or added to positions in Abbott Labs, Alcoa, Arconic, Bank of America, Diebold Nixdorf, Goldcorp, Kansas City Southern, Macy’s, Palo Alto Networks, Pitney Bowes, Schlumberger, Signature Bank, Snap-On Inc., US Concrete and Williams Sonoma.
Most sales or reductions were conducted to provide liquidity to investors or to make room for other ideas. Of the sales related to fundamental changes, Macy’s stands out as probably being one where the situation deteriorated much more quickly than we anticipated. Other sales and reductions included Aflac, Alcoa, Alkermes, Alphabet, Amazon, Apple, Applied Materials, Automated Data Processing, Bank of New York, Bioverativ, H&R Block, Boeing, Delta, Diebold, DowDupont, Exxon Mobil, GE, Intel, Ionis, Johnson & Johnson, Macys, Merck, Microsoft, Nextera Energy, Noble Energy, Pitney Bowes, QUALCOMM, Signature Bank, Snap On, Sonoco Products, Weyerhaeuser, Xerox and XL Group.
With equity markets at or near all-time highs, our efforts as disciplined contrarian value investors tend to be focused on idiosyncratic opportunities where individual companies fall out of favor for one reason or another or are otherwise misunderstood, rather than finding wholesale sectors of the market that might be depressed. The potential for growth enhancing legislative success, the generally synchronized global economic expansion, low rates by historical standards and still accommodative monetary policy globally (notwithstanding what tightening might come with a new Fed Chairperson) provide a still attractive backdrop for preferring equity investments over other financial alternatives.
Sincerely,
| | |
| |  |
| |
| Robert W. Kleinschmidt | | Peter D. Shawn |
| Portfolio Manager | | Director of Research |
The Tocqueville Fund
(Unaudited)
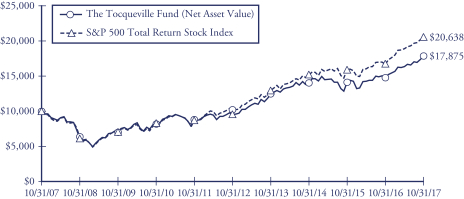
This chart assumes an initial gross investment of $10,000 made on 10/31/07. Returns shown do not reflect the deduction of taxes that a shareholder would pay on fund distributions or the redemption of fund shares. Performance reflects fee waivers in effect. In the absence of fee waivers, total return would be reduced. Returns shown include the reinvestment of all dividends and other distributions. Past performance is not predictive of future performance. Investment return and principal value will fluctuate so that your shares, when redeemed, may be worth more or less than their original cost.
The Standard & Poor’s 500 Total Return Stock Index (S&P 500) is a capital-weighted index, representing the aggregate market value of the common equity of 500 stocks primarily traded on the New York Stock Exchange. Returns assume the reinvestment of all dividends.
AVERAGE ANNUAL RATE OF RETURN (%)
FOR YEARS ENDED OCTOBER 31, 2017
| | | | | | | | | | | | | | | | |
| | | 1 Year | | | 3 Year | | | 5 Year | | | 10 Year | |
The Tocqueville Fund | | | 20.88% | | | | 8.32% | | | | 13.22% | | | | 5.98% | |
Standard & Poor’s 500 Total Return Stock Index | | | 23.63% | | | | 10.77% | | | | 15.18% | | | | 7.51% | |
The Tocqueville Opportunity Fund
Dear Fellow Shareholder,
We are pleased to provide this investment overview for the 2017 fiscal year for the Tocqueville Opportunity Fund. During the year ended October 31, 2017, the Fund appreciated 36.47% and outperformed the SMID cap growth benchmark, the Russell 2500 Growth Index, which gained 30.07%. Investors in the Fund will recall that the prior fiscal year was a particularly challenging year during which SMID cap growth issues were faced with steady outflows of capital as markets were characterized by massive swings in sentiment driven by a multitude of risk concerns: Chinese currency devaluation, U.S. dollar strength, EU bank defaults, oil price collapse, negative interest rates, and Brexit. The Healthcare and Technology sectors, two of the three principal growth sectors were each twice hammered: Healthcare issues suffered under pervasive threats of drug price regulation by candidates Clinton and Trump; Technology issues suffered under candidate Trump’s threat of regulation of everything Silicon Valley—work visas, taxes, and business models; and each was hard hit in the significant January-February 2016 market correction. As the new fiscal year began in November 2016, we had hoped that with the election settled the turmoil was over—although the Fund swung positive with its exposures to financial and industrial participants in the Trump rally, software investments weighed heavily on performance under the President elect’s continued belligerent and haranguing attitude towards Technology companies.
Over the twelve-month fiscal period, Healthcare and Technology sector investments provided the leading contributions to the Fund’s total return and accounted for nearly four-fifths of the absolute increase. Surprisingly, on a relative basis, Healthcare investments drove more than one-half of outperformance versus the benchmark while the Consumer Discretionary sector provided the second best relative performance—due to a significantly underweighted position in this sector, which has been under severe pressure all year long as new models of competition undermine and disrupt existing company models. Technology investments, while lagging Discretionary issues in relative performance, ranked third; the Fund held a minimal position over the time period in Staples which enabled outperformance as well.
But the perspective over the calendar year (excluding November-December 2016) is altogether different! Since the beginning of the 2017 calendar year, the Fund gained appreciably through the fiscal year end with an increase of 33.40% versus 20.16% for the SMID cap growth benchmark. Investments in Technology led the Fund’s performance on both an absolute and relative basis over the past ten months—while fundamentals had been supportive and excellent throughout 2016 and the first two months of the fiscal year, a meeting hosted by the new Administration soon after the Inauguration with Silicon Valley technology leaders to make peace may have marked the bottom of an excessively long period of unduly negative sentiment which had weighed on the sector for at least a year! Technology investments have provided nearly one half of the Fund’s
absolute gain in 2017 and greater than 40% of the relative gain through the October 2017 month end. Over the entire twelve-month fiscal period, Energy sector investments were the only ones to negatively contribute to the Fund’s otherwise positive or flat sector returns (all sectors included) but with an impact limited to -0.46%. Early in the fiscal period, we had increased commitments to certain U.S. based production and service based energy companies in an effort to participate in a cyclical upswing in oil prices. At the close of the fiscal period, the Fund held no investments in Energy, Consumer Staples, Telecommunications, or Utilities.
Over the past twelve months, three of the Fund’s investments more than tripled in price: Kite Pharmaceuticals, NVIDIA Corporation and Alnylam Pharmaceuticals. Kite, a developer of cancer immunotherapies with a focus on T cell approaches, demonstrated strong data in DLBCL and was taken over by Gilead Sciences. NVIDIA has continued to lead the technology industry in both gaming platform GPU processing chips and its processors are the leading chips in many new technologies, including: HPC (High Performance Computing), AI, (Artificial Intelligence), Big Data analysis, ML (Machine Learning), and ADAS (Autonomous Driving platforms).
Alnylam is a biotechnology company which has pioneered technologies based on RNA interference addressed against genetically defined diseases. In addition to the triples, the Fund had 11 doubles—some of the heavier weighted contributors included: bluebird bio, Inc., Clovis Oncology, and Shopify, Inc. Including the triples and doubles, the Fund had 46 names which gained 50% or more, including two additional takeovers—ZELTIQ Aesthetics (Allergan) and Mobileye (Intel). NVIDIA was the leading contributor to the Fund’s absolute and relative performance; as the period ended, NVIDIA was the largest position. Seven of the Top 10 contributors to overall performance were Healthcare issues and three were Technology issues (Shopify and ServiceNow). Investments in Dexcom and Acacia Communications were most detrimental to the Fund over the fiscal period, albeit together they combined for a loss of 0.84%. On a relative basis, TESARO, Inc was the Fund’s most detrimental investment—the issue declined only 4.48% during the period but at a significant weight, TESARO dragged relative performance down by nearly a full percentage point.
At the close of the fiscal period, investments in Technology comprised the Fund’s largest commitments and had increased by nearly one-fifth over the prior 12 months—due to appreciation, increased investments, and a positive outlook for the industry. The only other sector with increased commitment was the Materials sector. Healthcare sector allocation was relatively unchanged. Investments in Industrials, Consumer Staples and Discretionary, Financials, and Energy had all been reduced. The Top 10, Top 25, and Top 50 positions comprised 35%, 60%, and 77% respectively of the Fund’s holdings at fiscal year-end; the Top 100 positions comprised 94% of the Fund’s holdings. A year ago, the Top 10/25/50/100 positions comprised 26%, 46%, 69%, and 90% respectively of the Fund. One year ago we wrote that the selloff in Healthcare investments that had commenced in the summer of 2015, when one of the candidates had invoked the threat of price controls, had only one precedent—in the early 1990’s that same candidate had made the same threats—we argued that the attempt would fall apart under the weight of
market based competition and due process of law—it did then and the threat has evaporated again. Over the past year, Healthcare investments provided strong returns to the Fund, but we would emphasize that the successes have been driven by innovation not by politics. We dare not venture into discussions of new paradigms for fear of angering the heavens, but we are keenly aware that many of the corners of technology where we have been investing for years seem to be steadily growing, if not accelerating in influence and in critical performance—this includes mobile communications platforms, autonomous driving, language processing, inference, SAAS and cloud computing, and the realms of machine learning and big data analysis. Concepts that may have seemed remote only recently, are driving significant change today.
We remain confident that the Fund’s investments are well placed in competitively advantaged companies, led by smart, visionary managements. If there is a lesson to be reiterated, it is that selling competitively advantaged companies in industries undergoing rapid change and expansion and adoption of new models just because market sentiment shifts is a huge mistake. We have continued throughout to pursue a steady and unchanged approach to identify strategic market leaders as investors, not traders succumbing to rapid, if not weekly, shifts in market sentiment. As always, we appreciate your continued confidence in our efforts on behalf of the Fund and its shareholders.
Sincerely,

Thomas R. Vandeventer
Portfolio Manager
The Tocqueville Opportunity Fund
(Unaudited)
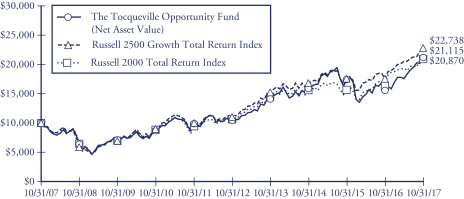
This chart assumes an initial gross investment of $10,000 made on 10/31/07. Returns shown do not reflect the deduction of taxes that a shareholder would pay on fund distributions or the redemption of fund shares. Returns shown include the reinvestment of all dividends and other distributions. Past performance is not predictive of future performance. Investment return and principal value will fluctuate so that your shares, when redeemed, may be worth more or less than their original cost.
The chart and table reflect The Opportunity Fund’s performance achieved prior to the changes effected in 2010 to its investment strategy.
The Russell 2500 Growth Total Return Index is an unmanaged index that measures the performance of the small to mid-cap growth segment of the U.S. equity universe. It includes those Russell 2500 companies with higher price-to-book ratios and higher forecasted growth values. Returns assume the reinvestment of all dividends
The Russell 2000 Total Return Index is an unmanaged index that measures the performance of the 2,000 smallest companies in the Russell 3000 Index. Returns include the reinvestment of all dividends.
AVERAGE ANNUAL RATE OF RETURN (%)
FOR YEARS ENDED OCTOBER 31, 2017
| | | | | | | | | | | | | | | | |
| | | 1 Year | | | 3 Year | | | 5 Year | | | 10 Year | |
The Tocqueville Opportunity Fund | | | 36.47% | | | | 9.99% | | | | 15.13% | | | | 7.76% | |
Russell 2500 Growth Total Return Index | | | 30.07% | | | | 10.66% | | | | 15.50% | | | | 8.56% | |
Russell 2000 Total Return Index | | | 27.85% | | | | 10.12% | | | | 14.49% | | | | 7.63% | |
The Tocqueville International Value Fund
Dear Fellow Shareholder,
For the fiscal year ended October 31, 2017, the Tocqueville International Value Fund’s total U.S. dollar return was 23.67%. In the same period, the Morgan Stanley EAFE Index Net, the index against which we are most often compared, had a net total U.S. dollar return of 23.44%. For the 15-year period ended October 31, 2017, the Fund’s total U.S. dollar return was 10.93% per annum. In the same period, the Morgan Stanley EAFE Index Net had a net total U.S. dollar return of 7.99% per annum.
Global equity markets generally rallied during the year, as positive economic and earnings data globally, combined with still low inflation and interest rates, trumped geopolitical tensions in Asia and policy gridlock in the U.S. Early on, economic indicators in most developed economies and in China gave credence to the notion of a synchronized global expansion. A positive election result in France helped investor sentiment by allaying fears regarding the future of the Eurozone. With growth accelerating outside the U.S. and policy reform efforts in the U.S. falling short of high expectations, most currencies increased in value against the U.S. dollar, though the Yen weakened from overbought levels. Industrial metals generally increased in price, as did oil to a lesser extent. Globally, long interest rates remained at low levels, credit spreads remained tight and volatility low. Among industry groups, home furnishings, machinery, industrial products, construction, transport, chemicals, software and certain financials performed well, while food retail, tobacco, energy, media and utilities were weak.
During the fiscal year period, the Fund benefited from stock selection in the consumer staples, health care, industrials, information technology and real estate areas. This was offset in part by a low exposure to financials, which had a strong year, as well as stock selection in the consumer and financials areas. The Fund had meaningful contributions from Samsung Electronics, software and service provider Sopra Steria Group, industrial conglomerate Hitachi, compact equipment maker Wacker Neuson, analog chipmaker Infineon Technologies, inspection services concern Applus Services and logistics and media conglomerate Bollore. Notable detractors were oil service concern Schlumberger, real estate broker Countrywide, advertising agency Publicis Groupe and Goldcorp. Results benefited from corporate activity in several of the Fund’s stocks. Specialty chemical producer Akzo Nobel received a takeover offer from PPG Industries, consumer goods company Unilever received a takeover offer from Kraft Heinz, aeronautical equipment maker Zodiac received a takeover offer from Safran, business services concern Spotless Group received a takeover offer from Downer EDI, real estate enterprise Global Logistics effectively put itself up for sale in response to pressure from shareholders, free to air TV Broadcasts offered to repurchase 27.4% of its shares at a roughly 30% premium to the market price, packaging producer Greatview Aseptic received a large investment from Jardine Strategic, and software concern Aveva Group received a takeover offer from Schneider electric.
During the year, we exited positions in Spotless Group, TV Broadcasts, Greatview Aseptic, mining concern Rio Tinto, U.K. drugmaker GlaxoSmithKline, industrial products distributor Rexel, branded food products company Orkla, defense contractor Cobham, and fuel distributor Superior Plus, as their respective share prices approached our estimates of intrinsic value. We sold Goldcorp when operational disappointments led us to reassess our estimates of intrinsic value.
We purchased shares of mobile and fixed data service provider Telefonica Brasil, which is down due to political turbulence in Brazil and related currency weakness. The company has low financial leverage, a high single digit free cash flow yield, margin improvement potential, and operates in a region characterized by improving competitive dynamics and moderating capital expenditure requirements. We believe shares should appreciate as free cash flow expands. We took a new position in diversified mining company BHP Billiton, which following several years of rationalizing assets, costs and capital expenditures, is poised to generate substantial amounts of free cash flow at prevailing commodity prices. We purchased shares of UBS, a leading global wealth management franchise which trades a reasonable multiple of current cash flow, has excess capital that should be returned to shareholders, and whose earnings will derive a meaningful benefit from any increase in interest rates in the U.S. and elsewhere. We established a new position in U.K. building materials distributor Travis Perkins, a well-managed and well-capitalized business with strong market positions and returns on capital, which trades at a discount to intrinsic value due to concerns about the construction volumes post-Brexit.
We purchased a new position in data network equipment supplier Ericsson, which is down in price as losses in the media division and cyclical weakness in the equipment business have obscured investor perceptions of the company’s long-term prospects. We believe Ericsson has a strong technological position in a consolidated equipment market and a bloated cost structure, and trades at a modest multiple of its potential mid-cycle cash flow. A strong new CEO with a large equity stake is highly incentivized to realize the intrinsic value of the enterprise. We purchased a new position in British American Tobacco (BAT), when the shares declined in response to proposed new FDA regulations. BAT is well-positioned in new smokeless technologies and has a strong franchise in growing emerging markets and trades at an attractive multiple of free cash flow.
We established a new position in French inspection services provider Bureau Veritas, a well-managed, cash generative business whose shares are depressed and trading at an attractive valuation level due to cyclical weakness in its energy and marine end markets. Another new position is Japanese in vitro diagnostic and clinical lab testing concern Miraca, also a cash generative business with a strong competitive position. Shares are down along with short-term earnings prospects, as new management makes investments in future growth that we judge will increase the long-term value of the franchise. During the year, we added to positions in Bayer, Fanuc, Royal Dutch Shell, Siemens, Publicis, Schlumberger, Applus Servces and Bollore, among others.
Overall, there was a marginal decrease in our exposure to Japan, Asia and Rest of World and an increase in our exposure to Latin America and Europe, including the U.K. We began the period with approximately 9% in cash reserves and finished the period with roughly 9%.
Equity markets are enjoying a combination of healthy economic growth, low inflation, still loose monetary policy, still low interest rates, expectations of increased fiscal spending and, in the U.S., lower taxes. This is an unusually positive confluence of factors for equities. The combination of growth and low inflation underpins valuation multiples that are high on a historical basis. We therefore remain vigilant regarding any pickup in inflation and a corresponding increase in interest rates. There are plenty more reasons for caution, including political turmoil in the U.S. and U.K administrations, the reemergence of populist politics in Europe, volatile relations with North Korea and Iran, among others. That said, absent a geopolitical shock, we believe the global economic expansion is likely to continue for some time, particularly outside the U.S., where there is also a meaningful opportunity to improve corporate profitability. Furthermore, sentiment toward stocks is generally not effusive. In this mixed context, we remain focused on individual company fundamentals and valuations.
The Fund’s investment objective remains long-term capital appreciation consistent with preservation of capital. To protect and grow your capital, we continue to seek out compelling long-term investment opportunities in companies that have defensible business franchises, are out of favor or misunderstood, and trade at a substantial discount to intrinsic value.
Sincerely,
James Hunt
Portfolio Manager
The Tocqueville International Value Fund
(Unaudited)
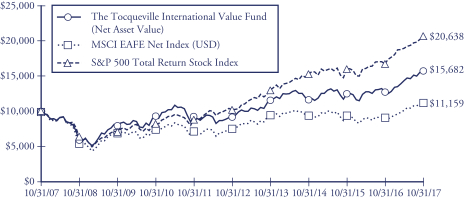
This chart assumes an initial gross investment of $10,000 made on 10/31/07. Returns shown do not reflect the deduction of taxes that a shareholder would pay on fund distributions or the redemption of fund shares. Performance reflects fee waivers in effect. In the absence of fee waivers, total return would be reduced. Returns shown include the reinvestment of all dividends and other distributions. Past performance is not predictive of future performance. Investment return and principal value will fluctuate so that your shares, when redeemed, may be worth more or less than their original cost.
The MSCI EAFE Net Index is an unmanaged market-capitalization-weighted index composed of companies representative of the market structure of 21 Developed Market Countries in Europe, Australia, Asia and the Far East.
The Standard & Poor’s 500 Total Return Stock Index (S&P 500) is a capital-weighted index, representing the aggregate market value of the common equity of 500 stocks primarily traded on the New York Stock Exchange. Returns include the reinvestment of all dividends.
AVERAGE ANNUAL RATE OF RETURN (%)
FOR YEARS ENDED OCTOBER 31, 2017
| | | | | | | | | | | | | | | | |
| | | 1 Year | | | 3 Year | | | 5 Year | | | 10 Year | |
The Tocqueville International Value Fund | | | 23.67% | | | | 10.57% | | | | 11.54% | | | | 4.60% | |
MSCI EAFE Net Index | | | 23.44% | | | | 6.08% | | | | 8.53% | | | | 1.10% | |
Standard & Poor’s 500 Total Return Stock Index | | | 23.63% | | | | 10.77% | | | | 15.18% | | | | 7.51% | |
The Tocqueville Gold Fund
Dear Fellow Shareholder,
During the period from November 2016 through October 2017, gold markets traded in a broad range. The Tocqueville Gold Fund was down 9.36% during the period, while the Philadelphia Gold and Silver index (including dividends) was down 6.08%, and while the price of gold was down 0.5%.
The precious metals sector has taken a breather this year after last year’s strong performance. In our view, the major headwind preventing broader investment interest has been the continuing strength of global equity markets. In our opinion, the most likely catalyst for renewed interest in gold would be a serious market correction. While we can suggest many reasons why a setback to strong financial asset valuations might occur, timing is another matter and more elusive.
In summary, our investment rationale for precious metals exposure is based on the core idea that the ongoing debasement of paper currencies imperils not only high financial asset valuations but the fundamentals of the real economy on which those values are predicated. In our view, this is an inescapable reality, which the financial markets, for now have chosen to ignore. Our more immediate focus for the Fund is to invest in mining companies that advance per share value through exploration, mine development, production, and corporate M&A. Value created in this manner is not dependent on rising gold and silver prices, but in our view is sure to be recognized when the long overdue (in our opinion) resumption of broader interest in gold awakens.
The largest position in the Fund is physical gold, at 119,680 ounces. It makes up about 13% of the Fund’s asset value. The gold is not traded but rather is vaulted outside the financial system in a secure Brink’s facility, which we regularly monitor and audit. Holding physical gold has reduced the volatility of the overall Fund and did so this past year. Additionally, it gives shareholders direct exposure to gold that the Fund owns.
Other than the position in physical gold, the Fund’s holdings are in precious metal mining equities, in which it seeks exposure across various aspects of the value creation spectrum within the precious metals mining sector. Through exposure to the different stages of mining activity, the Fund is able to diversify risk and capture the value inherent in discovery, development and production. As of October 31, 2017, the Fund’s equity exposure was in the following categories: senior producers (31%), mid-tier producers/advanced developers (22%), small producers/developers (31%), and early developers/exploration (16%).
Over the past year, the precious metal mining stocks that contributed to Fund performance included Ivanhoe Mines Ltd., Franco-Nevada Corporation, Royal Gold Inc., Premier Gold Mines Ltd. and Osisko Gold Royalties Ltd. Ivanhoe Mines Ltd. and Premier Gold Mines Ltd. have successfully expanded and improved on their resource
through exploration and project advancement. Royalty companies, such as Franco-Nevada Corporation, Royal Gold Inc. and Osisko Gold Royalties Ltd. continue to see their revenues and profits expand from the various investments in mining projects they have made in recent years.
Detour Gold Corporation, Jaguar Mining Inc., Semafo Inc., Torex Gold Resources and Mag Silver Corp. declined during the period, as those stocks corrected from much stronger performance during the previous reporting period. With the exception of Mag Silver, which is in the development stage, the other companies experienced some type of production disruption or delay due to mining activity, which we expect to be resolved over the next year.
During the reporting period, we established new positions in Iamgold Corporation, Barkerville Gold Mines Ltd., Independence Group, Northern Star Resources Ltd., Contango ORE Inc., Kinross Gold Corporation and Wellgreen Platinum Ltd. The common theme among the new additions was resource discovery and development each is undertaking, which we expect to result in positive revaluation.
Positions that were eliminated because they were either fully valued or presented limited value creation opportunities unassociated with the moves in the precious metal markets included AngloGold Ashanti Ltd., Hochschild Mining, Gold Road Resources, JDL Gold, Rubicon Minerals Corp., Silver Range Resources Ltd., Tahoe Resources Inc., Klondex Mines Ltd., Plata Latina Minerals Corp. and Eldorado Gold Corporation. The Richmont Mines Inc. position was sold after it was announced that the company would be acquired by Alamos Gold Inc.
Sincerely,
| | | | |
 | |  | |  |
| John C. Hathaway | | Douglas B. Groh | | Ryan McIntyre |
| Portfolio Manager | | Portfolio Manager | | Portfolio Manager |
The Tocqueville Gold Fund
(Unaudited)
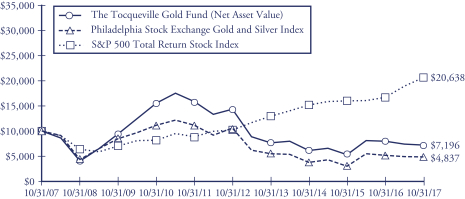
This chart assumes an initial gross investment of $10,000 made on 10/31/07. Returns shown do not reflect the deduction of taxes that a shareholder would pay on fund distributions or the redemption of fund shares. Returns shown include the reinvestment of all dividends and other distributions. Past performance is not predictive of future performance. Investment return and principal value will fluctuate so that your shares, when redeemed, may be worth more or less than their original cost. The Fund imposes a 2% redemption fee on shares held 90 days or less.
In 2009, 2010, and 2016 the performance of The Tocqueville Gold Fund was achieved during a period of unusually favorable market conditions. Such performance may not be sustainable.
The Philadelphia Stock Exchange Gold and Silver Index is an unmanaged capitalization-weighted index which includes the leading companies involved in the mining of gold and silver. Returns include the reinvestment of all dividends.
The Standard & Poor’s 500 Total Return Stock Index (S&P 500) is a capital-weighted index, representing the aggregate market value of the common equity of 500 stocks primarily traded on the New York Stock Exchange. Returns include the reinvestment of all dividends.
AVERAGE ANNUAL RATE OF RETURN (%)
FOR YEARS ENDED OCTOBER 31, 2017
| | | | | | | | | | | | | | | | |
| | | 1 Year | | | 3 Year | | | 5 Year | | | 10 Year | |
The Tocqueville Gold Fund | | | -9.36% | | | | 5.47% | | | | -12.87% | | | | -3.24% | |
Philadelphia Stock Exchange Gold and Silver Index | | | -6.08% | | | | 8.59% | | | | -14.47% | | | | -6.99% | |
Standard & Poor’s 500 Total Return Stock Index | | | 23.63% | | | | 10.77% | | | | 15.18% | | | | 7.51% | |
The Delafield Fund
Dear Fellow Shareholder,
For the fiscal year ended October 31, 2017, the Delafield Fund’s net asset value increased 19.01% versus an increase of 27.85% for the Russell 2000 Index (“Russell 2000”) and an increase of 23.63% for the Standard & Poor’s 500 Index (“S&P 500”), each on a total return basis. Owing to the smaller average market capitalization of companies in the Russell 2000, we view it as the more appropriately comparative index to the Fund. The Fund’s net asset value as of October 31, 2017, was $26.40 per share. The net asset value amounted to $373,353,042 of which 71.9% was invested in equities, and the balance in cash and equivalents.
There was little market volatility for nearly the entire fiscal year. The Russell 2000 posted gains in ten out of twelve months, while the S&P 500 did not experience a single losing month for the entire fiscal year. Early in the fiscal year, markets rallied on the heels of the Trump victory in November and held those gains to close out Calendar 2016, despite a mid-December increase in interest rates. Stocks continued to rise through the second fiscal quarter, with solid consumer confidence and improving employment data buoying investor conviction and more than offsetting market disappointment when the Trump administration failed in its initial attempt at repeal and replacement of the Affordable Care Act. The second half of the fiscal year was marked with the continuation of favorable domestic economic statistics, including labor force participation, consumer confidence and manufacturing data, for example, but also, a series of external events that in the past, may have managed to derail market momentum. These included the surprise firing of the then FBI Director James Comey in May, escalations in the verbal tensions between the U.S. and North Korea through the summer, a terrorist attack in Barcelona in August, devastation from Hurricane Harvey late in the summer, and a ballistic missile launch by the North Koreans also in late summer. And yet, seemingly ever-optimistic investors seized on dovish Fed commentary, generally favorable corporate results, modestly positive global economic data and the release of President Trump’s tax reform framework and continued to drive U.S. equity markets overall and small cap stocks in particular, to gains in both the third and fourth fiscal quarters.
While we trailed the indices, we believe that our fiscal year performance was satisfactory given our large reserves. In a world that from our perspective is fraught with uncertainties, we continued to hold substantially larger than normal reserves, which accounted for nearly 90% of our underperformance relative to the Russell 2000.
For the fiscal year, the top contributors included TrueBlue Inc., Harco Corporation, Korn Ferry, and US Concrete Inc. TrueBlue, Korn Ferry and US Concrete Inc. all benefited from satisfactory earnings expectations and from investors’ more optimistic outlook for organic growth prospects under the Trump administration. Harsco shares responded favorably to profits that exceeded expectations as well as successive increases in company issued earnings guidance.
In contrast, Team Inc. and Sequential Brands Group Inc., were the largest detractors to the performance, with both companies disappointing the market with weaker than expected earnings results more than once during the fiscal year.
We added a number of new positions to the portfolio during the fiscal year, the largest of which included Acacia Communications Inc, Avnet Inc., Fabrinet, and Hanesbrands Inc. In contrast, the largest portfolio deletions included Calgon Carbon Corporation, which was acquired by a competitor, Dover Corporation, Electro Scientific Industries Inc., and Honeywell International Inc.
From a macro perspective, we continue to be cautiously optimistic, with domestic economic data continuing to show modest signs of improvement. Further, should the recent efforts to modify the tax code, especially potential changes to the corporate tax rate and repatriation of profit rules, succeed; we would expect a meaningful benefit to corporations, and specifically, to a number of our industrial holdings which have substantial cash trapped overseas. However, as is our nature, we are not counting on exogenous factors such as these and will continue to search for compelling investment opportunities utilizing our fundamental and bottom up process with which to generate outsize returns over time.
Sincerely,
| | |
 | |  |
| J. Dennis Delafield | | Vincent Sellecchia |
| Portfolio Manager | | Portfolio Manager |
| | |
 | |  |
| Joshua Kaufthal | | James Maxwell |
| Portfolio Manager | | Portfolio Manager |
The Delafield Fund
(Unaudited)

This chart assumes an initial gross investment of $10,000 made on 10/31/07. Since the Delafield Fund did not commence operations until 9/28/09, returns prior to that date are those of the Predecessor Fund. The Delafield Fund assumed the net asset value and performance history of the Predecessor Fund (See Footnote 1 to the Financial Statements). Returns shown do not reflect the deduction of taxes that a shareholder would pay on fund distributions or the redemption of fund shares. Performance reflects fee waivers in effect. In the absence of fee waivers, total return would be reduced. Returns shown include the reinvestment of all dividends and other distributions. Past performance is not predictive of future performance. Investment return and principal value will fluctuate so that your shares, when redeemed, may be worth more or less than their original cost.
The Russell 2000 Total Return Index is an unmanaged index that measures the performance of the 2,000 smallest companies in the Russell 3000 Index, which represent approximately 10% of the total market capitalization of the Russell 3000 Index. Returns include the reinvestment of all dividends.
The Standard & Poor’s 500 Total Return Stock Index (S&P 500) is a capital-weighted index, representing the aggregate market value of the common equity of 500 stocks primarily traded on the New York Stock Exchange. Returns include the reinvestment of all dividends.
AVERAGE ANNUAL RATE OF RETURN (%)
FOR YEARS ENDED OCTOBER 31, 2017
| | | | | | | | | | | | | | | | |
| | | 1 Year | | | 3 Year | | | 5 Year | | | 10 Year | |
The Delafield Fund | | | 19.01% | | | | 2.54% | | | | 7.66% | | | | 5.62% | |
Russell 2000 Total Return Index | | | 27.85% | | | | 10.12% | | | | 14.49% | | | | 7.63% | |
Standard & Poor’s 500 Total Return Stock Index | | | 23.63% | | | | 10.77% | | | | 15.18% | | | | 7.51% | |
The Tocqueville Select Fund
Dear Fellow Shareholder,
For the fiscal year ended October 31, 2017 the Tocqueville Select Fund’s net asset value increased 8.93% verses increases of 24.68% for the Russell 2500 Index (“Russell 2500”) and 27.85% for the Russell 2000 Index (“Russell 2000”), each on a total return basis. The Fund’s net asset value as of October 31, 2017 was $11.87 per share. The net asset value amounted to $49,452,528 of which 93.5% was invested in equities, and the balance in cash and equivalents.
The Russell 2500 posted gains in nine out of twelve months this fiscal year and overall market volatility was unusually low. Early in the fiscal year, markets rallied on the heels of the Trump victory in November and held those gains to close out Calendar 2016, despite a mid-December increase in interest rates. Stocks continued to rise through the second fiscal quarter, with solid consumer confidence and improving employment data buoying investor conviction and more than offsetting market disappointment when the Trump administration failed in its initial attempt at repeal and replacement of the Affordable Care Act. The second half of the fiscal year was marked with the continuation of favorable domestic economic statistics, including labor force participation, consumer confidence and manufacturing data, for example, but also, a series of external events that in the past, may have managed to derail market momentum. These included the surprise firing of the then FBI Director James Comey in May, escalations in the verbal tensions between the U.S. and North Korea through the summer, a terrorist attack in Barcelona in August, devastation from Hurricane Harvey late in the summer, and a ballistic missile launch by the North Koreans also in late summer. And yet, seemingly ever-optimistic investors seized on dovish Fed commentary, generally favorable corporate results, modestly positive global economic data and the release of President Trump’s tax reform framework and continued to drive U.S. equity markets overall and small cap stocks in particular, to gains in both the third and fourth fiscal quarters.
Our performance this past fiscal year was unsatisfactory, with stock selection being the primary issue. Owing to the concentrated nature of the Fund, individual miscues can be rather meaningful to its aggregate performance, and this fiscal year, the Fund suffered particularly meaningful declines in five of its holdings. Three of these, namely Team Inc., Horizon Global Corporation and Xerium Technologies Inc. experienced what we believe were mostly temporary miscues and remain in the portfolio. Of the other two, Ascena Retail Group Inc. was sold out of the Fund, while Real Industry Inc. remained under review at fiscal year-end. In total, these five names detracted from our relative performance by in excess of ten percentage points during the fiscal year. Additionally, our cash reserves also impacted our relative performance by almost 200 basis points.
In contrast, for the fiscal year, our top contributors included Harsco Corporation and TrueBlue Inc. Harsco shares responded favorably to profits that exceeded expectations as well as successive increases in company issued earnings guidance. TrueBlue Inc. benefited from satisfactory earnings results and from investors’ more optimistic outlook for organic growth prospects under the Trump administration.
We added a number of new positions to the portfolio during the fiscal year, the largest of which included G-III Apparel Group, Ltd. and TTM Technologies Inc. In contrast, the largest portfolio deletions included Consol Energy Inc., Carlisle Companies Inc., and Ralph Lauren Corporation.
From a macro perspective, we continue to be cautiously optimistic, with domestic economic data continuing to show modest signs of improvement. Further, should the recent efforts to modify the tax code, especially potential changes to the corporate tax rate and repatriation of profit rules succeed, we would expect a meaningful benefit to corporations. However, as is our nature, we are not counting on exogenous factors such as these and will continue to search for compelling investment opportunities utilizing our fundamental and bottom up process to generate outsize returns over time.
Sincerely,
| | | | |
| | | | |
J. Dennis Delafield | | Vincent Sellecchia | | Joshua Kaufthal |
Portfolio Manager | | Portfolio Manager | | Portfolio Manager |
| | |

| | |
Donald Wang | | James Maxwell |
Portfolio Manager | | Portfolio Manager |
The Tocqueville Select Fund
(Unaudited)
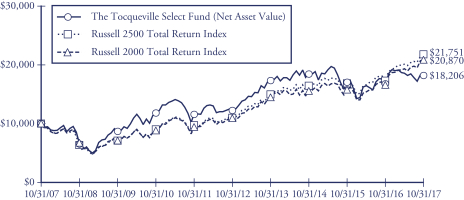
This chart assumes an initial gross investment of $10,000 made on 10/31/07. Since The Tocqueville Select Fund did not commence operations until 9/28/09, returns from the period from September 29, 2008 to September 27, 2009 are those of the Class Y Shares of the Predecessor Fund (See Footnote 1 to the Financial Statements). Prior to that period, returns shown are those of a limited partnership managed by the adviser. Returns shown do not reflect the deduction of taxes that a shareholder would pay on fund distributions or the redemption of fund shares. Performance reflects fee waivers in effect. In the absence of fee waivers, total return would be reduced. Returns shown include the reinvestment of all dividends and other distributions. Past performance is not predictive of future performance. Investment return and principal value will fluctuate so that your shares, when redeemed, may be worth more or less than their original cost.
In 2013 the performance of The Tocqueville Select Fund was achieved during a period of unusually favorable market conditions. Such performance may not be sustainable.
The Russell 2500 Total Return Index is an unmanaged index that measures the performance of the 2,500 smallest companies in the Russell 3000 Index. Returns include the reinvestment of all dividends.
The Russell 2000 Total Return Index is an unmanaged index that measures the performance of the 2,000 smallest companies in the Russell 3000 Index. Returns include the reinvestment of all dividends.
AVERAGE ANNUAL RATE OF RETURN (%)
FOR YEARS ENDED OCTOBER 31, 2017
| | | | | | | | | | | | | | | | |
| | | 1 Year | | | 3 Year | | | 5 Year | | | 10 Year | |
The Tocqueville Select Fund | | | 8.93% | | | | -0.56% | | | | 8.36% | | | | 6.17% | |
Russell 2500 Total Return Index | | | 24.68% | | | | 9.58% | | | | 14.45% | | | | 8.08% | |
Russell 2000 Total Return Index | | | 27.85% | | | | 10.12% | | | | 14.49% | | | | 7.63% | |
Expense Example—October 31, 2017 (Unaudited)
As a shareholder of The Tocqueville Trust (the “Funds”), you incur ongoing costs, including management fees; distribution fees; and other Fund expenses. This example is intended to help you understand your ongoing costs (in dollars) of investing in the Funds and to compare costs with the ongoing costs of investing in other mutual funds.
The Example is based on an investment of $1,000 invested at the beginning of the period and held the entire period (May 1, 2017-October 31, 2017).
Actual Expenses
The first line of the table below provides information about actual account values and actual expenses. You may use the information in this line, together with the amount you invested, to estimate the expenses that you paid over the period. Simply divide your account value by $1,000 (for example, an $8,600 account value divided by $1,000 = 8.6), then multiply the result by the number in the first line under the heading entitled “Expenses Paid During Period” to estimate the expenses you paid on your account during this period.
Hypothetical Example for Comparison Purposes
The second line of the table below provides information about hypothetical account values and hypothetical expenses based on the Funds’ actual expense ratios and an assumed rate of return of 5% per year before expenses, which is not the Funds’ actual return. The hypothetical account values and expenses may not be used to estimate the actual ending account balance or expenses you paid for the period. You may use this information to compare the ongoing costs of investing in the Funds and other funds. To do so, compare this 5% hypothetical example with the 5% hypothetical examples that appear in the shareholder reports of the other funds.
Please note that the expenses shown in the table are meant to highlight your ongoing costs only and do not reflect any transactional costs, such as sales charges (loads), redemption fees, or exchange fees. Therefore, the second line of the table is useful in comparing ongoing costs only, and will not help you determine the relative costs of owning different funds. In addition, if these transactional costs were included, your costs would have been higher.
Expense Example Tables (Unaudited)
The Tocqueville Fund
| | | | | | | | | | | | |
| | | Beginning
Account Value
May 1, 2017 | | | Ending
Account Value
October 31, 2017 | | | Expenses Paid
During Period*
May 1, 2017 -
October 31, 2017 | |
Actual | | $ | 1,000.00 | | | $ | 1,090.70 | | | $ | 6.64 | |
Hypothetical (5% return before expenses) | | | 1,000.00 | | | | 1,018.85 | | | | 6.41 | |
| * | Expenses are equal to the Fund’s annualized six-month expense ratio (including interest expense) of 1.26% for The Tocqueville Fund, multiplied by the average account value over the period, multiplied by 184/365 to reflect the one-half year period. |
The Tocqueville Opportunity Fund
| | | | | | | | | | | | |
| | | Beginning
Account Value
May 1, 2017 | | | Ending
Account Value
October 31, 2017 | | | Expenses Paid
During Period*
May 1, 2017 -
October 31, 2017 | |
Actual | | $ | 1,000.00 | | | $ | 1,201.50 | | | $ | 7.16 | |
Hypothetical (5% return before expenses) | | | 1,000.00 | | | | 1,018.70 | | | | 6.56 | |
| * | Expenses are equal to the Fund’s annualized six-month expense ratio (including interest expense) of 1.29% for The Tocqueville Opportunity Fund, multiplied by the average account value over the period, multiplied by 184/365 to reflect the one-half year period. |
The Tocqueville International Value Fund
| | | | | | | | | | | | |
| | | Beginning
Account Value
May 1, 2017 | | | Ending
Account Value
October 31, 2017 | | | Expenses Paid
During Period*
May 1, 2017 -
October 31, 2017 | |
Actual | | $ | 1,000.00 | | | $ | 1,096.00 | | | $ | 6.60 | |
Hypothetical (5% return before expenses) | | | 1,000.00 | | | | 1,018.90 | | | | 6.36 | |
| * | Expenses are equal to the Fund’s annualized six-month expense ratio of 1.25% for The Tocqueville International Value Fund, multiplied by the average account value over the period, multiplied by 184/365 to reflect the one-half year period. |
The Tocqueville Gold Fund
| | | | | | | | | | | | |
| | | Beginning
Account Value
May 1, 2017 | | | Ending
Account Value
October 31, 2017 | | | Expenses Paid
During Period*
May 1, 2017 -
October 31, 2017 | |
Actual | | $ | 1,000.00 | | | $ | 977.50 | | | $ | 6.83 | |
Hypothetical (5% return before expenses) | | | 1,000.00 | | | | 1,018.30 | | | | 6.97 | |
| * | Expenses are equal to the Fund’s annualized six-month expense ratio (including interest expense) of 1.37% for The Tocqueville Gold Fund, multiplied by the average account value over the period, multiplied by 184/365 to reflect the one-half year period. |
The Delafield Fund
| | | | | | | | | | | | |
| | | Beginning
Account Value
May 1, 2017 | | | Ending
Account Value
October 31, 2017 | | | Expenses Paid
During Period*
May 1, 2017 -
October 31, 2017 | |
Actual | | $ | 1,000.00 | | | $ | 1,039.40 | | | $ | 6.43 | |
Hypothetical (5% return before expenses) | | | 1,000.00 | | | | 1,018.90 | | | | 6.36 | |
| * | Expenses are equal to the Fund’s annualized six-month expense ratio of 1.25% for The Delafield Fund, multiplied by the average account value over the period, multiplied by 184/365 to reflect the one-half year period. |
The Tocqueville Select Fund
| | | | | | | | | | | | |
| | | Beginning
Account Value
May 1, 2017 | | | Ending
Account Value
October 31, 2017 | | | Expenses Paid
During Period*
May 1, 2017 -
October 31, 2017 | |
Actual | | $ | 1,000.00 | | | $ | 981.00 | | | $ | 6.24 | |
Hypothetical (5% return before expenses) | | | 1,000.00 | | | | 1,018.90 | | | | 6.36 | |
| * | Expenses are equal to the Fund’s annualized six-month expense ratio of 1.25% for The Tocqueville Select Fund, multiplied by the average account value over the period, multiplied by 184/365 to reflect the one-half year period. |
The Tocqueville Fund
Financial Highlights
| | | | | | | | | | | | | | | | | | | | |
Per share operating performance
(For a share outstanding throughout the
year) | | Years Ended October 31, | |
| | 2017 | | | 2016 | | | 2015 | | | 2014 | | | 2013 | |
Net asset value, beginning of year | | $ | 33.72 | | | $ | 32.91 | | | $ | 34.18 | | | $ | 30.67 | | | $ | 24.11 | |
| | | | | | | | | | | | | | | | | | | | |
Operations: | | | | | | | | | | | | | | | | | | | | |
Net investment income (1) | | | 0.37 | | | | 0.42 | | | | 0.37 | | | | 0.28 | | | | 0.40 | |
Net realized and unrealized gain (loss) | | | 6.40 | | | | 1.07 | | | | (0.19 | ) | | | 3.78 | | | | 6.51 | |
| | | | | | | | | | | | | | | | | | | | |
Total from investment operations * | | | 6.77 | | | | 1.49 | | | | 0.18 | | | | 4.06 | | | | 6.91 | |
| | | | | | | | | | | | | | | | | | | | |
Distributions to shareholders: | | | | | | | | | | | | | | | | | | | | |
Dividends from net investment income | | | (0.39 | ) | | | (0.35 | ) | | | (0.25 | ) | | | (0.30 | ) | | | (0.35 | ) |
Distributions from net realized gains | | | (1.50 | ) | | | (0.33 | ) | | | (1.20 | ) | | | (0.25 | ) | | | — | |
| | | | | | | | | | | | | | | | | | | | |
Total distributions | | | (1.89 | ) | | | (0.68 | ) | | | (1.45 | ) | | | (0.55 | ) | | | (0.35 | ) |
| | | | | | | | | | | | | | | | | | | | |
Change in net asset value for the year | | | 4.88 | | | | 0.81 | | | | (1.27 | ) | | | 3.51 | | | | 6.56 | |
| | | | | | | | | | | | | | | | | | | | |
Net asset value, end of year | | $ | 38.60 | | | $ | 33.72 | | | $ | 32.91 | | | $ | 34.18 | | | $ | 30.67 | |
| | | | | | | | | | | | | | | | | | | | |
* Includes redemption fees per share of | | | N/A | | | | N/A | | | | 0.00 | (2) | | | 0.00 | (2) | | | 0.00 | (2) |
Total Return | | | 20.9 | % | | | 4.6 | % | | | 0.5 | % | | | 13.4 | % | | | 29.0 | % |
Ratios/supplemental data | | | | | | | | | | | | | | | | | | | | |
Net assets, end of year (000) | | $ | 293,637 | | | $ | 283,126 | | | $ | 309,267 | | | $ | 380,561 | | | $ | 348,269 | |
Ratio to average net assets: | | | | | | | | | | | | | | | | | | | | |
Expenses before waiver/reimbursement | | | 1.27 | % | | | 1.27 | % | | | 1.29 | % | | | 1.25 | % | | | 1.28 | % |
Expenses after waiver/reimbursement | | | 1.26 | %(3) | | | 1.24 | %(3) | | | 1.25 | % | | | 1.24 | % | | | 1.26 | %(3) |
Net investment income before waiver/reimbursement | | | 0.97 | % | | | 1.18 | % | | | 0.91 | % | | | 0.84 | % | | | 1.33 | % |
Net investment income after waiver/reimbursement | | | 0.98 | % | | | 1.21 | % | | | 0.95 | % | | | 0.85 | % | | | 1.35 | % |
Portfolio turnover rate | | | 10 | % | | | 12 | % | | | 15 | % | | | 19 | % | | | 16 | % |
| (1) | Net investment income per share is calculated using the ending balance prior to consideration or adjustment for permanent book-to-tax differences. |
| (2) | Represents less than $0.01. |
| (3) | Includes 0.01% of interest expense which is not included in the Fund’s operating expense cap. |
The Accompanying Notes are an Integral Part of these Financial Statements.
The Tocqueville Opportunity Fund
Financial Highlights
| | | | | | | | | | | | | | | | | | | | |
Per share operating performance
(For a share outstanding throughout the
year) | | Years Ended October 31, | |
| | 2017 | | | 2016 | | | 2015 | | | 2014 | | | 2013 | |
Net asset value, beginning of year | | $ | 19.14 | | | $ | 21.41 | | | $ | 22.78 | | | $ | 21.29 | | | $ | 15.76 | |
| | | | | | | | | | | | | | | | | | | | |
Operations: | | | | | | | | | | | | | | | | | | | | |
Net investment loss (1) | | | (0.37 | ) | | | (0.29 | ) | | | (0.15 | ) | | | (0.22 | ) | | | (0.13 | ) |
Net realized and unrealized gain (loss) | | | 7.35 | | | | (1.98 | ) | | | 1.98 | | | | 2.80 | | | | 5.66 | |
| | | | | | | | | | | | | | | | | | | | |
Total from investment operations * | | | 6.98 | | | | (2.27 | ) | | | 1.83 | | | | 2.58 | | | | 5.53 | |
| | | | | | | | | | | | | | | | | | | | |
Distributions to shareholders: | | | | | | | | | | | | | | | | | | | | |
Dividends from net investment income | | | — | | | | — | | | | — | | | | — | | | | — | |
Distributions from net realized gains | | | — | | | | — | | | | (3.20 | ) | | | (1.09 | ) | | | — | |
| | | | | | | | | | | | | | | | | | | | |
Total distributions | | | — | | | | — | | | | (3.20 | ) | | | (1.09 | ) | | | — | |
| | | | | | | | | | | | | | | | | | | | |
Change in net asset value for the year | | | 6.98 | | | | (2.27 | ) | | | (1.37 | ) | | | 1.49 | | | | 5.53 | |
| | | | | | | | | | | | | | | | | | | | |
Net asset value, end of year | | $ | 26.12 | | | $ | 19.14 | | | $ | 21.41 | | | $ | 22.78 | | | $ | 21.29 | |
| | | | | | | | | | | | | | | | | | | | |
* Includes redemption fees per share of | | | N/A | | | | N/A | | | | 0.00 | (2) | | | 0.00 | (2) | | | 0.00 | (2) |
Total Return | | | 36.5 | % | | | (10.6 | )% | | | 9.1 | % | | | 12.6 | % | | | 35.1 | % |
Ratios/supplemental data | | | | | | | | | | | | | | | | | | | | |
Net assets, end of year (000) | | $ | 77,773 | | | $ | 92,958 | | | $ | 153,456 | | | $ | 80,324 | | | $ | 80,609 | |
Ratio to average net assets: | | | | | | | | | | | | | | | | | | | | |
Expenses before waiver/reimbursement | | | 1.38 | % | | | 1.38 | % | | | 1.31 | % | | | 1.30 | % | | | 1.30 | % |
Expenses after waiver/reimbursement | | | 1.30 | %(3)(4) | | | 1.38 | % | | | 1.31 | % | | | 1.30 | % | | | 1.30 | % |
Net investment loss before waiver/reimbursement | | | (1.05 | )% | | | (0.94 | )% | | | (0.95 | )% | | | (0.90 | )% | | | (0.64 | )% |
Net investment loss after waiver/reimbursement | | | (0.97 | )%(4) | | | (0.94 | )% | | | (0.95 | )% | | | (0.90 | )% | | | (0.64 | )% |
Portfolio turnover rate | | | 133 | % | | | 108 | % | | | 101 | % | | | 92 | % | | | 100 | % |
| (1) | Net investment loss per share is calculated using the ending balance prior to consideration or adjustment for permanent book-to-tax differences. |
| (2) | Represents less than $0.01. |
| (3) | Includes 0.05% of interest expense which is not included in the Fund’s operating expense cap. |
| (4) | Expense waiver of 1.25% was implemented on November 1, 2016. |
The Accompanying Notes are an Integral Part of these Financial Statements.
The Tocqueville International Value Fund
Financial Highlights
| | | | | | | | | | | | | | | | | | | | |
Per share operating performance
(For a share outstanding throughout
the year) | | Years Ended October 31, | |
| | 2017 | | | 2016 | | | 2015 | | | 2014 | | | 2013 | |
Net asset value, beginning of year | | $ | 14.44 | | | $ | 14.59 | | | $ | 14.48 | | | $ | 14.71 | | | $ | 11.68 | |
| | | | | | | | | | | | | | | | | | | | |
Operations: | | | | | | | | | | | | | | | | | | | | |
Net investment income (1) | | | 0.14 | | | | 0.14 | | | | 0.15 | | | | 0.15 | | | | 0.24 | |
Net realized and unrealized gain (loss) | | | 3.23 | | | | 0.14 | | | | 0.80 | | | | (0.15 | ) | | | 2.97 | |
| | | | | | | | | | | | | | | | | | | | |
Total from investment operations * | | | 3.37 | | | | 0.28 | | | | 0.95 | | | | — | | | | 3.21 | |
| | | | | | | | | | | | | | | | | | | | |
Distributions to shareholders: | | | | | | | | | | | | | | | | | | | | |
Dividends from net investment income | | | (0.15 | ) | | | (0.25 | ) | | | (0.32 | ) | | | (0.23 | ) | | | (0.18 | ) |
Distributions from net realized gains | | | (0.08 | ) | | | (0.18 | ) | | | (0.52 | ) | | | — | | | | — | |
| | | | | | | | | | | | | | | | | | | | |
Total distributions | | | (0.23 | ) | | | (0.43 | ) | | | (0.84 | ) | | | (0.23 | ) | | | (0.18 | ) |
| | | | | | | | | | | | | | | | | | | | |
Change in net asset value for the year | | | 3.14 | | | | (0.15 | ) | | | 0.11 | | | | (0.23 | ) | | | 3.03 | |
| | | | | | | | | | | | | | | | | | | | |
Net asset value, end of year | | $ | 17.58 | | | $ | 14.44 | | | $ | 14.59 | | | $ | 14.48 | | | $ | 14.71 | |
| | | | | | | | | | | | | | | | | | | | |
* Includes redemption fees per share of | | | N/A | | | | N/A | | | | 0.00 | (2) | | | 0.00 | (2) | | | 0.00 | (2) |
Total Return | | | 23.7 | % | | | 2.0 | % | | | 7.2 | % | | | (0.0 | )% | | | 27.8 | % |
Ratios/supplemental data | | | | | | | | | | | | | | | | | | | | |
Net assets, end of year (000) | | $ | 1,120,994 | | | $ | 525,808 | | | $ | 333,762 | | | $ | 237,051 | | | $ | 262,981 | |
Ratio to average net assets: | | | | | | | | | | | | | | | | | | | | |
Expenses before waiver/reimbursement | | | 1.53 | % | | | 1.58 | % | | | 1.57 | % | | | 1.54 | % | | | 1.55 | % |
Expenses after waiver/reimbursement | | | 1.25 | % | | | 1.25 | % | | | 1.25 | % | | | 1.25 | % | | | 1.30 | %(3) |
Net investment income before waiver/reimbursement | | | 0.73 | % | | | 0.90 | % | | | 0.71 | % | | | 0.62 | % | | | 1.55 | % |
Net investment income after waiver/reimbursement | | | 1.01 | % | | | 1.23 | % | | | 1.03 | % | | | 0.91 | % | | | 1.80 | %(3) |
Portfolio turnover rate | | | 22 | % | | | 26 | % | | | 42 | % | | | 31 | % | | | 37 | % |
| (1) | Net investment income per share is calculated using the ending balance prior to consideration or adjustment for permanent book-to-tax differences. |
| (2) | Represents less than $0.01. |
| (3) | Expense waiver of 1.25% was implemented on January 1, 2013. |
The Accompanying Notes are an Integral Part of these Financial Statements.
The Tocqueville Gold Fund
Financial Highlights
| | | | | | | | | | | | | | | | | | | | |
Per share operating performance
(For a share outstanding
throughout the year) | | Years Ended October 31, | |
| | 2017 | | | 2016 | | | 2015 | | | 2014 | | | 2013 | |
Net asset value, beginning of year | | $ | 39.32 | | | $ | 26.04 | | | $ | 30.38 | | | $ | 38.01 | | | $ | 72.82 | |
| | | | | | | | | | | | | | | | | | | | |
Operations: | | | | | | | | | | | | | | | | | | | | |
Net investment loss (1) | | | (0.39 | ) | | | (0.33 | ) | | | (0.27 | ) | | | (0.08 | ) | | | (0.26 | ) |
Net realized and unrealized gain (loss) | | | (3.29 | ) | | | 13.61 | | | | (4.07 | ) | | | (7.55 | ) | | | (32.93 | ) |
| | | | | | | | | | | | | | | | | | | | |
Total from investment operations * | | | (3.68 | ) | | | 13.28 | | | | (4.34 | ) | | | (7.63 | ) | | | (33.19 | ) |
| | | | | | | | | | | | | | | | | | | | |
Distributions to shareholders: | | | | | | | | | | | | | | | | | | | | |
Dividends from net investment income | | | — | | | | — | | | | — | | | | — | | | | — | |
Distributions from net realized gains | | | — | | | | — | | | | — | | | | — | | | | (1.62 | ) |
| | | | | | | | | | | | | | | | | | | | |
Total distributions | | | — | | | | — | | | | — | | | | — | | | | (1.62 | ) |
| | | | | | | | | | | | | | | | | | | | |
Change in net asset value for the year | | | (3.68 | ) | | | 13.28 | | | | (4.34 | ) | | | (7.63 | ) | | | (34.81 | ) |
| | | | | | | | | | | | | | | | | | | | |
Net asset value, end of year | | $ | 35.64 | | | $ | 39.32 | | | $ | 26.04 | | | $ | 30.38 | | | $ | 38.01 | |
| | | | | | | | | | | | | | | | | | | | |
* Includes redemption fees per share of | | | 0.01 | | | | 0.01 | | | | 0.01 | | | | 0.02 | | | | 0.02 | |
Total Return | | | (9.4 | )% | | | 51.0 | % | | | (14.3 | )% | | | (20.1 | )% | | | (46.4 | )% |
Ratios/supplemental data | | | | | | | | | | | | | | | | | | | | |
Net assets, end of year (000) | | $ | 1,153,287 | | | $ | 1,365,282 | | | $ | 947,367 | | | $ | 1,138,557 | | | $ | 1,215,081 | |
Ratio to average net assets: | | | | | | | | | | | | | | | | | | | | |
Expense | | | 1.38 | % | | | 1.39 | % | | | 1.43 | % | | | 1.36 | % | | | 1.34 | % |
Net investment loss | | | (0.95 | )% | | | (0.91 | )% | | | (0.84 | )% | | | (0.78 | )% | | | (0.41 | )% |
Portfolio turnover rate | | | 14 | % | | | 15 | % | | | 11 | % | | | 10 | % | | | 14 | % |
| (1) | Net investment loss per share is calculated using the ending balance prior to consideration or adjustment for permanent book-to-tax differences. |
The Accompanying Notes are an Integral Part of these Financial Statements.
The Delafield Fund
Financial Highlights
| | | | | | | | | | | | | | | | | | | | |
Per share operating performance
(For a share outstanding throughout
the year) | | Years Ended October 31, | |
| | 2017 | | | 2016 | | | 2015 | | | 2014 | | | 2013 | |
Net asset value, beginning of year | | $ | 26.47 | | | $ | 28.64 | | | $ | 36.40 | | | $ | 37.13 | | | $ | 29.79 | |
| | | | | | | | | | | | | | | | | | | | |
Operations: | | | | | | | | | | | | | | | | | | | | |
Net investment loss (1) | | | (0.15 | ) | | | (0.15 | ) | | | (0.14 | ) | | | (0.10 | ) | | | (0.05 | ) |
Net realized and unrealized gain (loss) | | | 4.91 | | | | 0.78 | | | | (3.99 | ) | | | 0.70 | | | | 9.19 | |
| | | | | | | | | | | | | | | | | | | | |
Total from investment operations * | | | 4.76 | | | | 0.63 | | | | (4.13 | ) | | | 0.60 | | | | 9.14 | |
| | | | | | | | | | | | | | | | | | | | |
Distributions to shareholders: | | | | | | | | | | | | | | | | | | | | |
Dividends from net investment income | | | — | | | | — | | | | — | | | | — | | | | — | |
Distributions from net realized gains | | | (4.83 | ) | | | (2.80 | ) | | | (3.63 | ) | | | (1.33 | ) | | | (1.80 | ) |
| | | | | | | | | | | | | | | | | | | | |
Total distributions | | | (4.83 | ) | | | (2.80 | ) | | | (3.63 | ) | | | (1.33 | ) | | | (1.80 | ) |
| | | | | | | | | | | | | | | | | | | | |
Change in net asset value for the year | | | (0.07 | ) | | | (2.17 | ) | | | (7.76 | ) | | | (0.73 | ) | | | 7.34 | |
| | | | | | | | | | | | | | | | | | | | |
Net asset value, end of year | | $ | 26.40 | | | $ | 26.47 | | | $ | 28.64 | | | $ | 36.40 | | | $ | 37.13 | |
| | | | | | | | | | | | | | | | | | | | |
* Includes redemption fees per share of | | | N/A | | | | N/A | | | | 0.00 | (2) | | | 0.00 | (2) | | | 0.00 | (2) |
Total Return | | | 19.0 | % | | | 3.3 | % | | | (12.3 | )% | | | 1.6 | % | | | 32.1 | % |
Ratios/supplemental data | | | | | | | | | | | | | | | | | | | | |
Net assets, end of year (000) | | $ | 373,353 | | | $ | 400,827 | | | $ | 674,525 | | | $ | 1,475,139 | | | $ | 1,759,341 | |
Ratio to average net assets: | | | | | | | | | | | | | | | | | | | | |
Expenses before waiver/reimbursement | | | 1.31 | % | | | 1.29 | % | | | 1.25 | % | | | 1.21 | % | | | 1.21 | % |
Expenses after waiver/reimbursement | | | 1.25 | %(3) | | | 1.29 | % | | | 1.25 | % | | | 1.21 | % | | | 1.21 | % |
Net investment loss before waiver/reimbursement | | | (0.55 | )% | | | (0.33 | )% | | | (0.15 | )% | | | (0.24 | )% | | | (0.15 | )% |
Net investment loss after waiver/reimbursement | | | (0.49 | )%(3) | | | (0.33 | )% | | | (0.15 | )% | | | (0.24 | )% | | | (0.15 | )% |
Portfolio turnover rate | | | 36 | % | | | 39 | % | | | 19 | % | | | 34 | % | | | 34 | % |
| (1) | Net investment loss per share is calculated using the ending balance prior to consideration or adjustment for permanent book-to-tax differences. |
| (2) | Represents less than $0.01. |
| (3) | Expense waiver of 1.25% was implemented on November 1, 2016. |
The Accompanying Notes are an Integral Part of these Financial Statements.
The Tocqueville Select Fund
Financial Highlights
| | | | | | | | | | | | | | | | | | | | |
Per share operating performance
(For a share outstanding throughout the
year) | | Years Ended October 31, | |
| | 2017 | | | 2016 | | | 2015 | | | 2014 | | | 2013 | |
Net asset value, beginning of year | | $ | 11.43 | | | $ | 12.08 | | | $ | 14.90 | | | $ | 15.57 | | | $ | 11.35 | |
| | | | | | | | | | | | | | | | | | | | |
Operations: | | | | | | | | | | | | | | | | | | | | |
Net investment loss (1) | | | (0.06 | ) | | | (0.07 | ) | | | (0.08 | ) | | | (0.07 | ) | | | (0.06 | ) |
Net realized and unrealized gain (loss) | | | 1.12 | | | | (0.18 | ) | | | (1.00 | ) | | | 0.94 | | | | 4.79 | |
| | | | | | | | | | | | | | | | | | | | |
Total from investment operations * | | | 1.06 | | | | (0.25 | ) | | | (1.08 | ) | | | 0.87 | | | | 4.73 | |
| | | | | | | | | | | | | | | | | | | | |
Distributions to shareholders: | | | | | | | | | | | | | | | | | | | | |
Dividends from net investment income | | | — | | | | — | | | | — | | | | — | | | | — | |
Distributions from net realized gains | | | (0.62 | ) | | | (0.40 | ) | | | (1.74 | ) | | | (1.54 | ) | | | (0.51 | ) |
| | | | | | | | | | | | | | | | | | | | |
Total distributions | | | (0.62 | ) | | | (0.40 | ) | | | (1.74 | ) | | | (1.54 | ) | | | (0.51 | ) |
| | | | | | | | | | | | | | | | | | | | |
Change in net asset value for the year | | | 0.44 | | | | (0.65 | ) | | | (2.82 | ) | | | (0.67 | ) | | | 4.22 | |
| | | | | | | | | | | | | | | | | | | | |
Net asset value, end of year | | $ | 11.87 | | | $ | 11.43 | | | $ | 12.08 | | | $ | 14.90 | | | $ | 15.57 | |
| | | | | | | | | | | | | | | | | | | | |
* Includes redemption fees per share of | | | N/A | | | | N/A | | | | 0.00 | (2) | | | 0.00 | (2) | | | 0.00 | (2) |
Total Return | | | 8.9 | % | | | (1.9 | )% | | | (8.0 | )% | | | 6.1 | % | | | 43.2 | % |
Ratios/supplemental data | | | | | | | | | | | | | | | | | | | | |
Net assets, end of year (000) | | $ | 49,453 | | | $ | 63,812 | | | $ | 81,813 | | | $ | 108,060 | | | $ | 99,888 | |
Ratio to average net assets: | | | | | | | | | | | | | | | | | | | | |
Expenses before waiver/reimbursement | | | 1.37 | % | | | 1.37 | % | | | 1.36 | % | | | 1.32 | % | | | 1.34 | % |
Expenses after waiver/reimbursement | | | 1.25 | %(3) | | | 1.37 | % | | | 1.36 | % | | | 1.32 | % | | | 1.34 | % |
Net investment loss before waiver/reimbursement | | | (0.47 | )% | | | (0.45 | )% | | | (0.52 | )% | | | (0.50 | )% | | | (0.39 | )% |
Net investment loss after waiver/reimbursement | | | (0.35 | )%(3) | | | (0.45 | )% | | | (0.52 | )% | | | (0.50 | )% | | | (0.39 | )% |
Portfolio turnover rate | | | 24 | % | | | 32 | % | | | 43 | % | | | 32 | % | | | 28 | % |
| (1) | Net investment loss per share is calculated using the ending balance prior to consideration or adjustment for permanent book-to-tax differences. |
| (2) | Represents less than $0.01. |
| (3) | Expense waiver of 1.25% was implemented on November 1, 2016. |
The Accompanying Notes are an Integral Part of these Financial Statements.
The Tocqueville Fund
Schedule of Investments as of October 31, 2017
| | | | | | | | |
| Common Stocks—96.0% | | Shares | | | Value | |
Automobiles & Components—1.5% | | | | | |
Ford Motor Co. | | | 350,000 | | | $ | 4,294,500 | |
Banks—0.9% | | | | | | | | |
Bank of America Corp. | | | 100,000 | | | | 2,739,000 | |
Capital Goods—9.3% | | | | | | | | |
Arconic, Inc. | | | 150,000 | | | | 3,768,000 | |
Caterpillar, Inc. | | | 25,000 | | | | 3,395,000 | |
General Electric Co. | | | 300,000 | | | | 6,048,000 | |
Illinois Tool Works, Inc. | | | 40,000 | | | | 6,260,800 | |
The Boeing Co. | | | 30,000 | | | | 7,739,400 | |
| | | | | | | | 27,211,200 | |
Commercial & Professional Services—1.0% | |
Steelcase, Inc.—Class A | | | 200,000 | | | | 2,910,000 | |
Consumer Services—2.3% | | | | | | | | |
McDonald’s Corp. | | | 40,000 | | | | 6,676,400 | |
Diversified Financials—4.4% | | | | | |
Lazard Ltd.—Class A(a) | | | 100,000 | | | | 4,754,000 | |
Synchrony Financial | | | 50,000 | | | | 1,631,000 | |
The Bank of New York Mellon Corp. | | | 125,000 | | | | 6,431,250 | |
| | | | | | | | 12,816,250 | |
Energy—5.7% | | | | | | | | |
Exxon Mobil Corp. | | | 100,000 | | | | 8,335,000 | |
Noble Energy, Inc. | | | 75,000 | | | | 2,090,250 | |
Schlumberger Ltd.(a) | | | 100,000 | | | | 6,400,000 | |
| | | | | | | | 16,825,250 | |
Food & Staples Retailing—3.0% | | | | | |
Wal-Mart Stores, Inc. | | | 100,000 | | | | 8,731,000 | |
Food, Beverage & Tobacco—3.6% | | | | | |
Campbell Soup Co. | | | 75,000 | | | | 3,552,750 | |
The Coca-Cola Co. | | | 150,000 | | | | 6,897,000 | |
| | | | | | | | 10,449,750 | |
Health Care Equipment & Services—0.9% | |
Abbott Laboratories | | | 50,000 | | | | 2,711,500 | |
Household & Personal Products—5.3% | |
Colgate-Palmolive Co. | | | 100,000 | | | | 7,045,000 | |
The Procter & Gamble Co. | | | 100,000 | | | | 8,634,000 | |
| | | | | | | | 15,679,000 | |
Insurance—1.9% | | | | | | | | |
Aflac, Inc. | | | 50,000 | | | | 4,194,500 | |
Brighthouse Financial, Inc.(b) | | | 25,000 | | | | 1,554,500 | |
| | | | | | | | 5,749,000 | |
Materials—8.2% | | | | | | | | |
Alcoa Corp.(b) | | | 100,000 | | | | 4,778,000 | |
BHP Billiton Ltd.—ADR(a) | | | 50,000 | | | | 2,049,000 | |
DowDuPont, Inc. | | | 125,000 | | | | 9,038,750 | |
Potash Corp of Saskatchewan, Inc.(a) | | | 100,000 | | | | 1,947,000 | |
Sonoco Products Co. | | | 75,000 | | | | 3,884,250 | |
U.S. Concrete, Inc.(b) | | | 30,000 | | | | 2,346,000 | |
| | | | | | | | 24,043,000 | |
Media—0.9% | | | | | | | | |
The Walt Disney Co. | | | 27,500 | | | | 2,689,775 | |
Pharmaceuticals, Biotechnology & Life Sciences—11.3% | |
Alkermes PLC(a)(b) | | | 75,000 | | | | 3,657,000 | |
Biogen, Inc.(b) | | | 5,000 | | | | 1,558,300 | |
Ionis Pharmaceuticals, Inc.(b) | | | 75,000 | | | | 4,283,250 | |
Johnson & Johnson | | | 70,000 | | | | 9,758,700 | |
Merck & Co., Inc. | | | 125,000 | | | | 6,886,250 | |
Pfizer, Inc. | | | 200,000 | | | | 7,012,000 | |
| | | | | | | | 33,155,500 | |
Retailing—4.9% | | | | | | | | |
Amazon.com, Inc.(b) | | | 10,000 | | | | 11,052,800 | |
JD.com, Inc.—ADR(a)(b) | | | 20,000 | | | | 750,400 | |
Williams-Sonoma, Inc. | | | 50,000 | | | | 2,580,000 | |
| | | | | | | | 14,383,200 | |
Semiconductors & Semiconductor Equipment—7.8% | |
Applied Materials, Inc. | | | 200,000 | | | | 11,286,000 | |
Intel Corp. | | | 175,000 | | | | 7,960,750 | |
QUALCOMM, Inc. | | | 75,000 | | | | 3,825,750 | |
| | | | | | | | 23,072,500 | |
Software & Services—12.0% | |
Alphabet, Inc.—Class A(b) | | | 7,000 | | | | 7,231,280 | |
Automatic Data Processing, Inc. | | | 75,000 | | | | 8,719,500 | |
Facebook, Inc.—Class A(b) | | | 50,000 | | | | 9,003,000 | |
Microsoft Corp. | | | 125,000 | | | | 10,397,500 | |
| | | | | | | | 35,351,280 | |
The Accompanying Footnotes are an Integral Part of these Financial Statements.
The Tocqueville Fund
Schedule of Investments as of October 31, 2017
| | | | | | | | |
| Common Stocks—96.0% | | Shares | | | Value | |
Technology Hardware & Equipment—2.4% | |
Apple, Inc. | | | 40,000 | | | $ | 6,761,600 | |
Bio-key International, Inc.(b)(c)(d)
(Originally acquired 09/16/05, Cost $0) | | | 1,963 | | | | — | |
Palo Alto Networks, Inc.(b) | | | 1,300 | | | | 191,360 | |
| | | | | | | | 6,952,960 | |
Telecommunication Services—1.6% | |
Verizon Communications, Inc. | | | 100,000 | | | | 4,787,000 | |
Transportation—3.1% | | | | | | | | |
Delta Air Lines, Inc. | | | 150,000 | | | | 7,504,500 | |
Kansas City Southern | | | 15,000 | | | | 1,563,300 | |
| | | | | | | | 9,067,800 | |
Utilities—4.0% | | | | | | | | |
NextEra Energy, Inc. | | | 75,000 | | | | 11,630,250 | |
Total Common Stocks
(Cost $140,834,667) | | | | | | | 281,926,115 | |
Preferred Stock—0.0% | | | | | | | | |
Health Care Equipment & Supplies—0.0% | |
ZymeQuest, Inc.(b)(c)(d) (Originally acquired 10/13/16, Cost $1,963) | | | 400,000 | | | | 1,600 | |
Total Preferred Stock
(Cost $0) | | | | | | | 1,600 | |
Real Estate Investment Trust (REIT)—2.4% | |
Real Estate—2.4% | | | | | | | | |
Weyerhaeuser Co. | | | 200,000 | | | | 7,182,000 | |
Total Real Estate Investment Trust
(Cost $3,645,642) | | | | 7,182,000 | |
Exchange-Traded Fund (ETF)—1.1% | |
Metals and Mining—1.1% | | | | | | | | |
SPDR S&P Metals & Mining ETF | | | 100,000 | | | | 3,167,000 | |
Total Exchange-Traded Fund
(Cost $1,495,845) | | | | 3,167,000 | |
| Government Security—0.5% | | Shares | | | Value | |
Banks—0.5% | | | | | | | | |
Federal National Mortgage Association, 8.250%(e) | | | 200,000 | | | | 1,362,000 | |
Total Government Security
(Cost $1,374,856) | | | | | | | 1,362,000 | |
Total Investments
(Cost $147,351,010)—100.0% | | | | 293,638,715 | |
Liabilities in Excess of Other Assets—0.0% | | | | | | | (1,535 | ) |
Total Net Assets—100.0% | | | | | | $ | 293,637,180 | |
| | | | | | | | |
Percentages are stated as a percent of net assets.
| ADR | American Depository Receipt |
| (a) | Foreign issued security. Foreign concentration (including ADR’s) was as follows: Australia 0.7%; Bermuda 1.6%; Canada 0.7%; Cayman Islands 0.3%; Curacao 2.2%; Ireland 1.2%. |
| (b) | Non-income producing security. |
| (c) | Denotes a security that is either fully or partially restricted to resale. The aggregate value of restricted securities as of October 31, 2017 was $1,600 which represented 0.0% of net assets. |
| (d) | Security is fair valued using procedures approved by the Board of Trustees which includes significant unobservable inputs. The aggregate value of fair valued securities as of October 31, 2017 was $1,600 which represented 0.0% of net assets. |
| (e) | Variable rate security. The rate listed is as of October 31, 2017. |
The Global Industry Classification Standard (GICS®) was developed by and/or is the exclusive property of MSCI, Inc. and Standard & Poor Financial Services LLC (“S&P”). GICS is a service mark of MSCI and S&P and has been licensed for use by U.S. Bancorp Fund Services, LLC.
The Accompanying Footnotes are an Integral Part of these Financial Statements.
The Tocqueville Opportunity Fund
Schedule of Investments as of October 31, 2017
| | | | | | | | |
| Common Stocks—96.8% | | Shares | | | Value | |
Automobiles & Components—1.3% | |
Adient PLC(a) | | | 1,500 | | | $ | 126,540 | |
BorgWarner, Inc. | | | 2,300 | | | | 121,256 | |
Delphi Automotive PLC(a) | | | 2,500 | | | | 248,450 | |
Lear Corp. | | | 1,000 | | | | 175,590 | |
Tesla, Inc.(b) | | | 250 | | | | 82,883 | |
Thor Industries, Inc. | | | 2,000 | | | | 272,440 | |
| | | | | | | | 1,027,159 | |
Banks—0.3% | | | | | | | | |
Pinnacle Financial Partners, Inc. | | | 3,500 | | | | 231,700 | |
Capital Goods—7.6% | | | | | | | | |
AO Smith Corp. | | | 6,000 | | | | 355,200 | |
Beacon Roofing Supply, Inc.(b) | | | 3,500 | | | | 193,935 | |
Donaldson Co., Inc. | | | 1,500 | | | | 70,815 | |
Esterline Technologies Corp.(b) | | | 500 | | | | 47,425 | |
Fortune Brands Home & Security, Inc. | | | 4,500 | | | | 297,270 | |
Granite Construction, Inc. | | | 1,500 | | | | 95,535 | |
HD Supply Holdings, Inc.(b) | | | 500 | | | | 17,695 | |
HEICO Corp. | | | 1,500 | | | | 136,020 | |
Hexcel Corp. | | | 3,600 | | | | 218,484 | |
Hubbell, Inc. | | | 1,700 | | | | 213,894 | |
IDEX Corp. | | | 2,500 | | | | 320,525 | |
Lennox International, Inc. | | | 4,000 | | | | 764,520 | |
Lincoln Electric Holdings, Inc. | | | 1,500 | | | | 137,505 | |
Masonite International Corp.(a)(b) | | | 500 | | | | 33,550 | |
MasTec, Inc.(b) | | | 1,000 | | | | 43,550 | |
Nordson Corp. | | | 4,000 | | | | 506,760 | |
Owens Corning | | | 1,000 | | | | 82,690 | |
PGT Innovations, Inc.(b) | | | 7,500 | | | | 105,750 | |
RBC Bearings, Inc.(b) | | | 1,000 | | | | 123,820 | |
SiteOne Landscape Supply, Inc.(b) | | | 11,000 | | | | 698,610 | |
Spirit AeroSystems Holdings, Inc.—Class A | | | 500 | | | | 40,050 | |
The Middleby Corp.(b) | | | 200 | | | | 23,180 | |
TransDigm Group, Inc. | | | 100 | | | | 27,750 | |
United Rentals, Inc.(b) | | | 2,250 | | | | 318,330 | |
WABCO Holdings, Inc.(b) | | | 1,800 | | | | 265,626 | |
Watsco, Inc. | | | 3,500 | | | | 582,995 | |
Welbilt, Inc.(b) | | | 1,500 | | | | 33,090 | |
Woodward, Inc. | | | 2,500 | | | | 193,325 | |
| | | | | | | | 5,947,899 | |
Commercial & Professional Services—0.8% | |
Copart, Inc.(b) | | | 5,400 | | | | 195,966 | |
TransUnion(b) | | | 8,500 | | | | 446,165 | |
| | | | | | | | 642,131 | |
Consumer Durables & Apparel—0.5% | |
Cavco Industries, Inc.(b) | | | 500 | | | | 78,450 | |
Leggett & Platt, Inc. | | | 3,000 | | | | 141,780 | |
Mohawk Industries, Inc.(b) | | | 500 | | | | 130,880 | |
| | | | | | | | 351,110 | |
Consumer Services—0.6% | | | | | | | | |
Domino’s Pizza, Inc. | | | 500 | | | | 91,500 | |
Restaurant Brands International LP(a) | | | 37 | | | | 2,403 | |
Vail Resorts, Inc. | | | 1,500 | | | | 343,530 | |
| | | | | | | | 437,433 | |
Diversified Financials—1.8% | | | | | | | | |
cboe Global Markets, Inc. | | | 4,000 | | | | 452,240 | |
CME Group, Inc. | | | 2,500 | | | | 342,925 | |
FactSet Research Systems, Inc. | | | 800 | | | | 151,896 | |
MarketAxess Holdings, Inc. | | | 200 | | | | 34,800 | |
MSCI, Inc. | | | 1,500 | | | | 176,040 | |
S&P Global, Inc. | | | 1,500 | | | | 234,705 | |
SEI Investments Co. | | | 500 | | | | 32,255 | |
| | | | | | | | 1,424,861 | |
Health Care Equipment & Services—3.7% | |
ABIOMED, Inc.(b) | | | 500 | | | | 96,460 | |
Align Technology, Inc.(b) | | | 1,500 | | | | 358,470 | |
Cardiovascular Systems, Inc.(b) | | | 4,500 | | | | 108,315 | |
Glaukos Corp.(b) | | | 500 | | | | 17,655 | |
IDEXX Laboratories, Inc.(b) | | | 2,000 | | | | 332,340 | |
Intuitive Surgical, Inc.(b) | | | 2,700 | | | | 1,013,472 | |
iRhythm Technologies, Inc.(b) | | | 3,500 | | | | 178,325 | |
K2M Group Holdings, Inc.(b) | | | 500 | | | | 9,845 | |
Pulse Biosciences, Inc.(b) | | | 21,500 | | | | 520,515 | |
Teleflex, Inc. | | | 1,000 | | | | 236,980 | |
| | | | | | | | 2,872,377 | |
Materials—2.9% | | | | | | | | |
AptarGroup, Inc. | | | 1,500 | | | | 130,605 | |
Berry Global Group, Inc.(b) | | | 4,000 | | | | 237,800 | |
The Chemours Co. | | | 12,000 | | | | 679,320 | |
Eagle Materials, Inc. | | | 1,000 | | | | 105,570 | |
Martin Marietta Materials, Inc. | | | 1,400 | | | | 303,590 | |
The Accompanying Footnotes are an Integral Part of these Financial Statements.
The Tocqueville Opportunity Fund
Schedule of Investments as of October 31, 2017
| | | | | | | | |
| Common Stocks—96.8% | | Shares | | | Value | |
Packaging Corp. of America | | | 3,500 | | | $ | 406,945 | |
The Sherwin-Williams Co. | | | 600 | | | | 237,090 | |
U.S. Concrete, Inc.(b) | | | 1,500 | | | | 117,300 | |
Worthington Industries, Inc. | | | 1,500 | | | | 68,250 | |
| | | | | | | | 2,286,470 | |
Media—0.1% | | | | | | | | |
Liberty Media Corp—Liberty SiriusXM—Class C(b) | | | 1,000 | | | | 41,650 | |
Pharmaceuticals, Biotechnology & Life Sciences—29.5% | |
ACADIA Pharmaceuticals, Inc.(b) | | | 9,000 | | | | 313,470 | |
Aclaris Therapeutics, Inc.(b) | | | 500 | | | | 12,605 | |
Advaxis, Inc.(b) | | | 1,000 | | | | 3,400 | |
Aerie Pharmaceuticals, Inc.(b) | | | 41,000 | | | | 2,531,750 | |
Alkermes PLC(a)(b) | | | 500 | | | | 24,380 | |
Alnylam Pharmaceuticals, Inc.(b) | | | 7,000 | | | | 852,880 | |
Audentes Therapeutics, Inc.(b) | | | 7,500 | | | | 199,425 | |
Avexis, Inc.(b) | | | 10,000 | | | | 1,045,100 | |
Bellicum Pharmaceuticals, Inc.(b) | | | 1,000 | | | | 9,420 | |
Bluebird Bio, Inc.(b) | | | 20,500 | | | | 2,851,550 | |
Cellectis SA—ADR(a)(b) | | | 500 | | | | 17,505 | |
Clovis Oncology, Inc.(b) | | | 20,000 | | | | 1,507,400 | |
Dermira, Inc.(b) | | | 500 | | | | 13,385 | |
Eisai Co. Ltd.—ADR(a)(b) | | | 4,000 | | | | 222,400 | |
Five Prime Therapeutics, Inc.(b) | | | 500 | | | | 22,430 | |
Forward Pharma A/S—ADR(a) | | | 1,000 | | | | 5,650 | |
Genfit(a)(b) | | | 500 | | | | 13,157 | |
Genmab A/S(a)(b) | | | 8,500 | | | | 1,716,433 | |
Immunomedics, Inc.(b) | | | 15,000 | | | | 160,800 | |
Incyte Corp.(b) | | | 19,500 | | | | 2,208,375 | |
Inovio Pharmaceuticals, Inc.(b) | | | 1,000 | | | | 5,830 | |
Intra-Cellular Therapies, Inc.(b) | | | 4,000 | | | | 62,360 | |
Iovance Biotherapeutics, Inc.(b) | | | 3,000 | | | | 23,325 | |
Jounce Therapeutics, Inc.(b) | | | 25,000 | | | | 350,000 | |
Juno Therapeutics, Inc.(b) | | | 2,500 | | | | 112,275 | |
La Jolla Pharmaceutical Co.(b) | | | 1,500 | | | | 51,540 | |
Mettler-Toledo International, Inc.(b) | | | 500 | | | | 341,315 | |
Neurocrine Biosciences, Inc.(b) | | | 3,000 | | | | 186,330 | |
Portola Pharmaceuticals, Inc.(b) | | | 3,500 | | | | 172,935 | |
Sage Therapeutics, Inc.(b) | | | 30,000 | | | | 1,898,400 | |
Sarepta Therapeutics, Inc.(b) | | | 12,500 | | | | 616,375 | |
Seattle Genetics, Inc.(b) | | | 7,000 | | | | 429,170 | |
Spark Therapeutics, Inc.(b) | | | 31,500 | | | | 2,548,350 | |
TESARO, Inc.(b) | | | 17,500 | | | | 2,025,975 | |
Ultragenyx Pharmaceutical, Inc.(b) | | | 500 | | | | 23,045 | |
Voyager Therapeutics, Inc.(b) | | | 15,500 | | | | 326,430 | |
Xencor, Inc.(b) | | | 1,500 | | | | 29,670 | |
| | | | | | | | 22,934,840 | |
Retailing—0.2% | | | | | | | | |
Pool Corp. | | | 1,500 | | | | 181,170 | |
Semiconductors & Semiconductor Equipment—9.8% | |
ams AG(a) | | | 10,500 | | | | 957,224 | |
Cavium, Inc.(b) | | | 6,500 | | | | 448,435 | |
Impinj, Inc.(b) | | | 9,500 | | | | 324,330 | |
Inphi Corp.(b) | | | 5,000 | | | | 204,900 | |
MACOM Technology Solutions Holdings, Inc.(b) | | | 500 | | | | 20,440 | |
NVIDIA Corp. | | | 24,000 | | | | 4,963,440 | |
Skyworks Solutions, Inc. | | | 500 | | | | 56,930 | |
Taiwan Semiconductor Manufacturing Co. Ltd.—ADR(a) | | | 500 | | | | 21,165 | |
Xilinx, Inc. | | | 9,000 | | | | 663,210 | |
| | | | | | | | 7,660,074 | |
Software & Services—31.6% | | | | | | | | |
Activision Blizzard, Inc. | | | 7,000 | | | | 458,430 | |
Adobe Systems, Inc.(b) | | | 7,500 | | | | 1,313,700 | |
Alibaba Group Holding Ltd.—ADR(a)(b) | | | 4,000 | | | | 739,560 | |
ANSYS, Inc.(b) | | | 1,000 | | | | 136,710 | |
Aspen Technology, Inc.(b) | | | 3,000 | | | | 193,560 | |
Baidu, Inc.—ADR(a)(b) | | | 2,000 | | | | 487,880 | |
Cadence Design Systems, Inc.(b) | | | 5,000 | | | | 215,800 | |
CoStar Group, Inc.(b) | | | 500 | | | | 147,875 | |
Electronic Arts, Inc.(b) | | | 4,000 | | | | 478,400 | |
EPAM Systems, Inc.(b) | | | 2,000 | | | | 182,300 | |
Euronet Worldwide, Inc.(b) | | | 2,000 | | | | 193,280 | |
Fair Isaac Corp. | | | 2,500 | | | | 362,900 | |
FleetCor Technologies, Inc.(b) | | | 1,500 | | | | 247,905 | |
The Accompanying Footnotes are an Integral Part of these Financial Statements.
The Tocqueville Opportunity Fund
Schedule of Investments as of October 31, 2017
| | | | | | | | |
| Common Stocks—96.8% | | Shares | | | Value | |
Fortinet, Inc.(b) | | | 3,500 | | | $ | 137,935 | |
Gartner, Inc.(b) | | | 1,000 | | | | 125,310 | |
Global Payments, Inc. | | | 3,500 | | | | 363,825 | |
Guidewire Software, Inc.(b) | | | 3,000 | | | | 239,940 | |
New Relic, Inc.(b) | | | 38,500 | | | | 1,976,205 | |
Nutanix, Inc.—Class A(b) | | | 31,000 | | | | 883,500 | |
Paycom Software, Inc.(b) | | | 15,000 | | | | 1,233,000 | |
Paylocity Holding Corp.(b) | | | 47,500 | | | | 2,536,975 | |
PayPal Holdings, Inc.(b) | | | 3,000 | | | | 217,680 | |
Pegasystems, Inc. | | | 1,500 | | | | 87,450 | |
Proofpoint, Inc.(b) | | | 13,600 | | | | 1,256,776 | |
PTC, Inc.(b) | | | 1,500 | | | | 99,675 | |
Red Hat, Inc.(b) | | | 4,000 | | | | 483,320 | |
salesforce.com, Inc.(b) | | | 7,500 | | | | 767,550 | |
ServiceNow, Inc.(b) | | | 24,000 | | | | 3,032,880 | |
Shopify, Inc.—Class A(a)(b) | | | 15,000 | | | | 1,492,350 | |
Splunk, Inc.(b) | | | 3,500 | | | | 235,550 | |
SS&C Technologies Holdings, Inc. | | | 2,000 | | | | 80,400 | |
Tableau Software, Inc.—Class A(b) | | | 5,000 | | | | 405,450 | |
Tencent Holdings Ltd.(b) | | | 2,500 | | | | 112,095 | |
The Ultimate Software Group, Inc.(b) | | | 600 | | | | 121,554 | |
Total System Services, Inc. | | | 2,000 | | | | 144,100 | |
Tyler Technologies, Inc.(b) | | | 1,500 | | | | 265,935 | |
Vantiv, Inc.—Class A(b) | | | 6,500 | | | | 455,000 | |
Wirecard AG(a) | | | 1,500 | | | | 147,732 | |
Workday, Inc.—Class A(b) | | | 22,000 | | | | 2,441,780 | |
Zillow Group, Inc.—Class A(b) | | | 1,000 | | | | 41,310 | |
| | | | | | | | 24,543,577 | |
Technology Hardware & Equipment—5.8% | |
Fabrinet(a)(b) | | | 3,500 | | | | 130,130 | |
II-VI, Inc.(b) | | | 11,000 | | | | 497,200 | |
Lumentum Holdings, Inc.(b) | | | 38,500 | | | | 2,431,275 | |
Oclaro, Inc.(b) | | | 55,000 | | | | 454,850 | |
Universal Display Corp. | | | 6,000 | | | | 879,000 | |
Viavi Solutions, Inc.(b) | | | 15,000 | | | | 139,200 | |
| | | | | | | | 4,531,655 | |
Transportation—0.3% | | | | | | | | |
Old Dominion Freight Line, Inc. | | | 800 | | | | 96,904 | |
XPO Logistics, Inc.(b) | | | 1,500 | | | | 104,025 | |
| | | | | | | | 200,929 | |
Total Common Stocks
(Cost $51,190,808) | | | | | | | 75,315,035 | |
Real Estate Investment Trusts (REITs)—0.1% | |
Real Estate—0.1% | | | | | | | | |
Digital Realty Trust, Inc. | | | 272 | | | | 32,216 | |
Equinix, Inc. | | | 1 | | | | 463 | |
Total Real Estate Investment Trusts
(Cost $30,400) | | | | 32,679 | |
Exchange-Traded Funds (ETFs)—1.8% | |
Funds, Trusts, and Other Financial Vehicles—1.8% | |
Direxion Daily S&P Oil & Gas Exp. & Prod. Bull 3X Shares | | | 7,500 | | | | 183,375 | |
Direxion Daily Semiconductors Bull 3x Shares | | | 4,000 | | | | 591,840 | |
Direxion Daily Financial Bull 3X Shares(b) | | | 10,500 | | | | 633,675 | |
Total Exchange-Traded Funds
(Cost $1,223,008) | | | | 1,408,890 | |
Right 0.0% | | | | | | | | |
Software & Services—0.0% | | | | | | | | |
Tencent Holdings Ltd.(a)(b) | | | 2 | | | | — | |
Total Right
(Cost $0) | | | | | | | — | |
Purchased Call
Options—2.4% | | Contracts | | | | |
Banks—1.2% | | | | | | | | |
Financial Select Sector SPDR Fund
Expiration: January 2018,
Exercise Price $26.00(b) | | | 5,500 | | | | 594,000 | |
SPDR S&P Regional Banking ETF
Expiration: January 2018,
Exercise Price $55.00(b) | | | 1,000 | | | | 351,000 | |
| | | | | | | | 945,000 | |
The Accompanying Footnotes are an Integral Part of these Financial Statements.
The Tocqueville Opportunity Fund
Schedule of Investments as of October 31, 2017
| | | | | | | | |
Purchased Call
Options—2.4% | | Contracts | | | Value | |
Retailing—0.1% | | | | | | | | |
JD.com, Inc.
Expiration: March 2018,
Exercise Price $40.00(b) | | | 375 | | | $ | 85,125 | |
Software & Services—0.3% | | | | | | | | |
Facebook, Inc.
Expiration: January 2018,
Exercise Price $175.00(b) | | | 200 | | | | 243,200 | |
Technology Hardware & Equipment—0.7% | |
Apple, Inc.
Expiration: November 2017,
Exercise Price $145.00(b) | | | 200 | | | | 481,000 | |
Finisar Corp.
Expiration: January 2018,
Exercise Price $28.00(b) | | | 400 | | | | 28,000 | |
| | | | | | | | 509,000 | |
Transportation—0.1% | | | | | | | | |
Spirit Airlines, Inc.
Expiration: January 2018,
Exercise Price $37.50(b) | | | 250 | | | | 63,125 | |
Total Purchased Call Options
(Cost $1,257,043) | | | | | | | 1,845,450 | |
Total Investments
(Cost $53,701,259)—101.1% | | | | 78,602,054 | |
Liabilities in Excess of Other Assets—(1.1)% | | | | | | | (828,572 | ) |
Total Net Assets—100.0% | | | | | | $ | 77,773,482 | |
| | | | | | | | |
Percentages are stated as a percent of net assets.
ADR American Depository Receipt
| (a) | Foreign issued security. Foreign concentration (including ADR’s) was as follows: Austria 1.2%; Canada 2.0%; Cayman Islands 1.9%; Denmark 2.2%; France 0.0%; Germany 0.2%; Hong Kong 0.0%; Ireland 0.2%; Japan 0.3%; Jersey 0.3%; Taiwan 0.0%. |
| (b) | Non-income producing security. |
The Accompanying Footnotes are an Integral Part of these Financial Statements.
The Tocqueville International Value Fund
Schedule of Investments as of October 31, 2017
| | | | | | | | |
| Common Stocks—85.6% | | Shares | | | Value | |
Australia—1.5% | |
BHP Billiton Ltd.—ADR | | | 404,500 | | | $ | 16,576,410 | |
Belgium—2.1% | | | | | | | | |
Groupe Bruxelles Lambert SA | | | 219,287 | | | | 23,552,895 | |
Brazil—1.5% | | | | | | | | |
Ambev SA—ADR | | | 2,676,000 | | | | 16,939,080 | |
Canada—1.5% | | | | | | | | |
Potash Corp of Saskatchewan, Inc. | | | 888,260 | | | | 17,294,422 | |
Denmark—2.3% | | | | | | | | |
ISS A/S | | | 604,100 | | | | 25,582,564 | |
Finland—1.4% | | | | | | | | |
Nokia OYJ—ADR | | | 3,232,900 | | | | 15,808,881 | |
France—14.9% | | | | | | | | |
Bollore SA | | | 4,730,329 | | | | 22,850,291 | |
Bureau Veritas SA | | | 850,148 | | | | 22,765,500 | |
Cie de Saint-Gobain | | | 358,088 | | | | 20,995,749 | |
IPSOS | | | 354,338 | | | | 13,096,107 | |
Publicis Groupe SA | | | 376,300 | | | | 24,494,436 | |
Sanofi | | | 269,366 | | | | 25,505,353 | |
Sopra Steria Group | | | 140,282 | | | | 26,316,765 | |
Zodiac Aerospace | | | 387,714 | | | | 11,081,956 | |
| | | | | | | | 167,106,157 | |
Germany—8.4% | | | | | | | | |
Bayer AG | | | 221,415 | | | | 28,801,425 | |
Infineon Technologies AG | | | 930,069 | | | | 25,723,891 | |
Siemens AG—ADR | | | 352,500 | | | | 25,387,050 | |
Wacker Neuson SE | | | 443,119 | | | | 14,432,910 | |
| | | | | | | | 94,345,276 | |
Hong Kong—1.4% | | | | | | | | |
Clear Media Ltd. | | | 13,155,100 | | | | 15,091,925 | |
Ireland—2.2% | | | | | | | | |
CRH PLC | | | 548,563 | | | | 20,643,493 | |
DCC PLC | | | 41,195 | | | | 3,906,645 | |
| | | | | | | | 24,550,138 | |
Japan—16.2% | | | | | | | | |
Amano Corp. | | | 1,009,400 | | | | 24,837,787 | |
FANUC Corp. | | | 123,570 | | | | 28,893,619 | |
Hitachi Ltd. | | | 3,737,440 | | | | 29,762,542 | |
Hoya Corp. | | | 266,600 | | | | 14,484,576 | |
Kao Corp. | | | 290,900 | | | | 17,580,584 | |
Makita Corp. | | | 525,000 | | | | 22,002,040 | |
Miraca Holdings, Inc. | | | 384,100 | | | | 17,871,021 | |
MISUMI Group, Inc. | | | 184,800 | | | | 5,063,068 | |
SMC Corp. | | | 29,515 | | | | 11,291,271 | |
Toho Co., Ltd. | | | 286,380 | | | | 9,488,148 | |
| | | | | | | | 181,274,656 | |
Netherlands—3.0% | | | | | | | | |
Akzo Nobel NV | | | 187,400 | | | | 16,918,637 | |
Unilever NV—ADR | | | 294,000 | | | | 17,040,240 | |
| | | | | | | | 33,958,877 | |
Netherlands Antilles—2.2% | |
Schlumberger Ltd. | | | 387,000 | | | | 24,768,000 | |
Republic of Korea—0.5% | |
KT&G Corp. | | | 60,000 | | | | 5,681,750 | |
Singapore—0.5% | | | | | | | | |
Global Logistic Properties Ltd. | | | 2,046,280 | | | | 4,984,481 | |
Spain—3.8% | | | | | | | | |
Applus Services SA | | | 1,862,330 | | | | 26,042,263 | |
Banco Santander SA | | | 2,477,400 | | | | 16,795,068 | |
| | | | | | | | 42,837,331 | |
Sweden—1.2% | | | | | | | | |
Telefonaktiebolaget LM Ericsson—Class B | | | 2,160,488 | | | | 13,596,124 | |
Switzerland—4.9% | | | | | | | | |
Credit Suisse Group AG—ADR | | | 1,023,900 | | | | 16,095,708 | |
Novartis AG—ADR | | | 286,600 | | | | 23,667,428 | |
UBS Group AG | | | 920,600 | | | | 15,659,406 | |
| | | | | | | | 55,422,542 | |
United Kingdom—13.1% | |
AVEVA Group PLC | | | 650,423 | | | | 21,790,759 | |
British American Tobacco PLC—ADR | | | 275,000 | | | | 17,710,000 | |
Countrywide PLC(a) | | | 4,489,021 | | | | 7,437,682 | |
Diageo PLC—ADR | | | 179,400 | | | | 24,579,594 | |
Lloyds Banking Group PLC | | | 17,707,412 | | | | 16,050,498 | |
The Accompanying Footnotes are an Integral Part of these Financial Statements.
The Tocqueville International Value Fund
Schedule of Investments as of October 31, 2017
| | | | | | | | |
| Common Stocks—85.6% | | Shares | | | Value | |
Royal Dutch Shell PLC—Class B—ADR | | | 376,500 | | | $ | 24,608,040 | |
Smiths Group PLC | | | 801,364 | | | | 16,721,107 | |
Travis Perkins PLC | | | 880,535 | | | | 17,776,064 | |
| | | | | | | | 146,673,744 | |
United States—3.0% | | | | | | | | |
Aflac, Inc. | | | 274,900 | | | | 23,061,361 | |
Boulevard Acquisition Corp. II(a) | | | 789,900 | | | | 7,899,000 | |
Oceaneering International, Inc. | | | 150,000 | | | | 3,033,000 | |
| | | | | | | | 33,993,361 | |
Total Common Stocks
(Cost $788,502,270) | | | | 960,038,614 | |
Preferred Stocks—4.3% | |
Brazil—1.6% | | | | | | | | |
Telefonica Brasil SA—ADR | | | 1,156,000 | | | | 17,802,400 | |
Republic of Korea—2.7% | |
Samsung Electronics Co., Ltd. | | | 15,200 | | | | 30,443,243 | |
Total Preferred Stocks
(Cost $32,877,094) | | | | 48,245,643 | |
Real Estate Investment Trust (REIT)—0.8% | |
Mexico—0.8% | | | | | | | | |
Fibra Uno Administracion SA de CV | | | 5,832,556 | | | | 9,151,136 | |
Total Real Estate Investment Trust
(Cost $9,811,461) | | | | 9,151,136 | |
Short-Term Investments—9.7% | | Shares | | | Value | |
Money Market Fund—5.0% | |
STIT-Treasury Portfolio—Institutional Class, 0.940%(b) | | | 55,400,000 | | | | 55,400,000 | |
Money Market
Deposit
Account—4.7% | | Principal
Amount | | | | |
U.S. Bank Money Market Deposit Account, 0.300%(c) | | $ | 53,136,198 | | | | 53,136,198 | |
Total Short-Term Investments
(Cost $108,536,198) | | | | 108,536,198 | |
Total Investments
(Cost $939,727,023)—100.4% | | | | 1,125,971,591 | |
Liabilities in Excess of Other Assets—(0.4)% | | | | (4,977,796 | ) |
Total Net Assets—100.0% | | | $ | 1,120,993,795 | |
| | | | | | | | |
Percentages are stated as a percent of net assets.
ADR American Depository Receipt
| (a) | Non-income producing security. |
| (b) | Rate listed is the 7-day effective yield. |
| (c) | Variable rate security. The rate listed is as of 10/31/2017. |
The Accompanying Footnotes are an Integral Part of these Financial Statements.
The Tocqueville Gold Fund
Schedule of Investments as of October 31, 2017
| | | | | | | | |
| Common Stocks—85.1% | | Shares | | | Value | |
Gold Related Securities—77.2% | |
Australia—7.1% | |
Evolution Mining Ltd. | | | 12,386,774 | | | $ | 22,373,343 | |
Independence Group NL | | | 4,576,400 | | | | 14,045,235 | |
Newcrest Mining Ltd. | | | 1,925,100 | | | | 33,018,385 | |
Northern Star Resources Ltd.(b) | | | 3,187,500 | | | | 12,734,484 | |
| | | | | | | | 82,171,447 | |
Canada—57.2% | |
Agnico Eagle Mines Ltd. | | | 412,573 | | | | 18,413,133 | |
Agnico Eagle Mines Ltd. | | | 526,485 | | | | 23,506,345 | |
Alacer Gold Corp.(b) | | | 4,091,800 | | | | 6,375,101 | |
Alamos Gold, Inc.—Class A | | | 5,419,000 | | | | 34,248,080 | |
Almaden Minerals Ltd.(b)(c) | | | 5,607,319 | | | | 5,693,813 | |
Almadex Minerals Ltd.(b) | | | 1,240,000 | | | | 1,095,729 | |
Argonaut Gold, Inc.(b)(c) | | | 2,837,000 | | | | 5,123,797 | |
ATAC Resources Ltd.(b)(c) | | | 9,784,891 | | | | 4,095,683 | |
AuRico Metals, Inc.(b)(c) | | | 7,411,437 | | | | 7,468,311 | |
B2Gold Corp.(b) | | | 13,130,700 | | | | 33,220,671 | |
Barkerville Gold Mines Ltd.(b) | | | 7,110,000 | | | | 4,243,625 | |
Corvus Gold, Inc.(b)(c) | | | 3,226,901 | | | | 3,112,346 | |
Corvus Gold, Inc.(a)(b)(c) | | | 13,030,000 | | | | 12,725,991 | |
Dalradian Resources, Inc.(b) | | | 8,154,000 | | | | 7,718,527 | |
Detour Gold Corp.(b) | | | 3,452,200 | | | | 36,793,853 | |
East Asia Minerals Corp.(b)(c) | | | 13,290,993 | | | | 1,081,741 | |
Falco Resources Ltd.(b)(c) | | | 16,222,300 | | | | 12,574,452 | |
Franco-Nevada Corp. | | | 844,900 | | | | 67,141,422 | |
GoGold Resources, Inc.(b)(c) | | | 13,668,000 | | | | 4,555,647 | |
Goldcorp, Inc. | | | 1,835,910 | | | | 23,978,826 | |
IAMGOLD Corp.(b) | | | 4,294,500 | | | | 23,576,805 | |
International Tower Hill Mines Ltd.(b)(c) | | | 5,738,836 | | | | 2,439,579 | |
International Tower Hill Mines Ltd.(a)(b)(c) | | | 20,331,298 | | | | 8,667,710 | |
Jaguar Mining, Inc.(b)(c) | | | 64,330,707 | | | | 15,956,768 | |
Kinross Gold Corp.(b) | | | 2,843,800 | | | | 11,233,010 | |
Novagold Resources, Inc.(b) | | | 3,264,300 | | | $ | 13,285,701 | |
NuLegacy Gold Corp.(b)(c) | | | 28,556,090 | | | | 3,984,261 | |
OceanaGold Corp. | | | 4,431,459 | | | | 11,964,939 | |
OceanaGold Corp.(a) | | | 6,649,600 | | | | 17,833,979 | |
Osisko Gold Royalties Ltd. | | | 3,184,740 | | | | 40,090,053 | |
Osisko Mining, Inc.(b)(c)(d)(e)
(Originally acquired 10/04/17, Cost $6,732,118) | | | 2,000,000 | | | | 5,955,507 | |
Osisko Mining, Inc.(b)(c) | | | 5,704,239 | | | | 17,420,899 | |
Pan American Silver Corp. | | | 3,154,298 | | | | 51,509,686 | |
Premier Gold Mines Ltd.(b)(c) | | | 9,643,160 | | | | 25,638,353 | |
Rockhaven Resources Ltd.(b) | | | 4,631,500 | | | | 502,605 | |
SEMAFO, Inc.(b)(c) | | | 11,467,000 | | | | 28,278,769 | |
Strategic Metals Ltd.(b)(c) | | | 10,113,400 | | | | 3,449,264 | |
Torex Gold Resources, Inc.(b)(c) | | | 2,366,950 | | | | 32,639,362 | |
Trifecta Gold Ltd.(b)(c) | | | 2,325,199 | | | | 234,304 | |
Wheaton Precious Metals Corp. | | | 1,561,075 | | | | 32,376,696 | |
| | | | | | | | 660,205,343 | |
Jersey—2.9% | |
Randgold Resources Ltd.—ADR | | | 334,400 | | | | 32,861,488 | |
United Kingdom—2.9% | |
Fresnillo PLC | | | 1,965,300 | | | | 33,984,840 | |
United States—7.1% | |
Contango ORE, Inc.(b)(c) | | | 263,200 | | | | 5,231,100 | |
The Accompanying Footnotes are an Integral Part of these Financial Statements.
The Tocqueville Gold Fund
Schedule of Investments as of October 31, 2017
| | | | | | | | |
| Common Stocks—85.1% | | Shares | | | Value | |
Electrum Ltd.(b)(d)(e)
(Originally acquired 12/21/07, Cost $13,065,361) | | | 2,127,287 | | | $ | 702,005 | |
Newmont Mining Corp. | | | 1,044,500 | | | | 37,769,120 | |
Royal Gold, Inc. | | | 449,600 | | | | 37,815,856 | |
| | | | | | | | 81,518,081 | |
Total Gold Related Securities | | | | 890,741,199 | |
Other Precious Metals Related Securities—7.2% | |
Canada—6.3% | | | | | | | | |
Bear Creek Mining Corp.(b)(c) | | | 7,413,200 | | | | 11,205,131 | |
Ivanhoe Mines Ltd.—Class A(b) | | | 7,882,379 | | | | 28,533,223 | |
MAG Silver Corp.(b)(c) | | | 2,827,100 | | | | 30,023,802 | |
Wellgreen Platinum Ltd.(b)(c)(d)(e)
(Originally acquired 08/04/17, Cost $2,544,342) | | | 12,379,201 | | | | 2,821,088 | |
| | | | | | | | 72,583,244 | |
United States—0.9% | |
Sunshine Mining & Refining (b)(d)(e)
(Originally acquired 03/15/11, Cost $21,353,108) | | | 2,300,212 | | | | 10,350,954 | |
Total Other Precious Metals Related Securities | | | | 82,934,198 | |
Other Securities—0.7% | |
United States—0.7% | |
Gold Bullion International LLC(b)(c)(d)(e)
(Originally acquired 05/12/10, Cost $5,000,000) | | | 5,000,000 | | | | 6,893,000 | |
I-Pulse, Inc.(b)(d)(e)
(Originally acquired 10/09/07, Cost $175,524) | | | 74,532 | | | | 640,975 | |
Total Other Securities | | | | 7,533,975 | |
Total Common Stocks
(Cost $1,106,762,700) | | | | 981,209,372 | |
| Private Fund—1.5% | | Shares | | | Value | |
Gold Related Securities—1.5% | |
Tocqueville Bullion Reserve LP(b)(c)(d)(e)
(Originally acquired 11/28/11, Cost $25,000,000) | | | 13,806 | | | | 16,978,176 | |
Total Private Fund
(Cost $25,000,000) | | | | 16,978,176 | |
Gold Bullion—13.2% | |
Gold Bullion(b) | | | 119,680 | | | | 152,121,074 | |
Total Gold Bullion
(Cost $70,975,248) | | | | 152,121,074 | |
Warrants—0.2% | |
Gold Related Securities—0.2% | |
Canada—0.2% | |
Almaden Minerals Ltd. Expiration: 08/08/2019,
Exercise Price: CAD $2.00(b)(c)(d)(e)
(Originally acquired 02/03/17, Cost $0) | | | 79,585 | | | | 22,887 | |
Almaden Minerals Ltd. Expiration: 11/11/2018,
Exercise Price: CAD $2.00(b)(c)(d)(e)
(Originally acquired 05/11/16, Cost $0) | | | 740,741 | | | | 104,557 | |
Almaden Minerals Ltd. Expiration: 11/17/2017,
Exercise Price: CAD $1.00(b)(c)(d)(e)
(Originally acquired 11/04/15, Cost $0) | | | 875,000 | | | | 211,883 | |
Barkerville Gold Mines Ltd. Expiration: 11/16/2018,
Exercise Price: CAD $1.30(b)(d)(e)
(Originally acquired 05/12/17, Cost $0) | | | 3,555,000 | | | | 18,463 | |
The Accompanying Footnotes are an Integral Part of these Financial Statements.
The Tocqueville Gold Fund
Schedule of Investments as of October 31, 2017
| | | | | | | | |
| Warrants—0.2% | | Shares | | | Value | |
East Asia Minerals Corp. Expiration: 03/08/2022,
Exercise Price: CAD $0.50(b)(c)(d)(e)
(Originally acquired 03/03/17, Cost $0) | | | 3,321,250 | | | $ | 270,313 | |
East Asia Minerals Corp. Expiration: 03/05/2020,
Exercise Price: CAD $0.50(b)(c)(d)(e)
(Originally acquired 03/04/15, Cost $0) | | | 4,617,560 | | | | 375,461 | |
East Asia Minerals Corp. Expiration: 12/05/2019,
Exercise Price: CAD $0.50(b)(c)(d)(e)
(Originally acquired 12/05/14, Cost $0) | | | 976,493 | | | | — | |
Falco Resources Ltd. Expiration: 05/22/2018,
Exercise Price: CAD $1.45(b)(c)(d)(e)
(Originally acquired 11/18/16, Cost $0) | | | 7,000,000 | | | | 475,854 | |
NuLegacy Gold Corp. Expiration: 04/12/2018,
Exercise Price: CAD $0.65(b)(c)(d)(e)
(Originally acquired 10/07/16, Cost $0) | | | 9,020,590 | | | | 2,797 | |
Osisko Gold Royalties Ltd. Expiration: 02/18/2022,
Exercise Price: CAD $36.50(b)
(Originally acquired 02/17/15, Cost $0) | | | 274,000 | | | | 535,214 | |
Trek Mining, Inc. Expiration: 04/16/2019,
Exercise Price: CAD $2.92(b)(d)(e)
(Originally acquired 04/03/14, Cost $0) | | | 150,000 | | | | 535 | |
Total Gold Related Securities | | | | 2,017,964 | |
Other Precious Metals Related Security—0.0% | |
Canada—0.0% | |
Wellgreen Platinum Ltd. Expiration: 08/08/2022,
Exercise Price: CAD $0.35(b)(c)(d)(e)
(Originally acquired 08/04/17, Cost $0) | | | 6,189,601 | | | | 892,864 | |
Total Warrants
(Cost $1) | | | | 2,910,828 | |
Total Investments
(Cost $1,202,737,949)—100.0% | | | | 1,153,219,450 | |
Other Assets in Excess of
Liabilities—0.0% | | | | 67,786 | |
Total Net Assets—100.0% | | | $ | 1,153,287,236 | |
| | | | | | | | |
Percentages are stated as a percent of net assets.
ADR American Depository Receipt
| (a) | Denotes an issue that is traded on a foreign exchange when a company is listed more than once. |
| (b) | Non-income producing security. |
| (c) | Affiliated company. See Footnote 8. |
| (d) | Denotes a security that is either fully or partially restricted to resale. The value of restricted securities as of October 31, 2017 was $46,717,319, which represented 4.1% of net assets. |
| (e) | Securities are fair valued using procedures approved by the Board of Trustees which includes significant unobservable inputs. The aggregate value of fair valued securities as of October 31, 2017 was $46,717,319, which represented 4.1% of net assets. |
The Accompanying Footnotes are an Integral Part of these Financial Statements.
The Delafield Fund
Schedule of Investments as of October 31, 2017
| | | | | | | | |
| Common Stocks—71.9% | | Shares | | | Value | |
Aerospace & Defense—1.7% | |
Ducommun, Inc.(a) | | | 190,000 | | | $ | 6,264,300 | |
Auto Components—3.1% | | | | | | | | |
Gentex Corp. | | | 200,000 | | | | 3,882,000 | |
Horizon Global Corp.(a) | | | 475,000 | | | | 7,709,250 | |
| | | | | | | | 11,591,250 | |
Chemicals—11.0% | | | | | | | | |
A Schulman, Inc. | | | 25,000 | | | | 982,500 | |
Eastman Chemical Co. | | | 150,000 | | | | 13,621,500 | |
GCP Applied Technologies, Inc.(a) | | | 120,000 | | | | 3,510,000 | |
HB Fuller Co. | | | 150,000 | | | | 8,530,500 | |
Minerals Technologies, Inc. | | | 85,000 | | | | 6,111,500 | |
PolyOne Corp. | | | 180,000 | | | | 8,292,600 | |
| | | | | | | | 41,048,600 | |
Commercial Services & Supplies—1.8% | |
Pitney Bowes, Inc. | | | 150,000 | | | | 2,061,000 | |
Team, Inc.(a) | | | 375,000 | | | | 4,612,500 | |
| | | | | | | | 6,673,500 | |
Communications Equipment—1.0% | |
Acacia Communications, Inc.(a) | | | 90,000 | | | | 3,807,900 | |
Construction & Engineering—0.8% | |
KBR, Inc. | | | 150,000 | | | | 2,944,500 | |
Construction and Engineering—1.6% | |
Aegion Corp.(a) | | | 255,000 | | | | 5,938,950 | |
Construction Materials—3.6% | |
U.S. Concrete, Inc.(a) | | | 170,000 | | | | 13,294,000 | |
Electronic Equipment, Instruments & Components—9.7% | |
Avnet, Inc. | | | 50,000 | | | | 1,990,000 | |
Fabrinet(a)(b) | | | 125,000 | | | | 4,647,500 | |
Flex Ltd.(a)(b) | | | 500,000 | | | | 8,900,000 | |
Plexus Corp.(a) | | | 70,000 | | | | 4,300,100 | |
TTM Technologies, Inc.(a) | | | 1,050,000 | | | | 16,569,000 | |
| | | | | | | | 36,406,600 | |
Energy Equipment & Services—1.9% | |
Aspen Aerogels, Inc.(a) | | | 600,000 | | | | 2,688,000 | |
McDermott International, Inc.(a)(b) | | | 350,000 | | | | 2,317,000 | |
Oceaneering International, Inc. | | | 100,000 | | | | 2,022,000 | |
| | | | | | | | 7,027,000 | |
Health Care Equipment & Supplies—2.3% | |
Abbott Laboratories | | | 55,000 | | | | 2,982,650 | |
Invacare Corp. | | | 365,000 | | | | 5,657,500 | |
| | | | | | | | 8,640,150 | |
Industrial Conglomerates—0.5% | |
General Electric Co. | | | 100,000 | | | | 2,016,000 | |
Internet Software & Services—1.3% | |
Cars.com, Inc.(a) | | | 196,666 | | | | 4,684,584 | |
Machinery—6.1% | | | | | | | | |
Barnes Group, Inc. | | | 90,000 | | | | 5,858,100 | |
Crane Co. | | | 75,000 | | | | 6,234,000 | |
Harsco Corp.(a) | | | 350,000 | | | | 7,437,500 | |
Xerium Technologies, Inc.(a)(c) | | | 700,000 | | | | 3,290,000 | |
| | | | | | | | 22,819,600 | |
Media—1.7% | |
TEGNA, Inc. | | | 525,000 | | | | 6,420,750 | |
Metals & Mining—0.8% | |
Real Industry, Inc.(a)(c) | | | 225,000 | | | | 393,750 | |
Schnitzer Steel Industries, Inc.—Class A | | | 90,000 | | | | 2,650,500 | |
| | | | | | | | 3,044,250 | |
Oil, Gas & Consumable Fuels—3.2% | |
Boardwalk Pipeline Partners LP | | | 475,000 | | | | 6,659,500 | |
Marathon Petroleum Corp. | | | 90,000 | | | | 5,376,600 | |
| | | | | | | | 12,036,100 | |
Professional Services—6.1% | |
Korn/Ferry International | | | 250,000 | | | | 10,457,500 | |
TrueBlue, Inc.(a) | | | 450,000 | | | | 12,195,000 | |
| | | | | | | | 22,652,500 | |
Specialty Retail—0.4% | |
Ascena Retail Group, Inc.(a) | | | 725,000 | | | | 1,406,500 | |
Technology Hardware, Storage & Peripherals—4.5% | |
Diebold Nixdorf, Inc. | | | 650,000 | | | | 12,545,000 | |
The Accompanying Footnotes are an Integral Part of these Financial Statements.
The Delafield Fund
Schedule of Investments as of October 31, 2017
| | | | | | | | |
Common
Stocks—71.9% | | Shares | | | Value | |
Hewlett Packard Enterprise Co. | | | 300,000 | | | $ | 4,176,000 | |
| | | | | | | | 16,721,000 | |
Textiles, Apparel & Luxury Goods—5.0% | |
G-III Apparel Group Ltd.(a) | | | 300,000 | | | | 7,602,000 | |
Hanesbrands, Inc. | | | 140,000 | | | | 3,150,000 | |
PVH Corp. | | | 47,000 | | | | 5,960,070 | |
Sequential Brands Group, Inc.(a) | | | 815,000 | | | | 2,119,000 | |
| | | | | | | | 18,831,070 | |
Trading Companies & Distributors—3.8% | |
Rush Enterprises, Inc.—Class A(a) | | | 110,000 | | | | 5,585,800 | |
WESCO International, Inc.(a) | | | 135,000 | | | | 8,525,250 | |
| | | | | | | | 14,111,050 | |
Total Common Stocks
(Cost $203,768,856) | | | | | | | 268,380,154 | |
Short-Term Investments—28.0% | |
Money Market Fund—5.0% | |
STIT-Treasury Portfolio—Institutional Class, 0.940%(d) | | | 18,600,000 | | | | 18,600,000 | |
Money Market Deposit
Account—23.0% | | Principal
Amount | | | Value | |
U.S. Bank Money Market Deposit Account, 0.300%(e) | | $ | 86,148,364 | | | | 86,148,364 | |
Total Short-Term Investments
(Cost $104,748,364) | | | | | | | 104,748,364 | |
Total Investments
(Cost $308,517,220)—99.9% | | | | 373,128,518 | |
Other Assets in Excess of Liabilities—0.1% | | | | 224,524 | |
Total Net Assets—100.0% | | | $ | 373,353,042 | |
| | | | | | | | |
Percentages are stated as a percent of net assets.
| (a) | Non-income producing security. |
| (b) | Foreign issued Security. Foreign Concentration (including ADR’s) was as follows: Cayman Islands 1.2%; Panama 0.6%; Singapore 2.4%. |
| (c) | Affiliated company. See Footnote 8. |
| (d) | Rate listed is the 7-day effective yield. |
| (e) | Variable rate security. The rate shown is as of 10/31/2017. |
The Accompanying Footnotes are an Integral Part of these Financial Statements.
The Tocqueville Select Fund
Schedule of Investments as of October 31, 2017
| | | | | | | | |
| Common Stocks—93.5% | | Shares | | | Value | |
Auto Components—9.6% | | | | | | | | |
Gentex Corp. | | | 108,000 | | | $ | 2,096,280 | |
Horizon Global Corp.(a) | | | 162,000 | | | | 2,629,260 | |
| | | | | | | | 4,725,540 | |
Chemicals—8.6% | | | | | | | | |
Eastman Chemical Co. | | | 23,700 | | | | 2,152,197 | |
Minerals Technologies, Inc. | | | 28,900 | | | | 2,077,910 | |
| | | | | | | | 4,230,107 | |
Commercial Services & Supplies—4.3% | |
Team, Inc.(a) | | | 171,800 | | | | 2,113,140 | |
Computers & Peripherals—3.5% | |
Diebold Nixdorf, Inc. | | | 90,000 | | | | 1,737,000 | |
Electronic Equipment, Instruments & Components—9.1% | |
Flex Ltd.(a)(b) | | | 122,700 | | | | 2,184,060 | |
TTM Technologies, Inc.(a) | | | 147,000 | | | | 2,319,660 | |
| | | | | | | | 4,503,720 | |
Internet Software & Services—8.3% | |
Cars.com, Inc.(a) | | | 65,733 | | | | 1,565,760 | |
j2 Global, Inc. | | | 34,400 | | | | 2,550,416 | |
| | | | | | | | 4,116,176 | |
IT Services—5.0% | | | | | | | | |
EPAM Systems, Inc.(a) | | | 27,400 | | | | 2,497,510 | |
Machinery—15.6% | | | | | | | | |
Dover Corp. | | | 20,700 | | | | 1,976,643 | |
Harsco Corp.(a) | | | 110,400 | | | | 2,346,000 | |
Stanley Black & Decker, Inc. | | | 13,300 | | | | 2,148,615 | |
Xerium Technologies, Inc.(a)(c) | | | 265,000 | | | | 1,245,500 | |
| | | | | | | | 7,716,758 | |
Media—3.4% | | | | | | | | |
TEGNA, Inc. | | | 136,000 | | | | 1,663,280 | |
Metals & Mining—3.1% | | | | | | | | |
Real Industry, Inc.(a)(c) | | | 890,281 | | | | 1,557,992 | |
Professional Services—10.7% | |
ICF International, Inc.(a) | | | 49,400 | | | | 2,652,780 | |
TrueBlue, Inc.(a) | | | 97,891 | | | | 2,652,846 | |
| | | | | | | | 5,305,626 | |
Specialty Retail—2.1% | | | | | | | | |
Pier 1 Imports, Inc. | | | 255,200 | | | | 1,061,632 | |
Textiles, Apparel & Luxury Goods—4.4% | |
G-III Apparel Group Ltd.(a) | | | 85,200 | | | | 2,158,968 | |
Trading Companies & Distributors—5.8% | |
WESCO International, Inc.(a) | | | 45,300 | | | | 2,860,695 | |
Total Common Stocks
(Cost $40,541,379) | | | | | | | 46,248,144 | |
Short-Term Investments—6.0% | | | | | |
Money Market Fund—4.8% | | | | | |
STIT-Treasury Portfolio—Institutional Class, 0.940%(d) | | | 2,400,000 | | | | 2,400,000 | |
Money Market Deposit
Account—1.2% | | Principal Amount | | | | |
U.S. Bank Money Market Deposit Account, 0.300%(e) | | $ | 579,279 | | | | 579,279 | |
Total Short-Term Investments
(Cost $2,979,279) | | | | | | | 2,979,279 | |
Total Investments
(Cost $43,520,658)—99.5% | | | | 49,227,423 | |
Other Assets in Excess of Liabilities—0.5% | | | | | | | 225,105 | |
Total Net Assets—100.0% | | | $ | 49,452,528 | |
| | | | | | | | |
Percentages are stated as a percent of net assets.
| (a) | Non-income producing security. |
| (b) | Foreign issued security. Foreign concentration was as follows: Singapore 4.4%. |
| (c) | Affiliated Company. See Footnote 8. |
| (d) | Rate listed is the 7-day effective yield. |
| (e) | Variable rate security. The rate listed is as of 10/31/2017. |
The Accompanying Footnotes are an Integral Part of these Financial Statements.
Percent of Total Investments
The Tocqueville Fund
Allocation of Portfolio Holdings
October 31, 2017

The Tocqueville Opportunity Fund
Allocation of Portfolio Holdings
October 31, 2017
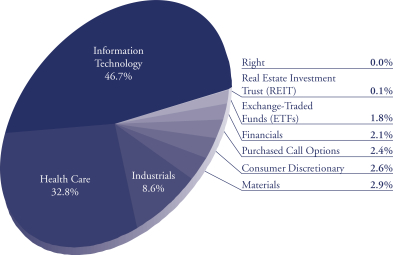
Percent of Total Investments
The Tocqueville International Value Fund
Allocation of Portfolio Holdings
October 31, 2017
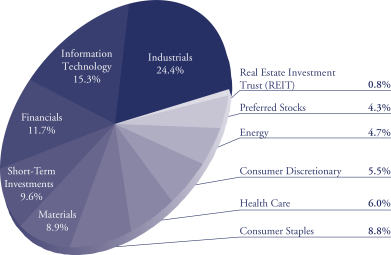
The Tocqueville Gold Fund
Allocation of Portfolio Holdings
October 31, 2017
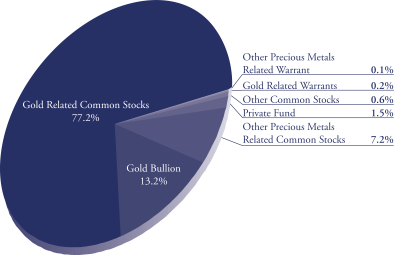
Percent of Total Investments
The Delafield Fund
Allocation of Portfolio Holdings
October 31, 2017
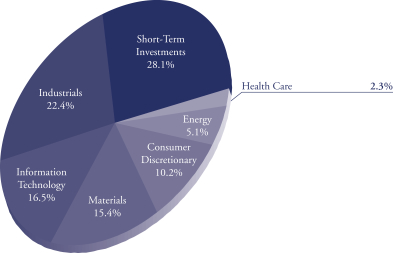
The Tocqueville Select Fund
Allocation of Portfolio Holdings
October 31, 2017
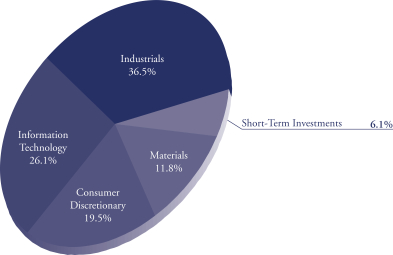
The Tocqueville Trust
Statements of Assets & Liabilities
October 31, 2017
| | | | | | | | | | | | |
| | | The
Tocqueville
Fund | | | The
Tocqueville
Opportunity
Fund | | | The
Tocqueville
International
Value Fund | |
Assets: | | | | | | | | | | | | |
Investments, at value (1) | | $ | 293,638,715 | | | $ | 78,602,054 | | | $ | 1,125,971,591 | |
Foreign currencies, at value (2) | | | — | | | | — | | | | 569,768 | |
Receivable for investments sold | | | 505,659 | | | | 747,546 | | | | — | |
Receivable for Fund shares sold | | | 120,560 | | | | 18,796 | | | | 3,437,294 | |
Receivable for foreign currencies sold | | | — | | | | — | | | | 23 | |
Dividends, interest and other receivables | | | 314,661 | | | | 3,343 | | | | 3,553,173 | |
Other assets | | | 15,105 | | | | 16,193 | | | | 47,131 | |
| | | | | | | | | | | | |
Total Assets | | | 294,594,700 | | | | 79,387,932 | | | | 1,133,578,980 | |
| | | | | | | | | | | | |
Liabilities: | | | | | | | | | | | | |
Payable for investments purchased | | | — | | | | 560,997 | | | | 10,498,185 | |
Payable for loans outstanding | | | 565,000 | | | | 551,000 | | | | — | |
Due to Custodian | | | 23,530 | | | | 395,929 | | | | — | |
Payable for Fund shares redeemed | | | 3,684 | | | | 1,188 | | | | 991,184 | |
Payable to Adviser (see Note 10) | | | 187,144 | | | | 42,820 | | | | 602,217 | |
Payable to Administrator | | | 46,140 | | | | 4,613 | | | | 165,639 | |
Payable to Trustees | | | 15,285 | | | | 4,450 | | | | 38,869 | |
Accrued distribution fee | | | 45,335 | | | | 11,098 | | | | 55,428 | |
Accrued expenses and other liabilities | | | 71,402 | | | | 42,355 | | | | 233,663 | |
| | | | | | | | | | | | |
Total Liabilities | | | 957,520 | | | | 1,614,450 | | | | 12,585,185 | |
| | | | | | | | | | | | |
Net Assets | | $ | 293,637,180 | | | $ | 77,773,482 | | | $ | 1,120,993,795 | |
| | | | | | | | | | | | |
Net assets consist of: | | | | | | | | | | | | |
Paid in capital | | $ | 120,882,982 | | | $ | 51,862,279 | | | $ | 925,555,802 | |
Accumulated net investment income (loss) | | | 2,189,663 | | | | (638,189 | ) | | | 5,919,191 | |
Accumulated net realized gain | | | 24,276,789 | | | | 1,648,622 | | | | 3,260,554 | |
Net unrealized appreciation on: | | | | | | | | | | | | |
Investments and foreign currency related items | | | 146,287,746 | | | | 24,900,770 | | | | 186,258,248 | |
| | | | | | | | | | | | |
Net assets | | $ | 293,637,180 | | | $ | 77,773,482 | | | $ | 1,120,993,795 | |
| | | | | | | | | | | | |
Shares of beneficial interest outstanding (unlimited shares of $0.01 par value authorized) | | | 7,607,072 | | | | 2,977,399 | | | | 63,772,356 | |
Net asset value, offering and redemption price per share | | $ | 38.60 | | | $ | 26.12 | | | $ | 17.58 | |
| | | | | | | | | | | | |
(1) Cost of investments | | $ | 147,351,010 | | | $ | 53,701,259 | | | $ | 939,727,023 | |
(2) Cost of foreign currencies | | $ | — | | | $ | — | | | $ | 565,468 | |
The Accompanying Notes are an Integral Part of these Financial Statements.
The Tocqueville Trust
Statements of Assets & Liabilities
October 31, 2017
| | | | | | | | | | | | |
| | | The
Tocqueville
Gold Fund | | | The
Delafield Fund | | | The
Tocqueville
Select Fund | |
Assets: | | | | | | | | | | | | |
Investments, at value (1) | | | | | | | | | | | | |
Unaffiliated issuers | | $ | 876,613,980 | | | $ | 369,444,768 | | | $ | 46,423,931 | |
Affiliated issuers | | | 276,605,470 | | | | 3,683,750 | | | | 2,803,492 | |
Foreign currencies, at value (2) | | | 1,053,981 | | | | — | | | | — | |
Receivable for investments sold | | | — | | | | 1,208,447 | | | | 268,901 | |
Receivable for Fund shares sold | | | 4,030,746 | | | | 35,382 | | | | 7,518 | |
Dividends, interest and other receivables | | | 1,326 | | | | 91,103 | | | | 19,825 | |
Other assets | | | 29,546 | | | | 11,507 | | | | 13,649 | |
| | | | | | | | | | | | |
Total Assets | | | 1,158,335,049 | | | | 374,474,957 | | | | 49,537,316 | |
| | | | | | | | | | | | |
Liabilities: | | | | | | | | | | | | |
Payable for loans outstanding | | | 409,000 | | | | — | | | | — | |
Due to Custodian | | | 33,362 | | | | — | | | | | |
Payable for Fund shares redeemed | | | 3,024,674 | | | | 622,158 | | | | 15,240 | |
Payable to Adviser (see Note 10) | | | 861,862 | | | | 244,356 | | | | 23,952 | |
Payable to Administrator | | | 173,505 | | | | 63,497 | | | | 7,822 | |
Payable to Trustees | | | 64,088 | | | | 21,614 | | | | 3,103 | |
Accrued distribution fee | | | 56,790 | | | | 38,059 | | | | 7,632 | |
Accrued expenses and other liabilities | | | 424,532 | | | | 132,231 | | | | 27,039 | |
| | | | | | | | | | | | |
Total Liabilities | | | 5,047,813 | | | | 1,121,915 | | | | 84,788 | |
| | | | | | | | | | | | |
Net Assets | | $ | 1,153,287,236 | | | $ | 373,353,042 | | | $ | 49,452,528 | |
| | | | | | | | | | | | |
Net assets consist of: | | | | | | | | | | | | |
Paid in capital | | $ | 1,612,325,854 | | | $ | 257,395,814 | | | $ | 42,859,264 | |
Accumulated net investment loss | | | (25,988,316 | ) | | | (619,614 | ) | | | (17,192 | ) |
Accumulated net realized gain (loss) | | | (383,513,621 | ) | | | 51,965,544 | | | | 903,691 | |
Net unrealized appreciation (depreciation) on: | | | | | | | | | | | | |
Investments and foreign currency related items | | | (49,536,681 | ) | | | 64,611,298 | | | | 5,706,765 | |
| | | | | | | | | | | | |
Net assets | | $ | 1,153,287,236 | | | $ | 373,353,042 | | | $ | 49,452,528 | |
| | | | | | | | | | | | |
Shares of beneficial interest outstanding (unlimited shares of $0.01 par value authorized) | | | 32,362,642 | | | | 14,139,560 | | | | 4,165,381 | |
Net asset value, offering and redemption price per share | | $ | 35.64 | | | $ | 26.40 | | | $ | 11.87 | |
| | | | | | | | | | | | |
(1) Cost of investments | | | | | | | | | | | | |
Unafilliated issuers | | $ | 775,391,768 | | | $ | 297,880,313 | | | $ | 36,584,733 | |
Affiliated issuers | | $ | 427,346,181 | | | $ | 10,636,907 | | | $ | 6,935,925 | |
(2) Cost of foreign currencies | | $ | 1,072,163 | | | $ | — | | | $ | — | |
The Accompanying Notes are an Integral Part of these Financial Statements.
The Tocqueville Trust
Statements of Operations
For the Year Ended October 31, 2017
| | | | | | | | | | | | |
| | | The
Tocqueville
Fund | | | The
Tocqueville
Opportunity
Fund | | | The
Tocqueville
International
Value Fund | |
Investment Income: | | | | | | | | | | | | |
Dividends* | | $ | 6,380,109 | | | $ | 262,412 | | | $ | 17,161,608 | |
Interest | | | 2,512 | | | | 178 | | | | 300,445 | |
| | | | | | | | | | | | |
Total investment income | | | 6,382,621 | | | | 262,590 | | | | 17,462,053 | |
| | | | | | | | | | | | |
Expenses: | | | | | | | | | | | | |
Investment Adviser’s fee (See Note 4) | | | 2,140,821 | | | | 592,529 | | | | 7,690,274 | |
Distribution fees (See Note 4) | | | 713,607 | | | | 197,509 | | | | 1,930,796 | |
Administration fees (See Note 4) | | | 428,164 | | | | 118,506 | | | | 1,082,697 | |
Transfer agent and shareholder services fees | | | 70,507 | | | | 18,401 | | | | 347,246 | |
Trustee fees and expenses | | | 60,357 | | | | 15,533 | | | | 145,900 | |
Legal fees | | | 44,262 | | | | 12,642 | | | | 104,790 | |
Fund accounting fees | | | 27,832 | | | | 19,400 | | | | 76,756 | |
Blue sky fees | | | 24,826 | | | | 25,772 | | | | 71,958 | |
Audit fees | | | 22,668 | | | | 12,060 | | | | 48,369 | |
Printing and mailing expense | | | 22,010 | | | | 6,827 | | | | 83,981 | |
Other expenses (See Note 10) | | | 17,910 | | | | 7,208 | | | | 76,820 | |
Interest expense | | | 15,622 | | | | 41,624 | | | | — | |
Custody fees | | | 14,456 | | | | 15,959 | | | | 150,934 | |
Insurance expense | | | 7,565 | | | | 2,925 | | | | 13,671 | |
Registration fees | | | 1,448 | | | | 1,486 | | | | 2,632 | |
| | | | | | | | | | | | |
Total expenses before waiver | | | 3,612,055 | | | | 1,088,381 | | | | 11,826,824 | |
Less: Fees waived (See Note 4) | | | (28,398 | ) | | | (59,209 | ) | | | (2,172,846 | ) |
| | | | | | | | | | | | |
Net expenses | | | 3,583,657 | | | | 1,029,172 | | | | 9,653,978 | |
| | | | | | | | | | | | |
Net Investment Income (Loss) | | | 2,798,964 | | | | (766,582 | ) | | | 7,808,075 | |
| | | | | | | | | | | | |
The Accompanying Notes are an Integral Part of these Financial Statements.
The Tocqueville Trust
Statements of Operations
For the Year Ended October 31, 2017
| | | | | | | | | | | | |
| | | The
Tocqueville
Fund | | | The
Tocqueville
Opportunity
Fund | | | The
Tocqueville
International
Value Fund | |
Realized and Unrealized Gain (Loss): | | | | | | | | | | | | |
Net realized gain (loss) on: | | | | | | | | | | | | |
Investments | | | 27,750,357 | | | | 7,319,536 | | | | 3,746,552 | |
Forward currency contracts | | | — | | | | — | | | | 1,817,315 | |
Foreign currency translation | | | 1 | �� | | | (1,532 | ) | | | (609,422 | ) |
| | | | | | | | | | | | |
| | | 27,750,358 | | | | 7,318,004 | | | | 4,954,445 | |
Net change in unrealized appreciation (depreciation) on: | | | | | | | | | | | | |
Investments | | | 23,747,017 | | | | 18,132,848 | | | | 130,984,854 | |
Forward currency contracts | | | — | | | | — | | | | (528,716 | ) |
Foreign currency translation | | | 74 | | | | 25,068 | | | | 20,470,379 | |
| | | | | | | | | | | | |
| | | 23,747,091 | | | | 18,157,916 | | | | 150,926,517 | |
| | | | | | | | | | | | |
Net gain on investments and foreign currency | | | 51,497,449 | | | | 25,475,920 | | | | 155,880,962 | |
| | | | | | | | | | | | |
Net Increase in Net Assets Resulting from Operations | | $ | 54,296,413 | | | $ | 24,709,338 | | | $ | 163,689,037 | |
| | | | | | | | | | | | |
* Net of foreign taxes withheld of: | | $ | 3,150 | | | $ | 1,230 | | | $ | 1,619,272 | |
| | | | | | | | | | | | |
The Accompanying Notes are an Integral Part of these Financial Statements.
The Tocqueville Trust
Statements of Operations
For the Year Ended October 31, 2017
| | | | | | | | | | | | |
| | | The
Tocqueville
Gold Fund | | | The
Delafield Fund | | | The
Tocqueville
Select Fund | |
Investment Income: | | | | | | | | | | | | |
Dividends* | | $ | 5,305,881 | | | $ | 2,733,434 | | | $ | 498,569 | |
Interest | | | 24,694 | | | | 292,375 | | | | 23,095 | |
| | | | | | | | | | | | |
Total investment income | | | 5,330,575 | | | | 3,025,809 | | | | 521,664 | |
| | | | | | | | | | | | |
Expenses: | | | | | | | | | | | | |
Investment Adviser’s fee (See Note 4) | | | 10,228,295 | | | | 3,105,406 | | | | 461,206 | |
Distribution fees (See Note 4) | | | 3,068,575 | | | | 993,469 | | | | 144,127 | |
Administration fees (See Note 4) | | | 1,652,916 | | | | 594,576 | | | | 86,476 | |
Transfer agent and shareholder services fees | | | 702,314 | | | | 150,301 | | | | 22,917 | |
Trustee fees and expenses | | | 239,936 | | | | 82,098 | | | | 11,408 | |
Legal fees | | | 228,548 | | | | 57,984 | | | | 8,812 | |
Fund accounting fees | | | 109,775 | | | | 37,845 | | | | 6,576 | |
Blue sky fees | | | 52,495 | | | | 27,916 | | | | 23,622 | |
Audit fees | | | 69,760 | | | | 28,606 | | | | 10,575 | |
Printing and mailing expense | | | 204,345 | | | | 51,579 | | | | 5,221 | |
Other expenses (See Note 10) | | | 80,637 | | | | 25,443 | | | | 3,815 | |
Interest expense | | | 23,066 | | | | — | | | | — | |
Custody fees | | | 262,700 | | | | 37,894 | | | | 3,518 | |
Insurance expense | | | 32,259 | | | | 8,672 | | | | 1,460 | |
Registration fees | | | 2,801 | | | | 347 | | | | 807 | |
| | | | | | | | | | | | |
Total expenses before waiver | | | 16,958,422 | | | | 5,202,136 | | | | 790,540 | |
Less: Fees waived (See Note 4) | | | — | | | | (234,792 | ) | | | (69,905 | ) |
| | | | | | | | | | | | |
Net expenses | | | 16,958,422 | | | | 4,967,344 | | | | 720,635 | |
| | | | | | | | | | | | |
Net Investment Loss | | | (11,627,847 | ) | | | (1,941,535 | ) | | | (198,971 | ) |
| | | | | | | | | | | | |
The Accompanying Notes are an Integral Part of these Financial Statements.
The Tocqueville Trust
Statements of Operations
For the Year Ended October 31, 2017
| | | | | | | | | | | | |
| | | The
Tocqueville
Gold Fund | | | The
Delafield Fund | | | The
Tocqueville
Select Fund | |
Realized and Unrealized Gain (Loss): | | | | | | | | | | | | |
Net realized gain (loss) on: | | | | | | | | | | | | |
Investments | | | | | | | | | | | | |
Unaffiliated issuers | | | (56,407,308 | ) | | | 64,678,175 | | | | 1,808,514 | |
Affililiated issuers | | | (6,371,414 | ) | | | (1,195,466 | ) | | | — | |
Forward currency contracts | | | — | | | | — | | | | — | |
Foreign currency translation | | | (170,549 | ) | | | — | | | | — | |
| | | | | | | | | | | | |
| | | (62,949,271 | ) | | | 63,482,709 | | | | 1,808,514 | |
Net change in unrealized appreciation (depreciation) on: | | | | | | | | | | | | |
Investments | | | (97,746,386 | ) | | | 9,477,267 | | | | 3,581,268 | |
Forward currency contracts | | | — | | | | — | | | | — | |
Foreign currency translation | | | 40,362,860 | | | | — | | | | — | |
| | | | | | | | | | | | |
| | | (57,383,526 | ) | | | 9,477,267 | | | | 3,581,268 | |
| | | | | | | | | | | | |
Net gain (loss) on investments and foreign currency | | | (120,332,797 | ) | | | 72,959,976 | | | | 5,389,782 | |
| | | | | | | | | | | | |
Net Increase (Decrease) in Net Assets Resulting from Operations | | $ | (131,960,644 | ) | | $ | 71,018,441 | | | $ | 5,190,811 | |
| | | | | | | | | | | | |
* Net of foreign taxes withheld of: | | $ | 512,096 | | | $ | 3,825 | | | $ | — | |
| | | | | | | | | | | | |
The Accompanying Notes are an Integral Part of these Financial Statements.
The Tocqueville Trust
Statements of Changes in Net Assets
| | | | | | | | | | | | | | | | | | | | | | | | |
| | | The Tocqueville Fund | | | The Tocqueville
Opportunity Fund | | | The Tocqueville
International Value Fund | |
| | | For the
Year Ended
October 31,
2017 | | | For the
Year Ended
October 31,
2016 | | | For the
Year Ended
October 31,
2017 | | | For the
Year Ended
October 31,
2016 | | | For the
Year Ended
October 31,
2017 | | | For the
Year Ended
October 31,
2016 | |
Operations: | | | | | | | | | | | | | | | | | | | | | | | | |
Net investment income (loss) | | $ | 2,798,964 | | | $ | 3,504,104 | | | $ | (766,582 | ) | | $ | (1,102,452 | ) | | $ | 7,808,075 | | | $ | 5,276,060 | |
Net realized gain (loss) on sale of investments and foreign currency | | | 27,750,358 | | | | 14,211,605 | | | | 7,318,004 | | | | (4,565,431 | ) | | | 4,954,445 | | | | 3,100,018 | |
Net change in unrealized appreciation (depreciation) | | | 23,747,091 | | | | (5,407,512 | ) | | | 18,157,916 | | | | (12,488,398 | ) | | | 150,926,517 | | | | 2,377,901 | |
| | | | | | | | | | | | | | | | | | | | | | | | |
Net increase (decrease) in net assets resulting from operations | | | 54,296,413 | | | | 12,308,197 | | | | 24,709,338 | | | | (18,156,281 | ) | | | 163,689,037 | | | | 10,753,979 | |
| | | | | | | | | | | | | | | | | | | | | | | | |
Dividends and distributions to shareholders: | | | | | | | | | | | | | | | | | | | | | | | | |
Net investment income | | | (3,191,286 | ) | | | (3,200,195 | ) | | | — | | | | — | | | | (5,348,368 | ) | | | (5,967,776 | ) |
Net realized gains | | | (12,245,533 | ) | | | (3,072,752 | ) | | | — | | | | — | | | | (2,913,833 | ) | | | (4,247,573 | ) |
| | | | | | | | | | | | | | | | | | | | | | | | |
Total dividends and distributions | | | (15,436,819 | ) | | | (6,272,947 | ) | | | — | | | | — | | | | (8,262,201 | ) | | | (10,215,349 | ) |
Fund share transactions: | | | | | | | | | | | | | | | | | | | | | | | | |
Shares sold | | | 20,393,861 | | | | 25,016,349 | | | | 7,604,183 | | | | 22,021,161 | | | | 603,434,286 | | | | 301,099,948 | |
Shares issued to holders in reinvestment of dividends | | | 14,742,846 | | | | 5,849,599 | | | | — | | | | — | | | | 7,212,804 | | | | 9,226,995 | |
Shares redeemed | | | (63,484,870 | ) | | | (63,042,445 | ) | | | (47,498,497 | ) | | | (64,362,409 | ) | | | (170,888,189 | ) | | | (118,819,277 | ) |
| | | | | | | | | | | | | | | | | | | | | | | | |
Net increase (decrease) | | | (28,348,163 | ) | | | (32,176,497 | ) | | | (39,894,314 | ) | | | (42,341,248 | ) | | | 439,758,901 | | | | 191,507,666 | |
| | | | | | | | | | | | | | | | | | | | | | | | |
Net increase (decrease) in net assets | | | 10,511,431 | | | | (26,141,247 | ) | | | (15,184,976 | ) | | | (60,497,529 | ) | | | 595,185,737 | | | | 192,046,296 | |
The Accompanying Notes are an Integral Part of these Financial Statements.
The Tocqueville Trust
Statements of Changes in Net Assets
| | | | | | | | | | | | | | | | | | | | | | | | |
| | | The Tocqueville Fund | | | The Tocqueville
Opportunity Fund | | | The Tocqueville
International Value Fund | |
| | | For the
Year Ended
October 31,
2017 | | | For the
Year Ended
October 31,
2016 | | | For the
Year Ended
October 31,
2017 | | | For the
Year Ended
October 31,
2016 | | | For the
Year Ended
October 31,
2017 | | | For the
Year Ended
October 31,
2016 | |
Net Assets: | | | | | | | | | | | | | | | | | | | | | | | | |
Beginning of year | | | 283,125,749 | | | | 309,266,996 | | | | 92,958,458 | | | | 153,455,987 | | | | 525,808,058 | | | | 333,761,762 | |
| | | | | | | | | | | | | | | | | | | | | | | | |
End of year* | | $ | 293,637,180 | | | $ | 283,125,749 | | | $ | 77,773,482 | | | $ | 92,958,458 | | | $ | 1,120,993,795 | | | $ | 525,808,058 | |
| | | | | | | | | | | | | | | | | | | | | | | | |
* Including undistributed net investment income (loss) of: | | $ | 2,189,663 | | | $ | 2,767,985 | | | $ | (638,189 | ) | | $ | (868,854 | ) | | $ | 5,919,191 | | | $ | 4,069,847 | |
| | | | | | | | | | | | | | | | | | | | | | | | |
The Accompanying Notes are an Integral Part of these Financial Statements.
The Tocqueville Trust
Statements of Changes in Net Assets
| | | | | | | | | | | | | | | | | | | | | | | | |
| | | The Tocqueville Gold Fund | | | The Delafield Fund | | | The Tocqueville Select Fund | |
| | | For the
Year Ended
October 31,
2017 | | | For the
Year Ended
October 31,
2016 | | | For the
Year Ended
October 31,
2017 | | | For the
Year Ended
October 31,
2016 | | | For the
Year Ended
October 31,
2017 | | | For the
Year Ended
October 31,
2016 | |
Operations: | | | | | | | | | | | | | | | | | | | | | | | | |
Net investment loss | | $ | (11,627,847 | ) | | $ | (11,183,827 | ) | | $ | (1,941,535 | ) | | $ | (1,567,530 | ) | | $ | (198,971 | ) | | $ | (300,067 | ) |
Net realized gain (loss) on sale of investments and foreign currency | | | (62,949,271 | ) | | | (197,265,554 | ) | | | 63,482,709 | | | | 91,740,571 | | | | 1,808,514 | | | | 3,638,104 | |
Net change in unrealized appreciation (depreciation) | | | (57,383,526 | ) | | | 694,885,236 | | | | 9,477,267 | | | | (99,178,781 | ) | | | 3,581,268 | | | | (5,616,215 | ) |
| | | | | | | | | | | | | | | | | | | | | | | | |
Net increase (decrease) in net assets resulting from operations | | | (131,960,644 | ) | | | 486,435,855 | | | | 71,018,441 | | | | (9,005,740 | ) | | | 5,190,811 | | | | (2,278,178 | ) |
| | | | | | | | | | | | | | | | | | | | | | | | |
Dividends and distributions to shareholders: | | | | | | | | | | | | | | | | | | | | | | | | |
Net investment income | | | — | | | | — | | | | — | | | | — | | | | — | | | | — | |
Net realized gains | | | — | | | | — | | | | (71,259,512 | ) | | | (62,285,610 | ) | | | (3,023,170 | ) | | | (2,573,589 | ) |
| | | | | | | | | | | | | | | | | | | | | | | | |
Total dividends and distributions | | | — | | | | — | | | | (71,259,512 | ) | | | (62,285,610 | ) | | | (3,023,170 | ) | | | (2,573,589 | ) |
Fund share transactions: | | | | | | | | | | | | | | | | | | | | | | | | |
Shares sold | | | 273,496,683 | | | | 424,034,799 | | | | 18,861,894 | | | | 36,427,575 | | | | 4,133,895 | | | | 4,929,975 | |
Shares issued to holders in reinvestment of dividends | | | — | | | | — | | | | 68,515,995 | | | | 59,082,717 | | | | 2,918,410 | | | | 2,508,581 | |
Shares redeemed* | | | (353,530,850 | ) | | | (492,555,310 | ) | | | (114,610,738 | ) | | | (297,916,569 | ) | | | (23,579,503 | ) | | | (20,587,532 | ) |
| | | | | | | | | | | | | | | | | | | | | | | | |
Net decrease | | | (80,034,167 | ) | | | (68,520,511 | ) | | | (27,232,849 | ) | | | (202,406,277 | ) | | | (16,527,198 | ) | | | (13,148,976 | ) |
| | | | | | | | | | | | | | | | | | | | | | | | |
Net increase (decrease) in net assets | | | (211,994,811 | ) | | | 417,915,344 | | | | (27,473,920 | ) | | | (273,697,627 | ) | | | (14,359,557 | ) | | | (18,000,743 | ) |
The Accompanying Notes are an Integral Part of these Financial Statements.
The Tocqueville Trust
Statements of Changes in Net Assets
| | | | | | | | | | | | | | | | | | | | | | | | |
| | | The Tocqueville Gold Fund | | | The Delafield Fund | | | The Tocqueville Select Fund | |
| | | For the
Year Ended
October 31,
2017 | | | For the
Year Ended
October 31,
2016 | | | For the
Year Ended
October 31,
2017 | | | For the
Year Ended
October 31,
2016 | | | For the
Year Ended
October 31,
2017 | | | For the
Year Ended
October 31,
2016 | |
Net Assets: | | | | | | | | | | | | | | | | | | | | | | | | |
Beginning of year | | | 1,365,282,047 | | | | 947,366,703 | | | | 400,826,962 | | | | 674,524,589 | | | | 63,812,085 | | | | 81,812,828 | |
| | | | | | | | | | | | | | | | | | | | | | | | |
End of year** | | $ | 1,153,287,236 | | | $ | 1,365,282,047 | | | $ | 373,353,042 | | | $ | 400,826,962 | | | $ | 49,452,528 | | | $ | 63,812,085 | |
| | | | | | | | | | | | | | | | | | | | | | | | |
* Net of redemption fees of: | | $ | 228,731 | | | $ | 324,599 | | | $ | — | | | $ | — | | | $ | — | | | $ | — | |
| | | | | | | | | | | | | | | | | | | | | | | | |
** Including undistributed net investment loss of: | | $ | (25,988,316 | ) | | $ | (16,401,790 | ) | | $ | (619,614 | ) | | $ | (2,131,051 | ) | | $ | (17,192 | ) | | $ | (253,567 | ) |
| | | | | | | | | | | | | | | | | | | | | | | | |
The Accompanying Notes are an Integral Part of these Financial Statements.
The Tocqueville Trust
Notes to Financial Statements
1. ORGANIZATION
The Tocqueville Trust (the “Trust”) is a Massachusetts business trust registered under the Investment Company Act of 1940 and organized on September 17, 1986, consisting of six separate funds (each, a “Fund” or, collectively, the “Funds”). Each Fund is an open-end management investment company with a different investment objective. The Tocqueville Fund, The Tocqueville Opportunity Fund (the “Opportunity Fund”), The Tocqueville International Value Fund (the “International Fund”), The Delafield Fund and The Tocqueville Select Fund (the “Select Fund”) are classified as diversified investment companies. The Tocqueville Gold Fund (the “Gold Fund”) is classified as a non-diversified investment company. The Tocqueville Fund’s investment objective is long-term capital appreciation which it seeks to achieve by investing primarily in securities of United States issuers. The Opportunity Fund’s investment objective is to achieve long-term capital appreciation which it seeks to achieve by investing in the common stocks of small and mid-cap companies which have the potential to deliver superior long term earnings growth. The International Fund’s investment objective is long-term capital appreciation consistent with preservation of capital which it seeks to achieve by investing primarily in securities of non-U.S. issuers. The Gold Fund’s investment objective is long-term capital appreciation which it seeks to achieve by investing in gold, securities of companies located throughout the world that are engaged in mining or processing gold (“gold related securities”), other precious metals and securities of companies located throughout the world that are engaged in mining or processing such other precious metals (“other precious metal securities”). The Delafield Fund’s investment objectives are to seek long-term preservation of capital (sufficient growth to outpace inflation over an extended period of time) and growth of capital which it seeks to achieve by investing primarily in the equity securities of domestic companies. The Tocqueville Select Fund’s investment objective is to achieve long-term capital appreciation by investing in a focused group of common stocks issued primarily by small and mid-sized U.S. companies. Current income is a secondary objective for The Tocqueville Select Fund.
The Delafield Fund, a series of the Trust, commenced operations on September 28, 2009 as successor to Delafield Fund, Inc. The predecessor Delafield Fund, Inc. commenced operations on November 19, 1993.
The Tocqueville Select Fund, a series of the Trust, commenced operations on September 28, 2009 as successor to the Delafield Select Fund, a series of Natixis Funds Trust II. The predecessor Delafield Select Fund commenced operations on September 29, 2008 for Class A and Class C shares and on September 26, 2008 for Class Y shares. Prior to September 29, 2008, the predecessor Delafield Select Fund operated as a Delaware limited partnership using substantially the same investment objectives and investment policies as the predecessor fund. The limited partnership was incepted in July 1998.
2. SIGNIFICANT ACCOUNTING POLICIES
The following is a summary of significant accounting principles followed by the Trust in the preparation of its financial statements.
a) Security valuation and security transactions
Investments in securities, including foreign securities, traded on an exchange or quoted on the over-the-counter market are valued at the last sale price or, if no sale occurred during the day, at the mean between closing bid and asked prices, as last reported by a pricing service approved by the Trustees. Securities that are principally traded on the National Association of Securities Dealers Automated Quotation National Market (“NASDAQ”) are generally valued at the NASDAQ Official Closing Price (“NOCP”). If there is no NASDAQ Official Closing Price for a NASDAQ-listed security or sale price available for an over-the-counter security, the mean of the latest bid and asked quotations from NASDAQ will be used. Investments in gold will be valued at the spot price of gold determined based on the mean of the last bid and asked price at the close of the New York Commodity Exchange. When market quotations for securities are not readily available, or when restricted securities or other assets are being valued, such assets are valued at fair value as determined in good faith by or under procedures approved by the Trustees. Money market funds are valued at market price. Money market deposit accounts are reflected at cost as this is a cash instrument. Fixed income securities are valued at market price. Fixed Income securities, such as corporate bonds, convertible bonds and U.S. government agency issues for which market quotations are not readily available may be valued based on information supplied by independent pricing services using matrix pricing formulas and/or independent broker bid quotations.
Trading in securities on foreign securities exchanges normally is completed before the calculation of the Funds’ net asset value. Trading on these foreign exchanges may not take place on all days on which there is regular trading on the New York Stock Exchange (“NYSE”), or may take place on days on which there is no regular trading on the NYSE. Similarly, the Funds may hold securities traded in domestic markets where the market may close early on a given day prior to calculation of the Funds’ net asset value. Events affecting the value of such securities held by the Funds that occur between the close of trading in the security and the close of trading on the NYSE normally will not be reflected in the Funds’ calculation of the net asset value. However, significant events will be closely monitored, and where it is determined that an adjustment should be made to the security’s value because significant interim events may materially affect the value of the security, the security will be priced at its fair value in accordance with the procedures approved by the Trustees.
Investment and shareholder transactions are recorded on trade date. Dividend income is recognized on the ex-dividend date. Interest income is recognized on an accrual basis and includes, where applicable, the amortization of premiums and accretion of discounts. Net realized gains and losses from sales of securities are determined on the specific identification cost method.
b) Restricted and illiquid securities
The Funds may invest in securities that are subject to legal or contractual restrictions on resale or are illiquid. A security may be considered illiquid if it lacks a readily available market or if its valuation has not changed for a certain period of time. Disposal of these securities may involve time consuming negotiations and expense, and a prompt sale at the current valuation may be difficult.
c) Fair Valuation Measurements
The Trust has adopted authoritative fair valuation accounting standards which establish an authoritative definition of fair value and set out a hierarchy for measuring fair value. These standards require additional disclosures about the various inputs and valuation techniques used to develop the measurements of fair value and a discussion in changes in valuation techniques and related inputs during the year. These inputs are summarized in the three broad levels listed below.
| | Level 1 - Quoted | prices in active markets for identical securities. |
| | Level 2 - Other | significant observable inputs (including quoted prices for similar securities, interest rates, prepayment speeds, credit risk, etc.). |
| | Level 3 - Significant | unobservable inputs (including the Fund’s own assumptions in determining the fair value of investments). |
When using the market quotations or closing price provided by the pricing service for equity investments, including common stocks, preferred stocks, foreign issued common stocks, exchange-traded funds, closed end mutual funds and real estate investment trusts, which are traded on an exchange are valued at the last sale price reported by the exchange on which the securities are primarily traded on the day of valuation and when the market is considered active, the security will be classified as a Level 1 security. When using the mean between the latest bid and ask price, the security will be classified as Level 2. Common stocks of the International Value Fund that are traded on non-North American exchanges are generally valued using matrix pricing formulas provided by an independent pricing service. These securities will be classified as Level 2 securities. When matrix pricing formulas are not available and fair valuation is not applied, the use of closing prices provided by the primary source of the funds will be used. These will be classified as Level 1 securities. Gold bullion is valued at the mean of the closing bid and ask prices from the New York Mercantile Exchange and is classified as a Level 2.
Investment in mutual funds, including money market funds, are generally priced at the ending net asset value (NAV) provided by the service agent of the funds and will be classified as Level 1 securities.
Debt securities, such as corporate bonds, convertible bonds, commercial paper, money market deposit accounts and U.S. government agency issues for which market quotations are not readily available may be valued based on information supplied by independent pricing
services using matrix pricing formulas and/or independent broker bid quotations and are classified as Level 2. Warrants and rights for which the underlying security is registered and equities which are subject to a required holding period, but have a comparable public issue, are valued in good faith by the adviser pursuant to procedures established under the general supervision and responsibility of the Funds’ Board of Trustees. These securities will generally be classified as Level 2 securities. If the warrant or right is exchange traded and the official closing price of the exchange is used, these instruments are classified as Level 1 securities. Forward currency contracts derive their value from the underlying currency prices. These are valued by a pricing service using pricing models. The models use inputs that are observed from active markets, such as exchange rates. These contracts are classified as Level 2. Options can diverge from the prices of their underlying instruments. These are valued at the composite last price reported by the exchange on which the options are primarily traded on the day of the valuation and are classified as Level 1. If there is no composite last price on a given day the mean between the latest bid and ask price will be used. These contracts are classified as Level 2.
Any securities or other assets for which market quotations are not readily available are valued at fair value as determined in good faith by the Adviser pursuant to procedures established under the general supervision and responsibility of the Funds’ Board of Trustees and will be classified as Level 3 securities. In determining fair value, a Fund will seek to assign a value to the security which it believes represents the amount that the Fund could reasonably expect to receive upon its current sale. With respect to securities that are actively traded on U.S. exchanges, the Funds expect that market quotations will generally be available and that fair value might be used only in limited circumstances, such as when trading for a security is halted during the trading day.
For securities traded principally on foreign exchanges, the Funds may use fair value pricing if an event occurs after the close of trading of the principal foreign exchange on which a security is traded, but before calculation of a Fund’s NAV, which a Fund believes affects the value of the security since its last market quotation. Such events may involve situations relating to a single issuer (such as news related to the issuer announced after the close of the principal foreign exchange), or situations relating to sectors of the market or the markets in general (such as significant fluctuations in the U.S. or foreign markets or significant changes in exchange rates, natural disasters, armed conflicts, or governmental actions).
In determining whether a significant event has occurred with respect to securities traded principally in foreign markets, the Funds may engage a third party fair value service provider to systematically recommend the adjustment of closing market prices of non-U.S. securities based upon changes in a designated U.S. securities market index occurring from the time of close of the relevant foreign market and the close of the NYSE. Fair value pricing may also be used to value restricted securities held by the Funds or securities with little or no trading activity for extended periods of time. Fair value pricing involves judgments that are inherently subjective and inexact and it is not possible to determine with certainty when, and to what extent, an event will affect a market price. As a result, there can be no assurance that fair value pricing will reflect actual market value
and it is possible that the fair value determined for a security may differ materially from the value that could be realized upon the sale of the security.
The following is a summary of the inputs used, as of October 31, 2017, involving the Funds’ assets and liabilities carried at fair value. The inputs of methodology used for valuing securities may not be an indication of the risk associated with investing in those securities.
| | | | | | | | | | | | | | | | |
| Description | | Level 1 | | | Level 2 | | | Level 3 | | | Total | |
The Tocqueville Fund | | | | | | | | | | | | | | | | |
Assets | | | | | | | | | | | | | | | | |
Common Stocks* | | $ | 281,926,115 | | | $ | — | | | $ | — | | | $ | 281,926,115 | |
Preferred Stock* | | | — | | | | — | | | | 1,600 | | | | 1,600 | |
Real Estate Investment Trust (REIT)* | | | 7,182,000 | | | | — | | | | — | | | | 7,182,000 | |
Exchange-Traded Fund (ETF)* | | | 3,167,000 | | | | — | | | | — | | | | 3,167,000 | |
Government Security* | | | 1,362,000 | | | | — | | | | — | | | | 1,362,000 | |
| | | | | | | | | | | | | | | | |
Total Assets | | $ | 293,637,115 | | | $ | — | | | $ | 1,600 | | | $ | 293,638,715 | |
| | | | | | | | | | | | | | | | |
| | | | |
| The Tocqueville Opportunity Fund | | Level 1 | | | Level 2 | | | Level 3 | | | Total | |
Assets | | | | | | | | | | | | | | | | |
Common Stocks* | | $ | 75,315,035 | | | $ | — | | | $ | — | | | $ | 75,315,035 | |
Real Estate Investment Trusts (REITs)* | | | 32,679 | | | | — | | | | — | | | | 32,679 | |
Exchange-Traded Funds (ETFs)* | | | 1,408,890 | | | | — | | | | — | | | | 1,408,890 | |
Purchased Call Options | | | | | | | | | | | | | | | | |
Banks | | | 945,000 | | | | — | | | | — | | | | 945,000 | |
Retailing | | | 85,125 | | | | — | | | | — | | | | 85,125 | |
Software & Services | | | 243,200 | | | | — | | | | — | | | | 243,200 | |
Technology Hardware & Equipment | | | 481,000 | | | | 28,000 | | | | — | | | | 509,000 | |
Transportation | | | — | | | | 63,125 | | | | — | | | | 63,125 | |
| | | | | | | | | | | | | | | | |
Total Purchased Call Options | | | 1,754,325 | | | | 91,125 | | | | — | | | | 1,845,450 | |
| | | | | | | | | | | | | | | | |
Total Assets | | $ | 78,510,929 | | | $ | 91,125 | | | $ | — | | | $ | 78,602,054 | |
| | | | | | | | | | | | | | | | |
| | | | | | | | | | | | | | | | |
The Tocqueville International Value
Fund | | Level 1 | | | Level 2 | | | Level 3 | | | Total | |
Assets | | | | | | | | | | | | | | | | |
Common Stocks | | | | | | | | | | | | | | | | |
Australia | | $ | 16,576,410 | | | $ | — | | | $ | — | | | $ | 16,576,410 | |
Belgium | | | — | | | | 23,552,895 | | | | — | | | | 23,552,895 | |
Brazil | | | 16,939,080 | | | | — | | | | — | | | | 16,939,080 | |
Canada | | | 17,294,422 | | | | — | | | | — | | | | 17,294,422 | |
Denmark | | | — | | | | 25,582,564 | | | | — | | | | 25,582,564 | |
Finland | | | 15,808,881 | | | | — | | | | — | | | | 15,808,881 | |
France | | | 26,316,765 | | | | 140,789,392 | | | | — | | | | 167,106,157 | |
Germany | | | 25,387,050 | | | | 68,958,226 | | | | — | | | | 94,345,276 | |
Hong Kong | | | 15,091,925 | | | | — | | | | — | | | | 15,091,925 | |
Ireland | | | — | | | | 24,550,138 | | | | — | | | | 24,550,138 | |
Japan | | | — | | | | 181,274,656 | | | | — | | | | 181,274,656 | |
Netherlands | | | 17,040,240 | | | | 16,918,637 | | | | — | | | | 33,958,877 | |
Netherlands Antilles | | | 24,768,000 | | | | — | | | | — | | | | 24,768,000 | |
Republic of Korea | | | — | | | | 5,681,750 | | | | — | | | | 5,681,750 | |
Singapore | | | — | | | | 4,984,481 | | | | — | | | | 4,984,481 | |
Spain | | | — | | | | 42,837,331 | | | | — | | | | 42,837,331 | |
Sweden | | | — | | | | 13,596,124 | | | | — | | | | 13,596,124 | |
Switzerland | | | 55,422,542 | | | | — | | | | — | | | | 55,422,542 | |
United Kingdom | | | 92,111,380 | | | | 54,562,364 | | | | — | | | | 146,673,744 | |
United States | | | 33,993,361 | | | | — | | | | — | | | | 33,993,361 | |
| | | | | | | | | | | | | | | | |
Total Common Stocks | | | 356,750,056 | | | | 603,288,558 | | | | — | | | | 960,038,614 | |
Preferred Stocks | | | | | | | | | | | | | | | | |
Brazil | | | 17,802,400 | | | | — | | | | — | | | | 17,802,400 | |
Republic of Korea | | | — | | | | 30,443,243 | | | | — | | | | 30,443,243 | |
| | | | | | | | | | | | | | | | |
Total Preferred Stocks | | | 17,802,400 | | | | 30,443,243 | | | | — | | | | 48,245,643 | |
Real Estate Investment Trust (REIT)* | | | 9,151,136 | | | | — | | | | — | | | | 9,151,136 | |
Money Market Fund | | | 55,400,000 | | | | — | | | | — | | | | 55,400,000 | |
Money Market Deposit Account | | | — | | | | 53,136,198 | | | | — | | | | 53,136,198 | |
| | | | | | | | | | | | | | | | |
Total Assets | | $ | 439,103,592 | | | $ | 686,867,999 | | | $ | — | | | $ | 1,125,971,591 | |
| | | | | | | | | | | | | | | | |
| | | | |
| The Tocqueville Gold Fund | | Level 1 | | | Level 2 | | | Level 3 | | | Total | |
Assets | | | | | | | | | | | | | | | | |
Common Stocks | | | | | | | | | | | | | | | | |
Gold Related | | $ | 878,852,587 | | | $ | 11,186,607 | | | $ | 702,005 | | | $ | 890,741,199 | |
Other Precious Metals Related | | | 69,762,156 | | | | 2,821,088 | | | | 10,350,954 | | | | 82,934,198 | |
Other | | | — | | | | — | | | | 7,533,975 | | | | 7,533,975 | |
| | | | | | | | | | | | | | | | |
Total Common Stocks | | | 948,614,743 | | | | 14,007,695 | | | | 18,586,934 | | | | 981,209,372 | |
Private Fund** ^ | | | — | | | | — | | | | — | | | | 16,978,176 | |
Gold Bullion* | | | — | | | | 152,121,074 | | | | — | | | | 152,121,074 | |
Warrants | | | | | | | | | | | | | | | | |
Gold Related | | | 535,214 | | | | 1,482,750 | | | | — | | | | 2,017,964 | |
Other Precious Metals Related | | | — | | | | 892,864 | | | | — | | | | 892,864 | |
| | | | | | | | | | | | | | | | |
Total Warrants | | | 535,214 | | | | 2,375,614 | | | | — | | | | 2,910,828 | |
| | | | | | | | | | | | | | | | |
Total Assets | | $ | 949,149,957 | | | $ | 168,504,383 | | | $ | 18,586,934 | | | $ | 1,153,219,450 | |
| | | | | | | | | | | | | | | | |
| | | | | | | | | | | | | | | | |
| The Delafield Fund | | Level 1 | | | Level 2 | | | Level 3 | | | Total | |
Assets | | | | | | | | | | | | | | | | |
Common Stocks* | | $ | 268,380,154 | | | $ | — | | | $ | — | | | $ | 268,380,154 | |
Money Market Fund | | | 18,600,000 | | | | — | | | | — | | | | 18,600,000 | |
Money Market Deposit Account | | | — | | | | 86,148,364 | | | | — | | | | 86,148,364 | |
| | | | | | | | | | | | | | | | |
Total Assets | | $ | 286,980,154 | | | $ | 86,148,364 | | | $ | — | | | $ | 373,128,518 | |
| | | | | | | | | | | | | | | | |
| | | | |
| The Tocqueville Select Fund | | Level 1 | | | Level 2 | | | Level 3 | | | Total | |
Assets | | | | | | | | | | | | | | | | |
Common Stocks* | | $ | 46,248,144 | | | $ | — | | | $ | — | | | $ | 46,248,144 | |
Money Market Fund | | | 2,400,000 | | | | — | | | | — | | | | 2,400,000 | |
Money Market Deposit Account | | | — | | | | 579,279 | | | | — | | | | 579,279 | |
| | | | | | | | | | | | | | | | |
Total Assets | | $ | 48,648,144 | | | $ | 579,279 | | | $ | — | | | $ | 49,227,423 | |
| | | | | | | | | | | | | | | | |
| * | For further information regarding portfolio characteristics, please see the accompanying Schedules of Investments. |
| ** | Certain investments that are measured at fair value using the net asset value per share (or its equivalent) practical expedient have not been categorized in the fair value hierarchy. The fair value amounts presented in the table are intended to permit reconciliation of the fair value hierarchy to the amounts presented in the Statement of Assets and Liabilities. |
| ^ | The Gold Fund currently invests in a private fund that primarily invests in physical gold and is subject to redemption restrictions. This private fund investment can only be disposed of with notice given 24 hours in advance of redemption. |
Below is a reconciliation that details the transfer of securities between Level 1 and Level 2 during the reporting year:
| | | | | | | | |
| | | The
Tocqueville
International
Value Fund | | | The
Tocqueville
Gold Fund | |
Transfers Into Level 1 | | $ | 20,646,448 | | | $ | 525,289 | |
Transfers Out of Level 1 | | | — | | | | — | |
| | | | | | | | |
Net Transfers Into/(Out of ) Level 1 | | | 20,646,448 | | | | 525,289 | |
| | | | | | | | |
Transfers Into Level 2 | | | — | | | | — | |
Transfers Out of Level 2 | | | (20,646,448 | ) | | | (525,289 | ) |
| | | | | | | | |
Net Transfers Into/(Out of ) Level 2 | | $ | (20,646,448 | ) | | $ | (525,289 | ) |
| | | | | | | | |
Below is a reconciliation that details the activity of securities in Level 3 during the current fiscal year:
| | | | | | | | |
| | | The
Tocqueville
Fund | | | The
Tocqueville
Gold Fund | |
Beginning Balance—November 1, 2016 | | $ | 1,600 | | | $ | 30,223,082 | |
Purchases | | | — | | | | 3,000,001 | |
Sales | | | — | | | | — | |
Realized gains | | | — | | | | — | |
Realized losses | | | — | | | | — | |
Change in unrealized appreciation | | | — | | | | 2,342,027 | |
Transfers in/(out) of Level 3 | | | — | | | | (16,978,176 | ) |
| | | | | | | | |
Ending Balance—October 31, 2017 | | $ | 1,600 | | | $ | 18,586,934 | |
| | | | | | | | |
The movement from Level 2 to Level 1 in the International Value Fund was due to the use of closing prices provided by the primary pricing source of the funds. The movement from Level 2 to Level 1 in the Gold Fund was due to the market quotations or closing prices provided by the pricing services because the market was considered active. There were no transfers between levels in The Tocqueville Fund, The Delafield Fund or The Select Fund. Transfers between levels are recognized at the end of the reporting year.
The movement out of Level 3 in the Gold Fund was due to the Private Fund held, which is measured at fair value using the net asset value per share (or its equivalent) practical expedient, no longer being categorized in the fair value hierarchy.
As of October 31, 2017, the change in unrealized appreciation on positions still held in the Tocqueville Gold Fund was $2,342,027.
| | | | | | | | | | | | | | |
Fund | | Type of
Security | | Industry | | Fair
Value at
10/31/2017 | | | Valuation
Techniques | | Unobservable
Inputs | | Range |
The Tocqueville Fund | | Preferred Stock | | Health Care
Equipment &
Supplies | | | $ 1,600 | | | Latest company valuation | | Financing
prices | | $0.004 |
The Tocqueville Gold Fund | | Common Stock | | Gold Related | | | $ 702,005 | | | Latest company valuation | | Financing
prices | | $0.33 |
| | | | Other
Precious
Metals
Related | | | 10,350,954 | | | Latest company financing price | | Financing
prices | | $4.50 |
| | | | Other | | | 7,533,975 | | | Latest company financing price | | Financing
prices | | $1.38-$8.60 |
The significant unobservable inputs used in the fair value measurement of the Tocqueville Fund’s preferred stock and the Gold Fund’s common stocks are the most recent financing prices of the portfolio company, which approximate the companies’ value in the market place.
Significant changes in the companies’ ability to receive financing for new projects in the future would be an indication of the companies’ financial position and market value.
The Trust’s valuation procedures have been adopted by the Trust’s Board of Trustees, which has established a Valuation Committee to oversee the valuation process. The Valuation Committee meets on an as needed basis to evaluate changes in the valuation of portfolio securities. The full findings and valuations are then reviewed quarterly by the Independent Trustees.
Derivative Instruments and Hedging Activities
The Funds’ Adviser may use derivative instruments, such as options and forward currency contracts, as a means to manage exposure to different types of risk, including market risk and exchange rate risk, and to gain exposure to underlying securities. The Trust has adopted disclosure standards in order to enable the investor to understand how and why an entity used derivatives, how derivatives are accounted for, and how derivatives affect an entity’s results of operations and financial position.
In the Opportunity Fund, the Adviser used options to gain exposure to the underlying equity security. In the International Value Fund, the Adviser used forward currency contracts to adjust exposure to foreign exchange rate risk.
Balance Sheet—Values of Derivative Instruments as of October 31, 2017.
The Tocqueville Opportunity Fund
| | | | | | | | | | | | |
| | | Asset Derivatives | | | Liability Derivatives | |
Derivatives not accounted for as hedging
instruments | | Balance Sheet
Location | | Value | | | Balance Sheet
Location | | Value | |
Purchased Options | | Investments,
at Value | | $ | 1,845,450 | | | | | $ | — | |
| | | | | | | | | | | | |
Total | | | | $ | 1,845,450 | | | | | $ | — | |
| | | | | | | | | | | | |
The Effect of Derivative Instruments on the Statement of Operations for the year ended October 31, 2017.
The Tocqueville Opportunity Fund
| | | | | | |
| | | Net Realized
Loss on Investments | | Net Change in
Unrealized
Appreciation on
Investments | |
Purchased Options | | $(335,944) | | $ | 811,270 | |
| | | | | | |
Total | | $(335,944) | | $ | 811,270 | |
| | | | | | |
The Tocqueville International Value Fund
| | | | | | |
| | | Net Realized
Gain on Forward
Currency Contracts | | Net Change in
Unrealized
Depreciation on
Forward Currency
Contracts | |
Foreign Currency Forward Contracts | | $1,817,315 | | $ | (528,716 | ) |
| | | | | | |
Total | | $1,817,315 | | $ | (528,716 | ) |
| | | | | | |
Derivatives Risk
The risks of using the types of derivatives in which the Funds may engage include the risk that movements in the value of the derivative may not fully offset or complement instruments currently held in the Funds in the manner intended by the Adviser; the risk that the counterparty to a derivative contract may fail to comply with their obligations to the Fund; the risk that the derivative may not possess a liquid secondary market at a time when the Fund would look to disengage the position; the risk that additional capital from the Fund may be called upon to fulfill the conditions of the derivative contract; and the risk that the cost of the derivative contracts may reduce the overall returns experienced by the Funds. The measurement of risks associated with these instruments is meaningful only when all related offsetting transactions are considered. The use of options and forward currency contracts do not create leverage in the Funds.
The average monthly value of call options in the Opportunity Fund during the year ended October 31, 2017 was $902,391.
Transactions in options in the Opportunity Fund during the year ended October 31, 2017 were as follows:
| | | | | | | | |
| | | Notional
Amount | | | Contracts | |
Outstanding, beginning of year: | | $ | 21,943,750 | | | | 1,295 | |
Options purchased | | | 108,382,500 | | | | 19,760 | |
Options terminated in closing transactions | | | (58,567,750 | ) | | | (8,068 | ) |
Options exercised | | | (1,940,000 | ) | | | (200 | ) |
Options expired | | | (40,061,000 | ) | | | (4,862 | ) |
| | | | | | | | |
Outstanding, end of year: | | $ | 29,757,500 | | | | 7,925 | |
| | | | | | | | |
The average monthly notional amount of forward currency contracts during the year ended October 31, 2017 was as follows:
| | | | |
| | | International
Value Fund | |
Long Positions | | $ | 2,458,330 | |
Forward currency contracts | | | | |
Short Positions | | $ | 19,618,907 | |
Forward currency contracts | | | | |
e) Foreign currency translation
Investments and other assets and liabilities denominated in foreign currencies are translated to U.S. dollars at the prevailing rates of exchange, in accordance with the Trust’s Portfolio Securities Valuation and Foreign Exchange Contracts Procedures. The Tocqueville Fund, The Tocqueville Opportunity Fund, The Tocqueville International Value Fund and The Tocqueville Gold Fund have engaged in transactions in securities denominated in foreign currencies and, as a result, entered into foreign exchange transactions. The Tocqueville International Value Fund has entered into forward contracts. These Funds are exposed to additional market risk as a result of changes in the value of the underlying currency in relation to the U.S. dollar. Risks include potential inability of counterparties to meet the terms of their obligations. The value of foreign currencies are marked-to-market on a daily basis, which reflects the changes in the market value of the contract at the close of each day’s trading, resulting in daily unrealized gains and/or losses. When the transactions are settled or the contracts are closed, the Funds recognize a realized gain or loss.
The Funds isolate that portion of the results of operations resulting from changes in foreign exchange rates on investments from the fluctuations arising from changes in market prices of securities held. Such fluctuations are reflected as net realized and unrealized gain or loss on foreign currency translation.
Reported net realized foreign exchange gains or losses arise from sales of foreign currencies, currency gains or losses realized between the trade and settlement dates on securities transactions, the differences between the amounts of dividends, interest, and foreign withholding taxes recorded on the Fund’s books, and the U.S. dollar equivalent of the amounts actually received or paid. Net unrealized foreign exchange gains and losses
arise from changes in the value of assets and liabilities other than investments in securities at the end of the fiscal year, resulting from changes in the exchange rates.
f) Dividends and distributions to shareholders
Dividends to shareholders are recorded on the ex-dividend date. Dividends from net investment income are declared and paid annually by the Funds. Distributions of net realized capital gains, if any, will be declared and paid at least annually. Income and capital gain distributions are determined in accordance with income tax regulations which may differ from generally accepted accounting principles. Permanent differences between financial and tax reporting may result in reclassification to capital stock.
g) Use of estimates
The preparation of financial statements in conformity with accounting principles generally accepted in the United States of America requires management to make estimates and assumptions that affect the reported amounts of assets and liabilities and disclosure of contingent assets and liabilities at the date of the financial statements and the reported amounts of revenues and expenses during the reporting year. Actual results could differ from those estimates.
h) Indemnification
In the normal course of business the Funds enter into contracts that contain general indemnification clauses. The Funds’ maximum exposure under these arrangements is unknown, as this would involve future claims against a Fund that have not yet occurred. Based on experience, the Funds expect the risk of loss to be remote.
i) Subsequent events evaluation
In preparing these financial statements, the Trust has evaluated events and transactions for potential recognition or disclosure resulting from subsequent events through the date financial statements were available to be issued. This evaluation did not result in any subsequent events, other than those noted above, that necessitated disclosure and/or adjustments.
3. FEDERAL INCOME TAX
There is no tax liability resulting from unrecognized tax benefits relating to uncertain income tax positions taken or expected to be taken on the tax return for the fiscal year-end October 31, 2017, or for any other tax years which are open for exam. As of October 31, 2017, open tax years include the tax years ended October 31, 2014 through 2017. The Trust is also not aware of any tax positions for which it is reasonably possible that the total amounts of unrecognized tax benefits will significantly change in the next six months. The Funds recognize interest and penalties, if any, related to unrecognized tax benefits as income tax expense in the Statement of Operations. During the year, the Funds did not incur any interest or penalties.
Provision for federal income taxes or excise taxes has not been made since the Funds have elected to be taxed as Regulated Investment Companies and intend to distribute substantially all taxable income to shareholders and otherwise comply with the provisions of the Internal Revenue Code applicable to Regulated Investment Companies. Distributions from net realized gains for book purposes may include short-term capital gains which are included as ordinary income to shareholders for tax purposes. Additionally, accounting principles generally accepted in the United States of America require that certain components of net assets relating to permanent differences be reclassified between financial and tax reporting. These reclassifications have no effect on net assets or net asset value per share. For the year ended October 31, 2017, the following table shows the reclassifications made:
| | | | | | | | | | | | |
| | | Undistributed
Net Investment
Income/(Loss) | | | Accumulated Net
Realized
Gain/(Loss) | | | Paid In Capital | |
Tocqueville Fund | | $ | (186,000 | ) | | $ | (3,366,126 | ) | | $ | 3,552,126 | |
Opportunity Fund | | | 997,247 | | | | (115,888 | ) | | | (881,359 | ) |
International Value Fund | | | (610,363 | ) | | | (847,698 | ) | | | 1,458,061 | |
Gold Fund | | | 2,041,321 | | | | (175,860 | ) | | | (1,865,461 | ) |
Delafield Fund | | | 3,452,972 | | | | (10,947,146 | ) | | | 7,494,174 | |
Select Fund | | | 435,346 | | | | (904,807 | ) | | | 469,461 | |
The permanent differences primarily relate to net operating losses, foreign currency reclasses, the usage of tax equalization, Partnerships, and PFICs.
As of October 31, 2017, the components of accumulated earnings (losses) for income tax purposes were as follows:
| | | | | | | | | | | | | | | | | | | | | | | | |
| | | Tocqueville
Fund | | | Opportunity
Fund | | | International
Value Fund | | | Gold
Fund | | | Delafield Fund | | | Select Fund | |
Tax cost of Investments | | $ | 147,409,223 | | | $ | 54,648,145 | | | $ | 944,848,997 | | | $ | 1,218,772,797 | | | $ | 309,119,744 | | | $ | 43,529,455 | |
| | | | | | | | | | | | | | | | | | | | | | | | |
Unrealized Appreciation | | | 146,567,564 | | | | 25,238,532 | | | | 205,547,198 | | | | 275,703,993 | | | | 88,483,278 | | | | 13,178,624 | |
Unrealized Depreciation | | | (338,031 | ) | | | (1,284,648 | ) | | | (21,424,604 | ) | | | (341,257,340 | ) | | | (24,474,504 | ) | | | (7,480,656 | ) |
| | | | | | | | | | | | | | | | | | | | | | | | |
Net unrealized appreciation (depreciation) | | | 146,229,533 | | | | 23,953,884 | | | | 181,122,594 | | | | (65,553,347 | ) | | | 64,008,774 | | | | 5,697,968 | |
| | | | | | | | | | | | | | | | | | | | | | | | |
Undistributed operating income | | | 2,189,663 | | | | — | | | | 10,633,274 | | | | — | | | | 2,432,971 | | | | — | |
Undistributed long-term gains | | | 24,335,002 | | | | 2,589,292 | | | | 3,668,445 | | | | — | | | | 49,515,483 | | | | 903,691 | |
| | | | | | | | | | | | | | | | | | | | | | | | |
Distributable earnings | | | 26,524,665 | | | | 2,589,292 | | | | 14,301,719 | | | | — | | | | 51,948,454 | | | | 903,691 | |
| | | | | | | | | | | | | | | | | | | | | | | | |
Other accumulated loss | | | — | | | | (631,973 | ) | | | — | | | | (393,467,089 | ) | | | — | | | | (8,395 | ) |
| | | | | | | | | | | | | | | | | | | | | | | | |
Total accumulated gain/(loss) | | $ | 172,754,198 | | | $ | 25,913,899 | | | $ | 195,437,993 | | | $ | (459,038,618 | ) | | $ | 115,957,228 | | | $ | 6,593,264 | |
| | | | | | | | | | | | | | | | | | | | | | | | |
The difference between book-basis and tax-basis unrealized appreciation is attributable primarily to wash sale deferrals and passive foreign investment companies (PFIC’s).
The tax character of distributions paid during the years ended October 31, 2017 and 2016 was as follows:
| | | | | | | | | | | | |
| | | October 31, 2017 | |
| | | Ordinary
Income | | | Long Term
Capital Gain | | | Total | |
Tocqueville Fund | | | 3,191,286 | | | | 12,245,533 | | | | 15,436,819 | |
Opportunity Fund | | | — | | | | — | | | | — | |
International Value Fund | | | 5,348,368 | | | | 2,913,833 | | | | 8,262,201 | |
Gold Fund | | | — | | | | — | | | | — | |
Delafield Fund | | | — | | | | 71,259,512 | | | | 71,259,512 | |
Select Fund | | | — | | | | 3,023,170 | | | | 3,023,170 | |
| |
| | | October 31, 2016 | |
| | | Ordinary
Income | | | Long Term
Capital Gain | | | Total | |
Tocqueville Fund | | $ | 3,200,195 | | | $ | 3,072,752 | | | $ | 6,272,947 | |
Opportunity Fund | | | — | | | | — | | | | — | |
International Value Fund | | | 5,967,776 | | | | 4,247,573 | | | | 10,215,349 | |
Gold Fund | | | — | | | | — | | | | — | |
Delafield Fund | | | — | | | | 62,285,610 | | | | 62,285,610 | |
Select Fund | | | — | | | | 2,573,589 | | | | 2,573,589 | |
The Fund designated as long-term capital gain dividend, pursuant to Internal Revenue Code Section 852(b)(3), the amount necessary to reduce the earnings and profits of the Funds related to net capital gain to zero for the tax years ended October 31, 2017 and 2016.
For the fiscal year ended October 31, 2017 the Opportunity Fund, Gold Fund, and Select Fund had late year losses of $631,973, $12,607,883 and $8,395, respectively.
At October 31, 2017 certain Funds had tax basis capital losses which may be carried forward to offset future capital gains as shown below.
| | | | |
| | | Capital Losses Expiring | |
| | | Indefinite Long Term | |
Gold Fund | | $ | 380,859,206 | |
To the extent that Funds listed above may realize future net capital gains, those gains will be offset by any of their unused respective capital loss carryforwards
4. INVESTMENT ADVISORY AND OTHER AGREEMENTS
Tocqueville Asset Management L.P. (“Tocqueville”) is the investment adviser (the “Adviser”) to the Trust under Investment Advisory Agreements approved by shareholders. For its services, Tocqueville receives fees from The Tocqueville Fund, calculated daily and payable monthly, at an annual rate of 0.75% on the first $1 billion of the average daily net assets of the Fund, and 0.65% of the average daily net assets in excess of $1 billion. Tocqueville receives fees from The Tocqueville Opportunity Fund, calculated daily and payable monthly, at an annual rate of 0.75% on the first $500 million of the average daily net assets of the Fund, and 0.65% of the average daily net assets in excess of $500 million. Tocqueville receives fees from The Tocqueville International Value Fund, calculated daily and payable monthly, at an annual rate of 1.00% on the first $1 billion of the average daily net assets of the Fund, and 0.75% of the average daily net assets in excess of $1 billion. Tocqueville receives fees from The Tocqueville Gold Fund, calculated daily and payable monthly, at an annual rate of 1.00% on the first $500 million of the average daily net assets of the Fund, 0.75% of the average daily net assets in excess of $500 million but not exceeding $1 billion, and 0.65% of the average daily net assets in excess of $1 billion. Tocqueville receives fees from The Delafield Fund, calculated daily and payable monthly, at an annual rate of 0.80% on the first $250 million of net assets of the Fund; 0.75% on the next $250 million of net assets of the Fund; 0.70% on the next $500 million of net assets of the Fund; and 0.65% on all net assets of the Fund over $1 billion. Tocqueville receives fees from The Tocqueville Select Fund, calculated daily and payable monthly, at an annual rate of 0.80% on all net assets of the Fund.
With respect to The Tocqueville Fund, The Tocqueville Opportunity Fund, The Tocqueville International Value Fund, The Delafield Fund and The Tocqueville Select Fund, the Adviser has contractually agreed to waive its advisory fees and/or reimburse expenses in order to ensure that The Tocqueville Fund’s and The Tocqueville International Value Fund’s total annual operating expenses do not exceed 1.25% of its average daily net assets (excluding taxes, interest expense, acquired fund fees and expenses, or extraordinary expenses such as litigation). The Expense Limitation Agreements will remain in effect until March 1, 2019 for each fund. For the fiscal year ended October 31, 2017, the Adviser waived $28,398, $59,209, $2,172,846, $234,792, and $69,905 of the advisory fee for The Tocqueville Fund, The Tocqueville Opportunity Fund, The Tocqueville International Fund, The Delafield Fund, and The Tocqueville Select Fund respectively. Such amounts are not subject to recoupment by the Adviser.
Pursuant to an Administrative Services Agreement, each Fund pays to the Adviser a fee computed and paid monthly at an annual rate of 0.15% on the first $400 million of the average daily net assets of each fund; 0.13% on the next $600 million of the average daily net assets of each fund; and 0.12% on all the average daily net assets of each fund over $1 billion. For the year ended October 31, 2017, the Adviser has made payments of $75,380, $20,891, $202,967, $324,410, $105,047, $15,252, to U.S. Bancorp Fund Services, LLC for services provided under a Sub-Administration Agreement for The Tocqueville Fund, The Tocqueville Opportunity Fund, The Tocqueville International Value Fund, The Tocqueville Gold Fund, The Delafield Fund and The Tocqueville Select Fund, respectively.
Tocqueville Securities, L.P. (the “Distributor”), an affiliate of Tocqueville, acts as distributor for shares of the Trust. Each Fund adopted a distribution and service plan pursuant to Rule 12b-1 of the 1940 Act. Pursuant to the plans, each Fund pays to the Distributor distribution and service fees of 0.25% per annum of its average daily net assets.
Commissions earned by the Distributor for services rendered as a registered broker-dealer in securities transactions for The Tocqueville Fund, The Tocqueville Opportunity Fund, The Tocqueville International Value Fund, The Delafield Fund and The Tocqueville Select Fund for the year ended October 31, 2017, were $24,691, $97,305, $41,563, $5,851, $27,368, respectively.
5. CAPITAL SHARE TRANSACTIONS.
Transactions in capital shares for each Fund were as follows:
| | | | | | | | |
| | | For the Year
Ended
October 31, 2017 | | | For the Year
Ended
October 31, 2016 | |
| The Tocqueville Fund | | Shares | | | Shares | |
Shares sold | | | 588,202 | | | | 758,998 | |
Shares issued to holders in reinvestment dividends | | | 435,792 | | | | 180,320 | |
Shares redeemed | | | (1,813,017 | ) | | | (1,941,924 | ) |
| | | | | | | | |
Net decrease | | | (789,023 | ) | | | (1,002,606 | ) |
| | |
| The Tocqueville Opportunity Fund | | | | | | | | |
Shares sold | | | 344,287 | | | | 1,126,477 | |
Shares issued to holders in reinvestment dividends | | | — | | | | — | |
Shares redeemed | | | (2,224,181 | ) | | | (3,435,340 | ) |
| | | | | | | | |
Net decrease | | | (1,879,894 | ) | | | (2,308,863 | ) |
| | |
| The Tocqueville International Value Fund | | | | | | | | |
Shares sold | | | 37,730,215 | | | | 21,229,873 | |
Shares issued to holders in reinvestment dividends | | | 509,379 | | | | 668,623 | |
Shares redeemed | | | (10,870,395 | ) | | | (8,378,756 | ) |
| | | | | | | | |
Net increase | | | 27,369,199 | | | | 13,519,740 | |
| | | | | | | | |
| | | For the Year
Ended
October 31, 2017 | | | For the Year
Ended
October 31, 2016 | |
| The Tocqueville Gold Fund | | | | | | | | |
Shares sold | | | 7,433,508 | | | | 12,486,612 | |
Shares issued to holders in reinvestment dividends | | | — | | | | — | |
Shares redeemed | | | (9,794,433 | ) | | | (14,150,662 | ) |
| | | | | | | | |
Net decrease | | | (2,360,925 | ) | | | (1,664,050 | ) |
| | |
| The Delafield Fund | | | | | | | | |
Shares sold | | | 735,499 | | | | 1,518,777 | |
Shares issued to holders in reinvestment dividends | | | 2,739,544 | | | | 2,473,115 | |
Shares redeemed | | | (4,475,349 | ) | | | (12,406,861 | ) |
| | | | | | | | |
Net decrease | | | (1,000,306 | ) | | | (8,414,969 | ) |
| | |
| The Tocqueville Select Fund | | | | | | | | |
Shares sold | | | 341,500 | | | | 440,494 | |
Shares issued to holders in reinvestment dividends | | | 231,253 | | | | 229,723 | |
Shares redeemed | | | (1,991,554 | ) | | | (1,860,720 | ) |
| | | | | | | | |
Net decrease | | | (1,418,801 | ) | | | (1,190,503 | ) |
6. FUND SHARE TRANSACTIONS
Each Fund currently offers only one class of shares of beneficial interest. A redemption fee of 2.00% is imposed on redemptions of shares held 90 days or fewer for The Tocqueville Gold Fund. This fee is retained by the Fund and is credited to paid in capital. Redemptions to which the fee applies include redemptions of shares resulting from an exchange made pursuant to the Exchange Privilege, as defined in the Trust’s Prospectus dated February 28, 2017. For a more detailed description of when the redemption fee does not apply, please see the Trust’s Prospectus.
7. INVESTMENT TRANSACTIONS
Purchases and sales of investment securities (excluding short-term instruments) for the year ended October 31, 2017 are summarized below.
| | | | | | | | | | | | | | | | | | | | | | | | |
| | | Tocqueville
Fund | | | Opportunity
Fund | | | International
Value Fund | | | Gold Fund | | | Delafield
Fund | | | Select
Fund | |
Purchases: | | $ | 26,441,114 | | | $ | 106,330,322 | | | $ | 542,269,040 | | | $ | 166,739,070 | | | $ | 107,105,899 | | | $ | 12,457,867 | |
| | | | | | | | | | | | | | | | | | | | | | | | |
Sales: | | $ | 68,007,109 | | | $ | 145,978,615 | | | $ | 154,846,658 | | | $ | 232,961,030 | | | $ | 222,642,635 | | | $ | 26,341,825 | |
| | | | | | | | | | | | | | | | | | | | | | | | |
U.S. Government Security Purchases: | | $ | 1,374,856 | | | $ | — | | | $ | — | | | $ | — | | | $ | — | | | $ | — | |
| | | | | | | | | | | | | | | | | | | | | | | | |
U.S. Government Security Sales: | | $ | — | | | $ | — | | | $ | — | | | $ | — | | | $ | — | | | $ | — | |
| | | | | | | | | | | | | | | | | | | | | | | | |
8. TRANSACTIONS WITH AFFILIATES
The following issuers are affiliated with the Funds; that is, the Adviser had control of 5% or more of the outstanding voting securities during the period from November 1, 2016 through October 31, 2017. As defined in Section (2)(a)(3) of the Investment Company Act of 1940; such issues are:
| | | | | | | | | | | | | | | | | | | | | | | | | | | | | | | | | | | | | | | | | | | | | | | | |
| | | November 1, 2016 | | | Additions | | | Reductions | | | October 31,
2017 | | | Dividend
Income | | | Realized
Gain/(Loss) | | | Change in
Gross
Unrealized
Appreciation/
(Depreciation) | | | October 31, 2017 | |
Issuer Name | | Share
Balance | | | Cost | | | Share
Balance | | | Cost | | | Share
Balance | | | Cost | | | Share
Balance | | | | | | Value | | | Cost | |
The Tocqueville Gold Fund | | | | | | | | | | | | | | | | | | | | | | | | | | | | | | | | | | | | | | | | | | | | | | | | |
Almaden Minerals Ltd. | | | 1,481,482 | | | $ | 1,556,421 | | | | 4,125,837 | | | $ | 3,488,775 | | | | — | | | $ | — | | | | 5,607,319 | | | $ | — | | | $ | — | | | $ | (1,321,160 | ) | | $ | 5,693,813 | | | $ | 5,045,196 | |
Almaden Minerals Ltd.(a) | | | — | | | | — | | | | 159,170 | | | | 164,930 | | | | (159,170 | ) | | | (164,930 | ) | | | — | | | | — | | | | — | | | | — | | | | — | | | | — | |
Almaden Minerals Ltd.(a) | | | 3,966,667 | | | | 3,323,845 | | | | — | | | | — | | | | (3,966,667 | ) | | | (3,323,845 | ) | | | — | | | | — | | | | — | | | | — | | | | — | | | | — | |
Almaden Minerals Ltd. Warrant | | | 740,741 | | | | — | | | | — | | | | — | | | | — | | | | — | | | | 740,741 | | | | — | | | | — | | | | (378,557 | ) | | | 104,557 | | | | — | |
Almaden Minerals Ltd. Warrant | | | 875,000 | | | | — | | | | — | | | | — | | | | — | | | | — | | | | 875,000 | | | | — | | | | — | | | | (392,456 | ) | | | 211,883 | | | | — | |
Almaden Minerals Ltd. Warrant | | | — | | | | — | | | | 79,585 | | | | — | | | | — | | | | — | | | | 79,585 | | | | — | | | | — | | | | 22,887 | | | | 22,887 | | | | — | |
Argonaut Gold, Inc. | | | 2,837,000 | | | | 12,710,613 | | | | — | | | | — | | | | — | | | | — | | | | 2,837,000 | | | | — | | | | — | | | | (608,158 | ) | | | 5,123,797 | | | | 12,710,613 | |
ATAC Resources Ltd. | | | 10,016,891 | | | | 32,715,236 | | | | — | | | | — | | | | (232,000 | ) | | | (1,483,400 | ) | | | 9,784,891 | | | | — | | | | (1,362,522 | ) | | | 1,471,658 | | | | 4,095,683 | | | | 31,231,836 | |
AuRico Metals, Inc. | | | 7,411,437 | | | | 4,616,358 | | | | — | | | | — | | | | — | | | | — | | | | 7,411,437 | | | | — | | | | — | | | | 671,869 | | | | 7,468,311 | | | | 4,616,358 | |
Bear Creek Mining Corp. | | | 7,413,200 | | | | 28,761,181 | | | | — | | | | — | | | | — | | | | — | | | | 7,413,200 | | | | — | | | | — | | | | (3,717,436 | ) | | | 11,205,131 | | | | 28,761,181 | |
Contango ORE, Inc. | | | — | | | | — | | | | 263,200 | | | | 5,000,800 | | | | — | | | | — | | | | 263,200 | | | | — | | | | — | | | | 230,300 | | | | 5,231,100 | | | | 5,000,800 | |
Corvus Gold, Inc. | | | 3,350,901 | | | | 2,356,445 | | | | — | | | | — | | | | (124,000 | ) | | | (143,541 | ) | | | 3,226,901 | | | | — | | | | (30,857 | ) | | | 1,124,044 | | | | 3,112,346 | | | | 2,212,904 | |
Corvus Gold, Inc. | | | 13,030,000 | | | | 10,588,821 | | | | — | | | | — | | | | — | | | | — | | | | 13,030,000 | | | | — | | | | — | | | | 4,468,703 | | | | 12,725,991 | | | | 10,588,821 | |
East Asia Minerals Corp. | | | 66,484,933 | | | | 22,296,021 | | | | 66,619,440 | | | | 3,648,570 | | | | (119,813,380 | ) | | | (3,148,570 | ) | | | 13,290,993 | | | | — | | | | — | | | | (38,822 | ) | | | 1,081,741 | | | | 22,796,021 | |
East Asia Minerals Corp. Warrant | | | 6,500,000 | | | | — | | | | — | | | | — | | | | (6,500,000 | ) | | | — | | | | — | | | | — | | | | — | | | | — | | | | — | | | | — | |
East Asia Minerals Corp. Warrant | | | 9,764,933 | | | | — | | | | — | | | | — | | | | (8,788,440 | ) | | | — | | | | 976,493 | | | | — | | | | — | | | | — | | | | — | | | | — | |
East Asia Minerals Corp. Warrant | | | — | | | | — | | | | 33,212,500 | | | | — | | | | (29,891,250 | ) | | | — | | | | 3,321,250 | | | | — | | | | — | | | | 270,313 | | | | 270,313 | | | | — | |
East Asia Minerals Corp. Warrant | | | 46,175,600 | | | | — | | | | — | | | | — | | | | (41,558,040 | ) | | | — | | | | 4,617,560 | | | | — | | | | — | | | | (140,929 | ) | | | 375,461 | | | | — | |
Falco Resources Ltd. | | | 2,222,300 | | | | 886,202 | | | | 14,000,000 | | | | 11,086,852 | | | | — | | | | — | | | | 16,222,300 | | | | — | | | | — | | | | (301,772 | ) | | | 12,574,452 | | | | 11,973,054 | |
Falco Resources Ltd. Warrant | | | — | | | | — | | | | 7,000,000 | | | | — | | | | — | | | | — | | | | 7,000,000 | | | | — | | | | — | | | | 475,854 | | | | 475,854 | | | | — | |
GoGold Resources, Inc. | | | 19,546,700 | | | | 24,317,749 | | | | — | | | | — | | | | (5,878,700 | ) | | | (7,250,404 | ) | | | 13,668,000 | | | | — | | | | (5,125,806 | ) | | | 1,896,443 | | | | 4,555,647 | | | | 17,067,345 | |
Gold Bullion International LLC | | | 5,000,000 | | | | 5,000,000 | | | | — | | | | — | | | | — | | | | — | | | | 5,000,000 | | | | — | | | | — | | | | — | | | | 6,893,000 | | | | 5,000,000 | |
International Tower Hill Mines Ltd. | | | 5,738,836 | | | | 20,953,121 | | | | — | | | | — | | | | — | | | | — | | | | 5,738,836 | | | | — | | | | — | | | | (1,856,513 | ) | | | 2,439,579 | | | | 20,953,121 | |
International Tower Hill Mines Ltd. | | | 11,289,744 | | | | 40,113,412 | | | | 9,041,554 | | | | 4,339,946 | | | | — | | | | — | | | | 20,331,298 | | | | — | | | | — | | | | (4,173,421 | ) | | | 8,667,710 | | | | 44,453,358 | |
Jaguar Mining, Inc. | | | 65,858,798 | | | | 7,512,329 | | | | 3,770,909 | | | | 1,220,000 | | | | (5,299,000 | ) | | | (604,442 | ) | | | 64,330,707 | | | | — | | | | 536,128 | | | | (20,993,324 | ) | | | 15,956,768 | | | | 8,127,887 | |
MAG Silver Corp. | | | 2,945,400 | | | | 32,406,929 | | | | — | | | | — | | | | (118,300 | ) | | | (1,185,745 | ) | | | 2,827,100 | | | | — | | | | 192,799 | | | | (11,881,655 | ) | | | 30,023,802 | | | | 31,221,184 | |
NuLegacy Gold Corp. | | | 19,535,500 | | | | 3,102,220 | | | | 9,020,590 | | | | 3,055,985 | | | | — | | | | — | | | | 28,556,090 | | | | — | | | | — | | | | (4,970,387 | ) | | | 3,984,261 | | | | 6,158,205 | |
NuLegacy Gold Corp.(a) | | | — | | | | — | | | | 9,020,590 | | | | 3,055,985 | | | | (9,020,590 | ) | | | (3,055,985 | ) | | | — | | | | — | | | | — | | | | — | | | | — | | | | — | |
NuLegacy Gold Corp.(a) | | | 9,553,152 | | | | 3,236,406 | | | | — | | | | — | | | | (9,553,152 | ) | | | (3,236,406 | ) | | | — | | | | — | | | | — | | | | 409,562 | | | | — | | | | — | |
NuLegacy Gold Corp. Warrant(a) | | | 9,553,152 | | | | — | | | | — | | | | — | | | | (9,553,152 | ) | | | — | | | | — | | | | — | | | | — | | | | — | | | | — | | | | — | |
NuLegacy Gold Corp. Warrant | | | — | | | | — | | | | 9,020,590 | | | | — | | | | — | | | | — | | | | 9,020,590 | | | | — | | | | — | | | | (1,121,816 | ) | | | 2,797 | | | | — | |
| | | | | | | | | | | | | | | | | | | | | | | | | | | | | | | | | | | | | | | | | | | | | | | | |
| | | November 1, 2016 | | | Additions | | | Reductions | | | October 31,
2017 | | | Dividend
Income | | | Realized
Gain/(Loss) | | | Change in
Gross
Unrealized
Appreciation/
(Depreciation) | | | October 31, 2017 | |
Issuer Name | | Share
Balance | | | Cost | | | Share
Balance | | | Cost | | | Share
Balance | | | Cost | | | Share
Balance | | | | | | Value | | | Cost | |
Osisko Mining, Inc.(a) | | | 1,123,239 | | | $ | 3,496,359 | | | | — | | | $ | — | | | | (1,123,239 | ) | | $ | (3,496,359 | ) | | | — | | | $ | — | | | $ | — | | | $ | — | | | $ | — | | | $ | — | |
Osisko Mining, Inc. | | | 2,730,000 | | | | 5,760,157 | | | | 2,974,239 | | | | 8,890,639 | | | | — | | | | — | | | | 5,704,239 | | | | — | | | | — | | | | 3,983,574 | | | | 17,420,899 | | | | 14,650,796 | |
Osisko Mining, Inc. | | | — | | | | — | | | | 2,000,000 | | | | 6,732,118 | | | | — | | | | — | | | | 2,000,000 | | | | — | | | | — | | | | (776,610 | ) | | | 5,955,507 | | | | 6,732,118 | |
Premier Gold Mines Ltd. | | | 7,857,660 | | | | 15,522,203 | | | | 1,785,500 | | | | 2,852,629 | | | | — | | | | — | | | | 9,643,160 | | | | — | | | | — | | | | 6,265,481 | | | | 25,638,353 | | | | 18,374,832 | |
Rockhaven Resources Ltd.(b) | | | 6,400,000 | | | | 6,455,589 | | | | — | | | | — | | | | (1,768,500 | ) | | | (2,216,050 | ) | | | 4,631,500 | | | | — | | | | (2,002,106 | ) | | | 1,835,928 | | | | 502,605 | | | | 4,239,539 | |
Rubicon Minerals Corp.(a)(b) | | | 11,275,000 | | | | 15,678,646 | | | | — | | | | — | | | | (11,275,000 | ) | | | (15,678,646 | ) | | | — | | | | — | | | | — | | | | 15,300,375 | | | | — | | | | — | |
Rubicon Minerals Corp.(b) | | | — | | | | — | | | | 69,556 | | | | 15,678,646 | | | | (69,556 | ) | | | (15,678,646 | ) | | | — | | | | — | | | | (15,562,638 | ) | | | — | | | | — | | | | — | |
SEMAFO, Inc. | | | 10,224,200 | | | | 38,716,798 | | | | 2,750,000 | | | | 6,859,325 | | | | (1,507,200 | ) | | | (2,213,981 | ) | | | 11,467,000 | | | | — | | | | 1,838,874 | | | | (16,276,740 | ) | | | 28,278,769 | | | | 43,362,142 | |
Strategic Metals Ltd. | | | 10,463,400 | | | | 15,145,574 | | | | — | | | | — | | | | (350,000 | ) | | | (588,265 | ) | | | 10,113,400 | | | | — | | | | (463,874 | ) | | | (330,997 | ) | | | 3,449,264 | | | | 14,557,309 | |
Tocqueville Bullion Reserve LP—Class G(c) | | | 13,806 | | | | 25,000,000 | | | | — | | | | — | | | | — | | | | — | | | | 13,806 | | | | — | | | | — | | | | (108,291 | ) | | | 16,978,176 | | | | 25,000,000 | |
Torex Gold Resources, Inc. | | | 3,278,550 | | | | 49,114,641 | | | | — | | | | — | | | | (911,600 | ) | | | (14,907,883 | ) | | | 2,366,950 | | | | — | | | | (1,956,156 | ) | | | (13,438,234 | ) | | | 32,639,362 | | | | 34,206,758 | |
Trifecta Gold Ltd. | | | — | | | | — | | | | 2,325,199 | | | | — | | | | — | | | | — | | | | 2,325,199 | | | | — | | | | — | | | | 234,304 | | | | 234,304 | | | | — | |
Wellgreen Platinum Ltd. | | | — | | | | — | | | | 12,379,201 | | | | 2,544,342 | | | | — | | | | — | | | | 12,379,201 | | | | — | | | | — | | | | 276,746 | | | | 2,821,088 | | | | 2,544,342 | |
Wellgreen Platinum Ltd. Warrant | | | — | | | | — | | | | 6,189,601 | | | | — | | | | — | | | | — | | | | 6,189,601 | | | | — | | | | — | | | | 892,864 | | | | 892,864 | | | | — | |
| | | | | | | | | | | | | | | | | | | | | | | | | | | | | | | | | | | | | | | | | | | | | | | | |
| | | | | | $ | 431,343,276 | | | | | | | $ | 78,619,542 | | | | | | | $ | (78,377,098 | ) | | | | | | $ | — | | | $ | (23,936,158 | ) | | $ | (42,996,373 | ) | | $ | 277,108,075 | | | $ | 431,585,720 | |
The Delafield Fund | | | | | | | | | | | | | | | | | | | | | | | | | | | | | | | | | | | | | | | | | | | | | | | | |
Real Industry, Inc. | | | 103,746 | | | | 623,945 | | | | 121,254 | | | | 478,144 | | | | — | | | | — | | | | 225,000 | | | | — | | | | — | | | | (639,434 | ) | | | 393,750 | | | | 1,102,089 | |
Xerium Technologies, Inc. | | | 900,000 | | | | 12,042,318 | | | | — | | | | — | | | | (200,000 | ) | | | (2,507,500 | ) | | | 700,000 | | | | — | | | | (1,195,466 | ) | | | 217,500 | | | | 3,290,000 | | | | 9,534,818 | |
| | | | | | | | | | | | | | | | | | | | | | | | | | | | | | | | | | | | | | | | | | | | | | | | |
| | | | | | $ | 12,666,263 | | | | | | | $ | 478,144 | | | | | | | $ | (2,507,500 | ) | | | | | | $ | — | | | $ | (1,195,466 | ) | | $ | (421,934 | ) | | $ | 3,683,750 | | | $ | 10,636,907 | |
The Tocqueville Select Fund | | | | | | | | | | | | | | | | | | | | | | | | | | | | | | | | | | | | | | | | | | | | | | | | |
Real Industry, Inc. | | | 265,581 | | | | 1,617,153 | | | | 624,700 | | | | 1,944,164 | | | | — | | | | — | | | | 890,281 | | | | — | | | | — | | | | (1,807,031 | ) | | | 1,557,992 | | | | 3,561,317 | |
Summer Infant, Inc.(b) | | | 631,231 | | | | 2,401,056 | | | | — | | | | — | | | | (631,231 | ) | | | (2,401,056 | ) | | | — | | | | — | | | | (1,201,961 | ) | | | 1,062,846 | | | | — | | | | — | |
Xerium Technologies, Inc. | | | 265,000 | | | | 3,374,608 | | | | — | | | | — | | | | — | | | | — | | | | 265,000 | | | | — | | | | — | | | | (397,500 | ) | | | 1,245,500 | | | | 3,374,608 | |
| | | | | | | | | | | | | | | | | | | | | | | | | | | | | | | | | | | | | | | | | | | | | | | | |
| | | | | | $ | 7,392,817 | | | | | | | $ | 1,944,164 | | | | | | | $ | (2,401,056 | ) | | | | | | $ | — | | | $ | (1,201,961 | ) | | $ | (1,141,685 | ) | | $ | 2,803,492 | | | $ | 6,935,925 | |
| (a) | Private security restrictions lifted during period and combined with other non restricted securities |
| (b) | Security is no longer an affiliated company at October 31, 2017. |
| (c) | Tocqueville Bullion Reserve (“TBR”) is a Delaware Limited Partnership created for the purpose of owning physical gold. The General Partner of TBR is TERA Management LLC (“Tera”), a Delaware Limited Liability Company, which is equally owned and managed by Tocqueville Partners II LLC (“TP2”), a Delaware Limited Liability Company, and Eidesis Real Assets LLC (“Eidesis”), a Delaware Limited Liability Company. The Managing Member of TP2 is Robert Kleinschmidt, President of the Trust, who has a 51% participating percentage in TP2 and the sole Non-Managing Member is John Hathaway, co-portfolio manager of the Tocqueville Gold Fund, who has a 49% participating percentage. |
9. LINE OF CREDIT
The Tocqueville Trust has a $300,000,000 line of credit (the “Line”), which is uncommitted, with U.S. Bank NA. The Line is for temporary emergency or extraordinary purposes, including the meeting of redemption requests that otherwise might require the untimely disposition of securities. The Line is secured by the Trust’s assets. The Line has a one year term and is reviewed annually by the Board of Trustees. The current agreement runs through May 26, 2018. The interest rate as of October 31, 2017 was 3.75%. During the year ended October 31, 2017, the Tocqueville Fund’s maximum borrowing was $6,137,000 and average borrowing was $414,877, the Opportunity Fund’s maximum borrowing was $6,496,000 and average borrowing was $1,281,238, and the Gold Fund’s maximum borrowing was $9,412,000 and average borrowing was $623,190. This borrowing resulted in interest expenses of $15,622, $41,624 and $23,066, respectively. The International Value Fund, The Delafield Fund and The Select Fund did not use the Line.
10. OTHER EXPENSES
Other expenses include reimbursement to the Adviser for compensation of the Trust’s Chief Compliance Officer. For the year ended October 31, 2017, reimbursement to the Adviser for compensation of the Trust’s Chief Compliance Officer from the Funds amounted to $15,243, $4,235, $40,596, $65,545, $21,285, $3,096 for the Tocqueville Fund, Opportunity Fund, International Value Fund, Gold Fund, Delafield Fund, and Select Fund respectively.
The Tocqueville Trust
Report of Independent Registered Public Accounting Firm
To the Shareholders and Board of Trustees of
The Tocqueville Trust
We have audited the accompanying statements of assets and liabilities, including the schedules of investments of the Tocqueville Trust, comprised of The Tocqueville Fund, The Tocqueville Opportunity Fund, The Tocqueville International Value Fund, The Tocqueville Gold Fund, The Delafield Fund and The Tocqueville Select Fund (collectively, the Funds), as of October 31, 2017, and the related statements of operations for the year then ended, statements of changes in net assets for each of the two years in the period then ended, and the financial highlights for each of the five years in the period then ended. These financial statements and financial highlights are the responsibility of the Funds’ management. Our responsibility is to express an opinion on these financial statements and financial highlights based on our audits.
We conducted our audits in accordance with the standards of the Public Company Accounting Oversight Board (United States). Those standards require that we plan and perform the audits to obtain reasonable assurance about whether the financial statements and financial highlights are free of material misstatement. We were not engaged to perform an audit of the Funds’ internal control over financial reporting. Our audits included consideration of internal control over financial reporting as a basis for designing audit procedures that are appropriate in the circumstances, but not for the purpose of expressing an opinion on the effectiveness of the Funds’ internal control over financial reporting. Accordingly, we express no such opinion. An audit also includes examining, on a test basis, evidence supporting the amounts and disclosures in the financial statements and financial highlights, assessing the accounting principles used and significant estimates made by management, as well as evaluating the overall financial statement presentation. Our procedures included confirmation of securities owned as of October 31, 2017, by correspondence with the custodians and brokers, or by other appropriate auditing procedures where replies from brokers were not received. We believe that our audits provide a reasonable basis for our opinion.
In our opinion, the financial statements and financial highlights referred to above present fairly, in all material respects, the financial position of the aforementioned Funds of the Tocqueville Trust as of October 31, 2017, and the results of their operations, the changes in their net assets, and financial highlights for the periods indicated above, in conformity with accounting principles generally accepted in the United States of America.
/s/ GRANT THORNTON LLP
Chicago, Illinois
December 22, 2017
ADDITIONAL INFORMATION (UNAUDITED)
1. ADDITIONAL DISCLOSURE REGARDING FUND TRUSTEES AND OFFICERS
Independent Trustees
| | | | | | | | | | |
Name and Age | | Position(s) Held
with the Trust | | Term of Office
and Length of
Time Served (1) | | Principal Occupation(s) During Past Five Years | | Number of Funds
in Fund Complex
Overseen By Trustee | | Other Directorships Held by Trustee |
| | | | | |
Charles W. Caulkins Year of Birth: 1956 | | Trustee; Member of Audit Committee; Member of Governance and Nominating Committee | | Indefinite Term, Since 2003 | | Private Investor dba Plan B Partners from January 2012 – present. | | 6 | | None |
| | | | | |
Alexander Douglas Year of Birth: 1947 | | Trustee; Member of Audit Committee; Member of Governance and Nominating Committee | | Indefinite Term, Since 2010 | | Retired. Formerly, President, CEO and owner of Spaulding Law Printing, Inc. from 1992 to November 2014. | | 6 | | None |
ADDITIONAL INFORMATION (UNAUDITED)
Independent Trustees
| | | | | | | | | | |
Name and Age | | Position(s) Held
with the Trust | | Term of Office
and Length of
Time Served (1) | | Principal Occupation(s) During Past Five Years | | Number of Funds
in Fund Complex
Overseen By Trustee | | Other Directorships Held by Trustee |
| | | | | |
Charles F. Gauvin Year of Birth: 1956 | | Trustee; Member of Audit Committee; Member of Governance and Nominating Committee | | Indefinite Term, Since February 2015 | | Chief Development Officer, Woods Hole Oceanographic Institution, from February 2016 – present; Executive Director, Maine Audubon, from August 2014 – January 2016; Chief Development Officer, Carnegie Endowment for International Peace, from September 2011 – May 2014; Partner, The Riparian Fund/Legacy Ranch Partners (private equity real estate fund), from February 2010 – December 2012. | | 6 | | Director, Bioqual, Inc., July 1992 – present. |
| | | | | |
James W. Gerard Year of Birth: 1961 | | Trustee; Member of Audit Committee; Member of Governance and Nominating Committee | | Indefinite Term, Since 2001 | | Managing Director, Hycroft Advisors, from January 2010-present; Managing Director, deVisscher & Co., LLC from January 2013 to present; The Chart Group from January 2001 to present. | | 6 | | President, American Overseas Memorial Day Association, 1998 to present; Trustee, Salisbury School, 2005 to present; Director, American Friends of Bleraucourt, 1992 to present; President, Little Baby Face Foundation, March 2015 to present. |
ADDITIONAL INFORMATION (UNAUDITED)
Independent Trustees
| | | | | | | | | | |
Name and Age | | Position(s) Held
with the Trust | | Term of Office
and Length of
Time Served (1) | | Principal Occupation(s) During Past Five Years | | Number of Funds
in Fund Complex
Overseen By Trustee | | Other Directorships Held by Trustee |
| | | | | |
William F. Indoe Year of Birth: 1942 | | Trustee; Member of Audit Committee; Member of Governance and Nominating Committee | | Indefinite Term, Since December 2006 | | Retired. Formerly, Sullivan & Cromwell LLP (attorneys-at-law). 1968 – 2011. | | 6 | | Director, Rho Capital Partners, Inc. |
| | | | | |
William J. Nolan III Year of Birth: 1947 | | Trustee; Chair of Audit Committee; Member of Governance and Nominating Committee | | Indefinite Term, Since December 2006 | | Retired. Executive Vice President & Treasurer PaineWebber Inc. 1997 – 2001. | | 6 | | Trustee, Adirondack Museum, Blue Mt. Lake, NY 1996 to present (Treasurer, 2000 to 2013; Executive Committee, 2000 – present). |
ADDITIONAL INFORMATION (UNAUDITED)
Interested Trustees2 and Officers
| | | | | | | | | | |
Name and Age | | Position(s) Held
with the Trust | | Term of Office
and Length of
Time Served (1) | | Principal Occupation(s) During Past Five Years | | Number of Funds
in Fund Complex
Overseen By Trustee | | Other Directorships Held by Trustee |
| | | | | |
Helen Balk Year of Birth:1972 | | Treasurer | | Indefinite Term, Since 2014 | | Controller / Treasurer of Tocqueville Asset Management from January 2014 to present; Manager / Staff Accountant at Pegg & Pegg LLP from August 1995 to January 2014. | | N/A | | N/A |
| | | | | |
Elizabeth Bosco Year of Birth: 1947 | | Anti-Money Laundering Compliance Officer | | Indefinite Term, Since 2009 | | Chief Compliance Officer of Tocqueville Securities, L.P. from January 2009 to present; Compliance Officer, Tocqueville Asset Management from January 2009 to present. | | N/A | | N/A |
| | | | | |
Robert W. Kleinschmidt Year of Birth: 1949 | | Chairman, President, and Trustee | | Indefinite Term, Chairman Since 2016, and President and Trustee Since 1991 | | President and Chief Investment Officer of Tocqueville Asset Management; Director, Tocqueville Management Corporation, the General Partner of Tocqueville Asset Management L.P. and Tocqueville Securities L.P. from January 1994 to present. | | 6 | | President and Director, Tocqueville Management Corporation, the General Partner of Tocqueville Asset Management L.P. and Tocqueville Securities L.P. |
| | | | | |
Cleo Kotis Year of Birth: 1975 | | Secretary | | Indefinite Term, Since 2010 | | Director of Operations, the Delafield Group of Tocqueville Asset Management L.P., 2009 to present. | | N/A | | N/A |
| | | | | |
Thomas Pandick Year of Birth: 1947 | | Chief Compliance Officer | | Indefinite Term, Since 2004 | | Chief Compliance Officer (October 2004 – present) Tocqueville Asset Management L.P. | | N/A | | N/A |
| 1 | Each Trustee will hold office for an indefinite term until the earliest of (i) the next meeting of shareholders, if any, called for the purpose of considering the election or re-election of such Trustee and until the election and qualification of his or her successor, if any, elected at such meeting, or (ii) the date a Trustee resigns or retires, or a Trustee is removed by the Board of Trustees or shareholders, in accordance with the Trust’s By-Laws, as amended, and Agreement and Declaration of Trust, as amended. Each officer will hold office for an indefinite term until the date he or she resigns or retires or until his or her successor is elected and qualifies. |
| 2 | “Interested person” of the Trust as defined in the 1940 Act. Mr. Kleinschmidt is considered “interested person” because of his affiliation with the Advisor. |
The Statement of Additional Information includes additional information about the Trustees and is available free of charge by calling the Funds toll free at 1-800-355-7307.
2. INVESTMENT ADVISORY AGREEMENT DISCLOSURE
In determining whether to approve the continuance of the Investment Advisory Agreement and the Administration Agreement with respect to the Tocqueville Fund, the Opportunity Fund, the International Value Fund, the Gold Fund, the Delafield Fund, and the Select Fund, the Trustees, including the Independent Trustees, considered the following information:
1) The nature, extent and quality of services provided by the Adviser.
The Trustees reviewed in detail the nature and extent of the services provided by the Adviser under the terms of the Investment Advisory Agreements and the quality of those services provided to Funds over the past year. The Trustees noted that the services under the Investment Advisory Agreements include: managing the investment and reinvestment of the Funds’ assets; supervising and managing all aspects of the Funds’ operations; and providing the Board on a regular basis with financial reports and analyses on the Funds’ operations and the operations of comparable investment companies. The Trustees also observed that the Adviser provides various administrative services to the Funds pursuant to the terms of the Administration Agreement and considered the nature, extent and quality of services provided under that agreement as well. The Trustees evaluated these factors based on their direct experience with the Adviser and in consultation with counsel. The Trustees concluded that the nature and extent of the services provided under the Investment Advisory Agreements and the Administration Agreement were reasonable and appropriate in relation to the advisory fee and administration fee, respectively, that the level of services provided by the Adviser to the Funds had not diminished over the past year and that the quality of services continues to be high. The Trustees reviewed the personnel responsible for providing advisory and administrative services to the Funds and concluded, based on their experience and interaction with the Adviser, that (i) the Adviser was able to retain quality portfolio managers and other personnel; (ii) the Adviser exhibited a high level of diligence and attention to detail in carrying out its advisory and administrative responsibilities under the Investment Advisory Agreements and Administration Agreement, respectively, for the Funds; (iii) the Adviser was responsive to requests of the Trustees; and (iv) the Adviser had kept the Trustees apprised of developments relating to the Funds and the industry in general. The Trustees also focused on the Adviser’s reputation and long-standing relationship with the Trust.
In connection with its assessment of the performance of the Adviser, the Trustees reviewed the Adviser’s financial statements and considered the Adviser’s financial condition and whether it has the resources necessary to continue to carry out its obligations under the Investment Advisory Agreements and the Administration Agreement. The Trustees concluded that the Adviser has the financial resources necessary to continue to perform its obligations under the Investment Advisory Agreements and the Administration Agreement and to continue to provide the high quality services that it has provided to the Funds to date.
2) The performance of the Funds and the Adviser.
The Trustees reviewed the investment performance of the Funds, both on an absolute basis and as compared to a peer group for each respective Fund for the one-year, three-year, five-year and ten-year periods, ended July 31, 2017. The peer groups were comprised of other funds that had similar investment objectives and sales load structures, as determined by Morningstar: The Morningstar Large Blend Funds peer group, with total net assets between $212 million and $334 million, for The Tocqueville Fund; the Morningstar Mid-Cap Growth Funds peer group, with total net assets between $38 million and $107 million, for The Tocqueville Opportunity Fund; the Morningstar Foreign Large Blend Funds peer group, with total net assets between $605 million and $1.2 billion, for The Tocqueville International Value Fund; the Morningstar Precious Metals Funds peer group, with total net assets between $96 million and 2.6 billion for The Tocqueville Gold Fund; the Morningstar Mid-Cap Value Funds peer group, with total net assets between $109 million and $667 million, for The Delafield Fund; and the Morningstar Small Value Funds peer group, with total net assets between $32 million and $94 million, for The Tocqueville Select Fund (the “Performance Peer Groups”). The Trustees considered that the performance information for The Delafield Fund and The Tocqueville Select Fund includes the performance information of their respective predecessor funds, which had different investment advisers, but the Trustees considered this information since these Funds have substantially the same portfolio management team.
The Trustees also compared each Fund’s investment performance against its benchmark market indices: the S&P 500 Index for The Tocqueville Fund; the Russell 2500 Growth Index for The Tocqueville Opportunity Fund; the Morgan Stanley EAFE Index for The Tocqueville International Value Fund; the S&P 500 Index and the Philadelphia Stock Exchange Gold & Silver Index for The Tocqueville Gold Fund; the S&P 500 Index and the Russell 2000 Index for The Delafield Fund; the Russell 2500 Index and the Russell 2000 Index for The Tocqueville Select Fund (the “Indices”) for the one-year, three-year, five-year and ten-year periods ended July 31, 2017 for all the Funds. The Trustees considered the above information as helpful in their assessment of whether the Adviser was obtaining for the Funds’ shareholders the performance that was available in the marketplace given each Fund’s investment objectives, policies, strategies, limitations and restrictions. The Trustees concluded that the performance of the Funds against their respective Performance Peer Groups was satisfactory. In particular, the Trustees noted that The Tocqueville Fund had underperformed as compared to its Index for all periods and underperformed the median of its Performance Peer Group for all periods. The Trustees noted that The Tocqueville Opportunity Fund outperformed its Index for the one-year, and three-year periods; underperformed its Index for the five-year and ten-year periods; and outperformed the median of its Performance Peer Group for all periods. The Trustees noted that The Tocqueville International Value Fund outperformed its Index for the three-year, five-year and ten-year periods; underperformed its Index for the one-year period; outperformed the median of its Performance Peer Group for the three-year,
five-year and ten-year periods; and underperformed the median of its Performance Peer Group for the one-year period. The Trustees noted that The Tocqueville Gold Fund outperformed the S&P 500 Index for the one-year period; underperformed the S&P 500 Index for the three-year, five-year and ten-year periods; outperformed the Philadelphia Stock Exchange Gold & Silver Index for the one-year and five-year periods; underperformed the Philadelphia Stock Exchange Gold & Silver Index for the three-year and ten-year periods; outperformed the median of its Performance Peer Group for the one-year period; underperformed for the three-year and ten-year periods; and performed consistently with the median of its Performance Peer Group for the five-year period. The Trustees noted that The Delafield Fund underperformed both of its Indices for all periods; performed consistently with the median of its Performance Peer Group for the one-year period; and underperformed the median of its Performance Peer Group for the three-year, five-year and ten-year periods. The Trustees noted that The Tocqueville Select Fund underperformed both of its Indices for all periods; underperformed the median of its Performance Peer Group for the one-year, three-year and five-year periods; and outperformed the for the ten-year period. The Trustees questioned Mr. Kleinschmidt, in particular, about the underperformance of The Delafield Fund and The Tocqueville Select Fund. He noted that these periods were challenging for the value style of investing used by The Delafield Fund and The Tocqueville Select Fund and, as a result, caused them to trail relevant indices. In addition, as previously communicated to the Board, Mr. Kleinschmidt noted that both The Delafield Fund and The Tocqueville Select Fund have recently added two new co-portfolio managers, Mr. Joshua Kaufthal and Mr. James Maxwell. Finally, he noted that their underperformance in the most recent year had a significant impact on the performance of the other specified periods.
3) The cost of the advisory services and the profits to the Adviser from the relationship with the Trust.
In connection with the Trustee’s consideration of the level of the advisory fees, the Trustees considered a number of factors. The Trustees compared the level of the advisory fees for each Fund against the advisory fees charged by funds in a universe of funds: the Morningstar Large Cap Funds peer group, with average net assets between $212 million and $334 million, for The Tocqueville Fund; the Morningstar Mid-Cap Growth Funds peer group, with average net assets between $38 million and $107 million, for The Tocqueville Opportunity Fund; the Morningstar Foreign Large Blend Funds peer group, with average net assets between $605 million and $1.2 billion, for The Tocqueville International Value Fund; all funds in the Morningstar Precious Metals Funds peer group, with average net assets between $96 million and $2.6 billion, for The Tocqueville Gold Fund; the Morningstar Mid-Cap Value Funds peer group, with average net assets between $109 million and $667 million, for The Delafield Fund; and the Morningstar Small Value Funds peer group, with average net assets between $32 million and $94 million, for The Tocqueville Select Fund (the “Expense Peer Groups”). The Trustees considered comparative total fund expenses of the Funds and the Expense Peer Groups. The Trustees used this comparative fee information and total expense data as a guide to help assess the reasonableness of each Fund’s advisory fee, although they acknowledged
that it was difficult to make precise comparisons with other funds since the exact nature of services provided under each Expense Peer Group fund agreement is often not apparent. The Trustees also viewed the Expense Peer Group fee information as a whole as useful in assessing whether the Adviser was providing services at a cost that was competitive with other, similar funds.
The Trustees noted that the contract rate advisory fee and administration fee for each of the Funds were reasonable, despite the contractual advisory fee rate being above average for The Tocqueville International Value Fund and The Tocqueville Gold Fund and the administration fee being above average for The Tocqueville Fund, The Tocqueville Opportunity Fund, The Tocqueville International Fund, The Delafield Fund The Tocqueville Select Fund when compared to their respective Expense Peer Groups. The Trustees also considered the combined contract rate advisory and administration fee as compared to their respective Expense Peer Group. The Board further observed that the total expense ratios of the Funds were also reasonable. The Board noted that the total expense ratio for The Tocqueville Fund, The Tocqueville International Value Fund, The Delafield Fund and The Tocqueville Select Fund was above average, when compared to their respective Expense Peer Groups and that the total expense ratio for The Tocqueville Gold Fund was below average, when compared to its respective Expense Peer Group. The Board also noted that The Tocqueville Fund and The Tocqueville International Value Fund each operate pursuant to an Expense Limitation Agreement whereby the Adviser has agreed to waive a portion of its fee necessary to limit the Fund’s total operating expenses to the level set forth in the Fund’s prospectus.
The Trustees also considered the profitability to the Adviser and its affiliate arising out of its relationship with the Trust. In this regard, the Trustees reviewed profitability data relating to the Adviser for the 12 month period ended July 31, 2017. The Trustees considered revenues received by the Adviser under the Investment Advisory Agreements and the Administration Agreement as well as revenues received by the Adviser’s affiliate, the Distributor, under the 12b-1 plans and Related Agreements and commissions received for effecting portfolio transactions. The Trustees also received and reviewed the Adviser’s financial statements and the Adviser provided an oral update on its profitability numbers since October 31, 2015. The Trustees concluded that the profitability of the Funds to the Adviser was not excessive.
4) The extent to which economies of scale will be realized as the Funds grow and whether fee levels reflect those economies of scale.
With respect to the Trustees’ consideration of economies of scale, the Trustees discussed with the Adviser whether economies of scale would be realized by it in its management of a Fund at higher asset levels. The Trustees noted that all of the Funds, except for The Tocqueville Select Fund, currently have advisory fee breakpoints and that they were satisfied that the current breakpoints were appropriate when compared with each Fund’s respective Peer Group. The Trustees considered that breakpoints are not necessary at this time for The Tocqueville Select Fund, given the small size of The Tocqueville Select Fund. The Trustees also noted that the administration fee also has
breakpoints. In the event there was significant asset growth in the future in a Fund, the Trustee’s determined to reassess whether the advisory fees and administration fee, including the current breakpoint structure, appropriately took into account any economies of scale that had been realized as a result of that growth.
5) Other Factors.
The Trustees also discussed the Adviser’s practices regarding the selection and compensation of brokers and dealers that execute portfolio transactions for the Funds and the brokers’ and dealers’ provision of brokerage and research services to the Adviser. The Trustees further discussed the potential benefits the Adviser derived from the Funds’ soft dollar arrangements, whereby brokers provide research to the Funds or the Adviser in return for allocating fund brokerage, and other investment data concerning soft dollars. The Board also discussed the Adviser’s use of an affiliated broker to effect portfolio transactions, noting that in addition to paying a competitive rate on commissions, the Adviser believed the Funds received better execution on trades.
Based on a consideration of all these factors in their totality, the Trustees, including all of the Independent Trustees, determined that the Funds’ advisory fees and administration fees were fair and reasonable with respect to the quality of services that the Adviser provides and in light of the other factors described above that the Trustees deemed relevant. The Trustees based their decision on evaluations of all these factors as a whole and did not consider any one factor as all-important or controlling.
3. PROXY VOTING POLICIES AND PROCEDURES
A description of the policies and procedures that The Tocqueville Trust uses to determine how to vote proxies relating to portfolio securities is available without charge upon request by calling 1-800-355-7307. Information regarding how The Tocqueville Trust voted proxies relating to portfolio securities during the most recent 12-month period ended June 30 is available by calling 1-800-355-7307 and it is also available on the SEC’s web site at http://www.sec.gov.
4. SHAREHOLDER REPORTS AND QUARTERLY PORTFOLIO DISCLOSURE
The Tocqueville Trust is required to file its complete schedule of portfolio holdings with the SEC for its first and third fiscal quarters on Form N-Q. The Trust’s Form N-Q will be available without charge, upon request on the SEC’s website (http://www.sec.gov) and may be available by calling 1-800-697-3863. You can also obtain copies of Form N-Q by (i) visiting the SEC’s Public Reference Room in Washington, DC (information on the operation of the Public Reference Room may be obtained by calling 1-202-551-8090); (ii) sending your request and a duplicating fee to the SEC’s Public Reference Room, Washington, DC 20549-1520; or (iii) sending your request electronically to publicinfosec.gov. Quarterly portfolio holdings are also available on the website of The Tocqueville Funds, www.tocquevillefunds.com.
5. SHAREHOLDER NOTIFICATION OF FEDERAL TAX STATUS
For the fiscal year ended October 31, 2017, certain dividends paid by the Funds may be subject to a maximum tax rate of 15%, as provided for by the Jobs and Growth Tax Relief Reconciliation Act of 2003. The percentage of dividends declared from ordinary income designated as qualified dividend income was as follows:
| | | | |
Tocqueville Fund | | | 100.00 | % |
Opportunity Fund | | | 0.00 | % |
International Value Fund | | | 100.00 | % |
Gold Fund | | | 0.00 | % |
Delafield Fund | | | 0.00 | % |
Select Fund | | | 0.00 | % |
For corporate shareholders, the percent of ordinary income distributions qualifying for the corporate dividends received deduction for the fiscal year ended October 31, 2017 was as follows:
| | | | |
Tocqueville Fund | | | 100.00 | % |
Opportunity Fund | | | 0.00 | % |
International Value Fund | | | 3.90 | % |
Gold Fund | | | 0.00 | % |
Delafield Fund | | | 0.00 | % |
Select Fund | | | 0.00 | % |
For the year ended October 31, 2017, the funds designate the following percent of ordinary distributions paid as interest-related dividends under the Internal Revenue Code Section 871(k)(1)(c):
| | | | |
Tocqueville Fund | | | 0.01 | % |
Opportunity Fund | | | 0.00 | % |
International Value Fund | | | 0.75 | % |
Gold Fund | | | 0.00 | % |
Delafield Fund | | | 0.00 | % |
Select Fund | | | 0.00 | % |
The percentage of taxable ordinary income distributions that are designated as short-term capital gain distributions under Internal Revenue Section 871(k)(2)(C) for each Fund were as follows.
| | | | |
Tocqueville Fund | | | 0.00 | % |
Opportunity Fund | | | 0.00 | % |
International Value Fund | | | 0.00 | % |
Gold Fund | | | 0.00 | % |
Delafield Fund | | | 0.00 | % |
Select Fund | | | 0.00 | % |
6. FOREIGN TAX CREDIT
For the year ended October 31, 2017, the Tocqueville International Value Fund earned foreign source income and paid foreign taxes which they intend to pass through to their shareholders pursuant to Section 853 of the Internal Revenue Code as follows:
| | | | | | | | |
Country | | Gross Dividend
Per Share | | | Taxes Withheld
Per Share | |
Australia | | | 0.0097 | | | | 0.0003 | |
Belgium | | | 0.0087 | | | | 0.0013 | |
Brazil | | | 0.0074 | | | | 0.0003 | |
Canada | | | 0.0060 | | | | 0.0009 | |
Denmark | | | 0.0094 | | | | 0.0014 | |
Finland | | | 0.0062 | | | | 0.0009 | |
France | | | 0.0466 | | | | 0.0070 | |
Germany | | | 0.0201 | | | | 0.0027 | |
Hong Kong | | | 0.0096 | | | | — | |
Japan | | | 0.0328 | | | | 0.0033 | |
Netherlands Antilles | | | 0.0068 | | | | — | |
Netherlands | | | 0.0099 | | | | 0.0015 | |
Mexico | | | 0.0056 | | | | 0.0015 | |
South Korea | | | 0.0082 | | | | 0.0014 | |
Spain | | | 0.0105 | | | | 0.0016 | |
Switzerland | | | 0.0255 | | | | 0.0012 | |
| | | | | | | | |
| | | 0.2230 | | | | 0.0253 | |
| | | | | | | | |
Investment Adviser
Tocqueville Asset Management L.P.
40 W. 57th St., 19th Floor
New York, NY 10019
(212) 698-0800
www.tocqueville.com
Distributor
Tocqueville Securities, L.P.
40 W. 57th St., 19th Floor
New York, NY 10019
(212) 698-0800
Shareholders’ Servicing and Transfer Agent
U.S. Bancorp Fund Services, LLC
P.O. Box 701
Milwaukee, WI 53201-0701
(800) 697-3863
Custodian
U.S. Bank, N.A.
Custody Operations
1555 River Center Drive, Suite 302
Milwaukee, WI 53212
Board of Trustees
Robert W. Kleinschmidt—Chairman
Charles W. Caulkins
Alexander Douglas
Charles F. Gauvin
James W. Gerard
William F. Indoe
William J. Nolan III
Tocqueville Funds
c/o US Bancorp Fund Services, LLC
P.O. Box 701
Milwaukee, WI 53201-0701
www.tocquevillefunds.com
TQ-ANNUAL 10/31/2017
The registrant has adopted a code of ethics that applies to the registrant’s principal executive officer and principal financial officer. The registrant has not made any substantive amendments to its code of ethics during the period covered by this report. The registrant has not granted any waivers from any provisions of the code of ethics during the period covered by this report.
Incorporated by reference to the Registrant’s Form N-CSR filed December 30, 2015.
| Item 3. | Audit Committee Financial Expert. |
The registrant’s board of trustees has determined that there is at least one audit committee financial expert serving on its audit committee. James Gerard and William Nolan III are the “audit committee financial experts” and are considered to be “independent” as each term is defined in Item 3 of Form N-CSR.
| Item 4. | Principal Accountant Fees and Services. |
The registrant has engaged its principal accountant to perform audit services, audit-related services, tax services and other services during the past two fiscal years. “Audit services” refer to performing an audit of the registrant’s annual financial statements or services that are normally provided by the accountant in connection with statutory and regulatory filings or engagements for those fiscal years. “Audit-related services” refer to the assurance and related services by the principal accountant that are reasonably related to the performance of the audit. “Tax services” refer to professional services rendered by the principal accountant for tax compliance, tax advice, and tax planning. “Other services” were not provided by the principal accountant. The following table details the aggregate fees billed or expected to be billed for each of the last two fiscal years for audit fees, audit-related fees, tax fees and other fees by the principal accountant.
| | | | | | | | |
| | | FYE 10/31/2017 | | | FYE 10/31/2016 | |
Audit Fees | | | 196,600 | | | | 193,041 | |
Audit-Related Fees | | | 0 | | | | 0 | |
Tax Fees | | | 25,440 | | | | 25,440 | |
All Other Fees | | | 0 | | | | 0 | |
The audit committee has adopted pre-approval policies and procedures that require the audit committee to pre-approve all audit and non-audit services of the registrant, including services provided to any entity affiliated with the registrant.
The percentage of fees billed by Grant Thornton applicable to non-audit services pursuant to waiver of pre-approval requirement were as follows:
| | | | | | | | |
| | | FYE 10/31/2017 | | | FYE 10/31/2016 | |
Audit-Related Fees | | | 0 | % | | | 0 | % |
Tax Fees | | | 0 | % | | | 0 | % |
All Other Fees | | | 0 | % | | | 0 | % |
All of the principal accountant’s hours spent on auditing the registrant’s financial statements were attributed to work performed by full-time permanent employees of the principal accountant.
The following table indicates the non-audit fees billed or expected to be billed by the registrant’s accountant for services to the registrant and to the registrant’s investment adviser (and any other controlling entity, etc.—not sub-adviser) for the last two years. The audit committee of the board of trustees/directors has considered whether the provision of non-audit services that were rendered to the registrant’s investment adviser is compatible with maintaining the principal accountant’s independence and has concluded that the provision of such non-audit services by the accountant has not compromised the accountant’s independence.
| | | | | | | | |
Non-Audit Related Fees | | FYE 10/31/2017 | | | FYE 10/31/2016 | |
Registrant | | | 25,440 | | | | 25,440 | |
Registrant’s Investment Adviser | | | 0 | | | | 0 | |
| Item 5. | Audit Committee of Listed Registrants. |
Not applicable to registrants who are not listed issuers (as defined in Rule 10A-3 under the Securities Exchange Act of 1934).
Schedule of Investments is included as part of the report to shareholders filed under Item 1 of this Form.
Item 7. Disclosure of Proxy Voting Policies and Procedures for Closed-End Management Investment Companies.
Not applicable to open-end investment companies.
| Item 8. | Portfolio Managers of Closed-End Management Investment Companies. |
Not applicable to open-end investment companies.
Item 9. Purchases of Equity Securities by Closed-End Management Investment Company and Affiliated Purchasers.
Not applicable to open-end investment companies.
| Item 10. | Submission of Matters to a Vote of Security Holders. |
There have been no material changes to the procedures by which shareholders may recommend nominees to the registrant’s board of trustees.
| Item 11. | Controls and Procedures. |
| (a) | The Registrant’s President and Treasurer have reviewed the Registrant’s disclosure controls and procedures (as defined in Rule 30a-3(c) under the Investment Company Act of 1940 (the “Act”)) as of a date within 90 days of the filing of this report, as required by Rule 30a-3(b) under the Act and Rules 13a-15(b) or 15d-15(b) under the Securities Exchange Act of 1934. Based on their review, such officers have concluded that the disclosure controls and procedures are effective in ensuring that information required to be disclosed in this report is appropriately recorded, processed, summarized and reported and made known to them by others within the Registrant and by the Registrant’s service provider. |
| (b) | There were no changes in the Registrant’s internal control over financial reporting (as defined in Rule 30a-3(d) under the Act) that occurred during the second fiscal quarter of the period covered by this report that has materially affected, or is reasonably likely to materially affect, the Registrant’s internal control over financial reporting. |
| (a) | (1) Any code of ethics or amendment thereto, that is the subject of the disclosure required by Item 2, to the extent that the registrant intends to satisfy Item 2 requirements through filing an exhibit. |
Incorporated by reference to the Registrant’s Form N-CSR filed December 30, 2015.
(2) A separate certification for each principal executive officer and principal financial officer pursuant to Section 302 of the Sarbanes-Oxley Act of 2002. Filed herewith.
(3) Any written solicitation to purchase securities under Rule 23c-1 under the Act sent or given during the period covered by the report by or on behalf of the registrant to 10 or more persons. Not applicable to open-end investment companies.
| (b) | Certifications pursuant to Section 906 of the Sarbanes-Oxley Act of 2002. Furnished herewith. |
SIGNATURES
Pursuant to the requirements of the Securities Exchange Act of 1934 and the Investment Company Act of 1940, the registrant has duly caused this report to be signed on its behalf by the undersigned, thereunto duly authorized.
| | | | |
| (Registrant) | | The Tocqueville Trust | | |
| | | | |
| | |
| By (Signature and Title)* | | /s/ Robert W. Kleinschmidt | | |
| | Robert W. Kleinschmidt, President | | |
Pursuant to the requirements of the Securities Exchange Act of 1934 and the Investment Company Act of 1940, this report has been signed below by the following persons on behalf of the registrant and in the capacities and on the dates indicated.
| | | | |
| By (Signature and Title)* | | /s/ Robert W. Kleinschmidt | | |
| | Robert W. Kleinschmidt, President | | |
| | | | |
| | |
| By (Signature and Title)* | | /s/ Helen Balk | | |
| | Helen Balk, Treasurer | | |
| * | Print the name and title of each signing officer under his or her signature. |