UNITED STATES
SECURITIES AND EXCHANGE COMMISSION
Washington, D.C. 20549
FORM N-CSR
CERTIFIED SHAREHOLDER REPORT OF REGISTERED
MANAGEMENT INVESTMENT COMPANIES
Investment Company Act file number 811-4840
The Tocqueville Trust
(Exact name of registrant as specified in charter)
The Tocqueville Trust
40 W. 57th St., 19th Floor
New York, NY 10019
(Address of principal executive offices) (Zip code)
Robert W. Kleinschmidt
The Tocqueville Trust
40 W. 57th St., 19th Floor
New York, NY 10019
(Name and address of agent for service)
(212) 698-0800
Registrant’s telephone number, including area code
Date of fiscal year end: October 31
Date of reporting period: October 31, 2014
Item 1. Reports to Stockholders.
ANNUAL REPORT
October 31, 2014
The Tocqueville Trust
Mutual Funds
The Tocqueville Fund
The Tocqueville Opportunity Fund
The Tocqueville International Value Fund
The Tocqueville Gold Fund
The Delafield Fund
The Tocqueville Select Fund
The Tocqueville Alternative Strategies Fund

This report is not authorized for distribution to prospective investors unless preceded or accompanied by a currently effective prospectus of The Tocqueville Trust. Please call 1-800-697-FUND (3863) for a free prospectus. Read it carefully before you invest.
You are invited to visit our website @ www.tocqueville.com/mutual-funds
Dear Fellow Shareholder,
According to the National Bureau of Economic Research Business Cycle Dating Committee, there have been seven economic recessions in the United States since 1969. Paradoxically, the stock market crash of Monday October 19, 1987, when the Dow Jones Industrial Average dropped almost 23% in one day, does not appear on that list. The reason is that even though the market decline was both violent and global, no economic recession ensued. The Federal Reserve managed to convince the banks to continue lending to each other: liquidity was preserved and the economy continued to operate normally.
It is very likely, however, that this scary episode deeply influenced Alan Greenspan, who had only become the Federal Reserve Chairman three months earlier. His whole tenure at the “Fed” (1987-2006) was marked by the tacit promise (the Greenspan Put) that the Fed would intervene to provide ample liquidity to the financial system as soon as the stock market declined significantly and threatened to destabilize the whole economy.
The recessions I remember, since 1969, followed a similar pattern. Central Banks, the U.S. Federal Reserve for example, tended to intervene towards the end of recessions by injecting free or very low-cost reserves into their banking system. Since this took place during a recession, when banks were still leery of lending and potential borrowers were scarce, commercial banks would invest most of these low-cost funds into Treasury securities. There was little immediate effect on economic activity, but this action allowed the banks to make a small but positive margin at zero risk, which offset the charges incurred from writing-off the bad loans extended during the previous boom. When bank balance sheets had been repaired and credit demand from the private sector eventually recovered, banks would be ready to lend anew.
The basic pattern has not changed materially in more recent years, but the Greenspan Put first, and then ZIRP (Zero Interest Rate Policy) and various stages of QE (Quantitative Easing) under Fed Chairman Ben Bernanke have institutionalized the role of the Fed as protector of the investment community. Some observers have claimed that, by tacitly eliminating the risk of large losses from the stock markets, the Fed and other central banks have contributed to the buildup of the next bubble, as they did with dot-com stocks in the late 1990s and sub-prime mortgages in the mid-2000s. History will tell, but one thing is sure: This is the way investors have played the game since 2009.
Economies have recovered in Europe, Japan and most emerging markets, but at very disappointing rates. The U.S. recovery has been more dynamic but still uneven. As a result, there exists ample unused capacity around the world and inflationary pressures have, so far, been feeble enough to give comfort to the major western Central Banks that their stimulus policies are appropriate; some European politicians actually are agitating for more. For the economies, that is. But since there is widespread concern in the public that, when the economies recover in earnest, the financial markets may suffer a withdrawal syndrome from the closure of the monetary floodgates, the new pattern for stock markets, has been to weaken when the economies accelerate and to recover in earnest as soon as economic activity seems to stumble—with faith that central banks’ monetary stimulus would then resume.
Of course, there has never been a precise correlation between economic activity and the stock market, except over the very long term. Nevertheless, the kind of (historically) perverse reasoning that has recently prevailed sounds like it deserves to be regarded with caution. Mostly because one cannot tell how long the game can be played, but for sure it is not forever because inflation and higher interest rates are sure to return one day as a result of the massive amount of money that has been injected into the world’s banking systems.
Fortunately, not all markets have been as buoyant as those for large-capitalization U.S. stocks. Many smaller companies as well as equities of emerging-markets have been moving toward more conservative valuations, while a relatively small sample of large companies or “trendy” sectors kept up the momentum of major indexes.
Opportunity in selectivity should be a challenging but favorable environment for discipline-oriented managers like the ones at Tocqueville.
Respectfully,

François Sicart
Chairman
| Annual Report | 1 |
The Tocqueville Fund
Dear Fellow Shareholder,
The Tocqueville Fund’s fiscal year that ended October 31, 2014 was full of surprises. Equity markets continued their upward trajectory throughout the year, overcoming several brief but sharp corrections that tested investor resolve before eventually returning to near record levels as the year came to a close. The bull market that some have argued has gone on too long ploughed right through a variety of macroeconomic and geopolitical concerns, any one of which might have been enough to turn the tide of investor sentiment, including multiple conflicts in the Middle East, a Russian incursion into the Ukraine, sharp price declines across the commodity complex, economic uncertainty in China and malaise in Europe, not to mention the Ebola scare in the U.S. That the market withstood these forces was indeed surprising perhaps but the biggest surprise (to most, though not us) was that interest rates failed to rise despite the “tapering” of the Fed’s quantitative easing initiative.
Over the past year, the Fund returned 13.43% while the S&P 500, the index against which the Fund is most often compared, gained 17.27%. This result is mildly disappointing when compared to the benchmark, and due largely to the performance of the positions in the energy sector, but it is better than we would have expected following last year’s strong results and the various headwinds described above.
The top performing sectors of the Fund in the past year were information technology, healthcare and industrials. while energy, materials and telecommunications were the laggards. The top individual contributors to portfolio performance were the pharmaceutical companies Allergan, which is the subject of an ongoing contested takeover, Isis Pharmaceuticals and Alkermes, two small capitalization, relatively early stage biotechnology companies, along with large cap technology stalwarts Microsoft and Xerox; while the largest detractors from performance were the energy companies Bill Barret Corporation, Energy XXI, and Frank’s International, along with Goldcorp, and surprisingly Ford.
As we see it, two of the fundamental forces that move risk markets are the cost of capital and the rate of economic growth. The cost of capital is tied to interest rates and, as the bull market marched onward in spite of the Fed’s plans to reduce its intervention into fixed income markets. Many investors believed that interest rates were set to rise once the Fed ended its bond purchases and began to shrink its balance sheet, increasing the cost of doing business for net borrowers and the discount rate for investors, and positioned their portfolios accordingly. That has certainly been one of the root causes of the brief bouts of volatility the market has seen over the past year.
The other driver of these corrections has been repeated scares that the global economy was weakening sufficiently to cause growth problems here at home. We too have been worried that double digit returns on equities would seem hard to support indefinitely on 2% GDP growth. U.S. dollar strength, export demand weakness and falling commodity prices have added to the concern that corporate profits might be topping out after several years of profit growth which has been driven by margin expansion rather than material improvement in top line revenues. Recent poor performance of energy and other commodity driven companies as well as those of multinationals, particularly industrials, is testimony to that concern. But, it is also true that lower commodity prices, particularly lower energy prices represent a significant cost reduction to most developed countries and companies. The markets seem to be missing this obvious long-term positive factor.
Despite the end of quantitative easing, the Fed is unlikely to change its key rates until things stabilize both here and abroad. With $18 trillion in public sector debt at the Federal level, the Fed has to be wary of what higher interests rates would do to the Federal fiscal landscape and, might better wait until the Federal government gets its fiscal house in order before adding to the burden of carrying all this debt. Also, offsetting the Fed’s taper have been a reduced supply of new Treasuries as budget deficits have shrunk as well as the actions of just about every other central bank around the globe which seem intent to devalue their own currencies to gain export advantage and stimulate their own economies. Low rates abroad and geopolitical uncertainty is driving foreign investors to step up their purchasing of Treasuries just as the Fed steps away.
While we could be wrong and the oft cited bond vigilantes could come out of the woodwork at any time and sooner rather than later, it does seem that rates and the cost of capital component of the risk market debate are likely to remain accommodating for some time.
| 2 | October 31, 2014 |
This leaves the growth component of the valuation equation as the determining factor. There are a few positive influences that lead us to conclude that growth may be better than expected and help us remain optimistic about equities despite the various concerns mentioned above. One of these is that we appear to be entering a period of lower energy prices driven by an increase in supply coming from new extraction technologies and soft demand in a slow global growth environment. While this isn’t great for those highly levered exploration and production companies, it is, as noted, a real tailwind for many businesses and consumers. An improvement in real wages and disposable income is the fuel that drives the consumption component of the economy. The vast middle class hasn’t experienced much of that during the post financial crisis period, but lower energy prices, coupled with restrained labor costs and continued low costs of capital, will contribute to improving the competitiveness of domestically sited manufacturing. This, in turn, and in due course, should have a salutary impact on consumer’s budgets.
Another positive factor for the economy is that bank loan growth is starting to expand. Many investors have been expecting inflation as a byproduct of the Fed’s balance sheet expansion and loose monetary policy (and as the hidden means to address the U.S. Government’s debt and fixed entitlement obligations). For the most part this hasn’t happened, as banks have been forced to retain greater capital, exit so-called “risk” businesses, and increase legal reserves, in an effort to repair their balance sheets and respond to greater regulation. If bank loan growth does pick up sustainably, economic growth could be greater than widely expected, at least nominally.
The global economic outlook may also be more gloomy than warranted. The European Central Bank continues to make incremental progress in recovering from its financial crisis, and may step up its stimulative efforts. Were that to occur, it might further improve that regions prospects. Japan has recently taken surprising steps to weaken the Yen even further to improve export demand. China, while targeting lower growth than in recent history and combating graft and consumer excesses, is also still working on stimulus programs.
Lastly, while it would be naive to expect any real progress, there is some prospect that the highly anticipated Republican victory in mid-term elections might lead to economically helpful legislation. If the President and Congress cancould set aside their differences, they might well be able to fashion some bi-partisan solutions to some well recognized problems. Corporate tax reform would be a favorite for investors, particularly more globally competitive tax rates and the elimination of the unitary tax provision which punishes U.S. companies for repatriating already taxed foreign income. Immigration reform might also be a boon to certain businesses and a way to offset declines in labor force participation, or at least that portion of it caused by demographics. Changes in energy policy, if they can be accomplished in a way that doesn’t hurt domestic consumers, could stabilize the current glut in that sector and open up new markets for domestically produced oil. That is a wish list perhaps, but hardly fanciful.
On balance, it is these forces and possibilities that lead us to remain constructive on U.S. equities, particularly in relation to fixed income assets which we expect to be range bound for some time. Even after a multi-year bull market there are sectors and companies that fall out of favor. We will continue to search for these opportunities to purchase quality businesses at a substantial discount to intrinsic value.
Thank you for your continued support,
Sincerely,

Robert W. Kleinschmidt
Portfolio Manager
| Annual Report | 3 |
The Tocqueville Fund
(Unaudited)
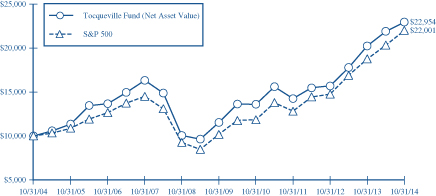
This chart assumes an initial gross investment of $10,000 made on 10/31/04. Returns shown do not reflect the deduction of taxes that a shareholder would pay on fund distributions or the redemption of fund shares. Performance reflects fee waivers in effect. In the absence of fee waivers, total return would be reduced. Returns shown include the reinvestment of all dividends and other distributions. Past performance is not predictive of future performance. Investment return and principal value will fluctuate so that your shares, when redeemed, may be worth more or less than their original cost. The Fund imposes a 2% redemption fee on shares held for 90 days or less.
The Standard & Poor’s 500 Stock Index (S&P 500) is a capital-weighted index, representing the aggregate market value of the common equity of 500 stocks primarily traded on the New York Stock Exchange. Returns assume the reinvestment of all dividends.
AVERAGE ANNUAL RATE OF RETURN (%)
FOR PERIODS ENDED OCTOBER 31, 2014
| 1 Year | 3 Year | 5 Year | 10 Year | |||||||||||||
The Tocqueville Fund | 13.43% | 17.24% | 14.77% | 8.66% | ||||||||||||
Standard & Poor’s 500 Stock Index | 17.27% | 19.77% | 16.69% | 8.20% | ||||||||||||
| 4 | October 31, 2014 |
The Tocqueville Opportunity Fund
Dear Fellow Shareholder,
We are pleased to provide this review of the Tocqueville Opportunity Fund’s performance for the fiscal year ended October 31, 2014. The Fund out performed its SMID cap (small/midcap) growth benchmark (the Russell 2500 Growth Index) for the fiscal year with a gain of 12.55% versus the benchmark return of 10.24%. Through the calendar year to date ended October 2014, the Fund also out performed with a gain of 6.10% versus the benchmark increase of 3.98%. The past fiscal year has been a bit of an unusual period for SMID cap stocks as headway has been difficult to establish given price volatility and rapid changes in sentiment.
The Fund experienced seven corrections of significance (10% or greater) since I assumed oversight of the Fund in the summer of 2010—with the average correction occurring every 6-7 months. In all of the prior cases, the corrections proved to be short lived, and the Fund moved to newer highs. Almost like clockwork, another correction hit the SMID cap (and the large cap) indices in early September. This most recent and last correction of nearly 11% was one month in duration, and once again provided plenty of fodder for market timers and bears, but sellers were severely whipsawed as SMID caps roared back and the Fund gained nearly 14% in just the last two weeks of the fiscal period! Corrections are unsettling, but they have continued to present numerous opportunities to increase the Fund’s investments in innovative companies that are achieving milestones and flawless execution. Sentiment driven corrections are generally driven by short-term oriented traders who are preoccupied with macroeconomic and political events and are not focused on investment fundamentals. Over the past year there have been five price swings of 10% or more—3 ups and 2 downs—which have allowed valuations to compress against prices and earnings growth, and proven to be excellent times for us to increase our investments in the strongest core positions.
We have continued to increase investments in the Healthcare and Technology sectors during the past twelve months. Most of the allocation to these sectors has come from a reduction in the economy sensitive sectors—particularly Basic Materials, Producer Durables, and Energy. A year ago, economy sensitive investments represented the largest collective sector based holdings for the Fund and reflected a positive view on the pace of the economic recovery. Economy sensitive sector allocations have been reduced from nearly 42% to 30% over the past year with decreases concentrated in automobile supply, housing, and European exposed manufacturing firms. Also, Energy investments have been reduced over the past year based on an ongoing view that technological advances would ultimately lead to imbalances in the global equilibrium in oil demand and supply—at the period’s end, the Fund had less than 1% of its holdings invested in Energy. For the first time in our lifetimes, the prospect of real competition driven by technology, conservation, alternative energy, and failing collusion could completely change the paradigm for investments in this sector. Healthcare sector investments comprised the largest single sector commitments in the Fund as of the end of the fourth quarter at 31% versus 23% last year—this increase was driven most significantly by appreciation of existing holdings—Healthcare investment returns were the leading contributors to both the Fund and the benchmark during the year. On a stand-alone basis, the Consumer and Technology sectors were #2 and #3 respectively at 19.5% and 19% of the Fund’s holdings. Over the past year, Technology investments were increased by nearly one-half with a particular emphasis on software companies which are providing new and disruptive services—these investments were significantly increased during the sentiment driven sell off in Technology holding in March and April this year, and Technology investments were the second leading contributors to the Fund’s performance for the year.
The Fund’s sector level investments provided relative out performance in 9 of the 11 measured sectors (Energy and Oils combined). Aside from the leading contributions of Healthcare and Technology investments, the Fund’s low allocation to Energy led to significant value added relative to the benchmark. Automobile, Transportation and Consumer investments accounted for additional positive relative performance. As we wrote in our semi-annual letter, we have maintained a very constructive view on the airline industry—this view was temporarily shaken by recent, ill- timed capacity expansions and the Ebola crisis, but appeared to be back on track at period end. The Fund’s performance was negatively impacted by its Utilities and Basic Materials exposures—or rather the lack of these exposures; the Fund held no Utility investments during the period, and was under weighted in certain Materials investments which appreciated significantly.
| Annual Report | 5 |
Eleven of the Fund’s top 15 contributors to performance were Healthcare investments, including: Forest Laboratories (acquired) and Actavis (acquirer) and Alnylam (the leading contributor). During the period, Algeta was acquired and Allergan was a named target by Valeant Pharmaceutical. The three Technology investments included: Manhattan Associates, Palo Alto Networks and Concur Technologies—Concur is being acquired by SAP. The investment in Delta Air Lines was the second leading contributor to the Fund’s relative performance. On the flip side, the Fund had several meaningful disappointments despite its diversification strategy—Intercept Pharmaceuticals and Aegerion Pharmaceuticals accounted for nearly 1% drag; and the Fund did not own Intermune which was acquired in the late summer. On an absolute basis, the Fund had 34 investments (common stock) which appreciated 50% or more during the period versus 6 which declined 50% or more. The leaders included Regulus Therapeutics, Puma Biotechnology, and Skyworks Solutions and three takeovers - Forest Labs, Hillshire and OpenTable. Of the six losers, five were Healthcare names and included the aforementioned Intercept and Aegerion as well as Sarepta Therapeutics, Dicerna Pharmaceuticals and Sangamo Biosciences.
As noted above, the past year’s volatility has provided several great shots to increase investments in the Fund’s leading companies. The top 50 holdings at the end of the fiscal year comprised over 52% of the Fund versus 37.5% one year ago. While we have continued to diversify the Fund against single issue risks, the Fund is very actively managed vis-à-vis its benchmark—of the top 50 positions weighting of 52%, less than 9.5% overlaps with the benchmark itself. For the Fund in total, the overlap with the benchmark at the period’s end was less than 37% - the Fund is very diversified, but very actively invested. We continue to employ fundamental research in a classically driven effort to identify and to invest in the leading companies and the companies which we expect to be tomorrow’s leaders. We want to own companies which innovate and reinvent, gain market share, set prices, expand and invest—companies which sustain competitive advantage and capital returns. We continue to be very optimistic with regard to investment opportunities and the appreciation potential within the SMID cap category, and we particularly appreciate your ongoing confidence in our efforts on behalf of the Fund and its shareholders.
Sincerely,

Thomas R. Vandeventer
Portfolio Manager
| 6 | October 31, 2014 |
The Tocqueville Opportunity Fund
(Unaudited)
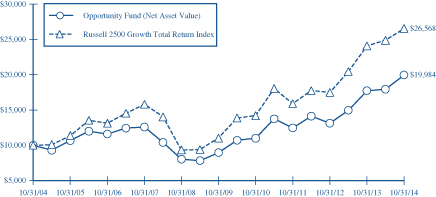
This chart assumes an initial gross investment of $10,000 made on 10/31/04. Returns shown do not reflect the deduction of taxes that a shareholder would pay on fund distributions or the redemption of fund shares. Performance reflects fee waivers in effect. In the absence of fee waivers, total return would be reduced. Returns shown include the reinvestment of all dividends and other distributions. Past performance is not predictive of future performance. Investment return and principal value will fluctuate so that your shares, when redeemed, may be worth more or less than their original cost. The Fund imposes a 2% redemption fee on shares held for 90 days or less.
The chart and table primarily reflect The Opportunity Fund’s performance achieved prior to the changes effected in 2010 to its investment strategy.
The Russell 2500 Growth Total Return Index is an unmanaged index that measures the performance of the small to mid-cap growth segment of the U.S. equity universe. It includes those Russell 2500 companies with higher price-to-book ratios and higher forcasted growth values. Returns assume the reinvestment of all dividends.
AVERAGE ANNUAL RATE OF RETURN (%)
FOR PERIODS ENDED OCTOBER 31, 2014
| 1 Year | 3 Year | 5 Year | 10 Year | |||||||||||||
The Tocqueville Opportunity Fund | 12.55% | 17.00% | 17.34% | 7.17% | ||||||||||||
Russell 2500 Growth Total Return Index | 10.24% | 18.64% | 19.20% | 10.26% | ||||||||||||
| Annual Report | 7 |
The Tocqueville International Value Fund
Dear Fellow Shareholder,
For the fiscal year ended October 31, 2014, the Tocqueville International Value Fund’s total U.S. dollar return was -0.04%. In the same period, the Morgan Stanley EAFE Index Net, the index against which we are most often compared, had a net total U.S. dollar loss of -0.60%. For the 10 year period ended October 31, 2014, the Tocqueville International Value Fund’s total U.S. dollar return was 93.61%. In the same period, the Morgan Stanley EAFE Index Net had a net total U.S. dollar return of 75.84%.
During the year, global equity markets had mixed results, as investors grappled with the potential impact of the end of quantitative easing in the U.S., weaker than expected manufacturing data from China and core Europe, the implications of geopolitical unrest in Ukraine and the Middle East, an outbreak of the Ebola virus, and renewed concerns about deflation and peripheral Europe. Markets in the U.S. and Japan had gains in local currency terms, driven by improving corporate earnings coupled with persistent low interest rates, while markets in Europe had losses on the back of disappointing economic data. Index results were generally flattered by a narrow group of large cap stocks, while the broader markets fared less well. With the U.S. economy growing at a healthy pace relative to most developed nations, and quantitative easing in the U.S. nearing its end, the U.S. dollar strengthened meaningfully against most currencies, resulting in flat to down returns in U.S. dollar terms in most non-U.S. markets. China and certain Asian emerging markets were notable exceptions, while emerging markets in Eastern Europe and Latin America were hard hit. In the context of increasing volatility and a growth scare, large caps fared better than smaller companies, and economically sensitive companies fared poorly, particularly in Europe. Commodity prices generally declined, as did the share prices of commodity producing companies. In terms of sectors, declines in Europe were led by auto related, building materials and food retail shares, and in Japan by marine transport, pulp & paper and energy.
While the Fund’s positions in Japan and Asia performed well during the period and it avoided problems in emerging markets, the results were hurt by the Fund’s exposure to economically sensitive stocks in core Europe. Notable contributors to gains include Japanese optical glass maker Hoya, U.K. emergency home repair insurer Homeserve, Singapore mail and logistics company Singapore Post, subject of a strategic investment by Chinese online retailing giant Alibaba, Hong Kong based outdoor advertising concern Clear Media, and Japanese imaging technology company Fujifilm. The Fund had meaningful losses in UK food retailer Tesco, Italian auto parts maker Sogefi, French oil country tubular goods maker Vallourec, French wire and cable producer Nexans, French marketing research concern Ipsos, and Dutch textile technology company Royal Ten Cate.
During the period, the Fund exited its positions in Telecom Italia, Dutch logistics concern TNT Express, Japanese athletic footwear maker Asics, French design software concern Dassault Systemes, oil service company Schlumberger, Japanese industrial automation concern Omron, and Japanese test and measurement maker Horiba, as they approached our estimates of intrinsic value. Fugro was sold when a new senior management team announced a large capital expenditure program, undercutting the central tenet of the investment thesis, which was based on harvesting free cash flow from prior investments. Also sold was Itau Unibanco, as we came to believe that our fundamental thesis will be overshadowed by deteriorating political circumstances in advance of Brazil’s Presidential election. The Fund exited its position in uranium producer Cameco, when the Japanese government extended the timetable for the reintroduction of nuclear power generation capacity. Tesco was sold when it became evident that the management has used aggressive accounting methods to inflate earnings.
The Fund took new positions in Canadian fuel distribution and chemical concern Superior Plus, a strong franchise where cost reductions under a new management team and the completion of a capital expenditure program should yield a substantial expansion in free cash flow; in Hong Kong real estate concern Hopewell Holdings, which trades at a meaningful discount to net asset value; in Korean consumer electronics maker Samsung Electronics, which is temporarily depressed due to investor concerns about competition in its smartphone business, trades at a single digit multiple of free cash flow and has an unrecognized asset in its memory chip business, an industry where pricing is benefitting from consolidation. The Fund took a new position in Japanese time recording equipment maker Amano, which is generally
| 8 | October 31, 2014 |
unknown to non-Japanese investors but has dominant market shares in Japan and Asia, strong free cash flow generation, excess cash and an investor friendly management team. Another new position was French market research firm Ipsos, a cash generative franchise in which the Fund has previously invested, which had declined recently in connection with market concerns about accelerating competition from social media and other digital means of data collection. In our view the concerns are overdone, the stock trades at a steep discount to its takeover value, and an eventual sale of the company is likely. A new position was initiated in Ireland domiciled Actavis, an emerging drug giant that trades at a low valuation of free cash flow pro forma for its recent acquisition of Forest Labs, and where management generally has a stellar track record of value enhancing acquisitions. Another new position is in Japanese motion picture producer and distributor Toho, which has net cash and real estate equal to the value of the shares. Positions in Misumi, Disco, Incitec Pivot, Kao, Sanofi, CRH, Akzo Nobel, Vallourec, Saint Gobain, Nexans, and Sogefi, inter alia were increased.
During the period, there was a decrease in the Fund’s exposure to Europe and Latin America and an increase in exposures to Japan and Asia. The Fund began the period with approximately 6% in cash reserves and finished the period with 7% in cash reserves.
The baseline macro scenario is: Europe experiences a gradual recovery, but it remains a growth challenged region in need of deep structural reforms; China averts a hard landing and consumer led growth settles at a lower but still healthy level; the U.S. continues to grow, though below potential; Japan achieves mild reflation and consumer sentiment there improves; inflation is more probable in light of serial monetary easing; the Yen is likely to decline in value against the Pound, Euro and U.S. dollar as the government there pursues an aggressive policy of devaluation.
In the U.S., we continue to be concerned about high corporate profit margins and the fact that equity valuations have been abetted by financial and tax engineering, in addition to lax monetary policy. For developed markets generally, certain emerging markets heretofore presumed to be a source of growth for multinationals have become a headwind, due both to slowing growth and to the declining value of currencies. In Europe, tensions in the Middle East and sanctions on Russia are having a direct impact on some businesses and, perhaps more importantly, a depressing effect on business sentiment, while a moderation of growth in China is affecting the German export machine.
In this context, we continue to focus our research efforts on idiosyncratic situations, particularly where activists are involved or we believe are likely to get involved. The Fund is also focusing more attention on Europe, where as noted weak economic data and geopolitical tensions have produced a sharp pullback in cyclical stocks. In Japan, there continue to be opportunities in companies that export to the global marketplace and companies where new and younger management teams are focused on improving profitability and capital allocation.
To protect and grow your capital, we continue to seek out companies that have defensible business franchises, pricing power, limited financial leverage and the ability to return cash to shareholders, and which trade at a discount to intrinsic value based on future cash flows in a conservative economic growth scenario.
Respectfully,
 |
James Hunt
Portfolio Manager
| Annual Report | 9 |
The Tocqueville International Value Fund
(Unaudited)

This chart assumes an initial gross investment of $10,000 made on 10/31/04. Returns shown do not reflect the deduction of taxes that a shareholder would pay on fund distributions or the redemption of fund shares. Performance reflects fee waivers in effect. In the absence of fee waivers, total return would be reduced. Returns shown include the reinvestment of all dividends and other distributions. Past performance is not predictive of future performance. Investment return and principal value will fluctuate so that your shares, when redeemed, may be worth more or less than their original cost. The Fund imposes a 2% redemption fee on shares held 90 days or less.
The MSCI EAFE Index is an unmanaged market-capitalization-weighted index composed of companies representative of the market structure of 21 Developed Market Countries in Europe, Australia, Asia and the Far East.
AVERAGE ANNUAL RATE OF RETURN (%)
FOR PERIODS ENDED OCTOBER 31, 2014
| 1 Year | 3 Year | 5 Year | 10 Year | |||||||||||||
The Tocqueville International Value Fund | -0.04% | 7.91% | 7.90% | 6.83% | ||||||||||||
MSCI EAFE Net Index | -0.60% | 9.68% | 6.52% | 5.81% | ||||||||||||
MSCI EAFE Gross Index | -0.17% | 10.17% | 7.00% | 6.29% | ||||||||||||
| 10 | October 31, 2014 |
The Tocqueville Gold Fund
Dear Fellow Shareholder,
The Tocqueville Gold Fund declined 20.07% during the fiscal year ended October 2014, while the Philadelphia Gold and Silver Index, declined -30.89%, the Standard & Poor’s 500 Index increased 17.27% and the gold price fell 11.49% to finish the period at $1,171.60 per ounce. The top three performers in the Fund over this period included Anthem United Inc., GoGold Resources Inc. and Barisan Gold Corp. which appreciated by 141.5%, 47.0% and 41.4%, respectively. The bottom three performers were Ivanhoe Mines Ltd., East Asia Minerals Corp. and IAMGOLD Corp. which declined by 68.8%, 63.0% and 62.9%, respectively.
During the first quarter of the fiscal year, as the gold price put in a bottom for 2013, gold equity investors sold positions into market weakness to capture tax losses. However, by the turn of the calendar year, markets reassessed the overdone correction in gold and gold equities, as an opportunity. Gold prices and gold mining stocks turned up quickly with the start of the new calendar year. The value observed by gold stock investors was not lost on gold mining companies either. Goldcorp initiated a hostile bid in January for one of the Fund’s largest equity positions, Osisko Mining, which was wrapping up some of the start-up challenges of operating its newly built Malartic mine and beginning to settle in to more steady state production and cash flow generation. Osisko Mining was ultimately taken over with a friendly offer from Agnico Eagle Mines Limited and Yamana Gold Inc., both prominent positions in the Fund prior to their combined cash and stock offer for Osisko Mining. Even though Goldcorp was not successful with its bid, it did attract a broader interest in the sector’s low valuations, as investors sought out other potential take-out candidates. Detour Gold, also in the Fund, was one that became the subject of market commentary as a potential target and its stock rose in response, which added to the contribution Osisko Mining’s performance made to the Fund during the first nine months of fiscal 2014.
The middle of the fiscal year—February through July—continued to see a renewed interest in gold and gold stocks, with robust enthusiasm during the first few months and then more reluctantly, as general equity and bond markets attempted to factor in sluggish global economic growth and the U.S. Federal Reserve’s future interest rate policy. During this period, precious metal equities did outperform broader markets by a large margin and investors seemed to prefer exposure through royalty companies such as Franco Nevada Corporation, Royal Gold Inc. and Silver Wheaton Corp. Through most of the year those companies represented about 10% to 15% of the Fund’s overall investment in the precious metals equity sector. The royalty companies enjoy a business model that participates directly in metal production and revenues with less direct exposure to the operating risks and costs that precious metal mining companies are exposed to. Additionally, royalty companies have more flexibility and are more disciplined with their allocation of capital. Along with their diverse exposure to various sources of gold production or royalties, and reduced risk exposure, they tend to receive a much better valuation. The weighting exposure to the royalty companies and their performance made a considerable difference to the Fund’s returns throughout the year but especially during the middle of the year.
While the first nine months of the fiscal year showed impressive gains for the Fund’s precious metal equities positions, outperforming the S&P 500 during that time-frame; those strong gains were confronted with a bout of weakness for gold which began in late August and coincided with the breakdown of the Yen and the Euro vs. the U.S. dollar. Commentators from all quarters became aggressively negative on gold and increasingly on gold stocks with a chorus that seemed unanimously bearish during the last three months into late October. Meanwhile, investors seemed more committed to the performance in U.S. equity and bond markets as they left gold behind. The Fund’s weighting in gold bullion, the Fund’s largest investment position, tempered the decline in precious metal mining stock performance during the final fiscal quarter. Gold prices fell about a quarter of what gold equities corrected, offering a degree of stability in a sector that moved quickly from strong outperformer to underperformer as markets witnessed weaker Yen and Euros relative to the U.S. dollar.
As we start a new fiscal year, we have become more enthusiastic about values in the gold sector, and are witnessing more asset sales and signs of mergers and acquisitions. The lower gold price will make it more difficult for some of the higher cost producers to carry on, which will likely result in consolidation, usually a healthy development for a beaten up industry. M&A activity tends to attract capital and along with that higher valuations, in addition to a new commitment to profitability.
| Annual Report | 11 |
We continue to seek investments for the Fund in well managed companies with strong balance sheets and assets, which are able to create value independently of gold price action. Value creation comes about in numerous ways, whether it’s progress in the construction of new mines, or successful exploration or M&A activity. We believe that during 2015, cost cutting, capital allocation and M&A activity will likely be some of the main topics precious metal stock investors and market speculators will focus on. We continue to believe that investing in the securities of well managed precious metal mining and royalty companies, with sound balance sheets, offers the most dynamic and reliable exposure to the upside potential in the gold price. Our research activity and portfolio selection is based on emphasizing the value creators in the sector and avoiding the value destroyers.
Best regards,
 |
| |
| John C. Hathaway | Douglas B. Groh | |
| Portfolio Manager | Portfolio Manager |

| 12 | October 31, 2014 |
The Tocqueville Gold Fund
(Unaudited)
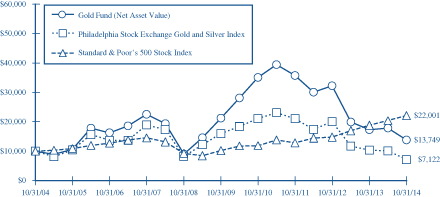
This chart assumes an initial gross investment of $10,000 made on 10/31/04. Returns shown do not reflect the deduction of taxes that a shareholder would pay on fund distributions or the redemption of fund shares. Performance reflects fee waivers in effect. In the absence of fee waivers, total return would be reduced. Returns shown include the reinvestment of all dividends and other distributions. Past performance is not predictive of future performance. Investment return and principal value will fluctuate so that your shares, when redeemed, may be worth more or less than their original cost. The Fund imposes a 2% redemption fee on shares held 90 days or less.
In 2006, 2009, and 2010 the performance of The Tocqueville Gold Fund was achieved during a period of unusually favorable market conditions. Such performance may not be sustainable.
The Philadelphia Stock Exchange Gold and Silver Index is an unmanaged capitalization-weighted index which includes the leading companies involved in the mining of gold and silver. Returns include the reinvestment of all dividends.
The Standard & Poor’s 500 Stock Index (S&P 500) is a capital-weighted index, representing the aggregate market value of the common equity of 500 stocks primarily traded on the New York Stock Exchange. Returns include the reinvestment of all dividends.
AVERAGE ANNUAL RATE OF RETURN (%)
FOR PERIODS ENDED OCTOBER 31, 2014
| 1 Year | 3 Year | 5 Year | 10 Year | |||||||||||||
The Tocqueville Gold Fund | -20.07% | -27.11% | -8.21% | 3.24% | ||||||||||||
Philadelphia Stock Exchange Gold and Silver Index | -30.89% | -30.18% | -14.87% | -3.32% | ||||||||||||
Standard & Poor’s 500 Stock Index | 17.27% | 19.77% | 16.69% | 8.20% | ||||||||||||
| Annual Report | 13 |
The Delafield Fund
Dear Fellow Shareholder,
Markets exhibited extraordinary resiliency early in the fiscal year, shrugging off the government shutdown in October 2013 and advancing to near all-time-highs despite ongoing concerns about the tapering of the Fed’s quantitative easing program, only modest improvement in labor data, and mixed signals from the housing market. Broadly speaking, investors remained favorably disposed to equities for the balance of the fiscal year, though episodic sell-offs seemed to reveal an underlying nervousness among investors. For example, solid corporate earnings results in February convinced investors that concurrent weak retail and housing data were only temporary and weather driven, and so markets rose across the board. However, in March, a lack of favorable data points seemed to trigger profit taking, and markets began to come under pressure, which continued into April with the release of weaker than expected first quarter domestic economic data. Then, as temperatures began to rise, both economic activity and the stock market began to rebound. Specifically, improved consumer confidence, jobs and housing reports during the latter part of the second calendar quarter seemed to be the tonic for a jittery market, and most major indices experienced solid gains despite renewed geopolitical flare-ups in the Middle East and Ukraine. The next selloff occurred in July, after the Federal Reserve’s meeting commentary caused investor anticipation of a near term interest rate hike. The volatile situation in both the Middle East and Ukraine also seemed to weigh on the markets. Mostly favorable domestic economic data released throughout August offered a respite, albeit only temporarily, as September brought with it renewed worries over slowing growth in foreign economies, particularly Europe and China, as well as reduced corporate earnings expectations heading into earnings season. These concerns then faded to close out the year, with the market rebounding in October.
The Fund’s performance, which had been satisfactory through the midpoint of the period, deteriorated in the latter half and resulted in a disappointing fiscal year. For the twelve months ended October 31, 2014, The Delafield Fund’s net asset value increased 1.58% to $36.40 per share. During the same twelve months, on a total return basis, the Russell 2000 Index (“Russell 2000”) posted an 8.06% increase, while the Standard & Poor’s 500 Index (“S&P 500”) increased 17.27%. Owing to the smaller average market capitalization of companies in the Russell 2000, we view it as the more appropriately comparative index to the Fund.
During the year, exposure to the energy sector was increased after identifying a number of compelling investment opportunities in the equipment and services and oil/gas consumable fuels industries. However, our timing proved to be early. Several of the energy companies have progressed somewhat more slowly on their turnarounds than we had anticipated and experienced earnings related disappointments. Later in the fiscal year, a global decline in oil prices further pressured all energy sector stocks, though the shares of the smaller capitalization energy names in which the Fund was invested were particularly impacted. In aggregate, the Fund’s energy holdings were responsible for nearly 300 basis points of negative absolute performance and roughly 165 basis points of relative underperformance when compared to the Russell 2000. One energy sector stock, Energy XXI Ltd. was the largest individual detractor from the fiscal year performance. Shares were initially purchased believing that its anticipated acquisition of EPL Oil & Gas would consolidate its position in the Gulf Coast shelf leading to efficiencies of operation and substantial free cash flow. However, due to some unexpected operating inefficiencies, the decline in the price of oil referenced earlier, and then late in the fiscal year, tax loss selling, the shares declined radically.
Performance in the specialty retail and metals and mining industries were also detrimental to the absolute and relative return this year (about 225 and 250 basis points, respectively). In specialty retail, Ascena Retail Group Inc. was the primary culprit, with the shares off on weaker than expected near-term results in a challenging retail environment. However, our thesis on this stock remains intact, and the position was opportunistically added to. The disappointing metal and mining performance was largely driven by Molycorp Inc. Considerable time was spent visiting Molycorp’s operations and with management, and we continue to believe that eventually Molycorp will be successful at operating the Mountain Pass mine efficiently and become a low cost, profitable supplier of rare earths. Unfortunately, however, the capital needed to achieve this result has increased dramatically and has stretched their balance sheet to the breaking point and therefore, we came to the difficult decision to sell the holding.
| 14 | October 31, 2014 |
Despite the disappointments highlighted above, the Fund did experience a number of successful outcomes as well. The chemicals industry, which represented about 15% of portfolio during the year, strongly outperformed the Russell 2000. The chemicals stocks in the Fund, led by LyondellBasell Industries, Minerals Technologies Inc. and PolyOne Corporation, generated better than a 12% aggregate return during the year compared to less than a 2% return in the Russell 2000 chemical industry components. Similarly, the electronic equipment instruments and components investments, together totaling almost 9% of the portfolio, increased about 23% during the year as compared to a 7% return from the comparable Russell 2000 stocks. Flextronics International Ltd. was the standout here, with the shares benefiting from consistently solid earnings results; strong free cash flow generation; and, meaningful share repurchase activity. And there were winning stocks even within sectors which hurt the portfolio the most this past year. For example, the Fund exited its investment in Finish Line, Inc. during the year, after the shares generated close to a 28% increase for the year.
To sum up, while not satisfied with last year’s results, we remain confident in our approach. We continued to actively search for companies that we believed were selling at prices which seemed modest in relation to the company’s intrinsic value and where something could change to alter that company’s future for the better. In general, we believe the companies in which the Fund is already invested in are doing well both fiscally and operationally. Some may be impacted in the near term by declining commodity prices, especially if energy exposed, and by the strengthening dollar. However, we continue to like the portfolio of special situation and value stocks and believe that over time the market will reflect the true value of these holdings. In retrospect, we should have taken more profits than we did earlier in the year, but since we believed the investments were making solid progress we were loath to do so. And, while the sharp decline in share prices over the past few months has reduced valuations we are paradoxically beginning to feel more bullish.
Sincerely,
 |  | |
| J. Dennis Delafield | Vincent Sellecchia | |
| Portfolio Manager | Portfolio Manager | |
| Annual Report | 15 |
The Delafield Fund
(Unaudited)
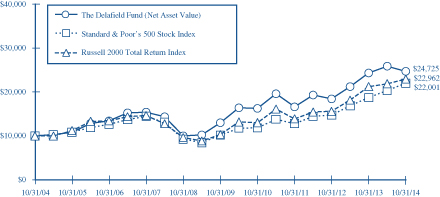
This chart assumes an initial gross investment of $10,000 made on 10/31/04. Since the Delafield Fund did not commence operations until 9/28/09, returns prior to that date are those of the Predecessor Fund. The Delafield Fund assumed the net asset value and performance history of the Predecessor Fund (See Footnote 1 to the Financial Statements). Returns shown do not reflect the deduction of taxes that a shareholder would pay on fund distributions or the redemption of fund shares. Performance reflects fee waivers in effect. In the absence of fee waivers, total return would be reduced. Returns shown include the reinvestment of all dividends and other distributions. Past performance is not predictive of future performance. Investment return and principal value will fluctuate so that your shares, when redeemed, may be worth more or less than their original cost. The Fund imposes a 2% redemption fee on shares held 90 days or less.
The Standard & Poor’s 500 Stock Index (S&P 500) is a capital-weighted index, representing the aggregate market value of the common equity of 500 stocks primarily traded on the New York Stock Exchange. Returns include the reinvestment of all dividends.
The Russell 2000 Total Return Index is an unmanaged index that measures the performance of the 2,000 smallest companies in the Russell 3000 Index, which represent approximately 10% of the total market capitalization of the Russell 3000 Index. Returns include the reinvestment of all dividends.
AVERAGE ANNUAL RATE OF RETURN (%)
FOR PERIODS ENDED OCTOBER 31, 2014
| 1 Year | 3 Year | 5 Year | 10 Year | |||||||||||||
The Delafield Fund | 1.58% | 14.18% | 13.69% | 9.47% | ||||||||||||
Standard & Poor’s 500 Stock Index | 17.27% | 19.77% | 16.69% | 8.20% | ||||||||||||
Russell 2000 Total Return Index | 8.06% | 18.18% | 17.39% | 8.67% | ||||||||||||
| 16 | October 31, 2014 |
The Tocqueville Select Fund
Dear Fellow Shareholder,
Markets exhibited extraordinary resiliency early in the fiscal year, shrugging off the government shutdown in October 2013 and advancing to near all-time-highs despite ongoing concerns about the tapering of the Fed’s quantitative easing program, only modest improvement in labor data, and mixed signals from the housing market. Broadly speaking, investors remained favorably disposed to equities for the balance of the fiscal year, though episodic sell-offs seemed to reveal an underlying nervousness among investors. For example, solid corporate earnings results in February convinced investors that concurrent weak retail and housing data were only temporary and weather driven, and so markets rose across the board. However, in March, a lack of favorable data points seemed to trigger profit taking, and markets began to come under pressure, which continued into April with the release of weaker than expected first quarter domestic economic data. Then, as temperatures began to rise, both economic activity and the stock market began to rebound. Specifically, improved consumer confidence, jobs and housing reports during the latter part of the second calendar quarter seemed to be the tonic for a jittery market, and most major indices experienced solid gains despite renewed geopolitical flare-ups in the Middle East and Ukraine. The next selloff occurred in July, after the Federal Reserve’s meeting commentary caused investor anticipation of a near term interest rate hike. The volatile situation in both the Middle East and Ukraine also seemed to weigh on the markets. Mostly favorable domestic economic data released throughout August offered a respite, albeit only temporarily, as September brought with it renewed worries over slowing growth in foreign economies, particularly Europe and China, as well as reduced corporate earnings expectations heading into earnings season. These concerns then faded to close out the year, with the market rebounding in October.
Unfortunately, the portfolio was at times out of sync with the market and did not manage to keep stride for the fiscal year. For the twelve months ended October 31, 2014, The Tocqueville Select Fund’s net asset value increased 6.14% to $14.90 per share. During the same twelve months, on a total return basis, the Russell 2500 Index (“Russell 2500”) posted a 10.23% increase, while the Russell 2000 Index (“Russell 2000”), the Fund’s benchmarks, increased 8.06%.
Stock selection was in aggregate, favorable to the Fund’s relative return for the fiscal year. However, the performance of the holdings in the specialty retail and containers and packaging industries was subpar. Positions in both industries detracted from the absolute performance for the year, and, owing to their large weighting in the Fund (about 16% combined), adversely impacted the performance relative to the Russell 2500 by more than 400 basis points. In specialty retail, Ascena Retail Group Inc. was the primary culprit and also the largest single detractor to the Fund for the year. The shares were off on weaker than expected near-term results in a challenging retail environment. However, our thesis on this stock remains intact, and we opportunistically added to the position. Staples, Inc., also a specialty retail name, experienced a difficult twelve months, though the stock did rebound somewhat towards the end of the period. Owens-Illinois, Inc. was the biggest disappointment in the containers and packaging industry, with the stock off almost 19% on disappointing earnings driven by sluggish end market trends in certain geographies as well as operating inefficiencies in some manufacturing facilities.
Performance was also tempered somewhat by the size of the reserves, which approached 15% of the Fund’s net assets for the year and accounted for close to 160 basis points of underperformance. That said, holding cash was by no means an asset allocation strategy on our part. Rather, the level of reserves was an indication of the challenge we faced finding attractive investment opportunities in a market that generally appeared fully valued to us, in particular during the first half of the fiscal year. We were content to use the cash as a hedge against volatility in the near term and ultimately, we will employ these cash reserves to seize upon attractive and appropriately priced investment opportunities as we uncover them.
With respect to positive highlights for the year, the chemicals industry, which represented about 7% of our portfolio, strongly outperformed the Russell 2500. The chemicals stocks, led by Minerals Technologies Inc. and Ashland Inc. generated better than a 28% aggregate return during the year compared to just above a 9% return in the Russell 2500 chemical industry components. Similarly, the internet software and services investments, together totaling more than 5% of the portfolio, increased about 15% during the year as compared to a loss of close to 5% from the comparable Russell
| Annual Report | 17 |
2500 stocks. Conversant Inc. was the standout here, with the shares up sharply after agreeing to a takeover by Alliance Data Systems Corp.
While we are not satisfied with last year’s end results, we remain confident in our approach. Our investment strategy utilizes a strictly bottom-up approach whereby we search for companies that we believe are selling at prices which seem modest in relation to the company’s intrinsic value and where something may change which will alter that company’s future for the better. We continued to actively search for companies that we believed were selling at prices which seemed modest in relation to the company’s intrinsic value and where something could change to alter that company’s future for the better. In general, we believe the companies in which the Fund has already invested in are doing well both fiscally and operationally. Some may be impacted in the near term by declining commodity prices, especially if energy exposed, and by the strengthening dollar. However, we continue to like the portfolio of special situation and value stocks and believe that over time the market will reflect the true value of these holdings.
Sincerely,
| ||||
| |  | ||
| J. Dennis Delafield | Vincent Sellecchia | Donald Wang | ||
| Portfolio Manager | Portfolio Manager | Portfolio Manager |
| 18 | October 31, 2014 |
The Tocqueville Select Fund
(Unaudited)
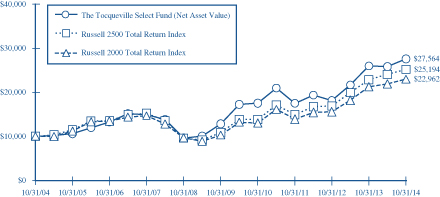
This chart assumes an initial gross investment of $10,000 made on 10/31/04. Since The Tocqueville Select Fund did not commence operations until 9/28/09, returns from the period from September 29, 2008 to September 27, 2009 are those of the Class Y Shares of the Predecessor Fund (See Footnote 1 to the Financial Statements). Prior to that period, returns shown are those of a limited partnership managed by the adviser. Returns shown do not reflect the deduction of taxes that a shareholder would pay on fund distributions or the redemption of fund shares. Performance reflects fee waivers in effect. In the absence of fee waivers, total return would be reduced. Returns shown include the reinvestment of all dividends and other distributions. Past performance is not predictive of future performance. Investment return and principal value will fluctuate so that your shares, when redeemed, may be worth more or less than their original cost. The Fund imposes a 2% redemption fee on shares held 90 days or less.
In 2013 the performance of The Tocqueville Select Fund was achieved during a period of unusually favorable market conditions. Such performance may not be sustainable.
The Russel 2500 Total Return Index is an unmanaged index that measures the performance of the 2,500 smallest companies in the Russell 3000 Index. Returns include the reinvestment of all dividends.
The Russell 2000 Total Return Index is an unmanaged index that measures the performance of the 2,000 smallest companies in the Russell 3000 Index, which represents approximately 8% of the total market capitalization of the Russell 3000 Index. Returns include the reinvestment of all dividends.
AVERAGE ANNUAL RATE OF RETURN (%)
FOR PERIODS ENDED OCTOBER 31, 2014
| 1 Year | 3 Year | 5 Year | 10 Year | |||||||||||||
The Tocqueville Select Fund | 6.14% | 16.35% | 16.53% | 10.67% | ||||||||||||
Russell 2500 Total Return Index | 10.23% | 19.03% | 18.40% | 9.68% | ||||||||||||
Russell 2000 Total Return Index | 8.06% | 18.18% | 17.39% | 8.67% | ||||||||||||
| Annual Report | 19 |
The Tocqueville Alternative Strategies Fund
Dear Fellow Shareholder,
I am pleased to be writing this first annual letter to you as portfolio manager of the Tocqueville Alternative Strategies Fund. This Fund, previously managed by me as the CIO of Bridgehampton Capital Management, was reorganized into a series of The Tocqueville Trust and, simultaneously, my team and I became affiliated with Tocqueville Asset Management. The focus throughout the process was to find a home for the Fund that would provide the best platform from which to generate strong results for shareholders. The move to Tocqueville has enhanced absolutely every aspect of our business, including research, operations, marketing support, compliance and trading, among other things. The official transition date was June 30, 2014, and I could not be more pleased with the deep resources that have been added to our efforts as we have sought both continuity and continuous process improvement.
In this context, I would like to take a moment to review the investment objectives: the Fund seeks higher returns and lower volatility than the S&P 500 Index over a three to five year time horizon. Over shorter time periods, some Fund investors like to compare it to the HFRX North America (HFRXNA) Index. Parsing this a little bit, it should be made clear that we are not expecting to do better than the S&P 500 Index in every market condition or every part of the market cycle. Instead, through the use of the alternative strategies we deploy, the Fund seeks to generate absolute returns in a 1-2 year period with strategies that have modest, low or negative correlations to the broad indexes. We believe, but cannot guarantee, that the result will be an attractive return profile resulting in better risk-adjusted returns in aggregate than the S&P 500 Index over the entire cycle.
Over the twelve month period ending October 31, 2014, the Fund generated a total return of 3.14%1 versus a total return of 17.27% for the S&P 500 (the Fund’s benchmark) and a loss of -1.03% for the HFRXNA and. Since the inception of the predecessor fund, June 29, 2012, the Fund has had an annualized return of 7.84%1 versus 20.83% for the S&P 500 and 6.17% for the HFRXNA.
Of the 314 basis points (or 3.14 percentage points) the Fund made in the fiscal year, more than half can be accounted for by gains in Blackberry (BBRY), a special situations trade which has consistently been in the top holdings over the last few quarters. We have a high degree of confidence that the new CEO, John Chen, and his team can capitalize on the security, messaging and software assets that were underutilized by the prior hardware-focused management. BBRY’s enterprise software solutions support iphones, android and Windows phones. We believe that the company is widely misunderstood by investors and that this investment can work in any market environment. As such, BBRY remains a high conviction position, although the position size has been aggressively reduced to lock in gains, and BBRY is strongly positive for shareholders since the position was initiated in 2012. Hallador Energy (HNRG), a coal and gas company, and ISIS Pharmaceuticals, a biotechnology firm, also contributed positively on the equity front. In fixed income and converts, returns were generally muted, but our largest positive contributor was a hedged position in JC Penney Bonds (JCP 7.65% 2016), which contributed approximately +37 basis points in the period.
There were a handful of poorly performing positions, including a position in Corinthian Colleges (COCO) which went to its risk management limit as investors, including the Fund, lost confidence in the company’s ability to meet its financial obligations. The largest losing position in a fixed income security was a position in NII Holdings, a distressed bond position which was exited at a loss. The company’s liquidity position deteriorated to the point that we felt it prudent to take losses and move on, rather than wait for a default or restructuring event.
Overall, however, returns were muted across strategies. The four main strategy classifications, Convertible Arbitrage, Fixed Income, Special Situations and Long Equity contributed approximately +55 basis points, -57 basis points, +253 basis points and +261 basis points, respectively. In addition, the portfolio was adversely impacted by approximately -195 basis points in its portfolio hedges, primarily as a result of index hedges hurting the portfolio as stock markets rallied strongly, although the Fund also experienced losses in interest rate hedges.
With the depth of Tocqueville research, our idea generation tools, an experienced team and the ability to go anywhere in the capital structure, we believe we have a sustainable process that will serve the Fund well in any market environment, including today’s. Thank you for investing with the Tocqueville Alternative Strategies Fund.
| 20 | October 31, 2014 |
We hope to work for you for many years to come!
Sincerely,
| ||||
| ||||
| Kenneth Lee | ||||
| Portfolio Manager | ||||

| 1 | The performance information provided prior to June 30, 2014 is historical information for the Bridgehampton Value Strategies Fund (the “Predecessor Fund”), which was reorganized into the Tocqueville Alternative Strategies Fund on June 30, 2014. The Predecessor Fund was managed by Bridgehampton Capital Management LLC and has the same portfolio managers, investment objectives and investment strategies as the Tocqueville Alternative Strategies Fund. |
| Annual Report | 21 |
The Tocqueville Alternative Strategies Fund
(Unaudited)
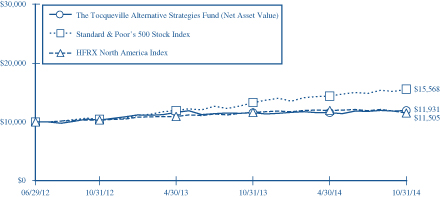
This chart assumes an initial gross investment of $10,000 made on June 29, 2012. Since the Tocqueville Alternative Strategies Fund did not commence operations until June 30, 2014, returns prior to that date are those of the Predecessor Fund (See Footnote 1 to the Financial Statements). Returns shown do not reflect the deduction of taxes that a shareholder would pay on fund distributions or the redemption of fund shares. Performance reflects fee waivers in effect. In the absence of fee waivers, total return would be reduced. Returns shown include the reinvestment of all dividends and other distributions. Past performance is not predictive of future performance. Investment return and principal value will fluctuate so that your shares, when redeemed, may be worth more or less than their original cost. The Fund imposes a 2% redemption fee on shares held for 90 days or less.
The Standard & Poor’s 500 Stock Index (S&P 500) is a capital-weighted index, representing the aggregate market value of the common equity of 500 stocks primarily traded on the New York Stock Exchange. Returns include the reinvestment of all dividends.
The HFRX North America Index is designed to reflect the performance of the North American region of the hedge fund universe. Regional Investment Focus is designed to reflect the primary focus of the Fund’s strategic exposure, over various market cycles, independent of the investment manager’s physical location or the domiciled registration location of the fund. Fund investing in North America typically have greater than 50% exposure in North America. Returns include the reinvestment of all dividends
AVERAGE ANNUAL RATE OF RETURN (%)
FOR PERIODS ENDED OCTOBER 31, 2014
| 1 Year | Inception(1) | |||||||
The Tocqueville Alternative Strategies Fund | 3.14% | 7.84% | ||||||
Standard & Poor’s 500 Stock Index | 17.27% | 20.83% | ||||||
HFRX North America Index | –1.03% | 6.17% | ||||||
| (1) | Inception of the Predecessor Fund was June 29, 2012. |
| 22 | October 31, 2014 |
Expense Example—October 31, 2014 (Unaudited)
As a shareholder of The Tocqueville Trust (the “Funds”), you incur ongoing costs, including management fees; distribution fees; and other Fund expenses. This example is intended to help you understand your ongoing costs (in dollars) of investing in the Funds and to compare costs with the ongoing costs of investing in other mutual funds.
The Example is based on an investment of $1,000 invested at the beginning of the period and held the entire period (May 1, 2014-October 31, 2014).
Actual Expenses
The first line of the table below provides information about actual account values and actual expenses. You may use the information in this line, together with the amount you invested, to estimate the expenses that you paid over the period. Simply divide your account value by $1,000 (for example, an $8,600 account value divided by $1,000 = 8.6), then multiply the result by the number in the first line under the heading entitled “Expenses Paid During Period” to estimate the expenses you paid on your account during this period.
Hypothetical Example for Comparison Purposes
The second line of the table below provides information about hypothetical account values and hypothetical expenses based on the Funds’ actual expense ratios and an assumed rate of return of 5% per year before expenses, which is not the Funds’ actual return. The hypothetical account values and expenses may not be used to estimate the actual ending account balance or expenses you paid for the period. You may use this information to compare the ongoing costs of investing in the Funds and other funds. To do so, compare this 5% hypothetical example with the 5% hypothetical examples that appear in the shareholder reports of the other funds.
Please note that the expenses shown in the table are meant to highlight your ongoing costs only and do not reflect any transactional costs, such as sales charges (loads), redemption fees, or exchange fees. Therefore, the second line of the table is useful in comparing ongoing costs only, and will not help you determine the relative costs of owning different funds. In addition, if these transactional costs were included, your costs would have been higher.
| Annual Report | 23 |
Expense Example Tables (Unaudited)
| The Tocqueville Fund | Beginning Account Value May 1, 2014 | Ending Account Value October 31, 2014 | Expenses Paid During Period* May 1, 2014 - October 31, 2014 | |||||||||
Actual | $ | 1,000.00 | $ | 1,048.10 | $ | 6.40 | ||||||
Hypothetical (5% return before expenses) | 1,000.00 | 1,018.95 | 6.31 | |||||||||
| The Tocqueville Opportunity Fund | ||||||||||||
Actual | $ | 1,000.00 | $ | 1,112.80 | $ | 6.98 | ||||||
Hypothetical (5% return before expenses) | 1,000.00 | 1,018.60 | 6.67 | |||||||||
| The Tocqueville International Value Fund | ||||||||||||
Actual | $ | 1,000.00 | $ | 932.40 | $ | 6.09 | ||||||
Hypothetical (5% return before expenses) | 1,000.00 | 1,018.90 | 6.36 | |||||||||
| The Tocqueville Gold Fund | ||||||||||||
Actual | $ | 1,000.00 | $ | 771.80 | $ | 5.94 | ||||||
Hypothetical (5% return before expenses) | 1,000.00 | 1,018.50 | 6.77 | |||||||||
| The Delafield Fund | ||||||||||||
Actual | $ | 1,000.00 | $ | 954.90 | $ | 6.01 | ||||||
Hypothetical (5% return before expenses) | 1,000.00 | 1,019.06 | 6.21 | |||||||||
| The Tocqueville Select Fund | ||||||||||||
Actual | $ | 1,000.00 | $ | 1,067.30 | $ | 6.93 | ||||||
Hypothetical (5% return before expenses) | 1,000.00 | 1,018.50 | 6.77 | |||||||||
| The Tocqueville Alternative Strategies Fund | ||||||||||||
Actual | $ | 1,000.00 | $ | 1,030.20 | $ | 13.15 | ||||||
Hypothetical (5% return before expenses) | 1,000.00 | 1,012.25 | 13.03 | |||||||||
| * | Expenses are equal to the Fund’s annualized six-month expense ratio (including extraordinary expenses) of 1.24%, 1.31%, 1.25%, 1.33%, 1.22%, 1.33% and 2.57% for The Tocqueville Fund, Opportunity Fund, International Value Fund, Gold Fund, Delafield Fund, Select Fund, and Alternative Strategies Fund respectively, multiplied by the average account value over the period, multiplied by 184/365 to reflect the one-half year period. |
| 24 | October 31, 2014 |
The Tocqueville Fund
Financial Highlights
| Per share operating performance (For a share outstanding throughout the year) | Years Ended October 31, | |||||||||||||||||||
| 2014 | 2013 | 2012 | 2011 | 2010 | ||||||||||||||||
Net asset value, beginning of year | $ | 30.67 | $ | 24.11 | $ | 22.23 | $ | 21.53 | $ | 18.47 | ||||||||||
|
|
|
|
|
|
|
|
|
| |||||||||||
Operations: | ||||||||||||||||||||
Net investment income (1) | 0.28 | 0.40 | 0.40 | 0.23 | 0.32 | |||||||||||||||
Net realized and unrealized gain | 3.78 | 6.51 | 1.81 | 0.80 | 2.97 | |||||||||||||||
|
|
|
|
|
|
|
|
|
| |||||||||||
Total from investment operations * | 4.06 | 6.91 | 2.21 | 1.03 | 3.29 | |||||||||||||||
|
|
|
|
|
|
|
|
|
| |||||||||||
Distributions to shareholders: | ||||||||||||||||||||
Dividends from net investment income | (0.30 | ) | (0.35 | ) | (0.33 | ) | (0.33 | ) | (0.23 | ) | ||||||||||
Distributions from net realized gains | (0.25 | ) | — | — | — | — | ||||||||||||||
|
|
|
|
|
|
|
|
|
| |||||||||||
Total distributions | (0.55 | ) | (0.35 | ) | (0.33 | ) | (0.33 | ) | (0.23 | ) | ||||||||||
|
|
|
|
|
|
|
|
|
| |||||||||||
Change in net asset value for the year | 3.51 | 6.56 | 1.88 | 0.70 | 3.06 | |||||||||||||||
|
|
|
|
|
|
|
|
|
| |||||||||||
Net asset value, end of year | $ | 34.18 | $ | 30.67 | $ | 24.11 | $ | 22.23 | $ | 21.53 | ||||||||||
|
|
|
|
|
|
|
|
|
| |||||||||||
* Includes redemption fees per share of | 0.00 | (2) | 0.00 | (2) | 0.00 | (2) | 0.00 | (2) | 0.00 | (2) | ||||||||||
Total Return | 13.4 | % | 29.0 | % | 10.1 | % | 4.8 | % | 18.0 | % | ||||||||||
Ratios/supplemental data | ||||||||||||||||||||
Net assets, end of year (000) | $ | 380,561 | $ | 348,269 | $ | 366,025 | $ | 491,541 | $ | 489,670 | ||||||||||
Ratio to average net assets: | ||||||||||||||||||||
Expenses before waiver/reimbursement | 1.25 | % | 1.28 | % | 1.29 | % | 1.26 | % | 1.26 | % | ||||||||||
Expenses after waiver/reimbursement | 1.24 | % | 1.26 | %(3) | 1.26 | %(3) | 1.25 | % | 1.25 | % | ||||||||||
Net investment income before waiver/reimbursement | 0.84 | % | 1.33 | % | 1.30 | % | 0.97 | % | 1.65 | % | ||||||||||
Net investment income after waiver/reimbursement | 0.85 | % | 1.35 | % | 1.33 | % | 0.98 | % | 1.66 | % | ||||||||||
Portfolio turnover rate | 19 | % | 16 | % | 17 | % | 28 | % | 23 | % | ||||||||||
| (1) | Net investment income per share is calculated using the ending balance prior to consideration or adjustment for permanent book-to-tax differences. |
| (2) | Represents less than $0.01. |
| (3) | Includes 0.01% of interest expense which is not included in the Fund’s operating expense cap. |
The Accompanying Notes are an Integral Part of these Financial Statements.
| Annual Report | 25 |
The Tocqueville Opportunity Fund
Financial Highlights
| Per share operating performance (For a share outstanding throughout the year) | Years Ended October 31, | |||||||||||||||||||
| 2014 | 2013 | 2012 | 2011 | 2010 | ||||||||||||||||
Net asset value, beginning of year | $ | 21.29 | $ | 15.76 | $ | 14.96 | $ | 13.20 | $ | 10.78 | ||||||||||
|
|
|
|
|
|
|
|
|
| |||||||||||
Operations: | ||||||||||||||||||||
Net investment loss (1) | (0.22 | ) | (0.13 | ) | (0.11 | ) | (0.13 | ) | (0.12 | ) | ||||||||||
Net realized and unrealized gain | 2.80 | 5.66 | 0.91 | 1.89 | 2.54 | |||||||||||||||
|
|
|
|
|
|
|
|
|
| |||||||||||
Total from investment operations * | 2.58 | 5.53 | 0.80 | 1.76 | 2.42 | |||||||||||||||
|
|
|
|
|
|
|
|
|
| |||||||||||
Distributions to shareholders: | ||||||||||||||||||||
Dividends from net investment income | — | — | — | — | — | |||||||||||||||
Distributions from net realized gains | (1.09 | ) | — | — | — | — | ||||||||||||||
|
|
|
|
|
|
|
|
|
| |||||||||||
Total distributions | (1.09 | ) | — | — | — | — | ||||||||||||||
|
|
|
|
|
|
|
|
|
| |||||||||||
Change in net asset value for the year | 1.49 | 5.53 | 0.80 | 1.76 | 2.42 | |||||||||||||||
|
|
|
|
|
|
|
|
|
| |||||||||||
Net asset value, end of year | $ | 22.78 | $ | 21.29 | $ | 15.76 | $ | 14.96 | $ | 13.20 | ||||||||||
|
|
|
|
|
|
|
|
|
| |||||||||||
* Includes redemption fees per share of | 0.00 | (2) | 0.00 | (2) | 0.00 | (2) | 0.00 | (2) | 0.00 | (2) | ||||||||||
Total Return | 12.6 | % | 35.1 | % | 5.4 | % | 13.3 | % | 22.6 | % | ||||||||||
Ratios/supplemental data | �� | |||||||||||||||||||
Net assets, end of year (000) | $ | 80,324 | $ | 80,609 | $ | 65,455 | $ | 46,963 | $ | 32,863 | ||||||||||
Ratio to average net assets: | ||||||||||||||||||||
Expense | 1.30 | % | 1.30 | % | 1.32 | % | 1.36 | % | 1.41 | % | ||||||||||
Net investment loss | (0.90 | )% | (0.64 | )% | (0.76 | )% | (1.04 | )% | (1.08 | )% | ||||||||||
Portfolio turnover rate | 92 | % | 100 | % | 77 | % | 110 | % | 104 | % | ||||||||||
| (1) | Net investment loss per share is calculated using the ending balance prior to consideration or adjustment for permanent book-to-tax differences. |
| (2) | Represents less than $0.01. |
The Accompanying Notes are an Integral Part of these Financial Statements.
| 26 | October 31, 2014 |
The Tocqueville International Value Fund
Financial Highlights
| Per share operating performance (For a share outstanding throughout the year) | Years Ended October 31, | |||||||||||||||||||
| 2014 | 2013 | 2012 | 2011 | 2010 | ||||||||||||||||
Net asset value, beginning of year | $ | 14.71 | $ | 11.68 | $ | 12.00 | $ | 12.12 | $ | 10.48 | ||||||||||
|
|
|
|
|
|
|
|
|
| |||||||||||
Operations: | ||||||||||||||||||||
Net investment income (1) | 0.15 | 0.24 | 0.17 | 0.11 | 0.11 | |||||||||||||||
Net realized and unrealized gain (loss) | (0.15 | ) | 2.97 | (0.37 | ) | (0.16 | ) | 1.65 | ||||||||||||
|
|
|
|
|
|
|
|
|
| |||||||||||
Total from investment operations * | — | 3.21 | (0.20 | ) | (0.05 | ) | 1.76 | |||||||||||||
|
|
|
|
|
|
|
|
|
| |||||||||||
Distributions to shareholders: | ||||||||||||||||||||
Dividends from net investment income | (0.23 | ) | (0.18 | ) | (0.12 | ) | (0.07 | ) | (0.12 | ) | ||||||||||
Distributions from net realized gains | — | — | — | — | — | |||||||||||||||
|
|
|
|
|
|
|
|
|
| |||||||||||
Total distributions | (0.23 | ) | (0.18 | ) | (0.12 | ) | (0.07 | ) | (0.12 | ) | ||||||||||
|
|
|
|
|
|
|
|
|
| |||||||||||
Change in net asset value for the year | (0.23 | ) | 3.03 | (0.32 | ) | (0.12 | ) | 1.64 | ||||||||||||
|
|
|
|
|
|
|
|
|
| |||||||||||
Net asset value, end of year | $ | 14.48 | $ | 14.71 | $ | 11.68 | $ | 12.00 | $ | 12.12 | ||||||||||
|
|
|
|
|
|
|
|
|
| |||||||||||
* Includes redemption fees of | 0.00 | (2) | 0.00 | (2) | 0.00 | (2) | $ | 0.01 | 0.00 | (2) | ||||||||||
Total Return | (0.0 | )% | 27.8 | % | (1.6 | )% | (0.5 | )% | 17.0 | % | ||||||||||
Ratios/supplemental data | ||||||||||||||||||||
Net assets, end of year (000) | $ | 237,051 | $ | 262,981 | $ | 218,793 | $ | 199,848 | $ | 150,103 | ||||||||||
Ratio to average net assets: | ||||||||||||||||||||
Expenses before waiver/reimbursement | 1.54 | % | 1.55 | % | 1.56 | % | 1.56 | % | 1.56 | % | ||||||||||
Expenses after waiver/reimbursement | 1.25 | % | 1.30 | %(3) | 1.56 | % | 1.56 | % | 1.56 | % | ||||||||||
Net investment income before waiver/reimbursement | 0.62 | % | 1.55 | % | 1.53 | % | 0.99 | % | 1.03 | % | ||||||||||
Net investment income after waiver/reimbursement | 0.91 | % | 1.80 | %(3) | 1.53 | % | 0.99 | % | 1.03 | % | ||||||||||
Portfolio turnover rate | 31 | % | 37 | % | 38 | % | 30 | % | 27 | % | ||||||||||
| (1) | Net investment income per share is calculated using the ending balance prior to consideration or adjustment for permanent book-to-tax differences. |
| (2) | Represents less than $0.01. |
| (3) | Expense waiver of 1.25% was implemented on January 1, 2013. |
The Accompanying Notes are an Integral Part of these Financial Statements.
| Annual Report | 27 |
The Tocqueville Gold Fund
Financial Highlights
| Per share operating performance (For a share outstanding throughout the year) | Years Ended October 31, | |||||||||||||||||||
| 2014 | 2013 | 2012 | 2011 | 2010 | ||||||||||||||||
Net asset value, beginning of year | $ | 38.01 | $ | 72.82 | $ | 81.97 | $ | 82.00 | $ | 49.71 | ||||||||||
|
|
|
|
|
|
|
|
|
| |||||||||||
Operations: | ||||||||||||||||||||
Net investment loss (1) | (0.08 | ) | (0.26 | ) | (0.35 | ) | (0.67 | ) | (0.58 | ) | ||||||||||
Net realized and unrealized gain (loss) | (7.55 | ) | (32.93 | ) | (7.47 | ) | 2.25 | 32.96 | ||||||||||||
|
|
|
|
|
|
|
|
|
| |||||||||||
Total from investment operations * | (7.63 | ) | (33.19 | ) | (7.82 | ) | 1.58 | 32.38 | ||||||||||||
|
|
|
|
|
|
|
|
|
| |||||||||||
Distributions to shareholders: | ||||||||||||||||||||
Dividends from net investment income | — | — | — | — | — | |||||||||||||||
Distributions from net realized gains | — | (1.62 | ) | (1.33 | ) | (1.61 | ) | (0.09 | ) | |||||||||||
|
|
|
|
|
|
|
|
|
| |||||||||||
Total distributions | — | (1.62 | ) | (1.33 | ) | (1.61 | ) | (0.09 | ) | |||||||||||
|
|
|
|
|
|
|
|
|
| |||||||||||
Change in net asset value for the year | (7.63 | ) | (34.81 | ) | (9.15 | ) | (0.03 | ) | 32.29 | |||||||||||
|
|
|
|
|
|
|
|
|
| |||||||||||
Net asset value, end of year | $ | 30.38 | $ | 38.01 | $ | 72.82 | $ | 81.97 | $ | 82.00 | ||||||||||
|
|
|
|
|
|
|
|
|
| |||||||||||
* Includes redemption fees per share of | 0.02 | 0.02 | 0.02 | 0.10 | 0.06 | |||||||||||||||
Total Return | (20.1 | )% | (46.4 | )% | (9.5 | )% | 1.8 | % | 65.2 | % | ||||||||||
Ratios/supplemental data | ||||||||||||||||||||
Net assets, end of year (000) | $ | 1,138,557 | $ | 1,215,081 | $ | 2,445,913 | $ | 2,647,078 | $ | 2,199,603 | ||||||||||
Ratio to average net assets: | ||||||||||||||||||||
Expense | 1.36 | % | 1.34 | % | 1.28 | % | 1.25 | % | 1.34 | % | ||||||||||
Net investment loss | (0.78 | )% | (0.41 | )% | (0.56 | )% | (0.86 | )% | (1.11 | )% | ||||||||||
Portfolio turnover rate | 10 | % | 14 | % | 11 | % | 3 | % | 9 | % | ||||||||||
| (1) | Net investment loss per share is calculated using the ending balance prior to consideration or adjustment for permanent book-to-tax differences. |
The Accompanying Notes are an Integral Part of these Financial Statements.
| 28 | October 31, 2014 |
The Delafield Fund
Financial Highlights
Per share operating performance (For a share outstanding throughout the year) | Years Ended October 31, | |||||||||||||||||||
| 2014 | 2013 | 2012 | 2011 | 2010 | ||||||||||||||||
Net asset value, beginning of year | $ | 37.13 | $ | 29.79 | $ | 27.21 | $ | 26.65 | $ | 21.35 | ||||||||||
|
|
|
|
|
|
|
|
|
| |||||||||||
Operations: | ||||||||||||||||||||
Net investment loss (1) | (0.10 | ) | (0.05 | ) | (0.04 | ) | (0.08 | ) | (0.00 | )(2) | ||||||||||
Net realized and unrealized gain | 0.70 | 9.19 | 2.99 | 0.64 | 5.32 | |||||||||||||||
|
|
|
|
|
|
|
|
|
| |||||||||||
Total from investment operations * | 0.60 | 9.14 | 2.95 | 0.56 | 5.32 | |||||||||||||||
|
|
|
|
|
|
|
|
|
| |||||||||||
Distributions to shareholders: | ||||||||||||||||||||
Dividends from net investment income | — | — | — | — | — | |||||||||||||||
Distributions from net realized gains | (1.33 | ) | (1.80 | ) | (0.37 | ) | — | — | ||||||||||||
Return of capital | — | — | — | — | (0.02 | ) | ||||||||||||||
|
|
|
|
|
|
|
|
|
| |||||||||||
Total distributions | (1.33 | ) | (1.80 | ) | (0.37 | ) | — | (0.02 | ) | |||||||||||
|
|
|
|
|
|
|
|
|
| |||||||||||
Change in net asset value for the year | (0.73 | ) | 7.34 | 2.58 | 0.56 | 5.30 | ||||||||||||||
|
|
|
|
|
|
|
|
|
| |||||||||||
Net asset value, end of year | $ | 36.40 | $ | 37.13 | $ | 29.79 | $ | 27.21 | $ | 26.65 | ||||||||||
|
|
|
|
|
|
|
|
|
| |||||||||||
* Includes redemption fees of | 0.00 | (2) | 0.00 | (2) | 0.00 | (2) | 0.01 | 0.01 | ||||||||||||
Total Return | 1.6 | % | 32.1 | % | 11.0 | % | 2.1 | % | 25.0 | % | ||||||||||
Ratios/supplemental data | ||||||||||||||||||||
Net assets, end of year (000) | $ | 1,475,139 | $ | 1,759,341 | $ | 1,346,273 | $ | 1,262,876 | $ | 933,674 | ||||||||||
Ratio to average net assets: | ||||||||||||||||||||
Expense | 1.21 | % | 1.21 | % | 1.23 | % | 1.23 | % | 1.27 | % | ||||||||||
Net investment loss | (0.24 | )% | (0.15 | )% | (0.13 | )% | (0.30 | )% | (0.02 | )% | ||||||||||
Portfolio turnover rate | 34 | % | 34 | % | 49 | % | 38 | % | 30 | % | ||||||||||
| (1) | Net investment loss per share is calculated using the ending balance prior to consideration or adjustment for permanent book-to-tax differences. |
| (2) | Represents less than $0.01. |
The Accompanying Notes are an Integral Part of these Financial Statements.
| Annual Report | 29 |
The Tocqueville Select Fund
Financial Highlights
Per share operating performance (For a share outstanding throughout the year) | Years Ended October 31, | |||||||||||||||||||
| 2014 | 2013 | 2012 | 2011 | 2010 | ||||||||||||||||
Net asset value, beginning of year | $ | 15.57 | $ | 11.35 | $ | 11.06 | $ | 11.54 | $ | 8.46 | ||||||||||
|
|
|
|
|
|
|
|
|
| |||||||||||
Operations: | ||||||||||||||||||||
Net investment loss (1) | (0.07 | ) | (0.06 | ) | (0.04 | ) | (0.07 | ) | (0.03 | ) | ||||||||||
Net realized and unrealized gain | 0.94 | 4.79 | 0.44 | 0.12 | 3.12 | |||||||||||||||
|
|
|
|
|
|
|
|
|
| |||||||||||
Total from investment operations * | 0.87 | 4.73 | 0.40 | 0.05 | 3.09 | |||||||||||||||
|
|
|
|
|
|
|
|
|
| |||||||||||
Distributions to shareholders: | ||||||||||||||||||||
Dividends from net investment income | — | — | — | — | (0.01 | ) | ||||||||||||||
Distributions from net realized gains | (1.54 | ) | (0.51 | ) | (0.11 | ) | (0.53 | ) | — | |||||||||||
|
|
|
|
|
|
|
|
|
| |||||||||||
Total distributions | (1.54 | ) | (0.51 | ) | (0.11 | ) | (0.53 | ) | (0.01 | ) | ||||||||||
|
|
|
|
|
|
|
|
|
| |||||||||||
Change in net asset value for the year | (0.67 | ) | 4.22 | 0.29 | (0.48 | ) | 3.08 | |||||||||||||
|
|
|
|
|
|
|
|
|
| |||||||||||
Net asset value, end of year | $ | 14.90 | $ | 15.57 | $ | 11.35 | $ | 11.06 | $ | 11.54 | ||||||||||
|
|
|
|
|
|
|
|
|
| |||||||||||
* Includes redemption fees of | 0.00 | (2) | 0.00 | (2) | 0.00 | (2) | $ | 0.01 | $ | 0.01 | ||||||||||
Total Return | 6.1 | % | 43.2 | % | 3.7 | % | (0.1 | )% | 36.6 | % | ||||||||||
Ratios/supplemental data | ||||||||||||||||||||
Net assets, end of year (000) | $ | 108,060 | $ | 99,888 | $ | 84,549 | $ | 71,554 | $ | 41,788 | ||||||||||
Ratio to average net assets: | ||||||||||||||||||||
Expense | 1.32 | % | 1.34 | % | 1.37 | % | 1.36 | % | 1.38 | % | ||||||||||
Net investment loss | (0.50 | )% | (0.39 | )% | (0.36 | )% | (0.67 | )% | (0.43 | )% | ||||||||||
Portfolio turnover rate | 32 | % | 28 | % | 31 | % | 28 | % | 40 | % | ||||||||||
| (1) | Net investment loss per share is calculated using the ending balance prior to consideration or adjustment for permanent book-to-tax differences. |
| (2) | Represents less than $0.01. |
The Accompanying Notes are an Integral Part of these Financial Statements.
| 30 | October 31, 2014 |
The Tocqueville Alternative Strategies Fund
Financial Highlights
Per share operating performance (For a share outstanding throughout the period) | For the Period January 1, 2014 to October 31, 2014 | For the Period June 1, 2013 to December 31, 2013† | For the Period June 29, 2012(3) to May 31, 2013† | |||||||||
Net asset value, beginning of period | $ | 26.19 | $ | 29.06 | $ | 25.00 | ||||||
|
|
|
|
|
| |||||||
Operations: | ||||||||||||
Net investment loss | (0.20 | )(1) | (0.15 | )(2) | (0.04 | )(2) | ||||||
Net realized and unrealized gain (loss) | 1.27 | (0.98 | ) | 4.75 | ||||||||
|
|
|
|
|
| |||||||
Total from investment operations * | 1.07 | (1.13 | ) | 4.71 | ||||||||
|
|
|
|
|
| |||||||
Distributions to shareholders: | ||||||||||||
Dividends from net investment income | — | (0.11 | ) | (0.02 | ) | |||||||
Distributions from net realized gains | — | (1.63 | ) | (0.63 | ) | |||||||
|
|
|
|
|
| |||||||
Total distributions | — | (1.74 | ) | (0.65 | ) | |||||||
|
|
|
|
|
| |||||||
Change in net asset value for the period | 1.07 | (2.87 | ) | 4.06 | ||||||||
|
|
|
|
|
| |||||||
Net asset value, end of period | $ | 27.26 | $ | 26.19 | $ | 29.06 | ||||||
|
|
|
|
|
| |||||||
* Includes redemption fees of | $ | 0.00 | (4) | $ | 0.00 | (4) | $ | 0.00 | (4) | |||
Total Return | 4.1 | %(5) | (3.8 | )%(5) | 19.2 | %(5) | ||||||
Ratios/supplemental data | ||||||||||||
Net assets, end of period (000) | $ | 39,143 | $ | 36,594 | $ | 38,846 | ||||||
Ratio to average net assets: | ||||||||||||
Expenses before waiver/reimbursement | 3.31 | %(6) | 3.25 | %(6) | 3.21 | %(6) | ||||||
Expenses after waiver/reimbursement | 2.66 | %(6) | 2.86 | %(6) | 2.63 | %(6) | ||||||
Net investment loss before waiver/reimbursement | (1.52 | )%(6) | (1.33 | )%(6) | (0.72 | )%(6) | ||||||
Net investment loss after waiver/reimbursement | (0.87 | )%(6) | (0.94 | )%(6) | (0.14 | )%(6) | ||||||
Ratio to average net assets (excluding dividends and interest on securities sold short): | ||||||||||||
Expenses before waiver/reimbursement | 2.60 | %(6) | 2.38 | %(6) | 2.57 | %(6) | ||||||
Expenses after waiver/reimbursement | 1.96 | %(6) | 1.99 | %(6) | 1.99 | %(6) | ||||||
Net investment loss before waiver/reimbursement | (0.81 | )%(6) | (0.46 | )%(6) | (0.08 | )%(6) | ||||||
Net investment income (loss) after waiver/reimbursement | (0.16 | )%(6) | (0.07 | )%(6) | 0.50 | %(6) | ||||||
Portfolio turnover rate | 99 | %(5) | 69 | %(5) | 91 | %(5) | ||||||
| † | Information shown is for Predecessor Fund—Class I |
| (1) | Net investment loss per share is calculated using the ending balance prior to consideration or adjustment for permanent book-to-tax differences. |
| (2) | Net investment loss per share is calculated based on average shares outstanding during the period. |
| (3) | Inception of Predecessor Fund—Class I. |
| (4) | Represents less than $0.01. |
| (5) | Not annualized. |
| (6) | Annualized. |
The Accompanying Notes are an Integral Part of these Financial Statements.
| Annual Report | 31 |
The Tocqueville Fund
Schedule of Investments as of October 31, 2014
| Common Stocks—97.6% | Shares | Value | ||||||
Automobiles & Components—1.9% |
| |||||||
Ford Motor Co. | 500,000 | $ | 7,045,000 | |||||
Banks—0.6% | ||||||||
M&T Bank Corp. | 20,000 | 2,443,600 | ||||||
Capital Goods—6.4% | ||||||||
Allison Transmission Holdings, Inc. | 100,000 | 3,248,000 | ||||||
The Boeing Co. | 50,000 | 6,245,500 | ||||||
General Electric Co. | 400,000 | 10,324,000 | ||||||
Illinois Tool Works, Inc. | 50,000 | 4,552,500 | ||||||
| 24,370,000 | ||||||||
Commercial & Professional Services—3.7% |
| |||||||
Pitney Bowes, Inc. | 250,000 | 6,185,000 | ||||||
Steelcase, Inc. | 250,000 | 4,430,000 | ||||||
The ADT Corp. | 100,000 | 3,584,000 | ||||||
| 14,199,000 | ||||||||
Consumer Services—2.7% | ||||||||
Bob Evans Farms, Inc. | 75,000 | 3,663,750 | ||||||
DeVry Education Group, Inc. | 100,000 | 4,841,000 | ||||||
McDonald’s Corp. | 20,000 | 1,874,600 | ||||||
| 10,379,350 | ||||||||
Diversified Financials—5.0% | ||||||||
Capital One Financial Corp. | 75,000 | 6,207,750 | ||||||
Lazard Ltd.(a) | 100,000 | 4,921,000 | ||||||
The Bank of New York Mellon Corp. | 200,000 | 7,744,000 | ||||||
| 18,872,750 | ||||||||
Energy—9.2% | ||||||||
Energen Corp. | 100,000 | 6,770,000 | ||||||
Exxon Mobil Corp. | 100,000 | 9,671,000 | ||||||
Frank’s International NV(a) | 200,000 | 3,446,000 | ||||||
Murphy Oil Corp. | 100,000 | 5,339,000 | ||||||
Schlumberger Ltd.(a) | 100,000 | 9,866,000 | ||||||
| 35,092,000 | ||||||||
Food & Staples Retailing—2.0% | ||||||||
Wal-Mart Stores, Inc. | 100,000 | 7,627,000 | ||||||
Food, Beverage & Tobacco—3.7% | ||||||||
Campbell Soup Co. | 125,000 | 5,521,250 | ||||||
The Coca-Cola Co. | 200,000 | 8,376,000 | ||||||
| 13,897,250 | ||||||||
Health Care Equipment & Services—1.0% |
| |||||||
Express Scripts Holding Co.(b) | 50,000 | 3,841,000 | ||||||
Household & Personal Products—4.1% |
| |||||||
Colgate-Palmolive Co. | 100,000 | 6,688,000 | ||||||
The Procter & Gamble Co. | 100,000 | 8,727,000 | ||||||
| 15,415,000 | ||||||||
Insurance—2.9% |
| |||||||
Aflac, Inc. | 100,000 | 5,973,000 | ||||||
XL Group PLC(a) | 150,000 | 5,082,000 | ||||||
| 11,055,000 | ||||||||
Materials—6.2% |
| |||||||
BHP Billiton Ltd.—ADR(a) | 75,000 | 4,458,000 | ||||||
EI du Pont de Nemours & Co. | 150,000 | 10,372,500 | ||||||
Goldcorp, Inc.(a) | 250,000 | 4,695,000 | ||||||
Sonoco Products Co. | 100,000 | 4,087,000 | ||||||
| 23,612,500 | ||||||||
Pharmaceuticals, Biotechnology & Life Sciences—16.1% |
| |||||||
Alkermes PLC(a)(b) | 200,000 | 10,110,000 | ||||||
Allergan, Inc. | 40,000 | 7,602,400 | ||||||
Isis Pharmaceuticals, Inc.(b) | 200,000 | 9,212,000 | ||||||
Johnson & Johnson | 100,000 | 10,778,000 | ||||||
Merck & Co., Inc. | 150,000 | 8,691,000 | ||||||
Omeros Corp.(b) | 175,000 | 2,899,750 | ||||||
Perrigo Co. PLC(a) | 25,000 | 4,036,250 | ||||||
Pfizer, Inc. | 200,000 | 5,990,000 | ||||||
PTC Therapeutics, Inc.(b) | 45,000 | 1,839,150 | ||||||
| 61,158,550 | ||||||||
Retailing—1.7% |
| |||||||
Amazon.com, Inc.(b) | 12,500 | 3,818,250 | ||||||
Target Corp. | 45,000 | 2,781,900 | ||||||
| 6,600,150 | ||||||||
Semiconductors & Semiconductor Equipment—4.6% |
| |||||||
Applied Materials, Inc. | 400,000 | 8,836,000 | ||||||
Intel Corp. | 250,000 | 8,502,500 | ||||||
| 17,338,500 | ||||||||
Software & Services—12.5% |
| |||||||
Automatic Data Processing, Inc. | 100,000 | 8,178,000 | ||||||
CDK Global, Inc.(b) | 33,333 | 1,119,989 | ||||||
Facebook, Inc.(b) | 75,000 | 5,624,250 | ||||||
Google, Inc.—Class A(b) | 7,000 | 3,975,090 | ||||||
Google, Inc.—Class C(b) | 7,000 | 3,913,560 | ||||||
Microsoft Corp. | 250,000 | 11,737,500 | ||||||
Oracle Corp. | 75,000 | 2,928,750 | ||||||
Xerox Corp. | 750,000 | 9,960,000 | ||||||
| 47,437,139 | ||||||||
Technology Hardware & Equipment—6.4% |
| |||||||
Apple, Inc. | 70,000 | 7,560,000 | ||||||
Avnet, Inc. | 75,000 | 3,243,750 | ||||||
Bio-key International, Inc.(b)(c)(d)(e) | 47,090 | — | ||||||
BlackBerry Ltd.(a)(b) | 250,000 | 2,625,000 | ||||||
The Accompanying Footnotes are an Integral Part of these Financial Statements.
| 32 | October 31, 2014 |
The Tocqueville Fund
Schedule of Investments as of October 31, 2014
| Common Stocks (continued) | Shares | Value | ||||||
EMC Corp. | 300,000 | $ | 8,619,000 | |||||
QUALCOMM, Inc. | 30,000 | 2,355,300 | ||||||
| 24,403,050 | ||||||||
Telecommunication Services—1.3% |
| |||||||
Verizon Communications, Inc. | 100,000 | 5,025,000 | ||||||
Transportation—3.0% |
| |||||||
CH Robinson Worldwide, Inc. | 50,000 | 3,460,500 | ||||||
Delta Air Lines, Inc. | 200,000 | 8,046,000 | ||||||
| 11,506,500 | ||||||||
Utilities—2.6% | ||||||||
NextEra Energy, Inc. | 100,000 | 10,022,000 | ||||||
Total Common Stocks | 371,340,339 | |||||||
Real Estate Investment Trust (REIT)—2.2% |
| |||||||
Real Estate—2.2% | ||||||||
Weyerhaeuser Co. | 250,000 | 8,465,000 | ||||||
Total Real Estate Investment Trust | 8,465,000 | |||||||
Short-Term Investment—0.2% | ||||||||
Money Market Fund—0.2% | ||||||||
STIT-Treasury Portfolio, 0.01%(f) | 714,183 | 714,183 | ||||||
Total Short-Term Investment (Cost $714,183) | 714,183 | |||||||
Total Investments (Cost $242,777,117)—100.0% | 380,519,522 | |||||||
Other Assets in Excess of Liabilities—0.0% |
| 41,841 | ||||||
Total Net Assets—100.0% | $ | 380,561,363 | ||||||
|
| |||||||
Percentages are stated as a percent of net assets.
ADR American Depository Receipt
| (a) | Foreign issued security. Foreign concentration (including ADR’s) was as follows: Australia 1.2%; Bermuda 1.3%; Canada 1.9%; Curacao 2.6%; Ireland 5.1%; Netherlands 0.9%. |
| (b) | Non-income producing security. |
| (c) | Denotes a security that is either fully or partially restricted to resale. The aggregate value of restricted securities as of October 31, 2014 was $0 which represented 0.0% of net assets. |
| (d) | Security is fair valued using procedures approved by the Board of Trustees. The aggregate value of fair valued securites as of October 31, 2014 was $0 which represented 0.0% of net assets. |
| (e) | Security is considered illiquid and may be difficult to sell. |
| (f) | Rate listed is the 7-day effective yield. |
The Global Industry Classification Standard (GICS®) was developed by and/or is the exclusive property of MSCI, Inc. and Standard & Poor Financial Services LLC (“S&P”). GICS is a service mark of MSCI and S&P and has been licensed for use by U.S. Bancorp Fund Services, LLC.
The Accompanying Footnotes are an Integral Part of these Financial Statements.
| Annual Report | 33 |
The Tocqueville Opportunity Fund
Schedule of Investments as of October 31, 2014
| Common Stocks—99.1% | Shares | Value | ||||||
Automobiles & Components—1.5% | ||||||||
BorgWarner, Inc. | 700 | $ | 39,914 | |||||
Tesla Motors, Inc.(a) | 4,600 | 1,111,820 | ||||||
The Goodyear Tire & Rubber Co. | 4,000 | 96,920 | ||||||
| 1,248,654 | ||||||||
Banks—6.4% | ||||||||
Bank of the Ozarks, Inc. | 30,000 | 1,057,200 | ||||||
City National Corp. | 4,500 | 354,195 | ||||||
Home BancShares, Inc. | 18,000 | 574,560 | ||||||
Pinnacle Financial Partners, Inc. | 33,500 | 1,313,200 | ||||||
Signature Bank(a) | 13,000 | 1,574,690 | ||||||
South State Corp. | 4,000 | 241,240 | ||||||
| 5,115,085 | ||||||||
Capital Goods—7.2% | ||||||||
Acuity Brands, Inc. | 2,000 | 278,860 | ||||||
Allegion PLC(b) | 2,400 | 127,416 | ||||||
Allison Transmission Holdings, Inc. | 6,800 | 220,864 | ||||||
AMETEK, Inc. | 1,000 | 52,150 | ||||||
AO Smith Corp. | 4,000 | 213,400 | ||||||
Armstrong World Industries, Inc.(a) | 2,500 | 121,050 | ||||||
Astronics Corp.(a) | 3,000 | 155,430 | ||||||
Chicago Bridge & Iron Co. NV(b) | 3,000 | 163,920 | ||||||
Colfax Corp.(a) | 4,100 | 222,958 | ||||||
Donaldson Co., Inc. | 4,100 | 170,478 | ||||||
Generac Holdings, Inc.(a) | 5,500 | 249,370 | ||||||
Graco, Inc. | 1,700 | 133,450 | ||||||
The Greenbrier Cos., Inc. | 1,500 | 93,810 | ||||||
HEICO Corp. | 2,400 | 130,176 | ||||||
Hexcel Corp.(a) | 3,800 | 159,182 | ||||||
IDEX Corp. | 3,200 | 239,712 | ||||||
Lennox International, Inc. | 2,000 | 177,840 | ||||||
Lincoln Electric Holdings, Inc. | 1,000 | 72,480 | ||||||
Navistar International Corp.(a) | 9,500 | 336,015 | ||||||
Nordson Corp. | 1,500 | 114,825 | ||||||
Proto Labs, Inc.(a) | 1,150 | 75,175 | ||||||
Spirit AeroSystems Holdings, Inc.(a) | 4,500 | 177,030 | ||||||
The Middleby Corp.(a) | 5,000 | 442,500 | ||||||
TransDigm Group, Inc. | 3,600 | 673,308 | ||||||
Trinity Industries, Inc. | 5,200 | 185,692 | ||||||
United Rentals, Inc.(a) | 1,500 | 165,090 | ||||||
WABCO Holdings, Inc.(a) | 500 | 48,690 | ||||||
Wabtec Corp. | 4,500 | 388,350 | ||||||
Watsco, Inc. | 2,100 | 213,402 | ||||||
| 5,802,623 | ||||||||
Commercial & Professional Services—1.0% |
| |||||||
Cintas Corp. | 1,500 | 109,860 | ||||||
Copart, Inc.(a) | 3,400 | 113,696 | ||||||
Equifax, Inc. | 3,500 | 265,090 | ||||||
Robert Half International, Inc. | 5,100 | 279,378 | ||||||
| 768,024 | ||||||||
| Common Stocks (continued) | Shares | Value | ||||||
Consumer Durables & Apparel—4.8% |
| |||||||
Fossil Group, Inc.(a) | 1,500 | $ | 152,490 | |||||
Hanesbrands, Inc. | 9,300 | 982,173 | ||||||
Harman International Industries, Inc. | 4,500 | 483,030 | ||||||
Jarden Corp.(a) | 3,500 | 227,815 | ||||||
lululemon athletica, Inc.(a) | 500 | 20,825 | ||||||
Mohawk Industries, Inc.(a) | 2,400 | 340,896 | ||||||
NIKE, Inc. | 6,500 | 604,305 | ||||||
Polaris Industries, Inc. | 3,500 | 528,010 | ||||||
Tempur Sealy International, Inc.(a) | 700 | 36,848 | ||||||
Tupperware Brands Corp. | 1,000 | 63,750 | ||||||
Under Armour, Inc.(a) | 6,500 | 426,270 | ||||||
| 3,866,412 | ||||||||
Consumer Services—3.0% | ||||||||
Bob Evans Farms, Inc. | 500 | 24,425 | ||||||
Chipotle Mexican Grill, Inc.(a) | 800 | 510,400 | ||||||
Domino’s Pizza, Inc. | 7,300 | 648,167 | ||||||
Dunkin’ Brands Group, Inc. | 5,900 | 268,332 | ||||||
Jack in the Box, Inc. | 5,600 | 397,824 | ||||||
Las Vegas Sands Corp. | 5,500 | 342,430 | ||||||
Wyndham Worldwide Corp. | 3,000 | 233,010 | ||||||
| 2,424,588 | ||||||||
Diversified Financials—3.4% | ||||||||
Affiliated Managers Group, Inc.(a) | 1,900 | 379,601 | ||||||
The Blackstone Group LP | 15,000 | 451,800 | ||||||
CBOE Holdings, Inc. | 3,400 | 200,396 | ||||||
KKR & Co. LP | 12,700 | 273,812 | ||||||
Lazard Ltd.(b) | 4,800 | 236,208 | ||||||
MSCI, Inc. | 500 | 23,330 | ||||||
Portfolio Recovery Associates, Inc.(a) | 3,500 | 221,375 | ||||||
T. Rowe Price Group, Inc. | 3,200 | 262,688 | ||||||
The Charles Schwab Corp. | 15,500 | 444,385 | ||||||
Waddell & Reed Financial, Inc. | 4,600 | 219,604 | ||||||
| 2,713,199 | ||||||||
Energy—0.5% | ||||||||
Cheniere Energy, Inc.(a) | 1,000 | 75,000 | ||||||
Continental Resources, Inc.(a) | 1,500 | 84,555 | ||||||
Diamondback Energy, Inc.(a) | 1,100 | 75,284 | ||||||
Oceaneering International, Inc. | 2,000 | 140,540 | ||||||
| 375,379 | ||||||||
Food, Beverage & Tobacco—3.7% | ||||||||
Constellation Brands, Inc.(a) | 8,000 | 732,320 | ||||||
Monster Beverage Corp.(a) | 5,200 | 524,576 | ||||||
The Boston Beer Co., Inc.(a) | 1,600 | 398,400 | ||||||
The Hain Celestial Group, Inc.(a) | 5,800 | 627,850 | ||||||
The WhiteWave Foods Co.(a) | 17,800 | 662,694 | ||||||
| 2,945,840 | ||||||||
The Accompanying Footnotes are an Integral Part of these Financial Statements.
| 34 | October 31, 2014 |
The Tocqueville Opportunity Fund
Schedule of Investments as of October 31, 2014
| Common Stocks (continued) | Shares | Value | ||||||
Health Care Equipment & Services—3.8% |
| |||||||
Acadia Healthcare Co., Inc.(a) | 2,500 | $ | 155,125 | |||||
Align Technology, Inc.(a) | 3,800 | 199,956 | ||||||
athenahealth, Inc.(a) | 1,100 | 134,750 | ||||||
DexCom, Inc.(a) | 9,200 | 413,540 | ||||||
Hanger, Inc.(a) | 6,000 | 143,580 | ||||||
IDEXX Laboratories, Inc.(a) | 2,800 | 396,676 | ||||||
Insulet Corp.(a) | 6,900 | 297,873 | ||||||
Medidata Solutions, Inc.(a) | 1,000 | 45,110 | ||||||
MWI Veterinary Supply, Inc.(a) | 1,100 | 186,620 | ||||||
ResMed, Inc. | 500 | 26,110 | ||||||
Sirona Dental Systems, Inc.(a) | 2,100 | 164,955 | ||||||
Teleflex, Inc. | 2,100 | 239,652 | ||||||
Tenet Healthcare Corp.(a) | 5,200 | 291,460 | ||||||
The Cooper Cos., Inc. | 1,300 | 213,070 | ||||||
Tornier NV(a)(b) | 500 | 13,975 | ||||||
Universal Health Services, Inc. | 1,400 | 145,194 | ||||||
| 3,067,646 | ||||||||
Household & Personal Products—0.4% |
| |||||||
Church & Dwight Co., Inc. | 2,800 | 202,748 | ||||||
Herbalife Ltd.(b) | 3,000 | 157,380 | ||||||
| 360,128 | ||||||||
Insurance—0.3% | ||||||||
Arthur J. Gallagher & Co. | 4,200 | 200,340 | ||||||
RenaissanceRe Holdings Ltd.(b) | 500 | 51,665 | ||||||
| 252,005 | ||||||||
Materials—4.7% | ||||||||
AptarGroup, Inc. | 2,600 | 161,824 | ||||||
Ball Corp. | 3,500 | 225,505 | ||||||
Caesarstone Sdot-Yam Ltd.(b) | 6,500 | 363,090 | ||||||
Crown Holdings, Inc.(a) | 4,500 | 215,685 | ||||||
Eagle Materials, Inc. | 3,000 | 262,290 | ||||||
Ecolab, Inc. | 4,100 | 456,043 | ||||||
Huntsman Corp. | 4,600 | 112,240 | ||||||
International Flavors & Fragrances, Inc. | 2,000 | 198,300 | ||||||
Martin Marietta Materials, Inc. | 2,000 | 233,840 | ||||||
Packaging Corp. of America | 7,200 | 518,976 | ||||||
PolyOne Corp. | 4,000 | 148,040 | ||||||
RPM International, Inc. | 5,500 | 249,150 | ||||||
The Sherwin-Williams Co. | 500 | 114,780 | ||||||
The Valspar Corp. | 4,200 | 345,072 | ||||||
WR Grace & Co.(a) | 1,500 | 141,900 | ||||||
| 3,746,735 | ||||||||
Media—0.4% | ||||||||
The Interpublic Group of Cos., Inc. | 1,000 | 19,390 | ||||||
Morningstar, Inc. | 4,200 | 286,650 | ||||||
| 306,040 | ||||||||
| Common Stocks (continued) | Shares | Value | ||||||
Pharmaceuticals, Biotechnology & Life Sciences—27.5% |
| |||||||
ACADIA Pharmaceuticals, Inc.(a) | 13,500 | $ | 373,950 | |||||
Acceleron Pharma, Inc.(a) | 7,000 | 258,860 | ||||||
Actavis plc(a)(b) | 7,000 | 1,699,180 | ||||||
Agios Pharmaceuticals, Inc.(a) | 1,500 | 126,045 | ||||||
Alexion Pharmaceuticals, Inc.(a) | 4,800 | 918,528 | ||||||
Alkermes PLC(a)(b) | 10,500 | 530,775 | ||||||
Allergan, Inc. | 5,000 | 950,300 | ||||||
Alnylam Pharmaceuticals, Inc.(a) | 16,500 | 1,530,210 | ||||||
Auspex Pharmaceuticals, Inc.(a) | 5,000 | 135,500 | ||||||
BioMarin Pharmaceutical, Inc.(a) | 6,500 | 536,250 | ||||||
Bluebird Bio, Inc.(a) | 4,500 | 188,955 | ||||||
Celldex Therapeutics, Inc.(a) | 3,000 | 50,250 | ||||||
Cubist Pharmaceuticals, Inc.(a) | 6,500 | 469,885 | ||||||
Dicerna Pharmaceuticals, Inc.(a) | 500 | 4,685 | ||||||
Endo International PLC(a)(b) | 1,000 | 66,920 | ||||||
Five Prime Therapeutics, Inc.(a) | 3,000 | 39,120 | ||||||
Genfit(a)(b) | 5,000 | 256,269 | ||||||
Genmab A/S(a)(b) | 8,500 | 370,511 | ||||||
Illumina, Inc.(a) | 1,100 | 211,838 | ||||||
Incyte Corp.(a) | 11,000 | 737,660 | ||||||
Innate Pharma SA(a)(b) | 5,000 | 46,053 | ||||||
Inovio Pharmaceuticals, Inc.(a) | 36,000 | 408,960 | ||||||
Intercept Pharmaceuticals, Inc.(a) | 2,500 | 645,975 | ||||||
Intrexon Corp.(a) | 500 | 11,160 | ||||||
Isis Pharmaceuticals, Inc.(a) | 10,000 | 460,600 | ||||||
Jazz Pharmaceuticals PLC(a)(b) | 2,400 | 405,216 | ||||||
La Jolla Pharmaceutical Co.(a) | 500 | 5,495 | ||||||
Medivation, Inc.(a) | 6,000 | 634,200 | ||||||
Mettler-Toledo International, Inc.(a) | 1,350 | 348,935 | ||||||
NewLink Genetics Corp.(a) | 4,000 | 130,600 | ||||||
Northwest Biotherapeutics, Inc.(a) | 1,000 | 5,260 | ||||||
NPS Pharmaceuticals, Inc.(a) | 22,500 | 616,500 | ||||||
Omeros Corp.(a) | 1,000 | 16,570 | ||||||
OncoMed Pharmaceuticals, Inc.(a) | 15,000 | 311,550 | ||||||
PAREXEL International Corp.(a) | 3,200 | 173,792 | ||||||
PerkinElmer, Inc. | 500 | 21,710 | ||||||
Perrigo Co. PLC(b) | 500 | 80,725 | ||||||
Pharmacyclics, Inc.(a) | 12,500 | 1,633,375 | ||||||
Prosensa Holding NV(a)(b) | 35,000 | 412,650 | ||||||
PTC Therapeutics, Inc.(a) | 19,000 | 776,530 | ||||||
Puma Biotechnology, Inc.(a) | 4,600 | 1,152,760 | ||||||
Receptos, Inc.(a) | 2,500 | 259,125 | ||||||
Regeneron Pharmaceuticals, Inc.(a) | 3,200 | 1,259,904 | ||||||
Regulus Therapeutics, Inc.(a) | 16,000 | 319,360 | ||||||
Salix Pharmaceuticals Ltd.(a) | 8,700 | 1,251,495 | ||||||
Seattle Genetics, Inc.(a) | 7,300 | 267,691 | ||||||
Shire PLC—ADR(b) | 1,000 | 199,800 | ||||||
Stemline Therapeutics, Inc.(a) | 500 | 7,695 | ||||||
Synageva BioPharma Corp.(a) | 1,700 | 128,758 | ||||||
United Therapeutics Corp.(a) | 900 | 117,873 | ||||||
The Accompanying Footnotes are an Integral Part of these Financial Statements.
| Annual Report | 35 |
The Tocqueville Opportunity Fund
Schedule of Investments as of October 31, 2014
| Common Stocks (continued) | Shares | Value | ||||||
Vertex Pharmaceuticals, Inc.(a) | 4,500 | $ | 506,880 | |||||
| 22,072,888 | ||||||||
Retailing—5.1% | ||||||||
Foot Locker, Inc. | 4,000 | 224,040 | ||||||
GNC Holdings, Inc. | 3,000 | 124,710 | ||||||
HomeAway, Inc.(a) | 5,000 | 174,500 | ||||||
L Brands, Inc. | 3,500 | 252,420 | ||||||
Liberty TripAdvisor Holdings, Inc.(a) | 4,000 | 126,320 | ||||||
Lithia Motors, Inc. | 1,700 | 131,954 | ||||||
Netflix, Inc.(a) | 500 | 196,385 | ||||||
Restoration Hardware Holdings, Inc.(a) | 4,700 | 377,504 | ||||||
Signet Jewelers Ltd.(b) | 2,000 | 240,020 | ||||||
The Priceline Group, Inc.(a) | 950 | 1,145,900 | ||||||
TripAdvisor, Inc.(a) | 5,000 | 443,300 | ||||||
Ulta Salon Cosmetics & Fragrance, Inc.(a) | 2,900 | 350,349 | ||||||
Urban Outfitters, Inc.(a) | 500 | 15,180 | ||||||
Williams-Sonoma, Inc. | 5,000 | 325,150 | ||||||
| 4,127,732 | ||||||||
Semiconductors & Semiconductor Equipment—1.8% |
| |||||||
Cavium, Inc.(a) | 7,600 | 389,956 | ||||||
NXP Semiconductor NV(a)(b) | 4,500 | 308,970 | ||||||
Skyworks Solutions, Inc. | 11,000 | 640,640 | ||||||
SunEdison, Inc.(a) | 4,100 | 79,991 | ||||||
| 1,419,557 | ||||||||
Software & Services—18.4% | ||||||||
Alibaba Group Holding Ltd.—ADR(a)(b) | 8,900 | 877,540 | ||||||
Alliance Data Systems Corp.(a) | 450 | 127,507 | ||||||
ANSYS, Inc.(a) | 5,200 | 408,512 | ||||||
Aspen Technology, Inc.(a) | 12,500 | 461,625 | ||||||
Broadridge Financial Solutions, Inc. | 5,500 | 241,615 | ||||||
Cadence Design Systems, Inc.(a) | 14,500 | 260,275 | ||||||
CoStar Group, Inc.(a) | 1,450 | 233,581 | ||||||
Demandware, Inc.(a) | 13,500 | 809,325 | ||||||
Equinix, Inc. | 700 | 146,230 | ||||||
FactSet Research Systems, Inc. | 2,500 | 328,600 | ||||||
FireEye, Inc.(a) | 7,000 | 237,930 | ||||||
FleetCor Technologies, Inc.(a) | 3,600 | 542,016 | ||||||
Fortinet, Inc.(a) | 8,000 | 208,400 | ||||||
Gartner, Inc.(a) | 5,200 | 419,692 | ||||||
Guidewire Software, Inc.(a) | 3,500 | 174,790 | ||||||
LinkedIn Corp.(a) | 2,000 | 457,920 | ||||||
Manhattan Associates, Inc.(a) | 29,500 | 1,183,245 | ||||||
Mobileye NV(a)(b) | 2,000 | 104,020 | ||||||
NetSuite, Inc.(a) | 8,300 | 901,878 | ||||||
Pandora Media, Inc.(a) | 5,000 | 96,400 | ||||||
PTC, Inc.(a) | 8,500 | 324,275 | ||||||
Qlik Technologies, Inc.(a) | 3,700 | 104,895 | ||||||
Rackspace Hosting, Inc.(a) | 5,500 | 210,980 | ||||||
Red Hat, Inc.(a) | 3,500 | 206,220 | ||||||
| Common Stocks (continued) | Shares | Value | ||||||
ServiceNow, Inc.(a) | 16,500 | $ | 1,120,845 | |||||
SolarWinds, Inc.(a) | 3,300 | 156,915 | ||||||
Solera Holdings, Inc. | 4,900 | 254,555 | ||||||
Splunk, Inc.(a) | 10,900 | 720,272 | ||||||
SS&C Technologies Holdings, Inc.(a) | 4,100 | 198,112 | ||||||
Synchronoss Technologies, Inc.(a) | 10,000 | 516,700 | ||||||
The Ultimate Software Group, Inc.(a) | 4,500 | 677,295 | ||||||
Trulia, Inc.(a) | 5,000 | 233,250 | ||||||
Twitter, Inc.(a) | 2,500 | 103,675 | ||||||
Workday, Inc.(a) | 10,500 | 1,002,540 | ||||||
Yelp, Inc.(a) | 12,000 | 720,000 | ||||||
| 14,771,630 | ||||||||
Technology Hardware & Equipment—2.8% |
| |||||||
3D Systems Corp.(a) | 4,000 | 151,200 | ||||||
Belden, Inc. | 2,800 | 199,332 | ||||||
FEI Co. | 1,700 | 143,276 | ||||||
FLIR Systems, Inc. | 5,200 | 174,356 | ||||||
IPG Photonics Corp.(a) | 1,900 | 139,479 | ||||||
Palo Alto Networks, Inc.(a) | 10,200 | 1,078,140 | ||||||
SanDisk Corp. | 1,500 | 141,210 | ||||||
Stratasys Ltd.(a)(b) | 1,000 | 120,360 | ||||||
Trimble Navigation Ltd.(a) | 5,300 | 142,358 | ||||||
| 2,289,711 | ||||||||
Transportation—2.4% | ||||||||
American Airlines Group, Inc. | 12,000 | 496,200 | ||||||
Avis Budget Group, Inc.(a) | 5,000 | 278,750 | ||||||
Genesee & Wyoming, Inc.(a) | 1,800 | 173,160 | ||||||
Kirby Corp.(a) | 1,500 | 165,870 | ||||||
Old Dominion Freight Line, Inc.(a) | 4,500 | 327,915 | ||||||
Spirit Airlines, Inc.(a) | 7,000 | 511,770 | ||||||
| 1,953,665 | ||||||||
Total Common Stocks | 79,627,541 | |||||||
Real Estate Investment Trust—0.2% |
| |||||||
Real Estate—0.2% | ||||||||
Extra Space Storage, Inc. | 2,000 | 116,320 | ||||||
Total Real Estate Investment Trust | 116,320 | |||||||
| Purchased Call Options—0.6% | Contracts | |||||||
Energy—0.0% |
| |||||||
Core Laboratories NV | 70 | 19,425 | ||||||
Health Care Equipment & Services—0.0% |
| |||||||
Brookdale Senior Living, Inc. | 50 | 5,000 | ||||||
The Accompanying Footnotes are an Integral Part of these Financial Statements.
| 36 | October 31, 2014 |
The Tocqueville Opportunity Fund
Schedule of Investments as of October 31, 2014
| Purchased Call Options (continued) | Contracts | Value | ||||||
Pharmaceuticals, Biotechnology & Life Sciences—0.4% |
| |||||||
Gilead Sciences, Inc. | 70 | $ | 185,325 | |||||
Intercept Pharmaceuticals, Inc. | 20 | 89,200 | ||||||
| 274,525 | ||||||||
Retailing—0.0% | ||||||||
LKQ Corp. | 125 | 13,750 | ||||||
Software & Services—0.0% | ||||||||
Twitter, Inc. | 100 | 4,500 | ||||||
Technology Hardware & Equipment—0.2% |
| |||||||
Apple, Inc. | 115 | 127,650 | ||||||
Transportation—0.1% | ||||||||
Delta Air Lines, Inc. | 100 | 36,100 | ||||||
Kansas City Southern | 35 | 34,650 | ||||||
| 70,750 | ||||||||
Total Purchased Call Options | 515,600 | |||||||
| Short-Term Investment—0.0% | Shares | |||||||
Money Market Fund—0.0% | ||||||||
STIT-Treasury Portfolio, 0.01%(c) | 267 | 267 | ||||||
Total Short-Term Investment | 267 | |||||||
Total Investments |
| 80,259,728 | ||||||
Other Assets in Excess of Liabilities—0.1% |
| 64,434 | ||||||
Total Net Assets—100.0% | $ | 80,324,162 | ||||||
|
| |||||||
Percentages are stated as a percent of net assets.
ADR American Depository Receipt
| (a) | Non-income producing security. |
| (b) | Foreign issued security. Foreign concentration (including ADR’s) was as follows: Bermuda 0.7%; Cayman Islands 1.3%; Denmark 0.5%; France 0.4%; Ireland 3.6%; Israel 0.6%; Jersey 0.2%; Netherlands 1.2%. |
| (c) | Rate listed is the 7-day effective yield. |
The Accompanying Footnotes are an Integral Part of these Financial Statements.
| Annual Report | 37 |
The Tocqueville International Value Fund
Schedule of Investments as of October 31, 2014
| Common Stocks—90.9% | Shares | Value | ||||||
Australia—2.0% | ||||||||
Incitec Pivot Ltd. | 1,801,128 | $ | 4,612,343 | |||||
Belgium—4.0% | ||||||||
Groupe Bruxelles Lambert SA | 58,500 | 5,223,280 | ||||||
NV Bekaert SA | 131,100 | 4,115,408 | ||||||
| 9,338,688 | ||||||||
Canada—1.1% | ||||||||
Superior Plus Corp. | 242,500 | 2,627,146 | ||||||
China—1.6% | ||||||||
Greatview Aseptic Packaging Co., Ltd. | 5,854,600 | 3,835,047 | ||||||
France—13.9% | ||||||||
Bollore SA | 10,020 | 4,746,375 | ||||||
Cie de St-Gobain | 123,928 | 5,318,255 | ||||||
IPSOS | 229,450 | 5,950,536 | ||||||
Metropole Television SA | 163,689 | 2,831,773 | ||||||
Nexans SA(a) | 138,475 | 4,224,582 | ||||||
Sanofi | 63,450 | 5,856,874 | ||||||
Vallourec SA | 111,975 | 4,111,414 | ||||||
| 33,039,809 | ||||||||
Germany—7.4% | ||||||||
Infineon Technologies AG | 506,215 | 4,910,601 | ||||||
SAF-Holland SA | 271,700 | 3,395,271 | ||||||
Siemens AG—ADR | 42,075 | 4,743,535 | ||||||
Wacker Neuson SE | 225,000 | 4,368,946 | ||||||
| 17,418,353 | ||||||||
Hong Kong—5.8% | ||||||||
Chow Tai Fook Jewellery Group Ltd. | 1,938,200 | 2,694,183 | ||||||
Clear Media Ltd. | 3,813,000 | 3,884,219 | ||||||
Hopewell Holdings Ltd. | 1,149,250 | 4,075,276 | ||||||
Hopewell Highway Infrastructure Ltd. | 57,463 | 27,712 | ||||||
Television Broadcasts Ltd. | 574,500 | 3,144,688 | ||||||
| 13,826,078 | ||||||||
Ireland—4.2% | ||||||||
CRH PLC | 214,513 | 4,749,990 | ||||||
DCC PLC | 94,100 | 5,259,557 | ||||||
| 10,009,547 | ||||||||
Italy—0.8% | ||||||||
Sogefi SpA(a) | 760,000 | 1,977,168 | ||||||
Japan—26.0% | ||||||||
Amano Corp. | 325,000 | 3,506,788 | ||||||
Disco Corp. | 74,400 | 4,947,857 | ||||||
FUJIFILM Holdings Corp. | 188,200 | 6,177,551 | ||||||
Hitachi Ltd. | 1,069,500 | 8,179,902 | ||||||
Hoya Corp. | 127,000 | 4,418,006 | ||||||
| Common Stocks (continued) | Shares | Value | ||||||
Kao Corp. | 108,500 | $ | 4,157,919 | |||||
Kyoto Kimono Yuzen Co., Ltd. | 139,800 | 1,255,804 | ||||||
MISUMI Group, Inc. | 189,400 | 5,817,316 | ||||||
Mitsubishi UFJ Financial Group, Inc. | 955,400 | 5,377,288 | ||||||
Miura Co., Ltd. | 120,000 | 1,378,144 | ||||||
Shiseido Co., Ltd. | 327,000 | 5,340,587 | ||||||
SMC Corp. | 20,000 | 5,532,161 | ||||||
Toho Co., Ltd. | 180,600 | 4,080,684 | ||||||
Toyo Suisan Kaisha Ltd. | 43,600 | 1,488,591 | ||||||
| 61,658,598 | ||||||||
Netherlands—4.2% | ||||||||
Akzo Nobel NV | 77,425 | 5,143,297 | ||||||
Koninklijke Ten Cate NV | 214,450 | 4,830,560 | ||||||
| 9,973,857 | ||||||||
Norway—4.9% | ||||||||
Orkla ASA | 669,800 | 5,119,117 | ||||||
Statoil ASA—ADR | 186,950 | 4,290,503 | ||||||
Stolt-Nielsen Ltd. | 122,941 | 2,214,595 | ||||||
| 11,624,215 | ||||||||
Singapore—1.9% | ||||||||
Singapore Post Ltd. | 2,853,400 | 4,375,495 | ||||||
Sweden—1.3% | ||||||||
Lindab International AB(a) | 340,000 | 3,114,915 | ||||||
Switzerland—3.3% | ||||||||
Novartis AG—ADR | 85,000 | 7,878,650 | ||||||
United Kingdom—2.7% | ||||||||
HomeServe PLC | 488,708 | 2,697,150 | ||||||
Unilever NV—ADR | 97,600 | 3,780,048 | ||||||
| 6,477,198 | ||||||||
United States—5.8% | ||||||||
Actavis plc(a) | 18,000 | 4,369,320 | ||||||
Aflac, Inc. | 87,000 | 5,196,510 | ||||||
Freeport-McMoRan, Inc. | 143,000 | 4,075,500 | ||||||
| 13,641,330 | ||||||||
Total Common Stocks |
| 215,428,437 | ||||||
Preferred Stock—2.5% | ||||||||
Republic of Korea—2.5% | ||||||||
Samsung Electronics Co., Ltd. | 6,500 | 5,990,755 | ||||||
Total Preferred Stocks |
| 5,990,755 | ||||||
The Accompanying Footnotes are an Integral Part of these Financial Statements.
| 38 | October 31, 2014 |
The Tocqueville International Value Fund
Schedule of Investments as of October 31, 2014
| Short-Term Investments—6.9% | Shares | Value | ||||||
Money Market Fund—5.0% | ||||||||
STIT-Treasury Portfolio, 0.01%(b) | 11,809,023 | $ | 11,809,023 | |||||
| Commercial Paper—1.9% | | Principal Amount | | |||||
U.S. Bank | $ | 4,450,000 | 4,450,000 | |||||
Total Short-Term Investments (Cost $16,259,023) | 16,259,023 | |||||||
Total Investments |
| 237,678,215 | ||||||
Liabilities in Excess of Other Assets—(0.3)% |
| (627,444 | ) | |||||
Total Net Assets—100.0% | $ | 237,050,771 | ||||||
|
| |||||||
Percentages are stated as a percent of net assets.
ADR American Depository Receipt
| (a) | Non-income producing security. |
| (b) | Rate listed is the 7-day effective yield. |
Schedule of Open Forward Currency Contracts
October 31, 2014
| Counterparties of Contracts | Forward Settlement Date | Currency to be Received | Currency to be Delivered | Amount of Currency to be Delivered | Amount of Currency to be Received | Unrealized Appreciation/ (Depreciation) | ||||||||||||||||||
Pershing | 11/26/2014 | U.S. Dollars | Euro | 8,250,000 | 10,316,213 | $ | (24,012 | ) | ||||||||||||||||
U.S. Bank N.A. | 11/26/2014 | U.S. Dollars | Euro | 19,800,000 | 25,043,040 | 226,500 | ||||||||||||||||||
U.S. Bank N.A. | 11/26/2014 | U.S. Dollars | British Pound | 4,790,000 | 7,678,370 | 17,445 | ||||||||||||||||||
|
| |||||||||||||||||||||||
| $ | 219,933 | |||||||||||||||||||||||
|
| |||||||||||||||||||||||
The Accompanying Footnotes are an Integral Part of these Financial Statements.
| Annual Report | 39 |
The Tocqueville Gold Fund
Schedule of Investments as of October 31, 2014
| Common Stocks—78.3% | Shares | Value | ||||||
Gold Related Securities—68.5% |
| |||||||
Australia—0.0% | ||||||||
OceanaGold Corp.(a) | 250,000 | $ | 408,145 | |||||
Canada—52.7% | ||||||||
Agnico Eagle Mines Ltd. | 1,531,073 | 35,980,216 | ||||||
Agnico Eagle Mines Ltd.(b) | 540,985 | 12,748,824 | ||||||
Alamos Gold, Inc. | 2,710,000 | 20,243,700 | ||||||
Almaden Minerals Ltd.(a)(d)(e)(f) (Originally acquired 07/31/2014, Cost $1,192,278) | 866,667 | 972,131 | ||||||
Anthem United, Inc.(a)(c) | 5,000,000 | 2,173,817 | ||||||
ATAC Resources Ltd.(a)(c) | 11,516,891 | 4,904,935 | ||||||
B2Gold Corp.(a) | 12,927,100 | 21,588,257 | ||||||
Barisan Gold Corp.(a) | 877,100 | 101,169 | ||||||
Brazil Resources, Inc.(a) | 202,392 | 118,521 | ||||||
Continental Gold Ltd.(a) | 2,039,900 | 3,420,799 | ||||||
Corvus Gold, Inc.(a)(c) | 2,079,901 | 1,616,083 | ||||||
Corvus Gold, Inc.(b)(a)(c) | 9,130,000 | 7,047,691 | ||||||
Dalradian Resources, Inc.(a) | 2,600,000 | 1,268,799 | ||||||
Detour Gold Corp.(a)(c) | 5,296,600 | 31,016,867 | ||||||
East Asia Minerals Corp.(a)(c) | 10,544,400 | 140,336 | ||||||
Eldorado Gold Corp. | 8,189,885 | 44,880,570 | ||||||
Eldorado Gold Corp.(b) | 1,000,000 | 5,465,596 | ||||||
Falco Resources Ltd.(a)(d)(e)(f) (Originally acquired 10/20/2014, Cost $886,202) | 2,222,300 | 695,646 | ||||||
Franco-Nevada Corp.(a) | 1,265,300 | 59,231,825 | ||||||
GoGold Resources, Inc.(a)(c) | 12,555,000 | 17,712,125 | ||||||
Goldcorp, Inc. | 580,850 | 10,908,363 | ||||||
Goldcorp, Inc.(b) | 2,138,010 | 40,121,478 | ||||||
IAMGOLD Corp.(a) | 2,383,396 | 4,504,618 | ||||||
International Tower Hill Mines Ltd.(a)(c) | 5,738,836 | 2,008,593 | ||||||
International Tower Hill Mines Ltd.(b)(a)(c) | 7,589,744 | 2,693,667 | ||||||
Kinross Gold Corp.(a) | 800,000 | 1,720,000 | ||||||
New Gold, Inc.(a) | 6,341,640 | 22,829,904 | ||||||
NOVAGOLD Resources, Inc.(a) | 4,181,300 | 10,327,811 | ||||||
Osisko Gold Royalties Ltd.(a)(c) | 2,549,540 | 31,850,870 | ||||||
Pan American Silver Corp. | 2,398,098 | 22,134,444 | ||||||
Premier Gold Mines Ltd.(a) | 700,000 | 1,124,174 | ||||||
Primero Mining Corp.(a)(c) | 8,468,800 | 28,929,400 | ||||||
Rockhaven Resources Ltd.(a)(c) | 6,400,000 | 993,745 | ||||||
Romarco Minerals, Inc.(a) | 18,387,800 | 9,396,166 | ||||||
Rubicon Minerals Corp.(a)(c) | 11,230,000 | 9,465,862 | ||||||
SEMAFO, Inc.(a)(c) | 8,814,200 | 22,916,920 | ||||||
Silver Wheaton Corp. | 1,884,875 | 32,740,279 | ||||||
Strategic Metals Ltd.(a)(c) | 10,926,900 | 2,957,015 | ||||||
Sunward Resources Ltd.(a) | 660,800 | 70,357 | ||||||
Torex Gold Resources, Inc.(a)(c) | 34,685,500 | 36,930,571 | ||||||
Turquoise Hill Resources Ltd.(a) | 271,032 | 907,957 | ||||||
Turquoise Hill Resources Ltd.(b)(a) | 100,000 | $ | 335,389 | |||||
Yamana Gold, Inc. | 7,007,412 | 27,889,500 | ||||||
Yamana Gold, Inc.(b) | 1,351,906 | 5,385,793 | ||||||
| 600,470,783 | ||||||||
Jersey—3.5% | ||||||||
Randgold Resources Ltd.—ADR | 677,900 | 39,460,559 | ||||||
Mexico—1.6% | ||||||||
Fresnillo PLC | 1,640,000 | 18,298,887 | ||||||
Peru—0.5% | ||||||||
Cia de Minas Buenaventura SAA—ADR | 553,600 | 5,093,120 | ||||||
South Africa—1.2% | ||||||||
Gold Fields Ltd.—ADR | 4,141,950 | 13,212,821 | ||||||
Gold Fields Ltd.(b) | 166,249 | 548,649 | ||||||
| 13,761,470 | ||||||||
United States—9.0% | ||||||||
Alacer Gold Corp. | 2,626,800 | 4,358,383 | ||||||
Argonaut Gold, Inc.(a)(c) | 2,687,000 | 5,721,840 | ||||||
Electrum Ltd.(a)(d)(e)(f) (Originally acquired 12/21/2007, Cost $13,065,361) | 2,127,287 | 1,489,101 | ||||||
Newmont Mining Corp. | 1,335,300 | 25,050,228 | ||||||
Royal Gold, Inc. | 1,143,965 | 65,377,600 | ||||||
| 101,997,152 | ||||||||
Total Gold Related Securities | 779,490,116 | |||||||
Other Precious Metals Related Securities—9.2% |
| |||||||
Canada—3.6% | ||||||||
Bear Creek Mining Corp.(a)(c) | 7,413,200 | 8,419,233 | ||||||
Ivanhoe Mines Ltd.—Class A(a) | 10,077,031 | 7,599,908 | ||||||
Ivanhoe Mines Ltd.—Class B(a)(d)(e)(f)(g) (Originally acquired 08/15/2001, Cost $3,887,381) | 2,541,184 | 1,842,108 | ||||||
MAG Silver Corp.(a)(c) | 2,960,700 | 17,882,628 | ||||||
Plata Latina Minerals Corp.(a) | 2,000,000 | 150,836 | ||||||
Scorpio Mining Corp.(a)(c) | 25,668,419 | 4,183,952 | ||||||
Scorpio Mining Corp.(b)(a)(c) | 522,400 | 88,067 | ||||||
Silver Range Resources Ltd.(a)(c) | 3,450,000 | 260,193 | ||||||
SilverCrest Mines, Inc.(a) | 755,600 | 952,000 | ||||||
| 41,378,925 | ||||||||
United States—5.6% | ||||||||
Stillwater Mining Co.(a) | 1,010,900 | 13,273,117 | ||||||
Sunshine Mining & Refining(a)(d)(e)(f) (Originally acquired 03/15/2011, Cost $18,353,107) | 1,633,545 | 7,350,952 | ||||||
The Accompanying Footnotes are an Integral Part of these Financial Statements.
| 40 | October 31, 2014 |
The Tocqueville Gold Fund
Schedule of Investments as of October 31, 2014
| Common Stocks (continued) | Shares | Value | ||||||
Tahoe Resources, Inc.(a) | 2,450,000 | $ | 42,454,638 | |||||
| 63,078,707 | ||||||||
Total Other Precious Metals Related Securities | 104,457,632 | |||||||
Other Securities—0.6% | ||||||||
Canada—0.0% | ||||||||
Oban Mining(a) | 530,785 | 42,386 | ||||||
Niger—0.0% | ||||||||
GoviEx Uranium, Inc.(b)(a)(d)(e)(f) (Originally acquired 10/09/2007, Cost $840,061) | 428,750 | 133,146 | ||||||
GoviEx Uranium, Inc.(a)(d)(e)(f) (Originally acquired 10/09/2007, Cost $2,588,759) | 1,321,250 | 205,154 | ||||||
| 338,300 | ||||||||
United States—0.6% | ||||||||
Gold Bullion International LLC(a)(c)(d)(e)(f) (Originally acquired 05/12/2010, Cost $5,000,000) | 5,000,000 | 6,893,000 | ||||||
I-Pulse, Inc.(a)(d)(e)(f) (Originally acquired 10/09/2007, Cost $175,524) | 74,532 | 256,390 | ||||||
| 7,149,390 | ||||||||
Total Other Securities | 7,530,076 | |||||||
Total Common Stocks (Cost $1,593,085,657) | 891,477,824 | |||||||
Private Fund—1.4% |
| |||||||
Gold Related Securities—1.4% |
| |||||||
United States—1.4% |
| |||||||
Tocqueville Bullion Reserve LP(a)(c)(d)(e)(f) (Originally acquired 11/28/2011, Cost $25,000,000) | 13,806 | 15,609,286 | ||||||
Total Private Fund (Cost 25,000,000) | 15,609,286 | |||||||
| Gold Bullion—10.3% | Ounces | |||||||
Gold Bullion(a) | 99,645 | 116,931,899 | ||||||
Total Gold Bullion (Cost $47,174,933) | 116,931,899 | |||||||
| Warrants—0.0% | Shares | |||||||
Gold Related Securities—0.0% |
| |||||||
Canada—0.0% | ||||||||
Almaden Minerals Ltd. | 433,333 | 29,874 | ||||||
Anthem United, Inc. | 1,250,000 | $ | 186,660 | |||||
ATAC Resources Ltd. | 276,595 | — | ||||||
Dalradian Resources, Inc. | 875,000 | 40,759 | ||||||
East Asia Minerals Corp. | 6,500,000 | 32,297 | ||||||
Pan American Silver Corp. | 133,333 | 35 | ||||||
Primero Mining Corp. | 1,848,400 | 180,404 | ||||||
Rockhaven Resources Ltd. | 700,000 | 31,054 | ||||||
Rubicon Minerals Corp. | 3,064,000 | 108,744 | ||||||
Total Gold Related Securities | 609,827 | |||||||
Other Precious Metals Related Securities—0.0% |
| |||||||
Canada—0.0% |
| |||||||
Plata Latina Minerals Corp. | 1,000,000 | — | ||||||
Total Other Precious Metals Related Securities | — | |||||||
Total Warrants (Cost $0) | 609,827 | |||||||
The Accompanying Footnotes are an Integral Part of these Financial Statements.
| Annual Report | 41 |
The Tocqueville Gold Fund
Schedule of Investments as of October 31, 2014
| Short-Term Investments—5.9% | Shares | Value | ||||||
Money Market Fund—5.1% | ||||||||
STIT—Treasury Portfolio, 0.01%(h) | 58,486,346 | $ | 58,486,345 | |||||
| Commerical Paper—0.8% | | Principal Amount | | |||||
U.S. Bank | $ | 8,666,000 | 8,666,000 | |||||
Total Short-Term Investments (Cost $67,152,345) | 67,152,345 | |||||||
Total Investments |
| 1,091,781,181 | ||||||
Other Assets in Excess of Liabilities—4.1% |
| 46,775,959 | ||||||
Total Net Assets—100.0% | $ | 1,138,557,140 | ||||||
|
| |||||||
Percentages are stated as a percent of net assets.
ADR American Depository Receipt
| (a) | Non-income producing security. |
| (b) | Denotes an issue that is traded on a foreign exchange when a company is listed more than once. |
| (c) | Affiliated Company. See Footnote 8. |
| (d) | Denotes a security is either fully or partially restricted to resale. The aggregate value of restricted securities as of October 31, 2014 was $35,726,834, which represented 3.1% of net assets. |
| (e) | Securities are fair valued using procedures approved by the Board of Trustees. The aggregate value of fair valued securities as of October 31, 2014 was $35,726,834, which represented 3.1% of net assets. |
| (f) | Security is considered illiquid and may be difficult to sell. |
| (g) | Convertible into Ivanplats Ltd.—Class A shares. |
| (h) | Rate listed is the 7-day effective yield. |
The Accompanying Footnotes are an Integral Part of these Financial Statements.
| 42 | October 31, 2014 |
The Delafield Fund
Schedule of Investments as of October 31, 2014
| Common Stocks—86.3% | Shares | Value | ||||||
Aerospace & Defense—3.3% |
| |||||||
Honeywell International, Inc. | 500,000 | $ | 48,060,000 | |||||
Building Products—0.5% | ||||||||
Gibraltar Industries, Inc.(a) | 535,000 | 8,158,750 | ||||||
Chemicals—17.1% |
| |||||||
Albemarle Corp. | 100,000 | 5,838,000 | ||||||
Ashland, Inc. | 125,000 | 13,508,750 | ||||||
Cabot Corp. | 350,000 | 16,250,500 | ||||||
Chemtura Corp.(a) | 1,100,000 | 25,619,000 | ||||||
Eastman Chemical Co. | 725,000 | 58,565,500 | ||||||
HB Fuller Co. | 500,000 | 20,985,000 | ||||||
Kraton Performance Polymers, Inc.(a) | 150,000 | 2,683,500 | ||||||
Minerals Technologies, Inc. | 550,000 | 42,190,500 | ||||||
OM Group, Inc. | 590,000 | 15,357,700 | ||||||
Orion Engineered Carbons SA(a)(b) | 50,000 | 755,000 | ||||||
PolyOne Corp. | 1,200,000 | 44,412,000 | ||||||
Rockwood Holdings, Inc. | 75,000 | 5,768,250 | ||||||
| 251,933,700 | ||||||||
Commercial Services & Supplies—1.4% |
| |||||||
ACCO Brands Corp.(a) | 1,750,000 | 14,402,500 | ||||||
Brady Corp. | 250,000 | 5,960,000 | ||||||
| 20,362,500 | ||||||||
Computers & Peripherals—1.8% |
| |||||||
Diebold, Inc. | 300,000 | 10,629,000 | ||||||
Hewlett-Packard Co. | 425,000 | 15,249,000 | ||||||
| 25,878,000 | ||||||||
Construction & Engineering—1.0% |
| |||||||
Aegion Corp.(a) | 800,000 | 14,656,000 | ||||||
Containers & Packaging—6.3% |
| |||||||
Avery Dennison Corp. | 800,000 | 37,480,000 | ||||||
Owens-Illinois, Inc.(a) | 1,000,000 | 25,770,000 | ||||||
Sealed Air Corp. | 800,000 | 29,000,000 | ||||||
| 92,250,000 | ||||||||
Electrical Equipment—0.6% |
| |||||||
General Cable Corp. | 250,000 | 3,542,500 | ||||||
Hubbell, Inc. | 45,000 | 5,103,450 | ||||||
| 8,645,950 | ||||||||
Electronic Equipment, Instruments & Components—9.6% |
| |||||||
Checkpoint Systems, Inc.(a) | 650,000 | 8,619,000 | ||||||
Flextronics International Ltd.(a)(b) | 3,925,000 | 42,076,000 | ||||||
Ingram Micro, Inc.(a) | 1,175,000 | 31,537,000 | ||||||
Jabil Circuit, Inc. | 1,200,000 | 25,140,000 | ||||||
Kemet Corp.(a)(c) | 2,600,000 | 12,480,000 | ||||||
Plexus Corp.(a) | 525,000 | 21,708,750 | ||||||
| 141,560,750 | ||||||||
| Common Stocks (continued) | Shares | Value | ||||||
Energy Equipment & Services—3.7% |
| |||||||
Frank’s International NV(b) | 825,000 | $ | 14,214,750 | |||||
McDermott International, Inc.(a)(b) | 2,500,000 | 9,600,000 | ||||||
Oil States International, Inc.(a) | 250,000 | 14,935,000 | ||||||
Weatherford International PLC(a)(b) | 1,000,000 | 16,420,000 | ||||||
| 55,169,750 | ||||||||
Industrial Conglomerates—1.8% |
| |||||||
Carlisle Cos., Inc. | 300,000 | 26,664,000 | ||||||
Insurance—1.1% |
| |||||||
XL Group PLC(b) | 500,000 | 16,940,000 | ||||||
Machinery—13.2% |
| |||||||
Crane Co. | 400,000 | 24,940,000 | ||||||
Dover Corp. | 700,000 | 55,608,000 | ||||||
Harsco Corp. | 1,250,000 | 27,100,000 | ||||||
Joy Global, Inc. | 20,000 | 1,052,600 | ||||||
Kennametal, Inc. | 800,000 | 30,888,000 | ||||||
Stanley Black & Decker, Inc. | 475,000 | 44,479,000 | ||||||
Xerium Technologies, Inc.(a)(c) | 750,000 | 11,190,000 | ||||||
| 195,257,600 | ||||||||
Marine—0.1% |
| |||||||
Baltic Trading Ltd.(b) | 400,000 | 1,500,000 | ||||||
Metals & Mining—6.0% |
| |||||||
Allegheny Technologies, Inc. | 700,000 | 22,995,000 | ||||||
AM Castle & Co.(a)(c) | 1,200,000 | 8,820,000 | ||||||
Carpenter Technology Corp. | 500,000 | 25,025,000 | ||||||
Horsehead Holding Corp.(a) | 750,000 | 11,782,500 | ||||||
Ryerson Holding Corp.(a) | 725,000 | 9,265,500 | ||||||
Universal Stainless & Alloy Products, Inc.(a)(c) | 400,000 | 10,284,000 | ||||||
| 88,172,000 | ||||||||
Oil, Gas & Consumable Fuels—4.1% |
| |||||||
Bill Barrett Corp.(a) | 500,000 | 7,600,000 | ||||||
Boardwalk Pipeline Partners LP | 1,100,000 | 18,832,000 | ||||||
CONSOL Energy, Inc. | 725,000 | 26,680,000 | ||||||
Energy XXI Bermuda Ltd.(b) | 1,000,000 | 7,690,000 | ||||||
| 60,802,000 | ||||||||
Professional Services—1.7% |
| |||||||
TrueBlue, Inc.(a) | 1,000,000 | 24,720,000 | ||||||
Semiconductors & Semiconductor Equipment—4.7% |
| |||||||
Fairchild Semiconductor International, Inc.(a) | 2,850,000 | 43,747,500 | ||||||
Infineon Technologies AG(b) | 550,000 | 5,335,343 | ||||||
Teradyne, Inc. | 1,125,000 | 20,700,000 | ||||||
| 69,782,843 | ||||||||
Specialty Retail—5.0% |
| |||||||
Ascena Retail Group, Inc.(a) | 2,175,000 | 27,078,750 | ||||||
Pier 1 Imports, Inc. | 1,100,000 | 14,190,000 | ||||||
The Accompanying Footnotes are an Integral Part of these Financial Statements.
| Annual Report | 43 |
The Delafield Fund
Schedule of Investments as of October 31, 2014
| Common Stocks (continued) | Shares | Value | ||||||
Stage Stores, Inc. | 600,000 | $ | 10,122,000 | |||||
Staples, Inc. | 1,750,000 | 22,190,000 | ||||||
| 73,580,750 | ||||||||
Textiles, Apparel & Luxury Goods—0.4% |
| |||||||
Perry Ellis International, Inc.(a) | 263,550 | 5,389,597 | ||||||
Trading Companies & Distributors—2.9% |
| |||||||
Rush Enterprises, Inc.(a) | 275,000 | 10,477,500 | ||||||
WESCO International, Inc.(a) | 400,000 | 32,964,000 | ||||||
| 43,441,500 | ||||||||
Total Common Stocks | 1,272,925,690 | |||||||
| Corporate Bonds—2.7% | | Principal Amount | | |||||
Banks—0.3% |
| |||||||
Royal Bank of Canada | $ | 5,000,000 | 5,002,735 | |||||
Capital Markets—0.3% |
| |||||||
The Goldman Sachs Group, Inc. | 5,000,000 | 4,996,565 | ||||||
Consumer Finance—0.4% | ||||||||
American Express Credit Corp. | 5,000,000 | 5,024,050 | ||||||
Diversified Financial Services—1.2% |
| |||||||
General Electric Capital Corp. | 14,000,000 | 14,011,522 | ||||||
Wells Fargo Bank N.A. | 4,000,000 | 3,996,932 | ||||||
| 18,008,454 | ||||||||
Pharmaceuticals—0.5% |
| |||||||
Merck & Co., Inc. | 7,200,000 | 7,218,022 | ||||||
Total Corporate Bonds |
| 40,249,826 | ||||||
| Short-Term Investments—11.2% | Shares | Value | ||||||
Money Market Fund—2.7% |
| |||||||
STIT-Treasury Portfolio, 0.01%(e) | 39,928,033 | $ | 39,928,033 | |||||
U.S. Treasury Bills—8.5% | | Principal Amount | | |||||
0.017%, 11/13/2014(f) | $ | 75,000,000 | 74,999,573 | |||||
0.015%, 12/18/2014(f) | 50,000,000 | 49,999,027 | ||||||
| 124,998,600 | ||||||||
Total Short-Term Investments |
| 164,926,633 | ||||||
Total Investments |
| 1,478,102,149 | ||||||
Liabilities in Excess of Other Assets—(0.2)% |
| (2,963,150 | ) | |||||
Total Net Assets—100.0% | $ | 1,475,138,999 | ||||||
|
| |||||||
Percentages are stated as a percent of net assets.
| (a) | Non-income producing security. |
| (b) | Foreign issued security. Foreign concentration (including ADR’s) was as follows: Bermuda 0.5%; Canada 0.3%; Germany 0.4%; Ireland 2.3%; Luxembourg 0.1%; Marshall Islands 0.1%; Netherlands 1.0%; Panama 0.7%; Singapore 2.9%. |
| (c) | Affiliated company. See Footnote 8. |
| (d) | Variable rate security. The rate shown is as of 10/31/2014. |
| (e) | Rate listed is the 7-day effective yield. |
| (f) | Rate listed is the effective yield based on purchase price. The calculation assumes the security is held to maturity. |
The Accompanying Footnotes are an Integral Part of these Financial Statements.
| 44 | October 31, 2014 |
The Tocqueville Select Fund
Schedule of Investments as of October 31, 2014
| Common Stocks—88.2% | Shares | Value | ||||||
Chemicals—6.5% | ||||||||
Ashland, Inc. | 20,600 | $ | 2,226,242 | |||||
Minerals Technologies, Inc. | 62,500 | 4,794,375 | ||||||
| 7,020,617 | ||||||||
Commercial Services & Supplies—4.6% |
| |||||||
ACCO Brands Corp.(a) | 478,600 | 3,938,878 | ||||||
Civeo Corp. | 88,600 | 1,080,034 | ||||||
| 5,018,912 | ||||||||
Containers & Packaging—5.7% |
| |||||||
Avery Dennison Corp. | 77,500 | 3,630,875 | ||||||
Owens-Illinois, Inc.(a) | 97,000 | 2,499,690 | ||||||
| 6,130,565 | ||||||||
Electronic Equipment, Instruments & Components—10.4% |
| |||||||
Checkpoint Systems, Inc.(a) | 109,000 | 1,445,340 | ||||||
Flextronics International Ltd.(a)(b) | 468,200 | 5,019,104 | ||||||
Jabil Circuit, Inc. | 227,400 | 4,764,030 | ||||||
| 11,228,474 | ||||||||
Energy Equipment & Services—2.9% |
| |||||||
Oil States International, Inc.(a) | 53,200 | 3,178,168 | ||||||
Industrial Conglomerates—2.8% |
| |||||||
Carlisle Cos., Inc. | 33,500 | 2,977,480 | ||||||
Internet Software & Services—9.5% |
| |||||||
Conversant, Inc.(a) | 95,000 | 3,348,750 | ||||||
j2 Global, Inc. | 61,400 | 3,321,126 | ||||||
Web.com Group, Inc.(a) | 175,000 | 3,592,750 | ||||||
| 10,262,626 | ||||||||
IT Services—3.9% | ||||||||
EPAM Systems, Inc.(a) | 88,400 | 4,220,216 | ||||||
Leisure Products—2.6% | ||||||||
Summer Infant, Inc.(a)(c) | 814,933 | 2,762,623 | ||||||
Machinery—13.3% | ||||||||
Harsco Corp. | 160,000 | 3,468,800 | ||||||
Kennametal, Inc. | 83,500 | 3,223,935 | ||||||
Stanley Black & Decker, Inc. | 39,900 | 3,736,236 | ||||||
Xerium Technologies, Inc.(a)(c) | 265,000 | 3,953,800 | ||||||
| 14,382,771 | ||||||||
Metals & Mining—2.8% | ||||||||
Carpenter Technology Corp. | 60,000 | 3,003,000 | ||||||
Oil, Gas & Consumable Fuels—3.1% |
| |||||||
CONSOL Energy, Inc. | 90,700 | 3,337,760 | ||||||
Professional Services—6.5% | ||||||||
RPX Corp.(a) | 198,000 | 2,781,900 | ||||||
Stantec, Inc.(b) | 67,600 | 4,289,896 | ||||||
| 7,071,796 | ||||||||
| Common Stocks (continued) | Shares | Value | ||||||
Semiconductors & Semiconductor Equipment—4.5% |
| |||||||
Fairchild Semiconductor International, Inc.(a) | 317,000 | $ | 4,865,950 | |||||
Specialty Retail—9.1% | ||||||||
Ascena Retail Group, Inc.(a) | 245,000 | 3,050,250 | ||||||
Pier 1 Imports, Inc. | 218,000 | 2,812,200 | ||||||
Staples, Inc. | 316,000 | 4,006,880 | ||||||
| 9,869,330 | ||||||||
Total Common Stocks | 95,330,288 | |||||||
Short-Term Investments—10.8% |
| |||||||
Money Market Fund—2.5% |
| |||||||
STIT-Treasury Portfolio, 0.01%(d) | 2,670,166 | 2,670,166 | ||||||
| U.S. Treasury Bills—8.3% | | Principal Amount | | |||||
0.007%, 11/13/2014(e) | $ | 3,000,000 | 2,999,994 | |||||
0.011%, 12/18/2014(e) | 6,000,000 | 5,999,917 | ||||||
| 8,999,911 | ||||||||
Total Short-Term Investments |
| 11,670,077 | ||||||
Total Investments | 107,000,365 | |||||||
Other Assets in Excess of Liabilities—1.0% |
| 1,059,329 | ||||||
Total Net Assets—100.0% | $ | 108,059,694 | ||||||
|
| |||||||
Percentages are stated as a percent of net assets.
| (a) | Non-income producing security. |
| (b) | Foreign issued security. Foreign concentration was as follows: Canada 4.0%; Singapore 4.6%. |
| (c) | Affiliated company. See Footnote 8. |
| (d) | Rate listed is the 7-day effective yield. |
| (e) | Rate listed is the effective yield based on the purchase price. The calculation assumes the security is held to maturity. |
The Accompanying Footnotes are an Integral Part of these Financial Statements.
| Annual Report | 45 |
The Tocqueville Alternative Strategies Fund
Schedule of Investments as of October 31, 2014
| Common Stocks—31.6% | Shares | Value | ||||||
Airlines—0.5% | ||||||||
Delta Air Lines, Inc. | 5,000 | $ | 201,150 | |||||
Biotechnology—3.6% | ||||||||
Isis Pharmaceuticals, Inc.(a) | 13,000 | 598,780 | ||||||
PTC Therapeutics, Inc.(a) | 20,000 | 817,400 | ||||||
| 1,416,180 | ||||||||
Health Care Providers & Services—2.0% |
| |||||||
Hanger, Inc.(a) | 32,500 | 777,725 | ||||||
Hotels, Restaurants & Leisure—1.1% |
| |||||||
Bob Evans Farms, Inc. | 9,000 | 439,650 | ||||||
Internet & Catalog Retail—0.4% |
| |||||||
Amazon.com, Inc.(a) | 500 | 152,730 | ||||||
Internet Software & Services—2.2% |
| |||||||
eBay, Inc.(a) | 7,500 | 393,750 | ||||||
Inuvo, Inc.(a)(b) | 350,000 | 469,000 | ||||||
| 862,750 | ||||||||
Machinery—1.8% |
| |||||||
Allison Transmission Holdings, Inc. | 21,500 | 698,320 | ||||||
Metals & Mining—3.9% |
| |||||||
Alamos Gold, Inc.(c) | 80,000 | 597,600 | ||||||
B2Gold Corp.(a)(c) | 165,000 | 275,550 | ||||||
Endeavour Mining Corp.(a) | 200,000 | 85,178 | ||||||
Freeport-McMoRan, Inc. | 20,000 | 570,000 | ||||||
| 1,528,328 | ||||||||
Oil, Gas & Consumable Fuels—2.4% |
| |||||||
Gulf Coast Ultra Deep Royalty Trust(a) | 50,000 | 80,000 | ||||||
Hallador Energy Co. | 60,000 | 720,000 | ||||||
Ur-Energy, Inc.(a)(c) | 187,400 | 149,920 | ||||||
| 949,920 | ||||||||
Pharmaceuticals—5.5% |
| |||||||
Actavis plc(a)(c) | 2,500 | 606,850 | ||||||
Allergan, Inc. | 5,000 | 950,300 | ||||||
Omeros Corp.(a) | 35,000 | 579,950 | ||||||
| 2,137,100 | ||||||||
Professional Services—0.2% |
| |||||||
Hudson Global, Inc.(a) | 27,000 | 92,070 | ||||||
Semiconductors & Semiconductor Equipment—0.7% |
| |||||||
Magnachip Semiconductor Corp.(a) | 24,000 | 267,120 | ||||||
Software—2.7% |
| |||||||
GSE Systems, Inc.(a) | 270,523 | 408,490 | ||||||
Splunk, Inc.(a) | 10,000 | 660,800 | ||||||
| 1,069,290 | ||||||||
Technology Hardware, Storage & Peripherals—3.3% |
| |||||||
BlackBerry Ltd.(a)(c) | 122,500 | 1,286,250 | ||||||
| Common Stocks (continued) | Shares | Value | ||||||
Tobacco—1.3% |
| |||||||
Lorillard, Inc. | 8,000 | $ | 492,000 | |||||
Total Common Stocks |
| 12,370,583 | ||||||
| Convertible Bonds—45.7% | | Principal Amount | | |||||
Air Freight & Logistics—1.4% | ||||||||
UTi Worldwide, Inc. | $ | 500,000 | 539,063 | |||||
Airlines—1.4% |
| |||||||
Hawaiian Holdings, Inc. 5.000%, 03/15/2016* | 250,000 | 558,281 | ||||||
Automobiles—3.7% |
| |||||||
Tesla Motors, Inc. 1.250%, 03/01/2021* | 1,500,000 | 1,435,313 | ||||||
Electric Utilities—3.0% |
| |||||||
NRG Yield, Inc. 3.500%, 02/01/2019* | 1,000,000 | 1,163,125 | ||||||
Health Care Equipment & Supplies—5.1% |
| |||||||
Teleflex, Inc. | 500,000 | 938,749 | ||||||
The Spectranetics Corp. | 500,000 | 617,188 | ||||||
Volcano Corp. | 500,000 | 425,625 | ||||||
| 1,981,562 | ||||||||
Internet Software & Services—2.3% |
| |||||||
Qihoo 360 Technology Co., Ltd. | 1,000,000 | 915,625 | ||||||
Life Sciences Tools & Services—1.4% |
| |||||||
Fluidigm Corp. | 600,000 | 556,125 | ||||||
Machinery—2.7% |
| |||||||
Chart Industries, Inc. 2.000%, 08/01/2018 | 1,000,000 | 1,071,250 | ||||||
Materials—2.6% |
| |||||||
Owens-Brockway Glass Container, Inc. | 1,000,000 | 1,003,750 | ||||||
Metals & Mining—7.2% |
| |||||||
NOVAGOLD Resources, Inc. | 1,000,000 | 1,006,250 | ||||||
RTI International Metals, Inc. | 1,000,000 | 961,875 | ||||||
Stillwater Mining Co. | 750,000 | 859,688 | ||||||
| 2,827,813 | ||||||||
The Accompanying Footnotes are an Integral Part of these Financial Statements.
| 46 | October 31, 2014 |
The Tocqueville Alternative Strategies Fund
Schedule of Investments as of October 31, 2014
| Convertible Bonds (continued) | Principal | Value | ||||||
Oil, Gas & Consumable Fuels—0.6% |
| |||||||
Alpha Natural Resources, Inc. 2.375%, 04/15/2015* | $ | 250,000 | $ | 237,500 | ||||
Pharmaceuticals—2.5% |
| |||||||
Auxilium Pharmaceuticals, Inc. 1.500%, 07/15/2018* | 700,000 | 980,000 | ||||||
Real Estate Investment Trusts (REITs)—2.3% |
| |||||||
Starwood Property Trust, Inc. 3.750%, 10/15/2017 | 900,000 | 907,313 | ||||||
Semiconductors & Semiconductor Equipment—3.8% |
| |||||||
SunEdison, Inc. 0.250%, 01/15/2020* | 1,500,000 | 1,501,875 | ||||||
Software—5.7% |
| |||||||
Nuance Communications, Inc. 2.750%, 11/01/2031(d) | 1,250,000 | 1,225,780 | ||||||
Rovi Corp. | 1,000,000 | 998,750 | ||||||
| 2,224,530 | ||||||||
Total Convertible Bonds |
| 17,903,125 | ||||||
Corporate Bonds—14.5% | ||||||||
Auto Components—2.1% | ||||||||
The Goodyear Tire & Rubber Co. 8.250%, 08/15/2020(d) | 750,000 | 810,000 | ||||||
Banks—4.6% |
| |||||||
JPMorgan Chase & Co. 5.150%, 12/29/2049*(d)(e) | 1,400,000 | 1,330,000 | ||||||
Wachovia Capital Trust III 5.570%, 03/15/2042*(d)(e) | 500,000 | 486,250 | ||||||
| 1,816,250 | ||||||||
Capital Markets—1.7% |
| |||||||
Goldman Sachs Capital II 4.000%, 06/01/2043*(d)(e) | 900,000 | 681,300 | ||||||
Food & Staples Retailing—1.3% |
| |||||||
Bunge Ltd. Finance Corp. 4.100%, 03/15/2016* | 500,000 | 520,881 | ||||||
Insurance—0.7% |
| |||||||
Prudential Financial, Inc. 5.625%, 06/15/2043*(d)(e) | 250,000 | 260,625 | ||||||
Metals & Mining—2.8% |
| |||||||
IAMGOLD Corp. 6.750%, 10/01/2020(c)(d) | 1,000,000 | 830,000 | ||||||
Noranda Aluminum Acquisition Corp. 11.000%, 06/01/2019(d) | 250,000 | 252,500 | ||||||
| 1,082,500 | ||||||||
| Corporate Bonds (continued) | Principal | Value | ||||||
Oil, Gas & Consumable Fuels—1.3% |
| |||||||
W&T Offshore, Inc. 8.500%, 06/15/2019*(d) | $ | 500,000 | $ | 490,000 | ||||
Total Corporate Bonds |
| 5,661,556 | ||||||
| Exchange-Traded Fund (ETF)—1.7% | Shares | |||||||
Capital Markets—1.7% |
| |||||||
SPDR Gold Shares*(a) | 5,700 | 642,162 | ||||||
Total Exchange-Traded Fund | 642,162 | |||||||
Closed-End Funds—2.4% |
| |||||||
Capital Markets—2.4% | ||||||||
BlackRock Debt Strategies Fund, Inc. | 110,496 | 420,990 | ||||||
Credit Suisse Asset Management Income Fund, Inc. | 60,000 | 208,140 | ||||||
Western Asset Income Fund | 23,000 | 310,270 | ||||||
| 939,400 | ||||||||
Total Closed-End Funds |
| 939,400 | ||||||
Preferred Stocks—8.1% | ||||||||
Banks—4.5% |
| |||||||
Bank of America Corp.(d) 6.625%, 12/31/2049(d) | 11,500 | 290,835 | ||||||
Citigroup, Inc. 6.875%, 12/31/2049*(d)(e) | 15,000 | 401,400 | ||||||
HSBC USA, Inc. 3.500%, 12/31/2049*(d)(e) | 30,000 | 658,500 | ||||||
U.S. Bancorp 3.500%, 12/31/2049*(d)(e) | 500 | 410,070 | ||||||
| 1,760,805 | ||||||||
Consumer Finance—2.2% |
| |||||||
SLM Corp. 1.934%, 12/31/2049*(d)(e) | 12,000 | 865,920 | ||||||
Diversified Financials—1.4% |
| |||||||
Citigroup Capital XIII 7.875%, 12/31/2041(d)(e) | 20,000 | 532,400 | ||||||
Total Preferred Stocks |
| 3,159,125 | ||||||
| Purchased Call Options—0.3% | Contracts | |||||||
Airlines—0.2% |
| |||||||
Delta Air Lines, Inc. | 200 | 63,000 | ||||||
Delta Air Lines, Inc. | 100 | 36,100 | ||||||
| 99,100 | ||||||||
The Accompanying Footnotes are an Integral Part of these Financial Statements.
| Annual Report | 47 |
The Tocqueville Alternative Strategies Fund
Schedule of Investments as of October 31, 2014
| Purchased Call Options (continued) | Contracts | Value | ||||||
Oil, Gas & Consumable Fuels—0.1% |
| |||||||
Halcon Resources Corp. | 400 | $ | 30,000 | |||||
Total Purchased Call Options |
| 129,100 | ||||||
Purchased Put Option—0.0% | ||||||||
Capital Markets—0.0% | ||||||||
Evercore Partners, Inc. | 80 | 4,200 | ||||||
Total Purchased Put Option |
| 4,200 | ||||||
| Warrants—0.0% | Shares | |||||||
Internet Software & Services—0.0% |
| |||||||
Inuvo, Inc. | 31,750 | 10,455 | ||||||
Oil, Gas & Consumable Fuels—0.0% |
| |||||||
Magnum Hunter Resources Corp. | 4,000 | 3,655 | ||||||
Total Warrants | 14,110 | |||||||
Short-Term Investments—10.6% | ||||||||
Money Market Fund—3.8% | ||||||||
STIT-Treasury Portfolio, 0.01%(i) | 1,467,704 | 1,467,704 | ||||||
| Commerical Paper—6.8% | | Principal Amount | | |||||
U.S. Bank | $ | 2,667,000 | 2,667,000 | |||||
Total Short-Term Investments (Cost $4,134,704) | 4,134,704 | |||||||
Total Investments |
| 44,958,065 | ||||||
Liabilities in Excess of Other Assets—(14.9)% |
| (5,814,734 | ) | |||||
Total Net Assets—100.0% | $ | 39,143,331 | ||||||
|
| |||||||
| Securities Sold Short Common Stocks—(13.9)% | Shares | |||||||
Air Freight & Logistics—(0.7)% | ||||||||
UTi Worldwide, Inc.(a)(c) | (24,000 | ) | (262,320 | ) | ||||
| Securities Sold Short Common Stocks (continued) | Shares | Value | ||||||
Airlines—(1.1)% |
| |||||||
Hawaiian Holdings, Inc.(a) | (23,800 | ) | $ | (412,692 | ) | |||
Automobiles—(1.7)% |
| |||||||
Tesla Motors, Inc.(a) | (2,810 | ) | (679,177 | ) | ||||
Electric Utilities—(1.5)% |
| |||||||
NRG Yield, Inc. | (12,000 | ) | (599,640 | ) | ||||
Health Care Equipment & Supplies—(3.2)% |
| |||||||
Teleflex, Inc. | (7,700 | ) | (878,724 | ) | ||||
The Spectranetics Corp.(a) | (11,000 | ) | (349,470 | ) | ||||
| (1,228,194 | ) | |||||||
Internet Software & Services—(0.9)% |
| |||||||
Qihoo 360 Technology Co., Ltd.—ADR(a)(c) | (5,000 | ) | (364,900 | ) | ||||
Life Sciences Tools & Services—(0.4)% |
| |||||||
Fluidigm Corp.(a) | (5,580 | ) | (161,820 | ) | ||||
Machinery—(0.4)% |
| |||||||
Chart Industries, Inc.(a) | (3,600 | ) | (167,580 | ) | ||||
Metals & Mining—(2.1)% |
| |||||||
RTI International Metals, Inc.(a) | (10,700 | ) | (251,985 | ) | ||||
Stillwater Mining Co.(a) | (44,000 | ) | (577,720 | ) | ||||
| (829,705 | ) | |||||||
Semiconductors & Semiconductor Equipment—(1.9)% |
| |||||||
SunEdison, Inc.(a) | (37,200 | ) | (725,772 | ) | ||||
Total Common Stocks | (5,431,800 | ) | ||||||
Exchange-Traded Funds (ETF)—(12.5)% |
| |||||||
Capital Markets—(12.5)% | ||||||||
iShares Nasdaq Biotechnology ETF | (3,000 | ) | (889,860 | ) | ||||
iShares U.S. Energy ETF | (6,000 | ) | (297,720 | ) | ||||
iShares Russell 2000 ETF | (7,000 | ) | (815,920 | ) | ||||
Market Vectors Semiconductor ETF | (12,000 | ) | (617,040 | ) | ||||
Powershares QQQ Trust Series 1 | (5,600 | ) | (567,840 | ) | ||||
SPDR S&P 500 ETF Trust | (8,500 | ) | (1,714,110 | ) | ||||
| (4,902,490 | ) | |||||||
Total Exchange-Traded Funds | (4,902,490 | ) | ||||||
The Accompanying Footnotes are an Integral Part of these Financial Statements.
| 48 | October 31, 2014 |
The Tocqueville Alternative Strategies Fund
Schedule of Investments as of October 31, 2014
| U.S. Treasury Notes—(15.2)% | Principal Amount | Value | ||||||
1.750%, 09/30/2019 | $ | (1,000,000 | ) | $ | (1,006,719 | ) | ||
2.125%, 09/30/2021 | (1,000,000 | ) | (1,005,703 | ) | ||||
1.750%, 05/15/2022 | (2,500,000 | ) | (2,437,305 | ) | ||||
2.375%, 08/15/2024 | (1,500,000 | ) | (1,505,976 | ) | ||||
Total U.S. Treasury Notes | (5,955,703 | ) | ||||||
Total Securities Sold Short |
| $ | (16,289,993 | ) | ||||
|
| |||||||
Percentages are stated as a percent of net assets.
ADR American Depository Receipt
| * | All or a portion of this security is segregated as collateral for securities sold short. |
| (a) | Non-income producing security. |
| (b) | Affiliated Security. See Footnote 8. |
| (c) | Foreign issued security. Foreign concentration (including ADR’s) was as follows: Canada 10.5%; Cayman Islands 2.3%; Ireland 1.6%; Virgin Islands 1.4%. Foreign concentration (including ADR’s) of short positions was as follows: Cayman Islands (0.9%); Virgin Islands (0.7%). |
| (d) | Callable security. |
| (e) | Variable rate security. The rate shown is as of 10/31/2014. |
| (f) | Denotes a security is either fully or partially restricted to resale. The aggregate value of restricted securities as of October 31, 2014 was $14,110, which represented 0.0% of net assets. |
| (g) | Securities are fair valued using procedures approved by the Board of Trustees. The aggregate value of fair valued securities as of October 31, 2014 was $14,110, which represented 0.00% of net assets. |
| (h) | Security is considered illiquid and may be difficult to sell. |
| (i) | Rate listed is the 7-day effective yield. |
The Accompanying Footnotes are an Integral Part of these Financial Statements.
| Annual Report | 49 |
Percent of Total Investments
The Tocqueville Fund
Allocation of Portfolio Holdings
October 31, 2014
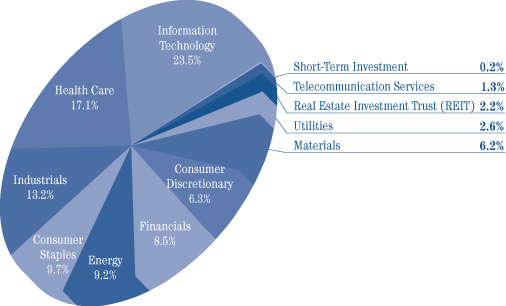
The Tocqueville Opportunity Fund
Allocation of Portfolio Holdings
October 31, 2014
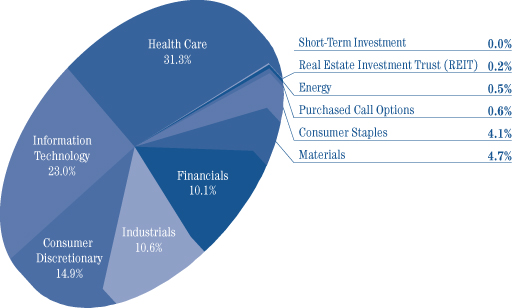
| 50 | October 31, 2014 |
Percent of Total Investments
The Tocqueville International Value Fund
Allocation of Portfolio Holdings
October 31, 2014
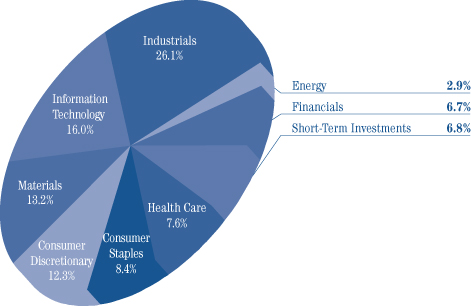
The Tocqueville Gold Fund
Allocation of Portfolio Holdings
October 31, 2014
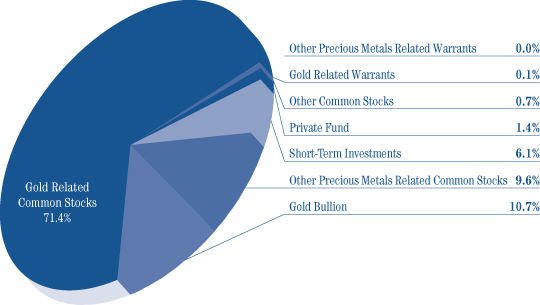
| Annual Report | 51 |
Percent of Total Investments
The Delafield Fund
Allocation of Portfolio Holdings
October 31, 2014
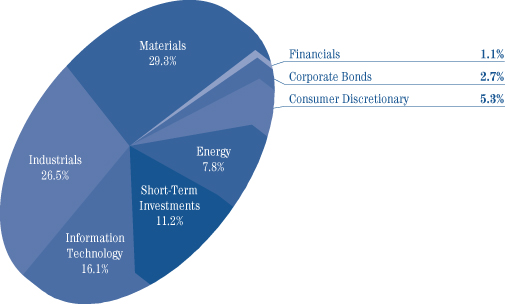
The Tocqueville Select Fund
Allocation of Portfolio Holdings
October 31, 2014
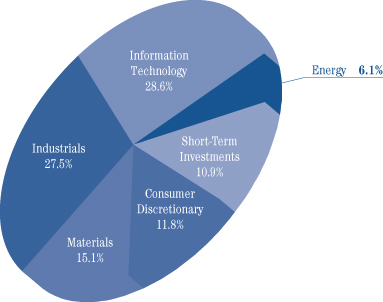
| 52 | October 31, 2014 |
Percent of Total Investments
The Tocqueville Alternative Strategies Fund
Allocation of Portfolio Holdings
Long Positions
October 31, 2014
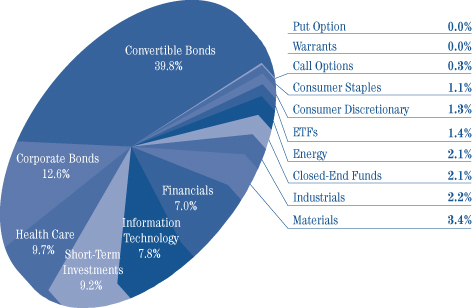
The Tocqueville Alternative Strategies Fund
Allocation of Portfolio Holdings
Short Positions
October 31, 2014
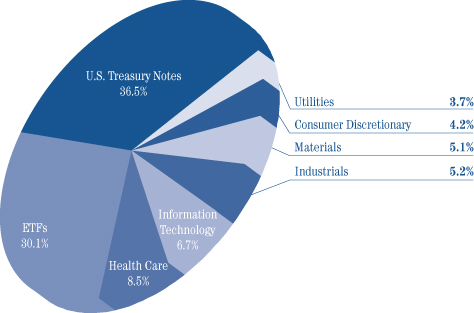
| Annual Report | 53 |
The Tocqueville Trust
Statements of Assets & Liabilities
For the Year Ended October 31, 2014
| The Tocqueville Fund | The Tocqueville Opportunity Fund | The Tocqueville International Value Fund | The Tocqueville Gold Fund | The Delafield Fund | The Tocqueville Select Fund | The Tocqueville Alternative Strategies Fund | ||||||||||||||||||||||
Assets: | ||||||||||||||||||||||||||||
Investments, at value (1) | ||||||||||||||||||||||||||||
Unaffiliated Issuers | $ | 380,519,522 | $ | 80,259,728 | $ | 237,678,215 | $ | 828,825,326 | $ | 1,415,536,052 | $ | 96,345,064 | $ | 44,080,120 | ||||||||||||||
Affiliated Issuers | — | — | — | 262,955,855 | 62,566,097 | 10,655,301 | 877,945 | |||||||||||||||||||||
Foreign currencies, at value (2) | — | — | 218 | 400,023 | — | — | — | |||||||||||||||||||||
Cash | — | 21,321 | 389,840 | 230,350 | — | — | 6,000 | |||||||||||||||||||||
Unrealized appreciation on forward currency contracts | — | — | 219,933 | — | — | — | — | |||||||||||||||||||||
Segregated cash at broker | — | — | — | — | — | — | 8,703,206 | |||||||||||||||||||||
Receivable for investments sold | — | 903,589 | 121,670 | — | 2,712,423 | 1,067,776 | 1,872,879 | |||||||||||||||||||||
Receivable from Adviser (See Note 10) | — | — | — | — | — | — | 25,788 | |||||||||||||||||||||
Receivable for foreign currencies sold | — | — | — | 2,771 | — | — | — | |||||||||||||||||||||
Receivable for fund shares sold | 141,678 | 10,738 | 299,704 | 55,565,176 | 2,745,026 | 68,181 | 33,884 | |||||||||||||||||||||
Dividends, interest and other receivables | 393,815 | 12,392 | 940,312 | 474 | 428,700 | 54,037 | 224,969 | |||||||||||||||||||||
Prepaid assets | 19,595 | 13,429 | 17,889 | 50,741 | 32,709 | 14,339 | 21,018 | |||||||||||||||||||||
Return of capital receivable | 30,000 | 13,755 | — | — | — | — | — | |||||||||||||||||||||
|
|
|
|
|
|
|
|
|
|
|
|
|
| |||||||||||||||
Total Assets | 381,104,610 | 81,234,952 | 239,667,781 | 1,148,030,716 | 1,484,021,007 | 108,204,698 | 55,845,809 | |||||||||||||||||||||
|
|
|
|
|
|
|
|
|
|
|
|
|
| |||||||||||||||
Liabilities: | ||||||||||||||||||||||||||||
Securities sold short, at value (3) | — | — | — | — | — | — | 16,289,993 | |||||||||||||||||||||
Payable for investments purchased | — | 718,192 | 800,776 | — | 3,539,483 | — | 319,836 | |||||||||||||||||||||
Payable for loans outstanding | — | 81,000 | — | — | — | — | — | |||||||||||||||||||||
Due to Custodian | — | — | 379,408 | — | — | — | 23,946 | |||||||||||||||||||||
Payable for fund shares redeemed | 80,229 | 4,410 | 1,143,689 | 7,699,877 | 3,612,003 | 3,650 | — | |||||||||||||||||||||
Payable to Adviser (See Note 10) | 234,721 | 49,114 | 128,271 | 904,503 | 871,618 | 70,357 | — | |||||||||||||||||||||
Payable to Administrator | 60,738 | 12,559 | 38,066 | 208,943 | 250,251 | 17,686 | 5,700 | |||||||||||||||||||||
Payable to Trustees | 14,736 | 3,532 | 10,344 | 52,420 | 66,375 | 4,145 | 1,859 | |||||||||||||||||||||
Accrued distribution fee | 63,569 | 14,224 | 28,679 | 111,071 | 106,037 | 17,761 | 5,306 | |||||||||||||||||||||
Accrued expenses and other liabilities | 89,254 | 27,759 | 87,777 | 496,762 | 436,241 | 31,405 | 55,838 | |||||||||||||||||||||
|
|
|
|
|
|
|
|
|
|
|
|
|
| |||||||||||||||
Total Liabilities | 543,247 | 910,790 | 2,617,010 | 9,473,576 | 8,882,008 | 145,004 | 16,702,478 | |||||||||||||||||||||
|
|
|
|
|
|
|
|
|
|
|
|
|
| |||||||||||||||
Net Assets | $ | 380,561,363 | $ | 80,324,162 | $ | 237,050,771 | $ | 1,138,557,140 | $ | 1,475,138,999 | $ | 108,059,694 | $ | 39,143,331 | ||||||||||||||
|
|
|
|
|
|
|
|
|
|
|
|
|
| |||||||||||||||
Net assets consist of: | ||||||||||||||||||||||||||||
Paid in capital | $ | 227,271,667 | $ | 51,839,937 | $ | 192,811,559 | $ | 1,799,126,690 | $ | 972,795,763 | $ | 77,790,541 | $ | 36,789,357 | ||||||||||||||
Accumulated net investment income (loss) | 2,358,640 | — | 4,129,917 | (10,340,448 | ) | (4,198,357 | ) | (479,135 | ) | (74,713 | ) | |||||||||||||||||
Accumulated net realized gain (loss) | 13,188,651 | 9,555,446 | 7,747,558 | (9,587,453 | ) | 135,340,173 | 12,178,865 | 783,489 | ||||||||||||||||||||
Net unrealized appreciation (depreciation) on: | ||||||||||||||||||||||||||||
Investments and foreign currency related items | 137,742,405 | 18,928,779 | 32,361,737 | (640,641,649 | ) | 371,201,420 | 18,569,423 | 1,645,198 | ||||||||||||||||||||
|
|
|
|
|
|
|
|
|
|
|
|
|
| |||||||||||||||
Net assets | $ | 380,561,363 | $ | 80,324,162 | $ | 237,050,771 | $ | 1,138,557,140 | $ | 1,475,138,999 | $ | 108,059,694 | $ | 39,143,331 | ||||||||||||||
|
|
|
|
|
|
|
|
|
|
|
|
|
| |||||||||||||||
Shares of beneficial interest outstanding (unlimited shares of $0.01 par value autorized) | 11,135,558 | 3,526,029 | 16,369,521 | 37,482,011 | 40,524,963 | 7,249,999 | 1,436,139 | |||||||||||||||||||||
Net asset value, offering and redemption price per share | $ | 34.18 | $ | 22.78 | $ | 14.48 | $ | 30.38 | $ | 36.40 | $ | 14.90 | $ | 27.26 | ||||||||||||||
|
|
|
|
|
|
|
|
|
|
|
|
|
| |||||||||||||||
(1) Cost of investments | ||||||||||||||||||||||||||||
Unafilliated issuers | $ | 242,777,117 | $ | 61,330,911 | $ | 205,495,601 | $ | 1,151,629,924 | $ | 1,046,433,497 | $ | 77,764,625 | $ | 41,873,479 | ||||||||||||||
Affiliated issuers | $ | — | $ | — | $ | — | $ | 580,783,011 | $ | 60,467,232 | $ | 10,666,317 | $ | 1,053,974 | ||||||||||||||
(2) Cost of foreign currencies | $ | — | $ | — | $ | 225 | $ | 412,689 | $ | — | $ | — | $ | (25,174 | ) | |||||||||||||
(3) Proceeds of securities sold short | $ | — | $ | — | $ | — | $ | — | $ | — | $ | — | $ | 15,901,836 | ||||||||||||||
The Accompanying Notes are an Integral Part of these Financial Statements.
| 54 | October 31, 2014 |
The Tocqueville Trust
Statements of Operations
For the Year Ended October 31, 2014
| The Tocqueville Fund | The Tocqueville Opportunity Fund | The Tocqueville International Value Fund | The Tocqueville Gold Fund | The Delafield Fund | The Tocqueville Select Fund | |||||||||||||||||||
Investment Income: | ||||||||||||||||||||||||
Dividends* | $ | 7,738,635 | $ | 330,970 | $ | 5,786,630 | $ | 7,704,514 | $ | 16,216,826 | $ | 861,967 | ||||||||||||
Interest | 371 | 14 | 1,970 | 10,824 | 255,464 | 3,042 | ||||||||||||||||||
|
|
|
|
|
|
|
|
|
|
|
| |||||||||||||
Total investment income | 7,739,006 | 330,984 | 5,788,600 | 7,715,338 | 16,472,290 | 865,009 | ||||||||||||||||||
|
|
|
|
|
|
|
|
|
|
|
| |||||||||||||
Expenses: | ||||||||||||||||||||||||
Investment Adviser’s fee (See Note 4) | 2,772,547 | 626,139 | 2,682,447 | 10,825,493 | 11,915,347 | 837,957 | ||||||||||||||||||
Distribution fees (See Note 4) | 924,182 | 208,713 | 670,612 | 3,298,395 | 4,246,287 | 261,862 | ||||||||||||||||||
Administration fees (See Note 4) | 554,510 | 125,228 | 402,367 | 1,979,037 | 2,547,772 | 157,117 | ||||||||||||||||||
Transfer agent and shareholder services fees | 120,772 | 19,141 | 92,375 | 897,801 | 697,797 | 40,263 | ||||||||||||||||||
Trustee fees and expenses | 56,405 | 12,878 | 43,182 | 166,250 | 275,731 | 16,670 | ||||||||||||||||||
Legal fees | 33,936 | 7,960 | 24,989 | 122,198 | 164,447 | 9,689 | ||||||||||||||||||
Fund accounting fees | 32,219 | 24,999 | 45,415 | 104,872 | 134,514 | 9,790 | ||||||||||||||||||
Printing and mailing expense | 25,972 | 6,101 | 23,268 | 148,797 | 185,082 | 8,458 | ||||||||||||||||||
Blue sky fees | 25,483 | 21,120 | 22,798 | 80,145 | 47,411 | 22,227 | ||||||||||||||||||
Custody fees | 22,393 | 15,906 | 71,974 | 252,378 | 106,667 | 5,870 | ||||||||||||||||||
Audit fees | 21,632 | 5,650 | 17,269 | 54,703 | 109,373 | 6,890 | ||||||||||||||||||
Other expenses (See Note 10) | 16,412 | 3,986 | 36,101 | 51,083 | 75,784 | 5,022 | ||||||||||||||||||
Insurance expense | 6,861 | 2,048 | 5,662 | 18,568 | 40,956 | 2,146 | ||||||||||||||||||
Registration fees | 2,339 | 1,959 | 840 | 3,084 | 4,709 | 3,486 | ||||||||||||||||||
Interest expense | 741 | 2,752 | — | — | — | — | ||||||||||||||||||
Interest expense on securities sold short | — | — | — | — | — | — | ||||||||||||||||||
Dividends expense on securities sold short | — | — | — | — | — | — | ||||||||||||||||||
|
|
|
|
|
|
|
|
|
|
|
| |||||||||||||
Total expenses before waiver | 4,616,404 | 1,084,580 | 4,139,299 | 18,002,804 | 20,551,877 | 1,387,447 | ||||||||||||||||||
Less: Fees waived (See Note 4) | (24,687 | ) | — | (786,240 | ) | — | — | — | ||||||||||||||||
|
|
|
|
|
|
|
|
|
|
|
| |||||||||||||
Net expenses | 4,591,717 | 1,084,580 | 3,353,059 | 18,002,804 | 20,551,877 | 1,387,447 | ||||||||||||||||||
|
|
|
|
|
|
|
|
|
|
|
| |||||||||||||
Net Investment Income (Loss) | 3,147,289 | (753,596 | ) | 2,435,541 | (10,287,466 | ) | (4,079,587 | ) | (522,438 | ) | ||||||||||||||
|
|
|
|
|
|
|
|
|
|
|
| |||||||||||||
Realized and Unrealized Gain (Loss): | ||||||||||||||||||||||||
Net realized gain (loss) on: | ||||||||||||||||||||||||
Investments | ||||||||||||||||||||||||
Unaffiliated issuers | 15,406,801 | 12,219,482 | 15,405,808 | (4,059,320 | ) | 169,307,128 | 13,674,446 | |||||||||||||||||
Affililiated issuers | — | — | — | — | (2,639,587 | ) | — | |||||||||||||||||
Securities sold short | — | — | — | — | — | — | ||||||||||||||||||
Forward currency contracts | — | — | 2,785,424 | — | — | — | ||||||||||||||||||
Foreign currency translation | (341 | ) | (2,558 | ) | (264,717 | ) | (162,109 | ) | (120,475 | ) | (329 | ) | ||||||||||||
|
|
|
|
|
|
|
|
|
|
|
| |||||||||||||
| 15,406,460 | 12,216,924 | 17,926,515 | (4,221,429 | ) | 166,547,066 | 13,674,117 | ||||||||||||||||||
Net change in unrealized appreciation (depreciation) on: | ||||||||||||||||||||||||
Investments | 27,645,101 | (2,029,998 | ) | (23,327,492 | ) | (231,957,001 | ) | (125,448,432 | ) | (6,858,895 | ) | |||||||||||||
Securities sold short | — | — | — | — | — | — | ||||||||||||||||||
Forward currency contracts | — | — | 60,207 | — | — | — | ||||||||||||||||||
Foreign currency translation | — | (71,501 | ) | 3,444,318 | (42,365,893 | ) | (953,054 | ) | — | |||||||||||||||
|
|
|
|
|
|
|
|
|
|
|
| |||||||||||||
| 27,645,101 | (2,101,499 | ) | (19,822,967 | ) | (274,322,894 | ) | (126,401,486 | ) | (6,858,895 | ) | ||||||||||||||
Net gain (loss) on investments and foreign currency | 43,051,561 | 10,115,425 | (1,896,452 | ) | (278,544,323 | ) | 40,145,580 | 6,815,222 | ||||||||||||||||
|
|
|
|
|
|
|
|
|
|
|
| |||||||||||||
Net Increase (Decrease) in Net Assets Resulting from Operations | $ | 46,198,850 | $ | 9,361,829 | $ | 539,089 | $ | (288,831,789 | ) | $ | 36,065,993 | $ | 6,292,784 | |||||||||||
|
|
|
|
|
|
|
|
|
|
|
| |||||||||||||
* Net of foreign taxes withheld of: | $ | 43,159 | $ | 1,541 | $ | 677,312 | $ | 1,047,601 | $ | 18,000 | $ | 6,694 | ||||||||||||
|
|
|
|
|
|
|
|
|
|
|
| |||||||||||||
The Accompanying Notes are an Integral Part of these Financial Statements.
| Annual Report | 55 |
The Tocqueville Trust
Statements of Operations
| The Tocqueville Alternative Strategies Fund | ||||||||
| For the Period January 1, 2014 to October 31, 2014 | For the Period June 1, 2013 to December 31, 2013(1) | |||||||
Investment Income: | ||||||||
Dividends* | 259,957 | 157,755 | ||||||
Interest | 342,475 | 276,671 | ||||||
|
|
|
| |||||
Total investment income | 602,432 | 434,426 | ||||||
|
|
|
| |||||
Expenses: | ||||||||
Investment Adviser’s fee (See Note 4) | 475,373 | 340,127 | ||||||
Interest expense | 134,386 | 111,846 | ||||||
Legal fees | 95,419 | 22,223 | ||||||
Blue sky fees | 78,892 | 21,448 | ||||||
Interest expense on securities sold short | 54,534 | 17,616 | ||||||
Transfer agent and shareholder services fees | 51,265 | 36,614 | ||||||
Dividends expense on securities sold short | 48,699 | 68,753 | ||||||
Administration fees (See Note 4) | 46,018 | 29,255 | ||||||
Distribution fees (See Note 4) | 41,117 | 4,534 | ||||||
Fund accounting fees | 39,020 | 31,055 | ||||||
Printing and mailing expense | 11,708 | 9,161 | ||||||
Custody fees | 11,188 | 8,838 | ||||||
Other expenses (See Note 10) | 7,930 | 18,276 | ||||||
Audit fees | 5,353 | 17,000 | ||||||
Trustee fees and expenses | 4,670 | 3,674 | ||||||
Registration fees | 3,086 | — | ||||||
Insurance expense | 1,870 | 814 | ||||||
|
|
|
| |||||
Total expenses before waiver | 1,110,528 | 741,234 | ||||||
Less: Fees waived (See Note 4) | (216,898 | ) | (87,250 | ) | ||||
|
|
|
| |||||
Net expenses | 893,630 | 653,984 | ||||||
|
|
|
| |||||
Net Investment Income (Loss) | (291,198 | ) | (219,558 | ) | ||||
|
|
|
| |||||
Realized and Unrealized Gain (Loss): | ||||||||
Net realized gain (loss) on: | ||||||||
Investments | ||||||||
Unaffiliated issuers | 3,190,643 | 1,909,373 | ||||||
Affililiated issuers | (127,424 | ) | — | |||||
Securities sold short | (2,546,983 | ) | (1,363,082 | ) | ||||
Foreign currency translation | (7,782 | ) | (330 | ) | ||||
Written option contracts | — | 83,500 | ||||||
|
|
|
| |||||
| 508,454 | 629,461 | |||||||
Net change in unrealized appreciation (depreciation) on: | ||||||||
Investments | 678,707 | (1,151,273 | ) | |||||
Securities sold short | 615,073 | (800,250 | ) | |||||
Foreign currency translation | (9,280 | ) | 1,035 | |||||
|
|
|
| |||||
| 1,284,500 | (1,950,488 | ) | ||||||
Net gain (loss) on investments and foreign currency | 1,792,954 | (1,321,027 | ) | |||||
|
|
|
| |||||
Net Increase (Decrease) in Net Assets Resulting from Operations | $ | 1,501,756 | $ | (1,540,585 | ) | |||
|
|
|
| |||||
* Net of foreign taxes withheld of: | $ | 1,725 | $ | — | ||||
|
|
|
| |||||
| (1) | Results shown are those of the Predecessor Fund. See Footnote 1. |
The Accompanying Notes are an Integral Part of these Financial Statements.
| 56 | October 31, 2014 |
[This page intentionally left blank]
| Annual Report | 57 |
The Tocqueville Trust
Statements of Changes in Net Assets
| The Tocqueville Fund | The Tocqueville Opportunity Fund | The Tocqueville International Value Fund | ||||||||||||||||||||||
| For the Year Ended October 31, 2014 | For the Year Ended October 31, 2013 | For the Year Ended October 31, 2014 | For the Year Ended October 31, 2013 | For the Year Ended October 31, 2014 | For the Year Ended October 31, 2013 | |||||||||||||||||||
Operations: | ||||||||||||||||||||||||
Net investment income (loss) | $ | 3,147,289 | $ | 4,778,719 | $ | (753,596 | ) | $ | (461,498 | ) | $ | 2,435,541 | $ | 4,250,455 | ||||||||||
Net realized gain (loss) on sale of investments, foreign currency, and securities sold short | 15,406,460 | 26,838,214 | 12,216,924 | 9,380,542 | 17,926,515 | 10,347,619 | ||||||||||||||||||
Net change in unrealized appreciation (depreciation) | 27,645,101 | 58,949,325 | (2,101,499 | ) | 12,734,576 | (19,822,967 | ) | 43,468,248 | ||||||||||||||||
|
|
|
|
|
|
|
|
|
|
|
| |||||||||||||
Net increase (decrease) in net assets resulting from operations | 46,198,850 | 90,566,258 | 9,361,829 | 21,653,620 | 539,089 | 58,066,322 | ||||||||||||||||||
|
|
|
|
|
|
|
|
|
|
|
| |||||||||||||
Dividends and distributions to shareholders: | ||||||||||||||||||||||||
Net investment income | (3,425,837 | ) | (5,030,132 | ) | — | — | (4,005,675 | ) | (3,270,330 | ) | ||||||||||||||
Net realized gains | (2,781,747 | ) | — | (4,131,999 | ) | — | — | — | ||||||||||||||||
|
|
|
|
|
|
|
|
|
|
|
| |||||||||||||
Total dividends and distributions | (6,207,584 | ) | (5,030,132 | ) | (4,131,999 | ) | — | (4,005,675 | ) | (3,270,330 | ) | |||||||||||||
Fund share transactions: | ||||||||||||||||||||||||
Shares sold | 48,540,663 | 29,776,783 | 8,062,871 | 4,767,903 | 64,986,954 | 41,933,095 | ||||||||||||||||||
Shares sold—Predecessor Fund Class I | — | — | — | — | — | — | ||||||||||||||||||
Shares sold—Predecessor Fund Class C | — | — | — | — | — | — | ||||||||||||||||||
Shares issued to holders in reinvestment of dividends | 5,727,081 | 4,132,373 | 3,947,515 | — | 3,955,730 | 2,452,030 | ||||||||||||||||||
Shares issued to holders in reinvestment of dividends—Predecessor Fund Class I | — | — | — | — | — | — | ||||||||||||||||||
Shares issued to holders in reinvestment of dividends—Predecessor Fund Class C | — | — | — | — | — | — | ||||||||||||||||||
Shares redeemed* | (61,966,744 | ) | (137,200,773 | ) | (17,525,024 | ) | (11,267,163 | ) | (91,406,713 | ) | (54,992,275 | ) | ||||||||||||
Shares redeemed—Predecessor Fund Class I* | — | — | — | — | — | — | ||||||||||||||||||
Shares redeemed—Predecessor Fund Class C* | — | — | — | — | — | — | ||||||||||||||||||
Transfers into Fund from: | ||||||||||||||||||||||||
Predecessor Fund—Class I | — | — | — | — | — | — | ||||||||||||||||||
Predecessor Fund—Class C | — | — | — | — | — | — | ||||||||||||||||||
Transfers out of Predecessor Fund-Class I into Fund: | — | — | — | — | — | — | ||||||||||||||||||
Transfers out of Predecessor Fund-Class C into Fund: | — | — | — | — | — | — | ||||||||||||||||||
|
|
|
|
|
|
|
|
|
|
|
| |||||||||||||
Net increase (decrease) | (7,699,000 | ) | (103,291,617 | ) | (5,514,638 | ) | (6,499,260 | ) | (22,464,029 | ) | (10,607,150 | ) | ||||||||||||
|
|
|
|
|
|
|
|
|
|
|
| |||||||||||||
Net increase (decrease) in net assets | 32,292,266 | (17,755,491 | ) | (284,808 | ) | 15,154,360 | (25,930,615 | ) | 44,188,842 | |||||||||||||||
Net Assets: | ||||||||||||||||||||||||
Beginning of period | 348,269,097 | 366,024,588 | 80,608,970 | 65,454,610 | 262,981,386 | 218,792,544 | ||||||||||||||||||
|
|
|
|
|
|
|
|
|
|
|
| |||||||||||||
End of period** | $ | 380,561,363 | $ | 348,269,097 | $ | 80,324,162 | $ | 80,608,970 | $ | 237,050,771 | $ | 262,981,386 | ||||||||||||
|
|
|
|
|
|
|
|
|
|
|
| |||||||||||||
* Net of redemption fees of: | $ | 6,837 | $ | 22,305 | $ | 4,879 | $ | 931 | $ | 16,383 | $ | 16,794 | ||||||||||||
|
|
|
|
|
|
|
|
|
|
|
| |||||||||||||
** Including undistributed net investment income (loss) of: | $ | 2,358,640 | $ | 2,824,529 | $ | — | $ | (427,298 | ) | $ | 4,129,917 | $ | 3,131,775 | |||||||||||
|
|
|
|
|
|
|
|
|
|
|
| |||||||||||||
| (1) | The predecessor fund of the Tocqueville Alternative Strategies Fund fiscal years began January 1, 2014 and June 1, 2013, respectively. |
The Accompanying Notes are an Integral Part of these Financial Statements.
| 58 | October 31, 2014 |
The Tocqueville Trust
Statements of Changes in Net Assets
| The Tocqueville Gold Fund | The Delafield Fund | The Tocqueville Select Fund | ||||||||||||||||||||||||
| For the Year Ended October 31, 2014 | For the Year Ended October 31, 2013 | For the Year Ended October 31, 2014 | For the Year Ended October 31, 2013 | For the Year Ended October 31, 2014 | For the Year Ended October 31, 2013 | |||||||||||||||||||||
| $ | (10,287,466 | ) | $ | (6,540,749 | ) | $ | (4,079,587 | ) | $ | (2,462,497 | ) | $ | (522,438 | ) | $ | (348,436 | ) | |||||||||
| (4,221,429 | ) | 388,787 | 166,547,066 | 71,422,904 | 13,674,117 | 11,110,235 | |||||||||||||||||||
| (274,322,894 | ) | (1,099,579,672 | ) | (126,401,486 | ) | 357,151,669 | (6,858,895 | ) | 21,132,838 | ||||||||||||||||
|
|
|
|
|
|
|
|
|
|
|
| |||||||||||||||
| (288,831,789 | ) | (1,105,731,634 | ) | 36,065,993 | 426,112,076 | 6,292,784 | 31,894,637 | ||||||||||||||||||
|
|
|
|
|
|
|
|
|
|
|
| |||||||||||||||
| — | — | — | — | — | — | |||||||||||||||||||||
| — | (53,161,749 | ) | (61,841,266 | ) | (80,537,788 | ) | (9,932,816 | ) | (3,451,599 | ) | ||||||||||||||||
|
|
|
|
|
|
|
|
|
|
|
| |||||||||||||||
| — | (53,161,749 | ) | (61,841,266 | ) | (80,537,788 | ) | (9,932,816 | ) | (3,451,599 | ) | ||||||||||||||||
| 662,295,777 | 689,958,884 | 200,760,342 | 424,376,572 | 16,655,565 | 13,020,097 | |||||||||||||||||||||
| — | — | — | — | — | — | |||||||||||||||||||||
| — | — | — | — | — | — | |||||||||||||||||||||
| — |
| 48,734,410 | 58,365,398 | 75,042,452 | 9,680,740 | 3,271,889 | |||||||||||||||||||
| — |
| — | — | — | — | — | |||||||||||||||||||
| — |
| — | — | — | — | — | |||||||||||||||||||
| (449,988,243 | ) | (810,631,326 | ) | (517,552,743 | ) | (431,925,473 | ) | (14,524,187 | ) | (29,395,929 | ) | |||||||||||||||
| — | — | — | — | — | — | |||||||||||||||||||||
| — | — | — | — | — | — | |||||||||||||||||||||
| — | — | — | — | — | — | |||||||||||||||||||||
| — | — | — | — | — | — | |||||||||||||||||||||
| — |
| — | — | — | — | — | |||||||||||||||||||
| — |
| — | — | — | — | — | |||||||||||||||||||
|
|
|
|
|
|
|
|
|
|
|
| |||||||||||||||
| 212,307,534 | (71,938,032 | ) | (258,427,003 | ) | 67,493,551 | 11,812,118 | (13,103,943 | ) | ||||||||||||||||||
|
|
|
|
|
|
|
|
|
|
|
| |||||||||||||||
| (76,524,255 | ) | (1,230,831,415 | ) | (284,202,276 | ) | 413,067,839 | 8,172,086 | 15,339,095 | ||||||||||||||||||
| 1,215,081,395 | 2,445,912,810 | 1,759,341,275 | 1,346,273,436 | 99,887,608 | 84,548,513 | |||||||||||||||||||||
|
|
|
|
|
|
|
|
|
|
|
| |||||||||||||||
| $ | 1,138,557,140 | $ | 1,215,081,395 | $ | 1,475,138,999 | $ | 1,759,341,275 | $ | 108,059,694 | $ | 99,887,608 | |||||||||||||||
|
|
|
|
|
|
|
|
|
|
|
| |||||||||||||||
| $ | 610,399 | $ | 714,261 | $ | 50,053 | $ | 103,101 | $ | 1,184 | $ | 2,935 | |||||||||||||||
|
|
|
|
|
|
|
|
|
|
|
| |||||||||||||||
$ | (10,340,448 | ) | $ | (42,539,011 | ) | $ | (4,198,357 | ) | $ | — | $ | (479,135 | ) | $ | (387,335 | ) | ||||||||||
|
|
|
|
|
|
|
|
|
|
|
| |||||||||||||||
The Accompanying Notes are an Integral Part of these Financial Statements.
| Annual Report | 59 |
The Tocqueville Trust
Statements of Changes in Net Assets
| The Tocqueville Alternative Strategies Fund | ||||||||||||
| For the Period January 1, 2014 to October 31, 2014 | For the Period June 1, 2013 to December 31, 2013(2) | For the Period June 29, 2013(1) to May 31, 2013(2) | ||||||||||
Operations: | ||||||||||||
Net investment income (loss) | $ | (291,198 | ) | $ | (219,558 | ) | $ | (34,183 | ) | |||
Net realized gain (loss) on sale of investments, foreign currency, and securities sold short | 508,454 | 629,461 | 2,787,455 | |||||||||
Net change in unrealized appreciation (depreciation) | 1,284,500 | (1,950,488 | ) | 2,345,727 | ||||||||
|
|
|
|
|
| |||||||
Net increase (decrease) in net assets resulting from operations | 1,501,756 | (1,540,585 | ) | 5,098,999 | ||||||||
|
|
|
|
|
| |||||||
Dividends and distributions to shareholders: | ||||||||||||
Net investment income | — | (151,536 | ) | (22,205 | ) | |||||||
Net realized gains | — | (2,234,040 | ) | (647,984 | ) | |||||||
|
|
|
|
|
| |||||||
Total dividends and distributions | — | (2,385,576 | ) | (670,189 | ) | |||||||
Fund share transactions: | ||||||||||||
Shares sold | 6,810,152 | — | — | |||||||||
Shares sold—Predecessor Fund Class I | 6,305,831 | 8,987,962 | 17,399,644 | |||||||||
Shares sold—Predecessor Fund Class C | 102,500 | 1,222,630 | — | |||||||||
Predecessor Fund Class I shares issued in connection with reorganization of a private fund | — | — | 19,753,858 | |||||||||
Shares issued to holders in reinvestment of dividends—Predecessor Fund Class I | — | 1,183,824 | 539,696 | |||||||||
Shares issued to holders in reinvestment of dividends—Predecessor Fund Class C | — | 67,455 | — | |||||||||
Shares redeemed* | (8,344,933 | ) | — | — | ||||||||
Shares redeemed—Predecessor Fund Class I* | (4,678,480 | ) | (8,580,347 | ) | (3,276,151 | ) | ||||||
Shares redeemed—Predecessor Fund Class C* | (354,715 | ) | — | — | ||||||||
Transfers into Fund from: | ||||||||||||
Predecessor Fund—Class I | 37,578,661 | — | — | |||||||||
Predecessor Fund—Class C | 1,035,984 | — | — | |||||||||
Transfers out of Predecessor Fund—Class I into Fund: | (37,578,661 | ) | — | — | ||||||||
Transfers out of Predecessor Fund—Class C into Fund: | (1,035,984 | ) | — | — | ||||||||
|
|
|
|
|
| |||||||
Net increase (decrease) | (159,645 | ) | 2,881,524 | 34,417,047 | ||||||||
|
|
|
|
|
| |||||||
Net increase (decrease) in net assets | 1,342,111 | (1,044,637 | ) | 38,845,857 | ||||||||
Net Assets: | ||||||||||||
Beginning of period | 37,801,220 | 38,845,857 | — | |||||||||
|
|
|
|
|
| |||||||
End of period** | $ | 39,143,331 | $ | 37,801,220 | $ | 38,845,857 | ||||||
|
|
|
|
|
| |||||||
* Net of redemption fees of: | $ | 2,575 | $ | 2,385 | $ | 373 | ||||||
|
|
|
|
|
| |||||||
** Including undistributed net investment income (loss) of: | $ | (74,713 | ) | $ | (185,738 | ) | $ | (1,024 | ) | |||
|
|
|
|
|
| |||||||
| (1) | Inception of Predecessor Fund. |
| (2) | Results shown are those of the Predecessor Fund. See Footnote 1. |
The Accompanying Notes are an Integral Part of these Financial Statements.
| 60 | October 31, 2014 |
The Tocqueville Trust
Statements of Cash Flows
| The Tocqueville Alternative Strategies Fund | ||||||||
| For the Period January 1, 2014 to October 31, 2014 | For the Period June 1, 2013 to December 31, 2013(1) | |||||||
Cash flows from operating activities | ||||||||
Net increase (decrease) in net assets resulting from operations | $ | 1,501,756 | $ | (1,540,585 | ) | |||
Adjustments to reconcile net increase (decrease) in net assets resulting from operations to net cash provided by (used in) operating activities: | ||||||||
Net realized gain on investments and foreign currency translation | (3,071,001 | ) | (1,992,873 | ) | ||||
Net realized loss on securities sold short | 2,546,983 | 1,363,082 | ||||||
Net change in unrealized gain on investments and foreign currency translation | (707,377 | ) | 1,151,273 | |||||
Net change in unrealized gain on securities sold short | (615,073 | ) | 800,250 | |||||
Amortization and accretion of premium and discount | 182,372 | 75,843 | ||||||
Changes in assets and liabilities: | ||||||||
Due to Custodian | (6,721 | ) | (410 | ) | ||||
Segregated cash at broker | 3,221,197 | (2,626,165 | ) | |||||
Receivable from/Payble to Adviser | (59,630 | ) | (97 | ) | ||||
Dividends, interest and other receivables | (45,158 | ) | (59,815 | ) | ||||
Prepaid assets | 21,658 | 14,605 | ||||||
Payable to broker for dividends and interest on securities sold short | (35,491 | ) | 26,191 | |||||
Payable to Trustees | 1,346 | (345 | ) | |||||
Accrued distribution fees | 4,295 | (1,011 | ) | |||||
Accrued expenses and other liabilities | 18,889 | 6,089 | ||||||
Purchases of investments | (34,909,309 | ) | (24,505,957 | ) | ||||
Proceeds from sale of investments | 31,168,790 | 23,968,059 | ||||||
Net purchases and sales of short-term investments | 1,887,825 | (18,355 | ) | |||||
Payments to close short transactions | (19,016,391 | ) | (13,601,638 | ) | ||||
Proceeds from securities sold short | 18,002,096 | 16,554,521 | ||||||
|
|
|
| |||||
Net cash provided by (used in) operating activities | 91,056 | (387,338 | ) | |||||
|
|
|
| |||||
Cash flows from financing activities: | ||||||||
Proceeds from shares issued | 13,334,018 | 10,061,173 | ||||||
Dividends paid to shareholders, net of reinvestments | (13,419,074 | ) | (8,539,538 | ) | ||||
Cash distribution paid to shareholders | — | (1,134,297 | ) | |||||
|
|
|
| |||||
Net cash provided by (used in) financing activities | (85,056 | ) | 387,338 | |||||
|
|
|
| |||||
Net increase in cash | 6,000 | — | ||||||
|
|
|
| |||||
Cash, beginning of period | — | — | ||||||
|
|
|
| |||||
Cash, end of period | $ | 6,000 | $ | — | ||||
|
|
|
| |||||
Non-cash financing activities | ||||||||
Transfer of shares from predecessor fund into Fund. | $ | 38,614,645 | $ | — | ||||
Reinvested dividends | $ | — | $ | 1,251,279 | ||||
| (1) | Results shown are those of the Predecessor Fund. |
The Accompanying Notes are an Integral Part of these Financial Statements.
| Annual Report | 61 |
The Tocqueville Trust
The Tocqueville Fund
The Tocqueville Opportunity Fund
The Tocqueville International Value Fund
The Tocqueville Gold Fund
The Delafield Fund
The Tocqueville Select Fund
The Tocqueville Alternative Strategies Fund
Notes to Financial Statements
1. ORGANIZATION
The Tocqueville Trust (the “Trust”) is a Massachusetts business trust registered under the Investment Company Act of 1940 and organized on September 17, 1986, currently consisting of seven separate funds (each, a “Fund” or, collectively, the “Funds”). Each Fund is an open-end management investment company with a different investment objective. The Tocqueville Fund, The Tocqueville Opportunity Fund (the “Opportunity Fund”), The Tocqueville International Value Fund (the “International Fund”), and The Delafield Fund are classified as diversified investment companies. The Tocqueville Gold Fund (the “Gold Fund”), The Tocqueville Select Fund (the “Select Fund”) and The Tocqueville Alternative Strategies Fund (the “Alternative Strategies Fund”) are classified as non-diversified investment companies. The Tocqueville Fund’s investment objective is long-term capital appreciation which it seeks to achieve by investing primarily in securities of United States issuers. The Opportunity Fund’s investment objective is to achieve long-term capital appreciation which it seeks to achieve by investing in the common stocks of small and mid cap companies which have the potential to deliver superior long term earnings growth. The International Fund’s investment objective is long-term capital appreciation consistent with preservation of capital which it seeks to achieve by investing primarily in securities of non-U.S. issuers. The Gold Fund’s investment objective is long-term capital appreciation which it seeks to achieve by investing in gold, securities of companies located throughout the world that are engaged in mining or processing gold (“gold related securities”), other precious metals and securities of companies located throughout the world that are engaged in mining or processing such other precious metals (“other precious metal securities”). The Delafield Fund’s investment objectives are to seek long-term preservation of capital (sufficient growth to outpace inflation over an extended period of time) and growth of capital which it seeks to achieve by investing primarily in the equity securities of domestic companies. The Tocqueville Select Fund’s investment objective is to achieve long-term capital appreciation by investing in a focused group of common stocks issued primarily by small and mid-sized U.S. companies. Current income is a secondary objective for The Tocqueville Select Fund. The Tocqueville Alternative Strategies Fund’s investment objective seeks higher returns and lower volatility than the Standard & Poor’s (“S&P”) 500 Index over a 3-5 year time horizon.
On June 22, 2009, the Board of Directors of Delafield Fund, Inc. approved an Agreement and Plan of Reorganization providing for, among other things, the transfer of the assets and liabilities of Delafield Fund, Inc. into The Delafield Fund, a series of The Tocqueville Trust. On September 24, 2009, the shareholders of Delafield Fund, Inc. approved the Agreement and Plan of Reorganization. On July 9, 2009, the Board of Trustees of Delafield Select Fund, a series of Natixis Funds Trust II, approved an Agreement and Plan of Reorganization providing for, among other things, the transfer of the assets and liabilities of Delafield Select Fund into the sole share class of The Select Fund (now The Tocqueville Select Fund), a series of The Tocqueville Trust. On September 24, 2009, the shareholders of Delafield Select Fund approved the Agreement and Plan of Reorganization. The effective date of both reorganizations was September 28, 2009. Transfers into The Delafield Fund and The Select Fund from their predecessor funds amounted to $649,892,191 and $25,888,388, respectively.
The Delafield Fund, a series of the Trust, commenced operations on September 28, 2009 as successor to Delafield Fund, Inc. The predecessor Delafield Fund, Inc. commenced operations on November 19, 1993.
The Tocqueville Select Fund, a series of the Trust, commenced operations on September 28, 2009 as successor to the Delafield Select Fund, a series of Natixis Funds Trust II. The predecessor Delafield Select Fund commenced operations on September 29, 2008 for Class A and Class C shares and on September 26, 2008 for Class Y shares. Prior to September 29, 2008, the predecessor Delafield Select Fund operated as a Delaware limited partnership using substantially the same investment objectives and investment policies as the predecessor fund. The limited partnership was incepted in July 1998.
| 62 | October 31, 2014 |
On April 15, 2014, the Board of Trustees of the Bridgehampton Value Strategies Fund, a series of Investment Management Series Trust, approved an Agreement and Plan of Reorganization providing for, among other things, the transfer of the assets and liabilities of the Bridgehampton Value Strategies Fund into the sole share class of The Tocqueville Alternative Strategies Fund, a newly-created series of The Tocqueville Trust. On June 20, 2014, the shareholders of the Bridgehampton Value Strategies Fund approved the Agreement and Plan of Reorganization. The effective date of the reorganization was June 27, 2014. Transfers into the Tocqueville Alternative Strategies Fund from its predecessor fund amounted to $38,614,645.
The Tocqueville Alternative Strategies Fund, a series of the Trust, commenced operations at the close of business on June 27, 2014 as successor to the Bridgehampton Value Strategies Fund, a series of Investment Managers Series Trust. The predecessor Bridgehampton Value Strategies Fund commenced operations on June 3, 2013 for Class C shares and June 29, 2012 for Class I shares, after the conversion of a limited liability company account, Bridgehampton Multi-Strategy Fund LLC, which commenced operations October 1, 2006, into Class I shares of the Fund. From October 1, 2006 to May 7, 2010, the name of the predecessor account was Bridgehampton Arbitrage LLC.
2. SIGNIFICANT ACCOUNTING POLICIES
The following is a summary of significant accounting principles followed by the Trust in the preparation of its financial statements.
a) Security valuation and security transactions
Investments in securities, including foreign securities, traded on an exchange or quoted on the over-the-counter market are valued at the last sale price or, if no sale occurred during the day, at the mean between closing bid and asked prices, as last reported by a pricing service approved by the Trustees. Securities that are principally traded on the National Association of Securities Dealers Automated Quotation National Market (“NASDAQ”) are generally valued at the NASDAQ Official Closing Price (“NOCP”). If there is no Nasdaq Official Closing Price for a Nasdaq-listed security or sale price available for an over-the-counter security, the mean of the latest bid and asked quotations from Nasdaq will be used. Investments in gold will be valued at the spot price of gold determined based on the mean of the last bid and asked price at the close of the New York Commodity Exchange. When market quotations for securities are not readily available, or when restricted securities or other assets are being valued, such assets are valued at fair value as determined in good faith by or under procedures approved by the Trustees. Short-term securities maturing within 60 days are valued on an amortized cost basis. Fixed income securities with maturities greater than 60 days are valued at market price. Debt securities, such as corporate bonds, convertible bonds and U.S. government agency issues for which market quotations are not readily available may be valued based on information supplied by independent pricing services using matrix pricing formulas and/or independent broker bid quotations. Debt securities with remaining maturities of 60 days or less may be valued on an amortized cost basis, which involves valuing an instrument at its cost and thereafter assuming a constant amortization to maturity of any discount or premium, regardless of the impact of fluctuating rates on the fair value of the instrument.
Trading in securities on European and Far Eastern securities exchanges normally is completed before the calculation of the Funds’ net asset value. Trading on these foreign exchanges may not take place on all days on which there is regular trading on the New York Stock Exchange (“NYSE”), or may take place on days on which there is no regular trading on the NYSE. Similarly, the Funds may hold securities traded in domestic markets where the market may close early on a given day prior to calculation of the Funds’ net asset value. Events affecting the value of such securities held by the Funds that
| Annual Report | 63 |
occur between the close of trading in the security and the close of trading on the NYSE normally will not be reflected in the Funds’ calculation of the net asset value. Significant events will be closely monitored, and where it is determined that an adjustment should be made to the security’s value because significant interim events may materially affect the value of the security, the security will be priced at its fair value in accordance with the procedures approved by the Trustees.
Investment and shareholder transactions are recorded on trade date. Dividend income is recognized on the ex-dividend date. Interest income is recognized on an accrual basis and includes, where applicable, the amortization of premiums and accretion of discounts. Net realized gains and losses from sales of securities are determined on the specific identification cost method.
b) Restricted and illiquid securities
The Funds may invest in securities that are subject to legal or contractual restrictions on resale or are illiquid. A security may be considered illiquid if it lacks a readily available market or if its valuation has not changed for a certain period of time. Disposal of these securities may involve time consuming negotiations and expense, and a prompt sale at the current valuation may be difficult.
c) Fair valuation measurements
The Trust has adopted authoritative fair valuation accounting standards which establish an authoritative definition of fair value and set out a hierarchy for measuring fair value. These standards require additional disclosures about the various inputs and valuation techniques used to develop the measurements of fair value and a discussion in changes in valuation techniques and related inputs during the period. These inputs are summarized in the three broad levels listed below.
| Level 1 - | Quoted prices in active markets for identical securities. |
| Level 2 - | Other significant observable inputs (including quoted prices for similar securities, interest rates, prepayment speeds, credit risk, etc.). |
| Level 3 - | Significant unobservable inputs (including the Fund’s own assumptions in determining the fair value of investments). |
When using the market quotations or closing price provided by the pricing service for equity investments (including securities sold short), including common stocks, preferred stocks, foreign issued common stocks, exchange-traded funds, closed end mutual funds and real estate investments trusts, which are traded on an exchange are valued at the last sale price reported by the exchange on which the securities are primarily traded on the day of valuation and when the market is considered active, the security will be classified as a Level 1 security. When using the mean between the latest bid and ask price, the security will be classified as Level 2. On days when the closing price of the S&P 500 moves more than 1% from its previous close, common stocks of the International Value Fund which are traded on non-North American exchanges may be valued using matrix pricing formulas provided by an independent pricing service. These securities will generally be classified as Level 2 securities. Gold bullion is valued at the mean of the closing bid and ask prices from the New York Mercantile Exchange and is classified as a Level 2.
Investment in mutual funds, including money market funds, are generally priced at the ending net asset value (NAV) provided by the service agent of the funds and will be classified as Level 1 securities.
Debt securities, such as corporate bonds, convertible bonds, bank loan obligations and U.S. government agency issues for which market quotations are not readily available may be valued based on information supplied by independent
| 64 | October 31, 2014 |
pricing services using matrix pricing formulas and/or independent broker bid quotations and are classified as Level 2. Debt securities with remaining maturities of 60 days or less may be valued on an amortized cost basis, which involves valuing an instrument at its cost and thereafter assuming a constant amortization to maturity of any discount or premium, regardless of the impact of fluctuating rates on the fair value of the instrument and are classified as Level 2. Warrants for which the underlying security is registered and equities which are subject to a required holding period, but have a comparable public issue, are valued in good faith by the Adviser pursuant to procedures established under the general supervision and responsibility of the Funds’ Board of Trustees. These securities will generally be classified as Level 2 securities. Forward currency contracts derive their value from the underlying currency prices. These are valued by a pricing service using pricing models. The models use inputs that are observed from active markets, such as exchange rates. These contracts are classified as Level 2. Options can diverge from the prices of their underlying instruments. These are valued at the composite last price reported by the exchange on which the options are primarily traded on the day of the valuation and are classified as Level 1. If there is no composite last price on a given day the mean between the latest bid and ask price will be used. These contracts are classified as Level 2.
Any securities or other assets for which market quotations are not readily available are valued at fair value as determined in good faith by the Adviser pursuant to procedures established under the general supervision and responsibility of the Funds’ Board of Trustees and will be classified as Level 3 securities. In determining fair value, a Fund will seek to assign a value to the security which it believes represents the amount that the Fund could reasonably expect to receive upon its current sale. With respect to securities that are actively traded on U.S. exchanges, the Funds expect that market quotations will generally be available and that fair value might be used only in limited circumstances, such as when trading for a security is halted during the trading day.
The Gold Fund currently invests in a private fund that primarily invests in physical gold and is subject to redemption restrictions. This private fund investment can only be disposed of with notice given 24 hours in advance of redemption. This investment is currently valued at $15,609,286 which represents 1.4% of the Gold Fund’s net assets and is classified as Level 3.
For securities traded principally on foreign exchanges, the Funds may use fair value pricing if an event occurs after the close of trading of the principal foreign exchange on which a security is traded, but before calculation of a Fund’s NAV, which a Fund believes affects the value of the security since its last market quotation. Such events may involve situations relating to a single issuer (such as news related to the issuer announced after the close of the principal foreign exchange), or situations relating to sectors of the market or the markets in general (such as significant fluctuations in the U.S. or foreign markets or significant changes in exchange rates, natural disasters, armed conflicts, or governmental actions).
In determining whether a significant event has occurred with respect to securities traded principally in foreign markets, the Funds may engage a third party fair value service provider to systematically recommend the adjustment of closing market prices of non-U.S. securities based upon changes in a designated U.S. securities market index occurring from the time of close of the relevant foreign market and the close of the NYSE. Fair value pricing may also be used to value restricted securities held by the Funds or securities with little or no trading activity for extended periods of time. Fair value pricing involves judgements that are inherently subjective and inexact and it is not possible to determine with certainty when, and to what extent, an event will affect a market price. As a result, there can be no assurance that fair value pricing will reflect actual market value and it is possible that the fair value determined for a security may differ materially from the value that could be realized upon the sale of the security.
| Annual Report | 65 |
The following is a summary of the inputs used, as of October 31, 2014, involving the Funds’ assets and liabilities carried at fair value. The inputs of methodology used for valuing securities may not be an indication of the risk associated with investing in those securities.
| Description | Level 1 | Level 2 | Level 3 | Total | ||||||||||||
The Tocqueville Fund | ||||||||||||||||
Assets | ||||||||||||||||
Common Stocks* | $ | 371,340,339 | $ | — | $ | — | $ | 371,340,339 | ||||||||
Real Estate Investment Trust (REIT)* | 8,465,000 | — | — | 8,465,000 | ||||||||||||
Money Market Fund | 714,183 | — | — | 714,183 | ||||||||||||
|
|
|
|
|
|
|
| |||||||||
Total Assets | $ | 380,519,522 | $ | — | $ | — | $ | 380,519,522 | ||||||||
|
|
|
|
|
|
|
| |||||||||
| The Tocqueville Opportunity Fund | Level 1 | Level 2 | Level 3 | Total | ||||||||||||
Assets | ||||||||||||||||
Common Stocks* | $ | 79,627,541 | $ | — | $ | — | $ | 79,627,541 | ||||||||
Real Estate Investment Trust (REIT)* | 116,320 | — | — | 116,320 | ||||||||||||
Purchased Call Options* | — | 515,600 | — | 515,600 | ||||||||||||
Money Market Fund | 267 | — | — | 267 | ||||||||||||
|
|
|
|
|
|
|
| |||||||||
Total Assets | $ | 79,744,128 | $ | 515,600 | $ | — | $ | 80,259,728 | ||||||||
|
|
|
|
|
|
|
| |||||||||
| The Tocqueville International Value Fund | Level 1 | Level 2 | Level 3 | Total | ||||||||||||
Assets | ||||||||||||||||
Common Stocks* | $ | 215,428,437 | $ | — | $ | — | $ | 215,428,437 | ||||||||
Preferred Stock* | 5,990,755 | — | — | 5,990,755 | ||||||||||||
Money Market Fund | 11,809,023 | — | — | 11,809,023 | ||||||||||||
Commercial Paper | — | 4,450,000 | — | 4,450,000 | ||||||||||||
Forward Currency Contracts | — | 243,945 | — | 243,945 | ||||||||||||
|
|
|
|
|
|
|
| |||||||||
Total Assets | $ | 233,228,215 | $ | 4,693,945 | $ | — | $ | 237,922,160 | ||||||||
|
|
|
|
|
|
|
| |||||||||
Liabilities | ||||||||||||||||
Forward Currency Contracts | $ | — | $ | (24,012 | ) | $ | — | $ | (24,012 | ) | ||||||
|
|
|
|
|
|
|
| |||||||||
Total Liabilities | $ | — | $ | (24,012 | ) | $ | — | $ | (24,012 | ) | ||||||
|
|
|
|
|
|
|
| |||||||||
| The Tocqueville Gold Fund | Level 1 | Level 2 | Level 3 | Total | ||||||||||||
Assets | ||||||||||||||||
Common Stocks | ||||||||||||||||
Gold Related | $ | 776,232,069 | $ | 1,768,946 | $ | 1,489,101 | $ | 779,490,116 | ||||||||
Other Precious Metals Related | 95,264,572 | 1,842,108 | 7,350,952 | 104,457,632 | ||||||||||||
Other | 42,386 | 133,146 | 7,354,544 | 7,530,076 | ||||||||||||
|
|
|
|
|
|
|
| |||||||||
Total Common Stocks | 871,539,027 | 3,744,200 | 16,194,597 | 891,477,824 | ||||||||||||
Private Fund* | — | — | 15,609,286 | 15,609,286 | ||||||||||||
Gold Bullion | — | 116,931,899 | — | 116,931,899 | ||||||||||||
Warrants* | — | 609,827 | — | 609,827 | ||||||||||||
Money Market Fund | 58,486,345 | — | — | 58,486,345 | ||||||||||||
Commercial Paper | — | 8,666,000 | — | 8,666,000 | ||||||||||||
|
|
|
|
|
|
|
| |||||||||
Total Assets | $ | 930,025,372 | $ | 129,951,926 | $ | 31,803,883 | $ | 1,091,781,181 | ||||||||
|
|
|
|
|
|
|
| |||||||||
| 66 | October 31, 2014 |
| The Delafield Fund | Level 1 | Level 2 | Level 3 | Total | ||||||||||||
Assets | ||||||||||||||||
Common Stocks* | $ | 1,272,925,690 | $ | — | $ | — | $ | 1,272,925,690 | ||||||||
Corporate Bonds* | — | 40,249,826 | — | 40,249,826 | ||||||||||||
Money Market Fund | 39,928,033 | — | — | 39,928,033 | ||||||||||||
U.S. Treasury Bills | — | 124,998,600 | — | 124,998,600 | ||||||||||||
|
|
|
|
|
|
|
| |||||||||
Total Assets | $ | 1,312,853,723 | $ | 165,248,426 | $ | — | $ | 1,478,102,149 | ||||||||
|
|
|
|
|
|
|
| |||||||||
| The Tocqueville Select Fund | Level 1 | Level 2 | Level 3 | Total | ||||||||||||
Assets | ||||||||||||||||
Common Stocks* | $ | 95,330,288 | $ | — | $ | — | $ | 95,330,288 | ||||||||
Money Market Fund | 2,670,166 | — | — | 2,670,166 | ||||||||||||
U.S. Treasury Bills | — | 8,999,911 | — | 8,999,911 | ||||||||||||
|
|
|
|
|
|
|
| |||||||||
Total Assets | $ | 98,000,454 | $ | 8,999,911 | $ | — | $ | 107,000,365 | ||||||||
|
|
|
|
|
|
|
| |||||||||
| The Tocqueville Alternative Strategies Fund | Level 1 | Level 2 | Level 3 | Total | ||||||||||||
Assets | ||||||||||||||||
Common Stocks* | $ | 12,370,583 | $ | — | $ | — | $ | 12,370,583 | ||||||||
Convertible Bonds* | — | 17,903,125 | — | 17,903,125 | ||||||||||||
Corporate Bonds* | — | 5,661,556 | — | 5,661,556 | ||||||||||||
Exchange-Traded Fund* | 642,162 | — | — | 642,162 | ||||||||||||
Closed-End Funds | 939,400 | — | — | 939,400 | ||||||||||||
Preferred Stocks | ||||||||||||||||
Banks | 1,350,735 | 410,070 | — | 1,760,805 | ||||||||||||
Consumer Finance | 865,920 | — | — | 865,920 | ||||||||||||
Diversified Financials | 532,400 | — | — | 532,400 | ||||||||||||
|
|
|
|
|
|
|
| |||||||||
Total Preferred Stocks | 2,749,055 | 410,070 | — | 3,159,125 | ||||||||||||
Purchased Call Options* | — | 129,100 | — | 129,100 | ||||||||||||
Purchased Put Options* | — | 4,200 | — | 4,200 | ||||||||||||
Warrants* | — | 14,110 | — | 14,110 | ||||||||||||
Money Market Fund | 1,467,704 | — | — | 1,467,704 | ||||||||||||
Commercial Paper | — | 2,667,000 | — | 2,667,000 | ||||||||||||
|
|
|
|
|
|
|
| |||||||||
Total Assets | $ | 18,168,904 | $ | 26,789,161 | $ | — | $ | 44,958,065 | ||||||||
|
|
|
|
|
|
|
| |||||||||
Liabilities | ||||||||||||||||
Securities Sold Short | ||||||||||||||||
Common Stocks* | $ | 5,431,800 | $ | — | $ | — | $ | 5,431,800 | ||||||||
Exchange-Traded Funds* | 4,902,490 | — | — | 4,902,490 | ||||||||||||
U.S. Treasury Notes | — | 5,955,703 | — | 5,955,703 | ||||||||||||
|
|
|
|
|
|
|
| |||||||||
Total Liabilities | $ | 10,334,290 | $ | 5,955,703 | $ | — | $ | 16,289,993 | ||||||||
|
|
|
|
|
|
|
| |||||||||
| * | For further information regarding portfolio characteristics, please see the accompanying Schedules of Investments. |
| ** | Other financial instruments are derivative instruments not reflected in the Schedule of Investments, such as forward currency contracts, which are reflected at the unrealized appreciation (depreciation) on the instrument. |
| Annual Report | 67 |
Below is a reconciliation that details the transfer of securities between Level 1 and Level 2 during the reporting period.
| The Tocqueville Fund | The Tocqueville Opportunity Fund | The Tocqueville International Value Fund | The Tocqueville Gold Fund | The Delafield Fund | The Tocqueville Select Fund | The Tocqueville Alternative Strategies Fund | ||||||||||||||||||||||
Transfers Into Level 1 | $ | — | $ | — | $ | — | $ | 20,260,698 | $ | — | $ | — | $ | — | ||||||||||||||
Transfers Out of Level 1 | — | — | — | (117,030,372 | ) | — | — | — | ||||||||||||||||||||
|
|
|
|
|
|
|
|
|
|
|
|
|
| |||||||||||||||
Net Transfers Into/(Out of) Level 1 | — | — | — | (96,769,674 | ) | — | — | — | ||||||||||||||||||||
|
|
|
|
|
|
|
|
|
|
|
|
|
| |||||||||||||||
Transfers Into Level 2 | — | — | — | 117,030,372 | — | — | — | |||||||||||||||||||||
Transfers Out of Level 2 | — | — | — | (20,260,698 | ) | — | — | — | ||||||||||||||||||||
|
|
|
|
|
|
|
|
|
|
|
|
|
| |||||||||||||||
Net Transfers Into/(Out of) Level 2 | $ | — | $ | — | $ | — | $ | 96,769,674 | $ | — | $ | — | $ | — | ||||||||||||||
|
|
|
|
|
|
|
|
|
|
|
|
|
| |||||||||||||||
Below is a reconciliation that details the activity of securities in Level 3 during the current fiscal period:
| The Tocqueville Fund | The Tocqueville Opportunity Fund | The Tocqueville International Value Fund | The Tocqueville Gold Fund | The Delafield Fund | The Tocqueville Select Fund | The Tocqueville Alternative Strategies Fund | ||||||||||||||||||||||
Beginning Balance—November 1, 2013 (January 1, 2014 for The Tocqueville Alternative Strategies Fund) | $ | — | $ | — | $ | — | $ | 37,883,131 | $ | — | $ | — | $ | — | ||||||||||||||
Purchases | — | — | — | — | — | — | — | |||||||||||||||||||||
Sales | — | — | — | — | — | — | — | |||||||||||||||||||||
Realized gains | — | — | — | — | — | — | — | |||||||||||||||||||||
Realized losses | — | — | — | — | — | — | — | |||||||||||||||||||||
Change in unrealized depreciation | — | — | — | (6,079,248 | ) | — | — | — | ||||||||||||||||||||
Transfers in/(out) of Level 3 | — | — | — | — | — | — | — | |||||||||||||||||||||
|
|
|
|
|
|
|
|
|
|
|
|
|
| |||||||||||||||
Ending Balance—October 31, 2014 | $ | — | $ | — | $ | — | $ | 31,803,883 | $ | — | $ | — | $ | — | ||||||||||||||
|
|
|
|
|
|
|
|
|
|
|
|
|
| |||||||||||||||
The movement from Level 2 to Level 1 in the Gold Fund was due to the use of market quotations or closing prices provided by the pricing service because the market was considered active. The movement from Level 1 to Level 2 in the Gold Fund was from the securities being priced using the mean of the bid and ask price due to the lack of trading volume on October 31, 2014 and due to the lack of an official closing price for gold bullion. Transfers between levels are recognized at the end of the reporting period.
| 68 | October 31, 2014 |
The Tocqueville Gold Fund
Significant Unobservable Inputs for Level 3 Portfolio Company Securities
Type of Security | Industry | Fair Value at 10/31/2014 | Valuation Techniques | Unobservable Inputs | Range | |||||||
Common Stock | ||||||||||||
| Gold Related | $ | 1,489,101 | Latest company valuation | Financing prices | N/A | |||||||
| Other Precious Metals Related | 7,350,952 | Latest company financing price | Financing prices | N/A | ||||||||
| Other | 256,390 | Latest company financing price | Financing prices | N/A | ||||||||
| 205,154 | Discounted closing value of comparable exchange listed security | Illiquidity discount | 50-75% | |||||||||
| 6,893,000 | Latest company financing price | Financing prices | N/A | |||||||||
Private Fund | Gold Related | 15,609,286 | NAV from custodian discounted by adviser | Illiquidity discount | 2% | |||||||
The significant unobservable inputs used in the fair value measurement of the Gold Fund’s common stocks are the most recent financing prices of the portfolio company and discounted closing value of comparable exchange listed security, both approximate the companies’ value in the market place. The significant unobservable inputs for the private fund is the discount for illiquidity applied to the Net Asset Value per share determined by the private fund’s custodian.
Significant changes in the companies’ ability to receive financing for new projects in the future would be an indication of the companies’ financial position and market value. An increase in the discount applied to the value of resources, future expected cash flows, or to account for illiquidity would decrease the value of the portfolio security.
The Trust’s valuation procedures have been adopted by the Trust’s Board of Trustees, which has established a Valuation Committee to oversee the valuation process. The Valuation Committee meets on an as needed basis to evaluate changes in the valuation of portfolio securities. The full findings and valuations are then reviewed quarterly by the Independent Trustees.
d) Derivative Instruments and Hedging Activities
The Funds’ Adviser may use derivative instruments, such as options and forward currency contracts, as a means to manage exposure to different types of risk, including market risk and exchange rate risk, and to gain exposure to underlying securities. The Trust has adopted disclosure standards in order to enable the investor to understand how and why an entity used derivatives, how derivatives are accounted for, and how derivatives affect an entity’s results of operations and financial position.
In the Opportunity Fund and the Alternative Strategies Fund, the Adviser used options to gain exposure to the underlying equity security. In the International Value Fund, the Adviser used forward currency contracts to adjust exposure to foreign exchange rate risk.
| Annual Report | 69 |
Offsetting on the Statement of Assets and Liabilities
In December 2011, the Financial Accounting Standard Board (“FASB”) issued Accounting Standards Update No. 2011-11 “Disclosures about Offsetting Assets and Liabilities” (“ASU 2011-11”). This disclosure requirement is intended to help investors and other financial statement users better assess the effect or potential effect of offsetting arrangements on a fund’s financial position. ASU 2011-11 requires entities to disclose both gross and net information about both instruments and transaction eligible for offset on the statement of Assets and Liabilities, and disclose instruments and transactions subject to master netting or similar agreements. In addition, in January 2013, FASB issued Accounting Standards Update No. 2013-1 “Clarifying the Scope of Offsetting Assets and Liabilities” (“ASU 2013-1”), specifying exactly which transactions are subject to offsetting disclosures. The scope of the disclosure requirements is limited to derivative instruments, repurchase agreements and reverse repurchase agreements, and securities borrowing and securities lending transactions. ASU 2011-11 and ASU 2013-1 are effective for financial statements with fiscal years beginning on or after January 1, 2013.
The Trust adopted the disclosure requirement on offsetting as of November 1, 2013. For financial reporting purposes, the Fund offsets financial assets and financial liabilities that are subject to master netting arrangements or similar agreements within appreciation on forward currency contracts and depreciation on forward currency contracts on the Statement of Assets and Liabilities.
At October 31, 2014, the amount of derivative assets and liabilities by type that are subject to offsetting for the Tocqueville International Value Fund are as follows:
Forward Currency Contracts*
| Gross Amounts not Offset in the Statement of Assets and Liabilities | ||||||||||||||||||||||||
| Gross Amounts of Recognized Assets | Gross Amounts Offset in the Statements of Assets and Liabilities | Net Amounts of Assets Presented in the Statement of Assets and Liabilities | Financial Instruments | Collateral Amounts Received | Net Amount | |||||||||||||||||||
Tocqueville International Value Fund | $ | 243,945 | $ | (24,012 | ) | $ | 219,933 | $ | — | $ | — | $ | 219,933 | |||||||||||
| Gross Amounts not Offset in the Statement of Assets and Liabilities | ||||||||||||||||||||||||
| Gross Amounts of Recognized Liabilities | Gross Amounts Offset in the Statements of Assets and Liabilities | Net Amounts of Liabilities Presented in the Statement of Assets and Liabilities | Financial Instruments | Collateral Amounts Received | Net Amount | |||||||||||||||||||
Tocqueville International Value Fund | $ | (24,012 | ) | $ | (24,012 | ) | $ | — | $ | — | $ | — | $ | — | ||||||||||
| * | The respective counterparties for each contract are disclosed in the Open Forward Currency Contract detail within the Schedule of Investments. |
| 70 | October 31, 2014 |
Balance Sheet—Values of Derivative Instruments as of October 31, 2014.
The Tocqueville Opportunity Fund
| Asset Derivatives | Liability Derivatives | |||||||||||
| Derivatives not accounted for as hedging instruments | Balance Sheet Location | Value | Balance Sheet Location | Value | ||||||||
Purchased Options | Investments, at Value | $ | 515,600 | $ | — | |||||||
|
|
|
| |||||||||
Total | $ | 515,600 | $ | — | ||||||||
|
|
|
| |||||||||
The Tocqueville Alternative Strategies Fund
| Asset Derivatives | Liability Derivatives | |||||||||||
| Derivatives not accounted for as hedging instruments | Balance Sheet Location | Value | Balance Sheet Location | Value | ||||||||
Purchased Options | Investments, at Value | $ | 133,300 | $ | — | |||||||
|
|
|
| |||||||||
Total | $ | 133,300 | $ | — | ||||||||
|
|
|
| |||||||||
The Effect of Derivative Instruments on the Statement of Operations for the period ended October 31, 2014.
The Tocqueville Opportunity Fund
| Net Realized Loss on Investments | Net Change in Unrealized Depreciation on Investments | |||||||
Purchased Options | $ | (83,871 | ) | $ | (40,952 | ) | ||
|
|
|
| |||||
Total | $ | (83,871 | ) | $ | (40,952 | ) | ||
|
|
|
| |||||
The Tocqueville International Value Fund
| Net Realized Gain on Forward Currency Contracts | Net Change in Unrealized Appreciation on Forward Currency Contracts | |||||||
Foreign Currency Forward Contract | $ | 2,785,424 | $ | 60,207 | ||||
|
|
|
| |||||
Total | $ | 2,785,424 | $ | 60,207 | ||||
|
|
|
| |||||
| Annual Report | 71 |
The Tocqueville Alternative Strategies Fund
| Net Realized Loss Investments | Net Change in Unrealized Appreciation on Investments | |||||||
Purchased Options | $ | (341,531 | ) | $ | 216,785 | |||
|
|
|
| |||||
Total | $ | (341,531 | ) | $ | 216,785 | |||
|
|
|
| |||||
The Effect of Derivative Instruments on the Statement of Operations for the period ended December 31, 2013.
The Tocqueville Alternative Strategies Fund*
| Net Realized Loss on Purchased Options Contracts | Net Realized Gain on Written Options Contracts | Net Change in Unrealized Loss on Purchased Options Contracts | ||||||||||
Purchased Options | $ | (562,621 | ) | $ | — | $ | (359,545 | ) | ||||
Written Options | $ | — | $ | 83,500 | $ | — | ||||||
| * | Results of the Predecessor Fund. |
Derivatives Risk
The risks of using the types of derivatives in which the Funds may engage include the risk that movements in the value of the derivative may not fully offset or complement instruments currently held in the Funds in the manner intended by the Adviser; the risk that the counterparty to a derivative contract may fail to comply with their obligations to the Fund; the risk that the derivative may not possess a liquid secondary market at a time when the Fund would look to disengage the position; the risk that additional capital from the Fund may be called upon to fulfill the conditions of the derivative contract; and the risk that the cost of the derivative contracts may reduce the overall returns experienced by the Funds. The measurement of risks associated with these instruments is meaningful only when all related offsetting transactions are considered. The use of options and forward currency contracts do not create leverage in the Funds.
The average monthly value of options in the Opportunity Fund during the year ended October 31, 2014 was $328,969.
Transactions in options in the Opportunity Fund during the year ended October 31, 2014 were as follows:
| Notional Amount | Contracts | |||||||
Outstanding, beginning of year: | $ | 2,592,500 | 340 | |||||
Options purchased | 11,246,500 | 1,930 | ||||||
Options terminated in closing transactions | (4,585,000 | ) | (565 | ) | ||||
Options exercised | (380,000 | ) | (60 | ) | ||||
Options expired | (3,670,250 | ) | (960 | ) | ||||
|
|
|
| |||||
Outstanding, end of year: | $ | 5,203,750 | 685 | |||||
| 72 | October 31, 2014 |
The average monthly value of options in the Alternative Strategies Fund during the period ended October 31, 2014 was $123,744.
Transactions in options in the Alternative Strategies Fund during the period ended October 31, 2014 were as follows:
| Notional Amount | Contracts | |||||||
Outstanding, beginning of year: | $ | 6,989,800 | 3,821 | |||||
Options purchased | 1,780,000 | 780 | ||||||
Options terminated in closing transactions | (2,925,000 | ) | (325 | ) | ||||
Options exercised | (250,000 | ) | (250 | ) | ||||
Options expired | (3,814,800 | ) | (3,246 | ) | ||||
|
|
|
| |||||
Outstanding, end of year: | $ | 1,780,000 | 780 | |||||
Transactions in option contracts written in the Alternative Strategies Fund during the period ended December 31, 2013* were as follows:
| Number of Contracts | Premiums Received | |||||||
Outstanding at June 1, 2013 | — | $ | — | |||||
Options written | 800 | 87,598 | ||||||
Options terminated in closing purchasing transactions | (800 | ) | (87,598 | ) | ||||
Options expired | — | — | ||||||
Options exercised | — | — | ||||||
|
|
|
| |||||
Outstanding at December 31, 2013 | — | $ | — | |||||
| * | Results of the Predessor Fund. |
The average monthly notional amount of forward currency contracts during the year ended October 31, 2014 was as follows:
| International Value Fund | ||||
Long Positions | $ | — | ||
Forward currency contracts | ||||
Short Positions | $ | 20,298,588 | ||
Forward currency contracts | ||||
e) Foreign currency translation
Investments and other assets and liabilities denominated in foreign currencies are translated to U.S. dollars at the prevailing rates of exchange, in accordance with the Trust’s Portfolio Securities Valuation and Foreign Exchange Contracts Procedures. The Tocqueville Fund, The Tocqueville Opportunity Fund, The Tocqueville International Value Fund, The Tocqueville Gold Fund, The Delafield Fund, The Tocqueville Select Fund and The Tocqueville Alternative Strategies Fund have engaged in transactions in securities denominated in foreign currencies and, as a result, entered into foreign exchange transactions. The Tocqueville International Value Fund has entered into forward contracts. These Funds
| Annual Report | 73 |
are exposed to additional market risk as a result of changes in the value of the underlying currency in relation to the U.S. dollar. Risks include potential inability of counterparties to meet the terms of their obligations. The value of foreign currencies are marked-to-market on a daily basis, which reflects the changes in the market value of the contract at the close of each day’s trading, resulting in daily unrealized gains and/or losses. When the transactions are settled or the contracts are closed, the Funds recognize a realized gain or loss.
The Funds isolate that portion of the results of operations resulting from changes in foreign exchange rates on investments from the fluctuations arising from changes in market prices of securities held. Such fluctuations are reflected as net realized and unrealized gain or loss on foreign currency translation.
Reported net realized foreign exchange gains or losses arise from sales of foreign currencies, currency gains or losses realized between the trade and settlement dates on securities transactions, the differences between the amounts of dividends, interest, and foreign withholding taxes recorded on the Fund’s books, and the U.S. dollar equivalent of the amounts actually received or paid. Net unrealized foreign exchange gains and losses arise from changes in the value of assets and liabilities other than investments in securities at the end of the fiscal period, resulting from changes in the exchange rates.
f) Dividends and distributions to shareholders
Dividends to shareholders are recorded on the ex-dividend date. Dividends from net investment income are declared and paid annually by the Funds. Distributions of net realized capital gains, if any, will be declared and paid at least annually. Income and capital gain distributions are determined in accordance with income tax regulations which may differ from generally accepted accounting principles. Permanent differences between financial and tax reporting may result in reclassification to capital stock.
g) Use of estimates
The preparation of financial statements in conformity with accounting principles generally accepted in the United States of America requires management to make estimates and assumptions that affect the reported amounts of assets and liabilities and disclosure of contingent assets and liabilities at the date of the financial statements and the reported amounts of revenues and expenses during the reporting period. Actual results could differ from those estimates.
h) Indemnification
In the normal course of business the Funds enter into contracts that contain general indemnification clauses. The Funds’ maximum exposure under these arrangements is unknown, as this would involve future claims against a Fund that have not yet occurred. Based on experience, the Funds expect the risk of loss to be remote.
(i) Short Sales
Short sales are transactions under which the Funds sell a security they do not own. To complete such a transaction, the Funds must borrow the security to make delivery to the buyer. The Funds then are obligated to replace the security borrowed by purchasing the security at the market price at the time of replacement. The price at such time may be more or less than the price at which the security was sold by the Funds. Until the security is replaced, the Funds are required to pay the lender amounts equal to dividend or interest that accrue during the period of the loan which is recorded as an expense on the Statements of Operations. To borrow the security, the Funds also may be required to pay a premium or an interest fee, which would decrease proceeds of the security sold. The proceeds of the short sale will be retained by the
| 74 | October 31, 2014 |
broker, to the extent necessary to meet margin requirements, until the short position is closed out. A gain, limited to the price at which the Funds sell the security short, or a loss, potentially unlimited in size, will be recognized upon the closing of a short sale. The Funds may not always be able to borrow a security or to close out a short position at a particular time or at an acceptable price. If the price of the borrowed security increases between the date of the short sale and the date on which the Funds replace the security, the Funds will experience a loss. The Funds’ loss on a short sale is limited only by the maximum attainable price of the security (which could be limitless) less the price the Funds paid for the security at the time it was borrowed.
j) Subsequent events evaluation
Effective November 1, 2014, the Administrative Services Agreement was amended and approved by the Board of Trustees. The amount will be calculated daily and payable monthly, at an annual rate of 0.15% on the first $400 million of net assets of each Fund; 0.13% on the next $600 million of net assets of each Fund; and 0.12% on all net assets of each Fund over $1 billion.
In preparing these financial statements, the Trust has evaluated events and transactions for potential recognition or disclosure resulting from subsequent events through the date financial statements were available to be issued.
k) Reclassifications
Certain prior period amounts for the Alternative Strategies Fund were reclassified to conform with current period presentation. These reclassifications did not impact total financial position or results of operations.
3. FEDERAL INCOME TAX
There is no tax liability resulting from unrecognized tax benefits relating to uncertain income tax positions taken or expected to be taken on the tax return for the fiscal year-end October 31, 2014, or for any other tax years which are open for exam. As of October 31, 2014, open tax years include the tax years ended October 31, 2011 through 2014. The Trust is also not aware of any tax positions for which it is reasonably possible that the total amounts of unrecognized tax benefits will significantly change in the next six months. The Funds recognize interest and penalties, if any, related to unrecognized tax benefits as income tax expense in the Statement of Operations. During the period, the Funds did not incur any interest or penalties.
Provision for federal income taxes or excise taxes has not been made since the Funds have elected to be taxed as Regulated Investment Companies and intend to distribute substantially all taxable income to shareholders and otherwise comply with the provisions of the Internal Revenue Code applicable to Regulated Investment Companies. Distributions from net realized gains for book purposes may include short-term capital gains which are included as ordinary income to shareholders for tax purposes. Additionally, accounting principles generally accepted in the United States of America require that certain components of net assets relating to permanent differences be reclassified between financial and tax
| Annual Report | 75 |
reporting. These reclassifications have no effect on net assets or net asset value per share. For the period ended October 31, 2014, the following table shows the reclassifications made:
| Undistributed Net Investment Income/(Loss) | Accumulated Net Realized Gain/(Loss) | Paid In Capital | ||||||||||
Tocqueville Fund | $ | (187,341 | ) | $ | (2,110,354 | ) | $ | 2,297,695 | ||||
Opportunity Fund | 1,180,894 | (2,577,975 | ) | 1,397,081 | ||||||||
International Value Fund | 2,568,276 | (4,594,913 | ) | 2,026,637 | ||||||||
Gold Fund | 42,486,029 | 162,109 | (42,648,138 | ) | ||||||||
Delafield Fund | (118,770 | ) | (30,402,746 | ) | 30,521,516 | |||||||
Select Fund | 430,638 | (1,265,361 | ) | 834,723 | ||||||||
Alternative Strategies Fund | 402,223 | (111,716 | ) | (290,507 | ) | |||||||
The permanent differences primarily relate to net operating losses, foreign currency reclasses and usage of tax equalization.
As of October 31, 2014, the components of accumulated earnings (losses) for income tax purposes were as follows:
| Tocqueville Fund | Opportunity Fund | International Value Fund | Gold Fund | Delafield Fund | Select Fund | Alternative Strategies Fund | ||||||||||||||||||||||
Tax cost of Investments | $ | 242,884,525 | $ | 61,951,803 | $ | 206,581,992 | $ | 1,733,391,924 | $ | 1,107,661,103 | $ | 88,600,817 | $ | 43,071,989 | ||||||||||||||
|
|
|
|
|
|
|
|
|
|
|
|
|
| |||||||||||||||
Unrealized Appreciation | 141,154,948 | 20,330,407 | 42,784,013 | 185,951,545 | 422,349,763 | 22,801,144 | 4,207,131 | |||||||||||||||||||||
Unrealized Depreciation | (3,519,951 | ) | (2,022,482 | ) | (11,687,572 | ) | (827,162,265 | ) | (51,908,717 | ) | (4,401,597 | ) | (2,321,055 | ) | ||||||||||||||
|
|
|
|
|
|
|
|
|
|
|
|
|
| |||||||||||||||
Net unrealized appreciation (depreciation) | 137,634,997 | 18,307,925 | 31,096,441 | (641,210,720 | ) | 370,441,046 | 18,399,547 | 1,886,076 | ||||||||||||||||||||
|
|
|
|
|
|
|
|
|
|
|
|
|
| |||||||||||||||
Undistributed operating income | 2,358,640 | 787,554 | 4,908,168 | — | — | — | ||||||||||||||||||||||
Undistributed long-term gains | 13,296,059 | 9,388,784 | 8,275,406 | — | 136,100,547 | 12,348,740 | 852,471 | |||||||||||||||||||||
|
|
|
|
|
|
|
|
|
|
|
|
|
| |||||||||||||||
Distributable earnings | 15,654,699 | 10,176,338 | 13,183,574 | — | 136,100,547 | 12,348,740 | 852,471 | |||||||||||||||||||||
|
|
|
|
|
|
|
|
|
|
|
|
|
| |||||||||||||||
Other accumulated gain/(loss) | — | (38 | ) | (40,803 | ) | (19,358,830 | ) | (4,198,357 | ) | (479,135 | ) | (384,572 | ) | |||||||||||||||
|
|
|
|
|
|
|
|
|
|
|
|
|
| |||||||||||||||
Total accumulated gain/(loss) | $ | 153,289,696 | $ | 28,484,225 | | $ | 44,239,212 | $ | (660,569,550 | ) | $ | 502,343,236 | $ | 30,269,152 | | $ | 2,353,975 | |||||||||||
|
|
|
|
|
|
|
|
|
|
|
|
|
| |||||||||||||||
The difference between book-basis and tax-basis unrealized appreciation is attributable primarily to wash sale deferrals and passive foreign investment companies (PFIC’s).
| 76 | October 31, 2014 |
The tax character of distributions paid during the periods ended October 31, 2014 and 2013 was as follows:
| October 31, 2014 | ||||||||||||
| Ordinary Income | Long Term Capital Gain | Total | ||||||||||
Tocqueville Fund | $ | 3,425,837 | $ | 2,781,747 | $ | 6,207,584 | ||||||
Opportunity Fund | — | 4,131,999 | 4,131,999 | |||||||||
International Value Fund | 4,005,675 | — | 4,005,675 | |||||||||
Gold Fund | — | — | — | |||||||||
Delafield Fund | 2,044,951 | 59,796,315 | 61,841,266 | |||||||||
Select Fund | — | 9,932,816 | 9,932,816 | |||||||||
Alternative Strategies Fund | — | — | — | |||||||||
| October 31, 2013 | ||||||||||||
| Ordinary Income | Long Term Capital Gain | Total | ||||||||||
Tocqueville Fund | $ | 5,030,132 | $ | — | $ | 5,030,132 | ||||||
Opportunity Fund | — | — | — | |||||||||
International Value Fund | 3,270,330 | — | 3,270,330 | |||||||||
Gold Fund | — | 53,161,749 | 53,161,749 | |||||||||
Delafield Fund | — | 80,537,788 | 80,537,788 | |||||||||
Select Fund | �� | — | 3,451,599 | 3,451,599 | ||||||||
The tax character of distributions paid during the seven months ended December 31, 2013 and during the period June 29, 2012 (commencement of operations) through May 31, 2013 for the predecessor fund of the Alternative Strategies Fund was as follows:
| Distributions paid from | For the Period January 1, 2014 to October 31, 2014 | For the Period June 1, 2013 to December 31, 2013 | ||||||
Ordinary income | $ | 1,482,558 | $ | 187,454 | ||||
Net Long-term capital gains | $ | 903,018 | $ | 482,735 | ||||
|
|
|
| |||||
Total distributions paid | $ | 2,385,576 | $ | 670,189 | ||||
The Fund designated as long-term capital gain dividend, pursuant to Internal Revenue Code Section 852(b)(3), the amount necessary to reduce the earnings and profits of the Funds related to net capital gain to zero for the tax years ended October 31, 2014 and 2013.
For the fiscal year ended October 31, 2014 the Gold Fund, Delafield Fund, and Select Fund had late year losses of $9,774,191, $4,198,357, and $470,338, respectively.
At October 31, 2014 certain Funds had tax basis capital losses which may be carried forward to offset future capital gains as shown below.
| Capital losses Expiring | ||||||||
| Indefinite ST | Indefinite LT | |||||||
Gold Fund | $ | 9,587,410 | — | |||||
| Annual Report | 77 |
To the extent that Funds listed above may realize future net capital gains, those gains will be offset by any of their unused respective capital loss carryforwards
4. INVESTMENT ADVISORY AND OTHER AGREEMENTS
Tocqueville Asset Management L.P. (“Tocqueville”) is the investment adviser (the “Adviser”) to the Trust under Investment Advisory Agreements approved by shareholders. For its services, Tocqueville receives fees from The Tocqueville Fund, calculated daily and payable monthly, at an annual rate of 0.75% on the first $1 billion of the average daily net assets of the Fund, and 0.65% of the average daily net assets in excess of $1 billion. Tocqueville receives fees from The Tocqueville Opportunity Fund, calculated daily and payable monthly, at an annual rate of 0.75% on the first $500 million of the average daily net assets of the Fund, and 0.65% of the average daily net assets in excess of $500 million. Tocqueville receives fees from The Tocqueville International Value Fund, calculated daily and payable monthly, at an annual rate of 1.00% on the first $1 billion of the average daily net assets of the Fund, and 0.75% of the average daily net assets in excess of $1 billion. Tocqueville receives fees from The Tocqueville Gold Fund, calculated daily and payable monthly, at an annual rate of 1.00% on the first $500 million of the average daily net assets of the Fund, 0.75% of the average daily net assets in excess of $500 million but not exceeding $1 billion, and 0.65% of the average daily net assets in excess of $1 billion. Tocqueville receives fees from The Delafield Fund, calculated daily and payable monthly, at an annual rate of 0.80% on the first $250 million of net assets of the Fund; 0.75% on the next $250 million of net assets of the Fund; 0.70% on the next $500 million of net assets of the Fund; and 0.65% on all net assets of the Fund over $1 billion. Tocqueville receives fees from The Tocqueville Select Fund, calculated daily and payable monthly, at an annual rate of 0.80% on all net assets of the Fund. Tocqueville receives fees from The Tocqueville Alternative Strategies Fund, calculated daily and payable monthly, at an annual rate of 1.30% on the first $500 million of net assets of the Fund; 1.25% on the next $500 million of net assets of the Fund; and 1.20% on all net assets of the Fund over $1 billion.
With respect to The Tocqueville Fund, the Adviser has contractually agreed to waive its advisory fees and/or reimburse expenses in order to ensure that The Tocqueville Fund’s total annual operating expenses do not exceed 1.25% of its average daily net assets (excluding taxes, interest expense, acquired fund fees and expenses, or extraordinary expenses such as litigation). The Expense Limitation Agreement will remain in effect until March 1, 2016. For the fiscal year ended October 31, 2014, the Adviser waived $24,687 of the advisory fee. Such amount is not subject to recoupment by the Adviser.
With respect to The Tocqueville International Value Fund, the Adviser has contractually agreed to waive its advisory fees and/or reimburse expenses in order to ensure that The Tocqueville International Value Fund’s total annual operating expenses do not exceed 1.25% of its average daily net assets (excluding taxes, interest expense, acquired fund fees and expenses, or extraordinary expenses such as litigation). The Expense Limitation Agreement will remain in effect until March 1, 2016. For the fiscal year ended October 31, 2014, the Adviser waived $786,240 of the advisory fee. Such amount is not subject to recoupment by the Adviser.
With respect to The Tocqueville Alternative Strategies Fund, the Adviser has contractually agreed to waive its advisory fees and/or reimburse expenses in order to ensure that The Tocqueville Alternative Strategies Fund’s total annual operating expenses do not exceed 1.90% of its average daily net assets (excluding taxes, dividends and interest expense on short sales, acquired fund fees and expenses, or extraordinary expenses such as litigation). The Expense Limitation Agreement will remain in effect until March 1, 2016. For the period ended October 31, 2014, the Adviser waived $158,545 of the advisory fee. With respect to The Predecessor Fund, The Predecessor Adviser had contractually agreed to waive its advisory fees and/or reimburse expenses in order to ensure that The Predecessor Fund’s Class C shares and
| 78 | October 31, 2014 |
Class I shares total annual operating expenses did not exceed 2.99% and 1.99% of its average daily net assets (excluding taxes, interest expense, acquired fund fees and expenses, or extraordinary expenses such as litigation). For the period ended October 31, 2014, The Predecessor Adviser waived $58,353 of the advisory fee.
Pursuant to an Administrative Services Agreement, each Fund pays to the Adviser a fee computed and paid monthly at an annual rate of 0.15% of the average daily net assets of the Fund. For the period ended October 31, 2014, the Adviser has made payments of $91,189, $20,608, $66,175, $325,174, $419,199, $25,835, $3,314 to U.S. Bancorp Fund Services, LLC for services provided under a Sub-Administration Agreement for The Tocqueville Fund, The Tocqueville Opportunity Fund, The Tocqueville International Value Fund, The Tocqueville Gold Fund, The Delafield Fund, The Tocqueville Select Fund and The Tocqueville Alternative Strategies Fund, respectively.
Tocqueville Securities, L.P. (the “Distributor”), an affiliate of Tocqueville, acts as distributor for shares of the Trust. Each Fund adopted a distribution and service plan pursuant to Rule 12b-1 of the 1940 Act. Pursuant to the plans, each Fund pays to the Distributor distribution and service fees of 0.25% per annum of its average daily net assets.
Commissions earned by the Distributor for services rendered as a registered broker-dealer in securities transactions for The Tocqueville Fund, The Tocqueville Opportunity Fund, The Tocqueville International Value Fund, The Tocqueville Gold Fund, The Delafield Fund, The Tocqueville Select Fund and The Tocqueville Alternative Strategies Fund for the period ended October 31, 2014, were $50,933, $13,391, $267, $0, $5,236, $10,213, $2,742, respectively.
5. CAPITAL SHARE TRANSACTIONS.
Transactions in capital shares for each Fund were as follows:
| For the Year Ended October 31, 2014 | For the Year Ended October 31, 2013 | |||||||
| The Tocqueville Fund | Shares | Shares | ||||||
Shares sold | 1,496,275 | 1,122,567 | ||||||
Shares issued to holders in reinvestment dividends | 185,944 | 171,255 | ||||||
Shares redeemed | (1,900,663 | ) | (5,121,252 | ) | ||||
|
|
|
| |||||
Net decrease | (218,444 | ) | (3,827,430 | ) | ||||
| The Tocqueville Opportunity Fund | ||||||||
Shares sold | 365,439 | 269,202 | ||||||
Shares issued to holders in reinvestment dividends | 188,786 | — | ||||||
Shares redeemed | (815,128 | ) | (636,699 | ) | ||||
|
|
|
| |||||
Net decrease | (260,903 | ) | (367,497 | ) | ||||
| The Tocqueville International Value Fund | ||||||||
Shares sold | 4,236,272 | 3,191,072 | ||||||
Shares issued to holders in reinvestment dividends | 272,246 | 197,585 | ||||||
Shares redeemed | (6,013,133 | ) | (4,243,896 | ) | ||||
|
|
|
| |||||
Net decrease | (1,504,615 | ) | (855,239 | ) | ||||
| Annual Report | 79 |
| For the Year Ended October 31, 2014 | For the Year Ended October 31, 2013 | |||||||
| The Tocqueville Gold Fund | Shares | Shares | ||||||
Shares sold | 17,656,219 | 14,396,666 | ||||||
Shares issued to holders in reinvestment dividends | — | 783,134 | ||||||
Shares redeemed | (12,141,438 | ) | (16,801,311 | ) | ||||
|
|
|
| |||||
Net increase (decrease) | 5,514,781 | (1,621,511 | ) | |||||
| The Delafield Fund | ||||||||
Shares sold | 5,318,910 | 12,682,948 | ||||||
Shares issued to holders in reinvestment dividends | 1,587,742 | 2,479,103 | ||||||
Shares redeemed | (13,763,895 | ) | (12,970,111 | ) | ||||
|
|
|
| |||||
Net increase (decrease) | (6,857,243 | ) | 2,191,940 | |||||
| The Tocqueville Select Fund | ||||||||
Shares sold | 1,150,692 | 975,053 | ||||||
Shares issued to holders in reinvestment dividends | 684,635 | 280,128 | ||||||
Shares redeemed | (1,002,652 | ) | (2,288,027 | ) | ||||
|
|
|
| |||||
Net increase (decrease) | 832,675 | (1,032,846 | ) | |||||
| For the Period January 1, 2014 to October 31, 2014 | For the Period June 1, 2013 to December 31, 2013 | For the Period June 29, 2012 to May 31, 2013 | ||||||||||
| The Tocqueville Alternative Strategies Fund (See Footnote 1) | Shares | Shares | Shares | |||||||||
Shares sold | 250,099 | — | — | |||||||||
Shares redeemed | (308,999 | ) | — | — | ||||||||
Transfers in | — | — | ||||||||||
From Predecessor Fund—Class I | 1,458,541 | — | — | |||||||||
From Predecessor Fund—Class M | 36,498 | — | — | |||||||||
|
|
|
|
|
| |||||||
Total Transfers in | 1,495,039 | — | — | |||||||||
|
|
|
|
|
| |||||||
Net increase | 1,436,139 | — | — | |||||||||
| Predecessor Fund—Class I (See Footnote 1) | ||||||||||||
Shares sold | 237,764 | 328,467 | 650,406 | |||||||||
Shares issued to holders in reinvestment of dividends | — | 45,690 | 20,935 | |||||||||
Shares redeemed | (176,276 | ) | (313,717 | ) | (124,907 | ) | ||||||
Transfers out to The Tocquevill Alternative Strategies Fund | (1,458,541 | ) | — | — | ||||||||
Shares issued in connection with reorganization of a private fund | — | — | 790,179 | |||||||||
|
|
|
|
|
| |||||||
Net decrease | (1,397,053 | ) | 60,440 | 1,336,613 | ||||||||
| 80 | October 31, 2014 |
| For the Period January 1, 2014 to October 31, 2014 | For the Period June 1, 2013 to December 31, 2013 | For the Period June 29, 2012 to May 31, 2013 | ||||||||||
| The Tocqueville Alternative Strategies Fund (See Footnote 1) | Shares | Shares | Shares | |||||||||
| Predecessor Fund—Class M (See Footnote 1) | ||||||||||||
Shares sold | 3,855 | 43,583 | — | |||||||||
Shares issued to holders in reinvestment of dividends | — | 2,606 | — | |||||||||
Shares redeemed | (13,290 | ) | — | — | ||||||||
Transfers out to The Tocquevill Alternative Strategies Fund | (36,754 | ) | — | — | ||||||||
|
|
|
|
|
| |||||||
Net decrease | (46,189 | ) | 46,189 | — | ||||||||
6. FUND SHARE TRANSACTIONS
The Funds currently offer only one class of shares of beneficial interest. A redemption fee of 2.00% is imposed on redemptions of shares held 90 days or fewer. This fee is retained by each Fund and is credited to paid in capital. Redemptions to which the fee applies include redemptions of shares resulting from an exchange made pursuant to the Exchange Privilege, as defined in the Trust’s Prospectus dated February 28, 2014 (June 16, 2014 for the Alternative Strategies Fund). For a more detailed description of when the redemption fee does not apply, please see the Trust’s Prospectus.
7. INVESTMENT TRANSACTIONS
Purchases and sales of investment securities (excluding short-term instruments) for the period ended October 31, 2014 are summarized below.
| Tocqueville Fund | Opportunity Fund | International Value Fund | Gold Fund | Delafield Fund | Select Fund | Alternative Strategies Fund | ||||||||||||||||||||||
Purchases: | $ | 69,358,165 | $ | 76,942,812 | $ | 78,903,429 | $ | 284,105,478 | $ | 498,982,183 | $ | 32,779,026 | $ | 33,139,461 | ||||||||||||||
|
|
|
|
|
|
|
|
|
|
|
|
|
| |||||||||||||||
Sales: | $ | 76,402,984 | $ | 87,539,109 | $ | 102,265,735 | $ | 120,048,122 | $ | 743,656,820 | $ | 28,463,919 | $ | 32,509,781 | ||||||||||||||
|
|
|
|
|
|
|
|
|
|
|
|
|
| |||||||||||||||
U.S. Government Security Purchases: | $ | — | $ | — | $ | — | $ | — | $ | — | $ | — | $ | — | ||||||||||||||
|
|
|
|
|
|
|
|
|
|
|
|
|
| |||||||||||||||
U.S. Government Security Sales: | $ | — | $ | — | $ | — | $ | — | $ | — | $ | — | $ | — | ||||||||||||||
|
|
|
|
|
|
|
|
|
|
|
|
|
| |||||||||||||||
| Annual Report | 81 |
8. Transactions with Affiliates
The following issuers are affiliated with the Funds; that is, the Adviser had control of 5% or more of the outstanding voting securities during the period from November 1, 2013 through October 31, 2014. As defined in Section (2)(a)(3) of the Investment Company Act of 1940; such issues are:
| November 1, 2013 | Additions | Reductions | Share Balance/Face Value($) at October 31, 2014 | Interest Income | Dividend Income | Realized Gain/(Loss) | Value at October 31, 2014 | Cost at October 31, 2014 | ||||||||||||||||||||||||||||||||||||||||
Issuer Name | Share Balance/ Face Value($) | Cost | Share Balance/ Face Value($) | Cost | Share Balance/ Face Value($) | Cost | ||||||||||||||||||||||||||||||||||||||||||
The Tocqueville Gold Fund |
| |||||||||||||||||||||||||||||||||||||||||||||||
Anthem United, Inc. | — | $ | — | 5,000,000 | $ | 905,961 | — | $ | — | 5,000,000 | $ | — | $ | — | $ | — | $ | 2,173,817 | $ | 905,961 | ||||||||||||||||||||||||||||
Anthem United, Inc. Warrants | — | — | 1,250,000 | — | — | — | 1,250,000 | — | — | — | 186,660 | — | ||||||||||||||||||||||||||||||||||||
Argonaut Gold, Inc. | — | — | 2,687,000 | 12,286,127 | — | — | 2,687,000 | — | — | — | 5,721,840 | 12,286,127 | ||||||||||||||||||||||||||||||||||||
ATAC Resources Ltd. | 10,963,700 | 39,089,734 | 553,191 | 703,748 | — | — | 11,516,891 | — | — | — | 4,904,935 | 39,793,482 | ||||||||||||||||||||||||||||||||||||
ATAC Resources Ltd.(a) | — | — | 553,191 | 703,748 | (553,191 | ) | (703,748 | ) | — | — | — | — | — | — | ||||||||||||||||||||||||||||||||||
ATAC Resources Ltd. Warrants | — | — | 276,595 | — | — | — | 276,595 | — | — | — | — | — | ||||||||||||||||||||||||||||||||||||
Bear Creek Mining Corp. | 7,413,200 | 28,761,181 | — | — | — | — | 7,413,200 | — | — | — | 8,419,233 | 28,761,181 | ||||||||||||||||||||||||||||||||||||
Corvus Gold, Inc. | 2,079,901 | 1,617,492 | — | — | — | — | 2,079,901 | — | — | — | 1,616,083 | 1,617,492 | ||||||||||||||||||||||||||||||||||||
Corvus Gold, Inc. | 6,100,000 | 4,939,377 | 3,030,000 | 3,181,615 | — | — | 9,130,000 | — | — | — | 7,047,691 | 8,120,992 | ||||||||||||||||||||||||||||||||||||
Corvus Gold, Inc.(a) | — | — | 1,000,000 | 955,840 | (1,000,000 | ) | (955,840 | ) | — | — | — | — | — | — | ||||||||||||||||||||||||||||||||||
Detour Gold Corp. | 3,704,200 | 85,931,681 | 1,592,400 | 9,527,580 | — | — | 5,296,600 | — | — | — | 31,016,867 | 95,459,261 | ||||||||||||||||||||||||||||||||||||
East Asia Minerals Corp. | 10,544,400 | 21,793,116 | — | — | — | — | 10,544,400 | — | — | — | 140,336 | 21,793,116 | ||||||||||||||||||||||||||||||||||||
East Asia Minerals Corp. Warrants | 6,500,000 | — | — | — | — | — | 6,500,000 | — | — | — | 32,297 | — | ||||||||||||||||||||||||||||||||||||
GoGold Resources, Inc. | 8,100,000 | 9,990,010 | 4,455,000 | 5,664,072 | — | — | 12,555,000 | — | — | — | 17,712,125 | 15,654,082 | ||||||||||||||||||||||||||||||||||||
GoGold Resources, Inc. Warrants(b) | 4,050,000 | — | — | — | (4,050,000 | ) | — | — | — | — | — | — | — | |||||||||||||||||||||||||||||||||||
Gold Bullion International LLC | 5,000,000 | 5,000,000 | — | — | — | — | 5,000,000 | — | — | — | 6,893,000 | 5,000,000 | ||||||||||||||||||||||||||||||||||||
International Tower Hill Mines Ltd. | 5,738,836 | 20,953,121 | — | — | — | — | 5,738,836 | — | — | — | 2,008,593 | 20,953,121 | ||||||||||||||||||||||||||||||||||||
International Tower Hill Mines Ltd. | 7,589,744 | 38,630,898 | — | — | — | — | 7,589,744 | — | — | — | 2,693,667 | 38,630,898 | ||||||||||||||||||||||||||||||||||||
MAG Silver Corp. | 2,960,700 | 31,563,819 | — | — | — | — | 2,960,700 | — | — | — | 17,882,628 | 31,563,819 | ||||||||||||||||||||||||||||||||||||
Osisko Gold Royalties Ltd. | — | — | 2,549,540 | 36,115,325 | — | — | 2,549,540 | — | — | — | 31,850,870 | 36,115,325 | ||||||||||||||||||||||||||||||||||||
Primero Mining Corp. | 4,840,700 | 24,573,319 | 3,628,100 | 26,369,927 | — | — | 8,468,800 | — | — | — | 28,929,400 | 50,943,246 | ||||||||||||||||||||||||||||||||||||
Primero Mining Corp. Warrants | 1,848,400 | — | — | — | — | — | 1,848,400 | — | — | — | 180,404 | — | ||||||||||||||||||||||||||||||||||||
Rockhaven Resources Ltd. | 5,000,000 | 6,265,337 | 1,400,000 | 190,252 | — | — | 6,400,000 | — | — | — | 993,745 | 6,455,589 | ||||||||||||||||||||||||||||||||||||
Rockhaven Resources Ltd.(a) | — | — | 1,400,000 | 190,252 | (1,400,000 | ) | (190,252 | ) | — | — | — | — | — | — | ||||||||||||||||||||||||||||||||||
Rockhaven Resources Ltd. Warrants | — | — | 700,000 | — | — | — | 700,000 | — | — | — | 31,054 | — | ||||||||||||||||||||||||||||||||||||
Rubicon Minerals Corp. | — | — | 11,230,000 | 15,650,482 | — | — | 11,230,000 | — | — | — | 9,465,862 | 15,650,482 | ||||||||||||||||||||||||||||||||||||
Rubicon Minerals Corp. Warrants | — | — | 3,064,000 | — | — | — | 3,064,000 | — | — | — | 108,744 | — | ||||||||||||||||||||||||||||||||||||
Scorpio Mining Corp. | 25,668,419 | 23,975,473 | — | — | — | — | 25,668,419 | — | — | — | 4,183,952 | 23,975,473 | ||||||||||||||||||||||||||||||||||||
Scorpio Mining Corp. | 522,400 | 984,285 | — | — | — | — | 522,400 | — | — | — | 88,067 | 984,285 | ||||||||||||||||||||||||||||||||||||
SEMAFO, Inc. | 7,676,200 | 28,072,966 | 1,138,000 | 4,032,459 | — | — | 8,814,200 | — | — | — | 22,916,920 | 32,105,425 | ||||||||||||||||||||||||||||||||||||
Silver Range Resources Ltd. | 3,450,000 | — | — | — | — | — | 3,450,000 | — | — | — | 260,193 | — | ||||||||||||||||||||||||||||||||||||
Strategic Metals Ltd. | 10,926,900 | 15,810,172 | — | — | — | — | 10,926,900 | — | — | — | 2,957,015 | 15,810,172 | ||||||||||||||||||||||||||||||||||||
Tocqueville Bullion Reserve LP(c) | — | — | 13,806 | 25,000,000 | — | — | 13,806 | — | — | — | 15,609,286 | 25,000,000 | ||||||||||||||||||||||||||||||||||||
Torex Gold Resources, Inc. | 25,260,500 | 42,073,692 | 9,425,000 | 11,129,790 | — | — | 34,685,500 | — | — | — | 36,930,571 | 53,203,482 | ||||||||||||||||||||||||||||||||||||
|
|
|
|
|
|
|
|
|
|
|
|
|
|
|
| |||||||||||||||||||||||||||||||||
| $ | 430,025,673 | $ | 152,607,178 | $ | (1,849,840 | ) | $ | — | $ | — | $ | — | $ | 262,955,855 | $ | 580,783,011 | ||||||||||||||||||||||||||||||||
| 82 | October 31, 2014 |
| November 1, 2013 | Additions | Reductions | Share Balance/Face Value($) at October 31, 2014 | Interest Income | Dividend Income | Realized Gain/(Loss) | Value at October 31, 2014 | Cost at October 31, 2014 | ||||||||||||||||||||||||||||||||||||||||
Issuer Name | Share Balance/ Face Value($) | Cost | Share Balance/ Face Value($) | Cost | Share Balance/ Face Value($) | Cost | ||||||||||||||||||||||||||||||||||||||||||
The Delafield Fund |
| |||||||||||||||||||||||||||||||||||||||||||||||
AM Castle & Co. | 725,000 | $ | 6,980,251 | 575,000 | $ | 6,962,766 | (100,000 | ) | $ | (1,386,980 | ) | 1,200,000 | $ | — | $ | — | $ | 103,437 | $ | 8,820,000 | $ | 12,556,037 | ||||||||||||||||||||||||||
ACCO Brands Corp.(b) | 4,000,000 | 31,935,099 | 1,000,000 | 6,052,160 | (3,250,000 | ) | (27,178,121 | ) | 1,750,000 | — | — | (6,232,124 | ) | 14,402,500 | 10,809,138 | |||||||||||||||||||||||||||||||||
Kemet Corp. | 2,625,000 | 13,419,471 | 325,000 | 1,379,267 | (350,000 | ) | (2,295,065 | ) | 2,600,000 | — | — | (222,798 | ) | 12,480,000 | 12,503,673 | |||||||||||||||||||||||||||||||||
LTX-Credence Corp. (b) | 2,000,000 | 14,057,657 | — | — | (2,000,000 | ) | (14,057,657 | ) | — | — | — | 2,418,780 | — | — | ||||||||||||||||||||||||||||||||||
Perry Ellis International(b) | — | — | 600,000 | 8,948,026 | (336,450 | ) | (5,259,610 | ) | 263,550 | — | — | 1,402,854 | 5,389,597 | 3,688,416 | ||||||||||||||||||||||||||||||||||
Universal Stainless & Alloy | 451,000 | 13,213,349 | — | — | (51,000 | ) | (1,906,296 | ) | 400,000 | — | — | (109,736 | ) | 10,284,000 | 11,307,053 | |||||||||||||||||||||||||||||||||
Xerium Technologies, Inc. | 600,000 | 7,522,500 | 150,000 | 2,080,417 | — | — | 750,000 | — | — | — | 11,190,000 | 9,602,917 | ||||||||||||||||||||||||||||||||||||
|
|
|
|
|
|
|
|
|
|
|
|
|
|
|
| |||||||||||||||||||||||||||||||||
| $ | 87,128,327 | $ | 25,422,636 | $ | (52,083,729 | ) | $ | — | $ | — | $ | (2,639,587 | ) | $ | 62,566,097 | $ | 60,467,234 | |||||||||||||||||||||||||||||||
The Tocqueville Select Fund |
| |||||||||||||||||||||||||||||||||||||||||||||||
ACCO Brands Corp.(b) | 524,500 | $ | 3,958,205 | 59,100 | $ | 345,835 | (105,000 | ) | $ | (983,771 | ) | 478,600 | $ | — | $ | — | $ | (223,871 | ) | $ | 3,938,878 | 3,320,269 | ||||||||||||||||||||||||||
Summer Infant, Inc. | 814,933 | 3,971,441 | — | — | — | — | 814,933 | — | — | — | 2,762,623 | 3,971,441 | ||||||||||||||||||||||||||||||||||||
Xerium Technologies, Inc. | 200,000 | 2,507,500 | 65,000 | 867,108 | — | — | 265,000 | — | — | — | 3,953,800 | 3,374,608 | ||||||||||||||||||||||||||||||||||||
|
|
|
|
|
|
|
|
|
|
|
|
|
|
|
| |||||||||||||||||||||||||||||||||
| $ | 10,437,146 | $ | 1,212,943 | $ | (983,771 | ) | $ | — | $ | — | $ | (223,871 | ) | $ | 10,655,301 | $ | 10,666,318 | |||||||||||||||||||||||||||||||
|
|
|
|
|
|
|
|
|
|
|
|
|
|
|
| |||||||||||||||||||||||||||||||||
| January 1, 2014 | Additions | Reductions | Share Balance at October 31, 2014 | Interest Income | Dividend Income | Realized Loss | Value at October 31, 2014 | Cost at October 31, 2014 | ||||||||||||||||||||||||||||||||||||||||
Issuer Name | Share Balance | Cost | Share Balance | Cost | Share Balance | Cost | ||||||||||||||||||||||||||||||||||||||||||
The Tocqueville Alternative Strategies Fund* |
| |||||||||||||||||||||||||||||||||||||||||||||||
GSE Systems, Inc.(b) | 695,475 | $ | 1,300,357 | — | $ | — | (424,952 | ) | $ | (834,710 | ) | 270,523 | $ | — | $ | — | $ | (127,424 | ) | $ | 408,490 | 465,647 | ||||||||||||||||||||||||||
Inuvo, Inc. | 350,000 | 588,327 | — | — | — | — | 350,000 | — | — | — | 469,000 | 588,327 | ||||||||||||||||||||||||||||||||||||
Inuvo, Inc. Warrants | 31,750 | — | — | — | — | — | 31,750 | — | — | — | 10,455 | — | ||||||||||||||||||||||||||||||||||||
|
|
|
|
|
|
|
|
|
|
|
|
|
|
|
| |||||||||||||||||||||||||||||||||
| $ | 1,888,684 | $ | — | $ | (834,710 | ) | $ | — | $ | — | $ | (127,424 | ) | $ | 887,945 | $ | 1,053,974 | |||||||||||||||||||||||||||||||
|
|
|
|
|
|
|
|
|
|
|
|
|
|
|
| |||||||||||||||||||||||||||||||||
| (a) | Private security restrictions lifted during period and combined with other non restricted securities. |
| (b) | Security is no longer an affiliated company at October 31, 2014. |
| (c) | Tocqueville Bullion Reserve (“TBR”) is a Delaware Limited Partnership created for the purpose of owning physical gold. The General Partner of TBR is TERA Management LLC (“Tera”), a Delaware Limited Liability Company, which is equally owned and managed by Tocqueville Partners II LLC (“TP2”), a Delaware Limited Liability Company, and Eidesis Real Assets LLC (“Eidesis”), a Delaware Limited Liability Company. The Managing Member of TP2 is Robert Kleinschmidt, President of the Trust,who has a 51% participating percentage in TP2 and the sole Non-Managing Member is John Hathaway, co-portfolio manager of the Tocqueville Gold Fund, who has a 49% participating percentage. |
| * | The predecessor fund of The Tocqueville Alternative Strategies Fund fiscal year began on January 1, 2014. |
9. LINE OF CREDIT
The Tocqueville Trust has a $300,000,000 line of credit (the “Line”), which is uncommitted, with U.S. Bank NA. The Line is for temporary emergency or extraordinary purposes, including the meeting of redemption requests that otherwise might require the untimely disposition of securities. The Line is secured by the Trust’s assets. The Line has a one year term and is reviewed annually by the Board of Trustees. The current agreement runs through May 29, 2015. The interest rate as of October 31, 2014 was 2.75%. During the period ended October 31, 2014, the Tocqueville Fund’s maximum borrowing was $2,623,000 and average borrowing was $26,063 and the Opportunity Fund’s maximum borrowing was $3,426,000 and average borrowing was $112,976. This borrowing resulted in interest expenses of $741 and $2,752, respectively. These amounts are included in Other Expenses on the Funds’ Statement of Operations. The International Value Fund, The Gold Fund, The Delafield Fund, The Select Fund and The Alternative Strategies Fund did not use the Line.
| Annual Report | 83 |
For the period ended October 31, 2014 the outstanding loan amounts for The Tocqueville Fund, The Tocqueville Opportunity Fund, The Tocqueville International Value Fund, The Tocqueville Gold Fund, The Delafield Fund, The Tocqueville Select Fund and The Tocqueville Alternative Strategies Fund were $0, $81,000, $0, $0, $0, $0, $0, respectively.
10. OTHER EXPENSES
Other expenses include reimbursement to the Adviser for compensation of the Trust’s Chief Compliance Officer. For the year ended October 31, 2014, reimbursement to the Adviser for compensation of the Trust’s Chief Compliance Officer from the Funds amounted to $14,390, $3,254, $10,439, $51,138, $66,189, $4,076, $515 for the Tocqueville Fund, Opportunity Fund, International Value Fund, Gold Fund, Delafield Fund, Select Fund and Alternative Strategies Fund, respectively.
| 84 | October 31, 2014 |
The Tocqueville Trust
Report of Independent Registered Public Accounting Firm
To the Shareholders and Board of Trustees of
The Tocqueville Trust
We have audited the accompanying statements of assets and liabilities of The Tocqueville Trust, including The Tocqueville Fund, The Tocqueville Opportunity Fund, The Tocqueville International Value Fund, The Tocqueville Gold Fund, The Delafield Fund, The Tocqueville Select Fund, and The Tocqueville Alternative Strategies Fund (collectively, the Funds), including the schedules of investments, as of October 31, 2014, and the related statements of operations for the year then ended, changes in net assets for each of the two years in the period then ended, and the financial highlights for each of the five years in the period then ended for The Tocqueville Fund, The Tocqueville Opportunity Fund, The Tocqueville International Value Fund, The Tocqueville Gold Fund, The Delafield Fund, and The Tocqueville Select Fund; the related statements of operations, changes in net assets, and cash flows, and the financial highlights for the period January 1, 2014 through October 31, 2014 for The Tocqueville Alternative Strategies Fund. These financial statements and financial highlights are the responsibility of the Funds’ management. Our responsibility is to express an opinion on these financial statements and financial highlights based on our audits. The statement of operations for the period June 1, 2013 through December 31, 2013 and the statements of changes in net assets and the financial highlights for the period June 1, 2013 through December 31, 2013 and for the period June 29, 2012 (date of inception) through May 31, 2013, for The Tocqueville Alternative Strategies Fund were audited by other auditors. Those auditors expressed an unqualified opinion on the financial statements and financial highlights in their report dated February 28, 2014.
We conducted our audits in accordance with the standards of the Public Company Accounting Oversight Board (United States). Those standards require that we plan and perform the audits to obtain reasonable assurance about whether the financial statements are free of material misstatement. We were not engaged to perform an audit of the Funds’ internal control over financial reporting. Our audits included consideration of internal control over financial reporting as a basis for designing audit procedures that are appropriate in the circumstances, but not for the purpose of expressing an opinion on the effectiveness of the Funds’ internal control over financial reporting. Accordingly, we express no such opinion. An audit also includes examining, on a test basis, evidence supporting the amounts and disclosures in the financial statements and financial highlights, assessing the accounting principles used and significant estimates made by management, as well as evaluating the overall financial statement presentation. Our procedures included confirmation of securities owned as of October 31, 2014, by correspondence with the custodian and brokers or by other appropriate auditing procedures where replies from brokers were not received. We believe that our audits provide a reasonable basis for our opinion.
In our opinion, the financial statements and financial highlights referred to above present fairly, in all material respects, the financial position of each of the aforementioned Funds of The Tocqueville Trust as of October 31, 2014, and the results of operations for the year then ended, the changes in net assets for each of the two years in the period then ended, and the financial highlights for each of the five years in the period then ended for The Tocqueville Fund, The Tocqueville Opportunity Fund, The Tocqueville International Value Fund, The Tocqueville Gold Fund, The Delafield Fund, and The Tocqueville Select Fund; and the results of operations, changes in net assets, and cash flows, and the financial highlights for the period January 1, 2014 to October 31, 2014 for The Tocqueville Alternative Strategies Fund, in conformity with accounting principles generally accepted in the United States of America.
/s/ GRANT THORNTON LLP
Chicago, Illinois
December 30, 2014
| Annual Report | 85 |
ADDITIONAL INFORMATION (UNAUDITED)
1. ADDITIONAL DISCLOSURE REGARDING FUND TRUSTEES AND OFFICERS
Independent Trustees
Name, Age and Address | Position(s) Held with the Trust | Term of Office and Length of Time Served (1) | Principal Occupation(s) During Past Five Years | # of Portfolios in Fund Complex Overseen By Trustee | Other Held by Trustee | |||||||
Guy A. Main (78) 40 W. 57th St., 19th Floor New York, NY 10019 | Trustee | Indefinite Term, Since 2000 | Retired. Formerly, Executive Vice President, Amwest Insurance Group, Inc. from April 1996 to January 2001. | 6 | Director, Amwest Insurance Group, Inc. from April 1996 to January 2001; Chairman, Association of California Insurance Companies from January 1996 to January 1998. | |||||||
Charles W. Caulkins (58) 40 W. 57th St., 19th Floor New York, NY 10019 | Trustee | Indefinite Term, Since 2003 | Private Investor from January 2012 – present; Partner, Chora Capital, LLC from June 2010 – December 2011; Director of Marketing, L.R. Global Partners from January 2008 – May 2010; President, Arbor Marketing, Inc. from October 1994 to December 2007. | 6 | Director, Stepping Stones from January 2012- present; Director, Phoenix House from January 2001 to 2007. | |||||||
James W. Gerard (53) 40 W. 57th St., 19th Floor New York, NY 10019 | Trustee | Indefinite Term, Since 2001 | Managing Director, North Sea Partners, from January 2010-present; Principal, Juniper Capital Group, LLC (formerly known as Argus Advisors International, LLC) from August 2003 to December 2009; Managing Director, The Chart Group from January 2001 to present. | 6 | Director and Treasurer, American Overseas Memorial Day Association, 1998 to present; Director and Treasurer ASPCA, 1998 to 2008; Trustee, Salisbury School, 2005 to present; Director, American Friends of Bleraucourt, 1992 to present. | |||||||
| 86 | October 31, 2014 |
Independent Trustees
Name, Age and Address | Position(s) Held with the Trust | Term of Office and Length of Time Served (1) | Principal Occupation(s) During Past Five Years | # of Portfolios in Fund Complex Overseen By Trustee | Other Held by Trustee | |||||||
William F. Indoe (72) 40 W. 57th St., 19th Floor New York, NY 10019 | Trustee | Indefinite Term, Since 2006 | Senior Counsel, Sullivan & Cromwell LLP (attorneys- at-law). 1968 – present. | 6 | Director, Rho Capital Partners, Inc. | |||||||
William J. Nolan III (67) 40 W. 57th St., 19th Floor New York, NY 10019 | Trustee | Indefinite Term, Since 2006 | Retired. Executive Vice President & Treasurer PaineWebber Inc. 1997 – 2001. | 6 | Trustee, Adirondack Museum, Blue Mt. Lake, NY 1996 to present (Treasurer, 2000 to 2013; Chair of the Investment Committee, 2009 – present). | |||||||
Alexander Douglas (67) 40 W. 57th St., 19th Floor New York, NY 10019 | Trustee | Indefinite Term, Since 2010 | President, CEO and owner of Spaulding Law Printing, Inc. | 6 | None | |||||||
Interested Trustees (and Officers)*
Name, Age and Address | Position(s) Held with the Trust | Term of Office and Length of Time Served (1) | Principal Occupation(s) During Past Five Years | # of Portfolios in Fund Complex Overseen By Trustee | Other Held by Trustee | |||||||
Francois D. Sicart (71) 40 W. 57th St., 19th Floor New York, NY 10019 | Chairman and Trustee | Indefinite Term, Since 1987 | Chairman, Tocqueville Management Corporation, the General Partner of Tocqueville Asset Management L.P. and Tocqueville Securities L.P. from January 1990 to present; Chairman and Founder, Tocqueville Asset Management Corporation from December 1985 to January 1990; Vice Chairman of Tucker Anthony Management Corporation from 1981 to October 1986; Vice President (formerly general partner) among other positions with Tucker Anthony, Inc. from 1969 to January 1990. | 6 | Chairman and Director, Tocqueville Management Corporation, the General Partner of Tocqueville Asset Management L.P. and Tocqueville Securities L.P. from January 1990 to present. | |||||||
| Annual Report | 87 |
Interested Trustees (and Officers)*
Name, Age and Address | Position(s) Held with the Trust | Term of Office and Length of Time Served (1) | Principal Occupation(s) During Past Five Years | # of Portfolios in Fund Complex Overseen By Trustee | Other Held by Trustee | |||||||
Robert W. Kleinschmidt (65) 40 W. 57th St., 19th Floor New York, NY 10019 | President and Trustee | Indefinite Term, Since 1991 | President and Chief Investment Officer of Tocqueville Asset Management; Director, Tocqueville Management Corporation, the General Partner of Tocqueville Asset Management L.P. and Tocqueville Securities L.P. from January 1994 to present; and Managing Director from July 1991 to January 1994; Partner, David J. Greene & Co. from May 1978 to July 1991. | 6 | President and Director, Tocqueville Management Corporation, the General Partner of Tocqueville Asset Management L.P. and Tocqueville Securities L.P. | |||||||
Cleo Kotis (39) 40 W. 57th St., 19th Floor New York, NY 10019 | Secretary | Indefinite Term, Since 2010 | Director of Operations, the Delafield Group of Tocqueville Asset Management L.P., 2009 to present; Vice President and Chief Operations Officer, the Delafield Fund, Inc. from 2005-2009; Vice President and Chief Operations Officer, Delafield Asset Management from 2005- 2009; Vice President, Reich & Tang Asset Management, LLC from 2002-2009. | N/A | N/A | |||||||
Helen Balk (42) 40 W. 57th St., 19th Floor New York, NY 10019 | Treasurer | Indefinite Term, Since 2014 | Controller / Treasurer of Tocqueville Asset Management from January 2014 to present; Manager / Staff Accountant at Pegg & Pegg LLP from August 1995 to January 2014. | N/A | N/A | |||||||
| 88 | October 31, 2014 |
Interested Trustees (and Officers)*
Name, Age and Address | Position(s) Held with the Trust | Term of Office and Length of Time Served (1) | Principal Occupation(s) During Past Five Years | # of Portfolios in Fund Complex Overseen By Trustee | Other Held by Trustee | |||||||
Elizabeth Bosco (66) 40 W. 57th St., 19th Floor | Anti-Money Laundering Compliance Officer | Indefinite Term, Since 2009 | Chief Compliance Officer of Tocqueville Securities, L.P. from January 2009 to present; Compliance Officer, Tocqueville Securities L.P. and Tocqueville Asset Management from January 1997 to January 2009. | N/A | N/A | |||||||
Thomas Pandick (67) 40 W. 57th St., 19th Floor New York, NY 10019 | Chief Compliance Officer | Indefinite Term, Since 2004 | Chief Compliance Officer (October 2004-present) Tocqueville Asset Management L.P. | N/A | N/A | |||||||
| * | “Interested person” of the Trust is defined in the 1940 Act. Mr. Sicart and Mr. Kleinschmidt are considered “interested persons” because of their affiliation with the Adviser. |
| (1) | Each Trustee will hold office for an indefinite term until the earliest of (i) the next meeting of shareholders, if any, called for the purpose of considering the election or re-election of such Trustee and until the election and qualification of his or her successor, if any, elected at such meeting, or (ii) the date a Trustee resigns or retires, or a Trustee is removed by the Board of Trustees or shareholders, in accordance with the Trust’s By-Laws, as amended, and Agreement and Declaration of Trust, as amended. Each officer will hold office for an indefinite term until the date he or she resigns or retires or until his or her successor is elected and qualified. |
2. INVESTMENT ADVISORY AGREEMENT DISCLOSURE
In determining whether to approve the continuance of the Investment Advisory Agreement and the Administration Agreement with respect to the Tocqueville Fund, the Opportunity Fund, the International Value Fund, the Gold Fund, the Delafield Fund and the Select Fund, the Trustees, including the Independent Trustees, considered the following information:
1) The nature, extent and quality of services provided by the Adviser.
The Trustees reviewed in detail the nature and extent of the services provided by the Adviser under the terms of the Investment Advisory Agreements and the quality of those services provided to The Tocqueville Fund, The Tocqueville Opportunity Fund, The Tocqueville International Value Fund, The Tocqueville Gold Fund, The Delafield Fund and The Tocqueville Select Fund (the “Funds”) over the past year. The Trustees noted that the services under the Investment Advisory Agreements include: managing the investment and reinvestment of the Funds’ assets; supervising and managing all aspects of the Funds’ operations; and providing the Board on a regular basis with financial reports and analyses on the Funds’ operations and the operations of comparable investment companies. The Trustees also observed that the Adviser provides various administrative services to the Funds pursuant to the terms of the Administration Agreement and considered the nature, extent and quality of services provided under that agreement as well. The Trustees evaluated these
| Annual Report | 89 |
factors based on their direct experience with the Adviser and in consultation with counsel. The Trustees concluded that the nature and extent of the services provided under the Investment Advisory Agreements and the Administration Agreement were reasonable and appropriate in relation to the advisory fee and administration fee, respectively, that the level of services provided by the Adviser to the Funds had not diminished over the past year and that the quality of services continues to be high. The Trustees reviewed the personnel responsible for providing advisory and administrative services to the Funds and concluded, based on their experience and interaction with the Adviser, that (i) the Adviser was able to retain quality portfolio managers and other personnel; (ii) the Adviser exhibited a high level of diligence and attention to detail in carrying out its advisory and administrative responsibilities under the Investment Advisory Agreements and Administration Agreement, respectively, for the Funds; (iii) the Adviser was responsive to requests of the Trustees; and (iv) the Adviser had kept the Trustees apprised of developments relating to the Funds and the industry in general. The Trustees also focused on the Adviser’s reputation and long-standing relationship with the Trust.
In connection with its assessment of the performance of the Adviser, the Trustees reviewed the Adviser’s financial statements and considered the Adviser’s financial condition and whether it has the resources necessary to continue to carry out its obligations under the Investment Advisory Agreements and the Administration Agreement. The Trustees concluded that the Adviser has the financial resources necessary to continue to perform its obligations under the Investment Advisory Agreements and the Administration Agreement and to continue to provide the high quality services that it has provided to the Funds to date.
2) The performance of the Funds and the Adviser.
The Trustees reviewed the investment performance of the Funds, both on an absolute basis and as compared to a peer group for each respective Fund for the one-year, three-year, five-year and ten-year periods, ended July 31, 2014. The peer groups were comprised of other funds that had similar investment objectives and sales load structures, as determined by Morningstar: The Morningstar Large Blend Funds peer group, with total net assets between $337 million and $428 million, for The Tocqueville Fund; the Morningstar Mid-Cap Growth Funds peer group, with total net assets between $60 million and $101 million, for The Tocqueville Opportunity Fund; the Morningstar Foreign Large Value Funds peer group, with total net assets between $218 million and $314 million, for The Tocqueville International Value Fund; the Morningstar Precious Metals Funds peer group, with total net assets between $1.4 billion and $2.6 billion, for The Tocqueville Gold Fund; the Morningstar Mid-Cap Value Funds peer group, with total net assets between $1.3 billion and $2.2 billion, for The Delafield Fund and the Morningstar Small Value Funds peer group, with total net assets between $80 million and $142 million, for The Tocqueville Select Fund (the “Performance Peer Groups”). The Trustees considered that the performance information for The Delafield Fund and The Tocqueville Select Fund includes the performance information of their respective predecessor funds, which had different investment advisers, but the Trustees considered this information since these Funds have substantially the same portfolio management team.
The Trustees also compared each Fund’s investment performance against its benchmark market indices: the S&P 500 Index for The Tocqueville Fund; the Russell 2500 Growth Index for The Tocqueville Opportunity Fund; the Morgan Stanley EAFE Index for The Tocqueville International Value Fund; the S&P 500 Index and the Philadelphia Stock Exchange Gold & Silver Index for The Tocqueville Gold Fund; the S&P 500 Index and the Russell 2000 Index for The Delafield Fund and the Russell 2500 Index and the Russell 2000 Index for The Tocqueville Select Fund (the “Indices”) for the one-year, three-year, five-year and ten-year periods ended July 31, 2014 for all the Funds. The Trustees considered the above information as helpful in their assessment of whether the Adviser was obtaining for the Funds’ shareholders the performance that was available in the marketplace given each Fund’s investment objectives, policies, strategies, limitations and restrictions. The Trustees concluded that the performance of the Funds against their respective
| 90 | October 31, 2014 |
Performance Peer Groups was satisfactory. In particular, the Trustees noted that The Tocqueville Fund had outperformed as compared to its Index for the one-year and ten-year periods and underperformed for the three-year and five-year periods, and outperformed the median of its Performance Peer Group for the one-year, three-year and ten-year periods and underperformed for the five-year period. The Trustees noted that The Tocqueville Opportunity Fund underperformed its Index for all time periods, was equal to the median for the three-year period, outperformed the median of its Performance Peer Group for the five-year period and underperformed for the one-year and ten-year periods. The Trustees noted that The Tocqueville International Value Fund outperformed its Index for the one-year, five-year and ten-year periods and underperformed for the three-year period, and outperformed the median of its Performance Peer Group for all periods except the three-year period. The Trustees noted that The Tocqueville Gold Fund outperformed both of its Indices for the ten-year period, and outperformed the Philadelphia Stock Exchange Gold & Silver Index and underperformed the S&P 500 Index for the one-year, three-year and five-year periods, and outperformed the median of its Performance Peer Group for all periods. The Trustees noted that The Delafield Fund outperformed both of its Indices for the ten-year period, underperformed both of its Indices for the three-year and five-year periods and outperformed the Russell 2000 Index and underperformed the S&P 500 Index for the one-year period, and outperformed the median of its Performance Peer Group for the ten-year period and underperformed for all other periods. The Trustees noted that The Tocqueville Select Fund outperformed both of its Indices for the ten-year period, underperformed both of its Indices for the three-year period, and outperformed the Russell 2000 Index and underperformed the Russell 2500 Index for the one-year and five-year periods and outperformed the median of its Performance Peer Group for all time periods except the three-year period.
3) The cost of the advisory services and the profits to the Adviser from the relationship with the Trust.
In connection with the Trustee’s consideration of the level of the advisory fees, the Trustees considered a number of factors. The Trustees compared the level of the advisory fees for each Fund against the advisory fees charged by funds in a universe of funds: the Morningstar Large Cap Blend Funds peer group, with average net assets between $200 million and $500 million, for The Tocqueville Fund; the Morningstar Mid-Cap Growth Funds peer group, with average net assets between $50 million and $110 million, for The Tocqueville Opportunity Fund; the Morningstar Foreign Large Value Funds peer group, with average net assets between $150 million and $400 million, for The Tocqueville International Value Fund; all funds in the Morningstar Equity Precious Metals Funds peer group, for The Tocqueville Gold Fund; the Morningstar Mid-Cap Value Funds peer group, with average net assets between $1.0 billion and $2.4 billion, for The Delafield Fund and the Morningstar Small Value Funds peer group, with average net assets between $50 million and $150 million, for The Tocqueville Select Fund (the “Expense Peer Groups”). The Trustees considered comparative total fund expenses of the Funds and the Expense Peer Groups. The Trustees used this comparative fee information and total expense data as a guide to help assess the reasonableness of each Fund’s advisory fee, although they acknowledged that it was difficult to make precise comparisons with other funds since the exact nature of services provided under each Expense Peer Group fund agreement is often not apparent. The Trustees also viewed the Expense Peer Group fee information as a whole as useful in assessing whether the Adviser was providing services at a cost that was competitive with other, similar funds.
The Trustees noted that the contract rate advisory fee and administration fee for each of the Funds were reasonable, despite the contractual advisory fee rate being above average for The Tocqueville Fund, The Tocqueville International Value Fund and The Tocqueville Gold Fund and the administration fee being above average for The Tocqueville Fund, The Tocqueville Opportunity Fund, The Tocqueville International Value Fund and The Delafield Fund, when compared to their respective Expense Peer Groups. The Trustees also considered the combined contract rate advisory and administration fee as compared to their respective Expense Peer Group. The Board further observed that the total expense
| Annual Report | 91 |
ratios of the Funds were also reasonable. The Board noted that the total expense ratio for The Tocqueville Fund, The Tocqueville Opportunity Fund, The Tocqueville International Value Fund, The Delafield Fund and The Tocqueville Select Fund was above average, when compared to their respective Expense Peer Groups and that the total expense ratio for The Tocqueville Gold Fund was below average, when compared to its respective Expense Peer Groups. The Board also noted that The Tocqueville Fund and The Tocqueville International Value Fund each operate pursuant to an Expense Limitation Agreement whereby the Adviser has agreed to waive a portion of its fee necessary to limit the Fund’s total operating expenses to the level set forth in the Fund’s prospectus.
The Trustees also considered the profitability to the Adviser and its affiliate arising out of its relationship with the Trust. In this regard, the Trustees reviewed profitability data relating to the Adviser for the year ended October 31, 2013. The Trustees considered revenues received by the Adviser under the Investment Advisory Agreements and the Administration Agreement as well as revenues received by the Adviser’s affiliate, the Distributor, under the 12b-1 plans and Related Agreements and commissions received for effecting portfolio transactions. The Trustees also received and reviewed the Adviser’s financial statements and the Adviser provided an oral update on its profitability numbers since October 31, 2013. The Trustees concluded that the profitability of the Funds to the Adviser was not excessive.
4) The extent to which economies of scale will be realized as the Funds grow and whether fee levels reflect those economies of scale.
With respect to the Trustees’ consideration of economies of scale, the Trustees discussed with the Adviser whether economies of scale would be realized by it in its management of a Fund at higher asset levels. The Trustees also reviewed the Peer Group data to assess whether the Peer Group funds had advisory fee breakpoints and, if so, at what asset levels. The Trustees noted that all of the Funds, except for The Tocqueville Select Fund, currently have advisory fee breakpoints and that they were satisfied that the current breakpoints were appropriate when compared with each Fund’s respective Peer Group. The Trustees considered that breakpoints are not necessary at this time for The Tocqueville Select Fund, given the small size of The Tocqueville Select Fund. The Trustees also noted that, as of November 1, 2014, the administration fee would have breakpoints. In the event there was significant asset growth in the future in a Fund, the Trustee’s determined to reassess whether the advisory fees and administration fee, including the current breakpoint structure, appropriately took into account any economies of scale that had been realized as a result of that growth.
5) Other Factors.
The Trustees also discussed the Adviser’s practices regarding the selection and compensation of brokers and dealers that execute portfolio transactions for the Funds and the brokers’ and dealers’ provision of brokerage and research services to the Adviser. The Trustees further discussed the potential benefits the Adviser derived from the Funds’ soft dollar arrangements, whereby brokers provide research to the Funds or the Adviser in return for allocating fund brokerage, and other investment data concerning soft dollars. The Board also discussed the Adviser’s use of an affiliated broker to effect portfolio transactions, noting that in addition to paying a competitive rate on commissions, the Adviser believed the Funds received better execution on trades.
Based on a consideration of all these factors in their totality, the Trustees, including all of the Independent Trustees, determined that the Funds’ advisory fees and administration fees were fair and reasonable with respect to the quality of services that the Adviser provides and in light of the other factors described above that the Trustees deemed relevant. The Trustees based their decision on evaluations of all these factors as a whole and did not consider any one factor as all-important or controlling.
| 92 | October 31, 2014 |
In determining whether to initially approve the Investment Advisory Agreement and the Administration Agreement with respect to the Alternative Strategies Fund, the Trustees, including the Independent Trustees, considered the following information:
1) The nature, extent and quality of services provided by the Adviser.
The Trustees reviewed in detail the nature and extent of the services to be provided by the Adviser under the terms of the Investment Advisory Agreement. The Trustees noted that the services under the Investment Advisory Agreement include: managing the investment and reinvestment of the Fund’s assets; supervising and managing all aspects of the Fund’s operations; and providing the Board on a regular basis with financial reports and analyses on the Fund’s operations and the operations of comparable investment companies. The Trustees also observed that the Adviser provides various administrative services to the Fund pursuant to the terms of the Administration Agreement and considered the nature, extent and quality of services to be provided under that agreement as well. The Trustees evaluated these factors based on their direct experience with the Adviser and in consultation with counsel. The Trustees concluded that the nature and extent of the services to be provided under the Investment Advisory Agreement and the Administration Agreement were reasonable and appropriate in relation to the advisory fee and administration fee, respectively. The Trustees noted that the level of services provided by the Adviser to the other series of the Trust had not diminished over the past year and that the quality of services continues to be high, and that they expect the same level of service for the Fund. The Trustees reviewed the personnel responsible for providing advisory and administrative services to the Fund and concluded, based on their experience and interaction with the Adviser, that (i) the Adviser was able to retain quality portfolio managers and other personnel; (ii) the Adviser exhibited a high level of diligence and attention to detail in carrying out its advisory and administrative responsibilities under the investment advisory agreements and administration agreement, respectively, for the other series of the Trust and that they expect the same level of attention to be paid to the Fund; (iii) the Adviser was responsive to requests of the Trustees; and (iv) the Adviser had kept the Trustees apprised of developments relating to the existing series of the Trust and the industry in general and that the Trustees expect the same for the Fund. The Trustees also focused on the Adviser’s reputation and long-standing relationship with the Trust.
In connection with its assessment of the performance of the Adviser, the Trustees reviewed the Adviser’s financial statements and considered the Adviser’s financial condition and whether it has the resources necessary to continue to carry out its obligations under the Investment Advisory Agreement and the Administration Agreement. The Trustees concluded that the Adviser has the financial resources necessary to perform its obligations under the Investment Advisory Agreement and the Administration Agreement and to provide the high quality services that it has provided to the other series of the Trust to date.
2) The performance of the Fund and the Adviser.
The Trustees reviewed the investment performance of the predecessor fund, both on an absolute basis and as compared to a peer group for the one-year period, ended April 30, 2014. The peer group was comprised of other funds that had similar investment objectives and sales load structures, as determined by Morningstar: The Morningstar Multialternative Funds peer group, with average net assets between $13 million and $88 million (the “Performance Peer Group”). The Trustees considered that the performance information reflects the performance information of the predecessor fund, which had a different investment adviser, but the Trustees considered this information since the Fund has substantially the same portfolio management team.
| Annual Report | 93 |
The Trustees also compared the predecessor fund’s investment performance against its benchmark market indices: the S&P 500 Index and the HFRX North America Index (the “Indices”) for the one-year periods ended April 30, 2014. The Trustees considered the performance information of the predecessor fund given that the Fund has substantially the same portfolio management team. The Trustees concluded that the performance of the predecessor fund against its Performance Peer Group was satisfactory. In particular, the Trustees noted that the predecessor fund had underperformed both of its Indices for the one-year period and outperformed the median of its Performance Peer Group for the one-year period.
3) The cost of the advisory services and the profits to the Adviser from the relationship with the Trust.
In connection with the Trustees’ consideration of the level of the advisory fees, the Trustees considered a number of factors. The Trustees compared the level of the advisory fees for the Fund against the advisory fees charged by funds in a universe of funds: the Morningstar Large Blend Funds peer group, with average net assets between $13 million and $88 million (the “Expense Peer Group”). The Trustees considered comparative total fund expenses of the Fund and the Expense Peer Group. The Trustees used this comparative fee information and total expense data as a guide to help assess the reasonableness of the Fund’s advisory fee, although they acknowledged that it was difficult to make precise comparisons with other funds since the exact nature of services provided under the Expense Peer Group fund agreement is often not apparent. The Trustees also viewed the Expense Peer Group fee information as a whole as useful in assessing whether the Adviser was providing services at a cost that was competitive with other, similar funds.
The Trustees noted that the contract rate advisory fee and administration fee for the Fund was reasonable, despite the contractual advisory fee rate and administration fee being above average for the Fund, when compared to its Expense Peer Group. The Trustees also considered the combined contract rate advisory and administration fee as compared to the Expense Peer Group. The Board further observed that the total net expense ratio of the Fund was also reasonable. The Board noted that the total net expense ratio for the Fund was above average when compared to its Expense Peer Group. The Board also noted that the Fund operates pursuant to an Expense Limitation Agreement whereby the Adviser has agreed to waive a portion of its fee necessary to limit the Fund’s total operating expenses to the level set forth in the Fund’s prospectus.
The Trustees also considered the projected profitability to the Adviser and its affiliate arising out of its relationship with the Fund. The Trustees considered projected revenues to be received by the Adviser under the Investment Advisory Agreement and the Administration Agreement as well as revenues to be received by the Adviser’s affiliate, the Distributor, under the 12b-1 plans and Related Agreements and commissions received for effecting portfolio transactions. The Adviser provided an oral update on its profitability numbers. The Trustees concluded that the profitability of the Fund to the Adviser is not excessive.
4) The extent to which economies of scale will be realized as the Fund grows and whether fee levels reflect those economies of scale.
With respect to the Trustees’ consideration of economies of scale, the Trustees discussed with the Adviser whether economies of scale would be realized by it in its management of the Fund at higher asset levels. The Trustees also reviewed the Peer Group data to assess whether the Peer Group funds had advisory fee breakpoints and, if so, at what asset levels. The Trustees noted that the Fund currently has advisory fee breakpoints and that they were satisfied that the current breakpoints were appropriate when compared with the Fund’s respective Peer Group. The Trustees also noted that
| 94 | October 31, 2014 |
the administration fee for the Fund does not have a breakpoint and they concluded that breakpoints were not needed at this time. In the event there was significant asset growth in the future in the Fund, the Trustees’ determined to reassess whether the advisory fees and administration fee, including the current breakpoint structure, appropriately took into account any economies of scale that had been realized as a result of that growth.
5) Other Factors.
The Trustees also discussed the Adviser’s practices regarding the selection and compensation of brokers and dealers that execute portfolio transactions for the Fund and the brokers’ and dealers’ provision of brokerage and research services to the Adviser. The Trustees further discussed the potential benefits the Adviser derived from the Fund’s soft dollar arrangements, whereby brokers provide research to the Fund or the Adviser in return for allocating fund brokerage, and other investment data concerning soft dollars. The Board also discussed the Adviser’s use of an affiliated broker to effect portfolio transactions, noting that in addition to paying a competitive rate on commissions, the Adviser believed the Fund will receive better execution on trades.
Based on a consideration of all these factors in their totality, the Trustees, including all of the Independent Trustees, determined that the Fund’s advisory fee and administration fee were fair and reasonable with respect to the quality of services that the Adviser provides and in light of the other factors described above that the Trustees deemed relevant. The Trustees based their decision on evaluations of all these factors as a whole and did not consider any one factor as all-important or controlling.
3. PROXY VOTING POLICIES AND PROCEDURES
A description of the policies and procedures that The Tocqueville Trust uses to determine how to vote proxies relating to portfolio securities is available without charge upon request by calling 1-800-355-7307. Information regarding how The Tocqueville Trust voted proxies relating to portfolio securities during the most recent 12-month period ended June 30 is available by calling 1-800-355-7307 and it is also available on the SEC’s web site at http://www.sec.gov.
4. SHAREHOLDER REPORTS AND QUARTERLY PORTFOLIO DISCLOSURE
The Tocqueville Trust is required to file its complete schedule of portfolio holdings with the SEC for its first and third fiscal quarters on Form N-Q. The Trust’s Form N-Q will be available without charge, upon request on the SEC’s website (http://www.sec.gov) and may be available by calling 1-800-697-3863. You can also obtain copies of Form N-Q by (i) visiting the SEC’s Public Reference Room in Washington, DC (information on the operation of the Public Reference Room may be obtained by calling 1-202-551-8090); (ii) sending your request and a duplicating fee to the SEC’s Public Reference Room, Washington, DC 20549-1520; or (iii) sending your request electronically to publicinfosec.gov. Quarterly portfolio holdings are also available on the website of The Tocqueville Funds, www.tocqueville.com/mutual-funds.
| Annual Report | 95 |
5. SHAREHOLDER NOTIFICATION OF FEDERAL TAX STATUS
For the fiscal period ended October 31, 2014, certain dividends paid by the Funds may be subject to a maximum tax rate of 15%, as provided for by the Jobs and Growth Tax Relief Reconciliation Act of 2003. The percentage of dividends declared from ordinary income designated as qualified dividend income was as follows:
Tocqueville Fund | 100.00 | % | ||
Opportunity Fund | 0.00 | % | ||
International Value Fund | 99.80 | % | ||
Gold Fund | 0.00 | % | ||
Delafield Fund | 0.00 | % | ||
Select Fund | 0.00 | % | ||
Alternative Strategies Fund | 0.00 | % |
For corporate shareholders, the percent of ordinary income distributions qualifying for the corporate dividends received deduction for the fiscal period ended October 31, 2014 was as follows:
Tocqueville Fund | 90.25 | % | ||
Opportunity Fund | 0.00 | % | ||
International Value Fund | 10.05 | % | ||
Gold Fund | 0.00 | % | ||
Delafield Fund | 0.00 | % | ||
Select Fund | 0.00 | % | ||
Alternative Strategies Fund | 0.00 | % |
For the period ended October 31, 2014, the funds designate the following percent of ordinary distributions paid as interest-related dividends under the Internal Revenue Code Section 871(k)(1)(c):
Tocqueville Fund | 0.00 | % | ||
Opportunity Fund | 0.00 | % | ||
International Value Fund | 0.02 | % | ||
Gold Fund | 0.00 | % | ||
Delafield Fund | 0.00 | % | ||
Select Fund | 0.00 | % | ||
Alternative Strategies Fund | 0.00 | % |
The percentage of taxable ordinary income distributions that are designated as short-term capital gain distributions under Internal Revenue Section 871(k)(2)(C) for each Fund were as follows.
Tocqueville Fund | 0.00 | % | ||
Opportunity Fund | 0.00 | % | ||
International Value Fund | 0.00 | % | ||
Gold Fund | 0.00 | % | ||
Delafield Fund | 100.00 | % | ||
Select Fund | 0.00 | % | ||
Alternative Strategies Fund | 0.00 | % |
| 96 | October 31, 2014 |
6. FOREIGN TAX CREDIT
For the year ended October 31, 2014, the Tocqueville International Value Fund earned foreign source income and paid foreign taxes which they intend to pass through to their shareholders pursuant to Section 853 of the Internal Revenue Code as follows:
Country | Gross Dividend Per Share | Taxes Withheld Per Share | ||||||
Netherlands Antilles | 0.00662 | 0.00000 | ||||||
Australia | 0.00264 | 0.00000 | ||||||
Belgium | 0.02247 | 0.00337 | ||||||
Bermuda | 0.00113 | 0.00000 | ||||||
Brazil | 0.00131 | 0.00015 | ||||||
Canada | 0.00895 | 0.00134 | ||||||
Switzerland | 0.01427 | 0.00128 | ||||||
Germany | 0.02580 | 0.00299 | ||||||
France | 0.05187 | 0.00767 | ||||||
Hong Kong | 0.03051 | 0.00000 | ||||||
Ireland | 0.00842 | 0.00000 | ||||||
Japan | 0.06740 | 0.00885 | ||||||
South Korea | 0.00020 | 0.00003 | ||||||
Cayman Islands | 0.00918 | 0.00000 | ||||||
Luxembourg | 0.00678 | 0.00102 | ||||||
Netherlands | 0.02510 | 0.00376 | ||||||
Norway | 0.04578 | 0.00765 | ||||||
|
|
|
| |||||
| 0.32843 | 0.03811 | |||||||
|
|
|
| |||||
| Annual Report | 97 |
Investment Adviser
Tocqueville Asset Management L.P.
40 W. 57th St., 19th Floor
New York, NY 10019
(212) 698-0800
www.tocqueville.com
Distributor
Tocqueville Securities, L.P.
40 W. 57th St., 19th Floor
New York, NY 10019
(212) 698-0800
Shareholders’ Servicing and Transfer Agent
U.S. Bancorp Fund Services, LLC
P.O. Box 701
Milwaukee, WI 53201-0701
(800) 697-3863
Custodian
U.S. Bank, N.A.
Custody Operations
1555 River Center Drive, Suite 302
Milwaukee, WI 53212
Board of Trustees
François D. Sicart—Chairman
Charles W. Caulkins
Alexander Douglas
James W. Gerard
William F. Indoe
Robert W. Kleinschmidt
Guy A. Main
William J. Nolan III

Tocqueville Funds
c/o US Bancorp Fund Services, LLC
P.O. Box 701
Milwaukee, WI 53201-0701
www.tocqueville.com/mutual-funds
TQ-ANNUAL 10/31/2014
Item 2. Code of Ethics.
The registrant has adopted a code of ethics that applies to the registrant’s principal executive officer and principal financial officer. The registrant has not made any substantive amendments to its code of ethics during the period covered by this report. The registrant has not granted any waivers from any provisions of the code of ethics during the period covered by this report.
Incorporated by reference to the Registrant’s Form N-CSR filed January 6, 2011.
Item 3. Audit Committee Financial Expert.
The registrant’s board of trustees has determined that there is at least one audit committee financial expert serving on its audit committee. James Gerard, William Nolan III, and Guy Main are the “audit committee financial experts” and are considered to be “independent” as each term is defined in Item 3 of Form N-CSR.
Item 4. Principal Accountant Fees and Services.
The registrant has engaged its principal accountant to perform audit services, audit-related services, tax services and other services during the past two fiscal years. “Audit services” refer to performing an audit of the registrant’s annual financial statements or services that are normally provided by the accountant in connection with statutory and regulatory filings or engagements for those fiscal years. “Audit-related services” refer to the assurance and related services by the principal accountant that are reasonably related to the performance of the audit. “Tax services” refer to professional services rendered by the principal accountant for tax compliance, tax advice, and tax planning. “Other services” were not provided by the principal accountant. The following table details the aggregate fees billed or expected to be billed for each of the last two fiscal years for audit fees, audit-related fees, tax fees and other fees by the principal accountant.
| FYE 10/31/2014 | FYE 10/31/2013 | |||||||
Audit Fees | 206,000 | 156,000 | ||||||
Audit-Related Fees | 0 | 0 | ||||||
Tax Fees | 27,000 | 21,500 | ||||||
All Other Fees | 0 | 0 | ||||||
The audit committee has adopted pre-approval policies and procedures that require the audit committee to pre-approve all audit and non-audit services of the registrant, including services provided to any entity affiliated with the registrant.
The percentage of fees billed by Grant Thornton applicable to non-audit services pursuant to waiver of pre-approval requirement were as follows:
| FYE 10/31/2014 | FYE 10/31/2013 | |||||||
Audit-Related Fees | 0 | % | 0 | % | ||||
Tax Fees | 0 | % | 0 | % | ||||
All Other Fees | 0 | % | 0 | % | ||||
All of the principal accountant’s hours spent on auditing the registrant’s financial statements were attributed to work performed by full-time permanent employees of the principal accountant. The following table indicates the non-audit fees billed or expected to be billed by the registrant’s accountant for services to the registrant and to the registrant’s investment adviser (and any other controlling entity, etc.—not sub-adviser) for the last two years. The audit committee of the board of trustees/directors has considered whether the provision of non-audit services that were rendered to the registrant’s investment adviser is compatible with maintaining the principal accountant’s independence and has concluded that the provision of such non-audit services by the accountant has not compromised the accountant’s independence.
Non-Audit Related Fees | FYE 10/31/2014 | FYE 10/31/2013 | ||||||
Registrant | 0 | 0 | ||||||
Registrant’s Investment Adviser | 0 | 0 | ||||||
Item 5. Audit Committee of Listed Registrants.
Not applicable to registrants who are not listed issuers (as defined in Rule 10A-3 under the Securities Exchange Act of 1934).
Item 6. Investments.
Schedule of Investments is included as part of the report to shareholders filed under Item 1 of this Form.
Item 7. Disclosure of Proxy Voting Policies and Procedures for Closed-End Management Investment Companies.
Not applicable to open-end investment companies.
Item 8. Portfolio Managers of Closed-End Management Investment Companies.
Not applicable to open-end investment companies.
Item 9. Purchases of Equity Securities by Closed-End Management Investment Company and Affiliated Purchasers.
Not applicable to open-end investment companies.
Item 10. Submission of Matters to a Vote of Security Holders.
There have been no material changes to the procedures by which shareholders may recommend nominees to the registrant’s board of trustees.
Item 11. Controls and Procedures.
| (a) | The Registrant’s President and Treasurer have reviewed the Registrant’s disclosure controls and procedures (as defined in Rule 30a-3(c) under the Investment Company Act of 1940 (the “Act”)) as of a date within 90 days of the filing of this report, as required by Rule 30a-3(b) under the Act and Rules 13a-15(b) or 15d-15(b) under the Securities Exchange Act of 1934. Based on their review, such officers have concluded that the disclosure controls and procedures are effective in ensuring that information required to be disclosed in this report is appropriately recorded, processed, summarized and reported and made known to them by others within the Registrant and by the Registrant’s service provider. |
| (b) | There were no changes in the Registrant’s internal control over financial reporting (as defined in Rule 30a-3(d) under the Act) that occurred during the second fiscal quarter of the period covered by this report that has materially affected, or is reasonably likely to materially affect, the Registrant’s internal control over financial reporting. |
Item 12. Exhibits.
| (a) | (1) Any code of ethics or amendment thereto, that is the subject of the disclosure required by Item 2, to the extent that the registrant intends to satisfy Item 2 requirements through filing an exhibit. Incorporated by reference to the Registrant’s Form N-CSR filed January 6, 2011. |
(2) A separate certification for each principal executive and principal financial officer pursuant to Section 302 of the Sarbanes-Oxley Act of 2002. Filed herewith.
(3) Any written solicitation to purchase securities under Rule 23c-1 under the Act sent or given during the period covered by the report by or on behalf of the registrant to 10 or more persons. Not applicable to open-end investment companies.
| (b) | Certifications pursuant to Section 906 of the Sarbanes-Oxley Act of 2002. Furnished herewith. |
SIGNATURES
Pursuant to the requirements of the Securities Exchange Act of 1934 and the Investment Company Act of 1940, the registrant has duly caused this report to be signed on its behalf by the undersigned, thereunto duly authorized.
(Registrant) The Tocqueville Trust | ||||
By (Signature and Title)* | /s/ Robert W. Kleinschmidt | |||
| Robert W. Kleinschmidt, President | ||||
Date January 8, 2015 | ||||
Pursuant to the requirements of the Securities Exchange Act of 1934 and the Investment Company Act of 1940, this report has been signed below by the following persons on behalf of the registrant and in the capacities and on the dates indicated.
By (Signature and Title)* | /s/ Robert W. Kleinschmidt | |
| Robert W. Kleinschmidt, President | ||
Date January 8, 2015 | ||
By (Signature and Title)* | /s/ Helen Balk | |
| Helen Balk, Treasurer | ||
Date January 8, 2015 | ||
| * | Print the name and title of each signing officer under his or her signature. |