UNITED STATES
SECURITIES AND EXCHANGE COMMISSION
Washington, D.C. 20549
FORM N-CSR
CERTIFIED SHAREHOLDER REPORT OF REGISTERED
MANAGEMENT INVESTMENT COMPANIES
Investment Company Act file number 811-4840
The Tocqueville Trust
(Exact name of registrant as specified in charter)
The Tocqueville Trust
40 W. 57th St., 19th Floor
New York, NY 10019
(Address of principal executive offices) (Zip code)
Robert W. Kleinschmidt
The Tocqueville Trust
40 W. 57th St., 19th Floor
New York, NY 10019
(Name and address of agent for service)
(212) 698-0800
Registrant’s telephone number, including area code
Date of fiscal year end: October 31
Date of reporting period: October 31, 2012
Item 1. Reports to Stockholders.
ANNUAL REPORT
October 31, 2012
The Tocqueville Trust
Mutual Funds
The Tocqueville Fund
The Tocqueville Opportunity Fund
The Tocqueville International Value Fund
The Tocqueville Gold Fund
The Delafield Fund
The Tocqueville Select Fund

This report is not authorized for distribution to prospective investors unless preceded or accompanied by a currently effective prospectus of The Tocqueville Trust. Please call 1-800-697-FUND (3863) for a free prospectus. Read it carefully before you invest.
You are invited to visit our website @ www.tocqueville.com/mutual-funds
Dear Fellow Shareholder,
From an investment perspective, the declines of global stock markets in 2007-2009 were a watershed event. This is not so much because the declines were so deep or so protracted, but because they discredited most historically-successful investment disciplines. That short-term traders or momentum followers got caught in the big reversal was not a novel surprise. The real shock was that some of the best value investors, including some iconic ones, who typically resisted bear markets better than the majority of participants, also got caught in the downward spiral.
As bottom-up investors, our view had always been that our time is better spent on the analysis of company-specific fundamentals and valuations than on trying to forecast macro-economic or “market” developments. In retrospect, however, no strategy or discipline would have been better, going into that bear market, than staying out of the markets altogether. That lesson was learned by many market participants and was reinforced during the subsequent recoveries by a compression of valuations and a tendency by most equity investments to move more or less in unison. Avoidance of macro or market risk became the accepted wisdom.
To cap this trend, several studies and articles proclaimed something like the famous magazine cover on the eve of the preceding, long boom—the “death of equities”. Going further, other sources suggested, like CNBC, that: “the days of stock picking may be coming to an end”.
These are normal human reactions, but probably misguided.
There have been great global traumas, even in recent history. But seldom has the world been faced with a broader set of uncertainties—political (regional wars and uprisings everywhere; even tensions between major powers such as China and Japan); economic (global, seemingly irrepressible sea of debt; the threat of implosion of a major economic bloc such as Europe; a tricky change of economic locomotives in Asia); even a climatic threat to the planet (global warming; famine-threatening droughts).
To some degree, global stock markets have reflected these uncertainties for some time and, from a purely contrarian point of view, it would be time to try and adopt a more optimistic tack. The principal remaining problem is that, historically, company valuations in the stock markets have become much more reasonable than in 2007, for example, but not as deeply undervalued as they have been on the eves of past, secular bull markets.
One safe assumption, however, is that we have not seen the end of stock picking, for this is the nature of both human and crowd psychology, and the very essence of stock market investing. At Tocqueville, we will refrain from assuming that the most recent bear market reflects a new paradigm, a “new normal”, and, instead, intensify our search for individual stock opportunities.
Respectfully,

François Sicart
Chairman
| Annual Report | 1 |
The Tocqueville Fund
Dear Fellow Shareholder,
Your Fund finished its fiscal year on October 31, 2012, just days before the voters spoke and returned the President and most of the Congress back to Washington for another two, four or six years, depending upon the office. So, notwithstanding all the talk about a dysfunctional government during the campaign, it appears that voters, in the aggregate, prefer divided government. The Founders of the U.S., who constructed a government full of checks and balances, meant to move slowly and to prevent abuses, would be proud. (So would Alexis de Tocqueville, our namesake, who worried about the tyranny of majorities). From an investment point of view, the return of the partisan combatants seems to have sparked the realization among the politicians that compromise, that dirty word, is a necessary component of governing. (Who knew?) This could well prove to be the best of all possible outcomes. Politics is, after all, the art of the possible, and what is possible when you have divided government and strongly held and conflicting points of view on both sides, is compromise. Investors would greet such a compromise favorably, in our view, if only for the temporary elimination of uncertainty, and this could well set the stage for a better tone in the markets next year. We live in hope.
This year, the markets enjoyed a modest rally, but it was not one that generated much enthusiasm. The S&P 500 gained 15.21% while your Fund recorded a 10.08% gain. (The Dow Jones Index was up 12.56% in the same twelve month period). The underperformance of the Fund relative to the S&P 500 was due to several factors, most significantly the absence of Apple in our holdings. Apple is such a large component in the indices and performed so remarkably well that it had an outsized impact on the Standard and Poor index. (Apple isn’t in the Dow). Why didn’t we own Apple? On the metrics we favor, it was certainly cheap enough to own, but we were troubled by the universal enthusiasm for the company and its products and feared that there was no room for disappointments, notwithstanding the valuation. (In fact, some of our caution was rewarded late in the fiscal year as the stock sold off rather sharply with some disappointment in its latest phone and tablet offerings, and, taking advantage of the sell-off, early in the new fiscal year we initiated a small position). The next largest driver of the underperformance was our positioning in the materials sector, specifically Newmont Mining and Cliffs Natural Resources. As a gold producer, Newmont is leveraged to the price of the underlying metal (of which we maintain a favorable long-term view) and the shares are inexpensive on traditional value metrics; however, its price has lagged as production problems, higher energy costs and fears of increased regional taxes weighed on sentiment. Cliffs Natural Resources, which we had trimmed at significantly higher prices, was also a significant detractor as recessionary concerns, particularly in China, impacted demand for iron ore and metallurgical coal even as we continue to believe this major domestic resource has strategic value well in excess of its fiscal year end price.
On a positive note, it is worth mentioning the contribution we had from the financial sector. This is an area in which we are typically underweight because we have had a hard time making a long-term investment case for large, money center, “too big to fail” banks. While we acknowledge there have been trading opportunities in names like Goldman Sachs, Citibank, J.P. Morgan, Bank of America, et al, we believe these institutions have been transformed into quasi- government entities or highly regulated utilities, taking orders from politicians rather than shareholders. Given the tight but uncertain regulations that Dodd-Frank imposes upon them, and the political interference of grandstanding politicians, traditional financial analysis on which we base our investment criteria is not very helpful; so we have chosen to avoid them altogether. Rather, we have focused our attention on more transparent ways to invest in the recovery of credit and housing markets such as transaction processors, title insurers, financial advisors and timber REITs. Still the banks are large companies and when they rally, as they have somewhat this year, they can have an outsized impact on market averages. So be it; we prefer to invest in what we can understand.
That the markets could rally at all, what with the cross currents of negative news out of Europe, slowing Chinese growth and the looming prospect of the fiscal cliff, all combined with the uncertainty of the U.S. elections, is something of a minor miracle and a testament to the underlying resiliency of the American economy. It is also due, in no small part, to the ministrations of the Federal Reserve, combined with fortuitously low inflation rates and concomitant interest rates. How long these happy circumstances can persist is anybody’s guess. Ours is “not very long.” But the markets are not priced as if the current level of interest rates will last forever, so we do not expect an immediate sell-off once interest and inflation rates do begin their inevitable and inexorable climb, perhaps as early as the next fiscal year.
| 2 | October 31, 2012 |
No comment on the markets would be complete without referring to the remarkable rebirth of the oil and gas industry in the United States, despite, it seems at times, the best efforts of the federal and some state governments to stifle it. After billions in government subsidies to promote “alternative” energy fantasies, with little to show for it, it is the traditional energy industry which has come roaring back, so much so that recent estimates put the U.S. as the largest oil and gas producer in the world in the not too distant future. If true, the salutary impact on the U.S. economy, as well as on the geopolitical environment, can scarcely be over-emphasized. Notwithstanding all the problems the country faces with the combination of an enormous federal debt and deficit, and an entitlement system not built for the realities of today’s demographics, the outlook for the domestic economy is considerably enhanced by this revolution in energy production. While staying within our discipline, we have taken several positions that seek to take advantage of our home grown energy resurgence.
Regardless of what the markets may or may not do, we continue to believe that high quality common stocks represent good value and the best way to preserve wealth for the long term in an uncertain world. Our proprietary research continues to uncover overlooked, unloved and undervalued stocks across the capitalization spectrum, and we will continue to buy and own these names so long as they remain at a discount to their intrinsic value. This is a strategy that has served us well over the years. As ever, we thank you for your interest and support.
Respectfully,

Robert W. Kleinschmidt
Portfolio Manager
| Annual Report | 3 |
The Tocqueville Fund
(Unaudited)
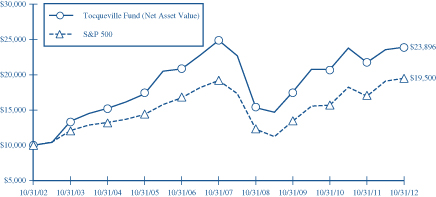
This chart assumes an initial gross investment of $10,000 made on 10/31/02. Returns shown do not reflect the deduction of taxes that a shareholder would pay on fund distributions or the redemption of fund shares. Performance reflects fee waivers in effect. In the absence of fee waivers, total return would be reduced. Returns shown include the reinvestment of all dividends and other distributions. Past performance is not predictive of future performance. Investment return and principal value will fluctuate so that your shares, when redeemed, may be worth more or less than their original cost. The Fund imposes a 2% redemption fee on shares held for 90 days or less.
The Standard & Poor’s 500 Stock Index (S&P 500) is a capital-weighted index, representing the aggregate market value of the common equity of 500 stocks primarily traded on the New York Stock Exchange. Returns assume the reinvestment of all dividends.
AVERAGE ANNUAL RATE OF RETURN (%)
FOR PERIODS ENDED OCTOBER 31, 2012
| 1 Year | 3 Year | 5 Year | 10 Year | |||||||||||||
Tocqueville Fund | 10.08% | 10.80% | -0.79% | 9.10% | ||||||||||||
Standard & Poor’s 500 Stock Index | 15.21% | 13.21% | 0.36% | 6.91% | ||||||||||||
| 4 | October 31, 2012 |
The Tocqueville Opportunity Fund
Dear Fellow Shareholder,
We are pleased to provide this review of the Opportunity Fund’s performance for the fiscal year ended October 31, 2012. While the Fund and major indices provided positive returns over the past twelve months, performance was less favorable for small and mid-capitalization issues and growth stocks in particular. The trend favoring value and large capitalization issues persisted throughout the period, but there was a distinct bias away from the small growth asset class during the past six months—macro risk dominated investor concerns and included the ongoing issues with the European Union, U.S. political uncertainty in front of the Presidential election, and the threat of a U.S. recession upon the expiration of current fiscal stimulus at the end of 2012. For the fiscal period, the Fund returned 5.35% versus the Russell 2500 Growth Index return of 10.08%. While the Fund solidly outperformed its benchmark during the first half of the fiscal year, selling off many of the Fund’s over weighted winners intensified during the post-Labor Day period through the end of October. Despite a majority of these companies having exceeded earnings expectations, muted corporate earnings guidance for the remainder of 2012 and the first half of 2013 appears to be providing an incentive for short-term oriented traders to sell in order to lock in profits. Moreover a dimming economic view framed by political uncertainty and a potential recession, may push investors concerned with a potential increase in the capital gains tax rate in 2013 to sell early.
Rapid fire rotations and profit taking have impacted several of the Fund’s larger holdings, which had performed excellently including Apple, Tractor Supply, priceline.com, LinkedIn and Hain Celestial. All reported positive earnings surprises during the last fiscal quarter and we are confident that all continue to be superbly positioned. The Fund’s biotechnology investments are perhaps the best example of the increased volatility of stock performance over the past several months—after having led all industry sectors over the first nine months of the fiscal year in relative and absolute returns, biotechnology was the worst performing group over the last three months of the fiscal year—despite terrific sales outlooks and new therapeutic approvals, shorter term oriented investors raced to sell ahead of the election, higher tax rates and each other!
The technology, consumer discretionary and healthcare sectors comprised the Fund’s dominant investment allocations at the fiscal year end—23.0%, 21.4%, and 19.2% respectively. Over the past year the commitment to the healthcare sector has increased markedly through appreciation of existing holdings and new investments. Four of the Fund’s top 5 performers for the year were biotech issues, including: Pharamasset, Alnylam Pharmaceuticals, Pharmacyclics, and Onyx Pharmaceuticals. The healthcare and financial services sectors provided the lead contributions to absolute returns over the past fiscal year. We increased investments in financials significantly. Several of the Fund’s technology holdings were among the top 10 performers including Equinix, Ultimate Software, Netsuite, and Cirrus Logic, which was the top performer for the fiscal year. Technology takeovers included: Kenexa (IBM), Success Factors (SAP), and Taleo (Oracle). We reduced investments in energy to less than 5% of the Fund. While energy investments provided a slight positive relative performance during the year, the overall energy sector return was negative and the worst performing sector for both the Fund and the benchmark. Oil prices would certainly benefit from increased risk to supply due to increased tensions in the Middle East, but absent this cyclical, geopolitical risk we see little reason to increase exposure.
New names among the top 10 included LinkedIn, salesforce.com, Portfolio Recovery Associates, Hain Celestial, Pharmacyclics and Fresh Market. The top 10 and top 25 holdings comprised 16.3% and 31.2% respectively of the Fund versus 17.8% and 34.0% a year ago—the Fund continues to be well diversified. At the beginning of the year, Facebook had been a top holding. Facebook was among the top 5 relative performers in the first half of the fiscal year, but was the third worst in the second half. Among one of the more controversial IPO’s in memory, Facebook delivered surprisingly strong growth in revenues and key metrics this past quarter—we continue to believe that Facebook is developing a dominant internet business with a massive daily audience. Over the past fiscal year, 11 of the Fund’s holdings were takeover targets; during the second half Medicis Pharmaceuticals, Peet’s Coffee and Tea, Robbins and Myers and Kenexa were sold as a result of takeover offers.
| Annual Report | 5 |
We believe it is important to emphasize that our fundamental approach is primarily oriented to identify and to invest in long-term investments in leading companies which are positioned to continue to innovate successfully, to gain market share in expanding markets, and to sustain competitive advantage and high returns on investment. We have been surprised by intense recent price volatility in many of our holdings, but we are confident that our investment principles will deliver competitive returns over the long run. While we do not subscribe to the tax tail wagging the dog maxim with regard to a focus on after-tax returns, our objective of investing in high return and high reinvestment companies is by consequence an investment approach with a longer time horizon than many of today’s prevailing market participants. Over a long investment career, there have been plenty of difficult markets but time has provided a perspective on the irrational behavior which grips investors at peaks of elation and the depths of despair. We expect there is a very high probability that companies will take advantage of their strong balance sheets and low prices to announce increased stock repurchases and/or to provide special dividends.
We appreciate your ongoing confidence in our efforts on behalf of the Opportunity Fund.
Sincerely,

Thomas R. Vandeventer
Portfolio Manager
| 6 | October 31, 2012 |
The Tocqueville Opportunity Fund
(Unaudited)
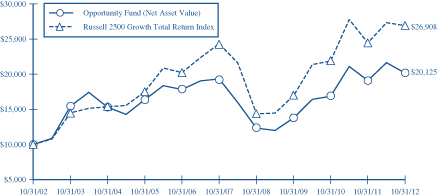
This chart assumes an initial gross investment of $10,000 made on 10/31/02. Returns shown do not reflect the deduction of taxes that a shareholder would pay on fund distributions or the redemption of fund shares. Performance reflects fee waivers in effect. In the absence of fee waivers, total return would be reduced. Returns shown include the reinvestment of all dividends and other distributions. Past performance is not predictive of future performance. Investment return and principal value will fluctuate so that your shares, when redeemed, may be worth more or less than their original cost. The Fund imposes a 2% redemption fee on shares held for 90 days or less.
The Russell 2500 Growth Total Return Index is an unmanaged index that measures the performance of the small to mid-cap growth segment of the U.S. equity universe. It includes those Russell 2500 companies with higher price-to-book ratios and higher forcasted growth values. Returns assume the reinvestment of all dividends.
AVERAGE ANNUAL RATE OF RETURN (%)
FOR PERIODS ENDED OCTOBER 31, 2012
| 1 Year | 3 Year | 5 Year | 10 Year | |||||||||||||
Tocqueville Opportunity Fund | 5.35% | 13.53% | 0.85% | 7.24% | ||||||||||||
Russell 2500 Growth Total Return Index | 10.08% | 16.62% | 2.04% | 10.40% | ||||||||||||
| Annual Report | 7 |
The Tocqueville International Value Fund
Dear Fellow Shareholder,
For the fiscal year ended October 31, 2012, the Tocqueville International Value Fund’s total U.S. dollar return was a loss of 1.60%. In the same period, the Morgan Stanley EAFE Index, the index against which we are most often compared, had a total U.S. dollar gain of 5.15%. For the 10 year period ended October 31, 2012, the Tocqueville International Value Fund’s cumulative total U.S. dollar return was 174.4%. In the same period, the Morgan Stanley EAFE Index had a total U.S. dollar return of 120.17%.
During the fiscal year, global equity markets were driven to an unusually large extent by macroeconomic forces and changes in Central Bank policy. Equity markets advanced early in the period as the European Central Bank’s Long Term Refinancing Operations (“LTRO”) reduced credit spreads and created a false sense of security regarding Europe’s debt crisis. Then in April markets declined as the palliative of Europe’s LTRO program wore off and investors focused once more on the deterioration of bank and government finances in Europe, the possibility of a sharp slowdown in China, and the prospect of a fiscal cliff in the U.S. Markets recovered beginning in July after the ECB stated its determination to recapitalize Europe’s faltering banks and move toward fiscal integration and a common banking system, and the U.S. Fed promised to maintain low interest rates until unemployment comes down.
Over the course of the fiscal year, on a total return basis the European BE 500 Index increased by 14.1% in local currency terms, the Japanese Nikkei 225 Index increased by 1.4% in local currency terms, and the MSCI Asia Pacific ex- Japan Index increased by 4.3%. The Euro declined against the U.S. dollar as shaky bank and sovereign finances undercut confidence in the currency, and the Yen remained at historically high levels in U.S. dollar terms. Among equity sectors, gains were dominated by traditionally defensive groups like tobacco products, health care and food and beverage, as well as financials, while steel, energy, telecom and utilities performed poorly.
Due to the bottom up nature of our investment approach, which has served us well for many years, there may be times when our performance is out of step with the overall market. This fiscal year was clearly one of those times. Gains in the developed international markets were concentrated in mega cap consumer stocks and in financials, both areas where we are underrepresented by virtue of our contrarian value investment discipline. The consumer stocks, which were fairly valued at the outset of the period in our judgment, were revalued upward by investors placing a premium on certainty of cash flows and high dividend yields. The financials did represent a sector that might appeal to a contrarian and eventually the stocks recovered from valuation levels that reflected some probability of a banking system meltdown as the ECB and other central banks took actions to calm investor nerves. However, financial institutions are by their nature structurally leveraged and operate opaque business models and, in the current circumstances, depend on some measure of government largesse. For these reasons, they generally do not meet our standards regarding margin of safety for our investors. On the other hand, our investment process led us to industrial and materials companies, where we have a large weighting, and smaller capitalization companies, that were overlooked or revalued downward despite cheap valuations and attractive long-term business fundamentals. With time, fundamentals are normally recognized by the market, value realized, and our positioning rewarded.
Significant contributors to the Fund’s profits during the year included: French logistics-focused holding company Bollore, Australian business services concern Spotless Group, subject of a takeover offer, Hong Kong broadcast television concern Television Broadcasts, UK auto parts retailer Halfords Group, French pharmaceutical concern Sanofi, Dutch lighting and healthcare conglomerate Philips, and Japanese performance athletic shoe maker Asics. We had meaningful losses in the shares of Japanese exporting companies, including precision equipment concern Canon and auto parts maker Takata, that declined due to Yen strength and related investor concerns regarding the competitiveness and profitability of their businesses. We believe these stocks represent some of the most compelling values in our portfolio today. We also had losses in certain economically sensitive names in Europe, including German steel distributor Kloeckner, Italian auto parts maker Sogefi, and French wire and cable producer Nexans.
During the fiscal year, we exited positions in UK credit scoring concern Experian, Mexican beverage producer FEMSA, Italian hydraulic equipment maker Interpump, and UK business and construction services concern Interserve,
| 8 | October 31, 2012 |
which, following strong performance, approached our estimates of intrinsic value. We tendered our shares of Spotless Group into the takeover offer, the terms of which we considered to be adequate. We sold French integrated oil producer Total after a gas leak in the North Sea created an unquantifiable liability for the company. We also sold Mobistar, where our investment thesis was undercut by a change in competitive conditions that had a negative impact on pricing and profit margins, French drug maker Ipsen, where management failed to meet certain of its execution milestones, and Spanish IT services provider Indra Sistemas, where weakening payment terms from government customers undercut our thesis regarding free cash generation. We took new positions in French television broadcaster M6, which generates a double digit free cash flow yield in a tepid economic environment; in drug maker Novartis, which has a high free cash yield based on its existing pharma portfolio and where we were not paying much for an attractive pipeline of new products and the eyecare franchise; in German chipmaker Infineon, which has a market leading position in analog chips for power management and auto applications and trades at a mid-single digit multiple of mid-cycle cash flow; in Hong Kong real estate and investment conglomerate Guoco Group, which in our judgment trades at a 50% discount to its net asset value; and in Japanese company Disco, the global leader in chip dicing and wafer grinding equipment and related consumables which was depressed due to worries about the global IT cycle. We also added to several existing positions when prices were under pressure, including Siemens, Halfords Group, Groupe Bruxelles Lambert, Statoil, Hoya, Takata and SMC.
The macro backdrop contains much uncertainty. While Europe has articulated a reasonable prescription to address its banking and fiscal issues, implementation is subject to political forces. Further, while the plan may address the problem in financial markets, Europe still needs structural reform in labor markets and entitlements in order to improve its growth potential. Also, the U.S. is drawing nearer to the so-called fiscal cliff, which, if allowed to occur, will have a negative impact on growth in the U.S. On a more positive note, China’s economy, which slowed predictably during this year of political transition, appears to be firming. Too, Japan’s government has called for elections that are likely to result in growth oriented economic policies. All that being said, as part of our discipline, when we analyze and value companies and evaluate opportunity and risk in individual stocks, we do so on the basis of conservative macro assumptions.
We continue to employ our investment discipline, seeking to discover fundamentally attractive companies that are out of favor and undervalued, and to provide our shareholders with above average returns with below average risk over the course of an economic cycle.
Respectfully,
 |
James Hunt |
| Portfolio Manager |
| Annual Report | 9 |
The Tocqueville International Value Fund
(Unaudited)
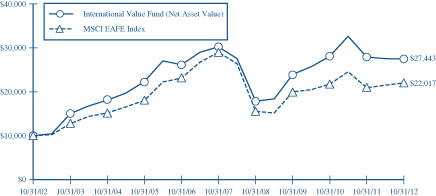
This chart assumes an initial gross investment of $10,000 made on 10/31/02. Returns shown do not reflect the deduction of taxes that a shareholder would pay on fund distributions or the redemption of fund shares. Performance reflects fee waivers in effect. In the absence of fee waivers, total return would be reduced. Returns shown include the reinvestment of all dividends and other distributions. Past performance is not predictive of future performance. Investment return and principal value will fluctuate so that your shares, when redeemed, may be worth more or less than their original cost. The Fund imposes a 2% redemption fee on shares held 90 days or less.
The MSCI EAFE Index is an unmanaged market-capitalization-weighted index composed of companies representative of the market structure of 20 Developed Market Countries in Europe, Australia, Asia and the Far East.
AVERAGE ANNUAL RATE OF RETURN (%)
FOR PERIODS ENDED OCTOBER 31, 2012
| 1 Year | 3 Year | 5 Year | 10 Year | |||||||||||||
Tocqueville International Value Fund | -1.60% | 4.63% | -1.90% | 10.62% | ||||||||||||
MSCI EAFE Index | 5.15% | 3.31% | -5.35% | 8.21% | ||||||||||||
| 10 | October 31, 2012 |
The Tocqueville Gold Fund
Dear Fellow Shareholder,
The past year was one of consolidation in the gold price as well as mining shares, following the run up to historic highs in the bullion price in August of 2011. Over the past fiscal year, the Tocqueville Gold Fund returned -9.53% vs. -4.84% for the Philadelphia Stock Exchange Gold and Silver Index benchmark and 15.21% for the S&P 500.
The gold price spent most of the year consolidating its 2011 run up to the all-time high of $1921/oz. The 2011 run up was driven by investor worries about a credit downgrade of the U.S. as well as a possible shutdown of the U.S. government because of the deadlock over raising the ceiling on the national debt. Those fears receded with the last minute compromise over tax and fiscal issues. However, those same issues remain unresolved and a replay of last year’s drama still seems to be in the cards as 2012 comes to a close. The ongoing euro zone currency crisis has also heightened investor worries as to the safety of paper currency. The prospect of widespread monetary debasement seems stronger today than in August of 2011, and for this reason, we believe that the bull market in gold is far from over.
The corrective action of the past twelve months has, in our opinion, served to stabilize an overbought market and to create sufficient doubt in the minds of investors as to validity of the investment rationale for gold and precious metals. We believe that all of this, while frustrating, is a necessary precursor for a dynamic move higher in the entire sector.
Gold mining shares remain exceptionally cheap in our opinion. Our XAU benchmark traded at 9% of the spot gold price in May of 2012, approximately the same level as October 2008, which was followed by a rally of 155% in the subsequent twelve months. Gold shares have rallied relative to the bullion price since the low of 141 (XAU) in mid-2012 with a rise of 34% through the end of our fiscal year vs. a rise of 13% in the gold price.
Market sentiment on mining stocks relative to physical gold appears to be at a negative extreme comparable to the low of 2008. We believe that the negative issues raised by skeptics such as rising costs of mining, political risk, competition from ETFs, and poor capital allocation decisions by senior management are well known and already discounted in the current low valuations of mining stocks. This negative view will change, in our opinion, should gold trade at new highs over the coming twelve months. From a contrarian and from a valuation point of view, we believe gold mining stocks are poised to outperform the metal in the coming year. Should the bull market in gold resume in earnest, as we expect, gold and silver mining equities are well positioned to deliver satisfactory returns.
Our investment approach remains consistent with our practice of the past ten years. We have a strong research group consisting of five full time research professionals committed to extensive due diligence on all aspects of the business of mining for gold and silver. This includes extensive travel to remote locations to visit mine sites, local mine management, and in many cases, officials of host countries in order to assess political risk. Our low turnover is based on the idea that in order to capture value in excess of whatever return is provided by the gold price, we must identify those companies which in turn understand how best to create shareholder value through exploration for new ore bodies, and developing those assets through mine building activity into cash generators.
For the fiscal year, the top contributors to the Fund over this period included Franco-Nevada, Yamana Gold, and Primero Mining which appreciated 46.6%, 36.9%, and 163.4% respectively. Notable among these was the performance by Primero Mining, which received a favorable tax ruling. The Fund also had its fair share of disappointments, which included Turquoise Hill, International Tower Hill, and Alacer Gold which declined by 58.0%, 52.0% and 52.6% respectively. We continue to view these holdings as companies which fit well with our aforementioned investment approach.
Thank you for your continued support.
Sincerely,
 |  | |
| John C. Hathaway | Douglas B. Groh | |
| Portfolio Manager | Portfolio Manager | |
| Annual Report | 11 |
The Tocqueville Gold Fund
(Unaudited)
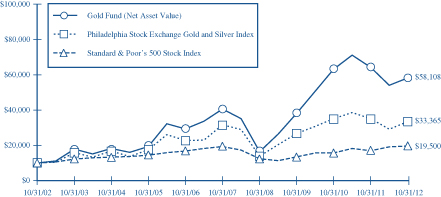
This chart assumes an initial gross investment of $10,000 made on 10/31/02. Returns shown do not reflect the deduction of taxes that a shareholder would pay on fund distributions or the redemption of fund shares. Performance reflects fee waivers in effect. In the absence of fee waivers, total return would be reduced. Returns shown include the reinvestment of all dividends and other distributions. Past performance is not predictive of future performance. Investment return and principal value will fluctuate so that your shares, when redeemed, may be worth more or less than their original cost. The Fund imposes a 2% redemption fee on shares held 90 days or less.
In 2003, 2006, 2009, and 2010 the performance of The Tocqueville Gold Fund was achieved during a period of unusually favorable market conditions. Such performance may not be sustainable.
The Philadelphia Stock Exchange Gold and Silver Index is an unmanaged capitalization-weighted index which includes the leading companies involved in the mining of gold and silver. Returns include the reinvestment of all dividends.
The Standard & Poor’s 500 Stock Index (S&P 500) is a capital-weighted index, representing the aggregate market value of the common equity of 500 stocks primarily traded on the New York Stock Exchange. Returns include the reinvestment of all dividends.
AVERAGE ANNUAL RATE OF RETURN (%)
FOR PERIODS ENDED OCTOBER 31, 2012
| 1 Year | 3 Year | 5 Year | 10 Year | |||||||||||||
Tocqueville Gold Fund | -9.53% | 15.03% | 7.46% | 19.24% | ||||||||||||
Philadelphia Stock Exchange Gold and Silver Index | -4.84% | 7.72% | 1.15% | 12.79% | ||||||||||||
Standard & Poor’s 500 Stock Index | 15.21% | 13.21% | 0.36% | 6.91% | ||||||||||||
| 12 | October 31, 2012 |
The Delafield Fund
Dear Fellow Shareholder,
For the twelve months ended October 31, 2012, the Fund returned 10.96%. This compares to a 15.21% increase in the Standard & Poor’s 500 Index (“S&P 500”) and an increase of 12.08% for the more representative Russell 2000 Index (“Russell 2000”), both on a total return basis. The Fund’s net asset value as of October 31, 2012 was $29.79 per share. The net asset value amounted to $1,346,273,436, of which 79.5% was invested in equities and the balance held in cash reserves.
Fiscal 2012, much like the prior fiscal year, was a tale of two halves. Equities experienced a strong recovery for almost the entire first half of the fiscal year. Investors responded enthusiastically to modest improvement in U.S. economic indicators and to solid corporate earnings. A pause in negative Eurozone related headlines during this period also seemed to calm investors’ nerves and helped drive the market’s upturn. Through the first six months of the fiscal year ending April 30, 2012, the Fund was up 16.25% versus total returns of 12.77% and 11.02% for the S&P 500 and Russell 2000, respectively.
In the second half of the fiscal year, investors took a decidedly less optimistic view of the domestic political and economic landscape, including the persistently high unemployment rate and the outcome of the Presidential election. The rapid approach of the January 2013 “fiscal cliff” and the possible repercussions also became more in focus. Outside the U.S., Europe continued to suffer, Chinese economic growth further decelerated, and rising nationalism and mounting religious intolerance contributed to global unease. The Fund declined 4.55% during the final six months of the fiscal year, while the S&P 500 managed a 2.16% gain and the Russell 2000 increased 0.95%, both on a total return basis.
While stock selection was generally favorable to our performance this year, several of our holdings experienced outsized declines on weak financial results, particularly in the information technology sector. In contrast, our consumer discretionary and energy holdings exhibited very strong performance during the year, but owing to their modest aggregate position size in the portfolio, they made only a small contribution. Our heavy exposure to the industrials and materials sectors benefited our return for the year as a whole, but negatively impacted our second half performance due to their more cyclical nature. Our large cash position was also a negative factor with respect to our performance, although we remain content to use the cash reserves as a hedge against volatility and as “dry powder” to allow us to seize upon attractive investment opportunities as we uncover them.
Eastman Chemical Company was the largest contributor to our performance during the year, with the shares showing steady gains on strong earnings and the smooth integration of the Solutia acquisition. In contrast, Checkpoint Systems, Inc. and Acco Brands Corp. were the largest detractors, negatively impacting our return by nearly 200 basis points in total. Both stocks fell on the heels of disappointing earnings.
We believe that our portfolio is generally composed of companies where managements are taking actions to position their businesses for a bright long-term future which could allow them to outperform expectations in a difficult environment. Additionally, virtually all of our holdings exhibit substantial free cash flow and strong or improving balance sheets. Due to the company specific nature of our investment approach, our performance is not likely to correlate closely to any of the market indices, nor can we control the volatility of market prices, which can sometimes gyrate significantly. However, we continue to expect that over time, the market will accurately reflect the true value of a business. Therefore, our focus remains on employing our long-standing strategy to protect your capital and to enhance its growth.
Sincerely,
 |  | |
| J. Dennis Delafield | Vincent Sellecchia | |
| Portfolio Manager | Portfolio Manager | |
| Annual Report | 13 |
The Delafield Fund
(Unaudited)

This chart assumes an initial gross investment of $10,000 made on 10/31/02. Since the Delafield Fund did not commence operations until 9/28/09, returns prior to that date are those of the Predecessor Fund. The Delafield Fund assumed the net asset value and performance history of the Predecessor Fund (See Footnote 1 to the Financial Statements). Returns shown does not reflect the deduction of taxes that a shareholder would pay on fund distributions or the redemption of fund shares. Performance reflects fee wiaviers in effect. In the absence of fee waivers, total return would be reduced. Returns shown include the reinvestment of all dividends and other distributions. Past performance is not predictive of future performance. Investment return and principal value will fluctuate so that your shares, when redeemed, may be worth more or less than their original cost. The Fund imposes a 2% redemption fee on shares held 90 days or less.
The Standard & Poor’s 500 Stock Index (S&P 500) is a capital-weighted index, representing the aggregate market value of the common equity of 500 stocks primarily traded on the New York Stock Exchange. Returns include the reinvestment of all dividends.
The Russell 2000 Total Return Index is an unmanaged index that measures the performance of the 2,000 smallest companies in the Russell 3000 Index, which represent approximately 8% of the total market capitalization of the Russell 3000 Index. Returns include the reinvestment of all dividends.
AVERAGE ANNUAL RATE OF RETURN (%)
FOR PERIODS ENDED OCTOBER 31, 2012
| 1 Year | 3 Year | 5 Year | 10 Year | |||||||||||||
The Delafield Fund | 10.96% | 12.28% | 3.61% | 11.67% | ||||||||||||
Standard & Poor’s 500 Stock Index | 15.21% | 13.21% | 0.36% | 6.91% | ||||||||||||
Russell 2000 Total Return Index | 12.08% | 14.82% | 1.19% | 9.58% | ||||||||||||
| 14 | October 31, 2012 |
The Tocqueville Select Fund
Dear Fellow Shareholder,
For the twelve months ended October 31, 2012, the Fund returned 3.66% versus an increase of 13.00% for the Russell 2500 Index (“Russell 2500”) and 12.08% for the Russell 2000 Index (“Russell 2000”), each on a total return basis. The Fund’s net asset value as of October 31, 2012 was $11.35 per share. The net asset value amounted to $84,548,513, of which 89.3% was invested in equities and the balance held in cash reserves.
Fiscal 2012, much like the prior fiscal year, was a tale of two halves. Equities experienced a strong recovery for almost the entire first half of the fiscal year. Investors responded enthusiastically to modest improvement in U.S. economic indicators and to solid corporate earnings. A pause in negative Eurozone related headlines during this period also seemed to calm investors’ nerves and helped drive the market’s upturn. Through the first six months of the fiscal year ending April 30, 2012, the Fund was up 10.60% versus total returns of 12.03% and 11.02% for the Russell 2500 and Russell 2000, respectively.
In the second half of the fiscal year, investors took a decidedly less optimistic view of the domestic political and economic landscape, including the persistently high unemployment rate and the outcome of the Presidential election. The rapid approach of the January 2013 “fiscal cliff” and the possible repercussions also became more in focus. Outside the U.S., Europe continued to suffer, Chinese economic growth further decelerated, and rising nationalism and mounting religious intolerance contributed to global unease. The Fund declined 6.28% during the final six months of the fiscal year, while the Russell 2500 gained 0.87% and the Russell 2000 increased 0.95%, both on a total return basis.
Our performance during the year, particularly in the second half, was disappointing. Several of our investments suffered outsized declines, and owing to the relatively concentrated nature of the Fund, their impact on total performance was magnified. Summer Infant, Inc. was the most substantial detractor to our performance, representing about 400 basis points of negative return. During the year, the company struggled with issues related to its cost structure, an overly promotional sales environment and undisciplined pricing. We continue to own the stock because we believe that management will successfully navigate the company through these challenges and that the current valuation does not adequately reflect the potential operating margin and earnings power of the business. Our holdings in Checkpoint Systems, Inc. and Ferro Corporation were also substantial drags on our performance, negatively impacting our return by nearly 250 basis points in total. Both stocks fell on the heels of disappointing earnings, and we have exited our position in Ferro. In contrast, our heavy exposure to the industrials and materials sectors benefited our return for the year. Our position in Solutia Inc. was particularly beneficial, with the shares contributing nearly 200 basis points to performance after the announcement of a deal to be acquired by Eastman Chemical Company.
Despite our challenging 2012, we continue to believe that our portfolio is well positioned. In general, our investments have solid balance sheets, strong free cash flow and excellent management teams, which should position them to prosper over time.
Sincerely,
| ||||
| |  | ||
| J. Dennis Delafield | Vincent Sellecchia | Donald Wang | ||
| Portfolio Manager | Portfolio Manager | Portfolio Manager | ||
| Annual Report | 15 |
The Tocqueville Select Fund
(Unaudited)
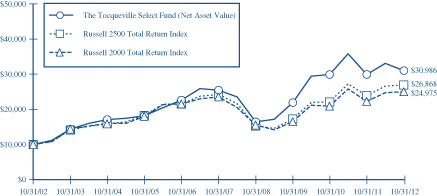
This chart assumes an initial gross investment of $10,000 made on 10/31/02. Since The Tocqueville Select Fund did not commence operations until 9/28/09, returns from the period from September 29, 2008 to September 27, 2009 are those of the Class Y Shares of the Predecessor Fund (See Footnote 1 to the Financial Statements). Prior to that period, returns shown are those of a limited partnership managed by the adviser. Returns shown do not reflect the deduction of taxes that a shareholder would pay on fund distributions or the redemption of fund shares. Performance reflects fee waivers in effect. In the absence of fee waivers, total return would be reduced. Returns shown include the reinvestment of all dividends and other distributions. Past performance is not predictive of future performance. Investment return and principal value will fluctuate so that your shares, when redeemed, may be worth more or less than their original cost. The Fund imposes a 2% redemption fee on shares held 90 days or less.
The Russel 2500 Total Return Index is an unmanaged index that measures the performance of the 2,500 smallest companies in the Russell 3000 Index. Returns include the reinvestment of all dividends.
The Russell 2000 Total Return Index is an unmanaged index that measures the performance of the 2,000 smallest companies in the Russell 3000 Index, which represents approximately 8% of the total market capitalization of the Russell 3000 Index. Returns include the reinvestment of all dividends.
AVERAGE ANNUAL RATE OF RETURN (%)
FOR PERIODS ENDED OCTOBER 31, 2012
| 1 Year | 3 Year | 5 Year | 10 Year | |||||||||||||
The Tocqueville Select Fund | 3.66% | 12.24% | 4.03% | 11.97% | ||||||||||||
Russell 2500 Total Return Index | 13.00% | 15.95% | 2.06% | 10.39% | ||||||||||||
Russell 2000 Total Return Index | 12.08% | 14.82% | 1.19% | 9.58% | ||||||||||||
| 16 | October 31, 2012 |
Expense Example—October 31, 2012 (Unaudited)
As a shareholder of The Tocqueville Trust (the “Funds”), you incur ongoing costs, including management fees; distribution fees; and other Fund expenses. This example is intended to help you understand your ongoing costs (in dollars) of investing in the Funds and to compare costs with the ongoing costs of investing in other mutual funds.
The Example is based on an investment of $1,000 invested at the beginning of the period and held the entire period (May 1, 2012-October 31, 2012).
Actual Expenses
The first line of the table below provides information about actual account values and actual expenses. You may use the information in this line, together with the amount you invested, to estimate the expenses that you paid over the period. Simply divide your account value by $1,000 (for example, an $8,600 account value divided by $1,000 = 8.6), then multiply the result by the number in the first line under the heading entitled “Expenses Paid During Period” to estimate the expenses you paid on your account during this period.
Hypothetical Example for Comparison Purposes
The second line of the table below provides information about hypothetical account values and hypothetical expenses based on the Funds’ actual expense ratios and an assumed rate of return of 5% per year before expenses, which is not the Funds’ actual return. The hypothetical account values and expenses may not be used to estimate the actual ending account balance or expenses you paid for the period. You may use this information to compare the ongoing costs of investing in the Funds and other funds. To do so, compare this 5% hypothetical example with the 5% hypothetical examples that appear in the shareholder reports of the other funds.
Please note that the expenses shown in the table are meant to highlight your ongoing costs only and do not reflect any transactional costs, such as sales charges (loads), redemption fees, or exchange fees. Therefore, the second line of the table is useful in comparing ongoing costs only, and will not help you determine the relative costs of owning different funds. In addition, if these transactional costs were included, your costs would have been higher.
| Annual Report | 17 |
Expense Example Tables (Unaudited)
| The Tocqueville Fund | Beginning Account Value May 1, 2012 | Ending Account Value October 31, 2012 | Expenses Paid During Period* May 1, 2012 - October 31, 2012 | |||||||||
Actual | $ | 1,000.00 | $ | 1,014.30 | $ | 6.33 | ||||||
Hypothetical (5% return before expenses) | 1,000.00 | 1,018.85 | 6.34 | |||||||||
| The Tocqueville Opportunity Fund | ||||||||||||
Actual | $ | 1,000.00 | $ | 929.80 | $ | 6.50 | ||||||
Hypothetical (5% return before expenses) | 1,000.00 | 1,018.40 | 6.80 | |||||||||
| The Tocqueville International Value Fund | ||||||||||||
Actual | $ | 1,000.00 | $ | 995.70 | $ | 7.88 | ||||||
Hypothetical (5% return before expenses) | 1,000.00 | 1,017.24 | 7.96 | |||||||||
| The Tocqueville Gold Fund | ||||||||||||
Actual | $ | 1,000.00 | $ | 1,075.80 | $ | 6.73 | ||||||
Hypothetical (5% return before expenses) | 1,000.00 | 1,018.65 | 6.55 | |||||||||
| The Delafield Fund | ||||||||||||
Actual | $ | 1,000.00 | $ | 954.50 | $ | 6.04 | ||||||
Hypothetical (5% return before expenses) | 1,000.00 | 1,018.95 | 6.24 | |||||||||
| The Tocqueville Select Fund | ||||||||||||
Actual | $ | 1,000.00 | $ | 937.20 | $ | 6.72 | ||||||
Hypothetical (5% return before expenses) | 1,000.00 | 1,018.20 | 7.00 | |||||||||
| * | Expenses are equal to the Fund’s annualized six-month expense ratio of 1.25%, 1.34%, 1.57%, 1.29%, 1.23% and 1.38% for The Tocqueville Fund, Opportunity Fund, International Value Fund, Gold Fund, Delafield Fund, and Select Fund, respectively, multiplied by the average account value over the period, multiplied by 184/366 to reflect the one-half year period. |
| 18 | October 31, 2012 |
The Tocqueville Fund
Financial Highlights
Per share operating performance (For a share outstanding throughout the year) | Years Ended October 31, | |||||||||||||||||||
| 2012 | 2011 | 2010 | 2009 | 2008 | ||||||||||||||||
Net asset value, beginning of year | $ | 22.23 | $ | 21.53 | $ | 18.47 | $ | 16.39 | $ | 28.93 | ||||||||||
|
|
|
|
|
|
|
|
|
| |||||||||||
Operations: | ||||||||||||||||||||
Net investment income (1) | 0.40 | 0.23 | 0.32 | 0.28 | 0.24 | |||||||||||||||
Net realized and unrealized gain (loss) | 1.81 | 0.80 | 2.97 | 2.09 | (10.56 | ) | ||||||||||||||
|
|
|
|
|
|
|
|
|
| |||||||||||
Total from investment operations (2) | 2.21 | 1.03 | 3.29 | 2.37 | (10.32 | ) | ||||||||||||||
|
|
|
|
|
|
|
|
|
| |||||||||||
Distributions to shareholders: | ||||||||||||||||||||
Dividends from net investment income | (0.33 | ) | (0.33 | ) | (0.23 | ) | (0.29 | ) | (0.19 | ) | ||||||||||
Distributions from net realized gains | — | — | — | — | (2.03 | ) | ||||||||||||||
|
|
|
|
|
|
|
|
|
| |||||||||||
Total distributions | (0.33 | ) | (0.33 | ) | (0.23 | ) | (0.29 | ) | (2.22 | ) | ||||||||||
|
|
|
|
|
|
|
|
|
| |||||||||||
Change in net asset value for the year | 1.88 | 0.70 | 3.06 | 2.08 | (12.54 | ) | ||||||||||||||
|
|
|
|
|
|
|
|
|
| |||||||||||
Net asset value, end of year | $ | 24.11 | $ | 22.23 | $ | 21.53 | $ | 18.47 | $ | 16.39 | ||||||||||
|
|
|
|
|
|
|
|
|
| |||||||||||
Total Return | 10.1 | % | 4.8 | % | 18.0 | % | 14.8 | % | (38.5 | )% | ||||||||||
Ratios/supplemental data | ||||||||||||||||||||
Net assets, end of year (000) | $ | 366,025 | $ | 491,541 | $ | 489,670 | $ | 383,470 | $ | 328,609 | ||||||||||
Ratio to average net assets: | ||||||||||||||||||||
Expense (3) | 1.26 | %(4) | 1.25 | % | 1.25 | % | 1.25 | % | 1.25 | % | ||||||||||
Net investment income (3) | 1.33 | % | 0.98 | % | 1.66 | % | 1.68 | % | 0.94 | % | ||||||||||
Portfolio turnover rate | 17 | % | 28 | % | 23 | % | 32 | % | 51 | % | ||||||||||
| (1) | Net investment income per share is calculated using the ending balances prior to consideration or adjustment for permanent book-to-tax differences. |
| (2) | Total from investment operations per share includes redemption fees of $0.002, $0.002, $0.002, $0.004, and $0.009 per share for the fiscal years ended October 31, 2012, 2011, 2010, 2009, and 2008, respectively. |
| (3) | Net of fees waived amounting to 0.03%, 0.01%, 0.01%, 0.08%, and 0.04% of average net assets for the fiscal years ended October 31, 2012, 2011, 2010, 2009, and 2008, respectively. |
| (4) | Includes 0.01% of interest expense which is not included in the Fund’s operating expense cap. |
The Accompanying Notes are an Integral Part of these Financial Statements.
| Annual Report | 19 |
The Tocqueville Opportunity Fund
Financial Highlights
Per share operating performance (For a share outstanding throughout the year) | Years Ended October 31, | |||||||||||||||||||
| 2012 | 2011 | 2010 | 2009 | 2008 | ||||||||||||||||
Net asset value, beginning of year | $ | 14.96 | $ | 13.20 | $ | 10.78 | $ | 9.77 | $ | 17.24 | ||||||||||
|
|
|
|
|
|
|
|
|
| |||||||||||
Operations: | ||||||||||||||||||||
Net investment income (loss) (1) | (0.11 | ) | (0.13 | ) | (0.12 | ) | (0.11 | ) | 0.02 | |||||||||||
Net realized and unrealized gain (loss) | 0.91 | 1.89 | 2.54 | 1.23 | (5.67 | ) | ||||||||||||||
|
|
|
|
|
|
|
|
|
| |||||||||||
Total from investment operations (2) | 0.80 | 1.76 | 2.42 | 1.12 | (5.65 | ) | ||||||||||||||
|
|
|
|
|
|
|
|
|
| |||||||||||
Distributions to shareholders: | ||||||||||||||||||||
Dividends from net investment income | — | — | — | (0.01 | ) | (0.12 | ) | |||||||||||||
Distributions from net realized gains | — | — | — | (0.10 | ) | (1.70 | ) | |||||||||||||
|
|
|
|
|
|
|
|
|
| |||||||||||
Total distributions | — | — | — | (0.11 | ) | (1.82 | ) | |||||||||||||
|
|
|
|
|
|
|
|
|
| |||||||||||
Change in net asset value for the year | 0.80 | 1.76 | 2.42 | 1.01 | (7.47 | ) | ||||||||||||||
|
|
|
|
|
|
|
|
|
| |||||||||||
Net asset value, end of year | $ | 15.76 | $ | 14.96 | $ | 13.20 | $ | 10.78 | $ | 9.77 | ||||||||||
|
|
|
|
|
|
|
|
|
| |||||||||||
Total Return | 5.4 | % | 13.3 | % | 22.6 | % | 11.7 | % | (36.2 | )% | ||||||||||
Ratios/supplemental data | ||||||||||||||||||||
Net assets, end of year (000) | $ | 65,455 | $ | 46,963 | $ | 32,863 | $ | 30,498 | $ | 36,429 | ||||||||||
Ratio to average net assets: | ||||||||||||||||||||
Expense | 1.32 | % | 1.36 | % | 1.41 | % | 1.41 | % | 1.35 | % | ||||||||||
Net investment income (loss) | (0.76 | )% | (1.04 | )% | (1.08 | )% | (0.97 | )% | 0.12 | % | ||||||||||
Portfolio turnover rate | 77 | % | 110 | % | 104 | % | 62 | % | 169 | % | ||||||||||
| (1) | Net investment income (loss) per share is calculated using the ending balances prior to consideration or adjustment for permanent book-to-tax differences. |
| (2) | Total from investment operations per share includes redemption fees of $0.004, $0.001, and $0.005 for the fiscal years ended October 31, 2012, 2009, and 2008, respectively and less than $0.001 for the fiscal years ended October 31, 2011 and 2010. |
The Accompanying Notes are an Integral Part of these Financial Statements.
| 20 | October 31, 2012 |
The Tocqueville International Value Fund
Financial Highlights
Per share operating performance (For a share outstanding throughout the year) | Years Ended October 31, | |||||||||||||||||||
| 2012 | 2011 | 2010 | 2009 | 2008 | ||||||||||||||||
Net asset value, beginning of year | $ | 12.00 | $ | 12.12 | $ | 10.48 | $ | 8.49 | $ | 16.48 | ||||||||||
|
|
|
|
|
|
|
|
|
| |||||||||||
Operations: | ||||||||||||||||||||
Net investment income (1) | 0.17 | 0.11 | 0.11 | 0.10 | 0.13 | |||||||||||||||
Net realized and unrealized gain (loss) | (0.37 | ) | (0.16 | ) | 1.65 | 2.59 | (6.09 | ) | ||||||||||||
|
|
|
|
|
|
|
|
|
| |||||||||||
Total from investment operations (2) | (0.20 | ) | (0.05 | ) | 1.76 | 2.69 | (5.96 | ) | ||||||||||||
|
|
|
|
|
|
|
|
|
| |||||||||||
Distributions to shareholders: | ||||||||||||||||||||
Dividends from net investment income | (0.12 | ) | (0.07 | ) | (0.12 | ) | (0.20 | ) | (0.10 | ) | ||||||||||
Distributions from net realized gains | — | — | — | (0.50 | ) | (1.93 | ) | |||||||||||||
|
|
|
|
|
|
|
|
|
| |||||||||||
Total distributions | (0.12 | ) | (0.07 | ) | (0.12 | ) | (0.70 | ) | (2.03 | ) | ||||||||||
|
|
|
|
|
|
|
|
|
| |||||||||||
Change in net asset value for the year | (0.32 | ) | (0.12 | ) | 1.64 | 1.99 | (7.99 | ) | ||||||||||||
|
|
|
|
|
|
|
|
|
| |||||||||||
Net asset value, end of year | $ | 11.68 | $ | 12.00 | $ | 12.12 | $ | 10.48 | $ | 8.49 | ||||||||||
|
|
|
|
|
|
|
|
|
| |||||||||||
Total Return | (1.6 | )% | (0.5 | )% | 17.0 | % | 34.0 | % | (40.8 | )% | ||||||||||
Ratios/supplemental data | ||||||||||||||||||||
Net assets, end of year (000) | $ | 218,793 | $ | 199,848 | $ | 150,103 | $ | 131,613 | $ | 118,189 | ||||||||||
Ratio to average net assets: | ||||||||||||||||||||
Expense | 1.56 | % | 1.56 | % | 1.56 | % | 1.62 | % | 1.56 | % | ||||||||||
Net investment income | 1.53 | % | 0.99 | % | 1.03 | % | 0.96 | % | 1.07 | % | ||||||||||
Portfolio turnover rate | 38 | % | 30 | % | 27 | % | 27 | % | 63 | % | ||||||||||
| (1) | Net investment income per share is calculated using the ending balances prior to consideration or adjustment for permanent book-to-tax differences. |
| (2) | Total from investment operations per share includes redemption fees of $0.001, $0.010, $0.002, $0.001, and $0.001 for the fiscal years ended October 31, 2012, 2011, 2010, 2009, and 2008, respectively. |
The Accompanying Notes are an Integral Part of these Financial Statements.
| Annual Report | 21 |
The Tocqueville Gold Fund
Financial Highlights
Per share operating performance (For a share outstanding throughout the year) | Years Ended October 31, | |||||||||||||||||||
| 2012 | 2011 | 2010 | 2009 | 2008 | ||||||||||||||||
Net asset value, beginning of year | $ | 81.97 | $ | 82.00 | $ | 49.71 | $ | 21.77 | $ | 64.36 | ||||||||||
|
|
|
|
|
|
|
|
|
| |||||||||||
Operations: | ||||||||||||||||||||
Net investment loss (1) | (0.35 | ) | (0.67 | ) | (0.58 | ) | (0.45 | ) | (0.57 | ) | ||||||||||
Net realized and unrealized gain (loss) | (7.47 | ) | 2.25 | 32.96 | 29.28 | (33.24 | ) | |||||||||||||
|
|
|
|
|
|
|
|
|
| |||||||||||
Total from investment operations (2) | (7.82 | ) | 1.58 | 32.38 | 28.83 | (33.81 | ) | |||||||||||||
|
|
|
|
|
|
|
|
|
| |||||||||||
Distributions to shareholders: | ||||||||||||||||||||
Dividends from net investment income | — | — | — | — | (0.46 | ) | ||||||||||||||
Distributions from net realized gains | (1.33 | ) | (1.61 | ) | (0.09 | ) | (0.89 | ) | (8.32 | ) | ||||||||||
|
|
|
|
|
|
|
|
|
| |||||||||||
Total distributions | (1.33 | ) | (1.61 | ) | (0.09 | ) | (0.89 | ) | (8.78 | ) | ||||||||||
|
|
|
|
|
|
|
|
|
| |||||||||||
Change in net asset value for the year | (9.15 | ) | (0.03 | ) | 32.29 | 27.94 | (42.59 | ) | ||||||||||||
|
|
|
|
|
|
|
|
|
| |||||||||||
Net asset value, end of year | $ | 72.82 | $ | 81.97 | $ | 82.00 | $ | 49.71 | $ | 21.77 | ||||||||||
|
|
|
|
|
|
|
|
|
| |||||||||||
Total Return | (9.5 | )% | 1.8 | % | 65.2 | % | 135.2 | % | (60.0 | )% | ||||||||||
Ratios/supplemental data | ||||||||||||||||||||
Net assets, end of year (000) | $ | 2,445,913 | $ | 2,647,078 | $ | 2,199,603 | $ | 937,492 | $ | 410,857 | ||||||||||
Ratio to average net assets: | ||||||||||||||||||||
Expense | 1.28 | % | 1.25 | % | 1.34 | % | 1.50 | % | 1.43 | % | ||||||||||
Net investment loss | (0.56 | )% | (0.86 | )% | (1.11 | )% | (1.25 | )% | (1.07 | )% | ||||||||||
Portfolio turnover rate | 11 | % | 3 | % | 9 | % | 9 | % | 28 | % | ||||||||||
| (1) | Net investment loss per share is calculated using the ending balances prior to consideration or adjustment for permanent book-to-tax differences. |
| (2) | Total from investment operations per share includes redemption fees of $0.021, $0.102, $0.056, $0.025, and $0.027 for the fiscal years ended October 31, 2012, 2011, 2010, 2009, and 2008, respectively. |
The Accompanying Notes are an Integral Part of these Financial Statements.
| 22 | October 31, 2012 |
The Delafield Fund
Financial Highlights
Per share operating performance (For a share outstanding throughout | Years Ended October 31, | January 1, 2009 through October 31, 2009 | Years Ended December 31, | |||||||||||||||||||||
| 2012 | 2011 | 2010 | 2008 | 2007 | ||||||||||||||||||||
Net asset value, beginning of period | $ | 27.21 | $ | 26.65 | $ | 21.35 | $ | 15.10 | $ | 24.33 | $ | 25.64 | ||||||||||||
|
|
|
|
|
|
|
|
|
|
|
| |||||||||||||
Operations: | ||||||||||||||||||||||||
Net investment income (loss) (1) | (0.04 | ) | (0.08 | ) | (0.00 | )(3) | 0.03 | 0.07 | 0.17 | |||||||||||||||
Net realized and unrealized gain (loss) | 2.99 | 0.64 | 5.32 | 6.25 | (9.23 | ) | 1.10 | |||||||||||||||||
|
|
|
|
|
|
|
|
|
|
|
| |||||||||||||
Total from investment operations (2) | 2.95 | 0.56 | 5.32 | 6.28 | (9.16 | ) | 1.27 | |||||||||||||||||
|
|
|
|
|
|
|
|
|
|
|
| |||||||||||||
Distributions to shareholders: | ||||||||||||||||||||||||
Dividends from net investment income | — | — | — | (0.03 | ) | (0.07 | ) | (0.16 | ) | |||||||||||||||
Distributions from net realized gains | (0.37 | ) | — | — | — | (0.00 | )(3) | (2.42 | ) | |||||||||||||||
Return of capital | — | — | (0.02 | ) | (0.00 | )(3) | (0.00 | )(3) | — | |||||||||||||||
|
|
|
|
|
|
|
|
|
|
|
| |||||||||||||
Total distributions | (0.37 | ) | — | (0.02 | ) | (0.03 | ) | (0.07 | ) | (2.58 | ) | |||||||||||||
|
|
|
|
|
|
|
|
|
|
|
| |||||||||||||
Change in net asset value for the period | 2.58 | 0.56 | 5.30 | 6.25 | (9.23 | ) | (1.31 | ) | ||||||||||||||||
|
|
|
|
|
|
|
|
|
|
|
| |||||||||||||
Net asset value, end of period | $ | 29.79 | $ | 27.21 | $ | 26.65 | $ | 21.35 | $ | 15.10 | $ | 24.33 | ||||||||||||
|
|
|
|
|
|
|
|
|
|
|
| |||||||||||||
Total Return | 11.0 | % | 2.1 | % | 25.0 | % | 41.6 | %(4) | (37.6 | )% | 4.9 | % | ||||||||||||
Ratios/supplemental data | ||||||||||||||||||||||||
Net assets, end of period (000) | $ | 1,346,273 | $ | 1,262,876 | $ | 933,674 | $ | 636,548 | $ | 404,860 | $ | 656,999 | ||||||||||||
Ratio to average net assets: | ||||||||||||||||||||||||
Expense | 1.23 | % | 1.23 | % | 1.27 | % | 1.38 | %(5) | 1.34 | %(6) | 1.28 | %(6) | ||||||||||||
Net investment income (loss) | (0.13 | )% | (0.30 | )% | (0.02 | )% | 0.21 | %(5) | 0.35 | %(6) | 0.57 | %(6) | ||||||||||||
Portfolio turnover rate | 49 | % | 38 | % | 30 | % | 46 | %(4) | 81 | % | 61 | % | ||||||||||||
| (1) | Net investment income (loss) per share is calculated using the ending balances prior to consideration or adjustment for permanent book-to-tax differences. |
| (2) | Total from investment operations per share includes redemption fees of $0.003, $0.006, and $0.006 for the fiscal years ended October 31, 2012, 2011, and 2010, $0.008 per share for the period ended October 31, 2009, less than $0.01 for the fiscal year ended December 31, 2008 and $0.01 for the fiscal year ended December 31, 2007. |
| (3) | Represents less than $0.01. |
| (4) | Not Annualized. |
| (5) | Annualized. |
| (6) | Net of fees waived amounting to 0.06% and 0.05% for the fiscal years ended December 31, 2008, and 2007, respectively. |
The Accompanying Notes are an Integral Part of these Financial Statements.
| Annual Report | 23 |
The Tocqueville Select Fund
Financial Highlights
Per share operating performance (For a share outstanding throughout the | Years Ended October 31, | January 1, 2009 through October 31, 2009 | Period from September 2008 (3) through December 31, 2008 | |||||||||||||||||
| 2012 | 2011 | 2010 | ||||||||||||||||||
Net asset value, beginning of period | $ | 11.06 | $ | 11.54 | $ | 8.46 | $ | 5.77 | $ | 8.74 | ||||||||||
|
|
|
|
|
|
|
|
|
| |||||||||||
Operations: | ||||||||||||||||||||
Net investment income (loss) (1) | (0.04 | ) | (0.07 | ) | (0.03 | ) | (0.00 | )(4) | 0.01 | |||||||||||
Net realized and unrealized gain (loss) | 0.44 | 0.12 | 3.12 | 2.70 | (2.97 | ) | ||||||||||||||
|
|
|
|
|
|
|
|
|
| |||||||||||
Total from investment operations (2) | 0.40 | 0.05 | 3.09 | 2.70 | (2.96 | ) | ||||||||||||||
|
|
|
|
|
|
|
|
|
| |||||||||||
Distributions to shareholders: | ||||||||||||||||||||
Dividends from net investment income | — | — | (0.01 | ) | (0.00 | )(4) | (0.01 | ) | ||||||||||||
Distributions from net realized gains | (0.11 | ) | (0.53 | ) | — | — | — | |||||||||||||
Return of capital | — | — | — | (0.01 | ) | | — | | ||||||||||||
|
|
|
|
|
|
|
|
|
| |||||||||||
Total distributions | (0.11 | ) | (0.53 | ) | (0.01 | ) | (0.01 | ) | (0.01 | ) | ||||||||||
|
|
|
|
|
|
|
|
|
| |||||||||||
Change in net asset value for the period | 0.29 | (0.48 | ) | 3.08 | 2.69 | (2.97 | ) | |||||||||||||
|
|
|
|
|
|
|
|
|
| |||||||||||
Net asset value, end of period | $ | 11.35 | $ | 11.06 | $ | 11.54 | $ | 8.46 | $ | 5.77 | ||||||||||
|
|
|
|
|
|
|
|
|
| |||||||||||
Total Return | 3.7 | % | (0.1 | )% | 36.6 | % | 46.7 | %(5) | (33.9 | )%(5) | ||||||||||
Ratios/supplemental data | ||||||||||||||||||||
Net assets, end of period (000) | $ | 84,549 | $ | 71,554 | $ | 41,788 | $ | 24,681 | $ | 9,226 | ||||||||||
Ratio to average net assets: | ||||||||||||||||||||
Expense | 1.37 | % | 1.36 | % | 1.38 | % | 1.26 | %(6)(7) | 1.15 | %(6)(7) | ||||||||||
Net investment income (loss) | (0.36 | )% | (0.67 | )% | (0.43 | )% | (0.16 | )%(6)(7) | 0.29 | %(6)(7) | ||||||||||
Portfolio turnover rate | 31 | % | 28 | % | 40 | % | 24 | %(5) | 29 | %(5) | ||||||||||
| (1) | Net investment income (loss) per share is calculated using the ending balances prior to consideration or adjustment for permanent book-to-tax differences. |
| (2) | Total from investment operations per share includes redemption fees of $0.002, $0.008 and $0.007 for the fiscal years ended October 31, 2012, 2011, and 2010, respectively. |
| (3) | Inception of Fund. |
| (4) | Represents less than $0.01. |
| (5) | Not Annualized. |
| (6) | Annualized. |
| (7) | Net of fees waived amounting to 0.77% and 2.32% for the fiscal periods ended October 31, 2009 and December 31, 2008, respectively. |
The Accompanying Notes are an Integral Part of these Financial Statements.
| 24 | October 31, 2012 |
The Tocqueville Fund
Schedule of Investments as of October 31, 2012
| Common Stocks—99.3% | Shares | Value | ||||||
Automobiles & Components—2.3% |
| |||||||
Ford Motor Co. | 748,000 | $ | 8,347,680 | |||||
Banks—0.9% | ||||||||
Mitsubishi UFJ Financial Group, Inc.—ADR | 750,000 | 3,367,500 | ||||||
Capital Goods—7.4% | ||||||||
General Electric Co. | 750,000 | 15,795,000 | ||||||
Illinois Tool Works, Inc. | 100,000 | 6,133,000 | ||||||
The Boeing Co. | 75,000 | 5,283,000 | ||||||
| 27,211,000 | ||||||||
Commercial & Professional Services—1.9% |
| |||||||
Steelcase, Inc. | 700,000 | 7,007,000 | ||||||
Couriers and Messengers—0.8% |
| |||||||
FedEx Corp. | 30,000 | 2,759,700 | ||||||
Credit Intermediation and Related Activities—0.3% |
| |||||||
M&T Bank Corp. | 11,000 | 1,145,100 | ||||||
Diversified Financials—2.8% | ||||||||
Lazard Ltd.(a) | 100,000 | 2,946,000 | ||||||
The Bank of New York Mellon Corp. | 300,000 | 7,413,000 | ||||||
| 10,359,000 | ||||||||
Educational Services—0.7% | ||||||||
DeVry, Inc. | 100,000 | 2,626,000 | ||||||
Energy—13.1% | ||||||||
Cameco Corp.(a) | 171,400 | 3,316,590 | ||||||
Chesapeake Energy Corp. | 300,000 | 6,078,000 | ||||||
Endeavour International Corp.(b) | 125,000 | 907,500 | ||||||
Energen Corp. | 100,000 | 4,665,000 | ||||||
Exxon Mobil Corp. | 150,000 | 13,675,500 | ||||||
Murphy Oil Corp. | 150,000 | 9,000,000 | ||||||
Schlumberger Ltd.(a) | 150,000 | 10,429,500 | ||||||
| 48,072,090 | ||||||||
Food & Staples Retailing—2.1% |
| |||||||
Wal-Mart Stores, Inc. | 100,000 | 7,502,000 | ||||||
Food, Beverage & Tobacco—5.1% |
| |||||||
Campbell Soup Co. | 225,000 | 7,935,750 | ||||||
PepsiCo, Inc. | 50,000 | 3,462,000 | ||||||
The Coca-Cola Co. | 200,000 | 7,436,000 | ||||||
| 18,833,750 | ||||||||
Household & Personal Products—4.3% |
| |||||||
Colgate-Palmolive Co. | 50,000 | 5,248,000 | ||||||
The Procter & Gamble Co. | 150,000 | 10,386,000 | ||||||
| 15,634,000 | ||||||||
| Common Stocks (continued) | Shares | Value | ||||||
Insurance—4.7% | ||||||||
Aflac, Inc. | 171,500 | $ | 8,537,270 | |||||
Fidelity National Financial, Inc. | 200,000 | 4,282,000 | ||||||
XL Group PLC(a) | 171,000 | 4,230,540 | ||||||
| 17,049,810 | ||||||||
Materials—10.0% | ||||||||
BHP Billiton Ltd.—ADR | 63,900 | 4,520,286 | ||||||
Cliffs Natural Resources, Inc. | 75,000 | 2,720,250 | ||||||
EI du Pont de Nemours & Co. | 250,000 | 11,130,000 | ||||||
Newmont Mining Corp. | 250,000 | 13,637,500 | ||||||
Sonoco Products Co. | 150,000 | 4,669,500 | ||||||
| 36,677,536 | ||||||||
Pharmaceuticals, Biotechnology & Life Sciences—9.9% |
| |||||||
Alkermes PLC(a)(b) | 250,000 | 4,632,500 | ||||||
Isis Pharmaceuticals, Inc.(b) | 200,000 | 1,730,000 | ||||||
Johnson & Johnson | 150,000 | 10,623,000 | ||||||
Merck & Co., Inc. | 150,000 | 6,844,500 | ||||||
Pfizer, Inc. | 500,000 | 12,435,000 | ||||||
| 36,265,000 | ||||||||
Real Estate—3.0% | ||||||||
Weyerhaeuser Co. | 400,000 | 11,076,000 | ||||||
Retailing—1.3% | ||||||||
Lowe’s Companies, Inc. | 150,000 | 4,857,000 | ||||||
Semiconductors & Semiconductor Equipment—4.4% |
| |||||||
Applied Materials, Inc. | 700,000 | 7,420,000 | ||||||
Intel Corp. | 400,000 | 8,650,000 | ||||||
| 16,070,000 | ||||||||
Software & Services—12.2% | ||||||||
Adobe Systems, Inc.(b) | 150,000 | 5,100,000 | ||||||
Automatic Data Processing, Inc. | 100,000 | 5,779,000 | ||||||
Google, Inc.(b) | 15,000 | 10,196,550 | ||||||
Mastercard, Inc. | 20,000 | 9,218,600 | ||||||
Microsoft Corp. | 500,000 | 14,267,500 | ||||||
| 44,561,650 | ||||||||
Technology Hardware & Equipment—7.2% |
| |||||||
Bio-key International, Inc.(b)(c)(d)(e) | 47,090 | — | ||||||
Cisco Systems, Inc. | 420,000 | 7,198,800 | ||||||
EMC Corp.(b) | 125,000 | 3,052,500 | ||||||
Hitachi Ltd.—ADR | 150,000 | 7,869,000 | ||||||
Plexus Corp.(b) | 125,000 | 3,363,750 | ||||||
Xerox Corp. | 750,000 | 4,830,000 | ||||||
| 26,314,050 | ||||||||
Telecommunication Services—1.5% |
| |||||||
Verizon Communications, Inc. | 125,000 | 5,580,000 | ||||||
The Accompanying Footnotes are an Integral Part of these Financial Statements.
| Annual Report | 25 |
The Tocqueville Fund
Schedule of Investments as of October 31, 2012
| Common Stocks (continued) | Shares | Value | ||||||
Utilities—3.4% | ||||||||
NextEra Energy, Inc. | 175,000 | $ | 12,260,500 | |||||
Total Common Stocks | 363,576,366 | |||||||
Warrant—0.0% | ||||||||
Technology Hardware & Equipment—0.0% |
| |||||||
EMCORE Corp. | ||||||||
Expiration: 02/19/13, | 9,844 | — | ||||||
Total Warrant | — | |||||||
| Short-Term Investments—0.5% | Principal Amount | |||||||
Repurchase Agreement—0.5% | ||||||||
Repurchase Agreement with U.S. Bank, N.A., 0.01% dated 10/31/2012, due 11/01/2012, collateralized by: Freddie Mac Conventional 15 Year Fixed (Pool #E99837) valued at $62,234. Repurchase proceeds of $60,975. Fannie Mae Conventional Level Pay 15 Year Fixed (Pool #254919) valued at $1,868,550. Repurchase proceeds of $1,832,026. | $ | 1,893,000 | 1,893,000 | |||||
Total Short-Term Investments | 1,893,000 | |||||||
Total Investments |
| 365,469,366 | ||||||
Other Assets in Excess of Liabilities—0.2% |
| 555,222 | ||||||
Total Net Assets—100.0% | $ | 366,024,588 | ||||||
|
| |||||||
Percentages are stated as a percent of net assets.
ADR—American Depository Receipt
| (a) | Foreign issued security. Foreign concentration (including ADRs) was as follows: Australia 1.2%; Bermuda 0.8%; Canada 0.9%; Ireland 2.4%; Japan 3.1%; Netherlands Antilles 2.8%; |
| (b) | Non-income producing security. |
| (c) | Denotes a security is either fully or partially restricted to resale. The aggregate value of restricted securities at October 31, 2012 was $0 which represented 0.0% of net assets. |
| (d) | Fair valued security.The aggregate value of fair valued securities as of October 31, 2012 was $0 which represented 0.0% of net assets. |
| (e) | Security is considered illiquid and may be difficult to sell. |
The Global Industry Classification Standard (GICS®) was developed by and/or is the exclusive property of MSCI, Inc. and Standard & Poor Financial Services LLC (“S&P”).GICS is a service mark of MSCI and S&P and has been licensed for use by U.S. Bancorp Fund Services, LLC.
The Accompanying Footnotes are an Integral Part of these Financial Statements.
| 26 | October 31, 2012 |
The Tocqueville Opportunity Fund
Schedule of Investments as of October 31, 2012
| Common Stocks—99.8% | Shares | Value | ||||||
Automobiles & Components—0.7% | ||||||||
BorgWarner, Inc.(a) | 4,200 | $ | 276,444 | |||||
The Goodyear Tire & Rubber Co.(a) | 17,000 | 193,970 | ||||||
| 470,414 | ||||||||
Banks—3.5% | ||||||||
BankUnited, Inc. | 19,000 | 450,490 | ||||||
Pinnacle Financial Partners, Inc.(a) | 34,000 | 664,700 | ||||||
SCBT Financial Corp. | 6,900 | 273,792 | ||||||
Signature Bank(a) | 9,900 | 705,276 | ||||||
Texas Capital Bancshares, Inc.(a) | 3,800 | 180,386 | ||||||
| 2,274,644 | ||||||||
Capital Goods—7.6% | ||||||||
Acuity Brands, Inc. | 4,200 | 271,740 | ||||||
AMETEK, Inc. | 13,950 | 495,922 | ||||||
AO Smith Corp. | 11,700 | 711,009 | ||||||
B/E Aerospace, Inc.(a) | 6,000 | 270,540 | ||||||
Beacon Roofing Supply, Inc.(a) | 6,000 | 194,040 | ||||||
Hexcel Corp.(a) | 8,000 | 204,480 | ||||||
Hubbell, Inc. | 3,700 | 309,764 | ||||||
Lincoln Electric Holdings, Inc. | 3,600 | 156,132 | ||||||
RBC Bearings, Inc.(a) | 5,500 | 273,130 | ||||||
TransDigm Group, Inc. | 3,600 | 479,556 | ||||||
Triumph Group, Inc. | 2,200 | 143,924 | ||||||
Valmont Industries, Inc. | 2,500 | 337,750 | ||||||
WABCO Holdings, Inc.(a) | 7,200 | 421,704 | ||||||
Wabtec Corp. | 5,000 | 409,500 | ||||||
Watsco, Inc. | 4,200 | 287,070 | ||||||
| 4,966,261 | ||||||||
Commercial & Professional Services—2.9% |
| |||||||
Clean Harbors, Inc.(a) | 5,300 | 309,255 | ||||||
Equifax, Inc. | 7,500 | 375,300 | ||||||
Multi-Color Corp. | 10,000 | 227,200 | ||||||
Portfolio Recovery Associates, Inc.(a) | 8,300 | 868,595 | ||||||
Republic Services, Inc. | 5,200 | 147,420 | ||||||
| 1,927,770 | ||||||||
Consumer Durables & Apparel—6.2% |
| |||||||
Fossil, Inc.(a) | 3,800 | 330,980 | ||||||
Hanesbrands, Inc.(a) | 12,600 | 421,722 | ||||||
Hermes International(b) | 1,400 | 382,154 | ||||||
Lululemon Athletica, Inc.(a) | 9,900 | 683,199 | ||||||
Michael Kors Holdings Ltd.(a)(b) | 6,300 | 344,547 | ||||||
Polaris Industries, Inc. | 4,300 | 363,350 | ||||||
Prada SpA(b) | 59,500 | 485,210 | ||||||
Ralph Lauren Corp. | 4,100 | 630,129 | ||||||
Tupperware Brands Corp. | 3,200 | 189,120 | ||||||
Under Armour, Inc.(a) | 4,300 | 224,718 | ||||||
| 4,055,129 | ||||||||
Consumer Services—4.5% | ||||||||
BJ’s Restaurants, Inc.(a) | 5,100 | 168,555 | ||||||
Buffalo Wild Wings, Inc.(a) | 1,600 | 121,520 | ||||||
Chipotle Mexican Grill, Inc.(a) | 1,400 | 356,342 | ||||||
| Common Stocks (continued) | Shares | Value | ||||||
Domino’s Pizza, Inc. | 6,800 | $ | 276,216 | |||||
Dunkin’ Brands Group, Inc. | 13,500 | 418,500 | ||||||
Panera Bread Co.(a) | 2,900 | 489,056 | ||||||
Sotheby’s | 4,400 | 136,972 | ||||||
Starbucks Corp. | 6,400 | 293,760 | ||||||
Starwood Hotels & Resorts Worldwide, Inc. | 3,100 | 160,735 | ||||||
Wyndham Worldwide Corp. | 4,000 | 201,600 | ||||||
Wynn Resorts Ltd. | 2,700 | 326,862 | ||||||
| 2,950,118 | ||||||||
Diversified Financials—3.4% | ||||||||
Blackstone Group LP | 28,000 | 430,080 | ||||||
KKR & Co. LP | 28,000 | 421,400 | ||||||
Lazard Ltd.(b) | 4,200 | 123,732 | ||||||
MSCI, Inc.(a) | 7,000 | 188,580 | ||||||
T. Rowe Price Group, Inc. | 10,500 | 681,870 | ||||||
The Charles Schwab Corp. | 28,500 | 387,030 | ||||||
| 2,232,692 | ||||||||
Energy—6.4% | ||||||||
Approach Resources, Inc.(a) | 6,800 | 167,484 | ||||||
BPZ Resources, Inc.(a) | 74,700 | 215,136 | ||||||
Cameron International Corp.(a) | 3,700 | 187,368 | ||||||
Continental Resources, Inc.(a) | 2,300 | 165,278 | ||||||
Core Laboratories NV(b) | 7,100 | 735,986 | ||||||
Dresser-Rand Group, Inc.(a) | 5,200 | 267,956 | ||||||
Dril-Quip, Inc.(a) | 3,400 | 235,484 | ||||||
Energy XXI Bermuda Ltd.(b) | 3,100 | 102,610 | ||||||
EOG Resources, Inc. | 1,800 | 209,682 | ||||||
FMC Technologies, Inc.(a) | 5,800 | 237,220 | ||||||
Halcon Resources Corp.(a) | 20,000 | 129,400 | ||||||
Oasis Petroleum, Inc.(a) | 4,100 | 120,417 | ||||||
Oceaneering International, Inc. | 8,300 | 434,339 | ||||||
Oil States International, Inc.(a) | 3,100 | 226,610 | ||||||
Pioneer Natural Resources Co. | 2,300 | 242,995 | ||||||
Rosetta Resources, Inc.(a) | 6,000 | 276,240 | ||||||
SM Energy Co. | 4,200 | 226,464 | ||||||
| 4,180,669 | ||||||||
Food & Staples Retailing—1.2% | ||||||||
The Fresh Market, Inc.(a) | 13,400 | 759,914 | ||||||
Food, Beverage & Tobacco—3.1% | ||||||||
Constellation Brands, Inc.(a) | 9,400 | 332,196 | ||||||
Mead Johnson Nutrition Co. | 4,500 | 277,470 | ||||||
Monster Beverage Corp.(a) | 9,500 | 424,365 | ||||||
The Boston Beer Co., Inc.(a) | 1,700 | 182,886 | ||||||
The Hain Celestial Group, Inc.(a) | 14,500 | 838,100 | ||||||
| 2,055,017 | ||||||||
Health Care Equipment & Services—4.3% |
| |||||||
Align Technology, Inc.(a) | 3,400 | 90,372 | ||||||
athenahealth, Inc.(a) | 2,100 | 135,009 | ||||||
Cerus Corp.(a) | 32,200 | 100,142 | ||||||
DexCom, Inc.(a) | 22,500 | 294,750 | ||||||
The Accompanying Footnotes are an Integral Part of these Financial Statements.
| Annual Report | 27 |
The Tocqueville Opportunity Fund
Schedule of Investments as of October 31, 2012
| Common Stocks (continued) | Shares | Value | ||||||
HeartWare International, Inc.(a) | 6,100 | $ | 512,278 | |||||
HMS Holdings Corp.(a) | 5,700 | 131,613 | ||||||
Hologic, Inc.(a) | 8,900 | 183,518 | ||||||
IDEXX Laboratories, Inc.(a) | 4,100 | 394,420 | ||||||
Insulet Corp.(a) | 9,500 | 201,495 | ||||||
MWI Veterinary Supply, Inc.(a) | 2,300 | 241,546 | ||||||
Sirona Dental Systems, Inc.(a) | 4,500 | 257,670 | ||||||
Tornier NV(a)(b) | 11,700 | 200,070 | ||||||
Vanguard Health Systems, Inc.(a) | 8,900 | 86,152 | ||||||
| 2,829,035 | ||||||||
Household & Personal Products—1.4% |
| |||||||
Church & Dwight Co., Inc. | 4,500 | 228,420 | ||||||
Herbalife Ltd.(b) | 14,000 | 718,900 | ||||||
| 947,320 | ||||||||
Materials—5.3% | ||||||||
Airgas, Inc. | 3,700 | 329,189 | ||||||
Albemarle Corp. | 4,000 | 220,440 | ||||||
Allied Nevada Gold Corp.(a) | 5,500 | 203,060 | ||||||
Aptargroup, Inc. | 3,800 | 194,864 | ||||||
Crown Holdings, Inc.(a) | 5,600 | 214,200 | ||||||
Ecolab, Inc. | 7,600 | 528,960 | ||||||
HB Fuller Co. | 3,400 | 103,360 | ||||||
Owens-Illinois, Inc.(a) | 14,100 | 274,809 | ||||||
Royal Gold, Inc. | 3,800 | 334,704 | ||||||
Schweitzer-Mauduit International, Inc. | 7,000 | 245,210 | ||||||
Silgan Holdings, Inc. | 8,000 | 346,480 | ||||||
WR Grace & Co.(a) | 7,000 | 449,120 | ||||||
| 3,444,396 | ||||||||
Media—0.4% | ||||||||
Morningstar, Inc. | 4,200 | 264,516 | ||||||
Pharmaceuticals, Biotechnology & Life Sciences—14.9% |
| |||||||
Achillion Pharmaceuticals, Inc.(a) | 49,000 | 462,560 | ||||||
Alexion Pharmaceuticals, Inc.(a) | 10,700 | 967,066 | ||||||
Algeta ASA(a)(b) | 10,500 | 282,699 | ||||||
Alkermes PLC(a)(b) | 9,600 | 177,888 | ||||||
Alnylam Pharmaceuticals, Inc.(a) | 17,100 | 276,507 | ||||||
Auxilium Pharmaceuticals, Inc.(a) | 10,200 | 208,896 | ||||||
BioMarin Pharmaceutical, Inc.(a) | 11,800 | 437,072 | ||||||
Cepheid, Inc.(a) | 10,500 | 318,255 | ||||||
Clovis Oncology, Inc.(a) | 15,500 | 334,335 | ||||||
Cubist Pharmaceuticals, Inc.(a) | 6,200 | 265,980 | ||||||
Endo Health Solutions, Inc.(a) | 4,500 | 128,970 | ||||||
Endocyte, Inc.(a) | 19,400 | 185,658 | ||||||
Exact Sciences Corp.(a) | 10,900 | 103,114 | ||||||
Forest Laboratories, Inc.(a) | 5,900 | 198,889 | ||||||
Genomic Health, Inc.(a) | 6,000 | 187,500 | ||||||
Incyte Corp., Ltd.(a) | 27,500 | 438,900 | ||||||
Medivation, Inc.(a) | 10,000 | 511,200 | ||||||
NPS Pharmaceuticals, Inc.(a) | 23,200 | 214,368 | ||||||
Onyx Pharmaceuticals, Inc.(a) | 6,900 | 540,684 | ||||||
Pharmacyclics, Inc.(a) | 12,800 | 781,696 | ||||||
| Common Stocks (continued) | Shares | Value | ||||||
Pluristem Therapeutics, Inc.(a) | 36,700 | $ | 132,487 | |||||
Raptor Pharmaceutical Corp.(a) | 22,000 | 102,300 | ||||||
Regeneron Pharmaceuticals, Inc.(a) | 4,700 | 668,810 | ||||||
Salix Pharmaceuticals, Inc.(a) | 6,600 | 257,664 | ||||||
Sarepta Therapeutics, Inc.(a) | 4,300 | 91,633 | ||||||
Seattle Genetics, Inc.(a) | 16,500 | 415,140 | ||||||
Synageva BioPharma Corp.(a) | 6,600 | 279,048 | ||||||
Threshold Pharmaceuticals, Inc.(a) | 23,300 | 95,763 | ||||||
United Therapeutics Corp.(a) | 6,600 | 301,422 | ||||||
Valeant Pharmaceuticals International, Inc.(a)(b) | 6,500 | 363,545 | ||||||
| 9,730,049 | ||||||||
Retailing—9.6% | ||||||||
Abercrombie & Fitch Co. | 5,700 | 174,306 | ||||||
American Eagle Outfitters, Inc. | 19,200 | 400,704 | ||||||
GNC Holdings, Inc. | 16,700 | 645,789 | ||||||
LKQ Corp.(a) | 17,000 | 355,130 | ||||||
L’Occitane International SA(b) | 115,500 | 359,911 | ||||||
PetSmart, Inc. | 9,400 | 624,066 | ||||||
priceline.com, Inc.(a) | 1,800 | 1,032,786 | ||||||
Sally Beauty Holdings, Inc.(a) | 8,000 | 192,640 | ||||||
Tiffany & Co. | 4,000 | 252,880 | ||||||
Tractor Supply Co. | 14,600 | 1,405,104 | ||||||
Ulta Salon Cosmetics & Fragrance, Inc. | 5,900 | 544,098 | ||||||
Urban Outfitters, Inc.(a) | 7,700 | 275,352 | ||||||
| 6,262,766 | ||||||||
Semiconductors & Semiconductor Equipment—1.9% |
| |||||||
Broadcom Corp. | 5,000 | 157,675 | ||||||
Cavium, Inc.(a) | 8,800 | 291,984 | ||||||
Cirrus Logic, Inc.(a) | 11,000 | 448,360 | ||||||
Skyworks Solutions, Inc.(a) | 15,300 | 358,020 | ||||||
| 1,256,039 | ||||||||
Software & Services—16.7% | ||||||||
Alliance Data Systems Corp.(a) | 2,700 | 386,235 | ||||||
ANSYS, Inc.(a) | 7,300 | 517,424 | ||||||
Aspen Technology, Inc.(a) | 11,700 | 289,926 | ||||||
CommVault Systems, Inc.(a) | 4,700 | 293,609 | ||||||
Concur Technologies, Inc.(a) | 6,500 | 430,495 | ||||||
Ebix, Inc. | 6,300 | 137,277 | ||||||
Equinix, Inc.(a) | 1,000 | 180,410 | ||||||
Facebook, Inc.(a)(c)(d)(e) | 30,000 | 620,634 | ||||||
Facebook, Inc.(a) | 1,500 | 31,673 | ||||||
FactSet Research Systems, Inc. | 2,800 | 253,540 | ||||||
Fortinet, Inc.(a) | 9,500 | 184,015 | ||||||
Gartner, Inc.(a) | 5,200 | 241,332 | ||||||
Google, Inc.(a) | 700 | 475,839 | ||||||
Informatica Corp.(a) | 8,300 | 225,262 | ||||||
LinkedIn Corp.(a) | 8,900 | 951,677 | ||||||
Manhattan Associates, Inc.(a) | 6,500 | 390,000 | ||||||
MICROS Systems, Inc.(a) | 7,800 | 354,042 | ||||||
NetSuite, Inc.(a) | 9,100 | 577,941 | ||||||
The Accompanying Footnotes are an Integral Part of these Financial Statements.
| 28 | October 31, 2012 |
The Tocqueville Opportunity Fund
Schedule of Investments as of October 31, 2012
| Common Stocks (continued) | Shares | Value | ||||||
Nuance Communications, Inc.(a) | 16,100 | $ | 358,386 | |||||
Parametric Technology Corp.(a) | 10,900 | 219,962 | ||||||
Rackspace Hosting, Inc.(a) | 6,000 | 382,140 | ||||||
Red Hat, Inc.(a) | 5,800 | 285,186 | ||||||
Salesforce.com, Inc.(a) | 6,050 | 883,179 | ||||||
SolarWinds, Inc.(a) | 9,200 | 465,428 | ||||||
Solera Holdings, Inc. | 5,900 | 276,179 | ||||||
Sourcefire, Inc.(a) | 1,600 | 68,464 | ||||||
Tangoe, Inc.(a) | 13,500 | 174,420 | ||||||
Teradata Corp.(a) | 3,000 | 204,930 | ||||||
TIBCO Software, Inc.(a) | 13,000 | 327,730 | ||||||
Ultimate Software Group, Inc.(a) | 4,600 | 466,256 | ||||||
VMware, Inc.(a) | 3,400 | 288,218 | ||||||
| 10,941,809 | ||||||||
Technology Hardware & Equipment—4.3% |
| |||||||
Apple, Inc. | 3,700 | 2,201,870 | ||||||
F5 Networks, Inc.(a) | 2,500 | 206,200 | ||||||
Fusion-IO, Inc.(a) | 15,000 | 354,000 | ||||||
Riverbed Technology, Inc.(a) | 4,200 | 77,574 | ||||||
| 2,839,644 | ||||||||
Transportation—1.5% | ||||||||
Genesee & Wyoming, Inc.(a) | 2,900 | 210,163 | ||||||
Kansas City Southern | 6,600 | 531,036 | ||||||
Kirby Corp.(a) | 4,100 | 235,668 | ||||||
| 976,867 | ||||||||
Total Common Stocks | 65,365,069 | |||||||
| Short-Term Investments—0.2% | Principal Amount | Value | ||||||
Repurchase Agreement—0.2% | ||||||||
Repurchase Agreement with U.S. Bank, N.A., 0.01% dated 10/31/2012, due 11/01/2012, collateralized by: Freddie Mac Conventional 15 Year Fixed (Pool #E99837) valued at $98,428. Repurchase proceeds of $96,359. Freddie Mac 30 Year Variable (Pool #3447) valued at $9,833. Repurchase proceeds of $9,641. | $ | 106,000 | $ | 106,000 | ||||
Total Repurchase Agreement | 106,000 | |||||||
Total Investments | 65,471,069 | |||||||
Liabilities in Excess of Other Assets—0.0% |
| (16,459 | ) | |||||
Total Net Assets—100.0% | $ | 65,454,610 | ||||||
|
| |||||||
Percentages are stated as a percent of net assets.
| (a) | Non-income producing security. |
| (b) | Foreign issued security. Foreign concentration was as follows: Bermuda 0.3%; Canada 0.6%; Cayman Islands 1.1%; France 0.6%; Ireland 0.3%; Italy 0.7%; Luxembourg 0.5%; Netherlands 1.4%; Norway 0.4%; Virgin Islands 0.5%; |
| (c) | Denotes a security is either fully or partially restricted to resale. The aggregate value of restricted securities at October 31, 2012 was $620,634 which represented 0.9% of net assets. |
| (d) | Fair valued security. The aggregate value of fair valued securities as of October 31, 2012 was $620,634 which represented 0.9% of net assets. |
| (e) | Security is considered illiquid and may be difficult to sell. |
The Accompanying Footnotes are an Integral Part of these Financial Statements.
| Annual Report | 29 |
The Tocqueville International Value Fund
Schedule of Investments as of October 31, 2012
| Common Stocks—92.3% | Shares | Value | ||||||
Australia—1.0% | ||||||||
BHP Billiton Ltd.—ADR | 30,000 | $ | 2,122,200 | |||||
Belgium—3.4% | ||||||||
Groupe Bruxelles Lambert SA | 50,000 | 3,691,414 | ||||||
NV Bekaert SA | 100,000 | 2,729,677 | ||||||
Umicore SA | 21,000 | 1,077,736 | ||||||
| 7,498,827 | ||||||||
Bermuda—1.6% | ||||||||
Guoco Group Ltd. | 385,000 | 3,556,880 | ||||||
Brazil—0.8% | ||||||||
Itau Unibanco Holding SA | 115,500 | 1,683,990 | ||||||
Canada—1.3% | ||||||||
IAMGOLD Corp. | 182,000 | 2,837,380 | ||||||
France—12.9% | ||||||||
Bollore SA | 20,000 | 5,927,260 | ||||||
Cie de St-Gobain | 123,000 | 4,334,781 | ||||||
Eutelsat Communica SA | 44,200 | 1,415,051 | ||||||
Haulotte Group SA(a) | 182,500 | 1,125,959 | ||||||
IPSOS | 37,000 | 1,300,122 | ||||||
Metropole Television SA | 280,000 | 3,903,204 | ||||||
Nexans SA | 30,100 | 1,281,021 | ||||||
Sanofi | 52,740 | 4,636,078 | ||||||
Vivendi SA | 208,759 | 4,271,128 | ||||||
| 28,194,604 | ||||||||
Germany—6.3% | ||||||||
Deutsche Telekom AG | 56,500 | 645,101 | ||||||
Infineon Technologies AG | 530,600 | 3,610,600 | ||||||
Kloeckner & Co. SE(a) | 174,700 | 1,582,336 | ||||||
Siemens AG—ADR | 50,000 | 5,045,500 | ||||||
Wacker Neuson SE | 220,000 | 2,996,941 | ||||||
| 13,880,478 | ||||||||
Hong Kong—4.0% | ||||||||
Chow Tai Fook Jewellery Group Ltd. | 1,600,000 | 1,973,665 | ||||||
Clear Media Ltd. | 3,813,000 | 1,967,987 | ||||||
Television Broadcasts Ltd. | 656,500 | 4,891,952 | ||||||
| 8,833,604 | ||||||||
Indonesia—0.8% | ||||||||
Timah Persero Tbk PT | 12,195,000 | 1,815,601 | ||||||
Ireland—4.0% | ||||||||
CRH PLC | 186,323 | 3,467,957 | ||||||
DCC PLC | 180,900 | 5,220,524 | ||||||
| 8,688,481 | ||||||||
Italy—1.4% | ||||||||
Sogefi SpA | 1,250,000 | 2,997,330 | ||||||
| Common Stocks (continued) | Shares | Value | ||||||
Japan—27.1% | ||||||||
Asahi Kasei Corp. | 645,000 | $ | 3,546,975 | |||||
Asics Corp. | 349,800 | 5,078,519 | ||||||
Bridgestone Corp. | 166,700 | 3,881,940 | ||||||
Canon, Inc.—ADR | 141,000 | 4,533,150 | ||||||
Disco Corp. | 85,900 | 4,234,204 | ||||||
Hitachi Ltd. | 1,040,000 | 5,510,710 | ||||||
Horiba Ltd. | 112,300 | 3,059,658 | ||||||
Hoya Corp. | 212,000 | 4,291,520 | ||||||
Kyoto Kimono Yuzen Co., Ltd. | 300,700 | 3,634,918 | ||||||
Makita Corp. | 131,500 | 5,197,075 | ||||||
MISUMI Group, Inc. | 141,500 | 3,472,360 | ||||||
Omron Corp. | 212,200 | 4,226,456 | ||||||
SMC Corp. | 28,300 | 4,459,652 | ||||||
Takata Corp. | 225,900 | 4,125,795 | ||||||
| 59,252,932 | ||||||||
Luxembourg—1.1% | ||||||||
SAF-Holland SA(a) | 388,500 | 2,517,757 | ||||||
Netherlands—4.7% | ||||||||
Akzo Nobel NV | 77,000 | 4,188,732 | ||||||
Unilever NV—ADR | 165,000 | 6,053,850 | ||||||
| 10,242,582 | ||||||||
Norway—5.1% | ||||||||
Orkla ASA | 720,000 | 5,695,543 | ||||||
Statoil ASA—ADR | 225,000 | 5,523,750 | ||||||
| 11,219,293 | ||||||||
Singapore—1.9% | ||||||||
Singapore Post Ltd. | 4,345,000 | 4,060,748 | ||||||
Switzerland—4.8% | ||||||||
Nestle SA | 85,000 | 5,394,073 | ||||||
Novartis AG—ADR | 85,000 | 5,139,100 | ||||||
| 10,533,173 | ||||||||
United Kingdom—4.0% | ||||||||
Halfords Group PLC | 588,700 | 3,283,275 | ||||||
HSBC Holdings PLC—ADR | 50,000 | 2,468,000 | ||||||
Vodafone Group PLC—ADR | 109,500 | 2,980,590 | ||||||
| 8,731,865 | ||||||||
United States—6.1% | ||||||||
Aflac, Inc. | 98,000 | 4,878,440 | ||||||
Freeport-McMoRan Copper & Gold, Inc. | 89,900 | 3,495,312 | ||||||
Newmont Mining Corp. | 90,000 | 4,909,500 | ||||||
| 13,283,252 | ||||||||
Total Common Stocks | 201,950,977 | |||||||
The Accompanying Footnotes are an Integral Part of these Financial Statements.
| 30 | October 31, 2012 |
The Tocqueville International Value Fund
Schedule of Investments as of October 31, 2012
| Short-Term Investments—5.6% | Shares | Value | ||||||
Money Market Fund—0.7% | ||||||||
AIM STIT-Treasury Portfolio, 0.02%(b) | 1,555,411 | $ | 1,555,411 | |||||
| Repurchase Agreement—4.9% | Principal Amount | |||||||
Repurchase Agreement with U.S. Bank, N.A., 0.01% dated 10/31/2012, due 11/01/2012, collateralized by: Fannie Mae Conventional Level Pay 15 Year Fixed (Pool #555611) valued at $6,722,490. Repurchase proceeds of $6,591,135. Fannie Mae 30 Year Variable (Pool #2008-48) valued at $2,584,151. Repurchase proceeds of $2,533,492. Fannie Mae Conventional Level Pay 30 Year Fixed (Pool #695167) valued at $1,650,797. Repurchase proceeds of $1,618,377. | $ | 10,743,000 | 10,743,000 | |||||
Total Short-Term Investments | 12,298,411 | |||||||
Total Investments | 214,249,388 | |||||||
Other Assets in Excess of Liabilities—2.1% |
| 4,543,156 | ||||||
Total Net Assets—100.0% | $ | 218,792,544 | ||||||
|
| |||||||
Percentages are stated as a percent of net assets.
ADR—American Depository Receipt
| (a) | Non-income producing security. |
| (b) | Variable rate security. The rate listed is as of October 31, 2012. |
Schedule of Open Forward Currency Contracts
October 31, 2012
| Counterparty of Contract | Forward Expiration Date | Currency to be Received | Currency to be delivered | Amount of Currency to be Delivered | Amount of Currency to be Received | Unrealized Appreciation | ||||||||||||||||
U.S. Bank N.A. | 11/9/2012 | U.S. Dollars | Euro | 12,000,000 | 15,641,400 | $ | 86,391 | |||||||||||||||
U.S. Bank N.A. | 11/9/2012 | U.S. Dollars | Yen | 500,000,000 | 6,358,087 | 94,340 | ||||||||||||||||
|
| |||||||||||||||||||||
| $ | 180,731 | |||||||||||||||||||||
|
| |||||||||||||||||||||
The Accompanying Footnotes are an Integral Part of these Financial Statements.
| Annual Report | 31 |
The Tocqueville Gold Fund
Schedule of Investments as of October 31, 2012
| Common Stocks—89.0% | Shares | Value | ||||||
Gold Related Securities—79.9% |
| |||||||
Australia—0.2% | ||||||||
St. Barbara Ltd.(a) | 2,697,333 | $ | 5,305,963 | |||||
Canada—59.5% | ||||||||
Agnico Eagle Mines Ltd. | 893,000 | 50,445,570 | ||||||
Agnico Eagle Mines Ltd.(b) | 210,837 | 11,903,978 | ||||||
Alacer Gold Corp.(a) | 4,626,800 | 25,386,597 | ||||||
Alamos Gold, Inc. | 2,546,400 | 50,164,080 | ||||||
Atac Resources Ltd.(a)(c)(d)(e)(f) | 702,000 | 1,515,406 | ||||||
Atac Resources Ltd.(a)(c) | 10,261,700 | 22,603,996 | ||||||
B2Gold Corp.(a) | 10,267,100 | 42,464,726 | ||||||
Banro Corp.(a) | 8,383,000 | 39,064,780 | ||||||
Barisan Gold Corp.(a) | 877,100 | 131,730 | ||||||
Barrick Gold Corp. | 303,500 | 12,291,750 | ||||||
Blue Gold Mining, Inc.(a)(c) | 4,000,000 | 2,202,753 | ||||||
Brazilian Gold Corp.(a) | 4,285,800 | 793,865 | ||||||
Corvus Gold, Inc.(a)(c) | 2,079,901 | 3,431,837 | ||||||
Corvus Gold, Inc.(a)(b)(c) | 1,500,000 | 2,463,079 | ||||||
Dalradian Resources, Inc.(a) | 1,250,000 | 1,952,441 | ||||||
Detour Gold Corp.(a) | 2,669,900 | 75,225,017 | ||||||
East Asia Minerals Corp.(a)(c) | 10,544,400 | 2,269,883 | ||||||
Eldorado Gold Corp. | 8,324,885 | 123,374,796 | ||||||
Eldorado Gold Corp.(b) | 1,000,000 | 14,778,473 | ||||||
Franco-Nevada Corp. | 1,399,300 | 80,574,461 | ||||||
GoGold Resources, Inc. | 8,100,000 | 12,084,105 | ||||||
Goldcorp, Inc. | 718,050 | 32,477,402 | ||||||
Goldcorp, Inc.(b) | 2,138,010 | 96,651,966 | ||||||
IAMGOLD Corp. | 3,816,796 | 59,503,850 | ||||||
International Tower Hill Mines Ltd.(a)(c) | 5,738,836 | 13,945,372 | ||||||
International Tower Hill Mines Ltd.(a)(b)(c) | 5,666,667 | 13,730,497 | ||||||
International Tower Hill Mines Ltd.(a)(b)(c)(d)(e)(f) | 1,923,077 | 4,566,478 | ||||||
Kinross Gold Corp. | 3,382,600 | 33,792,174 | ||||||
New Gold, Inc.(a) | 5,440,240 | 63,814,015 | ||||||
Novagold Resources, Inc.(a) | 3,240,500 | 15,878,450 | ||||||
Orezone Gold Corp.(a) | 2,145,462 | 4,119,287 | ||||||
Osisko Mining Corp.(a) | 9,934,500 | 97,579,419 | ||||||
Pan American Silver Corp. | 2,248,098 | 49,458,156 | ||||||
Premier Gold Mines Ltd.(a) | 986,000 | 5,538,383 | ||||||
Primero Mining Corp.(a)(c) | 4,840,700 | 35,914,480 | ||||||
Regulus Resources, Inc.(a) | 2,609,000 | 1,005,722 | ||||||
Rockhaven Resources Ltd.(a)(c) | 5,000,000 | 1,226,533 | ||||||
Romarco Minerals, Inc.(a) | 16,887,800 | 16,124,471 | ||||||
Rubicon Minerals Corp.(a) | 100,000 | 354,443 | ||||||
SEMAFO, Inc. | 8,926,200 | 34,008,822 | ||||||
Silver Wheaton Corp. | 2,714,875 | 109,952,438 | ||||||
Strategic Metals Ltd.(a)(c) | 10,926,900 | 8,971,272 | ||||||
Sunward Resources Ltd.(a) | 660,800 | 827,034 | ||||||
| Common Stocks (continued) | Shares | Value | ||||||
Torex Gold Resources, Inc.(a)(c) | 25,250,600 | $ | 52,586,981 | |||||
Turquoise Hill Resources Ltd.(a) | 4,880,132 | 38,504,242 | ||||||
Wesdome Gold Mines Ltd.(a) | 1,469,700 | 1,383,247 | ||||||
Yamana Gold, Inc. | 4,317,500 | 87,256,675 | ||||||
| 1,454,295,132 | ||||||||
Peru—1.4% | ||||||||
Cia de Minas Buenaventura SA—ADR | 978,600 | 34,994,736 | ||||||
South Africa—2.1% | ||||||||
AngloGold Ashanti Ltd.—ADR | 487,000 | 16,548,260 | ||||||
Gold Fields Ltd.—ADR | 2,641,950 | 33,050,795 | ||||||
Gold Fields Ltd.(b) | 166,249 | 2,052,552 | ||||||
Harmony Gold Mining Co., Ltd. | 1 | 8 | ||||||
Witwatersrand Consolidated Gold Resources Ltd.(a) | 206,813 | 429,337 | ||||||
| 52,080,952 | ||||||||
United Kingdom—3.9% | ||||||||
Randgold Resources Ltd.—ADR | 802,100 | 95,923,139 | ||||||
United States—12.8% | ||||||||
Allied Nevada Gold Corp.(a) | 1,466,048 | 54,126,492 | ||||||
Electrum Ltd.(a)(d)(e)(f) | 2,127,287 | 5,530,946 | ||||||
Gold Resource Corp.(c) | 3,655,997 | 61,128,270 | ||||||
Newmont Mining Corp. | 1,777,800 | 96,978,990 | ||||||
Royal Gold, Inc. | 1,083,165 | 95,405,173 | ||||||
| 313,169,871 | ||||||||
Total Gold Related Securities | 1,955,769,793 | |||||||
Other Precious Metals Related Securities—7.9% |
| |||||||
Canada—7.2% | ||||||||
Bear Creek Mining Corp.(a)(c) | 6,061,800 | 21,485,629 | ||||||
Ivanplats Ltd.—Class A(a) | 7,147,300 | 33,204,978 | ||||||
Ivanplats Ltd.—Class B(a)(d)(e)(f) | 5,775,415 | 25,489,892 | ||||||
MAG Silver Corp.(a) | 1,218,000 | 15,590,400 | ||||||
Scorpio Mining Corp.(a)(c) | 25,668,419 | 27,208,524 | ||||||
Scorpio Mining Corp.(a)(b)(c) | 522,400 | 549,207 | ||||||
Silver Range Resources Ltd.(a)(c) | 3,450,000 | 967,209 | ||||||
Tahoe Resources, Inc.(a) | 2,474,100 | 50,435,720 | ||||||
| 174,931,559 | ||||||||
United States—0.7% | ||||||||
Sunshine Mining & Refining(a)(c)(d)(e)(f) | 1,633,545 | 17,560,609 | ||||||
Total Other Precious Metals Related Securities | 192,492,168 | |||||||
Other Securities—1.2% | ||||||||
Australia—0.2% | ||||||||
Ivanhoe Australia Ltd.(a) | 6,464,000 | 5,871,239 | ||||||
The Accompanying Footnotes are an Integral Part of these Financial Statements.
| 32 | October 31, 2012 |
The Tocqueville Gold Fund
Schedule of Investments as of October 31, 2012
| Common Stocks (continued) | Shares | Value | ||||||
United Kingdom—0.5% | ||||||||
Copper Development Corp.(a) | 12,512,000 | $ | 605,742 | |||||
West African Minerals Corp.(a) | 10,000,000 | 11,215,647 | ||||||
| 11,821,389 | ||||||||
United States—0.5% | ||||||||
Gold Bullion International LLC(a)(c)(d)(e)(f) | 5,000,000 | 5,837,000 | ||||||
GoviEx Uranium Inc.(a)(d)(e)(f) | 1,750,000 | 5,250,000 | ||||||
I-Pulse, Inc.(a)(d)(e)(f) | 74,532 | 237,757 | ||||||
| 11,324,757 | ||||||||
Total Other Securities | 29,017,385 | |||||||
Total Common Stocks | 2,177,279,346 | |||||||
Closed-End Mutual Fund—0.8% |
| |||||||
Gold Related Securities—0.8% |
| |||||||
Canada—0.8% | ||||||||
Sprott Physical Gold Trust(a) | 1,400,000 | 20,622,000 | ||||||
Total Closed End Mutual Fund | 20,622,000 | |||||||
Private Fund—1.0% | ||||||||
Gold Related Securities—1.0% |
| |||||||
United States—1.0% | ||||||||
Eidesis Special Opportunities II LP(a)(c)(d)(e)(f) | 25,000 | 23,716,245 | ||||||
Total Private Fund | 23,716,245 | |||||||
| Ounces | ||||||||
Gold Bullion—7.0% | ||||||||
Gold Bullion(a) | 98,735 | 169,888,061 | ||||||
Total Gold Bullion | 169,888,061 | |||||||
| Warrants—0.3% | Shares | |||||||
Gold Related Securities—0.3% |
| |||||||
Canada—0.3% | ||||||||
Atac Resources Ltd. | 351,000 | 35 | ||||||
Blue Gold Mining, Inc. | 2,000,000 | 41,652 | ||||||
| Warrants (continued) | Shares | Value | ||||||
East Asia Minerals Corp. | 6,500,000 | $ | 225,832 | |||||
GoGold Resources, Inc. | 4,050,000 | 2,698,648 | ||||||
Kinross Gold Corp. | 108,032 | 23,797 | ||||||
Pan American Silver Corp. | 133,333 | 349,970 | ||||||
Primero Mining Corp. | 1,848,400 | 3,257,256 | ||||||
Regulus Resources, Inc. | 1,304,500 | 96,393 | ||||||
Cayman Islands—0.0% | ||||||||
Endeavour Mining Corp. | 1,000,000 | 475,594 | ||||||
Total Gold Related Securities | 7,169,177 | |||||||
Other Precious Metals Related Securities—0.0% |
| |||||||
Canada—0.0% | ||||||||
Silver Range Resources Ltd. | ||||||||
Expiration: 02/10/2013, | 1,725,000 | 8,636 | ||||||
Total Other Precious Metals Related Securities | 8,636 | |||||||
Total Warrants | 7,177,813 | |||||||
The Accompanying Footnotes are an Integral Part of these Financial Statements.
| Annual Report | 33 |
The Tocqueville Gold Fund
Schedule of Investments as of October 31, 2012
| Short-Term Investments—2.2% | Principal Amount | Value | ||||||
Repurchase Agreement—2.2% |
| |||||||
Repurchase Agreement with U.S. Bank, N.A., 0.01% dated 10/31/2012, due 11/01/2012, collateralized by: Freddie Mac Giant Multilender Conventional 15 Year Fixed (Pool #G11649) valued at $16,831,490. Repurchase proceeds of $16,501,365. Freddie Mac Giant Conventional 30 Year Fixed (Pool #A87842) valued at $37,880,811. Repurchase proceeds of $37,140,650. | $ | 53,642,000 | $ | 53,642,000 | ||||
Total Short-Term Investments | 53,642,000 | |||||||
Total Investments |
| 2,452,325,465 | ||||||
Liabilities in Excess of Other Assets—(0.3)% |
| (6,412,655 | ) | |||||
Total Net Assets—100.0% | $ | 2,445,912,810 | ||||||
|
| |||||||
Percentages are stated as a percent of net assets.
ADR—American Depository Reciept
| (a) | Non-income producing security. |
| (b) | Denotes an issue that is traded on a foreign exchange when a company is listed more than once. |
| (c) | Affiliated company. See Footnote 8. |
| (d) | Denotes a security is either fully or partially restricted to resale. The aggregate value of restricted securites at October 31, 2012 was $93,116,863, which represented 3.8% of net assets. |
| (e) | Fair valued security.The aggregate value of fair valued securities as of October 31, 2012 was $93,116,863, which represented 3.8% of net assets. |
| (f) | Security is considered illiquid and may be difficult to sell. |
The Accompanying Footnotes are an Integral Part of these Financial Statements.
| 34 | October 31, 2012 |
The Delafield Fund
Schedule of Investments as of October 31, 2012
| Common Stocks—79.0% | Shares | Value | ||||||
Aerospace & Defense—2.4% |
| |||||||
Honeywell International, Inc. | 525,000 | $ | 32,151,000 | |||||
Building Products—0.7% |
| |||||||
Griffon Corp. | 965,900 | 9,803,885 | ||||||
Capital Markets—1.1% |
| |||||||
The Bank of New York Mellon Corp. | 600,000 | 14,826,000 | ||||||
Chemicals—15.3% | ||||||||
Ashland, Inc. | 425,000 | 30,238,750 | ||||||
Celanese Corp. | 665,000 | 25,263,350 | ||||||
Chemtura Corp.(a) | 1,350,000 | 21,505,500 | ||||||
Eastman Chemical Co. | 800,000 | 47,392,000 | ||||||
Ferro Corp.(a) | 1,600,000 | 4,208,000 | ||||||
HB Fuller Co. | 525,000 | 15,960,000 | ||||||
Minerals Technologies, Inc. | 325,000 | 23,289,500 | ||||||
OM Group, Inc.(a) | 375,000 | 7,586,250 | ||||||
PolyOne Corp. | 1,575,000 | 29,814,750 | ||||||
| 205,258,100 | ||||||||
Commercial Banks—0.7% |
| |||||||
Hancock Holding Co. | 310,000 | 9,792,900 | ||||||
Commercial Services & Supplies—4.0% |
| |||||||
ACCO Brands Corp.(a) | 2,800,000 | 20,272,000 | ||||||
Avery Dennison Corp. | 825,000 | 26,713,500 | ||||||
Tyco International Ltd.(b) | 250,000 | 6,717,500 | ||||||
| 53,703,000 | ||||||||
Communications Equipment—1.3% |
| |||||||
Harris Corp. | 375,000 | 17,167,500 | ||||||
Computers & Peripherals—0.9% |
| |||||||
Hewlett-Packard Co. | 550,000 | 7,617,500 | ||||||
Intermec, Inc.(a) | 622,700 | 4,221,906 | ||||||
| 11,839,406 | ||||||||
Construction & Engineering—1.1% |
| |||||||
Aegion Corp.(a) | 800,000 | 14,776,000 | ||||||
Containers & Packaging—4.6% |
| |||||||
Owens-Illinois, Inc.(a) | 1,100,000 | 21,439,000 | ||||||
Sealed Air Corp. | 1,750,000 | 28,385,000 | ||||||
Sonoco Products Co. | 400,000 | 12,452,000 | ||||||
| 62,276,000 | ||||||||
Electrical Equipment—3.4% |
| |||||||
Acuity Brands, Inc. | 300,000 | 19,410,000 | ||||||
Brady Corp. | 400,000 | 12,304,000 | ||||||
Hubbell, Inc. | 165,000 | 13,813,800 | ||||||
| 45,527,800 | ||||||||
Electronic Equipment, Instruments & Components—6.0% |
| |||||||
Checkpoint Systems, Inc.(a)(c) | 2,250,000 | 18,270,000 | ||||||
Flextronics International Ltd.(a)(b) | 4,000,000 | 23,080,000 | ||||||
Ingram Micro, Inc.(a) | 1,000,000 | 15,200,000 | ||||||
| Common Stocks (continued) | Shares | Value | ||||||
Kemet Corp.(a)(c) | 2,000,000 | $ | 9,080,000 | |||||
Plexus Corp.(a) | 600,000 | 16,146,000 | ||||||
| 81,776,000 | ||||||||
Industrial Conglomerates—2.0% |
| |||||||
Carlisle Companies, Inc. | 475,000 | 26,386,250 | ||||||
Insurance—1.4% |
| |||||||
XL Group PLC(b) | 750,000 | 18,555,000 | ||||||
Life Sciences Tools & Services—1.0% |
| |||||||
Thermo Fisher Scientific, Inc. | 225,000 | 13,738,500 | ||||||
Machinery—15.6% |
| |||||||
Albany International Corp. | 625,000 | 13,731,250 | ||||||
Crane Co. | 385,000 | 16,162,300 | ||||||
Dover Corp. | 590,000 | 34,349,800 | ||||||
Federal Signal Corp.(a) | 1,458,104 | 8,413,260 | ||||||
Harsco Corp. | 1,000,000 | 19,990,000 | ||||||
IDEX Corp. | 325,000 | 13,822,250 | ||||||
Ingersoll-Rand PLC(b) | 525,000 | 24,690,750 | ||||||
Kennametal, Inc. | 890,000 | 31,523,800 | ||||||
Stanley Black & Decker, Inc. | 435,000 | 30,145,500 | ||||||
Timken Co. | 450,000 | 17,770,500 | ||||||
| 210,599,410 | ||||||||
Metals & Mining—4.5% |
| |||||||
AM Castle & Co.(a) | 1,000,000 | 12,150,000 | ||||||
Carpenter Technology Corp. | 305,000 | 14,826,050 | ||||||
Kaiser Aluminum Corp. | 200,000 | 12,116,000 | ||||||
Molycorp, Inc.(a) | 700,000 | 7,280,000 | ||||||
Universal Stainless & Alloy(a)(c) | 425,000 | 14,620,000 | ||||||
| 60,992,050 | ||||||||
Professional Services—1.5% |
| |||||||
TrueBlue, Inc.(a)(c) | 1,550,000 | 20,227,500 | ||||||
Semiconductors & Semiconductor Equipment—6.1% |
| |||||||
Brooks Automation, Inc. | 1,650,000 | 11,913,000 | ||||||
Diodes, Inc.(a) | 775,000 | 11,749,000 | ||||||
Fairchild Semiconductor International, Inc.(a) | 1,700,000 | 19,992,000 | ||||||
Infineon Technologies AG(b) | 2,000,000 | 13,609,498 | ||||||
LTX-Credence Corp.(a)(c) | 2,150,000 | 11,975,500 | ||||||
Teradyne, Inc.(a) | 900,000 | 13,158,000 | ||||||
| 82,396,998 | ||||||||
Specialty Retail—1.9% |
| |||||||
Staples, Inc. | 2,250,000 | 25,908,750 | ||||||
Textiles, Apparel & Luxury Goods—0.9% |
| |||||||
Maidenform Brands, Inc.(a)(c) | 625,000 | 11,693,750 | ||||||
The Accompanying Footnotes are an Integral Part of these Financial Statements.
| Annual Report | 35 |
The Delafield Fund
Schedule of Investments as of October 31, 2012
| Common Stocks (continued) | Shares | Value | ||||||
Trading Companies & Distributors—2.6% |
| |||||||
Rush Enterprises, Inc.(a) | 600,000 | $ | 11,400,000 | |||||
WESCO International, Inc.(a) | 350,000 | 22,708,000 | ||||||
| 34,108,000 | ||||||||
Total Common Stocks | 1,063,503,799 | |||||||
Real Estate Investment Trust (REIT)—0.5% |
| |||||||
Real Estate—0.5% | ||||||||
Kimco Realty Corp. | 300,000 | 5,856,000 | ||||||
Total Real Estate Investment Trust | 5,856,000 | |||||||
Short-Term Investments—20.6% |
| |||||||
Money Market Funds—4.5% |
| |||||||
AIM STIT-Treasury Portfolio, 0.02%(d) | 61,170,006 | 61,170,006 | ||||||
| 61,170,006 | ||||||||
| U.S. Treasury Bills—11.1% | | Principal Amount | | |||||
0.081%, 11/8/2012(e) | $ | 100,000,000 | 99,998,448 | |||||
0.097%, 12/27/2012(e) | 50,000,000 | 49,992,583 | ||||||
| 149,991,031 | ||||||||
| Short-Term Investments (continued) | Principal Amount | Value | ||||||
Repurchase Agreement—5.0% |
| |||||||
Repurchase Agreement with U.S. Bank, N.A., 0.01% dated 10/31/2012, due 11/01/2012, collateralized by: Freddie Mac 30 Year Adjustable Rate Mortgage (Pool #1B2502) valued at $9,733,098. Repurchase proceeds of $9,542,654. Freddie Mac Conventional 15 Year Fixed (Pool #B13517) valued at $2,137,691. Repurchase proceeds of $2,095,669. Freddie Mac 30 Year Adjustable Rate Mortgage (Pool #782472) valued at $14,414,342. Repurchase proceeds of $14,132,240. Fannie Mae Conventional Level Pay 15 Year Fixed (Pool #AE7757) valued at $41,871,232. Repurchase proceeds of $41,052,456. | $ | 66,823,000 | $ | 66,823,000 | ||||
Total Short-Term Investments |
| 277,984,037 | ||||||
Total Investments |
| 1,347,343,836 | ||||||
Liabilities in Excess of Other Assets—(0.1)% |
| (1,070,400 | ) | |||||
Total Net Assets—100.0% | $ | 1,346,273,436 | ||||||
|
| |||||||
Percentages are stated as a percent of net assets.
| (a) | Non-income producing security. |
| (b) | Foreign issued security. Foreign concentration (including ADRs) was as follows: Germany 1.0%; Ireland 3.2%; Singapore 1.7%; Switzerland 0.5% |
| (c) | Affiliated company. See Footnote 8. |
| (d) | Variable rate security. The rate listed is as of October 31, 2012. |
| (e) | Rate shown is the effective yield based on purchase price. The calculation assumes the security is held to maturity. |
The Accompanying Footnotes are an Integral Part of these Financial Statements.
| 36 | October 31, 2012 |
The Tocqueville Select Fund
Schedule of Investments as of October 31, 2012
| Common Stocks—89.3% | Shares | Value | ||||||
Chemicals—9.6% |
| |||||||
Ashland, Inc. | 37,600 | $ | 2,675,240 | |||||
Celanese Corp. | 68,000 | 2,583,320 | ||||||
Minerals Technologies, Inc. | 40,000 | 2,866,400 | ||||||
| 8,124,960 | ||||||||
Commercial Services & Supplies—7.7% |
| |||||||
ACCO Brands Corp.(a) | 493,000 | 3,569,320 | ||||||
Avery Dennison Corp. | 89,600 | 2,901,248 | ||||||
| 6,470,568 | ||||||||
Communications Equipment—3.0% |
| |||||||
Harris Corp. | 54,624 | 2,500,687 | ||||||
Computers & Peripherals—2.5% |
| |||||||
Logitech International SA(b) | 296,000 | 2,134,160 | ||||||
Containers & Packaging—5.3% |
| |||||||
Owens-Illinois, Inc.(a) | 107,000 | 2,085,430 | ||||||
Sonoco Products Co. | 77,400 | 2,409,462 | ||||||
| 4,494,892 | ||||||||
Electrical Equipment—3.0% |
| |||||||
Acuity Brands, Inc. | 39,500 | 2,555,650 | ||||||
Electronic Equipment, Instruments & Components—5.1% |
| |||||||
Checkpoint Systems, Inc.(a)(c) | 255,000 | 2,070,600 | ||||||
Flextronics International Ltd.(a)(b) | 397,200 | 2,291,844 | ||||||
| 4,362,444 | ||||||||
Household Durables—4.1% |
| |||||||
Universal Electronics, Inc.(a) | 203,915 | 3,499,181 | ||||||
Industrial Conglomerates—3.5% |
| |||||||
Carlisle Companies, Inc. | 54,000 | 2,999,700 | ||||||
Internet Software & Services—4.9% |
| |||||||
j2 Global, Inc. | 96,300 | 2,892,852 | ||||||
XO Group, Inc.(a) | 158,000 | 1,271,900 | ||||||
| 4,164,752 | ||||||||
Leisure Equipment & Products—1.3% |
| |||||||
Summer Infant, Inc.(a)(c) | 739,933 | 1,139,497 | ||||||
Machinery—20.0% |
| |||||||
Albany International Corp. | 119,500 | 2,625,415 | ||||||
Harsco Corp. | 130,000 | 2,598,700 | ||||||
Ingersoll-Rand PLC(b) | 67,000 | 3,151,010 | ||||||
Kennametal, Inc. | 110,000 | 3,896,200 | ||||||
Stanley Black & Decker, Inc. | 39,900 | 2,765,070 | ||||||
Trimas Corp.(a) | 72,800 | 1,825,824 | ||||||
| 16,862,219 | ||||||||
Professional Services—4.3% |
| |||||||
Stantec, Inc.(b) | 106,600 | 3,651,050 | ||||||
Semiconductors & Semiconductor Equipment—1.9% |
| |||||||
Diodes, Inc.(a) | 102,800 | 1,558,448 | ||||||
| Common Stocks (continued) | Shares | Value | ||||||
Software—4.5% |
| |||||||
Monotype Imaging Holdings, Inc. | 249,000 | $ | 3,812,190 | |||||
Specialty Retail—5.0% |
| |||||||
Foot Locker, Inc. | 45,500 | 1,524,250 | ||||||
Staples, Inc. | 232,000 | 2,671,480 | ||||||
| 4,195,730 | ||||||||
Textiles, Apparel & Luxury Goods—3.6% |
| |||||||
Maidenform Brands, Inc.(a)(c) | 160,400 | 3,001,084 | ||||||
Total Common Stocks | 75,527,212 | |||||||
Short-Term Investments—11.0% |
| |||||||
Money Market Funds—0.2% |
| |||||||
AIM STIT-Treasury Portfolio, 0.02%(d) | 143,587 | 143,587 | ||||||
|
| Principal Amount |
| ||||||
U.S. Treasury Bills—5.9% |
| |||||||
0.091%, 12/27/2012(e) | $ | 5,000,000 | 4,999,303 | |||||
Repurchase Agreement—4.9% |
| |||||||
Repurchase Agreement with | 4,159,000 | 4,159,000 | ||||||
Total Short-Term Investments |
| 9,301,890 | ||||||
Total Investments | 84,829,102 | |||||||
Liabilities in Excess of Other Assets—(0.3)% |
| (280,589 | ) | |||||
Total Net Assets—100.0% | $ | 84,548,513 | ||||||
|
| |||||||
The Accompanying Footnotes are an Integral Part of these Financial Statements.
| Annual Report | 37 |
The Tocqueville Select Fund
Schedule of Investments as of October 31, 2012
Percentages are stated as a percent of net assets.
| (a) | Non-income producing security. |
| (b) | Foreign issued security. Foreign concentration was as follows: Canada 4.3%; Ireland 3.7%; Singapore 2.7%; Switzerland 2.5%. |
| (c) | Affiliated company. See Footnote 8. |
| (d) | Variable rate security. The rate shown is as of October 31, 2012. |
| (e) | Rate shown is the effective yield based on purchase price. The calculation assumes the security is held to maturity. |
The Accompanying Footnotes are an Integral Part of these Financial Statements.
| 38 | October 31, 2012 |
Percent of Total Investments
The Tocqueville Fund
Allocation of Portfolio Holdings
October 31, 2012

The Tocqueville Opportunity Fund
Allocation of Portfolio Holdings
October 31, 2012
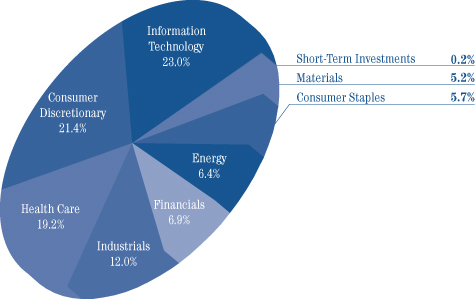
| Annual Report | 39 |
Percent of Total Investments
The Tocqueville International Value Fund
Allocation of Portfolio Holdings
October 31, 2012
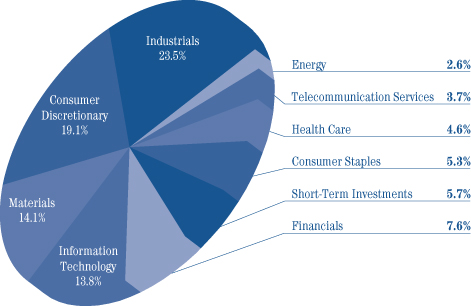
The Tocqueville Gold Fund
Allocation of Portfolio Holdings
October 31, 2012
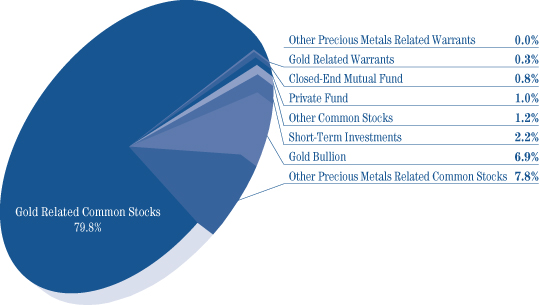
| 40 | October 31, 2012 |
Percent of Total Investments
The Delafield Fund
Allocation of Portfolio Holdings
October 31, 2012
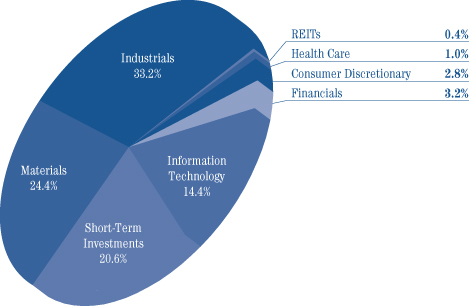
The Tocqueville Select Fund
Allocation of Portfolio Holdings
October 31, 2012
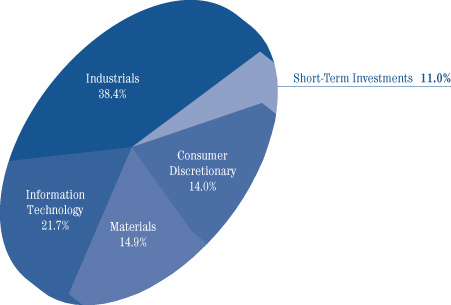
| Annual Report | 41 |
The Tocqueville Trust
Statements of Assets and Liabilities
October 31, 2012
| The Tocqueville Fund | Opportunity Fund | International Value Fund | Gold Fund | Delafield Fund | Select Fund | |||||||||||||||||||
Assets: | ||||||||||||||||||||||||
Investments, at value (1) | ||||||||||||||||||||||||
Unaffiliated issuers | $ | 365,469,366 | $ | 65,471,069 | $ | 214,249,388 | $ | 2,124,910,794 | $ | 1,211,835,076 | $ | 73,126,106 | ||||||||||||
Affiliated issuers | — | — | — | 327,414,671 | 135,508,760 | 11,702,996 | ||||||||||||||||||
Foreign currencies, at value (2) | — | — | 91,064 | — | — | — | ||||||||||||||||||
Cash | 69 | 21,490 | — | 216,849 | — | — | ||||||||||||||||||
Appreciation on forward currency contracts | — | — | 180,731 | — | — | — | ||||||||||||||||||
Receivable for investments sold | 1,029,497 | 257,759 | 1,100,545 | 171 | 322,692 | — | ||||||||||||||||||
Receivable for foreign currencies sold | — | — | — | — | — | — | ||||||||||||||||||
Receivable for fund shares sold | 127,077 | 7,482 | 3,423,309 | 8,700,402 | 3,419,407 | 157,588 | ||||||||||||||||||
Dividends, interest and other receivables | 373,977 | 52,597 | 846,527 | 15 | 518,443 | 36,890 | ||||||||||||||||||
Prepaid assets | 24,495 | 12,839 | 18,715 | 85,817 | 47,965 | 15,591 | ||||||||||||||||||
|
|
|
|
|
|
|
|
|
|
|
| |||||||||||||
Total Assets | 367,024,481 | 65,823,236 | 219,910,279 | 2,461,328,719 | 1,351,652,343 | 85,039,171 | ||||||||||||||||||
|
|
|
|
|
|
|
|
|
|
|
| |||||||||||||
Liabilities: | ||||||||||||||||||||||||
Payable for investments purchased | — | 246,399 | 557,203 | 7,194,676 | 896,325 | — | ||||||||||||||||||
Currency payable | — | — | — | 317,806 | — | — | ||||||||||||||||||
Payable for fund shares redeemed | 524,678 | 31,475 | 230,354 | 5,032,486 | 2,931,758 | 376,497 | ||||||||||||||||||
Payable to Adviser | 239,890 | 43,445 | 183,627 | 1,542,188 | 819,050 | 57,988 | ||||||||||||||||||
Payable to Administrator | 62,614 | 10,957 | 32,976 | 386,853 | 227,953 | 14,478 | ||||||||||||||||||
Payable to Trustees | 13,212 | 1,656 | 7,470 | 82,770 | 42,629 | 2,676 | ||||||||||||||||||
Payable to Chief Compliance Officer | 1,116 | 207 | 601 | 6,781 | 3,907 | 257 | ||||||||||||||||||
Accrued distribution fee | 39,428 | 11,618 | 34,465 | 147,143 | 97,474 | 9,412 | ||||||||||||||||||
Accrued expenses and other liabilities | 118,955 | 22,869 | 71,039 | 705,206 | 359,811 | 29,350 | ||||||||||||||||||
|
|
|
|
|
|
|
|
|
|
|
| |||||||||||||
Total Liabilities | 999,893 | 368,626 | 1,117,735 | 15,415,909 | 5,378,907 | 490,658 | ||||||||||||||||||
|
|
|
|
|
|
|
|
|
|
|
| |||||||||||||
Net Assets | $ | 366,024,588 | $ | 65,454,610 | $ | 218,792,544 | $ | 2,445,912,810 | $ | 1,346,273,436 | $ | 84,548,513 | ||||||||||||
|
|
|
|
|
|
|
|
|
|
|
| |||||||||||||
Net assets consist of: | ||||||||||||||||||||||||
Paid in capital | $ | 335,547,042 | $ | 62,762,322 | $ | 223,856,101 | $ | 1,703,316,359 | $ | 1,127,464,181 | $ | 77,381,996 | ||||||||||||
Accumulated net investment income (loss) | 3,422,977 | (413,759 | ) | 2,440,944 | (38,731,318 | ) | (1,480,317 | ) | (282,004 | ) | ||||||||||||||
Accumulated net realized gain (loss) | (24,093,410 | ) | (5,189,655 | ) | (16,220,957 | ) | 48,066,852 | 79,838,335 | 3,153,041 | |||||||||||||||
Net unrealized appreciation on: | ||||||||||||||||||||||||
Investments and foreign currency related items | 51,147,979 | 8,295,702 | 8,716,456 | 733,260,917 | 140,451,237 | 4,295,480 | ||||||||||||||||||
|
|
|
|
|
|
|
|
|
|
|
| |||||||||||||
Net assets | $ | 366,024,588 | $ | 65,454,610 | $ | 218,792,544 | $ | 2,445,912,810 | $ | 1,346,273,436 | $ | 84,548,513 | ||||||||||||
|
|
|
|
|
|
|
|
|
|
|
| |||||||||||||
Shares of beneficial interest outstanding (unlimited shares of $0.01 par value authorized) | 15,181,432 | 4,154,429 | 18,729,375 | 33,588,741 | 45,190,266 | 7,450,170 | ||||||||||||||||||
Net asset value, offering and redemption price per share | $ | 24.11 | $ | 15.76 | $ | 11.68 | $ | 72.82 | $ | 29.79 | $ | 11.35 | ||||||||||||
|
|
|
|
|
|
|
|
|
|
|
| |||||||||||||
(1) Cost of investments | ||||||||||||||||||||||||
Unafilliated issuers | $ | 314,321,387 | $ | 57,175,367 | $ | 205,705,389 | $ | 1,368,894,702 | $ | 1,057,657,644 | $ | 65,795,879 | ||||||||||||
Affiliated issuers | $ | — | $ | — | $ | — | $ | 350,169,195 | $ | 149,234,955 | $ | 14,737,743 | ||||||||||||
(2) Cost of foreign currencies | $ | — | $ | — | $ | 90,643 | $ | — | $ | — | $ | — | ||||||||||||
The Accompanying Notes are an Integral Part of these Financial Statements.
| 42 | October 31, 2012 |
The Tocqueville Trust
Statements of Operations
For the Year Ended October 31, 2012
| The Tocqueville Fund | Opportunity Fund | International Value Fund | Gold Fund | Delafield Fund | Select Fund | |||||||||||||||||||
Investment Income: | ||||||||||||||||||||||||
Dividends* | ||||||||||||||||||||||||
Unaffiliated issuers | $ | 10,078,884 | $ | 352,201 | $ | 6,460,554 | $ | 14,000,760 | $ | 14,353,517 | $ | 778,258 | ||||||||||||
Affiliated issuers | — | 170 | — | 2,433,803 | 432,500 | 72,530 | ||||||||||||||||||
Interest | 474 | 13 | 1,831 | 7,632 | 78,878 | 3,796 | ||||||||||||||||||
|
|
|
|
|
|
|
|
|
|
|
| |||||||||||||
Total investment income | 10,079,358 | 352,384 | 6,462,385 | 16,442,195 | 14,864,895 | 854,584 | ||||||||||||||||||
|
|
|
|
|
|
|
|
|
|
|
| |||||||||||||
Expenses: | ||||||||||||||||||||||||
Investment Adviser’s fee (See Note 4) | 2,924,864 | 470,256 | 2,093,170 | 17,170,369 | 9,631,426 | 681,313 | ||||||||||||||||||
Distribution fees (See Note 4) | 974,954 | 156,752 | 523,292 | 5,738,603 | 3,367,856 | 212,910 | ||||||||||||||||||
Administration fees (See Note 4) | 584,973 | 94,051 | 313,976 | 3,443,162 | 2,020,714 | 127,746 | ||||||||||||||||||
Transfer agent and shareholder services fees | 215,752 | 18,102 | 88,722 | 1,265,229 | 680,237 | 50,685 | ||||||||||||||||||
Professional fees | 58,056 | 14,626 | 33,959 | 343,158 | 182,779 | 17,621 | ||||||||||||||||||
Trustee fees and expenses | 48,060 | 8,507 | 25,874 | 274,291 | 169,352 | 10,870 | ||||||||||||||||||
Printing and mailing expense | 45,001 | 3,256 | 20,821 | 325,185 | 159,623 | 8,845 | ||||||||||||||||||
Registration fees | 36,355 | 26,147 | 37,717 | 153,442 | 76,797 | 33,024 | ||||||||||||||||||
Custody fees | 32,852 | 14,795 | 55,546 | 314,071 | 88,983 | 8,083 | ||||||||||||||||||
Fund accounting fees | 32,270 | 16,957 | 40,165 | 170,250 | 103,651 | 7,964 | ||||||||||||||||||
Insurance expense | 8,947 | 1,028 | 3,763 | 44,669 | 25,356 | 1,923 | ||||||||||||||||||
Other expenses (See Note 10) | 38,844 | 4,556 | 29,606 | 110,541 | 60,896 | 3,862 | ||||||||||||||||||
|
|
|
|
|
|
|
|
|
|
|
| |||||||||||||
Total expenses before waiver | 5,000,928 | 829,033 | 3,266,611 | 29,352,970 | 16,567,670 | 1,164,846 | ||||||||||||||||||
Less: Fees waived (See Note 4) | (104,090 | ) | — | — | — | — | — | |||||||||||||||||
|
|
|
|
|
|
|
|
|
|
|
| |||||||||||||
Net expenses | 4,896,838 | 829,033 | 3,266,611 | 29,352,970 | 16,567,670 | 1,164,846 | ||||||||||||||||||
|
|
|
|
|
|
|
|
|
|
|
| |||||||||||||
Net Investment Income (Loss) | 5,182,520 | (476,649 | ) | 3,195,774 | (12,910,775 | ) | (1,702,775 | ) | (310,262 | ) | ||||||||||||||
|
|
|
|
|
|
|
|
|
|
|
| |||||||||||||
Realized and Unrealized Gain (Loss): | ||||||||||||||||||||||||
Net realized gain (loss) on: | ||||||||||||||||||||||||
Investments | ||||||||||||||||||||||||
Unaffiliated issuers | 7,286,484 | (13,082 | ) | (8,537,244 | ) | 50,607,728 | 94,633,800 | 5,128,238 | ||||||||||||||||
Affililiated issuers | — | 15,196 | — | (2,540,295 | ) | (14,119,253 | ) | (1,735,333 | ) | |||||||||||||||
Forward currency contracts | — | — | 490,802 | — | — | — | ||||||||||||||||||
Foreign currency translation | (70 | ) | (5,396 | ) | (307,146 | ) | (466,384 | ) | (49,760 | ) | 302 | |||||||||||||
|
|
|
|
|
|
|
|
|
|
|
| |||||||||||||
| 7,286,414 | (3,282 | ) | (8,353,588 | ) | 47,601,049 | 80,464,787 | 3,393,207 | |||||||||||||||||
Net change in unrealized appreciation (depreciation) on: | ||||||||||||||||||||||||
Investments | 21,609,077 | 2,019,954 | 4,422,692 | (260,640,816 | ) | 51,049,033 | (456,174 | ) | ||||||||||||||||
Forward currency contracts | — | — | 75,132 | — | — | — | ||||||||||||||||||
Foreign currency translation | — | 28,433 | (3,367,653 | ) | (23,213,970 | ) | 216,037 | — | ||||||||||||||||
|
|
|
|
|
|
|
|
|
|
|
| |||||||||||||
| 21,609,077 | 2,048,387 | 1,130,171 | (283,854,786 | ) | 51,265,070 | (456,174 | ) | |||||||||||||||||
Net gain (loss) on investments and foreign currency | 28,895,491 | 2,045,105 | (7,223,417 | ) | (236,253,737 | ) | 131,729,857 | 2,937,033 | ||||||||||||||||
|
|
|
|
|
|
|
|
|
|
|
| |||||||||||||
Net Increase (Decrease) in Net Assets Resulting from Operations | $ | 34,078,011 | $ | 1,568,456 | $ | (4,027,643 | ) | $ | (249,164,512 | ) | $ | 130,027,082 | $ | 2,626,771 | ||||||||||
|
|
|
|
|
|
|
|
|
|
|
| |||||||||||||
* Net of foreign taxes withheld of: | $ | 113,237 | $ | 1,632 | $ | 752,448 | $ | 1,512,520 | $ | 5,625 | $ | 7,846 | ||||||||||||
|
|
|
|
|
|
|
|
|
|
|
| |||||||||||||
The Accompanying Notes are an Integral Part of these Financial Statements.
| Annual Report | 43 |
The Tocqueville Trust
Statements of Changes in Net Assets
| The Tocqueville Fund | Opportunity Fund | |||||||||||||||
| For the Year Ended October 31, 2012 | For the Year Ended October 31, 2011 | For the Year Ended October 31, 2012 | For the Year Ended October 31, 2011 | |||||||||||||
Operations: | ||||||||||||||||
Net investment income (loss) | $ | 5,182,520 | $ | 5,079,622 | $ | (476,649 | ) | $ | (424,842 | ) | ||||||
Net realized gain (loss) on sale of investments and foreign currency | 7,286,414 | 17,652,719 | (3,282 | ) | 3,042,114 | |||||||||||
Net change in unrealized appreciation (depreciation) | 21,609,077 | 207,732 | 2,048,387 | 1,600,782 | ||||||||||||
|
|
|
|
|
|
|
| |||||||||
Net increase (decrease) in net assets resulting from operations | 34,078,011 | 22,940,073 | 1,568,456 | 4,218,054 | ||||||||||||
Dividends and distributions to shareholders: | ||||||||||||||||
Net investment income | (5,526,502 | ) | (7,457,179 | ) | — | — | ||||||||||
Net realized gains | — | — | — | — | ||||||||||||
|
|
|
|
|
|
|
| |||||||||
Total dividends and distributions | (5,526,502 | ) | (7,457,179 | ) | — | — | ||||||||||
Fund share transactions: | ||||||||||||||||
Shares sold | 56,283,828 | 104,940,298 | 29,832,239 | 17,172,239 | ||||||||||||
Shares issued to holders in reinvestment of dividends | 4,694,231 | 6,567,494 | – | – | ||||||||||||
Shares redeemed* | (215,046,320 | ) | (125,118,930 | ) | (12,908,921 | ) | (7,290,932 | ) | ||||||||
|
|
|
|
|
|
|
| |||||||||
Net increase (decrease) from capital share transactions | (154,068,261 | ) | (13,611,138 | ) | 16,923,318 | 9,881,307 | ||||||||||
|
|
|
|
|
|
|
| |||||||||
Net increase (decrease) in net assets | (125,516,752 | ) | 1,871,756 | 18,491,774 | 14,099,361 | |||||||||||
Net Assets: | ||||||||||||||||
Beginning of year | 491,541,340 | 489,669,584 | 46,962,836 | 32,863,475 | ||||||||||||
|
|
|
|
|
|
|
| |||||||||
End of year** | $ | 366,024,588 | $ | 491,541,340 | $ | 65,454,610 | $ | 46,962,836 | ||||||||
|
|
|
|
|
|
|
| |||||||||
* Net of redemption fees of: | $ | 27,989 | $ | 54,120 | $ | 15,791 | $ | 2,364 | ||||||||
|
|
|
|
|
|
|
| |||||||||
** Including undistributed net investment income (loss) of: | $ | 3,422,977 | $ | 4,136,952 | $ | (413,759 | ) | $ | — | |||||||
|
|
|
|
|
|
|
| |||||||||
The Accompanying Notes are an Integral Part of these Financial Statements.
| 44 | October 31, 2012 |
The Tocqueville Trust
Statements of Changes in Net Assets
| International Value Fund | Gold Fund | Delafield Fund | Select Fund | |||||||||||||||||||||||||||
| For the Year Ended October 31, 2012 | For the Year Ended October 31, 2011 | For the Year Ended October 31, 2012 | For the Year Ended October 31, 2011 | For the Year Ended October 31, 2012 | For the Year Ended October 31, 2011 | For the Year Ended October 31, 2012 | For the Year Ended October 31, 2011 | |||||||||||||||||||||||
| $ | 3,195,774 | $ | 1,851,852 | $ | (12,910,775 | ) | $ | (22,318,902 | ) | $ | (1,702,775 | ) | $ | (3,728,541 | ) | $ | (310,262 | ) | $ | (462,741 | ) | |||||||||
| (8,353,588 | ) | 4,385,228 | 47,601,049 | 41,808,457 | 80,464,787 | 22,888,560 | 3,393,207 | 764,193 | ||||||||||||||||||||||
| 1,130,171 | (15,807,028 | ) | (283,854,786 | ) | (16,530,651 | ) | 51,265,070 | (40,431,393 | ) | (456,174 | ) | (5,381,939 | ) | |||||||||||||||||
|
|
|
|
|
|
|
|
|
|
|
|
|
|
|
| |||||||||||||||
| (4,027,643 | ) | (9,569,948 | ) | (249,164,512 | ) | 2,958,904 | 130,027,082 | (21,271,374 | ) | 2,626,771 | (5,080,487 | ) | ||||||||||||||||||
| (2,105,224 | ) | (831,651 | ) | — | — | — | — | — | — | |||||||||||||||||||||
| — | — | (42,282,689 | ) | (46,368,277 | ) | (16,542,579 | ) | — | (766,158 | ) | (2,112,007 | ) | ||||||||||||||||||
|
|
|
|
|
|
|
|
|
|
|
|
|
|
|
| |||||||||||||||
| (2,105,224 | ) | (831,651 | ) | (42,282,689 | ) | (46,368,277 | ) | (16,542,579 | ) | — | (766,158 | ) | (2,112,007 | ) | ||||||||||||||||
| 70,782,405 | 107,151,161 | 768,183,795 | 1,494,120,323 | 362,662,133 | 714,889,299 | 30,896,673 | 60,470,466 | |||||||||||||||||||||||
| 1,547,905 | 615,614 | 39,153,702 | 42,874,881 | 15,316,165 | — | 675,793 | 2,067,329 | |||||||||||||||||||||||
| (47,252,825 | ) | (47,620,593 | ) | (717,055,407 | ) | (1,046,110,637 | ) | (408,065,143 | ) | (364,415,732 | ) | (20,438,315 | ) | (25,579,690 | ) | |||||||||||||||
|
|
|
|
|
|
|
|
|
|
|
|
|
|
|
| |||||||||||||||
| 25,077,485 | 60,146,182 | 90,282,090 | 490,884,567 | (30,086,845 | ) | 350,473,567 | 11,134,151 | 36,958,105 | ||||||||||||||||||||||
|
|
|
|
|
|
|
|
|
|
|
|
|
|
|
| |||||||||||||||
| 18,944,618 | 49,744,583 | (201,165,111 | ) | 447,475,194 | 83,397,658 | 329,202,193 | 12,994,764 | 29,765,611 | ||||||||||||||||||||||
| 199,847,926 | 150,103,343 | 2,647,077,921 | 2,199,602,727 | 1,262,875,778 | 933,673,585 | 71,553,749 | 41,788,138 | |||||||||||||||||||||||
|
|
|
|
|
|
|
|
|
|
|
|
|
|
|
| |||||||||||||||
| $ | 218,792,544 | $ | 199,847,926 | $ | 2,445,912,810 | $ | 2,647,077,921 | $ | 1,346,273,436 | $ | 1,262,875,778 | $ | 84,548,513 | $ | 71,553,749 | |||||||||||||||
|
|
|
|
|
|
|
|
|
|
|
|
|
|
|
| |||||||||||||||
| $ | 27,394 | $ | 153,900 | $ | 698,471 | $ | 3,132,177 | $ | 155,189 | $ | 277,875 | $ | 15,430 | $ | 48,586 | |||||||||||||||
|
|
|
|
|
|
|
|
|
|
|
|
|
|
|
| |||||||||||||||
| $ | 2,440,944 | $ | 1,155,644 | $ | (38,731,318 | ) | $ | (26,998,621 | ) | $ | (1,480,317 | ) | $ | — | $ | (282,004 | ) | $ | (8,797 | ) | ||||||||||
|
|
|
|
|
|
|
|
|
|
|
|
|
|
|
| |||||||||||||||
The Accompanying Notes are an Integral Part of these Financial Statements.
| Annual Report | 45 |
The Tocqueville Trust
The Tocqueville Fund
The Tocqueville Opportunity Fund
The Tocqueville International Value Fund
The Tocqueville Gold Fund
The Delafield Fund
The Tocqueville Select Fund
Notes to Financial Statements
1. ORGANIZATION
The Tocqueville Trust (the “Trust”) is a Massachusetts business trust registered under the Investment Company Act of 1940 and organized on September 17, 1986, currently consisting of six separate funds (each, a “Fund” or, collectively, the “Funds”). Each Fund is an open-end management investment company with a different investment objective. The Tocqueville Fund, The Tocqueville Opportunity Fund (the “Opportunity Fund”), The Tocqueville International Value Fund (the “International Fund”), and The Delafield Fund are classified as diversified investment companies. The Tocqueville Gold Fund (the “Gold Fund”) and The Tocqueville Select Fund (the “Select Fund”) are classified as non-diversified investment companies. The Tocqueville Fund’s investment objective is long-term capital appreciation which it seeks to achieve by investing primarily in securities of United States issuers. The Opportunity Fund’s investment objective is to achieve long-term capital appreciation which it seeks to achieve by investing in the common stocks of small and mid cap companies which have the potential to deliver superior long term earnings growth. The International Fund’s investment objective is long-term capital appreciation consistent with preservation of capital which it seeks to achieve by investing primarily in securities of non-U.S. issuers. The Gold Fund’s investment objective is long-term capital appreciation which it seeks to achieve by investing in gold, securities of companies located throughout the world that are engaged in mining or processing gold (“gold related securities”), other precious metals and securities of companies located throughout the world that are engaged in mining or processing such other precious metals (“other precious metal securities”). The Delafield Fund’s investment objectives are to seek long-term preservation of capital (sufficient growth to outpace inflation over an extended period of time) and growth of capital which it seeks to achieve by investing primarily in the equity securities of domestic companies. The Tocqueville Select Fund’s investment objective is to achieve long-term capital appreciation by investing in a focused group of common stocks issued primarily by small and mid-sized U.S. companies. Current income is a secondary objective for The Tocqueville Select Fund.
On June 22, 2009, the Board of Directors of Delafield Fund, Inc. approved an Agreement and Plan of Reorganization providing for, among other things, the transfer of the assets and liabilities of Delafield Fund, Inc. into The Delafield Fund, a series of The Tocqueville Trust. On September 24, 2009, the shareholders of Delafield Fund, Inc. approved the Agreement and Plan of Reorganization. On July 9, 2009, the Board of Trustees of Delafield Select Fund, a series of Natixis Funds Trust II, approved an Agreement and Plan of Reorganization providing for, among other things, the transfer of the assets and liabilities of Delafield Select Fund into the sole share class of The Select Fund (now The Tocqueville Select Fund), a series of The Tocqueville Trust. On September 24, 2009, the shareholders of Delafield Select Fund approved the Agreement and Plan of Reorganization. The effective date of both reorganizations was September 28, 2009. Transfers into The Delafield Fund and The Select Fund from their predecessor funds amounted to $649,892,191 and $25,888,388, respectively.
The Delafield Fund, a series of the Trust, commenced operations on September 28, 2009 as successor to Delafield Fund, Inc. The predecessor Delafield Fund, Inc. commenced operations on November 19, 1993.
The Tocqueville Select Fund, a series of the Trust, commenced operations on September 28, 2009 as successor to the Delafield Select Fund, a series of Natixis Funds Trust II. The predecessor Delafield Select Fund commenced operations on September 29, 2008 for Class A and Class C shares and on September 26, 2008 for Class Y shares. Prior to September 29, 2008, the predecessor Delafield Select Fund operated as a Delaware limited partnership using substantially the same investment objectives and investment policies as the predecessor fund. The limited partnership was incepted in July 1998.
Effective October 12, 2010, the investment strategy of the Opportunity Fund was changed as described in the supplements dated August 12, 2010 to the Trust’s prospectus and statement of additional information. The Opportunity
| 46 | October 31, 2012 |
Fund will invest primarily in stocks of small and mid capitalization companies, as measured at the time of initial purchase. The Fund seeks to invest in companies which management feels are market leaders in growth industries and have consistent growth in sales and earnings.
2. SIGNIFICANT ACCOUNTING POLICIES
The following is a summary of significant accounting principles followed by the Trust in the preparation of its financial statements.
a) Security valuation
Investments in securities, including foreign securities, traded on an exchange or quoted on the over-the-counter market are valued at the last sale price or, if no sale occurred during the day, at the mean between closing bid and asked prices, as last reported by a pricing service approved by the Trustees. Securities that are principally traded on the National Association of Securities Dealers Automated Quotation National Market (“NASDAQ”) are generally valued at the NASDAQ Official Closing Price (“NOCP”). Investments in gold and silver are valued on the basis of the respective closing spot prices of the New York Commodity Exchange. Investments in other precious metals are valued at their respective market values determined on the basis of the mean between the last current bid and asked prices based on dealer or exchange quotations. When market quotations are not readily available, or when restricted securities or other assets are being valued, such assets are valued at fair value as determined in good faith by or under procedures approved by the Trustees. Short-term securities maturing within 60 days are valued on an amortized cost basis. Fixed income securities with maturities greater than 60 days are valued at market price.
Trading in securities on European and Far Eastern securities exchanges normally is completed before the calculation of the Funds’ net asset value. Trading on these foreign exchanges may not take place on all days on which there is regular trading on the New York Stock Exchange (“NYSE”), or may take place on days on which there is no regular trading on the NYSE. Similarly, the Funds may hold securities traded in domestic markets where the market may close early on a given day prior to calculation of the Funds’ net asset value. Events affecting the value of such securities held by the Funds that occur between the close of trading in the security and the close of trading on the NYSE normally will not be reflected in the Funds’ calculation of the net asset value. Significant events will be closely monitored, and where it is determined that an adjustment should be made to the security’s value because significant interim events may materially affect the value of the security, the security will be priced at its fair value in accordance with the procedures approved by the Trustees.
Investment and shareholder transactions are recorded on trade date. Dividend income is recognized on the ex-dividend date and interest income is recognized on an accrual basis.
b) Repurchase agreements
The Funds may enter into repurchase agreements with institutions that the Adviser has determined are creditworthy. Each repurchase agreement is recorded at cost. Under the terms of a typical repurchase agreement, the Fund acquires a debt security subject to an obligation of the seller to repurchase, and of the Fund to resell, the security at an agreed-upon price and time, thereby determining the yield during the Fund’s holding period. When entering into repurchase agreements, it is the Fund’s policy that its custodian or a third party custodian, acting on the Fund’s behalf, take possession of the underlying collateral securities, the market value of which, at all times, at least equals the principal
| Annual Report | 47 |
amount of the repurchase transaction, including accrued interest. To the extent that any repurchase transaction maturity exceeds one business day, the value of the collateral is marked to market and measured against the value of the agreement in an effort to ensure the adequacy of the collateral. If the counterparty defaults, the Fund generally has the right to use the collateral to satisfy the terms of the repurchase transaction.
c) Restricted and illiquid securities
The Funds may invest in securities that are subject to legal or contractual restrictions on resale or are illiquid. A security may be considered illiquid if it lacks a readily available market or if its valuation has not changed for a certain period of time. Disposal of these securities may involve time consuming negotiations and expense, and a prompt sale at the current valuation may be difficult.
d) Fair valuation pricing inputs
The Trust has adopted authoritative fair valuation accounting standards which establish an authoritative definition of fair value and set out a hierarchy for measuring fair value. These standards require additional disclosures about the various inputs and valuation techniques used to develop the measurements of fair value and a discussion in changes in valuation techniques and related inputs during the period. These inputs are summarized in the three broad levels listed below.
| Level 1 - | Quoted prices in active markets for identical securities. |
| Level 2 - | Other significant observable inputs (including quoted prices for similar securities, interest rates, prepayment speeds, credit risk, etc.). |
| Level 3 - | Significant unobservable inputs (including the Fund’s own assumptions in determining the fair value of investments). |
Equity investments, including common stocks, foreign issued common stocks, exchange-traded funds, closed end mutual funds and real estate investments trusts, which are traded on an exchange are valued at the last sale price reported by the exchange on which the securities are primarily traded on the day of valuation. If there are no sales on a given day for securities traded on an exchange, the mean between the latest bid and ask price will be used. If there is no Nasdaq Official Closing Price for a Nasdaq-listed security or sale price available for an over-the-counter security, the mean of the latest bid and asked quotations from Nasdaq will be used. When using the market quotations or closing price provided by the pricing service and when the market is considered active, the security will be classified as a Level 1 security. On days when the closing price of the S&P 500 moves more than 1% from its previous close, common stocks of the International Value Fund which are traded on non-North American exchanges may be valued using matrix pricing formulas provided by an independent pricing service. These securities will generally be classified as Level 2 securities. Gold bullion is valued at the mean of the closing bid and ask prices from the New York Mercantile Exchange and is classified as a Level 1.
Investment in mutual funds, including money market funds, are generally priced at the ending net asset value (NAV) provided by the service agent of the funds and will be classified as Level 1 securities.
Debt securities, such as corporate bonds, convertible bonds and U.S. government agency issues for which market quotations are not readily available may be valued based on information supplied by independent pricing services using matrix pricing formulas and/or independent broker bid quotations. Debt securities with remaining maturities of 60 days or less may be valued on an amortized cost basis, which involves valuing an instrument at its cost and thereafter assuming a constant amortization to maturity of any discount or premium, regardless of the impact of fluctuating rates on the fair value of the instrument. Warrants for which the underlying security is registered and equities which are subject to a
| 48 | October 31, 2012 |
required holding period, but have a comparable public issue, are valued in good faith by the Advisor pursuant to procedures established under the general supervision and responsibility of the Funds’ Board of Trustees. These securities will generally be classified as Level 2 securities. Forward currency contracts derive their value from the underlying currency prices. These are valued by a pricing service using pricing models. The models use inputs that are observed from active markets, such as exchange rates. These contracts are classified as Level 2.
Any securities or other assets for which market quotations are not readily available are valued at fair value as determined in good faith by the Advisor pursuant to procedures established under the general supervision and responsibility of the Funds’ Board of Trustees and will be classified as Level 3 securities. In determining fair value, a Fund will seek to assign a value to the security which it believes represents the amount that the Fund could reasonably expect to receive upon its current sale. With respect to securities that are actively traded on U.S. exchanges, the Funds expect that market quotations will generally be available and that fair value might be used only in limited circumstances, such as when trading for a security is halted during the trading day.
The Gold Fund currently invests in a private fund that primarily invests in physical gold and is subject to redemption restrictions. This private fund investment is subject to an initial holding period of one year and, thereafter, can only be disposed of on the last day of a given month with notice given 25 business days in advance of redemption. If the Gold Fund redeems the investment before the end of the initial holding period, it would incur a penalty of 4% to 1% of the net worth of the investment to be withdrawn on the withdrawal date. This restriction expires on December 31, 2012. This investment is currently valued at $23,716,245, which represents 1.0% of the Gold Fund’s net assets.
For securities traded principally on foreign exchanges, the Funds may use fair value pricing if an event occurs after the close of trading of the principal foreign exchange on which a security is traded, but before calculation of a Fund’s NAV, which a Fund believes affects the value of the security since its last market quotation. Such events may involve situations relating to a single issuer (such as news related to the issuer announced after the close of the principal foreign exchange), or situations relating to sectors of the market or the markets in generals (such as significant fluctuations in the U.S. or foreign markets or significant changes in exchange rates, natural disasters, armed conflicts, or governmental actions).
In determining whether a significant event has occurred with respect to securities traded principally in foreign markets, the Funds may engage a third party fair value service provider to systematically recommend the adjustment of closing market prices of non-U.S. securities based upon changes in a designated U.S. securities market index occuring from the time of close of the relevant foreign market and the close of the NYSE. Fair value pricing may also be used to value restricted securities held by the Funds or securities with little or no trading activity for extended periods of time. Fair value pricing involves judgements that are inherently subjective and inexact and it is not possible to determine with certainty when, and to what extent, an event will affect a market price. As a result, there can be no assurance that fair value pricing will reflect actual market value and it is possible that the fair value determined for a security may differ materially from the value that could be realized upon the sale of the security.
The following is a summary of the inputs used, as of October 31, 2012, involving the Funds’ assets carried at fair value. The inputs of methodology used for valuing securities may not be an indication of the risk associated with investing in those securities.
| Description | Level 1 | Level 2 | Level 3 | Total | ||||||||||||
The Tocqueville Fund | ||||||||||||||||
Common Stocks* | $ | 363,576,366 | $ | — | $ | — | $ | 363,576,366 | ||||||||
Warrants* | — | — | — | — | ||||||||||||
Repurchase Agreement | — | 1,893,000 | — | 1,893,000 | ||||||||||||
|
|
|
|
|
|
|
| |||||||||
Total Fund | $ | 363,576,366 | $ | 1,893,000 | $ | — | $ | 365,469,366 | ||||||||
|
|
|
|
|
|
|
| |||||||||
| Annual Report | 49 |
| The Tocqueville Opportunity Fund | Level 1 | Level 2 | Level 3 | Total | ||||||||||||
Common Stocks | ||||||||||||||||
Consumer Discretionary | $ | 14,002,943 | $ | — | $ | — | $ | 14,002,943 | ||||||||
Consumer Staples | 3,762,251 | — | — | 3,762,251 | ||||||||||||
Energy | 4,180,669 | — | — | 4,180,669 | ||||||||||||
Financials | 4,507,336 | — | — | 4,507,336 | ||||||||||||
Health Care | 12,559,084 | — | — | 12,559,084 | ||||||||||||
Industrials | 7,870,898 | — | — | 7,870,898 | ||||||||||||
Information Technology | 14,416,858 | 620,634 | — | 15,037,492 | ||||||||||||
Materials | 3,444,396 | — | — | 3,444,396 | ||||||||||||
|
|
|
|
|
|
|
| |||||||||
Total Common Stocks | 64,744,435 | 620,634 | — | 65,365,069 | ||||||||||||
Repurchase Agreement | — | 106,000 | — | 106,000 | �� | |||||||||||
|
|
|
|
|
|
|
| |||||||||
Total Fund | $ | 64,744,435 | $ | 726,634 | $ | — | $ | 65,471,069 | ||||||||
|
|
|
|
|
|
|
| |||||||||
| The Tocqueville International Value Fund | Level 1 | Level 2 | Level 3 | Total | ||||||||||||
Common Stocks* | 201,950,977 | — | — | 201,950,977 | ||||||||||||
Money Market Fund | 1,555,411 | — | — | 1,555,411 | ||||||||||||
Repurchase Agreement | — | 10,743,000 | — | 10,743,000 | ||||||||||||
|
|
|
|
|
|
|
| |||||||||
Total Fund | $ | 203,506,388 | $ | 10,743,000 | $ | — | $ | 214,249,388 | ||||||||
|
|
|
|
|
|
|
| |||||||||
Other Financial Instruments** | ||||||||||||||||
Forward Currency Contracts | — | $ | 180,731 | — | $ | 180,731 | ||||||||||
|
|
|
|
|
|
|
| |||||||||
| The Tocqueville Gold Fund | Level 1 | Level 2 | Level 3 | Total | ||||||||||||
Common Stocks | ||||||||||||||||
Gold Related | $ | 1,944,156,963 | $ | 6,081,884 | $ | 5,530,946 | $ | 1,955,769,793 | ||||||||
Other Precious Metals Related | 149,441,667 | 25,489,892 | 17,560,609 | 192,492,168 | ||||||||||||
Other | 17,692,628 | — | 11,324,757 | 29,017,385 | ||||||||||||
|
|
|
|
|
|
|
| |||||||||
Total Common Stocks | 2,111,291,258 | 31,571,776 | 34,416,312 | 2,177,279,346 | ||||||||||||
Closed End Mutual Fund* | 20,622,000 | — | — | 20,622,000 | ||||||||||||
Private Fund* | — | — | 23,716,245 | 23,716,245 | ||||||||||||
Warrants* | — | 7,177,813 | — | 7,177,813 | ||||||||||||
Gold Bullion | | 169,888,061 | | | — | | — | 169,888,061 | ||||||||
Repurchase Agreement | — | 53,642,000 | — | 53,642,000 | ||||||||||||
|
|
|
|
|
|
|
| |||||||||
Total Fund | $ | 2,301,801,319 | $ | 92,391,589 | $ | 58,132,557 | $ | 2,452,325,465 | ||||||||
|
|
|
|
|
|
|
| |||||||||
| 50 | October 31, 2012 |
| The Delafield Fund | Level 1 | Level 2 | Level 3 | Total | ||||||||||||
Common Stocks* | $ | 1,063,503,799 | $ | — | $ | — | $ | 1,063,503,799 | ||||||||
Real Estate Investment Trust (REIT) | 5,856,000 | — | — | 5,856,000 | ||||||||||||
U.S. Treasury Bills | — | 149,991,031 | — | 149,991,031 | ||||||||||||
Money Market Fund | 61,170,006 | — | — | 61,170,006 | ||||||||||||
Repurchase Agreement | — | 66,823,000 | — | 66,823,000 | ||||||||||||
|
|
|
|
|
|
|
| |||||||||
Total Fund | $ | 1,130,529,805 | $ | 216,814,031 | $ | — | $ | 1,347,343,836 | ||||||||
|
|
|
|
|
|
|
| |||||||||
| The Tocqueville Select Fund | Level 1 | Level 2 | Level 3 | Total | ||||||||||||
Common Stocks* | $ | 75,527,212 | $ | — | $ | — | $ | 75,527,212 | ||||||||
U.S. Treasury Bills | — | 4,999,303 | — | 4,999,303 | ||||||||||||
Money Market Fund | 143,587 | — | — | 143,587 | ||||||||||||
Repurchase Agreement | — | 4,159,000 | — | 4,159,000 | ||||||||||||
|
|
|
|
|
|
|
| |||||||||
Total Fund | $ | 75,670,799 | $ | 9,158,303 | $ | — | $ | 84,829,102 | ||||||||
|
|
|
|
|
|
|
| |||||||||
| * | For further information regarding portfolio characteristics, please see the accompanying Schedules of Investments. |
| ** | Other financial instruments are derivative instruments not reflected in the Schedule of Investments, such as forward currency contracts, which are reflected at the unrealized appreciation (depreciation) on the instrument. |
Below is a reconciliation that details the transfer of securities between Level 1 and Level 2 during the reporting period.
| The Tocqueville Fund | The Tocqueville Opportunity Fund | The Tocqueville International Value Fund | The Tocqueville Gold Fund | The Delafield Fund | The Tocqueville Select Fund | |||||||||||||||||||
Transfers Into Level 1 | $ | — | $ | — | $ | 92,962,198 | $ | 185,180,641 | $ | — | $ | — | ||||||||||||
Transfers Out of Level 1 | — | — | — | — | — | — | ||||||||||||||||||
|
|
|
|
|
|
|
|
|
|
|
| |||||||||||||
Net Transfers Into/(Out of ) Level 1 | — | — | 92,962,198 | 185,180,641 | — | — | ||||||||||||||||||
|
|
|
|
|
|
|
|
|
|
|
| |||||||||||||
Transfers Into Level 2 | — | 620,634 | — | 28,284,933 | — | — | ||||||||||||||||||
Transfers Out of Level 2 | — | — | (92,962,198 | ) | (172,090,814 | ) | — | — | ||||||||||||||||
|
|
|
|
|
|
|
|
|
|
|
| |||||||||||||
Net Transfers Into/(Out of ) Level 2 | $ | — | $ | 620,634 | $ | (92,962,198 | ) | $ | (143,805,881 | ) | $ | — | $ | — | ||||||||||
|
|
|
|
|
|
|
|
|
|
|
| |||||||||||||
| Annual Report | 51 |
Below is a reconciliation that details the activity of securities in Level 3 during the current fiscal period:
| The Tocqueville Fund | The Tocqueville Opportunity Fund | The Tocqueville International Value Fund | The Tocqueville Gold Fund | The Delafield Fund | The Tocqueville Select Fund | |||||||||||||||||||
Beginning Balance—November 1, 2011 | $ | — | $ | 810,000 | $ | — | $ | 59,870,579 | $ | — | $ | — | ||||||||||||
Purchases | — | — | — | 40,548,934 | — | — | ||||||||||||||||||
Sales | — | — | — | — | — | — | ||||||||||||||||||
Realized gains | — | — | — | — | — | — | ||||||||||||||||||
Realized losses | — | — | — | — | — | — | ||||||||||||||||||
Change in unrealized appreciation (depreciation) | — | (189,366 | ) | — | (912,196 | ) | — | — | ||||||||||||||||
Transfers in/(out) of Level 3 | — | (620,634 | ) | — | (41,374,760 | ) | — | — | ||||||||||||||||
|
|
|
|
|
|
|
|
|
|
|
| |||||||||||||
Ending Balance—October 31, 2012 | $ | — | $ | — | $ | — | $ | 58,132,557 | $ | — | $ | — | ||||||||||||
|
|
|
|
|
|
|
|
|
|
|
| |||||||||||||
The change in unrealized appreciation (depreciation) for Level 3 assets still held at October 31, 2012, and still classified as Level 3, for the Tocqueville Gold Fund was $(11,770,527).
The movement from Level 2 to Level 1 in the International Value Fund was due to non-North American traded securities being fair valued on October 31, 2011 and not on October 31, 2012. The movement from Level 2 to Level 1 in the Gold Fund was due to the release of restrictions on the securities and to the recategorization of gold bullion to Level 1. The movement from Level 3 to Levels 2 and 1 in the Gold Fund was from the conversion of subscription receipts to warrants and common stock. The movement from Level 3 to Level 2 in the Opportunity Fund was due to the initial public offering of a privately held company.
Transfers between levels are recognized at the end of the reporting period.
e) Derivative instruments and hedging activities
The Funds’ Adviser may use derivative instruments, such as purchased options, written options and forward currency contracts, as a means to manage exposure to different types of risk, including market risk and exchange rate risk. The Trust has adopted disclosure standards in order to enable the investor to understand how and why an entity used derivatives, how derivatives are accounted for, and derivatives affect an entity’s results of operations and financial position.
In the Opportunity Fund, the Adviser used purchased put options to adjust market risk on the underlying equity security that was held in the Fund.
In the International Value Fund, the Adviser used forward currency contracts to adjust exposure to foreign exchange rate risk.
The Tocqueville Opportunity Fund
Balance Sheet—Values of Derivative Instruments as of October 31, 2012.
The Tocqueville Opportunity Fund does not hold any derivative instruments as of October 31, 2012.
| 52 | October 31, 2012 |
The Effect of Derivative Insturments on the Statement of Operations for the year ended October 31, 2012
| Realized Gain (Loss) | ||||||||
| Purchased Options | Written Options | |||||||
Equity Contracts | $ | (3,702 | ) | $ | — | |||
|
|
|
| |||||
Total | $ | (3,702 | ) | $ | — | |||
|
|
|
| |||||
The Tocqueville International Value Fund
Balance Sheet—Values of Derivative Instruments as of October 31, 2012.
| Asset Derivatives | Liability Derivatives | |||||||||||
| Derivatives not accounted for as hedging instruments | Balance Sheet Location | Value | Balance Sheet Location | Value | ||||||||
Forward Currency Contracts | Appreciation on forward currency contracts | $ | 180,731 | $ | — | |||||||
|
|
|
| |||||||||
Total | $ | 180,731 | $ | — | ||||||||
|
|
|
| |||||||||
The Effect of Derivative Instruments on the Statement of Operations for the year ended October 31, 2012.
| Net Realized Gain on Forward Currency Contracts | Net Change in Unrealized Appreciation on Forward Currency Contracts | |||||||
Foreign Currency Forward Contract | $ | 490,802 | $ | 75,132 | ||||
|
|
|
| |||||
Total | $ | 490,802 | $ | 75,132 | ||||
|
|
|
| |||||
Derivatives Risk
The risks of using the types of derivatives in which the Funds may engage include the risk that movements in the value of the derivative may not fully offset or complement instruments currently held in the Funds in the manner intended by the Adviser; the risk that the counterparty to a derivative contract may fail to comply with their obligations to the Fund; the risk that the derivative may not possess a liquid secondary market at a time when the Fund would look to disengage the position; the risk that additional capital from the Fund may be called upon to fulfill the conditions of the derivative contract; and the risk that the cost of the derivative contracts may reduce the overall returns experienced by the Funds. The measurement of risks associated with these instruments is meaningful only when all related offsetting transactions are considered. The use of purchased put options creates leverage in the Funds. The use of forward currency contracts does not create leverage in the Funds.
| Annual Report | 53 |
The average monthly market value of purchased and written options during the year ended October 31, 2012 were as follows
| The Tocqueville Opportunity Fund | ||||
Purchased Options | $ | 292 | ||
Written Options | — | |||
The average monthly notional amount of forward currency contracts during the year ended October 31, 2012 was as follows:
| The Tocqueville International Value Fund | ||||
Long Positions | $ | 918,600 | ||
Forward Currency Contracts | ||||
Short Positions | $ | 14,286,536 | ||
Forward Currency Contracts | ||||
f) Foreign currency translation
Investments and other assets and liabilities denominated in foreign currencies are translated to U.S. dollars at the prevailing rates of exchange, in accordance with the Trust’s Portfolio Securities Valuation and Foreign Exchange Contracts Procedures. The Tocqueville Fund, The Tocqueville International Value Fund, The Tocqueville Gold Fund and The Delafield Fund have engaged in transactions in securities denominated in foreign currencies and, as a result, entered into foreign exchange contracts. These Funds are exposed to additional market risk as a result of changes in the value of the underlying currency in relation to the U.S. dollar. Risks include potential inability of counterparties to meet the terms of their contracts. The value of foreign currency contracts are marked-to-market on a daily basis, which reflects the changes in the market value of the contract at the close of each day’s trading, resulting in daily unrealized gains and/or losses. When the contracts are closed, the Funds recognize a realized gain or loss.
The Funds do not isolate that portion of the results of operations resulting from changes in foreign exchange rates on investments from the fluctuations arising from changes in market prices of securities held. Such fluctuations are included with the net realized and unrealized gain or loss from investments.
Reported net realized foreign exchange gains or losses arise from sales of foreign currencies, currency gains or losses realized between the trade and settlement dates on securities transactions, the differences between the amounts of dividends, interest, and foreign withholding taxes recorded on the Fund’s books, and the U.S. dollar equivalent of the amounts actually received or paid. Net unrealized foreign exchange gains and losses arise from changes in the value of assets and liabilities other than investments in securities at the end of the fiscal period, resulting from changes in the exchange rates.
g) Written option accounting
The Tocqueville Opportunity Fund, The Tocqueville International Value Fund, The Tocqueville Select Fund and The Tocqueville Gold Fund may write (sell) covered call options to hedge portfolio investments. When the Funds write (sell) an option, an amount equal to the premium received by the Funds is included in the Statements of Assets and Liabilities as
| 54 | October 31, 2012 |
an asset and an equivalent liability. The amount of the liability is subsequently marked-to-market to reflect the current value of the option written. By writing an option, the Funds may become obligated during the term of the option to deliver or purchase the securities underlying the option at the exercise price if the option is exercised. Option contracts are valued at the last sales price reported on the date of obligation. If the seller defaults and the value of the collateral declines or if bankruptcy proceedings are commenced with respect to the seller of the security, realization of the collateral by the Funds may be delayed or limited.
h) Dividends and distributions to Shareholders
Dividends to shareholders are recorded on the ex-dividend date. Dividends from net investment income are declared and paid annually by the Funds. Distributions of net realized capital gains, if any, will be declared and paid at least annually. Income and capital gain distributions are determined in accordance with income tax regulations which may differ from generally accepted accounting principles. Permanent differences between financial and tax reporting may result in reclassification to capital stock.
i) Use of estimates
The preparation of financial statements in conformity with accounting principles generally accepted in the United States of America requires management to make estimates and assumptions that affect the reported amounts of assets and liabilities and disclosure of contingent assets and liabilities at the date of the financial statements and the reported amounts of revenues and expenses during the reporting period. Actual results could differ from those estimates.
j) Indemnification
In the normal course of business the Funds enter into contracts that contain general indemnification clauses. The Funds’ maximum exposure under these arrangements is unknown, as this would involve future claims against a Fund that have not yet occurred. Based on experience, the Funds expect the risk of loss to be remote.
k) Recent Accounting Pronouncement
In May 2011, the FASB issued ASU No. 2011-04 “Amendments to Achieve Common Fair Value Measurement and Disclosure Requirements” in GAAP and the International Financial Reporting Standards (“IFRSs”). ASU No. 2011-04 amends FASB ASC Topic 820, Fair Value Measurements and Disclosures, to establish common requirements for measuring fair value and for disclosing information about fair value measurements in accordance with GAAP and IFRSs. Specifically, the ASU requires reporting entities to disclose i) the amounts of any transfers between Level 1 and Level 2, and the reasons for the transfers, ii) for Level 3 fair value measurements, a) quantitative information about significant unobservable inputs used, b) a description of the valuation processes used by the reporting entity and c) a narrative description of the sensitivity of the fair value measurement to changes in unobservable inputs if a change in those inputs might result in a significantly higher or lower fair value measurement. The effective date of the ASU is for interim and annual periods beginning after December 15, 2011. At this time, management is evaluating the implications of this guidance and the impact it will have on the financial statement amounts and footnote disclosures.
| Annual Report | 55 |
l) Subsequent Events Evaluation
In preparing these financial statements, the Trust has evaluated events and transactions for potential recognition or disclosure resulting from subsequent events after the statement of assets and liabilities date of October 31, 2012.
On December 20, 2012, the Trust declared and paid distributions from ordinary income and net realized capital gains to shareholders of record as of December 19, 2012, as follows:
| Ordinary income | Long-term capital gain | |||||||
The Tocqueville Fund | $ | 5,030,132 | $ | — | ||||
Opportunity Fund | — | — | ||||||
International Value Fund | 3,270,289 | — | ||||||
Gold Fund | — | 53,161,700 | ||||||
The Delafield Fund | — | 80,535,193 | ||||||
Select Fund | — | 6,451,599 | ||||||
On December 27, 2012 the Trust filed a supplement to its prospectus dated February 28, 2012. The supplement stated that, effective January 1, 2013, Tocqueville Asset Management L.P. (the “Advisor”) has contractually agreed to waive its advisory fees and/or reimburse operating expenses in order to ensure that The Tocqueville International Value Fund’s annual operating expenses do not exceed 1.25% of its average daily net assets.
3. FEDERAL INCOME TAX
There is no tax liability resulting from unrecognized tax benefits relating to uncertain income tax positions taken or expected to be taken on the tax return for the fiscal year-end October 31, 2012, or for any other tax years which are open for exam. As of October 31, 2012, open tax years include the tax years ended October 31, 2009 through 2012. The Trust is also not aware of any tax positions for which it is reasonably possible that the total amounts of unrecognized tax benefits will significantly change in the next six months. The Fund recognizes interest and penalties, if any, related to unrecognized tax benefits as income tax expense in the Statement of Operations. During the period, the Funds did not incur any interest or penalties.
Provision for federal income taxes or excise taxes has not been made since the Funds have elected to be taxed as Regulated Investment Companies and intend to distribute substantially all taxable income to shareholders and otherwise comply with the provisions of the Internal Revenue Code applicable to Regulated Investment Companies. Distributions from net realized gains for book purposes may include short-term capital gains which are included as ordinary income to shareholders for tax purposes. Additionally, U.S. generally accepted accounting principles require that certain components of net assets relating to permanent differences be reclassified between financial and tax reporting. These reclassifications have no effect on net assets or net asset value per share. For the period ended October 31, 2012, the following table shows the reclassifications made:
| 56 | October 31, 2012 |
| Undistributed Net Investment Income/(Loss) | Accumulated Net Realized Gain/(Loss) | Paid In Capital | ||||||||||
Tocqueville Fund | $ | (369,993 | ) | $ | 369,993 | $ | — | |||||
Opportunity Fund | 62,890 | (358 | ) | (62,532 | ) | |||||||
International Value Fund | 194,750 | (184,233 | ) | (10,517 | ) | |||||||
Gold Fund | 1,178,078 | 466,383 | (1,644,461 | ) | ||||||||
Delafield Fund | 222,458 | (226,820 | ) | 4,362 | ||||||||
Select Fund | 37,055 | (852 | ) | (36,203 | ) | |||||||
The permanent differences primarily relate to net operating losses and foreign currency reclasses.
As of October 31, 2012, the components of accumulated earnings (losses) for income tax purposes were as follows:
| Tocqueville Fund | Opportunity Fund | International Value Fund | Gold Fund | Delafield Fund | Select Fund | |||||||||||||||||||
Tax cost of investments | $ | 314,428,795 | $ | 57,284,392 | $ | 206,498,483 | $ | 1,762,889,825 | $ | 1,207,589,382 | $ | 80,832,159 | ||||||||||||
|
|
|
|
|
|
|
|
|
|
|
| |||||||||||||
Unrealized appreciation | 70,662,725 | 11,134,061 | 24,625,645 | 953,942,757 | 214,838,649 | 12,604,632 | ||||||||||||||||||
Unrealized depreciation | (19,622,154 | ) | (2,947,384 | ) | (16,874,740 | ) | (264,507,117 | ) | (75,084,195 | ) | (8,607,689 | ) | ||||||||||||
|
|
|
|
|
|
|
|
|
|
|
| |||||||||||||
Net unrealized appreciation | 51,040,571 | 8,186,677 | 7,750,905 | 689,435,640 | 139,754,454 | 3,996,943 | ||||||||||||||||||
|
|
|
|
|
|
|
|
|
|
|
| |||||||||||||
Undistributed operating income | 3,422,977 | — | 3,019,379 | — | — | — | ||||||||||||||||||
Undistributed long-term gains | — | — | — | 53,161,462 | 80,535,118 | 3,451,578 | ||||||||||||||||||
|
|
|
|
|
|
|
|
|
|
|
| |||||||||||||
Distributable earnings | 3,422,977 | — | 3,019,379 | 53,161,462 | 80,535,118 | 3,451,578 | ||||||||||||||||||
|
|
|
|
|
|
|
|
|
|
|
| |||||||||||||
Other accumulated gain/(loss) | (23,986,002 | ) | (5,494,389 | ) | (15,833,841 | ) | (651 | ) | (1,480,317 | ) | (282,004 | ) | ||||||||||||
|
|
|
|
|
|
|
|
|
|
|
| |||||||||||||
Total accumulated gain/(loss) | $ | 30,477,546 | $ | 2,692,288 | $ | (5,063,557 | ) | $ | 742,596,451 | $ | 218,809,255 | $ | 7,166,517 | |||||||||||
|
|
|
|
|
|
|
|
|
|
|
| |||||||||||||
The difference between book-basis and tax-basis unrealized appreciation is attributable primarily to wash sale deferrals and passive foreign investment companies (PFIC’s).
| Annual Report | 57 |
The tax character of distributions paid during the periods ended October 31, 2012 and 2011 was as follows:
| October 31, 2012 | ||||||||||||
| Ordinary Income | Long Term Capital Gain | Total | ||||||||||
Tocqueville Fund | $ | 5,526,502 | $ | — | $ | 5,526,502 | ||||||
Opportunity Fund | — | — | — | |||||||||
International Value Fund | 2,105,224 | — | 2,105,224 | |||||||||
Gold Fund | 15,486,206 | 26,796,483 | 42,282,689 | |||||||||
Delafield Fund | — | 16,542,579 | 16,542,579 | |||||||||
Select Fund | — | 766,158 | 766,158 | |||||||||
| October 31, 2011 | ||||||||||||
| Ordinary Income | Long Term Capital Gain | Total | ||||||||||
Tocqueville Fund | $ | 7,457,179 | $ | — | $ | 7,457,179 | ||||||
Opportunity Fund | — | — | — | |||||||||
International Value Fund | 831,651 | — | 831,651 | |||||||||
Gold Fund | — | 46,368,277 | 46,368,277 | |||||||||
Delafield Fund | — | — | — | |||||||||
Select Fund | 282,014 | 1,829,993 | 2,112,007 | |||||||||
The Fund designated as long-term capital gain dividend, pursuant to Internal Revenue Code Section 852(b)(3), the amount necessary to reduce the earnings and profits of the Funds related to net capital gain to zero for the tax years ended October 31, 2012 and 2011.
At October 31, 2012 the Opportunity Fund, Delafield Fund and Select Fund had net Post-October capital losses of $413,759, $1,480,317, and $273,207, respectively.
At October 31, 2012 certain Funds had tax basis capital losses which may be carried forward to offset future capital gains as shown below.
| Capital losses Expiring | ||||||||||||
| 10/31/2017 | Indefinite ST | Indefinite LT | ||||||||||
Tocqueville Fund | 23,986,002 | — | — | |||||||||
Opportunity Fund | 5,080,630 | — | — | |||||||||
International Value Fund | 7,254,600 | 5,364,413 | 3,206,554 | |||||||||
To the extent that Funds listed above may realize future net capital gains, those gains will be offset by any of their unused respective capital loss carryforwards
On December 22, 2010, the Regulated Investment Company Modernization Act of 2010 (the “Act”) was enacted, which changed various technical rules governing the tax treatment of RICs. The changes are generally effective for
| 58 | October 31, 2012 |
taxable years beginning after the date of enactment. One of the more prominent changes addresses capital loss carryforwards. Under the Act, each Fund will be permitted to carry forward capital losses incurred in taxable years beginning after the date of enactment for an unlimited period. However, any losses incurred during those future taxable years will be required to be utilized prior to the losses incurred in pre-enactment years, which carry an expiration date. As a result of this ordering rule, pre-enactment capital loss carryforwards may be more likely to expire unused. Additionally, post-enactment capital loss carryforwards will retain their character as either short-term or long-term capital losses rather than being considered all short-term as permitted under previous regulation.
4. INVESTMENT ADVISORY AND OTHER AGREEMENTS
Tocqueville Asset Management L.P. (“Tocqueville”) is the investment adviser (the “Adviser”) to the Trust under Investment Advisory Agreements approved by shareholders. For its services, Tocqueville receives fees from The Tocqueville Fund, calculated daily and payable monthly, at an annual rate of 0.75% on the first $1 billion of the average daily net assets of the Fund, and 0.65% of the average daily net assets in excess of $1 billion. Tocqueville receives fees from The Tocqueville Opportunity Fund, calculated daily and payable monthly, at an annual rate of 0.75% on the first $500 million of the average daily net assets of the Fund, and 0.65% of the average daily net assets in excess of $500 million. Tocqueville receives fees from The Tocqueville International Value Fund, calculated daily and payable monthly, at an annual rate of 1.00% on the first $1 billion of the average daily net assets of the Fund, and 0.75% of the average daily net assets in excess of $1 billion. Tocqueville receives fees from The Tocqueville Gold Fund, calculated daily and payable monthly, at an annual rate of 1.00% on the first $500 million of the average daily net assets of the Fund, 0.75% of the average daily net assets in excess of $500 million but not exceeding $1 billion, and 0.65% of the average daily net assets in excess of $1 billion. Tocqueville receives fees from The Delafield Fund, calculated daily and payable monthly, at an annual rate of 0.80% on the first $250 million of net assets of the Fund; 0.75% on the next $250 million of net assets of the Fund; 0.70% on the next $500 million of net assets of the Fund; and 0.65% on all net assets of the Fund over $1 billion. Tocqueville receives fees from The Tocqueville Select Fund, calculated daily and payable monthly, at an annual rate of 0.80% on all net assets of the Fund.
With respect to The Tocqueville Fund, effective October 31, 2011, the Adviser has contractually agreed to waive its advisory fees and/or reimburse expenses in order to ensure that The Tocqueville Fund’s total annual operating expenses do not exceed 1.25% of its average daily net assets. The Expense Limitation Agreement was renewed effective October 31, 2012 and will remain in effect until March 1, 2014. For the fiscal year ended October 31, 2012, the Adviser waived $104,090 of the advisory fee. Such amount is not subject to recoupment by the Adviser.
Pursuant to an Administrative Services Agreement, each Fund pays to the Adviser a fee computed and paid monthly at an annual rate of 0.15% of the average daily net assets of the Fund. For the year ended October 31, 2012, the Adviser has made payments of $94,034, $15,121, $50,461, $553,389, $324,826 and $20,534 to U.S. Bancorp Fund Services, LLC for services provided under a Sub-Administration Agreement for The Tocqueville Fund, The Tocqueville Opportunity Fund, The Tocqueville International Value Fund, The Tocqueville Gold Fund, The Delafield Fund and The Tocqueville Select Fund, respectively.
Tocqueville Securities, L.P. (the “Distributor”), an affiliate of Tocqueville, acts as distributor for shares of the Trust. Each Fund adopted a distribution and service plan pursuant to Rule 12b-1 of the 1940 Act. Pursuant to the plans, each Fund pays to the Distributor distribution and service fees of 0.25% per annum of its average daily net assets.
Commissions earned by the Distributor for services rendered as a registered broker-dealer in securities transactions for The Tocqueville Fund, The Tocqueville Opportunity Fund, The Tocqueville International Value Fund, The
| Annual Report | 59 |
Tocqueville Gold Fund, The Delafield Fund and The Tocqueville Select Fund for the year ended October 31, 2012, were $222,074, $57,903, $38,499, $23,208, $70,123 and $35,088, respectively.
5. CAPITAL SHARE TRANSACTIONS.
Transactions in capital shares for each Fund were as follows:
| For the Year Ended October 31, 2012 | For the Year Ended October 31, 2011 | |||||||
| The Tocqueville Fund | Shares | Shares | ||||||
Shares sold | 2,417,617 | 4,607,900 | ||||||
Shares issued to holders in reinvestment dividends | 210,977 | 295,833 | ||||||
Shares redeemed | (9,561,092 | ) | (5,531,619 | ) | ||||
|
|
|
| |||||
Net decrease | (6,932,498 | ) | (627,886 | ) | ||||
| The Tocqueville Opportunity Fund | ||||||||
Shares sold | 1,838,335 | 1,140,439 | ||||||
Shares issued to holders in reinvestment dividends | – | – | ||||||
Shares redeemed | (823,770 | ) | (489,872 | ) | ||||
|
|
|
| |||||
Net increase | 1,014,565 | 650,567 | ||||||
| The Tocqueville International Value Fund | ||||||||
Shares sold | 6,098,494 | 8,270,352 | ||||||
Shares issued to holders in reinvestment dividends | 139,955 | 49,328 | ||||||
Shares redeemed | (4,162,884 | ) | (4,051,383 | ) | ||||
|
|
|
| |||||
Net increase | 2,075,565 | 4,268,297 | ||||||
| The Tocqueville Gold Fund |
|
| ||||||
Shares sold | 10,956,862 | 17,575,521 | ||||||
Shares issued to holders in reinvestment dividends | 539,233 | 498,255 | ||||||
Shares redeemed | (10,200,599 | ) | (12,604,092 | ) | ||||
|
|
|
| |||||
Net increase | 1,295,496 | 5,469,684 | ||||||
| The Delafield Fund | ||||||||
Shares sold | 12,276,891 | 24,411,778 | ||||||
Shares issued to holders in reinvestment dividends | 562,887 | – | ||||||
Shares redeemed | (14,055,439 | ) | (13,045,815 | ) | ||||
|
|
|
| |||||
Net increase (decrease) | (1,215,661 | ) | 11,365,963 | |||||
| The Tocqueville Select Fund | ||||||||
Shares sold | 2,720,578 | 4,890,152 | ||||||
Shares issued to holders in reinvestment dividends | 62,056 | 166,855 | ||||||
Shares redeemed | (1,803,804 | ) | (2,206,460 | ) | ||||
|
|
|
| |||||
Net increase | 978,830 | 2,850,547 | ||||||
| 60 | October 31, 2012 |
6. FUND SHARE TRANSACTIONS
The Funds currently offer only one class of shares of beneficial interest. A redemption fee of 2.00% is imposed on redemptions of shares held 90 days or fewer. This fee is retained by each Fund and is credited to paid in capital. Redemptions to which the fee applies include redemptions of shares resulting from an exchange made pursuant to the Exchange Privilege, as defined in the Trust’s Prospectus dated February 28, 2012. For a more detailed description of when the redemption fee does not apply, please see the Trust’s Prospectus.
7. INVESTMENT TRANSACTIONS
Purchases and sales of investment securities (excluding short-term instruments) for the period ended October 31, 2012 are summarized below.
| Tocqueville Fund | Opportunity Fund | International Value Fund | Gold Fund | Delafield Fund | Select Fund | |||||||||||||||||||
Purchases: | $ | 66,805,763 | $ | 64,361,153 | $ | 92,816,867 | $ | 391,220,378 | $ | 546,434,776 | $ | 32,363,481 | ||||||||||||
|
|
|
|
|
|
|
|
|
|
|
| |||||||||||||
Sales: | $ | 219,936,058 | $ | 47,944,993 | $ | 74,073,011 | $ | 238,356,551 | $ | 686,319,013 | $ | 22,325,324 | ||||||||||||
|
|
|
|
|
|
|
|
|
|
|
| |||||||||||||
U.S. Government Security Purchases: | $ | — | $ | — | $ | — | $ | — | $ | — | $ | — | ||||||||||||
|
|
|
|
|
|
|
|
|
|
|
| |||||||||||||
U.S. Government Security Sales: | $ | — | $ | — | $ | — | $ | — | $ | — | $ | — | ||||||||||||
|
|
|
|
|
|
|
|
|
|
|
| |||||||||||||
8. TRANSACTIONS WITH AFFILIATES
The following issuers are affiliated with the Funds; that is, the Adviser had control of 5% or more of the outstanding voting securities during the period from November 1, 2011 through October 31, 2012. As defined in Section (2)(a)(3) of the Investment Company Act of 1940; such issues are:
| November 1, 2011 | Additions | Reductions | Share Balance at October 31, 2012 | Dividend Income | Realized Gain/(Loss) | Value at October 31, 2012 | Cost at October 31, 2012 | |||||||||||||||||||||||||||||||||||||
Issuer Name | Share Balance | Cost | Shares | Cost | Shares | Cost | ||||||||||||||||||||||||||||||||||||||
The Tocqueville Opportunity Fund |
| |||||||||||||||||||||||||||||||||||||||||||
Minerals Technologies, Inc. (a) | 2,000 | $ | 102,874 | — | $ | — | (2,000 | ) | $ | (102,874 | ) | — | $ | 170 | $ | 15,196 | $ | — | $ | — | ||||||||||||||||||||||||
|
|
|
|
|
|
|
|
|
|
|
|
|
| |||||||||||||||||||||||||||||||
| $ | 102,874 | $ | — | $ | (102,874 | ) | $ | 170 | $ | 15,196 | $ | — | $ | — | ||||||||||||||||||||||||||||||
The Tocqueville Gold Fund |
| |||||||||||||||||||||||||||||||||||||||||||
Atac Resources Ltd. | — | $ | — | 702,000 | $ | 1,968,031 | — | $ | — | 702,000 | $ | — | $ | — | $ | 1,515,406 | $ | 1,968,031 | ||||||||||||||||||||||||||
Atac Resources Ltd. | 10,261,700 | 37,121,703 | — | — | — | — | 10,261,700 | — | — | 22,603,996 | 37,121,703 | |||||||||||||||||||||||||||||||||
Atac Resources Ltd. Warrants | — | — | 351,000 | — | — | — | 351,000 | — | — | 35 | — | |||||||||||||||||||||||||||||||||
Bear Creek Mining Corp. | — | — | 6,061,800 | 23,977,515 | — | — | 6,061,800 | — | — | 21,485,629 | 23,977,515 | |||||||||||||||||||||||||||||||||
Blue Gold Mining, Inc. | 4,000,000 | 3,845,969 | — | — | — | — | 4,000,000 | — | — | 2,202,753 | 3,845,969 | |||||||||||||||||||||||||||||||||
Blue Gold Mining, Inc. Warrants | 2,000,000 | — | — | — | — | — | 2,000,000 | — | — | 41,652 | — | |||||||||||||||||||||||||||||||||
Corvus Gold, Inc. | — | — | 1,500,000 | 1,002,144 | — | — | 1,500,000 | — | — | 2,463,079 | 1,002,144 | |||||||||||||||||||||||||||||||||
Corvus Gold, Inc. | 2,079,901 | 1,617,492 | — | — | — | — | 2,079,901 | — | — | 3,431,837 | 1,617,492 | |||||||||||||||||||||||||||||||||
| Annual Report | 61 |
| November 1, 2011 | Additions | Reductions | Share Balance at October 31, 2012 | Dividend Income | Realized Gain/(Loss) | Value at October 31, 2012 | Cost at October 31, 2012 | |||||||||||||||||||||||||||||||||||||
Issuer Name | Share Balance | Cost | Shares | Cost | Shares | Cost | ||||||||||||||||||||||||||||||||||||||
East Asia Minerals Corp. | 4,044,400 | $ | 18,597,128 | 6,500,000 | $ | 3,195,988 | — | $ | — | 10,544,400 | $ | — | $ | — | $ | 2,269,883 | $ | 21,793,116 | ||||||||||||||||||||||||||
East Asia Minerals Corp. (b) | — | — | 6,500,000 | 3,195,988 | (6,500,000 | ) | (3,195,988 | ) | — | — | — | — | — | |||||||||||||||||||||||||||||||
East Asia Minerals Corp. Warrants | — | — | 6,500,000 | — | — | — | 6,500,000 | — | — | 225,832 | — | |||||||||||||||||||||||||||||||||
Eidesis Special Opportunities II LP | — | — | 25,000 | 25,000,000 | — | — | 25,000 | — | — | 23,716,245 | 25,000,000 | |||||||||||||||||||||||||||||||||
Gold Bullion International LLC | 5,000,000 | 5,000,000 | — | — | — | — | 5,000,000 | — | — | 5,837,000 | 5,000,000 | |||||||||||||||||||||||||||||||||
Gold Resource Corp. | 3,642,297 | 35,567,058 | 79,700 | 1,942,942 | (66,000 | ) | (264,000 | ) | 3,655,997 | 2,433,803 | 1,022,648 | 61,128,270 | 37,246,000 | |||||||||||||||||||||||||||||||
International Tower Hill Mines Ltd. | 5,666,667 | 33,656,021 | — | — | — | — | 5,666,667 | — | — | 13,730,497 | 33,656,021 | |||||||||||||||||||||||||||||||||
International Tower Hill Mines Ltd. | — | — | 1,923,077 | 4,974,877 | — | — | 1,923,077 | — | — | 4,566,478 | 4,974,877 | |||||||||||||||||||||||||||||||||
International Tower Hill Mines Ltd. | 2,493,136 | 5,978,092 | 3,245,700 | 14,975,029 | — | — | 5,738,836 | — | — | 13,945,372 | 20,953,121 | |||||||||||||||||||||||||||||||||
Primero Mining Corp. | 4,264,800 | 21,505,060 | 575,900 | 3,068,259 | — | — | 4,840,700 | — | — | 35,914,480 | 24,573,319 | |||||||||||||||||||||||||||||||||
Primero Mining Corp. Warrants | 1,848,400 | — | — | — | — | — | 1,848,400 | — | — | 3,257,256 | — | |||||||||||||||||||||||||||||||||
Rockhaven Resources Ltd. | 5,000,000 | 6,265,337 | — | — | — | — | 5,000,000 | — | — | 1,226,533 | 6,265,337 | |||||||||||||||||||||||||||||||||
Scorpio Mining Corp. | 25,668,419 | 23,975,473 | — | — | — | — | 25,668,419 | — | — | 27,208,524 | 23,975,473 | |||||||||||||||||||||||||||||||||
Scorpio Mining Corp. | 522,400 | 984,285 | — | — | — | — | 522,400 | — | — | 549,207 | 984,285 | |||||||||||||||||||||||||||||||||
Silver Range Resources Ltd. | 3,450,000 | — | — | — | — | — | 3,450,000 | — | — | 967,209 | — | |||||||||||||||||||||||||||||||||
Silver Range | 1,725,000 | — | — | — | — | �� | — | 1,725,000 | — | — | 8,636 | — | ||||||||||||||||||||||||||||||||
Strategic Metals Ltd. | 10,350,000 | 14,840,544 | 576,900 | 969,628 | — | — | 10,926,900 | — | — | 8,971,272 | 15,810,172 | |||||||||||||||||||||||||||||||||
Sunshine Mining & Refining | 1,633,545 | 18,353,107 | — | — | — | — | 1,633,545 | — | — | 17,560,609 | 18,353,107 | |||||||||||||||||||||||||||||||||
Torex Gold Mining | 11,267,400 | 16,526,328 | 13,983,200 | 25,525,185 | — | — | 25,250,600 | — | — | 52,586,981 | 42,051,513 | |||||||||||||||||||||||||||||||||
Torex Gold Mining Warrants | 1,250,000 | — | — | — | (1,250,000 | ) | — | — | — | — | — | — | ||||||||||||||||||||||||||||||||
Trevali Mining Corp. (a) | 8,000,000 | 12,381,345 | — | — | (8,000,000 | ) | (12,381,345 | ) | — | — | (3,562,943 | ) | — | — | ||||||||||||||||||||||||||||||
|
|
|
|
|
|
|
|
|
|
|
|
|
| |||||||||||||||||||||||||||||||
| $ | 256,214,942 | $ | 109,795,586 | (15,841,333 | ) | $ | 2,433,803 | $ | (2,540,295 | ) | $ | 327,414,671 | $ | 350,169,195 | ||||||||||||||||||||||||||||||
The Delafield Fund |
| |||||||||||||||||||||||||||||||||||||||||||
Albany International Corp. (a) | 725,000 | $ | 11,373,437 | — | $ | — | (100,000 | ) | $ | (2,602,365 | ) | 625,000 | $ | 357,500 | $ | (186,493 | ) | $ | 13,731,250 | $ | 8,771,072 | |||||||||||||||||||||||
Checkpoint Systems, Inc. | 2,150,000 | 36,419,006 | 500,000 | 5,189,896 | (400,000 | ) | (6,859,839 | ) | 2,250,000 | — | (3,502,637 | ) | 18,270,000 | 34,749,063 | ||||||||||||||||||||||||||||||
Federal Signal Corp. (a) | 1,900,000 | 12,164,636 | 806,100 | 3,478,052 | (1,247,996 | ) | (8,134,373 | ) | 1,458,104 | — | (312,013 | ) | 8,413,260 | 7,508,315 | ||||||||||||||||||||||||||||||
Ferro Corp. (a) | 2,400,000 | 18,136,786 | 100,000 | 666,820 | (900,000 | ) | (10,074,697 | ) | 1,600,000 | — | (6,396,375 | ) | 4,208,000 | 8,728,909 | ||||||||||||||||||||||||||||||
Kemet Corp. | — | — | 2,900,000 | 20,389,762 | (900,000 | ) | (8,540,796 | ) | 2,000,000 | — | (4,432,987 | ) | 9,080,000 | 11,848,966 | ||||||||||||||||||||||||||||||
LTX-Credence Corp. | 2,000,000 | 14,502,829 | 150,000 | 960,330 | — | — | 2,150,000 | — | — | 11,975,500 | 15,463,159 | |||||||||||||||||||||||||||||||||
Maidenform Brands, Inc. | — | — | 775,000 | 14,143,044 | (150,000 | ) | (2,771,010 | ) | 625,000 | — | 538,154 | 11,693,750 | 11,372,034 | |||||||||||||||||||||||||||||||
Minerals Technologies, Inc. (a) | 420,000 | 22,960,523 | — | — | (95,000 | ) | (5,916,743 | ) | 325,000 | 75,000 | 164,667 | 23,289,500 | 17,043,780 | |||||||||||||||||||||||||||||||
TrueBlue, Inc. | 1,475,000 | 19,940,160 | 75,000 | 953,132 | — | — | 1,550,000 | — | — | 20,227,500 | 20,893,292 | |||||||||||||||||||||||||||||||||
| 62 | October 31, 2012 |
| November 1, 2011 | Additions | Reductions | Share Balance at October 31, 2012 | Dividend Income | Realized Gain/(Loss) | Value at October 31, 2012 | Cost at October 31, 2012 | |||||||||||||||||||||||||||||||||||||
Issuer Name | Share Balance | Cost | Shares | Cost | Shares | Cost | ||||||||||||||||||||||||||||||||||||||
Universal Stainless & Alloy | 234,000 | $ | 6,086,416 | 216,000 | $ | 7,790,484 | (25,000 | ) | $ | (1,020,535 | ) | 425,000 | $ | — | $ | 8,431 | $ | 14,620,000 | $ | 12,856,365 | ||||||||||||||||||||||||
|
|
|
|
|
|
|
|
|
|
|
|
|
| |||||||||||||||||||||||||||||||
| $ | 141,583,793 | $ | 53,571,520 | $ | (45,920,358 | ) | $ | 432,500 | $ | (14,119,253 | ) | $ | 135,508,760 | $ | 149,234,955 | |||||||||||||||||||||||||||||
The Tocqueville Select Fund |
| |||||||||||||||||||||||||||||||||||||||||||
Albany International Corp. (a) | 119,500 | $ | 1,901,613 | — | $ | — | — | $ | — | 119,500 | $ | 64,530 | $ | — | $ | 2,625,415 | $ | 1,901,613 | ||||||||||||||||||||||||||
Checkpoint Systems, Inc. | 173,000 | 2,851,736 | 129,000 | 1,294,630 | (47,000 | ) | (842,988 | ) | 255,000 | — | (440,244 | ) | 2,070,600 | 3,303,378 | ||||||||||||||||||||||||||||||
Ferro Corp. (a) | — | — | 465,000 | 2,807,523 | (465,000 | ) | (2,807,523 | ) | — | — | (912,413 | ) | — | — | ||||||||||||||||||||||||||||||
Maidenform Brands, Inc. | 100,400 | 2,254,275 | 60,000 | 1,108,404 | — | — | 160,400 | — | — | 3,001,084 | 3,362,679 | |||||||||||||||||||||||||||||||||
Minerals Technologies, Inc. (a) | 40,000 | 2,353,692 | — | — | — | — | 40,000 | 8,000 | — | 2,866,400 | 2,353,692 | |||||||||||||||||||||||||||||||||
Summer Infant, Inc. | 324,933 | 2,333,310 | 474,200 | 1,955,901 | (59,200 | ) | (472,830 | ) | 739,933 | — | (382,676 | ) | 1,139,497 | 3,816,381 | ||||||||||||||||||||||||||||||
|
|
|
|
|
|
|
|
|
|
|
|
|
| |||||||||||||||||||||||||||||||
| $ | 11,694,626 | $ | 7,166,458 | $ | (4,123,341 | ) | $ | 72,530 | $ | (1,735,333 | ) | $ | 11,702,996 | $ | 14,737,743 | |||||||||||||||||||||||||||||
|
|
|
|
|
|
|
|
|
|
|
|
|
| |||||||||||||||||||||||||||||||
| (a) | Security is no longer an affiliated company at October 31, 2012. |
| (b) | Private security restrictions lifted during period and combined with other non restricted securities. |
9. LINE OF CREDIT
The Tocqueville Fund, Opportunity Fund, International Value Fund, Gold Fund, Delafield Fund, and Select Fund each have a revolving secured credit facility with U.S. Bank, the Trust’s custodian, in the amounts of $40,000,000, $5,000,000, $15,000,000, $130,000,000, $50,000,000 and $9,500,000, respectively, for temporary emergency or extraordinary purposes, including the meeting of redemption requests that otherwise might require the untimely disposition of securities. Each Fund’s line of credit is secured by the respective fund’s assets. The lines of credit have a one year term and are reviewed annually by the Board of Trustees. The current agreements run through May 31, 2013. The interest rate as of October 31, 2012 was 2.75%. During the year ended October 31, 2012, the Tocqueville Fund’s maximum borrowing was $40,000,000 and average borrowing was $712,320, the Opportunity Fund’s maximum borrowing was $2,062,000 and average borrowing was $67,012, and the Gold Fund’s maximum borrowing was $9,453,000 and average borrowing was $220,676. This borrowing resulted in interest expenses of $22,480, $1,653 and $4,949, respectively. These amounts are included in Other Expenses on the Funds’ Statement of Operations. The International Value Fund, the Delafield Fund, and the Select Fund did not use their lines of credit.
10. OTHER EXPENSES
Other expenses include reimbursement to the Adviser for compensation of the Chief Compliance Officer. For the fiscal year ended October 31, 2012, reimbursement to the Adviser for compensation of the Trust’s Chief Compliance Officer from the Funds amounted to $12,880, $2,099, $6,944, $75,502, $44,741 and $2,834 for the Tocqueville Fund, Opportunity Fund, International Value Fund, Gold Fund, Delafield Fund, and Select Fund, respectively.
| Annual Report | 63 |
The Tocqueville Trust
Report of Independent Registered Public Accounting Firm
To the Shareholders and Board of Trustees of
The Tocqueville Trust:
We have audited the accompanying statements of assets and liabilities of The Tocqueville Trust, including The Tocqueville Fund, The Tocqueville Opportunity Fund, The Tocqueville International Value Fund, The Tocqueville Gold Fund, The Delafield Fund, and The Tocqueville Select Fund (collectively, the “Funds”), including the schedules of investments, as of October 31, 2012, and the related statements of operations for the year then ended, changes in net assets for each of the two years in the period then ended, and the financial highlights for each of the five years in the period then ended for The Tocqueville Fund, The Tocqueville Opportunity Fund, The Tocqueville International Value Fund, and The Tocqueville Gold Fund; the related statements of operations for the year then ended, changes in net assets for each of the two years in the period then ended and financial highlights for each of the three years in the period then ended and for the period January 1, 2009 to October 31, 2009 for The Delafield Fund and The Tocqueville Select Fund. These financial statements and financial highlights are the responsibility of the Funds’ management. Our responsibility is to express an opinion on these financial statements and financial highlights based on our audits. The financial highlights for the two years in the period ended December 31, 2008 for The Delafield Fund and for the period September 28, 2008 (inception) through December 31, 2008 for The Tocqueville Select Fund were audited by other auditors. Those auditors expressed an unqualified opinion on those financial highlights in their report dated February 24, 2009.
We conducted our audits in accordance with the standards of the Public Company Accounting Oversight Board (United States). Those standards require that we plan and perform the audit to obtain reasonable assurance about whether the financial statements and financial highlights are free of material misstatement. The Funds are not required to have, nor were we engaged to perform, an audit of their internal control over financial reporting. Our audits included consideration of internal control over financial reporting as a basis for designing audit procedures that are appropriate in the circumstances, but not for the purpose of expressing an opinion on the effectiveness of the Funds’ internal control over financial reporting. Accordingly, we express no such opinion. An audit also includes examining, on a test basis, evidence supporting the amounts and disclosures in the financial statements and financial highlights, assessing the accounting principles used and significant estimates made by management, as well as evaluating the overall financial statement presentation. Our procedures included confirmation of the securities owned as of October 31, 2012, by correspondence with the custodian and brokers. We believe that our audits provide a reasonable basis for our opinion.
In our opinion, the financial statements and financial highlights referred to above present fairly, in all material respects, the financial position of each of the aforementioned Funds of The Tocqueville Trust as of October 31, 2012, the results of their operations for the year then ended, the changes in net assets for each of the two years in the period then ended, and the financial highlights for each of the five years in the period then ended for The Tocqueville Fund, The Tocqueville Opportunity Fund, The Tocqueville International Value Fund and The Tocqueville Gold Fund; the results of operations for the year then ended, changes in net assets for each of the two years in the period then ended and financial highlights for each of the three years in the period then ended and for the period January 1, 2009 to October 31, 2009 for The Delafield Fund and The Tocqueville Select Fund, in conformity with accounting principles generally accepted in the United States of America.
/s/ GRANT THORNTON LLP
Chicago, Illinois
December 28, 2012
| 64 | October 31, 2012 |
ADDITIONAL INFORMATION (UNAUDITED)
1. ADDITIONAL DISCLOSURE REGARDING FUND TRUSTEES AND OFFICERS
Independent Trustees
Name, Age and Address | Position(s) Held with the Trust | Term of Office and Length of Time Served (1) | Principal Occupation During Past Five Years | # of Portfolios in Fund Complex Overseen By Trustee | Other Directorships Held by Trustee | |||||||
Guy A. Main (76) 40 W. 57th St., 19th Floor New York, NY 10019 | Trustee | Indefinite Term, Since 2000 | Retired. Formerly, Executive Vice President, Amwest Insurance Group, Inc. from April 1996 to January 2001; Chairman, President and Chief Executive Officer, Condor Services Inc. from April 1989 to April 1996. | 6 | Director, Amwest Insurance Group, Inc. from April 1996 to January 2001; Chairman, Association of California Insurance Companies from January 1996 to January 1998; Director, Condor Services Inc. from April 1989 to April 1996. | |||||||
Charles W. Caulkins (56) 40 W. 57th St., 19th Floor New York, NY 10019 | Trustee | Indefinite Term, Since 2003 | Partner, Chora Capital, LLC from June 2010 to present; Marketing Manager, L.R. Global Partners from January 2008 to May 2010; President, Arbor Marketing, Inc. from October 1994 to December 2007. | 6 | Director, Phoenix House from January 2001 to 2007; Director, Bridges to Community from July 2002 to 2006. | |||||||
James W. Gerard (51) 40 W. 57th St., 19th Floor New York, NY 10019 | Trustee | Indefinite Term, Since 2001 | Managing Director, North Sea Partners, January 2010 to present. Principal, Juniper Capital Group, LLC (formerly known as Argus Advisors International, LLC), from August 2003 to December 2009; Managing Director, The Chart Group from January 2001 to present; Managing Principal, Ironbound Partners from October 1998 to December 2000. | 6 | Director, American Overseas Memorial Day Association, 1988 to present; Trustee, Salisbury School, 2005 to present; Director, American Friends of Blerancourt, 1992-present; Director and Treasurer ASPCA, 1988 to 2008; | |||||||
| Annual Report | 65 |
Independent Trustees
Name, Age and Address | Position(s) Held with the Trust | Term of Office and Length of Time Served (1) | Principal Occupation During Past Five Years | # of Portfolios in Fund Complex Overseen By Trustee | Other Directorships Held by Trustee | |||||||
William F. Indoe (70) 40 W. 57th St., 19th Floor New York, NY 10019 | Trustee | Indefinite Term, Since 2006 | Senior Counsel, Sullivan & Cromwell LLP (attorneys-at-law) 1990-present. | 6 | Director, Rho Capital Partners, Inc. | |||||||
William J. Nolan III (65) 40 W. 57th St., 19th Floor New York, NY 10019 | Trustee | Indefinite Term, Since 2006 | Retired, Executive Vice President & Treasurer PaineWebber Inc. 1997-2001. | 6 | Trustee, Adirondock Museum, Blue Mt. Lake, NY 1996 to present (Treasurer, 2000 to present). | |||||||
Alexander Douglas (65) 40 W. 57th St., 19th Floor New York, NY 10019 | Trustee | Indefinite Term, Since 2010 | President, CEO and owner of Spaulding Law Printing, Inc. | 6 | None | |||||||
Interested Trustees (and Officers)*
Name, Age and Address | Position(s) Held with the Trust | Term of Office and Length of Time Served (1) | Principal Occupation During Past Five Years | # of Portfolios in Fund Complex Overseen By Trustee | Other Directorships Held by Trustee | |||||||
Francois D. Sicart (69) 40 W. 57th St., 19th Floor New York, NY 10019 | Chairman and Trustee | Indefinite Term, Since 1987 | Chairman, Tocqueville Management Corporation, the General Partner of Tocqueville Asset Management L.P. and Tocqueville Securities, L.P. from January 1990 to present; Chairman and Founder, Tocqueville Asset Management Corp. from December 1985 to January 1990; Vice Chairman of Tucker Anthony Management Corporation from 1981 to October 1986; Vice President (formerly general partner) among other positions with Tucker Anthony, Inc. from 1969 to January 1990. | 6 | Chairman and Director, Tocqueville Management Corporation, the General Partner of Tocqueville Asset Management L.P. and Tocqueville Securities, L.P. from January 1990 to present. | |||||||
| 66 | October 31, 2012 |
Interested Trustees (and Officers)*
Name, Age and Address | Position(s) Held with the Trust | Term of Office and Length of Time Served (1) | Principal Occupation During Past Five Years | # of Portfolios in Fund Complex Overseen By Trustee | Other Directorships Held by Trustee | |||||||
Robert W. Kleinschmidt (63) 40 W. 57th St., 19th Floor New York, NY 10019 | President and Trustee | Indefinite Term, Since 1991 | President, Chief Investment Officer and Director, Tocqueville Management Corporation, the General Partner of Tocqueville Asset Management L.P. and Tocqueville Securities, L.P. from January 1994 to present; and Managing Director from July 1991 to January 1994; Partner, David J. Greene & Co. from May 1978 to July 1991. | 6 | President and Director, Tocqueville Management Corporation, the General Partner of Tocqueville Asset Management L.P. and Tocqueville Securities, L.P. | |||||||
Cleo Kotis (37) 40 W. 57th St., 19th Floor New York, NY 10019 | Secretary | Indefinite Term, Since 2010 | Director of Operations, the Delafield Group of Tocqueville Asset Management L.P., 2009 to present; Vice President and Chief Operations Officer, the Delafield Fund, Inc. from 2005-2009; Vice President and Chief Operations Officer, Delafield Asset Management from 2005-2009; Vice President, Reich & Tang Asset Management, LLC from 2002-2009. | N/A | N/A | |||||||
John Cassidy (69) 40 W. 57th St., 19th Floor New York, NY 10019 | Treasurer | Indefinite Term, Since 2010 | Treasurer, Tocqueville Asset Management L.P., from May 2002 to present. | N/A | N/A | |||||||
Elizabeth Bosco (64) 40 W. 57th St., 19th Floor | Anti- Money Laundering Compliance Officer | Indefinite Term, Since 2009 | Chief Compliance Officer (January 2009-present), Tocqueville Securities L.P.; Compliance Officer (January 1997-January 2009), Tocqueville Securities L.P. and Tocqueville Asset Management, L.P. | N/A | N/A | |||||||
| * | “Interested person” of the Trust is defined in the 1940 Act. Mr. Sicart and Mr. Kleinschmidt are considered “interested persons” because of their affiliation with the Adviser. |
| Annual Report | 67 |
Interested Trustees (and Officers)*
Name, Age and Address | Position(s) Held with the Trust | Term of Office and Length of Time Served (1) | Principal Occupation During Past Five Years | # of Portfolios in Fund Complex Overseen By Trustee | Other Directorships Held by Trustee | |||||||
Thomas Pandick (65) 40 W. 57th St., 19th Floor New York, NY 10019 | Chief Compliance Officer | Indefinite Term, Since 2004 | Chief Compliance Officer (October 2004-present), Tocqueville Asset Management L.P.; General Counsel (January-October 2004), Tocqueville Asset Management L.P. | N/A | N/A | |||||||
| (1) | Each Trustee will hold office for an indefinite term until the earliest of (i) the next meeting of shareholders, if any, called for the purpose of considering the election or re-election of such Trustee and until the election and qualification of his or her successor, if any, elected at such meeting, or (ii) the date a Trustee resigns or retires, or a Trustee is removed by the Board of Trustees or shareholders, in accordance with the Trust’s By-Laws, as amended, and Agreement and Declaration of Trust, as amended. Each officer will hold office for an indefinite term until the date he or she resigns or retires or until his or her successor is elected and qualified. |
2. INVESTMENT ADVISORY AGREEMENT DISCLOSURE
In determining whether to approve the continuance of the Investment Advisory Agreements and the Administration Agreement, the Trustees, including the Independent Trustees, considered the following information:
1) The nature, extent and quality of services provided by the Adviser.
The Trustees reviewed in detail the nature and extent of the services provided by the Adviser under the terms of the Investment Advisory Agreements and the quality of those services provided to the Tocqueville Fund, the Tocqueville Opportunity Fund, the Tocqueville International Value Fund, the Tocqueville Gold Fund, the Delafield Fund and the Tocqueville Select Fund (the “Funds”) over the past year. The Trustees noted that the services under the Investment Advisory Agreements include: managing the investment and reinvestment of the Funds’ assets; supervising and managing all aspects of the Funds’ operations; and providing the Board on a regular basis with financial reports and analyses on the Funds’ operations and the operations of comparable investment companies. The Trustees also observed that the Adviser provides various administrative services to the Funds pursuant to the terms of the Administration Agreement and considered the nature, extent and quality of services provided under that agreement as well. The Trustees evaluated these factors based on their direct experience with the Adviser and in consultation with counsel. The Trustees concluded that the nature and extent of the services provided under the Investment Advisory Agreements and the Administration Agreement were reasonable and appropriate in relation to the advisory fee and administration fee, respectively, that the level of services provided by the Adviser to the Funds had not diminished over the past year and that the quality of services continues to be high. The Trustees reviewed the personnel responsible for providing advisory and administrative services to the Funds and concluded, based on their experience and interaction with the Adviser, that (i) the Adviser was able to retain quality portfolio managers and other personnel; (ii) the Adviser exhibited a high level of diligence and attention to detail in carrying out its advisory and administrative responsibilities under the Investment Advisory Agreements and Administration Agreement, respectively, for the Funds; (iii) the Adviser was responsive to requests of the
| 68 | October 31, 2012 |
Trustees; and (iv) the Adviser had kept the Trustees apprised of developments relating to the Funds and the industry in general. The Trustees also focused on the Adviser’s reputation and long-standing relationship with the Trust.
In connection with its assessment of the performance of the Adviser, the Trustees reviewed the Adviser’s financial statements and considered the Adviser’s financial condition and whether it has the resources necessary to continue to carry out its obligations under the Investment Advisory Agreements and the Administration Agreement. The Trustees concluded that the Adviser has the financial resources necessary to continue to perform its obligations under the Investment Advisory Agreements and the Administration Agreement and to continue to provide the high quality services that it has provided to the Funds to date.
2) The performance of the Funds and the Adviser.
The Trustees reviewed the investment performance of the Funds, both on an absolute basis and as compared to a peer group for each respective Fund for the one-year, three-year, five-year and ten-year periods, ended July 31, 2012. The peer groups were comprised of other funds that had similar investment objectives and sales load structures, as determined by Morningstar: The Morningstar Large Blend Funds peer group, with average net assets between $364 million and $460 million, for the Tocqueville Fund; the Morningstar Small Blend Funds peer group, with average net assets between $46 million and $79 million, for the Tocqueville Opportunity Fund; the Morningstar Foreign Small/Mid Value Funds peer group, with average net assets between $155 million and $285 million, for the Tocqueville International Value Fund; the Morningstar Precious Metals Funds peer group, with average net assets between $480 million and $3.3 billion, for the Tocqueville Gold Fund; the Morningstar Mid-Cap Value Funds peer group, with average net assets between $968 million and $1.84 billion, for the Delafield Fund; and the Morningstar Small Value Funds peer group, with average net assets between $64 million and $130 million, for the Tocqueville Select Fund (the “Performance Peer Groups”). The Trustees considered that the performance information for the Delafield Fund and the Tocqueville Select Fund includes the performance information of their respective predecessor funds, which had different investment advisers, but the Trustees considered this information since these Funds have substantially the same portfolio management team.
The Trustees also compared each Fund’s investment performance against its benchmark market indices: the S&P 500 Index for the Tocqueville Fund; the Russell 2500 Index for the Tocqueville Opportunity Fund; the Morgan Stanley EAFE Index for the Tocqueville International Value Fund; the S&P 500 Index and the Philadelphia Stock Exchange Gold & Silver Index for the Tocqueville Gold Fund; the S&P 500 Index and the Russell 2000 Index for the Delafield Fund; and the Russell 2500 Index and the Russell 2000 Index for the Tocqueville Select Fund (the “Indices”) for the one-year, three-year, five-year and ten-year periods ended July 31, 2012 for all the Funds. The Trustees considered the above information as helpful in their assessment of whether the Adviser was obtaining for the Funds’ shareholders the performance that was available in the marketplace given each Fund’s investment objectives, policies, strategies, limitations and restrictions. The Trustees concluded that the performance of the Funds against their respective Performance Peer Groups was satisfactory. In particular, the Trustees noted that the Tocqueville Fund had outperformed as compared to its Index for the ten-year period and underperformed for the one-year, three-year and five-year periods, and outperformed the median of its Performance Peer Group for the three-year and ten-year periods and underperformed for the one-year and five-year periods. The Trustees noted that with respect to the Tocqueville Opportunity Fund that despite underperforming its Index for all time periods, the Fund had outperformed or equaled the median of its Performance Peer Group for all periods except the ten-year period. The Trustees further noted that the Tocqueville International Value Fund outperformed its Index for all time periods except the one-year period and outperformed the median of its Performance Peer Group for the all periods except the one-year period. The Trustees noted that the Tocqueville Gold Fund outperformed both of its Indices for the five-year and ten-year periods, underperformed both its Indices for the one-year period, and outperformed
| Annual Report | 69 |
the Philadelphia Stock Exchange Gold & Silver Index and underperformed the S&P 500 Index for the three-year period, and had outperformed the median of its Performance Peer Group for all periods except the one-year period. The Trustees noted that the Delafield Fund outperformed both of its Indices for the five-year and ten-year periods, underperformed both of its Indices for the one-year period and outperformed the Russell 2000 Index and underperformed the S&P 500 Index for the three-year period, and outperformed the median of its Performance Peer Group for the five-year and ten-year periods and underperformed for the one-year and three-year periods. The Trustees noted that the Tocqueville Select Fund outperformed both of its Indices for the five-year and ten-year periods, underperformed both of its Indices for the one-year period and outperformed the Russell 2000 Index and underperformed the Russell 2500 Index for the three-year period, and outperformed the median of its Performance Peer Group for all time periods except the one-year period.
3) The cost of the advisory services and the profits to the Adviser from the relationship with the Trust.
In connection with the Trustee’s consideration of the level of the advisory fees, the Trustees considered a number of factors. The Trustees compared the level of the advisory fees for each Fund against the advisory fees charged by funds in a universe of funds: the Morningstar Large Cap Blend Funds peer group, with average net assets between $250 million and $550 million, for the Tocqueville Fund; the Morningstar Small Blend Funds peer group, with average net assets between $40 million and $100 million, for the Tocqueville Opportunity Fund; the Morningstar Foreign Small/Mid Value Funds peer group, with average net assets between $100 million and $300 million, for the Tocqueville International Value Fund; all funds in the Morningstar Equity Precious Metals Funds peer group, for the Tocqueville Gold Fund; the Morningstar Mid-Cap Value Funds peer group, with average net assets between $900 million and $1.90 billion, for the Delafield Fund; and the Morningstar Small Value Funds peer group, with average net assets between $50 million and $150 million, for the Tocqueville Select Fund (the “Expense Peer Groups”). The Trustees considered comparative total fund expenses of the Funds and the Expense Peer Groups. The Trustees used this comparative fee information and total expense data as a guide to help assess the reasonableness of each Fund’s advisory fee, although they acknowledged that it was difficult to make precise comparisons with other funds since the exact nature of services provided under each Expense Peer Group fund agreement is often not apparent. The Trustees also viewed the Expense Peer Group fee information as a whole as useful in assessing whether the Adviser was providing services at a cost that was competitive with other, similar funds.
The Trustees noted that the contract rate advisory fee and administration fee for each of the Funds were reasonable, despite the contractual advisory fee rate being above average for the Tocqueville Fund, the Tocqueville International Value Fund and the Tocqueville Gold Fund and the administration fee being above average for all of the Funds, when compared to their respective Expense Peer Groups. The Trustees also considered the combined contract rate advisory and administration fee as compared to their respective Expense Peer Group. The Board further observed that the total expense ratios of the Funds were also reasonable. The Board noted that the total expense ratio for the Tocqueville Fund, the Tocqueville International Value Fund, the Delafield Fund and the Tocqueville Select Fund were above average, when compared to their respective Expense Peer Groups and that the total expense ratio for the Tocqueville Opportunity Fund and the Tocqueville Gold Fund were below average, when compared to their respective Expense Peer Groups. The Board also noted that the Tocqueville Fund operates pursuant to an Expense Limitation Agreement whereby the Adviser has agreed to waive a portion of its fee necessary to limit the Fund’s total operating expenses to the level set forth in the Fund’s prospectus.
| 70 | October 31, 2012 |
The Trustees also considered the profitability to the Adviser and its affiliate arising out of its relationship with the Trust. In this regard, the Trustees reviewed profitability data relating to the Adviser for the year October 31, 2011. The Trustees considered revenues received by the Adviser under the Investment Advisory Agreements and the Administration Agreement as well as revenues received by the Adviser’s affiliate, the Distributor, under the 12b-1 plans and Related Agreements and commissions received for effecting portfolio transactions. The Trustees also received and reviewed the Adviser’s financial statements and the Adviser provided an oral update on its profitability numbers since October 31, 2011. The Trustees concluded that the profitability of the Funds to the Adviser was not excessive.
4) The extent to which economies of scale will be realized as the Funds grow and whether fee levels reflect those economies of scale.
With respect to the Trustees’ consideration of economies of scale, the Trustees discussed with the Adviser whether economies of scale would be realized by it in its management of a Fund at higher asset levels. The Trustees also reviewed the Peer Group data to assess whether the Peer Group funds had advisory fee breakpoints and, if so, at what asset levels. The Trustees noted that the Funds, except for the Tocqueville Select Fund, currently have advisory fee breakpoints and that they were satisfied that the current breakpoints were appropriate when compared with each Fund’s respective Peer Group. The Trustees considered that breakpoints are not necessary at this time for the Tocqueville Select Fund, given the small size of the Tocqueville Select Fund. The Trustees also noted that the administration fee for the Funds does not have a breakpoint and they concluded that breakpoints were not needed at this time. In the event there was significant asset growth in the future in a Fund, the Trustee’s determined to reassess whether the advisory fees and administration fee, including the current breakpoint structure, appropriately took into account any economies of scale that had been realized as a result of that growth.
5) Other Factors.
The Trustees also discussed the Adviser’s practices regarding the selection and compensation of brokers and dealers that execute portfolio transactions for the Funds and the brokers’ and dealers’ provision of brokerage and research services to the Adviser. The Trustees further discussed the potential benefits the Adviser derived from the Funds’ soft dollar arrangements, whereby brokers provide research to the Funds or the Adviser in return for allocating fund brokerage, and other investment data concerning soft dollars. The Board also discussed the Adviser’s use of an affiliated broker to effect portfolio transactions, noting that in addition to paying a competitive rate on commissions, the Adviser believed the Funds received better execution on trades.
Based on a consideration of all these factors in their totality, the Trustees, including all of the Independent Trustees, determined that the Funds’ advisory fees and administration fees were fair and reasonable with respect to the quality of services that the Adviser provides and in light of the other factors described above that the Trustees deemed relevant. The Trustees based their decision on evaluations of all these factors as a whole and did not consider any one factor as all-important or controlling. The Independent Trustees were also assisted by the advice of independent counsel in making this determination.
3. PROXY VOTING POLICIES AND PROCEDURES
A description of the policies and procedures that The Tocqueville Trust uses to determine how to vote proxies relating to portfolio securities is available without charge upon request by calling 1-800-355-7307. Information regarding how The Tocqueville Trust voted proxies relating to portfolio securities during the most recent 12-month period ended June 30 is available by calling 1-800-355-7307 and it is also available on the SEC’s web site at http://www.sec.gov.
| Annual Report | 71 |
4. SHAREHOLDER REPORTS AND QUARTERLY PORTFOLIO DISCLOSURE
The Tocqueville Trust is required to file its complete schedule of portfolio holdings with the SEC for its first and third fiscal quarters on Form N-Q. The Trust’s Form N-Q will be available without charge, upon request on the SEC’s website (http://www.sec.gov) and may be available by calling 1-800-697-3863. You can also obtain copies of Form N-Q by (i) visiting the SEC’s Public Reference Room in Washington, DC (information on the operation of the Public Reference Room may be obtained by calling 1-202-551-8090); (ii) sending your request and a duplicating fee to the SEC’s Public Reference Room, Washington, DC 20549-1520; or (iii) sending your request electronically to publicinfosec.gov. Quarterly portfolio holdings are also available on the website of The Tocqueville Funds, www.tocqueville.com/mutual-funds.
5. SHAREHOLDER NOTIFICATION OF FEDERAL TAX STATUS
For the fiscal period ended October 31, 2012, certain dividends paid by the Funds may be subject to a maximum tax rate of 15%, as provided for by the Jobs and Growth Tax Relief Reconciliation Act of 2003. The percentage of dividends declared from ordinary income designated as qualified dividend income was as follows:
Tocqueville Fund | 100.00 | % | ||
Opportunity Fund | 0.00 | % | ||
International Value Fund | 100.00 | % | ||
Gold Fund | 0.00 | % | ||
Delafield Fund | 0.00 | % | ||
Select Fund | 0.00 | % |
For corporate shareholders, the percent of ordinary income distributions qualifying for the corporate dividends received deduction for the fiscal period ended October 31, 2012 was as follows:
Tocqueville Fund | 100.00 | % | ||
Opportunity Fund | 0.00 | % | ||
International Value Fund | 4.53 | % | ||
Gold Fund | 0.00 | % | ||
Delafield Fund | 0.00 | % | ||
Select Fund | 0.00 | % |
For the period ended October 31, 2012, the funds designate the following percent of ordinary distributions paid as interest-related dividends under the Internal Revenue Code Section 871(k)(1)(c):
Tocqueville Fund | 0.01 | % | ||
Opportunity Fund | 0.00 | % | ||
International Value Fund | 0.05 | % | ||
Gold Fund | 0.00 | % | ||
Delafield Fund | 0.00 | % | ||
Select Fund | 0.00 | % |
The percentage of taxable ordinary income distributions that are designated as short-term capital gain distributions under Internal Revenue Section 871(k)(2)(C) for each Fund were as follows.
Tocqueville Fund | 0.00 | % | ||
Opportunity Fund | 0.00 | % | ||
International Value Fund | 0.00 | % | ||
Gold Fund | 100.00 | % | ||
Delafield Fund | 0.00 | % | ||
Select Fund | 0.00 | % |
| 72 | October 31, 2012 |
6. FOREIGN TAX CREDIT
For the year ended October 31, 2012, the Tocqueville International Value Fund earned foreign source income and paid foreign taxes which they intend to pass through to their shareholders pursuant to Section 853 of the Internal Revenue Code as follows:
Country | Gross Dividend Per Share | Taxes Withheld Per Share | ||||||
Australia | $ | 0.00976 | $ | 0.00000 | ||||
Belgium | 0.01232 | 0.00185 | ||||||
Brazil | 0.00098 | 0.00013 | ||||||
Canada | 0.00319 | 0.00048 | ||||||
Switzerland | 0.00974 | 0.00146 | ||||||
Germany | 0.01495 | 0.00229 | ||||||
Spain | 0.00259 | 0.00067 | ||||||
France | 0.07493 | 0.01130 | ||||||
Hong Kong | 0.01185 | 0.00000 | ||||||
Ireland | 0.01726 | 0.00000 | ||||||
Italy | 0.01369 | 0.00205 | ||||||
Jersey | 0.00137 | 0.00000 | ||||||
Japan | 0.06648 | 0.00465 | ||||||
Mexico | 0.00000 | 0.00000 | ||||||
Netherlands | 0.02917 | 0.00438 | ||||||
Norway | 0.05739 | 0.00981 | ||||||
|
|
|
| |||||
| $ | 0.32567 | $ | 0.03907 | |||||
|
|
|
| |||||
| Annual Report | 73 |
Investment Adviser
Tocqueville Asset Management L.P.
40 W. 57th St., 19th Floor
New York, NY 10019
(212) 698-0800
www.tocqueville.com
Distributor
Tocqueville Securities, L.P.
40 W. 57th St., 19th Floor
New York, NY 10019
(212) 698-0800
Shareholders’ Servicing and Transfer Agent
U.S. Bancorp Fund Services, LLC
P.O. Box 701
Milwaukee, WI 53201-0701
(800) 697-3863
Custodian
U.S. Bank, N.A.
Custody Operations
1555 River Center Drive, Suite 302
Milwaukee, WI 53212
Board of Trustees
François D. Sicart—Chairman
Charles W. Caulkins
Alexander Douglas
James W. Gerard
William F. Indoe
Robert W. Kleinschmidt
Guy A. Main
William J. Nolan III

Tocqueville Funds
c/o US Bancorp Fund Services, LLC
P.O. Box 701
Milwaukee, WI 53201-0701
www.tocqueville.com/mutual-funds
TQRPANNU 12
Item 2. Code of Ethics.
The registrant has adopted a code of ethics that applies to the registrant’s principal executive officer and principal financial officer. The registrant has not made any amendments to its code of ethics during the period covered by this report. The registrant has not granted any waivers from any provisions of the code of ethics during the period covered by this report.
Incorporated by reference to the Registrant’s Form N-CSR filed January 6, 2011.
Item 3. Audit Committee Financial Expert.
The registrant’s board of trustees has determined that there are three audit committee financial experts serving on its audit committee. James Gerard, William Nolan III, and Guy Main are the “audit committee financial expert” and are considered to be “independent” as each term is defined in Item 3 of Form N-CSR.
Item 4. Principal Accountant Fees and Services.
The registrant has engaged its principal accountant to perform audit services, audit-related services, tax services and other services during the past two fiscal years. “Audit services” refer to performing an audit of the registrant’s annual financial statements or services that are normally provided by the accountant in connection with statutory and regulatory filings or engagements for those fiscal years. “Audit-related services” refer to the assurance and related services by the principal accountant that are reasonably related to the performance of the audit. “Tax services” refer to professional services rendered by the principal accountant for tax compliance, tax advice, and tax planning. “Other services” were not provided by the principal accountant. The following table details the aggregate fees billed or expected to be billed for each of the last two fiscal years for audit fees, audit-related fees, tax fees and other fees by the principal accountant.
| FYE 10/31/2012 | FYE 10/31/2011 | |||||||
Audit Fees | 147,700 | 142,000 | ||||||
Audit-Related Fees | 0 | 0 | ||||||
Tax Fees | 20,200 | 19,200 | ||||||
All Other Fees | 0 | 0 | ||||||
The audit committee has adopted pre-approval policies and procedures that require the audit committee to pre-approve all audit and non-audit services of the registrant, including services provided to any entity affiliated with the registrant.
The percentage of fees billed by Grant Thornton applicable to non-audit services pursuant to waiver of pre-approval requirement were as follows:
| FYE 10/31/2012 | FYE 10/31/2011 | |||||||
Audit-Related Fees | 0 | % | 0 | % | ||||
Tax Fees | 0 | % | 0 | % | ||||
All Other Fees | 0 | % | 0 | % | ||||
All of the principal accountant’s hours spent on auditing the registrant’s financial statements were attributed to work performed by full-time permanent employees of the principal accountant.
The following table indicates the non-audit fees billed or expected to be billed by the registrant’s accountant for services to the registrant and to the registrant’s investment adviser (and any other controlling entity, etc.—not sub-adviser) for the last two years. The audit committee of the board of trustees/directors has considered whether the provision of non-audit services that were rendered to the registrant’s investment adviser is compatible with maintaining the principal accountant’s independence and has concluded that the provision of such non-audit services by the accountant has not compromised the accountant’s independence.
Non-Audit Related Fees | FYE 10/31/2012 | FYE 10/31/2011 | ||||||
Registrant | 0 | 0 | ||||||
Registrant’s Investment Adviser | 0 | 0 | ||||||
Item 5. Audit Committee of Listed Registrants.
Not applicable to registrants who are not listed issuers (as defined in Rule 10A-3 under the Securities Exchange Act of 1934).
Item 6. Investments.
Schedule of Investments is included as part of the report to shareholders filed under Item 1 of this Form.
Item 7. Disclosure of Proxy Voting Policies and Procedures for Closed-End Management Investment Companies.
Not applicable to open-end investment companies.
Item 8. Portfolio Managers of Closed-End Management Investment Companies.
Not applicable to open-end investment companies.
Item 9. Purchases of Equity Securities by Closed-End Management Investment Company and Affiliated Purchasers.
Not applicable to open-end investment companies.
Item 10. Submission of Matters to a Vote of Security Holders.
There have been no material changes to the procedures by which shareholders may recommend nominees to the registrant’s board of trustees.
2
Item 11. Controls and Procedures.
| (a) | The Registrant’s President and Treasurer have reviewed the Registrant’s disclosure controls and procedures (as defined in Rule 30a-3(c) under the Investment Company Act of 1940 (the “Act”)) as of a date within 90 days of the filing of this report, as required by Rule 30a-3(b) under the Act and Rules 13a-15(b) or 15d-15(b) under the Securities Exchange Act of 1934. Based on their review, such officers have concluded that the disclosure controls and procedures are effective in ensuring that information required to be disclosed in this report is appropriately recorded, processed, summarized and reported and made known to them by others within the Registrant and by the Registrant’s service provider. |
| (b) | There were no changes in the Registrant’s internal control over financial reporting (as defined in Rule 30a-3(d) under the Act) that occurred during the second fiscal quarter of the period covered by this report that has materially affected, or is reasonably likely to materially affect, the Registrant’s internal control over financial reporting. |
Item 12. Exhibits.
| (a) | (1) Any code of ethics or amendment thereto, that is the subject of the disclosure required by Item 2, to the extent that the registrant intends to satisfy Item 2 requirements through filing an exhibit. Incorporated by reference to the Registrant’s Form N-CSR filed January 6, 2011. |
(2) A separate certification for each principal executive and principal financial officer pursuant to Section 302 of the Sarbanes-Oxley Act of 2002. Filed herewith.
(3) Any written solicitation to purchase securities under Rule 23c-1 under the Act sent or given during the period covered by the report by or on behalf of the registrant to 10 or more persons. Not applicable to open-end investment companies.
| (b) | Certifications pursuant to Section 906 of the Sarbanes-Oxley Act of 2002. Furnished herewith. |
3
SIGNATURES
Pursuant to the requirements of the Securities Exchange Act of 1934 and the Investment Company Act of 1940, the registrant has duly caused this report to be signed on its behalf by the undersigned, thereunto duly authorized.
| (Registrant) The Tocqueville Trust | ||||||
| By (Signature and Title)* | /s/ Robert W. Kleinschmidt | |||||
| Robert W. Kleinschmidt, President | ||||||
| Date December 28, 2012 | ||||||
Pursuant to the requirements of the Securities Exchange Act of 1934 and the Investment Company Act of 1940, this report has been signed below by the following persons on behalf of the registrant and in the capacities and on the dates indicated.
| By (Signature and Title)* | /s/ Robert W. Kleinschmidt | |||
| Robert W. Kleinschmidt, President | ||||
| Date December 28, 2012 | ||||
| By (Signature and Title)* | /s/ John Cassidy | |||
| John Cassidy, Treasurer | ||||
| Date December 28, 2012 | ||||
| * | Print the name and title of each signing officer under his or her signature. |
4