UNITED STATES
SECURITIES AND EXCHANGE COMMISSION
Washington, D.C. 20549
FORM N-CSR
CERTIFIED SHAREHOLDER REPORT OF REGISTERED
MANAGEMENT INVESTMENT COMPANIES
Investment Company Act file number 811-4840
The Tocqueville Trust
(Exact name of registrant as specified in charter)
The Tocqueville Trust
40 W. 57th Street, 19th Floor
New York, NY 10019
(Address of principal executive offices) (Zip code)
Robert W. Kleinschmidt, President
The Tocqueville Trust
40 W. 57th Street, 19th Floor
New York, NY 10019
(Name and address of agent for service)
212-698-0800
Registrant’s telephone number, including area code
Date of fiscal year end: October 31
Date of reporting period: October 31, 2010
| Item 1. | Report to Stockholders. |
ANNUAL REPORT
October 31, 2010
The Tocqueville Trust
Mutual Funds
The Tocqueville Fund
The Tocqueville Opportunity Fund
The Tocqueville International Value Fund
The Tocqueville Gold Fund
The Delafield Fund
The Select Fund

This report is not authorized for distribution to prospective investors unless preceded or accompanied by a currently effective prospectus of The Tocqueville Trust. Please call 1-800-697-FUND (3863) for a free prospectus. Read it carefully before you invest.
You are invited to visit our website @ www.tocquevillefunds.com
Dear Fellow Shareholder,
The markets have been generally good to investors for the past year and, in their wake, the major economies have given some signs of revival or, at least, stabilization. The more dynamic emerging economies have even weathered the financial crisis and continued to grow strongly.
Nevertheless, the global economic backdrop continues to follow a path that has been characteristic of the aftermaths of financial crises, as documented in last year’s opus by professors Carmen Reinhart and Kenneth Rogoff: This Time Is Different: Eight Centuries of Financial Folly (Princeton University Press). What this means, essentially, is that even if the worst is behind us, we may not yet be close to resuming pre-crisis rates of economic growth.
If history according to the authors is any guide, we could expect the following to continue for another few years:
Rising, or at least stubborn, unemployment in the major, developed economies; weak industrial commodities prices; continued weakness in housing activity and prices; and, altogether, historically sub-par economic growth. This does not mean that there will not be phases of growth acceleration, but these should be followed, in shorter order than usual, by slowdowns and hesitancies. More importantly, in the aftermath of financial crises, governments’ debts have always continued to rise even as economic activity began to recover and, according to Reinhart and Rogoff, this was not principally due to governments’ stimulus initiatives but, simply, to the fact that the sub-par rates of economic growth produced disappointing tax revenues.
Finally, convalescence from major financial crises are typically interrupted by aftershocks—often in the currency or sovereign credit areas. In other words, it will be prudent not to extrapolate too fast and too far every sign of reacceleration in economic growth.
One additional reason to be patient in awaiting the next great Bull Run is that share valuations across markets, while they have fallen back toward their historical averages, have not yet declined enough to qualify as a prelude to a significant expansion of multiples. This is especially true in view of near record-low interest rates. Without another major collapse in stock prices, which we neither wish nor expect, the resolution of this valuation problem would be for stock prices to mark time while corporate profits continue to recover.
In all this, I see a somewhat paradoxical silver lining. In recent weeks, some leading individual stocks have experienced air pockets (declines of 25%-30% in a few days) on news that were somewhat disappointing for the near-term but not necessarily devastating in a fundamental or longer-term perspective. Such declines, if not fully warranted (subject, of course, to further analyses), may have brought the individual stocks in question much closer to bottom-like valuation levels. If this trend persists, it may become a kind of rolling bottom that would not necessitate a deep correction of the broad market. What I find encouraging is that, while it has been difficult, since 2008, for investors to outperform without making macro-decisions (to be in or out of the “market”), such a development would usher a new golden period for stock-picking investors.
Wishing everyone a happy and prosperous New Year,
Respectfully,

François Sicart
Chairman
| Annual Report | 1 |
The Tocqueville Fund
Dear Fellow Shareholder,
Our fiscal year ended just prior to an important so-called “wave” election that dramatically altered the power structure in Washington, D.C., at least according to the pundits. Whether the results will really change anything remains to be seen, but the rally in the markets leading up to the election suggests that investors expect, at the very least, to see a slowdown, if not a reversal, in the rash of new government programs, regulations, and taxes that have spooked the economy. While hopeful, we’re not so sure. Both national political parties have been complicit in the steady growth in the size, power, and scope of the federal government over the past several decades, and it is almost too much to ask of the mere mortals recently elected to begin the long process of voluntary reduction.
It is the natural tendency of governments to broaden their prerogatives, and the historical record is bereft of peaceful diminishments. The only exception in the past century was the collapse of communism in Eastern Europe. Fortunately, our situation is not yet so dire that we can or need contemplate a similar fate for our own government. But the signs do not auger well. Throughout what used to be called the developed world, sovereign debt and public finances are in a state of extreme disrepair, but not yet at crisis levels except in such places as Greece, Ireland, and, arguably, California. It will take a crisis, I suspect—and one more severe than what we experienced in 2008 and 2009—before U.S. politicians of either stripe feel the sense of urgency required to scale back the size of the State. Until that time (and it is not to be wished for), it is against precedent to expect a solution to our budgetary woes, regardless of who is in power. As a result, it is unlikely that the markets will continue a rally based upon that particular note of optimism.
Nor do we expect corporate profits, which have rebounded very smartly from their recession lows, to continue their torrid pace. Profitability has been restored in large part by cost-cutting and inventory restocking, and it seems likely that there is little momentum left in either of those two drivers. This leaves us where we have been for most of the past decade: in a stock-picker’s market. Individual companies selling at depressed levels and at a discount from their intrinsic long-term value are attractive purchase candidates in just about any macroeconomic or political scenario, and that is precisely what our “contrarian-value” approach endeavors to identify. Increasingly, we also look for companies whose internal dynamics offer opportunity for either reassessment by the consensus or the possibility of a “corporate event,” such as a merger or recapitalization, to surface submerged value.
In the fiscal year just ended, in which the Tocqueville Fund returned 17.95 percent compared with a 16.52 percent return for the S&P 500 Index, stocks involved in corporate actions were important contributors to our results. Smith International, Mariner Energy, King Pharmaceuticals, Genzyme, Weyerhaeuser, and East West Bancorp were all involved in various corporate actions that benefited shareholders. In the coming year we will continue to look for companies similarly positioned to take actions to enhance the value of their stock.
Our major winners in the year just past, however, were material companies that gained from their exposure to higher commodity prices; the result, no doubt, of the inflationary fears engendered by the aforementioned budgetary crisis in the U.S., Europe, and Japan, as well as by soaring demand from China. Cliffs Natural Resources, an iron-ore producer; Newmont Mining, a leading gold company; and DuPont de Nemours, a chemical and agricultural giant, generated more than 20 percent of our total return for the year.
On the other side of the equation, losing positions were modest, with financial names Wilmington Trust (the subject of a “take-under” bid), Bank of New York, and Mitsubishi Financial Group being among the largest negative contributors to our results. As is usually the case in a strong year, it was the relatively few losing positions and their lack of severity that was most beneficial to our returns. Of the 87 positions held in the fund at one time or another over the course of the year, only 16 contributed negatively to performance; the largest of these cost fewer than 40 basis points. Avoiding losers by managing price risk remains a key focus of our value strategy.
“Bull markets climb a wall of worry” is an old Wall Street adage, and there are plenty of bricks in that wall at present. So we cannot rule out a continuation of the rally that began in earnest in March of ‘09 and resumed in the two
| 2 | October 31, 2010 |
months before the recent election. But, as I said before, we are not counting on it; nor are we investing in names that would particularly profit from market momentum. If we are incorrect in our assessment, our shareholders will certainly benefit from an updraft, though likely at a slower pace than the overall market. That is a price we are willing to pay in order to manage our downside risk in this uncertain world.
As the fund’s portfolio manager and one of its largest shareholders, let me take this opportunity to thank you for your continued support.
Respectfully,

Robert W. Kleinschmidt
Portfolio Manager
| Annual Report | 3 |
The Tocqueville Fund
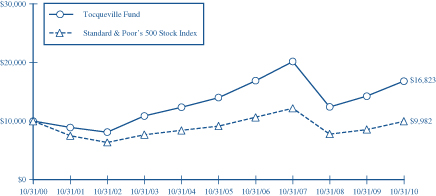
This chart assumes an initial gross investment of $10,000 made on 10/31/00. Returns shown do not reflect the deduction of taxes that a shareholder would pay on fund distributions or the redemption of fund shares. Performance reflects fee waivers in effect. In the absence of fee waivers, total return would be reduced. Returns shown include the reinvestment of all dividends and other distributions. Past performance is not predictive of future performance. Investment return and principal value will fluctuate so that your shares, when redeemed, may be worth more or less than their original cost. The Fund imposes a 2% redemption fee on shares held for 120 days or less.
The Standard & Poor’s 500 Stock Index (S&P 500) is a capital-weighted index, representing the aggregate market value of the common equity of 500 stocks primarily traded on the New York Stock Exchange. Returns assume the reinvestment of all dividends.
AVERAGE ANNUAL RATE OF RETURN (%)
FOR PERIODS ENDED OCTOBER 31, 2010
| 1 Year | 3 Year | 5 Year | 10 Year | |||||||||||||
Tocqueville Fund | 17.95% | -5.90% | 3.70% | 5.34% | ||||||||||||
Standard & Poor’s 500 Stock Index | 16.52% | -6.49% | 1.73% | -0.02% | ||||||||||||
| 4 | October 31, 2010 |
The Tocqueville Opportunity Fund
Dear Fellow Shareholder,
We are pleased to provide a review of the Fund’s performance and strategy for the fiscal year ended 10/31/10. For the fiscal year, the Fund performance was +22.56%, the Russell 2500 Growth Index rose 28.76% and the Russell 2000 Index rose +26.58%. The Fund was managed in the Contrarian value style for the bulk of the fiscal year, and slightly outperformed the respective small capitalization Russell 2000 Value index which increased +24.43%. On July 1, 2010 a new portfolio management team assumed management of the Fund, and on October 12, 2010 the Fund was renamed The Tocqueville Opportunity Fund. Over the last four months of the fiscal year, the Fund’s value increased +18.92% under the new portfolio management team versus the Russell 2000 Index which increased +15.84%.
During the fiscal year, the portfolio team proceeded to shift investments toward a more pro-cyclical, economy sensitive bias as our confidence in a sustained economic recovery strengthened. Investments in the Healthcare and Consumer Staples sectors were reduced, and commitments to the Technology and Consumer Discretionary sectors were increased. While investments in the Energy sector were reduced significantly, the sector’s overall investment profile was diversified by adding exposure to U.S. based oil production and offshore drilling equipment suppliers. In a notable shift over the past year, the Fund’s holdings at the end of the fiscal year included a 5% holding in ADRs which were predominantly comprised of investments in China based companies in the Internet, Industrial, Travel and Lodging industries.
The Fund’s name has been changed to reflect an expanded investment strategy which will include small and mid capitalization stocks which may be categorized as either value or growth stocks. The investment strategy is built around a stock selection methodology in which valuation, growth, stability, return on capital, and management execution are assessed through fundamental based research. This effort includes meeting with the managements of the companies in which we are invested. Cyclical recovery and restructuring themes have frequently been investment targets for the Fund. As a result of a broadened investment approach, the Fund will also be increasingly tilted toward investment opportunities which have demonstrated superior and steady growth in operating earnings. At its core, the strategy is focused on a search for better than average growth investments while maintaining a valuation discipline which we deem “growth at a reasonable price” versus “growth at any price”.
The universe of stocks in the small and mid cap space is immense at more than 5000 issues, and the team applies a proprietary selection methodology which reduces the universe to less than 400 issues which should be considered as premier candidates. This universe is subsequently further refined and ranked . The team’s approach includes the evaluation of young, emerging companies which may have limited operating track records and therefore may provide limitations with regard to historical analysis—these kinds of investments may present a significant investment opportunity for the Fund and may be made during the initial public offer or shortly thereafter. The Fund recently invested in the initial sale of shares in NetSpend Holdings and in the shares of RealD which went public in July 2010. Our investment approach does not specify investment in companies with any targeted holding period, however there is a preference for strategic and long term investments in companies which are positioned to continue to gain market share in a dynamic and expanding underlying business. In selecting issues for the portfolio, there are several standards which are critical in addition to valuation levels and expected growth, including:
| 1) | a differentiated model and potentially disruptive technology, product or service |
| 2) | a powerful and innovative R&D platform |
| 3) | a leadership position in a growth market |
| 4) | a competitive advantage and high barriers to competition |
| 5) | a visionary management and high insider ownership |
Unlike many investment approaches which emphasize concentrated portfolio holdings of 25 to 50 issues, we anticipate that the Fund will average 75 to 100 issues. Against a benchmark comprised of 2500 issues, the Russell 2500
| Annual Report | 5 |
Growth Index, even 100 issues should provide plenty of concentration but enough diversification to mitigate risks experienced by smaller companies—competitor innovation, financing, single product, key management, obsolescence. A wider lens for investment than the Fund historically allowed should allow for strategic footholds in strong, emerging investment opportunities which can be increased over time as evidence of success is achieved—often it is the surviving pawn which claims the victory from the standing King in the game of chess. The strategy allows a prospective winner a spot on the field. And we expect the diversified portfolio to provide a measured level of protection against any single issue’s risk.
During the past year, strong performance attribution was provided by investments in TIBCO Software, Ultratech and Silicon Images in Technology, and Thoratec, Alkermes and IMS Health in the Healthcare sector. These investments were reduced during the fiscal period in order to fund new investments. Portfolio performance was negatively impacted by investments in Energy Solutions and Telecommunications Systems. From the end of June 30, 2010, new investments which have contributed significantly to Fund performance include: Priceline; Dril-Quip; Plains Exploration; Chipotle Mexican Grill; Real D; Northern Oil and Gas, Brigham Exploration ; and Pride International. As a group, the Chinese ADRs also provided a good lift to performance: Ctrip Intl, VanceInfo Technologies, Home Inns and Hotels and Baidu.
The past year has proven once again the difficulty of forecasting. A year ago, investment strategists were seized with fears of inflation, a valueless dollar, double dips and an earnings peak. One year later, the market is higher, deflation is a primary concern, the dollar still stands, and earnings have grown strongly. Ironically, while companies have exceeded both revenue and earnings expectations every quarter, investors refuse to believe the good news can continue. We have continued to maintain that valuation multiples are attractive on an historical basis and are significantly discounted relative to potentially improved news over the next several quarters with regard to the pace of economic growth, the unemployment level, and a resumption of capital spending by private enterprise. Moreover, we find many examples of companies in the USA which grew right through the recession and have continued to grow by leaps and bounds—disproving the argument that investors need to move to emerging markets to find growth. Finally, strict attention to costs should positioned companies to experience significant profitability if revenues accelerate with a decent economy.
The Opportunity Fund team appreciates your confidence in our efforts and looks forward to the coming year.
Sincerely,

Thomas R. Vandeventer
Portfolio Manager
| 6 | October 31, 2010 |
The Tocqueville Opportunity Fund
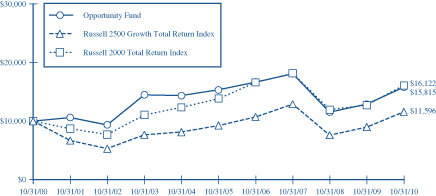
This chart assumes an initial gross investment of $10,000 made on 10/31/00. On July 1, 2010, a new portfolio management team assumed management of The Tocqueville Small Cap Fund and the Fund’s name and investment strategy changed as of October 12, 2010 (See Footnote 1 to the Financial Statements). Returns shown do not reflect the deduction of taxes that a shareholder would pay on fund distributions or the redemption of fund shares. Performance reflects fee waivers in effect. In the absence of fee waivers, total return would be reduced. Returns shown include the reinvestment of all dividends and other distributions. Past performance is not predictive of future performance. Investment return and principal value will fluctuate so that your shares, when redeemed, may be worth more or less than their original cost. The Fund imposes a 2% redemption fee on shares held for 120 days or less.
The Russell 2500 Growth Total Return Index* is an unmanaged index that measures the performance of the small to mid-cap growth segment of the U.S. equity universe. It includes those Russell 2500 companies with higher price-to-book ratios and higher forcasted growth values. Returns assume the reinvestment of all dividends.
The Russell 2000 Total Return Index is an unmanaged index that measures the performance of the 2,000 smallest companies in the Russell 3000 Index, which represents approximately 8% of the total market capitalization of the Russell 3000 Index. Returns assume the reinvestment of all dividends.
AVERAGE ANNUAL RATE OF RETURN (%)
FOR PERIODS ENDED OCTOBER 31, 2010
| 1 Year | 3 Year | 5 Year | 10 Year | |||||||||||||
Tocqueville Opportunity Fund | 22.56% | -4.40% | 0.61% | 4.69% | ||||||||||||
Russell 2500 Growth Total Return Index | 28.76% | -3.52% | 4.55% | 1.49% | ||||||||||||
Russell 2000 Total Return Index | 26.58% | -3.91% | 3.07% | 4.89% | ||||||||||||
| * | As a result of the Fund’s change in investment strategy, the Fund is changing its primary benchmark to the Russell 2500 Growth Total Return Index. Management feels that this index more accurately compares to the Fund in its broader scope of market capitalization than that of the Russell 2000 Total Return Index and focus on companies with growth characteristics. |
| Annual Report | 7 |
The Tocqueville International Value Fund
Dear Fellow Shareholder,
For the fiscal year ended October 31, 2010, the Tocqueville International Value Fund’s total U.S. dollar return was 16.96%. In the same period, the Morgan Stanley EAFE Index, the index against which we are most often compared, had a total U.S. dollar return of 8.82%.
During the first part of the year, global equity markets continued the recovery begun in March 2009, as credit spreads tightened further, an inventory cycle took hold and helped fuel growth, and improving corporate cash flows and business confidence fueled an increase in mergers and acquisitions activity. Markets suffered a sharp setback mid-year when investors were unnerved by a host of issues including European fiscal problems, the possibility of tightening measures in China, the as yet unresolved oil spill in the Gulf of Mexico, a growing lack of faith in the economic policies of the Obama administration, and the possibility of deflation and a “double dip” economic scenario. However, markets began to rally in late summer as these worries were allayed by an apparently benign outcome to European bank stress tests, better than expected macroeconomic data, strong corporate earnings, and the recognition that the U.S. Federal Reserve stood ready to implement additional quantitative easing.
Over the course of the fiscal year, on a total return basis the European BE 500 Index increased by 16.66% in local currency terms, the Japanese Nikkei 225 Index decreased by 6.80% in local currency terms, and the MSCI Asia Pacific ex- Japan Index increased by 11.29%. The Euro declined against the U.S. dollar as shaky bank and sovereign finances raised the specter of weak economic growth and a challenge to the integrity of Europe’s economic unit. The Japanese Yen strengthened further as local investors repatriated cash and deflation produced acceptable real interest rates. Elsewhere, the currencies of well-capitalized sovereigns with positive current accounts, like Australia, Brazil, Malaysia and Thailand, increased against the US dollar while currencies of indebted nations in Eastern Europe and elsewhere, flagged. The CRB RIND Index of commodities increased by 23.34% and gold continued its ascent as money printing undercut the credibility of paper currencies and tepid economic performance in developed economies raised the specter of competitive devaluations. In equities, the greatest gains were experienced in frontier markets in Africa and Asia like Bangladesh, Philippines and Kenya, and in markets whose economies are linked with commodities, like Indonesia and Chile. In terms of sectors, the greatest gains were experienced in real estate, auto parts, metals and mining, and industrial products, while banks and construction materials were laggards.
Our Fund produced a meaningful absolute return during the fiscal year and finished well ahead of its benchmark largely due to security selection: most of our positions produced gains, we avoided substantial losses, and we generated substantial profits in Japan, notwithstanding the fact that the overall markets was up marginally in U.S. dollar terms. Standout contributors to profits during the year included: Belgian steel wire and cord producer Bekaert, which continued to benefit from growing car production in emerging markets; German compact equipment maker Wacker Neuson, where effective business management and export demand helped the company generate strong cash flow despite a tepid demand environment in Europe; Thai broadcast television company BEC World, whose leading market position in a recovering advertising market combined to produce strong free cash generation; and Japanese industrial automation concern Omron, a beneficiary of increased industrial activity in Asia and globally. Our only notable loss was in Brazilian oil giant Petrobras, whose shares declined in anticipation of a large equity financing, the proceeds of which will be used to develop the company’s plentiful reserves.
We believe the global economy will continue along a path of uneven recovery, where fortunes will be mixed among countries and companies that are well capitalized and those that are not. Europe will likely muddle through as the leading European nations have too much invested in the Euro project to allow it to fail. Growth in developed economies will likely underwhelm. Moreover, it is reasonable to think that China’s growth has been fueled in part by government directed investment in unneeded real estate projects and excess production capacity, giving rise to the possibility of a slowdown there. Further, while bank finances have improved, the financial system is still not healthy. In sum, it remains a stock picker’s market. And in the face of multiple macro uncertainties, our approach is to be ever more strict in applying our discipline of purchasing stocks at a substantial discount to intrinsic value and selling them when they are fairly valued.
| 8 | October 31, 2010 |
During the year, we exited positions in BEC World, in Japanese robotics maker Fanuc, in Swiss technology firm Kudelski, and in French outdoor advertising concern JC Decaux as they reached our valuations objectives.
We continue to seek and find exceptional values in companies with strong business franchises. A few notable additions to the portfolio during the year include: UK telecom operator Vodafone, whose minority stake in Verizon Wireless is ascribed little value by the market and where we see events unfolding that will cause that value to be realized; Japanese conglomerate Hitachi, which trades at a substantial discount to the value of its parts and where a new management team has undertaken shareholder friendly restructuring initiatives and a program of improving the returns of underperforming business units; UK private equity concern 3i, which trades at a steep discount to net asset value; Hong Kong Electric, a highly cash generative utility that stands to benefit from growth in demand and price inflation; German steel distributor Kloeckner, which remains a well-capitalized leader in a consolidating industry; Belgian holding company Groupe Bruxelles Lambert, which trades at a substantial discount to the net asset value of its holdings, several of which are in turn undervalued; Interserve, a UK-based facilities management company with operations in the Middle East whose business produces a double digit cash flow yield in spite of currently depressed business conditions; and Makita, a leading global producer of power tools with large exposure to emerging markets in Asia that trades at a modest multiple of operating cash flow.
One question that is often posed to us by investors and potential investors in our Fund is our target exposure to emerging markets stocks. Our response is that we have no preconceived notions about an appropriate level of exposure. We have at times had a very substantial exposure to emerging markets stocks and at times quite limited exposure. Our holdings are a byproduct of our contrarian value discipline and our investment dollars flow to the most attractive risk reward propositions wherever they might exist. Today, it may be the case that economic growth fundamentals in emerging markets are generally more attractive than those in developed economies, and the risk profile of some emerging markets is improving with better fiscal management, improved disclosure etc. It is also the case, in our view, that with the consensus of investors favorably disposed to emerging markets, it is more difficult to uncover compelling values in emerging markets stocks. On the other hand, there are plenty of companies in developed markets that derive a significant portion of their cash flows from emerging economies, a fact which may not be reflected in their valuations. So there are times, and in our view today is one, when the best way to get exposure to emerging market economic growth is through developed market stocks. This abstract notion is brought to life in a number of our current portfolio holdings, such as Makita, which derives some 40% of its revenues from emerging markets, Bekaert, which derives roughly 50% of its operating earnings from China, Italian auto parts maker Sogefi, which derives approximately 40% of its operating earnings from Mercosur, or even Unilever, which has very substantial businesses in Indonesia and India, inter alia. We aim to buy good businesses, part of the definition of which is having a strong market position in healthy end markets, including the growth attendant in emerging markets exposure, but we also buy good businesses when they are out of favor and cheap in order to ensure a margin of safety for our investors.
We continue to employ our investment discipline, seeking to discover fundamentally attractive companies that are out of favor and undervalued, and to provide our shareholders with above average returns with below average risk over the course of an economic cycle.
Respectfully,
 /s/ James Hunt | /s/ | |||
| James Hunt | Francois Sicart | |||
| Portfolio Manager | Portfolio Manager | |||
| Annual Report | 9 |
The Tocqueville International Value Fund
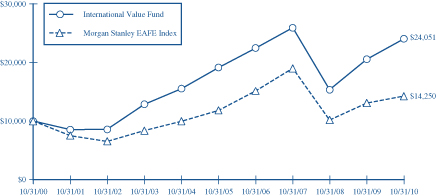
This chart assumes an initial gross investment of $10,000 made on 10/31/00. Returns shown do not reflect the deduction of taxes that a shareholder would pay on fund distributions or the redemption of fund shares. Performance reflects fee waivers in effect. In the absence of fee waivers, total return would be reduced. Returns shown include the reinvestment of all dividends and other distributions. Past performance is not predictive of future performance. Investment return and principal value will fluctuate so that your shares, when redeemed, may be worth more or less than their original cost. The Fund imposes a 2% redemption fee on shares held 120 days or less.
The Morgan Stanley EAFE Index is an unmanaged market-capitalization-weighted index composed of companies representative of the market structure of 20 Developed Market Countries in Europe, Australia, Asia and the Far East.
AVERAGE ANNUAL RATE OF RETURN (%)
FOR PERIODS ENDED OCTOBER 31, 2010
| 1 Year | 3 Year | 5 Year | 10 Year | |||||||||||||
Tocqueville International Value Fund | 16.96% | -2.47% | 4.66% | 9.17% | ||||||||||||
Morgan Stanley EAFE Index | 8.82% | -9.15% | 3.79% | 3.61% | ||||||||||||
| 10 | October 31, 2010 |
The Tocqueville Gold Fund
Dear Fellow Shareholder,
During fiscal 2010, the Tocqueville Gold Fund returned 65.22% and over the past ten years the cumulative return has been 1187.84%. For the same respective time periods, this compares to 31.46% and 425.37% for the Philadelphia Stock Exchange Gold and Silver Index (“XAU Index”); 30.04% and 412.49% for the gold price; and, 16.52% and -0.17% for the S&P 500 Index.
Two significant developments boosted the gold price in 2010. First the Greek debt crisis in the spring contributed to doubts as to the safety of the euro. In our opinion, many investors who took refuge in the euro to escape from the US dollar learned a tough lesson—that no paper currency deserves safe haven status. As investors dumped their euro holdings, the dollar appreciated and gave the appearance of strength. Dollar strength has usually been associated with a weak gold price. However, in this instance, the gold price rallied both in US dollar and euro terms. More important, gold broke out to an all time high in euro terms. As a side note, it is remarkable but unsurprising that the European sovereign debt crisis remains unresolved. At the moment, finance ministers in Europe are scrambling to rescue Ireland, while spreads for Greek sovereign debt have widened to levels that exceed those when Greece was front page news in May. In our opinion, permanent resolution of the credit woes afflicting the weaker European economies (PIIGS-Portugal, Italy, Ireland, Greece, and Spain) will remain elusive. Bailouts and rescues resolve nothing and have only bought time while potentially fueling inflation by further undermining confidence in the euro.
The second key development was the launch of a second round of quantitative easing (QE 2) by the Federal Reserve. While economists debate whether additional money printing by the Fed was necessary or will have a positive effect on economic activity, the rationale put forth by Chairman Bernanke and other Fed officials was quite disturbing to foreign holders of US dollars. That rationale unequivocally stated that the purpose of QE 2 was to create inflation. Such statements coincided with a new upward leg in the gold price, which rose from $1,308.35 at the end of September to an all time high of $1,387.35 on October 14, 2010. On the day after the Fed officially announced that it would proceed with QE 2, the gold price rallied 3% in a single day. The action was met with a storm of criticism from academia, former Fed officials, and ministries of our trading partners claiming Fed actions would result in dollar debasement.
While many observers feel that the gold rally has been over done, is too crowded, resembles a bubble or whatever, the simple fact remains that central banks of the Western democracies appear on course to debase paper currencies. On the one hand, currency debasement is the path of least resistance to grapple with the seemingly intractable fiscal issues of record deficits and unchecked growth in entitlements. On the other hand, persistent economic weakness translates into political pressure for central banks to pursue extremely lax monetary policies. Under these circumstances, it is hard to argue against the notion that some exposure to gold offers protection against monetary damage still to come.
Our investment strategy in managing the Tocqueville Gold Fund portfolio remains consistent with practices since the inception date of 6/30/98. Our research team has travelled over 500,000 miles since 2003, to remote sites around the world to visit the mining and exploration activities of smaller companies. We seek to invest in companies at an early stage of development which can generate growth through exploration success or new mine construction. In this way, we have invested earlier than most of our peers and well before investment banks and brokerage firms commenced research coverage. This strategy is reflected in the fact that our average market cap is 60% of our peer group average. It is also exhibited in our low turnover of less than 10% in 2010. The success of our approach is manifest in having numerous acquisitions of our positions by large cap mining companies. Two notable examples of this in the past year were the acquisition of Red Back by Kinross and the acquisition of Andean Resources by Gold Corp.
Other examples of the our strategy contributing to the outperformance of the Fund over the past year were Andean Resources, Osisko Mining and Ivanhoe Mines, which were up 211.8%, 105.8%, and 123.5% respectively. Overall, many of the positions in the portfolio performed well but there were also some that did not meet our expectations. However, these were few and far between and did not significantly impact the overall performance of the Fund. Among this group were Wits Gold, Ivanhoe Australia, and Minefinders which were down -31.2%, -2.6%, and -6.9% respectively.
| Annual Report | 11 |
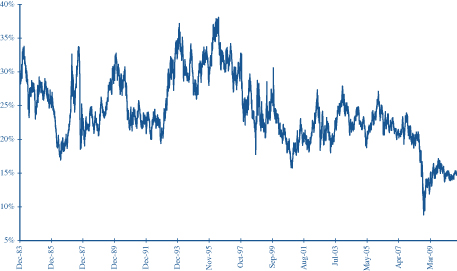
We believe that mining stocks remain cheap relative to gold bullion. As evidence, we point to the chart below which depicts our benchmark, the XAU Index, as a fraction of the gold price. At its level on 10/31/10 of 15%, it remains well below its historical norm of 20%-25%. What investors seem to be forgetting is that the business of producing gold has suddenly become a quite healthy, unlike the lean years leading up to 2008. This is reflected in strong earnings reports, much improved returns on capital, and a multitude of dividend increases. Unlike gold bullion, successful gold mining companies are capable of generating internal growth, returning capital to shareholders in the form of dividends, and participating in potentially accretive merger activity. We believe that investment in gold mining shares, given the current level of profitability, is capable of producing acceptable investment returns even if the price of gold were to hypothetically remain range bound for a period of a few years.
XAU (PHLX Gold/Silver Sector Index) as a Ratio of Spot Gold ($/oz)
(Dec. 19, 1983 – Oct. 29, 2010)
Finally, I am pleased to report that the Tocqueville Gold Fund was cited in the Wall Street Journal (10/01/10) as one of the top four “Ten Year Best Performers” as of 9/30/10. This designation was not only in comparison to other precious metals funds, but against the entire Lipper universe of equity mutual funds. Furthermore, the Fund’s performance was in the top 1% of all mutual funds in the Morningstar universe for the 1-, 3-, 5-, 10-year periods ended 9/30/10. Lastly, the Fund is the only fund in Morningstar’s Equity Precious Metals Funds Category with top quartile performance for the 1-, 3-, 5- and 10-year periods ended 9/30/10 and below average risk for its category.
With best wishes for a prosperous 2011,
Sincerely,

/s/ John C. Hathaway
John C. Hathaway
Portfolio Manager
| 12 | October 31, 2010 |
The Tocqueville Gold Fund
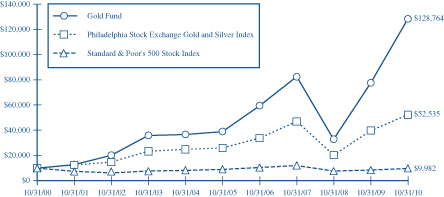
This chart assumes an initial gross investment of $10,000 made on 10/31/00. Returns shown do not reflect the deduction of taxes that a shareholder would pay on fund distributions or the redemption of fund shares. Performance reflects fee waivers in effect. In the absence of fee waivers, total return would be reduced. Returns shown include the reinvestment of all dividends and other distributions. Past performance is not predictive of future performance. Investment return and principal value will fluctuate so that your shares, when redeemed, may be worth more or less than their original cost. The Fund imposes a 2% redemption fee on shares held 120 days or less.
In 2003, 2006, 2009, and 2010 the performance of The Tocqueville Gold Fund was achieved during a period of unusually favorable market conditions. Such performance may not be sustainable.
The Philadelphia Stock Exchange Gold and Silver Index is an unmanaged capitalization-weighted index which includes the leading companies involved in the mining of gold and silver. Returns include the reinvestment of all dividends.
The Standard & Poor’s 500 Stock Index (S&P 500) is a capital-weighted index, representing the aggregate market value of the common equity of 500 stocks primarily traded on the New York Stock Exchange. Returns include the reinvestment of all dividends.
AVERAGE ANNUAL RATE OF RETURN (%)
FOR PERIODS ENDED OCTOBER 31, 2010
| 1 Year | 3 Year | 5 Year | 10 Year | |||||||||||||
Tocqueville Gold Fund | 65.22% | 15.87% | 26.84% | 29.12% | ||||||||||||
Philadelphia Stock Exchange Gold and Silver Index | 31.46% | 3.64% | 15.02% | 18.04% | ||||||||||||
Standard & Poor’s 500 Stock Index | 16.52% | -6.49% | 1.73% | -0.02% | ||||||||||||
| Annual Report | 13 |
The Delafield Fund
Dear Fellow Shareholder,
For the twelve months ended October 31, 2010, the Fund’s net asset value increased 24.96% versus an increase of 16.52% for the Standard & Poor’s 500 Index (“S&P 500”) and 26.58% for the Russell 2000 Index (“Russell 2000”), each on a total return basis. The Fund’s net asset value as of October 31, 2010 was $26.65 per share. The net asset value amounted to $933,673,585, of which 81.0% was invested in equities, 2.7% in fixed income, and the balance held in cash reserve.
The largest contributors to our twelve month performance were Ferro Corporation, Checkpoint Systems, Inc. and Vishay Intertechnology, Inc. On the negative side, Collective Brands, Inc., School Specialty, Inc. and Harsco Corporation were among the largest detractors. While the portfolio is not constructed with Sector/Industry allocation targets, the portfolio was relatively overweight in the materials and industrials sectors throughout the year, which benefited performance. In contrast, we were relatively underweight in the consumer discretionary sector, which was among the top performing sectors in the Russell 2000 for the fiscal year.
Share price volatility remains high and the stock market, which went on an unabated upward tear through the first six months of the year, waffled over the last six months. At the end of the year, the S&P 500 was almost flat relative to its closing price on April 30th, while the Russell 2000 trailed its second fiscal quarter close by a modest amount. The debate between inflation and deflation continues to rage. Moderate growth is generally expected in the U.S. and Europe, while strength continues in Latin America and Asia. To some extent, the emerging markets are supporting the rest of the world.
The situation of the American consumer remains mixed. Unemployment remains high, foreclosures continue and during the second calendar quarter of 2010, the consumers’ net worth declined modestly. A further drop in interest rates has allowed some homeowners to refinance at more attractive rates, increasing disposable income and enabling our savings rate to increase.
The financial system is slowly deleveraging. Corporate balance sheets, in general, remain strong. Companies are able to borrow with relative ease at rates which seem very attractive compared to recent years. As a corollary, with rates down, pension fund obligations, which have increased meaningfully, will have to be satisfied with substantial capital additions.
It seems worth reiterating the strategy which we employ in attempting to protect your capital and to enhance its growth. This approach has resulted in above average returns for many years. We believe it is logical and we will continue to seek to provide attractive returns in the years ahead.
1. We search for companies that we believe are selling at prices which seem modest in relationship to the company’s intrinsic value.
2. We meet with management, visit plants, talk to their competitors, consider the makeup of the Board of Directors and make a judgment as to whether we wish to be in business with the management. In other words, we try to understand the business of the companies in which we invest and the individuals who direct the company’s future.
3. We search for companies wherein something may change which will alter that company’s future for the better. These can be simple matters ranging from a change in the management or management’s attitude toward how they run the business, to a change in control, to a change in business opportunity, or to a change in the dynamics of a company’s cash flow and its use.
4. If we perform our analysis correctly, the value added we bring to you is an earlier and better understanding of the companies in our portfolio than that of other investors. Then, if the companies begin to improve, their earnings should increase and they should be valued at a higher price earnings multiple.
5. We have never worried about the profits that we did not make. We worry much more about what we might lose. We believe that stock selection is much more relevant to successful investing than total commitment to equities. In the volatile markets which have developed over the last 15 to 20 years, we have come to believe that the long-term
| 14 | October 31, 2010 |
investors’ best hedge against volatility is to have cash with which to invest in companies when prices seem unduly depressed.
While it is nice to be able to report that we have recovered substantially the wealth which we had lost since June 2007, the mixed signals we observed during the year and continue to monitor currently keep us cautious.
Sincerely,
 /s/ |  /s/ | |
| J. Dennis Delafield | Vincent Sellecchia | |
| Portfolio Manager | Portfolio Manager | |
| Annual Report | 15 |
The Delafield Fund
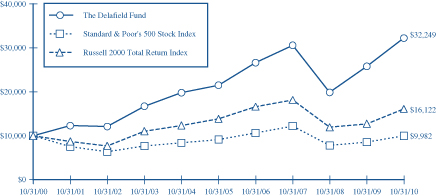
This chart assumes an initial gross investment of $10,000 made on 10/31/00. Since the Delafield Fund did not commence operations until 9/28/09, returns prior to that date are those of the Predecessor Fund. The Delafield Fund assumed the net asset value and performance history of the Predecessor Fund (See Footnote 1 to the Financial Statements). Returns shown does not reflect the deduction of taxes that a shareholder would pay on fund distributions or the redemption of fund shares. Performance reflects fee wiaviers in effect. In the absence of fee waivers, total return would be reduced. Returns shown include the reinvestment of all dividends and other distributions. Past performance is not predictive of future performance. Investment return and principal value will fluctuate so that your shares, when redeemed, may be worth more or less than their original cost. The Fund imposes a 2% redemption fee on shares held 120 days or less.
The Standard & Poor’s 500 Stock Index (S&P 500) is a capital-weighted index, representing the aggregate market value of the common equity of 500 stocks primarily traded on the New York Stock Exchange. Returns include the reinvestment of all dividends.
The Russell 2000 Total Return Index is an unmanaged index that measures the performance of the 2,000 smallest companies in the Russell 3000 Index, which represent approximately 8% of the total market capitalization of the Russell 3000 Index. Returns include the reinvestment of all dividends.
AVERAGE ANNUAL RATE OF RETURN (%)
FOR PERIODS ENDED OCTOBER 31, 2010
| 1 Year | 3 Year | 5 Year | 10 Year | |||||||||||||
The Delafield Fund | 24.96% | 1.77% | 8.44% | 12.42% | ||||||||||||
Standard & Poor’s 500 Stock Index | 16.52% | -6.49% | 1.73% | -0.02% | ||||||||||||
Russell 2000 Total Return Index | 26.58% | -3.91% | 3.07% | 4.89% | ||||||||||||
| 16 | October 31, 2010 |
The Select Fund
Dear Fellow Shareholder,
For the twelve months ended October 31, 2010, the Fund’s net asset value increased 36.55% versus an increase of 27.76% for the Russell 2500 Index (“Russell 2500”) and 26.58% for the Russell 2000 Index (“Russell 2000”), each on a total return basis. The Fund’s net asset value as of October 31, 2010 was $11.54 per share. The net asset value amounted to $41,788,138, of which 81.7% was invested in equities and the balance held in cash reserve.
The largest contributors to our twelve month performance were Trimas Corporation, Vishay Intertechnology, Inc., and Maidenform Brands, Inc. On the negative side, Tier Technologies, Inc. and Collective Brands, Inc. were among the largest detractors. While the portfolio is not constructed with Sector/Industry allocation targets, the portfolio was relatively overweight in the industrials sectors throughout the year, which benefited performance.
Share price volatility remains high and the stock market, which went on an unabated upward tear through the first six months of the year, waffled over the last six months. At the end of the fiscal year, the Standard & Poor’s 500 was almost flat relative to its closing price on April 30th, while the Russell 2000 trailed its second fiscal quarter close by a modest amount. The debate between inflation and deflation continues to rage. Moderate growth is generally expected in the U.S. and Europe, while strength continues in Latin America and Asia. To some extent, the emerging markets are supporting the rest of the world.
The situation of the American consumer remains mixed. Unemployment remains high, foreclosures continue and during the second calendar quarter of 2010, the consumers’ net worth declined modestly. A further drop in interest rates has allowed some homeowners to refinance at more attractive rates, increasing disposable income and enabling our savings rate to increase.
The financial system is slowly deleveraging. Corporate balance sheets, in general, remain strong. Companies are able to borrow with relative ease at rates which seem very attractive compared to recent years. As a corollary, with rates down, pension fund obligations, which have increased meaningfully, will have to be satisfied with substantial capital additions.
It seems worth reiterating the strategy which we employ in attempting to protect your capital and to enhance its growth. This approach has resulted in above average returns for many years. We believe it is logical and we will continue to seek to provide attractive returns in the years ahead.
1. We search for companies that we believe are selling at prices which seem modest in relationship to the company’s intrinsic value.
2. We meet with management, visit plants, talk to their competitors, consider the makeup of the Board of Directors and make a judgment as to whether we wish to be in business with the management. In other words, we try to understand the business of the companies in which we invest and the individuals who direct the company’s future.
3. We search for companies wherein something may change which will alter that company’s future for the better. These can be simple matters ranging from a change in the management or management’s attitude toward how they run the business, to a change in control, to a change in business opportunity, or to a change in the dynamics of a company’s cash flow and its use.
4. We will typically invest in a focused group of 12 to 25 common stocks issued primarily by small- to mid- sized domestic companies.
5. If we perform our analysis correctly, the value added we bring to you is an earlier and better understanding of the companies in our portfolio than that of other investors. Then, if the companies begin to improve, their earnings should increase and they should be valued at a higher price earnings multiple.
6. We have never worried about the profits that we did not make. We worry much more about what we might lose. We believe that stock selection is much more relevant to successful investing than total commitment to equities.
| Annual Report | 17 |
In the volatile markets which have developed over the last 15 to 20 years, we have come to believe that the long-term investors’ best hedge against volatility is to have cash with which to invest in companies when prices seem unduly depressed.
While it is nice to be able to report that we have recovered substantially the wealth which we had lost since June 2007, the mixed signals we observed during the year and continue to monitor currently keep us cautious.
| Sincerely, | ||||
/s/ | |  /s/ | ||
| J. Dennis Delafield | Vincent Sellecchia | Donald Wang | ||
| Portfolio Manager | Portfolio Manager | Portfolio Manager | ||
| 18 | October 31, 2010 |
The Select Fund
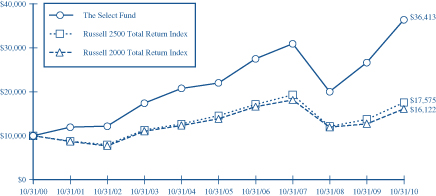
This chart assumes an initial gross investment of $10,000 made on 10/31/00. Since The Select Fund did not commence operations until 9/28/09, returns from the period from September 29, 2008 to September 27, 2009 are those of the Class Y Shares of the Predecessor Fund (See Footnote 1 to the Financial Statements). Prior to that period, returns shown are those of a limited partnership managed by the adviser. Returns shown do not reflect the deduction of taxes that a shareholder would pay on fund distributions or the redemption of fund shares. Performance reflects fee waivers in effect. In the absence of fee waivers, total return would be reduced. Returns shown include the reinvestment of all dividends and other distributions. Past performance is not predictive of future performance. Investment return and principal value will fluctuate so that your shares, when redeemed, may be worth more or less than their original cost. The Fund imposes a 2% redemption fee on shares held 120 days or less.
The Russel 2500 Total Return Index is an unmanaged index that measures the performance of the 2,500 smallest companies in the Russell 3000 Index. Returns include the reinvestment of all dividends.
The Russell 2000 Total Return Index is an unmanaged index that measures the performance of the 2,000 smallest companies in the Russell 3000 Index, which represents approximately 8% of the total market capitalization of the Russell 3000 Index. Returns include the reinvestment of all dividends.
AVERAGE ANNUAL RATE OF RETURN (%)
FOR PERIODS ENDED OCTOBER 31, 2010
| 1 Year | 3 Year | 5 Year | 10 Year | |||||||||||||
The Select Fund | 36.55% | 5.58% | 10.56% | 13.80% | ||||||||||||
Russell 2500 Total Return Index | 27.76% | -3.17% | 3.78% | 5.80% | ||||||||||||
Russell 2000 Total Return Index | 26.58% | -3.91% | 3.07% | 4.89% | ||||||||||||
| Annual Report | 19 |
Expense Example—October 31, 2010
As a shareholder of The Tocqueville Trust (the “Funds”), you incur ongoing costs, including management fees; distribution fees; and other Fund expenses. This example is intended to help you understand your ongoing costs (in dollars) of investing in the Funds and to compare costs with the ongoing costs of investing in other mutual funds.
The Example is based on an investment of $1,000 invested at the beginning of the period and held the entire period (May 1, 2010-October 31, 2010).
Actual Expenses
The first line of the table below provides information about actual account values and actual expenses. You may use the information in this line, together with the amount you invested, to estimate the expenses that you paid over the period. Simply divide your account value by $1,000 (for example, an $8,600 account value divided by $1,000 = 8.6), then multiply the result by the number in the first line under the heading entitled “Expenses Paid During Period” to estimate the expenses you paid on your account during this period.
Hypothetical Example for Comparison Purposes
The second line of the table below provides information about hypothetical account values and hypothetical expenses based on the Funds’ actual expense ratios and an assumed rate of return of 5% per year before expenses, which is not the Funds’ actual return. The hypothetical account values and expenses may not be used to estimate the actual ending account balance or expenses you paid for the period. You may use this information to compare the ongoing costs of investing in the Funds and other funds. To do so, compare this 5% hypothetical example with the 5% hypothetical examples that appear in the shareholder reports of the other funds.
Please note that the expenses shown in the table are meant to highlight your ongoing costs only and do not reflect any transactional costs, such as sales charges (loads), redemption fees, or exchange fees. Therefore, the second line of the table is useful in comparing ongoing costs only, and will not help you determine the relative costs of owning different funds. In addition, if these transactional costs were included, your costs would have been higher.
| 20 | October 31, 2010 |
Expense Example Tables
The Tocqueville Fund
| Beginning Account Value May 1, 2010 | Ending Account Value October 31, 2010 | Expenses Paid During Period* May 1, 2010 - October 31, 2010 | ||||||||||
Actual | $ | 1,000.00 | $ | 998.10 | $ | 6.30 | ||||||
Hypothetical (5% return before expenses) | 1,000.00 | 1,018.90 | 6.36 | |||||||||
| * | Expenses are equal to the Fund’s annualized expense ratio of 1.25%, multiplied by the average account value over the period, multiplied by 184/365 to reflect the one-half year period. |
The Tocqueville Opportunity Fund
| Beginning Account Value May 1, 2010 | Ending Account Value October 31, 2010 | Expenses Paid During Period* May 1, 2010 - October 31, 2010 | ||||||||||
Actual | $ | 1,000.00 | $ | 1,026.40 | $ | 7.46 | ||||||
Hypothetical (5% return before expenses) | 1,000.00 | 1,017.85 | 7.43 | |||||||||
| * | Expenses are equal to the Fund’s annualized expense ratio of 1.46%, multiplied by the average account value over the period, multiplied by 184/365 to reflect the one-half year period. |
The Tocqueville International Value Fund
| Beginning Account Value May 1, 2010 | Ending Account Value October 31, 2010 | Expenses Paid During Period* May 1, 2010 - October 31, 2010 | ||||||||||
Actual | $ | 1,000.00 | $ | 1,088.00 | $ | 8.21 | ||||||
Hypothetical (5% return before expenses) | 1,000.00 | 1,017.34 | 7.93 | |||||||||
| * | Expenses are equal to the Fund’s annualized expense ratio of 1.56%, multiplied by the average account value over the period, multiplied by 184/365 to reflect the one-half year period. |
The Tocqueville Gold Fund
| Beginning Account Value May 1, 2010 | Ending Account Value October 31, 2010 | Expenses Paid During Period* May 1, 2010 - October 31, 2010 | ||||||||||
Actual | $ | 1,000.00 | $ | 1,246.20 | $ | 7.53 | ||||||
Hypothetical (5% return before expenses) | 1,000.00 | 1,018.50 | 6.77 | |||||||||
| * | Expenses are equal to the Fund’s annualized expense ratio of 1.33%, multiplied by the average account value over the period, multiplied by 184/365 to reflect the one-half year period. |
The Delafield Fund
| Beginning Account Value May 1, 2010 | Ending Account Value October 31, 2010 | Expenses Paid During Period* May 1, 2010 - October 31, 2010 | ||||||||||
Actual | $ | 1,000.00 | $ | 992.20 | $ | 6.43 | ||||||
Hypothetical (5% return before expenses) | 1,000.00 | 1,018.75 | 6.51 | |||||||||
| * | Expense are equal to the Fund’s annualized expense ratio of 1.28%, multiplied by the average account value over the period, multiplied by 184/365 to reflect the one-half year period. |
| Annual Report | 21 |
The Select Fund
| Beginning Account Value May 1, 2010 | Ending Account Value October 31, 2010 | Expenses Paid During Period* May 1, 2010 - October 31, 2010 | ||||||||||
Actual | $ | 1,000.00 | $ | 1,015.80 | $ | 7.11 | ||||||
Hypothetical (5% return before expenses) | 1,000.00 | 1,018.15 | 7.12 | |||||||||
| * | Expense are equal to the Fund’s annualized expense ratio of 1.40%, multiplied by the average account value over the period, multiplied by 184/365 to reflect the one-half year period. |
| 22 | October 31, 2010 |
The Tocqueville Fund
Financial Highlights
Per share operating performance (For a share outstanding throughout the year) | Years Ended October 31, | |||||||||||||||||||
| 2010 | 2009 | 2008 | 2007 | 2006 | ||||||||||||||||
Net asset value, beginning of year | $ | 18.47 | $ | 16.39 | $ | 28.93 | $ | 24.25 | $ | 22.17 | ||||||||||
Operations: | ||||||||||||||||||||
Net investment income | 0.32 | 0.28 | 0.24 | 0.18 | 0.14 | |||||||||||||||
Net realized and unrealized gain (loss) | 2.97 | 2.09 | (10.56 | ) | 4.53 | 4.33 | ||||||||||||||
Total from investment operations (1) | 3.29 | 2.37 | (10.32 | ) | 4.71 | 4.47 | ||||||||||||||
Dividends and distributions to shareholders: | ||||||||||||||||||||
Dividends from net investment income | (0.23 | ) | (0.29 | ) | (0.19 | ) | (0.03 | ) | (0.22 | ) | ||||||||||
Distributions from net realized gains | — | — | (2.03 | ) | — | (2.17 | ) | |||||||||||||
Total dividends and distributions | (0.23 | ) | (0.29 | ) | (2.22 | ) | (0.03 | ) | (2.39 | ) | ||||||||||
Change in net asset value for the year | 3.06 | 2.08 | (12.54 | ) | 4.68 | 2.08 | ||||||||||||||
Net asset value, end of year | $ | 21.53 | $ | 18.47 | $ | 16.39 | $ | 28.93 | $ | 24.25 | ||||||||||
Total return | 18.0 | % | 14.8 | % | (38.5 | )% | 19.4 | % | 20.5 | % | ||||||||||
Ratios/supplemental data | ||||||||||||||||||||
Net assets, end of year (000) | $ | 489,670 | $ | 383,470 | $ | 328,609 | $ | 523,878 | $ | 392,495 | ||||||||||
Ratio to average net assets: | ||||||||||||||||||||
Expenses | 1.25 | %(2) | 1.25 | %(2) | 1.25 | %(2) | 1.25 | %(2) | 1.30 | % | ||||||||||
Net investment income | 1.66 | %(2) | 1.68 | %(2) | 0.94 | %(2) | 0.69 | %(2) | 0.68 | % | ||||||||||
Portfolio turnover rate | 23 | % | 32 | % | 51 | % | 39 | % | 32 | % | ||||||||||
| (1) | Total from investment operations per share includes redemption fees of $0.002, $0.004, $0.009, $ 0.002 and $0.002 per share for the five years ended October 31, 2010, 2009, 2008, 2007 and 2006, respectively. |
| (2) | Net of fees waived amounting to 0.01%, 0.08%, 0.04%, and 0.01% of average net assets for the four years ended October 31, 2010, 2009, 2008 and 2007, respectively. |
The accompanying notes are an integral part of these financial statements.
| Annual Report | 23 |
The Tocqueville Opportunity Fund
Financial Highlights
Per share operating performance (For a share outstanding throughout the year) | Years Ended October 31, | |||||||||||||||||||
| 2010 | 2009 | 2008 | 2007 | 2006 | ||||||||||||||||
Net asset value, beginning of year | $ | 10.78 | $ | 9.77 | $ | 17.24 | $ | 18.04 | $ | 16.58 | ||||||||||
Operations: | ||||||||||||||||||||
Net investment income (loss) | (0.12 | ) | (0.11 | ) | 0.02 | 0.11 | (0.07 | ) | ||||||||||||
Net realized and unrealized gain (loss) | 2.54 | 1.23 | (5.67 | ) | 1.26 | 1.53 | ||||||||||||||
Total from investment operations (1) | 2.42 | 1.12 | (5.65 | ) | 1.37 | 1.46 | ||||||||||||||
Distributions to shareholders: | ||||||||||||||||||||
Dividends from net investment income | — | (0.01 | ) | (0.12 | ) | — | — | |||||||||||||
Distributions from net realized gains | — | (0.10 | ) | (1.70 | ) | (2.17 | ) | — | ||||||||||||
Total distributions | — | (0.11 | ) | (1.82 | ) | (2.17 | ) | — | ||||||||||||
Change in net asset value for the year | 2.42 | 1.01 | (7.47 | ) | (0.80 | ) | 1.46 | |||||||||||||
Net asset value, end of year | $ | 13.20 | $ | 10.78 | $ | 9.77 | $ | 17.24 | $ | 18.04 | ||||||||||
Total return | 22.6 | % | 11.7 | % | (36.2 | )% | 8.4 | % | 8.8 | % | ||||||||||
Ratios/supplemental data | ||||||||||||||||||||
Net assets, end of year (000) | $ | 32,863 | $ | 30,498 | $ | 36,429 | $ | 49,543 | $ | 52,701 | ||||||||||
Ratio to average net assets: | ||||||||||||||||||||
Expenses | 1.41 | % | 1.41 | % | 1.35 | % | 1.32 | % | 1.34 | % | ||||||||||
Net investment income (loss) | (1.08 | )% | (0.97 | )% | 0.12 | % | 0.63 | % | (0.38 | )% | ||||||||||
Portfolio turnover rate | 104 | % | 62 | % | 169 | % | 90 | % | 45 | % | ||||||||||
| (1) | Total from investment operations per share includes redemption fees of less than $0.001, $0.001, $0.005, $ 0.001 and $0.015 per share for the five years ended October 31, 2010, 2009, 2008, 2007 and 2006, respectively. |
The accompanying notes are an integral part of these financial statements.
| 24 | October 31, 2010 |
The Tocqueville International Value Fund
Financial Highlights
Per share operating performance | Years Ended October 31, | |||||||||||||||||||
| 2010 | 2009 | 2008 | 2007 | 2006 | ||||||||||||||||
Net asset value, beginning of year | $ | 10.48 | $ | 8.49 | $ | 16.48 | $ | 16.72 | $ | 16.06 | ||||||||||
Operations: | ||||||||||||||||||||
Net investment income | 0.11 | 0.10 | 0.13 | 0.08 | 0.27 | |||||||||||||||
Net realized and unrealized gain (loss) | 1.65 | 2.59 | (6.09 | ) | 2.25 | 2.30 | ||||||||||||||
Total from investment operations (1) | 1.76 | 2.69 | (5.96 | ) | 2.33 | 2.57 | ||||||||||||||
Dividends and distributions to shareholders: | ||||||||||||||||||||
Dividends from net investment income | (0.12 | ) | (0.20 | ) | (0.10 | ) | (0.27 | ) | (0.05 | ) | ||||||||||
Distributions from net realized gains | — | (0.50 | ) | (1.93 | ) | (2.30 | ) | (1.86 | ) | |||||||||||
Total dividends and distributions | (0.12 | ) | (0.70 | ) | (2.03 | ) | (2.57 | ) | (1.91 | ) | ||||||||||
Change in net asset value for the year | 1.64 | 1.99 | (7.99 | ) | (0.24 | ) | 0.66 | |||||||||||||
Net asset value, end of year | $ | 12.12 | $ | 10.48 | $ | 8.49 | $ | 16.48 | $ | 16.72 | ||||||||||
Total return | 17.0 | % | 34.0 | % | (40.8 | )% | 15.3 | % | 17.4 | % | ||||||||||
Ratios/supplemental data | ||||||||||||||||||||
Net assets, end of year (000) | $ | 150,103 | $ | 131,613 | $ | 118,189 | $ | 219,220 | $ | 225,234 | ||||||||||
Ratio to average net assets: | ||||||||||||||||||||
Expenses | 1.56 | % | 1.62 | % | 1.56 | % | 1.59 | % | 1.61 | % | ||||||||||
Net investment income | 1.03 | % | 0.96 | % | 1.07 | % | 0.49 | % | 1.49 | % | ||||||||||
Portfolio turnover rate | 27 | % | 27 | % | 63 | % | 49 | % | 39 | % | ||||||||||
| (1) | Total from investment operations per share includes redemption fees of $0.002, $0.001, $0.001, $0.002 and $0.011 per share for the five years ended October 31, 2010, 2009, 2008, 2007 and 2006, respectively. |
The accompanying notes are an integral part of these financial statements.
| Annual Report | 25 |
The Tocqueville Gold Fund
Financial Highlights
| Per share operating performance (For a share outstanding throughout the year) | Years Ended October 31, | |||||||||||||||||||
| 2010 | 2009 | 2008 | 2007 | 2006 | ||||||||||||||||
Net asset value, beginning of year | $ | 49.71 | $ | 21.77 | $ | 64.36 | $ | 51.41 | $ | 35.51 | ||||||||||
Operations: | ||||||||||||||||||||
Net investment loss | (0.58 | ) | (0.45 | ) | (0.57 | ) | (0.30 | ) | (0.22 | ) | ||||||||||
Net realized and unrealized gain (loss) | 32.96 | 29.28 | (33.24 | ) | 18.52 | 18.21 | ||||||||||||||
Total from investment operations (1) | 32.38 | 28.83 | (33.81 | ) | 18.22 | 17.99 | ||||||||||||||
Dividends and distributions to shareholders: | ||||||||||||||||||||
Dividends from net investment income | — | — | (0.46 | ) | (0.22 | ) | — | |||||||||||||
Dividends from net realized gains | (0.09 | ) | (0.89 | ) | (8.32 | ) | (5.05 | ) | (2.09 | ) | ||||||||||
Total distributions | (0.09 | ) | (0.89 | ) | (8.78 | ) | (5.27 | ) | (2.09 | ) | ||||||||||
Change in net asset value for the year | 32.29 | 27.94 | (42.59 | ) | 12.95 | 15.90 | ||||||||||||||
Net asset value, end of year | $ | 82.00 | $ | 49.71 | $ | 21.77 | $ | 64.36 | $ | 51.41 | ||||||||||
Total return | 65.2 | % | 135.2 | % | (60.0 | )% | 38.4 | % | 52.5 | % | ||||||||||
Ratios/supplemental data | ||||||||||||||||||||
Net assets, end of year (000) | $ | 2,199,603 | $ | 937,492 | $ | 410,857 | $ | 1,231,475 | $ | 833,254 | ||||||||||
Ratios to average net assets: | ||||||||||||||||||||
Expenses | 1.34 | % | 1.50 | % | 1.43 | % | 1.42 | % | 1.50 | % | ||||||||||
Net investment loss | (1.11 | )% | (1.25 | )% | (1.07 | )% | (0.81 | )% | (0.51 | )% | ||||||||||
Portfolio turnover rate | 9 | % | 9 | % | 28 | % | 26 | % | 30 | % | ||||||||||
| (1) | Total from investment operations per share includes redemption fees of $0.056, $0.025, $0.027, $0.028, and $0.060 per share for the five years ended October 31, 2010, 2009, 2008, 2007 and 2006, respectively. |
The accompanying notes are an integral part of these financial statements.
| 26 | October 31, 2010 |
The Delafield Fund
Financial Highlights
| Year Ended October 31, 2010 | January 1, 2009 through October 31, 2009 | Years Ended December 31, | ||||||||||||||||||||||
| Per share operating performance (For a share outstanding throughout the period) | 2008 | 2007 | 2006 | 2005 | ||||||||||||||||||||
Net asset value, beginning of period | $ | 21.35 | $ | 15.10 | $ | 24.33 | $ | 25.64 | $ | 23.63 | $ | 25.21 | ||||||||||||
Operations: | ||||||||||||||||||||||||
Net investment income (loss) | (0.00 | )(2) | 0.03 | 0.07 | 0.17 | 0.19 | 0.03 | |||||||||||||||||
Net realized and unrealized gain (loss) | 5.32 | 6.25 | (9.23 | ) | 1.10 | 4.64 | 1.49 | |||||||||||||||||
Total from investment operations (1) | 5.32 | 6.28 | (9.16 | ) | 1.27 | 4.83 | 1.52 | |||||||||||||||||
Dividends and distributions to shareholders: | ||||||||||||||||||||||||
Dividends from net investment income | — | (0.03 | ) | (0.07 | ) | (0.16 | ) | (0.19 | ) | (0.03 | ) | |||||||||||||
Dividends from net realized gains | — | — | (0.00 | )(2) | (2.42 | ) | (2.63 | ) | (3.07 | ) | ||||||||||||||
Return of capital | (0.02 | ) | (0.00 | )(2) | (0.00 | )(2) | — | — | — | |||||||||||||||
Total distributions | (0.02 | ) | (0.03 | ) | (0.07 | ) | (2.58 | ) | (2.82 | ) | (3.10 | ) | ||||||||||||
Change in net asset value for the period | 5.30 | 6.25 | (9.23 | ) | (1.31 | ) | 2.01 | (1.58 | ) | |||||||||||||||
Net asset value, end of period | $ | 26.65 | $ | 21.35 | $ | 15.10 | $ | 24.33 | $ | 25.64 | $ | 23.63 | ||||||||||||
Total return | 25.0 | % | 41.6 | %(3) | (37.6 | )% | 4.9 | % | 20.4 | % | 6.0 | % | ||||||||||||
Ratios / supplemental data | ||||||||||||||||||||||||
Net assets, end of period (000) | $ | 933,674 | $ | 636,548 | $ | 404,860 | $ | 656,999 | $ | 532,108 | $ | 372,467 | ||||||||||||
Ratios to average net assets: | ||||||||||||||||||||||||
Expenses | 1.27 | % | 1.38 | %(4) | 1.34 | %(5) | 1.28 | %(5) | 1.32 | %(5) | 1.33 | % | ||||||||||||
Net investment income (loss) | (0.02 | )% | 0.21 | %(4) | 0.35 | %(5) | 0.57 | %(5) | 0.82 | %(5) | 0.11 | % | ||||||||||||
Portfolio turnover rate | 30 | % | 46 | %(3) | 81 | % | 61 | % | 72 | % | 71 | % | ||||||||||||
| (1) | Total from investment operations per share includes redemption fees of $0.006 per share for the year ended October 31, 2010, $0.008 per share for the period ended October 31, 2009, $0.01 per share for the fiscal year ended December 31, 2007 and less than $0.01 per share for the fiscal years ended December 31, 2008, 2006 and 2005. |
| (2) | Represents less than $0.01. |
| (3) | Not Annualized. |
| (4) | Annualized. |
| (5) | Net of fees waived amounting to 0.06%, 0.05%, 0.08%, and 0.11% for the fiscal years ended December 31, 2008, 2007, 2006, and 2005, respectively. |
The accompanying notes are an integral part of these financial statements.
| Annual Report | 27 |
The Select Fund
Financial Highlights
| Year Ended October 31, 2010 | January 1, 2009 through October 31, 2009 | Period from September 29, 2008 (2) through December 31, 2008 | ||||||||||
Per share operating performance (For a share outstanding throughout the period) | ||||||||||||
Net asset value, beginning of period | $ | 8.46 | $ | 5.77 | $ | 8.74 | ||||||
Operations: | ||||||||||||
Net investment income (loss) | (0.03 | ) | (0.00 | )(3) | 0.01 | |||||||
Net realized and unrealized gain (loss) | 3.12 | 2.70 | (2.97 | ) | ||||||||
Total from investment operations (1) | 3.09 | 2.70 | (2.96 | ) | ||||||||
Dividends and distributions to shareholders: | ||||||||||||
Dividends from net investment income | (0.01 | ) | (0.00 | )(3) | (0.01 | ) | ||||||
Dividends from net realized gains | — | — | — | |||||||||
Return of capital | — | (0.01 | ) | — | ||||||||
Total distributions | (0.01 | ) | (0.01 | ) | (0.01 | ) | ||||||
Change in net asset value for the period | 3.08 | 2.69 | (2.97 | ) | ||||||||
Net asset value, end of period | $ | 11.54 | $ | 8.46 | $ | 5.77 | ||||||
Total return | 36.6 | % | 46.7 | %(4) | (33.9 | )%(4) | ||||||
Ratios/supplemental data | ||||||||||||
Net assets, end of period (000) | $ | 41,788 | $ | 24,681 | $ | 9,226 | ||||||
Ratios to average net assets: | ||||||||||||
Expenses | 1.38 | % | 1.26 | %(5)(6) | 1.15 | %(5)(6) | ||||||
Net investment income (loss) | (0.43 | )% | (0.16 | )%(5)(6) | 0.29 | %(5)(6) | ||||||
Portfolio turnover rate | 40 | % | 24 | %(4) | 29 | %(4) | ||||||
| (1) | Total from investment operations per share includes redemption fees of $0.007 per share for the year ended October 31, 2010. |
| (2) | Inception of Fund. |
| (3) | Represents less than $0.01 per share. |
| (4) | Not Annualized. |
| (5) | Annualized. |
| (6) | Net of fees waived amounting to 0.77% and 2.32% for the periods ended October 31, 2009 and December 31, 2008, respectively. |
The accompanying notes are an integral part of these financial statements.
| 28 | October 31, 2010 |
The Tocqueville Fund
Schedule of Investments as of October 31, 2010
| Common Stocks—100.0% | Shares | Value | ||||||
Automobiles & Components—1.1% |
| |||||||
Toyota Motor Corp.—ADR | 75,000 | $ | 5,311,500 | |||||
Banks—3.2% | ||||||||
Banco Santander SA—ADR | 300,000 | 3,843,000 | ||||||
East West Bancorp, Inc. | 250,000 | 4,407,500 | ||||||
Mitsubishi UFJ Financial Group, Inc.—ADR | 1,000,000 | 4,660,000 | ||||||
Wilmington Trust Corp. | 400,000 | 2,844,000 | ||||||
| 15,754,500 | ||||||||
Capital Goods—10.4% | ||||||||
3M Co. | 50,000 | 4,211,000 | ||||||
The Boeing Co. | 75,000 | 5,298,000 | ||||||
General Electric Co. | 1,000,000 | 16,020,000 | ||||||
Illinois Tool Works, Inc. | 150,000 | 6,855,000 | ||||||
Masco Corp. | 400,000 | 4,264,000 | ||||||
Northrop Grumman Corp. | 75,000 | 4,740,750 | ||||||
Rockwell Automation, Inc. | 75,000 | 4,677,750 | ||||||
Tyco International Ltd.(a) | 125,000 | 4,785,000 | ||||||
| 50,851,500 | ||||||||
Commercial & Professional Services—1.7% |
| |||||||
Steelcase, Inc. | 1,000,000 | 8,410,000 | ||||||
Consumer Services—1.0% | ||||||||
Yum! Brands, Inc. | 100,000 | 4,956,000 | ||||||
Diversified Financials—2.8% | ||||||||
American Express Co. | 150,000 | 6,219,000 | ||||||
The Bank of New York Mellon Corp. | 300,000 | 7,518,000 | ||||||
| 13,737,000 | ||||||||
Energy—8.6% | ||||||||
Anadarko Petroleum Corp. | 50,000 | 3,078,500 | ||||||
Chesapeake Energy Corp. | 250,000 | 5,425,000 | ||||||
Exxon Mobil Corp. | 200,000 | 13,294,000 | ||||||
Murphy Oil Corp. | 150,000 | 9,774,000 | ||||||
Schlumberger Ltd.(a) | 150,000 | 10,483,500 | ||||||
| 42,055,000 | ||||||||
Food, Beverage & Tobacco—7.0% |
| |||||||
Campbell Soup Co. | 225,000 | 8,156,250 | ||||||
The Coca-Cola Co. | 150,000 | 9,198,000 | ||||||
Kraft Foods, Inc. | 300,000 | 9,681,000 | ||||||
Unilever NV—ADR | 100,000 | 2,969,000 | ||||||
Zhongpin, Inc.(a)(b) | 200,000 | 4,044,000 | ||||||
| 34,048,250 | ||||||||
Health Care Equipment & Services—1.0% |
| |||||||
St. Jude Medical, Inc.(b) | 125,000 | 4,787,500 | ||||||
Household & Personal Products—3.5% |
| |||||||
Colgate-Palmolive Co. | 100,000 | 7,712,000 | ||||||
Kimberly-Clark Corp. | 150,000 | 9,501,000 | ||||||
| 17,213,000 | ||||||||
| Common Stocks (continued) | Shares | Value | ||||||
Insurance—2.7% | ||||||||
Aflac, Inc. | 75,000 | $ | 4,191,750 | |||||
The Allstate Corp. | 125,000 | 3,811,250 | ||||||
Fidelity National Financial, Inc. | 400,000 | 5,356,000 | ||||||
| 13,359,000 | ||||||||
Materials—14.2% | ||||||||
BHP Billiton Ltd.—ADR | 75,000 | 6,194,250 | ||||||
Cliffs Natural Resources, Inc. | 150,000 | 9,780,000 | ||||||
EI du Pont de Nemours & Co. | 300,000 | 14,184,000 | ||||||
Minefinders Corp.(a)(b) | 90,000 | 792,900 | ||||||
Newmont Mining Corp. | 300,000 | 18,261,000 | ||||||
Owens-Illinois, Inc.(b) | 250,000 | 7,007,500 | ||||||
Sonoco Products Co. | 200,000 | 6,700,000 | ||||||
W.R. Grace & Co.(b) | 200,000 | 6,412,000 | ||||||
| 69,331,650 | ||||||||
Media—1.0% | ||||||||
The Washington Post Co. | 12,500 | 5,026,875 | ||||||
Pharmaceuticals, Biotechnology & Life Sciences—8.3% |
| |||||||
Genzyme Corp.(b) | 75,000 | 5,409,750 | ||||||
Isis Pharmaceuticals, Inc.(b) | 300,000 | 2,742,000 | ||||||
Johnson & Johnson | 150,000 | 9,550,500 | ||||||
King Pharmaceuticals, Inc.(b) | 250,000 | 3,535,000 | ||||||
Myriad Genetics, Inc.(b) | 200,000 | 3,986,000 | ||||||
Pfizer, Inc. | 900,000 | 15,660,000 | ||||||
| 40,883,250 | ||||||||
Real Estate—1.7% | ||||||||
CB Richard Ellis Group, Inc.(b) | 200,000 | 3,670,000 | ||||||
Weyerhaeuser Co. | 300,000 | 4,866,000 | ||||||
| 8,536,000 | ||||||||
Retailing—1.3% | ||||||||
Home Depot, Inc. | 200,000 | 6,176,000 | ||||||
Semiconductors & Semiconductor Equipment—4.5% |
| |||||||
Applied Materials, Inc. | 750,000 | 9,270,000 | ||||||
Intel Corp. | 500,000 | 10,035,000 | ||||||
LSI Corp.(b) | 500,000 | 2,620,000 | ||||||
| 21,925,000 | ||||||||
Software & Services—10.9% | ||||||||
Adobe Systems, Inc.(b) | 150,000 | 4,222,500 | ||||||
Automatic Data Processing, Inc. | 150,000 | 6,663,000 | ||||||
Bio-key International, Inc.(b)(c)(d)(e) | 47,090 | — | ||||||
Google, Inc.(b) | 16,000 | 9,807,840 | ||||||
Mastercard, Inc. | 20,000 | 4,801,200 | ||||||
Microsoft Corp. | 600,000 | 15,984,000 | ||||||
Symantec Corp.(b) | 450,000 | 7,281,000 | ||||||
Total System Services, Inc. | 300,000 | 4,683,000 | ||||||
| 53,442,540 | ||||||||
The accompanying footnotes are an integral part of these Schedules of Investments
| Annual Report | 29 |
The Tocqueville Fund
Schedule of Investments as of October 31, 2010
| Common Stocks (continued) | Shares | Value | ||||||
Technology Hardware & Equipment—6.4% |
| |||||||
Canon, Inc.—ADR | 60,000 | $ | 2,760,000 | |||||
Cisco Systems, Inc.(b) | 500,000 | 11,415,000 | ||||||
Corning, Inc. | 450,000 | 8,226,000 | ||||||
Hitachi Ltd.—ADR(b) | 50,000 | 2,255,500 | ||||||
Nokia OYJ—ADR | 400,000 | 4,272,000 | ||||||
QUALCOMM, Inc. | 50,000 | 2,256,500 | ||||||
| 31,185,000 | ||||||||
Telecommunication Services—3.2% |
| |||||||
Alaska Communications Systems Group, Inc.(f) | 550,000 | 5,516,500 | ||||||
Verizon Communications, Inc. | 150,000 | 4,870,500 | ||||||
Vodafone Group PLC—ADR | 200,000 | 5,502,000 | ||||||
| 15,889,000 | ||||||||
Transportation—2.1% | ||||||||
United Parcel Service, Inc. | 150,000 | 10,101,000 | ||||||
Utilities—3.4% | ||||||||
NextEra Energy, Inc. | 300,000 | 16,512,000 | ||||||
Total Common Stocks (Cost $460,177,770) | 489,491,565 | |||||||
Warrants—0.0% | ||||||||
Communication Equipment—0.0% |
| |||||||
EMCORE Corp. | 39,375 | — | ||||||
Capital Goods—0.0% | ||||||||
Raytheon Co. | 1,581 | 14,656 | ||||||
Total Warrants | 14,656 | |||||||
| Short-Term Investments—0.4% | Principal Amount | Value | ||||||
Repurchase Agreement—0.4% | ||||||||
Repurchase Agreement with U.S. Bank, N.A., 0.01% dated 10/29/2010, due 11/01/2010, collateralized by: Freddie Mac Giant 15 Year Fixed (Pool #G11440) valued at $2,196,326. Repurchase proceeds of $2,153,002. | $ | 2,153,000 | $ | 2,153,000 | ||||
Total Short-Term Investments (Cost $2,153,000) | 2,153,000 | |||||||
Total Investments |
| 491,659,221 | ||||||
Liabilities in Excess of Other Assets—(0.4)% |
| (1,989,637 | ) | |||||
Total Net Assets—100.0% | $ | 489,669,584 | ||||||
Percentages are stated as a percent of net assets.
ADR American Depository Receipt
| (a) | Foreign issued security. Foreign concentration (including ADRs) was as follows: Australia 1.3%; Britain 1.1%; Canada 0.2%; China 0.8%; Finland 0.9%; Japan 3.1%; Netherlands 0.6%; Netherlands Antilles 2.1%; Spain 0.8%; Switzerland 1.0% |
| (b) | Non-income producing security. |
| (c) | Denotes a security is either fully or partially restricted to resale. The aggregate value of restricted securities at October 31, 2010 was $0 which represented 0.0% of net assets. |
| (d) | Fair valued security. The aggregate value of fair valued securities as of October 31, 2010 was $0 which represented 0.0% of net assets. |
| (e) | Security is considered illiquid and may be difficult to sell. |
| (f) | Affiliated company. See Footnote 9. |
The Global Industry Classification Standard (GICS®) was developed by and/or is the exclusive property of MSCI, Inc. and Standard & Poor Financial Services LLC (“S&P”). GICS is a service mark of MSCI and S&P and has been licensed for use by U.S. Bancorp Fund Services, LLC.
The accompanying footnotes are an integral part of these Schedules of Investments
| 30 | October 31, 2010 |
The Tocqueville Opportunity Fund
Schedule of Investments as of October 31, 2010
| Common Stocks—93.0% | Shares | Value | ||||||
Automobiles & Components—0.8% | ||||||||
BorgWarner, Inc.(a) | 4,500 | $ | 252,495 | |||||
Banks—1.6% | ||||||||
Pinnacle Financial Partners, Inc.(a) | 5,000 | 57,050 | ||||||
Umpqua Holdings Corp. | 42,000 | 462,000 | ||||||
| 519,050 | ||||||||
Capital Goods—1.7% | ||||||||
Alliant Techsystems, Inc.(a) | 2,000 | 152,480 | ||||||
Ceradyne, Inc.(a) | 10,000 | 238,100 | ||||||
Harbin Electric, Inc.(a) | 8,000 | 172,480 | ||||||
| 563,060 | ||||||||
Commercial & Professional Services—1.3% |
| |||||||
Clean Harbors, Inc.(a) | 4,600 | 324,300 | ||||||
EnergySolutions, Inc. | 20,000 | 93,800 | ||||||
| 418,100 | ||||||||
Consumer Durables & Apparel—3.7% |
| |||||||
Columbia Sportswear Co. | 3,500 | 182,875 | ||||||
Deckers Outdoor Corp.(a) | 3,000 | 174,300 | ||||||
Lululemon Athletica, Inc.(a) | 5,500 | 243,760 | ||||||
Polo Ralph Lauren Corp. | 1,000 | 96,880 | ||||||
Tempur-Pedic International, Inc.(a) | 7,000 | 241,500 | ||||||
Tupperware Brands Corp. | 6,000 | 268,860 | ||||||
| 1,208,175 | ||||||||
Consumer Services—4.9% | ||||||||
Chipotle Mexican Grill, Inc.(a) | 800 | 168,168 | ||||||
Choice Hotels International, Inc. | 3,500 | 133,105 | ||||||
Ctrip.com International Ltd.—ADR(a) | 6,000 | 312,420 | ||||||
Gaylord Entertainment Co.(a) | 3,500 | 116,690 | ||||||
Home Inns & Hotels Management, Inc.—ADR(a) | 4,000 | 204,640 | ||||||
Hyatt Hotels Corp.(a) | 5,000 | 201,500 | ||||||
Panera Bread Co.(a) | 2,000 | 179,020 | ||||||
Texas Roadhouse, Inc.(a) | 13,500 | 207,360 | ||||||
Wyndham Worldwide Corp. | 3,500 | 100,625 | ||||||
| 1,623,528 | ||||||||
Diversified Financials—4.1% | ||||||||
Blackstone Group LP | 13,000 | 175,240 | ||||||
Green Dot Corp.(a) | 4,500 | 228,600 | ||||||
KKR & Co. LP | 9,000 | 114,120 | ||||||
Lazard Ltd.(b) | 7,000 | 258,300 | ||||||
MSCI, Inc.(a) | 7,000 | 250,950 | ||||||
Netspend Holdings, Inc.(a) | 10,200 | 139,944 | ||||||
Portfolio Recovery Associates, Inc.(a) | 2,500 | 167,625 | ||||||
| 1,334,779 | ||||||||
Energy—9.2% | ||||||||
Bill Barrett Corp.(a) | 7,000 | 264,250 | ||||||
Brigham Exploration Co.(a) | 14,500 | 305,805 | ||||||
Cameron International Corp.(a) | 2,500 | 109,375 | ||||||
| Common Stocks (continued) | Shares | Value | ||||||
CARBO Ceramics, Inc. | 3,000 | $ | 251,310 | |||||
Core Laboratories NV(a)(b) | 3,000 | 233,310 | ||||||
Dril-Quip, Inc.(a) | 6,500 | 449,150 | ||||||
Noble Corp.(b) | 5,000 | 172,650 | ||||||
Northern Oil and Gas, Inc.(a) | 14,000 | 275,520 | ||||||
Oceaneering International, Inc.(a) | 8,000 | 494,960 | ||||||
Pride International, Inc.(a) | 7,000 | 212,240 | ||||||
Tetra Technologies, Inc.(a) | 18,000 | 175,680 | ||||||
Unit Corp.(a) | 2,500 | 98,075 | ||||||
| 3,042,325 | ||||||||
Food, Beverage & Tobacco—2.0% | ||||||||
Boston Beer Co., Inc.(a) | 3,000 | 214,770 | ||||||
Green Mountains Coffee Roasters, Inc.(a) | 4,500 | 148,455 | ||||||
The Hain Celestial Group, Inc.(a) | 12,000 | 296,760 | ||||||
| 659,985 | ||||||||
Health Care Equipment & Services—7.4% |
| |||||||
Allscripts Healthcare Solutions, Inc.(a) | 45,000 | 859,050 | ||||||
Bio-Reference Labs, Inc.(a) | 6,500 | 140,140 | ||||||
Greatbatch, Inc.(a) | 12,500 | 271,875 | ||||||
HMS Holdings Corp.(a) | 2,000 | 120,220 | ||||||
Magellan Health Services, Inc.(a) | 4,000 | 192,000 | ||||||
Patterson Companies, Inc. | 3,500 | 96,775 | ||||||
Sirona Dental Systems, Inc.(a) | 7,000 | 263,550 | ||||||
Thoratec Corp.(a) | 10,000 | 326,400 | ||||||
Wright Medical Group, Inc.(a) | 12,000 | 160,080 | ||||||
| 2,430,090 | ||||||||
Household & Personal Products—2.8% |
| |||||||
Church & Dwight Co., Inc. | 2,500 | 164,625 | ||||||
Herbalife Ltd.(b) | 4,000 | 255,440 | ||||||
WD-40 Co. | 14,000 | 516,460 | ||||||
| 936,525 | ||||||||
Materials—5.4% | ||||||||
Allied Nevada Gold Corp.(a) | 3,000 | 74,040 | ||||||
Brush Engineered Materials, Inc.(a) | 22,500 | 745,875 | ||||||
Fronteer Gold, Inc.(a)(b) | 12,500 | 99,250 | ||||||
Landec Corp.(a)(c) | 15,000 | 94,350 | ||||||
Minerals Technologies, Inc. | 13,000 | 762,710 | ||||||
| 1,776,225 | ||||||||
Media—0.9% | ||||||||
DreamWorks Animation SKG, Inc.(a) | 8,000 | 282,400 | ||||||
Pharmaceuticals, Biotechnology & Life Sciences—12.2% |
| |||||||
Alexion Pharmaceuticals, Inc.(a) | 5,000 | 341,500 | ||||||
Alkermes, Inc.(a) | 30,000 | 347,100 | ||||||
Auxilium Pharmaceuticals, Inc.(a) | 13,000 | 321,750 | ||||||
BioMarin Pharmaceutical, Inc.(a) | 5,500 | 143,880 | ||||||
Human Genome Sciences, Inc.(a) | 12,000 | 322,560 | ||||||
Incyte Corp., Ltd.(a) | 15,000 | 249,900 | ||||||
The accompanying notes are an integral part of these financial statements.
| Annual Report | 31 |
The Tocqueville Opportunity Fund
Schedule of Investments as of October 31, 2010
| Common Stocks (continued) | Shares | Value | ||||||
Inspire Pharmaceuticals, Inc.(a) | 87,900 | 615,300 | ||||||
Isis Pharmaceuticals, Inc.(a) | 5,000 | 45,700 | ||||||
King Pharmaceuticals, Inc.(a) | 30,000 | 424,200 | ||||||
Myriad Genetics, Inc.(a) | 15,000 | 298,950 | ||||||
Pharmaceutical Product Development, Inc. | 23,000 | 593,630 | ||||||
United Therapeutics Corp.(a) | 5,000 | 300,000 | ||||||
| 4,004,470 | ||||||||
Retailing—6.5% | ||||||||
1-800-Flowers.com, Inc.(a)(c) | 50,000 | 90,000 | ||||||
Advance Auto Parts, Inc. | 3,000 | 194,940 | ||||||
LKQ Corp.(a) | 8,000 | 173,920 | ||||||
PetSmart, Inc. | 8,000 | 299,440 | ||||||
priceline.com, Inc.(a) | 1,400 | 527,534 | ||||||
Tractor Supply Co. | 17,000 | 673,200 | ||||||
Ulta Salon Cosmetics & Fragrance, Inc.(a) | 5,500 | 168,795 | ||||||
| 2,127,829 | ||||||||
Semiconductors & Semiconductor Equipment—5.9% |
| |||||||
Cavium Networks, Inc.(a) | 11,000 | 350,570 | ||||||
Cirrus Logic, Inc.(a) | 7,500 | 96,375 | ||||||
Netlogic Microsystems, Inc.(a) | 8,000 | 240,480 | ||||||
Silicon Image, Inc.(a)(c) | 75,000 | 461,250 | ||||||
Skyworks Solutions, Inc.(a) | 9,000 | 206,190 | ||||||
Ultratech, Inc.(a)(c) | 20,000 | 366,200 | ||||||
Veeco Instruments, Inc.(a) | 5,000 | 209,250 | ||||||
| 1,930,315 | ||||||||
Software & Services—17.3% |
| |||||||
Baidu, Inc.—ADR(a) | 3,000 | 330,030 | ||||||
Concur Technologies, Inc.(a) | 2,500 | 129,050 | ||||||
Equinix, Inc.(a) | 2,000 | 168,480 | ||||||
Fair Isaac Corp. | 15,000 | 360,600 | ||||||
GSI Commerce, Inc.(a) | 14,000 | 341,880 | ||||||
MercadoLibre, Inc.(a) | 3,500 | 231,455 | ||||||
Openwave Systems, Inc.(a) | 110,000 | 226,600 | ||||||
Parametric Technology Corp.(a) | 36,400 | 781,508 | ||||||
RealD, Inc.(a) | 19,000 | 397,480 | ||||||
Rosetta Stone, Inc.(a) | 4,000 | 92,600 | ||||||
Rovi Corp.(a) | 4,500 | 227,925 | ||||||
Sonic Solutions, Inc.(a) | 13,500 | 161,595 | ||||||
TeleCommunication Systems, Inc.(a) | 30,000 | 162,300 | ||||||
TeleTech Holdings, Inc.(a) | 20,000 | 303,600 | ||||||
TIBCO Software, Inc.(a) | 55,000 | 1,057,100 | ||||||
ValueClick, Inc.(a) | 22,500 | 309,600 | ||||||
VanceInfo Technologies, Inc.—ADR(a) | 4,500 | 163,665 | ||||||
VeriFone Systems, Inc.(a) | 4,000 | 135,320 | ||||||
Websense, Inc.(a) | 5,000 | 100,600 | ||||||
| 5,681,388 | ||||||||
| Common Stocks (continued) | Shares | Value | ||||||
Technology Hardware & Equipment—3.1% |
| |||||||
Acme Packet, Inc.(a) | 4,500 | $ | 177,975 | |||||
Dolby Laboratories, Inc.(a) | 4,000 | 246,720 | ||||||
FLIR Systems, Inc.(a) | 6,500 | 180,960 | ||||||
Netgear, Inc.(a) | 5,600 | 172,536 | ||||||
Riverbed Technology, Inc.(a) | 4,500 | 258,930 | ||||||
| 1,037,121 | ||||||||
Transportation—2.2% | ||||||||
Arkansas Best Corp. | 13,000 | 329,290 | ||||||
JetBlue Airways Corp.(a) | 11,000 | 76,780 | ||||||
Kansas City Southern(a) | 7,500 | 328,650 | ||||||
| 734,720 | ||||||||
Total Common Stocks | 30,562,580 | |||||||
Exchange Traded Funds—7.0% |
| |||||||
iShares Russell 2000 Growth Index Fund | 16,000 | 1,249,280 | ||||||
iShares Russell 2000 Index Fund | 15,000 | 1,054,650 | ||||||
Total Exchange Traded Funds | 2,303,930 | |||||||
| Short-Term Investments—0.4% | | Principal Amount | | |||||
Repurchase Agreement—0.4% | ||||||||
Repurchase Agreement with | $ | 118,000 | 118,000 | |||||
Total Short-Term Investments | 118,000 | |||||||
Total Investments |
| 32,984,510 | ||||||
Liabilities in Excess of Other Assets—(0.4)% |
| (121,035 | ) | |||||
Total Net Assets—100.0% | $ | 32,863,475 | ||||||
Percentages are stated as a percent of net assets.
ADR American Depository Receipt
| (a) | Non-income producing security. |
| (b) | Foreign issued security. Foreign concentration (including ADR’s) was as follows: Bermuda 0.8%; Canada 0.3%; Cayman Islands 3.9%; Netherlands 0.7%; Switzerland 0.5% |
| (c) | Affiliated company. See Footnote 9. |
The accompanying notes are an integral part of these financial statements.
| 32 | October 31, 2010 |
The Tocqueville International Value Fund
Schedule of Investments as of October 31, 2010
| Common Stocks—88.8% | Shares | Value | ||||||
Australia—1.1% | ||||||||
BHP Billiton, Ltd.—ADR | 20,000 | $ | 1,651,800 | |||||
Belgium—7.5% | ||||||||
Bekaert SA | 13,500 | 4,113,940 | ||||||
Groupe Bruxelles Lambert SA | 25,063 | 2,219,598 | ||||||
Solvay SA | 21,500 | 2,276,907 | ||||||
Umicore | 56,000 | 2,635,973 | ||||||
| 11,246,418 | ||||||||
Brazil—3.7% | ||||||||
Petroleo Brasileiro SA—ADR | 70,000 | 2,388,400 | ||||||
Vale SA—ADR | 100,000 | 3,214,000 | ||||||
| 5,602,400 | ||||||||
France—10.9% | ||||||||
Bollore | 8,358 | 1,872,869 | ||||||
Cie de St-Gobain | 36,928 | 1,724,873 | ||||||
Haulotte Group SA(a) | 106,039 | 1,376,976 | ||||||
Sanofi-Aventis SA | 40,000 | 2,793,637 | ||||||
Total SA—ADR | 65,000 | 3,541,200 | ||||||
Veolia Environnement—ADR | 55,000 | 1,616,450 | ||||||
Vivendi SA | 120,000 | 3,423,012 | ||||||
| 16,349,017 | ||||||||
Germany—5.8% | ||||||||
Kloeckner & Co. SE(a) | 100,000 | 2,212,975 | ||||||
Siemens AG—ADR | 22,800 | 2,606,268 | ||||||
Wacker Neuson SE(a) | 210,000 | 3,799,635 | ||||||
| 8,618,878 | ||||||||
Hong Kong—4.3% | ||||||||
Clear Media, Ltd.(a) | 2,776,000 | 1,658,169 | ||||||
Hongkong Electric Holdings Ltd. | 250,000 | 1,588,453 | ||||||
PYI Corp., Ltd.(a) | 25,370,000 | 949,176 | ||||||
Television Broadcasts Ltd. | 427,750 | 2,279,126 | ||||||
| 6,474,924 | ||||||||
Indonesia—1.6% | ||||||||
Telekomunikasi Indonesia Tbk PT—ADR | 58,000 | 2,342,620 | ||||||
Ireland—2.7% | ||||||||
DCC PLC | 138,105 | 3,988,474 | ||||||
Italy—5.1% | ||||||||
CIR—Compagnie Industriali Riunite SpA(a) | 1,035,000 | 2,352,371 | ||||||
Interpump Group SpA(a) | 492,068 | 3,210,300 | ||||||
Sogefi SpA(a) | 602,000 | 2,086,292 | ||||||
| 7,648,963 | ||||||||
Japan—19.6% | ||||||||
Amada Co., Ltd. | 234,000 | 1,541,195 | ||||||
Bridgestone Corp. | 160,000 | 2,869,144 | ||||||
Canon, Inc.—ADR | 70,000 | 3,220,000 | ||||||
| Common Stocks (continued) | Shares | Value | ||||||
Hitachi Ltd. | 750,000 | $ | 3,392,569 | |||||
Kyoto Kimono Yuzen Co. Ltd. | 343,500 | 3,735,088 | ||||||
Makita Corp. | 75,000 | 2,637,629 | ||||||
MISUMI Group, Inc. | 92,500 | 1,982,882 | ||||||
Nippon Express Co. Ltd. | 50,500 | 200,820 | ||||||
Omron Corp. | 162,000 | 3,760,606 | ||||||
SMC Corp. | 24,000 | 3,668,448 | ||||||
Takata Corp. | 100,000 | 2,455,574 | ||||||
| 29,463,955 | ||||||||
Mexico—2.2% | ||||||||
Fomento Economico Mexicano S.A.B. de C.V.—ADR | 60,000 | 3,294,600 | ||||||
Netherlands—4.1% | ||||||||
Nutreco NV | 31,256 | 2,274,303 | ||||||
Unilever NV—ADR | 131,500 | 3,904,235 | ||||||
| 6,178,538 | ||||||||
Netherlands Antilles—1.9% | ||||||||
Schlumberger Ltd. | 40,000 | 2,795,600 | ||||||
South Africa—0.5% | ||||||||
Gold Fields Ltd.—ADR | 50,000 | 788,500 | ||||||
Spain—3.4% | ||||||||
Banco Santander SA—ADR | 190,000 | 2,433,900 | ||||||
Sol Melia SA | 271,000 | 2,696,836 | ||||||
| 5,130,736 | ||||||||
Switzerland—3.0% | ||||||||
Nestle SA | 80,000 | 4,381,891 | ||||||
Pargesa Holding SA | 1,992 | 157,996 | ||||||
| 4,539,887 | ||||||||
United Kingdom—8.6% | ||||||||
3i Group PLC | 350,000 | 1,680,233 | ||||||
Experian PLC | 270,000 | 3,138,780 | ||||||
Interserve PLC | 670,073 | 2,158,132 | ||||||
Invensys PLC | 600,000 | 2,770,799 | ||||||
Vodafone Group PLC—ADR | 115,000 | 3,163,650 | ||||||
| 12,911,594 | ||||||||
United States—2.8% | ||||||||
Newmont Mining Corp. | 70,000 | 4,260,900 | ||||||
Total Common Stocks | 133,287,804 | |||||||
Warrants—0.1% | ||||||||
Italy—0.1% | ||||||||
Interpump Group SpA | 105,240 | 71,040 | ||||||
Total Warrants | 71,040 | |||||||
The accompanying notes are an integral part of these Schedules of Investments
| Annual Report | 33 |
The Tocqueville International Value Fund
Schedule of Investments as of October 31, 2010
| Short-Term Investments—9.8% | Shares | Value | ||||||
Money Market Funds—4.9% | ||||||||
AIM STIT-Treasury Portfolio, 0.06%(b) | 7,424,636 | $ | 7,424,636 | |||||
| | Principal Amount | | ||||||
Repurchase Agreement—4.9% | ||||||||
Repurchase Agreement with | $ | 7,424,000 | 7,424,000 | |||||
Total Short-Term Investments | 14,848,636 | |||||||
Total Investments |
| 148,207,480 | ||||||
Other Assets in Excess of Liabilities—1.3% |
| 1,895,863 | ||||||
Total Net Assets—100.0% | $ | 150,103,343 | ||||||
Percentages are stated as a percent of net assets.
ADR American Depository Receipt
| (a) | Non-income producing security. |
| (b) | Variable rate security. The rate shown is as of October 31, 2010. |
The accompanying notes are an integral part of these Schedules of Investments
| 34 | October 31, 2010 |
The Tocqueville Gold Fund
Schedule of Investments as of October 31, 2010
| Common Stocks—76.4% | Shares | Value | ||||||
Gold & Gold Related—72.7% | ||||||||
Australia—7.6% | ||||||||
Andean Resources, Ltd.(a) | 15,271,500 | $ | 94,841,030 | |||||
Centamin Egypt, Ltd.(a) | 9,830,000 | 27,621,516 | ||||||
Eldorado Gold Corp.(a) | 1,544,785 | 26,117,653 | ||||||
Ivanhoe Australia Ltd.(a) | 5,964,000 | 18,577,619 | ||||||
| 167,157,818 | ||||||||
Canada—46.7% | ||||||||
Agnico-Eagle Mines Ltd. | 502,000 | 38,950,180 | ||||||
Agnico-Eagle Mines Ltd.(h) | 210,837 | 16,351,827 | ||||||
Alamos Gold, Inc.(a) | 2,615,100 | 40,486,743 | ||||||
Allied Gold Ltd.(a) | 23,860,000 | 10,527,503 | ||||||
Atac Resources Ltd.(a)(b) | 7,000,000 | 54,701,441 | ||||||
Banro Corp.(a)(b) | 5,181,100 | 15,240,024 | ||||||
Barrick Gold Corp. | 716,200 | 34,442,058 | ||||||
Corvus Gold, Inc.(a)(b) | 2,079,902 | 1,998,533 | ||||||
Detour Gold Corp.(a) | 280,000 | 8,178,449 | ||||||
East Asia Minerals Corp.(a) | 3,781,000 | 25,950,583 | ||||||
Eldorado Gold Corp. | 2,126,800 | 36,012,871 | ||||||
European Goldfields Ltd.(a) | 4,035,500 | 54,524,160 | ||||||
Franco-Nevada Corp. | 1,535,900 | 52,978,686 | ||||||
Goldcorp, Inc. | 1,118,050 | 49,853,849 | ||||||
IAMGOLD Corp. | 3,416,796 | 62,345,890 | ||||||
International Tower Hill Mines Ltd.(a)(b) | 2,493,136 | 18,548,932 | ||||||
International Tower Hill Mines Ltd.(a)(b)(h) | 1,666,667 | 12,452,204 | ||||||
Ivanhoe Mines Ltd.(a) | 4,217,000 | 100,969,840 | ||||||
Minefinders Corp.—ADR(a) | 1,041,000 | 9,145,367 | ||||||
Nevsun Resources Ltd.(a) | 1,441,400 | 8,211,132 | ||||||
Novagold Resources, Inc.(a) | 500,000 | 5,608,393 | ||||||
Orezone Gold Corp.(a) | 2,145,463 | 6,668,415 | ||||||
Osisko Mining Corp.(a) | 7,934,500 | 110,004,736 | ||||||
Primero Mining Corp.(a)(b) | 4,621,000 | 26,731,934 | ||||||
Richfield Ventures Corp.(a)(b)(c)(d) | 2,800,000 | 7,425,669 | ||||||
Romarco Minerals, Inc.(a)(b) | 15,387,800 | 41,038,157 | ||||||
Scorpio Mining Corp.(a)(b) | 16,699,542 | 14,245,110 | ||||||
SEMAFO, Inc.(a) | 4,900,000 | 58,805,765 | ||||||
Silver Wheaton Corp.(a) | 2,714,875 | 78,047,000 | ||||||
Strategic Metals Ltd.(a)(b)(c)(d) | 10,350,000 | 21,282,498 | ||||||
Torex Gold Resources, Inc.(a) | 5,000,000 | 6,716,345 | ||||||
| 1,028,444,294 | ||||||||
Peru—2.1% | ||||||||
Cia de Minas Buenaventura SA—ADR | 853,600 | 45,274,944 | ||||||
South Africa—1.8% | ||||||||
AngloGold Ashanti Ltd.—ADR | 300,000 | $ | 14,133,000 | |||||
Gold Fields Ltd. | 166,249 | 2,601,601 | ||||||
Gold Fields Ltd.—ADR | 1,311,500 | 20,682,355 | ||||||
| Common Stocks (continued) | Shares | Value | ||||||
Harmony Gold Mining Co. Ltd. | 1 | 12 | ||||||
Witwatersrand Consolidated Gold Resources Ltd.(a) | 335,000 | 2,487,273 | ||||||
| 39,904,241 | ||||||||
United Kingdom—3.6% | ||||||||
Randgold Resources Ltd.—ADR | 833,200 | 78,254,144 | ||||||
United States—10.9% | ||||||||
Allied Nevada Gold Corp.(a) | 1,129,848 | 27,884,649 | ||||||
Electrum Ltd.(a)(c)(d)(e) | 2,095,552 | 11,735,091 | ||||||
Freeport-McMoRan Copper & Gold, Inc. | 150,000 | 14,202,000 | ||||||
Gold Bullion International LLC(a)(c)(d)(e) | 5,000,000 | 5,000,000 | ||||||
Gold Resource Corp.(b) | 2,300,797 | 48,546,817 | ||||||
Gold Resource Corp.(b)(c)(d) | 1,500,000 | 31,046,400 | ||||||
I-Pulse, Inc.(a)(c)(d)(e) | 37,266 | 52,545 | ||||||
Newmont Mining Corp. | 1,064,800 | 64,814,376 | ||||||
Royal Gold, Inc. | 741,765 | 36,724,785 | ||||||
| 240,006,663 | ||||||||
Total Gold & Gold Related | 1,599,042,104 | |||||||
Oil, Gas & Consumable Fuels—0.1% |
| |||||||
Canada—0.1% | ||||||||
Geomark Exploration, Ltd.(a) | 1,337,800 | 1,364,165 | ||||||
Total Oil, Gas & Consumable Fuels | 1,364,165 | |||||||
Precious Metals & Related—3.6% |
| |||||||
Australia—0.0% |
| |||||||
Panoramic Resources Ltd. | 153,660 | 353,715 | ||||||
Canada—3.0% |
| |||||||
Pan American Silver Corp. | 1,299,467 | 41,478,973 | ||||||
Pan American Silver Corp.(h) | 61,536 | 1,968,742 | ||||||
Tahoe Resources, Inc.(a) | 2,406,600 | 23,596,431 | ||||||
| 67,044,146 | ||||||||
South Africa—0.4% |
| |||||||
Ivanhoe Nickel & Platinum Ltd.(a)(c)(d)(e) | 978,333 | 8,804,997 | ||||||
United States—0.2% |
| |||||||
GoviEx Uranium, Inc.(a)(c)(d)(e) | 1,750,000 | 5,250,000 | ||||||
Total Precious Metals & Related | 81,452,858 | |||||||
Total Common Stocks (Cost $743,236,991) | 1,681,859,127 | |||||||
Closed-End Mutual Fund—0.8% |
| |||||||
Gold & Gold Related—0.8% |
| |||||||
Canada—0.8% |
| |||||||
Sprott Physical Gold Trust(a) | 1,400,000 | 16,646,000 | ||||||
Total Closed-End Mutual Fund (Cost $14,500,000) | 16,646,000 | |||||||
The accompanying footnotes are an integral part of these Schedules of Investments.
| Annual Report | 35 |
The Tocqueville Gold Fund
Schedule of Investments as of October 31, 2010
| Gold Bullion—6.1% | Ounces | Value | ||||||
Gold Bullion(a) | 98,032 | $ | 133,254,498 | |||||
Total Gold Bullion | 133,254,498 | |||||||
| Warrants—0.3% | Shares | |||||||
Financial—0.1% |
| |||||||
Cayman Islands—0.1% |
| |||||||
Endeavour Financial Corp. Expires: 01/30/14, Exercise Price: CAD $2.50(a) | 1,000,000 | 1,098,147 | ||||||
Total Financial | 1,098,147 | |||||||
Gold & Gold Related—0.2% |
| |||||||
Canada—0.2% |
| |||||||
Kinross Gold Corp. | 108,032 | 248,922 | ||||||
Minefinders Corp. | 125,000 | 513,531 | ||||||
Primero Mining Corp. | 1,848,400 | 3,407,189 | ||||||
Richfield Ventures | 1,400,000 | 231,983 | ||||||
Torex Gold Resources, Inc. | 1,250,000 | 490,244 | ||||||
Yukon-Nevada Gold Corp. | 4,175,000 | — | ||||||
| 4,891,869 | ||||||||
United States—0.0% | ||||||||
I-Pulse, Inc. | 37,266 | — | ||||||
U.S. Gold Corp. | 111,500 | 8,746 | ||||||
| 8,746 | ||||||||
Total Gold & Gold Related | 4,900,615 | |||||||
Precious Metals & Related—0.0% |
| |||||||
Canada—0.0% | ||||||||
Pan American Silver Corp. | 133,333 | $ | — | |||||
| Warrants (continued) | Shares | Value | ||||||
South Africa—0.0% | ||||||||
Ivanhoe Nickel & Platinum Ltd. IPO Warrants, Expires: 12/31/10(a)(d) | 97,500 | — | ||||||
Total Precious Metals & Related | — | |||||||
Total Warrants (Cost $1,314,862) | 5,998,762 | |||||||
Purchased Options—0.0% |
| |||||||
Gold & Gold Related—0.0% |
| |||||||
United States—0.0% | ||||||||
Los Gatos Ltd. | 2,369,755 | — | ||||||
Total Gold & Gold Related | — | |||||||
Total Purchased Options (cost $0) | — | |||||||
Rights—0.0% | ||||||||
Precious Metals & Related—0.0% |
| |||||||
South Africa—0.0% | ||||||||
Ivanhoe Nickel & Platinum Ltd.(a)(c)(d)(e) | 195,000 | — | ||||||
Total Precious Metals & Related | — | |||||||
Total Rights (Cost $0) | — | |||||||
Short Term Investments—14.9% |
| |||||||
Money Market Fund—3.7% |
| |||||||
AIM STIT—Treasury Portfolio, 0.06%(f) | 81,676,064 | 81,676,064 | ||||||
| Principal Amount | ||||||||
| U.S. Treasury Bills—6.8% | ||||||||
0.133%, 12/23/2010(g) | $ | 100,000,000 | 99,980,861 | |||||
0.133%, 12/30/2010(g) | 50,000,000 | 49,989,350 | ||||||
| 149,970,211 | ||||||||
The accompanying footnotes are an integral part of these Schedules of Investments.
| 36 | October 31, 2010 |
The Tocqueville Gold Fund
Schedule of Investments as of October 31, 2010
| Short Term Investments (continued) | Principal Amount | Value | ||||||
Repurchase Agreement—4.4% |
| |||||||
Repurchase Agreement with U.S. Bank, N.A., 0.01% dated 10/29/10, due 11/01/10, collateralized by: Fannie Mae Conventional Level Pay 15 Year Fixed (Pool #255494) valued at $12,547,865. Repurchase proceeds of $12,301,500. Fannie Mae Conventional Level Pay 30 Year Fixed (Pool #555408) valued at $86,486,182. Repurchase proceeds of $84,796,581. (Cost $97,098,000) | $ | 97,098,000 | $ | 97,098,000 | ||||
Total Short Term Investments (Cost $328,743,617) | 328,744,275 | |||||||
Total Investments |
| 2,166,502,662 | ||||||
Other Assets in Excess of Liabilities—1.5% |
| 33,100,065 | ||||||
Total Net Assets—100.0% | $ | 2,199,602,727 | ||||||
Percentages are stated as a percent of net assets.
ADR American Depository Receipt
| (a) | Non-income producing security. |
| (b) | Affiliated company. See Footnote 9. |
| (c) | Denotes a security is either fully or partially restricted to resale. The aggregate value of restricted securities at October 31, 2010 was $90,597,200, which represented 4.1% of net assets. |
| (d) | Fair valued security. The aggregate value of fair valued securities as of October 31, 2010 was $90,829,183, which represented 4.1% of net assets. |
| (e) | Security is considered illiquid an may be difficult to sell. |
| (f) | Variable rate security. The rate listed is as of October 31, 2010. |
| (g) | Rate shown is the effective yield based on purchase price. The calculation assumes the security is held to maturity. |
| (h) | Denotes an issue that is traded on a foreign exchange when a company is listed more than once. |
The accompanying footnotes are an integral part of these Schedules of Investments.
| Annual Report | 37 |
The Delafield Fund
Schedule of Investments as of October 31, 2010
| Common Stocks—79.9% | Shares | Value | ||||||
Aerospace & Defense—1.8% | ||||||||
Honeywell International, Inc. | 350,000 | $ | 16,488,500 | |||||
Building Products—2.3% | ||||||||
Griffon Corp.(a) | 750,000 | 8,842,500 | ||||||
NCI Building Systems, Inc.(a) | 500,000 | 4,955,000 | ||||||
Trex Co., Inc.(a) | 450,000 | 8,077,500 | ||||||
| 21,875,000 | ||||||||
Chemicals—17.7% | ||||||||
A Schulman, Inc. | 425,000 | 9,222,500 | ||||||
Ashland, Inc. | 225,000 | 11,616,750 | ||||||
Cytec Industries, Inc. | 375,000 | 18,570,000 | ||||||
Eastman Chemical Co. | 255,000 | 20,035,350 | ||||||
Ferro Corp.(a) | 1,650,000 | 22,638,000 | ||||||
FMC Corp. | 300,000 | 21,930,000 | ||||||
Lubrizol Corp. | 115,000 | 11,786,350 | ||||||
Minerals Technologies, Inc. | 334,800 | 19,642,716 | ||||||
PolyOne Corp.(a) | 825,000 | 10,659,000 | ||||||
Solutia, Inc.(a) | 675,000 | 12,224,250 | ||||||
Spartech Corp.(a) | 800,000 | 6,768,000 | ||||||
| 165,092,916 | ||||||||
Commercial Services & Supplies—1.0% |
| |||||||
RR Donnelley & Sons Co. | 500,000 | 9,225,000 | ||||||
Communications Equipment—1.2% |
| |||||||
Harris Corp. | 240,000 | 10,845,600 | ||||||
Computers & Peripherals—0.4% |
| |||||||
Intermec, Inc.(a) | 350,000 | 4,077,500 | ||||||
Construction & Engineering—1.1% |
| |||||||
Insituform Technologies, Inc.(a) | 475,000 | 10,260,000 | ||||||
Containers & Packaging—1.2% | ||||||||
Sonoco Products Co. | 325,000 | 10,887,500 | ||||||
Electrical Equipment—6.6% | ||||||||
Acuity Brands, Inc. | 400,000 | 20,028,000 | ||||||
AMETEK, Inc. | 190,000 | 10,269,500 | ||||||
Belden, Inc. | 335,000 | 9,346,500 | ||||||
Brady Corp. | 400,000 | 12,300,000 | ||||||
Hubbell, Inc. | 180,000 | 9,723,600 | ||||||
| 61,667,600 | ||||||||
Electronic Equipment, Instruments & Components—8.0% |
| |||||||
Checkpoint Systems, Inc.(a) | 1,300,000 | 28,600,000 | ||||||
Flextronics International Ltd.(a)(b) | 5,100,000 | 36,516,000 | ||||||
LeCroy Corp.(a) | 113,000 | 1,056,550 | ||||||
Vishay Intertechnology, Inc.(a) | 733,100 | 8,284,030 | ||||||
| 74,456,580 | ||||||||
Energy Equipment & Services—0.7% |
| |||||||
Weatherford International Ltd.(a)(b) | 410,000 | 6,892,100 | ||||||
| Common Stocks (continued) | Shares | Value | ||||||
Household Durables—3.5% | ||||||||
Ethan Allen Interiors, Inc. | 550,000 | $ | 8,343,500 | |||||
Stanley Black & Decker, Inc. | 400,000 | 24,788,000 | ||||||
| 33,131,500 | ||||||||
Industrial Conglomerates—2.8% | ||||||||
Carlisle Companies, Inc. | 300,000 | 10,521,000 | ||||||
Tyco International Ltd.(b) | 400,000 | 15,312,000 | ||||||
| 25,833,000 | ||||||||
Life Sciences Tools & Services—1.9% |
| |||||||
Thermo Fisher Scientific, Inc.(a) | 350,000 | 17,997,000 | ||||||
Machinery—14.8% | ||||||||
Albany International Corp.(c) | 1,050,000 | 21,420,000 | ||||||
Barnes Group, Inc. | 925,000 | 16,825,750 | ||||||
Crane Co. | 250,000 | 9,565,000 | ||||||
Dover Corp. | 335,000 | 17,788,500 | ||||||
Federal Signal Corp. | 1,675,000 | 9,463,750 | ||||||
Harsco Corp. | 425,000 | 9,851,500 | ||||||
IDEX Corp. | 235,000 | 8,478,800 | ||||||
Ingersoll-Rand PLC(b) | 575,000 | 22,603,250 | ||||||
Kennametal, Inc. | 550,000 | 18,777,000 | ||||||
Lydall, Inc.(a) | 480,975 | 3,573,644 | ||||||
| 138,347,194 | ||||||||
Materials—2.9% | ||||||||
Owens-Illinois, Inc.(a) | 825,000 | 23,124,750 | ||||||
W.R. Grace & Co.(a) | 125,000 | 4,007,500 | ||||||
| 27,132,250 | ||||||||
Metals & Mining—0.2% | ||||||||
Commercial Metals Co. | 150,000 | 2,082,000 | ||||||
Oil, Gas & Consumable Fuels—2.6% |
| |||||||
El Paso Corp. | 825,000 | 10,939,500 | ||||||
Southern Union Co. | 525,000 | 13,193,250 | ||||||
| 24,132,750 | ||||||||
Professional Services—0.5% | ||||||||
School Specialty, Inc.(a) | 350,000 | 4,690,000 | ||||||
Semiconductors & Semiconductor Equipment—2.6% |
| |||||||
Fairchild Semiconductor International, Inc.(a) | 900,000 | 10,143,000 | ||||||
Teradyne, Inc.(a) | 825,000 | 9,273,000 | ||||||
Verigy Ltd.(a)(b) | 500,000 | 4,580,000 | ||||||
| 23,996,000 | ||||||||
Specialty Retail—4.2% | ||||||||
Collective Brands, Inc.(a) | 1,450,000 | 22,228,500 | ||||||
Foot Locker, Inc. | 625,000 | 9,956,250 | ||||||
GameStop Corp.(a) | 350,000 | 6,881,000 | ||||||
| 39,065,750 | ||||||||
The accompanying footnotes are an integral part of these Schedules of Investments
| 38 | October 31, 2010 |
The Delafield Fund
Schedule of Investments as of October 31, 2010
| Common Stocks (continued) | Shares | Value | ||||||
Trading Companies & Distributors—1.9% |
| |||||||
Rush Enterprises, Inc.(a) | 635,000 | $ | 10,090,150 | |||||
WESCO International, Inc.(a) | 175,000 | 7,493,500 | ||||||
| 17,583,650 | ||||||||
Total Common Stocks | 745,759,390 | |||||||
| Corporate Bonds—1.2% | | Principal Amount | | |||||
Aerospace & Defense—0.2% | ||||||||
BAE Systems Holdings, Inc. 4.950%, 06/01/2014 | $ | 500,000 | 553,917 | |||||
Honeywell International, Inc. 3.875%, 02/15/2014 | 1,000,000 | 1,089,212 | ||||||
| 1,643,129 | ||||||||
Chemicals—0.4% | ||||||||
The Dow Chemical Co. | 2,500,000 | 2,943,712 | ||||||
5.900%, 02/15/2015 | 1,000,000 | 1,127,924 | ||||||
| 4,071,636 | ||||||||
Diversified Financial Services—0.1% |
| |||||||
JPMorgan Chase & Co. | 1,000,000 | 1,091,910 | ||||||
Electric Utilities—0.1% | ||||||||
Duke Energy Corp. | 1,000,000 | 1,082,787 | ||||||
Health Care Equipment & Supplies—0.1% |
| |||||||
St. Jude Medical, Inc. | 1,000,000 | 1,079,149 | ||||||
Oil, Gas & Consumable Fuels—0.1% |
| |||||||
El Paso Corp. | 1,000,000 | 1,072,506 | ||||||
Software—0.1% | ||||||||
Oracle Corp. | 1,000,000 | 1,090,706 | ||||||
Utilities—0.1% | ||||||||
Sonat, Inc. | 655,000 | 682,328 | ||||||
Total Corporate Bonds | 11,814,151 | |||||||
Foreign Corporate Bonds—0.4% | ||||||||
Telecommunications—0.4% | ||||||||
Deutsche Telekom International Finance BV(b) | 3,000,000 | 3,329,634 | ||||||
Total Foreign Corporate Bonds | 3,329,634 | |||||||
| Real Estate Investment Trusts (REITs)—1.1% | Shares | Value | ||||||
Real Estate—1.1% | ||||||||
Kimco Realty Corp. | 600,000 | $ | 10,338,000 | |||||
Total Real Estate Investment Trusts | 10,338,000 | |||||||
| U.S. Treasury Obligations—1.1% | | Principal Amount | | |||||
United States Treasury Notes—1.1% |
| |||||||
1.000%, 07/31/2011 | $ | 10,000,000 | 10,059,380 | |||||
Total U.S. Treasury Obligations | 10,059,380 | |||||||
| Warrants—0.00% | Shares | |||||||
Air Freight & Logistics—0.00% |
| |||||||
Clark Holdings, Inc. | 410,000 | 4,305 | ||||||
Total Warrants | 4,305 | |||||||
Short-Term Investments—16.0% |
| |||||||
Money Market Funds—16.0% |
| |||||||
AIM STIT-Treasury Portfolio, | 149,370,816 | 149,370,816 | ||||||
Total Short-Term Investments | 149,370,816 | |||||||
Total Investments |
| 930,675,676 | ||||||
Other Assets in Excess of Liabilities—0.3% |
| 2,997,909 | ||||||
Total Net Assets—100.0% | $ | 933,673,585 | ||||||
Percentages are stated as a percent of net assets.
| (a) | Non-income producing security. |
| (b) | Foreign issued security. Foreign concentration was as follows: Ireland 2.4%; Netherlands 0.3%; Singapore 4.4%; Switzerland 2.4% |
| (c) | Affiliated company. See Footnote 9. |
| (d) | Variable rate security. The rate listed is as of October 31, 2010. |
The accompanying footnotes are an integral part of these Schedules of Investments
| Annual Report | 39 |
The Select Fund
Schedule of Investments as of October 31, 2010
| Common Stocks—81.7% | Shares | Value | ||||||
Chemicals—9.7% | ||||||||
Ashland, Inc. | 21,600 | $ | 1,115,208 | |||||
Cytec Industries, Inc. | 24,500 | 1,213,240 | ||||||
Minerals Technologies, Inc. | 29,500 | 1,730,765 | ||||||
| 4,059,213 | ||||||||
Containers & Packaging—2.4% | ||||||||
Sonoco Products Co. | 30,000 | 1,005,000 | ||||||
Electrical Equipment—3.5% | ||||||||
Acuity Brands, Inc. | 29,500 | 1,477,065 | ||||||
Electronic Equipment, Instruments & Components—9.7% |
| |||||||
Checkpoint Systems, Inc.(a) | 79,000 | 1,738,000 | ||||||
Flextronics International Ltd.(a)(b) | 202,000 | 1,446,320 | ||||||
Vishay Intertechnology, Inc.(a) | 78,000 | 881,400 | ||||||
| 4,065,720 | ||||||||
Hotels, Restaurants & Leisure—2.5% |
| |||||||
Ruby Tuesday, Inc.(a) | 84,800 | 1,026,080 | ||||||
Household Durables—5.1% | ||||||||
Ethan Allen Interiors, Inc. | 73,500 | 1,114,995 | ||||||
Stanley Black & Decker, Inc. | 16,000 | 991,520 | ||||||
| 2,106,515 | ||||||||
Industrial Conglomerates—2.5% | ||||||||
Carlisle Companies, Inc. | 29,800 | 1,045,086 | ||||||
Internet Software & Services—3.2% |
| |||||||
j2 Global Communications, Inc.(a) | 50,500 | 1,330,675 | ||||||
IT Services—2.7% | ||||||||
Cognizant Technology Solutions Corp.(a) | 9,500 | 619,305 | ||||||
Tier Technologies, Inc.(a) | 90,000 | 513,900 | ||||||
| 1,133,205 | ||||||||
Machinery—21.7% | ||||||||
Albany International Corp.(c) | 108,000 | 2,203,200 | ||||||
Barnes Group, Inc. | 74,000 | 1,346,060 | ||||||
Ingersoll-Rand PLC(b) | 38,000 | 1,493,780 | ||||||
Kennametal, Inc. | 52,000 | 1,775,280 | ||||||
Trimas Corp.(a) | 143,000 | 2,263,690 | ||||||
| 9,082,010 | ||||||||
Materials—3.2% | ||||||||
Owens-Illinois, Inc.(a) | 47,000 | 1,317,410 | ||||||
Software—3.5% | ||||||||
Monotype Imaging Holdings, Inc.(a) | 153,000 | 1,458,090 | ||||||
Specialty Retail—7.3% | ||||||||
Collective Brands, Inc.(a) | 118,000 | 1,808,940 | ||||||
Foot Locker, Inc. | 79,000 | 1,258,470 | ||||||
| 3,067,410 | ||||||||
| Common Stocks (continued) | Shares | Value | ||||||
Textiles, Apparel & Luxury Goods—2.2% |
| |||||||
Maidenform Brands, Inc.(a) | 34,000 | $ | 909,840 | |||||
Trading Companies & Distributors—2.5% |
| |||||||
WESCO International, Inc.(a) | 24,500 | 1,049,090 | ||||||
Total Common Stocks | 34,132,409 | |||||||
| Short-Term Investments—17.9% | ||||||||
Money Market Funds—17.9% | ||||||||
AIM STIT-Treasury Portfolio, | 7,482,864 | 7,482,864 | ||||||
Total Short-Term Investments | 7,482,864 | |||||||
Total Investments | 41,615,273 | |||||||
Other Assets in Excess of Liabilities—0.4% |
| 172,865 | ||||||
TOTAL NET ASSETS—100.0% | $ | 41,788,138 | ||||||
Percentages are stated as a percent of net assets.
| (a) | Non-income producing security. |
| (b) | Foreign issued security. Foreign concentration was as follows: Ireland 3.6%; Singapore 3.5%. |
| (c) | Affiliated company. See Footnote 9. |
| (d) | Variable rate security. The rate shown is as of October 31, 2010. |
The accompanying footnotes are an integral part of these Schedules of Investments
| 40 | October 31, 2010 |
Percent of Total Investments
The Tocqueville Fund
Allocation of Portfolio Holdings
October 31, 2010
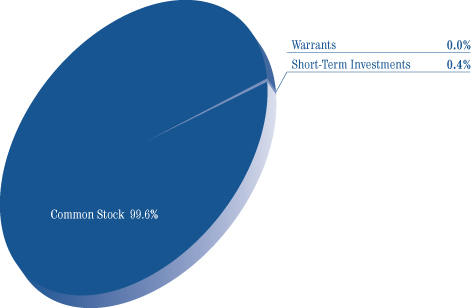
The Tocqueville Opportunity Fund
Allocation of Portfolio Holdings
October 31, 2010
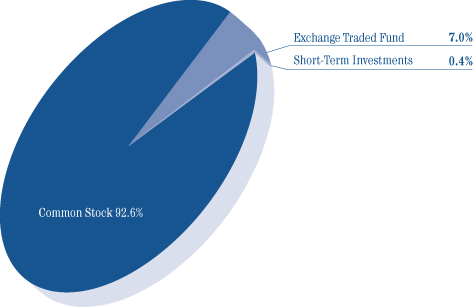
| Annual Report | 41 |
Percent of Total Investments
The Tocqueville International Value Fund
Allocation of Portfolio Holdings
October 31, 2010
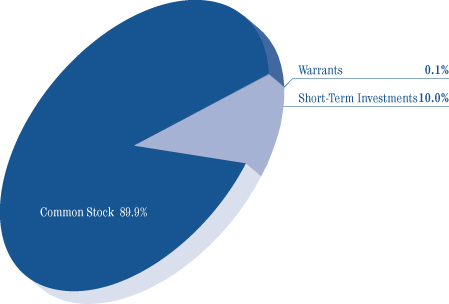
The Tocqueville Gold Fund
Allocation of Portfolio Holdings
October 31, 2010
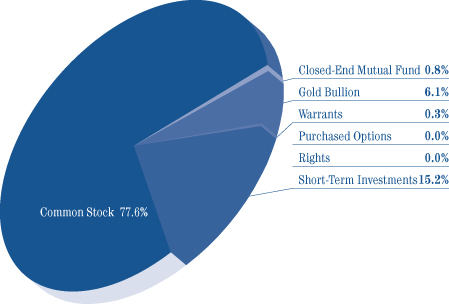
| 42 | October 31, 2010 |
Percent of Total Investments
The Delafield Fund
Allocation of Portfolio Holdings
October 31, 2010
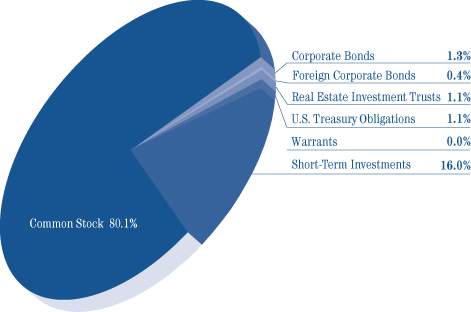
The Select Fund
Allocation of Portfolio Holdings
October 31, 2010
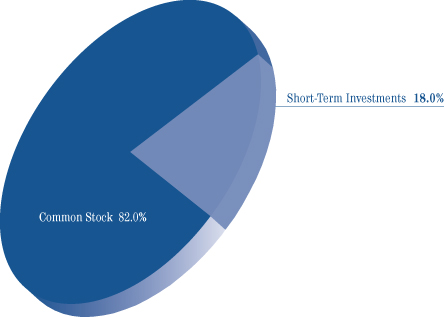
| Annual Report | 43 |
The Tocqueville Trust
Statements of Assets and Liabilities
October 31, 2010
| The Tocqueville Fund | Opportunity Fund | International Value Fund | Gold Fund | Delafield Fund | Select Fund | |||||||||||||||||||
Assets | ||||||||||||||||||||||||
Investments, at value (1) | ||||||||||||||||||||||||
Unaffiliated issuers | $ | 486,142,721 | $ | 31,972,710 | $ | 148,207,480 | $ | 1,855,730,767 | $ | 909,255,676 | $ | 39,412,073 | ||||||||||||
Affiliated issuers | 5,516,500 | 1,011,800 | — | 310,771,895 | 21,420,000 | 2,203,200 | ||||||||||||||||||
Foreign currencies (2) | — | — | 1,483,197 | 24,516,048 | — | — | ||||||||||||||||||
Cash | 676 | 889 | 463,719 | 107,212 | — | — | ||||||||||||||||||
Receivable for investments sold | — | 84,699 | 2,580,991 | — | 6,512,197 | — | ||||||||||||||||||
Receivable for fund shares sold | 696,574 | 5,114 | 224,184 | 13,426,298 | 3,020,165 | 203,407 | ||||||||||||||||||
Dividends, interest and other receivables | 409,511 | 1,729 | 395,509 | 49,153 | 581,480 | 4,222 | ||||||||||||||||||
Prepaid assets | 22,777 | 13,143 | 13,294 | 86,140 | 36,114 | 18,995 | ||||||||||||||||||
Total Assets | 492,788,759 | 33,090,084 | 153,368,374 | 2,204,687,513 | 940,825,632 | 41,841,897 | ||||||||||||||||||
Liabilities | ||||||||||||||||||||||||
Payable for investments purchased | 2,062,815 | 130,734 | 1,481,186 | — | 5,495,463 | — | ||||||||||||||||||
Currency payable | — | — | 1,483,197 | — | — | — | ||||||||||||||||||
Payable for fund shares redeemed | 519,477 | 57,280 | 80,712 | 2,901,053 | 661,731 | 2,500 | ||||||||||||||||||
Payable to Adviser | 308,748 | 20,040 | 124,799 | 1,354,604 | 576,265 | 28,127 | ||||||||||||||||||
Payable to Administrator | 51,720 | 3,357 | 15,680 | 224,889 | 97,294 | 4,417 | ||||||||||||||||||
Accrued distribution fee | 23,010 | 2,730 | 26,215 | 59,219 | 30,157 | 3,717 | ||||||||||||||||||
Accrued expenses and other liabilities | 153,405 | 12,468 | 53,242 | 545,021 | 291,137 | 14,998 | ||||||||||||||||||
Total Liabilities | 3,119,175 | 226,609 | 3,265,031 | 5,084,786 | 7,152,047 | 53,759 | ||||||||||||||||||
Net Assets | $ | 489,669,584 | $ | 32,863,475 | $ | 150,103,343 | $ | 2,199,602,727 | $ | 933,673,585 | $ | 41,788,138 | ||||||||||||
Net assets consist of: | ||||||||||||||||||||||||
Paid in capital | $ | 503,226,441 | $ | 36,380,826 | $ | 138,642,951 | $ | 1,123,789,310 | $ | 810,801,638 | $ | 29,788,685 | ||||||||||||
Accumulated net investment income (loss) | 6,319,760 | (4,413 | ) | 717,508 | (4,206,068 | ) | — | (8,797 | ) | |||||||||||||||
Accumulated net realized gain (loss) | (49,207,787 | ) | (8,159,471 | ) | (12,650,429 | ) | 46,373,131 | (6,745,613 | ) | 1,874,657 | ||||||||||||||
Net unrealized appreciation on: | ||||||||||||||||||||||||
Investments and foreign currency related items | 29,331,170 | 4,646,533 | 23,393,313 | 1,033,646,354 | 129,617,560 | 10,133,593 | ||||||||||||||||||
Net assets | $ | 489,669,584 | $ | 32,863,475 | $ | 150,103,343 | $ | 2,199,602,727 | $ | 933,673,585 | $ | 41,788,138 | ||||||||||||
Shares of beneficial interest outstanding (unlimited shares of $0.01 par value authorized) | 22,741,816 | 2,489,297 | 12,385,513 | 26,823,561 | 35,039,964 | 3,620,793 | ||||||||||||||||||
Net asset value and redemption price per share | $ | 21.53 | $ | 13.20 | $ | 12.12 | $ | 82.00 | $ | 26.65 | $ | 11.54 | ||||||||||||
Maximum offering price per share | $ | 21.53 | $ | 13.20 | $ | 12.12 | $ | 82.00 | $ | 26.65 | $ | 11.54 | ||||||||||||
(1) Cost of Investments | ||||||||||||||||||||||||
Unafilliated issuers | $ | 455,729,521 | $ | 27,444,999 | $ | 124,847,415 | $ | 971,336,072 | $ | 778,774,470 | $ | 29,835,215 | ||||||||||||
Affiliated issuers | $ | 6,601,249 | $ | 892,978 | $ | — | $ | 161,068,639 | $ | 22,283,646 | $ | 1,646,465 | ||||||||||||
(2) Cost of Foreign Currencies | $ | — | $ | — | $ | 1,480,126 | $ | 24,967,645 | $ | — | $ | — | ||||||||||||
The accompanying notes are an integral part of these financial statements.
| 44 | October 31, 2010 |
The Tocqueville Trust
Statements of Operations
For the Year Ended October 31, 2010
| The Tocqueville Fund | Opportunity Fund | International Value Fund | Gold Fund | The Delafield Fund | The Select Fund | |||||||||||||||||||
Investment Income: | ||||||||||||||||||||||||
Dividends* | ||||||||||||||||||||||||
Unaffiliated issuers | $ | 12,227,634 | $ | 93,980 | $ | 3,206,074 | $ | 2,964,861 | $ | 8,475,778 | $ | 262,727 | ||||||||||||
Affiliated issuers | 494,500 | — | — | 207,072 | 447,000 | 40,680 | ||||||||||||||||||
Interest | 209,180 | 57 | 246,621 | 40,052 | 885,351 | 2,057 | ||||||||||||||||||
| 12,931,314 | 94,037 | 3,452,695 | 3,211,985 | 9,808,129 | 305,464 | |||||||||||||||||||
Expenses: | ||||||||||||||||||||||||
Investment Adviser’s fee (See Note 5) | 3,330,308 | 214,604 | 1,330,343 | 11,394,152 | 5,882,924 | 256,510 | ||||||||||||||||||
Distribution fees (See Note 5) | 1,110,103 | 71,534 | 332,586 | 3,517,173 | 1,967,116 | 80,159 | ||||||||||||||||||
Administration fee (See Note 5) | 666,062 | 42,921 | 199,551 | 2,110,304 | 1,180,269 | 48,096 | ||||||||||||||||||
Transfer agent and shareholder services fees | 182,776 | 7,977 | 33,724 | 595,726 | 323,715 | 14,807 | ||||||||||||||||||
Professional fees | 85,401 | 22,401 | 26,267 | 398,193 | 162,871 | 10,618 | ||||||||||||||||||
Printing and mailing expense | 49,718 | 1,875 | 12,638 | 179,739 | 162,240 | 5,423 | ||||||||||||||||||
Custody fees | 43,412 | 10,861 | 68,599 | 237,489 | 67,105 | 3,355 | ||||||||||||||||||
Fund accounting fees | 42,588 | 4,998 | 33,673 | 124,456 | 68,860 | 4,252 | ||||||||||||||||||
Registration fees | 29,422 | 20,653 | 21,513 | 79,773 | 35,184 | 14,050 | ||||||||||||||||||
Other expenses | 23,962 | 1,961 | 5,391 | 58,878 | 32,389 | 1,894 | ||||||||||||||||||
Trustee fees and expenses | 20,611 | 654 | 6,577 | 100,371 | 72,379 | 2,631 | ||||||||||||||||||
Insurance expense | 20,566 | 1,753 | 5,995 | 45,847 | 4,437 | 174 | ||||||||||||||||||
Total expenses before waiver | 5,604,929 | 402,192 | 2,076,857 | 18,842,101 | 9,959,489 | 441,969 | ||||||||||||||||||
Less: Fees waived (See Note 5) | (57,721 | ) | — | — | — | — | — | |||||||||||||||||
Net expenses | 5,547,208 | 402,192 | 2,076,857 | 18,842,101 | 9,959,489 | 441,969 | ||||||||||||||||||
Net Investment Income (Loss) | 7,384,106 | (308,155 | ) | 1,375,838 | (15,630,116 | ) | (151,360 | ) | (136,505 | ) | ||||||||||||||
Realized and Unrealized Gain (Loss): | ||||||||||||||||||||||||
Net realized gain (loss) on: | ||||||||||||||||||||||||
Investments | ||||||||||||||||||||||||
Unaffiliated issuers | 15,418,865 | 1,873,252 | 683,700 | 45,747,646 | 38,214,197 | 2,980,704 | ||||||||||||||||||
Affiliated issuers | (99,217 | ) | (455,223 | ) | — | 5,241,447 | (1,743,030 | ) | (177,289 | ) | ||||||||||||||
Foreign currency translation | — | — | (288,153 | ) | (1,435,635 | ) | — | — | ||||||||||||||||
| 15,319,648 | 1,418,029 | 395,547 | 49,553,458 | 36,471,167 | 2,803,415 | |||||||||||||||||||
Net change in unrealized appreciation (depreciation) on: | ||||||||||||||||||||||||
Investments | 49,148,587 | 5,071,383 | 20,463,351 | 662,417,780 | 124,092,551 | 6,854,132 | ||||||||||||||||||
Foreign currency translation | — | — | (382,392 | ) | 18,667,022 | — | — | |||||||||||||||||
| 49,148,587 | 5,071,383 | 20,080,959 | 681,084,802 | 124,092,551 | 6,854,132 | |||||||||||||||||||
Net gain on investments and foreign currency | 64,468,235 | 6,489,412 | 20,476,506 | 730,638,260 | 160,563,718 | 9,657,547 | ||||||||||||||||||
Net Increase in Net Assets Resulting from Operations | $ | 71,852,341 | $ | 6,181,257 | $ | 21,852,344 | $ | 715,008,144 | $ | 160,412,358 | $ | 9,521,042 | ||||||||||||
* Net of foreign taxes withheld | $ | 92,389 | $ | 305 | $ | 393,277 | $ | 280,698 | $ | — | $ | — | ||||||||||||
The accompanying notes are an integral part of these financial statements.
| Annual Report | 45 |
The Tocqueville Trust
Statements of Changes in Net Assets
| The Tocqueville Fund | Opportunity Fund | |||||||||||||||
| For the Year Ended October 31, 2010 | For the Year Ended October 31, 2009 | For the Year Ended October 31, 2010 | For the Year Ended October 31, 2009 | |||||||||||||
Operations: | ||||||||||||||||
Net investment income (loss) | $ | 7,384,106 | $ | 5,337,457 | $ | (308,155 | ) | $ | (299,908 | ) | ||||||
Net realized gain (loss) on investments and foreign currency | 15,319,648 | (56,329,824 | ) | 1,418,029 | (9,248,318 | ) | ||||||||||
Net change in unrealized appreciation | 49,148,587 | 96,418,009 | 5,071,383 | 12,719,087 | ||||||||||||
Net increase in net assets resulting from operations | 71,852,341 | 45,425,642 | 6,181,257 | 3,170,861 | ||||||||||||
Dividends and distributions to shareholders: | ||||||||||||||||
Net investment income | (4,954,961 | ) | (5,443,841 | ) | — | (38,161 | ) | |||||||||
Net realized gains | — | — | — | (387,146 | ) | |||||||||||
Return of capital | — | — | — | — | ||||||||||||
Total dividends and distributions | (4,954,961 | ) | (5,443,841 | ) | — | (425,307 | ) | |||||||||
Fund share transactions: | ||||||||||||||||
Net increase (decrease) in assets from capital share transactions (See Footnote 6) | 39,302,474 | 14,878,679 | (3,815,430 | ) | (8,677,015 | ) | ||||||||||
Net increase (decrease) in net assets | 106,199,854 | 54,860,480 | 2,365,827 | (5,931,461 | ) | |||||||||||
Net Assets: | ||||||||||||||||
Beginning of period | 383,469,730 | 328,609,250 | 30,497,648 | 36,429,109 | ||||||||||||
End of period** | $ | 489,669,584 | $ | 383,469,730 | $ | 32,863,475 | $ | 30,497,648 | ||||||||
* Net of redemption fees of: | $ | 37,740 | $ | 77,031 | $ | 424 | $ | 4,390 | ||||||||
** Including undistributed net investment income (loss) of: | $ | 6,319,760 | $ | 3,890,615 | $ | (4,413 | ) | $ | — | |||||||
| (1) | The predecessor funds of The Delafield Fund and The Select Fund fiscal years began on January 1, 2009. See Footnote 1 to the Financial Statements. |
The accompanying notes are an integral part of these financial statements.
| 46 | October 31, 2010 |
The Tocqueville Trust
Statements of Changes in Net Assets
| International Value Fund | Gold Fund | Delafield Fund | Select Fund | |||||||||||||||||||||||||||
| For the Year Ended October 31, 2010 | For the Year Ended October 31, 2009 | For the Year Ended October 31, 2010 | For the Year Ended October 31, 2009 | For the Year Ended October 31, 2010 | For the Period Ended October 31, 2009 (1) | For the Year Ended October 31, 2010 | For the Period Ended October 31, 2009 (1) | |||||||||||||||||||||||
| $ | 1,375,838 | $ | 1,084,024 | $ | (15,630,116 | ) | $ | (8,542,294 | ) | $ | (151,360 | ) | $ | 855,406 | $ | (136,505 | ) | $ | (23,941 | ) | ||||||||||
| 395,547 | (13,054,503 | ) | 49,553,458 | 1,638,714 | 36,471,167 | (40,983,734 | ) | 2,803,415 | (536,620 | ) | ||||||||||||||||||||
| 20,080,959 | 45,858,158 | 681,084,802 | 523,468,128 | 124,092,551 | 210,086,644 | 6,854,132 | 7,477,312 | |||||||||||||||||||||||
| 21,852,344 | 33,887,679 | 715,008,144 | 516,564,548 | 160,412,358 | 169,958,316 | 9,521,042 | 6,916,751 | |||||||||||||||||||||||
| (1,534,647 | ) | (2,581,611 | ) | — | — | — | (826,756 | ) | (27,613 | ) | (5,068 | ) | ||||||||||||||||||
| — | (6,588,454 | ) | (1,803,165 | ) | (15,721,021 | ) | — | — | — | — | ||||||||||||||||||||
| — | — | — | — | (719,160 | ) | (164,562 | ) | — | (5,751 | ) | ||||||||||||||||||||
| (1,534,647 | ) | (9,170,065 | ) | (1,803,165 | ) | (15,721,021 | ) | (719,160 | ) | (991,318 | ) | (27,613 | ) | (10,819 | ) | |||||||||||||||
| (1,827,719 | ) | (11,292,902 | ) | 548,905,488 | 25,792,039 | 137,432,759 | 62,720,729 | 7,613,666 | 6,916,294 | |||||||||||||||||||||
| 18,489,978 | 13,424,712 | 1,262,110,467 | 526,635,566 | 297,125,957 | 231,687,727 | 17,107,095 | 13,822,226 | |||||||||||||||||||||||
| 131,613,365 | 118,188,653 | 937,492,260 | 410,856,694 | 636,547,628 | 404,859,901 | 24,681,043 | 10,858,817 | |||||||||||||||||||||||
| $ | 150,103,343 | $ | 131,613,365 | $ | 2,199,602,727 | $ | 937,492,260 | $ | 933,673,585 | $ | 636,547,628 | $ | 41,788,138 | $ | 24,681,043 | |||||||||||||||
| $ | 18,321 | $ | 18,461 | $ | 1,224,208 | $ | 463,326 | $ | 188,324 | $ | 227,715 | $ | 22,745 | $ | — | |||||||||||||||
| $ | 717,508 | $ | 1,164,470 | $ | (4,206,068 | ) | $ | (393,813 | ) | $ | — | $ | — | $ | (8,797 | ) | $ | (8,797 | ) | |||||||||||
The accompanying notes are an integral part of these financial statements.
| Annual Report | 47 |
The Tocqueville Trust
The Tocqueville Fund
The Tocqueville Opportunity Fund
The Tocqueville International Value Fund
The Tocqueville Gold Fund
The Delafield Fund
The Select Fund
Notes to Financial Statements
1. ORGANIZATION
The Tocqueville Trust (the “Trust”) is a Massachusetts business trust organized on September 17, 1986, currently consisting of six separate funds (each, a “Fund” or, collectively, the “Funds”). Each Fund is an open-end management investment company with a different investment objective. The Tocqueville Fund, The Tocqueville Opportunity Fund (the “Opportunity Fund”), The Tocqueville International Value Fund (the “International Fund”), and The Delafield Fund are classified as diversified investment companies. The Tocqueville Gold Fund (the “Gold Fund”) and The Select Fund are classified as non-diversified investment companies. The Tocqueville Fund’s investment objective is long-term capital appreciation which it seeks to achieve by investing primarily in securities of United States issuers. The Opportunity Fund’s investment objective is to achieve long-term capital appreciation which it seeks to achieve by investing in the common stocks of small and mid cap companies which have the potential to deliver superior long term earnings growth. The International Fund’s investment objective is long-term capital appreciation consistent with preservation of capital which it seeks to achieve by investing primarily in securities of non-U.S. issuers. The Gold Fund’s investment objective is long-term capital appreciation which it seeks to achieve by investing in gold, securities of companies located throughout the world that are engaged in mining or processing gold (“gold related securities”), other precious metals and securities of companies located throughout the world that are engaged in mining or processing such other precious metals (“other precious metal securities”). The Delafield Fund’s investment objectives are to seek long-term preservation of capital (sufficient growth to outpace inflation over an extended period of time) and growth of capital which it seeks to achieve by investing primarily in the equity securities of domestic companies. The Select Fund’s investment objective is to achieve long-term capital appreciation by investing in a focused group of common stocks issued primarily by small and mid-sized U.S. companies. Current income is a secondary objective for The Select Fund.
On June 22, 2009, the Board of Directors of Delafield Fund, Inc. approved an Agreement and Plan of Reorganization providing for, among other things, the transfer of the assets and liabilities of Delafield Fund, Inc. into The Delafield Fund, a series of The Tocqueville Trust. On September 24, 2009, the shareholders of Delafield Fund, Inc. approved the Agreement and Plan of Reorganization. On July 9, 2009, the Board of Trustees of Delafield Select Fund, a series of Natixis Funds Trust II, approved an Agreement and Plan of Reorganization providing for, among other things, the transfer of the assets and liabilities of Delafield Select Fund into the sole share class of The Select Fund, a series of The Tocqueville Trust. On September 24, 2009, the shareholders of Delafield Select Fund approved the Agreement and Plan of Reorganization. The effective date of both reorganizations was September 28, 2009. Transfers into The Delafield Fund and The Select Fund from their predecessor funds amounted to $649,892,191 and $25,888,388, respectively.
The Delafield Fund, a series of the Trust, commenced operations on September 28, 2009 as successor to Delafield Fund, Inc. The predecessor Delafield Fund, Inc. commenced operations on November 19, 1993.
The Select Fund, a series of the Trust, commenced operations on September 28, 2009 as successor to the Delafield Select Fund, a series of Natixis Funds Trust II. The predecessor Delafield Select Fund commenced operations on September 29, 2008 for Class A and Class C shares and on September 26, 2008 for Class Y shares. Prior to September 29, 2008, the predecessor Delafield Select Fund operated as a Delaware limited partnership using substantially the same investment objectives and investment policies as the predecessor fund. The limited partnership was incepted in July 1998.
Effective October 12, 2010, the investment strategy of the Opportunity Fund was changed as described in the supplements dated August 12, 2010 to the Trust’s prospectus and statement of additional information. The Opportunity Fund will invest primarily in stocks of small and mid capitalization companies, as measured at the time of initial purchase. The Fund seeks to invest in companies which management feels are market leaders in growth industries and have consistent growth in sales and earnings.
| 48 | October 31, 2010 |
The following is a summary of significant accounting principles followed by the Trust in the preparation of its financial statements.
2. SIGNIFICANT ACCOUNTING POLICIES
a) Security valuation
Investments in securities, including foreign securities, traded on an exchange or quoted on the over-the-counter market are valued at the last sale price or, if no sale occurred during the day, at the mean between closing bid and asked prices, as last reported by a pricing service approved by the Trustees. Securities that are principally traded on the National Association of Securities Dealers Automated Quotation National Market (“NASDAQ”) are generally valued at the NASDAQ Official Closing Price (“NOCP”). Investments in gold and silver are valued on the basis of the respective closing spot prices of the New York Commodity Exchange. Investments in other precious metals are valued at their respective market values determined on the basis of the mean between the last current bid and asked prices based on dealer or exchange quotations. When market quotations are not readily available, or when restricted securities or other assets are being valued, such assets are valued at fair value as determined in good faith by or under procedures approved by the Trustees. Short-term securities maturing within 60 days are valued on an amortized cost basis. Fixed income securities with maturities greater than 60 days are valued at market price.
Trading in securities on European and Far Eastern securities exchanges normally is completed before the calculation of the Funds’ net asset value. Trading on these foreign exchanges may not take place on all days on which there is regular trading on the New York Stock Exchange (“NYSE”), or may take place on days on which there is no regular trading on the NYSE. Similarly, the Funds may hold securities traded in domestic markets where the market may close early on a given day prior to calculation of the Funds’ net asset value. Events affecting the value of such securities held by the Funds that occur between the close of trading in the security and the close of trading on the NYSE normally will not be reflected in the Funds’ calculation of the net asset value. Significant events will be closely monitored, and where it is determined that an adjustment should be made to the security’s value because significant interim events may materially affect the value of the security, the security will be priced at its fair value in accordance with the procedures approved by the Trustees.
Investment and shareholder transactions are recorded on trade date. Dividend income is recognized on the ex-dividend date and interest income is recognized on an accrual basis.
b) Restricted and illiquid securities
The Funds may invest in securities that are subject to legal or contractual restrictions on resale or are illiquid. A security may be considered illiquid if it lacks a readily available market or if its valuation has not changed for a certain period of time. Disposal of these securities may involve time consuming negotiations and expense, and a prompt sale at the current valuation may be difficult.
c) Fair valuation pricing inputs
The Trust has adopted authoritative fair valuation accounting standards which establish an authoritative definition of fair value and set out a hierarchy for measuring fair value. These standards require additional disclosures about the
| Annual Report | 49 |
various inputs and valuation techniques used to develop the measurements of fair value and a discussion in changes in valuation techniques and related inputs during the period. These inputs are summarized in the three broad levels listed below.
| Level 1 - | Quoted prices in active markets for identical securities. |
| Level 2 - | Other significant observable inputs (including quoted prices for similar securities, interest rates, prepayment speeds, credit risk, etc.). |
| Level 3 - | Significant unobservable inputs (including the Fund’s own assumptions in determining the fair value of investments). |
Equity investments, including common stocks, foreign issued common stocks, exchange-traded funds, closed end mutual funds and real estate investments trusts, which are traded on an exchange are valued at the last sale price reported by the exchange on which the securities are primarily traded on the day of valuation. If there are no sales on a given day for securities traded on an exchange, the mean between the latest bid and ask price will be used. If there is no Nasdaq Official Closing Price for a Nasdaq-listed security or sale price available for an over-the-counter security, the mean of the latest bid and asked quotations from Nasdaq will be used. When using the market quotations or closing price provided by the pricing service and when the market is considered active, the security will be classified as a Level 1 security.
Investment in mutual funds, including money market funds, are generally priced at the ending net asset value (NAV) provided by the service agent of the funds and will be classified as Level 1 securities.
Debt securities, such as corporate bonds, convertible bonds and U.S. government agency issues for which market quotations are not readily available may be valued based on information supplied by independent pricing services using matrix pricing formulas and/or independent broker bid quotations. Debt securities with remaining maturities of 60 days or less may be valued on an amortized cost basis, which involves valuing an instrument at its cost and thereafter assuming a constant amortization to maturity of any discount or premium, regardless of the impact of fluctuating rates on the fair value of the instrument. On days when the closing price of the S&P 500 moves more than 1% from its previous close, common stocks of the International Value Fund which are traded on non-North American exchanges may be valued using matrix pricing formulas provided by an independent pricing service. Warrants for which the underlying security is registered and equities which are subject to a required holding period, but have a comparable public issue, are valued in good faith by the Advisor pursuant to procedures established under the general supervision and responsibility of the Funds’ Board of Trustees. These securities will generally be classified as Level 2 securities.
Any securities or other assets for which market quotations are not readily available are valued at fair value as determined in good faith by the Advisor pursuant to procedures established under the general supervision and responsibility of the Funds’ Board of Trustees and will be classified as Level 3 securities. In determining fair value, a Fund will seek to assign a value to the security which it believes represents the amount that the Fund could reasonably expect to receive upon its current sale. With respect to securities that are actively traded on U.S. exchanges, the Funds expect that market quotations will generally be available and that fair value might be used only in limited circumstances, such as when trading for a security is halted during the trading day.
For securities traded principally on foreign exchanges, the Funds may use fair value pricing if an event occurs after the close of trading of the principal foreign exchange on which a security is traded, but before calculation of a Fund’s NAV, which a Fund believes affects the value of the security since its last market quotation. Such events may involve situations relating to a single issuer (such as news related to the issuer announced after the close of the principal foreign
| 50 | October 31, 2010 |
exchange), or situations relating to sectors of the market or the markets in generals (such as significant fluctuations in the U.S. or foreign markets or significant changes in exchange rates, natural disasters, armed conflicts, or governmental actions).
In determining whether a significant event has occurred with respect to securities traded principally in foreign markets, the Funds may engage a third party fair value service provider to systematically recommend the adjustment of closing market prices of non-U.S. securities based upon changes in a designated U.S. securities market index occuring from the time of close of the relevant foreign market and the close of the NYSE. Fair value pricing may also be used to value restricted securities held by the Funds or securities with little or no trading activity for extended periods of time. Fair value pricing involves judgements that are inherently subjective and inexact and it is not possible to determine with certainty when, and to what extent, an event will affect a market price. As a result, there can be no assurance that fair value pricing will reflect actual market value and it is possible that the fair value determined for a security may differ materially from the value that could be realized upon the sale of the security.
The following is a summary of the inputs used, as of October 31, 2010, involving the Funds’ assets carried at value. The inputs of methodology used for valuing securities may not be an indication of the risk associated with investing in those securities.
| Description | Level 1 | Level 2 | Level 3 | Total | ||||||||||||
The Tocqueville Fund | ||||||||||||||||
Common Stocks* | $ | 489,491,565 | $ | — | $ | — | $ | 489,491,565 | ||||||||
Warrants* | — | 14,656 | — | 14,656 | ||||||||||||
Repurchase Agreement | — | 2,153,000 | — | 2,153,000 | ||||||||||||
Total Fund | $ | 489,491,565 | $ | 2,167,656 | $ | — | $ | 491,659,221 | ||||||||
| The Tocqueville Opportunity Fund | Level 1 | Level 2 | Level 3 | Total | ||||||||||||
Common Stocks* | $ | 30,562,580 | $ | — | $ | — | $ | 30,562,580 | ||||||||
Exchange Traded Funds* | 2,303,930 | — | — | 2,303,930 | ||||||||||||
Repurchase Agreement | — | 118,000 | — | 118,000 | ||||||||||||
Total Fund | $ | 32,866,510 | $ | 118,000 | $ | — | $ | 32,984,510 | ||||||||
| The Tocqueville International Value Fund | Level 1 | Level 2 | Level 3 | Total | ||||||||||||
Common Stocks* | $ | 133,287,804 | $ | — | $ | — | $ | 133,287,804 | ||||||||
Warrants* | — | 71,040 | — | 71,040 | ||||||||||||
Money Market Fund | 7,424,636 | — | — | 7,424,636 | ||||||||||||
Repurchase Agreement | — | 7,424,000 | — | 7,424,000 | ||||||||||||
Total Fund | $ | 140,712,440 | $ | 7,495,040 | $ | — | $ | 148,207,480 | ||||||||
| Annual Report | 51 |
| The Tocqueville Gold Fund | Level 1 | Level 2 | Level 3 | Total | ||||||||||||
Common Stocks | ||||||||||||||||
Gold & Gold Related | $ | 1,522,499,901 | $ | 59,754,567 | $ | 16,787,636 | $ | 1,599,042,104 | ||||||||
Oil, Gas and Consumable Fuels | 1,364,165 | — | — | 1,364,165 | ||||||||||||
Precious Metals & Related | 67,397,861 | — | 14,054,997 | 81,452,858 | ||||||||||||
Total Common Stocks | 1,591,261,927 | 59,754,567 | 30,842,633 | 1,681,859,127 | ||||||||||||
Closed End Mutual Funds* | 16,646,000 | — | — | 16,646,000 | ||||||||||||
Warrants* | — | 5,998,762 | — | 5,998,762 | ||||||||||||
Purchased Call Options* | — | — | — | — | ||||||||||||
Rights* | — | — | — | — | ||||||||||||
Gold Bullion | — | 133,254,498 | — | 133,254,498 | ||||||||||||
U.S. Treasury Bills | — | 149,970,211 | — | 149,970,211 | ||||||||||||
Money Market Fund | 81,676,064 | — | — | 81,676,064 | ||||||||||||
Repurchase Agreement | — | 97,098,000 | — | 97,098,000 | ||||||||||||
Total Fund | $ | 1,689,583,991 | $ | 446,076,038 | $ | 30,842,633 | $ | 2,166,502,662 | ||||||||
| The Delafield Fund | Level 1 | Level 2 | Level 3 | Total | ||||||||||||
Common Stocks* | $ | 745,759,390 | $ | — | $ | — | $ | 745,759,390 | ||||||||
Corporate Bonds* | — | 11,814,151 | — | 11,814,151 | ||||||||||||
Foreign Corporate Bonds* | — | 3,329,634 | — | 3,329,634 | ||||||||||||
Real Estate Investment Trust (REIT) | 10,338,000 | — | — | 10,338,000 | ||||||||||||
Warrants* | — | 4,305 | — | 4,305 | ||||||||||||
U.S. Treasury Notes | — | 10,059,380 | — | 10,059,380 | ||||||||||||
Money Market Funds | 149,370,816 | — | — | 149,370,816 | ||||||||||||
Total Fund | $ | 905,468,206 | $ | 25,207,470 | $ | — | $ | 930,675,676 | ||||||||
| The Select Fund | Level 1 | Level 2 | Level 3 | Total | ||||||||||||
Common Stocks* | $ | 34,132,409 | $ | — | $ | — | $ | 34,132,409 | ||||||||
Money Market Funds | 7,482,864 | — | — | 7,482,864 | ||||||||||||
Total Fund | $ | 41,615,273 | $ | — | $ | — | $ | 41,615,273 | ||||||||
| * | For further information regarding portfolio characteristics, please see the accompanying Schedules of Investments. |
| 52 | October 31, 2010 |
Below is a reconciliation that details the activity of securities in Level 3 during the current fiscal period:
| The Tocqueville Fund | The Tocqueville Opportunity Fund | The Tocqueville International Value Fund | The Tocqueville Gold Fund | The Delafield Fund | The Select Fund | |||||||||||||||||||
Beginning Balance—November 1, 2009 | $ | — | $ | — | $ | — | $ | 18,168,423 | $ | — | $ | — | ||||||||||||
Purchases | — | — | — | 34,536,814 | — | — | ||||||||||||||||||
Sales | — | — | — | — | — | — | ||||||||||||||||||
Realized gains | — | — | — | — | — | — | ||||||||||||||||||
Realized losses | — | — | — | — | — | — | ||||||||||||||||||
Change in unrealized appreciation | — | — | — | 5,402,614 | — | — | ||||||||||||||||||
Transfers in/(out) of level 3 | — | — | — | (27,265,218 | ) | — | — | |||||||||||||||||
Ending Balance—October 31, 2010 | $ | — | $ | — | $ | — | $ | 30,842,633 | $ | — | $ | — | ||||||||||||
d) Derivative instruments and hedging activities
The Trust has adopted derivative instruments disclosure standards in order to enable the investor to understand how and why an entity used derivatives, how derivatives are accounted for, and how derivative instruments affect an entity’s results of operations and financial position.
During the year ended October 31, 2010, The Tocqueville Gold Fund held call option contracts. Purchased call options on an equity are typically used to hedge against an equity position in the portfolio. The purchased call options held in the portfolio came attached to the equity position, at no additional cost, when it was purchased. The options were acquired in the normal course of pursuing the Fund’s investment objectives, not necessarily to hedge against a particular position.
Balance sheet—value of derivative instruments at October 31, 2010
The purchased options held in The Tocqueville Gold Fund are valued at $0 and have a cost of $0. As such, they have no impact on the Fund’s balance sheet.
The effect of derivative instruments on the statement of operations for the period ended October 31, 2010
The purchased options held in The Tocqueville Gold Fund are valued at $0 and have a cost of $0. As such, they have no impact on the Fund’s statement of operations.
e) Subsequent Events Evaluation
In preparing these financial statements, the Trust has evaluated events and transactions for potential recognition or disclosure resulting from subsequent events through the date financial statements were available to be issued.
f) Foreign currency translation
Investments and other assets and liabilities denominated in foreign currencies are translated to U.S. dollars at the prevailing rates of exchange, in accordance with the Trust’s Portfolio Securities Valuation and Foreign Exchange
| Annual Report | 53 |
Contracts Procedures. The Tocqueville Fund, The Tocqueville International Value Fund, The Tocqueville Gold Fund and The Delafield Fund are engaged in transactions in securities denominated in foreign currencies and, as a result, enter into foreign exchange contracts. These Funds are exposed to additional market risk as a result of changes in the value of the underlying currency in relation to the U.S. dollar. Risks include potential inability of counterparties to meet the terms of their contracts. The value of foreign currency contracts are marked-to-market on a daily basis, which reflects the changes in the market value of the contract at the close of each day’s trading, resulting in daily unrealized gains and/or losses. When the contracts are closed, the Funds recognize a realized gain or loss.
The Funds do not isolate that portion of the results of operations resulting from changes in foreign exchange rates on investments from the fluctuations arising from changes in market prices of securities held. Such fluctuations are included with the net realized and unrealized gain or loss from investments.
Reported net realized foreign exchange gains or losses arise from sales of foreign currencies, currency gains or losses realized between the trade and settlement dates on securities transactions, the differences between the amounts of dividends, interest, and foreign withholding taxes recorded on the Fund’s books, and the U.S. dollar equivalent of the amounts actually received or paid. Net unrealized foreign exchange gains and losses arise from changes in the value of assets and liabilities other than investments in securities at the end of the fiscal period, resulting from changes in the exchange rates.
g) Written option accounting
The Tocqueville Opportunity Fund, The Tocqueville International Value Fund, The Select Fund and The Tocqueville Gold Fund may write (sell) covered call options to hedge portfolio investments. When the Funds write (sell) an option, an amount equal to the premium received by the Funds is included in the Statements of Assets and Liabilities as an asset and an equivalent liability. The amount of the liability is subsequently marked-to-market to reflect the current value of the option written. By writing an option, the Funds may become obligated during the term of the option to deliver or purchase the securities underlying the option at the exercise price if the option is exercised. Option contracts are valued at the last sales price reported on the date of obligation. If the seller defaults and the value of the collateral declines or if bankruptcy proceedings are commenced with respect to the seller of the security, realization of the collateral by the Funds may be delayed or limited.
h) Dividends and distributions to Shareholders
Dividends to shareholders are recorded on the ex-dividend date. Dividends from net investment income are declared and paid annually by the Funds. Distributions of net realized capital gains, if any, will be declared and paid at least annually. Income and capital gain distributions are determined in accordance with income tax regulations which may differ from generally accepted accounting principles. Permanent differences between financial and tax reporting may result in reclassification to capital stock.
i) Use of estimates
The preparation of financial statements in conformity with accounting principles generally accepted in the United States of America requires management to make estimates and assumptions that affect the reported amounts of assets and liabilities and disclosure of contingent assets and liabilities at the date of the financial statements and the reported amounts of revenues and expenses during the reporting period. Actual results could differ from those estimates.
| 54 | October 31, 2010 |
3. FEDERAL INCOME TAX
There is no tax liability resulting from unrecognized tax benefits relating to uncertain income tax positions taken or expected to be taken on the tax return for the fiscal year-end October 31, 2010, or for any other tax years which are open for exam. As of October 31, 2010, open tax years include the tax years ended October 31, 2007 through 2010. The Trust is also not aware of any tax positions for which it is reasonably possible that the total amounts of unrecognized tax benefits will significantly change in the next six months. The Fund recognizes interest and penalties, if any, related to unrecognized tax benefits as income tax expense in the Statement of Operations. During the period, the Funds did not incur any interest or penalties.
Provision for federal income taxes or excise taxes has not been made since the Funds have elected to be taxed as Regulated Investment Companies and intend to distribute substantially all taxable income to shareholders and otherwise comply with the provisions of the Internal Revenue Code applicable to Regulated Investment Companies. Distributions from net realized gains for book purposes may include short-term capital gains which are included as ordinary income to shareholders for tax purposes. Additionally, U.S. generally accepted accounting principles require that certain components of net assets relating to permanent differences be reclassified between financial and tax reporting. These reclassifications have no effect on net assets or net asset value per share. For the period ended October 31, 2010, the following table shows the reclassifications made:
| Undistributed Net Investment Income/(Loss) | Accumulated Net Realized Gain/(Loss) | Paid In Capital | ||||||||||
The Tocqueville Fund | $ | — | $ | — | $ | — | ||||||
Opportunity Fund | 303,742 | — | (303,742 | ) | ||||||||
International Value Fund | (288,153 | ) | 288,153 | — | ||||||||
Gold Fund | 11,817,861 | (3,180,244 | ) | (8,637,617 | ) | |||||||
Delafield Fund | 870,520 | (28,650 | ) | (841,870 | ) | |||||||
Select Fund | 164,118 | (164,119 | ) | 1 | ||||||||
The permanent differences primarily relate to net operating losses and foreign currency reclasses.
As of October 31, 2010, the components of accumulated earnings (losses) for income tax purposes were as follows:
| The Tocqueville Fund | Opportunity Fund | International Value Fund | Gold Fund | The Delafield Fund | The Select Fund | |||||||||||||||||||
Tax cost of investments | $ | 462,438,178 | $ | 28,451,500 | $ | 124,847,415 | $ | 1,136,610,779 | $ | 801,140,933 | $ | 31,719,009 | ||||||||||||
Unrealized appreciation | 74,974,749 | 5,611,666 | 30,248,853 | 1,044,199,273 | 169,845,704 | 10,484,203 | ||||||||||||||||||
Unrealized depreciation | (45,753,706 | ) | (1,078,656 | ) | (6,888,788 | ) | (14,307,390 | ) | (40,310,961 | ) | (587,939 | ) | ||||||||||||
Net unrealized appreciation | 29,221,043 | 4,533,010 | 23,360,065 | 1,029,891,883 | 129,534,743 | 9,896,264 | ||||||||||||||||||
Undistributed operating income | 6,319,760 | — | 717,508 | — | — | 282,013 | ||||||||||||||||||
Undistributed long-term gains | — | — | — | 46,373,131 | — | 1,829,973 | ||||||||||||||||||
Distributable earnings | 6,319,760 | — | 717,508 | 46,373,131 | — | 2,111,986 | ||||||||||||||||||
Other accumulated loss | (49,097,660 | ) | (8,050,361 | ) | (12,617,181 | ) | (451,597 | ) | (6,662,796 | ) | (8,797 | ) | ||||||||||||
Total accumulated gain/(loss) | $ | (13,556,857 | ) | $ | (3,517,351 | ) | $ | 11,460,392 | $ | 1,075,813,417 | $ | 122,871,947 | $ | 11,999,453 | ||||||||||
The difference between book-basis and tax-basis unrealized appreciation is attributable primarily to capital loss carry overs.
| Annual Report | 55 |
The tax character of distributions paid during the periods ended October 31, 2010 and 2009 (October 31, 2010 and December 31, 2009 for The Delafield Fund and the Select Fund) was as follows:
| October 31, 2010 | ||||||||||||||||
| Ordinary Income | Long Term Capital Gain | Return of Capital | Total | |||||||||||||
The Tocqueville Fund | $ | 4,954,961 | $ | — | $ | — | $ | 4,954,961 | ||||||||
Opportunity Fund | — | — | — | — | ||||||||||||
International Value Fund | 1,534,647 | — | — | 1,534,647 | ||||||||||||
Gold Fund | — | 1,803,165 | — | 1,803,165 | ||||||||||||
The Delafield Fund | — | — | 719,160 | 719,160 | ||||||||||||
The Select Fund | 27,613 | — | — | 27,613 | ||||||||||||
| October 31, 2009 | ||||||||||||||||
| Ordinary Income | Long Term Capital Gain | Return of Capital | Total | |||||||||||||
The Tocqueville Fund | $ | 5,443,841 | $ | — | $ | — | $ | 5,443,841 | ||||||||
Opportunity Fund | 38,161 | 387,146 | — | 425,307 | ||||||||||||
International Value Fund | 2,581,611 | 6,588,454 | — | 9,170,065 | ||||||||||||
Gold Fund | — | 15,721,021 | — | 15,721,021 | ||||||||||||
The Delafield Fund | 826,756 | — | 164,562 | 991,318 | ||||||||||||
The Select Fund | 5,068 | — | 5,751 | 10,819 | ||||||||||||
The Fund designated as long-term capital gain dividend, pursuant to Internal Revenue Cose Section 852(b)(3), the amount necessary to reduce the earnings and profits of the Funds related to net capital gain to zero for the tax years ended October 31, 2010 and 2009.
At October 31, 2010, certain Funds had tax basis capital losses which may be carried forward to offset future capital gains as shown below.
| The Tocqueville Fund | Opportunity Fund | International Value Fund | The Delafield Fund | |||||||||||||
| Capital losses expiring on: | ||||||||||||||||
10/31/2017 | $ | (49,100,379 | ) | $ | (8,050,361 | ) | $ | (12,337,944 | ) | $ | (6,662,796 | ) | ||||
4. FINANCIAL INSTRUMENTS
The Funds may trade financial instruments with off-balance sheet risk in the normal course of investing activities and to assist in managing exposure to market risks such as interest rates and foreign currency exchange rates. The financial instruments include written options, forward foreign currency exchange contracts and futures contracts. The contractual amounts of these instruments represent the investment the Funds have in particular classes of financial instruments and
| 56 | October 31, 2010 |
the amounts potentially subject to risk. The measurement of the risks associated with these instruments is meaningful only when all related and offsetting transactions are considered. At October 31, 2010, the Funds did not hold any financial instruments with off-balance sheet risk.
5. INVESTMENT ADVISORY AND OTHER AGREEMENTS
Tocqueville Asset Management L.P. (“Tocqueville”) is the investment adviser (the “Adviser”) to the Trust under Investment Advisory Agreements approved by shareholders. For its services, Tocqueville receives fees from The Tocqueville Fund, calculated daily and payable monthly, at an annual rate of 0.75% on the first $1 billion of the average daily net assets of the Fund, and 0.65% of the average daily net assets in excess of $1 billion. Tocqueville receives fees from The Tocqueville Opportunity Fund, calculated daily and payable monthly, at an annual rate of 0.75% on the first $500 million of the average daily net assets of the Fund, and 0.65% of the average daily net assets in excess of $500 million. Tocqueville receives fees from the Tocqueville International Value Fund, calculated daily and payable monthly, at an annual rate of 1.00% on the first $1 billion of the average daily net assets of the Fund, and 0.75% of the average daily net assets in excess of $1 billion. Tocqueville receives fees from The Tocqueville Gold Fund, calculated daily and payable monthly, at an annual rate of 1.00% on the first $500 million of the average daily net assets of the Fund, 0.75% of the average daily net assets in excess of $500 million but not exceeding $1 billion, and 0.65% of the average daily net assets in excess of $1 billion. Tocqueville receives fees from The Delafield Fund, calculated daily and payable monthly, at an annual rate of 0.80% on the first $250 million of net assets of the Fund; 0.75% on the next $250 million of net assets of the Fund; 0.70% on the next $500 million of net assets of the Fund; and 0.65% on all net assets of the Fund over $1 billion. Tocqueville receives fees from The Select Fund, calculated daily and payable monthly, at an annual rate of 0.80% on all net assets of the Fund.
With respect to The Tocqueville Fund, effective October 31, 2010, the Adviser has contractually agreed to waive its advisory fees and/or reimburse expenses in order to ensure that The Tocqueville Fund’s total annual operating expenses do not exceed 1.25% of its average daily net assets. The Expense Limitation Agreement will remain in effect until March 1, 2012.
Pursuant to an Administrative Services Agreement, each Fund pays to the Adviser a fee computed and paid monthly at an annual rate of 0.15% of the average daily net assets of the Fund. For the year ended October 31, 2010, the Adviser has made payments of $117,387, $7,583, $35,210, $369,468, $207,577, and $8,445 to U.S. Bancorp Fund Services, LLC for services provided under a Sub-Administration Agreement for The Tocqueville Fund, The Tocqueville Opportunity Fund, The Tocqueville International Value Fund, The Tocqueville Gold Fund, The Delafield Fund and The Select Fund, respectively.
Tocqueville Securities, L.P. (the “Distributor”), an affiliate of Tocqueville, acts as distributor for shares of the Trust. Each Fund adopted a distribution and service plan pursuant to Rule 12b-1 of the 1940 Act. Pursuant to the plans, each Fund pays to the Distributor distribution and service fees of 0.25% per annum of its average daily net assets.
Commissions earned by the Distributor for services rendered as a registered broker-dealer in securities transactions for The Tocqueville Fund, The Tocqueville Opportunity Fund, The Tocqueville International Value Fund, The Tocqueville Gold Fund, The Delafield Fund and The Select Fund for the year ended October 31, 2010, were $190,790, $23,943, $28,288, $28,181, $73,173, and $8,467, respectively.
| Annual Report | 57 |
6. CAPITAL SHARE TRANSACTIONS.
Transactions in capital shares for each Fund were as follows:
| For the Year Ended October 31, 2010 | For the Year Ended October 31, 2009 | |||||||||||||||
| The Tocqueville Fund | Shares | Dollar Amount | Shares | Dollar Amount | ||||||||||||
Shares sold | 7,015,241 | $ | 142,456,732 | 6,836,665 | $ | 110,323,953 | ||||||||||
Shares issued to holders in reinvestment of dividends | 203,892 | 4,041,138 | 286,662 | 4,443,262 | ||||||||||||
Shares redeemed | (5,240,419 | ) | (107,195,396 | ) | (6,403,983 | ) | (99,888,536 | ) | ||||||||
Net increase | 1,978,714 | $ | 39,302,474 | 719,344 | $ | 14,878,679 | ||||||||||
| For the Year Ended October 31, 2010 | For the Year Ended October 31, 2009 | |||||||||||||||
| The Tocqueville Opportunity Fund | Shares | Dollar Amount | Shares | Dollar Amount | ||||||||||||
Shares sold | 472,367 | $ | 5,812,777 | 414,365 | $ | 3,491,896 | ||||||||||
Shares issued to holders in reinvestment of dividends | — | — | 36,504 | 317,949 | ||||||||||||
Shares redeemed | (813,438 | ) | (9,628,207 | ) | (1,347,737 | ) | (12,486,860 | ) | ||||||||
Net decrease | (341,071 | ) | $ | (3,815,430 | ) | (896,868 | ) | $ | (8,677,015 | ) | ||||||
| For the Year Ended October 31, 2010 | For the Year Ended October 31, 2009 | |||||||||||||||
| The Tocqueville International Value Fund | Shares | Dollar Amount | Shares | Dollar Amount | ||||||||||||
Shares sold | 1,398,815 | $ | 15,384,677 | 1,023,107 | $ | 9,171,246 | ||||||||||
Shares issued to holders in reinvestment of dividends | 102,342 | 1,121,673 | 996,807 | 8,163,847 | ||||||||||||
Shares redeemed | (1,671,623 | ) | (18,334,069 | ) | (3,387,189 | ) | (28,627,995 | ) | ||||||||
Net decrease | (170,466 | ) | $ | (1,827,719 | ) | (1,367,275 | ) | $ | (11,292,902 | ) | ||||||
| For the Year Ended October 31, 2010 | For the Year Ended October 31, 2009 | |||||||||||||||
| The Tocqueville Gold Fund | Shares | Dollar Amount | Shares | Dollar Amount | ||||||||||||
Shares sold | 14,061,481 | $ | 936,511,037 | 5,107,647 | $ | 207,301,579 | ||||||||||
Shares issued to holders in reinvestment of dividends | 30,182 | 1,723,993 | 510,898 | 15,061,134 | ||||||||||||
Shares redeemed | (6,127,797 | ) | (389,329,542 | ) | (5,632,933 | ) | (196,570,674 | ) | ||||||||
Net increase (decrease) | 7,963,866 | $ | 548,905,488 | (14,388 | ) | $ | 25,792,039 | |||||||||
| 58 | October 31, 2010 |
| For the Year Ended October 31, 2010 | For the Ten-Month Period Ended October 31, 2009 | |||||||||||||||
| The Delafield Fund (See Footnote 1) | Shares | Dollar Amount | Shares | Dollar Amount | ||||||||||||
Shares sold | 14,274,437 | $ | 354,831,009 | 9,655,036 | $ | 167,437,687 | ||||||||||
Shares issued to holders in reinvestment of dividends | 29,759 | 682,368 | 43,997 | 944,184 | ||||||||||||
Shares redeemed | (9,085,090 | ) | (218,080,618 | ) | (6,690,659 | ) | (105,661,142 | ) | ||||||||
Net increase | 5,219,106 | $ | 137,432,759 | 3,008,374 | $ | 62,720,729 | ||||||||||
| For the Year Ended October 31, 2010 | For the Ten-Month Period Ended October 31,2009 | |||||||||||||||
| The Select Fund (See Footnote 1) | Shares | Dollar Amount | Shares | Dollar Amount | ||||||||||||
Shares sold | 1,383,358 | $ | 14,517,906 | 30,634 | $ | 270,523 | ||||||||||
Shares issued to holders in reinvestment of dividends | 3,045 | 27,465 | — | — | ||||||||||||
Shares redeemed | (683,159 | ) | (6,931,705 | ) | (42,404 | ) | (337,493 | ) | ||||||||
Transfers in from Class A and Class C | ||||||||||||||||
From The Delafield Select Fund—Class A | — | — | 1,272,151 | 11,242,428 | ||||||||||||
From The Delafield Select Fund—Class C | — | — | 20,352 | 179,855 | ||||||||||||
From The Delafield Select Fund—Class Y | — | — | 1,636,816 | 14,466,105 | ||||||||||||
Total transfers in | — | — | 2,929,319 | 25,888,388 | ||||||||||||
Net increase | 703,244 | $ | 7,613,666 | 2,917,549 | $ | 25,821,418 | ||||||||||
| For the Ten-Month Period Ended October 31, 2009 | ||||||||||||||||
| The Delafield Select Fund—Class A (See Footnote 1) | Shares | Dollar Amount | ||||||||||||||
Shares sold | 1,237,383 | $ | 7,946,654 | |||||||||||||
Shares issued to holders in reinvestment of dividends | 262 | 1,538 | ||||||||||||||
Shares redeemed | (245,960 | ) | (1,231,673 | ) | ||||||||||||
Transfers out to the Select Fund | (1,273,744 | ) | (11,242,428 | ) | ||||||||||||
Net decrease | (282,059 | ) | $ | (4,525,909 | ) | |||||||||||
| Annual Report | 59 |
| For the Ten-Month Period Ended October 31, 2009 | ||||||||||||||||
| The Delafield Select Fund—Class C (See Footnote 1) | Shares | Dollar Amount | ||||||||||||||
Shares sold | 23,853 | $ | 174,583 | |||||||||||||
Shares issued to holders in reinvestment of dividends | 1 | 4 | ||||||||||||||
Shares redeemed | (4,461 | ) | (28,330 | ) | ||||||||||||
Transfers out to the Select Fund | (20,571 | ) | (179,855 | ) | ||||||||||||
Net decrease | (1,178 | ) | $ | (33,598 | ) | |||||||||||
| For the Ten-Month Period Ended October 31, 2009 | ||||||||||||||||
| The Delafield Select Fund—Class Y (See Footnote 1) | Shares | Dollar Amount | ||||||||||||||
Shares sold | 208,399 | $ | 1,561,596 | |||||||||||||
Shares issued to holders in reinvestment of dividends | 1,236 | 9,277 | ||||||||||||||
Shares issued in connections with the acquisition of assets | — | — | ||||||||||||||
Shares redeemed | (173,969 | ) | (1,450,385 | ) | ||||||||||||
Transfers out to the Select Fund | (1,635,003 | ) | (14,466,105 | ) | ||||||||||||
Net decrease | (1,599,337 | ) | $ | (14,345,617 | ) | |||||||||||
7. FUND SHARE TRANSACTIONS
The Funds currently offer only one class of shares of beneficial interest. A redemption fee of 2.00% is imposed on redemptions of shares held 120 days or fewer. This fee is retained by each Fund and is credited to paid in capital. Redemptions to which the fee applies include redemptions of shares resulting from an exchange made pursuant to the Exchange Privilege, as defined in the Trust’s Prospectus dated March 1, 2010. For a more detailed description of when the redemption fee does not apply, please see the Trust’s Prospectus. The Trust may waive the redemption fee when the Adviser determines that the imposition of the redemption fee is not necessary to protect a Fund from the effects of redemptions by investors who use the Fund as a short-term trading vehicle.
| 60 | October 31, 2010 |
8. INVESTMENT TRANSACTIONS
Purchases and sales of investment securities (excluding short-term instruments) for the period ended October 31, 2010 are summarized below.
| The Tocqueville Fund | Opportunity Fund | International Value Fund | Gold Fund | Delafield Fund | The Select Fund | |||||||||||||||||||
Purchases: | $ | 151,168,292 | $ | 29,223,496 | $ | 33,484,373 | $ | 313,376,534 | $ | 332,412,265 | $ | 14,424,270 | ||||||||||||
Sales: | $ | 97,819,235 | $ | 32,204,983 | $ | 44,477,282 | $ | 116,584,609 | $ | 202,428,335 | $ | 11,131,464 | ||||||||||||
U.S. Government Security Purchases: | $ | — | $ | — | $ | — | $ | — | $ | $ | — | |||||||||||||
U.S. Government Security Sales: | $ | — | $ | — | $ | — | $ | — | $ | — | $ | — | ||||||||||||
9. TRANSACTIONS WITH AFFILIATES
The following issuers are affiliated with the Funds; that is, the Adviser had control of 5% or more of the outstanding voting securities during the period from November 1, 2009 through October 31, 2010. As defined in Section (2)(a)(3) of the Investment Company Act of 1940; such issues are:
The Tocqueville Fund
Issuer Name | Share Balance at Nov. 1, 2009 | Additions | Reductions | Share Balance at October 31, 2010 | Dividend Income | Realized Gain/(Loss) | Value at October 31, 2010 | |||||||||||||||||||||
Alaska Communication Systems Group, Inc. | 600,000 | — | (50,000 | ) | 550,000 | $ | 494,500 | $ | (99,217 | ) | $ | 5,516,500 | ||||||||||||||||
| $ | 494,500 | $ | (99,217 | ) | $ | 5,516,500 | ||||||||||||||||||||||
The Tocqueville Opportunity Fund |
| |||||||||||||||||||||||||||
Issuer Name | Share Balance at Nov. 1, 2009 | Additions | Reductions | Share Balance at October 31, 2010 | Dividend Income | Realized Gain/(Loss) | Value at October 31, 2010 | |||||||||||||||||||||
1-800 Flowers.com, Inc. | 102,500 | — | (52,500 | ) | 50,000 | $ | — | $ | (314,932 | ) | $ | 90,000 | ||||||||||||||||
Landec Corp. | 44,700 | — | (29,700 | ) | 15,000 | — | (82,615 | ) | 94,350 | |||||||||||||||||||
Silicon Image, Inc. | 255,500 | — | (180,500 | ) | 75,000 | — | (251,877 | ) | 461,250 | |||||||||||||||||||
Ultratech, Inc. | 94,500 | — | (74,500 | ) | 20,000 | — | 194,201 | 366,200 | ||||||||||||||||||||
| $ | — | $ | (455,223 | ) | $ | 1,011,800 | ||||||||||||||||||||||
| Annual Report | 61 |
The Tocqueville Gold Fund |
| |||||||||||||||||||||||||||
Issuer Name | Share Balance at Nov. 1, 2009 | Additions | Reductions | Share Balance at October 31, 2010 | Dividend Income | Realized Gain/(Loss) | Value at October 31, 2010 | |||||||||||||||||||||
Atac Resources Ltd. | — | 7,000,000 | — | 7,000,000 | $ | — | $ | — | $ | 54,701,441 | ||||||||||||||||||
Banro Corp. | 4,631,400 | 549,700 | — | 5,181,100 | — | — | 15,240,024 | |||||||||||||||||||||
Comaplex Minerals Corp. (a) | 2,839,000 | — | (2,839,000 | ) | — | — | 5,241,447 | — | ||||||||||||||||||||
Corvus Gold, Inc. | — | 2,079,902 | — | 2,079,902 | — | — | 1,998,533 | |||||||||||||||||||||
Gold Resource Corp. | 2,300,797 | — | — | 2,300,797 | 207,072 | — | 48,546,817 | |||||||||||||||||||||
Gold Resource Corp. | — | 1,500,000 | — | 1,500,000 | — | — | 31,046,400 | |||||||||||||||||||||
International Tower Hill Mines Ltd. | 1,993,100 | 500,036 | — | 2,493,136 | — | — | 18,548,932 | |||||||||||||||||||||
International Tower Hill Mines Ltd. | — | 1,666,667 | — | 1,666,667 | — | — | 12,452,204 | |||||||||||||||||||||
Orezone Gold Corp. (a) | 2,145,463 | — | — | 2,145,463 | — | — | 6,668,415 | |||||||||||||||||||||
Primero Mining Corp. | — | 4,621,000 | — | 4,621,000 | — | — | 26,731,934 | |||||||||||||||||||||
Primero Mining Corp. Warrants | — | 1,848,400 | — | 1,848,400 | — | — | 3,407,189 | |||||||||||||||||||||
Richfield Ventures Corp. | — | 2,800,000 | — | 2,800,000 | — | — | 7,425,669 | |||||||||||||||||||||
Richfield Ventures Corp. Warrants | — | 1,400,000 | — | 1,400,000 | — | — | 231,983 | |||||||||||||||||||||
Romarco Minerals | 15,387,800 | — | — | 15,387,800 | — | — | 41,038,157 | |||||||||||||||||||||
Scorpio Mining Corp. | — | 16,699,542 | — | 16,699,542 | — | — | 14,245,110 | |||||||||||||||||||||
Strategic Metals Ltd. | — | 10,350,000 | — | 10,350,000 | — | — | 21,282,498 | |||||||||||||||||||||
Torex Gold Resources, Inc. (a) | — | 5,000,000 | — | 5,000,000 | — | — | 6,716,345 | |||||||||||||||||||||
Torex Gold Resources, Inc., Warrants (a) | — | 1,250,000 | — | 1,250,000 | — | — | 490,244 | |||||||||||||||||||||
| $ | 207,072 | $ | 5,241,447 | $ | 310,771,895 | |||||||||||||||||||||||
| 62 | October 31, 2010 |
The Delafield Fund |
| |||||||||||||||||||||||||||
Issuer Name | Share Balance at Nov. 1, 2009 | Additions | Reductions | Share Balance at October 31, 2010 | Dividend Income | Realized Gain/(Loss) | Value at October 31, 2010 | |||||||||||||||||||||
Albany International Corp. | 850,000 | 325,000 | (125,000 | ) | 1,050,000 | $ | 447,000 | $ | (1,743,030 | ) | $ | 21,420,000 | ||||||||||||||||
| $ | 447,000 | $ | (1,743,030 | ) | $ | 21,420,000 | ||||||||||||||||||||||
The Select Fund | ||||||||||||||||||||||||||||
Issuer Name | Share Balance at Nov. 1, 2009 | Additions | Reductions | Share Balance at October 31, 2010 | Dividend Income | Realized Gain/(Loss) | Value at October 31, 2010 | |||||||||||||||||||||
Albany International Corp. | 80,000 | 49,000 | (21,000 | ) | 108,000 | $ | 40,680 | $ | (177,289 | ) | $ | 2,203,200 | ||||||||||||||||
| $ | 40,680 | $ | (177,289 | ) | $ | 2,203,200 | ||||||||||||||||||||||
| (a) | Security is no longer an affiliated company at October 31, 2010. |
10. LINE OF CREDIT
The Tocqueville Fund, Opportunity Fund, Gold Fund, Delafield Fund, and Select Fund each have a revolving secured credit facility with U.S. Bank, the Trust’s custodian, in the amounts of $40,000,000, $3,000,000, $130,000,000, $40,000,000 and $9,500,000, respectively, for temporary emergency or extraordinary purposes, including the meeting of redemption requests that otherwise might require the untimely disposition of securities. The lines of credit have a one year term and are reviewed annually by the Board of Trustees. The current agreements for the Tocqueville Fund, Opportunity Fund and Gold Fund run through May 31, 2011. The agreements for the Delafield Fund and the Select Fund run through June 17, 2011. The interest rate as of October 31, 2010 was 2.75%. During the fiscal year ended October 31, 2010, the Tocqueville Fund’s maximum borrowing was $5,009,000 and average borrowing was $191,504 and the Opportunity Fund’s maximum borrowing was $934,000 and average borrowing was $15,885. This borrowing resulted in interest expenses of $4,730 and $142, respectively. These amounts are included in Other Expenses on the Funds’ Statement of Operations. The Gold Fund, the Delafield Fund, and the Select Fund did not use their lines of credit. None of the Funds had outstanding loan balances as of October 31, 2010.
| Annual Report | 63 |
The Tocqueville Trust
Report of Independent Registered Public Accounting Firm
To the Shareholders and Board of Trustees of
The Tocqueville Trust:
We have audited the accompanying statements of assets and liabilities of The Tocqueville Trust, including The Tocqueville Fund, The Tocqueville Opportunity Fund, The Tocqueville International Value Fund, The Tocqueville Gold Fund, The Delafield Fund, and The Select Fund (collectively, the “Funds”), including the schedules of investments as of October 31, 2010, and the related statements of operations for the year then ended, changes in net assets for each of the two years then ended, and the financial highlights for each of the five years then ended for The Tocqueville Fund, The Tocqueville Opportunity Fund, The Tocqueville International Value Fund, and The Tocqueville Gold Fund; the related statements of operations for the year then ended, changes in net assets and financial highlights for the year then ended and the period January 1, 2009 to October 31, 2009 for The Delafield Fund and The Select Fund. These financial statements and financial highlights are the responsibility of the Funds’ management. Our responsibility is to express an opinion on these financial statements based on our audits. The financial highlights for the four years in the period ended December 31, 2008 for The Delafield Fund was audited by other auditors. Those auditors expressed an unqualified opinion on those financial highlights in their report dated February 24, 2009. The financial highlights for the period ended December 31, 2008 for the Select Fund (whose inception date was September 28, 2009) was audited by other auditors. Those auditors expressed an unqualified opinion on those financial highlights in their report dated February 24, 2009.
We conducted our audits in accordance with the standards of the Public Company Accounting Oversight Board (United States). Those standards require that we plan and perform the audits to obtain reasonable assurance about whether the financial statements and financial highlights are free of material misstatement. The Funds are not required to have, nor were we engaged to perform, and audit of their internal control over financial reporting. Our audits included consideration of internal control over financial reporting as a basis for designing audit procedures that are appropriate in the circumstances, but not for the purpose of expressing an opinion on the effectiveness of the Funds’ internal control over financial reporting. Accordingly, we express no such opinion. An audit also includes examining, on test basis evidence supporting the amounts and disclosures in the financial statements and financial highlights, assessing the accounting principles used and significant estimates made by management, as well as evaluating the overall financial statement presentation. Our procedures included confirmation of securities owned as of October 31, 2010, by correspondence with custodian and brokers. We believe that our audits provide a reasonable basis for our opinion.
In our opinion, the financial statements and financial highlights referred to above present fairly, in all material respects, the financial position of each of the aforementioned Funds of The Tocqueville Trust as of October 31, 2010, and the results of their operations for the year then ended, the changes in net assets for each of the two years in the period ended, and the financial highlights for each of the five years in the period then ended for The Tocqueville Fund, The Tocqueville Opportunity Fund, The Tocqueville International Value Fund and The Tocqueville Gold Fund; the results of operations for the year then ended, changes in net assets and financial highlights for the year then ended and the period January 1, 2009 to October 31, 2009 for The Delafield Fund and The Select Fund, in conformity with accounting principles generally accepted in the United States of America.
/s/ GRANT THORNTON LLP
Chicago, Illinois
December 30, 2010
| 64 | October 31, 2010 |
ADDITIONAL INFORMATION (UNAUDITED)
1. ADDITIONAL DISCLOSURE REGARDING FUND TRUSTEES AND OFFICERS
Independent Trustees
Name, Age and Address | Position(s) Held with the Trust | Term of Office and Length of Time Served (1) | Principal Occupation During Past Five Years | # of Portfolios in Fund Complex Overseen By Trustee | Other Directorships Held by Trustee | |||||||
Guy A. Main (74) 40 W. 57th St., 19th Floor New York, NY 10019 | Trustee | Indefinite Term, Since 2000 | Retired. Formerly, Executive Vice President, Amwest Insurance Group, Inc. from April 1996 to January 2001; Chairman, President and Chief Executive Officer, Condor Services Inc. from April 1989 to April 1996. | 6 | Director, Amwest Insurance Group, Inc. from April 1996 to January 2001; Chairman, Association of California Insurance Companies from January 1996 to January 1998; Director, Condor Services Inc. from April 1989 to April 1996. | |||||||
Charles W. Caulkins (54) 40 W. 57th St., 19th Floor New York, NY 10019 | Trustee | Indefinite Term, Since 2003 | Marketing Manager, L.R. Global Partners from January 2008 to present; President, Arbor Marketing, Inc. from October 1994 to December 2007. | 6 | Director, Phoenix House from January 2001 to 2007; Director, Bridges to Community from July 2002 to 2006. | |||||||
James W. Gerard (49) 40 W. 57th St., 19th Floor New York, NY 10019 | Trustee | Indefinite Term, Since 2001 | Managing Director, North Sea Partners, January 2010 to present. Principal, Juniper Capital Group, LLC (formerly known as Argus Advisors International, LLC), from August 2003 to December 2009; Managing Director, The Chart Group from January 2001 to present; Managing Principal, Ironbound Partners from October 1998 to December 2000. | 6 | Director, American Overseas Memorial Day Association, 1988 to present; Trustee, Salisbury School, 2005 to present; Director, American Friends of Blerancourt, 1992-present; Director and Treasurer ASPCA, 1988 to 2008; | |||||||
| Annual Report | 65 |
Independent Trustees
Name, Age and Address | Position(s) Held with the Trust | Term of Office and Length of Time Served (1) | Principal Occupation During Past Five Years | # of Portfolios in Fund Complex Overseen By Trustee | Other Directorships Held by Trustee | |||||||
William F. Indoe (68) 40 W. 57th St., 19th Floor New York, NY 10019 | Trustee | Indefinite Term, Since 2006 | Senior Counsel, Sullivan & Cromwell LLP (attorneys-at-law) 1990-present. | 6 | Director, Rho Capital Partners, Inc. | |||||||
William J. Nolan III (63) 40 W. 57th St., 19th Floor New York, NY 10019 | Trustee | Indefinite Term, Since 2006 | Retired, Executive Vice President & Treasurer PaineWebber Inc. 1997-2001. | 6 | Trustee, Adirondock Museum, Blue Mt. Lake, NY 1996 to present (Treasurer, 2000 to present). | |||||||
Alexander Douglas (63) 40 W. 57th St., 19th Floor New York, NY 10019 | Trustee | Indefinite Term, Since 2010 | President, CEO and owner of Spaulding Law Printing, Inc. | 6 | None | |||||||
Interested Trustees (and Officers)*
Name, Age and Address | Position(s) Held with the Trust | Term of Office and Length of Time Served (1) | Principal Occupation During Past Five Years | # of Portfolios in Fund Complex Overseen By Trustee | Other Directorships Held by Trustee | |||||||
Francois D. Sicart (67) 40 W. 57th St., 19th Floor New York, NY 10019 | Chairman and Trustee | Indefinite Term, Since 1987 | Chairman, Tocqueville Management Corporation, the General Partner of Tocqueville Asset Management L.P. and Tocqueville Securities, L.P. from January 1990 to present; Chairman and Founder, Tocqueville Asset Management Corp. from December 1985 to January 1990; Vice Chairman of Tucker Anthony Management Corporation from 1981 to October 1986; Vice President (formerly general partner) among other positions with Tucker Anthony, Inc. from 1969 to January 1990. | 6 | Chairman and Director, Tocqueville Management Corporation, the General Partner of Tocqueville Asset Management L.P. and Tocqueville Securities, L.P. from January 1990 to present. | |||||||
| 66 | October 31, 2010 |
Interested Trustees (and Officers)*
Name, Age and Address | Position(s) Held with the Trust | Term of Office and Length of Time Served (1) | Principal Occupation During Past Five Years | # of Portfolios in Fund Complex Overseen By Trustee | Other Directorships Held by Trustee | |||||||
Robert W. Kleinschmidt (61) 40 W. 57th St., 19th Floor New York, NY 10019 | President and Trustee | Indefinite Term, Since 1991 | President, Chief Investment Officer and Director, Tocqueville Management Corporation, the General Partner of Tocqueville Asset Management L.P. and Tocqueville Securities, L.P. from January 1994 to present; and Managing Director from July 1991 to January 1994; Partner, David J. Greene & Co. from May 1978 to July 1991. | 6 | President and Director, Tocqueville Management Corporation, the General Partner of Tocqueville Asset Management L.P. and Tocqueville Securities, L.P. | |||||||
Cleo Kotis (34) 40 W. 57th St., 19th Floor New York, NY 10019 | Secretary | Indefinite Term, Since 2010 | Director of Operations, the Delafield Group of Tocqueville Asset Management L.P., 2009 to present; Vice President and Chief Operations Officer, the Delafield Fund, Inc. from 2005-2009; Vice President and Chief Operations Officer, Delafield Asset Management from 2005-2009; Vice President, Reich & Tang Asset Management, LLC from 2002-2009. | N/A | N/A | |||||||
John Cassidy (67) 40 W. 57th St., 19th Floor New York, NY 10019 | Treasurer | Indefinite Term, Since 2010 | Treasurer, Tocqueville Asset Management L.P., from May 2002 to present. | N/A | N/A | |||||||
Elizabeth Bosco (62) 40 W. 57th St., 19th Floor | Anti- Money Laundering Compliance Officer | Indefinite Term, Since 2009 | Chief Compliance Officer (January 2009-present), Tocqueville Securities L.P.; Compliance Officer (January 1997-January 2009), Tocqueville Securities L.P. and Tocqueville Asset Management, L.P. | N/A | N/A | |||||||
| * | “Interested person” of the Trust is defined in the 1940 Act. Mr. Sicart and Mr. Kleinschmidt are considered “interested persons” because of their affiliation with the Adviser. |
| Annual Report | 67 |
Interested Trustees (and Officers)*
Name, Age and Address | Position(s) Held with the Trust | Term of Office and Length of Time Served (1) | Principal Occupation During Past Five Years | # of Portfolios in Fund Complex Overseen By Trustee | Other Directorships Held by Trustee | |||||||
Thomas Pandick (63) 40 W. 57th St., 19th Floor New York, NY 10019 | Chief Compliance Officer | Indefinite Term, Since 2004 | Chief Compliance Officer (October 2004-present), Tocqueville Asset Management L.P.; General Counsel (January-October 2004), Tocqueville Asset Management L.P. | N/A | N/A | |||||||
| 1 | Each Trustee will hold office for an indefinite term until the earliest of (i) the next meeting of shareholders, if any, called for the purpose of considering the election or re-election of such Trustee and until the election and qualification of his or her successor, if any, elected at such meeting, or (ii) the date a Trustee resigns or retires, or a Trustee is removed by the Board of Trustees or shareholders, in accordance with the Trust’s By-Laws, as amended, and Agreement and Declaration of Trust, as amended. Each officer will hold office for an indefinite term until the date he or she resigns or retires or until his or her successor is elected and qualified. |
2. INVESTMENT ADVISORY AGREEMENT DISCLOSURE
In determining whether to approve the continuance of the Investment Advisory Agreements and the Administration Agreement, the Trustees, including the Independent Trustees, considered the following information:
1) The nature, extent and quality of services provided by the Adviser.
The Trustees reviewed in detail the nature and extent of the services provided by the Adviser under the terms of the Investment Advisory Agreements and the quality of those services provided to The Tocqueville Fund, The Tocqueville Opportunity Fund, The Tocqueville International Value Fund, The Tocqueville Gold Fund, The Delafield Fund and The Select Fund (the “Funds”) over the past year. The Trustees noted that the services include: managing the investment and reinvestment of the Funds’ assets; supervising and managing all aspects of the Funds’ operations; and providing the Board on a regular basis with financial reports and analyses on the Funds’ operations and the operations of comparable investment companies. The Trustees also observed that the Adviser provides various administrative services to the Funds pursuant to the terms of a separate Administration Agreement and considered the nature, extent and quality of services provided under that agreement as well. The Trustees evaluated these factors based on their direct experience with the Adviser and in consultation with counsel. The Trustees concluded that the nature and extent of the services provided under the Investment Advisory Agreements were reasonable and appropriate in relation to the advisory fee, that the level of services provided by the Adviser to the Funds had not diminished over the past year and that the quality of services continues to be high. The Trustees reviewed the personnel responsible for providing advisory services to the Funds and concluded, based on their experience and interaction with the Adviser, that (i) the Adviser was able to retain quality portfolio managers and other personnel; (ii) the Adviser exhibited a high level of diligence and attention to detail in carrying out its advisory responsibilities under the Investment Advisory Agreements for the Funds; (iii) the Adviser was responsive to requests of the Trustees; and (iv) the Adviser had kept the Trustees apprised of developments relating to the
| 68 | October 31, 2010 |
Funds and the industry in general. The Trustees also focused on the Adviser’s reputation and long-standing relationship with the Trust. The Trustees also noted the high quality of services provided by the Adviser under the Administration Agreement.
In connection with its assessment of the performance of the Adviser, the Trustees reviewed the Adviser’s financial statements and considered the Adviser’s financial condition and whether it has the resources necessary to continue to carry out its obligations under the Investment Advisory Agreements and the Administration Agreement. The Trustees concluded that the Adviser has the financial resources necessary to continue to perform its obligations under the Investment Advisory Agreements and the Administration Agreement and to continue to provide the high quality services that it has provided to the Funds to date.
2) The performance of the Funds and the Adviser.
The Trustees reviewed the investment performance of the Funds, both on an absolute basis and as compared to a peer group for each respective Fund for the one-year, three-year, five-year and ten-year periods, as applicable, ended July 31, 2010. The peer groups were comprised of other funds that had similar investment objectives and sales load structures, as determined by Lipper: The Lipper Multi-Cap Value Funds peer group, with average net assets between $250 million and $1 billion, for The Tocqueville Fund; the Lipper Small-Cap Core Funds peer group, with average net assets between $22 million and $26 million, for The Tocqueville Opportunity Fund; the Lipper International Small/Mid Cap Value Funds peer group, with average net assets between $50 million and $200 million, for The Tocqueville International Value Fund; the Lipper Precious Metals Funds peer group, with average net assets above $150 million, for The Tocqueville Gold Fund; the Lipper Mid-Cap Value Funds peer group, with average net assets above $250 million, for The Delafield Fund; and the Lipper Mid-Cap Value Funds, with average net assets between $15 million and $40 million, for The Select Fund (the “Performance Peer Groups”). The Trustees considered that the performance information for The Delafield Fund and The Select Fund includes the performance information of their respective predecessor funds, which had different investment advisers, but the Trustees considered this information since these Funds have substantially the same portfolio management team.
The Trustees also compared each Fund’s investment performance against its benchmark market indices: the S&P 500 Index for The Tocqueville Fund; the Russell 2000 Index for The Tocqueville Opportunity Fund; the Morgan Stanley EAFE Index for The Tocqueville International Value Fund; the S&P 500 Index and the Philadelphia Stock Exchange Gold & Silver Index for The Tocqueville Gold Fund; the S&P 500 Index and the Russell 2000 Index for The Delafield Fund; and the Russell 2500 Index and the Russell 2000 Index for The Select Fund (the “Indices”) for the one-year, three-year, five-year and ten-year periods ended July 31, 2010 for all the Funds (except for The Select Fund which was incepted in 2008 and therefore only has one-year performance). The Trustees considered the above information as helpful in their assessment of whether the Adviser was obtaining for the Funds’ shareholders the performance that was available in the marketplace given each Fund’s investment objectives, policies, strategies, limitations and restrictions. The Trustees concluded that the performance of the Funds against their respective Performance Peer Groups was satisfactory. In particular, the Trustees noted that The Tocqueville Fund had outperformed as compared to its Index for all periods, except the one-year period, where it underperformed its Index, and outperformed or performed in line with the median of its Performance Peer Group for all periods. The Trustees noted that with respect to The Tocqueville Opportunity Fund that despite underperforming its Index for all time periods and the median of its Performance Peer Group for the one-year and ten-year periods, the Fund had outperformed the median of its Performance Peer Group for the five-year period and performed in line with the median of its Performance Peer Group for its three-year period. The Trustees further noted that
| Annual Report | 69 |
The Tocqueville International Value Fund outperformed its Index for all time periods and outperformed the median of its Performance Peer Group for the three-year and ten-year periods and underperformed the median of its Performance Peer Group for the one-year and five-year periods. The Trustees noted that The Tocqueville Gold Fund outperformed its Indices and the median of its Performance Peer Group for all periods. The Trustees noted that The Delafield Fund outperformed its Indices and the median of its Performance Peer Group for all time periods. The Trustees noted that The Select Fund outperformed its Indices and the median of its Performance Peer Group for the one-year period.
3) The cost of the advisory services and the profits to the Adviser from the relationship with the Trust.
In connection with the Trustee’s consideration of the level of the advisory fees, the Trustees considered a number of factors. The Trustees compared the level of the advisory fees for each Fund against the advisory fees charged by funds in their respective Performance Peer Groups and a larger universe of funds that included their Performance Peer Groups: the Lipper Multi-Cap Value Funds peer group, with average net assets between $250 million and $1 billion, for The Tocqueville Fund; the Lipper Small-Cap Core Funds peer group, with average net assets between $22 and $26 million, for The Tocqueville Opportunity Fund; the Lipper International Small/Mid Cap Value and Growth Funds peer group, with average net assets between $50 million and $200 million, for The Tocqueville International Value Fund; the Lipper Gold Oriented Funds peer group, with average assets greater than $150 million, for The Tocqueville Gold Fund; the Lipper Mid-Cap Value Funds peer group, with average net assets greater than $250 million, for The Delafield Fund; and the Lipper Multi-Cap Value Funds peer group, with average net assets between $15 million and $40 million, for The Select Fund (the “Expense Peer Groups” and together with the Performance Peer Groups, the “Peer Groups”). The Adviser noted that it does not advise or sub-advise other funds with an investment policy similar to the Funds’ or other types of accounts, such as institutional and pension accounts, with similar investment policies to the Funds’. The Trustees considered comparative total fund expenses of the Funds and the Peer Groups. The Trustees used this comparative fee information and total expense data as a guide to help assess the reasonableness of each Fund’s advisory fee, although they acknowledged that it was difficult to make precise comparisons with other funds since the exact nature of services provided under each Peer Group fund agreement is often not apparent. The Trustees also viewed the Peer Group fee information as a whole as useful in assessing whether the Adviser was providing services at a cost that was competitive with other, similar funds.
The Trustees noted that the contract rate advisory fee and administration fee for each of the Funds were reasonable, despite the contract advisory fee rate being above average for the Funds and the administration fee being above average for The Tocqueville International Value Fund and The Tocqueville Gold Fund, when compared to their respective Expense Peer Groups. The Board further observed that the total expense ratios of the Funds were also reasonable. The Board noted that the total expense ratio for The Tocqueville Fund was above average, when compared to its respective Expense Peer Groups and that the total expense ratio for The Tocqueville Opportunity Fund, The Tocqueville International Value Fund, The Tocqueville Gold Fund, The Delafield Fund and The Select Fund were below average, when compared to their respective Expense Peer Groups. The Board also noted that The Tocqueville Fund operates pursuant to an Expense Limitation Agreement whereby the Adviser has agreed to waive a portion of its fee necessary to limit the Fund’s total operating expenses to the level set forth in the Fund’s prospectus.
The Trustees also considered the profitability to the Adviser and its affiliate arising out of its relationship with the Trust. In this regard, the Trustees reviewed profitability data relating to the Adviser for the year October 31, 2009. The Trustees considered revenues received by the Adviser under the Investment Advisory Agreements and the Administration
| 70 | October 31, 2010 |
Agreement as well as revenues received by the Adviser’s affiliate, the Distributor, under the 12b-1 plans and Related Agreements and commissions received for effecting portfolio transactions. The Trustees also received and reviewed the Adviser’s financial statements and the Adviser provided an oral update on its profitability numbers since October 31, 2009. The Trustees concluded that the profitability of the Funds to the Adviser was not excessive.
4) The extent to which economies of scale will be realized as the Funds grow and whether fee levels reflect those economies of scale.
With respect to the Trustees’ consideration of economies of scale, the Trustees discussed with the Adviser whether economies of scale would be realized by it in its management of a Fund at higher asset levels. The Trustees also reviewed the Peer Group data to assess whether the Peer Group funds had advisory fee breakpoints and, if so, at what asset levels. The Trustees noted that the Funds, except for The Select Fund, currently have advisory fee breakpoints and that they were satisfied that the current breakpoints were appropriate when compared with each Fund’s respective Peer Group. The Trustees considered that breakpoints are not necessary at this time for The Select Fund, given the small size of The Select Fund. In the event there was significant asset growth in the future in a Fund, the Trustee’s determined to reassess whether the advisory fees, including the current breakpoint structure, appropriately took into account any economies of scale that had been realized as a result of that growth.
5) Other Factors.
The Trustees also discussed the Adviser’s practices regarding the selection and compensation of brokers and dealers that execute portfolio transactions for the Funds and the brokers’ and dealers’ provision of brokerage and research services to the Adviser. The Trustees further discussed the potential benefits the Adviser derived from the Funds’ soft dollar arrangements, whereby brokers provide research to the Funds or the Adviser in return for allocating fund brokerage, and other investment data concerning soft dollars. The Board also discussed the Adviser’s use of an affiliated broker to effect portfolio transactions, noting that in addition to paying a competitive rate on commissions, the Adviser believed the Funds received better execution on trades.
Based on a consideration of all these factors in their totality, the Trustees, including all of the Independent Trustees, determined that the Funds’ advisory fees and administration fees were fair and reasonable with respect to the quality of services that the Adviser provides and in light of the other factors described above that the Trustees deemed relevant. The Trustees based their decision on evaluations of all these factors as a whole and did not consider any one factor as all-important or controlling. The Independent Trustees were also assisted by the advice of independent counsel in making this determination.
3. PROXY VOTING POLICIES AND PROCEDURES
A description of the policies and procedures that The Tocqueville Trust uses to determine how to vote proxies relating to portfolio securities is available without charge upon request by calling 1-800-355-7307. Information regarding how The Tocqueville Trust voted proxies relating to portfolio securities during the most recent 12-month period ended June 30 is available by calling 1-800-355-7307 and it is also available on the SEC’s web site at http://www.sec.gov.
4. SHAREHOLDER REPORTS AND QUARTERLY PORTFOLIO DISCLOSURE
The Tocqueville Trust is required to file its complete schedule of portfolio holdings with the SEC for its first and third fiscal quarters on Form N-Q. The Trust’s Form N-Q will be available without charge, upon request on the SEC’s
| Annual Report | 71 |
website (http://www.sec.gov) and may be available by calling 1-800-697-3863. You can also obtain copies of Form N-Q by (i) visiting the SEC’s Public Reference Room in Washington, DC (information on the operation of the Public Reference Room may be obtained by calling 1-202-551-8090); (ii) sending your request and a duplicating fee to the SEC’s Public Reference Room, Washington, DC 20549-1520; or (iii) sending your request electronically to publicinfosec.gov. Quarterly portfolio holdings are also available on the website of The Tocqueville Funds, www.tocquevillefunds.com.
5. SHAREHOLDER NOTIFICATION OF FEDERAL TAX STATUS
For the fiscal period ended October 31, 2010, certain dividends paid by the Funds may be subject to a maximum tax rate of 15%, as provided for by the Jobs and Growth Tax Relief Reconciliation Act of 2003. The percentage of dividends declared from ordinary income designated as qualified dividend income was as follows:
Tocqueville Fund | 100.00 | % | ||
Opportunity Fund | 0.00 | % | ||
International Value Fund | 100.00 | % | ||
Gold Fund | 0.00 | % | ||
The Delafield Fund | 0.00 | % | ||
The Select Fund | 97.99 | % |
For corporate shareholders, the percent of ordinary income distributions qualifying for the corporate dividends received deduction for the fiscal period ended October 31, 2010 was as follows:
Tocqueville Fund | 100.00 | % | ||
Opportunity Fund | 0.00 | % | ||
International Value Fund | 1.50 | % | ||
Gold Fund | 0.00 | % | ||
The Delafield Fund | 0.00 | % | ||
The Select Fund | 96.61 | % |
For the period ended October 31, 2010, the funds designate the following percent of ordinary distributions paid as interest-related dividends under the Internal Revenue Code Section 871(k)(1)(c):
Tocqueville Fund | 3.04 | % | ||
Opportunity Fund | 0.00 | % | ||
International Value Fund | 0.99 | % | ||
Gold Fund | 0.00 | % | ||
The Delafield Fund | 0.00 | % | ||
The Select Fund | 0.27 | % |
| 72 | October 31, 2010 |
The percentage of taxable ordinary income distributions that are designated as short-term capital gain distributions under Internal Revenue Section 871(k)(2)(C) for each Fund were as follows.
Tocqueville Fund | 0.00 | % | ||
Opportunity Fund | 0.00 | % | ||
International Value Fund | 0.00 | % | ||
Gold Fund | 0.00 | % | ||
The Delafield Fund | 0.00 | % | ||
The Select Fund | 100.00 | % |
6. FOREIGN TAX CREDIT
For the year ended October 31, 2010, the Tocqueville International Value Fund earned foreign source income and paid foreign taxes which they intend to pass through to their shareholders pursuant to Section 853 of the Internal Revenue Code as follows:
Country | Gross Dividend Per Share | Taxes Withheld Per Share | ||||||
Australia | $ | 0.00281 | $ | 0.00000 | ||||
Belgium | 0.01839 | 0.00276 | ||||||
Brazil | 0.01009 | 0.00185 | ||||||
Finland | 0.00669 | 0.00105 | ||||||
France | 0.05554 | 0.01163 | ||||||
Germany | 0.00378 | 0.00113 | ||||||
Hong Kong | 0.01192 | 0.00000 | ||||||
Indonesia | 0.00596 | 0.00118 | ||||||
Ireland | 0.01033 | 0.00119 | ||||||
Japan | 0.05112 | 0.00374 | ||||||
Jersey | 0.00702 | 0.00050 | ||||||
Mexico | 0.00242 | 0.00000 | ||||||
Netherlands | 0.01873 | 0.00257 | ||||||
Netherlands Antilles | 0.00288 | 0.00000 | ||||||
Singapore | 0.00292 | 0.00000 | ||||||
South Africa | 0.00064 | 0.00000 | ||||||
Spain | 0.00631 | 0.00109 | ||||||
Switzerland | 0.01137 | 0.00171 | ||||||
Thailand | 0.00866 | 0.00087 | ||||||
United Kingdom | 0.02122 | 0.00000 | ||||||
| $ | 0.25880 | $ | 0.03127 | |||||
| Annual Report | 73 |
Investment Adviser
Tocqueville Asset Management L.P.
40 W. 57th St., 19th Floor
New York, NY 10019
(212) 698-0800
www.tocqueville.com
Distributor
Tocqueville Securities, L.P.
40 W. 57th St., 19th Floor
New York, NY 10019
(212) 698-0800
Shareholders’ Servicing and Transfer Agent
U.S. Bancorp Fund Services, LLC
P.O. Box 701
Milwaukee, WI 53201-0701
(800) 697-3863
Custodian
U.S. Bank, N.A.
Custody Operations
1555 River Center Drive, Suite 302
Milwaukee, WI 53212
Board of Trustees
François D. Sicart—Chairman
Charles W. Caulkins
Alexander Douglas
James W. Gerard
William F. Indoe
Robert W. Kleinschmidt
Guy A. Main
William J. Nolan III

Tocqueville Funds
c/o US Bancorp Fund Services, LLC
P.O. Box 701
Milwaukee, WI 53201-0701
www.tocquevillefunds.com
TQRPANNU 10
| Item 2. | Code of Ethics. |
The registrant has adopted a code of ethics that applies to the registrant’s Principal Executive Officer and Principal Financial Officer. The registrant has not made any amendments to its code of ethics during the period covered by this report. The registrant has not granted any waivers from any provisions of the code of ethics during the period covered by this report.
Filed herewith.
| Item 3. | Audit Committee Financial Expert. |
The registrant’s Board of Trustees has determined that there are two audit committee financial experts serving on its audit committee, James Gerard and Guy Main, who are “independent” as defined in Item 3 of Form N-CSR.
| Item 4. | Principal Accountant Fees and Services. |
| FYE 10/31/10 | FYE 10/31/09 | |||||||
4(a) Audit Fees | $ | 136,500 | $ | 130,000 | ||||
4(b) Audit Related Fees | $ | 3,000 | $ | 0 | ||||
4(c) Tax Fees | $ | 18,900 | $ | 19,000 | ||||
4(d) All Other Fees | $ | 0 | $ | 0 | ||||
“Tax Services” refer to professional services rendered by the principal accountant for tax compliance, tax advice, and tax planning.
4(e)(1) The registrant’s audit committee is required to pre-approve (i) all audit and non-audit services performed by the independent registered public accounting firm (“accountants”) for the registrant and (ii) any non-audit services performed by the accountants for the registrant’s investment adviser and control persons of the adviser that provide ongoing services to the registrant (“Service Affiliates”) if the services relate directly to the operations and financial reporting of the registrant. The audit committee has not presently established any pre-approval policies and procedures that permit the pre-approval of the above services other than by the full audit committee. Certain de minimis exceptions are allowed for non-audit services in accordance with Rule 2-01(c)(7)(i)(C) of Regulation S-X as set forth in the registrant’s audit committee charter.
4(e)(2) None.
4(f) Not applicable.
4(g) The amount of non-audit fees that were billed by the registrant’s accountant for services rendered to (i) the registrant, and (ii) the registrant’s investment adviser and any control person of the adviser that provides ongoing services to the registrant for the fiscal year ended
October 31, 2010 were $18,900 and $0, respectively. The amount of non-audit fees that were billed by the registrant’s accountant for services rendered to (i) the registrant, and (ii) the registrant’s investment adviser and any control person of the adviser that provides ongoing services to the registrant for the fiscal year ended October 31, 2009 were $19,000 and $0, respectively.
4(h) Not applicable.
| Item 5. | Audit Committee of Listed Registrants. |
Not applicable to registrants who are not listed issuers (as defined in Rule 10A-3 under the Securities Exchange Act of 1934).
| Item 6. | Schedule of Investments. |
Schedule of Investments is included as part of the report to shareholders filed under Item 1 of this Form.
| Item 7. | Disclosure of Proxy Voting Policies and Procedures for Closed-End Management Investment Companies. |
Not applicable to open-end investment companies.
| Item 8. | Portfolio Managers of Closed-End Management Investment Companies. |
Not applicable to open-end investment companies.
| Item 9. | Purchases of Equity Securities by Closed-End Management Investment Company and Affiliated Purchasers. |
Not applicable to open-end investment companies.
| Item 10. | Submission of Matters to a Vote of Security Holders. |
There were no material changes to the procedures by which shareholders may recommend nominees to the registrant’s Board of Trustees that were implemented after the registrant last provided disclosure in response to the requirements of Item 407(c)(2)(iv) of Regulation S-K (as required by Item 22(b)(15) of Schedule 14A), or this Item 10.
| Item 11. | Controls and Procedures. |
| (a) | The registrant’s Principal Executive Officer and Principal Financial Officer have evaluated the design and operation of the registrant’s disclosure controls and procedures within 90 days of the filing and have concluded that the registrant’s disclosure controls and procedures were effective in ensuring that information required to be disclosed by the registrant in this Form N-CSR was recorded, processed, summarized and reported on a timely basis. |
2
| (b) | There were no changes in the registrant’s internal controls over financial reporting that occurred during the period covered by this report that have materially affected, or are reasonably likely to materially affect, the registrant’s internal control over financial reporting. |
| Item 12. | Exhibits. |
��
| (a) | (1) Any code of ethics or amendment thereto, that is subject of the disclosure required by Item 2, to the extent that the registrant intends to satisfy Item 2 requirements through filing an exhibit. Filed herewith. |
(2) Certifications pursuant to Section 302 of the Sarbanes-Oxley Act of 2002. Filed herewith.
(3) Not applicable to open-end investment companies.
| (b) | Certifications of Principal Executive Officer and Principal Financial Officer, under Section 906 of the Sarbanes-Oxley Act of 2002 and 18 U.S.C. § 1350. Filed herewith. |
3
SIGNATURES
Pursuant to the requirements of the Securities Exchange Act of 1934 and the Investment Company Act of 1940, the registrant has duly caused this report to be signed on its behalf by the undersigned, thereunto duly authorized.
| (Registrant) The Tocqueville Trust | ||
| By (Signature and Title)* | /S/ ROBERT W. KLEINSCHMITDT | |
| Robert W. Kleinschmidt, President | ||
| Date 1/4/2011 | ||
Pursuant to the requirements of the Securities Exchange Act of 1934 and the Investment Company Act of 1940, this report has been signed below by the following persons on behalf of the registrant and in the capacities and on the dates indicated.
| By (Signature and Title)* | /S/ ROBERT W. KLEINSCHMIDT | |
| Robert W. Kleinschmidt, President | ||
| Date 1/4/2011 | ||
| By (Signature and Title)* | /S/ JOHN CASSIDY | |
| John Cassidy, Treasurer | ||
| Date 1/4/2011 | ||
| * | Print the name and title of each signing officer under his or her signature. |