UNITED STATES
SECURITIES AND EXCHANGE COMMISSION
Washington, D.C. 20549
FORM N-CSR
CERTIFIED SHAREHOLDER REPORT OF REGISTERED
MANAGEMENT INVESTMENT COMPANIES
Investment Company Act file number 811-4840
The Tocqueville Trust
(Exact name of registrant as specified in charter)
The Tocqueville Trust
40 W. 57th St., 19th Floor
New York, NY 10019
(Address of principal executive offices) (Zip code)
Robert W. Kleinschmidt
The Tocqueville Trust
40 W. 57th St., 19th Floor
New York, NY 10019
(Name and address of agent for service)
(212) 698-0800
Registrant’s telephone number, including area code
Date of fiscal year end: October 31
Date of reporting period: October 31, 2016
Item 1. Reports to Stockholders.

The Tocqueville Trust
Mutual Funds
Annual Report
October 31, 2016
The Tocqueville Fund
The Tocqueville Opportunity Fund
The Tocqueville International Value Fund
The Tocqueville Gold Fund
The Delafield Fund
The Tocqueville Select Fund

This report is not authorized for distribution to prospective investors unless preceded or accompanied by a currently effective prospectus of The Tocqueville Trust. Please call 1-800-697-FUND (3863) for a free prospectus. Read it carefully before you invest.
You are invited to visit our website @ www.tocqueville.com/mutual-funds
Chairman’s Letter
Dear Fellow Shareholder,
Now that the elections are mercifully behind us, the markets should be able to focus on fundamentals, which are, as of this writing, neither terribly positive nor terribly negative. Over the next 12 months, we would expect, so long as U.S. growth continues, that interest rates will rise gradually at first, but then, possibly, more rapidly, in response to greater levels of inflation than what we have witnessed for the past several years. This will provide something of a headwind to stock valuations, particularly growth-oriented names that depend, in part, upon expanding price-earnings ratios. So long as economic growth continues, or accelerates modestly, we would expect traditional value names, which have long underperformed the growth sector until just recently, to do better.
The key to stock price performance going forward will be economic growth. The Trump administration is likely to be far more growth-oriented and business-friendly than was the case in the Obama era. So, we expect this to provide a tailwind for the markets. The upside to the tepid growth of the past nine years is that few excesses have been built up in the economy. Indeed, the one identifiable excess, and the one obvious bubble, is sovereign debt. This situation has persisted for some time, but there is reason to believe that the day of reckoning may be here sooner than the markets seem to think. This is a very obvious headwind.
Very moderate commercial-loan demand and quiescent inflation statistics have kept bond rates at unprecedented lows, even negative, levels. It is simply wishful thinking to suppose that this can continue for very much longer. (And, indeed, since the Trump election, rates have begun moving up.) Higher rates and higher deficits, without very robust economic growth, is a recipe for fiscal disaster. So it seems obvious to us that the Trump administration will have no choice but to pursue an aggressive growth agenda. How successful they will be is another question, but at least until budgets get completely out of control, we would expect an expansionary bias to government policy that should have a salutary impact on the global economy.
Our portfolios are generally positioned to participate in this environment, should it come to pass; but, as we are bottom-up stock pickers, rather than top-down managers, our stock selection is not dependent upon this scenario unfolding. Rather, we focus on companies of good quality that are selling below what we believe to be their intrinsic value. We will look at companies in any sector or industry. Value investors need to search for value wherever it can be found, not necessarily where we would like it to be.
The past several years have been difficult ones for active managers, and beating the benchmarks has been a formidable challenge that very few managers have achieved. For any number of reasons, we believe that active management will have a recovery over the course of the next several years and we look forward to participating in that revival.
Sincerely,

Robert W. Kleinschmidt
Chairman
The Tocqueville Fund
Dear Fellow Shareholder,
For the 12 months ended October 31, 2016, the Tocqueville Fund gained 4.6%, compared with 4.5% for the S&P 500 Index, 4.2% for the Russell 3000.
The period running up to the quadrennial U.S. elections was a turbulent one, with major swings, positive and negative, reflecting changing expectations on both the political and economic scenes. A steep sell-off early in the 2016 calendar year was followed by an equally steep rally in the early spring. Another sell-off in June was followed by a July rally, and then a two-month period of relative calm. Finally, yet another sell-off at the end of the reporting period underscored the volatility of U.S. markets, which seemed to move in an inverse direction to the prospects of GOP nominee Donald Trump.
At the end of October, however, the broader market was not much changed from where it stood a year earlier, with most of the return in the index due to dividend payments. Utilities and consumer staples were the best performing sectors of the broader market, as investors were attracted to stocks with strong dividend yields. Our U.S. results were in line with or modestly better than broader market indices like the S&P 500 and the Russell 3000, due to strong performance in technology names like Applied Materials—by far the single biggest contributor to 12-month results—as well as Microsoft and QUALCOMM; in digital media, especially Facebook and Amazon; in the metals, mining and material sectors Alcoa, BHP, DuPont and Caterpillar contributed to results, as did XME, a metals and mining ETF that was purchased earlier in the year.
Offsetting our gains, in part, was the extreme weakness in the healthcare sector, particularly biotech names such as PTC Therapeutics, Omeros and Ionis Pharmaceuticals, as well as Alkermes. The profound weakness in healthcare names followed a very strong previous year, but also reflected growing concern over pricing due to real and anticipated political pressure. Also detracting from results were energy companies like Energen, Frank’s and Cameco, a uranium producer, although Exxon Mobile, Noble Energy and Schlumberger largely offset these losses. Transportation related companies Ford, Boeing and Delta Airlines hurt results, as did financials, M&T Bank, Lazard and the XL Group.
We initiated or added to a variety of domestic positions throughout the year, during periods of market uncertainty or when opportunities presented themselves. Positions were sold or reduced when valuation objectives were achieved, better ideas arose, or circumstances changed that influenced our investment thesis. Overall, portfolio turnover during the past year was less than 25% which is consistent with our long-term approach.
Abbott Labs was one of the largest purchases during the year. Abbott has transformed itself into a medical-device company with generics exposure in the emerging markets. Its shares had come under pressure due to concerns over recent acquisitions and
the poor sentiment for the healthcare sector. Abbott’s defensive business model, highly regarded management team, and a long track record of generating shareholder returns make it attractive at its price, in our view.
Another large purchase was Macy’s, which has been suffering with much of the retail industry as consumer tastes and shopping habits change and the threat from Amazon looms large. However, our view is that Macy’s real estate, particularly its flagship Herald Square location, was significantly undervalued in the then-current stock price, and that investors weren’t giving them credit for any stabilization, much less improvement, in the retail business.
We also purchased Walt Disney, which has an enviable list of high-quality brands (Disney, Marvel, Star Wars, ESPN, etc.) that it monetizes across its business segments (Media Networks, Studio, Consumer, and Theme Parks). Disney shares have been under pressure as concerns about technological changes across the media landscape and challenges to its cable networks took hold of investor sentiment. In our view, while there is clearly some risk to the current model, the positives outweigh those concerns, and the stock was still quite attractive.
Lazard Ltd., the investment banking and asset-management firm, is a name we have owned for several years but were able to add to our position during the downdraft in the markets caused by the Brexit surprise. Investors were concerned that economic and political uncertainty would put a damper on merger activity, which represents about half of Lazard’s business. However, the other half of the business is asset management, which has proven resilient and “sticky” in the face of volatile markets. The shares seemed to be trading at close to a worst-case scenario, but with an unlevered balance sheet and healthy dividend, they were available at a sizeable discount.
We also purchased Johnson Controls, which was undergoing a transformational merger and spin-off with Tyco. The result has been the creation of an integrated building-efficiency, fire, and security business; much of the automotive-related operations have been kept separate. The complexity of the transaction and investors’ fears about a peak in the auto cycle created the opportunity to purchase a leading and highly cash-generative manufacturer at a valuation that met our criteria.
We began buying shares in Diebold, a provider of hardware and software to the banking and retail industries. Its shares were out of favor as a result of concerns about its merger with Wincor Nixdorf, as well as the health and capital-spending patterns of its target markets. Our view is that the synergy opportunities from the merger are significant and, following what will likely be a heavy year of cash expenditures in 2017 related to restructuring efforts, the combined company is poised to generate substantial free cash flow thereafter. We have confidence that management, which is doing some heavy insider buying, is more than capable of successfully integrating the two companies; and we believe that the shares, currently trading at less than seven times our pro forma 2017 EBITDA estimate, are undervalued.
We also purchased or added to our existing position in the aforementioned ETF, Alcoa, Qualcomm, Caesar Stone, H&R Block, Biogen, Snap On, Inc., Alkermes, Cameco, IAC/Interactive, PTC Therapeutics, BHP Billiton.
Our largest sale during the reporting period was EMC Corp., which was the recipient of a takeover offer from Dell. ADT was also sold in response to a takeover offer from private-equity firm, Apollo Global Management.
Another significant sale was Express Scripts. This was somewhat of a change of heart, though not a costly one. A closer examination of its business model suggested to us that the company was more vulnerable from a political/regulatory standpoint than we had originally believed, despite its attractive valuation and return characteristics.
Amazon Inc., Facebook, and Applied Materials represented some of the better ideas of the past year and were reduced as they approached our valuation objectives. Ionis Pharmaceuticals was reduced initially as it approached our valuation objective, and again later, at a lower price, as we reduced our risk when there was concern about safety of its platform product. Alphabet, the parent of Google was reduced, based upon price, as was Target, Campbell Soups, and Pitney Bowes. A number of other positions were trimmed to accommodate fund redemptions.
We remain committed to our goals of capital preservation and the generation of positive absolute returns regardless of the market climate. As ever, we thank you for your continued loyalty and support of the Tocqueville Fund.
Sincerely,
Robert W. Kleinschmidt
Portfolio Manager
The Tocqueville Fund
(Unaudited)
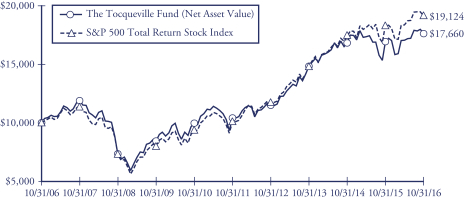
This chart assumes an initial gross investment of $10,000 made on 10/31/06. Returns shown do not reflect the deduction of taxes that a shareholder would pay on fund distributions or the redemption of fund shares. Performance reflects fee waivers in effect. In the absence of fee waivers, total return would be reduced. Returns shown include the reinvestment of all dividends and other distributions. Past performance is not predictive of future performance. Investment return and principal value will fluctuate so that your shares, when redeemed, may be worth more or less than their original cost.
The Standard & Poor’s 500 Total Return Stock Index (S&P 500) is a capital-weighted index, representing the aggregate market value of the common equity of 500 stocks primarily traded on the New York Stock Exchange. Returns assume the reinvestment of all dividends.
AVERAGE ANNUAL RATE OF RETURN (%)
FOR YEARS ENDED OCTOBER 31, 2016
| | | | | | | | | | | | | | | | |
| | | 1 Year | | | 3 Year | | | 5 Year | | | 10 Year | |
The Tocqueville Fund | | | 4.61% | | | | 6.04% | | | | 11.12% | | | | 5.85% | |
Standard & Poor’s 500 Total Return Stock Index | | | 4.51% | | | | 8.84% | | | | 13.57% | | | | 6.70% | |
The Tocqueville Opportunity Fund
Dear Fellow Shareholder,
We are pleased to provide this investment overview for the 2016 fiscal year for the Opportunity Fund. During the fiscal year ended October 31, 2016, the Fund declined (10.6%) and underperformed its SMID cap growth benchmark which also declined. During a period over which small cap growth issues were significantly out of favor, the Russell 2000 Growth Index which tracks the performance of small cap growth stocks also ended the period in negative territory. The measuring dates for the fiscal year bookended a particularly difficult and volatile time period for the Fund, and the price actually peaked less than one month into the new fiscal on November 25, 2015. As we wrote in the semi-annual letter, the subsequent decline in the Fund was the worst over the past six years and it exceeded the magnitude of the 2011 correction which was caused by fears of financial, political and currency instability within the European Union. The deep correction finally ended in early February 2016 and we believe that it stemmed from heightened macroeconomic fears related to a number of risks: Chinese currency devaluation, U.S. dollar strength, EU bank default concerns, oil price collapse, growth slowdown, negative interest rates, Fed tightening, and political banter around increased regulation. A very toxic mix!
Since the bottom in early February 2016, the Fund gained +25.26% through the period’s end. And although the Fund had risen solidly back into positive territory by late September, election related sentiment overwhelmed good quarterly earnings reports which led to yet another correction into the fiscal year end. To write that 2016 has been a challenging period would be an understatement—the volatility has been unprecedented. From the February low, the Fund cycled through price moves of +25% (4/21/16), (7%) (5/6/16), +13% (6/8/16), (13%) (6/27/16, Brexit), +23% (9/28/16), and (11%) (10/27/16, election). We believe markets entered a period of heightened sensitivity to macro (currency, interest rate, policy, trade) and political risks during the late Spring 2015 which has governed much of the market action in the small cap growth arena for at least the past fifteen months. Just as importantly, market risk has outweighed and camouflaged the solid execution and fundamental investment opportunity of many of the Fund’s investments as investors appear to be preoccupied with “the forests and not the trees”.
We believe that the intense and persistent volatility obscures an ongoing trend under which many market participants are not embracing traditional approaches to evaluating and appraising the value of an ongoing business. Such investors are trading stocks as if the underlying values are determined by “Tweet” or a Presidential candidate’s flip opinion, as opposed to a company’s market share, management, cash flows, competitive advantage, and opportunity set. While a bias towards short term trading has presented an unwelcome headwind, we continue to believe that the economy will be governed by due process and that fundamentals will determine the long run valuation of our investments.
Despite the challenging starts of the 2016 fiscal and calendar years, the Fund performed solidly during the second and third calendar quarters—outperforming the benchmark comfortably +5.1% (versus +2.7%) and +11.3% (versus +7%) respectively. But overall performance was impacted during the first six weeks of 2016 as Healthcare and Technology issues accounted for nearly two thirds of the Fund’s decline. While holdings in both sectors are traditionally the “go to sell” beta names during periodic corrections, Healthcare names came under the greatest pressure, as concerns mounted that a new administration would attempt a radical transformation of the U.S. drug industry pricing model. The correction dragged down not only the large, well established pharmaceutical companies, but also the full array of smaller Biotechnology issues which have been so enabled by genomics. The correction in Biotechnology stocks was one of the three worst since the industry’s inception in 1981. Although we were encouraged by the Fund’s gains from the February low through the October period end (+26.7% versus SMID growth +23.7%), Healthcare issues had continued to be weighed down under the threats of regulation and price controls espoused during the election cycle. Lost in the political narrative of price controls have been the cost and risk of R&D of new therapies and the potential savings to the health care system. While many Healthcare issues rallied strongly into late September, they sold off hard again in October—as the reporting period ended, these investments as a group had recouped only about 60% of their losses from the first weeks of 2016 and significantly impacted fiscal period return.
There was plenty of good news to report. Five of the Fund’s leading contributors were Healthcare issues, three were Technology holdings, and two were Consumer Discretionary names. On a relative basis, five of the ten leaders were Healthcare investments. The leaders included: TESARO—PARP inhibition in ovarian cancer; Paycom Software—cloud based HR and human capital management; GW Pharmaceutical—cannabinoid platform in epilepsy disorder; and NVIDIA—semiconductor platform in visual computing, gaming, artificial intelligence/machine learning, and autonomous driving.
The Fund held several issues which were M&A targets, two of which were top contributors: Medivation—prostate cancer and PARP inhibition, and WhiteWave Foods—organic foods. Other significant takeovers included: Fleetmatics, Anacor Pharmaceuticals, Netsuite, NXP Semiconductor, and Demandware. Overall, there were at least eleven outright takeovers—takeovers reinforce the argument that despite the unsettled political and trading environment, acquirers continue to appreciate long term and strategic value. While there were success stories, there were also plenty of issues to fret about—Clovis Oncology missed on a non-inferior endpoint and its shares collapsed 70% only two weeks into the new fiscal year; a second drug, a PARP inhibitor has recently been filed for approval and the shares have commenced a recovery. The greatest disappointment and the worst impact to the portfolio was Intra-Cellular Therapies, which has developed a first in class treatment, with benign side effect profile, for schizophrenia (dementia and bipolar). However, despite prior significance in clinical trials, ITI-007 failed to separate versus placebo in a second Phase 3 trial. Nevertheless, we understand
that the company hopes to proceed to file for FDA approval based on prior trial data, ongoing FDA discussions, and an argument that certain trial centers incorrectly biased the latest data set.
At the period end, Technology sector investments led all others in commitments. Technology issues led performance since the February low and are comprised of investments in cloud based software, semiconductors, security, payments, and gaming. Seven of the Top 10 holdings were tech issues, including: ServiceNow—an enterprise cloud company with roots in IT management; and INPHI Corp—a leading fabless semiconductor company, designing components and optical interconnects for the highest speed data and bandwidth needs. Healthcare sector investments represented the second largest commitment for the Fund, at nearly one third of the Fund. In addition to TESARO and GW Pharma, Aerie Pharmaceuticals was a top holding of the Fund; Aerie has developed the first novel treatment for glaucoma in over twenty years. We have continued to be encouraged by advances and milestone successes in the healthcare investments. In addition, a steady pace in and high probability of ongoing M&A activity, and an expectation that with any reform of healthcare, the bark would have been worse than the bite, as a result, In the end, we believe that our holdings should perform very well, as sentiment improves. The remainder of the portfolio has been focused in the cyclical sectors of Financial, Energy, Materials, and Industrials. Although investments in the Energy sector increased to an overweight mid-year, the overall investment has been maintained at less than 5%. Investments in the Financial services sector increased over the last month, as the probability of a December rate increase has risen. Investments in producer and materials companies have been balanced against a view that the domestic U.S. economy has continued to move ahead grudgingly; we have continued to underweight the consumer sectors throughout 2016, due to changing models of competition and pricing pressures with only a few clear winners.
The Top 10, Top 25, and Top 50 positions comprised 26%, 46%, and 69% respectively of the Fund’s holdings at the fiscal year end. The Top 100 holdings accounted for 90% of the Fund’s holdings. While the past months have been more than a bit unnerving at times, there have been numerous opportunities to build positions in the most exceptional investments, as “jitteries” have indiscriminately bailed out of stocks without regard to valuations or fundamentals. It is impossible to forecast when or even if small cap growth issues will resume a steadier and upward track—the good news is that each successive correction subsequent to the “big one” in January has stopped cold above the prior correction low—a good indication that selling has been exhausted. It is impossible to discuss Healthcare investments over the past eighteen months, without considering the prospect of price controls which was repeatedly invoked during certain candidates’ campaigns. There is only one precedent for such actions which occurred during the early 1990s; those attempts failed as the model of market based competition proceeded under due process and law. And Healthcare issues went on to innovate and succeed as enterprises.
We remain confident that the Fund’s investments are well placed in competitively advantaged companies led by visionary management. Our methodology is steady and unchanged, and we continue to approach investments from a strategic perspective—not for day trading purposes. Innovation, market share, differentiation, barriers to competition, high reinvestment and ROE, and business model are sacrosanct.
We look forward to a more normal period for investing, as political noise subsides. As always, we greatly appreciate your continued confidence in our efforts on behalf of the Fund and its shareholders.
Sincerely,

Thomas R. Vandeventer
Portfolio Manager
The Tocqueville Opportunity Fund
(Unaudited)
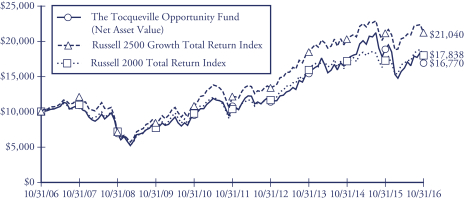
This chart assumes an initial gross investment of $10,000 made on 10/31/06. Returns shown do not reflect the deduction of taxes that a shareholder would pay on fund distributions or the redemption of fund shares. Returns shown include the reinvestment of all dividends and other distributions. Past performance is not predictive of future performance. Investment return and principal value will fluctuate so that your shares, when redeemed, may be worth more or less than their original cost.
The chart and table reflect The Opportunity Fund’s performance achieved prior to the changes effected in 2010 to its investment strategy.
The Russell 2500 Growth Total Return Index is an unmanaged index that measures the performance of the small to mid-cap growth segment of the U.S. equity universe. It includes those Russell 2500 companies with higher price-to-book ratios and higher forecasted growth values. Returns assume the reinvestment of all dividends
The Russell 2000 Total Return Index is an unmanaged index that measures the performance of the 2,000 smallest companies in the Russell 3000 Index. Returns include the reinvestment of all dividends.
AVERAGE ANNUAL RATE OF RETURN (%)
FOR YEARS ENDED OCTOBER 31, 2016
| | | | | | | | | | | | | | | | |
| | | 1 Year | | | 3 Year | | | 5 Year | | | 10 Year | |
The Tocqueville Opportunity Fund | | | -10.60% | | | | 3.15% | | | | 9.33% | | | | 5.31% | |
Russell 2500 Growth Total Return Index | | | 0.00% | | | | 4.72% | | | | 11.71% | | | | 7.72% | |
Russell 2000 Total Return Index | | | 4.11% | | | | 4.12% | | | | 11.51% | | | | 5.96% | |
The Tocqueville International Value Fund
Dear Fellow Shareholder,
For the fiscal year ended October 31, 2016, the Tocqueville International Value Fund’s total U.S. dollar return was 2.01%. In the same period, the Morgan Stanley EAFE Index Net, the index against which we are most often compared, had a net total U.S. dollar loss of (3.23)%. For the 15 year period ended October 31, 2016, the Fund’s total U.S. dollar return was 9.40% per annum. In the same period, the Morgan Stanley EAFE Index Net had a net total U.S. dollar return of 5.49% per annum.
��
Global equity markets were mixed during the year, with developed markets generally down and select emerging markets up meaningfully. Markets declined through mid-February, as investors focused on flagging growth and currency devaluation in China, low oil prices and their implications for credit markets and financial institutions, and weak economic data in the U.S. All assets linked to commodities and emerging markets came under stress. Then the U.S. dollar weakened and oil prices recovered, sparking a recovery in equities led by emerging markets and commodities. In June, there was another bout of volatility and market declines in response to the U.K. referendum vote to leave the European Union. Subsequently, markets rebounded, as concerns regarding the impact of “Brexit” on the global economy abated, and global economic statistics generally improved. Italy and a handful of African markets were among the worst performers globally, while commodity linked economies in Latin America and certain eastern European emerging markets had strong increases. The U.S. dollar decreased in value against most currencies, including the Euro and the Yen, but increased versus the Chinese Yuan and the British Pound. Most sectors declined, with financials, transport, leisure, retail, and media doing worst, while building materials and basic resources fared best.
The Fund’s portfolio benefitted from stock selection in the consumer, industrial and information technology areas, in both Europe and Japan, and from a low exposure to banks and other financial stocks. This was offset in part by weakness in healthcare related holdings as well as certain stocks in the U.K. and elsewhere that were impacted by Brexit fears. Notable contributors to profits were market research concern Ipsos, time management equipment maker Amano, analog chipmaker Infineon, power tool maker Makita, aeronautical equipment producer Zodiac, industrial conglomerate Smiths Group, wire and cable producer Bekaert, and buildings materials producer CRH. There were meaningful declines in real estate brokerage Countrywide, specialty pharma concern Allergan, and logistics service company Bollore.
During the year, we exited positions in Bekaert, cosmetics and household products maker Shiseido, logistics service company Singapore Post, precious metals miner Fresnillo, real estate concern Hopewell Holdings, and Volkswagen as they approached our estimates of intrinsic value. We sold the position in Syngenta following the takeover offer by ChemChina, and tendered the shares of specialty chemicals producer Royal Ten Cate,
subject of a takeover offer by Gilde Partners. We exited the position in Norwegian oil & gas producer Statoil when a questionable capital allocation decision by company management undercut our investment thesis. We also sold Australian explosives and fertilizer maker Incitec Pivot when deteriorating conditions in the U.S. ammonia markets caused us to reduce our estimate of intrinsic value, and in shares of U.K. drugmaker Shire when an expensive acquisition called into question managements capital allocation discipline.
We purchased shares of Zodiac Aerospace, a niche manufacturer of aerospace equipment, with strong positions in specialized markets; we believe that operating margins and the share price are depressed due to temporary production problems, causing the stock to trade at a deep discount to intrinsic value. We believe that operating margins will recover over time and that Zodiac Aerospace will be an attractive acquisition candidate for a larger player. We took a position in global mining concern Rio Tinto when shares were depressed along with the price of iron ore, the company’s most important commodity by revenues. Rio Tinto has the lowest cash cost of production and the strongest balance sheet in the industry which in our judgment provide downside protection while supply and demand for the commodity come into balance and prices firm. We bought shares of Schlumberger, a global oil services company with attractive return on capital and free cash generation characteristics. Shares have declined with the price of oil, and while profits will be depressed for a period due to a decline in exploration and production activity, Schlumberger is managing its expenses well and taking market share, which should result in strong cash flows when activity recovers. We purchased shares of Global Logistic Properties, which owns and leases out modern warehouse facilities in China and Japan, when fears regarding flagging growth and currency devaluation in China caused it to trade down. Global Logistic has a large first mover advantage in China, first class real estate, warehouse technology and customer list, and trades at a meaningful discount to the net asset value of its properties. We took a new position in shares of leading global industrial automation concern Fanuc, as concerns about the impact of a strong Yen and soft results in China on current earnings gave us the opportunity to purchase this growing, well-capitalized franchise at a meaningful discount to intrinsic value. We purchased shares of Australian office services provider—Spotless—after shares traded down in response to a poorly communicated earnings shortfall. We owned Spotless when it was taken private in 2012 and regard it as a consistent, highly cash generative business which is trading at a low multiple of free cash flow. We purchased shares of telecom equipment supplier Nokia which recently merged with Alcatel and whose share price has been depressed due to a weak near term business outlook and a lack of clarity regarding pro forma financials for the combined entity. With a cash rich balance sheet, the company is well placed to withstand the lull in business activity, while significant merger synergies and an improved product offer should allow for a meaningful expansion in free cash generation when spending on its products rebounds.
We took a new position in Cobham plc, a niche manufacturer of electronics with strong positions in specialized military and communications markets. Cobham’s stock
came under pressure as a result of cyclical weakness in certain of its end markets, and a rights issuance aimed at reducing corporate financial leverage enabled us to purchase shares at a meaningful discount to intrinsic value based on normalized cash flows. We purchased shares of U.K. real estate brokerage Countrywide which has been depressed by investor concerns regarding prospective real estate prices and transaction volumes in the post-Brexit context. In our judgment, the shares are reasonably valued based on a conservative scenario regarding future prices and volumes and stand to recover handsomely when transaction activity increases to levels more in line with long-term trends. We took a new position in Canadian miner Goldcorp, which possesses attractive long-lived assets in Canada, Mexico, and Central and South America. Shares have lagged peers due to heavy development spending and resulting poor cash-flow generation. The company is transitioning from a period of high investment to a period of asset optimization and cash-flow harvesting under the direction of a new CEO, who has a strong focus on producing adequate returns on capital and increasing net asset value per share.
We purchased shares of drug and chemical company Bayer when shares sold off in response to its bid for Monsanto. Bayer has strong franchises in consumer and animal health, crop science and pharma, and in our view the combined value of the three businesses exceeds the price of the shares by a wide margin. During the period, we added to Kingfisher, Applus, Aveva, Sanofi, Royal Dutch, Sanofi, Countrywide, Kingfisher, and Sopra, inter alia.
Overall, there was a marginal decrease in our exposure to Japan and Asia and a small increase in our exposure to Europe and Rest of World, where we have been finding the most attractive values. We began the period with approximately 10% in cash reserves and finished the period with roughly 9%.
Economic growth has improved marginally in the U.S. and Europe, and commodity prices have stabilized, which in turn has improved the prospects for a number of emerging markets. Against this backdrop, investor expectations for earnings growth are quite modest. Meanwhile, the perceived failure of monetary policy to stimulate global growth has given rise to a growing consensus regarding the need for broad fiscal stimulus. Indeed, it would appear that the economic agenda of the U.S. President-elect will include fiscal stimulus and tax cuts, intended to stimulate economic growth. Growth in the U.S. would be supportive of global growth, notwithstanding the lip service that has been paid to protectionism. We believe that the combination of improving growth and earnings against the backdrop of investor skepticism should be supportive of equities. That said, we remain vigilant regarding the risks of surprise political outcome in Europe, a faster than expected rise in interest rates, the intractability of and potential for increased conflict in the Middle East, to name a few.
Our goal remains to generate positive absolute returns and to exceed the returns of the major indices over the course of an economic cycle. To protect and grow your capital, we continue to seek out compelling long-term investment opportunities in companies that have defensible business franchises, are out of favor or misunderstood, and trade at a substantial discount to intrinsic value.
Sincerely,

James Hunt
Portfolio Manager
The Tocqueville International Value Fund
(Unaudited)
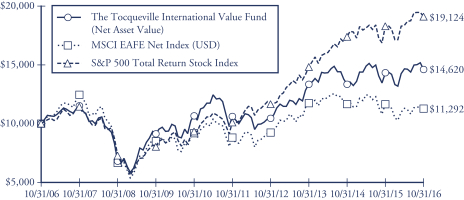
This chart assumes an initial gross investment of $10,000 made on 10/31/06. Returns shown do not reflect the deduction of taxes that a shareholder would pay on fund distributions or the redemption of fund shares. Performance reflects fee waivers in effect. In the absence of fee waivers, total return would be reduced. Returns shown include the reinvestment of all dividends and other distributions. Past performance is not predictive of future performance. Investment return and principal value will fluctuate so that your shares, when redeemed, may be worth more or less than their original cost.
The MSCI EAFE Index is an unmanaged market-capitalization-weighted index composed of companies representative of the market structure of 21 Developed Market Countries in Europe, Australia, Asia and the Far East.
The Standard & Poor’s 500 Total Return Stock Index (S&P 500) is a capital-weighted index, representing the aggregate market value of the common equity of 500 stocks primarily traded on the New York Stock Exchange. Returns include the reinvestment of all dividends.
AVERAGE ANNUAL RATE OF RETURN (%)
FOR YEARS ENDED OCTOBER 31, 2016
| | | | | | | | | | | | | | | | |
| | | 1 Year | | | 3 Year | | | 5 Year | | | 10 Year | |
The Tocqueville International Value Fund | | | 2.01% | | | | 2.99% | | | | 6.55% | | | | 3.87% | |
MSCI EAFE Net Index | | | -3.23% | | | | -1.31% | | | | 4.99% | | | | 1.22% | |
Standard & Poor’s 500 Total Return Stock Index | | | 4.51% | | | | 8.84% | | | | 13.57% | | | | 6.70% | |
The Tocqueville Gold Fund
Dear Fellow Shareholder,
The past year through October 31, 2016, has seen significant change in the gold market. Gold prices set a low not seen in over five years in December only to rise to a two-year high by July. For the 12-month period, gold rose 11.5%, finishing at $1,273.10 per ounce, while the Tocqueville Gold Fund returned 51.0%. The overarching theme of the past year has been the market’s obsession with the U.S. Federal Reserve Bank’s monetary policy, and the impact on global markets and financial assets from rising interest rates.
As the fiscal year began in November 2015, investors braced for an increase in U.S. interest rates, which the Fed did raise in December, while gold prices marked multi-year lows. The 2016 year began as markets obsessed on weakening economic developments in China and softening global oil markets. As gold turned around in February and March, investors embraced gold’s cyclical low as an opportunity to offset risk exposure from other markets. Meanwhile, global interest rates continued to turn negative on the back of easier central bank policies in Europe and Japan. Market participants showed a renewed interest in physical gold by re-building exposure through gold exchange traded funds—a noteworthy turnaround from the sell-off of the past several years. The Brexit vote in June further supported gold markets as investors sought to offset the weakening British pound sterling and the global impact from Britain being less integrated with Europe. During the late summer months and early autumn, gold and gold mining shares consolidated the substantial gains from earlier in the year, as markets continued to speculate on when the U.S. Fed would raise interest rates.
As the new fiscal year begins, gold markets have reacted to the uncertain implications of a new presidential regime. At this stage, with the transition just underway, it seems there are too many unknowns, except for the market’s expression of relief that the past is behind. There is a decent chance interest rates will continue to rise and bond market losses will mount. So too, it is likely that inflation will rise, as fiscal deficits expand under programs intended to “Make America Great Again”. The momentary euphoria over the prospective change of course in public policy could easily turn to disenchantment, as these realities settle in.
The Fund continues to hold physical gold vaulted at a secure storage facility (which, very importantly, is outside the financial system), as its largest single position, at approximately 11% of the Fund’s assets. This exposure offsets some of the volatility inherent in equities in general and gold mining stocks in particular.
The precious metal mining stocks that contributed the most during the period included Agnico-Eagle Mines, Alamos Gold, B2Gold, Detour Gold, Fresnillo Plc, Jaguar Mining, Newmont Mining Corp. Mag Silver, Silver Wheaton, and Torex Gold. Each position participated with the positive move in precious metals this past year, but each has
also created value in unique ways whether through discovery, resource development or successful, corporate strategic execution and profitable precious metal production. The Fund seeks exposure across various aspects of the value creation spectrum within the precious metals sector, as a way to not only diversify risk but also capture the value inherent in discovery, development and production.
New positions were established during the year such as Jaguar Mining, Gold Road, Hochschild Mining, Klondex, and NuLegacy. Each has the potential to generate value from its assets. These companies are developing economic ore deposits and/or generating quality cash flow from assets that have the potential to expand from the influence of the gold price or from geologic discovery. Several companies were sold from the Fund that either presented limited value creation opportunities or posed risks unassociated with moves in the precious metals markets. This includes companies such as Americas Silver, Buenaventura, Continental Gold, Gold Fields, Iamgold, Kinross, New Gold, and Primero Mining. While each of those companies has different challenges and opportunities, we determined they did not offer the best nor an immediate contribution to value creation.
Some positions were held for under a year, as investments that were originally undervalued by the market but reached higher values, to the point of excessive, as the gold price ran up in mid-2016. This was the case with Barrick, held for much of the year as the position was acquired when the company’s valuation was extremely low in early 2016. As markets and valuations rose into mid-year, the position was sold down. The same was true for Reservoir Minerals, but in that case, the company was acquired. TMAC Resources was another company that reached a favorable valuation late in the year and was sold off.
We continue to avoid the more financially or operationally leveraged companies that make up a good portion of indexes such as the Philadelphia Gold and Silver index or various gold mining equity ETFs. As always, we seek to invest in those companies characterized by “wealth builders”, managements that we believe can produce accretive per share growth in production and reserves independent of changes in the gold price.
In our view, the systemic risks that existed prior to the presidential election have not suddenly vanished. Most important among these is a massive bond market bubble. How the new administration will deal with this vexing issue is a complete unknown. Any unwinding process promises to be extremely precarious and full of potential pitfalls, which we believe is reason enough to hedge all bets on a positive outcome with exposure to gold and precious metals equities. Rising interest rates, expanding fiscal deficits, and the return of inflation may well prove to be the catalysts necessary to drive gold prices much higher.
We believe that the recent sharp correction in precious metal prices will form into a solid foundation from which gold and gold mining stocks will advance toward new highs. We recommend taking advantage of any price weakness as an opportunity to build on or establish new positions in the precious metal sector.
Sincerely,
| | |
 | |  |
| John C. Hathaway | | Douglas B. Groh |
| Portfolio Manager | | Portfolio Manager |
The Tocqueville Gold Fund
(Unaudited)
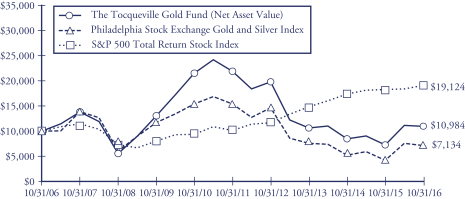
This chart assumes an initial gross investment of $10,000 made on 10/31/06. Returns shown do not reflect the deduction of taxes that a shareholder would pay on fund distributions or the redemption of fund shares. Returns shown include the reinvestment of all dividends and other distributions. Past performance is not predictive of future performance. Investment return and principal value will fluctuate so that your shares, when redeemed, may be worth more or less than their original cost. The Fund imposes a 2% redemption fee on shares held 90 days or less.
In 2006, 2009, 2010, and 2016 the performance of The Tocqueville Gold Fund was achieved during a period of unusually favorable market conditions. Such performance may not be sustainable.
The Philadelphia Stock Exchange Gold and Silver Index is an unmanaged capitalization-weighted index which includes the leading companies involved in the mining of gold and silver. Returns include the reinvestment of all dividends.
The Standard & Poor’s 500 Total Return Stock Index (S&P 500) is a capital-weighted index, representing the aggregate market value of the common equity of 500 stocks primarily traded on the New York Stock Exchange. Returns include the reinvestment of all dividends.
AVERAGE ANNUAL RATE OF RETURN (%)
FOR YEARS ENDED OCTOBER 31, 2016
| | | | | | | | | | | | | | | | |
| | | 1 Year | | | 3 Year | | | 5 Year | | | 10 Year | |
The Tocqueville Gold Fund | | | 51.00% | | | | 1.14% | | | | -12.90% | | | | 0.94% | |
Philadelphia Stock Exchange Gold and Silver Index | | | 69.93% | | | | -1.95% | | | | -14.23% | | | | -3.30% | |
Standard & Poor’s 500 Total Return Stock Index | | | 4.51% | | | | 8.84% | | | | 13.57% | | | | 6.70% | |
The Delafield Fund
Dear Fellow Shareholder,
For the fiscal year ended October 31, 2016 the Delafield Fund’s net asset value increased 3.26% versus an increase of 4.11% for the Russell 2000 Index (“Russell 2000”) and an increase of 4.51% for the Standard & Poor’s 500 Index (“S&P 500”), each on a total return basis. Owing to the smaller average market capitalization of companies in the Russell 2000, we view it as the more appropriately comparative index to the Fund. The Fund’s net asset value as of October 31, 2016 was $26.47 per share. The net asset value amounted to $400,826,962 of which 77.6% was invested in equities, and the balance in cash and equivalents.
Stock markets endured a battering in the first quarter of our fiscal 2016 and then proceeded on a nearly unabated upward trajectory for the balance of the fiscal year. From November 1, 2015 through January 31, 2016, the Russell 2000 experienced a 10.56% drop and our portfolio trailed, declining 15.04% for the same period. During the first quarter, the deceleration in the Chinese economy (and related weakness in commodity metals), the energy sector’s continued swoon, and the strong U.S. dollar continued to be among the leading headlines. Unfortunately, these external fears most severely challenged stocks in the industrial, material, energy and retail sectors, all which have commonly been ripe for our strategy of discovering unloved and misunderstood opportunities in which to invest. While the lion’s share of our portfolio companies in these sectors advanced on their respective internal operating initiatives during this challenging quarter, these accomplishments were overshadowed by exogenous macro concerns, and our exposure to these sectors contributed to the Fund’s relative first quarter underperformance.
Beginning with the second fiscal quarter and throughout the balance of the fiscal year, the market, and the Fund’s portfolio in particular, snapped back sharply. From February 1, 2016 through October 31, 2016, the Russell 2000 returned 16.40%, while the Fund outperformed by about 600 basis points, generating a 21.53% gain, net of fees. Energy and commodity prices began to stabilize early in the period, and a somewhat weaker dollar also benefited the macro environment, helping to fuel the start of the market rally. Favorable employment, wage and inflation data drove improved investor expectations and stock prices through the first half of the third fiscal quarter before Britain’s unexpected vote on the so called “Brexit” shocked the system and caused a massive two day selloff. However, the promise of further government stimulus around the globe, including the expectation that the U.S. Fed would shelve a previously anticipated rate hike quickly pulled the markets out of their doldrums and the rally resumed into the fourth fiscal quarter, before petering out towards quarter end on U.S. presidential election uncertainty. While the portfolio of course benefited from these external factors, performance during quarters two through four of the fiscal year was augmented with strong moves in a number of our holdings that reported operating results which highlighted the internal progress they had managed to make in their operations and/or capital structures.
For the fiscal year, top contributors included Consol Energy Inc. (Consol), Hewlett Packard Enterprise Company (HPE), and Horizon Global Corporation (Horizon). Consol responded favorably to energy price stabilization as well as evidence that operational improvements had begun to take hold. HPE had a successful debut following its spin-off from HP Inc., while Horizon benefited from improved earnings results owing to margin enhancing strategies implemented by its new management team.
In contrast, Ascena Retail Group Inc., TrueBlue, Inc., and Xerium Technologies Inc. were the largest detractors to our performance. Despite making progress on righting issues within their Justice division, Ascena’s overall results and its shares, disappointed throughout the year due to both retail industry headwinds as well as missteps in other operating divisions. TrueBlue disappointed the market with weaker than expected earnings and the unexpected loss of contract work with Amazon, while Xerium’s shares declined on soft earnings results.
We added a number of new positions to the portfolio during the fiscal year, the largest of which included Team Inc., Tegna Inc., U.S. Concrete Inc., Barnes Group Inc., and Korn Ferry. In contrast, the largest portfolio deletions included two companies which announced deals to be acquired, namely Ingram Micro Inc. and Fairchild Semiconductor International Inc, as well as Consol Energy Inc., Jabil Circuit Inc., Carlisle Corporation, and Avery Dennison Corporation.
Looking forward, in the near-term, the transition of power to President-elect Trump, the movement of the U.S. dollar and energy prices and interest rate expectations are likely to dominate the headlines. Further, we expect that market volatility will continue to be an issue as ETFs, computer traded portfolios and hedge funds dominate day to day investment activity. On the plus side is our domestic economy which is growing, albeit at a moderate pace. This macro backdrop could make for a tentative investment climate, which we believe could be ripe for the discovery of the value and special situation opportunities which we look to invest in.
Sincerely,
| | |
 | |  |
| J. Dennis Delafield | | Vincent Sellecchia |
| Portfolio Manager | | Portfolio Manager |
| | |
 | |  |
| Joshua Kaufthal | | James Maxwell |
| Portfolio Manager | | Portfolio Manager |
The Delafield Fund
(Unaudited)
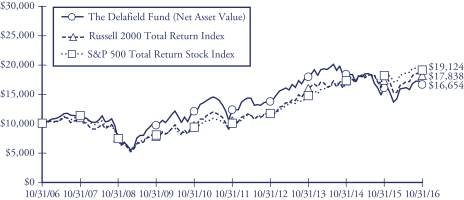
This chart assumes an initial gross investment of $10,000 made on 10/31/06. Since the Delafield Fund did not commence operations until 9/28/09, returns prior to that date are those of the Predecessor Fund. The Delafield Fund assumed the net asset value and performance history of the Predecessor Fund (See Footnote 1 to the Financial Statements). Returns shown do not reflect the deduction of taxes that a shareholder would pay on fund distributions or the redemption of fund shares. Performance reflects fee waivers in effect. In the absence of fee waivers, total return would be reduced. Returns shown include the reinvestment of all dividends and other distributions. Past performance is not predictive of future performance. Investment return and principal value will fluctuate so that your shares, when redeemed, may be worth more or less than their original cost.
The Russell 2000 Total Return Index is an unmanaged index that measures the performance of the 2,000 smallest companies in the Russell 3000 Index, which represent approximately 10% of the total market capitalization of the Russell 3000 Index. Returns include the reinvestment of all dividends.
The Standard & Poor’s 500 Total Return Stock Index (S&P 500) is a capital-weighted index, representing the aggregate market value of the common equity of 500 stocks primarily traded on the New York Stock Exchange. Returns include the reinvestment of all dividends.
AVERAGE ANNUAL RATE OF RETURN (%)
FOR YEARS ENDED OCTOBER 31, 2016
| | | | | | | | | | | | | | | | |
| | | 1 Year | | | 3 Year | | | 5 Year | | | 10 Year | |
The Delafield Fund | | | 3.26% | | | | -2.74% | | | | 6.16% | | | | 5.23% | |
Russell 2000 Total Return Index | | | 4.11% | | | | 4.12% | | | | 11.51% | | | | 5.96% | |
Standard & Poor’s 500 Total Return Stock Index | | | 4.51% | | | | 8.84% | | | | 13.57% | | | | 6.70% | |
The Tocqueville Select Fund
Dear Fellow Shareholder,
For the fiscal year ended October 31, 2016 the Tocqueville Select Fund’s net asset value decreased 1.93% verses increases of 3.98% for the Russell 2500 Index (“Russell 2500”) and 4.11% for the Russell 2000 Index (“Russell 2000”), each on a total return basis. The Fund’s net asset value as of October 31, 2016 was $11.43 per share. The net asset value amounted to $63,812,085 of which 85.8% was invested in equities, and the balance in cash and equivalents.
Stock markets endured a battering in the first quarter of our fiscal 2016 and then proceeded on a nearly unabated upward trajectory for the balance of the fiscal year. From November 1, 2015 through January 31, 2016, the Russell 2500 experienced a 9.99% drop and the Fund’s portfolio trailed, declining 16.43% for the same period. During the first quarter, the deceleration in the Chinese economy (and related weakness in commodity metals), the energy sector’s continued swoon, and the strong U.S. dollar continued to be among the leading headlines. Unfortunately, these external fears most severely challenged stocks in the industrial, material, energy and retail sectors, all which have commonly been ripe for our strategy of discovering unloved and misunderstood opportunities in which to invest in. While the majority of portfolio companies in these sectors advanced on their respective internal operating initiatives during this challenging quarter, these accomplishments were overshadowed by exogenous macro concerns, and our exposure to these sectors contributed to our relative first quarter underperformance.
Beginning with the second fiscal quarter and throughout the balance of the fiscal year, the market, and the Fund’s portfolio in particular, snapped back sharply, albeit not enough to entirely offset our relative underperformance in the first fiscal quarter. From February 1, 2016 through October 31, 2016, the Russell 2500 returned 15.52%, while the Fund generated a 17.35% gain, net of fees. Energy and commodity prices began to stabilize early in the period, and a somewhat weaker dollar also benefited the macro environment, helping to fuel the start of the market rally. Favorable employment, wage and inflation data drove improved investor expectations and stock prices through the first half of the third fiscal quarter before Britain’s unexpected vote on the so called “Brexit” shocked the system and caused a massive two day selloff. However, the promise of further government stimulus around the globe, including the expectation that the U.S. Fed would shelve a previously anticipated rate hike, quickly pulled the markets out of their doldrums and the rally resumed into the fourth fiscal quarter, before petering out towards quarter end on U.S. presidential election uncertainty. While the Fund’s portfolio of course benefited from these external factors, performance during quarters two through four of the fiscal year was augmented with strong moves in a number of our holdings that reported operating results which highlighted the internal progress they had managed to make in their operations and/or capital structures. Fund holdings in the consumer discretionary and materials sectors were particularly strong relative to the Russell 2500 and were outsize contributors to the Fund’s relative strength for this period.
For the fiscal year, top contributors included Horizon Global Corporation (Horizon) and Consol Energy Inc. (Consol). Horizon benefited from improved earnings results owing to margin enhancing strategies implemented by its new management team, while Consol responded favorably to energy price stabilization as well as evidence that operational improvements had begun to take hold. In contrast, Ascena Retail Group Inc., and Xerium Technologies Inc. were the largest detractors to performance. Despite making progress on righting issues within their Justice division, Ascena’s overall results and its shares, disappointed throughout the year due to both retail industry headwinds as well as missteps in other operating divisions. Xerium’s shares declined on soft earnings results.
We added a number of new positions to the portfolio during the fiscal year, the largest of which included TrueBlue Inc., Tegna Inc., Diebold Inc., and ICF International Inc. We also exited several investments, the largest of which was Fairchild Semiconductor International Inc., which announced a deal to be acquired. Other large positions that were exited included Avery Dennison Corporation, Jabil Circuit Inc., Carpenter Technology Corp., and Acco Brands Corp.
Looking forward, in the near-term, the transition of power to President-elect Trump, the movement of the U.S. dollar and energy prices and interest rate expectations are likely to dominate the headlines. Further, we expect that market volatility will continue to be an issue as ETFs, computer traded portfolios and hedge funds dominate day to day investment activity. On the plus side is the domestic economy which is growing, albeit at a moderate pace. This macro backdrop could make for a tentative investment climate, which we believe could be ripe for the discovery of the value and special situation opportunities which we look to invest in.
Sincerely,
| | | | |
| | | | |
| J. Dennis Delafield | | Vincent Sellecchia | | Joshua Kaufthal |
| Portfolio Manager | | Portfolio Manager | | Portfolio Manager |
| | |

| | |
| Donald Wang | | James Maxwell |
| Portfolio Manager | | Portfolio Manager |
The Tocqueville Select Fund
(Unaudited)
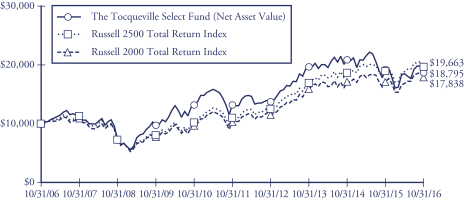
This chart assumes an initial gross investment of $10,000 made on 10/31/06. Since The Tocqueville Select Fund did not commence operations until 9/28/09, returns from the period from September 29, 2008 to September 27, 2009 are those of the Class Y Shares of the Predecessor Fund (See Footnote 1 to the Financial Statements). Prior to that period, returns shown are those of a limited partnership managed by the adviser. Returns shown do not reflect the deduction of taxes that a shareholder would pay on fund distributions or the redemption of fund shares. Performance reflects fee waivers in effect. In the absence of fee waivers, total return would be reduced. Returns shown include the reinvestment of all dividends and other distributions. Past performance is not predictive of future performance. Investment return and principal value will fluctuate so that your shares, when redeemed, may be worth more or less than their original cost.
In 2013 the performance of The Tocqueville Select Fund was achieved during a period of unusually favorable market conditions. Such performance may not be sustainable.
The Russell 2500 Total Return Index is an unmanaged index that measures the performance of the 2,500 smallest companies in the Russell 3000 Index. Returns include the reinvestment of all dividends.
The Russell 2000 Total Return Index is an unmanaged index that measures the performance of the 2,000 smallest companies in the Russell 3000 Index. Returns include the reinvestment of all dividends.
AVERAGE ANNUAL RATE OF RETURN (%)
FOR YEARS ENDED OCTOBER 31, 2016
| | | | | | | | | | | | | | | | |
| | | 1 Year | | | 3 Year | | | 5 Year | | | 10 Year | |
The Tocqueville Select Fund | | | -1.93% | | | | -1.42% | | | | 7.29% | | | | 6.51% | |
Russell 2500 Total Return Index | | | 3.98% | | | | 5.17% | | | | 12.22% | | | | 7.00% | |
Russell 2000 Total Return Index | | | 4.11% | | | | 4.12% | | | | 11.51% | | | | 5.96% | |
Expense Example—October 31, 2016 (Unaudited)
As a shareholder of The Tocqueville Trust (the “Funds”), you incur ongoing costs, including management fees; distribution fees; and other Fund expenses. This example is intended to help you understand your ongoing costs (in dollars) of investing in the Funds and to compare costs with the ongoing costs of investing in other mutual funds.
The Example is based on an investment of $1,000 invested at the beginning of the period and held the entire period (May 1, 2016-October 31, 2016).
Actual Expenses
The first line of the table below provides information about actual account values and actual expenses. You may use the information in this line, together with the amount you invested, to estimate the expenses that you paid over the period. Simply divide your account value by $1,000 (for example, an $8,600 account value divided by $1,000 = 8.6), then multiply the result by the number in the first line under the heading entitled “Expenses Paid During Period” to estimate the expenses you paid on your account during this period.
Hypothetical Example for Comparison Purposes
The second line of the table below provides information about hypothetical account values and hypothetical expenses based on the Funds’ actual expense ratios and an assumed rate of return of 5% per year before expenses, which is not the Funds’ actual return. The hypothetical account values and expenses may not be used to estimate the actual ending account balance or expenses you paid for the period. You may use this information to compare the ongoing costs of investing in the Funds and other funds. To do so, compare this 5% hypothetical example with the 5% hypothetical examples that appear in the shareholder reports of the other funds.
Please note that the expenses shown in the table are meant to highlight your ongoing costs only and do not reflect any transactional costs, such as sales charges (loads), redemption fees, or exchange fees. Therefore, the second line of the table is useful in comparing ongoing costs only, and will not help you determine the relative costs of owning different funds. In addition, if these transactional costs were included, your costs would have been higher.
Expense Example Tables (Unaudited)
The Tocqueville Fund
| | | | | | | | | | | | |
| | | Beginning
Account Value
May 1, 2016 | | | Ending
Account Value
October 31, 2016 | | | Expenses Paid
During Period*
May 1, 2016 -
October 31, 2016 | |
Actual | | $ | 1,000.00 | | | $ | 1,035.60 | | | $ | 6.24 | |
Hypothetical (5% return before expenses) | | | 1,000.00 | | | | 1,019.00 | | | | 6.19 | |
| * | Expenses are equal to the Fund’s annualized six-month expense ratio (including interest expense) of 1.22% for The Tocqueville Fund, multiplied by the average account value over the period, multiplied by 184/366 to reflect the one-half year period. |
The Tocqueville Opportunity Fund
| | | | | | | | | | | | |
| | | Beginning
Account Value
May 1, 2016 | | | Ending
Account Value
October 31, 2016 | | | Expenses Paid
During Period*
May 1, 2016 -
October 31, 2016 | |
Actual | | $ | 1,000.00 | | | $ | 1,039.70 | | | $ | 7.33 | |
Hypothetical (5% return before expenses) | | | 1,000.00 | | | | 1,017.95 | | | | 7.25 | |
| * | Expenses are equal to the Fund’s annualized six-month expense ratio (including interest expense) of 1.43% for The Tocqueville Opportunity Fund, multiplied by the average account value over the period, multiplied by 184/366 to reflect the one-half year period. |
The Tocqueville International Value Fund
| | | | | | | | | | | | |
| | | Beginning
Account Value
May 1, 2016 | | | Ending
Account Value
October 31, 2016 | | | Expenses Paid
During Period*
May 1, 2016 -
October 31, 2016 | |
Actual | | $ | 1,000.00 | | | $ | 995.90 | | | $ | 6.27 | |
Hypothetical (5% return before expenses) | | | 1,000.00 | | | | 1,018.85 | | | | 6.34 | |
| * | Expenses are equal to the Fund’s annualized six-month expense ratio of 1.25% for The Tocqueville International Value Fund, multiplied by the average account value over the period, multiplied by 184/366 to reflect the one-half year period. |
The Tocqueville Gold Fund
| | | | | | | | | | | | |
| | | Beginning
Account Value
May 1, 2016 | | | Ending
Account Value
October 31, 2016 | | | Expenses Paid
During Period*
May 1, 2016 -
October 31, 2016 | |
Actual | | $ | 1,000.00 | | | $ | 984.50 | | | $ | 6.68 | |
Hypothetical (5% return before expenses) | | | 1,000.00 | | | | 1,018.40 | | | | 6.80 | |
| * | Expenses are equal to the Fund’s annualized six-month expense ratio (including interest expense) of 1.34% for The Tocqueville Gold Fund, multiplied by the average account value over the period, multiplied by 184/366 to reflect the one-half year period. |
The Delafield Fund
| | | | | | | | | | | | |
| | | Beginning
Account Value
May 1, 2016 | | | Ending
Account Value
October 31, 2016 | | | Expenses Paid
During Period*
May 1, 2016 -
October 31, 2016 | |
Actual | | $ | 1,000.00 | | | $ | 1,038.90 | | | $ | 6.20 | |
Hypothetical (5% return before expenses) | | | 1,000.00 | | | | 1,019.05 | | | | 6.14 | |
| * | Expenses are equal to the Fund’s annualized six-month expense ratio of 1.21% for The Delafield Fund, multiplied by the average account value over the period, multiplied by 184/366 to reflect the one-half year period. |
The Tocqueville Select Fund
| | | | | | | | | | | | |
| | | Beginning
Account Value
May 1, 2016 | | | Ending
Account Value
October 31, 2016 | | | Expenses Paid
During Period*
May 1, 2016 -
October 31, 2016 | |
Actual | | $ | 1,000.00 | | | $ | 1,016.00 | | | $ | 6.79 | |
Hypothetical (5% return before expenses) | | | 1,000.00 | | | | 1,018.40 | | | | 6.80 | |
| * | Expenses are equal to the Fund’s annualized six-month expense ratio of 1.34% for The Tocqueville Select Fund, multiplied by the average account value over the period, multiplied by 184/366 to reflect the one-half year period. |
The Tocqueville Fund
Financial Highlights
| | | | | | | | | | | | | | | | | | | | |
Per share operating performance
(For a share outstanding throughout the
year) | | Years Ended October 31, | |
| | 2016 | | | 2015 | | | 2014 | | | 2013 | | | 2012 | |
Net asset value, beginning of year | | $ | 32.91 | | | $ | 34.18 | | | $ | 30.67 | | | $ | 24.11 | | | $ | 22.23 | |
| | | | | | | | | | | | | | | | | | | | |
Operations: | | | | | | | | | | | | | | | | | | | | |
Net investment income (1) | | | 0.42 | | | | 0.37 | | | | 0.28 | | | | 0.40 | | | | 0.40 | |
Net realized and unrealized gain (loss) | | | 1.07 | | | | (0.19 | ) | | | 3.78 | | | | 6.51 | | | | 1.81 | |
| | | | | | | | | | | | | | | | | | | | |
Total from investment operations * | | | 1.49 | | | | 0.18 | | | | 4.06 | | | | 6.91 | | | | 2.21 | |
| | | | | | | | | | | | | | | | | | | | |
Distributions to shareholders: | | | | | | | | | | | | | | | | | | | | |
Dividends from net investment income | | | (0.35 | ) | | | (0.25 | ) | | | (0.30 | ) | | | (0.35 | ) | | | (0.33 | ) |
Distributions from net realized gains | | | (0.33 | ) | | | (1.20 | ) | | | (0.25 | ) | | | — | | | | — | |
| | | | | | | | | | | | | | | | | | | | |
Total distributions | | | (0.68 | ) | | | (1.45 | ) | | | (0.55 | ) | | | (0.35 | ) | | | (0.33 | ) |
| | | | | | | | | | | | | | | | | | | | |
Change in net asset value for the year | | | 0.81 | | | | (1.27 | ) | | | 3.51 | | | | 6.56 | | | | 1.88 | |
| | | | | | | | | | | | | | | | | | | | |
Net asset value, end of year | | $ | 33.72 | | | $ | 32.91 | | | $ | 34.18 | | | $ | 30.67 | | | $ | 24.11 | |
| | | | | | | | | | | | | | | | | | | | |
* Includes redemption fees per share of | | | N/A | | | $ | 0.00 | (2) | | $ | 0.00 | (2) | | $ | 0.00 | (2) | | $ | 0.00 | (2) |
Total Return | | | 4.6 | % | | | 0.5 | % | | | 13.4 | % | | | 29.0 | % | | | 10.1 | % |
Ratios/supplemental data | | | | | | | | | | | | | | | | | | | | |
Net assets, end of year (000) | | $ | 283,126 | | | $ | 309,267 | | | $ | 380,561 | | | $ | 348,269 | | | $ | 366,025 | |
Ratio to average net assets: | | | | | | | | | | | | | | | | | | | | |
Expenses before waiver/reimbursement | | | 1.27 | % | | | 1.29 | % | | | 1.25 | % | | | 1.28 | % | | | 1.29 | % |
Expenses after waiver/reimbursement | | | 1.24 | %(3) | | | 1.25 | % | | | 1.24 | % | | | 1.26 | %(3) | | | 1.26 | %(3) |
Net investment income before waiver/reimbursement | | | 1.18 | % | | | 0.91 | % | | | 0.84 | % | | | 1.33 | % | | | 1.30 | % |
Net investment income after waiver/reimbursement | | | 1.21 | % | | | 0.95 | % | | | 0.85 | % | | | 1.35 | % | | | 1.33 | % |
Portfolio turnover rate | | | 12 | % | | | 15 | % | | | 19 | % | | | 16 | % | | | 17 | % |
| (1) | Net investment income per share is calculated using the ending balance prior to consideration or adjustment for permanent book-to-tax differences. |
| (2) | Represents less than $0.01. |
| (3) | Includes 0.01% of interest expense which is not included in the Fund’s operating expense cap. |
The Accompanying Notes are an Integral Part of these Financial Statements.
The Tocqueville Opportunity Fund
Financial Highlights
| | | | | | | | | | | | | | | | | | | | |
Per share operating performance
(For a share outstanding throughout the year) | | Years Ended October 31, | |
| | 2016 | | | 2015 | | | 2014 | | | 2013 | | | 2012 | |
Net asset value, beginning of year | | $ | 21.41 | | | $ | 22.78 | | | $ | 21.29 | | | $ | 15.76 | | | $ | 14.96 | |
| | | | | | | | | | | | | | | | | | | | |
Operations: | | | | | | | | | | | | | | | | | | | | |
Net investment loss (1) | | | (0.29 | ) | | | (0.15 | ) | | | (0.22 | ) | | | (0.13 | ) | | | (0.11 | ) |
Net realized and unrealized gain (loss) | | | (1.98 | ) | | | 1.98 | | | | 2.80 | | | | 5.66 | | | | 0.91 | |
| | | | | | | | | | | | | | | | | | | | |
Total from investment operations * | | | (2.27 | ) | | | 1.83 | | | | 2.58 | | | | 5.53 | | | | 0.80 | |
| | | | | | | | | | | | | | | | | | | | |
Distributions to shareholders: | | | | | | | | | | | | | | | | | | | | |
Dividends from net investment income | | | — | | | | — | | | | — | | | | — | | | | — | |
Distributions from net realized gains | | | — | | | | (3.20 | ) | | | (1.09 | ) | | | — | | | | — | |
| | | | | | | | | | | | | | | | | | | | |
Total distributions | | | — | | | | (3.20 | ) | | | (1.09 | ) | | | — | | | | — | |
| | | | | | | | | | | | | | | | | | | | |
Change in net asset value for the year | | | (2.27 | ) | | | (1.37 | ) | | | 1.49 | | | | 5.53 | | | | 0.80 | |
| | | | | | | | | | | | | | | | | | | | |
Net asset value, end of year | | $ | 19.14 | | | $ | 21.41 | | | $ | 22.78 | | | $ | 21.29 | | | $ | 15.76 | |
| | | | | | | | | | | | | | | | | | | | |
* Includes redemption fees per share of | | | N/A | | | $ | 0.00 | (2) | | $ | 0.00 | (2) | | $ | 0.00 | (2) | | $ | 0.00 | (2) |
Total Return | | | (10.6 | )% | | | 9.1 | % | | | 12.6 | % | | | 35.1 | % | | | 5.4 | % |
Ratios/supplemental data | | | | | | | | | | | | | | | | | | | | |
Net assets, end of year (000) | | $ | 92,958 | | | $ | 153,456 | | | $ | 80,324 | | | $ | 80,609 | | | $ | 65,455 | |
Ratio to average net assets: | | | | | | | | | | | | | | | | | | | | |
Expense | | | 1.38 | % | | | 1.31 | % | | | 1.30 | % | | | 1.30 | % | | | 1.32 | % |
Net investment loss | | | (0.94 | )% | | | (0.95 | )% | | | (0.90 | )% | | | (0.64 | )% | | | (0.76 | )% |
Portfolio turnover rate | | | 108 | % | | | 101 | % | | | 92 | % | | | 100 | % | | | 77 | % |
| (1) | Net investment loss per share is calculated using the ending balance prior to consideration or adjustment for permanent book-to-tax differences. |
| (2) | Represents less than $0.01. |
The Accompanying Notes are an Integral Part of these Financial Statements.
The Tocqueville International Value Fund
Financial Highlights
| | | | | | | | | | | | | | | | | | | | |
Per share operating performance
(For a share outstanding throughout the
year) | | Years Ended October 31, | |
| | 2016 | | | 2015 | | | 2014 | | | 2013 | | | 2012 | |
Net asset value, beginning of year | | $ | 14.59 | | | $ | 14.48 | | | $ | 14.71 | | | $ | 11.68 | | | $ | 12.00 | |
| | | | | | | | | | | | | | | | | | | | |
Operations: | | | | | | | | | | | | | | | | | | | | |
Net investment income (1) | | | 0.14 | | | | 0.15 | | | | 0.15 | | | | 0.24 | | | | 0.17 | |
Net realized and unrealized gain (loss) | | | 0.14 | | | | 0.80 | | | | (0.15 | ) | | | 2.97 | | | | (0.37 | ) |
| | | | | | | | | | | | | | | | | | | | |
Total from investment operations * | | | 0.28 | | | | 0.95 | | | | — | | | | 3.21 | | | | (0.20 | ) |
| | | | | | | | | | | | | | | | | | | | |
Distributions to shareholders: | | | | | | | | | | | | | | | | | | | | |
Dividends from net investment income | | | (0.25 | ) | | | (0.32 | ) | | | (0.23 | ) | | | (0.18 | ) | | | (0.12 | ) |
Distributions from net realized gains | | | (0.18 | ) | | | (0.52 | ) | | | — | | | | — | | | | — | |
| | | | | | | | | | | | | | | | | | | | |
Total distributions | | | (0.43 | ) | | | (0.84 | ) | | | (0.23 | ) | | | (0.18 | ) | | | (0.12 | ) |
| | | | | | | | | | | | | | | | | | | | |
Change in net asset value for the year | | | (0.15 | ) | | | 0.11 | | | | (0.23 | ) | | | 3.03 | | | | (0.32 | ) |
| | | | | | | | | | | | | | | | | | | | |
Net asset value, end of year | | $ | 14.44 | | | $ | 14.59 | | | $ | 14.48 | | | $ | 14.71 | | | $ | 11.68 | |
| | | | | | | | | | | | | | | | | | | | |
* Includes redemption fees per share of | | | N/A | | | $ | 0.00 | (2) | | $ | 0.00 | (2) | | $ | 0.00 | (2) | | $ | 0.00 | (2) |
Total Return | | | 2.0 | % | | | 7.2 | % | | | (0.0 | )% | | | 27.8 | % | | | (1.6 | )% |
Ratios/supplemental data | | | | | | | | | | | | | | | | | | | | |
Net assets, end of year (000) | | $ | 525,808 | | | $ | 333,762 | | | $ | 237,051 | | | $ | 262,981 | | | $ | 218,793 | |
Ratio to average net assets: | | | | | | | | | | | | | | | | | | | | |
Expenses before waiver/reimbursement | | | 1.58 | % | | | 1.57 | % | | | 1.54 | % | | | 1.55 | % | | | 1.56 | % |
Expenses after waiver/reimbursement | | | 1.25 | % | | | 1.25 | % | | | 1.25 | % | | | 1.30 | %(3) | | | 1.56 | % |
Net investment income before waiver/reimbursement | | | 0.90 | % | | | 0.71 | % | | | 0.62 | % | | | 1.55 | % | | | 1.53 | % |
Net investment income after waiver/reimbursement | | | 1.23 | % | | | 1.03 | % | | | 0.91 | % | | | 1.80 | %(3) | | | 1.53 | % |
Portfolio turnover rate | | | 26 | % | | | 42 | % | | | 31 | % | | | 37 | % | | | 38 | % |
| (1) | Net investment income per share is calculated using the ending balance prior to consideration or adjustment for permanent book-to-tax differences. |
| (2) | Represents less than $0.01. |
| (3) | Expense cap of 1.25% was implemented on January 1, 2013. |
The Accompanying Notes are an Integral Part of these Financial Statements.
The Tocqueville Gold Fund
Financial Highlights
| | | | | | | | | | | | | | | | | | | | |
Per share operating performance
(For a share outstanding
throughout the year) | | Years Ended October 31, | |
| | 2016 | | | 2015 | | | 2014 | | | 2013 | | | 2012 | |
Net asset value, beginning of year | | $ | 26.04 | | | $ | 30.38 | | | $ | 38.01 | | | $ | 72.82 | | | $ | 81.97 | |
| | | | | | | | | | | | | | | | | | | | |
Operations: | | | | | | | | | | | | | | | | | | | | |
Net investment loss (1) | | | (0.33 | ) | | | (0.27 | ) | | | (0.08 | ) | | | (0.26 | ) | | | (0.35 | ) |
Net realized and unrealized gain (loss) | | | 13.61 | | | | (4.07 | ) | | | (7.55 | ) | | | (32.93 | ) | | | (7.47 | ) |
| | | | | | | | | | | | | | | | | | | | |
Total from investment operations * | | | 13.28 | | | | (4.34 | ) | | | (7.63 | ) | | | (33.19 | ) | | | (7.82 | ) |
| | | | | | | | | | | | | | | | | | | | |
Distributions to shareholders: | | | | | | | | | | | | | | | | | | | | |
Dividends from net investment income | | | — | | | | — | | | | — | | | | — | | | | — | |
Distributions from net realized gains | | | — | | | | — | | | | — | | | | (1.62 | ) | | | (1.33 | ) |
| | | | | | | | | | | | | | | | | | | | |
Total distributions | | | — | | | | — | | | | — | | | | (1.62 | ) | | | (1.33 | ) |
| | | | | | | | | | | | | | | | | | | | |
Change in net asset value for the year | | | 13.28 | | | | (4.34 | ) | | | (7.63 | ) | | | (34.81 | ) | | | (9.15 | ) |
| | | | | | | | | | | | | | | | | | | | |
Net asset value, end of year | | $ | 39.32 | | | $ | 26.04 | | | $ | 30.38 | | | $ | 38.01 | | | $ | 72.82 | |
| | | | | | | | | | | | | | | | | | | | |
* Includes redemption fees per share of | | $ | 0.01 | | | $ | 0.01 | | | $ | 0.02 | | | $ | 0.02 | | | $ | 0.02 | |
Total Return | | | 51.0 | % | | | (14.3 | )% | | | (20.1 | )% | | | (46.4 | )% | | | (9.5 | )% |
Ratios/supplemental data | | | | | | | | | | | | | | | | | | | | |
Net assets, end of year (000) | | $ | 1,365,282 | | | $ | 947,367 | | | $ | 1,138,557 | | | $ | 1,215,081 | | | $ | 2,445,913 | |
Ratio to average net assets: | | | | | | | | | | | | | | | | | | | | |
Expense | | | 1.39 | % | | | 1.43 | % | | | 1.36 | % | | | 1.34 | % | | | 1.28 | % |
Net investment loss | | | (0.91 | )% | | | (0.84 | )% | | | (0.78 | )% | | | (0.41 | )% | | | (0.56 | )% |
Portfolio turnover rate | | | 15 | % | | | 11 | % | | | 10 | % | | | 14 | % | | | 11 | % |
| (1) | Net investment loss per share is calculated using the ending balance prior to consideration or adjustment for permanent book-to-tax differences. |
The Accompanying Notes are an Integral Part of these Financial Statements.
The Delafield Fund
Financial Highlights
| | | | | | | | | | | | | | | | | | | | |
Per share operating performance
(For a share outstanding
throughout the year) | | Years Ended October 31, | |
| | 2016 | | | 2015 | | | 2014 | | | 2013 | | | 2012 | |
Net asset value, beginning of year | | $ | 28.64 | | | $ | 36.40 | | | $ | 37.13 | | | $ | 29.79 | | | $ | 27.21 | |
| | | | | | | | | | | | | | | | | | | | |
Operations: | | | | | | | | | | | | | | | | | | | | |
Net investment loss (1) | | | (0.15 | ) | | | (0.14 | ) | | | (0.10 | ) | | | (0.05 | ) | | | (0.04 | ) |
Net realized and unrealized gain (loss) | | | 0.78 | | | | (3.99 | ) | | | 0.70 | | | | 9.19 | | | | 2.99 | |
| | | | | | | | | | | | | | | | | | | | |
Total from investment operations * | | | 0.63 | | | | (4.13 | ) | | | 0.60 | | | | 9.14 | | | | 2.95 | |
| | | | | | | | | | | | | | | | | | | | |
Distributions to shareholders: | | | | | | | | | | | | | | | | | | | | |
Dividends from net investment income | | | — | | | | — | | | | — | | | | — | | | | — | |
Distributions from net realized gains | | | (2.80 | ) | | | (3.63 | ) | | | (1.33 | ) | | | (1.80 | ) | | | (0.37 | ) |
| | | | | | | | | | | | | | | | | | | | |
Total distributions | | | (2.80 | ) | | | (3.63 | ) | | | (1.33 | ) | | | (1.80 | ) | | | (0.37 | ) |
| | | | | | | | | | | | | | | | | | | | |
Change in net asset value for the year | | | (2.17 | ) | | | (7.76 | ) | | | (0.73 | ) | | | 7.34 | | | | 2.58 | |
| | | | | | | | | | | | | | | | | | | | |
Net asset value, end of year | | $ | 26.47 | | | $ | 28.64 | | | $ | 36.40 | | | $ | 37.13 | | | $ | 29.79 | |
| | | | | | | | | | | | | | | | | | | | |
* Includes redemption fees per share of | | | N/A | | | $ | 0.00 | (2) | | $ | 0.00 | (2) | | $ | 0.00 | (2) | | $ | 0.00 | (2) |
Total Return | | | 3.3 | % | | | (12.3 | )% | | | 1.6 | % | | | 32.1 | % | | | 11.0 | % |
Ratios/supplemental data | | | | | | | | | | | | | | | | | | | | |
Net assets, end of year (000) | | $ | 400,827 | | | $ | 674,525 | | | $ | 1,475,139 | | | $ | 1,759,341 | | | $ | 1,346,273 | |
Ratio to average net assets: | | | | | | | | | | | | | | | | | | | | |
Expense | | | 1.29 | % | | | 1.25 | % | | | 1.21 | % | | | 1.21 | % | | | 1.23 | % |
Net investment loss | | | (0.33 | )% | | | (0.15 | )% | | | (0.24 | )% | | | (0.15 | )% | | | (0.13 | )% |
Portfolio turnover rate | | | 39 | % | | | 19 | % | | | 34 | % | | | 34 | % | | | 49 | % |
| (1) | Net investment loss per share is calculated using the ending balance prior to consideration or adjustment for permanent book-to-tax differences. |
| (2) | Represents less than $0.01. |
The Accompanying Notes are an Integral Part of these Financial Statements.
The Tocqueville Select Fund
Financial Highlights
| | | | | | | | | | | | | | | | | | | | |
Per share operating performance
(For a share outstanding
throughout the year) | | Years Ended October 31, | |
| | 2016 | | | 2015 | | | 2014 | | | 2013 | | | 2012 | |
Net asset value, beginning of year | | $ | 12.08 | | | $ | 14.90 | | | $ | 15.57 | | | $ | 11.35 | | | $ | 11.06 | |
| | | | | | | | | | | | | | | | | | | | |
Operations: | | | | | | | | | | | | | | | | | | | | |
Net investment loss (1) | | | (0.07 | ) | | | (0.08 | ) | | | (0.07 | ) | | | (0.06 | ) | | | (0.04 | ) |
Net realized and unrealized gain (loss) | | | (0.18 | ) | | | (1.00 | ) | | | 0.94 | | | | 4.79 | | | | 0.44 | |
| | | | | | | | | | | | | | | | | | | | |
Total from investment operations * | | | (0.25 | ) | | | (1.08 | ) | | | 0.87 | | | | 4.73 | | | | 0.40 | |
| | | | | | | | | | | | | | | | | | | | |
Distributions to shareholders: | | | | | | | | | | | | | | | | | | | | |
Dividends from net investment income | | | — | | | | — | | | | — | | | | — | | | | — | |
Distributions from net realized gains | | | (0.40 | ) | | | (1.74 | ) | | | (1.54 | ) | | | (0.51 | ) | | | (0.11 | ) |
| | | | | | | | | | | | | | | | | | | | |
Total distributions | | | (0.40 | ) | | | (1.74 | ) | | | (1.54 | ) | | | (0.51 | ) | | | (0.11 | ) |
| | | | | | | | | | | | | | | | | | | | |
Change in net asset value for the year | | | (0.65 | ) | | | (2.82 | ) | | | (0.67 | ) | | | 4.22 | | | | 0.29 | |
| | | | | | | | | | | | | | | | | | | | |
Net asset value, end of year | | $ | 11.43 | | | $ | 12.08 | | | $ | 14.90 | | | $ | 15.57 | | | $ | 11.35 | |
| | | | | | | | | | | | | | | | | | | | |
* Includes redemption fees per share of | | | N/A | | | $ | 0.00 | (2) | | $ | 0.00 | (2) | | $ | 0.00 | (2) | | $ | 0.00 | (2) |
Total Return | | | (1.9 | )% | | | (8.0 | )% | | | 6.1 | % | | | 43.2 | % | | | 3.7 | % |
Ratios/supplemental data | | | | | | | | | | | | | | | | | | | | |
Net assets, end of year (000) | | $ | 63,812 | | | $ | 81,813 | | | $ | 108,060 | | | $ | 99,888 | | | $ | 84,549 | |
Ratio to average net assets: | | | | | | | | | | | | | | | | | | | | |
Expense | | | 1.37 | % | | | 1.36 | % | | | 1.32 | % | | | 1.34 | % | | | 1.37 | % |
Net investment loss | | | (0.45 | )% | | | (0.52 | )% | | | (0.50 | )% | | | (0.39 | )% | | | (0.36 | )% |
Portfolio turnover rate | | | 32 | % | | | 43 | % | | | 32 | % | | | 28 | % | | | 31 | % |
| (1) | Net investment loss per share is calculated using the ending balance prior to consideration or adjustment for permanent book-to-tax differences. |
| (2) | Represents less than $0.01. |
The Accompanying Notes are an Integral Part of these Financial Statements.
The Tocqueville Fund
Schedule of Investments as of October 31, 2016
| | | | | | | | |
| Common Stocks—96.7% | | Shares | | | Value | |
Automobiles & Components—1.5% | | | | | |
Adient plc(a) | | | 0 | | | $ | 3 | |
Ford Motor Co. | | | 350,000 | | | | 4,109,000 | |
| | | | | | | | 4,109,003 | |
Capital Goods—8.7% | | | | | |
Caterpillar, Inc. | | | 25,000 | | | | 2,086,500 | |
General Electric Co. | | | 400,000 | | | | 11,640,000 | |
Illinois Tool Works, Inc. | | | 40,000 | | | | 4,542,800 | |
Snap-on, Inc. | | | 5,000 | | | | 770,500 | |
The Boeing Co. | | | 40,000 | | | | 5,697,200 | |
| | | | | | | | 24,737,000 | |
Commercial & Professional Services—2.2% | |
Pitney Bowes, Inc. | | | 200,000 | | | | 3,568,000 | |
Steelcase, Inc.—Class A | | | 200,000 | | | | 2,670,000 | |
| | | | | | | | 6,238,000 | |
Consumer Services—2.0% | | | | | |
H&R Block, Inc. | | | 50,000 | | | | 1,148,500 | |
McDonald’s Corp. | | | 40,000 | | | | 4,502,800 | |
| | | | | | | | 5,651,300 | |
Diversified Financials—3.9% | | | | | |
Lazard Ltd.—Class A(b) | | | 100,000 | | | | 3,646,000 | |
The Bank of New York Mellon Corp. | | | 170,000 | | | | 7,355,900 | |
| | | | | | | | 11,001,900 | |
Energy—6.8% | |
Exxon Mobil Corp. | | | 120,000 | | | | 9,998,400 | |
Noble Energy, Inc. | | | 100,000 | | | | 3,447,000 | |
Schlumberger Ltd.(b) | | | 75,000 | | | | 5,867,250 | |
| | | | | | | | 19,312,650 | |
Food & Staples Retailing—2.5% | |
Wal-Mart Stores, Inc. | | | 100,000 | | | | 7,002,000 | |
Food, Beverage & Tobacco—3.7% | |
Campbell Soup Co. | | | 75,000 | | | | 4,075,500 | |
The Coca-Cola Co. | | | 150,000 | | | | 6,360,000 | |
| | | | | | | | 10,435,500 | |
Household & Personal Products—5.6% | |
Colgate-Palmolive Co. | | | 100,000 | | | | 7,136,000 | |
The Procter & Gamble Co. | | | 100,000 | | | | 8,680,000 | |
| | | | | | | | 15,816,000 | |
Insurance—3.4% | |
Aflac, Inc. | | | 100,000 | | | $ | 6,887,000 | |
XL Group Ltd.(b) | | | 75,000 | | | | 2,602,500 | |
| | | | | | | | 9,489,500 | |
Materials—6.0% | |
Alcoa, Inc. | | | 133,333 | | | | 3,829,324 | |
BHP Billiton Ltd.—ADR(b) | | | 50,000 | | | | 1,751,000 | |
EI du Pont de Nemours & Co. | | | 100,000 | | | | 6,879,000 | |
Sonoco Products Co. | | | 90,000 | | | | 4,526,100 | |
| | | | | | | | 16,985,424 | |
Media—0.9% | |
The Walt Disney Co. | | | 27,500 | | | | 2,548,975 | |
Pharmaceuticals, Biotechnology & Life Sciences—12.6% | |
Alkermes PLC(a)(b) | | | 100,000 | | | | 5,041,000 | |
Biogen, Inc.(a) | | | 5,000 | | | | 1,400,900 | |
Ionis Pharmaceuticals, Inc.(a) | | | 100,000 | | | | 2,598,000 | |
Johnson & Johnson | | | 100,000 | | | | 11,599,000 | |
Merck & Co., Inc. | | | 150,000 | | | | 8,808,000 | |
Pfizer, Inc. | | | 200,000 | | | | 6,342,000 | |
| | | | | | | | 35,788,900 | |
Retailing—4.0% | |
Amazon.com, Inc.(a) | | | 12,500 | | | | 9,872,750 | |
Macy’s, Inc. | | | 40,000 | | | | 1,459,600 | |
| | | | | | | | 11,332,350 | |
Semiconductors & Semiconductor Equipment—7.2% | |
Applied Materials, Inc. | | | 250,000 | | | | 7,270,000 | |
Intel Corp. | | | 200,000 | | | | 6,974,000 | |
QUALCOMM, Inc. | | | 90,000 | | | | 6,184,800 | |
| | | | | | | | 20,428,800 | |
Software & Services—14.7% | |
Alphabet, Inc.—Class A(a) | | | 7,000 | | | | 5,669,300 | |
Alphabet, Inc.—Class C(a) | | | 5,000 | | | | 3,922,700 | |
Automatic Data Processing, Inc. | | | 100,000 | | | | 8,706,000 | |
Facebook, Inc.—Class A(a) | | | 50,000 | | | | 6,549,500 | |
Microsoft Corp. | | | 200,000 | | | | 11,984,000 | |
Xerox Corp. | | | 500,000 | | | | 4,885,000 | |
| | | | | | | | 41,716,500 | |
The Accompanying Notes are an Integral Part of these Financial Statements.
The Tocqueville Fund
Schedule of Investments as of October 31, 2016
| | | | | | | | |
| Common Stocks—96.7% | | Shares | | | Value | |
Technology Hardware & Equipment—2.2% | |
Apple, Inc. | | | 50,000 | | | $ | 5,677,000 | |
Bio-key International, Inc.(a)(c)(d)(e)
(Originally acquired 09/16/2005, Cost $0) | | | 23,545 | | | | — | |
Diebold, Inc. | | | 25,000 | | | | 545,000 | |
| | | | | | | | 6,222,000 | |
Telecommunication Services—1.7% | |
Verizon Communications, Inc. | | | 100,000 | | | | 4,810,000 | |
Transportation—2.6% | | | | | | | | |
Delta Air Lines, Inc. | | | 175,000 | | | | 7,309,750 | |
Utilities—4.5% | | | | | | | | |
NextEra Energy, Inc. | | | 100,000 | | | | 12,800,000 | |
Total Common Stocks
(Cost $154,944,207) | | | | | | | 273,735,552 | |
Preferred Stock—0.0% | |
Health Care Equipment & Supplies—0.0% | |
Zymequest, Inc.(a) | | | 400,000 | | | | 1,600 | |
Total Preferred Stock
(Cost $—) | | | | | | | 1,600 | |
Real Estate Investment Trust (REIT)—2.3% | |
Real Estate—2.3% | |
Weyerhaeuser Co. | | | 225,000 | | | | 6,734,250 | |
Total Real Estate Investment Trust
(Cost $4,037,662) | | | | 6,734,250 | |
Exchange-Traded Fund (ETF)—0.9% | |
Metals & Mining—0.9% | | | | | | | | |
SPDR S&P Metals & Mining ETF | | | 100,000 | | | | 2,547,000 | |
Total Exchange-Traded Fund
(Cost $1,495,845) | | | | 2,547,000 | |
Money Market Fund—0.1% | |
STIT-Treasury Portfolio—Institutional Class,
0.210%(f) | | | 204,389 | | | $ | 204,389 | |
Total Short-Term Investment
(Cost $204,389) | | | | 204,389 | |
Total Investments
(Cost $160,682,103)—100.0% | | | | 283,222,791 | |
Liabilities in Excess of Other Assets—0.0% | | | | (97,042 | ) |
Total Net Assets—100.0% | | | | | | $ | 283,125,749 | |
| | | | | | | | |
Percentages are stated as a percent of net assets.
| (a) | Non-income producing security. |
| (b) | Foreign issued security. Foreign concentration (including ADR’s) was as follows: Australia 0.6%; Bermuda 2.2%; Curacao 2.1%; Ireland 1.8%. |
| (c) | Denotes a security that is either fully or partially restricted to resale. The aggregate value of restricted securities as of October 31, 2016 was $0 which represented 0.0% of net assets. |
| (d) | Security is fair valued using procedures approved by the Board of Trustees. The aggregate value of fair valued securities as of October 31, 2016 was $0 which represented 0.0% of net assets. |
| (e) | Security is considered illiquid and may be difficult to sell. |
| (f) | Rate listed is the 7-day effective yield. |
The Global Industry Classification Standard (GICS®) was developed by and/or is the exclusive property of MSCI, Inc. and Standard & Poor Financial Services LLC (“S&P”). GICS is a service mark of MSCI and S&P and has been licensed for use by U.S. Bancorp Fund Services, LLC.
The Accompanying Notes are an Integral Part of these Financial Statements.
The Tocqueville Opportunity Fund
Schedule of Investments as of October 31, 2016
| | | | | | | | |
| Common Stocks—97.3% | | Shares | | | Value | |
Automobiles & Components—0.1% | |
Adient plc—ADR(a)(b) | | | 100 | | | $ | 4,560 | |
Johnson Controls International plc(a) | | | 1,002 | | | | 40,401 | |
Lear Corp. | | | 500 | | | | 61,390 | |
| | | | | | | | 106,351 | |
Banks—2.4% | |
Bank of the Ozarks, Inc. | | | 10,000 | | | | 369,600 | |
Enterprise Financial Services Corp. | | | 7,000 | | | | 231,700 | |
Home BancShares, Inc. | | | 5,000 | | | | 107,550 | |
Pinnacle Financial Partners, Inc. | | | 18,000 | | | | 928,800 | |
Signature Bank(b) | | | 4,000 | | | | 482,240 | |
South State Corp. | | | 1,000 | | | | 73,350 | |
| | | | | | | | 2,193,240 | |
Capital Goods—7.7% | |
Acuity Brands, Inc. | | | 2,000 | | | | 447,140 | |
AO Smith Corp. | | | 20,000 | | | | 903,400 | |
Fortune Brands Home & Security, Inc. | | | 9,500 | | | | 518,985 | |
HEICO Corp. | | | 1,500 | | | | 101,340 | |
Hexcel Corp. | | | 4,500 | | | | 204,705 | |
IDEX Corp. | | | 1,000 | | | | 86,440 | |
Lennox International, Inc. | | | 3,200 | | | | 466,848 | |
Lincoln Electric Holdings, Inc. | | | 1,500 | | | | 98,745 | |
Masco Corp. | | | 500 | | | | 15,440 | |
Masonite International Corp.(a)(b) | | | 500 | | | | 28,450 | |
Nordson Corp. | | | 4,000 | | | | 400,520 | |
RBC Bearings, Inc.(b) | | | 2,500 | | | | 178,375 | |
Snap-on, Inc. | | | 2,000 | | | | 308,200 | |
Spirit AeroSystems Holdings, Inc.—Class A(b) | | | 8,000 | | | | 402,880 | |
The Middleby Corp.(b) | | | 4,000 | | | | 448,440 | |
TransDigm Group, Inc. | | | 4,800 | | | | 1,307,808 | |
United Rentals, Inc.(b) | | | 1,500 | | | | 113,490 | |
WABCO Holdings, Inc.(b) | | | 3,000 | | | | 295,380 | |
Wabtec Corp. | | | 3,500 | | | | 270,585 | |
Watsco, Inc. | | | 3,000 | | | | 411,870 | |
Woodward, Inc. | | | 2,500 | | | | 147,450 | |
| | | | | | | | 7,156,491 | |
Commercial & Professional Services—0.3% | |
Copart, Inc.(b) | | | 2,700 | | | | 141,669 | |
Equifax, Inc. | | | 500 | | | | 61,985 | |
Rentokil Initial PLC(a) | | | 30,000 | | | | 83,832 | |
| | | | | | | | 287,486 | |
Consumer Durables & Apparel—0.6% | |
Harman International Industries, Inc. | | | 500 | | | | 39,855 | |
Leggett & Platt, Inc. | | | 9,500 | | | | 435,860 | |
Mohawk Industries, Inc.(b) | | | 500 | | | | 92,150 | |
| | | | | | | | 567,865 | |
Consumer Services—1.2% | |
Domino’s Pizza, Inc. | | | 2,500 | | | | 423,100 | |
Restaurant Brands International LP(a) | | | 37 | | | | 1,641 | |
Vail Resorts, Inc. | | | 4,000 | | | | 637,760 | |
| | | | | | | | 1,062,501 | |
Diversified Financials—1.0% | |
CBOE Holdings, Inc. | | | 3,000 | | | | 189,630 | |
FactSet Research Systems, Inc. | | | 2,300 | | | | 355,856 | |
Morningstar, Inc. | | | 500 | | | | 35,315 | |
MSCI, Inc. | | | 4,500 | | | | 360,855 | |
SEI Investments Co. | | | 500 | | | | 22,165 | |
| | | | | | | | 963,821 | |
Energy—3.5% | |
Cabot Oil & Gas Corp. | | | 6,000 | | | | 125,280 | |
Concho Resources, Inc.(b) | | | 3,000 | | | | 380,820 | |
Continental Resources, Inc.(b) | | | 10,500 | | | | 513,555 | |
Diamondback Energy, Inc.(b) | | | 2,500 | | | | 228,225 | |
EOG Resources, Inc. | | | 8,000 | | | | 723,360 | |
Matador Resources Co.(b) | | | 5,000 | | | | 109,050 | |
Pioneer Natural Resources Co. | | | 4,000 | | | | 716,080 | |
US Silica Holdings, Inc. | | | 10,500 | | | | 484,995 | |
| | | | | | | | 3,281,365 | |
Food, Beverage & Tobacco—0.3% | |
Blue Buffalo Pet Products, Inc.(b) | | | 1,000 | | | | 25,120 | |
Calbee, Inc.(a) | | | 1,000 | | | | 36,331 | |
Constellation Brands, Inc.—Class A | | | 1,000 | | | | 167,120 | |
Monster Beverage Corp.(b) | | | 500 | | | | 72,170 | |
| | | | | | | | 300,741 | |
The Accompanying Notes are an Integral Part of these Financial Statements.
The Tocqueville Opportunity Fund
Schedule of Investments as of October 31, 2016
| | | | | | | | |
| Common Stocks—97.3% | | Shares | | | Value | |
Health Care Equipment & Services—4.4% | |
ABIOMED, Inc.(b) | | | 8,000 | | | $ | 839,920 | |
Align Technology, Inc.(b) | | | 2,500 | | | | 214,800 | |
athenahealth, Inc.(b) | | | 1,500 | | | | 154,980 | |
Cardiovascular Systems, Inc.(b) | | | 4,500 | | | | 105,435 | |
DENTSPLY SIRONA, Inc. | | | 1,063 | | | | 61,197 | |
DexCom, Inc.(b) | | | 6,500 | | | | 508,560 | |
Edwards Lifesciences Corp.(b) | | | 12,500 | | | | 1,190,250 | |
Glaukos Corp.(b) | | | 3,500 | | | | 116,900 | |
IDEXX Laboratories, Inc.(b) | | | 3,500 | | | | 374,990 | |
Teleflex, Inc. | | | 1,000 | | | | 143,130 | |
VCA, Inc.(b) | | | 3,500 | | | | 215,110 | |
Wright Medical Group NV(a)(b) | | | 1,500 | | | | 32,865 | |
Zeltiq Aesthetics, Inc.(b) | | | 3,000 | | | | 99,300 | |
| | | | | | | | 4,057,437 | |
Household & Personal Products—0.5% | |
Church & Dwight Co., Inc. | | | 2,000 | | | | 96,520 | |
Reckitt Benckiser Group PLC—ADR(a) | | | 5,000 | | | | 91,200 | |
Reckitt Benckiser Group PLC(a) | | | 3,000 | | | | 268,535 | |
| | | | | | | | 456,255 | |
Materials—1.8% | |
AptarGroup, Inc. | | | 1,500 | | | | 107,160 | |
Axalta Coating Systems Ltd.(a)(b) | | | 500 | | | | 12,560 | |
Crown Holdings, Inc.(b) | | | 3,000 | | | | 162,750 | |
Eagle Materials, Inc. | | | 4,000 | | | | 323,880 | |
International Flavors & Fragrances, Inc. | | | 500 | | | | 65,390 | |
Martin Marietta Materials, Inc. | | | 2,500 | | | | 463,450 | |
Packaging Corp. of America | | | 3,000 | | | | 247,500 | |
RPM International, Inc. | | | 1,500 | | | | 71,310 | |
Sealed Air Corp. | | | 2,000 | | | | 91,260 | |
Worthington Industries, Inc. | | | 3,500 | | | | 164,500 | |
| | | | | | | | 1,709,760 | |
Media—0.1% | | | | | | | | |
Liberty Media Corp - Liberty SiriusXM—Class C(b) | | | 3,000 | | | | 99,570 | |
| | | | | | | | 99,570 | |
Pharmaceuticals, Biotechnology & Life Sciences—30.2% | |
ACADIA Pharmaceuticals, Inc.(b) | | | 60,000 | | | | 1,398,600 | |
Aclaris Therapeutics, Inc.(b) | | | 5,000 | | | | 106,250 | |
Advaxis, Inc.(b) | | | 65,000 | | | | 525,850 | |
Aerie Pharmaceuticals, Inc.(b) | | | 61,500 | | | | 2,044,875 | |
Affimed NV(a)(b) | | | 4,500 | | | | 9,225 | |
Agios Pharmaceuticals, Inc.(b) | | | 500 | | | | 23,920 | |
Alder Biopharmaceuticals, Inc.(b) | | | 5,000 | | | | 121,250 | |
Alexion Pharmaceuticals, Inc.(b) | | | 4,000 | | | | 522,000 | |
Alnylam Pharmaceuticals, Inc.(b) | | | 15,000 | | | | 534,000 | |
ARIAD Pharmaceuticals, Inc.(b) | | | 10,000 | | | | 87,200 | |
Axovant Sciences Ltd.(a)(b) | | | 1,000 | | | | 12,310 | |
Bellicum Pharmaceuticals, Inc.(b) | | | 1,000 | | | | 16,560 | |
BioMarin Pharmaceutical, Inc.(b) | | | 4,000 | | | | 322,080 | |
Bluebird Bio, Inc.(b) | | | 17,500 | | | | 835,625 | |
Cancer Genetics, Inc.(b) | | | 23,800 | | | | 32,130 | |
Cellectis SA—ADR(a)(b) | | | 500 | | | | 8,840 | |
Clovis Oncology, Inc.(b) | | | 34,000 | | | | 988,720 | |
DBV Technologies SA—ADR(a)(b) | | | 15,000 | | | | 514,950 | |
Dermira, Inc.(b) | | | 7,000 | | | | 219,450 | |
Eisai Co., Ltd.(a) | | | 3,000 | | | | 191,609 | |
Fate Therapeutics, Inc.(b) | | | 22,000 | | | | 46,200 | |
Five Prime Therapeutics, Inc.(b) | | | 11,500 | | | | 558,095 | |
Forward Pharma A/S—ADR(a)(b) | | | 3,500 | | | | 68,425 | |
Genfit(a)(b) | | | 500 | | | | 9,358 | |
Genmab A/S(a)(b) | | | 8,500 | | | | 1,402,491 | |
GW Pharmaceuticals PLC—ADR(a)(b) | | | 23,500 | | | | 2,758,665 | |
Incyte Corp.(b) | | | 25,000 | | | | 2,174,250 | |
Inovio Pharmaceuticals, Inc.(b) | | | 20,000 | | | | 129,400 | |
Intra-Cellular Therapies, Inc.(b) | | | 4,000 | | | | 49,600 | |
Juno Therapeutics, Inc.(b) | | | 13,500 | | | | 327,915 | |
Kite Pharma, Inc.(b) | | | 27,500 | | | | 1,217,975 | |
La Jolla Pharmaceutical Co.(b) | | | 6,000 | | | | 105,000 | |
Lion Biotechnologies, Inc.(b) | | | 23,000 | | | | 143,750 | |
Mettler-Toledo International, Inc.(b) | | | 750 | | | | 303,060 | |
Neurocrine Biosciences, Inc.(b) | | | 15,000 | | | | 656,550 | |
The Accompanying Notes are an Integral Part of these Financial Statements.
The Tocqueville Opportunity Fund
Schedule of Investments as of October 31, 2016
| | | | | | | | |
| Common Stocks—97.3% | | Shares | | | Value | |
Ophthotech Corp.(b) | | | 33,000 | | | $ | 1,182,060 | |
Pacific Biosciences of California, Inc.(b) | | | 25,000 | | | | 212,500 | |
Portola Pharmaceuticals, Inc.(b) | | | 5,500 | | | | 99,990 | |
Regeneron Pharmaceuticals, Inc.(b) | | | 1,300 | | | | 448,526 | |
Sage Therapeutics, Inc.(b) | | | 30,500 | | | | 1,327,970 | |
Seattle Genetics, Inc.(b) | | | 20,500 | | | | 1,059,850 | |
Spark Therapeutics, Inc.(b) | | | 33,000 | | | | 1,551,330 | |
TESARO, Inc.(b) | | | 26,000 | | | | 3,142,880 | |
Ultragenyx Pharmaceutical, Inc.(b) | | | 9,500 | | | | 560,405 | |
| | | | | | | | 28,051,689 | |
Retailing—3.0% | |
Amazon.com, Inc.(b) | | | 1,200 | | | | 947,784 | |
O’Reilly Automotive, Inc.(b) | | | 200 | | | | 52,888 | |
Pool Corp. | | | 2,500 | | | | 231,450 | |
The Priceline Group, Inc.(b) | | | 200 | | | | 294,846 | |
Ulta Salon Cosmetics & Fragrance, Inc.(b) | | | 5,000 | | | | 1,216,700 | |
| | | | | | | | 2,743,668 | |
Semiconductors & Semiconductor Equipment—5.5% | |
Acacia Communications, Inc.(b) | | | 14,000 | | | | 975,660 | |
Ambarella, Inc.(a)(b) | | | 500 | | | | 30,685 | |
Cavium, Inc.(b) | | | 500 | | | | 28,225 | |
Inphi Corp.(b) | | | 44,500 | | | | 1,650,950 | |
NVIDIA Corp. | | | 34,500 | | | | 2,455,020 | |
| | | | | | | | 5,140,540 | |
Software & Services—29.3% | |
Adobe Systems, Inc.(b) | | | 7,500 | | | | 806,325 | |
Alibaba Group Holding Ltd.—ADR(a)(b) | | | 1,500 | | | | 152,535 | |
ANSYS, Inc.(b) | | | 1,000 | | | | 91,350 | |
Aspen Technology, Inc.(b) | | | 6,000 | | | | 295,440 | |
Barracuda Networks, Inc.(b) | | | 9,000 | | | | 209,880 | |
Broadridge Financial Solutions, Inc. | | | 5,500 | | | | 355,630 | |
Cadence Design Systems, Inc.(b) | | | 15,000 | | | | 383,700 | |
Cornerstone OnDemand, Inc.(b) | | | 20,000 | | | | 826,000 | |
CoStar Group, Inc.(b) | | | 200 | | | | 37,424 | |
CyberArk Software Ltd.(a)(b) | | | 1,000 | | | | 46,750 | |
Electronic Arts, Inc.(b) | | | 4,000 | | | | 314,080 | |
EPAM Systems, Inc.(b) | | | 8,500 | | | | 547,145 | |
Euronet Worldwide, Inc.(b) | | | 12,000 | | | | 954,600 | |
Fair Isaac Corp. | | | 2,500 | | | | 301,700 | |
FireEye, Inc.(b) | | | 4,000 | | | | 46,480 | |
FleetCor Technologies, Inc.(b) | | | 4,300 | | | | 753,790 | |
Fortinet, Inc.(b) | | | 11,000 | | | | 352,660 | |
Gartner, Inc.(b) | | | 4,000 | | | | 344,160 | |
Global Payments, Inc. | | | 13,500 | | | | 979,020 | |
Guidewire Software, Inc.(b) | | | 4,500 | | | | 258,525 | |
Manhattan Associates, Inc.(b) | | | 19,500 | | | | 987,480 | |
Mobileye NV(a)(b) | | | 1,000 | | | | 37,180 | |
New Relic, Inc.(b) | | | 68,000 | | | | 2,478,600 | |
Paycom Software, Inc.(b) | | | 53,500 | | | | 2,767,555 | |
Paylocity Holding Corp.(b) | | | 30,000 | | | | 1,304,700 | |
Proofpoint, Inc.(b) | | | 17,500 | | | | 1,371,650 | |
PTC, Inc.(b) | | | 3,500 | | | | 166,040 | |
ServiceNow, Inc.(b) | | | 25,000 | | | | 2,197,750 | |
Shopify, Inc.—Class A(a)(b) | | | 24,500 | | | | 1,015,525 | |
Splunk, Inc.(b) | | | 17,500 | | | | 1,053,325 | |
SS&C Technologies Holdings, Inc. | | | 7,000 | | | | 223,510 | |
Tableau Software, Inc.—Class A(b) | | | 5,000 | | | | 240,250 | |
The Ultimate Software Group, Inc.(b) | | | 9,500 | | | | 2,004,405 | |
Total System Services, Inc. | | | 3,000 | | | | 149,640 | |
Tyler Technologies, Inc.(b) | | | 6,250 | | | | 1,002,500 | |
Vantiv, Inc.—Class A(b) | | | 14,000 | | | | 817,040 | |
Workday, Inc.—Class A(b) | | | 16,000 | | | | 1,386,880 | |
Zillow Group, Inc.—Class A(b) | | | 1 | | | | 33 | |
| | | | | | | | 27,261,257 | |
Technology Hardware & Equipment—4.4% | |
Ciena Corp.(b) | | | 4,000 | | | | 77,520 | |
Fabrinet(a)(b) | | | 20,500 | | | | 778,180 | |
Finisar Corp.(b) | | | 33,500 | | | | 917,230 | |
Lumentum Holdings, Inc.(b) | | | 15,000 | | | | 504,000 | |
Oclaro, Inc.(b) | | | 55,000 | | | | 402,050 | |
Palo Alto Networks, Inc.(b) | | | 8,800 | | | | 1,353,704 | |
Universal Display Corp.(b) | | | 500 | | | | 25,850 | |
| | | | | | | | 4,058,534 | |
The Accompanying Notes are an Integral Part of these Financial Statements.
The Tocqueville Opportunity Fund
Schedule of Investments as of October 31, 2016
| | | | | | | | |
| Common Stocks—97.3% | | Shares | | | Value | |
Transportation—1.0% | |
Alaska Air Group, Inc. | | | 8,000 | | | $ | 577,760 | |
Hawaiian Holdings, Inc.(b) | | | 2,500 | | | | 112,562 | |
Spirit Airlines, Inc.(b) | | | 5,000 | | | | 239,650 | |
| | | | | | | | 929,972 | |
Total Common Stocks
(Cost $83,401,911) | | | | 90,428,543 | |
Real Estate Investment Trust (REIT)—0.0% | |
Real Estate—0.0% | |
Equinix, Inc. | | | 1 | | | | 357 | |
Total Real Estate Investment Trust
(Cost $297) | | | | 357 | |
Exchange-Traded Funds (ETFs)—1.0% | |
Emerging Markets—0.7% | |
Direxion Daily Emerging Markets Bull 3X Shares(b) | | | 10,500 | | | | 657,825 | |
Funds, Trusts, and Other Financial Vehicles—0.3% | |
SPDR S&P Regional Banking ETF | | | 6,500 | | | | 284,635 | |
Total Exchange-Traded Funds
(Cost $1,003,281) | | | | 942,460 | |
Purchased Call
Options—1.5% | | Contracts | | | | |
Banks—0.0% | |
Signature Bank
Expiration: December 2016, Exercise Price $130.00(b) | | | 75 | | | | 5,813 | |
Consumer Services—0.0% | |
Starbucks Corp.
Expiration: January 2017, Exercise Price $57.50(b) | | | 375 | | | | 19,500 | |
Pharmaceuticals, Biotechnology & Life Sciences—0.1% | |
Celgene Corp.
Expiration: January 2017,
Exercise Price $105.00(b) | | | 50 | | | | 20,000 | |
Kite Pharma, Inc.
Expiration: April 2017,
Exercise Price $55.00(b) | | | 100 | | | | 41,500 | |
| | | | | | | | 61,500 | |
Retailing—0.5% | |
Amazon.com, Inc.
Expiration: January 2017,
Exercise Price $700.00(b) | | | 30 | | | $ | 300,150 | |
The Priceline Group, Inc.
Expiration: January 2017,
Exercise Price $1,300.00(b) | | | 10 | | | | 196,000 | |
| | | | | | | | 496,150 | |
Software & Services—0.6% | |
Alphabet, Inc.
Expiration: January 2017,
Exercise Price $800.00(b) | | | 80 | | | | 158,800 | |
Facebook, Inc.
Expiration: March 2017,
Exercise Price $125.00(b) | | | 325 | | | | 412,750 | |
| | | | | | | | 571,550 | |
Technology Hardware & Equipment—0.3% | |
Palo Alto Networks, Inc.
Expiration: January 2017,
Exercise Price $155.00(b) | | | 250 | | | | 247,500 | |
Total Purchased Call Options
(Cost $1,624,875) | | | | | | | 1,402,013 | |
Short-Term
Investment—0.0% | | Shares | | | | |
Money Market Fund—0.0% | |
STIT-Treasury Portfolio—Institutional Class, 0.210%(c) | | | 27,782 | | | | 27,782 | |
Total Short-Term Investment
(Cost $27,782) | | | | 27,782 | |
Total Investments
(Cost $86,058,146)—99.8% | | | | 92,801,155 | |
Other Assets in Excess of Liabilities—0.2% | | | | 157,303 | |
Total Net Assets—100.0% | | | | | | $ | 92,958,458 | |
| | | | | | | | |
The Accompanying Notes are an Integral Part of these Financial Statements.
The Tocqueville Opportunity Fund
Schedule of Investments as of October 31, 2016
Percentages are stated as a percent of net assets.
| ADR | American Depository Receipt |
| (a) | Foreign issued security. Foreign concentration (including ADR’s) was as follows: Bermuda 0.0%; Canada 1.1%; Cayman Islands 1.0% Denmark 1.6%; France 0.6%; Ireland 0.0%; Israel 0.1%; Japan 0.2%; Netherlands 0.1%; United Kingdom 3.4%. |
| (b) | Non-income producing security. |
| (c) | Rate listed is the 7-day effective yield. |
The Accompanying Notes are an Integral Part of these Financial Statements.
The Tocqueville International Value Fund
Schedule of Investments as of October 31, 2016
| | | | | | | | |
| Common Stocks—87.8% | | Shares | | | Value | |
Australia—1.4% | | | | | | | | |
Spotless Group Holdings Ltd. | | | 9,699,280 | | | $ | 7,357,856 | |
Belgium—2.4% | | | | | | | | |
Groupe Bruxelles Lambert SA | | | 146,000 | | | | 12,551,223 | |
Canada—3.9% | | | | | | | | |
Goldcorp, Inc. | | | 550,050 | | | | 8,360,760 | |
Potash Corp of Saskatchewan, Inc. | | | 375,860 | | | | 6,119,001 | |
Superior Plus Corp. | | | 674,500 | | | | 6,004,272 | |
| | | | | | | | 20,484,033 | |
Cayman Islands—1.3% | |
Greatview Aseptic Packaging Co., Ltd. | | | 13,680,500 | | | | 6,945,283 | |
Denmark—2.1% | | | | | | | | |
ISS A/S | | | 277,114 | | | | 10,878,305 | |
Finland—1.6% | | | | | | | | |
Nokia OYJ—ADR | | | 1,820,000 | | | | 8,153,600 | |
France—15.4% | | | | | | | | |
Bollore SA | | | 2,732,850 | | | | 8,997,270 | |
Cie de Saint-Gobain | | | 241,056 | | | | 10,703,699 | |
IPSOS | | | 250,615 | | | | 8,185,246 | |
Publicis Groupe SA | | | 212,000 | | | | 14,543,212 | |
Rexel SA | | | 333,135 | | | | 4,620,351 | |
Sanofi | | | 192,700 | | | | 14,995,756 | |
Sopra Steria Group | | | 102,642 | | | | 10,442,180 | |
Zodiac Aerospace | | | 355,175 | | | | 8,631,574 | |
| | | | | | | | 81,119,288 | |
Germany—6.9% | |
Bayer AG | | | 87,000 | | | | 8,638,243 | |
Infineon Technologies AG | | | 571,615 | | | | 10,280,707 | |
Siemens AG—ADR | | | 97,175 | | | | 11,043,939 | |
Wacker Neuson SE | | | 453,934 | | | | 6,280,028 | |
| | | | | | | | 36,242,917 | |
Hong Kong—2.0% | |
Clear Media Ltd. | | | 7,686,500 | | | | 7,507,733 | |
Television Broadcasts Ltd. | | | 868,350 | | | | 3,143,335 | |
| | | | | | | | 10,651,068 | |
Ireland—3.3% | |
Allergan plc(a) | | | 33,200 | | | | 6,936,808 | |
CRH PLC | | | 324,563 | | | | 10,536,683 | |
| | | | | | | | 17,473,491 | |
Japan—16.8% | |
Amano Corp. | | | 802,400 | | | | 14,929,071 | |
FANUC Corp. | | | 46,000 | | | | 8,422,025 | |
Hitachi Ltd. | | | 2,562,440 | | | | 13,660,099 | |
Hoya Corp. | | | 191,300 | | | | 7,981,801 | |
Kao Corp. | | | 210,000 | | | | 10,805,870 | |
Makita Corp. | | | 169,800 | | | | 11,740,028 | |
MISUMI Group, Inc. | | | 266,600 | | | | 4,862,231 | |
SMC Corp. | | | 27,100 | | | | 7,855,618 | |
Toho Co., Ltd. | | | 264,000 | | | | 7,920,628 | |
| | | | | | | | 88,177,371 | |
Netherlands—3.9% | | | | | | | | |
Akzo Nobel NV | | | 170,000 | | | | 10,983,931 | |
Unilever NV—ADR | | | 226,750 | | | | 9,482,685 | |
| | | | | | | | 20,466,616 | |
Netherlands Antilles—2.0% | |
Schlumberger Ltd. | | | 136,800 | | | | 10,701,864 | |
Norway—1.2% | | | | | | | | |
Orkla ASA | | | 673,200 | | | | 6,356,644 | |
Singapore—1.0% | | | | | | | | |
Global Logistic Properties Ltd. | | | 3,931,000 | | | | 5,002,012 | |
Spain—2.0% | | | | | | | | |
Applus Services SA | | | 1,105,455 | | | | 10,606,813 | |
Switzerland—2.0% | | | | | | | | |
Novartis AG—ADR | | | 145,925 | | | | 10,363,593 | |
United Kingdom—16.6% | |
AVEVA Group PLC | | | 509,500 | | | | 11,471,774 | |
Cobham PLC | | | 4,158,000 | | | | 7,254,695 | |
Countrywide PLC | | | 2,791,200 | | | | 6,124,781 | |
DCC PLC | | | 93,375 | | | | 7,596,969 | |
Diageo PLC—ADR | | | 105,000 | | | | 11,290,650 | |
GlaxoSmithKline PLC—ADR | | | 241,400 | | | | 9,658,414 | |
Kingfisher PLC | | | 1,809,100 | | | | 7,991,590 | |
Rio Tinto PLC | | | 168,100 | | | | 5,845,754 | |
Royal Dutch Shell PLC—ADR—Class B | | | 196,000 | | | | 10,252,760 | |
The Accompanying Notes are an Integral Part of these Financial Statements.
The Tocqueville International Value Fund
Schedule of Investments as of October 31, 2016
| | | | | | | | |
| Common Stocks—87.8% | | Shares | | | Value | |
Smiths Group PLC | | | 571,170 | | | $ | 9,897,372 | |
| | | | | | | | 87,384,759 | |
United States—2.0% | |
Aflac, Inc. | | | 156,230 | | | | 10,759,560 | |
Total Common Stocks
(Cost $429,743,599) | | | | 461,676,296 | |
Preferred Stock—2.5% | |
Republic of Korea—2.5% | |
Samsung Electronics Co., Ltd. | | | 11,510 | | | | 13,233,853 | |
Total Preferred Stock
(Cost $10,295,649) | | | | | | | 13,233,853 | |
Short-Term Investments—9.4% | |
Money Market Fund—5.0% | |
STIT-Treasury Portfolio—Institutional Class, 0.210%(b) | | | 26,032,808 | | | | 26,032,808 | |
Money Market Deposit
Account—4.4% | | Principal
Amount | | | Value | |
U.S. Bank Money Market Deposit Account, 0.10% | | $ | 23,354,731 | | | | 23,354,731 | |
Total Short-Term Investments
(Cost $49,387,539) | | | | 49,387,539 | |
Total Investments
(Cost $489,426,787)—99.7% | | | | 524,297,688 | |
Other Assets in Excess of Liabilities—0.3% | | | | 1,510,370 | |
Total Net Assets—100.0% | | | $ | 525,808,058 | |
| | | | | | | | |
Percentages are stated as a percent of net assets.
ADR American Depository Receipt
| (a) | Non-income producing security. |
| (b) | Rate listed is the 7-day effective yield. |
Schedule of Open Forward Currency Contract
October 31, 2016
| | | | | | | | | | | | | | | | | | | | | | | | |
Counterparty of
Contract | | Forward
Settlement
Date | | | Currency to
be Received | | | Currency to
be Delivered | | | Amount of
Currency to
be Delivered | | | Amount of
Currency to
be Received | | | Unrealized
Appreciation | |
U.S. Bank | | | 11/10/2016 | | | | U.S. Dollars | | | | Japanese Yen | | | | 2,100,000,000 | | | | 20,560,016 | | | $ | 528,716 | |
| | | | | | | | | | | | | | | | | | | | | | | | |
| | | | | | | | | | | | | | | | | | | | | | $ | 528,716 | |
| | | | | | | | | | | | | | | | | | | | | | | | |
The Accompanying Notes are an Integral Part of these Financial Statements.
The Tocqueville Gold Fund
Schedule of Investments as of October 31, 2016
| | | | | | | | |
| Common Stocks—85.5% | | Shares | | | Value | |
Gold Related Securities—77.8% | |
Australia—3.9% | |
Evolution Mining Ltd. | | | 12,386,774 | | | $ | 21,295,098 | |
Gold Road Resources Ltd.(a) | | | 15,313,399 | | | | 6,581,623 | |
Newcrest Mining Ltd. | | | 1,500,000 | | | | 25,742,062 | |
| | | | | | | | 53,618,783 | |
Canada—61.9% | |
Agnico Eagle Mines Ltd. | | | 1,092,373 | | | | 55,492,548 | |
Agnico Eagle Mines Ltd.(b) | | | 526,485 | | | | 26,738,357 | |
Alacer Gold Corp.(a) | | | 4,091,800 | | | | 8,267,187 | |
Alamos Gold, Inc.—Class A | | | 6,636,500 | | | | 52,096,525 | |
Almaden Minerals Ltd.(a)(c)(d)(e)(f)
(Originally acquired 05/11/16, Cost $1,556,421) | | | 1,481,482 | | | | 1,937,535 | |
Almaden Minerals Ltd.(a)(b)(c) | | | 3,966,667 | | | | 5,293,621 | |
Almadex Minerals Ltd.(a) | | | 1,240,000 | | | | 1,534,631 | |
Argonaut Gold, Inc.(a) | | | 2,837,000 | | | | 5,731,954 | |
ATAC Resources Ltd.(a)(c) | | | 10,016,891 | | | | 4,107,426 | |
AuRico Metals, Inc.(a)(c) | | | 7,411,437 | | | | 6,796,442 | |
B2Gold Corp.(a) | | | 13,130,700 | | | | 37,947,723 | |
Corvus Gold, Inc.(a)(c) | | | 3,350,901 | | | | 2,131,843 | |
Corvus Gold, Inc.(a)(b)(c) | | | 13,030,000 | | | | 8,257,288 | |
Dalradian Resources, Inc.(a) | | | 1,750,000 | | | | 1,726,025 | |
Dalradian Resources, Inc.(a)(b) | | | 5,529,000 | | | | 5,399,978 | |
Detour Gold Corp.(a) | | | 4,478,200 | | | | 85,370,592 | |
East Asia Minerals Corp.(a)(c) | | | 66,484,933 | | | | 619,594 | |
Eldorado Gold Corp.(a) | | | 4,214,685 | | | | 13,318,405 | |
Eldorado Gold Corp.(a)(b) | | | 1,000,000 | | | | 3,153,657 | |
Falco Resources Ltd.(a) | | | 2,222,300 | | | | 1,789,371 | |
Franco-Nevada Corp. | | | 1,079,700 | | | | 70,667,906 | |
GoGold Resources, Inc.(a)(c) | | | 19,546,700 | | | | 9,909,607 | |
Goldcorp, Inc. | | | 551,350 | | | | 8,380,520 | |
Goldcorp, Inc.(b) | | | 1,948,910 | | | | 29,597,627 | |
International Tower Hill Mines Ltd.(a)(c) | | | 5,738,836 | | | $ | 4,296,093 | |
International Tower Hill Mines Ltd.(a)(b)(c) | | | 11,289,744 | | | | 8,501,187 | |
Jaguar Mining, Inc.(a)(c) | | | 65,858,798 | | | | 36,334,534 | |
JDL Gold Corp.(a) | | | 969,000 | | | | 1,394,296 | |
Klondex Mines Ltd.(a) | | | 2,958,500 | | | | 16,300,093 | |
Novagold Resources, Inc.(a) | | | 3,667,300 | | | | 18,336,500 | |
NuLegacy Gold Corp.(a)(c)(d)(e)(f)
(Originally acquired 10/07/16, Cost $3,236,406) | | | 9,553,152 | | | | 2,826,844 | |
NuLegacy Gold Corp.(a)(b)(c) | | | 19,535,500 | | | | 5,898,664 | |
OceanaGold Corp. | | | 4,431,459 | | | | 13,521,711 | |
OceanaGold Corp.(b) | | | 8,301,100 | | | | 25,374,271 | |
Osisko Gold Royalties Ltd. | | | 3,184,740 | | | | 33,526,078 | |
Osisko Mining, Inc.(a) | | | 1,123,239 | | | | 2,378,288 | |
Osisko Mining, Inc.(a)(b)(d)(e)(f)
(Originally acquired 09/09/16, Cost $5,760,157) | | | 2,730,000 | | | | 5,664,755 | |
Pan American Silver Corp. | | | 3,438,798 | | | | 55,123,932 | |
Premier Gold Mines Ltd.(a)(c) | | | 7,857,660 | | | | 16,520,242 | |
Richmont Mines, Inc.(a) | | | 425,000 | | | | 4,024,081 | |
Rockhaven Resources Ltd.(a)(c) | | | 6,400,000 | | | | 882,726 | |
Rubicon Minerals Corp.(a)(c) | | | 11,275,000 | | | | 378,271 | |
SEMAFO, Inc.(a)(c) | | | 10,224,200 | | | | 39,910,165 | |
Silver Wheaton Corp. | | | 1,734,575 | | | | 41,820,603 | |
Strategic Metals Ltd.(a)(c) | | | 10,463,400 | | | | 4,368,526 | |
Torex Gold Resources, Inc.(a)(c) | | | 3,278,550 | | | | 60,985,479 | |
| | | | | | | | 844,633,701 | |
Jersey—3.4% | |
Randgold Resources Ltd.—ADR | | | 524,200 | | | | 46,512,266 | |
The Accompanying Notes are an Integral Part of these Financial Statements.
The Tocqueville Gold Fund
Schedule of Investments as of October 31, 2016
| | | | | | | | |
Common
Stocks—85.5% | | Shares | | | Value | |
United Kingdom—2.2% | |
Fresnillo PLC | | | 1,495,000 | | | $ | 30,010,159 | |
United States—6.4% | |
Electrum Ltd.(a)(d)(e)(f)
(Originally acquired 12/21/07, Cost $13,065,361) | | | 2,127,287 | | | | 702,005 | |
Newmont Mining Corp. | | | 1,366,700 | | | | 50,622,568 | |
Royal Gold, Inc. | | | 525,500 | | | | 36,164,910 | |
| | | | | | | | 87,489,483 | |
Total Gold Related Securities | | | | 1,062,264,392 | |
Other Precious Metals Related Securities—7.1% | |
Canada—6.1% | | | | | | | | |
Bear Creek Mining Corp.(a)(c) | | | 7,413,200 | | | | 14,922,568 | |
Ivanhoe Mines Ltd.—Class A(a) | | | 7,882,379 | | | | 12,282,242 | |
MAG Silver Corp.(a)(c) | | | 2,945,400 | | | | 43,091,202 | |
Plata Latina Minerals Corp.(a) | | | 2,000,000 | | | | 70,827 | |
Silver Range Resources Ltd.(a) | | | 513,000 | | | | 43,983 | |
Tahoe Resources, Inc. | | | 1,094,400 | | | | 13,120,072 | |
| | | | | | | | 83,530,894 | |
United Kingdom—0.6% | |
Hochschild Mining PLC | | | 2,500,000 | | | | 8,154,935 | |
United States—0.4% | |
Sunshine Mining & Refining(a)(d)(e)(f)
(Originally acquired 03/15/11, Cost $18,353,107) | | | 1,633,545 | | | | 4,900,635 | |
Total Other Precious Metals
Related Securities | | | | 96,586,464 | |
Other Securities—0.6% | |
United States—0.6% | |
Gold Bullion International LLC(a)(c)(d)(e)(f)
(Originally acquired 05/12/10, Cost $5,000,000) | | | 5,000,000 | | | | 6,893,000 | |
I-Pulse, Inc.(a)(d)(e)(f)
(Originally acquired 10/09/07, Cost $175,524) | | | 74,532 | | | $ | 640,975 | |
Total Other Securities | | | | | | | 7,533,975 | |
Total Common Stocks
(Cost $1,236,058,520) | | | | 1,166,384,831 | |
Private Fund—1.2% | |
Gold Related Securities—1.2% | |
Tocqueville Bullion Reserve LP—
Class G (a)(c)(d)(e)(f)
(Originally acquired 11/28/11, Cost $25,000,000) | | | 13,806 | | | | 17,086,467 | |
Total Private Fund
(Cost $25,000,000) | | | | | | | 17,086,467 | |
| Gold Bullion—11.2% | | Ounces | | | | |
Gold Bullion(a) | | | 119,680 | | | | 152,866,678 | |
Total Gold Bullion
(Cost $70,975,249) | | | | | | | 152,866,678 | |
| Warrants—0.2% | | Shares | | | | |
Gold Related Securities—0.2% | |
Canada—0.2% | | | | | | | | |
Almaden Minerals Ltd. Expiration: 11/05/2017,
Exercise Price: CAD $1.00(a)(c)(d)(e)(f)
(Originally acquired 11/04/15,
Cost $0) | | | 875,000 | | | | 604,339 | |
Almaden Minerals Ltd. Expiration: 11/11/2018,
Exercise Price: CAD $2.00(a)(c)(d)(e)(f)
(Originally acquired 05/11/16,
Cost $0) | | | 740,741 | | | | 483,113 | |
The Accompanying Notes are an Integral Part of these Financial Statements.
The Tocqueville Gold Fund
Schedule of Investments as of October 31, 2016
| | | | | | | | |
| Warrants—0.2% | | Shares | | | Value | |
JDL Gold Corp.
Expiration: 04/16/2019,
Exercise Price: CAD $2.92(a)(d)(e)(f)
(Originally acquired 04/03/14,
Cost $0) | | | 150,000 | | | $ | 45,650 | |
NuLegacy Gold Corp. Expiration: 04/12/2018, Exercise Price: CAD $0.65(a)(c)(d)(e)(f)
(Originally acquired 10/07/16,
Cost $0) | | | 9,553,152 | | | | 1,124,613 | |
East Asia Minerals Corp. Expiration: 12/15/2016, Exercise Price: CAD $0.78(a)(c)(d)(e)(f)
(Originally acquired 12/05/11,
Cost $0) | | | 6,500,000 | | | | 969 | |
East Asia Minerals Corp. Expiration: 12/05/2019, Exercise Price: CAD $0.10(a)(c)(d)(e)(f)
(Originally acquired 12/05/14,
Cost $0) | | | 9,764,933 | | | | — | |
Osisko Gold Royalties Ltd. Expiration: 02/18/2022, Exercise Price:
CAD $36.50(a) | | | 274,000 | | | | 612,838 | |
Total Gold Related Securities | | | | | | | 2,871,522 | |
Total Warrants
(Cost $0) | | | | | | | 2,871,522 | |
Rights—0.0% | |
Gold Related Securities—0.0% | |
Dalradian Resources, Inc. Expiration: 07/31/2017, Exercise Price:
CAD $1.50(a) | | | 875,000 | | | | 159,826 | |
East Asia Minerals Corp.
Expiration: 03/05/2020, Exercise Price: CAD $0.10(a)(c)(d)(e)(f)
(Originally acquired 03/04/15,
Cost $0) | | | 46,175,600 | | | $ | 516,390 | |
Total Rights
(Cost $0) | | | | | | | 676,216 | |
Short-Term Investment—1.9% | |
Money Market Fund—1.9% | |
STIT-Treasury Portfolio—Institutional
Class, 0.210%(g) | | | 25,337,001 | | | | 25,337,001 | |
Total Short-Term Investment
(Cost $25,337,001) | | | | 25,337,001 | |
Total Investments
(Cost $1,357,370,770)—100.0% | | | | 1,365,222,715 | |
Other Assets in Excess of Liabilities—0.0% | | | | 59,332 | |
Total Net Assets—100.0% | | | $ | 1,365,282,047 | |
| | | | | | | | |
Percentages are stated as a percent of net assets.
ADR American Depository Receipt
| (a) | Non-income producing security. |
| (b) | Denotes an issue that is traded on a foreign exchange when a company is listed more than once. |
| (c) | Affiliated company. See Notes to Financial Statements, Footnote 8. |
| (d) | Denotes a security that is either fully or partially restricted to resale. The value of restricted securities as of October 31, 2016 was $43,427,290, which represented 3.2% of net assets. |
| (e) | Securities are fair valued using procedures approved by the Board of Trustees. The aggregate value of fair valued securities as of October 31, 2016 was $43,427,290, which represented 3.2% of net assets. |
| (f) | Security is considered illiquid and may be difficult to sell. |
| (g) | Rate listed is the 7-day effective yield. |
The Accompanying Notes are an Integral Part of these Financial Statements.
The Delafield Fund
Schedule of Investments as of October 31, 2016
| | | | | | | | |
| Common Stocks—77.6% | | Shares | | | Value | |
Aerospace & Defense—2.6% | |
Ducommun, Inc.(a) | | | 200,000 | | | $ | 3,808,000 | |
Honeywell International, Inc. | | | 60,000 | | | | 6,580,800 | |
| | | | | | | | 10,388,800 | |
Auto Components—2.6% | |
Gentex Corp. | | | 325,000 | | | | 5,495,750 | |
Horizon Global Corp.(a) | | | 250,000 | | | | 5,010,000 | |
| | | | | | | | 10,505,750 | |
Chemicals—11.7% | |
AdvanSix, Inc.(a) | | | 2,600 | | | | 41,496 | |
Calgon Carbon Corp. | | | 325,000 | | | | 5,135,000 | |
Eastman Chemical Co. | | | 215,000 | | | | 15,460,650 | |
HB Fuller Co. | | | 200,000 | | | | 8,414,000 | |
Minerals Technologies, Inc. | | | 145,000 | | | | 9,744,000 | |
PolyOne Corp. | | | 275,000 | | | | 8,038,250 | |
| | | | | | | | 46,833,396 | |
Commercial Services & Supplies—2.3% | |
Team, Inc.(a) | | | 300,000 | | | | 9,225,000 | |
Construction & Engineering—3.6% | |
KBR, Inc. | | | 555,000 | | | | 8,219,550 | |
Aegion Corp.(a) | | | 335,000 | | | | 6,200,850 | |
| | | | | | | | 14,420,400 | |
Construction Materials—1.7% | |
U.S. Concrete, Inc.(a) | | | 140,000 | | | | 6,986,000 | |
Electrical Equipment—0.9% | |
Babcock & Wilcox Enterprises, Inc.(a) | | | 225,000 | | | | 3,541,500 | |
Electronic Equipment, Instruments & Components—7.4% | |
Electro Scientific Industries, Inc.(a) | | | 290,000 | | | | 1,502,200 | |
Flex Ltd.(a)(b) | | | 700,000 | | | | 9,933,000 | |
Kemet Corp.(a) | | | 1,241,035 | | | | 4,418,084 | |
Plexus Corp.(a) | | | 120,000 | | | | 5,497,200 | |
TTM Technologies, Inc.(a) | | | 475,000 | | | | 6,246,250 | |
Zebra Technologies Corp.—Class A(a) | | | 30,000 | | | | 1,975,200 | |
| | | | | | | | 29,571,934 | |
Energy Equipment & Services—1.5% | |
Aspen Aerogels, Inc.(a) | | | 550,000 | | | $ | 3,393,500 | |
McDermott International, Inc.(a)(b) | | | 550,000 | | | | 2,827,000 | |
| | | | | | | | 6,220,500 | |
Health Care Equipment & Supplies—2.1% | |
Abbott Laboratories | | | 100,000 | | | | 3,924,000 | |
Invacare Corp. | | | 500,000 | | | | 4,575,000 | |
| | | | | | | | 8,499,000 | |
Insurance—1.0% | | | | | | | | |
XL Group Ltd(b) | | | 110,000 | | | | 3,817,000 | |
Machinery—11.3% | |
Barnes Group, Inc. | | | 190,000 | | | | 7,569,600 | |
Crane Co. | | | 110,000 | | | | 7,481,100 | |
Dover Corp. | | | 125,000 | | | | 8,361,250 | |
Harsco Corp. | | | 725,000 | | | | 7,068,750 | |
Stanley Black & Decker, Inc. | | | 80,000 | | | | 9,107,200 | |
Xerium Technologies, Inc.(a)(c) | | | 900,000 | | | | 5,580,000 | |
| | | | | | | | 45,167,900 | |
Media—1.6% | |
TEGNA, Inc. | | | 335,000 | | | | 6,572,700 | |
Metals & Mining—2.2% | |
Alcoa, Inc. | | | 125,000 | | | | 3,590,000 | |
Carpenter Technology Corp. | | | 95,000 | | | | 3,002,950 | |
Materion Corp. | | | 50,000 | | | | 1,515,000 | |
Real Industry, Inc.(a) | | | 103,746 | | | | 555,041 | |
| | | | | | | | 8,662,991 | |
Oil, Gas & Consumable Fuels—3.1% | |
Boardwalk Pipeline Partners LP | | | 580,000 | | | | 9,981,800 | |
Marathon Petroleum Corp. | | | 51,500 | | | | 2,244,885 | |
| | | | | | | | 12,226,685 | |
Professional Services—4.5% | |
Korn/Ferry International | | | 275,000 | | | | 5,607,250 | |
TrueBlue, Inc.(a) | | | 700,000 | | | | 12,250,000 | |
| | | | | | | | 17,857,250 | |
Semiconductors & Semiconductor Equipment—1.5% | |
Teradyne, Inc. | | | 265,000 | | | | 6,171,850 | |
The Accompanying Notes are an Integral Part of these Financial Statements.
The Delafield Fund
Schedule of Investments as of October 31, 2016
| | | | | | | | |
Common
Stocks—77.6% | | Shares | | | Value | |
Specialty Retail—2.3% | |
Ascena Retail Group, Inc.(a) | | | 1,250,000 | | | $ | 6,112,500 | |
Pier 1 Imports, Inc. | | | 500,000 | | | | 2,155,000 | |
Stage Stores, Inc. | | | 200,000 | | | | 1,018,000 | |
| | | | | | | | 9,285,500 | |
Technology Hardware, Storage & Peripherals—5.9% | |
Diebold, Inc. | | | 575,000 | | | | 12,535,000 | |
Hewlett Packard Enterprise Co. | | | 500,000 | | | | 11,235,000 | |
| | | | | | | | 23,770,000 | |
Textiles, Apparel & Luxury Goods—4.2% | |
G-III Apparel Group Ltd.(a) | | | 70,000 | | | | 1,828,400 | |
PVH Corp. | | | 42,000 | | | | 4,493,160 | |
Ralph Lauren Corp. | | | 45,000 | | | | 4,414,500 | |
Sequential Brands Group, Inc.(a) | | | 650,000 | | | | 4,680,000 | |
Unifi, Inc.(a) | | | 50,000 | | | | 1,437,500 | |
| | | | | | | | 16,853,560 | |
Trading Companies & Distributors—3.6% | |
Rush Enterprises, Inc.—Class A(a) | | | 225,000 | | | | 5,906,250 | |
WESCO International, Inc.(a) | | | 160,000 | | | | 8,672,000 | |
| | | | | | | | 14,578,250 | |
Total Common Stocks
(Cost $256,021,934) | | | | | | | 311,155,966 | |
Short-Term Investments—22.3% | |
Money Market Fund—5.1% | |
STIT-Treasury Portfolio—Institutional Class—0.210%(d) | | | 20,229,095 | | | | 20,229,095 | |
U.S. Bank Money Market Deposit Account, 0.10% | | $ | 68,915,759 | | | $ | 68,915,759 | |
Total Short-Term Investments
(Cost $89,144,854) | | | | 89,144,854 | |
Total Investments
(Cost $345,166,788)—99.9% | | | | 400,300,820 | |
Other Assets in Excess of Liabilities—0.1% | | | | 526,142 | |
Total Net Assets—100.0% | | | $ | 400,826,962 | |
| | | | | | | | |
Percentages are stated as a percent of net assets.
| (a) | Non-income producing security. |
| (b) | Foreign issued security. Foreign concentration was as follows: Bermuda 1.0%; Panama 0.7%; Singapore 2.5%. |
| (c) | Affiliated company. See Notes to Financial Statements, Footnote 8. |
| (d) | Rate listed is the 7-day effective yield. |
The Accompanying Notes are an Integral Part of these Financial Statements.
The Tocqueville Select Fund
Schedule of Investments as of October 31, 2016
| | | | | | | | |
| Common Stocks—85.8% | | Shares | | | Value | |
Auto Components—9.8% | |
Gentex Corp. | | | 132,000 | | | $ | 2,232,120 | |
Horizon Global Corp.(a) | | | 201,000 | | | | 4,028,040 | |
| | | | | | | | 6,260,160 | |
Chemicals—7.9% | |
Eastman Chemical Co. | | | 40,000 | | | | 2,876,400 | |
Minerals Technologies, Inc. | | | 32,400 | | | | 2,177,280 | |
| | | | | | | | 5,053,680 | |
Commercial Services & Supplies—2.4% | |
Team, Inc.(a) | | | 50,700 | | | | 1,559,025 | |
Computers & Peripherals—3.4% | |
Diebold, Inc. | | | 100,000 | | | | 2,180,000 | |
Electronic Equipment, Instruments & Components—3.7% | |
Flex Ltd.(a)(b) | | | 167,200 | | | | 2,372,568 | |
Industrial Conglomerates—2.9% | |
Carlisle Cos., Inc. | | | 17,700 | | | | 1,855,845 | |
Internet Software & Services—7.9% | |
j2 Global, Inc. | | | 54,100 | | | | 3,849,215 | |
Web.com Group, Inc.(a) | | | 74,100 | | | | 1,193,010 | |
| | | | | | | | 5,042,225 | |
IT Services—3.3% | |
EPAM Systems, Inc.(a) | | | 32,300 | | | | 2,079,151 | |
Leisure Products—2.1% | |
Summer Infant, Inc.(a)(c) | | | 631,231 | | | | 1,338,210 | |
Machinery—14.7% | |
Dover Corp. | | | 41,800 | | | | 2,796,002 | |
Harsco Corp. | | | 225,200 | | | | 2,195,700 | |
Stanley Black & Decker, Inc. | | | 23,900 | | | | 2,720,776 | |
Xerium Technologies, Inc.(a)(c) | | | 265,000 | | | | 1,643,000 | |
| | | | | | | | 9,355,478 | |
Media—3.9% | |
TEGNA, Inc. | | | 127,000 | | | | 2,491,740 | |
Metals & Mining—2.3% | |
Real Industry, Inc.(a) | | | 265,581 | | | | 1,420,858 | |
Oil, Gas & Consumable Fuels—2.6% | |
CONSOL Energy, Inc. | | | 97,900 | | | | 1,659,405 | |
Professional Services—7.8% | |
ICF International, Inc.(a) | | | 50,200 | | | | 2,329,280 | |
TrueBlue, Inc.(a) | | | 150,000 | | | $ | 2,625,000 | |
| | | | | | | | 4,954,280 | |
Specialty Retail—4.5% | |
Ascena Retail Group, Inc.(a) | | | 270,500 | | | | 1,322,745 | |
Pier 1 Imports, Inc. | | | 366,000 | | | | 1,577,460 | |
| | | | | | | | 2,900,205 | |
Textiles, Apparel & Luxury Goods—2.6% | |
Ralph Lauren Corp. | | | 17,100 | | | | 1,677,510 | |
Trading Companies & Distributors—4.0% | |
WESCO International, Inc.(a) | | | 46,900 | | | | 2,541,980 | |
Total Common Stocks
(Cost $52,616,823) | | | | 54,742,320 | |
Short-Term Investments—14.3% | | | | | |
Money Market Fund—5.0% | | | | | |
STIT-Treasury Portfolio—Institutional Class, 0.210%(d) | | | 3,206,073 | | | | 3,206,073 | |
Money Market Deposit
Account—9.3% | | Principal
Amount | | | | |
U.S. Bank Money Market Deposit Account, 0.10% | | $ | 5,940,210 | | | | 5,940,210 | |
Total Short-Term Investments
(Cost $9,146,283) | | | | 9,146,283 | |
Total Investments
(Cost $61,763,106)—100.1% | | | | 63,888,603 | |
Liabilities in Excess of Other Assets—(0.1)% | | | | (76,518 | ) |
Total Net Assets—100.0% | | | $ | 63,812,085 | |
| | | | | | | | |
Percentages are stated as a percent of net assets.
| (a) | Non-income producing security. |
| (b)Foreign | issued security. Foreign concentration was as follows: Singapore 3.7% |
| (c) | Affiliated Company. See Notes to Financial Statements, Footnote 8. |
| (d) | Rate listed is the 7-day effective yield. |
The Accompanying Notes are an Integral Part of these Financial Statements.
Percent of Total Investments
The Tocqueville Fund
Allocation of Portfolio Holdings
October 31, 2016
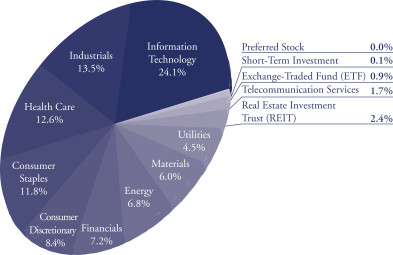
The Tocqueville Opportunity Fund
Allocation of Portfolio Holdings
October 31, 2016
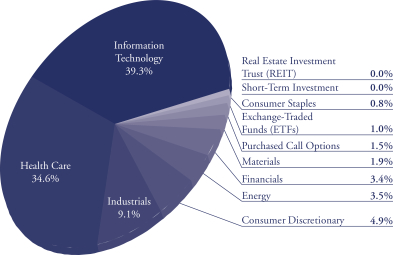
Percent of Total Investments
The Tocqueville International Value Fund
Allocation of Portfolio Holdings
October 31, 2016
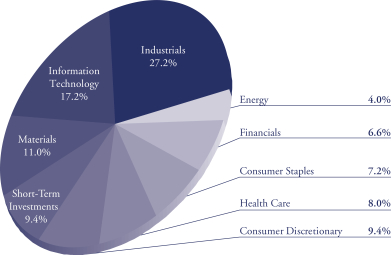
The Tocqueville Gold Fund
Allocation of Portfolio Holdings
October 31, 2016
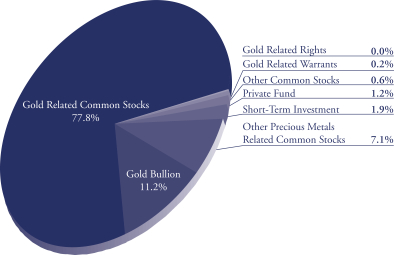
Percent of Total Investments
The Delafield Fund
Allocation of Portfolio Holdings
October 31, 2016
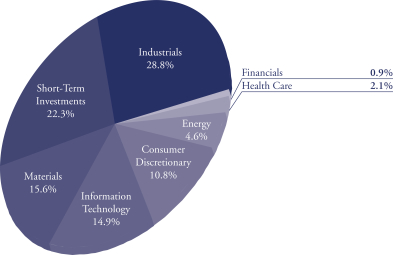
The Tocqueville Select Fund
Allocation of Portfolio Holdings
October 31, 2016

The Toqueville Trust
Statements of Assets & Liabilities
October 31, 2016
| | | | | | | | | | | | |
| | | The
Tocqueville
Fund | | | The
Tocqueville
Opportunity
Fund | | | The
Tocqueville
International
Value Fund | |
Assets: | | | | | | | | | | | | |
Investments, at value (1) | | | | | | | | | | | | |
Unaffiliated issuers | | $ | 283,222,791 | | | $ | 92,801,155 | | | $ | 524,297,688 | |
Affiliated issuers | | | — | | | | — | | | | — | |
Foreign currencies, at value (2) | | | — | | | | — | | | | 527,666 | |
Cash | | | 33 | | | | 1,175 | | | | — | |
Unrealized appreciation on forward currency contracts | | | — | | | | — | | | | 528,716 | |
Receivable for investments sold | | | — | | | | 2,210,615 | | | | 1,277,596 | |
Receivable for Fund shares sold | | | 237,818 | | | | 8,305 | | | | 2,111,602 | |
Dividends, interest and other receivables | | | 339,464 | | | | 121,746 | | | | 1,686,121 | |
Other assets | | | 13,810 | | | | 14,688 | | | | 33,142 | |
| | | | | | | | | | | | |
Total Assets | | | 283,813,916 | | | | 95,157,684 | | | | 530,462,531 | |
| | | | | | | | | | | | |
Liabilities: | | | | | | | | | | | | |
Payable for investments purchased | | | 114,894 | | | | 1,940,060 | | | | 3,552,306 | |
Payable for foreign currencies purchased | | | — | | | | — | | | | 743 | |
Payable for Fund shares redeemed | | | 228,953 | | | | 125,592 | | | | 540,641 | |
Payable to Adviser (see Note 10) | | | 180,088 | | | | 63,137 | | | | 230,419 | |
Payable to Administrator | | | 39,711 | | | | 8,676 | | | | 71,698 | |
Payable to Trustees | | | 10,182 | | | | 5,268 | | | | 24,838 | |
Accrued distribution fee | | | 44,728 | | | | 15,615 | | | | 63,308 | |
Accrued expenses and other liabilities | | | 69,611 | | | | 40,878 | | | | 170,520 | |
| | | | | | | | | | | | |
Total Liabilities | | | 688,167 | | | | 2,199,226 | | | | 4,654,473 | |
| | | | | | | | | | | | |
Net Assets | | $ | 283,125,749 | | | $ | 92,958,458 | | | $ | 525,808,058 | |
| | | | | | | | | | | | |
Net assets consist of: | | | | | | | | | | | | |
Paid in capital | | $ | 145,679,019 | | | $ | 92,637,952 | | | $ | 484,338,840 | |
Accumulated net investment income (loss) | | | 2,767,985 | | | | (868,854 | ) | | | 4,069,847 | |
Accumulated net realized gain (loss) | | | 12,138,090 | | | | (5,553,494 | ) | | | 2,067,640 | |
Net unrealized appreciation on: | | | | | | | | | | | | |
Investments and foreign currency related items | | | 122,540,655 | | | | 6,742,854 | | | | 35,331,731 | |
| | | | | | | | | | | | |
Net assets | | $ | 283,125,749 | | | $ | 92,958,458 | | | $ | 525,808,058 | |
| | | | | | | | | | | | |
Shares of beneficial interest outstanding (unlimited shares of $0.01 par value authorized) | | | 8,396,095 | | | | 4,857,293 | | | | 36,403,157 | |
Net asset value, offering and redemption price per share | | $ | 33.72 | | | $ | 19.14 | | | $ | 14.44 | |
| | | | | | | | | | | | |
(1) Cost of investments | | | | | | | | | | | | |
Unaffiliated issuers | | $ | 160,682,103 | | | $ | 86,058,146 | | | $ | 489,426,787 | |
Affiliated issuers | | $ | — | | | $ | — | | | $ | — | |
(2) Cost of foreign currencies | | $ | — | | | $ | — | | | $ | 525,712 | |
The Accompanying Notes are an Integral Part of these Financial Statements.
The Toqueville Trust
Statements of Assets & Liabilities
October 31, 2016
| | | | | | | | | | | | |
| | | The
Tocqueville
Gold Fund | | | The
Delafield Fund | | | The
Tocqueville
Select Fund | |
Assets: | | | | | | | | | | | | |
Investments, at value (1) | | | | | | | | | | | | |
Unaffiliated issuers | | $ | 1,060,543,967 | | | $ | 394,720,820 | | | $ | 60,907,393 | |
Affiliated issuers | | | 304,678,748 | | | | 5,580,000 | | | | 2,981,210 | |
Foreign currencies, at value (2) | | | 536,940 | | | | — | | | | — | |
Cash | | | — | | | | — | | | | — | |
Unrealized appreciation on forward currency contracts | | | — | | | | — | | | | — | |
Receivable for investments sold | | | — | | | | 7,107,814 | | | | — | |
Receivable for Fund shares sold | | | 2,370,086 | | | | 27,981 | | | | 6,454 | |
Dividends, interest and other receivables | | | 5,222 | | | | 91,478 | | | | 26,678 | |
Other assets | | | 23,159 | | | | 7,279 | | | | 12,098 | |
| | | | | | | | | | | | |
Total Assets | | | 1,368,158,122 | | | | 407,535,372 | | | | 63,933,833 | |
| | | | | | | | | | | | |
Liabilities: | | | | | | | | | | | | |
Payable for investments purchased | | | — | | | | 5,105,426 | | | | — | |
Payable for foreign currencies purchased | | | — | | | | — | | | | — | |
Payable for Fund shares redeemed | | | 1,108,208 | | | | 1,048,576 | | | | 31,206 | |
Payable to Adviser (see Note 10) | | | 936,644 | | | | 276,090 | | | | 44,916 | |
Payable to Administrator | | | 166,426 | | | | 61,633 | | | | 9,315 | |
Payable to Trustees | | | 70,152 | | | | 18,398 | | | | 3,393 | |
Accrued distribution fee | | | 123,248 | | | | 49,786 | | | | 9,341 | |
Accrued expenses and other liabilities | | | 471,397 | | | | 148,501 | | | | 23,577 | |
| | | | | | | | | | | | |
Total Liabilities | | | 2,876,075 | | | | 6,708,410 | | | | 121,748 | |
| | | | | | | | | | | | |
Net Assets | | $ | 1,365,282,047 | | | $ | 400,826,962 | | | $ | 63,812,085 | |
| | | | | | | | | | | | |
Net assets consist of: | | | | | | | | | | | | |
Paid in capital | | $ | 1,694,225,482 | | | $ | 277,134,489 | | | $ | 58,917,001 | |
Accumulated net investment income (loss) | | | (16,401,790 | ) | | | (2,131,051 | ) | | | (253,567 | ) |
Accumulated net realized gain (loss) | | | (320,388,490 | ) | | | 70,689,493 | | | | 3,023,154 | |
Net unrealized appreciation on: | | | | | | | | | | | | |
Investments and foreign currency related items | | | 7,846,845 | | | | 55,134,031 | | | | 2,125,497 | |
| | | | | | | | | | | | |
Net assets | | $ | 1,365,282,047 | | | $ | 400,826,962 | | | $ | 63,812,085 | |
| | | | | | | | | | | | |
Shares of beneficial interest outstanding (unlimited shares of $0.01 par value authorized) | | | 34,723,567 | | | | 15,139,866 | | | | 5,584,182 | |
Net asset value, offering and redemption price per share | | $ | 39.32 | | | $ | 26.47 | | | $ | 11.43 | |
| | | | | | | | | | | | |
(1) Cost of investments | | | | | | | | | | | | |
Unaffiliated issuers | | $ | 948,880,825 | | | $ | 333,124,470 | | | $ | 55,987,442 | |
Affiliated issuers | | $ | 408,489,945 | | | $ | 12,042,318 | | | $ | 5,775,664 | |
(2) Cost of foreign currencies | | $ | 542,040 | | | $ | — | | | $ | — | |
The Accompanying Notes are an Integral Part of these Financial Statements.
The Tocqueville Trust
Statements of Operations
For the Year Ended October 31, 2016
| | | | | | | | | | | | |
| | | The
Tocqueville
Fund | | | The
Tocqueville
Opportunity
Fund | | | The
Tocqueville
International
Value Fund | |
Investment Income: | | | | | | | | | | | | |
Dividends* | | | | | | | | | | | | |
Unaffiliated issuers | | $ | 7,074,816 | | | $ | 515,531 | | | $ | 10,613,822 | |
Affiliated issuers | | | — | | | | — | | | | — | |
Interest | | | | | | | | | | | | |
Unaffiliated issuers | | | 532 | | | | 86 | | | | 48,915 | |
Affiliated issuers | | | — | | | | — | | | | — | |
| | | | | | | | | | | | |
Total investment income | | | 7,075,348 | | | | 515,617 | | | | 10,662,737 | |
| | | | | | | | | | | | |
Expenses: | | | | | | | | | | | | |
Investment Adviser’s fee (See Note 4) | | | 2,164,019 | | | | 876,938 | | | | 4,309,341 | |
Distribution fees (See Note 4) | | | 721,340 | | | | 292,313 | | | | 1,077,335 | |
Administration fees (See Note 4) | | | 432,804 | | | | 175,388 | | | | 637,181 | |
Transfer agent and shareholder services fees | | | 87,551 | | | | 76,474 | | | | 219,446 | |
Trustee fees and expenses | | | 56,841 | | | | 27,213 | | | | 97,015 | |
Legal fees | | | 44,690 | | | | 31,434 | | | | 69,673 | |
Fund accounting fees | | | 33,671 | | | | 30,239 | | | | 71,580 | |
Blue sky fees | | | 26,673 | | | | 31,546 | | | | 40,522 | |
Audit fees | | | 21,456 | | | | 10,250 | | | | 47,349 | |
Other expenses (See Note 10) | | | 20,409 | | | | 10,528 | | | | 51,790 | |
Printing and mailing expense | | | 20,280 | | | | 15,386 | | | | 53,054 | |
Custody fees | | | 14,795 | | | | 16,163 | | | | 115,780 | |
Interest expense | | | 12,656 | | | | 18,570 | | | | — | |
Insurance expense | | | 7,391 | | | | 4,171 | | | | 9,554 | |
Registration fees | | | 1,821 | | | | 1,456 | | | | 1,640 | |
| | | | | | | | | | | | |
Total expenses before waiver | | | 3,666,397 | | | | 1,618,069 | | | | 6,801,260 | |
Less: Fees waived (See Note 4) | | | (95,153 | ) | | | — | | | | (1,414,583 | ) |
| | | | | | | | | | | | |
Net expenses | | | 3,571,244 | | | | 1,618,069 | | | | 5,386,677 | |
| | | | | | | | | | | | |
Net Investment Income (Loss) | | | 3,504,104 | | | | (1,102,452 | ) | | | 5,276,060 | |
| | | | | | | | | | | | |
The Accompanying Notes are an Integral Part of these Financial Statements.
The Tocqueville Trust
Statements of Operations
For the Year Ended October 31, 2016
| | | | | | | | | | | | |
| | | The
Tocqueville
Fund | | | The
Tocqueville
Opportunity
Fund | | | The
Tocqueville
International
Value Fund | |
Realized and Unrealized Gain (Loss): | | | | | | | | | | | | |
Net realized gain (loss) on: | | | | | | | | | | | | |
Investments | | | | | | | | | | | | |
Unaffiliated issuers | | | 14,211,029 | | | | (4,559,944 | ) | | | 4,111,782 | |
Affiliated issuers | | | — | | | | — | | | | — | |
Forward currency contracts | | | — | | | | — | | | | (421,863 | ) |
Foreign currency translation | | | 576 | | | | (5,487 | ) | | | (589,901 | ) |
| | | | | | | | | | | | |
| | | 14,211,605 | | | | (4,565,431 | ) | | | 3,100,018 | |
Net change in unrealized appreciation (depreciation) on: | | | | | | | | | | | | |
Investments | | | (5,407,479 | ) | | | (12,493,825 | ) | | | (57,827 | ) |
Forward currency contracts | | | — | | | | — | | | | 577,446 | |
Foreign currency translation | | | (33 | ) | | | 5,427 | | | | 1,858,282 | |
| | | | | | | | | | | | |
| | | (5,407,512 | ) | | | (12,488,398 | ) | | | 2,377,901 | |
| | | | | | | | | | | | |
Net gain (loss) on investments and foreign currency | | | 8,804,093 | | | | (17,053,829 | ) | | | 5,477,919 | |
| | | | | | | | | | | | |
Net Increase (Decrease) in Net Assets Resulting from Operations | | $ | 12,308,197 | | | $ | (18,156,281 | ) | | $ | 10,753,979 | |
| | | | | | | | | | | | |
* Net of foreign taxes withheld of: | | $ | 10,810 | | | $ | 978 | | | $ | 943,465 | |
| | | | | | | | | | | | |
The Accompanying Notes are an Integral Part of these Financial Statements.
The Tocqueville Trust
Statements of Operations
For the Year Ended October 31, 2016
| | | | | | | | | | | | |
| | | The
Tocqueville
Gold Fund | | | The
Delafield Fund | | | The
Tocqueville
Select Fund | |
Investment Income: | | | | | | | | | | | | |
Dividends* | | | | | | | | | | | | |
Unaffiliated issuers | | $ | 5,011,223 | | | $ | 4,494,263 | | | $ | 608,990 | |
Affiliated issuers | | | — | | | | — | | | | — | |
Interest | | | | | | | | | | | | |
Unaffiliated issuers | | | 465,071 | | | | 96,615 | | | | 7,276 | |
Affiliated issuers | | | 399,718 | | | | — | | | | — | |
| | | | | | | | | | | | |
Total investment income | | | 5,876,012 | | | | 4,590,878 | | | | 616,266 | |
| | | | | | | | | | | | |
Expenses: | | | | | | | | | | | | |
Investment Adviser’s fee (See Note 4) | | | 10,201,694 | | | | 3,685,240 | | | | 535,986 | |
Distribution fees (See Note 4) | | | 3,072,426 | | | | 1,190,828 | | | | 167,496 | |
Administration fees (See Note 4) | | | 1,651,103 | | | | 699,224 | | | | 100,497 | |
Transfer agent and shareholder services fees | | | 736,822 | | | | 163,535 | | | | 30,390 | |
Trustee fees and expenses | | | 280,545 | | | | 78,258 | | | | 13,961 | |
Legal fees | | | 230,612 | | | | 79,060 | | | | 14,245 | |
Fund accounting fees | | | 132,423 | | | | 55,418 | | | | 8,667 | |
Blue sky fees | | | 54,253 | | | | 27,618 | | | | 23,362 | |
Audit fees | | | 117,802 | | | | 21,873 | | | | 2,344 | |
Other expenses (See Note 10) | | | 84,427 | | | | 32,164 | | | | 4,804 | |
Printing and mailing expense | | | 126,544 | | | | 64,305 | | | | 7,817 | |
Custody fees | | | 308,282 | | | | 44,331 | | | | 4,975 | |
Interest expense | | | 40,244 | | | | — | | | | — | |
Insurance expense | | | 19,201 | | | | 11,908 | | | | 1,394 | |
Registration fees | | | 3,461 | | | | 4,646 | | | | 395 | |
| | | | | | | | | | | | |
Total expenses before waiver | | | 17,059,839 | | | | 6,158,408 | | | | 916,333 | |
Less: Fees waived (See Note 4) | | | — | | | | — | | | | — | |
| | | | | | | | | | | | |
Net expenses | | | 17,059,839 | | | | 6,158,408 | | | | 916,333 | |
| | | | | | | | | | | | |
Net Investment Income (Loss) | | | (11,183,827 | ) | | | (1,567,530 | ) | | | (300,067 | ) |
| | | | | | | | | | | | |
The Accompanying Notes are an Integral Part of these Financial Statements.
The Tocqueville Trust
Statements of Operations
For the Year Ended October 31, 2016
| | | | | | | | | | | | |
| | | The
Tocqueville
Gold Fund | | | The
Delafield Fund | | | The
Tocqueville
Select Fund | |
Realized and Unrealized Gain (Loss): | | | | | | | | | | | | |
Net realized gain (loss) on: | | | | | | | | | | | | |
Investments | | | | | | | | | | | | |
Unaffiliated issuers | | | (191,252,604 | ) | | | 91,857,071 | | | | 3,834,796 | |
Affililiated issuers | | | (5,611,864 | ) | | | (116,500 | ) | | | (196,525 | ) |
Forward currency contracts | | | — | | | | — | | | | — | |
Foreign currency translation | | | (401,086 | ) | | | — | | | | (167 | ) |
| | | | | | | | | | | | |
| | | (197,265,554 | ) | | | 91,740,571 | | | | 3,638,104 | |
Net change in unrealized appreciation (depreciation) on: | | | | | | | | | | | | |
Investments | | | 681,812,300 | | | | (99,178,781 | ) | | | (5,616,215 | ) |
Forward currency contracts | | | — | | | | — | | | | — | |
Foreign currency translation | | | 13,072,936 | | | | — | | | | — | |
| | | | | | | | | | | | |
| | | 694,885,236 | | | | (99,178,781 | ) | | | (5,616,215 | ) |
| | | | | | | | | | | | |
Net gain (loss) on investments and foreign currency | | | 497,619,682 | | | | (7,438,210 | ) | | | (1,978,111 | ) |
| | | | | | | | | | | | |
Net Increase (Decrease) in Net Assets Resulting from Operations | | $ | 486,435,855 | | | $ | (9,005,740 | ) | | $ | (2,278,178 | ) |
| | | | | | | | | | | | |
* Net of foreign taxes withheld of: | | $ | 635,645 | | | $ | 30,938 | | | $ | 912 | |
| | | | | | | | | | | | |
The Accompanying Notes are an Integral Part of these Financial Statements.
The Tocqueville Trust
Statements of Changes in Net Assets
| | | | | | | | | | | | | | | | | | | | | | | | |
| | | The Tocqueville Fund | | | The Tocqueville
Opportunity Fund | | | The Tocqueville
International Value Fund | |
| | | For the
Year Ended
October 31,
2016 | | | For the
Year Ended
October 31,
2015 | | | For the
Year Ended
October 31,
2016 | | | For the
Year Ended
October 31,
2015 | | | For the
Year Ended
October 31,
2016 | | | For the
Year Ended
October 31,
2015 | |
Operations: | | | | | | | | | | | | | | | | | | | | | | | | |
Net investment income (loss) | | $ | 3,504,104 | | | $ | 3,498,172 | | | $ | (1,102,452 | ) | | $ | (1,075,757 | ) | | $ | 5,276,060 | | | $ | 2,768,058 | |
Net realized gain (loss) on sale of investments and foreign currency | | | 14,211,605 | | | | 6,212,028 | | | | (4,565,431 | ) | | | 338,220 | | | | 3,100,018 | | | | 10,180,364 | |
Net change in unrealized appreciation (depreciation) | | | (5,407,512 | ) | | | (9,794,238 | ) | | | (12,488,398 | ) | | | 302,473 | | | | 2,377,901 | | | | 592,093 | |
| | | | | | | | | | | | | | | | | | | | | | | | |
Net increase (decrease) in net assets resulting from operations | | | 12,308,197 | | | | (84,038 | ) | | | (18,156,281 | ) | | | (435,064 | ) | | | 10,753,979 | | | | 13,540,515 | |
| | | | | | | | | | | | | | | | | | | | | | | | |
Dividends and distributions to shareholders: | | | | | | | | | | | | | | | | | | | | | | | | |
Net investment income | | | (3,200,195 | ) | | | (2,801,877 | ) | | | — | | | | — | | | | (5,967,776 | ) | | | (5,099,005 | ) |
Net realized gains | | | (3,072,752 | ) | | | (13,296,075 | ) | | | — | | | | (10,178,189 | ) | | | (4,247,573 | ) | | | (8,275,518 | ) |
| | | | | | | | | | | | | | | | | | | | | | | | |
Total dividends and distributions | | | (6,272,947 | ) | | | (16,097,952 | ) | | | — | | | | (10,178,189 | ) | | | (10,215,349 | ) | | | (13,374,523 | ) |
Fund share transactions: | | | | | | | | | | | | | | | | | | | | | | | | |
Shares sold | | | 25,016,349 | | | | 37,315,146 | | | | 22,021,161 | | | | 114,212,927 | | | | 301,099,948 | | | | 156,381,171 | |
Shares issued to holders in reinvestment of dividends | | | 5,849,599 | | | | 15,075,202 | | | | — | | | | 9,830,855 | | | | 9,226,995 | | | | 12,789,709 | |
Shares redeemed* | | | (63,042,445 | ) | | | (107,502,725 | ) | | | (64,362,409 | ) | | | (40,298,704 | ) | | | (118,819,277 | ) | | | (72,625,881 | ) |
| | | | | | | | | | | | | | | | | | | | | | | | |
Net increase (decrease) | | | (32,176,497 | ) | | | (55,112,377 | ) | | | (42,341,248 | ) | | | 83,745,078 | | | | 191,507,666 | | | | 96,544,999 | |
| | | | | | | | | | | | | | | | | | | | | | | | |
Net increase (decrease) in net assets | | | (26,141,247 | ) | | | (71,294,367 | ) | | | (60,497,529 | ) | | | 73,131,825 | | | | 192,046,296 | | | | 96,710,991 | |
The Accompanying Notes are an Integral Part of these Financial Statements.
The Tocqueville Trust
Statements of Changes in Net Assets
| | | | | | | | | | | | | | | | | | | | | | | | |
| | | The Tocqueville Fund | | | The Tocqueville
Opportunity Fund | | | The Tocqueville
International Value Fund | |
| | | For the
Year Ended
October 31,
2016 | | | For the
Year Ended
October 31,
2015 | | | For the
Year Ended
October 31,
2016 | | | For the
Year Ended
October 31,
2015 | | | For the
Year Ended
October 31,
2016 | | | For the
Year Ended
October 31,
2015 | |
Net Assets: | | | | | | | | | | | | | | | | | | | | | | | | |
Beginning of year | | | 309,266,996 | | | | 380,561,363 | | | | 153,455,987 | | | | 80,324,162 | | | | 333,761,762 | | | | 237,050,771 | |
| | | | | | | | | | | | | | | | | | | | | | | | |
End of year** | | $ | 283,125,749 | | | $ | 309,266,996 | | | $ | 92,958,458 | | | $ | 153,455,987 | | | $ | 525,808,058 | | | $ | 333,761,762 | |
| | | | | | | | | | | | | | | | | | | | | | | | |
* Net of redemption fees of: | | $ | — | | | $ | 14,088 | | | $ | — | | | $ | 10,031 | | | $ | — | | | $ | 7,448 | |
| | | | | | | | | | | | | | | | | | | | | | | | |
** Including undistributed net investment income (loss) of: | | $ | 2,767,985 | | | $ | 2,750,258 | | | $ | (868,854 | ) | | $ | (964,098 | ) | | $ | 4,069,847 | | | $ | 5,779,937 | |
| | | | | | | | | | | | | | | | | | | | | | | | |
The Accompanying Notes are an Integral Part of these Financial Statements.
The Tocqueville Trust
Statements of Changes in Net Assets
| | | | | | | | | | | | | | | | | | | | | | | | |
| | | The Tocqueville Gold Fund | | | The Delafield Fund | | | The Tocqueville Select Fund | |
| | | For the
Year Ended
October 31,
2016 | | | For the
Year Ended
October 31,
2015 | | | For the
Year Ended
October 31,
2016 | | | For the
Year Ended
October 31,
2015 | | | For the
Year Ended
October 31,
2016 | | | For the
Year Ended
October 31,
2015 | |
Operations: | | | | | | | | | | | | | | | | | | | | | | | | |
Net investment income (loss) | | $ | (11,183,827 | ) | | $ | (9,564,009 | ) | | $ | (1,567,530 | ) | | $ | (1,556,346 | ) | | $ | (300,067 | ) | | $ | (503,599 | ) |
Net realized gain (loss) on sale of investments and foreign currency | | | (197,265,554 | ) | | | (113,852,609 | ) | | | 91,740,571 | | | | 100,006,757 | | | | 3,638,104 | | | | 3,836,047 | |
Net change in unrealized appreciation (depreciation) | | | 694,885,236 | | | | (46,396,742 | ) | | | (99,178,781 | ) | | | (216,888,608 | ) | | | (5,616,215 | ) | | | (10,827,711 | ) |
| | | | | | | | | | | | | | | | | | | | | | | | |
Net increase (decrease) in net assets resulting from operations | | | 486,435,855 | | | | (169,813,360 | ) | | | (9,005,740 | ) | | | (118,438,197 | ) | | | (2,278,178 | ) | | | (7,495,263 | ) |
| | | | | | | | | | | | | | | | | | | | | | | | |
Dividends and distributions to shareholders: | | | | | | | | | | | | | | | | | | | | | | | | |
Net investment income | | | — | | | | — | | | | — | | | | — | | | | — | | | | — | |
Net realized gains | | | — | | | | — | | | | (62,285,610 | ) | | | (136,125,451 | ) | | | (2,573,589 | ) | | | (12,348,792 | ) |
| | | | | | | | | | | | | | | | | | | | | | | | |
Total dividends and distributions | | | — | | | | — | | | | (62,285,610 | ) | | | (136,125,451 | ) | | | (2,573,589 | ) | | | (12,348,792 | ) |
Fund share transactions: | | | | | | | | | | | | | | | | | | | | | | | | |
Shares sold | | | 424,034,799 | | | | 389,454,957 | | | | 36,427,575 | | | | 83,154,620 | | | | 4,929,975 | | | | 8,301,845 | |
Shares issued to holders in reinvestment of dividends | | | — | | | | — | | | | 59,082,717 | | | | 128,320,111 | | | | 2,508,581 | | | | 12,127,056 | |
Shares redeemed* | | | (492,555,310 | ) | | | (410,832,034 | ) | | | (297,916,569 | ) | | | (757,525,493 | ) | | | (20,587,532 | ) | | | (26,831,712 | ) |
| | | | | | | | | | | | | | | | | | | | | | | | |
Net increase (decrease) | | | (68,520,511 | ) | | | (21,377,077 | ) | | | (202,406,277 | ) | | | (546,050,762 | ) | | | (13,148,976 | ) | | | (6,402,811 | ) |
| | | | | | | | | | | | | | | | | | | | | | | | |
Net increase (decrease) in net assets | | | 417,915,344 | | | | (191,190,437 | ) | | | (273,697,627 | ) | | | (800,614,410 | ) | | | (18,000,743 | ) | | | (26,246,866 | ) |
The Accompanying Notes are an Integral Part of these Financial Statements.
The Tocqueville Trust
Statements of Changes in Net Assets
| | | | | | | | | | | | | | | | | | | | | | | | |
| | | The Tocqueville Gold Fund | | | The Delafield Fund | | | The Tocqueville Select Fund | |
| | | For the
Year Ended
October 31,
2016 | | | For the
Year Ended
October 31,
2015 | | | For the
Year Ended
October 31,
2016 | | | For the
Year Ended
October 31,
2015 | | | For the
Year Ended
October 31,
2016 | | | For the
Year Ended
October 31,
2015 | |
Net Assets: | | | | | | | | | | | | | | | | | | | | | | | | |
Beginning of year | | | 947,366,703 | | | | 1,138,557,140 | | | | 674,524,589 | | | | 1,475,138,999 | | | | 81,812,828 | | | | 108,059,694 | |
| | | | | | | | | | | | | | | | | | | | | | | | |
End of year** | | $ | 1,365,282,047 | | | $ | 947,366,703 | | | $ | 400,826,962 | | | $ | 674,524,589 | | | $ | 63,812,085 | | | $ | 81,812,828 | |
| | | | | | | | | | | | | | | | | | | | | | | | |
* Net of redemption fees of: | | $ | 324,599 | | | $ | 254,299 | | | $ | — | | | $ | 90,239 | | | $ | — | | | $ | 874 | |
| | | | | | | | | | | | | | | | | | | | | | | | |
** Including undistributed net investment income (loss) of: | | $ | (16,401,790 | ) | | $ | (8,758,830 | ) | | $ | (2,131,051 | ) | | $ | (1,818,953 | ) | | $ | (253,567 | ) | | $ | (410,830 | ) |
| | | | | | | | | | | | | | | | | | | | | | | | |
The Accompanying Notes are an Integral Part of these Financial Statements.
The Tocqueville Trust
Notes to Financial Statements
1. ORGANIZATION
The Tocqueville Trust (the “Trust”) is a Massachusetts business trust registered under the Investment Company Act of 1940 and organized on September 17, 1986, consisting of six separate funds (each, a “Fund” or, collectively, the “Funds”). Each Fund is an open-end management investment company with a different investment objective. The Tocqueville Fund, The Tocqueville Opportunity Fund (the “Opportunity Fund”), The Tocqueville International Value Fund (the “International Fund”), The Delafield Fund and The Tocqueville Select Fund (the “Select Fund”) are classified as diversified investment companies. The Tocqueville Gold Fund (the “Gold Fund”) is classified as a non-diversified investment company. The Tocqueville Fund’s investment objective is long-term capital appreciation which it seeks to achieve by investing primarily in securities of United States issuers. The Opportunity Fund’s investment objective is to achieve long-term capital appreciation which it seeks to achieve by investing in the common stocks of small and mid-cap companies which have the potential to deliver superior long term earnings growth. The International Fund’s investment objective is long-term capital appreciation consistent with preservation of capital which it seeks to achieve by investing primarily in securities of non-U.S. issuers. The Gold Fund’s investment objective is long-term capital appreciation which it seeks to achieve by investing in gold, securities of companies located throughout the world that are engaged in mining or processing gold (“gold related securities”), other precious metals and securities of companies located throughout the world that are engaged in mining or processing such other precious metals (“other precious metal securities”). The Delafield Fund’s investment objectives are to seek long-term preservation of capital (sufficient growth to outpace inflation over an extended period of time) and growth of capital which it seeks to achieve by investing primarily in the equity securities of domestic companies. The Tocqueville Select Fund’s investment objective is to achieve long-term capital appreciation by investing in a focused group of common stocks issued primarily by small and mid-sized U.S. companies. Current income is a secondary objective for The Tocqueville Select Fund.
The Delafield Fund, a series of the Trust, commenced operations on September 28, 2009 as successor to Delafield Fund, Inc. The predecessor Delafield Fund, Inc. commenced operations on November 19, 1993.
The Tocqueville Select Fund, a series of the Trust, commenced operations on September 28, 2009 as successor to the Delafield Select Fund, a series of Natixis Funds Trust II. The predecessor Delafield Select Fund commenced operations on September 29, 2008 for Class A and Class C shares and on September 26, 2008 for Class Y shares. Prior to September 29, 2008, the predecessor Delafield Select Fund operated as a Delaware limited partnership using substantially the same investment objectives and investment policies as the predecessor fund. The limited partnership was incepted in July 1998.
On April 25, 2016, the Board of Trustees of The Tocqueville Trust determined that it was advisable to liquidate, dissolve and terminate the legal existence of The Tocqueville Alternative Strategies Fund. Shareholders were notified immediately and the Fund ceased sales of Fund shares. Shareholders were given the options to redeem shares of the Fund, receive an in-kind redemptions of securities, or receive cash on the liquidation date. The liquidation was completed on May 17, 2016.
2. SIGNIFICANT ACCOUNTING POLICIES
The following is a summary of significant accounting principles followed by the Trust in the preparation of its financial statements.
a) Security valuation and security transactions
Investments in securities, including foreign securities, traded on an exchange or quoted on the over-the-counter market are valued at the last sale price or, if no sale occurred during the day, at the mean between closing bid and asked prices, as last reported by a pricing service approved by the Trustees. Securities that are principally traded on the National Association of Securities Dealers Automated Quotation National Market (“NASDAQ”) are generally valued at the NASDAQ Official Closing Price (“NOCP”). If there is no NASDAQ Official Closing Price for a NASDAQ-listed security or sale price available for an over-the-counter security, the mean of the latest bid and asked quotations from NASDAQ will be used. Investments in gold will be valued at the spot price of gold determined based on the mean of the last bid and asked price at the close of the New York Commodity Exchange. When market quotations for securities are not readily available, or when restricted securities or other assets are being valued, such assets are valued at fair value as determined in good faith by or under procedures approved by the Trustees. Money market funds are valued at market price. Money market deposit accounts are reflected at cost as this is a cash instrument. Fixed income securities are valued at market price. Fixed Income securities, such as corporate bonds, convertible bonds and U.S. government agency issues for which market quotations are not readily available may be valued based on information supplied by independent pricing services using matrix pricing formulas and/or independent broker bid quotations.
Trading in securities on foreign securities exchanges normally is completed before the calculation of the Funds’ net asset value. Trading on these foreign exchanges may not take place on all days on which there is regular trading on the New York Stock Exchange (“NYSE”), or may take place on days on which there is no regular trading on the NYSE. Similarly, the Funds may hold securities traded in domestic markets where the market may close early on a given day prior to calculation of the Funds’ net asset value. Events affecting the value of such securities held by the Funds that occur between the close of trading in the security and the close of trading on the NYSE normally will not be reflected in the Funds’ calculation of the net asset value. However, significant events will be closely monitored, and where it is determined that an adjustment should be made to the security’s value because significant interim events may materially affect the value of the
security, the security will be priced at its fair value in accordance with the procedures approved by the Trustees.
Investment and shareholder transactions are recorded on trade date. Dividend income is recognized on the ex-dividend date. Interest income is recognized on an accrual basis and includes, where applicable, the amortization of premiums and accretion of discounts. Net realized gains and losses from sales of securities are determined on the specific identification cost method.
b) Restricted and illiquid securities
The Funds may invest in securities that are subject to legal or contractual restrictions on resale or are illiquid. A security may be considered illiquid if it lacks a readily available market or if its valuation has not changed for a certain period of time. Disposal of these securities may involve time consuming negotiations and expense, and a prompt sale at the current valuation may be difficult.
c) Fair Valuation Measurements
The Trust has adopted authoritative fair valuation accounting standards which establish an authoritative definition of fair value and set out a hierarchy for measuring fair value. These standards require additional disclosures about the various inputs and valuation techniques used to develop the measurements of fair value and a discussion in changes in valuation techniques and related inputs during the year. These inputs are summarized in the three broad levels listed below.
| | • | Level 1 - Quoted prices in active markets for identical securities. |
| | • | Level 2 - Other significant observable inputs (including quoted prices for similar securities, interest rates, prepayment speeds, credit risk, etc.). |
| | • | Level 3 - Significant unobservable inputs (including the Fund’s own assumptions in determining the fair value of investments). |
When using the market quotations or closing price provided by the pricing service for equity investments, including common stocks, preferred stocks, foreign issued common stocks, exchange-traded funds, closed end mutual funds and real estate investment trusts, which are traded on an exchange are valued at the last sale price reported by the exchange on which the securities are primarily traded on the day of valuation and when the market is considered active, the security will be classified as a Level 1 security. When using the mean between the latest bid and ask price, the security will be classified as Level 2. Common stocks of the International Value Fund that are traded on non-North American exchanges are valued using matrix pricing formulas provided by an independent pricing service. These securities will generally be classified as Level 2 securities. Gold bullion is valued at the mean of the closing bid and ask prices from the New York Mercantile Exchange and is classified as a Level 2.
Investment in mutual funds, including money market funds, are generally priced at the ending net asset value (NAV) provided by the service agent of the funds and will be classified as Level 1 securities.
Debt securities, such as corporate bonds, convertible bonds, commercial paper, money market deposit accounts and U.S. government agency issues for which market quotations are not readily available may be valued based on information supplied by independent pricing services using matrix pricing formulas and/or independent broker bid quotations and are classified as Level 2. Warrants for which the underlying security is registered and equities which are subject to a required holding period, but have a comparable public issue, are valued in good faith by the adviser pursuant to procedures established under the general supervision and responsibility of the Funds’ Board of Trustees. These securities will generally be classified as Level 2 securities. If the warrant is exchange traded and the official closing price of the exchange is used, these instruments are classified as Level 1 securities. Forward currency contracts derive their value from the underlying currency prices. These are valued by a pricing service using pricing models. The models use inputs that are observed from active markets, such as exchange rates. These contracts are classified as Level 2. Options can diverge from the prices of their underlying instruments. These are valued at the composite last price reported by the exchange on which the options are primarily traded on the day of the valuation and are classified as Level 1. If there is no composite last price on a given day the mean between the latest bid and ask price will be used. These contracts are classified as Level 2.
Any securities or other assets for which market quotations are not readily available are valued at fair value as determined in good faith by the Adviser pursuant to procedures established under the general supervision and responsibility of the Funds’ Board of Trustees and will be classified as Level 3 securities. In determining fair value, a Fund will seek to assign a value to the security which it believes represents the amount that the Fund could reasonably expect to receive upon its current sale. With respect to securities that are actively traded on U.S. exchanges, the Funds expect that market quotations will generally be available and that fair value might be used only in limited circumstances, such as when trading for a security is halted during the trading day.
The Gold Fund currently invests in a private fund that primarily invests in physical gold and is subject to redemption restrictions. This private fund investment can only be disposed of with notice given 24 hours in advance of redemption. This investment is currently valued at $17,086,467 which represents 1.2% of the Gold Fund’s net assets and is classified as Level 3.
For securities traded principally on foreign exchanges, the Funds may use fair value pricing if an event occurs after the close of trading of the principal foreign exchange on which a security is traded, but before calculation of a Fund’s NAV, which a Fund believes affects the value of the security since its last market quotation. Such events may involve situations relating to a single issuer (such as news related to the issuer announced after the close of the principal foreign exchange), or situations relating to sectors of the market or the markets in general (such as significant fluctuations in the U.S. or foreign markets or significant changes in exchange rates, natural disasters, armed conflicts, or governmental actions).
In determining whether a significant event has occurred with respect to securities traded principally in foreign markets, the Funds may engage a third party fair value service provider to systematically recommend the adjustment of closing market prices of non-U.S. securities based upon changes in a designated U.S. securities market index occurring from the time of close of the relevant foreign market and the close of the NYSE. Fair value pricing may also be used to value restricted securities held by the Funds or securities with little or no trading activity for extended periods of time. Fair value pricing involves judgments that are inherently subjective and inexact and it is not possible to determine with certainty when, and to what extent, an event will affect a market price. As a result, there can be no assurance that fair value pricing will reflect actual market value and it is possible that the fair value determined for a security may differ materially from the value that could be realized upon the sale of the security.
The following is a summary of the inputs used, as of October 31, 2016, involving the Funds’ assets and liabilities carried at fair value. The inputs of methodology used for valuing securities may not be an indication of the risk associated with investing in those securities.
| | | | | | | | | | | | | | | | |
| Description | | Level 1 | | | Level 2 | | | Level 3 | | | Total | |
The Tocqueville Fund | | | | | | | | | | | | | | | | |
Assets | | | | | | | | | | | | | | | | |
Common Stocks* | | $ | 273,735,552 | | | $ | — | | | $ | — | | | $ | 273,735,552 | |
Preferred Stock* | | | — | | | | — | | | | 1,600 | | | | 1,600 | |
Real Estate Investment Trust (REIT)* | | | 6,734,250 | | | | — | | | | — | | | | 6,734,250 | |
Exchange-Traded Fund (ETF)* | | | 2,547,000 | | | | — | | | | — | | | | 2,547,000 | |
Money Market Fund | | | 204,389 | | | | — | | | | — | | | | 204,389 | |
| | | | | | | | | | | | | | | | |
Total Assets | | $ | 283,221,191 | | | $ | — | | | $ | 1,600 | | | $ | 283,222,791 | |
| | | | | | | | | | | | | | | | |
| | | | |
| The Tocqueville Opportunity Fund | | Level 1 | | | Level 2 | | | Level 3 | | | Total | |
Assets | | | | | | | | | | | | | | | | |
Common Stocks* | | $ | 90,428,543 | | | $ | — | | | $ | — | | | $ | 90,428,543 | |
Real Estate Investment Trust (REIT)* | | | 357 | | | | — | | | | — | | | | 357 | |
Exchange-Traded Funds (ETFs)* | | | 942,460 | | | | — | | | | — | | | | 942,460 | |
Purchased Call Options | | | | | | | | | | | | | | | | |
Banks | | | — | | | | 5,813 | | | | — | | | | 5,813 | |
Consumer Services | | | 19,500 | | | | — | | | | — | | | | 19,500 | |
Pharmaceuticals, Biotechnology & Life Sciences | | | 20,000 | | | | 41,500 | | | | — | | | | 61,500 | |
Retailing | | | 300,150 | | | | 196,000 | | | | — | | | | 496,150 | |
Software & Services | | | 571,550 | | | | — | | | | — | | | | 571,550 | |
Technology Hardware & Equipment | | | 247,500 | | | | — | | | | — | | | | 247,500 | |
| | | | | | | | | | | | | | | | |
Total Purchased Call Options | | | 1,158,700 | | | | 243,313 | | | | — | | | | 1,402,013 | |
Money Market Fund | | | 27,782 | | | | — | | | | — | | | | 27,782 | |
| | | | | | | | | | | | | | | | |
Total Assets | | $ | 92,557,842 | | | $ | 243,313 | | | $ | — | | | $ | 92,801,155 | |
| | | | | | | | | | | | | | | | |
| | | | | | | | | | | | | | | | |
The Tocqueville International Value
Fund | | Level 1 | | | Level 2 | | | Level 3 | | | Total | |
Assets | | | | | | | | | | | | | | | | |
Common Stocks | | | | | | | | | | | | | | | | |
Australia | | $ | — | | | $ | 7,357,856 | | | $ | — | | | $ | 7,357,856 | |
Belgium | | | — | | | | 12,551,223 | | | | — | | | | 12,551,223 | |
Canada | | | 20,484,033 | | | | — | | | | — | | | | 20,484,033 | |
Cayman Islands | | | — | | | | 6,945,283 | | | | — | | | | 6,945,283 | |
Denmark | | | — | | | | 10,878,305 | | | | — | | | | 10,878,305 | |
Finland | | | 8,153,600 | | | | — | | | | — | | | | 8,153,600 | |
France | | | — | | | | 81,119,288 | | | | — | | | | 81,119,288 | |
Germany | | | 11,043,939 | | | | 25,198,978 | | | | — | | | | 36,242,917 | |
Hong Kong | | | — | | | | 10,651,068 | | | | — | | | | 10,651,068 | |
Ireland | | | 6,936,808 | | | | 10,536,683 | | | | — | | | | 17,473,491 | |
Japan | | | — | | | | 88,177,371 | | | | — | | | | 88,177,371 | |
Netherlands | | | 9,482,685 | | | | 10,983,931 | | | | — | | | | 20,466,616 | |
Netherlands Antilles | | | 10,701,864 | | | | — | | | | — | | | | 10,701,864 | |
Norway | | | — | | | | 6,356,644 | | | | — | | | | 6,356,644 | |
Singapore | | | — | | | | 5,002,012 | | | | — | | | | 5,002,012 | |
Spain | | | — | | | | 10,606,813 | | | | — | | | | 10,606,813 | |
Switzerland | | | 10,363,593 | | | | — | | | | — | | | | 10,363,593 | |
United Kingdom | | | 31,201,824 | | | | 56,182,935 | | | | — | | | | 87,384,759 | |
United States | | | 10,759,560 | | | | — | | | | — | | | | 10,759,560 | |
| | | | | | | | | | | | | | | | |
Total Common Stocks | | | 119,127,906 | | | | 342,548,390 | | | | — | | | | 461,676,296 | |
Preferred Stock* | | | — | | | | 13,233,853 | | | | — | | | | 13,233,853 | |
Money Market Fund | | | 26,032,808 | | | | — | | | | — | | | | 26,032,808 | |
Money Market Deposit Account | | | — | | | | 23,354,731 | | | | — | | | | 23,354,731 | |
Forward Currency Contract** | | | — | | | | 528,716 | | | | — | | | | 528,716 | |
| | | | | | | | | | | | | | | | |
Total Assets | | $ | 145,160,714 | | | $ | 379,665,690 | | | $ | — | | | $ | 524,826,404 | |
| | | | | | | | | | | | | | | | |
| | | | |
| The Tocqueville Gold Fund | | Level 1 | | | Level 2 | | | Level 3 | | | Total | |
Assets | | | | | | | | | | | | | | | | |
Common Stocks | | | | | | | | | | | | | | | | |
Gold Related | | $ | 1,050,135,388 | | | $ | 11,426,999 | | | $ | 702,005 | | | $ | 1,062,264,392 | |
Other Precious Metals Related | | | 91,615,002 | | | | 70,827 | | | | 4,900,635 | | | | 96,586,464 | |
Other | | | — | | | | — | | | | 7,533,975 | | | | 7,533,975 | |
| | | | | | | | | | | | | | | | |
Total Common Stocks | | | 1,141,750,390 | | | | 11,497,826 | | | | 13,136,615 | | | | 1,166,384,831 | |
Private Fund* | | | — | | | | — | | | | 17,086,467 | | | | 17,086,467 | |
Gold Bullion | | | — | | | | 152,866,678 | | | | — | | | | 152,866,678 | |
Warrants | | | | | | | | | | | | | | | | |
Gold Related | | | 612,838 | | | | 2,258,684 | | | | — | | | | 2,871,522 | |
Rights* | | | — | | | | 676,216 | | | | — | | | | 676,216 | |
Money Market Fund | | | 25,337,001 | | | | — | | | | — | | | | 25,337,001 | |
| | | | | | | | | | | | | | | | |
Total Assets | | $ | 1,167,700,229 | | | $ | 167,299,404 | | | $ | 30,223,082 | | | $ | 1,365,222,715 | |
| | | | | | | | | �� | | | | | | | |
| | | | | | | | | | | | | | | | |
| The Delafield Fund | | Level 1 | | | Level 2 | | | Level 3 | | | Total | |
Assets | | | | | | | | | | | | | | | | |
Common Stocks* | | $ | 311,155,966 | | | $ | — | | | $ | — | | | $ | 311,155,966 | |
Money Market Fund | | | 20,229,095 | | | | — | | | | — | | | | 20,229,095 | |
Money Market Deposit Account | | | — | | | | 68,915,759 | | | | — | | | $ | 68,915,759 | |
| | | | | | | | | | | | | | | | |
Total Assets | | $ | 331,385,061 | | | $ | 68,915,759 | | | $ | — | | | $ | 400,300,820 | |
| | | | | | | | | | | | | | | | |
| | | | |
| The Tocqueville Select Fund | | Level 1 | | | Level 2 | | | Level 3 | | | Total | |
Assets | | | | | | | | | | | | | | | | |
Common Stocks* | | $ | 54,742,320 | | | $ | — | | | $ | — | | | $ | 54,742,320 | |
Money Market Fund | | | 3,206,073 | | | | — | | | | — | | | | 3,206,073 | |
Money Market Deposit Account | | | — | | | | 5,940,210 | | | | — | | | | 5,940,210 | |
| | | | | | | | | | | | | | | | |
Total Assets | | $ | 57,948,393 | | | $ | 5,940,210 | | | $ | — | | | $ | 63,888,603 | |
| | | | | | | | | | | | | | | | |
| * | For further information regarding portfolio characteristics, please see the accompanying Schedules of Investments. |
| ** | Derivative instruments not reflected in the Schedule of Investments, such as forward currency contracts, are reflected at the unrealized appreciation (depreciation) on the instrument. |
Below is a reconciliation that details the transfer of securities between Level 1 and Level 2 during the reporting year:
| | | | |
| | | The
Tocqueville
Gold Fund | |
Transfers Into Level 1 | | $ | 656,821 | |
Transfers Out of Level 1 | | | (1,068,692 | ) |
| | | | |
Net Transfers Into/(Out of ) Level 1 | | | (411,871 | ) |
| | | | |
Transfers Into Level 2 | | | 1,068,692 | |
Transfers Out of Level 2 | | | (656,821 | ) |
| | | | |
Net Transfers Into/(Out of ) Level 2 | | $ | 411,871 | |
| | | | |
Below is a reconciliation that details the activity of securities in Level 3 during the current fiscal year:
| | | | | | | | |
| | | The
Tocqueville
Fund | | | The
Tocqueville
Gold Fund | |
Beginning Balance—November 1, 2015 | | $ | — | | | $ | 35,911,551 | |
Purchases | | | 1,600 | | | | — | |
Sales | | | — | | | | (7,500,000 | ) |
Realized gains | | | — | | | | — | |
Realized losses | | | — | | | | — | |
Change in unrealized appreciation | | | — | | | | 1,811,531 | |
Transfers in/(out) of Level 3 | | | — | | | | — | |
| | | | | | | | |
Ending Balance—October 31, 2016 | | $ | 1,600 | | | $ | 30,223,082 | |
| | | | | | | | |
The movement from Level 1 to Level 2 in the Gold Fund was from the securities being priced using the mean of the bid and ask price due to the lack of trading volume on October 31, 2016. The movement from Level 2 to Level 1 in the Gold Fund was due to the use of market quotations or closing prices provided by the pricing service because the market was considered active. There were no transfers between levels in The Tocqueville Fund, The Opportunity Fund, The International Value Fund, The Delafield Fund or The Select Fund. Transfers between levels are recognized at the end of the reporting year.
As of October 31, 2016, the change in unrealized appreciation on positions still held in the Tocqueville Gold Fund was $1,811,531.
Significant Unobservable Inputs for Level 3 Portfolio Company Securities
| | | | | | | | | | | | | | |
Fund | | Type of
Security | | Industry | | Fair
Value at
10/31/2016 | | | Valuation
Techniques | | Unobservable
Inputs | | Range |
The Tocqueville Fund | | Preferred Stock | | Health Care | | | $ 1,600 | | | Latest company valuation | | Financing
prices | | $0.004 |
The Tocqueville Gold Fund | | Common Stock | | Gold Related | | | $ 702,005 | | | Latest company valuation | | Financing
prices | | $0.33 |
| | | | Other
Precious
Metals
Related | | | 4,900,635 | | | Latest company financing price | | Financing
prices | | $3.00 |
| | | | Other | | | 7,533,975 | | | Latest company financing price | | Financing
prices | | $1.38-$8.60 |
The Tocqueville Gold Fund | | Private Fund | | Gold Related | | | 17,086,467 | | | NAV from Fund Administrator | | Non-publicaly
traded NAV | | $1,237.60 |
The significant unobservable inputs used in the fair value measurement of the Tocqueville Fund’s preferred stock and the Gold Fund’s common stocks are the most recent financing prices of the portfolio company, which approximate the companies’ value in the market place. The significant unobservable inputs for the private fund is the non-publicaly traded net asset value per share determined by the private fund’s administrator.
Significant changes in the companies’ ability to receive financing for new projects in the future would be an indication of the companies’ financial position and market value.
The Trust’s valuation procedures have been adopted by the Trust’s Board of Trustees, which has established a Valuation Committee to oversee the valuation process. The Valuation Committee meets on an as needed basis to evaluate changes in the valuation of portfolio securities. The full findings and valuations are then reviewed quarterly by the Independent Trustees.
d) Derivative Instruments and Hedging Activities
The Funds’ Adviser may use derivative instruments, such as options and forward currency contracts, as a means to manage exposure to different types of risk, including market risk and exchange rate risk, and to gain exposure to underlying securities. The Trust has adopted disclosure standards in order to enable the investor to understand how and why an entity used derivatives, how derivatives are accounted for, and how derivatives affect an entity’s results of operations and financial position.
In the Opportunity Fund, the Adviser used options to gain exposure to the underlying equity security. In the International Value Fund, the Adviser used forward currency contracts to adjust exposure to foreign exchange rate risk.
Balance Sheet—Values of Derivative Instruments as of October 31, 2016.
The Tocqueville Opportunity Fund
| | | | | | | | | | | | |
| | | Asset Derivatives | | | Liability Derivatives | |
Derivatives not accounted for as hedging
instruments | | Balance Sheet
Location | | Value | | | Balance Sheet
Location | | Value | |
Purchased Options | | Investments,
at Value | | $ | 1,402,013 | | | | | $ | — | |
| | | | | | | | | | | | |
Total | | | | $ | 1,402,013 | | | | | $ | — | |
| | | | | | | | | | | | |
Tocqueville International Value Fund
| | | | | | | | | | | | |
| | | Asset Derivatives | | | Liability Derivatives | |
| | | Balance Sheet
Location | | Value | | | Balance Sheet
Location | | Value | |
Forward Currency Contract* | | Appreciation
on forward
currency
contract | | $ | 528,716 | | | | | $ | — | |
| | | | | | | | | | | | |
Total | | | | $ | 528,716 | | | | | $ | — | |
| | | | | | | | | | | | |
| * | The counterparty for the contract is disclosed in the Open Forward Currency Contract detail within the Schedule of Investments. |
| | | | | | | | |
The Effect of Derivative Instruments on the Statement of Operations for the year ended October 31, 2016. The Tocqueville Opportunity Fund | |
| | | Net Realized
Gain on Investments | | | Net Change in
Unrealized
Depreciation on
Investments | |
Purchased Options | | $ | 60,365 | | | $ | (1,731,953 | ) |
| | | | | | | | |
Total | | $ | 60,365 | | | $ | (1,731,953 | ) |
| | | | | | | | |
The Tocqueville International Value Fund
| | | | | | | | |
| | | Net Realized
Loss on Forward
Currency Contracts | | | Net Change in
Unrealized
Appreciation on
Forward Currency
Contracts | |
Foreign Currency Contract | | $ | (421,863 | ) | | $ | 577,446 | |
| | | | | | | | |
Total | | $ | (421,863 | ) | | $ | 577,446 | |
| | | | | | | | |
Derivatives Risk
The risks of using the types of derivatives in which the Funds may engage include the risk that movements in the value of the derivative may not fully offset or complement instruments currently held in the Funds in the manner intended by the Adviser; the risk that the counterparty to a derivative contract may fail to comply with their obligations to the Fund; the risk that the derivative may not possess a liquid secondary market at a time when the Fund would look to disengage the position; the risk that additional capital from the Fund may be called upon to fulfill the conditions of the derivative contract; and the risk that the cost of the derivative contracts may reduce the overall returns experienced by the Funds. The measurement of risks associated with these instruments is meaningful only when all related offsetting transactions are considered. The use of options and forward currency contracts do not create leverage in the Funds.
The average monthly value of call options in the Opportunity Fund during the year ended October 31, 2016 was $963,281.
Transactions in options in the Opportunity Fund during the year ended October 31, 2016 were as follows:
| | | | | | | | |
| | | Notional
Amount | | | Contracts | |
Outstanding, beginning of year: | | $ | 21,517,500 | | | | 1,820 | |
Options purchased | | | 51,626,250 | | | | 4,365 | |
Options terminated in closing transactions | | | (34,637,500 | ) | | | (2,960 | ) |
Options exercised | | | — | | | | — | |
Options expired | | | (16,562,500 | ) | | | (1,930 | ) |
| | | | | | | | |
Outstanding, end of year: | | $ | 21,943,750 | | | | 1,295 | |
The average monthly notional amount of forward currency contracts during the year ended October 31, 2016 was as follows:
| | | | | | | | |
| | | International
Value Fund | | | | |
Long Positions | | $ | — | | | | | |
Forward Currency Contracts | | | | | | | | |
Short Positions | | $ | 10,599,341 | | | | | |
Forward Currency Contracts | | | | | | | | |
Offsetting on the Statement of Assets and Liabilities
For financial reporting purposes, the Funds may offset financial assets and financial liabilities that are subject to master netting arrangements or similar agreements within appreciation on forward currency contracts and depreciation on forward currency contracts on the Statement of Assets and Liabilities.
As of October 31, 2016, the Funds did not have assets or liabilities that were subject to offsetting.
e) Foreign currency translation
Investments and other assets and liabilities denominated in foreign currencies are translated to U.S. dollars at the prevailing rates of exchange, in accordance with the Trust’s Portfolio Securities Valuation and Foreign Exchange Contracts Procedures. The Tocqueville Fund, The Tocqueville Opportunity Fund, The Tocqueville International Value Fund, The Tocqueville Gold Fund and The Tocqueville Select Fund have engaged in transactions in securities denominated in foreign currencies and, as a result, entered into foreign exchange transactions. The Tocqueville International Value Fund has entered into forward contracts. These Funds are exposed to additional market risk as a result of changes in the value of the underlying currency in relation to the U.S. dollar. Risks include potential inability of counterparties to meet the terms of their obligations. The value of foreign currencies are marked-to-market on a daily basis, which reflects the changes in the market value of the contract at the close of each day’s trading, resulting in daily unrealized gains and/or losses. When the transactions are settled or the contracts are closed, the Funds recognize a realized gain or loss.
The Funds isolate that portion of the results of operations resulting from changes in foreign exchange rates on investments from the fluctuations arising from changes in market prices of securities held. Such fluctuations are reflected as net realized and unrealized gain or loss on foreign currency translation.
Reported net realized foreign exchange gains or losses arise from sales of foreign currencies, currency gains or losses realized between the trade and settlement dates on securities transactions, the differences between the amounts of dividends, interest, and foreign withholding taxes recorded on the Fund’s books, and the U.S. dollar equivalent of the amounts actually received or paid. Net unrealized foreign exchange gains and losses arise from changes in the value of assets and liabilities other than investments in securities at the end of the fiscal year, resulting from changes in the exchange rates.
f) Dividends and distributions to shareholders
Dividends to shareholders are recorded on the ex-dividend date. Dividends from net investment income are declared and paid annually by the Funds. Distributions of net realized capital gains, if any, will be declared and paid at least annually. Income and capital gain distributions are determined in accordance with income tax regulations which may differ from generally accepted accounting principles. Permanent differences between financial and tax reporting may result in reclassification to capital stock.
g) Use of estimates
The preparation of financial statements in conformity with accounting principles generally accepted in the United States of America requires management to make estimates and assumptions that affect the reported amounts of assets and liabilities and disclosure of contingent assets and liabilities at the date of the financial statements and the reported amounts of revenues and expenses during the reporting year. Actual results could differ from those estimates.
h) Indemnification
In the normal course of business the Funds enter into contracts that contain general indemnification clauses. The Funds’ maximum exposure under these arrangements is unknown, as this would involve future claims against a Fund that have not yet occurred. Based on experience, the Funds expect the risk of loss to be remote.
i) Subsequent events evaluation
Effective November 1, 2016, with respect to the Tocqueville Opportunity Fund, the Delafield Fund and the Tocqueville Select Fund (each a “Fund” and collectively, the “Funds”), the Adviser for the Funds has contractually agreed to waive fees and/or reimburse expenses (“Expense Limitation Agreement”) in order to ensure that each Fund’s Total Annual Fund Operating Expenses after Fee Waiver/Expense Reimbursement do not exceed 1.25% of each Fund’s average daily net assets (excluding taxes, interest expense, acquired fund fees and expenses, or extraordinary expenses such as litigation). The Expense Limitation Agreement will remain in effect until at least March 1, 2018 and may not be terminated by the Adviser before such time.
In preparing these financial statements, the Trust has evaluated events and transactions for potential recognition or disclosure resulting from subsequent events through the date financial statements were available to be issued. This evaluation did not result in any subsequent events, other than those noted above, that necessitated disclosure and/or adjustments.
j) Recent Accounting Pronouncement
In May 2015, the Financial Accounting Standards Board (“FASB”) issued Accounting Standards Update (“ASU”) No. 2015-07 “Disclosure for Investments in Certain Entities that Calculate Net Asset Value per Share (or Its Equivalent)”. The amendments in ASU No. 2015-07 remove the requirement to categorize within the fair value hierarchy investments measured using the NAV practical expedient. The ASU also removes certain disclosure requirements for investments that qualify, but do not utilize, the NAV practical expedient. The amendments in the ASU are effective for fiscal years beginning after December 15, 2015, and interim periods within those fiscal years. Management is currently evaluating the impact these changes will have on the Fund’s financial statements and related disclosures.
3. FEDERAL INCOME TAX
There is no tax liability resulting from unrecognized tax benefits relating to uncertain income tax positions taken or expected to be taken on the tax return for the fiscal year-end October 31, 2016, or for any other tax years which are open for exam. As of October 31, 2016, open tax years include the tax years ended October 31, 2013 through 2016. The Trust is also not aware of any tax positions for which it is reasonably possible that the total amounts of unrecognized tax benefits will significantly change in the next six months. The Funds recognize
interest and penalties, if any, related to unrecognized tax benefits as income tax expense in the Statement of Operations. During the year, the Funds did not incur any interest or penalties.
Provision for federal income taxes or excise taxes has not been made since the Funds have elected to be taxed as Regulated Investment Companies and intend to distribute substantially all taxable income to shareholders and otherwise comply with the provisions of the Internal Revenue Code applicable to Regulated Investment Companies. Distributions from net realized gains for book purposes may include short-term capital gains which are included as ordinary income to shareholders for tax purposes. Additionally, accounting principles generally accepted in the United States of America require that certain components of net assets relating to permanent differences be reclassified between financial and tax reporting. These reclassifications have no effect on net assets or net asset value per share. For the year ended October 31, 2016, the following table shows the reclassifications made:
| | | | | | | | | | | | |
| | | Undistributed
Net Investment
Income/(Loss) | | | Accumulated Net
Realized
Gain/(Loss) | | | Paid In Capital | |
Tocqueville Fund | | $ | (286,182 | ) | | $ | (1,966,070 | ) | | $ | 2,252,252 | |
Opportunity Fund | | | 1,197,696 | | | | (41,598 | ) | | | (1,156,098 | ) |
International Value Fund | | | (1,018,374 | ) | | | (621,812 | ) | | | 1,640,186 | |
Gold Fund | | | 3,540,867 | | | | 401,085 | | | | (3,941,952 | ) |
Delafield Fund | | | 1,255,432 | | | | (21,428,918 | ) | | | 20,173,486 | |
Select Fund | | | 457,330 | | | | (614,925 | ) | | | 157,595 | |
The permanent differences primarily relate to net operating losses, foreign currency reclasses, the usage of tax equalization, Partnerships, and PFICs.
As of October 31, 2016, the components of accumulated earnings (losses) for income tax purposes were as follows:
| | | | | | | | | | | | | | | | | | | | | | | | |
| | | Tocqueville
Fund | | | Opportunity
Fund | | | International
Value Fund | | | Gold
Fund | | | Delafield Fund | | | Select Fund | |
Tax cost of Investments | | $ | 160,789,511 | | | $ | 87,319,957 | | | $ | 491,551,224 | | | $ | 1,373,772,582 | | | $ | 346,326,461 | | | $ | 61,771,903 | |
| | | | | | | | | | | | | | | | | | | | | | | | |
Unrealized Appreciation | | | 122,667,226 | | | | 14,522,310 | | | | 62,985,744 | | | | 389,453,381 | | | | 81,677,597 | | | | 12,593,122 | |
Unrealized Depreciation | | | (233,946 | ) | | | (9,041,112 | ) | | | (30,239,280 | ) | | | (398,003,248 | ) | | | (27,703,238 | ) | | | (10,476,422 | ) |
| | | | | | | | | | | | | | | | | | | | | | | | |
Net unrealized appreciation (depreciation) | | | 122,433,280 | | | | 5,481,198 | | | | 32,746,464 | | | | (8,549,867 | ) | | | 53,974,359 | | | | 2,116,700 | |
| | | | | | | | | | | | | | | | | | | | | | | | |
Undistributed operating income | | | 2,767,985 | | | | — | | | | 5,348,368 | | | | — | | | | — | | | | — | |
Undistributed long-term gains | | | 12,245,498 | | | | — | | | | 2,913,556 | | | | — | | | | 71,259,379 | | | | 3,023,154 | |
| | | | | | | | | | | | | | | | | | | | | | | | |
Distributable earnings | | | 15,013,483 | | | | — | | | | 8,261,924 | | | | — | | | | 71,259,379 | | | | 3,023,154 | |
| | | | | | | | | | | | | | | | | | | | | | | | |
Other accumulated gain/(loss) | | | (33 | ) | | | (5,160,692 | ) | | | 460,830 | | | | (320,393,568 | ) | | | (1,541,265 | ) | | | (244,770 | ) |
| | | | | | | | | | | | | | | | | | | | | | | | |
Total accumulated gain | | $ | 137,446,730 | | | $ | 320,506 | | | $ | 41,469,218 | | | $ | (328,943,435 | ) | | $ | 123,692,473 | | | $ | 4,895,084 | |
| | | | | | | | | | | | | | | | | | | | | | | | |
The difference between book-basis and tax-basis unrealized appreciation is attributable primarily to wash sale deferrals and passive foreign investment companies (PFIC’s).
The tax character of distributions paid during the years ended October 31, 2016 and 2015 was as follows:
| | | | | | | | | | | | |
| | | October 31, 2016 | |
| | | Ordinary
Income | | | Long Term
Capital Gain | | | Total | |
Tocqueville Fund | | $
| 3,200,195
|
| | $ | 3,072,752 | | | $ | 6,272,947 | |
Opportunity Fund | | | — | | | | — | | | | — | |
International Value Fund | | | 5,967,776 | | | | 4,247,573 | | | | 10,215,349 | |
Gold Fund | | | — | | | | — | | | | — | |
Delafield Fund | | | — | | | | 62,285,610 | | | | 62,285,610 | |
Select Fund | | | — | | | | 2,573,589 | | | | 2,573,589 | |
| |
| | | October 31, 2015 | |
| | | Ordinary
Income | | | Long Term
Capital Gain | | | Total | |
Tocqueville Fund | | $ | 2,801,877 | | | $ | 13,296,075 | | | $ | 16,097,952 | |
Opportunity Fund | | | 787,557 | | | | 9,390,632 | | | | 10,178,189 | |
International Value Fund | | | 5,099,005 | | | | 8,275,518 | | | | 13,374,523 | |
Gold Fund | | | — | | | | — | | | | — | |
Delafield Fund | | | — | | | | 136,125,451 | | | | 136,125,451 | |
Select Fund | | | — | | | | 12,348,792 | | | | 12,348,792 | |
The Fund designated as long-term capital gain dividend, pursuant to Internal Revenue Code Section 852(b)(3), the amount necessary to reduce the earnings and profits of the Funds related to net capital gain to zero for the tax years ended October 31, 2016 and 2015.
For the fiscal year ended October 31, 2016 the Opportunity Fund, Delafield Fund, and Select Fund had late year losses of $868,854, $1,541,264 and $244,770, respectively.
At October 31, 2016 certain Funds had tax basis capital losses which may be carried forward to offset future capital gains as shown below.
| | | | | | | | |
| | | Capital Losses Expiring | |
| | | Indefinite Short Term | | | Indefinite Long Term | |
Opportunity Fund | | $ | 4,291,683 | | | $ | — | |
Gold Fund | | | — | | | | 320,388,468 | |
To the extent that Funds listed above may realize future net capital gains, those gains will be offset by any of their unused respective capital loss carryforwards
4. INVESTMENT ADVISORY AND OTHER AGREEMENTS
Tocqueville Asset Management L.P. (“Tocqueville”) is the investment adviser (the “Adviser”) to the Trust under Investment Advisory Agreements approved by shareholders. For its services, Tocqueville receives fees from The Tocqueville Fund, calculated daily and payable monthly, at an annual rate of 0.75% on the first $1 billion of the average daily net assets of the Fund, and 0.65% of the average daily net assets in excess of $1 billion. Tocqueville receives fees from The Tocqueville Opportunity Fund, calculated daily and payable monthly, at an annual rate of 0.75% on the first $500 million of the average daily net assets of the Fund, and 0.65% of the average daily net assets in excess of $500 million. Tocqueville receives fees from The Tocqueville International Value Fund, calculated daily and payable monthly, at an annual rate of 1.00% on the first $1 billion of the average daily net assets of the Fund, and 0.75% of the average daily net assets in excess of $1 billion. Tocqueville receives fees from The Tocqueville Gold Fund, calculated daily and payable monthly, at an annual rate of 1.00% on the first $500 million of the average daily net assets of the Fund, 0.75% of the average daily net assets in excess of $500 million but not exceeding $1 billion, and 0.65% of the average daily net assets in excess of $1 billion. Tocqueville receives fees from The Delafield Fund, calculated daily and payable monthly, at an annual rate of 0.80% on the first $250 million of net assets of the Fund; 0.75% on the next $250 million of net assets of the Fund; 0.70% on the next $500 million of net assets of the Fund; and 0.65% on all net assets of the Fund over $1 billion. Tocqueville receives fees from The Tocqueville Select Fund, calculated daily and payable monthly, at an annual rate of 0.80% on all net assets of the Fund.
With respect to The Tocqueville Fund and The Tocqueville International Value Fund, the Adviser has contractually agreed to waive its advisory fees and/or reimburse expenses in order to ensure that The Tocqueville Fund’s and The Tocqueville International Value Fund’s total annual operating expenses do not exceed 1.25% of its average daily net assets (excluding taxes, interest expense, acquired fund fees and expenses, or extraordinary expenses such as litigation). The Expense Limitation Agreements will remain in effect until March 1, 2018 for each fund. For the fiscal year ended October 31, 2016, the Adviser waived $95,153 and $1,414,583 of the advisory fee for The Tocqueville Fund and The Tocqueville International Value Fund respectively. Such amounts are not subject to recoupment by the Adviser.
Pursuant to an Administrative Services Agreement, each Fund pays to the Adviser a fee computed and paid monthly at an annual rate of 0.15% on the first $400 million of the average daily net assets of each fund; 0.13% on the next $600 million of the average daily net assets of each fund; and 0.12% on all the average daily net assets of each fund over $1 billion. For the year ended October 31, 2016, the Adviser has made payments of $77,600, $31,529, $115,501, $328,727, $128,379, $18,022, to U.S. Bancorp Fund Services, LLC for services provided under a Sub-Administration Agreement for The Tocqueville Fund, The Tocqueville Opportunity Fund, The Tocqueville International Value Fund, The Tocqueville Gold Fund, The Delafield Fund and The Tocqueville Select Fund, respectively.
Tocqueville Securities, L.P. (the “Distributor”), an affiliate of Tocqueville, acts as distributor for shares of the Trust. Each Fund adopted a distribution and service plan pursuant to Rule 12b-1 of the 1940 Act. Pursuant to the plans, each Fund pays to the Distributor distribution and service fees of 0.25% per annum of its average daily net assets.
Commissions earned by the Distributor for services rendered as a registered broker-dealer in securities transactions for The Tocqueville Fund, The Tocqueville Opportunity Fund, The Tocqueville International Value Fund, The Tocqueville Gold Fund, The Delafield Fund and The Tocqueville Select Fund for the year ended October 31, 2016, were $58,570, $28,021, $9,460 $1,521, $24,300, $31,622, respectively.
5. CAPITAL SHARE TRANSACTIONS.
Transactions in capital shares for each Fund were as follows:
| | | | | | | | |
| | | For the Year
Ended
October 31, 2016 | | | For the Year
Ended
October 31, 2015 | |
| The Tocqueville Fund | | Shares | | | Shares | |
Shares sold | | | 758,998 | | | | 1,103,428 | |
Shares issued to holders in reinvestment dividends | | | 180,320 | | | | 455,582 | |
Shares redeemed | | | (1,941,924 | ) | | | (3,295,867 | ) |
| | | | | | | | |
Net decrease | | | (1,002,606 | ) | | | (1,736,857 | ) |
| | |
| The Tocqueville Opportunity Fund | | | | | | | | |
Shares sold | | | 1,126,477 | | | | 4,986,584 | |
Shares issued to holders in reinvestment dividends | | | — | | | | 493,022 | |
Shares redeemed | | | (3,435,340 | ) | | | (1,839,479 | ) |
| | | | | | | | |
Net increase (decrease) | | | (2,308,863 | ) | | | 3,640,127 | |
| | |
| The Tocqueville International Value Fund | | | | | | | | |
Shares sold | | | 21,229,873 | | | | 10,658,518 | |
Shares issued to holders in reinvestment dividends | | | 668,623 | | | | 958,749 | |
Shares redeemed | | | (8,378,756 | ) | | | (5,103,371 | ) |
| | | | | | | | |
Net increase | | | 13,519,740 | | | | 6,513,896 | |
| | | | | | | | |
| | | For the Year
Ended
October 31, 2016 | | | For the Year
Ended
October 31, 2015 | |
| The Tocqueville Gold Fund | | | | | | | | |
Shares sold | | | 12,486,612 | | | | 12,786,647 | |
Shares issued to holders in reinvestment dividends | | | — | | | | — | |
Shares redeemed | | | (14,150,662 | ) | | | (13,881,041 | ) |
| | | | | | | | |
Net decrease | | | (1,664,050 | ) | | | (1,094,394 | ) |
| | |
| The Delafield Fund | | | | | | | | |
Shares sold | | | 1,518,777 | | | | 2,623,792 | |
Shares issued to holders in reinvestment dividends | | | 2,473,115 | | | | 4,059,478 | |
Shares redeemed | | | (12,406,861 | ) | | | (23,653,398 | ) |
| | | | | | | | |
Net decrease | | | (8,414,969 | ) | | | (16,970,128 | ) |
| | |
| The Tocqueville Select Fund | | | | | | | | |
Shares sold | | | 440,494 | | | | 639,547 | |
Shares issued to holders in reinvestment dividends | | | 229,723 | | | | 940,811 | |
Shares redeemed | | | (1,860,720 | ) | | | (2,055,672 | ) |
| | | | | | | | |
Net decrease | | | (1,190,503 | ) | | | (475,314 | ) |
6. FUND SHARE TRANSACTIONS
Each Fund currently offers only one class of shares of beneficial interest. A redemption fee of 2.00% is imposed on redemptions of shares held 90 days or fewer for The Tocqueville Gold Fund. This fee is retained by the Fund and is credited to paid in capital. Redemptions to which the fee applies include redemptions of shares resulting from an exchange made pursuant to the Exchange Privilege, as defined in the Trust’s Prospectus dated February 26, 2016. For a more detailed description of when the redemption fee does not apply, please see the Trust’s Prospectus.
7. INVESTMENT TRANSACTIONS
Purchases and sales of investment securities (excluding short-term instruments) for the year ended October 31, 2016 are summarized below.
| | | | | | | | | | | | | | | | | | | | | | | | |
| | | Tocqueville
Fund | | | Opportunity
Fund | | | International
Value Fund | | | Gold Fund | | | Delafield
Fund | | | Select
Fund | |
Purchases: | | $ | 34,293,239 | | | $ | 127,516,167 | | | $ | 270,313,730 | | | $ | 176,304,729 | | | $ | 154,767,243 | | | $ | 20,062,143 | |
| | | | | | | | | | | | | | | | | | | | | | | | |
Sales: | | $ | 67,471,517 | | | $ | 172,070,522 | | | $ | 98,952,731 | | | $ | 282,597,440 | | | $ | 426,088,077 | | | $ | 38,384,513 | |
| | | | | | | | | | | | | | | | | | | | | | | | |
U.S. Government Security Purchases: | | $ | — | | | $ | — | | | $ | — | | | $ | — | | | $ | — | | | $ | — | |
| | | | | | | | | | | | | | | | | | | | | | | | |
U.S. Government Security Sales: | | $ | — | | | $ | — | | | $ | — | | | $ | — | | | $ | — | | | $ | — | |
| | | | | | | | | | | | | | | | | | | | | | | | |
8. TRANSACTIONS WITH AFFILIATES
The following issuers are affiliated with the Funds; that is, the Adviser had control of 5% or more of the outstanding voting securities during the year from November 1, 2015 through October 31, 2016. As defined in Section (2)(a)(3) of the Investment Company Act of 1940; such issues are:
| | | | | | | | | | | | | | | | | | | | | | | | | | | | | | | | | | | | | | | | | | | | | | | | |
| | | November 1, 2015 | | | Additions | | | Reductions | | | October 31, 2016 | | | Interest
Income | | | Dividend
Income | | | Realized
Gain/(Loss) | | | October 31, 2016 | |
Issuer Name | | Share
Balance | | | Cost | | | Share
Balance | | | Cost | | | Share
Balance | | | Cost | | | Share
Balance | | | | | | Value | | | Cost | |
The Tocqueville Gold Fund | | | | | | | | | | | | | | | | | | | | | | | | | | | | | | | | | | | | | | | | | | | | | | | | |
Almaden Minerals Ltd. | | | — | | | $ | — | | | | 1,481,482 | | | $ | 1,556,421 | | | | — | | | $ | — | | | | 1,481,482 | | | $ | — | | | $ | — | | | $ | — | | | $ | 1,937,535 | | | $ | 1,556,421 | |
Almaden Minerals Ltd. | | | 2,066,667 | | | | 2,147,349 | | | | 1,900,000 | | | | 1,176,496 | | | | — | | | | — | | | | 3,966,667 | | | | — | | | | — | | | | — | | | | 5,293,621 | | | | 3,323,845 | |
Almaden Minerals Ltd. Warrant | | | — | | | | — | | | | 740,741 | | | | — | | | | — | | | | — | | | | 740,741 | | | | — | | | | — | | | | — | | | | 483,113 | | | | — | |
Almaden Minerals Ltd. Warrant | | | — | | | | — | | | | 875,000 | | | | — | | | | — | | | | — | | | | 875,000 | | | | — | | | | — | | | | — | | | | 604,339 | | | | — | |
Americas Silver Corp.(a) | | | 25,668,419 | | | | 23,975,473 | | | | — | | | | — | | | | (25,668,419 | ) | | | (23,975,473 | ) | | | — | | | | — | | | | — | | | | (18,338,154 | ) | | | — | | | | — | |
Americas Silver Corp.(a) | | | 522,400 | | | | 984,285 | | | | — | | | | — | | | | (522,400 | ) | | | (984,285 | ) | | | — | | | | — | | | | — | | | | (831,667 | ) | | | — | | | | — | |
Anthem United, Inc.(a) | | | 8,075,000 | | | | 1,779,257 | | | | — | | | | — | | | | (8,075,000 | ) | | | (1,779,257 | ) | | | — | | | | — | | | | — | | | | — | | | | — | | | | — | |
Anthem United, Inc. Warrant(a) | | | 1,250,000 | | | | — | | | | — | | | | — | | | | (1,250,000 | ) | | | — | | | | — | | | | — | | | | — | | | | — | | | | — | | | | — | |
Argonaut Gold, Inc.(a) | | | 2,687,000 | | | | 12,286,127 | | | | 150,000 | | | | 424,486 | | | | — | | | | — | | | | 2,837,000 | | | | — | | | | — | | | | — | | | | 5,731,954 | | | | 12,710,613 | |
ATAC Resources Ltd. | | | 11,516,891 | | | | 39,793,482 | | | | — | | | | — | | | | (1,500,000 | ) | | | (7,078,246 | ) | | | 10,016,891 | | | | — | | | | — | | | | (6,202,846 | ) | | | 4,107,426 | | | | 32,715,236 | |
AuRico Metals, Inc. | | | 1,411,437 | | | | 1,395,088 | | | | 6,000,000 | | | | 3,221,270 | | | | — | | | | — | | | | 7,411,437 | | | | — | | | | — | | | | — | | | | 6,796,442 | | | | 4,616,358 | |
Bear Creek Mining Corp. | | | 7,413,200 | | | | 28,761,181 | | | | — | | | | — | | | | — | | | | — | | | | 7,413,200 | | | | — | | | | — | | | | — | | | | 14,922,568 | | | | 28,761,181 | |
Corvus Gold, Inc. | | | 3,350,901 | | | | 2,356,445 | | | | — | | | | — | | | | — | | | | — | | | | 3,350,901 | | | | — | | | | — | | | | — | | | | 2,131,843 | | | | 2,356,445 | |
Corvus Gold, Inc. | | | 10,630,000 | | | | 9,320,896 | | | | 2,400,000 | | | | 1,267,925 | | | | — | | | | — | | | | 13,030,000 | | | | — | | | | — | | | | — | | | | 8,257,288 | | | | 10,588,821 | |
Corvus Gold, Inc.(b) | | | — | | | | — | | | | 2,400,000 | | | | 1,267,925 | | | | (2,400,000 | ) | | | (1,267,925 | ) | | | — | | | | — | | | | — | | | | — | | | | — | | | | — | |
Detour Gold Corp.(a) | | | 5,604,200 | | | | 91,506,440 | | | | — | | | | — | | | | (1,126,000 | ) | | | (36,327,955 | ) | | | 4,478,200 | | | | — | | | | — | | | | (15,958,127 | ) | | | 85,370,592 | | | | 55,178,485 | |
East Asia Minerals Corp. | | | 66,484,933 | | | | 22,296,021 | | | | — | | | | — | | | | — | | | | — | | | | 66,484,933 | | | | — | | | | — | | | | — | | | | 619,594 | | | | 22,296,021 | |
East Asia Minerals Corp. Warrant | | | 6,500,000 | | | | — | | | | — | | | | — | | | | — | | | | — | | | | 6,500,000 | | | | — | | | | — | | | | — | | | | 969 | | | | — | |
East Asia Minerals Corp. Warrant | | | 9,764,933 | | | | — | | | | — | | | | — | | | | — | | | | — | | | | 9,764,933 | | | | — | | | | — | | | | — | | | | — | | | | — | |
East Asia Minerals Corp. Right | | | 46,175,600 | | | | — | | | | — | | | | — | | | | — | | | | — | | | | 46,175,600 | | | | — | | | | — | | | | — | | | | 516,390 | | | | — | |
GoGold Resources, Inc. | | | 20,670,300 | | | | 25,703,524 | | | | — | | | | — | | | | (1,123,600 | ) | | | (1,385,775 | ) | | | 19,546,700 | | | | — | | | | — | | | | (790,643 | ) | | | 9,909,607 | | | | 24,317,749 | |
Gold Bullion International LLC | | | 5,000,000 | | | | 5,000,000 | | | | — | | | | — | | | | — | | | | — | | | | 5,000,000 | | | | — | | | | — | | | | — | | | | 6,893,000 | | | | 5,000,000 | |
International Tower Hill Mines Ltd. | | | 5,738,836 | | | | 20,953,121 | | | | — | | | | — | | | | — | | | | — | | | | 5,738,836 | | | | — | | | | — | | | | — | | | | 4,296,093 | | | | 20,953,121 | |
International Tower Hill Mines Ltd. | | | 11,289,744 | | | | 40,113,412 | | | | — | | | | — | | | | — | | | | — | | | | 11,289,744 | | | | — | | | | — | | | | — | | | | 8,501,187 | | | | 40,113,412 | |
Jaguar Mining, Inc.(c) | | | — | | | | — | | | | 65,878,798 | | | | 7,512,329 | | | | — | | | | — | | | | 65,878,798 | | | | 845,604 | | | | — | | | | — | | | | 36,334,534 | | | | 7,512,329 | |
MAG Silver Corp. | | | 2,951,400 | | | | 31,481,549 | | | | 224,000 | | | | 3,006,281 | | | | (230,000 | ) | | | (2,080,901 | ) | | | 2,945,400 | | | | — | | | | — | | | | 1,378,507 | | | | 43,091,202 | | | | 32,406,929 | |
NuLegacy Gold Corp. | | | — | | | | — | | | | 19,535,500 | | | | 3,102,220 | | | | — | | | | — | | | | 19,535,500 | | | | — | | | | — | | | | — | | | | 5,898,664 | | | | 3,102,220 | |
NuLegacy Gold Corp. | | | — | | | | — | | | | 9,553,152 | | | | 3,236,406 | | | | — | | | | — | | | | 9,553,152 | | | | — | | | | — | | | | — | | | | 2,826,844 | | | | 3,236,406 | |
NuLegacy Gold Corp. Warrant | | | — | | | | — | | | | 9,553,152 | | | | — | | | | — | | | | — | | | | 9,553,152 | | | | — | | | | — | | | | — | | | | 1,124,613 | | | | — | |
Osisko Gold Royalties Ltd.(a) | | | 3,114,140 | | | | 44,534,686 | | | | 561,500 | | | | 6,859,309 | | | | (490,900 | ) | | | (6,160,551 | ) | | | 3,184,740 | | | | — | | | | 399,718 | | | | (506,036 | ) | | | 33,526,078 | | | | 45,233,444 | |
| | | | | | | | | | | | | | | | | | | | | | | | | | | | | | | | | | | | | | | | | | | | | | | | |
| | | November 1, 2015 | | | Additions | | | Reductions | | | October 31, 2016 | | | Interest
Income | | | Dividend
Income | | | Realized
Gain/(Loss) | | | October 31, 2016 | |
Issuer Name | | Share
Balance | | | Cost | | | Share
Balance | | | Cost | | | Share
Balance | | | Cost | | | Share
Balance | | | | | | Value | | | Cost | |
Osisko Gold Royalties Ltd. Warrant(a) | | | 274,000 | | | $ | — | | | | — | | | $ | — | | | | — | | | $ | — | | | | 274,000 | | | $ | — | | | $ | — | | | $ | — | | | $ | 612,838 | | | $ | — | |
Premier Gold Mines Ltd. | | | 7,857,660 | | | | 15,522,203 | | | | — | | | | — | | | | — | | | | — | | | | 7,857,660 | | | | — | | | | — | | | | — | | | | 16,520,242 | | | | 15,522,203 | |
Primero Mining Corp.(a) | | | 6,909,800 | | | | 44,503,243 | | | | — | | | | — | | | | (6,909,800 | ) | | | (44,503,243 | ) | | | — | | | | — | | | | — | | | | (31,823,917 | ) | | | — | | | | — | |
Rockhaven Resources Ltd. | | | 6,400,000 | | | | 6,455,589 | | | | — | | | | — | | | | — | | | | — | | | | 6,400,000 | | | | — | | | | — | | | | — | | | | 882,726 | | | | 6,455,589 | |
Rubicon Minerals Corp. | | | 11,275,000 | | | | 15,678,646 | | | | — | | | | — | | | | — | | | | — | | | | 11,275,000 | | | | — | | | | — | | | | — | | | | 378,271 | | | | 15,678,646 | |
SEMAFO, Inc. | | | 10,285,200 | | | | 36,814,926 | | | | 828,000 | | | | 3,207,756 | | | | (889,000 | ) | | | (1,305,884 | ) | | | 10,224,200 | | | | — | | | | — | | | | 2,674,973 | | | | 39,910,165 | | | | 38,716,798 | |
Silver Range Resources Ltd.(a) | | | 3,450,000 | | | | — | | | | — | | | | — | | | | (2,937,000 | ) | | | — | | | | 513,000 | | | | — | | | | — | | | | 387,415 | | | | 43,983 | | | | — | |
Strategic Metals Ltd. | | | 10,926,900 | | | | 15,810,172 | | | | — | | | | — | | | | (463,500 | ) | | | (664,598 | ) | | | 10,463,400 | | | | — | | | | — | | | | (508,411 | ) | | | 4,368,526 | | | | 15,145,574 | |
Tocqueville Bullion Reserve LP—Class G(d) | | | 13,806 | | | | 25,000,000 | | | | — | | | | — | | | | — | | | | — | | | | 13,806 | | | | — | | | | — | | | | — | | | | 17,086,467 | | | | 25,000,000 | |
Torex Gold Resources, Inc. | | | 34,615,500 | | | | 53,049,316 | | | | 2,835,550 | | | | 46,398,104 | | | | (34,172,500 | ) | | | (50,332,779 | ) | | | 3,278,550 | | | | — | | | | — | | | | (2,163,444 | ) | | | 60,985,479 | | | | 49,114,641 | |
| | | | | | | | | | | | | | | | | | | | | | | | | | | | | | | | | | | | | | | | | | | | | | | | |
| | | | | | $ | 617,222,431 | | | | | | | $ | 82,236,928 | | | | | | | $ | (177,846,872 | ) | | | | | | $ | 845,604 | | | $ | 399,718 | | | $ | (72,682,350 | ) | | $ | 429,964,103 | | | $ | 521,612,487 | |
The Delafield Fund | | | | | | | | | | | | | | | | | | | | | | | | | | | | | | | | | | | | | | | | | | | | | | | | |
Horizon Global Corp.(a) | | | 425,000 | | | $ | 5,335,877 | | | | — | | | $ | — | | | | (175,000 | ) | | $ | (2,270,975 | ) | | | 250,000 | | | $ | — | | | $ | — | | | $ | 967,595 | | | $ | 5,010,000 | | | $ | 3,064,902 | |
Kemet Corp.(a) | | | 2,850,000 | | | | 13,351,401 | | | | — | | | | — | | | | (1,608,965 | ) | | | (8,255,898 | ) | | | 1,241,035 | | | | — | | | | — | | | | (3,913,842 | ) | | | 4,418,084 | | | | 5,095,503 | |
Ryerson Holding Corp.(a) | | | 1,300,000 | | | | 12,470,700 | | | | — | | | | — | | | | (1,300,000 | ) | | | (12,470,700 | ) | | | — | | | | — | | | | — | | | | (4,522,414 | ) | | | — | | | | — | |
Xerium Technologies, Inc. | | | 950,000 | | | | 12,669,193 | | | | — | | | | — | | | | (50,000 | ) | | | (626,875 | ) | | | 900,000 | | | | — | | | | — | | | | (116,500 | ) | | | 5,580,000 | | | | 12,042,318 | |
| | | | | | | | | | | | | | | | | | | | | | | | | | | | | | | | | | | | | | | | | | | | | | | | |
| | | | | | $ | 43,827,171 | | | | | | | $ | — | | | | | | | $ | (23,624,448 | ) | | | | | | $ | — | | | $ | — | | | $ | (7,585,161 | ) | | $ | 15,008,084 | | | $ | 20,202,723 | |
The Tocqueville Select Fund | | | | | | | | | | | | | | | | | | | | | | | | | | | | | | | | | | | | | | | | | | | | | | | | |
Horizon Global Corp.(a) | | | 328,000 | | | $ | 4,274,125 | | | | 40,000 | | | $ | 373,605 | | | | (167,000 | ) | | $ | (2,255,471 | ) | | | 201,000 | | | $ | — | | | $ | — | | | $ | 655,020 | | | $ | 4,028,040 | | | $ | 2,392,259 | |
Summer Infant, Inc. | | | 674,016 | | | | 2,691,994 | | | | — | | | | — | | | | (42,785 | ) | | | (290,938 | ) | | | 631,231 | | | | — | | | | — | | | | (196,525 | ) | | | 1,338,210 | | | | 2,401,056 | |
Xerium Technologies, Inc. | | | 265,000 | | | | 3,374,608 | | | | — | | | | — | | | | — | | | | — | | | | 265,000 | | | | — | | | | — | | | | — | | | | 1,643,000 | | | | 3,374,608 | |
| | | | | | | | | | | | | | | | | | | | | | | | | | | | | | | | | | | | | | | | | | | | | | | | |
| | | | | | $ | 10,340,727 | | | | | | | $ | 373,605 | | | | | | | $ | (2,546,409 | ) | | | | | | $ | — | | | $ | — | | | $ | 458,495 | | | $ | 7,009,250 | | | $ | 8,167,923 | |
| | | | | | | | | | | | | | | | | | | | | | | | | | | | | | | | | | | | | | | | | | | | | | | | |
| (a) | Security is no longer an affiliated company at October 31, 2016. |
| (b) | Private security restrictions lifted during year and combined with other non restricted securities. |
| (c) | Jaguar Mining, Inc. 12.0000%, 10/23/2018 convertible bond converted to Jaguar Mining, Inc, common stock, on October 5, 2016. |
| (d) | Tocqueville Bullion Reserve (“TBR”) is a Delaware Limited Partnership created for the purpose of owning physical gold. The General Partner of TBR is TERA Management LLC (“Tera”), a Delaware Limited Liability Company, which is equally owned and managed by Tocqueville Partners II LLC (“TP2”), a Delaware Limited Liability Company, and Eidesis Real Assets LLC (“Eidesis”), a Delaware Limited Liability Company. The Managing Member of TP2 is Robert Kleinschmidt, President of the Trust, who has a 51% participating percentage in TP2 and the sole Non-Managing Member is John Hathaway, co-portfolio manager of the Tocqueville Gold Fund, who has a 49% participating percentage. |
9. LINE OF CREDIT
The Tocqueville Trust has a $300,000,000 line of credit (the “Line”), which is uncommitted, with U.S. Bank NA. The Line is for temporary emergency or extraordinary purposes, including the meeting of redemption requests that otherwise might require the untimely disposition of securities. The Line is secured by the Trust’s assets. The Line has a one year term and is reviewed annually by the Board of Trustees. The current agreement runs through May 27, 2017. The interest rate as of October 31, 2016 was 3.00%. During the year ended October 31, 2016, the Tocqueville Fund’s maximum borrowing was $4,308,000 and average borrowing was $450,595, the Opportunity Fund’s maximum borrowing was $3,885,000 and average borrowing was $614,468, and the Gold Fund’s maximum borrowing was $78,502,000 and average borrowing was $1,536,020. This borrowing resulted in interest expenses of $12,656, $18,570 and $40,244, respectively. The International Value Fund, The Delafield Fund and The Select Fund did not use the Line.
10. OTHER EXPENSES
Other expenses include reimbursement to the Adviser for compensation of the Trust’s Chief Compliance Officer. For the year ended October 31, 2016, reimbursement to the Adviser for compensation of the Trust’s Chief Compliance Officer from the Funds amounted to $16,587, $6,786, $24,474, $69,262, $27,591, $3,853 for the Tocqueville Fund, Opportunity Fund, International Value Fund, Gold Fund, Delafield Fund, and Select Fund respectively.
The Tocqueville Trust
Report of Independent Registered Public Accounting Firm
To the Shareholders and Board of Trustees of
The Tocqueville Trust
We have audited the accompanying statements of assets and liabilities of the Tocqueville Trust, including The Tocqueville Fund, The Tocqueville Opportunity Fund, The Tocqueville International Value Fund, The Tocqueville Gold Fund, The Delafield Fund, and The Tocqueville Select Fund (collectively, the Funds), including the schedules of investments, as of October 31, 2016, and the related statements of operations for the year then ended, changes in net assets for each of the two years in the period then ended, and the financial highlights for each of the five years then ended. These financial statements and financial highlights are the responsibility of the Funds’ management. Our responsibility is to express an opinion on these financial statements and financial highlights based on our audits.
We conducted our audits in accordance with the standards of the Public Company Accounting Oversight Board (United States). Those standards require that we plan and perform the audits to obtain reasonable assurance about whether the financial statements and financial highlights are free of material misstatement. We were not engaged to perform an audit of the Funds’ internal control over financial reporting. Our audits included consideration of internal control over financial reporting as a basis for designing audit procedures that are appropriate in the circumstances, but not for the purpose of expressing an opinion on the effectiveness of the Funds’ internal control over financial reporting. Accordingly, we express no such opinion. An audit also includes examining, on a test basis, evidence supporting the amounts and disclosures in the financial statements and financial highlights, assessing the accounting principles used and significant estimates made by management, as well as evaluating the overall financial statement presentation. Our procedures included confirmation of securities owned as of October 31, 2016, by correspondence with the custodians and brokers, or by other appropriate auditing procedures where replies from brokers were not received. We believe that our audits provide a reasonable basis for our opinion.
In our opinion, the financial statements and financial highlights referred to above present fairly, in all material respects, the financial position of each of the aforementioned funds of the Tocqueville Trust as of October 31, 2016, and the results of their operations, the changes in their net assets, and financial highlights for the periods indicated above, in conformity with accounting principles generally accepted in the United States of America.
/s/ GRANT THORNTON LLP
Chicago, Illinois
December 22, 2016
ADDITIONAL INFORMATION (UNAUDITED)
1. ADDITIONAL DISCLOSURE REGARDING FUND TRUSTEES AND OFFICERS
Independent Trustees
| | | | | | | | | | | | |
Name and Age | | Position(s) Held
with the Trust | | Term of Office
and Length of Time Served (1) | | Principal Occupation(s)
During Past Five Years | | Number of Funds
in Fund Complex
Overseen By Trustee | | | Other Directorships
Held by Trustee |
| | | | | |
Charles W. Caulkins Year of Birth: 1956 | | Trustee; Member of Audit Committee; Member of Governance and Nominating Committee | | Indefinite Term, Since 2003 | | Private Investor from January 2012 –present; Partner, Chora Capital, LLC from June 2010 – December 2011; Director of Marketing, L.R. Global Partners from January 2008 – May 2010; President, Arbor Marketing, Inc. from October 1994 to December 2007. | | | 6 | | | Director, Stepping Stones from January 2012 – 2013; Director, Phoenix House from January 2001 to 2007. |
| | | | | |
Alexander Douglas Year of Birth: 1947 | | Trustee; Member of Audit Committee; Member of Governance and Nominating Committee | | Indefinite Term, Since 2010 | | Retired. Formerly, President, CEO and owner of Spaulding Law Printing, Inc. from 1992 to November 2014 | | | 6 | | | None |
ADDITIONAL INFORMATION (UNAUDITED)
Independent Trustees
| | | | | | | | | | | | |
Name and Age | | Position(s) Held
with the Trust | | Term of Office
and Length of Time Served (1) | | Principal Occupation(s)
During Past Five Years | | Number of Funds
in Fund Complex
Overseen By Trustee | | | Other Directorships
Held by Trustee |
| | | | | |
Charles F. Gauvin Year of Birth: 1956 | | Trustee; Member of Audit Committee; Member of Governance and Nominating Committee | | Indefinite Term, Since 2015 | | Chief Development Officer, Woods Hole Oceanographic Institution, from February 2016 – present; Executive Director, Maine Audubon, from August 2014 – January 2016; Chief Development Officer, Carnegie Endowment for International Peace, from September 2011 – May 2014; Partner, The Riparian Fund/Legacy Ranch Partners (private equity real estate fund), from February 2010 – December 2012; President and CEO, Trout Unlimited (fish and river conservation), from April 1991 –February 2010. | | | 6 | | | Director, Bioqual, Inc., July 1992 – present. |
| | | | | |
James W. Gerard Year of Birth: 1961 | | Trustee; Member of Audit Committee; Member of Governance and Nominating Committee | | Indefinite Term, Since 2001 | | Managing Director, Hycroft Advisors, from January 2010 – present; Managing Director, deVisscher & Co., LLC from January 2013 to present; Principal, Juniper Capital Group, LLC (formerly known as Argus Advisors International, LLC) from August 2003 to December 2009; Managing Director, The Chart Group from January 2001 to present. | | | 6 | | | President, American Overseas Memorial Day Association, 1998 to present; Director and Treasurer ASPCA, 1998 to 2008; Trustee, Salisbury School, 2005 to present; Director, American Friends of Bleraucourt, 1992 to present; President, Little Baby Face Foundation, March 2015 to present. |
ADDITIONAL INFORMATION (UNAUDITED)
Independent Trustees
| | | | | | | | | | | | |
Name and Age | | Position(s) Held
with the Trust | | Term of Office
and Length of Time Served (1) | | Principal Occupation(s)
During Past Five Years | | Number of Funds
in Fund Complex
Overseen By Trustee | | | Other Directorships
Held by Trustee |
| | | | | |
William F. Indoe Year of Birth: 1942 | | Trustee; Member of Audit Committee; Member of Governance and Nominating- Committee | | Indefinite Term, Since 2006 | | Retired. Formerly, Sullivan & Cromwell LLP (attorneys-at-law). 1968 – 2011. | | | 6 | | | Director, Rho Capital Partners, Inc. |
| | | | | |
William J. Nolan III Year of Birth: 1947 | | Trustee; Chair of Audit Committee; Member of Governance and Nominating Committee | | Indefinite Term, Since 2006 | | Retired. Executive Vice President & Treasurer PaineWebber Inc. 1997 – 2001. | | | 6 | | | Trustee, Adirondack Museum, Blue Mt. Lake, NY 1996 to present (Treasurer, 2000 to 2013; Chair of the Investment Committee, 2009 – present). |
ADDITIONAL INFORMATION (UNAUDITED)
Interested Trustees2 and Officers
| | | | | | | | | | | | |
Name and Age | | Position(s) Held
with the Trust | | Term of Office
and Length of
Time Served (1) | | Principal Occupation(s)
During Past Five Years | | Number of Funds
in Fund Complex
Overseen By Trustee | | | Other Directorships
Held by Trustee |
| | | | | |
Helen Balk Year of Birth: 1972 | | Treasurer | | Indefinite Term, Since 2014 | | Controller / Treasurer of Tocqueville Asset Management from January 2014 to present; Manager / Staff Accountant at Pegg & Pegg LLP from August 1995 to January 2014. | | | N/A | | | N/A |
| | | | | |
Elizabeth Bosco Year of Birth: 1947 | | Anti-Money Laundering Compliance Officer | | Indefinite Term, Since 2009 | | Chief Compliance Officer of Tocqueville Securities, L.P. from January 2009 to present; Compliance Officer, Tocqueville Asset Management from January 2009 to present. | | | N/A | | | N/A |
| | | | | |
Robert W. Kleinschmidt Year of Birth: 1949 | | Chairman, President, and Trustee | | Indefinite Term, Chairman Since 2016, and President and Trustee Since 1991 | | President and Chief Investment Officer of Tocqueville Asset Management; Director, Tocqueville Management Corporation, the General Partner of Tocqueville Asset Management L.P. and Tocqueville Securities L.P. from January 1994 to present; and Managing Director from July 1991 to January 1994; Partner, David J, Greene & Co. from May 1978 to July 1991. | | | 6 | | | President and Director, Tocqueville Management Corporation, the General Partner of Tocqueville Asset Management L.P. and Tocqueville Securities L.P. |
| | | | | |
Cleo Kotis Year of Birth: 1975 | | Secretary | | Indefinite Term, Since 2010 | | Director of Operations, the Delafield Group of Tocqueville Asset Management L.P., 2009 to present; Vice President and Chief Operations Officer, the Delafield Fund, Inc. from 2005 – 2009; Vice President and Chief Operations Officer, Delafield Asset Management from 2005 – 2009; Vice President, Reich & Tang Asset Management, LLC from 2002 – 2009. | | | N/A | | | N/A |
ADDITIONAL INFORMATION (UNAUDITED)
Interested Trustees2 and Officers
| | | | | | | | | | | | |
Name and Age | | Position(s) Held
with the Trust | | Term of Office
and Length of
Time Served (1) | | Principal Occupation(s)
During Past Five Years | | Number of Funds
in Fund Complex
Overseen By Trustee | | | Other Directorships
Held by Trustee |
| | | | | |
Thomas Pandick Year of Birth: 1947 | | Chief Compliance Officer | | Indefinite Term, Since 2004 | | Chief Compliance Officer (October 2004 –present) Tocqueville Asset Management L.P. | | | N/A | | | N/A |
| 1 | Each Trustee will hold office for an indefinite term until the earliest of (i) the next meeting of shareholders, if any, called for the purpose of considering the election or re-election of such Trustee and until the election and qualification of his or her successor, if any, elected at such meeting, or (ii) the date a Trustee resigns or retires, or a Trustee is removed by the Board of Trustees or shareholders, in accordance with the Trust’s By-Laws, as amended, and Agreement and Declaration of Trust, as amended. Each officer will hold office for an indefinite term until the date he or she resigns or retires or until his or her successor is elected and qualifies. |
| 2 | “Interested person” of the Trust as defined in the 1940 Act. Mr. Kleinschmidt is considered “interested person” because of his affiliation with the Advisor. |
The Statement of Additional Information includes additional information about the Trustees and is available free of charge by calling the Funds toll free at 1-800-355-7307.
2. INVESTMENT ADVISORY AGREEMENT DISCLOSURE
In determining whether to approve the continuance of the Investment Advisory Agreement and the Administration Agreement with respect to the Tocquevilie Fund, the Opportunity Fund, the International Value Fund, the Gold Fund, the Delafield Fund, and the Select Fund, the Trustees, including the Independent Trustees, considered the following information:
1) The nature, extent and quality of services provided by the Adviser.
The Trustees reviewed in detail the nature and extent of the services provided by the Adviser under the terms of the Investment Advisory Agreements and the quality of those services provided to The Tocquevilie Fund, The Tocquevilie Opportunity Fund, The Tocquevilie International Value Fund, The Tocquevilie Gold Fund, The Delafield Fund, and The Tocquevilie Select Fund (the “Funds”) over the past year. The Trustees noted that the services under the Investment Advisory Agreements include: managing the investment and reinvestment of the Funds’ assets; supervising and managing all aspects of the Funds’ operations; and providing the Board on a regular basis with financial reports and analyses on the Funds’ operations and the operations of comparable investment companies. The Trustees also observed that the Adviser provides various administrative services to the Funds pursuant to the terms of the Administration Agreement and considered the nature, extent and quality of services provided under that agreement as well. The Trustees evaluated these factors based on their direct experience with the Adviser and in consultation with counsel. The Trustees concluded that the nature and extent of the services provided under the Investment Advisory Agreements and the Administration Agreement were reasonable and appropriate in relation to the advisory fee and administration fee, respectively, that the level of services provided by the Adviser to the Funds had not diminished over the past year and that the quality of services continues to be high. The Trustees reviewed the personnel responsible for providing advisory and administrative services to the Funds and concluded, based on their experience and interaction with the Adviser, that (i) the Adviser was able to retain quality portfolio managers and other personnel; (ii) the Adviser exhibited a high level of diligence and attention to detail in carrying out its advisory and administrative responsibilities under the Investment Advisory Agreements and Administration Agreement, respectively, for the Funds; (iii) the Adviser was responsive to requests of the Trustees; and (iv) the Adviser had kept the Trustees apprised of developments relating to the Funds and the industry in general. The Trustees also focused on the Adviser’s reputation and long-standing relationship with the Trust.
In connection with its assessment of the performance of the Adviser, the Trustees reviewed the Adviser’s financial statements and considered the Adviser’s financial condition and whether it has the resources necessary to continue to carry out its obligations under the Investment Advisory Agreements and the Administration Agreement. The Trustees concluded that the Adviser has the financial resources necessary
to continue to perform its obligations under the Investment Advisory Agreements and the Administration Agreement and to continue to provide the high quality services that it has provided to the Funds to date.
2) The performance or the Funds and the Adviser.
The Trustees reviewed the investment performance of the Funds, both on an absolute basis and as compared to a peer group for each respective Fund for the one-year, three-year, five-year and ten-year periods, ended July 31, 2016. The peer groups were comprised of other funds that had similar investment objectives and sales load structures, as determined by Morningstar: The Morningstar Large Blend Funds peer group, with total net assets between $230 million and $341 million, for The Tocqueville Fund; the Morningstar Mid-Cap Growth Funds peer group, with total net assets between $79 million and $128 million, for The Tocqueville Opportunity Fund; the Morningstar Foreign Large Blend Funds peer group, with total net assets between $485 million and $662 million, for The Tocqueville International Value Fund; the Morningstar Precious Metals Funds peer group, with total net assets between $1.5 billion and 3.0 billion for The Tocqueville Gold Fund; the Morningstar Mid-Cap Value Funds peer group, with total net assets between $356 million and $506 million, for The Delafield Fund; and the Morningstar Small Value Funds peer group, with total net assets between $42 million and $89 million, for The Tocqueville Select Fund (the “Performance Peer Groups”). The Trustees considered that the performance information for The Delafield Fund and The Tocqueville Select Fund includes the performance information of their respective predecessor funds, which had different investment advisers, but the Trustees considered this information since these Funds have substantially the same portfolio management team.
The Trustees also compared each Fund’s investment performance against its benchmark market indices: the S&P 500 Index for The Tocqueville Fund; the Russell 2500 Growth Index for The Tocqueville Opportunity Fund; the Morgan Stanley EAFE Index for The Tocqueville International Value Fund; the S&P 500 Index and the Philadelphia Stock Exchange Gold & Silver Index for The Tocqueville Gold Fund; the S&P 500 Index and the Russell 2000 Index for The Delafield Fund, the Russell 2500 Index and the Russell 2000 Index for The Tocqueville Select Fund (the “Indices”) for the one-year, three-year, five-year and ten-year periods ended July 31, 2016 for all the Funds. The Trustees considered the above information as helpful in their assessment of whether the Adviser was obtaining for the Funds’ shareholders the performance that was available in the marketplace given each Fund’s investment objectives, policies, strategies, limitations and restrictions. The Trustees concluded that the performance of the Funds against their respective Performance Peer Groups was satisfactory. In particular, the Trustees noted that The Tocqueville Fund had outperformed as compared to its Index for the one-year period and underperformed as compared to its Index for the three-year, five-year and ten-year periods, outperformed the median of its Performance Peer Group for the one-year, three-year, and ten-year periods and underperformed the median of its Performance Peer Group for the five-year period. The Trustees noted that The Tocqueville Opportunity
Fund underperformed its Index for the one-year, three-year, five-year and ten-year periods and outperformed the median of its Performance Peer Group for the three-year, five-year and ten-year periods and underperformed the median of its Performance Peer Group for the one-year period. The Trustees noted that The Tocqueville International Value Fund outperformed its Index for all periods and outperformed the median of its Performance Peer Group for all periods. The Trustees noted that The Tocqueville Gold Fund underperformed the S&P 500 Index for the three-year, five-year and ten-year periods, and outperformed the S&P 500 Index for the one-year period, and outperformed the Philadelphia Stock Exchange Gold & Silver Index for the three-year and ten-year periods and underperformed the Philadelphia Stock Exchange Gold & Silver Index for the one-year and five-year periods, and underperformed the median of its Performance Peer Group for the one-year and three-year periods and outperformed for the five-year and ten-year periods. The Trustees noted that The Delafield Fund underperformed both of its Indices for all periods and underperformed the median of its Performance Peer Group for all periods. The Trustees noted that The Tocqueville Select Fund underperformed both of its Indices for the one-year, three-year and five-year periods, outperformed both of its Indices for the ten-year period, underperformed the median of its Performance Peer Group for the one-year, three-year and five-year periods and outperformed the for the ten-year period. The Trustees questioned Mr. Kleinschmidt, in particular, about the underperformance of The Delafield Fund and The Tocqueville Select Fund. He noted that these periods saw the value style of investing used by The Delafield Fund and The Tocqueville Select Fund to be out of favor and trailing relevant indices. In addition, as previously communicated to the Board, Mr. Kleinschmidt noted that both The Delafield Fund and The Tocqueville Select Fund have recently added two new co-portfolio managers, Mr. Joshua Kaufthal and Mr. James Maxwell. Finally, he noted that their underperformance in the most recent year had a significant impact on the performance of the other specified periods.
3) The cost of the advisory services and the profits to the Adviser from the relationship with the Trust.
In connection with the Trustee’s consideration of the level of the advisory fees, the Trustees considered a number of factors. The Trustees compared the level of the advisory fees for each Fund against the advisory fees charged by funds in a universe of funds: the Morningstar Large Cap Blend Funds peer group, with average net assets between $200 million and $500 million, for The Tocqueville Fund; the Morningstar Mid-Cap Growth Funds peer group, with average net assets between $60 million and $140 million, for The Tocqueville Opportunity Fund; the Morningstar Foreign Large Blend Funds peer group, with average net assets between $300 million and $700 million, for The Tocqueville International Value Fund; all funds in the Morningstar Equity Precious Metals Funds peer group, for The Tocqueville Gold Fund; the Morningstar Mid-Cap Value Funds peer group, with average net assets between $200 million and $600 million, for The Delafield Fund; and the Morningstar Small Value Funds peer group, with average net assets between $30 million and $100 million, for The Tocqueville Select Fund (the “Expense Peer Groups”). The Trustees considered comparative total fund expenses of the Funds
and the Expense Peer Groups. The Trustees used this comparative fee information and total expense data as a guide to help assess the reasonableness of each Fund’s advisory fee, although they acknowledged that it was difficult to make precise comparisons with other funds since the exact nature of services provided under each Expense Peer Group fund agreement is often not apparent. The Trustees also viewed the Expense Peer Group fee information as a whole as useful in assessing whether the Adviser was providing services at a cost that was competitive with other, similar funds.
The Trustees noted that the contract rate advisory fee and administration fee for each of the Funds were reasonable, despite the contractual advisory fee rate being above average for The Tocqueville International Value Fund, The Tocqueville Gold Fund and The Delafield Fund and the administration fee being above average for The Tocqueville Fund, The Tocqueville Opportunity Fund and The Tocqueville International Fund, when compared to their respective Expense Peer Groups. The Trustees also considered the combined contract rate advisory and administration fee as compared to their respective Expense Peer Group. The Board further observed that the total expense ratios of the Funds were also reasonable. The Board noted that the total expense ratio for The Tocqueville Fund, The Tocqueville Opportunity Fund, The Tocqueville International Value Fund, The Delafield Fund, The Tocqueville Select Fund was above average, when compared to their respective Expense Peer Groups and that the total expense ratio for The Tocqueville Gold Fund was below average, when compared to its respective Expense Peer Group. The Board also noted that The Tocqueville Fund and The Tocqueville International Value Fund each operate pursuant to an Expense Limitation Agreement whereby the Adviser has agreed to waive a portion of its fee necessary to limit the Fund’s total operating expenses to the level set forth in the Fund’s prospectus.
The Trustees also considered the profitability to the Adviser and its affiliate arising out of its relationship with the Trust. In this regard, the Trustees reviewed profitability data relating to the Adviser for the 12 month period ended July 31, 2016. The Trustees considered revenues received by the Adviser under the Investment Advisory Agreements and the Administration Agreement as well as revenues received by the Adviser’s affiliate, the Distributor, under the 12b-1 plans and Related Agreements and commissions received for effecting portfolio transactions. The Trustees also received and reviewed the Adviser’s financial statements and the Adviser provided an oral update on its profitability numbers since October 31, 2015. The Trustees concluded that the profitability of the Funds to the Adviser was not excessive.
4) The extent to which economies of scale will be realized as the Funds grow and whether fee levels reflect those economies of scale.
With respect to the Trustees’ consideration of economies of scale, the Trustees discussed with the Adviser whether economies of scale would be realized by it in its management of a Fund at higher asset levels. The Trustees also reviewed the Peer Group data to assess whether the Peer Group funds had advisory fee breakpoints and, if so, at what asset levels. The Trustees noted that all of the Funds, except for The Tocqueville Select Fund, currently have advisory fee breakpoints and that they were satisfied that the
current breakpoints were appropriate when compared with each Fund’s respective Peer Group. The Trustees considered that breakpoints are not necessary at this time for The Tocqueville Select Fund, given the small size of The Tocqueville Select Fund. The Trustees also noted that the administration fee also has breakpoints. In the event there was significant asset growth in the future in a Fund, the Trustee’s determined to reassess whether the advisory fees and administration fee, including the current breakpoint structure, appropriately took into account any economies of scale that had been realized as a result of that growth.
5) Other Factors.
The Trustees also discussed the Adviser’s practices regarding the selection and compensation of brokers and dealers that execute portfolio transactions for the Funds and the brokers’ and dealers’ provision of brokerage and research services to the Adviser. The Trustees further discussed the potential benefits the Adviser derived from the Funds’ soft dollar arrangements, whereby brokers provide research to the Funds or the Adviser in return for allocating hand brokerage, and other investment data concerning soft dollars. The Board also discussed the Adviser’s use of an affiliated broker to effect portfolio transactions, noting that in addition to paying a competitive rate on commissions, the Adviser believed the Funds received better execution on trades.
Based on a consideration of all these factors in their totality, the Trustees, including all of the Independent Trustees, determined that the Funds’ advisory fees and administration fees were fair and reasonable with respect to the quality of services that the Adviser provides and in light of the other factors described above that the Trustees deemed relevant. The Trustees based their decision on evaluations of all these factors as a whole and did not consider any one factor as all-important or controlling.
3. PROXY VOTING POLICIES AND PROCEDURES
A description of the policies and procedures that The Tocqueville Trust uses to determine how to vote proxies relating to portfolio securities is available without charge upon request by calling 1-800-355-7307. Information regarding how The Tocqueville Trust voted proxies relating to portfolio securities during the most recent 12-month period ended June 30 is available by calling 1-800-355-7307 and it is also available on the SEC’s web site at http://www.sec.gov.
4. SHAREHOLDER REPORTS AND QUARTERLY PORTFOLIO DISCLOSURE
The Tocqueville Trust is required to file its complete schedule of portfolio holdings with the SEC for its first and third fiscal quarters on Form N-Q. The Trust’s Form N-Q will be available without charge, upon request on the SEC’s website (http://www.sec.gov) and may be available by calling 1-800-697-3863. You can also obtain copies of Form N-Q by (i) visiting the SEC’s Public Reference Room in Washington, DC (information on the operation of the Public Reference Room may be obtained by calling
1-202-551-8090); (ii) sending your request and a duplicating fee to the SEC’s Public Reference Room, Washington, DC 20549-1520; or (iii) sending your request electronically to publicinfosec.gov. Quarterly portfolio holdings are also available on the website of The Tocqueville Funds, www.tocqueville.com/mutual-funds.
5. SHAREHOLDER NOTIFICATION OF FEDERAL TAX STATUS
For the fiscal year ended October 31, 2016, certain dividends paid by the Funds may be subject to a maximum tax rate of 15%, as provided for by the Jobs and Growth Tax Relief Reconciliation Act of 2003. The percentage of dividends declared from ordinary income designated as qualified dividend income was as follows:
| | | | |
Tocqueville Fund | | | 100.00 | % |
Opportunity Fund | | | 0.00 | % |
International Value Fund | | | 76.37 | % |
Gold Fund | | | 0.00 | % |
Delafield Fund | | | 0.00 | % |
Select Fund | | | 0.00 | % |
For corporate shareholders, the percent of ordinary income distributions qualifying for the corporate dividends received deduction for the fiscal year ended October 31, 2016 was as follows:
| | | | |
Tocqueville Fund | | | 100.00 | % |
Opportunity Fund | | | 0.00 | % |
International Value Fund | | | 4.19 | % |
Gold Fund | | | 0.00 | % |
Delafield Fund | | | 0.00 | % |
Select Fund | | | 0.00 | % |
For the year ended October 31, 2016, the funds designate the following percent of ordinary distributions paid as interest-related dividends under the Internal Revenue Code Section 871(k)(1)(c):
| | | | |
Tocqueville Fund | | | 0.00 | % |
Opportunity Fund | | | 0.00 | % |
International Value Fund | | | 0.05 | % |
Gold Fund | | | 0.00 | % |
Delafield Fund | | | 0.00 | % |
Select Fund | | | 0.00 | % |
The percentage of taxable ordinary income distributions that are designated as short-term capital gain distributions under Internal Revenue Section 871(k)(2)(C) for each Fund were as follows.
| | | | |
Tocqueville Fund | | | 0.00 | % |
Opportunity Fund | | | 0.00 | % |
International Value Fund | | | 0.00 | % |
Gold Fund | | | 0.00 | % |
Delafield Fund | | | 0.00 | % |
Select Fund | | | 0.00 | % |
6. FOREIGN TAX CREDIT
For the year ended October 31, 2016, the Tocqueville International Value Fund earned foreign source income and paid foreign taxes which they intend to pass through to their shareholders pursuant to Section 853 of the Internal Revenue Code as follows:
| | | | | | | | |
Country | | Gross Dividend
Per Share | | | Taxes Withheld
Per Share | |
Australia | | | 0.0141 | | | | 0.0008 | |
Belgium | | | 0.0108 | | | | 0.0016 | |
Canada | | | 0.0144 | | | | 0.0022 | |
Switzerland | | | 0.0072 | | | | 0.0011 | |
Germany | | | 0.0160 | | | | 0.0019 | |
Denmark | | | 0.0075 | | | | 0.0011 | |
France | | | 0.0506 | | | | 0.0067 | |
Spain | | | 0.0038 | | | | 0.0006 | |
Finland | | | 0.0095 | | | | 0.0014 | |
Japan | | | 0.0396 | | | | 0.0040 | |
South Korea | | | 0.0052 | | | | 0.0009 | |
Netherlands | | | 0.0136 | | | | 0.0020 | |
Norway | | | 0.0074 | | | | 0.0011 | |
| | | | | | | | |
| | | 0.19977 | | | | 0.02534 | |
| | | | | | | | |
Investment Adviser
Tocqueville Asset Management L.P.
40 W. 57th St., 19th Floor
New York, NY 10019
(212) 698-0800
www.tocqueville.com
Distributor
Tocqueville Securities, L.P.
40 W. 57th St., 19th Floor
New York, NY 10019
(212) 698-0800
Shareholders’ Servicing and Transfer Agent
U.S. Bancorp Fund Services, LLC
P.O. Box 701
Milwaukee, WI 53201-0701
(800) 697-3863
Custodian
U.S. Bank, N.A.
Custody Operations
1555 River Center Drive, Suite 302
Milwaukee, WI 53212
Board of Trustees
Robert W. Kleinschmidt—Chairman
Charles W. Caulkins
Alexander Douglas
Charles F. Gauvin
James W. Gerard
William F. Indoe
William J. Nolan III
Tocqueville Funds
c/o US Bancorp Fund Services, LLC
P.O. Box 701
Milwaukee, WI 53201-0701
www.tocqueville.com/mutual-funds
TQ-ANNUAL 10/31/2016
Item 2. Code of Ethics.
The registrant has adopted a code of ethics that applies to the registrant’s principal executive officer and principal financial officer. The registrant has not made any substantive amendments to its code of ethics during the period covered by this report. The registrant has not granted any waivers from any provisions of the code of ethics during the period covered by this report.
Incorporated by reference to the Registrant’s Form N-CSR filed December 30, 2015.
Item 3. Audit Committee Financial Expert.
The registrant’s board of trustees has determined that there is at least one audit committee financial expert serving on its audit committee. James Gerard and William Nolan III are the “audit committee financial experts” and are considered to be “independent” as each term is defined in Item 3 of Form N-CSR.
Item 4. Principal Accountant Fees and Services.
The registrant has engaged its principal accountant to perform audit services, audit-related services, tax services and other services during the past two fiscal years. “Audit services” refer to performing an audit of the registrant’s annual financial statements or services that are normally provided by the accountant in connection with statutory and regulatory filings or engagements for those fiscal years. “Audit-related services” refer to the assurance and related services by the principal accountant that are reasonably related to the performance of the audit. “Tax services” refer to professional services rendered by the principal accountant for tax compliance, tax advice, and tax planning. “Other services” were not provided by the principal accountant. The following table details the aggregate fees billed or expected to be billed for each of the last two fiscal years for audit fees, audit-related fees, tax fees and other fees by the principal accountant.
| | | | |
| | | FYE 10/31/2016 | | FYE 10/31/2015 |
Audit Fees | | 168,000 | | 221,800 |
Audit-Related Fees | | 0 | | 0 |
Tax Fees | | 29,680 | | 29,000 |
All Other Fees | | 0 | | 0 |
The audit committee has adopted pre-approval policies and procedures that require the audit committee to pre-approve all audit and non-audit services of the registrant, including services provided to any entity affiliated with the registrant.
The percentage of fees billed by Grant Thornton applicable to non-audit services pursuant to waiver of pre-approval requirement were as follows:
| | | | |
| | | FYE 10/31/2016 | | FYE 10/31/2015 |
Audit-Related Fees | | 0% | | 0% |
Tax Fees | | 0% | | 0% |
All Other Fees | | 0% | | 0% |
All of the principal accountant’s hours spent on auditing the registrant’s financial statements were attributed to work performed by full-time permanent employees of the principal accountant.
The following table indicates the non-audit fees billed or expected to be billed by the registrant’s accountant for services to the registrant and to the registrant’s investment adviser (and any other controlling entity, etc.—not sub-adviser) for the last two years. The audit committee of the board of trustees/directors has considered whether the provision of non-audit services that were rendered to the registrant’s investment adviser is compatible with maintaining the principal accountant’s independence and has concluded that the provision of such non-audit services by the accountant has not compromised the accountant’s independence.
| | | | |
| Non-Audit Related Fees | | FYE 10/31/2016 | | FYE 10/31/2015 |
Registrant | | 0 | | 0 |
Registrant’s Investment Adviser | | 0 | | 0 |
Item 5. Audit Committee of Listed Registrants.
Not applicable to registrants who are not listed issuers (as defined in Rule 10A-3 under the Securities Exchange Act of 1934).
Item 6. Investments.
Schedule of Investments is included as part of the report to shareholders filed under Item 1 of this Form.
Item 7. Disclosure of Proxy Voting Policies and Procedures for Closed-End Management Investment Companies.
Not applicable to open-end investment companies.
Item 8. Portfolio Managers of Closed-End Management Investment Companies.
Not applicable to open-end investment companies.
Item 9. Purchases of Equity Securities by Closed-End Management Investment Company and Affiliated Purchasers.
Not applicable to open-end investment companies.
Item 10. Submission of Matters to a Vote of Security Holders.
There have been no material changes to the procedures by which shareholders may recommend nominees to the registrant’s board of trustees.
Item 11. Controls and Procedures.
| (a) | The Registrant’s President and Treasurer have reviewed the Registrant’s disclosure controls and procedures (as defined in Rule 30a-3(c) under the Investment Company Act of 1940 (the “Act”)) as of a date within 90 days of the filing of this report, as required by Rule 30a-3(b) under the Act and Rules 13a-15(b) or 15d-15(b) under the Securities Exchange Act of 1934. Based on their review, such officers have concluded that the disclosure controls and procedures are effective in ensuring that information required to be disclosed in this report is appropriately recorded, processed, summarized and reported and made known to them by others within the Registrant and by the Registrant’s service provider. |
| (b) | There were no changes in the Registrant’s internal control over financial reporting (as defined in Rule 30a-3(d) under the Act) that occurred during the second fiscal quarter of the period covered by this report that has materially affected, or is reasonably likely to materially affect, the Registrant’s internal control over financial reporting. |
Item 12. Exhibits.
| (a) | (1) Any code of ethics or amendment thereto, that is the subject of the disclosure required by Item 2, to the extent that the registrant intends to satisfy Item 2 requirements through filing an exhibit. |
Incorporated by reference to the Registrant’s Form N-CSR filed December 30, 2015.
(2) A separate certification for each principal executive officer and principal financial officer pursuant to Section 302 of the Sarbanes-Oxley Act of 2002. Filed herewith.
(3) Any written solicitation to purchase securities under Rule 23c-1 under the Act sent or given during the period covered by the report by or on behalf of the registrant to 10 or more persons. Not applicable to open-end investment companies.
| (b) | Certifications pursuant to Section 906 of the Sarbanes-Oxley Act of 2002. Furnished herewith. |
SIGNATURES
Pursuant to the requirements of the Securities Exchange Act of 1934 and the Investment Company Act of 1940, the registrant has duly caused this report to be signed on its behalf by the undersigned, thereunto duly authorized.
|
(Registrant) The Tocqueville Trust |
|
By (Signature and Title)* /s/ Robert W. Kleinschmidt |
Robert W. Kleinschmidt, President |
|
Date 12/28/2016 |
Pursuant to the requirements of the Securities Exchange Act of 1934 and the Investment Company Act of 1940, this report has been signed below by the following persons on behalf of the registrant and in the capacities and on the dates indicated.
|
By (Signature and Title)* /s/ Robert W. Kleinschmidt |
Robert W. Kleinschmidt, President |
|
Date 12/28/2016 |
|
By (Signature and Title)* /s/ Helen Balk |
Helen Balk, Treasurer |
|
Date 12/28/2016 |
* Print the name and title of each signing officer under his or her signature.