UNITED STATES
SECURITIES AND EXCHANGE COMMISSION
Washington, D.C. 20549
FORMN-CSR
CERTIFIED SHAREHOLDER REPORT OF REGISTERED
MANAGEMENT INVESTMENT COMPANIES
Investment Company Act file number811-04840
The Tocqueville Trust
(Exact name of registrant as specified in charter)
The Tocqueville Trust
40 W. 57th St., 19th Floor
New York, NY 10019
(Address of principal executive offices) (Zip code)
Robert W. Kleinschmidt
The Tocqueville Trust
40 W. 57th St., 19th Floor
New York, NY 10019
(Name and address of agent for service)
(212)698-0800
Registrant’s telephone number, including area code
Date of fiscal year end: October 31, 2019
Date of reporting period: October 31, 2019
Item 1. Reports to Stockholders.

The Tocqueville Trust
Mutual Funds
Annual Report
October 31, 2019
The Tocqueville Fund
The Tocqueville Opportunity Fund
The Tocqueville Gold Fund
The Tocqueville Phoenix Fund
The Tocqueville Select Fund
Beginning on January 1, 2021, as permitted by regulations adopted by the U.S. Securities and Exchange Commission, paper copies of the Funds’ annual and semiannual shareholder reports will no longer be sent by mail, unless you specifically request paper copies of the reports. Instead, the reports will be made available on the Funds’ website (http://tocquevillefunds.com/mutual-funds/download-information-literature-center), and you will be notified by mail each time a report is posted and provided with a website link to access the report.
If you already elected to receive shareholder reports electronically, you will not be affected by this change and you need not take any action. You may elect to receive shareholder reports and other communications from the Funds electronically anytime by contacting your financial intermediary (such as a broker-dealer or a bank) or, if you are a direct investor, by calling1-800-697-3863, or by enrolling at www.tocquevillefunds.com.
You may elect to receive all future reports in paper free of charge. If you invest through a financial intermediary, you can contact your financial intermediary to request that you continue to receive paper copies of your shareholder reports. If you invest directly with the Funds, you can call1-800-697-3863 to let the Funds know you wish to continue receiving paper copies of your shareholder reports. Your election to receive reports in paper will apply to all funds held in your account if you invest through your financial intermediary or all Funds held with the Fund complex if you invest directly with the Funds.

This report is not authorized for distribution to prospective investors unless preceded or accompanied by a currently effective prospectus of The Tocqueville Trust. Please call1-800-697-FUND (3863) for a free prospectus. Read it carefully before you invest.
You are invited to visit our website @www.tocquevillefunds.com
Chairman’s Letter
Dear Fellow Shareholders,
In the three fiscal years since the last Presidential election, U.S. equity markets have gained more than fifty percent. Not many financial observers would have predicted that on the night of Donald Trump’s election. Indeed, on election night, when the outcome became obvious, futures markets were off some ten percent. I remember calling our head trader to see if there was some way we could buy the downturn before the market opened. But, equity markets reassessed quickly, and, with few exceptions, most notably the fourth quarter of 2018 (the first quarter of our Funds’ fiscal year), have rallied ever since. Along the way, markets have had to absorb the Mueller investigation, international trade disputes, tariffs, at least one governmental shutdown, Brexit (or not), a prematurely tightening Fed, trillion dollar deficits, North Korea, regulatory harassment of the leading FANG technology companies, the 737 MAX, traces of asbestos in Baby Powder (or not), the revolving door in the White House, #Metoo, the Kavanaugh hearings, the Washington Nationals, and, last, but not least, the impeachment hearings. No doubt I forgot something.
The fact that, to date, markets have survived all this, and more, is a testament to their resiliency, or, equally, an indication of just how depressed they and the economy were prior to the election. Coming off an eight-year run of the slowest growing economy in the post war period, the economy and the markets had plenty of upside in November of 2016, which required nothing more than a change in animal spirits (and a few tax and regulatory changes) to unleash. We said as much at the time in a presentation I gave to the Florida Association of Insurance Brokers in early 2017 entitled “The Economy and Markets in the Age of Trump.”
Compare our optimism with that of this Nobel Prize winner…“It really does look like President Donald J. Trump, and the markets are plunging…So we are very probably looking at a global recession, with no end in sight. I suppose we could get lucky somehow. But on economic, as on everything else, a terrible thing has just happened.”—Paul Krugman, New York Times.
The lesson here, and it is always worth repeating, is that political preferences can lead to poor financial decisions. Separating them is essential and one of the most important tasks of our portfolio managers.
That was then, and this is now, as the saying goes, and the current fiscal year is fraught with political uncertainties which, it would seem, cannot help but impact markets. By the time of this writing next year, we will know if Trump turns out to be more (or less) than one-term President, or if he has been replaced by a Socialist, a small town mayor, a big town mayor, or a holdover from the previous eight year period of anemic growth, or, even, by his Vice President. Regardless of who triumphs, many will be chagrined.
As for the markets, what matters is not, apparently, all of these endless political sideshows, regardless of their entertainment value. Equity markets forecast earnings and how to value them. The valuation issue is intimately tied to interest rates which remain the single most important variable due to the enormity of worldwide and U.S. sovereign debt. Notwithstanding widespread belief, the Fed does not control interest rates, although it certainly makes an effort to appear that it does. Interest rates are determined by market forces and what market forces have been telling us for some time now, is that there is an excess supply of loanable funds, and no inflationary expectations across the developed world. It is hard to imagine a better backdrop for equity markets than that. To the extent politics, Presidential or otherwise, affects interest rates (and it can) it is important for the markets. If it doesn’t, as the last three years of market performance has shown, it doesn’t seem to matter very much.
Sincerely,

Robert W. Kleinschmidt
Chairman
The Tocqueville Fund
Dear Fellow Shareholder,
During the twelve months ended October 31, 2019, U.S. equity markets overcame two bouts of volatility, one at the end of calendar 2018 and the second in early summer 2019, to end the period at close to record highs. These episodes of uncertainty were driven primarily by the ever chaotic Trump administration and its trade disputes with China, signs of economic weakness in domestic industrial sectors, China, Europe and Japan, all exacerbated by the same as well as the strength of the dollar. In addition, there were concerns with an inverted yield curve that the Fed had tightened excessively and/or prematurely and needed to respond to that weakness. Indeed, the rally into the end of the period coincided with the gradual reintroduction of credit monetization ostensibly in response to a seizing up of the bank repo market in the U.S., as well as similar accommodative activity by the ECB and even a change in posture by the PBOC. With corporate earnings performing better than reduced expectations, this fourth quantitative easing by the Fed seemed to eliminate any doubts about its now dovish leanings and was not interpreted as presaging an imminent credit collapse or that central bankers believed easing would necessarily jump start the economy. Rather it seems that that Fed saw the need for additional liquidity in the system and responded.
For the fiscal year ended October 31, 2019, the Tocqueville Fund gained 14.91%, compared with the S&P 500, which returned 14.33% and with the Russell 3000 Value Index which returned 10.65%. Once again growth stocks outperformed value stocks but to a lesser extent than last year. While the S&P’s results were still led by most of the nowso-called FANMAG stocks, Procter & Gamble earned the fourth spot in the top five contributors behind Microsoft, Google and Facebook but ahead of Amazon. Sector performance of the Fund was mostly positive with Information Technology, Consumer Staples and Industrials leading the way and Energy, Real Estate and Consumer Discretionary being the biggest detractors. Individually, the top performing names of the Fund were Procter & Gamble, Microsoft, NextEra, Applied Materials and Illinois Tool Works. The laggards in the portfolio were DuPont, Halliburton, Exxon Mobil, Pfizer and Johnson & Johnson.
Applied Materials, which was a laggard last year, rebounded as expectations of a turn in the semiconductor cycle took hold. Procter & Gamble and NextEra benefitted from investors seeking defensive equities in light of economic fears but also in the case of Procter & Gamble reaping its investment in product innovation and marketing spend. Microsoft continues to execute in its growing cloud computing business and Illinois Tool Works is an example of an industrial company beating overly pessimistic expectations. Of the laggards, Halliburton stands out in hindsight as a mistake that was eliminated during the period in that its results have continued to be under pressure as
shale operators reduce activity in response to reduced demand for oil and gas. Of the others laggards, we continue to hold them though have trimmed Johnson & Johnson because of its litigation exposure.
During the period, a few new names were added to the portfolio. One of these was Nvidia, a manufacturer of graphics processing units (GPUs) typically used in video games but increasingly in other applications requiring rapid calculations like machine learning or autonomous vehicles. Nvidia’s shares had fallen out of favor because of concerns about a slowdown in demand for gaming equipment due to new game formats, an inventory overhang from cryptocurrencies where GPUs had been used for “mining” and the overall China trade fears. Our view is that this slowdown is temporary, that inventories will be cleared over time and that the secular trends are likely to continue. Hence, we believed that the shares were trading at a significant discount to intrinsic value.
Another new purchase was Raytheon, the defense contractor. Raytheon’s shares had been under pressure because of concerns that the defense spending would not be as favorable as expected with the Democrats winning in themid-term elections as well as the Trump administration proposing a budget that was less than expected and likely to pursue policies of military disengagement. Our view is that Raytheon is less vulnerable than the other large defense contractors to budget pressures and was well positioned for the sorts of spending that were likely to be priorities for the military in the future, namely cyber security and missile technology. The business has a strong balance sheet, generates consistent returns on capital and was trading at an attractive valuation considering the overall quality of the company.
Also added was United Technologies, a multi-industry conglomerate with traditionally attractive returns on capital that has seen its valuation compress because of concerns over China and recent performance issues at its Pratt and Whitney aerospace division. Our view is that the pending separation into three distinct companies focused on aerospace, HVAC equipment and elevators with a high service component brought on by investor activism will be value enhancing as the individual businesses receive higher ratings over time.
Another addition is Deere which has come under a great deal of strain as a result of trade tensions, declining soybean prices, flooding in the Midwest and recently, African swine fever. We believe that these are all temporary phenomena that will eventually improve enough to drive renewed demand for farm equipment and in the meantime the replacement cycle suggests that the fleet of currently owned equipment is reaching the point of needing to be refreshed, being closer to trough sales rather thanmid-cycle as is perceived by the market. Based on our analysis, this would indicate that Deere’s shares are attractively priced in relation to their intrinsic value
Another new position is Vulcan Materials, an aggregates and cement producer. Vulcan shares appeared out of favor, as investors continued to doubt the ability of the Trump Administration to pass any infrastructure related legislation. As well, poor weather delayed many construction projects. Our view was that the company would benefit from
an infrastructure bill that could be brought back into play followingmid-term elections, and that weather delays would eventually resolve themselves.
Aside from Halliburton and Johnson & Johnson mentioned previously, a variety of other positions were sold or trimmed in response to changes in circumstances, price targets being achieved or investor liquidity. These include Apple, Automated Data Processing, Bank of New York, Biogen, Boeing, Brighthouse Financial, Campbell Soup, Corteva, DOW Inc., DuPont, Facebook, Fireeye, Fluor, Goldcorp, Illinois Tool Works, JP Morgan Chase, McDonald’s, Merck, Metlife, Nektar Therapeutics, NextEra, Noble Energy, Pioneer Natural Resources, Schlumberger and Walmart.
With fixed income uncertainty contained for the moment, resolving the trade dispute with China is probably the biggest overhang on the market, but as we move into 2020 election uncertainty will likely come into play. As we look forward, one could not be faulted for believing that the market’s direction might continue to follow the past periods of global coordinated easing; and, that the reintroduction of liquidity might diminish risk aversion and encourage investors to return to equities and shy away from long dated fixed income.
But, of course, not necessarily in an election year, and not with so many of the leading candidates openly espousing socialist policies. Clearly, a socialist regime, and its attendant tax hikes, would not be bullish for the financial markets. Thus far, markets seem to have ignored this possibility, so, as time goes by, if the prospects for a socialist win increase, we would expect the markets to react. So, this is a development that bears close attention. Should those prospects decrease, however, while markets may heave a sigh of relief, we would not expect a major rally on the news. Likewise, with the impeachment drama currently unfolding. Investors seem very much unconcerned, or indifferent to the ongoing partisan machinations in the nation’s capital. Here, too, an unforeseen turn in current expectations holds risk for the markets.
As long-term, value-oriented investors, we tend to look through current events and focus on the long-term health of the economy and the prospects of our portfolio companies. While impeachment and a radical turn to failed socialist policies are cause for concern, we do not think either will have a lasting negative impact on the U.S. economy, albeit both could cause some temporary dislocations and downdrafts. We would attempt to take advantage of these developments, should they come, by adding high quality companies at favorable prices.
Sincerely,
| | |
| |  |
Robert W. Kleinschmidt Portfolio Manager | | Peter D. Shawn Director of Research |
The Tocqueville Fund
(Unaudited)
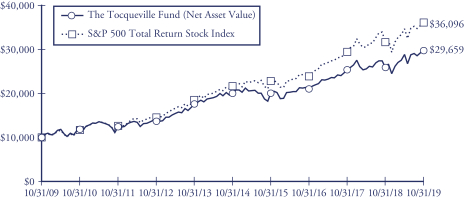
This chart assumes an initial gross investment of $10,000 made on 10/31/09. Returns shown do not reflect the deduction of taxes that a shareholder would pay on fund distributions or the redemption of fund shares. Performance reflects fee waivers in effect. In the absence of fee waivers, total return would be reduced. Returns shown include the reinvestment of all dividends and other distributions. Past performance is not predictive of future performance. Investment return and principal value will fluctuate so that your shares, when redeemed, may be worth more or less than their original cost.
The Standard & Poor’s 500 Total Return Stock Index (S&P 500) is a capital-weighted index, representing the aggregate market value of the common equity of 500 stocks primarily traded on the New York Stock Exchange. Returns assume the reinvestment of all dividends.
AVERAGE ANNUAL RATE OF RETURN (%)
FOR YEARS ENDED OCTOBER 31, 2019
| | | | | | | | | | | | | | | | |
| | | 1 Year | | | 3 Year | | | 5 Year | | | 10 Year | |
The Tocqueville Fund | | | 14.91% | | | | 12.32% | | | | 8.30% | | | | 11.48% | |
Standard & Poor’s 500 Total Return Stock Index | | | 14.33% | | | | 14.91% | | | | 10.78% | | | | 13.70% | |
The Tocqueville Opportunity Fund
Dear Fellow Shareholder:
We are pleased to provide this investment overview for the 2019 fiscal year for the Tocqueville Opportunity Fund. During the fiscal year ended October 31, 2019, the Fund appreciated 16.94% and outperformed the SMID cap growth benchmark, the Russell 2500 Growth Index, which gained 11.77%.
Over the past year, the Federal Reserve changed its policy and started cutting interest rates. This shift in policy was prompted by negative macro changes in China and Europe but also weakening data here in the U.S. as housing and industrial capex spending stagnated stoking fears of a recession. As we look forward and head into an election year, equity markets seem to have stabilized and have started to discount success on various trade fronts including an initial trade deal with China and a higher probability of the USMCA agreement being ratified by congress. Furthermore, consumer sentiment in the U.S. remains exceptionally strong which combined with low inflation and an accommodative Federal Reserve should support accelerating economic growth. Notwithstanding the economic cycle, the Fund continues to invest in issuers that can withstand an economic shock due to their secular growth opportunities, superior management teams, strong competitive advantages, and a plethora ofre-investment opportunities. While changes in investor sentiment can at times be irrational and exacerbated by program related trading it rarely results in dramatic fundamental shifts in the companies, such changes typically give us an opportunity to add to our higher conviction names.
Investments in Information Technology, Energy, and Financials provided the leading contributions on a relative basis versus the benchmark. Information Technology investments were the leading drivers of absolute and relative performance with Shopify, ServiceNow, Coupa Software, OKTA, and Workday representing the top five contributors to performance. We continue to maintain a positive view on the outlook for IT spending over the next year due to CIO spending surveys, CEO commentary, and the ongoing secular shift of IT spending fromon-premise and license-based to edge, cloud and SAAS based models. We also remain very constructive on the financial services industry and this is an area where we have increased exposure over the past year. We believe the digitization of cash and the demands by consumers to not only move money seamlessly but also access everything online are undeniable trends. Smaller regional banks are finding themselves in a difficult position to accommodate these demands as the level of investment required is immense. As a result, these smaller banks are increasingly outsourcing these mission critical tasks to companies like Fiserv and Fidelity National which have become top positions in our portfolio, and we remain bullish on the long-term prospects of these companies. Examining other areas of positive relative performance, we maintained an underweighted position in the Energy sector which contributed to our overall performance but we remain skeptical about the sector’s ability
to sustainably generate economic returns for shareholders. During the year the Healthcare sector weighed negatively on performance due to our investment in Sarepta Therapeutics which received a delay from the FDA for one of its drugs.
We are pleased to report that the Fund participated in five takeovers during the fiscal period, and has participated in approximately 95 takeovers since 2010 validating our investment process of investing in issuers with strong barriers to entry and sustainable competitive advantages. Fiscal 2019 takeovers included: Worldpay, Total System Services, Loxo Oncology, Ultimate Software, and Wellcare Health Plans. The Fund’s allocation to its top 10, 50, and 100 positions at the end of the fiscal period comprised 32%, 72%, and 91% respectively. The Fund’s active share relative to its benchmark continues to be high and has ranged from a low of 78% to high of 85% during the past 12 months.
As always, we sincerely appreciate your continued support.
Sincerely,

Paul Lambert
Portfolio Manager
The Tocqueville Opportunity Fund
(Unaudited)
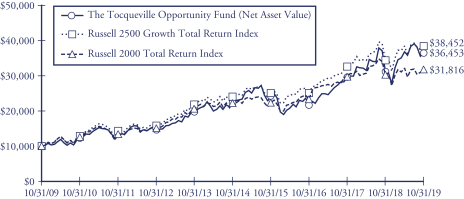
This chart assumes an initial gross investment of $10,000 made on 10/31/09. Returns shown do not reflect the deduction of taxes that a shareholder would pay on fund distributions or the redemption of fund shares. Returns shown include the reinvestment of all dividends and other distributions. Past performance is not predictive of future performance. Investment return and principal value will fluctuate so that your shares, when redeemed, may be worth more or less than their original cost.
The chart and table reflect The Opportunity Fund’s performance achieved prior to the changes effected in 2010 to its investment strategy.
The Russell 2500 Growth Total Return Index is an unmanaged index that measures the performance of the small to mid-cap growth segment of the U.S. equity universe. It includes those Russell 2500 companies with higher price-to-book ratios and higher forecasted growth values. Returns assume the reinvestment of all dividends.
The Russell 2000 Total Return Index is an unmanaged index that measures the performance of the 2,000 smallest companies in the Russell 3000 Index. Returns include the reinvestment of all dividends.
AVERAGE ANNUAL RATE OF RETURN (%)
FOR YEARS ENDED OCTOBER 31, 2019
| | | | | | | | | | | | | | | | |
| | | 1 Year | | | 3 Year | | | 5 Year | | | 10 Year | |
The Tocqueville Opportunity Fund | | | 16.94% | | | | 18.89% | | | | 10.38% | | | | 13.81% | |
Russell 2500 Growth Total Return Index | | | 11.77% | | | | 15.33% | | | | 9.83% | | | | 14.42% | |
Russell 2000 Total Return Index | | | 4.90% | | | | 10.96% | | | | 7.37% | | | | 12.27% | |
The Tocqueville Gold Fund
Dear Fellow Shareholder,
The Tocqueville Gold Fund’s fiscal year—November 2018 through October 2019—saw a significant and important change in the precious metals markets. After a multiple year downtrend and extended bottoming process, gold markets broke through price resistance levels that have held for six years. Gold’s steady rise throughout the fiscal year began as financial markets discounted the impact of a global economic slowdown due to trade wars. As the U.S. Federal Reserve raised interests at the end of the 2018 calendar year, and market volatility notably increased along with a weaker U.S. dollar, gold moved higher. By late January, the U.S. Federal Reserve had to backtrack on its interest rate stance, which provided further support for gold prices. During March through May, gold prices traded in a relatively flat and tight range before breaking out in late June, moving above a three-year resistance level of approximately $1350 per ounce. The continuing rhetoric around theChina-U.S. trade war supported gold’s advance during July while broader markets swooned in early August with extensive concern over negative interest rates. This enabled gold to break out, above an even longersix-year resistance level of $1550 per ounce—a price last seen when gold prices dramatically corrected in the spring of 2013. The end of the 2019 fiscal year finds broader financial markets and related valuations at unsustainable levels for the trillions of dollars of negative yielding debt trading around the globe. Gold has broken out to new highs in all currencies except in U.S. dollar terms, but we think it just a matter of time before it does. For the 2019 fiscal year, the Fund was up 33.54%, while the Philadelphia Gold and Silver Index was up 50.40% during the period.
In our quarterly investment letters, we have discussed the investment case for precious metal exposure and noted our concerns regarding the stability of broader markets. The main thesis remains our observation that government sponsored currencies will have to be debased when economic growth is insufficient to pay back the mounting obligations that fed that growth. Gold has stood the test of time as a means to preserve value and has demonstrated it can act as a form of portfolio insurance and a hedge to the destruction of financial asset values that could come with enormous debt loads.
The Fund holds physical gold that is vaulted outside the financial system, which we audit on a regular basis. It is the Fund’s largest position, making up approximately 14% of its assets. The Fund’s exposure to physical gold reduced Fund volatility during the period while it was also the second largest contributor to positive performance during the 2019 fiscal year. A small amount of gold was sold during the year for liquidity purposes.
Precious metal equities make up the rest of the Fund with approximately 70% in gold stocks and about 15% in silver stocks, and a small amount in cash. Silver like gold is considered a monetary metal, even though silver is used extensively for various industrial applications. The Fund has emphasized greater exposure to small- and mid-cap precious
metal mining stocks because their valuations offer greater long-term appreciation potential compared to the Philadelphia Gold and Silver Index which is heavily weighted to large precious metal producers.
The precious metal stocks that contributed the most during the period included Detour Gold Corporation, Franco-Nevada Corporation, Wheaton Precious Metals, and Agnico Eagle Mines. Detour Gold Corporation wasre-rated by the broader market as it restructured its board of directors in response to investor activism. Franco-Nevada Corporation benefitted from various investments that are now providing significant returns as well as the royalty model it has applied to the oil and gas sector. Wheaton Precious Metals received a favorable court decision regarding its tax status in Canada. As a result, the overhang on the stock lifted and Wheaton is receiving a more complete valuation that is now comparable to other precious metal royalty/streaming stocks. Agnico Eagle Mines is receiving a fuller valuation as it demonstrates that the past few years of mine investment are now yielding significant cash flow.
Corvus Gold, OceanaGold, Gold Standard Ventures Corp. and Jaguar Mining all corrected during the period, which held back Fund performance in a small way. In the case of Corvus Gold and OceanaGold, these stocks corrected from a period of outperformance during calendar 2018. Gold Standard Ventures, in which Goldcorp had a significant position, corrected with the merger of Newmont and Goldcorp. Jaguar Mining experienced challenges at its underground mines that resulted in less gold production. Are-capitalization of its balance sheet was very successful and has allowed the company to get back on track to recover and increase gold production.
Several positions were eliminated because they were either fully valued or presented limited value creation opportunities, such as Alacer Gold which became fully valued with the start of mining operations in Turkey. The Barrick position which resulted from its acquisition of the Fund’s holding in Randgold, was sold after the completion of that merger. The GoGold position was eliminated because of its limited options for value creation. GoldCorp was also sold during the period as its stock fully reflected the value of the Newmont bid for the company. Cia de Minas Buenaventura was sold as copper prices weakened and as operational challenges continued to impede stock price performance.
New names added during the period included Wesdome Gold Mines Ltd., AngloGold Ashanti Limited, Kirkland Lake Gold, Maverix Metals and West African Resources Ltd. Wesdome has identified gold ore zones at its operating Eagle River mine which should extend the mine-life of that operation and which will also provide the capital from its operating cash flow to restart Wesdome’s idled Kiena mine complex where high-grade ore zones are also being discovered. AngloGold Ashanti had been undervalued by the market, however new management has been successfully restructuring the company to improve its geographic and operating risk exposure. Kirkland Lake is benefitting from mining its high-grade gold deposits which are providing significant cash flow. Maverix Metals is a precious metal royalty/streaming company with a well-diversified portfolio of income generating royalties and precious metal streams. West African Resources has been
undervalued by the market, but is gettingre-rated, as it undertakes construction of its mine to access its high-grade gold deposit in west Africa.
Precious metal prices and related mining stocks have corrected somewhat from the August high and are consolidating in a relatively narrow trading range. We expect the U.S. Federal Reserve to keep interest rates low and the U.S. dollar to continue on its downward trend of the past couple of months. Low interest rates, a weaker U.S. dollar and continued volatility should be constructive for precious metal markets.
Sincerely,
| | | | |
 | |  | |  |
John C. Hathaway Portfolio Manager | | Douglas B. Groh Portfolio Manager | | Ryan McIntyre Portfolio Manager |
The Tocqueville Gold Fund—Investor Class
(Unaudited)
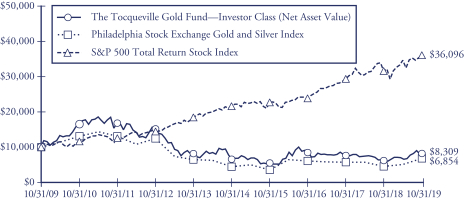
This chart assumes an initial gross investment of $10,000 made on 10/31/09. Returns shown do not reflect the deduction of taxes that a shareholder would pay on fund distributions or the redemption of fund shares. Returns shown include the reinvestment of all dividends and other distributions. Past performance is not predictive of future performance. Investment return and principal value will fluctuate so that your shares, when redeemed, may be worth more or less than their original cost. The Fund imposes a 2% redemption fee on shares held 90 days or less.
In 2009, 2010, and 2016 the performance of The Tocqueville Gold Fund—Investor Class was achieved during a period of unusually favorable market conditions. Such performance may not be sustainable.
The Philadelphia Stock Exchange Gold and Silver Index is an unmanaged capitalization-weighted index which includes the leading companies involved in the mining of gold and silver. Returns include the reinvestment of all dividends.
The Standard & Poor’s 500 Total Return Stock Index (S&P 500) is a capital-weighted index, representing the aggregate market value of the common equity of 500 stocks primarily traded on the New York Stock Exchange. Returns include the reinvestment of all dividends.
AVERAGE ANNUAL RATE OF RETURN (%)
FOR YEARS ENDED OCTOBER 31, 2019
| | | | | | | | | | | | | | | | |
| | | 1 Year | | | 3 Year | | | 5 Year | | | 10 Year | |
The Tocqueville Gold Fund—Investor Class | | | 33.54% | | | | -0.49% | | | | 4.98% | | | | -1.84% | |
Philadelphia Stock Exchange Gold and Silver Index | | | 50.40% | | | | 4.06% | | | | 8.95% | | | | -3.70% | |
Standard & Poor’s 500 Total Return Stock Index | | | 14.33% | | | | 14.91% | | | | 10.78% | | | | 13.70% | |
The Tocqueville Gold Fund—Institutional Class
(Unaudited)
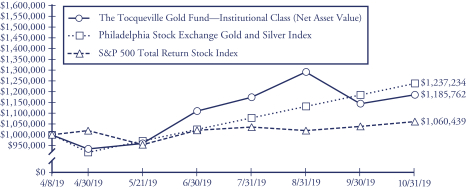
This chart assumes an initial gross investment of $1,000,000 made on 4/8/19 (commencement of operations for Institutional Class). Returns shown do not reflect the deduction of taxes that a shareholder would pay on fund distributions or the redemption of fund shares. Returns shown include the reinvestment of all dividends and other distributions. Past performance is not predictive of future performance. Investment return and principal value will fluctuate so that your shares, when redeemed, may be worth more or less than their original cost. The Fund imposes a 2% redemption fee on shares held 90 days or less.
The Philadelphia Stock Exchange Gold and Silver Index is an unmanaged capitalization-weighted index which includes the leading companies involved in the mining of gold and silver. Returns include the reinvestment of all dividends.
The Standard & Poor’s 500 Total Return Stock Index (S&P 500) is a capital-weighted index, representing the aggregate market value of the common equity of 500 stocks primarily traded on the New York Stock Exchange. Returns include the reinvestment of all dividends.
TOTAL RETURN (%)
FOR PERIOD ENDED OCTOBER 31, 2019
| | | | |
| | | Since Inception
(April 8, 2019) | |
The Tocqueville Gold Fund—Institutional Class | | | 18.58% | |
Philadelphia Stock Exchange Gold and Silver Index | | | 23.72% | |
Standard & Poor’s 500 Total Return Stock Index | | | 6.04% | |
The Tocqueville Phoenix Fund
Dear Fellow Shareholder,
For the fiscal year ended October 31, 2019, the Fund’s net asset value increased 6.16%, versus an increase of 4.90% for the Russell 2000 Index (“Russell 2000”), and an advance of 14.33% for the larger cap oriented Standard & Poor’s 500 Index (“S&P 500”), each on a total return basis. While domestic equity indices generally finished the fiscal year in the black, geopolitical headlines, particularly those related to U.S. and Chinese trade issues, dictated trading movements throughout and createdmonth-to-month volatility that we have not experienced in several years. After a subdued November 2018, a convergence of negative news drove market declines of historic proportions and the return of hyper-volatility. The federal government experienced a shut down, trade agreement talks between the United States and China deteriorated, and the rate of corporate earnings growth came into question. Markets panicked, with the Russell 2000 dropping 11.88% in December 2018. In what would become a pattern for the entire fiscal year, U.S. stocks would rebound in the following months after President Trump, seemingly spooked himself by the stock market’s drop, reversed course and delayed an anticipated increase in tariffs on Chinese imports. Further, evidence of a deceleration in the rate of growth in the U.S. economy prompted the Federal Reserve Board to delay anticipated rate hikes. The third fiscal quarter however, ushered in a new low in U.S./Chinese relations, with trade talks breaking down and President Trump abruptly naming Chinese telecom giant Huawei a national security threat and banning the sale of American technology to the company. The sudden threat of tariffs on Mexican imports also shocked markets. More of the sametit-for-tat between President Trump and the Chinese government continued into the fourth fiscal quarter, further pressuring equities, though accommodative easing by the Federal Reserve during the quarter was an effective antidote to investors’ blues.
Our style (value) and our market cap sweet spot (small to mid) remained a headwind for most of the fiscal year. The Russell 2000 Value Index generated a 3.22% return for the fiscal year, underperforming the Russell 2000 Growth Index by 318 basis points. The divergence in performance between small and large cap stocks was even more skewed, and evident in the 9.43 percentage point differential in the respective returns of the Russell 2000 and S&P 500. Despite an environment that was not supportive of our investment approach, the Fund managed to outperform the Russell 2000 on solid stock picking. Individual holdings that were top performers included US Concrete Inc, Flex Ltd., Fabrinet, Visteon Corporation and Lumentum Holdings Inc. The laggards in the portfolio included Cars.com Inc., McDermott International Inc., PVH Corp. and Harsco Corporation.
As we have written in the past, sector allocation is aby-product of ourbottom-up investment process. Nonetheless, our inadvertent sector weightings also added to the relative return for the period, as the Fund was overweight (and outperformed) the
strongest sector within the Russell 2000, information technology, which contributed about 480 basis points to the absolute return and 160 basis points to performance relative to the Russell 2000. The portfolio also had relatively little exposure to energy, which was a particularly weak component of the Russell 2000 during the fiscal year. The holdings in the materials sector were also strong contributors to both our absolute and relative performance.
A number of new positions were initiated during the fiscal year, the largest of which included DXC Technology Co., Loews Corporation, Louisiana Pacific Corp, Lumentum Holdings Inc, Orion Engineered Carbons, Solaris Oilfield Infrastructure Inc, Stanley Black & Decker Inc, and Visteon Corporation. The largest portfolio deletions included Avnet, Inc., Cars.com Inc., Ducommun Incorporated, Electronics for Imaging Inc., Gentex Corp., Hanesbrands Inc., and Minerals Technologies Inc.
We look ahead with a healthy dose of caution. U.S. leaders continue to meet with their Chinese counterparts in ongoing trade talks, lawmakers have initiated a public impeachment inquiry against President Trump, and the 2020 Presidential race is heating up, with tough to swallow implications anticipated no matter who the eventual winner is. That said, we remain active in searching for new investments, and to the extent that the market creates opportunities for us, we will act on them. We also believe that the portfolio remains well positioned, with companies that are generally generating cash, increasing their earnings and making strategic investment to accelerate their growth. Over time, we are confident that this progress will be reflected in higher market values.
Sincerely,
| | | | |
 | |  | |  |
J. Dennis Delafield Portfolio Manager | | Joshua Kaufthal Portfolio Manager | | James Maxwell Portfolio Manager |
The Tocqueville Phoenix Fund
(Unaudited)
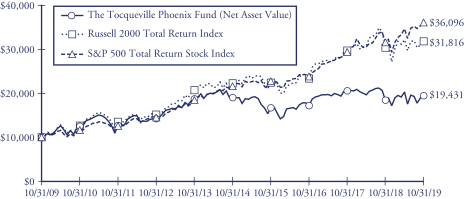
This chart assumes an initial gross investment of $10,000 made on 10/31/09. On February 15, 2019, The Delafield Fund’s name changed to The Tocqueville Phoenix Fund. Returns shown do not reflect the deduction of taxes that a shareholder would pay on fund distributions or the redemption of fund shares. Performance reflects fee waivers in effect. In the absence of fee waivers, total return would be reduced. Returns shown include the reinvestment of all dividends and other distributions. Past performance is not predictive of future performance. Investment return and principal value will fluctuate so that your shares, when redeemed, may be worth more or less than their original cost.
The Russell 2000 Total Return Index is an unmanaged index that measures the performance of the 2,000 smallest companies in the Russell 3000 Index, which represent approximately 10% of the total market capitalization of the Russell 3000 Index. Returns include the reinvestment of all dividends.
The Standard & Poor’s 500 Total Return Stock Index (S&P 500) is a capital-weighted index, representing the aggregate market value of the common equity of 500 stocks primarily traded on the New York Stock Exchange. Returns include the reinvestment of all dividends.
AVERAGE ANNUAL RATE OF RETURN (%)
FOR YEARS ENDED OCTOBER 31, 2019
| | | | | | | | | | | | | | | | |
| | | 1 Year | | | 3 Year | | | 5 Year | | | 10 Year | |
The Tocqueville Phoenix Fund* | | | 6.16% | | | | 4.14% | | | | 0.46% | | | | 6.87% | |
Russell 2000 Total Return Index | | | 4.90% | | | | 10.96% | | | | 7.37% | | | | 12.27% | |
Standard & Poor’s 500 Total Return Stock Index | | | 14.33% | | | | 14.91% | | | | 10.78% | | | | 13.70% | |
| * | Prior to February 15, 2019, the Fund’s name was The Delafield Fund. |
The Tocqueville Select Fund
Dear Fellow Shareholder,
For the fiscal year ended October 31, 2019, the Fund’s net asset value increased 4.68%, versus an increase of 8.84% for the Russell 2500 Index (“Russell 2500”), and an advance of 4.90% for the Russell 2000 Index (“Russell 2000”), each on a total return basis. Geopolitical headlines, particularly those related to U.S. and Chinese trade issues, dictated trading movements throughout the fiscal year. One month into the fiscal year a convergence of negative news drove market declines of historic proportions and the return of hyper-volatility. The federal government experienced a shut down, trade agreement talks between the United States and China deteriorated, and the rate of corporate earnings growth came into question. In what would become a pattern for the entire fiscal year, U.S. stocks would rebound in the following months after President Trump, seemingly spooked himself by the stock market’s drop, reversed course and delayed an anticipated increase in tariffs on Chinese imports. Further, evidence of a deceleration in the rate of growth in the U.S. economy prompted the Federal Reserve Board to delay anticipated rate hikes. The third fiscal quarter however, ushered in a new low in U.S./Chinese relations, with trade talks breaking down and President Trump abruptly naming Chinese telecom giant Huawei a national security threat and banning the sale of American technology to the company. The sudden threat of tariffs on Mexican imports also shocked markets. More of the sametit-for-tat between President Trump and the Chinese government continued into the fourth fiscal quarter, further pressuring equities, though accommodative easing by the Federal Reserve during the quarter was an effective antidote to investors’ blues.
Stock selection was mixed during the fiscal year and owing to the concentrated nature of the portfolio, performance was disproportionately impacted by the decline of a couple of holdings. To be more specific, Cars.com and Tile Shop Holdings Inc experienced several operational challenges and as a result, their shares were pressured and negatively impacted the absolute return by about 600 basis points in aggregate for the 2019 fiscal year. In contrast, Epam Systems Inc and J2 Global Inc were particularly strong performers, but their combined contribution was more than offset by the laggards.
Sector allocation is aby-product of ourbottom-up investment process. Nonetheless, we note that we were overweight in information technology, which contributed favorably to the performance. Among other heavily weighted sectors, industrials and consumer discretionary were a negative, as the Fund’s investments, in aggregate, underperformed the comparable sector holdings in the Russell 2500.
A number of new positions were initiated during the fiscal year. These included Cross Country Healthcare, DXC Technology, Orion Engineered Carbons, PVH Corp. and Solaris Oilfield Infrastructure Inc. Also, several positions were exited, the largest of
which at the time were Apogee Enterprises Inc, Epam Systems Inc, Gentex Corp, ICF International, J2 Global Inc, Minerals Technologies, Team Inc and TrueBlue Inc.
Sincerely,
| | |
| | |
J. Dennis Delafield Portfolio Manager | | Joshua Kaufthal Portfolio Manager |
| | |
 | | |
Donald Wang Portfolio Manager | | James Maxwell Portfolio Manager |
The Tocqueville Select Fund
(Unaudited)
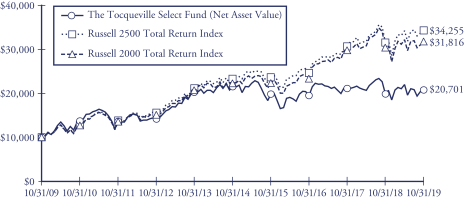
This chart assumes an initial gross investment of $10,000 made on 10/31/09. Returns shown do not reflect the deduction of taxes that a shareholder would pay on fund distributions or the redemption of fund shares. Performance reflects fee waivers in effect. In the absence of fee waivers, total return would be reduced. Returns shown include the reinvestment of all dividends and other distributions. Past performance is not predictive of future performance. Investment return and principal value will fluctuate so that your shares, when redeemed, may be worth more or less than their original cost.
In 2013 the performance of The Tocqueville Select Fund was achieved during a period of unusually favorable market conditions. Such performance may not be sustainable.
The Russell 2500 Total Return Index is an unmanaged index that measures the performance of the 2,500 smallest companies in the Russell 3000 Index. Returns include the reinvestment of all dividends.
The Russell 2000 Total Return Index is an unmanaged index that measures the performance of the 2,000 smallest companies in the Russell 3000 Index. Returns include the reinvestment of all dividends.
AVERAGE ANNUAL RATE OF RETURN (%)
FOR YEARS ENDED OCTOBER 31, 2019
| | | | | | | | | | | | | | | | |
| | | 1 Year | | | 3 Year | | | 5 Year | | | 10 Year | |
The Tocqueville Select Fund | | | 4.68% | | | | 2.20% | | | | -0.74% | | | | 7.55% | |
Russell 2500 Total Return Index | | | 8.84% | | | | 11.74% | | | | 8.04% | | | | 13.10% | |
Russell 2000 Total Return Index | | | 4.90% | | | | 10.96% | | | | 7.37% | | | | 12.27% | |
Expense Example—October 31, 2019 (Unaudited)
As a shareholder of The Tocqueville Trust (the “Funds”), you incur ongoing costs, including management fees; distribution fees; and other Fund expenses. This example is intended to help you understand your ongoing costs (in dollars) of investing in the Funds and to compare costs with the ongoing costs of investing in other mutual funds.
The Example is based on an investment of $1,000 invested at the beginning of the period and held the entire period (May 1, 2019-October 31, 2019).
Actual Expenses
The first line of the table below provides information about actual account values and actual expenses. You may use the information in this line, together with the amount you invested, to estimate the expenses that you paid over the period. Simply divide your account value by $1,000 (for example, an $8,600 account value divided by $1,000 = 8.6), then multiply the result by the number in the first line under the heading entitled “Expenses Paid During Period” to estimate the expenses you paid on your account during this period.
Hypothetical Example for Comparison Purposes
The second line of the table below provides information about hypothetical account values and hypothetical expenses based on the Funds’ actual expense ratios and an assumed rate of return of 5% per year before expenses, which is not the Funds’ actual return. The hypothetical account values and expenses may not be used to estimate the actual ending account balance or expenses you paid for the period. You may use this information to compare the ongoing costs of investing in the Funds and other funds. To do so, compare this 5% hypothetical example with the 5% hypothetical examples that appear in the shareholder reports of the other funds.
Please note that the expenses shown in the table are meant to highlight your ongoing costs only and do not reflect any transactional costs, such as sales charges (loads), redemption fees, or exchange fees. Therefore, the second line of the table is useful in comparing ongoing costs only, and will not help you determine the relative costs of owning different funds. In addition, if these transactional costs were included, your costs would have been higher.
Expense Example Tables (Unaudited)
The Tocqueville Fund
| | | | | | | | | | | | |
| | | Beginning
Account Value
May 1, 2019 | | | Ending
Account Value
October 31,
2019 | | | Expenses Paid
During Period*
May 1, 2019-
October 31, 2019 | |
Actual | | $ | 1,000.00 | | | $ | 1,030.50 | | | $ | 6.40 | |
Hypothetical (5% return before expenses) | | | 1,000.00 | | | | 1,018.90 | | | | 6.36 | |
| * | Expenses are equal to the Fund’s annualized six-month expense ratio (including interest expense) of 1.25% for The Tocqueville Fund, multiplied by the average account value over the period, multiplied by 184/365 to reflect the one-half year period. |
The Tocqueville Opportunity Fund
| | | | | | | | | | | | |
| | | Beginning
Account Value
May 1, 2019 | | | Ending
Account Value
October 31,
2019 | | | Expenses Paid
During Period*
May 1, 2019-
October 31, 2019 | |
Actual | | $ | 1,000.00 | | | $ | 990.10 | | | $ | 6.47 | |
Hypothetical (5% return before expenses) | | | 1,000.00 | | | | 1,018.70 | | | | 6.56 | |
| * | Expenses are equal to the Fund’s annualized six-month expense ratio (including interest expense) of 1.29% for The Tocqueville Opportunity Fund, multiplied by the average account value over the period, multiplied by 184/365 to reflect the one-half year period. |
The Tocqueville Gold Fund—Investor Class
| | | | | | | | | | | | |
| | | Beginning
Account Value
May 1, 2019 | | | Ending
Account Value
October 31,
2019 | | | Expenses Paid
During Period*
May 1, 2019-
October 31, 2019 | |
Actual | | $ | 1,000.00 | | | | | | | $ | | |
Hypothetical (5% return before expenses) | | | 1,000.00 | | | | | | | | | |
| * | Expenses are equal to the Fund’s annualized six-month expense ratio (including interest expense) of 1.46% for The Tocqueville Gold Fund Investor Class, multiplied by the average account value over the period, multiplied by 184/365 to reflect the one-half year period. |
The Tocqueville Gold Fund—Institutional Class
| | | | | | | | | | | | |
| | | Beginning
Account Value
May 1, 2019 | | | Ending
Account Value
October 31,
2019 | | | Expenses Paid
During Period*
May 1, 2019-
October 31, 2019 | |
Actual | | $ | 1,000.00 | | | $ | 1,269.50 | | | $ | 7.32 | |
Hypothetical (5% return before expenses) | | | 1,000.00 | | | | 1,018.75 | | | | 6.51 | |
| * | Expenses are equal to the Fund’s annualized six-month expense ratio of 1.28% for The Tocqueville Gold Fund Institutional Class, multiplied by the average value over the period, multiplied by the average value over the period, multiplied by 184/365 to reflect the one-half year period. |
The Tocqueville Phoenix Fund
| | | | | | | | | | | | |
| | | Beginning
Account Value
May 1, 2019 | | | Ending
Account Value
October 31,
2019 | | | Expenses Paid
During Period*
May 1, 2019-
October 31, 2019 | |
Actual | | $ | 1,000.00 | | | $ | 956.40 | | | $ | 6.16 | |
Hypothetical (5% return before expenses) | | | 1,000.00 | | | | 1,018.90 | | | | 6.36 | |
| * | Expenses are equal to the Fund’s annualized six-month expense ratio of 1.25% for The Tocqueville Phoenix Fund, multiplied by the average account value over the period, multiplied by 184/365 to reflect the one-half year period. |
The Tocqueville Select Fund
| | | | | | | | | | | | |
| | | Beginning
Account Value
May 1, 2019 | | | Ending
Account Value
October 31,
2019 | | | Expenses Paid
During Period*
May 1, 2019-
October 31, 2019 | |
Actual | | $ | 1,000.00 | | | $ | 941.40 | | | $ | 6.12 | |
Hypothetical (5% return before expenses) | | | 1,000.00 | | | | 1,018.90 | | | | 6.36 | |
| * | Expenses are equal to the Fund’s annualized six-month expense ratio of 1.25% for The Tocqueville Select Fund, multiplied by the average account value over the period, multiplied by 184/365 to reflect the one-half year period. |
The Tocqueville Fund
Financial Highlights
| | | | | | | | | | | | | | | | | | | | |
Per share operating performance
(For a share outstanding throughout the
year) | | Years Ended October 31, | |
| | 2019 | | | 2018 | | | 2017 | | | 2016 | | | 2015 | |
Net asset value, beginning of year | | $ | 35.84 | | | $ | 38.60 | | | $ | 33.72 | | | $ | 32.91 | | | $ | 34.18 | |
| | | | | | | | | | | | | | | | | | | | |
Operations: | | | | | | | | | | | | | | | | | | | | |
Net investment income (1) | | | 0.43 | | | | 0.35 | | | | 0.37 | | | | 0.42 | | | | 0.37 | |
Net realized and unrealized gain (loss) | | | 4.46 | | | | 0.45 | | | | 6.40 | | | | 1.07 | | | | (0.19 | ) |
| | | | | | | | | | | | | | | | | | | | |
Total from investment operations * | | | 4.89 | | | | 0.80 | | | | 6.77 | | | | 1.49 | | | | 0.18 | |
| | | | | | | | | | | | | | | | | | | | |
Distributions to shareholders: | | | | | | | | | | | | | | | | | | | | |
Dividends from net investment income | | | (0.34 | ) | | | (0.33 | ) | | | (0.39 | ) | | | (0.35 | ) | | | (0.25 | ) |
Distributions from net realized gains | | | (2.59 | ) | | | (3.23 | ) | | | (1.50 | ) | | | (0.33 | ) | | | (1.20 | ) |
| | | | | | | | | | | | | | | | | | | | |
Total distributions | | | (2.93 | ) | | | (3.56 | ) | | | (1.89 | ) | | | (0.68 | ) | | | (1.45 | ) |
| | | | | | | | | | | | | | | | | | | | |
Change in net asset value for the year | | | 1.96 | | | | (2.76 | ) | | | 4.88 | | | | 0.81 | | | | (1.27 | ) |
| | | | | | | | | | | | | | | | | | | | |
Net asset value, end of year | | $ | 37.80 | | | $ | 35.84 | | | $ | 38.60 | | | $ | 33.72 | | | $ | 32.91 | |
| | | | | | | | | | | | | | | | | | | | |
* Includes redemption fees per share of | | | N/A | | | | N/A | | | | N/A | | | | N/A | | | | 0.00 | (2) |
Total Return | | | 14.9 | % | | | 2.0 | % | | | 20.9 | % | | | 4.6 | % | | | 0.5 | % |
Ratios/supplemental data | | | | | | | | | | | | | | | | | | | | |
Net assets, end of year (000) | | $ | 285,070 | | | $ | 272,043 | | | $ | 293,637 | | | $ | 283,126 | | | $ | 309,267 | |
Ratio to average net assets: | | | | | | | | | | | | | | | | | | | | |
Expenses before waiver/reimbursement | | | 1.30 | % | | | 1.26 | % | | | 1.27 | % | | | 1.27 | % | | | 1.29 | % |
Expenses after waiver/reimbursement | | | 1.25 | % | | | 1.25 | % | | | 1.26 | %(3) | | | 1.24 | %(3) | | | 1.25 | % |
Net investment income before waiver/reimbursement | | | 1.11 | % | | | 0.91 | % | | | 0.97 | % | | | 1.18 | % | | | 0.91 | % |
Net investment income after waiver/reimbursement | | | 1.16 | % | | | 0.92 | % | | | 0.98 | % | | | 1.21 | % | | | 0.95 | % |
Portfolio turnover rate | | | 13 | % | | | 19 | % | | | 10 | % | | | 12 | % | | | 15 | % |
| (1) | Net investment income per share is calculated using the ending balance prior to consideration or adjustment for permanentbook-to-tax differences. |
| (2) | Represents less than $0.01. |
| (3) | Includes 0.01% of interest expense. Interest expense is not included in the Fund’s waiver/reimbursement. |
The Accompanying Notes are an Integral Part of these Financial Statements.
The Tocqueville Opportunity Fund
Financial Highlights
| | | | | | | | | | | | | | | | | | | | |
Per share operating performance
(For a share outstanding throughout the year) | | Years Ended October 31, | |
| | 2019 | | | 2018 | | | 2017 | | | 2016 | | | 2015 | |
Net asset value, beginning of year | | $ | 26.60 | | | $ | 26.12 | | | $ | 19.14 | | | $ | 21.41 | | | $ | 22.78 | |
| | | | | | | | | | | | | | | | | | | | |
Operations: | | | | | | | | | | | | | | | | | | | | |
Net investment loss (1) | | | (0.29 | ) | | | (0.29 | ) | | | (0.37 | ) | | | (0.29 | ) | | | (0.15 | ) |
Net realized and unrealized gain (loss) | | | 4.29 | | | | 1.63 | | | | 7.35 | | | | (1.98 | ) | | | 1.98 | |
| | | | | | | | | | | | | | | | | | | | |
Total from investment operations * | | | 4.00 | | | | 1.34 | | | | 6.98 | | | | (2.27 | ) | | | 1.83 | |
| | | | | | | | | | | | | | | | | | | | |
Distributions to shareholders: | | | | | | | | | | | | | | | | | | | | |
Dividends from net investment income | | | — | | | | — | | | | — | | | | — | | | | — | |
Distributions from net realized gains | | | (2.49 | ) | | | (0.86 | ) | | | — | | | | — | | | | (3.20 | ) |
| | | | | | | | | | | | | | | | | | | | |
Total distributions | | | (2.49 | ) | | | (0.86 | ) | | | — | | | | — | | | | (3.20 | ) |
| | | | | | | | | | | | | | | | | | | | |
Change in net asset value for the year | | | 1.51 | | | | 0.48 | | | | 6.98 | | | | (2.27 | ) | | | (1.37 | ) |
| | | | | | | | | | | | | | | | | | | | |
Net asset value, end of year | | $ | 28.11 | | | $ | 26.60 | | | $ | 26.12 | | | $ | 19.14 | | | $ | 21.41 | |
| | | | | | | | | | | | | | | | | | | | |
* Includes redemption fees per share of | | | N/A | | | | N/A | | | | N/A | | | | N/A | | | | 0.00 | (2) |
Total Return | | | 16.9 | % | | | 5.3 | % | | | 36.5 | % | | | (10.6 | )% | | | 9.1 | % |
Ratios/supplemental data | | | | | | | | | | | | | | | | | | | | |
Net assets, end of year (000) | | $ | 84,583 | | | $ | 82,106 | | | $ | 77,773 | | | $ | 92,958 | | | $ | 153,456 | |
Ratio to average net assets: | | | | | | | | | | | | | | | | | | | | |
Expenses before waiver/reimbursement | | | 1.41 | % | | | 1.33 | % | | | 1.38 | % | | | 1.38 | % | | | 1.31 | % |
Expenses after waiver/reimbursement | | | 1.28 | %(3) | | | 1.26 | %(3) | | | 1.30 | %(3)(4) | | | 1.38 | % | | | 1.31 | % |
Net investment income before waiver/reimbursement | | | (1.10 | )% | | | (1.13 | )% | | | (1.05 | )% | | | (0.94 | )% | | | (0.95 | )% |
Net investment income after waiver/reimbursement | | | (0.97 | )% | | | (1.06 | )% | | | (0.97 | )%(4) | | | (0.94 | )% | | | (0.95 | )% |
Portfolio turnover rate | | | 133 | % | | | 151 | % | | | 133 | % | | | 108 | % | | | 101 | % |
| (1) | Net investment loss per share is calculated using the ending balance prior to consideration or adjustment for permanentbook-to-tax differences. |
| (2) | Represents less than $0.01. |
| (3) | Includes interest expense of 0.03% for the year ended October 31, 2019, 0.01% for the year ended October 31, 2018, and 0.05% for the year ended October 31, 2017. Interest expense is not included in the Fund’s operating expense cap. |
| (4) | Expense waiver of 1.25% was implemented on November 1, 2016. |
The Accompanying Notes are an Integral Part of these Financial Statements.
The Tocqueville Gold Fund—Investor Class
Financial Highlights
| | | | | | | | | | | | | | | | | | | | |
Per share operating performance
(For a share outstanding throughout
the year) | | Years Ended October 31, | |
| | 2019 | | | 2018 | | | 2017 | | | 2016 | | | 2015 | |
Net asset value, beginning of year | | $ | 29.01 | | | $ | 35.64 | | | $ | 39.32 | | | $ | 26.04 | | | $ | 30.38 | |
| | | | | | | | | | | | | | | | | | | | |
Operations: | | | | | | | | | | | | | | | | | | | | |
Net investment loss (1) | | | (0.43 | ) | | | (0.38 | ) | | | (0.39 | ) | | | (0.33 | ) | | | (0.27 | ) |
Net realized and unrealized gain (loss) | | | 10.16 | | | | (6.25 | ) | | | (3.29 | ) | | | 13.61 | | | | (4.07 | ) |
| | | | | | | | | | | | | | | | | | | | |
Total from investment operations * | | | 9.73 | | | | (6.63 | ) | | | (3.68 | ) | | | 13.28 | | | | (4.34 | ) |
| | | | | | | | | | | | | | | | | | | | |
Distributions to shareholders: | | | | | | | | | | | | | | | | | | | | |
Dividends from net investment income | | | — | | | | — | | | | — | | | | — | | | | — | |
Distributions from net realized gains | | | — | | | | — | | | | — | | | | — | | | | — | |
| | | | | | | | | | | | | | | | | | | | |
Total distributions | | | — | | | | — | | | | — | | | | — | | | | — | |
| | | | | | | | | | | | | | | | | | | | |
Change in net asset value for the year | | | 9.73 | | | | (6.63 | ) | | | (3.68 | ) | | | 13.28 | | | | (4.34 | ) |
| | | | | | | | | | | | | | | | | | | | |
Net asset value, end of year | | $ | 38.74 | | | $ | 29.01 | | | $ | 35.64 | | | $ | 39.32 | | | $ | 26.04 | |
| | | | | | | | | | | | | | | | | | | | |
* Includes redemption fees per share of | | | 0.02 | | | | 0.00 | (2) | | | 0.01 | | | | 0.01 | | | | 0.01 | |
Total Return | | | 33.5 | % | | | (18.6 | )% | | | (9.4 | )% | | | 51.0 | % | | | (14.3 | )% |
Ratios/supplemental data | | | | | | | | | | | | | | | | | | | | |
Net assets, end of year (000) | | $ | 998,076 | | | $ | 859,394 | | | $ | 1,153,287 | | | $ | 1,365,282 | | | $ | 947,367 | |
Ratio to average net assets: | | | | | | | | | | | | | | | | | | | | |
Expense | | | 1.47 | % | | | 1.42 | % | | | 1.38 | % | | | 1.39 | % | | | 1.43 | % |
Net investment loss | | | (0.94 | )% | | | (0.88 | )% | | | (0.95 | )% | | | (0.91 | )% | | | (0.84 | )% |
Portfolio turnover rate | | | 12 | % | | | 9 | % | | | 14 | % | | | 15 | % | | | 11 | % |
| (1) | Net investment loss per share is calculated using the ending balance prior to consideration or adjustment for permanentbook-to-tax differences. |
| (2) | Represents less than $0.01. |
The Accompanying Notes are an Integral Part of these Financial Statements.
The Tocqueville Gold Fund—Institutional Class
Financial Highlights
| | | | |
Per share operating performance
(For a share outstanding throughout the period) | | April 8, 2019(1)
through
October 31, 2019 | |
|
Net asset value, beginning of period (1) | | $ | 32.73 | |
| | | | |
Operations: | | | | |
Net investment loss (2) | | | (0.10 | ) |
Net realized and unrealized gain | | | 6.18 | |
| | | | |
Total from investment operations * | | | 6.08 | |
| | | | |
Distributions to shareholders: | | | | |
Dividends from net investment income | | | — | |
Distributions from net realized gains | | | — | |
| | | | |
Total distributions | | | — | |
| | | | |
Change in net asset value for the year | | | 6.08 | |
| | | | |
Net asset value, end of year | | $ | 38.81 | |
| | | | |
* Includes redemption fees per share of | | | | |
Total Return (3) | | | 18.6 | % |
Ratios/supplemental data | | | | |
Net assets, end of year (000) | | $ | 39,732 | |
Ratio to average net assets: | | | | |
Expense (4) | | | 1.28 | % |
Net investment loss (4) | | | (0.93 | ) |
Portfolio turnover rate | | | 12 | % |
| (1) | Institutional Class shares commenced operations on April 8, 2019. |
| (2) | Net investment loss per share is calculated using the ending balance prior to consideration or adjustment for permanentbook-to-tax differences. |
| (3) | Not annualized for the period ended October 31, 2019. |
| (4) | Annualized for the period ended October 31, 2019. |
The Accompanying Notes are an Integral Part of these Financial Statements.
The Tocqueville Phoenix Fund
Financial Highlights
| | | | | | | | | | | | | | | | | | | | |
Per share operating performance
(For a share outstanding throughout the
year) | | Years Ended October 31, | |
| | 2019 | | | 2018 | | | 2017 | | | 2016 | | | 2015 | |
Net asset value, beginning of year | | $ | 20.20 | | | $ | 26.40 | | | $ | 26.47 | | | $ | 28.64 | | | $ | 36.40 | |
| | | | | | | | | | | | | | | | | | | | |
Operations: | | | | | | | | | | | | | | | | | | | | |
Net investment loss (1) | | | (0.03 | ) | | | (0.14 | ) | | | (0.15 | ) | | | (0.15 | ) | | | (0.14 | ) |
Net realized and unrealized gain (loss) | | | 1.16 | | | | (2.27 | ) | | | 4.91 | | | | 0.78 | | | | (3.99 | ) |
| | | | | | | | | | | | | | | | | | | | |
Total from investment operations * | | | 1.13 | | | | (2.41 | ) | | | 4.76 | | | | 0.63 | | | | (4.13 | ) |
| | | | | | | | | | | | | | | | | | | | |
Distributions to shareholders: | | | | | | | | | | | | | | | | | | | | |
Dividends from net investment income | | | 0.00 | (2) | | | — | | | | — | | | | — | | | | — | |
Distributions from net realized gains | | | (1.35 | ) | | | (3.79 | ) | | | (4.83 | ) | | | (2.80 | ) | | | (3.63 | ) |
| | | | | | | | | | | | | | | | | | | | |
Total distributions | | | (1.35 | ) | | | (3.79 | ) | | | (4.83 | ) | | | (2.80 | ) | | | (3.63 | ) |
| | | | | | | | | | | | | | | | | | | | |
Change in net asset value for the year | | | (0.22 | ) | | | (6.20 | ) | | | (0.07 | ) | | | (2.17 | ) | | | (7.76 | ) |
| | | | | | | | | | | | | | | | | | | | |
Net asset value, end of year | | $ | 19.98 | | | $ | 20.20 | | | $ | 26.40 | | | $ | 26.47 | | | $ | 28.64 | |
| | | | | | | | | | | | | | | | | | | | |
* Includes redemption fees per share of | | | N/A | | | | N/A | | | | N/A | | | | N/A | | | | 0.00 | (2) |
Total Return | | | 6.2 | % | | | (10.6 | )% | | | 19.0 | % | | | 3.3 | % | | | (12.3 | )% |
Ratios/supplemental data | | | | | | | | | | | | | | | | | | | | |
Net assets, end of year (000) | | $ | 160,433 | | | $ | 237,119 | | | $ | 373,353 | | | $ | 400,827 | | | $ | 674,525 | |
Ratio to average net assets: | | | | | | | | | | | | | | | | | | | | |
Expenses before waiver/reimbursement | | | 1.39 | % | | | 1.32 | % | | | 1.31 | % | | | 1.29 | % | | | 1.25 | % |
Expenses after waiver/reimbursement | | | 1.25 | % | | | 1.25 | % | | | 1.25 | %(3) | | | 1.29 | % | | | 1.25 | % |
Net investment income before waiver/reimbursement | | | (0.24 | )% | | | (0.55 | )% | | | (0.55 | )% | | | (0.33 | )% | | | (0.15 | )% |
Net investment income after waiver/reimbursement | | | (0.10 | )% | | | (0.48 | )% | | | (0.49 | )%(3) | | | (0.33 | )% | | | (0.15 | )% |
Portfolio turnover rate | | | 40 | % | | | 40 | % | | | 36 | % | | | 39 | % | | | 19 | % |
| (1) | Net investment loss per share is calculated using the ending balance prior to consideration or adjustment for permanentbook-to-tax differences. |
| (2) | Represents less than $0.01. |
| (3) | Expense waiver of 1.25% was implemented on November 1, 2016. |
The Accompanying Notes are an Integral Part of these Financial Statements.
The Tocqueville Select Fund
Financial Highlights
| | | | | | | | | | | | | | | | | | | | |
Per share operating performance
(For a share outstanding throughout the year) | | Years Ended October 31, | |
| | 2019 | | | 2018 | | | 2017 | | | 2016 | | | 2015 | |
Net asset value, beginning of year | | $ | 10.90 | | | $ | 11.87 | | | $ | 11.43 | | | $ | 12.08 | | | $ | 14.90 | |
| | | | | | | | | | | | | | | | | | | | |
Operations: | | | | | | | | | | | | | | | | | | | | |
Net investment loss (1) | | | (0.03 | ) | | | (0.05 | ) | | | (0.06 | ) | | | (0.07 | ) | | | (0.08 | ) |
Net realized and unrealized gain (loss) | | | 0.54 | | | | (0.70 | ) | | | 1.12 | | | | (0.18 | ) | | | (1.00 | ) |
| | | | | | | | | | | | | | | | | | | | |
Total from investment operations * | | | 0.51 | | | | (0.75 | ) | | | 1.06 | | | | (0.25 | ) | | | (1.08 | ) |
| | | | | | | | | | | | | | | | | | | | |
Distributions to shareholders: | | | | | | | | | | | | | | | | | | | | |
Dividends from net investment income | | | — | | | | — | | | | — | | | | — | | | | — | |
Distributions from net realized gains | | | — | | | | (0.22 | ) | | | (0.62 | ) | | | (0.40 | ) | | | (1.74 | ) |
| | | | | | | | | | | | | | | | | | | | |
Total distributions | | | — | | | | (0.22 | ) | | | (0.62 | ) | | | (0.40 | ) | | | (1.74 | ) |
| | | | | | | | | | | | | | | | | | | | |
Change in net asset value for the year | | | 0.51 | | | | (0.97 | ) | | | 0.44 | | | | (0.65 | ) | | | (2.82 | ) |
| | | | | | | | | | | | | | | | | | | | |
Net asset value, end of year | | $ | 11.41 | | | $ | 10.90 | | | $ | 11.87 | | | $ | 11.43 | | | $ | 12.08 | |
| | | | | | | | | | | | | | | | | | | | |
* Includes redemption fees per share of | | | N/A | | | | N/A | | | | N/A | | | | N/A | | | | 0.00 | (2) |
Total Return | | | 4.7 | % | | | (6.4 | )% | | | 8.9 | % | | | (1.9 | )% | | | (8.0 | )% |
Ratios/supplemental data | | | | | | | | | | | | | | | | | | | | |
Net assets, end of year (000) | | $ | 31,901 | | | $ | 39,225 | | | $ | 49,453 | | | $ | 63,812 | | | $ | 81,813 | |
Ratio to average net assets: | | | | | | | | | | | | | | | | | | | | |
Expenses before waiver/reimbursement | | | 1.47 | % | | | 1.37 | % | | | 1.37 | % | | | 1.37 | % | | | 1.36 | % |
Expenses after waiver/reimbursement | | | 1.25 | % | | | 1.25 | % | | | 1.25 | %(3) | | | 1.37 | % | | | 1.36 | % |
Net investment income before waiver/reimbursement | | | (0.33 | )% | | | (0.50 | )% | | | (0.47 | )% | | | (0.45 | )% | | | (0.52 | )% |
Net investment income after waiver/reimbursement | | | (0.11 | )% | | | (0.38 | )% | | | (0.35 | )%(3) | | | (0.45 | )% | | | (0.52 | )% |
Portfolio turnover rate | | | 23 | % | | | 27 | % | | | 24 | % | | | 32 | % | | | 43 | % |
| (1) | Net investment loss per share is calculated using the ending balance prior to consideration or adjustment for permanentbook-to-tax differences. |
| (2) | Represents less than $0.01. |
| (3) | Expense waiver of 1.25% was implemented on November 1, 2016. |
The Accompanying Notes are an Integral Part of these Financial Statements.
The Tocqueville Fund
Schedule of Investments as of October 31, 2019
| | | | | | | | |
| Common Stocks—96.2% | | Shares | | | Value | |
Automobiles & Components—1.2% | |
Ford Motor Co. | | | 400,000 | | | $ | 3,436,000 | |
Banks—1.1% | | | | | | | | |
Bank of America Corp. | | | 100,000 | | | | 3,127,000 | |
Capital Goods—10.0% | | | | | | | | |
Arconic, Inc. | | | 175,000 | | | | 4,807,250 | |
Caterpillar, Inc. | | | 25,000 | | | | 3,445,000 | |
Deere & Co. | | | 20,000 | | | | 3,482,800 | |
Illinois Tool Works, Inc. | | | 37,500 | | | | 6,321,750 | |
Parker-Hannifin Corp. | | | 15,000 | | | | 2,752,350 | |
Raytheon Co. | | | 10,000 | | | | 2,122,100 | |
The Boeing Co. | | | 10,000 | | | | 3,399,100 | |
United Technologies Corp. | | | 15,000 | | | | 2,153,700 | |
| | | | | | | | 28,484,050 | |
Commercial & Professional Services—1.2% | |
Steelcase, Inc.—Class A | | | 200,000 | | | | 3,494,000 | |
Consumer Services—2.1% | | | | | | | | |
McDonald’s Corp. | | | 30,000 | | | | 5,901,000 | |
Diversified Financials—2.5% | | | | | | | | |
Capital One Financial Corp. | | | 25,000 | | | | 2,331,250 | |
The Bank of New York Mellon Corp. | | | 100,000 | | | | 4,675,000 | |
| | | | | | | | 7,006,250 | |
Energy—5.3% | | | | | | | | |
Exxon Mobil Corp. | | | 100,000 | | | | 6,757,000 | |
Noble Energy, Inc. | | | 200,000 | | | | 3,852,000 | |
Schlumberger Ltd.(a) | | | 140,000 | | | | 4,576,600 | |
| | | | | | | | 15,185,600 | |
Food & Staples Retailing—3.1% | | | | | |
Walmart, Inc. | | | 75,000 | | | | 8,794,500 | |
Food, Beverage & Tobacco—3.5% | | | | | |
Constellation Brands, Inc.—Class A | | | 10,000 | | | | 1,903,300 | |
The Coca-Cola Co. | | | 150,000 | | | | 8,164,500 | |
| | | | | | | | 10,067,800 | |
Health Care Equipment & Services—1.5% | |
Abbott Laboratories | | | 50,000 | | | | 4,180,500 | |
Household & Personal Products—6.8% | |
Colgate-Palmolive Co. | | | 100,000 | | | | 6,860,000 | |
The Procter & Gamble Co. | | | 100,000 | | | | 12,451,000 | |
| | | | | | | | 19,311,000 | |
Insurance—2.4% | | | | | | | | |
Aflac, Inc. | | | 100,000 | | | $ | 5,316,000 | |
MetLife, Inc. | | | 30,000 | | | | 1,403,700 | |
| | | | | | | | 6,719,700 | |
Materials—7.3% | | | | | | | | |
BHP Group Ltd.—ADR(a) | | | 50,000 | | | | 2,445,500 | |
Dow, Inc. | | | 33,333 | | | | 1,682,983 | |
DuPont de Nemours, Inc. | | | 33,333 | | | | 2,196,978 | |
Nutrien Ltd.(a) | | | 40,000 | | | | 1,911,600 | |
Pan American Silver Corp.(a) | | | 75,000 | | | | 1,278,750 | |
Sonoco Products Co. | | | 75,000 | | | | 4,327,500 | |
Vulcan Materials Co. | | | 40,000 | | | | 5,714,800 | |
Wheaton Precious Metals Corp.(a) | | | 50,000 | | | | 1,403,500 | |
| | | | | | | | 20,961,611 | |
Media & Entertainment—6.7% | |
Alphabet, Inc.—Class A(b) | | | 7,000 | | | | 8,811,600 | |
Facebook, Inc.—Class A(b) | | | 20,000 | | | | 3,833,000 | |
The Walt Disney Co. | | | 50,000 | | | | 6,496,000 | |
| | | | | | | | 19,140,600 | |
Pharmaceuticals, Biotechnology & Life Sciences—8.9% | |
Biogen, Inc.(b) | | | 10,000 | | | | 2,987,100 | |
Ionis Pharmaceuticals, Inc.(b) | | | 40,000 | | | | 2,228,800 | |
Johnson & Johnson | | | 30,000 | | | | 3,961,200 | |
Merck & Co., Inc. | | | 100,000 | | | | 8,666,000 | |
Pfizer, Inc. | | | 200,000 | | | | 7,674,000 | |
| | | | | | | | 25,517,100 | |
Retailing—3.1% | | | | | | | | |
Amazon.com, Inc.(b) | | | 5,000 | | | | 8,883,300 | |
Semiconductors & Semiconductor Equipment—8.3% | |
Applied Materials, Inc. | | | 150,000 | | | | 8,139,000 | |
Intel Corp. | | | 150,000 | | | | 8,479,500 | |
NVIDIA Corp. | | | 15,000 | | | | 3,015,300 | |
QUALCOMM, Inc. | | | 50,000 | | | | 4,022,000 | |
| | | | | | | | 23,655,800 | |
Software & Services—7.9% | | | | | | | | |
Automatic Data Processing, Inc. | | | 50,000 | | | | 8,111,500 | |
Microsoft Corp. | | | 100,000 | | | | 14,337,000 | |
| | | | | | | | 22,448,500 | |
The Accompanying Footnotes are an Integral Part of these Financial Statements.
The Tocqueville Fund
Schedule of Investments as of October 31, 2019
| | | | | | | | |
| Common Stocks—96.2% | | Shares | | | Value | |
Technology Hardware & Equipment—3.5% | |
Apple, Inc. | | | 40,000 | | | $ | 9,950,400 | |
Bio-key International, Inc.(b)(c)(d)
(Originally acquired 09/16/05, Cost $0) | | | 1,963 | | | | — | |
| | | | | | | | 9,950,400 | |
Telecommunication Services—2.1% | |
Verizon Communications, Inc. | | | 100,000 | | | | 6,047,000 | |
Transportation—3.5% | | | | | | | | |
Delta Air Lines, Inc. | | | 100,000 | | | | 5,508,000 | |
FedEx Corp. | | | 15,000 | | | | 2,289,900 | |
Kansas City Southern | | | 15,000 | | | | 2,111,700 | |
| | | | | | | | 9,909,600 | |
Utilities—4.2% | | | | | | | | |
NextEra Energy, Inc. | | | 50,000 | | | | 11,917,000 | |
Total Common Stocks
(Cost $133,114,797) | | | | | | | 274,138,311 | |
Preferred Stock—0.0% | | | | | | | | |
Health Care Equipment & Supplies—0.0% | |
Velico Medical, Inc.(b)(c)(d) (Originally acquired 10/13/16, Cost $0) | | | 400,000 | | | | 1,600 | |
Total Preferred Stock
(Cost $0) | | | | | | | 1,600 | |
Real Estate Investment Trust (REIT)—2.6% | |
Real Estate—2.6% | | | | | | | | |
Weyerhaeuser Co. | | | 250,000 | | | | 7,302,500 | |
Total Real Estate Investment Trust
(Cost $4,725,263) | | | | 7,302,500 | |
Exchange-Traded Fund (ETF)—0.9% | |
Metals and Mining—0.9% | | | | | | | | |
SPDR S&P Metals & Mining ETF | | | 100,000 | | | | 2,631,000 | |
Total Exchange-Traded Fund
(Cost $1,495,845) | | | | 2,631,000 | |
Money Market Fund—0.0% | |
STIT-Treasury
Portfolio—Institutional Class, 1.661%(e) | | | 1,179 | | | $ | 1,179 | |
Total Short-Term Investment
(Cost $1,179) | | | | 1,179 | |
Total Investments
(Cost $139,337,084)—99.7% | | | | 284,074,590 | |
Other Assets in Excess of Liabilities—0.3% | | | | 995,680 | |
Total Net Assets—100.0% | | | | | | $ | 285,070,270 | |
| | | | | | | | |
Percentages are stated as a percent of net assets.
ADR American Depository Receipt
| (a) | Foreign issued Security. Foreign Concentration (including ADR’s) was as follows: Australia 0.9%; Canada 1.6%; Curacao 1.6%. |
| (b) | Non-income producing security. |
| (c) | Denotes a security that is either fully or partially restricted to resale. The aggregate value of restricted securities as of October 31, 2019 was $1,600 which represented 0.0% of net assets. |
| (d) | Security is fair valued using procedures approved by the Board of Trustees which includes significant unobservable inputs and is deemed a Level 3 security. See Footnote 2. The aggregate value of fair value securities as of October 31, 2019 was $1,600 which represented 0.0% of net assets. |
| (e) | Rate listed is the7-day effective yield. |
The Global Industry Classification Standard (GICS®) was developed by and/or is the exclusive property of MSCI, Inc. and Standard & Poor Financial Services LLC (“S&P”). GICS is a service mark of MSCI and S&P and has been licensed for use by U.S. Bank Global Fund Services.
The Accompanying Footnotes are an Integral Part of these Financial Statements.
The Tocqueville Opportunity Fund
Schedule of Investments as of October 31, 2019
| | | | | | | | |
| Common Stocks—99.2% | | Shares | | | Value | |
Automobiles & Components—0.0% | |
Delphi Technologies PLC(a) | | | 1 | | | $ | 12 | |
Capital Goods—11.0% | | | | | | | | |
Allison Transmission Holdings, Inc. | | | 500 | | | | 21,805 | |
AMETEK, Inc. | | | 6,000 | | | | 549,900 | |
AO Smith Corp. | | | 2,000 | | | | 99,360 | |
Armstrong World Industries, Inc. | | | 1,500 | | | | 140,295 | |
Cummins, Inc. | | | 500 | | | | 86,240 | |
Dover Corp. | | | 2,000 | | | | 207,780 | |
Emerson Electric Co. | | | 500 | | | | 35,075 | |
Fastenal Co. | | | 2,500 | | | | 89,850 | |
Fortive Corp. | | | 1,500 | | | | 103,500 | |
Gardner Denver Holdings, Inc.(b) | | | 4,000 | | | | 127,320 | |
Graco, Inc. | | | 5,000 | | | | 226,000 | |
HD Supply Holdings, Inc.(b) | | | 1,000 | | | | 39,540 | |
HEICO Corp. | | | 4,343 | | | | 535,666 | |
Hexcel Corp. | | | 3,000 | | | | 223,860 | |
Honeywell International, Inc. | | | 4,000 | | | | 690,920 | |
Hubbell, Inc. | | | 2,500 | | | | 354,250 | |
Huntington Ingalls Industries, Inc. | | | 1,000 | | | | 225,660 | |
IDEX Corp. | | | 2,500 | | | | 388,825 | |
L3Harris Technologies, Inc. | | | 2,500 | | | | 515,775 | |
Lennox International, Inc. | | | 1,300 | | | | 321,568 | |
Lincoln Electric Holdings, Inc. | | | 2,000 | | | | 179,140 | |
Masco Corp. | | | 5,500 | | | | 254,375 | |
Nordson Corp. | | | 2,000 | | | | 313,620 | |
Parker-Hannifin Corp. | | | 700 | | | | 128,443 | |
PGT Innovations, Inc.(b) | | | 1,000 | | | | 17,660 | |
Rockwell Automation, Inc. | | | 1,700 | | | | 292,383 | |
Sensata Technologies Holding PLC(a)(b) | | | 2,500 | | | | 127,975 | |
SiteOne Landscape Supply, Inc.(b) | | | 2,000 | | | | 176,120 | |
Stanley Black & Decker, Inc. | | | 500 | | | | 75,665 | |
The Middleby Corp.(b) | | | 500 | | | | 60,475 | |
The Toro Co. | | | 3,000 | | | | 231,390 | |
TransDigm Group, Inc. | | | 2,325 | | | | 1,223,601 | |
United Rentals, Inc.(b) | | | 1,700 | | | | 227,069 | |
Wabtec Corp. | | | 500 | | | | 34,685 | |
Watsco, Inc. | | | 1,500 | | | | 264,450 | |
Welbilt, Inc.(b) | | | 6,000 | | | | 113,760 | |
Woodward, Inc. | | | 3,500 | | | $ | 373,310 | |
Xylem, Inc. | | | 3,000 | | | | 230,070 | |
| | | | | | | | 9,307,380 | |
Commercial & Professional Services—5.2% | |
Cintas Corp. | | | 3,000 | | | | 806,010 | |
Copart, Inc.(b) | | | 7,000 | | | | 578,480 | |
CoStar Group, Inc.(b) | | | 1,000 | | | | 549,520 | |
Equifax, Inc. | | | 2,500 | | | | 341,775 | |
IHS Markit Ltd.(a)(b) | | | 8,000 | | | | 560,160 | |
Robert Half International, Inc. | | | 3,000 | | | | 171,810 | |
TransUnion | | | 8,500 | | | | 702,270 | |
Verisk Analytics, Inc. | | | 5,000 | | | | 723,500 | |
| | | | | | | | 4,433,525 | |
Consumer Durables & Apparel—1.9% | |
Leggett & Platt, Inc. | | | 500 | | | | 25,650 | |
Lululemon Athletica, Inc.(b) | | | 6,000 | | | | 1,225,620 | |
Roku, Inc.(b) | | | 2,500 | | | | 368,000 | |
| | | | | | | | 1,619,270 | |
Consumer Services—0.8% | |
Bright Horizons Family Solutions, Inc.(b) | | | 1,000 | | | | 148,520 | |
Domino’s Pizza, Inc. | | | 300 | | | | 81,486 | |
Planet Fitness, Inc.—Class A(b) | | | 4,500 | | | | 286,470 | |
Restaurant Brands International LP | | | 37 | | | | 2,465 | |
Vail Resorts, Inc. | | | 500 | | | | 116,185 | |
| | | | | | | | 635,126 | |
Diversified Financials—2.2% | |
FactSet Research Systems, Inc. | | | 1,000 | | | | 253,520 | |
MarketAxess Holdings, Inc. | | | 1,250 | | | | 460,738 | |
MSCI, Inc. | | | 2,000 | | | | 469,120 | |
S&P Global, Inc. | | | 2,500 | | | | 644,975 | |
SEI Investments Co. | | | 500 | | | | 29,960 | |
| | | | | | | | 1,858,313 | |
Health Care Equipment & Services—8.1% | |
ABIOMED, Inc.(b) | | | 500 | | | | 103,790 | |
Align Technology, Inc.(b) | | | 500 | | | | 126,145 | |
Boston Scientific Corp.(b) | | | 10,000 | | | | 417,000 | |
DexCom, Inc.(b) | | | 7,000 | | | | 1,079,680 | |
Edwards Lifesciences Corp.(b) | | | 2,500 | | | | 595,950 | |
Glaukos Corp.(b) | | | 500 | | | | 31,915 | |
The Accompanying Footnotes are an Integral Part of these Financial Statements.
The Tocqueville Opportunity Fund
Schedule of Investments as of October 31, 2019
| | | | | | | | |
| Common Stocks—99.2% | | Shares | | | Value | |
IDEXX Laboratories, Inc.(b) | | | 3,500 | | | $ | 997,535 | |
Inogen, Inc.(b) | | | 200 | | | | 10,887 | |
Insulet Corp.(b) | | | 6,000 | | | | 871,920 | |
Intuitive Surgical, Inc.(b) | | | 1,750 | | | | 967,662 | |
iRhythm Technologies, Inc.(b) | | | 3,000 | | | | 200,460 | |
STAAR Surgical Co.(b) | | | 1,000 | | | | 32,780 | |
Tandem Diabetes Care, Inc.(b) | | | 9,000 | | | | 554,220 | |
Veeva Systems, Inc.—Class A(b) | | | 5,500 | | | | 780,065 | |
WellCare Health Plans, Inc.(b) | | | 300 | | | | 88,980 | |
| | | | | | | | 6,858,989 | |
Materials—1.6% | |
Eagle Materials, Inc. | | | 1,000 | | | | 91,340 | |
Ingevity Corp.(b) | | | 500 | | | | 42,105 | |
Martin Marietta Materials, Inc. | | | 1,500 | | | | 392,865 | |
Summit Materials, Inc.—Class A(b) | | | 5,000 | | | | 114,650 | |
Vulcan Materials Co. | | | 5,000 | | | | 714,350 | |
Worthington Industries, Inc. | | | 500 | | | | 18,405 | |
| | | | | | | | 1,373,715 | |
Media & Entertainment—0.3% | |
Discovery, Inc.—Class A(b) | | | 500 | | | | 13,478 | |
IAC/InterActiveCorp(b) | | | 500 | | | | 113,625 | |
Live Nation Entertainment, Inc.(b) | | | 500 | | | | 35,250 | |
Match Group, Inc. | | | 1,000 | | | | 72,990 | |
Twitter, Inc.(b) | | | 1,000 | | | | 29,970 | |
| | | | | | | | 265,313 | |
Pharmaceuticals, Biotechnology & Life Sciences—11.1% | |
ACADIA Pharmaceuticals, Inc.(b) | | | 18,500 | | | | 784,585 | |
Acceleron Pharma, Inc.(b) | | | 2,000 | | | | 89,740 | |
Agios Pharmaceuticals, Inc.(b) | | | 3,000 | | | | 90,240 | |
Alnylam Pharmaceuticals, Inc.(b) | | | 2,000 | | | | 173,480 | |
Atara Biotherapeutics, Inc.(b) | | | 3,500 | | | | 38,220 | |
Audentes Therapeutics, Inc.(b) | | | 3,500 | | | | 94,150 | |
Bluebird Bio, Inc.(b) | | | 1,000 | | | | 81,000 | |
Blueprint Medicines Corp.(b) | | | 1,000 | | | | 68,840 | |
Cellectis SA—ADR(a)(b) | | | 2,500 | | | | 29,650 | |
CRISPR Therapeutics AG(a)(b) | | | 500 | | | | 25,185 | |
Editas Medicine, Inc.(b) | | | 500 | | | | 10,420 | |
Esperion Therapeutics, Inc.(b) | | | 5,500 | | | | 218,735 | |
Galapagos NV(a)(b) | | | 5,500 | | | $ | 1,010,908 | |
Genfit(a)(b) | | | 500 | | | | 7,222 | |
Genmab A/S(a)(b) | | | 3,000 | | | | 653,848 | |
Global Blood Therapeutics, Inc.(b) | | | 1,500 | | | | 71,925 | |
Hua Medicine(a)(b) | | | 22,000 | | | | 19,428 | |
Immunomedics, Inc.(b) | | | 35,000 | | | | 560,000 | |
Intellia Therapeutics, Inc.(b) | | | 5,000 | | | | 62,425 | |
Iovance Biotherapeutics, Inc.(b) | | | 60,000 | | | | 1,267,800 | |
Madrigal Pharmaceuticals, Inc.(b) | | | 500 | | | | 46,215 | |
Mirati Therapeutics, Inc.(b) | | | 2,000 | | | | 188,360 | |
NeoGenomics, Inc.(b) | | | 1,000 | | | | 22,930 | |
Neurocrine Biosciences, Inc.(b) | | | 10,000 | | | | 994,900 | |
Pacira BioSciences, Inc.(b) | | | 500 | | | | 20,245 | |
Reata Pharmaceuticals, Inc.—Class A(b) | | | 4,000 | | | | 824,320 | |
REGENXBIO, Inc.(b) | | | 5,000 | | | | 178,450 | |
Sage Therapeutics, Inc.(b) | | | 3,000 | | | | 406,950 | |
Sarepta Therapeutics, Inc.(b) | | | 1,000 | | | | 83,060 | |
Seattle Genetics, Inc.(b) | | | 2,500 | | | | 268,500 | |
The Medicines Co.(b) | | | 9,000 | | | | 472,410 | |
Viking Therapeutics, Inc.(b) | | | 10,000 | | | | 64,700 | |
Voyager Therapeutics, Inc.(b) | | | 15,000 | | | | 230,850 | |
Xencor, Inc.(b) | | | 2,500 | | | | 85,525 | |
Zogenix, Inc.(b) | | | 2,500 | | | | 111,625 | |
| | | | | | | | 9,356,841 | |
Retailing—1.4% | |
Chewy, Inc.—Class A(b) | | | 1,000 | | | | 24,670 | |
Five Below, Inc.(b) | | | 2,500 | | | | 312,775 | |
Pool Corp. | | | 2,000 | | | | 414,800 | |
The Home Depot, Inc. | | | 1,000 | | | | 234,580 | |
Ulta Beauty, Inc.(b) | | | 250 | | | | 58,287 | |
Wayfair, Inc.—Class A(b) | | | 1,500 | | | | 123,345 | |
| | | | | | | | 1,168,457 | |
Semiconductors & Semiconductor Equipment—3.2% | |
Advanced Micro Devices, Inc.(b) | | | 28,500 | | | | 967,005 | |
ams AG(a)(b) | | | 4,000 | | | | 178,814 | |
Marvell Technology Group Ltd.(a) | | | 7,500 | | | | 182,925 | |
NVIDIA Corp. | | | 6,000 | | | | 1,206,120 | |
The Accompanying Footnotes are an Integral Part of these Financial Statements.
The Tocqueville Opportunity Fund
Schedule of Investments as of October 31, 2019
| | | | | | | | |
| Common Stocks—99.2% | | Shares | | | Value | |
Xilinx, Inc. | | | 1,500 | | | $ | 136,110 | |
| | | | | | | | 2,670,974 | |
Software & Services—51.9% | |
Adobe, Inc.(b) | | | 4,500 | | | | 1,250,685 | |
ANSYS, Inc.(b) | | | 1,500 | | | | 330,225 | |
Appian Corp.(b) | | | 2,000 | | | | 89,280 | |
Aspen Technology, Inc.(b) | | | 2,000 | | | | 230,220 | |
Atlassian Corp. PLC—Class A(a)(b) | | | 3,500 | | | | 422,765 | |
Cadence Design Systems, Inc.(b) | | | 5,000 | | | | 326,750 | |
Coupa Software, Inc.(b) | | | 15,500 | | | | 2,131,095 | |
DocuSign, Inc.(b) | | | 2,000 | | | | 132,380 | |
Dropbox, Inc.—Class A(b) | | | 500 | | | | 9,910 | |
EPAM Systems, Inc.(b) | | | 1,000 | | | | 175,960 | |
Euronet Worldwide, Inc.(b) | | | 3,500 | | | | 490,245 | |
Fair Isaac Corp.(b) | | | 1,500 | | | | 456,060 | |
Fidelity National Information Services, Inc. | | | 10,786 | | | | 1,421,163 | |
Fiserv, Inc.(b) | | | 19,575 | | | | 2,077,690 | |
FleetCor Technologies, Inc.(b) | | | 2,500 | | | | 735,550 | |
Fortinet, Inc.(b) | | | 4,500 | | | | 367,020 | |
Gartner, Inc.(b) | | | 1,000 | | | | 154,080 | |
Global Payments, Inc. | | | 14,031 | | | | 2,373,765 | |
GoDaddy, Inc.—Class A(b) | | | 6,000 | | | | 390,180 | |
Guidewire Software, Inc.(b) | | | 2,500 | | | | 281,850 | |
Mastercard, Inc.—Class A | | | 2,000 | | | | 553,620 | |
MongoDB, Inc.(b) | | | 2,500 | | | | 319,425 | |
New Relic, Inc.(b) | | | 15,000 | | | | 960,900 | |
Nutanix, Inc.—Class A(b) | | | 5,000 | | | | 146,100 | |
Okta, Inc.(b) | | | 21,000 | | | | 2,290,470 | |
Palo Alto Networks, Inc.(b) | | | 3,500 | | | | 795,865 | |
Paycom Software, Inc.(b) | | | 10,500 | | | | 2,221,065 | |
Paylocity Holding Corp.(b) | | | 17,500 | | | | 1,795,500 | |
PayPal Holdings, Inc.(b) | | | 18,000 | | | | 1,873,800 | |
Pegasystems, Inc. | | | 500 | | | | 37,605 | |
Proofpoint, Inc.(b) | | | 2,000 | | | | 230,740 | |
PTC, Inc.(b) | | | 500 | | | | 33,455 | |
RealPage, Inc.(b) | | | 500 | | | | 30,275 | |
ServiceNow, Inc.(b) | | | 17,000 | | | | 4,203,420 | |
Shopify, Inc.—Class A(a)(b) | | | 15,500 | | | | 4,860,335 | |
Splunk, Inc.(b) | | | 9,000 | | | | 1,079,640 | |
Square, Inc.—Class A(b) | | | 8,000 | | | | 491,440 | |
SS&C Technologies Holdings, Inc. | | | 2,000 | | | $ | 104,020 | |
Talend SA—ADR(a)(b) | | | 1,000 | | | | 35,560 | |
The Trade Desk, Inc.—Class A(b) | | | 2,000 | | | | 401,600 | |
Twilio, Inc.—Class A(b) | | | 19,000 | | | | 1,834,640 | |
Tyler Technologies, Inc.(b) | | | 1,000 | | | | 268,520 | |
Upland Software, Inc.(b) | | | 3,000 | | | | 112,440 | |
WEX, Inc.(b) | | | 2,500 | | | | 472,950 | |
Wix.com Ltd.(a)(b) | | | 3,500 | | | | 427,245 | |
Workday, Inc.—Class A(b) | | | 19,500 | | | | 3,162,120 | |
Zendesk, Inc.(b) | | | 16,000 | | | | 1,130,400 | |
Zscaler, Inc.(b) | | | 4,000 | | | | 175,920 | |
| | | | | | | | 43,895,943 | |
Technology Hardware & Equipment—0.3% | |
II-VI, Inc.(b) | | | 500 | | | | 16,575 | |
Lumentum Holdings, Inc.(b) | | | 3,500 | | | | 219,310 | |
Viavi Solutions, Inc.(b) | | | 1,000 | | | | 15,960 | |
| | | | | | | | 251,845 | |
Transportation—0.2% | |
Delta Air Lines, Inc. | | | 3,000 | | | | 165,240 | |
Knight-Swift Transportation Holdings, Inc. | | | 500 | | | | 18,230 | |
| | | | | | | | 183,470 | |
Total Common Stocks
(Cost $54,770,407) | | | | | | | 83,879,173 | |
Real Estate Investment Trust (REIT)—0.0% | |
Real Estate—0.0% | |
Equinix, Inc. | | | 1 | | | | 567 | |
Total Real Estate Investment Trust
(Cost $297) | | | | 567 | |
Exchange-Traded Fund (ETF)—0.0% | |
Funds, Trusts, and Other Financial Vehicles—0.0% | |
Direxion Daily S&P Oil & Gas Exp. & Prod. Bull 3X Shares | | | 7,500 | | | | 20,250 | |
Total Exchange-Traded Fund
(Cost $22,850) | | | | | | | 20,250 | |
The Accompanying Footnotes are an Integral Part of these Financial Statements.
The Tocqueville Opportunity Fund
Schedule of Investments as of October 31, 2019
| | | | | | | | | | | | |
Purchased
Options—0.1% | | Contracts | | | Notional
Amount | | | Value | |
Capital Goods—0.0% | |
Caterpillar, Inc. Expiration: November 2019, Exercise Price $145.00(b) | | | 150 | | | $ | 2,175,000 | | | $ | 10,800 | |
Fastenal Co. Expiration: November 2019, Exercise Price $37.50(b) | | | 150 | | | | 562,500 | | | | 2,250 | |
| | | | | | | | | | | | 13,050 | |
Consumer Durables & Apparel—0.0% | |
NIKE, Inc. Expiration: November 2019, Exercise Price $94.00(b) | | | 250 | | | | 2,350,000 | | | | 2,500 | |
Pharmaceuticals, Biotechnology & Life Sciences—0.1% | |
Amarin Corp. PLC Expiration: November 2019, Exercise Price $16.50(b) | | | 250 | | | | 412,500 | | | | 57,125 | |
Total Purchased Options
(Cost $113,481) | | | | | | | | 72,675 | |
Short-Term
Investment—0.0% | | | | | Shares | | | Value | |
Money Market Fund—0.0% | | | | | | | | | | | | |
STIT-Treasury Portfolio—Institutional Class, 1.661%(c) | | | | | | | 741 | | | $ | 741 | |
Total Short-Term Investment
(Cost $741) | | | | | | | | | | | 741 | |
Total Investments
(Cost $54,907,776)—99.3% | | | | | | | | | | | 83,973,406 | |
Other Assets in Excess of Liabilities—0.7% | | | | | | | | | | | 609,132 | |
Total Net Assets—100.0% | | | | | | | | | | $ | 84,582,538 | |
| | | | | | | | | | | | |
Percentages are stated as a percent of net assets.
ADR American Depository Receipt
| (a) | Foreign issued Security. Foreign Concentration (including ADR’s) was as follows: Austria 0.2%; Belgium 1.2%; Bermuda 0.9%; Canada 5.7%; Cayman Islands 0.0%; Denmark 0.8%; France 0.1%; Israel 0.5%; Jersey 0.0%; Switzerland 0.0%; United Kingdom 0.7%. |
| (b) | Non-income producing security. |
| (c) | Rate listed is the7-day effective yield. |
The Accompanying Footnotes are an Integral Part of these Financial Statements.
The Tocqueville Gold Fund
Schedule of Investments as of October 31, 2019
| | | | | | | | |
| Common Stocks—83.6% | | Shares | | | Value | |
Gold Related Securities—74.0% | |
Australia—5.7% | | | | | | | | |
Evolution Mining Ltd. | | | 5,193,374 | | | $ | 14,785,636 | |
Newcrest Mining Ltd. | | | 654,300 | | | | 14,117,624 | |
Northern Star Resources Ltd. | | | 3,187,500 | | | | 21,511,626 | |
West African Resources Ltd.(a) | | | 27,400,000 | | | | 8,688,579 | |
| | | | | | | | 59,103,465 | |
Canada—60.9% | | | | | | | | |
Agnico Eagle Mines Ltd. | | | 46,200 | | | | 2,839,914 | |
Agnico Eagle Mines Ltd.(b) | | | 501,485 | | | | 30,821,662 | |
Alamos Gold, Inc.—Class A | | | 3,545,800 | | | | 19,289,152 | |
Almaden Minerals Ltd.—Class B(a)(c) | | | 5,600,619 | | | | 2,721,431 | |
Argonaut Gold, Inc.(a)(c) | | | 2,837,000 | | | | 4,631,045 | |
ATAC Resources Ltd.(a)(c) | | | 9,784,891 | | | | 1,485,824 | |
B2Gold Corp.(a) | | | 8,448,700 | | | | 29,654,937 | |
Barkerville Gold Mines Ltd.(a) | | | 24,110,000 | | | | 8,328,942 | |
Corvus Gold, Inc.(a)(c) | | | 3,226,901 | | | | 4,743,544 | |
Corvus Gold, Inc.(a)(b)(c) | | | 18,979,330 | | | | 28,099,380 | |
Detour Gold Corp.(a) | | | 4,506,140 | | | | 74,822,930 | |
East Asia Minerals Corp.(a)(c) | | | 13,290,993 | | | | 403,644 | |
Falco Resources Ltd.(a)(c) | | | 16,222,300 | | | | 2,524,920 | |
Franco-Nevada Corp.(a) | | | 539,900 | | | | 52,387,229 | |
Gold Standard Ventures Corp.(a) | | | 7,011,700 | | | | 5,323,589 | |
IAMGOLD Corp.(a) | | | 5,059,000 | | | | 18,920,660 | |
International Tower Hill Mines Ltd.(a)(c) | | | 5,738,836 | | | | 3,176,446 | |
International Tower Hill Mines Ltd.(a)(b)(c) | | | 20,331,298 | | | | 11,268,581 | |
Jaguar Mining, Inc.(a)(c) | | | 64,330,707 | | | | 7,814,830 | |
Jaguar Mining, Inc.(a)(c) | | | 77,179,388 | | | | 9,188,162 | |
Kinross Gold Corp.(a) | | | 3,152,167 | | | | 15,288,010 | |
Kirkland Lake Gold Ltd. | | | 246,800 | | | | 11,587,260 | |
Maverix Metals, Inc.(a) | | | 2,700,000 | | | | 10,352,289 | |
Novagold Resources, Inc.(a) | | | 2,726,300 | | | $ | 19,847,464 | |
NuLegacy Gold Corp.(a)(c) | | | 28,556,090 | | | | 1,517,672 | |
NuLegacy Gold Corp.(a)(c) | | | 9,296,395 | | | | 518,780 | |
OceanaGold Corp. | | | 4,431,459 | | | | 10,564,598 | |
OceanaGold Corp.(b) | | | 2,404,400 | | | | 5,768,661 | |
Osisko Gold Royalties Ltd. | | | 24,340 | | | | 239,506 | |
Osisko Gold Royalties Ltd.(b) | | | 2,014,400 | | | | 19,821,292 | |
Osisko Mining, Inc.(a) | | | 7,704,239 | | | | 16,319,814 | |
Pan American Silver Corp. | | | 2,394,798 | | | | 40,831,306 | |
Premier Gold Mines Ltd.(a)(c) | | | 8,630,160 | | | | 14,808,414 | |
Rockhaven Resources Ltd.(a) | | | 4,631,500 | | | | 465,928 | |
SEMAFO, Inc.(a)(c) | | | 10,563,000 | | | | 34,329,750 | |
Silvercrest Metals, Inc.(a) | | | 455,000 | | | | 2,556,028 | |
Strategic Metals Ltd.(a)(c) | | | 10,113,400 | | | | 3,916,054 | |
Torex Gold Resources, Inc.(a)(c) | | | 2,478,400 | | | | 36,260,549 | |
Trifecta Gold Ltd.(a)(c) | | | 2,325,199 | | | | 66,202 | |
Wesdome Gold Mines Ltd.(a) | | | 2,482,700 | | | | 15,174,045 | |
Wheaton Precious Metals Corp. | | | 1,524,375 | | | | 42,789,206 | |
Yamana Gold, Inc. | | | 3,004,000 | | | | 10,934,560 | |
| | | | | | | | 632,404,210 | |
South Africa—3.3% | | | | | | | | |
AngloGold Ashanti Ltd.—ADR | | | 1,562,800 | | | | 34,506,624 | |
United Kingdom—0.5% | | | | | | | | |
Fresnillo PLC | | | 517,100 | | | | 4,755,774 | |
United States—3.6% | | | | | | | | |
Contango ORE, Inc.(a) | | | 263,200 | | | | 4,099,340 | |
Electrum Ltd.(a)(d)(e) (Originally acquired 12/21/07, Cost $13,065,361) | | | 2,127,287 | | | | 42,546 | |
The Accompanying Footnotes are an Integral Part of these Financial Statements.
The Tocqueville Gold Fund
Schedule of Investments as of October 31, 2019
| | | | | | | | |
| Common Stocks—83.6% | | Shares | | | Value | |
Newmont Goldcorp Corp. | | | 310,500 | | | $ | 12,336,165 | |
Royal Gold, Inc. | | | 181,200 | | | | 20,917,728 | |
| | | | | | | | 37,395,779 | |
Total Gold Related Securities | | | | 768,165,852 | |
Other Precious Metals Related Securities—8.9% | |
Canada—7.5% | | | | | | | | |
Bear Creek Mining Corp.(a)(c) | | | 7,413,200 | | | | 13,958,497 | |
Ivanhoe Mines Ltd.—Class A(a) | | | 7,882,379 | | | | 19,569,797 | |
MAG Silver Corp.(a)(c) | | | 2,985,600 | | | | 29,438,016 | |
MAG Silver Corp.(a)(c) | | | 1,432,665 | | | | 14,140,646 | |
Nickel Creek Platinum Ltd.(a)(c) | | | 14,037,494 | | | | 1,065,788 | |
| | | | | | | | 78,172,744 | |
United States—1.4% | | | | | | | | |
Sunshine Mining & Refining(a)(d)(e) (Originally acquired 03/15/11, Cost $21,353,108) | | | 2,300,212 | | | | 13,801,272 | |
Total Other Precious Metals Related Securities | | | | 91,974,016 | |
Other Securities—0.8% | | | | | | | | |
United States—0.8% | | | | | | | | |
Gold Bullion International LLC(a)(c)(d)(e) (Originally acquired 05/12/10, Cost $5,000,000) | | | 5,000,000 | | | | 6,893,000 | |
I-Pulse, Inc.(a)(d)(e) (Originally acquired 10/09/07, Cost $175,524) | | | 74,532 | | | | 804,946 | |
Total Other Securities | | | | | | | 7,697,946 | |
Total Common Stocks
(Cost $901,210,359) | | | | | | | 867,837,814 | |
Gold Related Security—1.9% | |
Tocqueville Bullion Reserve LP(a)(c)(d) (Originally acquired 11/28/11, Cost $25,000,000) | | | 13,806 | | | $ | 19,874,345 | |
Total Private Fund
(Cost $25,000,000) | | | | | | | 19,874,345 | |
| Gold Bullion—14.3% | | Ounces | | | | |
United States—14.3% | | | | | | | | |
Gold Bullion(a) | | | 97,806 | | | | 147,975,170 | |
Total Gold Bullion
(Cost $44,461,165) | | | | | | | 147,975,170 | |
| Warrants—0.1% | | Shares | | | | |
Gold Related Securities—0.1% | |
Canada—0.1% | | | | | | | | |
East Asia Minerals Corp. Expiration: 03/10/2020, Exercise Price: CAD $0.15(a)(c)(d)(e) (Originally acquired 03/04/15, Cost $0) | | | 4,617,560 | | | | 83,089 | |
East Asia Minerals Corp. Expiration: 03/08/2022, Exercise Price: CAD $0.50(a)(c)(d)(e) (Originally acquired 03/03/17, Cost $0) | | | 3,321,250 | | | | 113,474 | |
East Asia Minerals Corp. Expiration: 12/05/2019, Exercise Price: CAD $0.50(a)(c)(d)(e) (Originally acquired 12/05/14, Cost $0) | | | 976,493 | | | | — | |
Maverix Metals, Inc. Expiration: 12/23/2021, Exercise Price: CAD $2.41(a)(d)(e) (Originally acquired 05/09/19, Cost $0) | | | 437,500 | | | | 853,907 | |
The Accompanying Footnotes are an Integral Part of these Financial Statements.
The Tocqueville Gold Fund
Schedule of Investments as of October 31, 2019
| | | | | | | | |
| Warrants—0.1% | | Shares | | | Value | |
NuLegacy Gold Corp. Expiration: 10/8/2022, Exercise Price: CAD $0.12(a)(c)(d)(e) (Originally acquired 10/07/19, Cost $0) | | | 4,648,198 | | | $ | 159,516 | |
Osisko Gold Royalties Ltd. Expiration: 02/18/2022, Exercise Price: CAD $36.50(a) | | | 274,000 | | | | 93,615 | |
Total Gold Related Securities | | | | 1,303,601 | |
Other Precious Metals Related Securities—0.0% | |
Canada—0.0% | | | | | | | | |
Nickel Creek Platinum Ltd. Expiration: 08/08/2022, Exercise Price: CAD $0.35(a)(c)(d)(e) (Originally acquired 08/04/17, Cost $0) | | | 6,189,601 | | | | 106,677 | |
Nickel Creek Platinum Ltd. Expiration: 07/01/2024, Exercise Price: CAD $0.08(a)(c)(d)(e) (Originally acquired 07/01/19, Cost $0) | | | 1,658,293 | | | | 105,004 | |
Total Other Precious Metals Related Securities | | | | | | | 211,681 | |
Total Warrants
(Cost $1) | | | | | | | 1,515,282 | |
Money Market Fund—0.0% | |
STIT-Treasury Portfolio—Institutional Class, 1.661%(f) | | | 645 | | | $ | 645 | |
Total Short-Term Investment
(Cost $645) | | | | 645 | |
Total Investments
(Cost $970,672,170)—99.9% | | | | 1,037,203,256 | |
Other Assets in Excess of Liabilities—0.1% | | | | 539,851 | |
Total Net Assets—100.0% | | | $ | 1,037,743,107 | |
| | | | | | | | |
Percentages are stated as a percent of net assets.
ADR American Depository Receipt
| (a) | Non-income producing security. |
| (b) | Denotes an issue that is traded on a foreign exchange when a company is listed more than once. |
| (c) | Affiliated company. See Footnote 8. |
| (d) | Denotes a security that is either fully or partially restricted to resale. The value of restricted securities as of October 31, 2019 was $42,837,776, which represented 4.1% of net assets. |
| (e) | Security is fair valued using procedures approved by the Board of Trustees which includes significant unobservable inputs and is deemed a Level 2 or 3 security. See Footnote 2. The aggregate value of fair valued securities as of October 31, 2019 was $22,963,431, which represented 2.2% of net assets. |
| (f) | Rate listed is the7-day effective yield. |
The Accompanying Footnotes are an Integral Part of these Financial Statements.
The Tocqueville Phoenix Fund
Schedule of Investments as of October 31, 2019
| | | | | | | | |
| Common Stocks—89.5% | | Shares | | | Value | |
Auto Components—4.2% | | | | | | | | |
Garrett Motion, Inc.(a) | | | 150,000 | | | $ | 1,425,000 | |
Visteon Corp.(a) | | | 57,000 | | | | 5,302,140 | |
| | | | | | | | 6,727,140 | |
Building Products—3.3% | | | | | | | | |
Apogee Enterprises, Inc. | | | 140,000 | | | | 5,255,600 | |
Chemicals—14.2% | | | | | | | | |
Eastman Chemical Co. | | | 80,000 | | | | 6,083,200 | |
GCP Applied Technologies, Inc.(a) | | | 70,000 | | | | 1,446,200 | |
HB Fuller Co. | | | 100,000 | | | | 4,880,000 | |
Orion Engineered Carbons SA(b) | | | 171,000 | | | | 2,831,760 | |
PolyOne Corp. | | | 100,000 | | | | 3,205,000 | |
WR Grace & Co. | | | 65,000 | | | | 4,319,250 | |
| | | | | | | | 22,765,410 | |
Commercial Services & Supplies—1.1% | |
Team, Inc.(a) | | | 100,000 | | | | 1,816,000 | |
Communications Equipment—3.6% | |
Lumentum Holdings, Inc.(a) | | | 91,000 | | | | 5,702,060 | |
Construction Materials—2.4% | |
U.S. Concrete, Inc.(a) | | | 72,500 | | | | 3,788,850 | |
Distributors—0.5% | | | | | | | | |
LKQ Corp.(a) | | | 25,000 | | | | 849,750 | |
Diversified Telecommunication Services—0.7% | |
CenturyLink, Inc. | | | 90,000 | | | | 1,164,600 | |
Electrical Equipment—3.7% | | | | | | | | |
Acuity Brands, Inc. | | | 48,000 | | | | 5,989,920 | |
Electronic Equipment, Instruments & Components—15.3% | |
Fabrinet(a)(b) | | | 104,000 | | | | 5,847,920 | |
Flex Ltd.(a)(b) | | | 400,000 | | | | 4,700,000 | |
Plexus Corp.(a) | | | 90,000 | | | | 6,654,600 | |
TTM Technologies, Inc.(a) | | | 625,000 | | | | 7,318,750 | |
| | | | | | | | 24,521,270 | |
Energy Equipment & Services—1.6% | |
McDermott International, Inc.(a)(b) | | | 287,500 | | | | 468,625 | |
Solaris Oilfield Infrastructure, Inc.—Class A | | | 190,000 | | | | 2,021,600 | |
| | | | | | | | 2,490,225 | |
Food Products—0.6% | | | | | | | | |
Landec Corp.(a) | | | 93,200 | | | $ | 918,020 | |
Health Care Equipment & Supplies—0.5% | |
IntriCon Corp.(a) | | | 40,000 | | | | 827,200 | |
Health Care Providers & Services—1.4% | |
Cross Country Healthcare, Inc.(a) | | | 200,000 | | | | 2,162,000 | |
Household Durables—4.2% | | | | | | | | |
Mohawk Industries, Inc.(a) | | | 23,800 | | | | 3,412,444 | |
Newell Brands, Inc. | | | 175,000 | | | | 3,319,750 | |
| | | | | | | | 6,732,194 | |
Insurance—0.9% | | | | | | | | |
Loews Corp. | | | 30,000 | | | | 1,470,000 | |
IT Services—1.5% | | | | | | | | |
DXC Technology Co. | | | 85,000 | | | | 2,351,950 | |
Machinery—11.4% | | | | | | | | |
Crane Co. | | | 72,500 | | | | 5,547,700 | |
Harsco Corp.(a) | | | 365,000 | | | | 7,398,550 | |
REV Group, Inc. | | | 245,000 | | | | 3,047,800 | |
Stanley Black & Decker, Inc. | | | 15,300 | | | | 2,315,349 | |
| | | | | | | | 18,309,399 | |
Media—2.8% | | | | | | | | |
TEGNA, Inc. | | | 300,000 | | | | 4,509,000 | |
Metals & Mining—1.8% | | | | | | | | |
Commercial Metals Co. | | | 150,000 | | | | 2,899,500 | |
Paper & Forest Products—1.5% | |
Louisiana-Pacific Corp. | | | 82,000 | | | | 2,396,860 | |
Professional Services—1.1% | |
TrueBlue, Inc.(a) | | | 80,000 | | | | 1,832,000 | |
Specialty Retail—0.2% | | | | | | | | |
Tile Shop Holdings, Inc. | | | 200,000 | | | | 336,000 | |
Technology Hardware, Storage & Peripherals—1.0% | |
Hewlett Packard Enterprise Co. | | | 100,000 | | | | 1,641,000 | |
Textiles, Apparel & Luxury Goods—3.5% | |
PVH Corp. | | | 65,100 | | | | 5,674,116 | |
Trading Companies & Distributors—6.5% | |
Rush Enterprises, Inc.—Class A | | | 124,400 | | | | 5,435,036 | |
The Accompanying Footnotes are an Integral Part of these Financial Statements.
The Tocqueville Phoenix Fund
Schedule of Investments as of October 31, 2019
| | | | | | | | |
| Common Stocks—89.5% | | Shares | | | Value | |
WESCO International, Inc.(a) | | | 100,000 | | | $ | 5,015,000 | |
| | | | | | | | 10,450,036 | |
Total Common Stocks (Cost $121,565,080) | | | | | | | 143,580,100 | |
Short-Term Investment—5.0% | | | | | |
Money Market Fund—5.0% | | | | | |
STIT-Treasury Portfolio—Institutional Class, 1.661%(c) | | | 8,100,000 | | | | 8,100,000 | |
Total Short-Term Investment (Cost $8,100,000) | | | | 8,100,000 | |
Total Investments
(Cost $129,665,080)—94.5% | | | | 151,680,100 | |
Other Assets in Excess of Liabilities—5.5% | | | | 8,752,587 | |
Total Net Assets—100.0% | | | $ | 160,432,687 | |
| | | | | | | | |
Percentages are stated as a percent of net assets.
| (a) | Non-income producing security. |
| (b) | Foreign issued security. Foreign concentration was as follows: Cayman Islands 3.6%; Luxembourg 1.8%; Panama 0.3%; Singapore 2.9%. |
| (c) | Rate listed is the7-day effective yield. |
The Accompanying Footnotes are an Integral Part of these Financial Statements.
The Tocqueville Select Fund
Schedule of Investments as of October 31, 2019
| | | | | | | | |
| Common Stocks—83.9% | | Shares | | | Value | |
Chemicals—14.6% | | | | | | | | |
Eastman Chemical Co. | | | 20,400 | | | $ | 1,551,216 | |
Orion Engineered Carbons SA(a) | | | 95,000 | | | | 1,573,200 | |
WR Grace & Co. | | | 23,000 | | | | 1,528,350 | |
| | | | | | | | 4,652,766 | |
Electrical Equipment—4.0% | |
Acuity Brands, Inc. | | | 10,150 | | | | 1,266,619 | |
Electronic Equipment, Instruments & Components—15.4% | |
Fabrinet(b)(a) | | | 28,100 | | | | 1,580,063 | |
Flex Ltd.(b)(a) | | | 153,300 | | | | 1,801,275 | |
TTM Technologies, Inc.(b) | | | 131,100 | | | | 1,535,181 | |
| | | | | | | | 4,916,519 | |
Energy Equipment & Services—3.6% | |
Solaris Oilfield Infrastructure, Inc.—Class A | | | 107,000 | | | | 1,138,480 | |
Health Care Providers & Services—5.2% | |
Cross Country Healthcare, Inc.(b) | | | 152,000 | | | | 1,643,120 | |
Household Durables—9.3% | |
Mohawk Industries, Inc.(b) | | | 11,000 | | | | 1,577,180 | |
Newell Brands, Inc. | | | 73,100 | | | | 1,386,707 | |
| | | | | | | | 2,963,887 | |
Interactive Media & Services—1.4% | |
Cars.com, Inc.(b) | | | 40,733 | | | | 460,690 | |
IT Services—2.8% | | | | | | | | |
DXC Technology Co. | | | 32,000 | | | | 885,440 | |
Machinery—11.9% | | | | | | | | |
Harsco Corp.(b) | | | 84,200 | | | | 1,706,734 | |
Stanley Black & Decker, Inc. | | | 13,900 | | | | 2,103,487 | |
| | | | | | | | 3,810,221 | |
Media—6.4% | | | | | | | | |
TEGNA, Inc. | | | 136,000 | | | | 2,044,080 | |
Textiles, Apparel & Luxury Goods—4.6% | |
PVH Corp. | | | 17,000 | | | | 1,481,720 | |
Trading Companies & Distributors—4.7% | |
WESCO International, Inc.(b) | | | 29,800 | | | $ | 1,494,470 | |
Total Common Stocks
(Cost $24,721,634) | | | | | | | 26,758,012 | |
Short-Term Investment—5.0% | |
Money Market Fund—5.0% | |
STIT-Treasury Portfolio—Institutional Class, 1.661%(c) | | | 1,600,000 | | | | 1,600,000 | |
Total Short-Term Investment
(Cost $1,600,000) | | | | 1,600,000 | |
Total Investments
(Cost $26,321,634)—88.9% | | | | 28,358,012 | |
Other Assets in Excess of Liabilities—11.1% | | | | 3,543,124 | |
Total Net Assets—100.0% | | | | | | $ | 31,901,136 | |
| | | | | | | | |
Percentages are stated as a percent of net assets.
| (a) | Foreign issued security. Foreign concentration was as follows: Cayman Islands 5.0%; Luxembourg 4.9%; Singapore 5.6%. |
| (b) | Non-income producing security. |
| (c) | Rate listed is the7-day effective yield. |
The Accompanying Footnotes are an Integral Part of these Financial Statements.
Percent of Total Investments
The Tocqueville Fund
Allocation of Portfolio Holdings
October 31, 2019
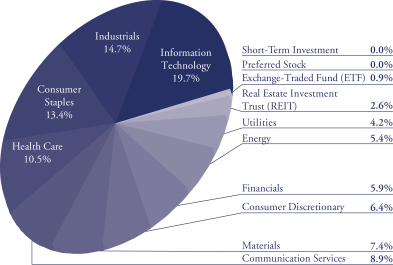
The Tocqueville Opportunity Fund
Allocation of Portfolio Holdings
October 31, 2019
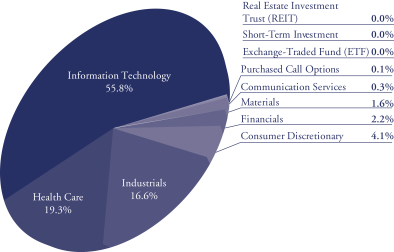
Percent of Total Investments
The Tocqueville Gold Fund
Allocation of Portfolio Holdings
October 31, 2019
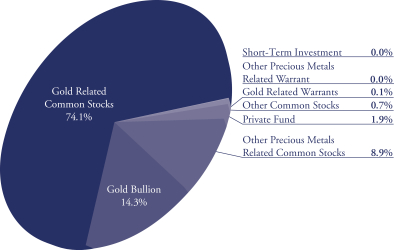
The Tocqueville Phoenix Fund
Allocation of Portfolio Holdings
October 31, 2019
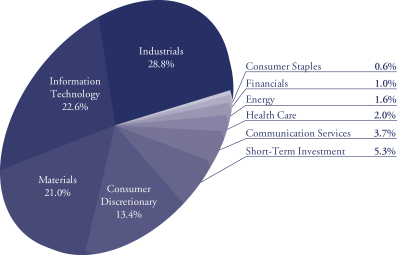
Percent of Total Investments
The Tocqueville Select Fund
Allocation of Portfolio Holdings
October 31, 2019
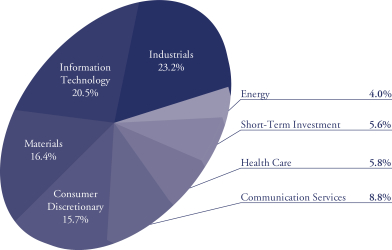
The Tocqueville Trust
Statements of Assets & Liabilities
October 31, 2019
| | | | | | | | | | | | | | | | | | | | |
| | | The
Tocqueville
Fund | | | The
Tocqueville
Opportunity
Fund | | | The
Tocqueville
Gold Fund | | | The
Tocqueville
Phoenix
Fund | | | The
Tocqueville
Select Fund | |
Assets: | | | | | | | | | | | | | | | | | | | | |
Investments, at value (1) | | | | | | | | | | | | | | | | | | | | |
Unaffiliated issuers | | $ | 284,074,590 | | | $ | 83,973,406 | | | $ | 783,789,976 | | | $ | 151,680,100 | | | $ | 28,358,012 | |
Affiliated issuers | | | — | | | | — | | | | 253,413,280 | | | | — | | | | — | |
Foreign currencies, at value (2) | | | — | | | | — | | | | 289,526 | | | | — | | | | — | |
Cash and Cash Equivalents | | | — | | | | — | | | | — | | | | 9,158,050 | | | | 3,574,051 | |
Receivable for investments sold | | | 463,036 | | | | 812,378 | | | | 2,034,646 | | | | — | | | | — | |
Receivable for Fund shares sold | | | 708,197 | | | | 225,856 | | | | 905,274 | | | | 4,285 | | | | 1,815 | |
Dividends, interest and other receivables | | | 378,657 | | | | 4,609 | | | | 166,228 | | | | 56,759 | | | | 3,262 | |
Other assets | | | 15,191 | | | | 12,856 | | | | 31,475 | | | | 10,299 | | | | 13,128 | |
Deferred offering costs—Institutional Class Only | | | — | | | | — | | | | 11,332 | | | | — | | | | — | |
| | | | | | | | | | | | | | | | | | | | |
Total Assets | | | 285,639,671 | | | | 85,029,105 | | | | 1,040,641,737 | | | | 160,909,493 | | | | 31,950,268 | |
| | | | | | | | | | | | | | | | | | | | |
Liabilities: | | | | | | | | | | | | | | | | | | | | |
Payable for loans outstanding | | | 163,000 | | | | 283,000 | | | | 401,000 | | | | — | | | | — | |
Payable for Fund shares redeemed | | | 64,364 | | | | 58,008 | | | | 1,146,958 | | | | 251,065 | | | | 12,141 | |
Payable to Adviser (see Note 10) | | | 162,160 | | | | 41,965 | | | | 759,773 | | | | 109,528 | | | | 11,903 | |
Payable to Administrator | | | 41,164 | | | | 12,293 | | | | 128,060 | | | | 19,959 | | | | 905 | |
Payable to Trustees | | | 17,266 | | | | 5,900 | | | | 61,005 | | | | 9,615 | | | | 2,602 | |
Accrued distribution fee—Investor Class Only | | | 44,950 | | | | 10,459 | | | | 23,723 | | | | 14,158 | | | | 4,130 | |
Accrued expenses and other liabilities | | | 76,497 | | | | 34,942 | | | | 378,111 | | | | 72,481 | | | | 17,451 | |
| | | | | | | | | | | | | | | | | | | | |
Total Liabilities | | | 569,401 | | | | 446,567 | | | | 2,898,630 | | | | 476,806 | | | | 49,132 | |
| | | | | | | | | | | | | | | | | | | | |
Net Assets | | $ | 285,070,270 | | | $ | 84,582,538 | | | $ | 1,037,743,107 | | | $ | 160,432,687 | | | $ | 31,901,136 | |
| | | | | | | | | | | | | | | | | | | | |
The Accompanying Notes are an Integral Part of these Financial Statements.
The Tocqueville Trust
Statements of Assets & Liabilities
October 31, 2019
| | | | | | | | | | | | | | | | | | | | |
| | | The
Tocqueville
Fund | | | The
Tocqueville
Opportunity
Fund | | | The
Tocqueville
Gold Fund | | | The
Tocqueville
Phoenix
Fund | | | The
Tocqueville
Select Fund | |
Net assets consist of: | | | | | | | | | | | | | | | | | | | | |
Paid in capital | | $ | 120,709,942 | | | $ | 52,123,412 | | | $ | 1,405,981,930 | | | $ | 135,091,227 | | | $ | 27,443,829 | |
Total distributable earnings | | | 164,360,328 | | | | 32,459,126 | | | | (368,238,823 | ) | | | 25,341,460 | | | | 4,457,307 | |
| | | | | | | | | | | | | | | | | | | | |
Net assets | | $ | 285,070,270 | | | $ | 84,582,538 | | | $ | 1,037,743,107 | | | $ | 160,432,687 | | | $ | 31,901,136 | |
| | | | | | | | | | | | | | | | | | | | |
Investor Class | | | | | | | | | | | | | | | | | | | | |
Net assets | | $ | 285,070,270 | | | $ | 84,582,538 | | | $ | 998,013,798 | | | $ | 160,432,687 | | | $ | 31,901,136 | |
Shares of beneficial interest outstanding (unlimited shares of $0.01 par value authorized) | | | 7,542,498 | | | | 3,009,490 | | | | 25,758,564 | | | | 8,027,801 | | | | 2,795,438 | |
Net asset value, offering and redemption price per share | | $ | 37.80 | | | $ | 28.11 | | | $ | 38.74 | | | $ | 19.98 | | | $ | 11.41 | |
| | | | | | | | | | | | | | | | | | | | |
Institutional Class | | | | | | | | | | | | | | | | | | | | |
Net assets | | $ | — | | | $ | — | | | $ | 39,729,309 | | | $ | — | | | $ | — | |
Shares of beneficial interest outstanding (unlimited shares of $0.01 par value authorized) | | | — | | | | — | | | | 1,023,595 | | | | — | | | | — | |
Net asset value, offering and redemption price per share | | $ | — | | | $ | — | | | $ | 38.81 | | | $ | — | | | $ | — | |
| | | | | | | | | | | | | | | | | | | | |
(1) Cost of investments | | | | | | | | | | | | | | | | | | | | |
Unaffiliated issuers | | $ | 139,337,084 | | | $ | 54,907,776 | | | $ | 570,437,782 | | | $ | 129,665,080 | | | $ | 26,321,634 | |
Affiliated issuers | | $ | — | | | $ | — | | | $ | 400,234,388 | | | $ | — | | | $ | — | |
(2) Cost of foreign currencies | | $ | — | | | $ | — | | | $ | 291,128 | | | $ | — | | | $ | — | |
The Accompanying Notes are an Integral Part of these Financial Statements.
The Tocqueville Trust
Statements of Operations
For the Year Ended October 31, 2019
| | | | | | | | | | | | | | | | | | | | |
| | | The
Tocqueville
Fund | | | The
Tocqueville
Opportunity
Fund | | | The
Tocqueville
Gold Fund | | | The
Tocqueville
Phoenix
Fund | | | The
Tocqueville
Select Fund | |
Investment Income: | | | | | | | | | | | | | | | | | | | | |
Dividends* | | $ | 6,519,936 | | | $ | 269,766 | | | $ | 4,741,949 | | | $ | 1,994,957 | | | $ | 391,011 | |
Interest | | | 51,453 | | | | 1,460 | | | | 198,880 | | | | 241,163 | | | | 35,724 | |
| | | | | | | | | | | | | | | | | | | | |
Total investment income | | | 6,571,389 | | | | 271,226 | | | | 4,940,829 | | | | 2,236,120 | | | | 426,735 | |
| | | | | | | | | | | | | | | | | | | | |
Expenses: | | | | | | | | | | | | | | | | | | | | |
Investment Adviser’s fee (See Note 4) | | | 2,040,260 | | | | 661,300 | | | | 8,204,690 | | | | 1,555,225 | | | | 298,499 | |
Distribution(12b-1) fees—Investor Class Only (See Note 4) | | | 680,086 | | | | 220,433 | | | | 2,297,997 | | | | 486,008 | | | | 93,281 | |
Administration fees (See Note 4) | | | 408,052 | | | | 132,260 | | | | 1,286,920 | | | | 291,605 | | | | 55,969 | |
Legal fees | | | 71,463 | | | | 22,854 | | | | 266,984 | | | | 51,614 | | | | 9,565 | |
Transfer agent and shareholder services fees—Investor Class | | | 69,721 | | | | 31,770 | | | | 621,187 | | | | 95,216 | | | | 14,822 | |
Transfer agent and shareholder services fees—Institutional Class | | | — | | | | — | | | | 4,931 | | | | — | | | | — | |
Trustee fees and expenses | | | 64,607 | | | | 20,747 | | | | 222,436 | | | | 43,914 | | | | 9,429 | |
Other expenses (See Note 10) | | | 48,982 | | | | 42,088 | | | | 120,997 | | | | 35,491 | | | | 16,816 | |
Audit fees | | | 36,597 | | | | 14,600 | | | | 118,559 | | | | 21,504 | | | | 9,721 | |
Fund accounting fees | | | 32,566 | | | | 20,767 | | | | 116,218 | | | | 24,276 | | | | 5,186 | |
Blue sky fees | | | 27,055 | | | | 24,277 | | | | 46,423 | | | | 26,702 | | | | 25,085 | |
Printing and mailing expense | | | 20,208 | | | | 8,069 | | | | 105,141 | | | | 35,997 | | | | 3,302 | |
Custody fees | | | 13,964 | | | | 15,904 | | | | 212,496 | | | | 24,834 | | | | 2,046 | |
Insurance expense | | | 6,925 | | | | 1,939 | | | | 22,835 | | | | 6,070 | | | | 995 | |
Interest expense | | | 2,997 | | | | 25,368 | | | | 29,992 | | | | — | | | | 669 | |
Registration fees | | | 1,962 | | | | 1,525 | | | | 3,710 | | | | 1,342 | | | | 1,754 | |
Deferred offering costs—Institutional Class Only (see Note 11) | | | — | | | | — | | | | 7,945 | | | | — | | | | — | |
| | | | | | | | | | | | | | | | | | | | |
Total expenses before waiver | | | 3,525,445 | | | | 1,243,901 | | | | 13,689,461 | | | | 2,699,798 | | | | 547,139 | |
Less: Fees waived (See Note 4) | | | (122,015 | ) | | | (116,366 | ) | | | — | | | | (272,121 | ) | | | (80,065 | ) |
| | | | | | | | | | | | | | | | | | | | |
Net expenses | | | 3,403,430 | | | | 1,127,535 | | | | 13,689,461 | | | | 2,427,677 | | | | 467,074 | |
| | | | | | | | | | | | | | | | | | | | |
Net Investment Income (Loss) | | $ | 3,167,959 | | | $ | (856,309 | ) | | $ | (8,748,632 | ) | | $ | (191,557 | ) | | $ | (40,339 | ) |
| | | | | | | | | | | | | | | | | | | | |
The Accompanying Notes are an Integral Part of these Financial Statements.
The Tocqueville Trust
Statements of Operations
For the Year Ended October 31, 2019
| | | | | | | | | | | | | | | | | | | | |
| | | The
Tocqueville
Fund | | | The
Tocqueville
Opportunity
Fund | | | The
Tocqueville
Gold Fund | | | The
Tocqueville
Phoenix
Fund | | | The
Tocqueville
Select Fund | |
Realized and Unrealized Gain (Loss): | | | | | | | | | | | | | | | | | | | | |
Net realized gain (loss) on: | | | | | | | | | | | | | | | | | | | | |
Investments | | | | | | | | | | | | | | | | | | | | |
Unaffiliated issuers | | $ | 18,309,841 | | | $ | 5,697,686 | | | $ | (35,839,509 | ) | | $ | 4,700,224 | | | $ | 6,725,536 | |
Affililiated issuers | | | — | | | | — | | | | (366,348 | ) | | | — | | | | — | |
Foreign currency translation | | | — | | | | (5,593 | ) | | | (195,286 | ) | | | (20,348 | ) | | | — | |
Written Option | | | — | | | | 4,761 | | | | — | | | | — | | | | — | |
| | | | | | | | | | | | | | | | | | | | |
| | | 18,309,841 | | | | 5,696,854 | | | | (36,401,143 | ) | | | 4,679,876 | | | | 6,725,536 | |
Net change in unrealized appreciation (depreciation) on: | | | | | | | | | | | | | | | | | | | | |
Investments | | | 16,292,414 | | | | 8,712,851 | | | | 291,023,433 | | | | 5,576,539 | | | | (5,260,683 | ) |
Foreign currency translation | | | — | | | | 6,141 | | | | 16,460,181 | | | | — | | | | — | |
| | | | | | | | | | | | | | | | | | | | |
| | | 16,292,414 | | | | 8,718,992 | | | | 307,483,614 | | | | 5,576,539 | | | | (5,260,683 | ) |
Net gain on investments and foreign currency | | | 34,602,255 | | | | 14,415,846 | | | | 271,082,471 | | | | 10,256,415 | | | | 1,464,853 | |
| | | | | | | | | | | | | | | | | | | | |
Net Increase in Net Assets Resulting from Operations | | $ | 37,770,214 | | | $ | 13,559,537 | | | $ | 262,333,839 | | | $ | 10,064,858 | | | $ | 1,424,514 | |
| | | | | | | | | | | | | | | | | | | | |
* Net of foreign taxes withheld of: | | $ | 11,809 | | | $ | 58 | | | $ | 368,064 | | | $ | 6,630 | | | $ | 2,850 | |
| | | | | | | | | | | | | | | | | | | | |
The Accompanying Notes are an Integral Part of these Financial Statements.
The Tocqueville Trust
Statements of Changes in Net Assets
| | | | | | | | | | | | | | | | |
| | | The Tocqueville Fund | | | The Tocqueville
Opportunity Fund | |
| | | For the
Year Ended
October 31,
2019 | | | For the
Year Ended
October 31,
2018 | | | For the
Year Ended
October 31,
2019 | | | For the
Year Ended
October 31,
2018 | |
Operations: | | | | | | | | | | | | | | | | |
Net investment income (loss) | | $ | 3,167,959 | | | $ | 2,674,174 | | | $ | (856,309 | ) | | $ | (928,400 | ) |
Net realized gain on sale of investments and foreign currency | | | 18,309,841 | | | | 21,495,197 | | | �� | 5,696,854 | | | | 9,080,674 | |
Net change in unrealized appreciation (depreciation) | | | 16,292,414 | | | | (17,842,653 | ) | | | 8,718,992 | | | | (4,554,160 | ) |
| | | | | | | | | | | | | | | | |
Net increase in net assets resulting from operations | | | 37,770,214 | | | | 6,326,718 | | | | 13,559,537 | | | | 3,598,114 | |
| | | | | | | | | | | | | | | | |
Net dividends and distributions to shareholders | | | (21,894,505 | ) | | | (26,828,335 | ) | | | (7,593,052 | ) | | | (2,589,302 | ) |
| | | | | | | | | | | | | | | | |
Total dividends and distributions | | | (21,894,505 | ) | | | (26,828,335 | ) | | | (7,593,052 | ) | | | (2,589,302 | ) |
| | | | | | | | | | | | | | | | |
Fund share transactions: | | | | | | | | | | | | | | | | |
Shares sold | | | 11,822,494 | | | | 14,681,016 | | | | 14,445,329 | | | | 16,112,469 | |
Shares issued to holders in reinvestment of dividends—Investor Class | | | 20,884,877 | | | | 25,480,630 | | | | 7,252,927 | | | | 2,468,524 | |
Shares redeemed | | | (35,556,284 | ) | | | (41,253,735 | ) | | | (25,187,960 | ) | | | (15,257,530 | ) |
| | | | | | | | | | | | | | | | |
Net increase (decrease) | | | (2,848,913 | ) | | | (1,092,089 | ) | | | (3,489,704 | ) | | | 3,323,463 | |
| | | | | | | | | | | | | | | | |
Net increase (decrease) in net assets | | | 13,026,796 | | | | (21,593,706 | ) | | | 2,476,781 | | | | 4,332,275 | |
Net Assets: | | | | | | | | | | | | | | | | |
Beginning of period | | | 272,043,474 | | | | 293,637,180 | | | | 82,105,757 | | | | 77,773,482 | |
| | | | | | | | | | | | | | | | |
End of period | | $ | 285,070,270 | | | $ | 272,043,474 | | | $ | 84,582,538 | | | $ | 82,105,757 | |
| | | | | | | | | | | | | | | | |
The Accompanying Notes are an Integral Part of these Financial Statements.
The Tocqueville Trust
Statements of Changes in Net Assets
| | | | | | | | | | | | | | | | | | | | | | | | |
| | | The Tocqueville
Gold Fund | | | The Tocqueville
Phoenix Fund | | | The Tocqueville
Select Fund | |
| | | For the
Year Ended
October 31,
2019 | | | For the
Year Ended
October 31,
2018 | | | For the
Year Ended
October 31,
2019 | | | For the
Year Ended
October 31,
2018 | | | For the
Year Ended
October 31,
2019 | | | For the
Year Ended
October 31,
2018 | |
Operations: | | | | | | | | | | | | | | | | | | | | | | | | |
Net investment loss | | $ | (8,748,632 | ) | | $ | (8,974,770 | ) | | $ | (191,557 | ) | | $ | (1,507,510 | ) | | $ | (40,339 | ) | | $ | (173,063 | ) |
Net realized gain (loss) on sale of investments and foreign currency | | | (36,401,143 | ) | | | 5,535,322 | | | | 4,679,876 | | | | 21,617,558 | | | | 6,725,536 | | | | (4,128,184 | ) |
Net change in unrealized appreciation (depreciation) | | | 307,483,614 | | | | (191,416,194 | ) | | | 5,576,539 | | | | (48,172,817 | ) | | | (5,260,683 | ) | | | 1,590,296 | |
| | | | | | | | | | | | | | | | | | | | | | | | |
Net increase (decrease) in net assets resulting from operations | | | 262,333,839 | | | | (194,855,642 | ) | | | 10,064,858 | | | | (28,062,769 | ) | | | 1,424,514 | | | | (2,710,951 | ) |
| | | | | | | | | | | | | | | | | | | | | | | | |
Net dividends and distributions to shareholders—Investor Class | | | — | | | | — | | | | (14,885,322 | ) | | | (51,947,188 | ) | | | — | | | | (903,727 | ) |
Net dividends and distributions to shareholders—Institutional Class | | | — | | | | — | | | | — | | | | — | | | | — | | | | — | |
| | | | | | | | | | | | | | | | | | | | | | | | |
Total dividends and distributions | | | — | | | | — | | | | (14,885,322 | ) | | | (51,947,188 | ) | | | — | | | | (903,727 | ) |
| | | | | | | | | | | | | | | | | | | | | | | | |
Fund share transactions: | | | | | | | | | | | | | | | | | | | | | | | | |
Shares sold—Investor Class | | | 237,866,185 | | | | 213,886,198 | | | | 5,944,084 | | | | 14,347,640 | | | | 2,401,396 | | | | 2,787,932 | |
Shares sold—Institutional Class | | | 36,464,397 | | | | — | | | | — | | | | — | | | | — | | | | — | |
Shares issued to holders in reinvestment of dividends—Investor Class | | | — | | | | — | | | | 13,333,980 | | | | 50,048,422 | | | | — | | | | 890,838 | |
Shares issued to holders in reinvestment of dividends—Institutional Class | | | — | | | | — | | | | — | | | | — | | | | — | | | | — | |
Shares redeemed—Investor Class* | | | (356,594,374 | ) | | | (312,923,463 | ) | | | (91,143,706 | ) | | | (120,620,354 | ) | | | (11,149,378 | ) | | | (10,292,016 | ) |
Shares redeemed—Institutional Class* | | | (1,721,269 | ) | | | — | | | | — | | | | — | | | | — | | | | — | |
| | | | | | | | | | | | | | | | | | | | | | | | |
Net decrease | | | (83,985,061 | ) | | | (99,037,265 | ) | | | (71,865,642 | ) | | | (56,224,292 | ) | | | (8,747,982 | ) | | | (6,613,246 | ) |
| | | | | | | | | | | | | | | | | | | | | | | | |
Net increase (decrease) in net assets | | | 178,348,778 | | | | (293,892,907 | ) | | | (76,686,106 | ) | | | (136,234,249 | ) | | | (7,323,468 | ) | | | (10,227,924 | ) |
Net Assets: | | | | | | | | | | | | | | | | | | | | | | | | |
Beginning of period | | | 859,394,329 | | | | 1,153,287,236 | | | | 237,118,793 | | | | 373,353,042 | | | | 39,224,604 | | | | 49,452,528 | |
| | | | | | | | | | | | | | | | | | | | | | | | |
End of period | | $ | 1,037,743,107 | | | $ | 859,394,329 | | | $ | 160,432,687 | | | $ | 237,118,793 | | | $ | 31,901,136 | | | $ | 39,224,604 | |
| | | | | | | | | | | | | | | | | | | | | | | | |
* Net of redemption fees of: | | $ | 416,731 | | | $ | 67,378 | | | $ | — | | | $ | — | | | $ | — | | | $ | — | |
| | | | | | | | | | | | | | | | | | | | | | | | |
The Accompanying Notes are an Integral Part of these Financial Statements.
The Tocqueville Trust
Notes to Financial Statements
1. ORGANIZATION
The Tocqueville Trust (the “Trust”) is a Massachusetts business trust registered under the Investment Company Act of 1940 and organized on September 17, 1986, consisting of five separate funds (each, a “Fund” or, collectively, the “Funds”). Each Fund is anopen-end management investment company with a different investment objective. The Tocqueville Fund, The Tocqueville Opportunity Fund (the “Opportunity Fund”), The Tocqueville Phoenix Fund and The Tocqueville Select Fund (the “Select Fund”) are classified as diversified investment companies. The Tocqueville Gold Fund (the “Gold Fund”) is classified as anon-diversified investment company. The Tocqueville Fund’s investment objective is long-term capital appreciation which it seeks to achieve by investing primarily in securities of United States issuers. The Opportunity Fund’s investment objective is to achieve long-term capital appreciation which it seeks to achieve by investing in the common stocks of small and mid-cap companies which have the potential to deliver superior long term earnings growth. The Gold Fund’s investment objective is long-term capital appreciation which it seeks to achieve by investing in gold, securities of companies located throughout the world that are engaged in mining or processing gold (“gold related securities”), other precious metals and securities of companies located throughout the world that are engaged in mining or processing such other precious metals (“other precious metal securities”). The Tocqueville Phoenix Fund’s investment objectives are to seek long-term preservation of capital (sufficient growth to outpace inflation over an extended period of time) and growth of capital which it seeks to achieve by investing primarily in the equity securities of domestic companies. The Tocqueville Select Fund’s investment objective is to achieve long-term capital appreciation by investing in a focused group of common stocks issued primarily by small andmid-sized U.S. companies. Current income is a secondary objective for The Tocqueville Select Fund.
Effective April 8, 2019, The Tocqueville Gold Fund issued Institutional class shares, and renamed the existing class as Investor class.
The Tocqueville Phoenix Fund (formerly known as The Delafield Fund), a series of the Trust, commenced operations on September 28, 2009 as successor to Delafield Fund, Inc. The predecessor Delafield Fund, Inc. commenced operations on November 19, 1993. The Delafield Fund changed its name to The Tocqueville Phoenix Fund on February 15, 2019.
The Tocqueville Select Fund, a series of the Trust, commenced operations on September 28, 2009 as successor to the Delafield Select Fund, a series of Natixis Funds Trust II. The predecessor Delafield Select Fund commenced operations on September 29, 2008 for Class A and Class C shares and on September 26, 2008 for Class Y shares. Prior to September 29, 2008, the predecessor Delafield Select Fund operated as a Delaware
limited partnership using substantially the same investment objectives and investment policies as the predecessor fund. The limited partnership was incepted in July 1998.
2. SIGNIFICANT ACCOUNTING POLICIES
The following is a summary of significant accounting principles followed by the Trust in the preparation of its financial statements.
a) Security valuation and security transactions
Investments in securities, including foreign securities, traded on an exchange or quoted on the over-the-counter market are valued at the last sale price or, if no sale occurred during the day, at the mean between closing bid and asked prices, as last reported by a pricing service approved by the Trustees. Securities that are principally traded on the National Association of Securities Dealers Automated Quotation National Market (“NASDAQ”) are generally valued at the NASDAQ Official Closing Price (“NOCP”). If there is no NASDAQ Official Closing Price for a NASDAQ-listed security or sale price available for an over-the-counter security, the mean of the latest bid and asked quotations from NASDAQ will be used. Investments in gold will be valued at the spot price of gold determined based on the mean of the last bid and asked price at the close of the New York Commodity Exchange. When market quotations for securities are not readily available, or when restricted securities or other assets are being valued, such assets are valued at fair value as determined in good faith by or under procedures approved by the Trustees. Money market funds are valued at market price. Money market deposit accounts are reflected at cost as this is a cash instrument. Fixed income securities are valued at market price. Fixed Income securities, such as corporate bonds, convertible bonds and U.S. government agency issues for which market quotations are not readily available may be valued based on information supplied by independent pricing services using matrix pricing formulas and/or independent broker bid quotations.
Trading in securities on foreign securities exchanges normally is completed before the calculation of the Funds’ net asset value. Trading on these foreign exchanges may not take place on all days on which there is regular trading on the New York Stock Exchange (“NYSE”), or may take place on days on which there is no regular trading on the NYSE. Similarly, the Funds may hold securities traded in domestic markets where the market may close early on a given day prior to calculation of the Funds’ net asset value. Events affecting the value of such securities held by the Funds that occur between the close of trading in the security and the close of trading on the NYSE normally will not be reflected in the Funds’ calculation of the net asset value. However, significant events will be closely monitored, and where it is determined that an adjustment should be made to the security’s value because significant interim events may materially affect the value of the security, the security will be priced at its fair value in accordance with the procedures approved by the Trustees.
Investment and shareholder transactions are recorded on trade date. Dividend income is recognized on the ex-dividend date. Interest income is recognized on an accrual
basis and includes, where applicable, the amortization of premiums and accretion of discounts. Net realized gains and losses from sales of securities are determined on the specific identification cost method.
b) Restricted and illiquid securities
The Funds may invest in securities that are subject to legal or contractual restrictions on resale or are illiquid. A security may be considered illiquid if it lacks a readily available market or if its valuation has not changed for a certain period of time. Disposal of these securities may involve time consuming negotiations and expense, and a prompt sale at the current valuation may be difficult.
c) Fair Valuation Measurements
The Trust has adopted authoritative fair valuation accounting standards which establish an authoritative definition of fair value and set out a hierarchy for measuring fair value. These standards require additional disclosures about the various inputs and valuation techniques used to develop the measurements of fair value and a discussion in changes in valuation techniques and related inputs during the year. These inputs are summarized in the three broad levels listed below.
| | • | Level 1 - Quoted prices in active markets for identical securities. |
| | • | Level 2 - Other significant observable inputs (including quoted prices for similar securities, interest rates, prepayment speeds, credit risk, etc.). |
| | • | Level 3 - Significant unobservable inputs (including the Fund’s own assumptions in determining the fair value of investments). |
When using the market quotations or closing price provided by the pricing service for equity investments, including common stocks, preferred stocks, foreign issued common stocks, exchange-traded funds, closed end mutual funds and real estate investment trusts, which are traded on an exchange are valued at the last sale price reported by the exchange on which the securities are primarily traded on the day of valuation and when the market is considered active, the security will be classified as a Level 1 security. When using the mean between the latest bid and ask price, the security will be classified as Level 2. Gold bullion is valued at the mean of the closing bid and ask prices from the New York Mercantile Exchange and is classified as a Level 2.
Investment in mutual funds, including money market funds, are generally priced at the ending net asset value (NAV) provided by the service agent of the funds and will be classified as Level 1 securities.
Debt securities, such as corporate bonds, convertible bonds, commercial paper, accounts and U.S. government agency issues for which market quotations are not readily available may be valued based on information supplied by independent pricing services using matrix pricing formulas and/or independent broker bid quotations and are classified as Level 2. Warrants and rights for which the underlying security is registered and equities which are subject to a required holding period, but have a comparable public issue, are
valued in good faith by the adviser pursuant to procedures established under the general supervision and responsibility of the Funds’ Board of Trustees. These securities will generally be classified as Level 2 securities. If the warrant or right is exchange traded and the official closing price of the exchange is used, these instruments are classified as Level 1 securities. Options can diverge from the prices of their underlying instruments. These are valued at the composite last price reported by the exchange on which the options are primarily traded on the day of the valuation and are classified as Level 1. If there is no composite last price on a given day the mean between the latest bid and ask price will be used. These contracts are classified as Level 2.
Any securities or other assets for which market quotations are not readily available are valued at fair value as determined in good faith by the Adviser pursuant to procedures established under the general supervision and responsibility of the Funds’ Board of Trustees and will be classified as Level 3 securities. In determining fair value, a Fund will seek to assign a value to the security which it believes represents the amount that the Fund could reasonably expect to receive upon its current sale. With respect to securities that are actively traded on U.S. exchanges, the Funds expect that market quotations will generally be available and that fair value might be used only in limited circumstances, such as when trading for a security is halted during the trading day.
For securities traded principally on foreign exchanges, the Funds may use fair value pricing if an event occurs after the close of trading of the principal foreign exchange on which a security is traded, but before calculation of a Fund’s NAV, which a Fund believes affects the value of the security since its last market quotation. Such events may involve situations relating to a single issuer (such as news related to the issuer announced after the close of the principal foreign exchange), or situations relating to sectors of the market or the markets in general (such as significant fluctuations in the U.S. or foreign markets or significant changes in exchange rates, natural disasters, armed conflicts, or governmental actions).
In determining whether a significant event has occurred with respect to securities traded principally in foreign markets, the Funds may engage a third party fair value service provider to systematically recommend the adjustment of closing market prices ofnon-U.S. securities based upon changes in a designated U.S. securities market index occurring from the time of close of the relevant foreign market and the close of the NYSE. Fair value pricing may also be used to value restricted securities held by the Funds or securities with little or no trading activity for extended periods of time. Fair value pricing involves judgments that are inherently subjective and inexact and it is not possible to determine with certainty when, and to what extent, an event will affect a market price. As a result, there can be no assurance that fair value pricing will reflect actual market value and it is possible that the fair value determined for a security may differ materially from the value that could be realized upon the sale of the security.
The following table summarizes the Fund’s investments that are measured at fair value by level within the fair value hierarchy as of October 31, 2019. The inputs or methodology used for valuing securities may not be an indication of the risk associated with investing in those securities.
| | | | | | | | | | | | | | | | |
| Description | | Level 1 | | | Level 2 | | | Level 3 | | | Total | |
The Tocqueville Fund* | | | | | | | | | | | | | | | | |
Assets | | | | | | | | | | | | | | | | |
Common Stocks | | $ | 274,138,311 | | | $ | — | | | $ | — | | | $ | 274,138,311 | |
Preferred Stock | | | — | | | | — | | | | 1,600 | | | | 1,600 | |
Real Estate Investment Trust (REIT) | | | 7,302,500 | | | | — | | | | — | | | | 7,302,500 | |
Exchange-Traded Fund (ETF) | | | 2,631,000 | | | | — | | | | — | | | | 2,631,000 | |
Money Market Fund | | | 1,179 | | | | — | | | | — | | | | 1,179 | |
| | | | | | | | | | | | | | | | |
Total Investments | | $ | 284,072,990 | | | $ | — | | | $ | 1,600 | | | $ | 284,074,590 | |
| | | | | | | | | | | | | | | | |
| | | | |
| The Tocqueville Opportunity Fund* | | Level 1 | | | Level 2 | | | Level 3 | | | Total | |
Assets | | | | | | | | | | | | | | | | |
Common Stocks | | $ | 83,879,173 | | | $ | — | | | $ | — | | | $ | 83,879,173 | |
Real Estate Investment Trust (REIT) | | | 567 | | | | — | | | | — | | | | 567 | |
Exchange-Traded Fund (ETF) | | | 20,250 | | | | — | | | | — | | | | 20,250 | |
Purchased Call Options | | | | | | | | | | | | | | | | |
Capital Goods | | | 13,050 | | | | — | | | | — | | | | 13,050 | |
Consumer Durables & Apparel | | | 2,500 | | | | — | | | | — | | | | 2,500 | |
Pharmaceuticals, Biotechnology & Life Sciences | | | — | | | | 57,125 | | | | — | | | | 57,125 | |
| | | | | | | | | | | | | | | | |
Total Purchased Call Options | | | 15,550 | | | | 57,125 | | | | — | | | | 72,675 | |
Money Market Fund | | | 741 | | | | — | | | | — | | | | 741 | |
| | | | | | | | | | | | | | | | |
Total Investments | | $ | 83,916,281 | | | $ | 57,125 | | | $ | — | | | $ | 83,973,406 | |
| | | | | | | | | | | | | | | | |
| | | | |
| The Tocqueville Gold Fund* | | Level 1 | | | Level 2 | | | Level 3 | | | Total | |
Assets | | | | | | | | | | | | | | | | |
Common Stocks | | | | | | | | | | | | | | | | |
Gold Related | | $ | 755,860,336 | | | $ | 12,262,970 | | | $ | 42,546 | | | $ | 768,165,852 | |
Other Precious Metals Related | | | 78,172,744 | | | | — | | | | 13,801,272 | | | | 91,974,016 | |
Other | | | — | | | | — | | | | 7,697,946 | | | | 7,697,946 | |
| | | | | | | | | | | | | | | | |
Total Common Stocks | | | 834,033,080 | | | | 12,262,970 | | | | 21,541,764 | | | | 867,837,814 | |
Private Fund**^ | | | — | | | | — | | | | — | | | | 19,874,345 | |
Gold Bullion | | | — | | | | 147,975,170 | | | | — | | | | 147,975,170 | |
Warrants | | | | | | | | | | | | | | | | |
Gold Related | | | 93,615 | | | | 1,209,986 | | | | — | | | | 1,303,601 | |
Other Precious Metals Related | | | — | | | | 211,681 | | | | — | | | | 211,681 | |
| | | | | | | | | | | | | | | | |
Total Warrants | | | 93,615 | | | | 1,421,667 | | | | — | | | | 1,515,282 | |
Money Market Fund | | | 645 | | | | — | | | | — | | | | 645 | |
| | | | | | | | | | | | | | | | |
Total Investments | | $ | 834,127,340 | | | $ | 161,659,807 | | | $ | 21,541,764 | | | $ | 1,037,203,256 | |
| | | | | | | | | | | | | | | | |
| | | | | | | | | | | | | | | | |
| The Tocqueville Phoenix Fund* | | Level 1 | | | Level 2 | | | Level 3 | | | Total | |
Assets | | | | | | | | | | | | | | | | |
Common Stocks | | $ | 143,580,100 | | | $ | — | | | $ | — | | | $ | 143,580,100 | |
Money Market Fund | | | 8,100,000 | | | | — | | | | — | | | | 8,100,000 | |
| | | | | | | | | | | | | | | | |
Total Investments | | $ | 151,680,100 | | | $ | — | | | $ | — | | | $ | 151,680,100 | |
| | | | | | | | | | | | | | | | |
| | | | |
| The Tocqueville Select Fund* | | Level 1 | | | Level 2 | | | Level 3 | | | Total | |
Assets | | | | | | | | | | | | | | | | |
Common Stocks | | $ | 26,758,012 | | | $ | — | | | $ | — | | | $ | 26,758,012 | |
Money Market Fund | | | 1,600,000 | | | | — | | | | — | | | | 1,600,000 | |
| | | | | | | | | | | | | | | | |
Total Investments | | $ | 28,358,012 | | | $ | — | | | $ | — | | | $ | 28,358,012 | |
| | | | | | | | | | | | | | | | |
| * | For further information regarding portfolio characteristics, please see the accompanying Schedules of Investments. |
| ** | Certain investments that are measured at fair value using the net asset value per share (or its equivalent) practical expedient have not been categorized in the fair value hierarchy. The fair value amounts presented in the table are intended to permit reconciliation of the fair value hierarchy to the amounts presented in the Statement of Assets and Liabilities. |
| ^ | The Gold Fund currently invests in a private fund that primarily invests in physical gold and is subject to redemption restrictions. This private fund investment can only be disposed of with notice given 24 hours in advance of redemption. Due to the elapsed time, the investment of the Gold Fund is not subject to any redemption fees going forward. |
Below is a reconciliation that details the activity of securities in Level 3 during the current fiscal year:
| | | | | | | | |
| | | The
Tocqueville
Fund | | | The
Tocqueville
Gold Fund | |
Beginning Balance—November 1, 2018 | | $ | 1,600 | | | $ | 34,104,458 | |
Purchases | | | — | | | | — | |
Sales | | | — | | | | — | |
Realized gains | | | — | | | | — | |
Realized losses | | | — | | | | — | |
Change in unrealized appreciation | | | — | | | | 7,311,651 | |
Transfers in/(out) of Level 3 | | | — | | | | (19,874,345 | ) |
| | | | | | | | |
Ending Balance—October 31, 2019 | | $ | 1,600 | | | $ | 21,541,764 | |
| | | | | | | | |
The movement out of Level 3 in the Gold Fund was due to the Private Fund held, which is measured at fair value using the net asset value per share (or its equivalent) practical expedient, no longer being categorized in the fair value hierarchy.
As of October 31, 2019 the change in unrealized appreciation on positions still held for securities that were considered Level 3 was $7,311,651.
The following table summarizes quantitative information about significant unobservable valuation inputs for Level 3 fair value measurement as of October 31, 2019.
| | | | | | | | | | | | |
Fund | | Type of
Security | | Industry | | Fair
Value at
10/31/2019 | | Valuation
Techniques | | Unobservable
Inputs | | Range |
The Tocqueville Fund | | Preferred Stock | | Health Care
Equipment &
Supplies | | $ 1,600 | | Professional analysis of latest company valuation | | Financing
prices | | $0.004 |
The Tocqueville Gold Fund | | Common Stock | | Gold Related | | 42,546 | | Professional analysis of latest company valuation | | Financing
prices | | $0.02-$0.05 |
| | | | Other
Precious
Metals
Related | | 13,801,272 | | Professional analysis of latest company financing | | Financing
prices | | $4.50-$6.00 |
| | | | Other | | 7,697,946 | | Professional analysis of latest company financing | | Financing
prices | | $1.38-$10.80 |
Professional analysis of company valuation is provided through the opinion of portfolio managers and analysts of the Adviser who provide periodic updates to securities of similar discipline which allows for insights to lesser known or followed securities. This analysis is important where there are few identifiable market inputs, the security is private, or has a narrowly focused business or is closely held.
Portfolio Management and the Trading department monitor fair valued positions for new financing or corporate actions that could lead to a change in valuation.
The significant unobservable inputs used in the fair value measurement of the Tocqueville Fund’s preferred stock and the Gold Fund’s common stocks are the most recent financing prices of the portfolio company, which approximate the companies’ value in the market and can provide an accurate measure of a closely held or private security as it represents a market price between two parties that are willing to transact.
Significant changes in the companies’ ability to receive financing for new projects in the future would be an indication of the companies’ financial position and market value.
The Trust’s valuation procedures have been adopted by the Trust’s Board of Trustees, which has established a Valuation Committee to oversee the valuation process. The Valuation Committee meets on an as needed basis to evaluate changes in the valuation of portfolio securities. The full findings and valuations are then reviewed quarterly by the Independent Trustees.
d) Derivative Instruments and Hedging Activities
The Funds’ Adviser may use derivative instruments, such as options, as a means to manage exposure to different types of risk, including market risk and exchange rate risk, and to gain exposure to underlying securities. The Trust has adopted disclosure standards in order to enable the investor to understand how and why an entity used derivatives, how derivatives are accounted for, and how derivatives affect an entity’s results of operations and financial position.
In the Opportunity Fund, the Adviser uses options to gain exposure to the underlying equity security and earn premium income.
Balance Sheet—Values of Derivative Instruments as of October 31, 2019.
The Tocqueville Opportunity Fund
| | | | | | | | | | | | |
| | | Asset Derivatives | | | Liability Derivatives | |
| Derivatives not accounted for as hedging instruments | | Balance Sheet
Location | | Value | | | Balance Sheet
Location | | Value | |
Purchased Options | | Investments,
at Value | | $ | 72,675 | | | Investments,
at Value | | $ | — | |
| | | | | | | | | | | | |
Total | | | | $ | 72,675 | | | | | $ | — | |
| | | | | | | | | | | | |
The Effect of Derivative Instruments on the Statement of Operations for the year ended October 31, 2019.
The Tocqueville Opportunity Fund
| | | | | | | | |
| | | Net Realized
Loss on Investments | | | Net Change in
Unrealized
Appreciation on
Investments | |
Purchased Options | | $ | (1,302,789 | ) | | $ | 521,993 | |
Written Option | | | (4,761 | ) | | | — | |
| | | | | | | | |
Total | | $ | (1,307,550 | ) | | $ | 521,993 | |
| | | | | | | | |
Derivatives Risk
The risks of using the types of derivatives in which the Funds may engage include the risk that movements in the value of the derivative may not fully offset or complement instruments currently held in the Funds in the manner intended by the Adviser; the risk that the counterparty to a derivative contract may fail to comply with their obligations to the Fund; the risk that the derivative may not possess a liquid secondary market at a time when the Fund would look to disengage the position; the risk that additional capital from the Fund may be called upon to fulfill the conditions of the derivative contract; and the risk that the cost of the derivative contracts may reduce the overall returns experienced by the Funds. The measurement of risks associated with these instruments is meaningful
only when all related offsetting transactions are considered. The Fund may enter into written call options to hedge against changes in the value of equities. The Fund’s option component of the overall investment strategy is often referred to as a“buy-write” strategy (also called a “covered call” strategy), in which the Adviser (as defined below) writes (sells) a call option contract while at the same time owning an equivalent number of shares of the underlying stock to generate moderate current income. The writing of call options is intended to reduce the volatility of the portfolio and to earn premium income. Written call options expose the Fund to minimal counterparty credit risk since they are exchange traded and the exchange’s clearing house guarantees the options against default. As the writer of a call option, the Fund has the obligation to sell the security at the exercise price during the exercise period in the event the option is exercised. The use of options do not create leverage in the Funds.
The average monthly value of purchased options in the Opportunity Fund during the year ended October 31, 2019 was $238,021.
Transactions in options in the Opportunity Fund during the year ended October 31, 2019 were as follows:
| | | | | | | | |
| | | Notional
Amount | | | Contracts | |
Outstanding, beginning of period: | | $ | 21,937,500 | | | | 1,170 | |
Options purchased | | | 213,331,250 | | | | 13,375 | |
Options terminated in closing transactions | | | (128,406,250 | ) | | | (8,055 | ) |
Options exercised | | | — | | | | — | |
Options expired | | | (101,362,500 | ) | | | (5,690 | ) |
| | | | | | | | |
Outstanding, end of period: | | $ | 5,500,000 | | | | 800 | |
e) Foreign currency translation
Investments and other assets and liabilities denominated in foreign currencies are translated to U.S. dollars at the prevailing rates of exchange, in accordance with the Trust’s Portfolio Securities Valuation and Foreign Exchange Contracts Procedures. The Tocqueville Fund, The Tocqueville Opportunity Fund, and The Tocqueville Gold Fund, and The Tocqueville Phoenix Fund have engaged in transactions in securities denominated in foreign currencies and, as a result, entered into foreign exchange transactions. These Funds are exposed to additional market risk as a result of changes in the value of the underlying currency in relation to the U.S. dollar. Risks include potential inability of counterparties to meet the terms of their obligations. The value of foreign currencies are marked-to-market on a daily basis, which reflects the changes in the market value of the contract at the close of each day’s trading, resulting in daily unrealized gains and/or losses. When the transactions are settled or the contracts are closed, the Funds recognize a realized gain or loss.
The Funds isolate that portion of the results of operations resulting from changes in foreign exchange rates on investments from the fluctuations arising from changes in market prices of securities held. Such fluctuations are reflected as net realized and unrealized gain or loss on foreign currency translation.
Reported net realized foreign exchange gains or losses arise from sales of foreign currencies, currency gains or losses realized between the trade and settlement dates on securities transactions, the differences between the amounts of dividends, interest, and foreign withholding taxes recorded on the Fund’s books, and the U.S. dollar equivalent of the amounts actually received or paid. Net unrealized foreign exchange gains and losses arise from changes in the value of assets and liabilities other than investments in securities at the end of the fiscal year, resulting from changes in the exchange rates.
f) Dividends and distributions to shareholders
Dividends to shareholders are recorded on the ex-dividend date. Dividends from net investment income are declared and paid annually by the Funds. Distributions of net realized capital gains, if any, will be declared and paid at least annually. Income and capital gain distributions are determined in accordance with income tax regulations which may differ from generally accepted accounting principles. Permanent differences between financial and tax reporting may result in reclassification to capital stock.
g) Allocation of Income, Expenses and Gains/Losses
Income, expenses (other than those deemed attributable to a specific share class), and gains and losses of the Fund are allocated daily to each class of shares based upon the ratio of net assets represented by each class as a percentage of the net assets of the Fund. Expenses deemed directly attributable to a class of shares are recorded by the specific class. Most Fund expenses are allocated by class based on relative net assets.
h) Use of estimates
The preparation of financial statements in conformity with accounting principles generally accepted in the United States of America requires management to make estimates and assumptions that affect the reported amounts of assets and liabilities and disclosure of contingent assets and liabilities at the date of the financial statements and the reported amounts of revenues and expenses during the reporting year. Actual results could differ from those estimates.
i) Indemnification
In the normal course of business the Funds enter into contracts that contain general indemnification clauses. The Funds’ maximum exposure under these arrangements is unknown, as this would involve future claims against a Fund that have not yet occurred. Based on experience, the Funds expect the risk of loss to be remote.
j) Recent accounting pronouncement
In August 2018, FASB issued ASU 2018-13,Fair Value Measurement (Topic 820): Disclosure Framework—Changes to the Disclosure Requirements for Fair Value Measurement(“ASU 2018-13’’). The primary focus of ASU 2018-13 is to improve the effectiveness of the disclosure requirements for fair value measurements. The changes affect all companies that are required to include fair value measurement disclosures. In general, the amendments
in ASU 2018-13 are effective for all entities for fiscal years and interim periods within those fiscal years, beginning after December 15, 2019. An entity is permitted to early adopt the removed or modified disclosures upon the issuance of ASU 2018-13 and may delay adoption of the additional disclosures, which are required for public companies only, until their effective date. Management has chosen to early adopt the modified disclosures for the year ended October 31, 2019.
k) Subsequent events evaluation
On November 15, 2019, The Tocqueville Phoenix Fund (the “Acquiring Fund”) acquired the net assets of The Tocqueville Select Fund (the “Acquired Fund”) pursuant to an Agreement and Plan of Reorganization which was approved by each Fund’s Board of Trustees on October 10, 2019. The purpose of the transaction was to combine two funds managed by the Adviser with comparable investment objectives and strategies. Following the completion of the reorganization, the Select Fund was liquidated and dissolved.
On October 2, 2019, the Board of Trustees of the Gold Fund approved an Agreement and Plan of Reorganization (the “Plan”) providing for the reorganization of the Gold Fund (the “Target Fund”), into the Sprott Gold Fund (the “Acquiring Fund”), a series of Sprott ETF Trust, a Delaware statutory trust. The Acquiring Fund will have a substantially similar investment objective and substantially similar investment strategies and policies as the Target Fund. Following the reorganization, Sprott Asset Management LP (the “Adviser”) will serve as the Acquiring Fund’s investment adviser and Sprott Asset Management USA Inc. (the“Sub-Adviser”) will serve as the Acquiring Fund’s sub-adviser. The Adviser will be responsible for overseeing the management of the Acquiring Fund, and the Sub-Adviser will be primarily responsible for the recommendation of the purchase, retention and sale of the Acquiring Fund’s portfolio securities, subject to the supervision of the Adviser and the oversight of the board. The current portfolio managers of the Target Fund, John Hathaway and Douglas B. Groh, will continue to act as portfolio managers of the Acquiring Fund as employees of the Sub-Adviser. On December 17, 2019, a special meeting of shareholders took place during which shareholders of the Gold Fund were asked to consider and vote on the Plan. The result of the vote at the special meeting of shareholders was as follows:
| | | | | | | | | | | | |
| | | Shares Voted | | | % of Shares Voted | | | % of Fund’s
Outstanding Shares Voted | |
For | | | 12,597,301 | | | | 91.0 | % | | | 46.8 | % |
Against | | | 321,772 | | | | 2.3 | % | | | 1.2 | % |
Abstained | | | 930,121 | | | | 6.7 | % | | | 3.5 | % |
As a result of the foregoing vote, the Plan was approved by the Gold Fund’s shareholders. The reorganization is expected to take effect on or about January 17, 2020.
3. FEDERAL INCOME TAX
There is no tax liability resulting from unrecognized tax benefits relating to uncertain income tax positions taken or expected to be taken on the tax return for the fiscalyear-end October 31, 2019, or for any other tax years which are open for exam. As of October 31, 2019, open tax years include the tax years ended October 31, 2016 through
2019. The Trust is also not aware of any tax positions for which it is reasonably possible that the total amounts of unrecognized tax benefits will significantly change in the next six months. The Funds recognize interest and penalties, if any, related to unrecognized tax benefits as income tax expense in the Statement of Operations. During the year, the Funds did not incur any interest or penalties.
Provision for federal income taxes or excise taxes has not been made since the Funds have elected to be taxed as Regulated Investment Companies and intend to distribute substantially all taxable income to shareholders and otherwise comply with the provisions of the Internal Revenue Code applicable to Regulated Investment Companies. Distributions from net realized gains for book purposes may include short-term capital gains which are included as ordinary income to shareholders for tax purposes. Additionally, accounting principles generally accepted in the United States of America require that certain components of net assets relating to permanent differences be reclassified between financial and tax reporting. These reclassifications have no effect on net assets or net asset value per share. For the year ended October 31, 2019, the following table shows the reclassifications made:
| | | | | | | | | | | | |
| | | Undistributed
Net Investment
Income/(Loss) | | | Accumulated Net
Realized
Gain/(Loss) | | | Paid In Capital | |
Tocqueville Fund | | $ | (323,000 | ) | | $ | (1,111,992 | ) | | $ | 1,434,992 | |
Opportunity Fund | | | 784,335 | | | | (489,812 | ) | | | (294,523 | ) |
Gold Fund | | | 8,812,464 | | | | 1,142 | | | | (8,813,606 | ) |
Phoenix Fund | | | 41,661 | | | | (1,068,192 | ) | | | 1,026,531 | |
Select Fund | | | 143,921 | | | | (128,190 | ) | | | (15,731 | ) |
The permanent differences primarily relate to net operating losses, foreign currency reclasses and the usage of tax equalization.
As of October 31, 2019, the components of accumulated earnings (losses) for income tax purposes were as follows:
| | | | | | | | | | | | | | | | | | | | |
| | | Tocqueville
Fund | | | Opportunity
Fund | | | Gold
Fund | | | Phoenix Fund | | | Select Fund | |
Tax cost of Investments | | $ | 139,337,084 | | | $ | 55,472,971 | | | $ | 983,454,834 | | | $ | 129,759,159 | | | $ | 26,330,431 | |
| | | | | | | | | | | | | | | | | | | | |
Unrealized Appreciation | | | 146,606,242 | | | | 30,069,786 | | | | 331,942,626 | | | | 33,274,912 | | | | 4,890,937 | |
Unrealized Depreciation | | | (1,868,736 | ) | | | (1,569,351 | ) | | | (277,904,678 | ) | | | (11,353,971 | ) | | | (2,863,356 | ) |
| | | | | | | | | | | | | | | | | | | | |
Net unrealized appreciation (depreciation) | | | 144,737,506 | | | | 28,500,435 | | | | 54,037,948 | | | | 21,920,941 | | | | 2,027,581 | |
| | | | | | | | | | | | | | | | | | | | |
Undistributed operating income | | | 2,425,043 | | | | — | | | | — | | | | — | | | | — | |
Undistributed long-term gains | | | 17,197,778 | | | | 4,684,097 | | | | — | | | | 3,636,091 | | | | 2,469,162 | |
| | | | | | | | | | | | | | | | | | | | |
Distributable earnings | | | 19,622,821 | | | | 4,684,097 | | | | — | | | | 3,636,091 | | | | 2,469,162 | |
| | | | | | | | | | | | | | | | | | | | |
Other accumulated gain/(loss) | | | 1 | | | | (725,406 | ) | | | (422,276,771 | ) | | | (215,572 | ) | | | (39,436 | ) |
| | | | | | | | | | | | | | | | | | | | |
Total accumulated gain/(loss) | | $ | 164,360,328 | | | $ | 32,459,126 | | | $ | (368,238,823 | ) | | $ | 25,341,460 | | | $ | 4,457,307 | |
| | | | | | | | | | | | | | | | | | | | |
The difference between book-basis andtax-basis unrealized appreciation is attributable primarily to wash sale deferrals and passive foreign investment companies (PFIC’s).
The tax character of distributions paid during the years ended October 31, 2019 and 2018 was as follows:
| | | | | | | | | | | | |
| | | October 31, 2019 | |
| | | Ordinary
Income | | | Long Term
Capital Gain | | | Total | |
Tocqueville Fund | | $ | 2,534,561 | | | $ | 19,359,944 | | | $ | 21,894,505 | |
Opportunity Fund | | | — | | | | 7,593,052 | | | | 7,593,052 | |
Gold Fund | | | — | | | | — | | | | — | |
Phoenix Fund | | | 2,829,094 | | | | 12,056,228 | | | | 14,885,322 | |
Select Fund | | | — | | | | — | | | | — | |
| |
| | | October 31, 2018 | |
| | | Ordinary
Income | | | Long Term
Capital Gain | | | Total | |
Tocqueville Fund | | $ | 2,493,282 | | | $ | 24,335,053 | | | $ | 26,828,335 | |
Opportunity Fund | | | — | | | | 2,589,302 | | | | 2,589,302 | |
Gold Fund | | | — | | | | — | | | | — | |
Phoenix Fund | | | 2,432,967 | | | | 49,514,221 | | | | 51,947,188 | |
Select Fund | | | — | | | | 903,727 | | | | 903,727 | |
The Fund designated as long-term capital gain dividend, pursuant to Internal Revenue Code Section 852(b)(3), the amount necessary to reduce the earnings and profits of the Funds related to net capital gain to zero for the tax years ended October 31, 2019 and 2018.
For the fiscal year ended October 31, 2019 the Opportunity Fund, Gold Fund, Phoenix Fund, and Select Fund had late year losses of $725,378, $7,547,334, $215,572, and $39,436, respectively.
At October 31, 2019 certain Funds had tax basis capital losses which may be carried forward to offset future capital gains as shown below.
| | | | | | | | |
| | | Capital Losses Expiring
Indefinite Short Term | | | Capital Losses Expiring
Indefinite Long Term | |
Gold Fund | | $ | 3,404,086 | | | $ | 411,326,606 | |
To the extent that Funds listed above may realize future net capital gains, those gains will be offset by any of their unused respective capital loss carryforwards
4. INVESTMENT ADVISORY AND OTHER AGREEMENTS
Tocqueville Asset Management L.P. (“Tocqueville”) is the investment adviser (the “Adviser”) to the Trust under Investment Advisory Agreements approved by shareholders. For its services, Tocqueville receives fees from The Tocqueville Fund, calculated daily and payable monthly, at an annual rate of 0.75% on the first $1 billion of the average daily net assets of the Fund, and 0.65% of the average daily net assets in excess of $1 billion.
Tocqueville receives fees from The Tocqueville Opportunity Fund, calculated daily and payable monthly, at an annual rate of 0.75% on the first $500 million of the average daily net assets of the Fund, and 0.65% of the average daily net assets in excess of $500 million. Tocqueville receives fees from The Tocqueville Gold Fund, calculated daily and payable monthly, at an annual rate of 1.00% on the first $500 million of the average daily net assets of the Fund, 0.75% of the average daily net assets in excess of $500 million but not exceeding $1 billion, and 0.65% of the average daily net assets in excess of $1 billion. Tocqueville receives fees from The Tocqueville Phoenix Fund, calculated daily and payable monthly, at an annual rate of 0.80% on the first $250 million of net assets of the Fund; 0.75% on the next $250 million of net assets of the Fund; 0.70% on the next $500 million of net assets of the Fund; and 0.65% on all net assets of the Fund over $1 billion. Tocqueville receives fees from The Tocqueville Select Fund, calculated daily and payable monthly, at an annual rate of 0.80% on all net assets of the Fund.
With respect to The Tocqueville Fund, The Tocqueville Opportunity Fund, The Tocqueville Phoenix Fund and The Tocqueville Select Fund, the Adviser has contractually agreed to waive its advisory fees and/or reimburse expenses in order to ensure that The Tocqueville Fund’s total annual operating expenses do not exceed 1.25% of its average daily net assets (excluding taxes, interest expense, acquired fund fees and expenses, or extraordinary expenses such as litigation). The Expense Limitation Agreements will remain in effect until March 1, 2021 for each Fund. For the year ended October 31, 2019, the Adviser waived $122,015, $116,366, $272,121, and $80,065 of the advisory fee for The Tocqueville Fund, The Tocqueville Opportunity Fund, The Tocqueville Phoenix Fund, and The Tocqueville Select Fund respectively. Such amounts are not subject to recoupment by the Adviser.
Pursuant to an Administrative Services Agreement, each Fund pays to the Adviser a fee computed and paid monthly at an annual rate of 0.15% on the first $400 million of the average daily net assets of each Fund; 0.13% on the next $600 million of the average daily net assets of each Fund; and 0.12% on all the average daily net assets of each Fund over $1 billion. For the year ended October 31, 2019, the Adviser has made payments of $83,396, $27,116, $291,856, $102,135, $23,817, to U.S. Bancorp Fund Services, LLC for services provided under a Sub-Administration Agreement for The Tocqueville Fund, The Tocqueville Opportunity Fund, The Tocqueville Gold Fund, The Tocqueville Phoenix Fund and The Tocqueville Select Fund, respectively.
Tocqueville Securities, L.P. (the “Distributor”), an affiliate of Tocqueville, acts as distributor for shares of the Trust. The Tocqueville Fund, The Tocqueville Opportunity Fund, The Tocqueville Gold Fund—Investor Class, The Tocqueville Phoenix Fund, and The Tocqueville Select Fund adopted a distribution and service plan pursuant to Rule 12b-1 of the 1940 Act. Pursuant to the plans, each Fund pays to the Distributor distribution and service fees of 0.25% per annum of its average daily net assets.
Commissions earned by the Distributor for services rendered as a registeredbroker-dealer in securities transactions for The Tocqueville Fund, The Tocqueville
Opportunity Fund, The Tocqueville Gold Fund, The Tocqueville Phoenix Fund and The Tocqueville Select Fund for the year ended October 31, 2019, were $1,975, $63,905, $0, $16,899, $4,867, respectively.
5. CAPITAL SHARE TRANSACTIONS.
Transactions in capital shares for each Fund were as follows:
| | | | | | | | |
| | | For the Year
Ended
October 31, 2019 | | | For the Year
Ended
October 31, 2018 | |
| The Tocqueville Fund | | Shares | | | Shares | |
Shares sold | | | 339,192 | | | | 400,145 | |
Shares issued to holders in reinvestment dividends | | | 638,291 | | | | 705,639 | |
Shares redeemed | | | (1,025,665 | ) | | | (1,122,176 | ) |
| | | | | | | | |
Net decrease | | | (48,182 | ) | | | (16,392 | ) |
| | |
| The Tocqueville Opportunity Fund | | | | | | | | |
Shares sold | | | 531,542 | | | | 566,780 | |
Shares issued to holders in reinvestment dividends | | | 310,884 | | | | 97,416 | |
Shares redeemed | | | (919,461 | ) | | | (555,070 | ) |
| | | | | | | | |
Net increase (decrease) | | | (77,035 | ) | | | 109,126 | |
| | |
| The Tocqueville Gold Fund—Investor Class | | | | | | | | |
Shares sold | | | 7,050,588 | | | | 6,517,002 | |
Shares issued to holders in reinvestment dividends | | | — | | | | — | |
Shares redeemed | | | (10,914,827 | ) | | | (9,256,841 | ) |
| | | | | | | | |
Net decrease | | | (3,864,239 | ) | | | (2,739,839 | ) |
| | |
| The Tocqueville Gold Fund—Institutional Class | | | | | | | | |
Shares sold | | | 1,071,251 | | | | | |
Shares issued to holders in reinvestment dividends | | | — | | | | | |
Shares redeemed | | | (47,657 | ) | | | | |
| | | | | | | | |
Net increase | | | 1,023,594 | | | | | |
| | |
| The Tocqueville Phoenix Fund | | | | | | | | |
Shares sold | | | 315,292 | | | | 621,501 | |
Shares issued to holders in reinvestment dividends | | | 722,709 | | | | 2,222,399 | |
Shares redeemed | | | (4,749,790 | ) | | | (5,243,871 | ) |
| | | | | | | | |
Net decrease | | | (3,711,789 | ) | | | (2,399,971 | ) |
| | |
| The Tocqueville Select Fund | | | | | | | | |
Shares sold | | | 215,017 | | | | 233,208 | |
Shares issued to holders in reinvestment dividends | | | — | | | | 76,796 | |
Shares redeemed | | | (1,019,581 | ) | | | (875,383 | ) |
| | | | | | | | |
Net decrease | | | (804,564 | ) | | | (565,379 | ) |
6. FUND SHARE TRANSACTIONS
Each Fund currently offers only one class of shares of beneficial interest with the exception of The Tocqueville Gold Fund. A redemption fee of 2.00% is imposed on redemptions of shares held 90 days or fewer for The Tocqueville Gold Fund. This fee is retained by the Fund and is credited to paid in capital. Redemptions to which the fee applies include redemptions of shares resulting from an exchange made pursuant to the Exchange Privilege, as defined in the Trust’s Prospectus. For a more detailed description of when the redemption fee does not apply, please see the Trust’s Prospectus.
7. INVESTMENT TRANSACTIONS
Purchases and sales of investment securities (excluding short-term instruments) for the year ended October 31, 2019 are summarized below.
| | | | | | | | | | | | | | | | | | | | |
| | | Tocqueville
Fund | | | Opportunity
Fund | | | Gold Fund | | | Phoenix
Fund | | | Select
Fund | |
Purchases: | | $ | 33,898,147 | | | $ | 116,964,951 | | | $ | 110,209,493 | | | $ | 64,900,797 | | | $ | 8,164,019 | |
| | | | | | | | | | | | | | | | | | | | |
Sales: | | $ | 48,814,787 | | | $ | 129,674,096 | | | $ | 169,557,769 | | | $ | 88,472,090 | | | $ | 19,289,534 | |
| | | | | | | | | | | | | | | | | | | | |
8. TRANSACTIONS WITH AFFILIATES*
The following issuers are affiliated with the Funds; that is, the Adviser had control of 5% or more of the outstanding voting securities during the period from November 1, 2018 through October 31, 2019. As defined in Section (2)(a)(3) of the Investment Company Act of 1940; such issues are:
| | | | | | | | | | | | | | | | | | | | | | | | | | | | | | | | | | | | | | | | | | | | | | | | |
| | | November 1, 2018 | | | Additions | | | Reductions | | | October 31,
2019 | | | Dividend
Income | | | Realized
Gain/(Loss) | | | Change in
Gross
Unrealized
Appreciation/
(Depreciation) | | | October 31, 2019 | |
Issuer Name | | Share
Balance | | | Cost | | | Share
Balance | | | Cost | | | Share
Balance | | | Cost | | | Share
Balance | | | Value | | | Cost | |
The Tocqueville Gold Fund | | | | | | | | | | | | | | | | | | | | | | | | | | | | | | | | | | | | | | | | | | | | | | | | |
Almaden Minerals Ltd.—Class B | | | 5,607,319 | | | $ | 4,657,349 | | | | — | | | $ | — | | | | (6,700 | ) | | $ | (7,992 | ) | | | 5,600,619 | | | $ | — | | | $ | (2,536 | ) | | $ | (124,392 | ) | | $ | 2,721,431 | | | $ | 4,649,357 | |
Almaden Minerals Ltd. Warrant | | | 740,741 | | | | — | | | | — | | | | — | | | | (740,741 | ) | | | — | | | | — | | | | — | | | | — | | | | — | | | | — | | | | — | |
Almaden Minerals Ltd. Warrant | | | 79,585 | | | | — | | | | — | | | | — | | | | (79,585 | ) | | | — | | | | — | | | | — | | | | — | | | | (1,143 | ) | | | — | | | | — | |
Argonaut Gold, Inc. | | | 2,837,000 | | | | 12,710,613 | | | | — | | | | — | | | | — | | | | — | | | | 2,837,000 | | | | — | | | | — | | | | 1,851,046 | | | | 4,631,045 | | | | 12,710,613 | |
ATAC Resources Ltd. | | | 9,784,891 | | | | 31,231,836 | | | | — | | | | — | | | | — | | | | — | | | | 9,784,891 | | | | — | | | | — | | | | (1,264,307 | ) | | | 1,485,824 | | | | 31,231,836 | |
Bear Creek Mining Corp. | | | 7,413,200 | | | | 28,761,181 | | | | — | | | | — | | | | — | | | | — | | | | 7,413,200 | | | | — | | | | — | | | | 6,750,554 | | | | 13,958,497 | | | | 28,761,181 | |
Corvus Gold, Inc. | | | 3,226,901 | | | | 2,212,904 | | | | — | | | | — | | | | — | | | | — | | | | 3,226,901 | | | | ��� | | | | — | | | | (1,636,039 | ) | | | 4,743,544 | | | | 2,212,904 | |
Corvus Gold, Inc. | | | 15,317,930 | | | | 12,975,684 | | | | 3,661,400 | | | | 5,113,982 | | | | — | | | | — | | | | 18,979,330 | | | | — | | | | — | | | | (6,918,572 | ) | | | 28,099,380 | | | | 18,089,666 | |
East Asia Minerals Corp. | | | 13,290,993 | | | | 22,796,021 | | | | — | | | | — | | | | — | | | | (22 | ) | | | 13,290,993 | | | | — | | | | (22 | ) | | | (454,501 | ) | | | 403,644 | | | | 22,795,999 | |
East Asia Minerals Corp. Warrant | | | 976,493 | | | | — | | | | — | | | | — | | | | — | | | | — | | | | 976,493 | | | | — | | | | — | | | | — | | | | — | | | | — | |
East Asia Minerals Corp. Warrant | | | 3,321,250 | | | | — | | | | — | | | | — | | | | — | | | | — | | | | 3,321,250 | | | | — | | | | — | | | | (100,971 | ) | | | 113,474 | | | | — | |
East Asia Minerals Corp. Warrant | | | 4,617,560 | | | | — | | | | — | | | | — | | | | — | | | | — | | | | 4,617,560 | | | | — | | | | — | | | | (208,742 | ) | | | 83,089 | | | | — | |
Falco Resources Ltd. | | | 16,222,300 | | | | 11,973,054 | | | | — | | | | — | | | | — | | | | — | | | | 16,222,300 | | | | — | | | | — | | | | (1,479,978 | ) | | | 2,524,920 | | | | 11,973,054 | |
Gold Bullion International LLC | | | 5,000,000 | | | | 5,000,000 | | | | — | | | | — | | | | — | | | | — | | | | 5,000,000 | | | | — | | | | — | | | | — | | | | 6,893,000 | | | | 5,000,000 | |
International Tower Hill Mines Ltd. | | | 5,738,836 | | | | 20,953,121 | | | | — | | | | — | | | | — | | | | — | | | | 5,738,836 | | | | — | | | | — | | | | 450,499 | | | | 3,176,446 | | | | 20,953,121 | |
International Tower Hill Mines Ltd. | | | 20,331,298 | | | | 44,453,358 | | | | — | | | | — | | | | — | | | | — | | | | 20,331,298 | | | | — | | | | — | | | | 2,002,160 | | | | 11,268,581 | | | | 44,453,358 | |
Jaguar Mining, Inc. | | | 64,330,707 | | | | 8,127,887 | | | | — | | | | — | | | | — | | | | — | | | | 64,330,707 | | | | — | | | | — | | | | (2,202,865 | ) | | | 7,814,830 | | | | 8,127,887 | |
Jaguar Mining, Inc. | | | — | | | | — | | | | 77,179,388 | | | | 4,895,707 | | | | — | | | | — | | | | 77,179,388 | | | | — | | | | — | | | | 4,292,454 | | | | 9,188,162 | | | | 4,895,707 | |
MAG Silver Corp. | | | 2,661,600 | | | | 29,536,706 | | | | 536,000 | | | | 5,378,846 | | | | (212,000 | ) | | | (2,237,978 | ) | | | 2,985,600 | | | | — | | | | (756,848 | ) | | | 7,266,708 | | | | 29,438,016 | | | | 32,677,574 | |
MAG Silver Corp. | | | 1,432,665 | | | | 15,000,003 | | | | — | | | | — | | | | — | | | | — | | | | 1,432,665 | | | | — | | | | — | | | | 3,845,526 | | | | 14,140,646 | | | | 15,000,003 | |
Nickel Creek Platinum | | | 12,379,201 | | | | 2,544,342 | | | | 1,658,293 | | | | 51,762 | | | | — | | | | — | | | | 14,037,494 | | | | — | | | | — | | | | (67,374 | ) | | | 1,065,788 | | | | 2,596,104 | |
Nickel Creek Platinum Warrant | | | 6,189,601 | | | | — | | | | — | | | | — | | | | — | | | | — | | | | 6,189,601 | | | | — | | | | — | | | | (86,565 | ) | | | 106,677 | | | | — | |
Nickel Creek Platinum Warrant | | | — | | | | — | | | | 1,658,293 | | | | — | | | | — | | | | — | | | | 1,658,293 | | | | — | | | | — | | | | 105,005 | | | | 105,004 | | | | — | |
NuLegacy Gold Corp. | | | 28,556,090 | | | | 6,158,205 | | | | — | | | | — | | | | — | | | | — | | | | 28,556,090 | | | | — | | | | — | | | | (2,169,923 | ) | | | 1,517,672 | | | | 6,158,205 | |
NuLegacy Gold Corp. | | | — | | | | — | | | | 9,296,395 | | | | 523,937 | | | | — | | | | — | | | | 9,296,395 | | | | — | | | | — | | | | (5,157 | ) | | | 518,780 | | | | 523,937 | |
NuLegacy Gold Corp. Warrants | | | — | | | | — | | | | 4,648,198 | | | | — | | | | — | | | | — | | | | 4,648,198 | | | | — | | | | — | | | | 159,516 | | | | 159,516 | | | | — | |
Premier Gold Mines Ltd. | | | 8,630,160 | | | | 15,782,521 | | | | — | | | | — | | | | — | | | | — | | | | 8,630,160 | | | | — | | | | — | | | | 3,532,729 | | | | 14,808,414 | | | | 15,782,521 | |
| | | | | | | | | | | | | | | | | | | | | | | | | | | | | | | | | | | | | | | | | | | | | | | | |
| | | November 1, 2018 | | | Additions | | | Reductions | | | October 31,
2019 | | | Dividend
Income | | | Realized
Gain/(Loss) | | | Change in
Gross
Unrealized
Appreciation/
(Depreciation) | | | October 31, 2019 | |
Issuer Name | | Share
Balance | | | Cost | | | Share
Balance | | | Cost | | | Share
Balance | | | Cost | | | Share
Balance | | | Value | | | Cost | |
SEMAFO, Inc. | | | 11,300,000 | | | $ | 43,116,829 | | | | — | | | $ | — | | | | (737,000 | ) | | $ | (1,082,606 | ) | | | 10,563,000 | | | $ | — | | | $ | 393,058 | | | $ | 10,778,356 | | | $ | 34,329,750 | | | $ | 42,034,223 | |
Strategic Metals Ltd. | | | 10,113,400 | | | | 14,557,309 | | | | — | | | | — | | | | — | | | | — | | | | 10,113,400 | | | | — | | | | — | | | | 1,265,650 | | | | 3,916,054 | | | | 14,557,309 | |
Tocqueville Bullion Reserve LP—Class G(a) | | | 13,806 | | | | 25,000,000 | | | | — | | | | — | | | | — | | | | — | | | | 13,806 | | | | — | | | | — | | | | 3,761,181 | | | | 19,874,345 | | | | 25,000,000 | |
Torex Gold Resources, Inc. | | | 1,678,100 | | | | 20,058,180 | | | | 800,300 | | | | 9,991,649 | | | | — | | | | — | | | | 2,478,400 | | | | — | | | | — | | | | 10,985,053 | | | | 36,260,549 | | | | 30,049,829 | |
Trifecta Gold Ltd. | | | 2,325,199 | | | | — | | | | — | | | | — | | | | — | | | | — | | | | 2,325,199 | | | | — | | | | — | | | | (44,189 | ) | | | 66,202 | | | | — | |
| | | | | | | | | | | | | | | | | | | | | | | | | | | | | | | | | | | | | | | | | | | | | | | | |
| | | | | | $ | 377,607,103 | | | | | | | $ | 25,955,883 | | | | | | | $ | (3,328,598 | ) | | | | | | $ | — | | | $ | (366,348 | ) | | $ | 40,281,719 | | | $ | 253,413,280 | | | $ | 400,234,388 | |
| | | | | | | | | | | | | | | | | | | | | | | | | | | | | | | | | | | | | | | | | | | | | | | | |
| * | All affiliates listed are neither majority-owned subsidiaries or other controlled companies. |
| (a) | Tocqueville Bullion Reserve (“TBR”) is a Delaware Limited Partnership created for the purpose of owning physical gold. The General Partner of TBR is TERA Management LLC (“Tera”), a Delaware Limited Liability Company, which is equally owned and managed by Tocqueville Partners II LLC (“TP2”), a Delaware Limited Liability Company, and Eidesis Real Assets LLC (“Eidesis”), a Delaware Limited Liability Company. The Managing Member of TP2 is Robert Kleinschmidt, President of the Trust, who has a 51% participating percentage in TP2 and the soleNon-Managing Member is John Hathaway,co-portfolio manager of the Tocqueville Gold Fund, who has a 49% participating percentage. |
9. LINE OF CREDIT
The Tocqueville Trust has a $300,000,000 line of credit (the “Line”), which is uncommitted, with U.S. Bank NA. The Line is for temporary emergency or extraordinary purposes, including the meeting of redemption requests that otherwise might require the untimely disposition of securities. The Line is secured by the Trust’s assets. The Line has a one year term and is reviewed annually by the Board of Trustees. The interest rate as of October 31, 2019 was 4.25%. During the year ended October 31, 2019, the Tocqueville Fund’s maximum borrowing was $820,000 and average borrowing was $61,790, the Opportunity Fund’s maximum borrowing was $8,729,000 and average borrowing was $465,623, the Gold Fund’s maximum borrowing was $20,690,000 and average borrowing was $641,468, and the Select Fund’s maximum borrowing was $1,208,000 and average borrowing was $9,774. This borrowing resulted in interest expenses of $2,997, $25,368, $29,992, and $669, respectively. The Tocqueville Phoenix Fund did not use the Line.
10. OTHER EXPENSES
Other expenses include reimbursement to the Adviser for compensation of the Trust’s Chief Compliance Officer. For the year ended October 31, 2019, reimbursement to the Adviser for compensation of the Trust’s Chief Compliance Officer from the Funds amounted to $24,402, $7,935, $82,750, $27,870, $6,350 for the Tocqueville Fund, Opportunity Fund, Gold Fund, Phoenix Fund, and Select Fund respectively.
11. OFFERING COSTS
Offering costs include registration fees and legal fees regarding the preparation of the initial registration statement. Offering costs are amortized to expense over twelve months on a straight-line basis. The offering expenses incurred by the Tocqueville Gold Fund is $33,235.
The Tocqueville Trust
Report of Independent Registered Public Accounting Firm
To the Board of Trustees and Shareholders of
The Tocqueville Trust
Opinion on the financial statements
We have audited the accompanying statements of assets and liabilities, including the schedules of investments, of the Tocqueville Trust, comprised of The Tocqueville Fund, The Tocqueville Opportunity Fund, The Tocqueville Gold Fund, The Tocqueville Phoenix Fund (formerly, “The Delafield Fund”) , and The Tocqueville Select Fund (collectively, the “Funds”) as of October 31, 2019, and the related statements of operations for the year then ended, statements of changes in net assets for the two years in the period then ended, and the financial highlights for each of the five years in the period then ended, and the related notes (collectively referred to as the “financial statements”). In our opinion, the financial statements present fairly, in all material respects, the financial position of the Funds as of October 31, 2019, and the results of their operations for the year then ended, the changes in net assets for the two years in the period then ended, and the financial highlights each of the five years in the period then ended, in conformity with accounting principles generally accepted in the United States of America.
Basis for opinion
These financial statements are the responsibility of the Funds’ management. Our responsibility is to express an opinion on the Funds’ financial statements based on our audits. We are a public accounting firm registered with the Public Company Accounting Oversight Board (United States) (“PCAOB”) and are required to be independent with respect to the Funds in accordance with the U.S. federal securities laws and the applicable rules and regulations of the Securities and Exchange Commission and the PCAOB.
We conducted our audits in accordance with the standards of the PCAOB. Those standards require that we plan and perform the audit to obtain reasonable assurance about whether the financial statements are free of material misstatement, whether due to error or fraud. The Funds are not required to have, nor were we engaged to perform, an audit of their internal control over financial reporting. As part of our audits, we are required to obtain an understanding of internal control over financial reporting but not for the purpose of expressing an opinion on the effectiveness of the Funds’ internal control over financial reporting. Accordingly, we express no such opinion.
Our audits included performing procedures to assess the risks of material misstatement of the financial statements, whether due to error or fraud, and performing procedures that respond to those risks. Such procedures included examining, on a test
basis, evidence supporting the amounts and disclosures in the financial statements. Our audits also included evaluating the accounting principles used and significant estimates made by management, as well as evaluating the overall presentation of the financial statements. Our procedures included confirmation of securities owned as of October 31, 2019, by correspondence with custodians and brokers. We believe that our audits provide a reasonable basis for our opinion.
/s/ GRANT THORNTON LLP
We have served as the Funds’ auditor since 2006.
Chicago, IL
December 23, 2019
ADDITIONAL INFORMATION (UNAUDITED)
1. ADDITIONAL DISCLOSURE REGARDING FUND TRUSTEES AND OFFICERS
Independent Trustees
| | | | | | | | | | | | |
Name and Age | | Position(s) Held
with the Trust | | Term of Office
and Length of
Time Served (1) | | Principal Occupation(s) During Past Five Years | | Number of Funds
in Fund Complex
Overseen By Trustee | | | Other Directorships Held by Trustee |
| | | | | |
Charles W. Caulkins Year of Birth: 1956 | | Trustee; Member of Audit Committee; Member of Governance and Nominating Committee | | Indefinite Term, Since 2003 | | Private Investor dba Plan B Partners from January 2012 – present. | | | 5 | | | None |
| | | | | |
Alexander Douglas Year of Birth: 1947 | | Trustee; Member of Audit Committee; Member of Governance and Nominating Committee | | Indefinite Term, Since 2010 | | Retired. Formerly, President, CEO and owner of Spaulding Law Printing, Inc. from 1992 to November 2014. | | | 5 | | | None |
ADDITIONAL INFORMATION (UNAUDITED)
Independent Trustees
| | | | | | | | | | | | |
Name and Age | | Position(s) Held
with the Trust | | Term of Office
and Length of
Time Served (1) | | Principal Occupation(s) During Past Five Years | | Number of Funds
in Fund Complex
Overseen By Trustee | | | Other Directorships Held by Trustee |
| | | | | |
Charles F. Gauvin Year of Birth: 1956 | | Trustee; Member of Audit Committee; Member of Governance and Nominating Committee | | Indefinite Term, Since February 2015 | | Independent consultant on strategy, leadership and philanthropy, from 2018 – present; Chief Development Officer, Woods Hole Oceanographic Institution, from February 2016 – 2018; Executive Director, Maine Audubon, from August 2014 – January 2016 | | | 5 | | | Director, Bioqual, Inc., July 1992 – present. |
| | | | | |
James W. Gerard Year of Birth: 1961 | | Trustee; Member of Audit Committee; Member of Governance and Nominating Committee | | Indefinite Term, Since 2001 | | Managing Director, Hycroft Advisors, from January 2010-present; Managing Director, deVisscher & Co., LLC from January 2013 to present; The Chart Group from January 2001 to present. | | | 5 | | | President, American Overseas Memorial Day Association, 1998 to present; Trustee, Salisbury School, 2005 to present; Director, American Friends of Bleraucourt, 1992 to present; President, Little Baby Face Foundation, March 2015 to present. |
| | | | | |
William J. Nolan III Year of Birth: 1947 | | Trustee; Chair of Audit Committee; Member of Governance and Nominating Committee | | Indefinite Term, Since December 2006 | | Retired. Executive Vice President & Treasurer PaineWebber Inc. 1997 – 2001. | | | 5 | | | Trustee, Adirondack Museum, Blue Mt. Lake, NY 1996 to 2017 (Treasurer, 2000 to 2013; Executive Committee, 2000 – 2017). |
ADDITIONAL INFORMATION (UNAUDITED)
Interested Trustees(2) and Officers
| | | | | | | | | | | | |
Name and Age | | Position(s) Held
with the Trust | | Term of Office
and Length of
Time Served (1) | | Principal Occupation(s) During Past Five Years | | Number of Funds
in Fund Complex
Overseen By Trustee | | | Other Directorships Held by Trustee |
| | | | | |
Helen Balk Year of Birth:1972 | | Treasurer | | Indefinite Term, Since 2014 | | Controller / Treasurer of Tocqueville Asset Management from January 2014 to present; Manager / Staff Accountant at Pegg & Pegg LLP from August 1995 to January 2014. | | | N/A | | | N/A |
| | | | | |
Robert W. Kleinschmidt Year of Birth: 1949 | | Chairman, President, and Trustee | | Indefinite Term, Chairman Since 2016, and President and Trustee Since 1991 | | President and Chief Investment Officer of Tocqueville Asset Management; Director, Tocqueville Management Corporation, the General Partner of Tocqueville Asset Management L.P. and Tocqueville Securities L.P. from January 1994 to present. | | | 5 | | | President and Director, Tocqueville Management Corporation, the General Partner of Tocqueville Asset Management L.P. and Tocqueville Securities L.P. |
| | | | | |
Stephan Yevak Year of Birth: 1959 | | Anti-Money Laundering Compliance Officer | | Indefinite Term, Since 2018 | | Deputy Chief Compliance Officer, Tocqueville Securities, L.P. from August 2011 to present; Deputy Chief Compliance Officer, Tocqueville Asset Management from August 2011 to present. Anti-Money Laundering Compliance Officer to both entities from March 2018 to present. | | | N/A | | | N/A |
| | | | | |
Cleo Kotis Year of Birth: 1975 | | Secretary | | Indefinite Term, Since 2010 | | Director of Operations, the Delafield Group of Tocqueville Asset Management L.P., 2009 to present. | | | N/A | | | N/A |
ADDITIONAL INFORMATION (UNAUDITED)
Interested Trustees(2) and Officers
| | | | | | | | | | |
Name and Age | | Position(s) Held
with the Trust | | Term of Office
and Length of
Time Served (1) | | Principal Occupation(s) During Past Five Years | | Number of Funds
in Fund Complex
Overseen By Trustee | | Other Directorships Held by Trustee |
| | | | | |
Thomas Pandick Year of Birth: 1947 | | Chief Compliance Officer | | Indefinite Term, Since 2004 | | Chief Compliance Officer (October 2004 –present) Tocqueville Asset Management L.P. | | N/A | | N/A |
| (1) | Each Trustee will hold office for an indefinite term until the earliest of (i) the next meeting of shareholders, if any, called for the purpose of considering the election or re-election of such Trustee and until the election and qualification of his or her successor, if any, elected at such meeting, or (ii) the date a Trustee resigns or retires, or a Trustee is removed by the Board of Trustees or shareholders, in accordance with the Trust’s By-Laws, as amended, and Agreement and Declaration of Trust, as amended. Each officer will hold office for an indefinite term until the date he or she resigns or retires or until his or her successor is elected and qualifies. |
| (2) | “Interested person” of the Trust as defined in the 1940 Act. Mr. Kleinschmidt is considered “interested person” because of his affiliation with the Advisor. |
The Statement of Additional Information includes additional information about the Trustees and is available free of charge by calling the Funds toll free at1-800-355-7307.
2. INVESTMENT ADVISORY AGREEMENT DISCLOSURE
In determining whether to approve the continuance of the Investment Advisory Agreements and the Administration Agreement, the Trustees, including the Independent Trustees, considered the following information:
1) The nature, extent and quality of services provided by the Adviser.
The Trustees reviewed in detail the nature and extent of the services provided by the Adviser under the terms of the Investment Advisory Agreements and the quality of those services provided to Funds over the past year. The Trustees noted that the services under the Investment Advisory Agreements include: managing the investment and reinvestment of the Funds’ assets; supervising and managing all aspects of the Funds’ operations; and providing the Board on a regular basis with financial reports and analyses on the Funds’ operations and the operations of comparable investment companies. The Trustees also observed that the Adviser provides various administrative services to the Funds pursuant to the terms of the Administration Agreement and considered the nature, extent and quality of services provided under that agreement as well. The Trustees evaluated these factors based on their direct experience with the Adviser and in consultation with counsel. The Trustees concluded that the nature and extent of the services provided under the Investment Advisory Agreements and the Administration Agreement were reasonable and appropriate in relation to the advisory fee and administration fee, respectively, that the level of services provided by the Adviser to the Funds had not diminished over the past year and that the quality of services continues to be high. The Trustees reviewed the personnel responsible for providing advisory and administrative services to the Funds and concluded, based on their experience and interaction with the Adviser, that (i) the Adviser was able to retain quality portfolio managers and other personnel; (ii) the Adviser exhibited a high level of diligence and attention to detail in carrying out its advisory and administrative responsibilities under the Investment Advisory Agreements and Administration Agreement, respectively, for the Funds; (iii) the Adviser was responsive to requests of the Trustees; and (iv) the Adviser had kept the Trustees apprised of developments relating to the Funds and the industry in general. The Trustees also focused on the Adviser’s reputation and long-standing relationship with the Trust.
In connection with its assessment of the performance of the Adviser, the Trustees reviewed the Adviser’s financial statements and considered the Adviser’s financial condition and whether it has the resources necessary to continue to carry out its obligations under the Investment Advisory Agreements and the Administration Agreement. The Trustees concluded that the Adviser has the financial resources necessary to continue to perform its obligations under the Investment Advisory Agreements and the Administration Agreement and to continue to provide the high quality services that it has provided to the Funds to date.
2) The performance of the Funds and the Adviser.
The Trustees reviewed the investment performance of the Funds, both on an absolute basis and as compared to a peer group for each respective Fund for the one-year, three-year, five-year and ten-year periods, ended July 31, 2019. The peer groups were comprised of other funds that had similar investment objectives and sales load structures, as determined by Morningstar: The Morningstar Large Blend Funds peer group, with total net assets between $230 million and $320 million, for The Tocqueville Fund; the Morningstar Mid-Cap Growth Funds peer group, with total net assets between $68 million and $144 million, for The Tocqueville Opportunity Fund; the Morningstar Precious Metals Funds peer group, with total net assets between $516 million and 1.6 billion for The Tocqueville Gold Fund Investor Class; the Morningstar Small Value Funds peer group, with total net assets between $102 million and $237 million, for The Tocqueville Phoenix Fund; and the Morningstar Small Value Funds peer group, with total net assets between $25 million and $83 million, for The Tocqueville Select Fund (the “Performance Peer Groups”).
The Trustees also compared each Fund’s investment performance against its benchmark market indices: the S&P 500 Index for The Tocqueville Fund; the Russell 2500 Growth Index for The Tocqueville Opportunity Fund; the S&P 500 Index and the Philadelphia Stock Exchange Gold & Silver Index for The Tocqueville Gold Fund; the S&P 500 Index and the Russell 2000 Index for The Tocqueville Phoenix Fund; the Russell 2500 Index and the Russell 2000 Index for The Tocqueville Select Fund (the “Indices”) for the one-year, three-year, five-year, and ten-year periods ended July 31, 2019 for all the Funds. The Trustees considered the above information as helpful in their assessment of whether the Adviser was obtaining for the Funds’ shareholders the performance that was available in the marketplace given each Fund’s investment objectives, policies, strategies, limitations and restrictions. The Trustees concluded that the performance of the Funds against their respective Performance Peer Groups was satisfactory. In particular, the Trustees noted that The Tocqueville Fund had underperformed as compared to its Index for all periods; outperformed the median of its Performance Peer Group for the one-year period; and underperformed the median of its Performance Peer Group for the three-year, five-year, and ten-year periods. The Trustees noted that The Tocqueville Opportunity Fund outperformed its Index for all periods and outperformed the median of its Performance Peer Group for all periods. The Trustees noted that The Tocqueville Gold Fund Investor Class outperformed both of its Indices in the one-year period; underperformed the S&P 500 Index for the three-year, five-year, and ten-year periods; outperformed the Philadelphia Stock Exchange Gold & Silver Index in the three-year and ten-year periods; underperformed the Philadelphia Stock Exchange Gold & Silver Index in the five-year period; underperformed the median of its Performance Peer Group for the one-year, three-year, and five-year periods; and outperformed the median of its Performance Peer Group for the ten-year periods. The Trustees noted that The Tocqueville Phoenix Fund underperformed both of its Indices for all periods; and underperformed the median of its Performance Peer Group for all
periods. The Trustees noted that The Tocqueville Select Fund underperformed both of its Indices for all periods; underperformed the median of its Performance Peer Group for the three-year, five-year, and ten-year periods; and outperformed the for the one-year period.
3) The cost of the advisory services and the profits to the Adviser from the relationship with the Trust.
In connection with the Trustee’s consideration of the level of the advisory fees, the Trustees considered a number of factors. The Trustees compared the level of the advisory fees for each Fund against the advisory fees charged by funds in a universe of funds: the Morningstar Large Blend Funds peer group, with average net assets between $230 million and $320 million, for The Tocqueville Fund; the Morningstar Mid-Cap Growth Funds peer group, with average net assets between $68 million and $144 million, for The Tocqueville Opportunity Fund; the Morningstar Precious Metals Funds peer group, with average net assets between $516 million and $1.6 billion, for The Tocqueville Gold Fund Investor Class; the Morningstar Precious Metals Funds peer group, with average net assets between $77 million and $1.6 billion, for The Tocqueville Gold Fund Institutional Class; the Morningstar Small Value Funds peer group, with average net assets between $102 million and $237 million, for The Tocqueville Phoenix Fund; and the Morningstar Small Value Funds peer group, with average net assets between $25 million and $83 million, for The Tocqueville Select Fund (the “Expense Peer Groups”). The Trustees considered comparative total fund expenses of the Funds and the Expense Peer Groups. The Trustees used this comparative fee information and total expense data as a guide to help assess the reasonableness of each Fund’s advisory fee, although they acknowledged that it was difficult to make precise comparisons with other funds since the exact nature of services provided under each Expense Peer Group fund agreement is often not apparent. The Trustees also viewed the Expense Peer Group fee information as a whole as useful in assessing whether the Adviser was providing services at a cost that was competitive with other, similar funds.
The Trustees noted that the contract rate advisory fee and administration fee for each of the Funds were reasonable, despite the contractual advisory fee rate being above average for The Tocqueville Fund, and The Tocqueville Gold Fund Investor Class, and The Tocqueville Gold Fund Institutional Class, and the administration fee being above average for The Tocqueville Fund, The Tocqueville Opportunity Fund, The Tocqueville Gold Fund Institutional Class, The Tocqueville Phoenix Fund, and The Tocqueville Select Fund when compared to their respective Expense Peer Groups. The Trustees also considered the combined contract rate advisory and administration fee as compared to their respective Expense Peer Group. The Board further observed that the total expense ratios of the Funds were also reasonable. The Board noted that the total expense ratio for The Tocqueville Fund, The Tocqueville Gold Fund Institutional Class, The Tocqueville Phoenix Fund, and The Tocqueville Select Fund was above average, when compared to their respective Expense Peer Groups and that the total expense ratios for The Tocqueville Opportunity Fund and The Tocqueville Gold Fund Investor Class were below average, when compared to their respective Expense Peer Groups. The Board also noted that the
Funds each operate pursuant to an Expense Limitation Agreement whereby the Adviser has agreed to waive a portion of its fee necessary to limit the Fund’s total operating expenses to the level set forth in the Fund’s prospectus.
The Trustees also considered the profitability to the Adviser and its affiliate arising out of its relationship with the Trust. In this regard, the Trustees reviewed profitability data relating to the Adviser for the 12 month period ended July 31, 2019. The Trustees considered revenues received by the Adviser under the Investment Advisory Agreements and the Administration Agreement as well as revenues received by the Adviser’s affiliate, the Distributor, under the 12b-1 plans and Related Agreements and commissions received for effecting portfolio transactions. The Trustees concluded that the profitability of the Funds to the Adviser was not excessive.
4) The extent to which economies of scale will be realized as the Funds grow and whether fee levels reflect those economies of scale.
With respect to the Trustees’ consideration of economies of scale, the Trustees discussed with the Adviser whether economies of scale would be realized by it in its management of a Fund at higher asset levels. The Trustees noted that all of the Funds, except for The Tocqueville Select Fund, currently have advisory fee breakpoints and that they were satisfied that the current breakpoints were appropriate when compared with each Fund’s respective Peer Group. The Trustees considered that breakpoints are not necessary at this time for The Tocqueville Select Fund, given the small size of The Tocqueville Select Fund. The Trustees also noted that the administration fee also has breakpoints. In the event there was significant asset growth in the future in a Fund, the Trustee’s determined to reassess whether the advisory fees and administration fee, including the current breakpoint structure, appropriately took into account any economies of scale that had been realized as a result of that growth.
5) Other Factors.
The Trustees also discussed the Adviser’s practices regarding the selection and compensation of brokers and dealers that execute portfolio transactions for the Funds and the brokers’ and dealers’ provision of brokerage and research services to the Adviser. The Trustees further discussed the potential benefits the Adviser derived from the Funds’ soft dollar arrangements, whereby brokers provide research to the Funds or the Adviser in return for allocating fund brokerage, and other investment data concerning soft dollars. The Board also discussed the Adviser’s use of an affiliated broker to effect portfolio transactions, noting that in addition to paying a competitive rate on commissions, the Adviser believed the Funds received better execution on trades.
Based on a consideration of all these factors in their totality, the Trustees, including all of the Independent Trustees, determined that the Funds’ advisory fees and administration fees were fair and reasonable with respect to the quality of services that the Adviser provides and in light of the other factors described above that the Trustees deemed relevant. The Trustees based their decision on evaluations of all these factors as a whole and did not consider any one factor as all-important or controlling.
3. PROXY VOTING POLICIES AND PROCEDURES
A description of the policies and procedures that The Tocqueville Trust uses to determine how to vote proxies relating to portfolio securities is available without charge upon request by calling1-800-355-7307. Information regarding how The Tocqueville Trust voted proxies relating to portfolio securities during the most recent 12-month period ended June 30 is available by calling 1-800-355-7307 and it is also available on the SEC’s web site athttp://www.sec.gov.
4. SHAREHOLDER REPORTS AND QUARTERLY PORTFOLIO DISCLOSURE
The Tocqueville Trust will file its complete schedule of portfolio holdings with the SEC for the first and third quarters of each fiscal year on Part F of Form N-PORT. The Fund’s Part F of Form N-PORT will be available on the EDGAR database on the SEC’s website at www.sec.gov. These Forms may also be reviewed and copied at the SEC’s Public Reference Room in Washington D.C. Information about the operation of the Public Reference Room may be obtained by calling 1-800-SEC-0330. Quarterly portfolio holdings are also available on the website of The Tocqueville Funds, www.tocquevillefunds.com.
5. SHAREHOLDER NOTIFICATION OF FEDERAL TAX STATUS
For the fiscal year ended October 31, 2019, certain dividends paid by the Funds may be subject to a maximum tax rate of 15%, as provided for by the Jobs and Growth Tax Relief Reconciliation Act of 2003. The percentage of dividends declared from ordinary income designated as qualified dividend income was as follows:
| | | | |
Tocqueville Fund | | | 100.00 | % |
Opportunity Fund | | | 0.00 | % |
Gold Fund | | | 0.00 | % |
Phoenix Fund | | | 0.00 | % |
Select Fund | | | 0.00 | % |
For corporate shareholders, the percent of ordinary income distributions qualifying for the corporate dividends received deduction for the fiscal year ended October 31, 2019 was as follows:
| | | | |
Tocqueville Fund | | | 100.00 | % |
Opportunity Fund | | | 0.00 | % |
Gold Fund | | | 0.00 | % |
Phoenix Fund | | | 0.00 | % |
Select Fund | | | 0.00 | % |
For the year ended October 31, 2019, the funds designate the following percent of ordinary distributions paid as interest-related dividends under the Internal Revenue Code Section 871(k)(1)(c):
| | | | |
Tocqueville Fund | | | 0.34 | % |
Opportunity Fund | | | 0.00 | % |
Gold Fund | | | 0.00 | % |
Phoenix Fund | | | 0.00 | % |
Select Fund | | | 0.00 | % |
The percentage of taxable ordinary income distributions that are designated as short-term capital gain distributions under Internal Revenue Section 871(k)(2)(C) for each Fund were as follows.
| | | | |
Tocqueville Fund | | | 0.00 | % |
Opportunity Fund | | | 0.00 | % |
Gold Fund | | | 0.00 | % |
Phoenix Fund | | | 8.60 | % |
Select Fund | | | 0.00 | % |
Investment Adviser
Tocqueville Asset Management L.P.
40 W. 57th St., 19th Floor
New York, NY 10019
(212) 698-0800
www.tocqueville.com
Distributor
Tocqueville Securities, L.P.
40 W. 57th St., 19th Floor
New York, NY 10019
(212) 698-0800
Shareholders’ Servicing and Transfer Agent
U.S. Bank Global Fund Services, LLC doing business as
U.S. Bank Global Fund Services
615 East Michigan Street
Milwaukee, WI 53202
Custodian
U.S. Bank, N.A.
Custody Operations
1555 River Center Drive, Suite 302
Milwaukee, WI 53212
Board of Trustees
Robert W. Kleinschmidt—Chairman
Charles W. Caulkins
Alexander Douglas
Charles F. Gauvin
James W. Gerard
William J. Nolan III
Independent Registered Public Accounting Firm
Grant Thornton LLP
171 North Clark St., Suite 200
Chicago, IL 60601
Tocqueville Funds
c/o US Bancorp Fund Services, LLC
P.O. Box 701
Milwaukee, WI 53201-0701
www.tocquevillefunds.com
TQ-ANNUAL Tocqueville Annual Report 10/31/2019
Item 2. Code of Ethics.
The registrant has adopted a code of ethics that applies to the registrant’s principal executive officer and principal financial officer. The registrant has not made any substantive amendments to its code of ethics during the period covered by this report. The registrant has not granted any waivers from any provisions of the code of ethics during the period covered by this report.
Incorporated by reference to the Registrant’s FormN-CSR filed December 30, 2015.
Item 3. Audit Committee Financial Expert.
The registrant’s board of trustees has determined that there is at least one audit committee financial expert serving on its audit committee. James Gerard and William Nolan III are the “audit committee financial experts” and are considered to be “independent” as each term is defined in Item 3 ofForm N-CSR.
Item 4. Principal Accountant Fees and Services.
The registrant has engaged its principal accountant to perform audit services, audit-related services, tax services and other services during the past two fiscal years. “Audit services” refer to performing an audit of the registrant’s annual financial statements or services that are normally provided by the accountant in connection with statutory and regulatory filings or engagements for those fiscal years. “Audit-related services” refer to the assurance and related services by the principal accountant that are reasonably related to the performance of the audit. “Tax services” refer to professional services rendered by the principal accountant for tax compliance, tax advice, and tax planning. “Other services” were not provided by the principal accountant. The following table details the aggregate fees billed or expected to be billed for each of the last two fiscal years for audit fees, audit-related fees, tax fees and other fees by the principal accountant.
| | | | | | | | |
| | | FYE 10/31/2019 | | | FYE 10/31/2018 | |
Audit Fees | | | 169,350 | | | | 191,100 | |
Audit-Related Fees | | | 0 | | | | 0 | |
Tax Fees | | | 27,000 | | | | 28,620 | |
All Other Fees | | | 0 | | | | 0 | |
The audit committee has adoptedpre-approval policies and procedures that require the audit committee topre-approve all audit andnon-audit services of the registrant, including services provided to any entity affiliated with the registrant.
The percentage of fees billed by Grant Thornton applicable tonon-audit services pursuant to waiver ofpre-approval requirement were as follows:
| | | | | | | | |
| | | FYE 10/31/2019 | | | FYE 10/31/2018 | |
Audit-Related Fees | | | 0 | % | | | 0 | % |
Tax Fees | | | 0 | % | | | 0 | % |
All Other Fees | | | 0 | % | | | 0 | % |
All of the principal accountant’s hours spent on auditing the registrant’s financial statements were attributed to work performed byfull-time permanent employees of the principal accountant.
The following table indicates thenon-audit fees billedor expected to be billed by the registrant’s accountant for services to the registrant and to the registrant’s investment adviser (and any other controlling entity, etc.—notsub-adviser) for the last two years. The audit committee of the board of trustees/directors has considered whether the provision ofnon-audit services that were rendered to the registrant’s investment adviser is compatible with maintaining the principal accountant’s independence and has concluded that the provision of suchnon-audit services by the accountant has not compromised the accountant’s independence.
| | | | | | | | |
Non-Audit Related Fees | | FYE 10/31/2019 | | | FYE 10/31/2018 | |
Registrant | | | 27,000 | | | | 28,620 | |
Registrant’s Investment Adviser | | | 0 | | | | 0 | |
Item 5. Audit Committee of Listed Registrants.
Not applicable to registrants who are not listed issuers (as defined in Rule10A-3 under the Securities Exchange Act of 1934).
Item 6. Investments.
Schedule of Investments is included as part of the report to shareholders filed under Item 1 of this Form.
Item 7. Disclosure of Proxy Voting Policies and Procedures forClosed-End Management Investment Companies.
Not applicable toopen-end investment companies.
Item 8. Portfolio Managers ofClosed-End Management Investment Companies.
Not applicable toopen-end investment companies.
Item 9. Purchases of Equity Securities byClosed-End Management Investment Company and Affiliated Purchasers.
Not applicable toopen-end investment companies.
Item 10. Submission of Matters to a Vote of Security Holders.
There have been no material changes to the procedures by which shareholders may recommend nominees to the registrant’s board of trustees.
Item 11. Controls and Procedures.
| (a) | The Registrant’s President and Treasurer have reviewed the Registrant’s disclosure controls and procedures (as defined inRule 30a-3(c) under the Investment Company Act of 1940 (the “Act”)) as of a date within 90 days of the filing of this report, as required by Rule30a-3(b) under the Act and Rules13a-15(b) or15d-15(b) under the Securities Exchange Act of 1934. Based on their review, such officers have concluded that the disclosure controls and procedures are effective in ensuring that information required to be disclosed in this report is appropriately recorded, processed, summarized and reported and made known to them by others within the Registrant and by the Registrant’s service provider. |
| (b) | There were no changes in the Registrant’s internal control over financial reporting (as defined in Rule30a-3(d) under the Act) that occurred during the period covered by this report that has materially affected, or is reasonably likely to materially affect, the Registrant’s internal control over financial reporting. |
Item 12. Disclosure of Securities Lending Activities forClosed-End Management Investment Companies
Not applicable toopen-end investment companies.
Item 13. Exhibits.
| (a) | (1) Any code of ethics or amendment thereto, that is the subject of the disclosure required by Item 2, to the extent that the registrant intends to satisfy Item 2 requirements through filing an exhibit. |
Incorporated by reference to the Registrant’s FormN-CSR filed December 30, 2015.
(2)A separate certification for each principal executive officer and principal financial officer pursuant to Section 302 of the Sarbanes-Oxley Act of 2002.Filed herewith.
(3)Any written solicitation to purchase securities under Rule 23c-1 under the Act sent or given during the period covered by the report by or on behalf of the registrant to 10 or more persons.Not applicable toopen-end investment companies.
(4)Change in the registrant’s independent public accountant.There was no change in the registrant’s independent public accountant for the period covered by this report.
| (b) | Certifications pursuant to Section 906 of the Sarbanes-Oxley Act of 2002. Furnished herewith. |
SIGNATURES
Pursuant to the requirements of the Securities Exchange Act of 1934 and the Investment Company Act of 1940, the registrant has duly caused this report to be signed on its behalf by the undersigned, thereunto duly authorized.
| | | | |
| (Registrant)The Tocqueville Trust | | |
| | |
| By (Signature and Title)* | | /s/ Robert W. Kleinschmidt | | |
| | Robert W. Kleinschmidt, President | | |
| |
| Date 12/27/2019 | | |
Pursuant to the requirements of the Securities Exchange Act of 1934 and the Investment Company Act of 1940, this report has been signed below by the following persons on behalf of the registrant and in the capacities and on the dates indicated.
| | | | |
| By (Signature and Title)* | | /s/ Robert W. Kleinschmidt | | |
| | Robert W. Kleinschmidt, President | | |
| | | | |
| | |
| By (Signature and Title)* | | /s/ Helen Balk | | |
| | Helen Balk, Treasurer | | |
| * | Print the name and title of each signing officer under his or her signature. |