This report is not authorized for distribution to prospective investors unless preceded or
accompanied by a currently effective prospectus of The Tocqueville Trust. Please call
1-800-697-FUND (3863) for a free prospectus. Read it carefully before you invest.
You are invited to visit our website @ www.tocquevillefunds.com
Chairman’s Letter
Dear Fellow Shareholder,
Having been away from the coop for so long that many, indeed, most, of the investing public had forgotten what they looked like, the chickens have started coming home to roost. And they appear to be settling in. Expect the clucking, already loud, to become deafening.
Massive and endless deficit spending, coupled with wanton monetary expansion, was bound to awaken the slumbering fowl of inflation, sooner or later. The wonder is that it took so long to rouse them from their perch. To make matters worse, the current government, elected by the slimmest of margins, to restore “normalcy,” is, instead, laboring mightily to transform the country into a European style welfare state (on steroids), with trillions of dollars in new and unfunded social programs, and trillions more for the climate boondoggle, which, regardless of whatever else it may accomplish, will have no meaningful impact on the climate.
The predictable rise in inflation to the highest level in thirty years is bad enough for those on fixed incomes or in jobs with wage gains stagnant or below the rate of inflation, it is also responsible for distorting capital markets and asset pricing, not to mention pushing people into higher tax brackets and subjecting purely nominal gains to capital gains taxes. But wait, it gets worse. If chickens wear shoes, they have one left to drop. The bond markets seem to be as oblivious to the dangers of an inflationary cycle as the media (and much of the culture) that has been mindlessly cheering on the government’s spending extravaganza and the Fed’s complicity. Rates remain stubbornly low and historically tiny. Real rates, after deducting for inflation, are negative up and down the yield curve. This is a situation that cannot last, and, since it cannot, it will not, particularly as the Fed’s purview is being increasingly expanded to include ESG (environment, sustainability and governance), DEI (diversity, equity and inclusion), and climate engagement. In case it went unnoticed, the Fed hasn’t exactly distinguished itself in tending to its two historical charges of price stability and full employment. However one may feel about the merit of these social goals, it is something of a reach to think that the Fed will do any better with its new responsibilities, which, most reasonable people would conclude, have next to nothing to do with monetary policy.
Annual Report | 1
Once rates do begin to rise to reflect the underlying inflationary pressures, budget chaos will follow, and there is little that the unfortunately politicized Fed can do to stop that, except for more of the same. To wit, continue to monetize the debt. So, it appears we are embarking on a long and self-reinforcing inflationary cycle. The decade old game of chicken is finally over, and the Fed seems to have lost. What to do about it, from an investment point of view, is what your fund managers will discuss, among other things, in the pages that follow.
Sincerely,

Robert W. Kleinschmidt
Chairman
2 | October 31, 2021
The Tocqueville Fund
Dear Fellow Shareholder,
The twelve months ended October 31, 2021, was a robust period for equity markets by all accounts. The release of COVID-19 vaccines back in November of 2020 fueled a continued rally that only hit a brief speed bump in September of 2021 when a host of factors seemed to weigh on investors. These included fear of inflation, hints of withdrawal of central bank stimulus, possibly weakening corporate earnings momentum, the ten year Treasury rate ticking higher, possible tax changes and the political game of chicken being played in Congress about the debt ceiling. These fears seemed to fall away as Halloween actually approached and the market began to discount the likelihood of major fiscal policy changes.
Underneath the steady upward march, was turmoil in the repeated rotations between growth oriented pandemic favorites and cyclical and rate sensitive names. These rotations tended to coincide with the waxing and waning of COVID outbreaks and the back and forth on investors’ perceptions of inflation being secular and caused by excessive liquidity and money printing by central banks or temporary, with observable price increases being caused by COVID induced supply chain disruptions around the globe.
That the U.S. generally did better than other markets during the period could be primarily attributed to policy decisions where the ECB and Japan had already slowed the pace of bond market interventions and China implemented a crackdown on market leading technology companies and is taking chances with the bursting of a long simmering real estate bubble while the U.S. has so far only played lip service to tapering (probably because Chairman Powell would rather have another term as the Chairman). Although there is some irony in that, when the markets recovered after the September swoon, it was probably due to COVID resurgence that suggested to investors that central banks might not be so quick to withdraw stimulus, particularly in Europe. That is sort of the behavior of an addict but worth noting that the Fed and ECB have somewhat differing mandates. The largest contributing sectors in the U.S. market were information technology, financials and healthcare while the weakest were utilities, materials and real estate. It is worth noting that the highest returning sector was energy by a wide margin, but it is now one of the smallest components of the benchmark.
The Fund’s net asset value gained 35.17% during the year compared to the S&P 500 Index which gained 42.91% and the Russell 1000 and 3000 Value indices which gained 43.76% and 44.97%, respectively. The strongest contributing sectors were information technology, industrials and financials, while the still positive laggards were real estate, utilities and consumer staples. The top performing individual names were Applied Materials, NVIDIA, Alphabet, Microsoft and Charles Schwab, while the detractors were Alibaba, Wheaton Precious Metals, Pan American Silver, Verizon and ACADIA Pharmaceuticals.
One new position during the period was Expedia, the online travel agency. Expedia is a business most directly impacted by the COVID-19 pandemic, with non-essential travel severely curtailed. As a result, there is considerable pent-up demand for travel that we believe bodes well for the near term. Being a capital light business, the company was able to navigate the difficult period without too much damage to its balance sheet. Moreover, we believe, its rapidly growing VRBO business, akin to the more well-known Air BnB, was not getting appropriate credit in the market.
Annual Report | 3
We also added Republic Services, a leader in the waste management business. Republic Services had underperformed and was out of favor with investors because it suffered an unexpectedly large loss of volumes due to the pandemic where the business had traditionally been perceived to be very defensive. Commercial customer closures caused the business to appear more cyclical in this crisis than in other downturns. Our view was that this was an opportunity to acquire a stable business with historical pricing power that would benefit from volume recovery, at an attractive discount.
Other positions that were initiated or added to included ACADIA Pharmaceuticals, Alibaba, Allegro Microsystems, Cameco, Chevron, Diamondback Energy, Dominion Energy, DOW, DuPont, Gilead, Mesabi Trust, Newmont Goldcorp, Organon, Rockwell Automation, South32 and Tejon Ranch.
A variety of positions were reduced or eliminated during the period due to changes in circumstances, prices reaching our targets or in response to investor requests for liquidity. These included ACADIA Pharmaceuticals, Alibaba, Allegro Microsystems, Amazon, Apple, Applied Materials, Biogen, Boeing, Cameco, Caterpillar, Coca Cola, Constellation Brands, DuPont, Expedia, Fidelity National Information Services, Gilead, Intel, Ionis, Johnson & Johnson, McDonald’s, Meta (Facebook), Microsoft, NextEra, NVIDIA, Organon, Procter & Gamble, Rockwell Automation, Viatris (received in a spinoff) and Walmart.
The primary market debate that still guides investor positioning is the prospect for higher rates and inflation. Companies have been reporting supply chain disruptions, port overcrowding, low inventory levels, higher raw material costs and difficulty finding enough workers. The media focuses on higher grocery prices and getting pinched at the gas pump, but none of these are “inflation” per se just a byproduct or symptom of it. Inflation is the sustained systemic increase in prices broadly across the economy caused by too much liquidity in the market. There has been enormous money printing by central banks globally with close to half of the entire supply of dollars printed in the past year. One might have expected with all that liquidity sloshing around that gold would be skyrocketing and the velocity of money would have increased, two traditional hallmarks of inflation. Instead, gold is virtually flat over the past year and the velocity of money has collapsed in the pandemic, leaving investors to continue to ponder. In the meantime, speculation in cryptocurrencies seems to have captured the imagination of those seeing evidence of sustained inflation and the equity markets appear to be pricing in the great inventory restocking, even as supply chain bottlenecks push that further into the future. While there are plenty of legitimate concerns, we continue to seek value where others are, perhaps, too fearful.
Sincerely,
| |  |
| Robert W. Kleinschmidt | Peter Shawn |
| Portfolio Manager | Director of Research |
4 | October 31, 2021
The Tocqueville Fund
(Unaudited)
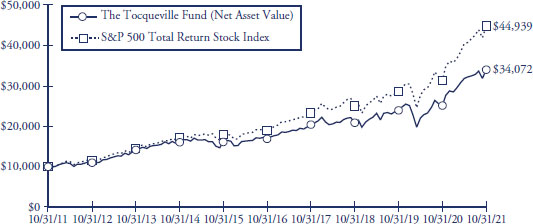
This chart assumes an initial gross investment of $10,000 made on 10/31/11. Returns shown do not reflect the deduction of taxes that a shareholder would pay on fund distributions or the redemption of fund shares. Performance reflects fee waivers in effect. In the absence of fee waivers, total return would be reduced. Returns shown include the reinvestment of all dividends and other distributions. Past performance is not predictive of future performance. Investment return and principal value will fluctuate so that your shares, when redeemed, may be worth more or less than their original cost.
The Standard & Poor’s 500 Total Return Stock Index (S&P 500) is a capital-weighted index, representing the aggregate market value of the common equity of 500 stocks primarily traded on the New York Stock Exchange. Returns assume the reinvestment of all dividends.
AVERAGE ANNUAL RATE OF RETURN (%)
FOR YEARS ENDED OCTOBER 31, 2021
| | 1 Year | 3 Year | 5 Year | 10 Year |
| The Tocqueville Fund | 35.17% | 17.72% | 15.00% | 13.04% |
| Standard & Poor’s 500 Total Return Stock Index | 42.91% | 21.48% | 18.93% | 16.21% |
Annual Report | 5
The Tocqueville Opportunity Fund
Dear Fellow Shareholder,
We are pleased to provide this investment overview for the 2021 fiscal year for the Tocqueville Opportunity Fund (“Fund”). During the fiscal year ended on October 31st, 2021, the Fund’s net asset value appreciated 32.60% while the SMID cap growth benchmark, the Russell 2500 Growth Index, appreciated 37.12%.
Since the last update, the unexpected announcement and rapid deployment of a COVID-19 vaccine has caused the U.S. economy to recover faster than expected. While we welcome this positive development, the unprecedented pent-up demand from consumers has outstripped available supply from companies who mothballed capacity during the pandemic. This has caused various bottlenecks in the supply chain, as materials and labor force that were once plentiful are now in severe shortage. We believe these dynamics are temporary as the amount of stimulus will not be repeated in 2022, and the high prices being experienced by consumers will create some demand destruction. On the supply side, companies should be able to add capacity over the next year to satisfy demand.
Despite our view of these temporary headwinds, investors are increasingly concerned about inflation and the knock-on effects that inflation causes. The 10-year Treasury Bond has roughly doubled over the past 12 months causing more cyclical sectors such as financials and industrials to outperform long duration cash flow stories in the Information Technology sector. While the worst of the pandemic appears to be behind us, COVID-19 has accelerated certain secular themes the Fund has been invested in, namely E-commerce and cloud computing. Shopify, one of the funds top holdings, has been a primary beneficiary of the shift from traditional brick and mortar to omni-channel solutions. Shopify enables merchants to quickly and seamlessly setup an online store within hours. In addition to a website, Shopify helps merchants fulfill orders, manage inventory, direct marketing spend, and facilitate payments among other services. It is our belief that this trend toward E-commerce will only become more important as the world returns to some semblance of normalcy and Shopify’s value proposition sets it up for years of rapid growth. Another theme that has come to the forefront during this pandemic has been the need for businesses to accelerate their digital transformation to the cloud. With more employees working from home or in a hybrid model, businesses are needing to rapidly invest to ensure their network is accessible, efficient, and secure. This has created demand for all sorts of software solutions related to the cloud such as workflow management, cyber security, and payroll processing just to name a few. The Fund’s investments in Service Now, Okta, and Paylocity are emblematic of these trends and are seeing accelerating demand for its products as a result. We continue to be long term believers in these companies as they offer an attractive pay back to its users while delivering shareholders superior growth and strong recurring revenues with little to no churn.
6 | October 31, 2021
Investments in Healthcare, Materials, and Consumer Staples provided the leading contributions on a relative basis versus the benchmark. The Information-technology sector was the leading driver of relative underperformance versus the benchmark. Looking at individual securities, Shopify, ServiceNow, Paylocity, Dexcom, and Paycom Software were the top-five contributors to performance while detractions from performance included Coupa Software, Iovance Biotherapeutics, Splunk, Skillz, and Invitae Corp.
The Fund’s allocation to its top 10 and 50 positions at the end of the fiscal period totaled 52% and 90%, respectively. The Fund’s active share relative to its benchmark continues to be high, ranging from a low of 82% to a high of 92% during the past 12 months.
As always, we sincerely appreciate your continued support.
Sincerely,

Paul Lambert
Portfolio Manager
Annual Report | 7
The Tocqueville Opportunity Fund
(Unaudited)
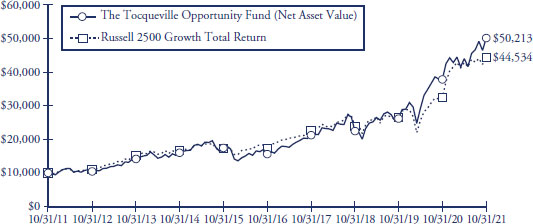
This chart assumes an initial gross investment of $10,000 made on 10/31/11. Returns shown do not reflect the deduction of taxes that a shareholder would pay on fund distributions or the redemption of fund shares. Returns shown include the reinvestment of all dividends and other distributions. Past performance is not predictive of future performance. Investment return and principal value will fluctuate so that your shares, when redeemed, may be worth more or less than their original cost.
The Russell 2500 Growth Total Return Index is an unmanaged index that measures the performance of the small to mid-cap growth segment of the U.S. equity universe. It includes those Russell 2500 companies with higher price-to-book ratios and higher forecasted growth values. Returns assume the reinvestment of all dividends.
AVERAGE ANNUAL RATE OF RETURN (%)
FOR YEARS ENDED OCTOBER 31, 2021
| | 1 Year | 3 Year | 5 Year | 10 Year |
| The Tocqueville Opportunity Fund | 32.60% | 30.79% | 26.31% | 17.51% |
| Russell 2500 Growth Total Return Index | 37.12% | 23.10% | 20.68% | 16.11% |
8 | October 31, 2021
The Tocqueville Phoenix Fund
Dear Fellow Shareholder,
For the fiscal year ended October 31, 2021, the Tocqueville Phoenix Fund’s (“Fund”) net asset value increased 52.80%, versus an increase of 64.30% for the Russell 2000 Value Index, and an increase of 50.80% for the Russell 2000 Index, each on a total return basis.
Fiscal and monetary stimulus, removal of many COVID-19 restrictions, and successful distribution of COVID-19 vaccinations helped the U.S. economy recover during the fiscal year. Small capitalization stocks benefited the most, and experienced outstanding gains due to their increased exposure to an improving domestic economy. The Fund’s holdings generally reported positive results throughout the year, and we are optimistic about their prospects for calendar year 2022.
The U.S. government’s strategy to counter the economic impact of COVID-19 has been extraordinary. In early March, President Biden signed a $1.9 trillion stimulus bill named “The American Rescue Plan”. This comes on top of the $900 billion package that was signed in December 2020, and the $2 trillion CARES Act that was signed by President Trump at the height of the pandemic last year. All-in, there will likely be over $5 trillion of fiscal stimulus to help the U.S. economy recover from its near total shutdown in 2020. In addition, it appears likely that President Biden has the bipartisan support necessary to pass a much-needed Infrastructure Bill that is estimated to contribute an additional $1 trillion to fiscal spending. The result of such aggressive fiscal policy, accompanied with expansionary monetary policy, has been a financial system awash with liquidity, that has undoubtedly caused record prices for nearly all asset classes and the largest annual increase in consumer prices in the last 30 years.
The rapid recovery produced by such dramatic government intervention, along with lingering COVID-19 travel restrictions have caused inventory and staffing shortages, longer lead times and record high shipping costs for products imported into the United States. Container freight rates from Shanghai to Los Angeles are five times higher than anytime over the previous ten years, and lead times for basic semiconductor components used in automobiles have increased from an average of ten to forty weeks. A resolution to these issues will likely take some time; however, we anticipate that as COVID-19 variants subside, production should return to more historical levels and demand will ultimately be the determinant of economic activity.
The Fund ended the fiscal year with 92% of the portfolio invested in equities and held 41 positions. The top ten positions accounted for 36% of the portfolio, while the average position size was slightly over 2% and had a market capitalization of $4.3 billion. We added seven new positions to the portfolio during the fiscal year while exiting ten. The largest new additions were AMS AG, Comtech Telecommunications Corp and BGSF Inc. AMS, through the acquisition of Osram, is positioning itself to be an essential supplier in the growing fields of autonomous driving and display technology; Comtech is poised for significant growth as low earth orbit satellites are launched from the likes of Amazon and states and municipalities upgrade 911 systems to accept picture and video text messages; while BGSF is a temporary staffing company that should benefit substantially from the removal of COVID-19 eviction moratoriums. Of the ten stocks that were sold, four were acquired by financial and strategic acquirors at significant premiums to their current trading prices, while the remaining six were disposed of to provide capital for other opportunities.
Annual Report | 9
We believe, the companies that we own are financially sound and have specific catalysts to improve their fortunes in all economic environments. In calendar year 2021, approximately 55% of the Fund holdings will generate higher earnings per share than they did in the year prior to the COVID-19 pandemic, and we expect earnings growth of approximately 30% for the portfolio in calendar year 2022. The price to forward earnings multiple of the portfolio is a modest 13 times and the free cash flow yield is approximately 8%. In addition, we are encouraged that insiders have purchased shares in over 40% of the portfolio companies within the past 12 months, and approximately 15% of the portfolio has either activist involvement and/or has commenced a strategic review process to enhance shareholder value.
We hope you are safe and with very best wishes.
Sincerely,
 |  |
| James Maxwell | Michael Sellecchia |
| Portfolio Manager | Portfolio Manager |
10 | October 31, 2021
The Tocqueville Phoenix Fund
(Unaudited)

This chart assumes an initial gross investment of $10,000 made on 10/31/11. On February 15, 2019, The Delafield Fund’s name changed to The Tocqueville Phoenix Fund. Returns shown do not reflect the deduction of taxes that a shareholder would pay on fund distributions or the redemption of fund shares. Performance reflects fee waivers in effect. In the absence of fee waivers, total return would be reduced. Returns shown include the reinvestment of all dividends and other distributions. Past performance is not predictive of future performance. Investment return and principal value will fluctuate so that your shares, when redeemed, may be worth more or less than their original cost.
The Russell 2000 Value Total Return Index measures performance of the small cap value segment of the U.S. equity universe. Securities are categorized as growth or value based on their relative book-to-price ratios, historical sales growth, and expected earnings growth. Returns include the reinvestment of all dividends.
The Russell 2000 Total Return Index is an unmanaged index that measures the performance of the 2,000 smallest companies in the Russell 3000 Index, which represent approximately 10% of the total market capitalization of the Russell 3000 Index. Returns include the reinvestment of all dividends.
AVERAGE ANNUAL RATE OF RETURN (%)
FOR YEARS ENDED OCTOBER 31, 2021
| | 1 Year | 3 Year | 5 Year | 10 Year |
| The Tocqueville Phoenix Fund*(a) | 52.80% | 13.65% | 9.32% | 7.73% |
| Russell 2000 Value Total Return Index | 64.30% | 13.44% | 12.61% | 12.12% |
| Russell 2000 Total Return Index | 50.80% | 16.47% | 15.52% | 13.50% |
| * | Prior to February 15, 2019, the Fund’s name was The Delafield Fund. |
| (a) | On November 15, 2019, The Tocqueville Phoenix Fund acquired all the net assets of The Tocqueville Select Fund. |
Annual Report | 11
Expense Example—October 31, 2021 (Unaudited)
As a shareholder of The Tocqueville Trust (the “Funds”), you incur ongoing costs, including management fees; distribution fees; and other Fund expenses. This example is intended to help you understand your ongoing costs (in dollars) of investing in the Funds and to compare costs with the ongoing costs of investing in other mutual funds.
The Example is based on an investment of $1,000 invested at the beginning of the period and held the entire period (May 1, 2021-October 31, 2021).
Actual Expenses
The first line of the table below provides information about actual account values and actual expenses. You may use the information in this line, together with the amount you invested, to estimate the expenses that you paid over the period. Simply divide your account value by $1,000 (for example, an $8,600 account value divided by $1,000 = 8.6), then multiply the result by the number in the first line under the heading entitled “Expenses Paid During Period” to estimate the expenses you paid on your account during this period.
Hypothetical Example for Comparison Purposes
The second line of the table below provides information about hypothetical account values and hypothetical expenses based on the Funds’ actual expense ratios and an assumed rate of return of 5% per year before expenses, which is not the Funds’ actual return. The hypothetical account values and expenses may not be used to estimate the actual ending account balance or expenses you paid for the period. You may use this information to compare the ongoing costs of investing in the Funds and other funds. To do so, compare this 5% hypothetical example with the 5% hypothetical examples that appear in the shareholder reports of the other funds.
Please note that the expenses shown in the table are meant to highlight your ongoing costs only and do not reflect any transactional costs, such as sales charges (loads), redemption fees, or exchange fees. Therefore, the second line of the table is useful in comparing ongoing costs only, and will not help you determine the relative costs of owning different funds. In addition, if these transactional costs were included, your costs would have been higher.
12 | October 31, 2021
Expense Example Tables (Unaudited)
The Tocqueville Fund
| | | | | | | Expenses Paid |
| | | Beginning | | Ending | | During Period* |
| | | Account Value | | Account Value | | May 1, 2021- |
| | | May 1, 2021 | | October 31, 2021 | | October 31, 2021 |
| Actual | | $ | 1,000.00 | | | $ | 1,068.40 | | | $ | 6.52 | |
| Hypothetical (5% return before expenses) | | | 1,000.00 | | | | 1,018.90 | | | | 6.36 | |
| * | Expenses are equal to the Fund’s annualized six-month expense ratio (including interest expense) of 1.25% for The Tocqueville Fund, multiplied by the average account value over the period, multiplied by 184/365 to reflect the one-half year period. |
The Tocqueville Opportunity Fund
| | | | | | | Expenses Paid |
| | | Beginning | | Ending | | During Period* |
| | | Account Value | | Account Value | | May 1, 2021- |
| | | May 1, 2021 | | October 31, 2021 | | October 31, 2021 |
| Actual | | $ | 1,000.00 | | | $ | 1,139.90 | | | $ | 6.80 | |
| Hypothetical (5% return before expenses) | | | 1,000.00 | | | | 1,018.85 | | | | 6.41 | |
| * | Expenses are equal to the Fund’s annualized six-month expense ratio (including interest expense) of 1.26% for The Tocqueville Opportunity Fund, multiplied by the average account value over the period, multiplied by 184/365 to reflect the one-half year period. |
The Tocqueville Phoenix Fund
| | | | | | | Expenses Paid |
| | | Beginning | | Ending | | During Period* |
| | | Account Value | | Account Value | | May 1, 2021- |
| | | May 1, 2021 | | October 31, 2021 | | October 31, 2021 |
| Actual | | $ | 1,000.00 | | | $ | 1,018.40 | | | $ | 6.36 | |
| Hypothetical (5% return before expenses) | | | 1,000.00 | | | | 1,018.90 | | | | 6.36 | |
| * | Expenses are equal to the Fund’s annualized six-month expense ratio (including interest expense) of 1.25% for The Tocqueville Phoenix Fund, multiplied by the average account value over the period, multiplied by 184/365 to reflect the one-half year period. |
Annual Report | 13
The Tocqueville Fund
Financial Highlights
| Per share operating performance | | Years Ended October 31, | |
| (For a share outstanding throughout the year) | | 2021 | | | 2020 | | | 2019 | | | 2018 | | | 2017 | |
| | | | | | | | | | | | | | | | |
| Net asset value, beginning of year | | $ | 37.03 | | | $ | 37.80 | | | $ | 35.84 | | | $ | 38.60 | | | $ | 33.72 | |
| Operations: | | | | | | | | | | | | | | | | | | | | |
| Net investment income (1) | | | 0.25 | | | | 0.31 | | | | 0.43 | | | | 0.35 | | | | 0.37 | |
| Net realized and unrealized gain | | | 12.49 | | | | 1.58 | | | | 4.46 | | | | 0.45 | | | | 6.40 | |
| Total from investment operations | | | 12.74 | | | | 1.89 | | | | 4.89 | | | | 0.80 | | | | 6.77 | |
| Distributions to shareholders: | | | | | | | | | | | | | | | | | | | | |
| Dividends from net investment income | | | (0.25 | ) | | | (0.37 | ) | | | (0.34 | ) | | | (0.33 | ) | | | (0.39 | ) |
| Distributions from net realized gains | | | (1.13 | ) | | | (2.29 | ) | | | (2.59 | ) | | | (3.23 | ) | | | (1.50 | ) |
| Total distributions | | | (1.38 | ) | | | (2.66 | ) | | | (2.93 | ) | | | (3.56 | ) | | | (1.89 | ) |
| Change in net asset value for the year | | | 11.36 | | | | (0.77 | ) | | | 1.96 | | | | (2.76 | ) | | | 4.88 | |
| Net asset value, end of year | | $ | 48.39 | | | $ | 37.03 | | | $ | 37.80 | | | $ | 35.84 | | | $ | 38.60 | |
| Total Return | | | 35.2 | % | | | 5.0 | % | | | 14.9 | % | | | 2.0 | % | | | 20.9 | % |
| Ratios/supplemental data | | | | | | | | | | | | | | | | | | | | |
| Net assets, end of year (000) | | $ | 313,739 | | | $ | 251,096 | | | $ | 285,070 | | | $ | 272,043 | | | $ | 293,637 | |
| Ratio to average net assets: | | | | | | | | | | | | | | | | | | | | |
| Expenses before waiver | | | 1.34 | % | | | 1.38 | % | | | 1.30 | % | | | 1.26 | % | | | 1.27 | % |
| Expenses after waiver | | | 1.25 | % | | | 1.25 | % | | | 1.25 | %(2) | | | 1.25 | % | | | 1.26 | %(2) |
| Net investment income before waiver | | | 0.46 | % | | | 0.69 | % | | | 1.11 | % | | | 0.91 | % | | | 0.97 | % |
| Net investment income after waiver | | | 0.55 | % | | | 0.82 | % | | | 1.16 | % | | | 0.92 | % | | | 0.98 | % |
| Portfolio turnover rate | | | 11 | % | | | 9 | % | | | 13 | % | | | 19 | % | | | 10 | % |
| (1) | Net investment income per share is calculated using the ending balance prior to consideration or adjustment for permanent book-to-tax differences. |
| (2) | Includes 0.01% of interest expense which is not included in the Fund’s operating expense cap. |
The Accompanying Notes are an Integral Part of these Financial Statements.
14 | October 31, 2021
The Tocqueville Opportunity Fund
Financial Highlights
| Per share operating performance | | Years Ended October 31, | |
| (For a share outstanding throughout the year) | | 2021 | | | 2020 | | | 2019 | | | 2018 | | | 2017 | |
| | | | | | | | | | | | | | | | |
| Net asset value, beginning of year | | $ | 38.34 | | | $ | 28.11 | | | $ | 26.60 | | | $ | 26.12 | | | $ | 19.14 | |
| Operations: | | | | | | | | | | | | | | | | | | | | |
| Net investment loss (1) | | | (0.53 | ) | | | (0.40 | ) | | | (0.29 | ) | | | (0.29 | ) | | | (0.37 | ) |
| Net realized and unrealized gain | | | 12.76 | | | | 12.29 | | | | 4.29 | | | | 1.63 | | | | 7.35 | |
| Total from investment operations | | | 12.23 | | | | 11.89 | | | | 4.00 | | | | 1.34 | | | | 6.98 | |
| Distributions to shareholders: | | | | | | | | | | | | | | | | | | | | |
| Dividends from net investment income | | | — | | | | — | | | | — | | | | — | | | | — | |
| Distributions from net realized gains | | | (1.52 | ) | | | (1.66 | ) | | | (2.49 | ) | | | (0.86 | ) | | | — | |
| Total distributions | | | (1.52 | ) | | | (1.66 | ) | | | (2.49 | ) | | | (0.86 | ) | | | — | |
| Change in net asset value for the year | | | 10.71 | | | | 10.23 | | | | 1.51 | | | | 0.48 | | | | 6.98 | |
| Net asset value, end of year | | $ | 49.05 | | | $ | 38.34 | | | $ | 28.11 | | | $ | 26.60 | | | $ | 26.12 | |
| Total Return | | | 32.6 | % | | | 44.3 | % | | | 16.9 | % | | | 5.3 | % | | | 36.5 | % |
| Ratios/supplemental data | | | | | | | | | | | | | | | | | | | | |
| Net assets, end of year (000) | | $ | 111,189 | | | $ | 91,147 | | | $ | 84,583 | | | $ | 82,106 | | | $ | 77,773 | |
| Ratio to average net assets: | | | | | | | | | | | | | | | | | | | | |
| Expenses before waiver | | | 1.40 | % | | | 1.49 | % | | | 1.41 | % | | | 1.33 | % | | | 1.38 | % |
| Expenses after waiver | | | 1.26 | %(2) | | | 1.26 | %(2) | | | 1.28 | %(2) | | | 1.26 | %(2) | | | 1.30 | %(2)(3) |
| Net investment income before waiver | | | (1.28 | )% | | | (1.18 | )% | | | (1.10 | )% | | | (1.13 | )% | | | (1.05 | )% |
| Net investment income after waiver | | | (1.13 | )% | | | (0.95 | )% | | | (0.97 | )% | | | (1.06 | )% | | | (0.97 | )%(3) |
| Portfolio turnover rate | | | 20 | % | | | 30 | % | | | 133 | % | | | 151 | % | | | 133 | % |
| (1) | Net investment loss per share is calculated using the ending balance prior to consideration or adjustment for permanent book-to-tax differences. |
| (2) | Includes interest expense of 0.01% for the year ended October 31, 2021, 0.01% for the year ended October 31, 2020, 0.03% for the year ended October 31, 2019, 0.01% for the year ended October 31, 2018, and 0.05% for the year ended October 31, 2017. Interest expense is not included in the Fund’s operating expense cap. |
| (3) | Expense waiver of 1.25% was implemented on November 1, 2016. |
The Accompanying Notes are an Integral Part of these Financial Statements.
Annual Report | 15
The Tocqueville Phoenix Fund
Financial Highlights
| Per share operating performance | | Years Ended October 31, | |
| (For a share outstanding throughout the year) | | 2021 | | | 2020 | | | 2019 | | | 2018 | | | 2017 | |
| | | | | | | | | | | | | | | | |
| Net asset value, beginning of year | | $ | 17.67 | | | $ | 19.98 | | | $ | 20.20 | | | $ | 26.40 | | | $ | 26.47 | |
| Operations: | | | | | | | | | | | | | | | | | | | | |
| Net investment loss (1) | | | (0.16 | ) | | | (0.03 | ) | | | (0.03 | ) | | | (0.14 | ) | | | (0.15 | ) |
| Net realized and unrealized gain (loss) | | | 9.40 | | | | (1.81 | ) | | | 1.16 | | | | (2.27 | ) | | | 4.91 | |
| Total from investment operations | | | 9.24 | | | | (1.84 | ) | | | 1.13 | | | | (2.41 | ) | | | 4.76 | |
| Distributions to shareholders: | | | | | | | | | | | | | | | | | | | | |
| Dividends from net investment income | | | — | | | | — | | | | — | (2) | | | — | | | | — | |
| Distributions from net realized gains | | | (0.38 | ) | | | (0.47 | ) | | | (1.35 | ) | | | (3.79 | ) | | | (4.83 | ) |
| Total distributions | | | (0.38 | ) | | | (0.47 | ) | | | (1.35 | ) | | | (3.79 | ) | | | (4.83 | ) |
| Change in net asset value for the year | | | 8.86 | | | | (2.31 | ) | | | (0.22 | ) | | | (6.20 | ) | | | (0.07 | ) |
| Net asset value, end of year | | $ | 26.53 | | | $ | 17.67 | | | $ | 19.98 | | | $ | 20.20 | | | $ | 26.40 | |
| Total Return | | | 52.8 | % | | | (9.5 | )% | | | 6.2 | % | | | (10.6 | )% | | | 19.0 | % |
| Ratios/supplemental data | | | | | | | | | | | | | | | | | | | | |
| Net assets, end of year (000) | | $ | 177,082 | | | $ | 131,658 | | | $ | 160,433 | | | $ | 237,119 | | | $ | 373,353 | |
| Ratio to average net assets: | | | | | | | | | | | | | | | | | | | | |
| Expenses before waiver | | | 1.43 | % | | | 1.50 | % | | | 1.39 | % | | | 1.32 | % | | | 1.31 | % |
| Expenses after waiver | | | 1.25 | % | | | 1.25 | % | | | 1.25 | % | | | 1.25 | % | | | 1.25 | %(3) |
| Net investment income before waiver | | | (0.78 | )% | | | (0.41 | )% | | | (0.24 | )% | | | (0.55 | )% | | | (0.55 | )% |
| Net investment income after waiver/reimbursement | | | (0.60 | )% | | | (0.16 | )% | | | (0.10 | )% | | | (0.48 | )% | | | (0.49 | )%(3) |
| Portfolio turnover rate | | | 21 | % | | | 24 | % | | | 40 | % | | | 40 | % | | | 36 | % |
| (1) | Net investment loss per share is calculated using the ending balance prior to consideration or adjustment for permanent book-to-tax differences. |
| (2) | Represents less than $0.01. |
| (3) | Expense waiver of 1.25% was implemented on November 1, 2016. |
The Accompanying Notes are an Integral Part of these Financial Statements.
16 | October 31, 2021
The Tocqueville Fund
Schedule of Investments as of October 31, 2021
| Common Stocks—97.8% | | Shares | | | Value | |
| Banks—1.8% | | | | | | | | |
| Bank of America Corp. | | | 120,000 | | | $ | 5,733,600 | |
| Capital Goods—6.7% | | | | | | | | |
| Caterpillar, Inc. | | | 20,000 | | | | 4,080,200 | |
| Deere & Co. | | | 20,000 | | | | 6,846,200 | |
| Illinois Tool Works, Inc. | | | 25,000 | | | | 5,696,750 | |
| Parker-Hannifin Corp. | | | 15,000 | | | | 4,448,850 | |
| | | | | | | | 21,072,000 | |
| Commercial & Professional Services—2.5% |
| Republic Services, Inc. | | | 40,000 | | | | 5,384,000 | |
| Steelcase, Inc.—Class A | | | 200,000 | | | | 2,380,000 | |
| | | | | | | | 7,764,000 | |
| Consumer Services—3.3% | | | | | | | | |
| Expedia Group, Inc.(a) | | | 25,000 | | | | 4,110,250 | |
| McDonald’s Corp. | | | 25,000 | | | | 6,138,750 | |
| | | | | | | | 10,249,000 | |
| Diversified Financials—3.5% | | | | | | | | |
| Berkshire Hathaway, Inc.(a) | | | 10,000 | | | | 2,870,100 | |
| The Charles Schwab Corp. | | | 100,000 | | | | 8,203,000 | |
| | | | | | | | 11,073,100 | |
| Energy—3.0% | | | | | | | | |
| Cameco Corp.—ADR(b) | | | 25,000 | | | | 607,500 | |
| Chevron Corp. | | | 40,000 | | | | 4,579,600 | |
| Diamondback Energy, Inc. | | | 40,000 | | | | 4,287,600 | |
| | | | | | | | 9,474,700 | |
| Food & Staples Retailing—2.1% | | | | | | | | |
| Walmart, Inc. | | | 45,000 | | | | 6,723,900 | |
| Food, Beverage & Tobacco—2.7% | | | | | | | | |
| Constellation Brands, Inc.—Class A | | | 7,500 | | | | 1,626,075 | |
| The Coca-Cola Co. | | | 120,000 | | | | 6,764,400 | |
| | | | | | | | 8,390,475 | |
| Health Care Equipment & Services—2.1% |
| Abbott Laboratories | | | 50,000 | | | | 6,444,500 | |
| Household & Personal Products—4.7% | | | | | | | | |
| Colgate-Palmolive Co. | | | 100,000 | | | | 7,619,000 | |
| The Procter & Gamble Co. | | | 50,000 | | | | 7,149,500 | |
| | | | | | | | 14,768,500 | |
| Insurance—1.7% | | | | | | | | |
| Aflac, Inc. | | | 100,000 | | | | 5,367,000 | |
| Common Stocks—97.8% | | Shares | | | Value | |
| Materials—11.5% | | | | | | | | |
| BHP Group Ltd.—ADR(b) | | | 50,000 | | | $ | 2,742,000 | |
| Dow, Inc. | | | 40,000 | | | | 2,238,800 | |
| DuPont de Nemours, Inc. | | | 25,000 | | | | 1,740,000 | |
| Freeport-McMoRan, Inc. | | | 100,000 | | | | 3,772,000 | |
| Mesabi Trust | | | 10,000 | | | | 220,300 | |
| Newmont Mining Corp. | | | 10,000 | | | | 540,000 | |
| Nutrien Ltd.(b) | | | 50,000 | | | | 3,495,500 | |
| Pan American Silver Corp.—ADR(b) | | | 100,000 | | | | 2,561,000 | |
| Sibanye Stillwater Ltd.—ADR(b) | | | 100,000 | | | | 1,420,000 | |
| Sonoco Products Co. | | | 75,000 | | | | 4,346,250 | |
| South32 Ltd.—ADR(b) | | | 100,000 | | | | 1,350,000 | |
| Vulcan Materials Co. | | | 40,000 | | | | 7,604,800 | |
| Wheaton Precious Metals Corp.—ADR(b) | | | 100,000 | | | | 4,041,000 | |
| | | | | | | | 36,071,650 | |
| Media & Entertainment—8.4% | | | | | | | | |
| Alphabet, Inc.—Class A(a) | | | 5,000 | | | | 14,804,600 | |
| Meta Platforms, Inc.—Class A(a) | | | 10,000 | | | | 3,235,700 | |
| The Walt Disney Co.(a) | | | 50,000 | | | | 8,453,500 | |
| | | | | | | | 26,493,800 | |
| Pharmaceuticals, Biotechnology & Life Sciences—7.2% | | | | | | | | |
| Gilead Sciences, Inc. | | | 25,000 | | | | 1,622,000 | |
| Johnson & Johnson | | | 20,000 | | | | 3,257,600 | |
| Merck & Co., Inc. | | | 100,000 | | | | 8,805,000 | |
| Pfizer, Inc. | | | 200,000 | | | | 8,748,000 | |
| | | | | | | | 22,432,600 | |
| Real Estate—0.1% | | | | | | | | |
| Tejon Ranch Co.(a) | | | 25,000 | | | | 455,250 | |
| Retailing—6.1% | | | | | | | | |
| Alibaba Group Holding Ltd.—ADR—ADR(a)(b) | | | 7,500 | | | | 1,237,050 | |
| Amazon.com, Inc.(a) | | | 3,000 | | | | 10,117,290 | |
| eBay, Inc. | | | 100,000 | | | | 7,672,000 | |
| | | | | | | | 19,026,340 | |
| Semiconductors & Semiconductor Equipment—11.0% | | | | | | | | |
| Applied Materials, Inc. | | | 75,000 | | | | 10,248,750 | |
| Intel Corp. | | | 99,000 | | | | 4,851,000 | |
The Accompanying Notes are an Integral Part of these Financial Statements.
Annual Report | 17
The Tocqueville Fund
Schedule of Investments as of October 31, 2021
| Common Stocks—97.8% | | Shares | | | Value | |
| NVIDIA Corp. | | | 50,000 | | | $ | 12,783,500 | |
| QUALCOMM, Inc. | | | 50,000 | | | | 6,652,000 | |
| | | | | | | | 34,535,250 | |
| Software & Services—7.6% | | | | | | | | |
| Automatic Data Processing, Inc. | | | 40,000 | | | | 8,979,600 | |
| Microsoft Corp. | | | 45,000 | | | | 14,922,900 | |
| | | | | | | | 23,902,500 | |
| Technology Hardware & Equipment—3.6% |
| Apple, Inc. | | | 75,000 | | | | 11,235,000 | |
| Telecommunication Services—1.7% | | | | | | | | |
| Verizon Communications, Inc. | | | 100,000 | | | | 5,299,000 | |
| Transportation—1.2% | | | | | | | | |
| Delta Air Lines, Inc.(a) | | | 100,000 | | | | 3,913,000 | |
| Utilities—5.3% | | | | | | | | |
| Dominion Energy, Inc. | | | 50,000 | | | | 3,796,500 | |
| NextEra Energy, Inc. | | | 150,000 | | | | 12,799,500 | |
| | | | | | | | 16,596,000 | |
| Total Common Stocks | | | | | | | | |
| (Cost $115,143,507) | | | | | | | 307,021,165 | |
| Real Estate Investment Trust (REIT)—2.3% |
| Real Estate—2.3% | | | | | | | | |
| Weyerhaeuser Co. | | | 200,000 | | | | 7,144,000 | |
| Total Real Estate Investment Trust | | | | | | | | |
| (Cost $3,868,091) | | | | | | | 7,144,000 | |
| Short-Term Investment—0.0% | | Shares | | | Value | |
| Money Market Fund—0.0% | | | | | | | | |
| STIT Treasury Portfolio—Institutional Class, 0.010%(c) | | | 557 | | | $ | 557 | |
| Total Short-Term Investment | | | | | | | | |
| (Cost $557) | | | | | | | 557 | |
| Total Investments | | | | | | | | |
| (Cost $119,012,155)—100.1% | | | | | | | 314,165,722 | |
| Liabilities in Excess of Other Assets—(0.1%) | | | | | | | (426,223 | ) |
| Total Net Assets—100.0% | | | | | | $ | 313,739,499 | |
Percentages are stated as a percent of net assets.
ADR American Depositary Receipt
| (a) | Non-income producing security. |
| (b) | Foreign issued Security. Foreign Concentration (including ADR’s) was as follows: Australia 1.3%; Canada 3.4%; Cayman Islands 0.4%; South Africa 0.5%. |
| (c) | Rate listed is the 7-day effective yield. |
The Global Industry Classification Standard (GICS®) was developed by and/or is the exclusive property of MSCI, Inc. and Standard & Poor Financial Services LLC (“S&P”). GICS is a service mark of MSCI and S&P and has been licensed for use by U.S. Bank Global Fund Services.
The Accompanying Notes are an Integral Part of these Financial Statements.
18 | October 31, 2021
The Tocqueville Opportunity Fund
Schedule of Investments as of October 31, 2021
| Common Stocks—100.3% | | Shares | | | Value | |
| Capital Goods—4.7% | | | | | | |
| Advanced Drainage Systems, Inc. | | | 2,500 | | | $ | 282,000 | |
| Array Technologies, Inc.(a) | | | 15,000 | | | | 320,250 | |
| Dover Corp. | | | 2,000 | | | | 338,160 | |
| HEICO Corp. | | | 3,843 | | | | 535,676 | |
| Hubbell, Inc. | | | 2,500 | | | | 498,425 | |
| IDEX Corp. | | | 2,500 | | | | 556,425 | |
| Masco Corp. | | | 6,000 | | | | 393,300 | |
| Nordson Corp. | | | 2,000 | | | | 508,420 | |
| nVent Electric PLC ADR(a)(b) | | | 10,000 | | | | 354,500 | |
| Simpson Manufacturing Co, Inc. | | | 2,500 | | | | 265,225 | |
| SiteOne Landscape Supply, Inc.(a) | | | 2,500 | | | | 587,400 | |
| Trex Co., Inc.(a) | | | 5,000 | | | | 532,000 | |
| | | | | | | | 5,171,781 | |
| Commercial & Professional Services—6.4% | | | | | | | | |
| Booz Allen Hamilton Holding Corp. | | | 6,500 | | | | 564,590 | |
| Cintas Corp. | | | 3,000 | | | | 1,299,300 | |
| Copart, Inc.(a) | | | 7,000 | | | | 1,087,030 | |
| CoStar Group, Inc.(a) | | | 10,000 | | | | 860,500 | |
| Exponent, Inc. | | | 5,000 | | | | 574,000 | |
| TransUnion | | | 8,500 | | | | 979,965 | |
| Verisk Analytics, Inc. | | | 4,000 | | | | 841,080 | |
| Waste Connections, Inc.—ADR(a)(b) | | | 7,000 | | | | 952,070 | |
| | | | | | | | 7,158,535 | |
| Consumer Durables & Apparel—0.6% | | | | | | | | |
| TopBuild Corp.(a) | | | 1,500 | | | | 385,455 | |
| YETI Holdings, Inc.(a) | | | 2,500 | | | | 245,825 | |
| | | | | | | | 631,280 | |
| Consumer Services—0.7% | | | | | | | | |
| Bright Horizons Family Solutions, Inc.(a) | | | 3,500 | | | | 581,000 | |
| DraftKings, Inc.(a) | | | 5,000 | | | | 232,950 | |
| Restaurant Brands International LP | | | 37 | | | | 2,089 | |
| | | | | | | | 816,039 | |
| Diversified Financials—4.3% | | | | | | | | |
| Coinbase Global, Inc.—Class A(a) | | | 1,700 | | | | 543,014 | |
| Common Stocks—100.3% | | Shares | | | Value | |
| LPL Financial Holdings, Inc. | | | 2,500 | | | $ | 410,050 | |
| MarketAxess Holdings, Inc. | | | 1,250 | | | | 510,838 | |
| MSCI, Inc. | | | 2,000 | | | | 1,329,760 | |
| S&P Global, Inc. | | | 2,500 | | | | 1,185,400 | |
| Tradeweb Markets, Inc.—Class A | | | 9,000 | | | | 801,900 | |
| | | | | | | | 4,780,962 | |
| Health Care Equipment & Services—10.5% |
| DexCom, Inc.(a) | | | 7,000 | | | | 4,362,470 | |
| IDEXX Laboratories, Inc.(a) | | | 2,800 | | | | 1,865,192 | |
| Insulet Corp.(a) | | | 5,600 | | | | 1,736,112 | |
| Intuitive Surgical, Inc.(a) | | | 1,950 | | | | 704,204 | |
| Masimo Corp.(a) | | | 1,500 | | | | 425,310 | |
| STAAR Surgical Co.(a) | | | 2,000 | | | | 236,920 | |
| Tandem Diabetes Care, Inc.(a) | | | 4,500 | | | | 613,485 | |
| Veeva Systems, Inc.—Class A(a) | | | 5,500 | | | | 1,743,555 | |
| | | | | | | | 11,687,248 | |
| Materials—0.3% | | | | | | | | |
| Ranpak Holdings Corp.(a) | | | 10,000 | | | | 344,600 | |
| Media & Entertainment—2.1% | | | | | | | | |
| Cardlytics, Inc.(a) | | | 2,000 | | | | 157,320 | |
| fuboTV, Inc.(a) | | | 15,000 | | | | 447,150 | |
| IAC/InterActiveCorp(a) | | | 3,800 | | | | 579,006 | |
| Magnite, Inc.(a) | | | 10,000 | | | | 270,300 | |
| Roku, Inc.(a) | | | 2,000 | | | | 609,800 | |
| Vimeo, Inc.(a) | | | 7,110 | | | | 239,820 | |
| | | | | | | | 2,303,396 | |
| Pharmaceuticals, Biotechnology & Life Sciences—6.0% | | | | | | | | |
| Acceleron Pharma, Inc.(a) | | | 2,000 | | | | 348,360 | |
| Avantor, Inc.(a) | | | 12,000 | | | | 484,560 | |
| Bio-Techne Corp. | | | 1,200 | | | | 628,380 | |
| Charles River Laboratories International, Inc.(a) | | | 2,400 | | | | 1,076,832 | |
| Elanco Animal Health, Inc.(a) | | | 10,000 | | | | 328,800 | |
| Genmab A/S(a)(b) | | | 3,000 | | | | 1,344,522 | |
| Iovance Biotherapeutics, Inc.(a) | | | 50,000 | | | | 1,215,500 | |
| Mirati Therapeutics, Inc.(a) | | | 2,000 | | | | 378,040 | |
| Neurocrine Biosciences, Inc.(a) | | | 4,000 | | | | 421,640 | |
| Seagen, Inc.(a) | | | 2,500 | | | | 440,825 | |
| | | | | | | | 6,667,459 | |
The Accompanying Notes are an Integral Part of these Financial Statements.
Annual Report | 19
The Tocqueville Opportunity Fund
Schedule of Investments as of October 31, 2021
| Common Stocks—100.3% | | Shares | | | Value | |
| Retailing—2.9% | | | | | | | | |
| Floor & Decor Holdings, Inc.—Class A(a) | | | 3,000 | | | $ | 407,760 | |
| Pool Corp. | | | 2,750 | | | | 1,416,690 | |
| RH(a) | | | 2,150 | | | | 1,418,205 | |
| | | | | | | | 3,242,655 | |
| Software & Services—61.2% | | | | | | | | |
| ANSYS, Inc.(a) | | | 1,500 | | | | 569,370 | |
| Aspen Technology, Inc.(a) | | | 2,000 | | | | 313,380 | |
| Atlassian Corp. PLC—Class A—ADR(a)(b) | | | 3,500 | | | | 1,603,455 | |
| Avalara, Inc.(a) | | | 7,000 | | | | 1,257,480 | |
| Cadence Design Systems, Inc.(a) | | | 5,000 | | | | 865,550 | |
| Coupa Software, Inc.(a) | | | 13,000 | | | | 2,960,100 | |
| EPAM Systems, Inc.(a) | | | 2,000 | | | | 1,346,480 | |
| Fair Isaac Corp.(a) | | | 1,500 | | | | 597,300 | |
| Fiserv, Inc.(a) | | | 7,625 | | | | 750,986 | |
| Fortinet, Inc.(a) | | | 4,500 | | | | 1,513,530 | |
| Global Payments, Inc. | | | 12,531 | | | | 1,791,808 | |
| Marqeta, Inc. Class—A(a) | | | 15,000 | | | | 459,000 | |
| MongoDB, Inc.(a) | | | 2,500 | | | | 1,303,225 | |
| Okta, Inc.(a) | | | 21,000 | | | | 5,190,780 | |
| Paycom Software, Inc.(a) | | | 9,800 | | | | 5,368,930 | |
| Paylocity Holding Corp.(a) | | | 22,500 | | | | 6,865,650 | |
| ServiceNow, Inc.(a) | | | 17,000 | | | | 11,861,920 | |
| Shopify, Inc.—Class A—ADR(a)(b) | | | 8,150 | | | | 11,953,849 | |
| TaskUS, Inc.—Class A(a) | | | 8,000 | | | | 463,200 | |
| Toast, Inc. Class—A(a) | | | 5,000 | | | | 266,100 | |
| Twilio, Inc.—Class A(a) | | | 9,500 | | | | 2,767,920 | |
| Tyler Technologies, Inc.(a) | | | 1,000 | | | | 543,220 | |
| Unity Software, Inc.(a) | | | 6,000 | | | | 907,860 | |
| Workday, Inc.—Class A(a) | | | 17,000 | | | | 4,929,660 | |
| Zendesk, Inc.(a) | | | 16,000 | | | | 1,628,800 | |
| | | | | | | | 68,079,553 | |
| Common Stocks—100.3% | | Shares | | | Value | |
| Transportation—0.6% | | | | | | | | |
| Saia, Inc.(a) | | | 1,950 | | | $ | 609,648 | |
| Total Common Stocks | | | | | | | | |
| (Cost $34,511,114) | | | | | | | 111,493,156 | |
| Short-Term Investment—0.0% | | | | | | | | |
| Money Market Fund—0.0% | | | | | | | | |
| STIT-Treasury Portfolio—Institutional Class, 0.010%(c) | | | 314 | | | | 314 | |
| Total Short-Term Investment | | | | | | | | |
| (Cost $314) | | | | | | | 314 | |
| Total Investments | | | | | | | | |
| (Cost $34,511,428)—100.3% | | | | | | | 111,493,470 | |
| Liabilities in Excess of Other Assets—(0.3)% | | | | | | | (304,134 | ) |
| Total Net Assets—100.0% | | | | | | $ | 111,189,336 | |
Percentages are stated as a percent of net assets.
ADR American Depositary Receipt
(a) Non-income producing security.
(b) Foreign issued Security. Foreign Concentration (including ADR’s) was as follows: Canada 11.6%; Denmark 1.2%; Ireland 0.3%; United Kingdom 1.4%.
(c) Rate listed is the 7-day effective yield.
The Accompanying Notes are an Integral Part of these Financial Statements.
20 | October 31, 2021
The Tocqueville Phoenix Fund
Schedule of Investments as of October 31, 2021
| Common Stocks—92.2% | | Shares | | | Value | |
| Auto Components—3.9% | | | | | | |
| Lear Corp. | | | 15,000 | | | $ | 2,577,750 | |
| Modine Manufacturing Co.(a) | | | 70,000 | | | | 770,000 | |
| Visteon Corp.(a) | | | 31,000 | | | | 3,508,580 | |
| | | | | | | | 6,856,330 | |
| Building Products—3.2% | | | | | | | | |
| Apogee Enterprises, Inc. | | | 135,000 | | | | 5,660,550 | |
| Chemicals—8.9% | | | | | | | | |
| Avient Corp. | | | 85,000 | | | | 4,579,800 | |
| HB Fuller Co. | | | 32,000 | | | | 2,256,320 | |
| Innospec, Inc. | | | 29,000 | | | | 2,627,690 | |
| Orion Engineered Carbons SA—ADR(a)(b) | | | 340,000 | | | | 6,392,000 | |
| | | | | | | | 15,855,810 | |
| Commercial Services & Supplies—5.2% | | | | | | | | |
| ABM Industries, Inc. | | | 105,000 | | | | 4,621,050 | |
| Harsco Corp.(a) | | | 270,000 | | | | 4,617,000 | |
| | | | | | | | 9,238,050 | |
| Communications Equipment—6.2% | | | | | | | | |
| Comtech Telecommunications Corp. | | | 190,435 | | | | 4,107,683 | |
| Lumentum Holdings, Inc.(a) | | | 83,000 | | | | 6,854,140 | |
| | | | | | | | 10,961,823 | |
| Electrical Equipment—3.4% | | | | | | | | |
| Acuity Brands, Inc. | | | 29,000 | | | | 5,957,470 | |
| Electronic Equipment, Instruments & Components—15.5% | | | | | | | | |
| Fabrinet—ADR(a)(b) | | | 62,100 | | | | 5,961,600 | |
| Flex Ltd.—ADR(a)(b) | | | 415,000 | | | | 7,013,500 | |
| II-VI, Inc.(a) | | | 35,000 | | | | 2,117,850 | |
| Knowles Corp.(a) | | | 85,000 | | | | 1,771,400 | |
| Plexus Corp.(a) | | | 60,000 | | | | 5,239,200 | |
| TTM Technologies, Inc.(a) | | | 400,000 | | | | 5,296,000 | |
| | | | | | | | 27,399,550 | |
| Food Products—2.7% | | | | | | | | |
| Farmer Brothers Co.(a) | | | 240,000 | | | | 1,812,000 | |
| Landec Corp.(a) | | | 298,700 | | | | 2,903,364 | |
| | | | | | | | 4,715,364 | |
| Common Stocks—92.2% | | Shares | | | Value | |
| Health Care Equipment & Supplies—2.1% |
| Inogen, Inc.(a) | | | 35,000 | | | $ | 1,387,750 | |
| Lantheus Holdings, Inc.(a) | | | 100,000 | | | | 2,339,000 | |
| | | | | | | | 3,726,750 | |
| Health Care Providers & Services—2.1% | | | | | | | | |
| Cross Country Healthcare, Inc.(a) | | | 182,000 | | | | 3,772,860 | |
| Household Durables—2.7% | | | | | | | | |
| Mohawk Industries, Inc.(a) | | | 19,700 | | | | 3,491,037 | |
| Newell Brands, Inc. | | | 55,000 | | | | 1,258,950 | |
| | | | | | | | 4,749,987 | |
| Interactive Media & Services—2.7% | | | | | | | | |
| Cars.com, Inc.(a) | | | 363,500 | | | | 4,732,770 | |
| IT Services—5.2% | | | | | | | | |
| DXC Technology Co.(a) | | | 124,000 | | | | 4,038,680 | |
| Unisys Corp.(a) | | | 204,598 | | | | 5,231,571 | |
| | | | | | | | 9,270,251 | |
| Machinery—9.4% | | | | | | | | |
| Crane Co. | | | 57,500 | | | | 5,938,600 | |
| Mayville Engineering Co., Inc.(a) | | | 281,311 | | | | 4,996,083 | |
| REV Group, Inc. | | | 75,000 | | | | 1,133,250 | |
| Stanley Black & Decker, Inc. | | | 26,000 | | | | 4,672,980 | |
| | | | | | | | 16,740,913 | |
| Media—4.0% | | | | | | | | |
| TEGNA, Inc. | | | 361,000 | | | | 7,097,260 | |
| Pharmaceuticals—1.7% | | | | | | | | |
| Phibro Animal Health Corp.—Class A | | | 140,000 | | | | 3,071,600 | |
| Professional Services—2.5% | | | | | | | | |
| BGSF, Inc. | | | 300,000 | | | | 3,609,000 | |
| Mistras Group, Inc.(a) | | | 80,000 | | | | 785,600 | |
| | | | | | | | 4,394,600 | |
| Semiconductors & Semiconductor Equipment—3.3% | | | | | | | | |
| ams AG(a)(b) | | | 300,000 | | | | 5,927,261 | |
| Textiles, Apparel & Luxury Goods—3.3% | | | | | | | | |
| PVH Corp.(a) | | | 53,000 | | | | 5,794,490 | |
The Accompanying Notes are an Integral Part of these Financial Statements.
Annual Report | 21
The Tocqueville Phoenix Fund
Schedule of Investments as of October 31, 2021
| Common Stocks—92.2% | | Shares | | | Value | |
| Trading Companies & Distributors—2.6% |
| Rush Enterprises, Inc.—Class A | | | 88,000 | | | $ | 4,583,040 | |
| Wireless Telecommunication Services—1.6% |
| Spok Holdings, Inc. | | | 280,000 | | | | 2,881,200 | |
| Total Common Stocks | | | | | | | | |
| (Cost $113,462,487) | | | | | | | 163,387,929 | |
| Short-Term Investment—5.0% | | | | | | | | |
| Money Market Fund—5.0% | | | | | | | | |
| STIT-Treasury Portfolio—Institutional Class, 0.010%(c) | | | 8,800,000 | | | | 8,800,000 | |
| Total Short-Term Investment | | | | | | | | |
| (Cost $8,800,000) | | | | | | | 8,800,000 | |
| Total Investments | | | | | | | | |
| (Cost $122,262,487)—97.2% | | | | | | | 172,187,929 | |
| Other Assets in Excess of Liabilities—2.8% | | | | | | | 4,894,376 | |
| Total Net Assets—100.0% | | | | | | $ | 177,082,305 | |
Percentages are stated as a percent of net assets.
ADR American Depositary Receipt
(a) Non-income producing security.
(b) Foreign issued Security. Foreign Concentration (including ADR’s) was as follows: Austria 3.3%; Cayman Islands 3.4%; Luxembourg 3.6%; Singapore 4.0%.
(c) Rate listed is the 7-day effective yield.
The Accompanying Notes are an Integral Part of these Financial Statements.
22 | October 31, 2021
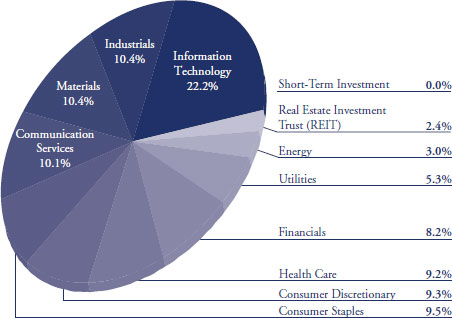
Percent of Total Investments (Unaudited)
The Tocqueville Fund
Allocation of Portfolio Holdings
October 31, 2021
The Tocqueville Opportunity Fund
Allocation of Portfolio Holdings
October 31, 2021

Annual Report | 23
Percent of Total Investments (Unaudited)
The Tocqueville Phoenix Fund
Allocation of Portfolio Holdings
October 31, 2021

24 | October 31, 2021
The Tocqueville Trust
Statements of Assets and Liabilities
October 31, 2021
| | The
Tocqueville
Fund | | | The
Tocqueville
Opportunity
Fund | | | The
Tocqueville
Phoenix
Fund | |
Assets: | | | | | | | | | | | | |
Investments, at value (1) | | $ | 314,165,722 | | | $ | 111,493,470 | | | $ | 172,187,929 | |
Cash and cash equivalents | | | — | | | | — | | | | 5,103,546 | |
Receivable for investments sold | | | 790,229 | | | | — | | | | — | |
Receivable for Fund shares sold | | | 2,431 | | | | 38,574 | | | | 1,851 | |
Dividends, interest and other receivables | | | 248,135 | | | | 1,751 | | | | 69,840 | |
Other assets | | | 21,513 | | | | 16,564 | | | | 12,655 | |
Total Assets | | | 315,228,030 | | | | 111,550,359 | | | | 177,375,821 | |
Liabilities: | | | | | | | | | | | | |
Payable for loans outstanding | | | 983,000 | | | | 157,000 | | | | — | |
Payable for Fund shares redeemed | | | 99,581 | | | | 50,131 | | | | 69,240 | |
Payable to Adviser | | | 209,476 | | | | 73,299 | | | | 108,143 | |
Payable to Administrator | | | 48,534 | | | | 16,971 | | | | 20,660 | |
Payable to Trustees | | | 25,846 | | | | 9,538 | | | | 14,532 | |
Accrued distribution fee | | | 51,895 | | | | 15,395 | | | | 20,859 | |
Accrued expenses and other liabilities | | | 70,199 | | | | 38,689 | | | | 60,082 | |
Total Liabilities | | | 1,488,531 | | | | 361,023 | | | | 293,516 | |
Net Assets | | $ | 313,739,499 | | | $ | 111,189,336 | | | $ | 177,082,305 | |
| | | | | | | | | | | | |
Net assets consist of: | | | | | | | | | | | | |
Paid in capital | | $ | 86,584,201 | | | $ | 28,350,631 | | | $ | 109,349,216 | |
Total distributable earnings | | | 227,155,298 | | | | 82,838,705 | | | | 67,733,089 | |
Net assets | | $ | 313,739,499 | | | $ | 111,189,336 | | | $ | 177,082,305 | |
| | | | | | | | | | | | |
Shares of beneficial interest outstanding (unlimited shares | | | | | | | | | | | | |
of $0.01 par value authorized) | | | 6,483,619 | | | | 2,266,984 | | | | 6,675,096 | |
Net asset value, offering and redemption price per share | | $ | 48.39 | | | $ | 49.05 | | | $ | 26.53 | |
| | | | | | | | | | | | |
(1) Cost of investments | | $ | 119,012,155 | | | $ | 34,511,428 | | | $ | 122,262,487 | |
The Accompanying Notes are an Integral Part of these Financial Statements.
Annual Report | 25
The Tocqueville Trust
Statements of Operations
For the Year Ended October 31, 2021
| | The
Tocqueville
Fund | | | The
Tocqueville
Opportunity
Fund | | | The
Tocqueville
Phoenix
Fund | |
Investment Income: | | | | | | | | | | | | |
Dividends* | | $ | 5,295,756 | | | $ | 127,951 | | | $ | 1,130,514 | |
Interest | | | 94 | | | | 20 | | | | 880 | |
Total investment income | | | 5,295,850 | | | | 127,971 | | | | 1,131,394 | |
Expenses: | | | | | | | | | | | | |
Investment Adviser’s fee (See Note 4) | | | 2,207,037 | | | | 771,393 | | | | 1,385,961 | |
Distribution (12b-1) fees (See Note 4) | | | 735,679 | | | | 257,130 | | | | 433,113 | |
Administration fees (See Note 4) | | | 441,407 | | | | 154,279 | | | | 259,868 | |
Legal fees | | | 137,269 | | | | 54,576 | | | | 80,863 | |
Transfer agent and shareholder services fees | | | 96,882 | | | | 45,800 | | | | 91,968 | |
Trustee fees and expenses | | | 87,129 | | | | 30,805 | | | | 50,800 | |
Other expenses | | | 57,715 | | | | 32,977 | | | | 39,945 | |
Fund accounting fees | | | 51,849 | | | | 20,596 | | | | 29,821 | |
Printing and mailing expense | | | 35,274 | | | | 14,614 | | | | 38,045 | |
Audit fees | | | 34,874 | | | | 4,508 | | | | 11,524 | |
Blue sky fees | | | 25,323 | | | | 24,106 | | | | 26,433 | |
Insurance expense | | | 23,814 | | | | 8,388 | | | | 14,058 | |
Custody fees | | | 15,052 | | | | 12,621 | | | | 13,580 | |
Registration fees | | | 4,059 | | | | 2,659 | | | | 3,139 | |
Interest expense | | | 1,434 | | | | 7,711 | | | | — | |
Total expenses before waiver | | | 3,954,797 | | | | 1,442,163 | | | | 2,479,118 | |
Less: Fees waived (See Note 4) | | | (273,697 | ) | | | (148,797 | ) | | | (313,553 | ) |
Net expenses | | | 3,681,100 | | | | 1,293,366 | | | | 2,165,565 | |
Net Investment Income (Loss) | | | 1,614,750 | | | | (1,165,395 | ) | | | (1,034,171 | ) |
Realized and Unrealized Gain (Loss): | | | | | | | | | | | | |
Net realized gain (loss) on: | | | | | | | | | | | | |
Investments | | | 32,413,869 | | | | 8,977,264 | | | | 20,184,152 | |
Foreign currency translation | | | — | | | | (389 | ) | | | 4,848 | |
Purchased options | | | — | | | | (179,344 | ) | | | — | |
| | | 32,413,869 | | | | 8,797,531 | | | | 20,189,000 | |
Net change in unrealized appreciation on: Investments | | | 51,257,914 | | | | 20,759,746 | | | | 47,541,402 | |
| | | 51,257,914 | | | | 20,759,746 | | | | 47,541,402 | |
Net gain on investments and foreign currency | | | 83,671,783 | | | | 29,557,277 | | | | 67,730,402 | |
Net Increase in Net Assets Resulting from Operations | | $ | 85,286,533 | | | $ | 28,391,882 | | | $ | 66,696,231 | |
* Net of foreign taxes withheld of: | | $ | 51,207 | | | $ | 1,058 | | | $ | — | |
The Accompanying Notes are an Integral Part of these Financial Statements.
26 | October 31, 2021
The Tocqueville Trust
Statements of Changes in Net Assets
| | The Tocqueville Fund | | | The Tocqueville
Opportunity Fund
| | | The Tocqueville
Phoenix Fund
| |
| | For the
Year Ended
October 31,
2021 | | | For the
Year Ended
October 31,
2020 | | | For the
Year Ended
October 31,
2021 | | | For the
Year Ended
October 31,
2020 | | | For the
Year Ended
October 31,
2021 | | | For the
Year Ended
October 31,
2020 | |
Operations: | | | | | | | | | | | | | | | | | | | | | | | | |
Net investment income (loss) | | $ | 1,614,750 | | | $ | 2,140,752 | | | $ | (1,165,395 | ) | | $ | (798,233 | ) | | $ | (1,034,171 | ) | | $ | (230,473 | ) |
Net realized gain on investments and foreign currency | | | 32,413,869 | | | | 9,207,859 | | | | 8,976,875 | | | | 4,435,871 | | | | 20,189,000 | | | | 3,324,516 | |
Net realized gain on written options | | | — | | | | — | | | | — | | | | 602,485 | | | | — | | | | — | |
Net realized loss on purchased options | | | — | | | | — | | | | (179,344 | ) | | | — | | | | — | | | | — | |
Net change in unrealized appreciation (depreciation) | | | 51,257,914 | | | | (841,853 | ) | | | 20,759,746 | | | | 27,115,889 | | | | 47,541,402 | | | | (23,588,188 | ) |
Net change in unrealized appreciation on written options | | | — | | | | — | | | | — | | | | 40,806 | | | | — | | | | — | |
Net increase (decrease) in net assets resulting
from operations | | | 85,286,533 | | | | 10,506,758 | | | | 28,391,882 | | | | 31,396,818 | | | | 66,696,231 | | | | (20,494,145 | ) |
Total dividends and distributions | | | (9,233,776 | ) | | | (20,004,394 | ) | | | (3,607,856 | ) | | | (4,684,120 | ) | | | (2,758,109 | ) | | | (3,732,986 | ) |
Fund share transactions: | | | | | | | | | | | | | | | | | | | | | | | | |
Proceed from merger (see Note 8) | | | — | | | | — | | | | — | | | | — | | | | — | | | | 33,427,094 | |
Shares sold | | | 7,070,997 | | | | 3,714,741 | | | | 10,665,735 | | | | 19,679,061 | | | | 7,574,788 | | | | 4,772,451 | |
Shares issued to holders in reinvestment of dividends | | | 8,758,558 | | | | 19,015,810 | | | | 3,539,900 | | | | 4,449,601 | | | | 2,688,871 | | | | 3,437,712 | |
Shares redeemed | | | (29,239,052 | ) | | | (47,206,946 | ) | | | (18,947,317 | ) | | | (44,276,906 | ) | | | (28,777,744 | ) | | | (46,184,545 | ) |
Net decrease | | | (13,409,497 | ) | | | (24,476,395 | ) | | | (4,741,682 | ) | | | (20,148,244 | ) | | | (18,514,085 | ) | | | (4,547,288 | ) |
Net increase (decrease) in net assets | | | 62,643,260 | | | | (33,974,031 | ) | | | 20,042,344 | | | | 6,564,454 | | | | 45,424,037 | | | | (28,774,419 | ) |
Net Assets: | | | | | | | | | | | | | | | | | | | | | | | | |
Beginning of year | | | 251,096,239 | | | | 285,070,270 | | | | 91,146,992 | | | | 84,582,538 | | | | 131,658,268 | | | | 160,432,687 | |
End of year | | $ | 313,739,499 | | | $ | 251,096,239 | | | $ | 111,189,336 | | | $ | 91,146,992 | | | $ | 177,082,305 | | | $ | 131,658,268 | |
*Net of redemption fees of: | | $ | — | | | $ | — | | | $ | — | | | $ | — | | | $ | — | | | $ | — | |
The Accompanying Notes are an Integral Part of these Financial Statements.
Annual Report | 27
The Tocqueville Trust
Notes to Financial Statements
The Tocqueville Trust (the “Trust”) is a Massachusetts business trust registered under the Investment Company Act of 1940 and organized on September 17, 1986, consisting of three separate funds (each, a “Fund” or, collectively, the “Funds”). Each Fund is an open-end management investment company with a different investment objective. The Tocqueville Fund, The Tocqueville Opportunity Fund (the “Opportunity Fund”), and The Tocqueville Phoenix Fund are each classified as diversified investment companies. The Tocqueville Fund’s investment objective is long-term capital appreciation which it seeks to achieve by investing primarily in securities of United States issuers. The Opportunity Fund’s investment objective is to achieve long-term capital appreciation which it seeks to achieve by investing in the common stocks of small and mid-cap companies which have the potential to deliver superior long term earnings growth. The Tocqueville Phoenix Fund’s investment objectives are to seek long-term preservation of capital (sufficient growth to outpace inflation over an extended period of time) and growth of capital which it seeks to achieve by investing primarily in common stocks of small and mid-cap value companies that the portfolio managers consider to be undervalued, generate strong free cash flow, have shareholder friendly management teams and possess a catalyst for improved financial performance.
The Tocqueville Phoenix Fund (formerly known as The Delafield Fund), a series of the Trust, commenced operations on September 28, 2009 as successor to Delafield Fund, Inc. The predecessor Delafield Fund, Inc. commenced operations on November 19, 1993. The Delafield Fund changed its name to The Tocqueville Phoenix Fund on February 15, 2019. On November 15, 2019, The Tocqueville Phoenix Fund acquired all the net assets of The Tocqueville Select Fund.
2. | SIGNIFICANT ACCOUNTING POLICIES |
The following is a summary of significant accounting policies consistently followed by the Portfolios in the preparation of their financial statements. These policies are in conformity with accounting principles generally accepted in the United States of America (“U.S. GAAP”). The Funds follow accounting and reporting guidance under Financial Accounting Standards Board (“FASB”) Accounting Standards Codification Topic 946, “Financial Services – Investment Companies.”
a) | Security valuation and security transactions |
Investments in securities, including foreign securities, traded on an exchange or quoted on the over-the-counter market are valued at the last sale price or, if no sale occurred during the day, at the mean between closing bid and asked prices, as last reported by a pricing service approved by the Trustees. Securities that are principally traded on the National Association of Securities Dealers Automated Quotation National Market (“NASDAQ”) are generally valued at the NASDAQ Official Closing Price (“NOCP”). If there is no NASDAQ Official Closing Price for a NASDAQ-listed security or sale price available for an over-the-counter security, the mean of the latest bid and asked quotations from NASDAQ will be used. When market quotations for securities are not readily available, or when restricted securities or other assets are being valued, such assets are valued at fair value as determined in good faith by or under procedures approved by the Trustees. Money market funds are valued at net asset value (“NAV”).
Fixed Income securities, such as corporate bonds, convertible bonds and U.S. government agency issues are valued based on evaluated mean prices supplied by independent pricing services using matrix pricing formulas and/or independent broker bid quotations.
28 | October 31, 2021
Trading in securities on foreign securities exchanges normally is completed before the calculation of the Funds’ NAV. Trading on these foreign exchanges may not take place on all days on which there is regular trading on the New York Stock Exchange (“NYSE”), or may take place on days on which there is no regular trading on the NYSE. Similarly, the Funds may hold securities traded in domestic markets where the market may close early on a given day prior to calculation of the Funds’ NAV. Events affecting the value of such securities held by the Funds that occur between the close of trading in the security and the close of trading on the NYSE normally will not be reflected in the Funds’ calculation of the NAV. However, significant events will be closely monitored, and where it is determined that an adjustment should be made to the security’s value because significant interim events may materially affect the value of the security, the security will be priced at its fair value in accordance with the procedures approved by the Trustees.
Cash and cash equivalents may exceed federal insurance limits. Money market deposit accounts are considered cash equivalents and reflected at cost.
Investment transactions are recorded on trade date. Dividend income is recognized on the ex-dividend date. Interest income is recognized on an accrual basis and includes, where applicable, the amortization of premiums and accretion of discounts. Net realized gains and losses from sales of securities are determined on the specific identification cost method.
b) | Restricted and illiquid securities |
The Funds may invest in securities that are subject to legal or contractual restrictions on resale or are illiquid. A security may be considered illiquid if it lacks a readily available market or if its valuation has not changed for a certain period of time. Disposal of these securities may involve time consuming negotiations and expense, and a prompt sale at the current valuation may be difficult.
Annual Report | 29
c) | Fair Valuation Measurements |
The Trust has adopted authoritative fair valuation accounting standards which establish an authoritative definition of fair value and set out a hierarchy for measuring fair value. These standards require additional disclosures about the various inputs and valuation techniques used to develop the measurements of fair value and a discussion in changes in valuation techniques and related inputs during the year. These inputs are summarized in the three broad levels listed below.
| ● | Level 1 - Quoted prices in active markets for identical securities. |
| ● | Level 2 - Other significant observable inputs (including quoted prices for similar securities, interest rates, prepayment speeds, credit risk, etc.). |
| ● | Level 3 - Significant unobservable inputs (including the Fund’s own assumptions in determining the fair value of investments). |
When using the market quotations or closing price provided by the pricing service for equity investments, including common stocks, preferred stocks, foreign issued common stocks, exchange-traded funds, closed end mutual funds and real estate investment trusts, which are traded on an exchange are valued at the last sale price reported by the exchange on which the securities are primarily traded on the day of valuation and when the market is considered active, the security will be classified as a Level 1 security. When using the mean between the latest bid and ask price, the security will be classified as Level 2.
Investment in mutual funds, including money market funds, are generally priced at the ending NAV provided by the service agent of the funds and will be classified as Level 1 securities.
Fixed Income securities, such as corporate bonds, convertible bonds, commercial paper, money market deposit accounts and U.S. government agency issues are valued based on evaluated mean prices supplied by independent pricing services using matrix pricing formulas and/or independent broker bid quotations and are classified as Level 2.
Options are valued at the composite last price reported by the exchange on which the options are primarily traded on the day of the valuation and are classified as Level 1. If there is no composite last price on a given day the mean between the latest bid and ask price will be used. These contracts are classified as Level 2.
Any securities or other assets for which market quotations are not readily available are valued at fair value as determined in good faith by the Adviser pursuant to procedures established under the general supervision and responsibility of the Funds’ Board of Trustees and may be classified as Level 3 securities. In determining fair value, a Fund will seek to assign a value to the security which it believes represents the amount that the Fund could reasonably expect to receive upon its current sale. With respect to securities that are actively traded on U.S. exchanges, the Funds expect that market quotations will generally be available and that fair value might be used only in limited circumstances, such as when trading for a security is halted during the trading day.
In determining whether a significant event has occurred with respect to securities traded principally in foreign markets, the Funds may engage a third party fair value service provider to systematically recommend the adjustment of closing market prices of non-U.S. securities based upon changes in a designated U.S. securities market index occurring from the time of close of the relevant foreign market and the close of the NYSE Fair value pricing may also be used to value restricted securities held by the Funds or securities with little or no trading activity for extended periods of time. Fair value pricing involves judgments that are inherently subjective and inexact and it is not possible to determine with certainty when, and to what extent, an event will affect a market price. As a result, there can be no assurance that fair value pricing will reflect actual market value and it is possible that the fair value determined for a security may differ materially from the value that could be realized upon the sale of the security.
30 | October 31, 2021
The following is a summary of the inputs used, as of October 31, 2021, involving the Funds’ assets and liabilities carried at fair value. The inputs of methodology used for valuing securities may not be an indication of the risk associated with investing in those securities.
Description | | Level 1 | | | Level 2 | | | Level 3 | | | Total | |
The Tocqueville Fund* | | | | | | | | | | | | | | | | |
Assets | | | | | | | | | | | | | | | | |
Common Stocks | | $ | 307,021,165 | | | $ | — | | | $ | — | | | $ | 307,021,165 | |
Real Estate Investment Trust (REIT) | | | 7,144,000 | | | | — | | | | — | | | | 7,144,000 | |
Money Market Fund | | | 557 | | | | — | | | | — | | | | 557 | |
Total Assets | | $ | 314,165,722 | | | $ | — | | | $ | — | | | $ | 314,165,722 | |
| | | | | | | | | | | | | | | | |
The Tocqueville Opportunity Fund* | | | Level 1 | | | | Level 2 | | | | Level 3 | | | | Total | |
Assets | | | | | | | | | | | | | | | | |
Common Stocks | | $ | 111,493,156 | | | $ | — | | | $ | — | | | $ | 111,493,156 | |
Money Market Fund | | | 314 | | | | — | | | | — | | | | 314 | |
Total Assets | | $ | 111,493,470 | | | $ | — | | | $ | — | | | $ | 111,493,470 | |
| | | | | | | | | | | | | | | | |
The Tocqueville Phoenix Fund* | | | Level 1 | | | | Level 2 | | | | Level 3 | | | | Total | |
Assets | | | | | | | | | | | | | | | | |
Common Stocks | | $ | 163,387,929 | | | $ | — | | | $ | — | | | $ | 163,387,929 | |
Money Market Fund | | | 8,800,000 | | | | — | | | | — | | | | 8,800,000 | |
Total Assets | | $ | 172,187,929 | | | $ | — | | | $ | — | | | $ | 172,187,929 | |
* | For further information regarding portfolio characteristics, please see the accompanying Schedules of Investments. |
The Funds did not hold any investments during the current fiscal year ended October 31, 2021 with significant unobservable inputs which would be classified as Level 3.
The Trust’s valuation procedures have been adopted by the Trust’s Board of Trustees, which has established a Valuation Committee to oversee the valuation process. The Valuation Committee meets on an as needed basis to evaluate changes in the valuation of portfolio securities. The full findings and valuations are then reviewed quarterly by the Independent Trustees.
Annual Report | 31
d) Derivative Instruments and Hedging Activities
The Funds’ Adviser may use derivative instruments, such as purchased and written options, as a means to manage exposure to different types of risk, including market risk and exchange rate risk, and to gain exposure to underlying securities. The Trust has adopted disclosure standards in order to enable the investor to understand how and why an entity used derivatives, how derivatives are accounted for, and how derivatives affect an entity’s results of operations and financial position.
In general an option contract is an agreement between a buyer and seller that gives the purchaser of the option the right to buy or sell a particular asset at a specified future date at an agreed upon price (commonly knows as the “strike price”).
When the Funds purchase an option, an amount equal to the premium paid by the Funds are recorded as an investment and is subsequently adjusted to the current value of the option purchased. If an option expires on the stipulated expiration date or if the Funds enter into a closing sale transaction, a gain or loss is realized. If a purchased call or put option is exercised, the cost of the security acquired is increased by the premium paid for the call, or in the case of a put, a gain or loss is realized from the sale of the underlying security, and the proceeds from such sale are decreased by the premium originally paid. Purchased options are non-income producing securities.
When the Funds write an option, an amount equal to the premium received by the Funds are recorded as a liability and is subsequently adjusted to the current value of the option written. Premiums received from writing options that expire unexercised are treated by the Funds on the expiration date as realized gain from written options. The difference between the premium and the amount paid on effecting a closing purchase transaction, including brokerage commissions, is also treated as a realized gain, or if the premium is less than the amount paid for the closing purchase transaction, as a realized loss. If a written call or put option is exercised, the premium is added or subtracted, respectively, from the proceeds or cost basis, respectively, to the related transaction of the underlying security. The Funds, as writers of an option, would bear the market risk of an unfavorable change in the price of the security underlying the written option.
In the Opportunity Fund, the Adviser used options to gain exposure to the underlying equity security and earn premium income.
The Effect of Derivative Instruments on the Statement of Operations for the year ended October 31, 2021.
The Tocqueville Opportunity Fund
| | | | | Net Change in |
| | | Net Realized | | Unrealized |
| | | Loss on | | Appreciation on |
| | | Purchased Options | | Investments |
| Purchased Options | | | $ | (179,344 | ) | | | $ | — | |
| Total | | | $ | (179,344 | ) | | | $ | — | |
32 | October 31, 2021
Derivatives Risk
The risks of using the types of derivatives in which the Funds may engage include the risk that movements in the value of the derivative may not fully offset or complement instruments currently held in the Funds in the manner intended by the Adviser; the risk that the counterparty to a derivative contract may fail to comply with their obligations to the Fund; the risk that the derivative may not possess a liquid secondary market at a time when the Fund would look to disengage the position; the risk that additional capital from the Fund may be called upon to fulfill the conditions of the derivative contract; and the risk that the cost of the derivative contracts may reduce the overall returns experienced by the Funds. The measurement of risks associated with these instruments is meaningful only when all related offsetting transactions are considered. The Fund may enter into written call options to hedge against changes in the value of equities. The Fund’s option component of the overall investment strategy is often referred to as a “buy-write” strategy (also called a “covered call” strategy), in which the Adviser (as defined below) writes (sells) a call option contract while at the same time owning an equivalent number of shares of the underlying stock to generate moderate current income. The writing of call options is intended to reduce the volatility of the portfolio and to earn premium income. Written call options expose the Fund to minimal counterparty credit risk since they are exchange traded and the exchange’s clearing house guarantees the options against default. As the writer of a call option, the Fund has the obligation to sell the security at the exercise price during the exercise period in the event the option is exercised. The use of options do not create leverage in the Funds. The Funds did not transact in written options during the year ended October 31, 2021.
The average monthly value of purchased options in the Opportunity Fund during the year ended October 31, 2021 was $27,510.
e) Foreign currency translation
Investments and other assets and liabilities denominated in foreign currencies are translated to U.S. dollars at the prevailing rates of exchange, in accordance with the Trust’s Portfolio Securities Valuation and Foreign Exchange Contracts Procedures. The Funds have engaged in transactions in securities denominated in foreign currencies and, as a result, entered into foreign exchange transactions. The Funds are exposed to additional market risk as a result of changes in the value of the underlying currency in relation to the U.S. dollar. Risks include potential inability of counterparties to meet the terms of their obligations. The value of foreign currencies are marked-to-market on a daily basis, which reflects the changes in the market value of the contract at the close of each day’s trading, resulting in daily unrealized gains and/or losses. When the transactions are settled or the contracts are closed, the Funds recognize a realized gain or loss.
The Funds do not isolate that portion of the results of operations resulting from changes in foreign exchange rates on investments from the fluctuations arising from changes in market prices of securities held. Such fluctuations are reflected as net realized and unrealized gain or loss on investments.
Annual Report | 33
Reported net realized foreign exchange gains or losses arise from sales of foreign currencies, currency gains or losses realized between the trade and settlement dates on securities transactions, the differences between the amounts of dividends, interest, and foreign withholding taxes recorded on the Funds’ books, and the U.S. dollar equivalent of the amounts actually received or paid. Net unrealized foreign exchange gains and losses arise from changes in the value of assets and liabilities other than investments in securities at the end of the fiscal year, resulting from changes in the exchange rates.
f) Shareholder transactions and distributions
Shareholder transactions are recorded on trade date. Dividends to shareholders are recorded on the ex-dividend date. Dividends from net investment income are declared and paid annually by the Funds. Distributions of net realized capital gains, if any, will be declared and paid at least annually. Income and capital gain distributions are determined in accordance with income tax regulations which may differ from generally accepted accounting principles. Permanent differences between financial and tax reporting may result in reclassification to capital stock.
g) Allocation of Income, Expenses and Gains/Losses
Income, expenses (other than those deemed attributable to a specific share class), and gains and losses of the Fund are allocated daily to each class of shares based upon the ratio of net assets represented by each class as a percentage of the net assets of the Fund. Expenses deemed directly attributable to a class of shares are recorded by the specific class. Most Fund expenses are allocated by class based on relative net assets.
h) Use of estimates
The preparation of financial statements in conformity with U.S. GAAP requires management to make estimates and assumptions that affect the reported amounts of assets and liabilities and disclosure of contingent assets and liabilities at the date of the financial statements and the reported amounts of income and expenses during the reporting year. Actual results could differ from those estimates.
i) Indemnification
In the normal course of business the Funds enter into contracts that contain general indemnification clauses. The Funds’ maximum exposure under these arrangements is unknown, as this would involve future claims against a Fund that have not yet occurred. Based on experience, the Funds expect the risk of loss to be remote.
j) COVID-19
The global outbreak of COVID-19 (commonly referred to as “coronavirus”) has disrupted economic markets and the prolonged economic impact is uncertain. The ultimate economic fallout from the pandemic, and the long-term impact on economies, markets, industries and individual issuers, are not known. The operational and financial performance of the issuers of securities in which the Funds invest depends on future developments, including the duration and spread of the outbreak, and such uncertainty may in turn adversely affect the value and liquidity of the Funds’ investments, impair the Funds’ ability to satisfy redemption requests, and negatively impact the Funds’ performance.
34 | October 31, 2021
k) Subsequent events evaluation
In preparing these financial statements, the Trust has evaluated events and transactions for potential recognition or disclosure resulting from subsequent events through the date financial statements were available to be issued. This evaluation did not result in any subsequent events, that necessitated disclosure and/or adjustments, other than below.
On December 10, 2021 the following Fund paid an income distribution in the amount as shown in the table.
| Income Dollar | | Income Per Share |
Fund | Amount | | Amount |
Tocqueville Fund | $1,292,985 | | $0.20046668 |
On December 10, 2021 the following Funds paid short-term capital gain distributions in the amount as shown in the table.
Fund | Income Dollar Amount | | Income Per Share Amount |
Tocqueville Opportunity Fund | $479,310 | | $0.21261 |
Tocqueville Phoenix Fund | 263,472 | | $0.04050 |
On December 10, 2021 the following Funds paid long-term capital gain distributions in the amount as shown in the table.
| Income | | |
| Dollar | | Income Per Share |
Fund | Amount | | Amount |
Tocqueville Fund | $30,734,493 | | $4.76513 |
Tocqueville Opportunity Fund | 5,704,042 | | $2.53017 |
Tocqueville Phoenix Fund | 17,598,013 | | $2.70510 |
3. FEDERAL INCOME TAX
There is no tax liability resulting from unrecognized tax benefits relating to uncertain income tax positions taken or expected to be taken on the tax return for the fiscal year-end October 31, 2021, or for any other tax years which are open for exam. As of October 31, 2021, open tax years include the tax years ended October 31, 2018 through 2021. The Trust is also not aware of any tax positions for which it is reasonably possible that the total amounts of unrecognized tax benefits will significantly change in the next six months. The Funds recognize interest and penalties, if any, related to unrecognized tax benefits as income tax expense in the Statement of Operations. During the year, the Funds did not incur any interest or penalties.
Annual Report | 35
Provision for federal income taxes or excise taxes has not been made since the Funds intend to continue to comply with the requirements of sub-chapter M of the Internal Revenue Code necessary to qualify as Regulated Investment Companies and intend to distribute substantially all taxable income to shareholders and otherwise comply with the provisions of the Internal Revenue Code applicable to Regulated Investment Companies. Distributions from net realized gains for book purposes may include short-term capital gains which are included as ordinary income to shareholders for tax purposes. Additionally, accounting principles generally accepted in the United States of America require that certain components of net assets relating to permanent differences be reclassified between financial and tax reporting. These reclassifications have no effect on net assets or NAV per share. For the year ended October 31, 2021, the following table shows the reclassifications made:
| | | | Distributable Earnings | | | Paid In Capital | |
| Tocqueville Fund | | | $ | (1,921,099 | ) | | $ | 1,921,099 | |
| Opportunity Fund | | | | (677,319 | ) | | | 677,319 | |
| Phoenix Fund | | | | (920,056 | ) | | | 920,056 | |
The permanent differences primarily relate to the usage of deemed distributions for tax purposes.
As of October 31, 2021, the components of distributable earnings (accumulated losses) for income tax purposes were as follows:
| | | Tocqueville
Fund | | | Opportunity
Fund | | | Phoenix
Fund | |
| Tax cost of Investments | | $ | 119,012,155 | | | $ | 34,838,024 | | | $ | 122,316,255 | |
| Unrealized Appreciation | | $ | 195,687,402 | | | $ | 77,555,753 | | | $ | 52,498,547 | |
| Unrealized Depreciation | | | (533,835 | ) | | | (900,305 | ) | | | (2,626,873 | ) |
| Net unrealized appreciation (depreciation) | | | 195,153,567 | | | | 76,655,448 | | | | 49,871,674 | |
| Undistributed operating income | | | 1,267,241 | | | | 479,301 | | | | 263,413 | |
| Undistributed long-term gains | | | 30,734,490 | | | | 5,703,957 | | | | 17,598,002 | |
| Distributable earnings | | | 32,001,731 | | | | 6,183,258 | | | | 17,861,415 | |
| Other accumulated gain/(loss) | | | — | | | | (1 | ) | | | — | |
| Total distributable earnings | | $ | 227,155,298 | | | $ | 82,838,705 | | | $ | 67,733,089 | |
The difference between book-basis and tax-basis unrealized appreciation is attributable primarily to wash sale deferrals and straddle loss defferals.
The tax character of distributions paid during the years ended October 31, 2021 and 2020 was as follows:
| | | | October 31, 2021 | |
| | | | Ordinary Income | | | Long Term Capital Gain | | | Total | |
| Tocqueville Fund | | | $ | 1,693,360 | | | $ | 7,540,416 | | | $ | 9,233,776 | |
| Opportunity Fund | | | | — | | | | 3,607,856 | | | | 3,607,856 | |
| Phoenix Fund | | | | — | | | | 2,758,109 | | | | 2,758,109 | |
36 | October 31, 2021
| | | | October 31, 2020 | |
| | | | Ordinary Income | | | Long Term Capital Gain | | | Total | |
| Tocqueville Fund | | | $ | 2,806,607 | | | $ | 17,197,787 | | | $ | 20,004,394 | |
| Opportunity Fund | | | | — | | | | 4,684,120 | | | | 4,684,120 | |
| Phoenix Fund | | | | — | | | | 3,732,986 | | | | 3,732,986 | |
The Funds designated as long-term capital gain dividend, pursuant to Internal Revenue Code Section 852(b)(3), the amount necessary to reduce the earnings and profits of the Funds related to net capital gain to zero for the tax years ended October 31, 2021 and 2020.
For the fiscal year ended October 31, 2021, the Funds did not have any late year losses.
| 4. | INVESTMENT ADVISORY AND OTHER AGREEMENTS |
Tocqueville Asset Management L.P. (“Tocqueville”) is the investment adviser (the “Adviser”) to the Trust under Investment Advisory Agreements approved by shareholders. For its services, Tocqueville receives fees from The Tocqueville Fund, calculated daily and payable monthly, at an annual rate of 0.75% on the first $1 billion of the average daily net assets of the Fund, and 0.65% of the average daily net assets in excess of $1 billion. Tocqueville receives fees from The Tocqueville Opportunity Fund, calculated daily and payable monthly, at an annual rate of 0.75% on the first $500 million of the average daily net assets of the Fund, and 0.65% of the average daily net assets in excess of $500 million. Tocqueville receives fees from The Tocqueville Phoenix Fund, calculated daily and payable monthly, at an annual rate of 0.80% on the first $250 million of net assets of the Fund; 0.75% on the next $250 million of net assets of the Fund; 0.70% on the next $500 million of net assets of the Fund; and 0.65% on all net assets of the Fund over $1 billion.
With respect to The Tocqueville Fund, The Tocqueville Opportunity Fund, and The Tocqueville Phoenix Fund, the Adviser has contractually agreed to waive its advisory fees and/or reimburse expenses in order to ensure that each Fund’s total annual operating expenses do not exceed 1.25% of its average daily net assets (excluding taxes, interest expense, acquired fund fees and expenses, or extraordinary expenses such as litigation). The Expense Limitation Agreements will remain in effect until March 1, 2023 for each Fund. For the year ended October 31, 2021, the Adviser waived $273,697, $148,797, and $313,553 of the advisory fee for The Tocqueville Fund, The Tocqueville Opportunity Fund, and The Tocqueville Phoenix Fund, respectively. Such amounts are not subject to recoupment by the Adviser.
Pursuant to an Administrative Services Agreement, each Fund pays to the Adviser a fee computed and paid monthly at an annual rate of 0.15% on the first $400 million of the average daily net assets of each Fund; 0.13% on the next $600 million of the average daily net assets of each Fund; and 0.12% on all the average daily net assets of each Fund over $1 billion. For the year ended October 31, 2021, the Adviser has made payments of $129,531, $45,318, and $76,239, to U.S. Bancorp Fund Services, LLC for services provided under a Sub-Administration Agreement for The Tocqueville Fund, The Tocqueville Opportunity Fund, and The Tocqueville Phoenix Fund, respectively.
Annual Report | 37
Tocqueville Securities, L.P. (the “Distributor”), an affiliate of Tocqueville, acts as distributor for shares of the Trust. The Tocqueville Fund, The Tocqueville Opportunity Fund, and the Tocqueville Phoenix Fund, adopted a distribution and service plan pursuant to Rule 12b-1 of the 1940 Act. Pursuant to the plans, each Fund pays to the Distributor distribution and service fees of 0.25% per annum of its average daily net assets.
Commissions earned by the Distributor for services rendered as a registered broker-dealer in securities transactions for The Tocqueville Fund, The Tocqueville Opportunity Fund, and The Tocqueville Phoenix Fund for the year ended October 31, 2021, were $7,566, $2,270, and $5,963, respectively.
| 5. | CAPITAL SHARE TRANSACTIONS. |
Transactions in capital shares for each Fund were as follows:
| | | For the Year Ended October 31, 2021 | | | For the Year Ended October 31, 2020 | |
| The Tocqueville Fund | | Shares | | | Shares | |
| Shares sold | | | 158,773 | | | | 103,586 | |
| Shares issued to holders in reinvestment dividends | | | 218,200 | | | | 513,802 | |
| Shares redeemed | | | (673,876 | ) | | | (1,379,364 | ) |
| Net decrease | | | (296,903 | ) | | | (761,976 | ) |
| | | | | | | | | |
| The Tocqueville Opportunity Fund | | | | | | | | |
| Shares sold | | | 243,635 | | | | 626,039 | |
| Shares issued to holders in reinvestment dividends | | | 85,134 | | | | 155,689 | |
| Shares redeemed | | | (439,355 | ) | | | (1,413,648 | ) |
| Net decrease | | | (110,586 | ) | | | (631,920 | ) |
| | | | | | | | | |
| The Tocqueville Phoenix Fund | | | | | | | | |
| Shares issued in connection with merger | | | — | | | | 1,635,723 | |
| Shares sold | | | 301,106 | | | | 283,424 | |
| Shares issued to holders in reinvestment dividends | | | 125,825 | | | | 169,346 | |
| Shares redeemed | | | (1,201,210 | ) | | | (2,666,919 | ) |
| Net decrease | | | (774,279 | ) | | | (578,426 | ) |
| 6. | INVESTMENT TRANSACTIONS |
Purchases and sales of investment securities (excluding short-term investments) for the year ended October 31, 2021 are summarized below.
| | | | Tocqueville
Fund | | | Opportunity
Fund | | | Phoenix
Fund | |
| Purchases: | | | $ | 32,365,824 | | | $ | 20,704,163 | | | $ | 33,020,034 | |
| | | | | | | | | | | | | | |
| Sales: | | | $ | 52,298,542 | | | $ | 31,513,277 | | | $ | 55,958,644 | |
38 | October 31, 2021
The Tocqueville Trust has a line of credit (the “Line”), which is uncommitted, in the amount of $50,000,000, 10% of The Tocqueville Fund’s or The Opportunity Fund’s gross market value, 15% of The Tocqueville Phoenix Fund’s gross market value or 33.33% of the fair value of a Fund’s investments, whichever is less, with U.S. Bank NA. The Line is for temporary emergency or extraordinary purposes, including the meeting of redemption requests that otherwise might require the untimely disposition of securities. The Line is secured by the Trust’s assets. The Line has a one-year term and is reviewed annually by the Board of Trustees. The Line matures, unless renewed, on January 18, 2022. Interest is charged at the greater of 0.00% and the prime rate minus 0.50%. The interest rate as of and for the year ended October 31, 2021 was 2.75%. The average interest rate during the year ended October 31, 2021 was 2.75%. During the year ended October 31, 2021, the Tocqueville Fund’s maximum borrowing was $1,634,000 and average borrowing was $53,008, the Opportunity Fund’s maximum borrowing was $3,153,000 and average borrowing was $271,343. This borrowing resulted in interest expenses of $1,434, and $7,711, respectively. The Tocqueville Phoenix Fund did not use the Line.
On November 15, 2019, The Tocqueville Phoenix Fund (the “Acquiring Fund”) acquired all the net assets of The Tocqueville Select Fund (the “Acquired Fund”) pursuant to an Agreement and Plan of Reorganization approved by the series’ board of trustees on October 1, 2019. The purpose of the transaction was to combine two funds managed by the Adviser with comparable investment objectives and strategies. The acquisition was accomplished by a tax-free exchange of 1,635,723 shares of the Acquiring Fund (valued at $33,427,094) for all 2,982,981 shares of the Acquired Fund at the close of business November 15, 2019. For financial reporting purposes, assets received, and shares issued by the Acquiring Fund were recorded at fair value; however, the cost basis of the investments received from the Acquired Fund was carried forward to align ongoing reporting to the Acquiring Fund’s realized and unrealized gains and losses with amounts distributable to shareholders for tax purposes. The Acquired Fund’s net assets at that date ($33,427,094), including $3,957,209 of unrealized appreciation, were combined with those of the Acquiring Fund. The aggregate net assets of the Acquiring Fund immediately before the acquisition were $165,074,604. The aggregate net assets of the Acquiring Fund immediately after the acquisition were $198,501,698. Because the combined investment portfolios have been managed as a single integrated portfolio since the acquisition was completed, it is not practicable to separate the amounts of revenue and earnings of the Acquired Fund that have been included on the acquiring fund’s Statement of Operations since November 15, 2019. 100% of the costs associated with the Plan of Reorganization were paid by the Adviser. The Semi-annual report dated as of April 30, 2020, previously disclosed the net assets resulting from the Reorganization as $29,469,886. This number has been revised as of October 31, 2020 to $33,427,094 with an offsetting revision to net change in unrealized appreciation (depreciation) on investments. This revision had no impact on the net assets of the Fund. Using the guidance in ASC Topic 250, Accounting Changes and Error Corrections, Fund Management has concluded that this revision is not material to the financial statements.
Annual Report | 39
Assuming the acquisition had been completed on November 1, 2019, the beginning of the annual reporting year of the Acquiring Fund, the Acquired Fund’s pro forma results of operations for the year ended October 31, 2020, are as follows:
Net Investment Loss: $(203,070)
Net Realized Gain on Investments: $4,679,876
Net Unrealized Depreciation on Investments: $(21,667,358)
Net Decrease in Net Assets Resulting from Operations: $(17,190,552)
40 | October 31, 2021
The Tocqueville Trust
Report of Independent Registered Public Accounting Firm
To the Shareholders and Board of Trustees of
The Tocqueville Trust
Opinion on the Financial Statements
We have audited the accompanying statements of assets and liabilities, including the schedules of investments, of The Tocqueville Trust comprising The Tocqueville Fund, The Tocqueville Opportunity Fund, and The Tocqueville Phoenix Fund (the “Funds”) as of October 31, 2021, the related statements of operations, the statements of changes in net assets, the related notes, and the financial highlights for the year then ended (collectively referred to as the “financial statements”). In our opinion, the financial statements present fairly, in all material respects, the financial position of the each of the Funds as of October 31, 2021, the results of their operations, the changes in net assets, and the financial highlights for the year then ended, in conformity with accounting principles generally accepted in the United States of America.
The Funds’ financial statements and financial highlights for the year ended October 31, 2020, and prior, were audited by other auditors whose report dated December 23, 2020 expressed an unqualified opinion on those financial statements and financial highlights.
Basis for Opinion
These financial statements are the responsibility of the Funds’ management. Our responsibility is to express an opinion on the Funds’ financial statements based on our audits. We are a public accounting firm registered with the Public Company Accounting Oversight Board (United States) (“PCAOB”) and are required to be independent with respect to the Funds in accordance with the U.S. federal securities laws and the applicable rules and regulations of the Securities and Exchange Commission and the PCAOB.
We conducted our audits in accordance with the standards of the PCAOB. Those standards require that we plan and perform the audit to obtain reasonable assurance about whether the financial statements are free of material misstatement whether due to error or fraud.
Annual Report | 41
Our audits included performing procedures to assess the risks of material misstatement of the financial statements, whether due to error or fraud, and performing procedures that respond to those risks. Such procedures included examining, on a test basis, evidence regarding the amounts and disclosures in the financial statements. Our procedures included confirmation of securities owned as of October 31, 2021, by correspondence with the custodian and brokers. Our audits also included evaluating the accounting principles used and significant estimates made by management, as well as evaluating the overall presentation of the financial statements. We believe that our audits provide a reasonable basis for our opinion.
We have served as the Funds’ auditor since 2021.
 | |
| | |
| COHEN & COMPANY, LTD. | |
| Milwaukee, Wisconsin | |
| December 22, 2021 | |
42 | October 31, 2021
ADDITIONAL INFORMATION (UNAUDITED)
1. ADDITIONAL DISCLOSURE REGARDING FUND TRUSTEES AND OFFICERS
Independent Trustees
| Name and Age | | Position(s) Held with the Trust | | Term of Office and Length of Time Served(1) | | Principal Occupation(s)During Past Five Years | | Number of Funds in Fund Complex Overseen By Trustee | | Other Directorships Held by Trustee |
| | | | | | | | | | | |
George Cooke
Year of Birth: 1952 | | Trustee; Member of Audit Committee; Member of Governance and Nominating Committee | | Indefinite Term, Since 2020 | | Business Development, Tocqueville Capital Management, June 2015 – April 2020. | | 3 | | None |
| | | | | | | | | | | |
Charles F. Gauvin
Year of Birth: 1956 | | Trustee; Member of Audit Committee; Member of Governance and Nominating Committee | | Indefinite Term, Since February 2015 | | Independent consultant on strategy, leadership and philanthropy, from 2018 –present; Chief Development Officer, Woods Hole Oceanographic Institution, from February 2016 – 2018; Executive Director, Maine Audubon, from August 2014 –January 2016 | | 3 | | Director, Bioqual, Inc., July 1992 – present. |
| | | | | | | | | | | |
| James W. Gerard Year of Birth: 1961 | | Trustee; Member of Audit Committee; Member of Governance and Nominating Committee | | Indefinite Term, Since 2001 | | Managing Director, Hycroft Advisors, from January 2010-present; Managing Director, deVisscher & Co., LLC from January 2013 to present; The Chart Group from January 2001 to present. | | 3 | | President, American Overseas Memorial Day Association, 1998 – present; Trustee, Salisbury School, 2005 – present; Director, American Friends of Bleraucourt, 1992 – present; President, Little Baby Face Foundation, March 2015 – present. |
Annual Report | 43
ADDITIONAL INFORMATION (UNAUDITED)
Interested Trustees(2) and Officers
| Name and Age | | Position(s) Held with the Trust | | Term of Office and Length of Time Served(1) | | Principal Occupation(s)During Past Five Years | | Number of Funds in Fund Complex Overseen By Trustee | | Other Directorships Held by Trustee |
| | | | | | | | | | | |
Jeff Zatkowsky
Year of Birth: 1970 | | Treasurer | | Indefinite Term, Since 2021 | | Controller / Treasurer of Tocqueville Asset Management from February 2021 to present; CFO, SMT Financial Corp., December 2019 – February 2021; Controller, Summit Financial Corp., August 2014 - November 2019; Manager, Citco Fund Services, March 2007 – July 2014. | | N/A | | N/A |
| | | | | | | | | | | |
Robert W. Kleinschmidt
Year of Birth: 1949 | | Chairman, President, and Trustee | | Indefinite Term, Chairman Since 2016, and President and Trustee Since 1991 | | Chief Executive Officer, President and Chief Investment Officer, Tocqueville Asset Management; Director, Tocqueville Management Corporation, General Partner, Tocqueville Asset Management L.P. and Tocqueville Securities L.P., January 1994 to present. | | 3 | | President and Director, Tocqueville Management Corporation, the General Partner of Tocqueville Asset Management L.P. and Tocqueville Securities L.P. |
| | | | | | | | | | | |
Stephan Yevak
Year of Birth: 1959 | | Anti-Money Laundering Compliance Officer | | Indefinite Term, Since 2018 | | Deputy Chief Compliance Officer, Tocqueville Securities, L.P. from August 2011 to present; Deputy Chief Compliance Officer, Tocqueville Asset Management from August 2011 to present. Anti-Money Laundering Compliance Officer to both entities from March 2018 to present. | | N/A | | N/A |
44 | October 31, 2021
ADDITIONAL INFORMATION (UNAUDITED)
Interested Trustees(2) and Officers
| Name and Age | | Position(s) Held with the Trust | | Term of Office and Length of Time Served(1) | | Principal Occupation(s)During Past Five Years | | Number of Funds in Fund Complex Overseen By Trustee | | Other Directorships Held by Trustee |
| | | | | | | | | | | |
Cleo Kotis Year of Birth: 1975 | | Secretary | | Indefinite Term, Since 2010 | | Director of Operations, the Delafield Group of Tocqueville Asset Management L.P., 2009 to present. | | N/A | | N/A |
| | | | | | | | | | | |
Charles Martin Year of Birth: 1988 | | Chief Compliance Officer | | Indefinite Term, Since 2020 | | Managing Director, Vigilant Compliance, LLC, 2012 – present. | | N/A | | N/A |
| (1) | Each Trustee will hold office for an indefinite term until the earliest of (i) the next meeting of shareholders, if any, called for the purpose of considering the election or re-election of such Trustee and until the election and qualification of his or her successor, if any, elected at such meeting, or (ii) the date a Trustee resigns or retires, or a Trustee is removed by the Board of Trustees or shareholders, in accordance with the Trust’s By-Laws, as amended, and Agreement and Declaration of Trust, as amended. Each officer will hold office for an indefinite term until the date he or she resigns or retires or until his or her successor is elected and qualifies. |
| | |
| (2) | “Interested person” of the Trust as defined in the 1940 Act. Mr. Kleinschmidt is considered “interested person” because of his affiliation with the Advisor. |
| The Statement of Additional Information includes additional information about the Trustees and is available free of charge by calling the Funds toll free at 1-800-355-7307. |
Annual Report | 45
2. | INVESTMENT ADVISORY AGREEMENT DISCLOSURE |
In determining whether to approve the continuance of the Investment Advisory Agreements and the Administration Agreement, the Trustees, including the Independent Trustees, considered the following information:
1) | The nature, extent and quality of services provided by the Adviser. |
The Trustees reviewed in detail the nature and extent of the services provided by the Adviser under the terms of the Investment Advisory Agreements and the quality of those services provided to Funds over the past year. The Trustees noted that the services under the Investment Advisory Agreements include: managing the investment and reinvestment of the Funds’ assets; supervising and managing all aspects of the Funds’ operations; and providing the Board on a regular basis with financial reports and analyses on the Funds’ operations and the operations of comparable investment companies. The Trustees also observed that the Adviser provides various administrative services to the Funds pursuant to the terms of the Administration Agreement and considered the nature, extent and quality of services provided under that agreement as well. The Trustees evaluated these factors based on their direct experience with the Adviser and in consultation with counsel. The Trustees concluded that the nature and extent of the services provided under the Investment Advisory Agreements and the Administration Agreement were reasonable and appropriate in relation to the advisory fee and administration fee, respectively, that the level of services provided by the Adviser to the Funds had not diminished over the past year and that the quality of services continues to be high. The Trustees reviewed the personnel responsible for providing advisory and administrative services to the Funds and concluded, based on their experience and interaction with the Adviser, that (i) the Adviser was able to retain quality portfolio managers and other personnel; (ii) the Adviser exhibited a high level of diligence and attention to detail in carrying out its advisory and administrative responsibilities under the Investment Advisory Agreements and Administration Agreement, respectively, for the Funds; (iii) the Adviser was responsive to requests of the Trustees; and (iv) the Adviser had kept the Trustees apprised of developments relating to the Funds and the industry in general. The Trustees also focused on the Adviser’s reputation and long-standing relationship with the Trust.
In connection with its assessment of the performance of the Adviser, the Trustees reviewed the Adviser’s financial statements and considered the Adviser’s financial condition and whether it has the resources necessary to continue to carry out its obligations under the Investment Advisory Agreements and the Administration Agreement. The Trustees concluded that the Adviser has the financial resources necessary to continue to perform its obligations under the Investment Advisory Agreements and the Administration Agreement and to continue to provide the high quality services that it has provided to the Funds to date.
2) | The performance of the Funds and the Adviser. |
The Trustees reviewed the investment performance of the Funds, both on an absolute basis and as compared to a peer group for each respective Fund for the one-year, three-year, five-year and ten-year periods, ended July 31, 2021. The peer groups were comprised of other funds that had similar investment objectives and sales load structures, as determined by Morningstar: The Morningstar Large Blend Funds peer group, with total net assets between $200 million and $400 million, for The Tocqueville Fund; the Morningstar Mid-Cap Growth Funds peer group, with total net assets between $50 million and $150 million, for The Tocqueville Opportunity Fund; and the Morningstar Small Value Funds peer group, with total net assets between $100 million and $300 million, for The Tocqueville Phoenix Fund (the “Performance Peer Groups”).
46 | October 31, 2021
The Trustees also compared each Fund’s investment performance against its benchmark market indices: the S&P 500 Index for The Tocqueville Fund; the Russell 2500 Growth Index for The Tocqueville Opportunity Fund; and the Russell 2000 Value Index and the Russell 2000 Total Return Index for The Tocqueville Phoenix Fund (the “Indices”) for the one-year, three-year, five-year, and ten-year periods ended July 31, 2021 for all the Funds. The Trustees considered the above information as helpful in their assessment of whether the Adviser was obtaining for the Funds’ shareholders the performance that was available in the marketplace given each Fund’s investment objectives, policies, strategies, limitations and restrictions. The Trustees concluded that the performance of the Funds against their respective Performance Peer Groups was satisfactory. In particular, the Trustees noted that The Tocqueville Fund had underperformed as compared to its Index for all periods and underperformed the median of its Performance Peer Group for all periods. The Trustees noted that The Tocqueville Opportunity Fund underperformed its Index for the one-year period and outperformed its Index for the three-year, five-year, and ten-year periods and underperformed the median of its Performance Peer Group for the one-year period and outperformed the median of its Performance Peer Group for the three-year, five-year, and ten-year periods. The Trustees noted that The Tocqueville Phoenix Fund overperformed both of its Indices for the one-year period and underperformed both of its Indices for the three-year, five-year, and ten-year periods; and overperformed the median of its Performance Peer Group for all periods.
| 3) | The cost of the advisory services and the profits to the Adviser from the relationship with the Trust. |
In connection with the Trustee’s consideration of the level of the advisory fees, the Trustees considered a number of factors. The Trustees compared the level of the advisory fees for each Fund against the advisory fees charged by funds in a universe of funds: the Morningstar Large Blend Funds peer group, with average net assets between $221 million and $384 million, for The Tocqueville Fund; the Morningstar Mid-Cap Growth Funds peer group, with average net assets between $54 million and $146 million, for The Tocqueville Opportunity Fund; and the Morningstar Small Value Funds peer group, with average net assets between $100 million and $282 million, for The Tocqueville Phoenix Fund (the “Expense Peer Groups”). The Trustees considered comparative total fund expenses of the Funds and the Expense Peer Groups. The Trustees used this comparative fee information and total expense data as a guide to help assess the reasonableness of each Fund’s advisory fee, although they acknowledged that it was difficult to make precise comparisons with other funds since the exact nature of services provided under each Expense Peer Group fund agreement is often not apparent. The Trustees also viewed the Expense Peer Group fee information as a whole as useful in assessing whether the Adviser was providing services at a cost that was competitive with other, similar funds.
Annual Report | 47
The Trustees noted that the contract rate advisory fee and administration fee for each of the Funds were reasonable, despite the contractual advisory fee rate being above average for The Tocqueville Fund, and the administration fee being above average for The Tocqueville Fund, The Tocqueville Opportunity Fund, and The Tocqueville Phoenix Fund when compared to their respective Expense Peer Groups. The Trustees also considered the combined contract rate advisory and administration fee as compared to their respective Expense Peer Group. The Board further observed that the total expense ratios of the Funds were also reasonable. The Board noted that the total expense ratio for the Funds were above average when compared to their respective Expense Peer Groups. The Board also noted that the Funds each operate pursuant to an Expense Limitation Agreement whereby the Adviser has agreed to waive a portion of its fee necessary to limit the Fund’s total operating expenses to the level set forth in the Fund’s prospectus.
The Trustees also considered the profitability to the Adviser and its affiliate arising out of its relationship with the Trust. In this regard, the Trustees reviewed profitability data relating to the Adviser for the 12 month period ended July 31, 2021. The Trustees considered revenues received by the Adviser under the Investment Advisory Agreements and the Administration Agreement as well as revenues received by the Adviser’s affiliate, the Distributor, under the 12b-1 plans and Related Agreements and commissions received for effecting portfolio transactions. The Trustees concluded that the profitability of the Funds to the Adviser was not excessive.
| 4) | The extent to which economies of scale will be realized as the Funds grow and whether fee levels reflect those economies of scale. |
With respect to the Trustees’ consideration of economies of scale, the Trustees discussed with the Adviser whether economies of scale would be realized by it in its management of a Fund at higher asset levels. The Trustees noted that all of the Funds currently have advisory fee breakpoints and that they were satisfied that the current breakpoints were appropriate when compared with each Fund’s respective Peer Group. The Trustees also noted that the administration fee also has breakpoints. In the event there was significant asset growth in the future in a Fund, the Trustee’s determined to reassess whether the advisory fees and administration fee, including the current breakpoint structure, appropriately took into account any economies of scale that had been realized as a result of that growth.
The Trustees also discussed the Adviser’s practices regarding the selection and compensation of brokers and dealers that execute portfolio transactions for the Funds and the brokers’ and dealers’ provision of brokerage and research services to the Adviser. The Trustees further discussed the potential benefits the Adviser derived from the Funds’ soft dollar arrangements, whereby brokers provide research to the Funds or the Adviser in return for allocating fund brokerage, and other investment data concerning soft dollars. The Board also discussed the Adviser’s use of an affiliated broker to effect portfolio transactions, noting that in addition to paying a competitive rate on commissions, the Adviser believed the Funds received better execution on trades.
48 | October 31, 2021
Based on a consideration of all these factors in their totality, the Trustees, including all of the Independent Trustees, determined that the Funds’ advisory fees and administration fees were fair and reasonable with respect to the quality of services that the Adviser provides and in light of the other factors described above that the Trustees deemed relevant. The Trustees based their decision on evaluations of all these factors as a whole and did not consider any one factor as all-important or controlling.
3. | PROXY VOTING POLICIES AND PROCEDURES |
A description of the policies and procedures that The Tocqueville Trust uses to determine how to vote proxies relating to portfolio securities is available without charge upon request by calling 1-800-355-7307. Information regarding how The Tocqueville Trust voted proxies relating to portfolio securities during the most recent 12-month period ended June 30 is available by calling 1-800-355-7307 and it is also available on the SEC’s web site at http://www.sec.gov.
| 4. | SHAREHOLDER REPORTS AND QUARTERLY PORTFOLIO DISCLOSURE |
The Tocqueville Trust will file its complete schedule of portfolio holdings with the SEC for the first and third quarters of each fiscal year on Part F of Form N-PORT. The Fund’s Part F of Form N-PORT will be available on the EDGAR database on the SEC’s website at www.sec.gov. These Forms may also be reviewed and copied at the SEC’s Public Reference Room in Washington D.C. Information about the operation of the Public Reference Room may be obtained by calling 1-800-SEC-0330. Quarterly portfolio holdings are also available on the website of The Tocqueville Funds, www.tocquevillefunds.com.
5. | SHAREHOLDER NOTIFICATION OF FEDERAL TAX STATUS |
For the fiscal year ended October 31, 2021, certain dividends paid by the Funds may be subject to a maximum tax rate of 23%, as provided for by the Tax Cuts and Jobs Act of 2017. The percentage of dividends declared from ordinary income designated as qualified dividend income was as follows:
Annual Report | 49
For corporate shareholders, the percent of ordinary income distributions qualifying for the corporate dividends received deduction for the fiscal year ended October 31, 2021 was as follows:
For the year ended October 31, 2021, the funds designate the following percent of ordinary distributions paid as interest-related dividends under the Internal Revenue Code Section 871(k)(1)(c):
The percentage of taxable ordinary income distributions that are designated as short-term capital gain distributions under Internal Revenue Section 871(k)(2)(C) for each Fund were as follows.
| 6. | CHANGE IN INDEPENDENT REGISTERED PUBLIC ACCOUNTING FIRM |
Grant Thornton LLP was previously the independent registered public accounting firm for the Trust. Effective September 16, 2021, that firm resigned and was replaced by Cohen & Company, Ltd. (“Cohen”). Cohen’s appointment as the independent registered public accounting firm for the Trust was recommended by the Audit Committee and approved by the full Board of Trustees.
During the prior years ended October 31, 2020 through October 31, 2017 and through September 16, 2021, there were no: (1) disagreements with Grant Thornton LLP on any matter of accounting principles or practices, financial statement disclosure or auditing scope or procedures, which disagreements if not resolved to their satisfaction would have caused them to make reference in connection with their opinion to the subject matter of the disagreement, or (2) reportable events.
The audit reports of Grant Thornton LLP on the financial statements of the Trust as of and for the prior years ended October 31, 2020 through October 31, 2017, did not contain any adverse opinion or disclaimer of opinion, nor were they qualified or modified as to uncertainty, audit scope or accounting principles.
50 | October 31, 2021
[This page intentionally left blank]
[This page intentionally left blank]
Investment Adviser
Tocqueville Asset Management L.P.
40 W. 57th St., 19th Floor
New York, NY 10019
(212) 698-0800
www.tocqueville.com
Distributor
Tocqueville Securities, L.P.
40 W. 57th St., 19th Floor
New York, NY 10019
(212) 698-0800
Shareholders’ Servicing and Transfer Agent
U.S. Bank Global Fund Services, LLC doing business as
U.S. Bank Global Fund Services
615 East Michigan Street
Milwaukee, WI 53202
Custodian
U.S. Bank, N.A.
Custody Operations
1555 River Center Drive, Suite 302
Milwaukee, WI 53212
Board of Trustees
Robert W. Kleinschmidt—Chairman
George Cooke
Charles F. Gauvin
James W. Gerard
Independent Registered Public Accounting Firm
Cohen & Company, Ltd.
342 North Water Street, Suite 830
Milwaukee, WI 53202

Tocqueville Funds c/o US Bancorp Fund Services, LLC P.O. Box 701 Milwaukee, WI 53201-0701 www.tocquevillefunds.com |
TQ ANNUAL-10/31/21
The registrant has adopted a code of ethics that applies to the registrant’s principal executive officer and principal financial officer. The registrant has not made any substantive amendments to its code of ethics during the period covered by this report. The registrant has not granted any waivers from any provisions of the code of ethics during the period covered by this report.
The registrant’s board of trustees has determined that there is at least one audit committee financial expert serving on its audit committee. James Gerard is the “audit committee financial expert” and are considered to be “independent” as each term is defined in Item 3 of Form N‑CSR.
The registrant has engaged its principal accountant to perform audit services, audit-related services, tax services and other services during the past two fiscal years. “Audit services” refer to performing an audit of the registrant’s annual financial statements or services that are normally provided by the accountant in connection with statutory and regulatory filings or engagements for those fiscal years. “Audit-related services” refer to the assurance and related services by the principal accountant that are reasonably related to the performance of the audit. “Tax services” refer to professional services rendered by the principal accountant for tax compliance, tax advice, and tax planning. “Other services” were not provided by the principal accountant. The following table details the aggregate fees billed or expected to be billed for each of the last two fiscal years for audit fees, audit-related fees, tax fees and other fees by the principal accountant.
The audit committee has adopted pre-approval policies and procedures that require the audit committee to pre‑approve all audit and non‑audit services of the registrant, including services provided to any entity affiliated with the registrant.
The percentage of fees billed by the principal accountant applicable to non-audit services pursuant to waiver of pre-approval requirement were as follows:
All of the principal accountant’s hours spent on auditing the registrant’s financial statements were attributed to work performed by full‑time permanent employees of the principal accountant.
Not applicable to registrants who are not listed issuers (as defined in Rule 10A-3 under the Securities Exchange Act of 1934).
Schedule of Investments is included as part of the report to shareholders filed under Item 1 of this Form.
Not applicable to open-end investment companies.
Not applicable to open-end investment companies.
Not applicable to open-end investment companies.
There have been no material changes to the procedures by which shareholders may recommend nominees to the registrant’s board of trustees.
Not applicable to open-end investment companies.
Filed herewith.
Tocqueville has requested that GT furnish it with a letter addressed to the Securities and Exchange Commission stating whether GT agrees with the statements contained above. A copy of the letter from GT to the Securities and Exchange Commission is filed as an exhibit hereto.
Pursuant to the requirements of the Securities Exchange Act of 1934 and the Investment Company Act of 1940, the registrant has duly caused this report to be signed on its behalf by the undersigned, thereunto duly authorized.
Robert W. Kleinschmidt, President
Pursuant to the requirements of the Securities Exchange Act of 1934 and the Investment Company Act of 1940, this report has been signed below by the following persons on behalf of the registrant and in the capacities and on the dates indicated.
Robert W. Kleinschmidt, President
* Print the name and title of each signing officer under his or her signature.