This report is not authorized for distribution to prospective investors unless preceded or accompanied by a currently effective prospectus of The Tocqueville Trust. Please call 1-800-697-FUND (3863) for a free prospectus. Read it carefully before you invest. You are invited to visit our website @ www.tocquevillefunds.com |
Chairman’s Letter
Dear Fellow Shareholder,
Notwithstanding the ugly bear market, the surprising elections, stubborn inflation, an aggressive Fed, rising interest rates, surprising judicial reversals, ongoing wars; the biggest event of the year, from our point of view, was the decision to merge our two undersized mutual funds into the larger and better performing Tocqueville Fund (“Fund”). This merger accomplished several important goals, including the lowering of expense ratios and the broadening of our portfolio. The new Tocqueville Fund more accurately represents a cross section of what we believe to be the best research ideas within the firm and provides a broadly diversified, benchmark agnostic, stock specific portfolio.
Shareholders should rest assured that the Fund’s long-tenured management team will continue to strive to emphasize cautious and conservative equity investment, with an objective of capital preservation and appreciation when conditions warrant. My team and I have managed this fund for more than thirty years, and we plan to continue to manage this portfolio for the foreseeable future, but this merger will immediately open the door for our younger talent to participate in this process and I am already elated by the contributions they are making.
Our shareholders include our employees, our families and many of our in house advisory clients. In fact, these shareholders represent the bulk of the Fund, and that informs the way we manage it. We have a lot of eggs in this basket, so we watch it very carefully. In other words, we measure risk continuously because our assets in the Fund are pari passu with those of our shareholders. Of course, non-affiliated shareholders are welcome, indeed, more than welcome, but we do not actively seek them out because that could divert our attention from the task at hand. We’re focused on managing the Fund. However, independent investors occasionally do find us through their Financial Advisors when searching for the kind and quality of management we offer. We are long-term investors and so are our shareholders.
The year ahead should be an exciting one for your Fund. I know it will be for me. For a look at the year just past, see the portfolio manager comments in the pages that follow.
Sincerely,

Robert W. Kleinschmidt
Chairman
Annual Report | 1
The Tocqueville Fund
Dear Fellow Shareholder,
The twelve months which ended October 31, 2022, were particularly painful for investors as global equity markets declined sharply, fixed income assets fell as rates rose and most commodities finished lower. Investors struggled to adapt to the transition from quantitative easing, deflation via globalization, and technological changes in productivity to a new regime that investors are betting has structurally higher inflation and interest rates. To further complicate matters, investors needed to adapt to implications of a build-up in sovereign debt at global central banks, a higher dependency ratio from unfavorable demographics that yield structural shortages of workers and political forces that seek to address inequality as well as the inefficiencies that come from attempting to rely on competing energy supply chains both in fossil fuels and greener alternatives. The COVID pandemic and the war in Ukraine have served as inflection points in this transition and contributed to inflationary pressures as stimulus funneled helicopter money to consumers and Russia’s behavior has caused the realization that there is no going back to the ex-ante situation with respect to energy supply. U.S. markets seem particularly concerned that this transition is likely to result in lower corporate earnings and possibly Fed overreaction as most commodities and the yield curve are flashing caution. Most sectors of the S&P 500 were down during the period, with Energy, Healthcare and Consumer Staples being the bright spots and Communication Services, Consumer Discretionary and Real Estate each experiencing meaningful declines.
The Fund finished down 9.34% on a net basis, while the S&P 500, the Russell 1000 Value and the Russell 3000 Value decreased 14.61%, 7.00% and 7.25%, respectively. The sectors that contributed the most to the portfolio during the period were Energy, Healthcare, and Financials while the detractors were Information Technology, Communications Services, and Consumer Discretionary. The top performing names in the period were Chevron, Merck, Diamondback Energy, Aflac, and Deere while the laggards were Alphabet, NVIDIA, Microsoft, Amazon, and Applied Materials.
During the period, we purchased Intercontinental Exchange (“ICE”), a global exchange for equities and commodity and interest rate derivatives, a business which enjoys high barriers to entry and high operating margins and secular growth in activity. Shares have been under pressure due to concerns about the impact of rising rates on its mortgage related business, exposure to which has been expanded recently via acquisition. In our judgment, the market misunderstands the exposure of the business, which is largely dependent on number of loans outstanding rather than originations, has a growing percentage of recurring revenue and also underestimates the extent to which the business may benefit from volatility in commodity prices and interest rates. ICE’s founder and CEO has been highly successful as a capital allocator.
2 | October 31, 2022
We also purchased Adobe, the leading provider of content creation and management software whose shares had been one of the worst performers in the tech sector of late as investors pivoted away from higher multiple technology related names. Negative sentiment was compounded by the announced acquisition of Figma which was perceived to be expensive and perhaps a sign of weakness. Our take is that with the shares trading near the lows on both absolute and relative bases and well below our intrinsic value DCF model the market had overreacted, presenting us with the opportunity to buy what we believe will likely be an even stronger business with high margins and recurring revenue.
We also purchased Haliburton, Marvell Technologies, Occidental Petroleum and SM Energy and added to existing positions in Cameco, Newmont, Sibanye Stillwater, and Tejon Ranch.
A variety of names were trimmed or sold as price objectives were met, macroeconomic circumstances led us to change our thinking or to make room for other ideas. These included Activision, Alphabet, Amazon, Apple, Applied Materials, Berkshire Hathaway, Delta, DuPont, eBay, Expedia, Intel, NVIDIA, Pfizer, Tejon Ranch, Weyerhaeuser, and Woodside Energy.
It seems that with the withdrawal of central bank liquidity and recent investor frustration with passive investment led by subjective ESG factors as if we may have reached a point where perhaps the cliched strategies over the past few decades of buying and holding indices, diving in at every dip and rigid 60/40 asset allocations between equities and fixed income may have reached the point of limited utility. In our estimation, a strategy involving a careful selection of individual stocks seems likely to be more rewarding than maintaining positions in still concentrated indices and sector ETFs, which seem exposed to the risk of moving sideways for a long time as sector rotation changes with sentiment. Our investment objective remains to generate positive absolute returns and to exceed the returns of the major indices over the course of an economic cycle. To protect and grow your capital, we continue to seek compelling long-term investment opportunities in companies that have defensible business franchises, are out of favor or misunderstood, and trade at a substantial discount to intrinsic value.
Sincerely,
 | |  |
| | | |
| Robert W. Kleinschmidt | | Peter Shawn |
| Portfolio Manager | | Director of Research |
Annual Report | 3
The Tocqueville Fund
(Unaudited)
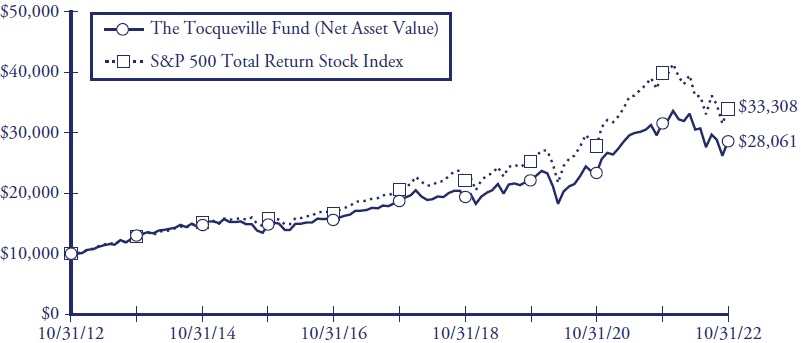
This chart assumes an initial gross investment of $10,000 made on 10/31/12. Returns shown do not reflect the deduction of taxes that a shareholder would pay on fund distributions or the redemption of fund shares. Performance reflects fee waivers in effect. In the absence of fee waivers, total return would be reduced. Returns shown include the reinvestment of all dividends and other distributions. Past performance is not predictive of future performance. Investment return and principal value will fluctuate so that your shares, when redeemed, may be worth more or less than their original cost.
The Standard & Poor’s 500 Total Return Stock Index (S&P 500) is a capital-weighted index, representing the aggregate market value of the common equity of 500 stocks primarily traded on the New York Stock Exchange. Returns assume the reinvestment of all dividends.
AVERAGE ANNUAL RATE OF RETURN (%)
FOR YEARS ENDED OCTOBER 31, 2022
| | | 1 Year | | | 3 Year | | | 5 Year | | | 10 Year | |
| The Tocqueville Fund | | | –9.34 | % | | | 8.78 | % | | | 8.57 | % | | | 10.87 | % |
| Standard & Poor’s 500 Total Return Stock Index | | | –14.61 | % | | | 10.22 | % | | | 10.44 | % | | | 12.79 | % |
4 | October 31, 2022
The Tocqueville Opportunity Fund
Dear Fellow Shareholder,
We are pleased to provide our investment overview for the fiscal year 2022. During the period which ended on October 31, 2022, the Tocqueville Opportunity Fund (“Fund”) declined 39.75% net of fees compared to the Russell 2500 Growth Index, which declined 27.38%.
Since our last update, three macroeconomic developments have occurred that negatively impacted equity markets: 1) the omicron variant of COVID-19 wreaked havoc on an already fragile supply chain; 2) Russia unexpectedly invaded Ukraine causing commodity prices to increase from already elevated levels; and 3) inflation as measured by the CPI reached levels not seen in 40 years. The consequence of these developments led the Federal Reserve to embark on a quantitative tightening cycle which entails raising short-term interest rates and reducing the size of its balance sheet. The combination of rising interest rates and persistently high inflation is weighing on business and consumer confidence and even caused the U.S. economy to unexpectedly shrink during the first two quarters of 2022. While the economy has rebounded, corporations are taking a more cautious approach to their outlooks, which includes reducing capital expenditures and announcing layoffs. Consumers are in a precarious position; the level of personal debt has not been this high since the great financial crisis and increasing interest rates make servicing this debt more expensive.
With inflation still at the top on the mind for investors and the Federal Reserve, the yield on risk free assets has increased dramatically. The yield on the 10-year treasury bond as of October 31, 2022, was approximately 4% which is an increase of 250bps year over year. This has caused investors to reallocate or rotate funds towards cyclical investments at the expense of growth-oriented investments. This rotation has caused Fund holdings in the Information Technology sector to underperform the broader market as valuation multiples have significantly compressed and now trade at significant discounts to pre-Covid valuations. Despite the valuation compression, the Fund continues to be overweight in Information Technology as we believe the long-term fundamentals remain intact.
While the Information Technology sector remains out of favor, we believe the opportunity set in front of many of our companies remains attractive. The quarterly results from our top holdings indicate customers are still spending money to get more productive and efficient through digital transformations. As an example, more employers are offering hybrid work solutions and are needing to rapidly invest to ensure their network is accessible, efficient, and secure. This has created demand for all sorts of software solutions related to the cloud such as workflow management and payroll processing. The Fund’s investments in Service Now and Paylocity are emblematic of these trends and are seeing accelerating demand for its products as a result. We continue to be long-term believers in these companies as they offer an attractive pay back to its users while delivering shareholders superior growth and strong recurring revenues with little to no churn.
Annual Report | 5
Investments in the Healthcare and Industrials sectors provided the leading contributions on a relative basis versus the benchmark. The Information Technology sector was the leading driver of relative underperformance versus the benchmark. Looking at individual securities Enphase Energy, LPL Financial, Booz Allen Hamilton, Fair Isaac, and Black Stone Minerals were the top contributors to performance while Shopify, ServiceNow, Okta, Workday, and Twilio were detractors from performance.
As always, we sincerely appreciate your continued support.
Sincerely,

Paul Lambert
Portfolio Manager
6 | October 31, 2022
The Tocqueville Opportunity Fund
(Unaudited)
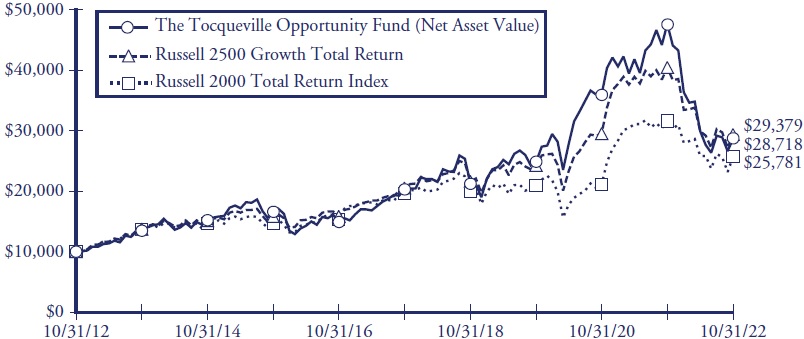
This chart assumes an initial gross investment of $10,000 made on 10/31/12. Returns shown do not reflect the deduction of taxes that a shareholder would pay on fund distributions or the redemption of fund shares. Returns shown include the reinvestment of all dividends and other distributions. Past performance is not predictive of future performance. Investment return and principal value will fluctuate so that your shares, when redeemed, may be worth more or less than their original cost.
The Russell 2500 Growth Total Return Index is an unmanaged index that measures the performance of the small to mid-cap growth segment of the U.S. equity universe. It includes those Russell 2500 companies with higher price-to-book ratios and higher forecasted growth values. Returns assume the reinvestment of all dividends.
AVERAGE ANNUAL RATE OF RETURN (%)
FOR YEARS ENDED OCTOBER 31, 2022
| | | 1 Year | | | 3 Year | | | 5 Year | | | 10 Year | |
| The Tocqueville Opportunity Fund | | | –39.75 | % | | | 4.86 | % | | | 7.25 | % | | | 11.13 | % |
| Russell 2500 Growth Total Return Index | | | –27.38 | % | | | 6.62 | % | | | 7.41 | % | | | 11.38 | % |
Annual Report | 7
The Tocqueville Phoenix Fund
Dear Fellow Shareholder,
For the fiscal year which ended October 31, 2022, the Tocqueville Phoenix Fund’s (“Fund”) net asset value decreased by 14.15%, versus a decrease of 10.73% for the Russell 2000 Value Index, and a decrease of 18.54% for the Russell 2000 Index, each on a total return basis.
The Fund, along with most major indices, suffered losses during the fiscal year as equity prices, for the most part, moved in tandem with economic data on inflation and comments from the Federal Reserve. The companies owned by the Fund are generally performing as we had expected entering the calendar year, with most of the decline in price being caused by multiple compression rather than earning revisions. While the fiscal year losses are disappointing, we feel confident that the companies owned have very good prospects, and are encouraged that insiders continue to purchase shares in many of them, supporting our belief that they are substantially undervalued at current prices.
The Federal Reserve continued its aggressive interest rate policy in the third quarter, raising the Federal Funds Rate by 75 basis points at both the July and September meetings. The rate of increase is the most since the 1980s, and may not be over, as commentary from Federal Reserve Chairman, Jerome Powell, suggests similar rate increases in future meetings. Most economists believe the Federal Funds discount rate will end 2022 in a range of 4-4.5%, a staggering 3.75-4.25% points higher than the beginning of the year. Unfortunately, such a rapid increase has led the U.S. into a period of economic contraction with GDP shrinking in both quarters reported so far this calendar year, and the U.S. dollar appreciating to levels never seen before against major currencies around the world. It appears that the Federal Reserve is more than willing to accept the repercussions of an economic recession in order to curtail inflation, which remains stubbornly above a 7% annual rate when last measured in August. The ramifications for the economy of such a committed inflation reduction strategy may well be painful. In the early 1980s, The Fed pursued a similar strategy to reduce consistently high levels of inflation that occurred in the 1970s. The result was two economic recessions and an unemployment rate that peaked at nearly 11% in late 1982. Over the long term, small-cap equities have been one of the few asset classes to outpace inflation, and investing during significant market drawdowns (such as the one we just experienced) has delivered exceptional returns. With that said, we remain focused on finding new companies in which to invest that meet our criteria.
The top three contributors to performance during the period were Lantheus Holdings, Cross Country Healthcare, and Tegna Inc., while the largest detractors were AMS-Osram, Stanley Black & Decker, and Harsco.
8 | October 31, 2022
We hope you are safe and with very best wishes.
Sincerely,
 | |  |
| James Maxwell | | Michael Sellecchia |
| Portfolio Manager | | Portfolio Manager |
Annual Report | 9
The Tocqueville Phoenix Fund
(Unaudited)
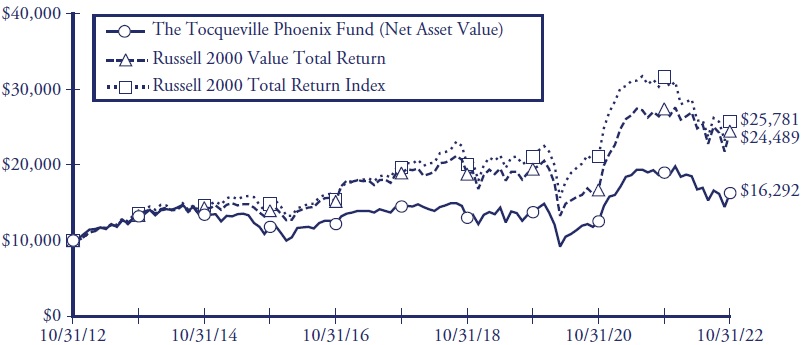
This chart assumes an initial gross investment of $10,000 made on 10/31/12. On February 15, 2019, The Delafield Fund’s name changed to The Tocqueville Phoenix Fund. Returns shown do not reflect the deduction of taxes that a shareholder would pay on fund distributions or the redemption of fund shares. Performance reflects fee waivers in effect. In the absence of fee waivers, total return would be reduced. Returns shown include the reinvestment of all dividends and other distributions. Past performance is not predictive of future performance. Investment return and principal value will fluctuate so that your shares, when redeemed, may be worth more or less than their original cost.
The Russell 2000 Value Total Return Index measures performance of the small cap value segment of the U.S. equity universe. Securities are categorized as growth or value based on their relative book-to-price ratios, historical sales growth, and expected earnings growth. Returns include the reinvestment of all dividends.
The Russell 2000 Total Return Index is an unmanaged index that measures the performance of the 2,000 smallest companies in the Russell 3000 Index, which represent approximately 10% of the total market capitalization of the Russell 3000 Index. Returns include the reinvestment of all dividends.
AVERAGE ANNUAL RATE OF RETURN (%)
FOR YEARS ENDED OCTOBER 31, 2022
| | | 1 Year | | | 3 Year | | | 5 Year | | | 10 Year | |
| The Tocqueville Phoenix Fund*(a) | | | –14.15 | % | | | 5.88 | % | | | 2.40 | % | | | 5.00 | % |
| Russell 2000 Value Total Return Index | | | –10.73 | % | | | 8.08 | % | | | 5.31 | % | | | 9.37 | % |
| Russell 2000 Total Return Index | | | –18.54 | % | | | 7.05 | % | | | 5.56 | % | | | 9.93 | % |
| * | Prior to February 15, 2019, the Fund’s name was The Delafield Fund. |
| (a) | On November 15, 2019, The Tocqueville Phoenix Fund acquired all the net assets of The Tocqueville Select Fund. |
10 | October 31, 2022
Expense Example—October 31, 2022 (Unaudited)
As a shareholder of The Tocqueville Trust (the “Funds”), you incur ongoing costs, including management fees; distribution fees; and other Fund expenses. This example is intended to help you understand your ongoing costs (in dollars) of investing in the Funds and to compare costs with the ongoing costs of investing in other mutual funds.
The Example is based on an investment of $1,000 invested at the beginning of the period and held the entire period (May 1, 2022 - October 31, 2022).
Actual Expenses
The first line of the table below provides information about actual account values and actual expenses. You may use the information in this line, together with the amount you invested, to estimate the expenses that you paid over the period. Simply divide your account value by $1,000 (for example, an $8,600 account value divided by $1,000 = 8.6), then multiply the result by the number in the first line under the heading entitled “Expenses Paid During Period” to estimate the expenses you paid on your account during this period.
Hypothetical Example for Comparison Purposes
The second line of the table below provides information about hypothetical account values and hypothetical expenses based on the Funds’ actual expense ratios and an assumed rate of return of 5% per year before expenses, which is not the Funds’ actual return. The hypothetical account values and expenses may not be used to estimate the actual ending account balance or expenses you paid for the period. You may use this information to compare the ongoing costs of investing in the Funds and other funds. To do so, compare this 5% hypothetical example with the 5% hypothetical examples that appear in the shareholder reports of the other funds.
Please note that the expenses shown in the table are meant to highlight your ongoing costs only and do not reflect any transactional costs, such as sales charges (loads), redemption fees, or exchange fees. Therefore, the second line of the table is useful in comparing ongoing costs only, and will not help you determine the relative costs of owning different funds. In addition, if these transactional costs were included, your costs would have been higher.
Annual Report | 11
Expense Example Tables (Unaudited)
The Tocqueville Fund
| | |
| |
| | Expenses Paid |
| | | Beginning | | Ending | | During Period* |
| | | Account Value | | Account Value | | May 1, 2022 - |
| | | May 1, 2022 | | October 31, 2022 | | October 31, 2022 |
| Actual | | $1,000.00 | | | $ 939.00 | | | $6.11 | |
| Hypothetical (5% return before expenses) | | 1,000.00 | | | 1,018.90 | | | 6.36 | |
| * | Expenses are equal to the Fund’s annualized six-month expense ratio (including interest expense) of 1.25% for The Tocqueville Fund, multiplied by the average account value over the period, multiplied by 184/365 to reflect the one-half year period. |
The Tocqueville Opportunity Fund
| | |
| |
| | Expenses Paid |
| | | Beginning | | Ending | | During Period* |
| | | Account Value | | Account Value | | May 1, 2022 - |
| | | May 1, 2022 | | October 31, 2022 | | October 31, 2022 |
| Actual | | $1,000.00 | | | $ 958.50 | | | $6.17 | |
| Hypothetical (5% return before expenses) | | 1,000.00 | | | 1,018.90 | | | 6.36 | |
| * | Expenses are equal to the Fund’s annualized six-month expense ratio (including interest expense) of 1.25% for The Tocqueville Opportunity Fund, multiplied by the average account value over the period, multiplied by 184/365 to reflect the one-half year period. |
The Tocqueville Phoenix Fund
| | |
| |
| | Expenses Paid |
| | | Beginning | | Ending | | During Period* |
| | | Account Value | | Account Value | | May 1, 2022 - |
| | | May 1, 2022 | | October 31, 2022 | | October 31, 2022 |
| Actual | | $1,000.00 | | | $ 973.40 | | | $6.22 | |
| Hypothetical (5% return before expenses) | | 1,000.00 | | | 1,018.90 | | | 6.36 | |
| * | Expenses are equal to the Fund’s annualized six-month expense ratio (including interest expense) of 1.25% for The Tocqueville Phoenix Fund, multiplied by the average account value over the period, multiplied by 184/365 to reflect the one-half year period. |
12 | October 31, 2022
The Tocqueville Fund
Financial Highlights
| Per share operating performance | | Years Ended October 31, | |
| (For a share outstanding throughout the year) | | 2022 | | | 2021 | | | 2020 | | | 2019 | | | 2018 | |
| Net asset value, beginning of year | | $ | 48.39 | | | $ | 37.03 | | | $ | 37.80 | | | $ | 35.84 | | | $ | 38.60 | |
| Operations: | | | | | | | | | | | | | | | | | | | | |
| Net investment income (1) | | | 0.43 | | | | 0.25 | | | | 0.31 | | | | 0.43 | | | | 0.35 | |
| Net realized and unrealized gain | | | (4.30 | ) | | | 12.49 | | | | 1.58 | | | | 4.46 | | | | 0.45 | |
| Total from investment operations | | | (3.87 | ) | | | 12.74 | | | | 1.89 | | | | 4.89 | | | | 0.80 | |
| Distributions to shareholders: | | | | | | | | | | | | | | | | | | | | |
| Dividends from net investment income | | | (0.20 | ) | | | (0.25 | ) | | | (0.37 | ) | | | (0.34 | ) | | | (0.33 | ) |
| Distributions from net realized gains | | | (4.77 | ) | | | (1.13 | ) | | | (2.29 | ) | | | (2.59 | ) | | | (3.23 | ) |
| Total distributions | | | (4.97 | ) | | | (1.38 | ) | | | (2.66 | ) | | | (2.93 | ) | | | (3.56 | ) |
| Change in net asset value for the year | | | (8.84 | ) | | | 11.36 | | | | (0.77 | ) | | | 1.96 | | | | (2.76 | ) |
| Net asset value, end of year | | $ | 39.55 | | | $ | 48.39 | | | $ | 37.03 | | | $ | 37.80 | | | $ | 35.84 | |
| Total Return | | | -9.3 | % | | | 35.2 | % | | | 5.0 | % | | | 14.9 | % | | | 2.0 | % |
| Ratios/supplemental data | | | | | | | | | | | | | | | | | | | | |
| Net assets, end of year (000) | | $ | 258,843 | | | $ | 313,739 | | | $ | 251,096 | | | $ | 285,070 | | | $ | 272,043 | |
| Ratio to average net assets: | | | | | | | | | | | | | | | | | | | | |
| Expenses before waiver | | | 1.33 | % | | | 1.34 | % | | | 1.38 | % | | | 1.30 | % | | | 1.26 | % |
| Expenses after waiver | | | 1.25 | %(2) | | 1.25 | % | | | 1.25 | % | | | 1.25 | %(3) | | 1.25 | % |
| Net investment income before waiver | | | 0.91 | % | | | 0.46 | % | | | 0.69 | % | | | 1.11 | % | | | 0.91 | % |
| Net investment income after waiver | | | 0.99 | % | | | 0.55 | % | | | 0.82 | % | | | 1.16 | % | | | 0.92 | % |
| Portfolio turnover rate | | | 6 | % | | | 11 | % | | | 9 | % | | | 13 | % | | | 19 | % |
| (1) | Net investment income per share is calculated using the ending balance prior to consideration or adjustment for permanent book-to-tax differences. |
| (2) | Effective October 1, 2022, the Tocqueville Fund reduced the operating expense limit from 1.25% to 1.20%. |
| (3) | Includes 0.01% of interest expense which is not included in the Fund’s operating expense cap. |
The Accompanying Notes are an Integral Part of these Financial Statements.
Annual Report | 13
The Tocqueville Opportunity Fund
Financial Highlights
| Per share operating performance | | Years Ended October 31, | |
| (For a share outstanding throughout the year) | | 2022 | | | 2021 | | | 2020 | | | 2019 | | | 2018 | |
| Net asset value, beginning of year | | $ | 49.05 | | | $ | 38.34 | | | $ | 28.11 | | | $ | 26.60 | | | $ | 26.12 | |
| Operations: | | | | | | | | | | | | | | | | | | | | |
| Net investment loss (1) | | | (0.38 | ) | | | (0.53 | ) | | | (0.40 | ) | | | (0.29 | ) | | | (0.29 | ) |
| Net realized and unrealized gain (loss) | | | (18.19 | ) | | | 12.76 | | | | 12.29 | | | | 4.29 | | | | 1.63 | |
| Total from investment operations | | | (18.57 | ) | | | 12.23 | | | | 11.89 | | | | 4.00 | | | | 1.34 | |
| Distributions to shareholders: | | | | | | | | | | | | | | | | | | | | |
| Dividends from net investment income | | | — | | | | — | | | | — | | | | — | | | | — | |
| Distributions from net realized gains | | | (2.74 | ) | | | (1.52 | ) | | | (1.66 | ) | | | (2.49 | ) | | | (0.86 | ) |
| Total distributions | | | (2.74 | ) | | | (1.52 | ) | | | (1.66 | ) | | | (2.49 | ) | | | (0.86 | ) |
| Change in net asset value for the year | | | (21.31 | ) | | | 10.71 | | | | 10.23 | | | | 1.51 | | | | 0.48 | |
| Net asset value, end of year | | $ | 27.74 | | | $ | 49.05 | | | $ | 38.34 | | | $ | 28.11 | | | $ | 26.60 | |
| Total Return | | | (39.8 | )% | | | 32.6 | % | | | 44.3 | % | | | 16.9 | % | | | 5.3 | % |
| Ratios/supplemental data | | | | | | | | | | | | | | | | | | | | |
| Net assets, end of year (000) | | $ | 55,558 | | | $ | 111,189 | | | $ | 91,147 | | | $ | 84,583 | | | $ | 82,106 | |
| Ratio to average net assets: | | | | | | | | | | | | | | | | | | | | |
| Expenses before waiver | | | 1.42 | % | | | 1.40 | % | | | 1.49 | % | | | 1.41 | % | | | 1.33 | % |
| Expenses after waiver | | | 1.25 | % | | | 1.26 | %(2) | | 1.26 | %(2) | | 1.28 | %(2) | | 1.26 | %(2) |
| Net investment income before waiver | | | (1.21 | )% | | | (1.28 | )% | | | (1.18 | )% | | | (1.10 | )% | | | (1.13 | )% |
| Net investment income after waiver | | | (1.04 | )% | | | (1.13 | )% | | | (0.95 | )% | | | (0.97 | )% | | | (1.06 | )% |
| Portfolio turnover rate | | | 14 | % | | | 20 | % | | | 30 | % | | | 133 | % | | | 151 | % |
| (1) | Net investment loss per share is calculated using the ending balance prior to consideration or adjustment for permanent book-to-tax differences. |
| (2) | Includes interest expense of 0.01% for the year ended October 31, 2021, 0.01% for the year ended October 31, 2020, 0.03% for the year ended October 31, 2019, and 0.01% for the year ended October 31, 2018. Interest expense is not included in the Fund’s operating expense cap. |
The Accompanying Notes are an Integral Part of these Financial Statements.
14 | October 31, 2022
The Tocqueville Phoenix Fund
Financial Highlights
| Per share operating performance | | Years Ended October 31, | |
| (For a share outstanding throughout the year) | | 2022 | | | 2021 | | | 2020 | | | 2019 | | | 2018 | |
| Net asset value, beginning of year | | $ | 26.53 | | | $ | 17.67 | | | $ | 19.98 | | | $ | 20.20 | | | $ | 26.40 | |
| Operations: | | | | | | | | | | | | | | | | | | | | |
| Net investment loss (1) | | | (0.12 | ) | | | (0.16 | ) | | | (0.03 | ) | | | (0.03 | ) | | | (0.14 | ) |
| Net realized and unrealized gain (loss) | | | (3.18 | ) | | | 9.40 | | | | (1.81 | ) | | | 1.16 | | | | (2.27 | ) |
| Total from investment operations | | | (3.30 | ) | | | 9.24 | | | | (1.84 | ) | | | 1.13 | | | | (2.41 | ) |
| Distributions to shareholders: | | | | | | | | | | | | | | | | | | | | |
| Dividends from net investment income | | | — | | | | — | | | | — | | | | — | (2) | | | — | |
| Distributions from net realized gains | | | (2.75 | ) | | | (0.38 | ) | | | (0.47 | ) | | | (1.35 | ) | | | (3.79 | ) |
| Total distributions | | | (2.75 | ) | | | (0.38 | ) | | | (0.47 | ) | | | (1.35 | ) | | | (3.79 | ) |
| Change in net asset value for the year | | | (6.05 | ) | | | 8.86 | | | | (2.31 | ) | | | (0.22 | ) | | | (6.20 | ) |
| Net asset value, end of year | | $ | 20.48 | | | $ | 26.53 | | | $ | 17.67 | | | $ | 19.98 | | | $ | 20.20 | |
| Total Return | | | (14.2 | )% | | | 52.8 | % | | | (9.5 | )% | | | 6.2 | % | | | (10.6 | )% |
| Ratios/supplemental data | | | | | | | | | | | | | | | | | | | | |
| Net assets, end of year (000) | | $ | 130,184 | | | $ | 177,082 | | | $ | 131,658 | | | $ | 160,433 | | | $ | 237,119 | |
| Ratio to average net assets: | | | | | | | | | | | | | | | | | | | | |
| Expenses before waiver | | | 1.45 | % | | | 1.43 | % | | | 1.50 | % | | | 1.39 | % | | | 1.32 | % |
| Expenses after waiver | | | 1.25 | % | | | 1.25 | % | | | 1.25 | % | | | 1.25 | % | | | 1.25 | % |
| Net investment income before waiver | | | (0.71 | )% | | | (0.78 | )% | | | (0.41 | )% | | | (0.24 | )% | | | (0.55 | )% |
| Net investment income after waiver/reimbursement | | | (0.50 | )% | | | (0.60 | )% | | | (0.16 | )% | | | (0.10 | )% | | | (0.48 | )% |
| Portfolio turnover rate | | | 15 | % | | | 21 | % | | | 24 | % | | | 40 | % | | | 40 | % |
| (1) | Net investment loss per share is calculated using the ending balance prior to consideration or adjustment for permanent book-to-tax differences. |
| (2) | Represents less than $0.01. |
The Accompanying Notes are an Integral Part of these Financial Statements.
Annual Report | 15
The Tocqueville Fund
Schedule of Investments as of October 31, 2022
| Common Stocks—97.6% | | Shares | | | Value | |
| Banks—1.7% | | | | | | | | |
| Bank of America Corp. | | | 120,000 | | | $ | 4,324,800 | |
| Capital Goods—8.9% | | | | | | | | |
| Caterpillar, Inc. | | | 25,000 | | | | 5,411,500 | |
| Deere & Co. | | | 20,000 | | | | 7,916,400 | |
| Illinois Tool Works, Inc. | | | 25,000 | | | | 5,338,250 | |
| Parker-Hannifin Corp. | | | 15,000 | | | | 4,359,300 | |
| | | | | | | | 23,025,450 | |
| Commercial & Professional Services—2.6% |
| Republic Services, Inc. | | | 40,000 | | | | 5,304,800 | |
| Steelcase, Inc.—Class A | | | 200,000 | | | | 1,554,000 | |
| | | | | | | | 6,858,800 | |
| Consumer Services—2.6% | | | | | | | | |
| McDonald’s Corp. | | | 25,000 | | | | 6,816,500 | |
| Diversified Financials—3.3% | | | | | | | | |
| Intercontinental Exchange, Inc. | | | 5,000 | | | | 477,850 | |
| The Charles Schwab Corp. | | | 100,000 | | | | 7,967,000 | |
| | | | | | | | 8,444,850 | |
| Energy—9.4% | | | | | | | | |
| Cameco Corp.—ADR(a) | | | 50,000 | | | | 1,186,000 | |
| Chevron Corp. | | | 40,000 | | | | 7,236,000 | |
| Diamondback Energy, Inc. | | | 40,000 | | | | 6,284,400 | |
| Halliburton Co. | | | 100,000 | | | | 3,642,000 | |
| Occidental Petroleum Corp. | | | 50,000 | | | | 3,630,000 | |
| SM Energy Co. | | | 50,000 | | | | 2,249,000 | |
| | | | | | | | 24,227,400 | |
| Food & Staples Retailing—2.5% | | | | | | | | |
| Walmart, Inc. | | | 45,000 | | | | 6,404,850 | |
| Food, Beverage & Tobacco—2.3% | | | | | | | | |
| The Coca-Cola Co. | | | 100,000 | | | | 5,985,000 | |
| Health Care Equipment & Services—1.9% |
| Abbott Laboratories | | | 50,000 | | | | 4,947,000 | |
| Household & Personal Products—5.5% | | | | | | | | |
| Colgate-Palmolive Co. | | | 100,000 | | | | 7,384,000 | |
| The Procter & Gamble Co. | | | 50,000 | | | | 6,733,500 | |
| | | | | | | | 14,117,500 | |
| Insurance—2.5% | | | | | | | | |
| Aflac, Inc. | | | 100,000 | | | | 6,511,000 | |
| Materials—12.7% | | | | | | | | |
| BHP Group Ltd.—ADR(a) | | | 50,000 | | | | 2,391,000 | |
| Dow, Inc. | | | 40,000 | | | | 1,869,600 | |
| Freeport-McMoRan, Inc. | | | 100,000 | | | | 3,169,000 | |
| Newmont Mining Corp. | | | 60,000 | | | | 2,539,200 | |
| Nutrien Ltd.(a) | | | 50,000 | | | | 4,225,000 | |
| Pan American Silver Corp.—ADR(a) | | | 100,000 | | | | 1,598,000 | |
| Sibanye Stillwater Ltd.— ADR(a) | | | 150,000 | | | | 1,408,500 | |
| Sonoco Products Co. | | | 75,000 | | | | 4,656,000 | |
| South32 Ltd.—ADR(a) | | | 100,000 | | | | 1,140,000 | |
| Vulcan Materials Co. | | | 40,000 | | | | 6,548,000 | |
| Wheaton Precious Metals Corp.—ADR(a) | | | 100,000 | | | | 3,269,000 | |
| | | | | | | | 32,813,300 | |
| Media & Entertainment—4.8% | | | | | | | | |
| Alphabet, Inc.—Class A(b) | | | 75,000 | | | | 7,088,250 | |
| The Walt Disney Co.(b) | | | 50,000 | | | | 5,327,000 | |
| | | | | | | | 12,415,250 | |
| Pharmaceuticals, Biotechnology & Life Sciences—8.0% | | | | | | | | |
| Johnson & Johnson | | | 20,000 | | | | 3,479,400 | |
| Merck & Co., Inc. | | | 100,000 | | | | 10,120,000 | |
| Pfizer, Inc. | | | 150,000 | | | | 6,982,500 | |
| | | | | | | | 20,581,900 | |
| Retailing—2.0% | | | | | | | | |
| Amazon.com, Inc.(b) | | | 50,000 | | | | 5,122,000 | |
| Semiconductors & Semiconductor Equipment—8.0% |
| Applied Materials, Inc. | | | 70,000 | | | | 6,180,300 | |
| Intel Corp. | | | 90,000 | | | | 2,558,700 | |
| Marvell Technology, Inc. | | | 32,000 | | | | 1,269,760 | |
| NVIDIA Corp. | | | 35,000 | | | | 4,723,950 | |
| QUALCOMM, Inc. | | | 50,000 | | | | 5,883,000 | |
| | | | | | | | 20,615,710 | |
| Software & Services—7.9% | | | | | | | | |
| Adobe, Inc.(b) | | | 5,000 | | | | 1,592,500 | |
| Automatic Data Processing, Inc. | | | 40,000 | | | | 9,668,000 | |
| Microsoft Corp. | | | 40,000 | | | | 9,285,200 | |
| | | | | | | | 20,545,700 | |
| Technology Hardware & Equipment—3.8% |
| Apple, Inc. | | | 65,000 | | | | 9,967,100 | |
The Accompanying Footnotes are an Integral Part of these Financial Statements.
16 | October 31, 2022
The Tocqueville Fund
Schedule of Investments as of October 31, 2022
| Common Stocks—97.6% | | Shares | | | Value | |
| Telecommunication Services—1.4% | | | |
| Verizon Communications, Inc. | | | 100,000 | | | $ | 3,737,000 | |
| Utilities—5.8% | | | | | | | | |
| Dominion Energy, Inc. | | | 50,000 | | | | 3,498,500 | |
| NextEra Energy, Inc. | | | 150,000 | | | | 11,625,000 | |
| | | | | | | | 15,123,500 | |
| Total Common Stocks | | | | | | | | |
| (Cost $108,310,494) | | | | | | | 252,584,610 | |
| Real Estate Investment Trust (REIT)—2.1% |
| Real Estate—2.1% | | | | | | | | |
| Weyerhaeuser Co. | | | 175,000 | | | | 5,412,750 | |
| Total Real Estate Investment Trust | | | | | | | | |
| (Cost $3,359,578) | | | | | | | 5,412,750 | |
| Short-Term Investment—0.3% | | | | | | | | |
| Money Market Mutual Fund—0.3% | | | | | | | | |
| STIT Treasury Portfolio—Instutional Class, 3.048%(c) | | | 832,226 | | | | 832,226 | |
| Total Short-Term Investment | | | | | | | | |
| (Cost $832,226) | | | | | | | 832,226 | |
| Total Investments | | | | | | | | |
| (Cost $112,502,298)—100.0% | | | | | | | 258,829,586 | |
| Other Assets in Excess of Liabilities—0.0% | | | | | | | 13,305 | |
| Total Net Assets—100.0% | | | | | | $ | 258,842,891 | |
Percentages are stated as a percent of net assets.
ADR American Depositary Receipt
| (a) | Foreign issued Security. Foreign Concentration (including ADR’s) was as follows: Australia 1.4%; Canada 4%; South Africa 0.5%. |
| (b) | Non-income producing security. |
| (c) | Rate listed is the 7-day effective yield. |
The Global Industry Classification Standard (GICS®) was developed by and/or is the exclusive property of MSCI, Inc. and Standard & Poor Financial Services LLC (“S&P”). GICS is a service mark of MSCI and S&P and has been licensed for use by U.S. Bank Global Fund Services.
The Accompanying Footnotes are an Integral Part of these Financial Statements.
Annual Report | 17
The Tocqueville Opportunity Fund
Schedule of Investments as of October 31, 2022
| Common Stocks—91.5% | | Shares | | | Value | |
| Capital Goods—8.3% | | | | | | | | |
| Advanced Drainage Systems, Inc. | | | 2,500 | | | $ | 289,700 | |
| Dover Corp. | | | 2,000 | | | | 261,380 | |
| HEICO Corp. | | | 3,843 | | | | 625,026 | |
| Hubbell, Inc. | | | 2,500 | | | | 593,700 | |
| IDEX Corp. | | | 2,500 | | | | 555,775 | |
| Masco Corp. | | | 6,000 | | | | 277,620 | |
| Nordson Corp. | | | 2,000 | | | | 450,000 | |
| nVent Electric Plc—ADR(a) | | | 10,000 | | | | 365,000 | |
| PGT Innovations, Inc.(b) | | | 50,000 | | | | 1,065,500 | |
| WillScot Mobile Mini Holdings Corp.(b) | | | 3,000 | | | | 127,590 | |
| | | | | | | | 4,611,291 | |
| Commercial & Professional Services—11.9% |
| Booz Allen Hamilton Holding Corp. | | | 6,500 | | | | 707,525 | |
| Cintas Corp. | | | 3,500 | | | | 1,496,425 | |
| Copart, Inc.(b) | | | 7,000 | | | | 805,140 | |
| CoStar Group, Inc.(b) | | | 10,000 | | | | 827,200 | |
| Exponent, Inc. | | | 5,000 | | | | 476,300 | |
| TransUnion | | | 8,500 | | | | 503,795 | |
| Verisk Analytics, Inc. | | | 4,000 | | | | 731,320 | |
| Waste Connections, Inc.— ADR(a) | | | 8,000 | | | | 1,055,280 | |
| | | | | | | | 6,602,985 | |
| Consumer Durables & Apparel—0.5% | | | | | | | | |
| TopBuild Corp.(b) | | | 1,500 | | | | 255,210 | |
| Consumer Services—0.2% | | | | | | | | |
| Choice Hotels International, Inc. | | | 1,000 | | | | 129,840 | |
| Restaurant Brands International LP(b) | | | 37 | | | | 2,236 | |
| | | | | | | | 132,076 | |
| Diversified Financials—4.8% | | | | | | | | |
| Apollo Global Management, Inc. | | | 5,000 | | | | 276,800 | |
| LPL Financial Holdings, Inc. | | | 2,500 | | | | 639,125 | |
| MarketAxess Holdings, Inc. | | | 1,250 | | | | 305,050 | |
| MSCI, Inc. | | | 2,000 | | | | 937,720 | |
| Tradeweb Markets, Inc. | | | 9,000 | | | | 495,720 | |
| | | | | | | | 2,654,415 | |
| Energy—1.4% | | | | | | | | |
| Black Stone Minerals LP | | | 43,104 | | | | 791,820 | |
| Health Care Equipment & Services—14.1% |
| DexCom, Inc.(b) | | | 28,000 | | | | 3,381,840 | |
| IDEXX Laboratories, Inc.(b) | | | 2,800 | | | | 1,007,104 | |
| Insulet Corp.(b) | | | 5,600 | | | | 1,449,336 | |
| Intuitive Surgical, Inc.(b) | | | 1,950 | | | | 480,616 | |
| Shockwave Medical, Inc.(b) | | | 1,200 | | | | 351,780 | |
| Tandem Diabetes Care, Inc.(b) | | | 4,500 | | | | 252,675 | |
| Veeva Systems, Inc.—Class A(b) | | | 5,500 | | | | 923,670 | |
| | | | | | | | 7,847,021 | |
| Pharmaceuticals, Biotechnology & Life Sciences—4.5% |
| Bio-Techne Corp. | | | 1,200 | | | | 355,512 | |
| Charles River Laboratories International, Inc.(b) | | | 2,400 | | | | 509,400 | |
| Genmab A/S(b)(a) | | | 3,000 | | | | 1,156,312 | |
| Neurocrine Biosciences, Inc.(b) | | | 4,000 | | | | 460,480 | |
| | | | | | | | 2,481,704 | |
| Retailing—2.0% | | | | | | | | |
| Murphy USA, Inc. | | | 800 | | | | 251,608 | |
| Pool Corp. | | | 2,750 | | | | 836,633 | |
| | | | | | | | 1,088,241 | |
| Software & Services—43.4% | | | | | | | | |
| ANSYS, Inc.(b) | | | 1,500 | | | | 331,740 | |
| Aspen Technology, Inc.(b) | | | 840 | | | | 202,818 | |
| Cadence Design Systems, Inc.(b) | | | 5,000 | | | | 756,950 | |
| EPAM Systems, Inc.(b) | | | 3,500 | | | | 1,225,000 | |
| Fair Isaac Corp.(b) | | | 1,500 | | | | 718,260 | |
| Fiserv, Inc.(b) | | | 2,300 | | | | 236,302 | |
| Fortinet, Inc.(b) | | | 22,500 | | | | 1,286,100 | |
| MongoDB, Inc.(b) | | | 2,500 | | | | 457,575 | |
| Paycom Software, Inc.(b) | | | 9,800 | | | | 3,390,800 | |
| Paylocity Holding Corp.(b) | | | 22,500 | | | | 5,215,275 | |
| ServiceNow, Inc.(b) | | | 13,000 | | | | 5,469,620 | |
| Shopify, Inc.—Class A—ADR(b)(a) | | | 56,500 | | | | 1,933,995 | |
| Tyler Technologies, Inc.(b) | | | 1,000 | | | | 323,330 | |
| Workday, Inc.—Class A(b) | | | 16,500 | | | | 2,571,030 | |
| | | | | | | | 24,118,795 | |
The Accompanying Footnotes are an Integral Part of these Schedules of Investments.
18 | October 31, 2022
The Tocqueville Opportunity Fund
Schedule of Investments as of October 31, 2022
| Common Stocks—91.5% | | Shares | | | Value | |
| Transportation—0.4% | | | | | | | | |
| Saia, Inc.(b) | | | 1,200 |
| | $ | 238,632 | |
| Total Common Stocks | | | | | | | | |
| (Cost $21,045,326) | | | | | | | 50,822,190 | |
| Short-Term Investment—2.9% | | | | | | | | |
| Money Market Fund—2.9% | | | | | | | | |
| STIT Treasury Portfolio Institutional Class, 3.048%(c) | | | 1,585,815 | | | | 1,585,815 | |
| Total Short-Term Investment | | | | | | | | |
| (Cost $1,585,815) | | | | | | | 1,585,815 | |
| Total Investments | | | | | | | | |
| (Cost $22,631,141)—94.3% | | | | | | | 52,408,005 | |
| Other Assets in Excess of Liabilities—5.7% | | | | | | | 3,150,125 | |
| Total Net Assets—100.0% | | | | | | $ | 55,558,130 | |
Percentages are stated as a percent of net assets.
ADR American Depositary Receipt
| (a) | Foreign issued Security. Foreign Concentration (including ADR’s) was as follows: Canada 5.4%, Denmark 2.1%, Ireland 0.7% |
| (b) | Non-income producing security. |
| (c) | Rate listed is the 7-day effective yield. |
The Accompanying Footnotes are an Integral Part of these Schedules of Investments.
Annual Report | 19
The Tocqueville Phoenix Fund
Schedule of Investments as of October 31, 2022
| Common Stocks—89.6% | | Shares | | | Value | |
| Auto Components—5.6% | | | | | | | | |
| Lear Corp. | | | 15,000 | | | $ | 2,080,651 | |
| Modine Manufacturing Co.(a) | | | 70,000 | | | | 1,254,400 | |
| Visteon Corp.(a) | | | 31,000 | | | | 4,044,570 | |
| | | | | | | | 7,379,620 | |
| Building Products—4.8% | | | | | | | | |
| Apogee Enterprises, Inc. | | | 135,000 | | | | 6,193,800 | |
| Chemicals—9.7% | | | | | | | | |
| Avient Corp. | | | 70,000 | | | | 2,414,300 | |
| Innospec, Inc. | | | 29,000 | | | | 2,899,710 | |
| Orion Engineered Carbons SA—ADR(b) | | | 455,000 | | | | 7,261,800 | |
| | | | | | | | 12,575,810 | |
| Commercial Services & Supplies—3.6% | | | | | | | | |
| ABM Industries, Inc. | | | 105,000 | | | | 4,673,550 | |
| Communications Equipment—4.7% | | | | | | | | |
| Lumentum Holdings, Inc.(a) | | | 83,000 | | | | 6,179,350 | |
| Electronic Equipment, Instruments & Components—21.8% | | | | | | | | |
| Fabrinet—ADR(a)(b) | | | 62,100 | | | | 7,104,240 | |
| Flex Ltd.—ADR(a)(b) | | | 415,000 | | | | 8,125,700 | |
| Knowles Corp.(a) | | | 85,000 | | | | 1,168,750 | |
| Plexus Corp.(a) | | | 60,000 | | | | 5,904,000 | |
| TTM Technologies, Inc.(a) | | | 400,000 | | | | 6,124,000 | |
| | | | | | | | 28,426,690 | |
| Food Products—5.5% | | | | | | | | |
| Farmer Brothers Co.(a) | | | 550,000 | | | | 3,300,000 | |
| Landec Corp.(a) | | | 388,700 | | | | 3,867,565 | |
| | | | | | | | 7,167,565 | |
| Health Care Equipment & Supplies—3.0% |
| Inogen, Inc.(a) | | | 175,000 | | | | 3,965,500 | |
| Health Care Providers & Services—5.4% | | | | | | | | |
| Cross Country Healthcare, Inc.(a) | | | 190,000 | | | | 7,047,100 | |
| Household Durables—0.6% | | | | | | | | |
| Newell Brands, Inc. | | | 55,000 | | | | 759,550 | |
| Interactive Media & Services—4.4% | | | | | | | | |
| Cars.com, Inc.(a) | | | 413,500 | | | | 5,739,380 | |
| IT Services—4.1% | | | | | | | | |
| DXC Technology Co.(a) | | | 124,000 | | | | 3,565,000 | |
| Unisys Corp.(a) | | | 204,598 | | | | 1,739,083 | |
| | | | | | | | 5,304,083 | |
| Machinery—7.4% | | | | | | | | |
| Crane Holdings Co. | | | 57,500 | | | | 5,769,550 | |
| Mayville Engineering Co., Inc.(a) | | | 426,311 | | | | 2,834,968 | |
| REV Group, Inc. | | | 75,000 | | | | 1,030,500 | |
| | | | | | | | 9,635,018 | |
| Professional Services—3.2% | | | | | | | | |
| BGSF, Inc. | | | 300,000 | | | | 3,771,000 | |
| Mistras Group, Inc.(a) | | | 80,000 | | | | 368,000 | |
| | | | | | | | 4,139,000 | |
| Semiconductors & Semiconductor Equipment—2.4% | | | | | | | | |
| ams AG(a)(b) | | | 550,000 | | | | 3,117,591 | |
| Trading Companies & Distributors—3.4% |
| Rush Enterprises, Inc.—Class A | | | 88,000 | | | | 4,390,320 | |
| Total Common Stocks | | | | | | | | |
| (Cost $91,338,991) | | | | | | | 116,693,928 | |
| Short-Term Investment 4.5% | | | | | | | | |
| Money Market Fund—4.5% | | | | | | | | |
| STIT Treasury Portfolio—Instutional Class, 3.048%(c) | | | 5,853,794 | | | | 5,853,794 | |
| Total Short-Term Investment | | | | | | | | |
| (Cost $5,853,794) | | | | | | | 5,853,794 | |
| Total Investments | | | | | | | | |
| (Cost $97,192,785)—94.1% | | | | | | | 122,547,722 | |
| Other Assets in Excess of Liabilities—5.9% | | | | | | | 7,636,362 | |
| Total Net Assets—100.0% | | | | | | $ | 130,184,084 | |
Percentages are stated as a percent of net assets.
ADR American Depositary Receipt
| (a) | Non-income producing security. |
| (b) | Foreign issued Security. Foreign Concentration (including ADR’s) was as follows: Luxembourg 5.6%; Singapore 6.2%; Cayman Islands 5.5%; Austria 2.4%. |
| (c) | Rate listed is the 7-day effective yield. |
The Accompanying Footnotes are an Integral Part of these Schedules of Investments.
20 | October 31, 2022
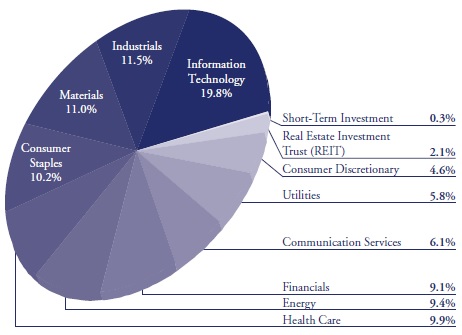
Percent of Total Investments (Unaudited)
The Tocqueville Fund
Allocation of Portfolio Holdings
October 31, 2022
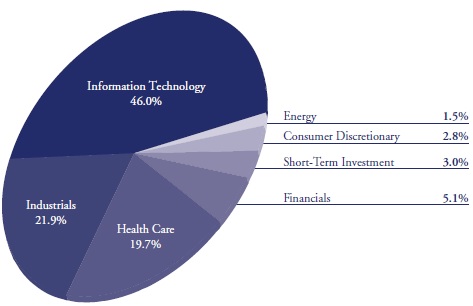
The Tocqueville Opportunity Fund
Allocation of Portfolio Holdings
October 31, 2022
Annual Report | 21
Percent of Total Investments (Unaudited)
The Tocqueville Phoenix Fund
Allocation of Portfolio Holdings
October 31, 2022

22 | October 31, 2022
The Tocqueville Trust
Statements of Assets and Liabilities
October 31, 2022
| | | The
Tocqueville
Fund | | | The
Tocqueville
Opportunity
Fund | | | The
Tocqueville
Phoenix
Fund | |
| Assets: | | | | | | | | | | | | |
| Investments, at value (1) | | $ | 258,829,586 | | | $ | 52,408,005 | | | $ | 122,547,722 | |
| Cash cash equivalents | | | — | | | | — | | | | 7,732,193 | |
| Receivable for investments sold | | | — | | | | 3,210,846 | | | | — | |
| Receivable for Fund shares sold | | | 26,418 | | | | 19,763 | | | | 3,546 | |
| Dividends, interest and other receivables | | | 270,761 | | | | 7,414 | | | | 68,419 | |
| Other assets | | | 22,042 | | | | 12,697 | | | | 13,147 | |
| Total Assets | | | 259,148,807 | | | | 55,658,725 | | | | 130,365,027 | |
| Liabilities: | | | | | | | | | | | | |
| Payable for Fund shares redeemed | | | 1,377 | | | | 516 | | | | 13,846 | |
| Payable to Adviser | | | 125,515 | | | | 42,482 | | | | 67,339 | |
| Payable to Administrator | | | 40,065 | | | | 8,529 | | | | 12,588 | |
| Payable to Trustees | | | 24,369 | | | | 5,844 | | | | 11,802 | |
| Accrued distribution fee | | | 37,227 | | | | 7,285 | | | | 6,395 | |
| Accrued expenses and other liabilities | | | 77,363 | | | | 35,939 | | | | 68,973 | |
| Total Liabilities | | | 305,916 | | | | 100,595 | | | | 180,943 | |
| Net Assets | | $ | 258,842,891 | | | $ | 55,558,130 | | | $ | 130,184,084 | |
| Net assets consist of: | | | | | | | | | | | | |
| Paid in capital | | $ | 91,653,394 | | | $ | 22,763,239 | | | $ | 105,506,501 | |
| Total distributable earnings | | | 167,189,497 | | | | 32,794,891 | | | | 24,677,583 | |
| Net assets | | $ | 258,842,891 | | | $ | 55,558,130 | | | $ | 130,184,084 | |
| Shares of beneficial interest outstanding (unlimited shares of $0.01 par value authorized) | | | 6,544,364 | | | | 2,002,780 | | | | 6,358,071 | |
| Net asset value, offering and redemption price per share | | $ | 39.55 | | | $ | 27.74 | | | $ | 20.48 | |
| (1) Cost of investments | | $ | 112,502,298 | | | $ | 22,631,141 | | | $ | 97,192,785 | |
The Accompanying Notes are an Integral Part of these Financial Statements.
Annual Report | 23
The Tocqueville Trust
Statements of Operations
For the Year Ended October 31, 2022
| | | The
Tocqueville
Fund | | | The
Tocqueville
Opportunity
Fund | | | The
Tocqueville
Phoenix
Fund | |
| Investment Income: | | | | | | | | | | | | |
| Dividends* | | $ | 5,971,897 | | | $ | 128,509 | | | $ | 1,081,996 | |
| Non-Cash Dividend | | | 430,247 | | | | — | | | | — | |
| Interest | | | 7,841 | | | | 23,903 | | | | 65,305 | |
| Total investment income | | | 6,409,985 | | | | 152,412 | | | | 1,147,301 | |
| Expenses: | | | | | | | | | | | | |
| Investment Adviser’s fee (See Note 4) | | | 2,150,158 | | | | 543,289 | | | | 1,226,765 | |
| Distribution (12b-1) fees (See Note 4) | | | 716,719 | | | | 181,096 | | | | 383,364 | |
| Administration fees (See Note 4) | | | 430,032 | | | | 108,658 | | | | 230,018 | |
| Transfer agent and shareholder services fees | | | 117,594 | | | | 42,263 | | | | 92,766 | |
| Trustee fees and expenses | | | 89,770 | | | | 19,793 | | | | 46,536 | |
| Legal fees | | | 72,727 | | | | 18,970 | | | | 39,326 | |
| Other expenses | | | 68,535 | | | | 31,011 | | | | 42,678 | |
| Fund accounting fees | | | 53,530 | | | | 15,824 | | | | 30,033 | |
| Printing and mailing expense | | | 29,781 | | | | 8,824 | | | | 67,595 | |
| Blue sky fees | | | 27,301 | | | | 23,949 | | | | 25,904 | |
| Audit fees | | | 16,229 | | | | 17,492 | | | | 17,480 | |
| Custody fees | | | 15,073 | | | | 11,397 | | | | 16,567 | |
| Insurance expense | | | 14,674 | | | | 4,027 | | | | 7,989 | |
| Interest expense | | | 5,584 | | | | 1,790 | | | | — | |
| Registration fees | | | 4,996 | | | | 2,882 | | | | 3,676 | |
| Total expenses before waiver | | | 3,812,703 | | | | 1,031,265 | | | | 2,230,697 | |
| Less: Fees waived (See Note 4) | | | (235,341 | ) | | | (123,994 | ) | | | (313,877 | ) |
| Net expenses | | | 3,577,362 | | | | 907,271 | | | | 1,916,820 | |
| Net Investment Income (Loss) | | | 2,832,623 | | | | (754,859 | ) | | | (769,519 | ) |
| Realized and Unrealized Gain (Loss): | | | | | | | | | | | | |
| Net realized gain (loss) on: | | | | | | | | | | | | |
| Investments | | | 19,627,576 | | | | 4,738,720 | | | | 1,065,332 | |
| Foreign currency translation | | | — | | | | (5 | ) | | | (769 | ) |
| Purchased Options | | | | | | | 201,803 | | | | | |
| | | | 19,627,576 | | | | 4,940,518 | | | | 1,064,563 | |
| Net change in unrealized appreciation (depreciation) on: | | | | | | | | | | | | |
| Investments | | | (48,826,278 | ) | | | (47,205,180 | ) | | | (24,570,506 | ) |
| | | | (48,826,278 | ) | | | (47,205,180 | ) | | | (24,570,506 | ) |
| Net loss on investments and foreign currency | | | (29,198,702 | ) | | | (42,264,662 | ) | | | (23,505,943 | ) |
| Net Decrease in Net Assets Resulting from Operations | | $ | (26,366,079 | ) | | $ | (43,019,521 | ) | | $ | (24,275,462 | ) |
| * Net of foreign taxes withheld of: | | $ | 44,856 | | | $ | 1,038 | | | $ | 5,294 | |
The Accompanying Notes are an Integral Part of these Financial Statements.
24 | October 31, 2022
The Tocqueville Trust
Statements of Changes in Net Assets
| | | The Tocqueville Fund | | | The Tocqueville
Opportunity Fund | | | The Tocqueville
Phoenix Fund | |
| | | For the
Year Ended
October 31,
2022 | | | For the
Year Ended
October 31,
2021 | | | For the
Year Ended
October 31,
2022 | | | For the
Year Ended
October 31,
2021 | | | For the
Year Ended
October 31,
2022 | | | For the
Year Ended
October 31,
2021 | |
| Operations: | | | | | | | | | | | | | | | | | | |
| Net investment income (loss) | | $ | 2,832,623 | | | $ | 1,614,750 | | | $ | (754,859 | ) | | $ | (1,165,395 | ) | | $ | (769,519 | ) | | $ | (1,034,171 | ) |
| Net realized gain on investments and foreign currency | | | 19,627,576 | | | | 32,413,869 | | | | 4,738,715 | | | | 8,976,875 | | | | 1,064,563 | | | | 20,189,000 | |
| Net realized gain (loss) on purchased options | | | — | | | | — | | | | 201,803 | | | | (179,344 | ) | | | — | | | | — | |
| Net change in unrealized appreciation (depreciation) | | | (48,826,278 | ) | | | 51,257,914 | | | | (47,205,180 | ) | | | 20,759,746 | | | | (24,570,506 | ) | | | 47,541,402 | |
| Net increase (decrease) in net assets resulting from operations | | | (26,366,079 | ) | | | 85,286,533 | | | | (43,019,521 | ) | | | 28,391,882 | | | | (24,275,462 | ) | | | 66,696,231 | |
| Total dividends and distributions | | | (32,027,478 | ) | | | (9,233,776 | ) | | | (6,183,352 | ) | | | (3,607,856 | ) | | | (17,861,486 | ) | | | (2,758,109 | ) |
| Fund share transactions: | | | | | | | | | | | | | | | | | | | | | | | | |
| Shares sold | | | 7,594,005 | | | | 7,070,997 | | | | 4,108,462 | | | | 10,665,735 | | | | 9,167,537 | | | | 7,574,788 | |
| Shares issued to holders in reinvestment of dividends | | | 30,439,280 | | | | 8,758,558 | | | | 6,056,414 | | | | 3,539,900 | | | | 17,378,188 | | | | 2,688,871 | |
| Shares redeemed | | | (34,536,336 | ) | | | (29,239,052 | ) | | | (16,593,209 | ) | | | (18,947,317 | ) | | | (31,306,998 | ) | | | (28,777,744 | ) |
| Net increase (decrease) | | | 3,496,949 | | | | (13,409,497 | ) | | | (6,428,333 | ) | | | (4,741,682 | ) | | | (4,761,273 | ) | | | (18,514,085 | ) |
| Net increase (decrease) in net assets | | | (54,896,608 | ) | | | 62,643,260 | | | | (55,631,206 | ) | | | 20,042,344 | | | | (46,898,221 | ) | | | 45,424,037 | |
| Net Assets: | | | | | | | | | | | | | | | | | | | | | | | | |
| Beginning of period | | | 313,739,499 | | | | 251,096,239 | | | | 111,189,336 | | | | 91,146,992 | | | | 177,082,305 | | | | 131,658,268 | |
| End of period | | $ | 258,842,891 | | | $ | 313,739,499 | | | $ | 55,558,130 | | | $ | 111,189,336 | | | $ | 130,184,084 | | | $ | 177,082,305 | |
| * Net of redemption fees of: | | $ | — | | | $ | — | | | $ | — | | | $ | — | | | $ | — | | | $ | — | |
The Accompanying Notes are an Integral Part of these Financial Statements.
Annual Report | 25
The Tocqueville Trust
Notes to Financial Statements
The Tocqueville Trust (the “Trust”) is a Massachusetts business trust registered under the Investment Company Act of 1940 and organized on September 17, 1986, consisting of three separate funds (each, a “Fund” or, collectively, the “Funds”). Each Fund is an open-end management investment company with a different investment objective. The Tocqueville Fund, The Tocqueville Opportunity Fund (the “Opportunity Fund”), and The Tocqueville Phoenix Fund (the “Phoenix Fund”) are each classified as diversified investment companies. The Tocqueville Fund’s investment objective is long-term capital appreciation, which it seeks to achieve by investing primarily in securities of United States issuers. The Opportunity Fund’s investment objective is to achieve long-term capital appreciation, which it seeks to achieve by investing in the common stocks of small and mid-cap companies which have the potential to deliver superior long term earnings growth. The Phoenix Fund’s investment objectives are to seek long-term preservation of capital (sufficient growth to outpace inflation over an extended period of time) and growth of capital, which it seeks to achieve by investing primarily in common stocks of small and mid-cap value companies that the portfolio managers consider to be undervalued, generate strong free cash flow, have shareholder friendly management teams and possess a catalyst for improved financial performance.
The Phoenix Fund (formerly known as The Delafield Fund), a series of the Trust, commenced operations on September 28, 2009, as successor to Delafield Fund, Inc. The predecessor Delafield Fund, Inc. commenced operations on November 19, 1993. The Delafield Fund changed its name to the Phoenix Fund on February 15, 2019. On November 15, 2019, the Phoenix Fund acquired all the net assets of The Tocqueville Select Fund.
| 2. | SIGNIFICANT ACCOUNTING POLICIES |
The following is a summary of significant accounting policies consistently followed by the Portfolios in the preparation of their financial statements. These policies are in conformity with accounting principles generally accepted in the United States of America (“U.S. GAAP”). The Funds follow accounting and reporting guidance under Financial Accounting Standards Board (“FASB”) Accounting Standards Codification Topic 946, “Financial Services—Investment Companies.”
a) Security valuation and security transactions
Investments in securities, including foreign securities, traded on an exchange or quoted on the over-the-counter market are valued at the last sale price or, if no sale occurred during the day, at the mean between closing bid and ask prices, as last reported by a pricing service approved by the Trustees. Securities that are principally traded on the National Association of Securities Dealers Automated Quotation National Market (“NASDAQ”) are generally valued at the NASDAQ Official Closing Price (“NOCP”). If there is no NASDAQ Official Closing Price for a NASDAQ-listed security or sale price available for an over-the-counter security, the mean of the latest bid and asked quotations from NASDAQ will be used. When market quotations for securities are not readily available, or when restricted securities or other assets are being valued, such assets are valued at fair value as determined in good faith by or under procedures approved by the Trustees. Money market funds are valued at net asset value (“NAV”). Fixed income securities, such as corporate bonds, convertible bonds and U.S. government agency issues are valued based on evaluated mean prices supplied by independent pricing services using matrix pricing formulas and/or independent broker bid quotations.
26 | October 31, 2022
Trading in securities on foreign securities exchanges normally is completed before the calculation of the Funds’ NAV. Trading on these foreign exchanges may not take place on all days on which there is regular trading on the New York Stock Exchange (“NYSE”), or may take place on days on which there is no regular trading on the NYSE. Similarly, the Funds may hold securities traded in domestic markets where the market may close early on a given day prior to calculation of the Funds’ NAV. Events affecting the value of such securities held by the Funds that occur between the close of trading in the security and the close of trading on the NYSE normally will not be reflected in the Funds’ calculation of the NAV. However, significant events will be closely monitored, and where it is determined that an adjustment should be made to the security’s value because significant interim events may materially affect the value of the security, the security will be priced at its fair value in accordance with the procedures approved by the Trustees.
Cash and cash equivalents may exceed federal insurance limits. Money market deposit accounts are considered cash equivalents and reflected at cost.
Investment transactions are recorded on trade date. Dividend income is recognized on the ex-dividend date. Interest income is recognized on an accrual basis and includes, where applicable, the amortization of premiums and accretion of discounts. Net realized gains and losses from sales of securities are determined on the specific identification cost method.
b) Restricted and illiquid securities
The Funds may invest in securities that are subject to legal or contractual restrictions on resale or are illiquid. A security may be considered illiquid if it lacks a readily available market or if its valuation has not changed for a certain period of time. Disposal of these securities may involve time consuming negotiations and expense, and a prompt sale at the current valuation may be difficult.
c) Fair Valuation Measurements
The Trust has adopted authoritative fair valuation accounting standards which establish an authoritative definition of fair value and set out a hierarchy for measuring fair value. These standards require additional disclosures about the various inputs and valuation techniques used to develop the measurements of fair value, and a discussion of changes in valuation techniques and related inputs during the year. These inputs are summarized in the three broad levels listed below.
Annual Report | 27
| ● | Level 1 - Quoted prices in active markets for identical securities. |
| ● | Level 2 - Other significant observable inputs (including quoted prices for similar securities, interest rates, prepayment speeds, credit risk, etc.). |
| ● | Level 3 - Significant unobservable inputs (including the Fund’s own assumptions in determining the fair value of investments). |
When using the market quotations or closing price provided by the pricing service for equity investments—including common stocks, preferred stocks, foreign issued common stocks, exchange-traded funds, closed end mutual funds and real estate investment trusts—which are traded on an exchange are valued at the last sale price reported by the exchange on which the securities are primarily traded on the day of valuation and when the market is considered active, the security will be classified as a Level 1 security. When using the mean between the latest bid and ask price, the security will be classified as Level 2.
Investment in mutual funds, including money market funds, are generally priced at the ending NAV provided by the service agent of the funds and will be classified as Level 1 securities.
Fixed income securities, such as corporate bonds, convertible bonds, commercial paper, money market deposit accounts and U.S. government agency issues are valued based on evaluated mean prices supplied by independent pricing services using matrix pricing formulas and/or independent broker bid quotations and are classified as Level 2.
Options are valued at the composite last price reported by the exchange on which the options are primarily traded on the day of the valuation and are classified as Level 1. If there is no composite last price on a given day, the mean between the latest bid and ask price will be used. These contracts are classified as Level 2.
Any securities or other assets for which market quotations are not readily available are valued at fair value as determined in good faith by the Adviser pursuant to procedures established under the general supervision and responsibility of the Funds’ Board of Trustees and may be classified as Level 3 securities. In determining fair value, a Fund will seek to assign a value to the security which it believes represents the amount that the Fund could reasonably expect to receive upon its current sale. With respect to securities that are actively traded on U.S. exchanges, the Funds expect that market quotations will generally be available and that fair value might be used only in limited circumstances, such as when trading for a security is halted during the trading day.
In determining whether a significant event has occurred with respect to securities traded principally in foreign markets, the Funds may engage a third party fair value service provider to systematically recommend the adjustment of closing market prices of non-U.S. securities based upon changes in a designated U.S. securities market index occurring from the time of close of the relevant foreign market and the close of the NYSE. Fair value pricing may also be used to value restricted securities held by the Funds or securities with little or no trading activity for extended periods of time. Fair value pricing involves judgments that are inherently subjective and inexact and it is not possible to determine with certainty when, and to what extent, an event will affect a market price. As a result, there can be no assurance that fair value pricing will reflect actual market value and it is possible that the fair value determined for a security may differ materially from the value that could be realized upon the sale of the security.
28 | October 31, 2022
The following is a summary of the inputs used, as of October 31, 2022 involving the Funds’ assets and liabilities carried at fair value. The inputs of methodology used for valuing securities may not be an indication of the risk associated with investing in those securities.
| Description | | Level 1 | | | Level 2 | | | Level 3 | | | Total | |
| The Tocqueville Fund* | | | | | | | | | | | | | | | | |
| Assets | | | | | | | | | | | | | | | | |
| Common Stocks | | $ | 252,584,610 | | | $ | — | | | $ | — | | | $ | 252,584,610 | |
| Real Estate Investment Trust (REIT) | | | 5,412,750 | | | | — | | | | — | | | | 5,412,750 | |
| Money Market Fund | | | 832,226 | | | | — | | | | — | | | | 832,226 | |
| Total Assets | | $ | 258,829,586 | | | $ | — | | | $ | — | | | $ | 258,829,586 | |
| | | | | | | | | | | | | | | | | |
| The Tocqueville Opportunity Fund* | | Level 1 | | | Level 2 | | | Level 3 | | | Total | |
| Assets | | | | | | | | | | | | | | | | |
| Common Stocks | | $ | 50,819,954 | | | $ | 2,236 | | | $ | — | | | $ | 50,822,190 | |
| Money Market Fund | | | 1,585,815 | | | | — | | | | — | | | | 1,585,815 | |
| Total Assets | | $ | 52,405,769 | | | $ | 2,236 | | | $ | — | | | $ | 52,408,005 | |
| | | | | | | | | | | | | | | | | |
| The Tocqueville Phoenix Fund* | | Level 1 | | | Level 2 | | | Level 3 | | | Total | |
| Assets | | | | | | | | | | | | | | | | |
| Common Stocks | | $ | 116,693,928 | | | $ | — | | | $ | — | | | $ | 116,693,928 | |
| Money Market Fund | | | 5,853,794 | | | | — | | | | — | | | | 5,853,794 | |
| Total Assets | | $ | 122,547,722 | | | $ | — | | | $ | — | | | $ | 122,547,722 | |
| * | For further information regarding portfolio characteristics, please see the accompanying Schedules of Investments. |
The Trust’s valuation procedures have been adopted by the Trust’s Board of Trustees, which has established a Valuation Committee to oversee the valuation process. The Valuation Committee meets on as needed basis, or at least annually to evaluate changes in the valuation of portfolio securities. The full findings and valuations are then reviewed quarterly by the Independent Trustees.
The Funds did not hold any investments during the current fiscal year ended October 31, 2021 with significant unobservable inputs which would be classified as Level 3.
Annual Report | 29
d) Derivative Instruments and Hedging Activities
The Funds’ Adviser may use derivative instruments, such as purchased and written options, as a means to manage exposure to different types of risk, including market risk and exchange rate risk, and to gain exposure to underlying securities. The Trust has adopted disclosure standards in order to enable the investor to understand how and why an entity used derivatives, how derivatives are accounted for, and how derivatives affect an entity’s results of operations and financial position.
In general an option contract is an agreement between a buyer and seller that gives the purchaser of the option the right to buy or sell a particular asset at a specified future date at an agreed upon price (commonly knows as the “strike price”).
When the Funds purchase an option, an amount equal to the premium paid by the Funds are recorded as an investment and subsequently adjusted to the current value of the option purchased. If an option expires on the stipulated expiration date or if the Funds enter into a closing sale transaction, a gain or loss is realized. If a purchased call or put option is exercised, the cost of the security acquired is increased by the premium paid for the call, or in the case of a put, a gain or loss is realized from the sale of the underlying security, and the proceeds from such sale are decreased by the premium originally paid. Purchased options are non-income producing securities.
When the Funds write an option, an amount equal to the premium received by the Funds are recorded as a liability and subsequently adjusted to the current value of the option written. Premiums received from writing options that expire unexercised are treated by the Funds on the expiration date as realized gain from written options. The difference between the premium and the amount paid on effecting a closing purchase transaction, including brokerage commissions, is also treated as a realized gain, or if the premium is less than the amount paid for the closing purchase transaction, as a realized loss. If a written call or put option is exercised, the premium is added or subtracted, respectively, from the proceeds or cost basis, respectively, to the related transaction of the underlying security. The Funds, as writers of an option, would bear the market risk of an unfavorable change in the price of the security underlying the written option. In the Opportunity Fund, the Adviser used options to gain exposure to the underlying equity security and earn premium income.
The Effect of Derivative Instruments on the Statement of Operations for the year ended October 31, 2022.
The Tocqueville Opportunity Fund
| | | Net Realized
Gain on
Purchased Options | | Net Change in
Unrealized
Appreciation on
Investments |
| Purchased Options | |
| $201,803 | | |
| $— | |
| Total | |
| $201,803 | | |
| $— | |
30 | October 31, 2022
Derivatives Risk
The risks of using the types of derivatives in which the Funds may engage include: the risk that movements in the value of the derivative may not fully offset or complement instruments currently held in the Funds in the manner intended by the Adviser; the risk that the counterparty to a derivative contract may fail to comply with their obligations to the Funds; the risk that the derivative may not possess a liquid secondary market at a time when the Funds would look to disengage the position; the risk that additional capital from the Funds may be called upon to fulfill the conditions of the derivative contract; and the risk that the cost of the derivative contracts may reduce the overall returns experienced by the Funds. The measurement of risks associated with these instruments is meaningful only when all related offsetting transactions are considered. The Funds may enter into written call options to hedge against changes in the value of equities. The Funds’ option component of the overall investment strategy is often referred to as a “buy-write” strategy (also called a “covered call” strategy), in which the Adviser (as defined below) writes (sells) a call option contract while at the same time owning an equivalent number of shares of the underlying stock to generate moderate current income. The writing of call options is intended to reduce the volatility of the portfolio and to earn premium income. Written call options expose the Funds to minimal counterparty credit risk since they are exchange traded and the exchange’s clearing house guarantees the options against default. As the writer of a call option each Fund has the obligation to sell the security at the exercise price during the exercise period in the event the option is exercised. The use of options do not create leverage in the Funds. The Funds did not transact in written options during the year ended October 31, 2022.
The average monthly value of purchased options in the Opportunity Fund during the year ended October 31, 2022 was $0.
e) Foreign currency translation
Investments and other assets and liabilities denominated in foreign currencies are translated to U.S. dollars at the prevailing rates of exchange, in accordance with the Trust’s Portfolio Securities Valuation and Foreign Exchange Contracts Procedures. The Funds have engaged in transactions in securities denominated in foreign currencies and, as a result, entered into foreign exchange transactions. The Funds are exposed to additional market risk as a result of changes in the value of the underlying currency in relation to the U.S. dollar. Risks include potential inability of counterparties to meet the terms of their obligations. The value of foreign currencies are marked-to-market on a daily basis, which reflects the changes in the market value of the contract at the close of each day’s trading, resulting in daily unrealized gains and/or losses. When the transactions are settled or the contracts are closed, the Funds recognize a realized gain or loss.
The Funds do not isolate that portion of the results of operations resulting from changes in foreign exchange rates on investments from the fluctuations arising from changes in market prices of securities held. Such fluctuations are reflected as net realized and unrealized gain or loss on investments.
Annual Report | 31
Reported net realized foreign exchange gains or losses arise from sales of foreign currencies, currency gains or losses realized between the trade and settlement dates on securities transactions, the differences between the amounts of dividends, interest, and foreign withholding taxes recorded on the Funds’ books, and the U.S. dollar equivalent of the amounts actually received or paid. Net unrealized foreign exchange gains and losses arise from changes in the value of assets and liabilities other than investments in securities at the end of the fiscal year, resulting from changes in the exchange rates.
f) Shareholder transactions and distributions
Shareholder transactions are recorded on trade date. Dividends to shareholders are recorded on the ex-dividend date. Dividends from net investment income are declared and paid annually by the Funds. Distributions of net realized capital gains, if any, will be declared and paid at least annually. Income and capital gain distributions are determined in accordance with income tax regulations which may differ from generally accepted accounting principles. Permanent differences between financial and tax reporting may result in reclassification to capital stock.
g) Allocation of Income, Expenses and Gains/Losses
Income, expenses (other than those deemed attributable to a specific share class), and gains and losses of the Fund are allocated daily to each class of shares based upon the ratio of net assets represented by each class as a percentage of the net assets of the Fund.
Expenses deemed directly attributable to a class of shares are recorded by the specific class.
Most Fund expenses are allocated by class based on relative net assets.
h) Use of estimates
The preparation of financial statements in conformity with U.S. GAAP requires management to make estimates and assumptions that affect the reported amounts of assets and liabilities and disclosure of contingent assets and liabilities at the date of the financial statements and the reported amounts of income and expenses during the reporting year. Actual results could differ from those estimates.
i) Indemnification
In the normal course of business the Funds enter into contracts that contain general indemnification clauses. The Funds’ maximum exposure under these arrangements is unknown, as this would involve future claims against a Fund that have not yet occurred. Based on experience, the Funds expect the risk of loss to be remote.
j) Coronavirus (“COVID-19”) and Global Health Event Risk
Since March 2020, there has been an outbreak of a highly contagious form of a novel coronavirus known as “COVID-19.” COVID-19 has been declared a pandemic by the World Health Organization and, in response to the outbreak, the U.S. Health and Human Services Secretary has declared a public health emergency in the United States. COVID-19 had a devastating impact on the global economy, including the U.S. economy, and resulted in a global economic recession. Many states issued orders requiring the closure of non-essential businesses and/or requiring residents to stay at home. The COVID-19 pandemic and preventative measures taken to contain or mitigate its spread have caused, and are continuing to cause, business shutdowns, cancellations of events and travel, significant reductions in demand for certain goods and services, reductions in business activity and financial transactions, supply chain interruptions and overall economic and financial market instability both globally and in the United States. Such effects will likely continue for the duration of the pandemic, which is uncertain, and for some period thereafter. While several countries, as well as certain states, counties, and cities in the United States, began to relax the early public health restrictions with a view to partially or fully reopening their economies, many cities, both globally and in the United States, continue to experience, from time to time, surges in the reported number of cases and hospitalizations related to the COVID-19 pandemic. Recurring COVID-19 outbreaks, newly discovered variant and sub-variant strains of the virus and increases in cases can, and has, led to the re-introduction of restrictions and business shutdowns in certain states, counties, and cities in the United States and globally, and could continue to lead to the re-introduction of such restrictions elsewhere. Even after the COVID-19 pandemic subsides, the U.S. economy and most other major global economies may continue to experience a substantial economic downturn or recession, and our business and operations, as well as the business and operations of our portfolio companies, could be materially adversely affected by a prolonged economic downturn or recession in the United States and other major markets.
32 | October 31, 2022
The current economic situation and the unprecedented measures taken by state, local and national governments around the world to combat the spread of COVID-19, as well as various social, political and psychological tensions in the United States and around the world, may continue to contribute to severe market disruptions and volatility and reduced economic activity, may have long-term negative effects on the U.S. and worldwide financial markets and economy and may cause further economic uncertainties in the United States and worldwide. It is difficult to predict how long the financial markets and economic activity will continue to be impacted by these events in the future on the U.S. economy and securities markets.
k) Political Risks Relating to Russia’s Invasion of Ukraine
In February 2022, Russia began its invasion of Ukraine that significantly amplified already existing geopolitical tensions among Russia, Ukraine, Europe, NATO and the United States. Russia’s military invasion of Ukraine, the resulting responses by the United States and other countries, and the potential for wider conflict has increased volatility and uncertainty in the financial markets, specifically on companies in the oil and gas sector, finance and resource extraction. The United States, other countries and certain international organizations have imposed broad-ranging economic sanctions on Russia and on certain Russian individuals, banking entities and corporations as a response to Russia’s invasion of Ukraine. These sanctions have included freezing certain Russian assets and prohibited trading in certain Russian securities and doing business with specific Russian corporate entities, large financial institutions, officials and oligarchs. The sanctions also included the removal of some Russian banks from the Society for Worldwide Interbank Financial Telecommunications (SWIFT), the electronic network that connects banks globally, and imposed restrictive measures to prevent the Russian Central Bank from undermining the impact of the sanctions. These sanctions could become broader in the future, including banning Russia from global payments systems that facilitate cross-border payments. A number of large corporations have also announced plans to divest interests or otherwise curtail business dealings with certain Russian businesses.
Annual Report | 33
The extent and duration of Russia’s military actions, resulting sanctions and consequent future market disruptions are impossible to predict, but could be significant and may negatively affect global supply chains, inflation, oil and gas supply, and global growth. Russian military action (including cyberattacks and espionage) or actual and threatened responses to such actions, including purchasing and financing restrictions, boycotts or changes in consumer or purchaser preferences, sanctions, tariffs or cyberattacks on the Russian government and Russian individuals, may have an impact not only on Russia, but the global economy.
In addition, conflict between Ukraine and Russia is likely to negatively impact other regional and global economic markets (including Europe, Asia and the United States), companies in other countries (particularly those that have exposure to Russia and Ukraine) and on various sectors, industries and markets for securities and commodities globally, such as oil and natural gas and banking. The potential for a wider conflict could increase financial market volatility, cause severe negative effects on regional and global economic markets, industries, and companies and have a negative effect on investments and performance beyond any direct exposure to Russian and Ukrainian issuers or those of adjoining geographic regions. These and any related events could have a significant impact on investment performance.
l) Inflation Risk
Inflation risk is the risk that the value of assets or income from investments will be less in the future as inflation decreases the value of money. Inflation risk is linked to increases in the prices of goods and services and a decrease in the purchasing power of money. Since the beginning of 2021, inflation has risen at its highest rate in four decades. Inflation has had, and is expected to continue to have, a major impact on the U.S. economy in 2022 for an indefinite period. While the Biden Administration and the Federal Reserve have attempted efforts to reduce the effects of inflation on the U.S. economy and financial markets, the mitigating effects of such efforts are highly uncertain. Furthermore, any such mitigating efforts––such as raising benchmark interest rates—may have other detrimental effects on the U.S. economy and capital markets.
m) Subsequent events evaluation
In preparing these financial statements, the Trust has evaluated events and transactions for potential recognition or disclosure resulting from subsequent events through the date financial statements were available to be issued. This evaluation did not result in any subsequent events, that necessitated disclosure and/or adjustments, other than below.
34 | October 31, 2022
On November 16, 2022 the following Fund paid long-term capital gain distributions in the amount shown in the table.
| Fund | Income Dollar
Amount | | Income Per Share
Amount |
| Tocqueville Opportunity Fund | $3,896,715 | | $1.99336 |
On December 8, 2022 the following Fund paid an income distribution in the amount as shown in the table.
| Fund | Income Dollar
Amount | | Income Per Share
Amount |
| Tocqueville Fund | $2,620,243 | | $0.23922233 |
On December 8, 2022 the following Funds paid long-term capital gain distributions in the amount as shown in the table.
| Fund | Income Dollar
Amount | | Income Per Share
Amount |
| Tocqueville Fund | $18,478,437 | | $1.68704 |
At a joint meeting of shareholders held on November 15, 2022, the shareholders of the Opportunity Fund and the Phoenix Fund approved an Agreement and Plan of Reorganization (the “Plan of Reorganization”) providing for the transfer of all of the assets of the Opportunity Fund and the Phoenix Fund to, and the assumption of all of the Funds’ liabilities by, The Tocqueville Fund, an existing series of the Trust, in exchange for shares of The Tocqueville Fund, and resulting in the liquidation and dissolution of the Opportunity Fund and the Phoenix Fund (the “Reorganization”). The Reorganization took place on November 18, 2022.
| | | Pre-
Reorganization
Net Assets | | Pre-
Reorganization
Shares
Outstanding | | Pre-
Reorganization
Net Asset
Value | | Post-
Reorganization
Net Assets | | Post-
Reorganization
Shares
Outstanding | | Post-
Reorganization
Exchange
Ratio |
| The Tocqueville Fund | | $267,574,191 | | | 6,524,094 | | | $41.01 | | | $453,968,232 | | | 11,068,825 | | | — | |
| The Tocqueville Opportunity Fund | | 52,841,966 | | | 2,065,186 | | | 25.59 | | | — | | | — | | | 0.62387231 | |
| The Tocqueville Phoenix Fund | | 133,552,075 | | | 6,291,404 | | | 21.23 | | | — | | | — | | | 0.51758214 | |
There is no tax liability resulting from unrecognized tax benefits relating to uncertain income tax positions taken or expected to be taken on the tax return for the fiscal year-end October 31, 2022, or for any other tax years which are open for exam. As of October 31, 2022, open tax years include the tax years ended October 31, 2019 through 2022. The Trust is also not aware of any tax positions for which it is reasonably possible that the total amounts of unrecognized tax benefits will significantly change in the next six months. The Funds recognize interest and penalties, if any, related to unrecognized tax benefits as income tax expense in the Statements of Operations. During the year, the Funds did not incur any interest or penalties.
Annual Report | 35
Provision for federal income taxes or excise taxes has not been made since the Funds intend to continue to comply with the requirements of subchapter M of the Internal Revenue Code necessary to qualify as Regulated Investment Companies and intend to distribute substantially all taxable income to shareholders and otherwise comply with the provisions of the Internal Revenue Code applicable to Regulated Investment Companies. Distributions from net realized gains for book purposes may include short-term capital gains which are included as ordinary income to shareholders for tax purposes. Additionally, accounting principles generally accepted in the United States of America require that certain components of net assets relating to permanent differences be reclassified between financial and tax reporting. These reclassifications have no effect on net assets or NAV per share. For the year ended October 31, 2022, the following table shows the reclassifications made:
| | Distributable
Earnings | | Paid In Capital |
| Tocqueville Fund | | | $(1,572,243 | ) | | $1,572,243 | |
| Opportunity Fund | | | (840,942 | ) | | 840,942 | |
| Phoenix Fund | | | (918,560 | ) | | 918,560 | |
The permanent differences primarily relate to the usage of deemed distributions for tax purposes.
As of October 31, 2022, the components of distributable earnings (accumulated losses) for income tax purposes were as follows:
| | | Tocqueville
Fund | | | Opportunity
Fund | | | Phoenix
Fund | |
| Tax cost of Investments | | $ | 112,502,298 | | | $ | 22,947,727 | | | $ | 97,237,501 | |
| Unrealized Appreciation | | $ | 148,063,918 | | | $ | 29,911,051 | | | $ | 38,559,284 | |
| Unrealized Depreciation | | | (1,736,630 | ) | | | (450,773 | ) | | | (13,249,063 | ) |
| Net unrealized appreciation (depreciation) | | | 146,327,288 | | | | 29,460,278 | | | | 25,310,221 | |
| Undistributed operating income | | | 2,383,863 | | | | — | | | | — | |
| Undistributed long-term gains | | | 18,478,346 | | | | 3,896,699 | | | | — | |
| Distributable earnings | | | 20,862,209 | | | | 3,896,699 | | | | — | |
| Other accumulated gain/(loss) | | | — | | | | (562,086 | ) | | | (632,638 | ) |
| Total distributable earnings | | $ | 167,189,497 | | | $ | 32,794,891 | | | $ | 24,667,583 | |
The difference between book-basis and tax-basis unrealized appreciation is attributable primarily to wash sale deferrals and straddle loss defferals.
36 | October 31, 2022
The tax character of distributions paid during the years ended October 31, 2022 and 2021 was as follows:
| | | October 31, 2022 | |
| | | Ordinary
Income | | | Long Term
Capital Gain | | | Total | |
| Tocqueville Fund | | $ | 1,292,985 | | | $ | 30,734,493 | | | $ | 32,027,478 | |
| Opportunity Fund | | | 479,301 | | | | 5,704,051 | | | | 6,183,352 | |
| Phoenix Fund | | | 263,413 | | | | 17,598,073 | | | | 17,861,486 | |
| | | | | | | | | | | | | |
| | | October 31, 2021 | |
| | | Ordinary
Income | | | Long Term
Capital Gain | | | Total | |
| Tocqueville Fund | | $ | 1,693,360 | | | $ | 7,540,416 | | | $ | 9,233,776 | |
| Opportunity Fund | | | — | | | | 3,607,856 | | | | 3,607,856 | |
| Phoenix Fund | | | — | | | | 2,758,109 | | | | 2,758,109 | |
The Funds designated as long-term capital gain dividend, pursuant to Internal Revenue Code Section 852(b)(3), the amount necessary to reduce the earnings and profits of the Funds related to net capital gain to zero for the tax years ended October 31, 2022 and 2021.
For the fiscal year ended October 31, 2022, the Funds deferred, on a tax basis, late year losses of $562,068 and $632,638 for the Opportunity Fund and the Phoenix Fund, respectively.
| 4. | INVESTMENT ADVISORY AND OTHER AGREEMENTS |
Tocqueville Asset Management L.P. (“Tocqueville”) is the investment adviser (the “Adviser”) to the Trust under Investment Advisory Agreements approved by shareholders. For its services, Tocqueville receives fees from The Tocqueville Fund, calculated daily and payable monthly, at an annual rate of 0.75% on the first $1 billion of the average daily net assets of the Fund, and 0.65% of the average daily net assets in excess of $1 billion. Tocqueville receives fees from the Opportunity Fund, calculated daily and payable monthly, at an annual rate of 0.75% on the first $500 million of the average daily net assets of the Fund, and 0.65% of the average daily net assets in excess of $500 million. Tocqueville receives fees from the Phoenix Fund, calculated daily and payable monthly, at an annual rate of 0.80% on the first $250 million of net assets of the Fund; 0.75% on the next $250 million of net assets of the Fund; 0.70% on the next $500 million of net assets of the Fund; and 0.65% on all net assets of the Fund over $1 billion.
With respect to The Tocqueville Fund, the Opportunity Fund, and the Phoenix Fund, the Adviser has contractually agreed to waive its advisory fees and/or reimburse expenses in order to ensure that the Tocqueville Fund’s total annual operating expenses do not exceed 1.20%, and the Opportunity Fund and Phoenix Fund do not exceed 1.25% of its average daily net assets (excluding taxes, interest expense, acquired fund fees and expenses, or extraordinary expenses such as litigation). Prior to October 1, 2022, the Tocqueville Fund had an expense limit of 1.25%. The Expense Limitation Agreements will remain in effect until March 1, 2024, for each Fund. For the year ended October 31, 2022, the Adviser waived $235,341, $123,994, and $313,877 of the advisory fee for The Tocqueville Fund, the Opportunity Fund, and the Phoenix Fund, respectively. Such amounts are not subject to recoupment by the Adviser.
Annual Report | 37
Pursuant to an Administrative Services Agreement, each Fund pays to the Adviser a fee computed and paid monthly at an annual rate of 0.15% on the first $400 million of the average daily net assets of each Fund; 0.13% on the next $600 million of the average daily net assets of each Fund; and 0.12% on all the average daily net assets of each Fund over $1 billion. For the Year ended October 31, 2022, the Adviser has made payments of $130,945, $32,932, and $69,956, to U.S. Bancorp Fund Services, LLC for services provided under a Sub-Administration Agreement for The Tocqueville Fund, the Opportunity Fund, and the Phoenix Fund, respectively.
Tocqueville Securities, L.P. (the “Distributor”), an affiliate of Tocqueville, acts as distributor for shares of the Trust. The Tocqueville Fund, the Opportunity Fund, and the Tocqueville Phoenix Fund, adopted a distribution and service plan pursuant to Rule 12b-1 of the 1940 Act. Pursuant to the plans, each Fund pays to the Distributor distribution and service fees of 0.25% per annum of its average daily net assets.
Commissions earned by the Distributor for services rendered as a registered broker-dealer in securities transactions for The Tocqueville Fund, the Opportunity Fund, and the Phoenix Fund for the Year ended October 31, 2022, were $2,835, $4,320, and $6,756, respectively.
| 5. | CAPITAL SHARE TRANSACTIONS. |
Transactions in capital shares for each Fund were as follows:
| | | For the Year
Ended
October 31, 2022 | | | For the Year
Ended
October 31, 2021 | |
| The Tocqueville Fund | | Shares | | | Shares | |
| Shares sold | | | 180,533 | | | | 158,773 | |
| Shares issued to holders in reinvestment dividends | | | 669,731 | | | | 218,200 | |
| Shares redeemed | | | (789,519 | ) | | | (673,876 | ) |
| Net increase (decrease) | | | 60,745 | | | | (296,903 | ) |
| | | | | | | | | |
| The Tocqueville Opportunity Fund | | | | | | | | |
| Shares sold | | | 125,103 | | | | 243,635 | |
| Shares issued to holders in reinvestment dividends | | | 144,338 | | | | 85,134 | |
| Shares redeemed | | | (533,645 | ) | | | (439,355 | ) |
| Net decrease | | | (264,204 | ) | | | (110,586 | ) |
| | | | | | | | | |
| The Tocqueville Phoenix Fund | | | | | | | | |
| Shares sold | | | 391,554 | | | | 301,106 | |
| Shares issued to holders in reinvestment dividends | | | 709,314 | | | | 125,825 | |
| Shares redeemed | | | (1,417,893 | ) | | | (1,201,210 | ) |
| Net decrease | | | (317,025 | ) | | | (774,279 | ) |
38 | October 31, 2022
| 6. | INVESTMENT TRANSACTIONS |
Purchases and sales of investment securities (excluding short-term investments) for the Year ended October 31, 2022, are summarized below.
| | | | Tocqueville
Fund | | | Opportunity
Fund | | | Phoenix
Fund | |
| Purchases: | | | $ | 18,218,747 | | | $ | 9,997,919 | | | $ | 21,852,741 | |
| Sales: | | | $ | 45,168,097 | | | $ | 28,133,477 | | | $ | 44,951,650 | |
The Tocqueville Trust has a line of credit (the “Line”), which is uncommitted, in the amount of $50,000,000, 10% of The Tocqueville Fund’s or the Opportunity Fund’s gross market value, 15% of the Phoenix Fund’s gross market value or 33.33% of the fair value of a Fund’s investments, whichever is less, with U.S. Bank NA. The Line is for temporary emergency or extraordinary purposes, including the meeting of redemption requests that otherwise might require the untimely disposition of securities. The Line is secured by the Trust’s assets. The Line has a one-year term and is reviewed annually by the Board of Trustees. The Line matures, unless renewed, on January 18, 2023. Interest is charged at the greater of 0.00% and the prime rate minus 0.50%. The interest rate as of for the year ended October 31, 2022, was 5.75%. The average interest rate during the year ended October 31, 2022, was 3.56%. During the period ended October 31, 2022, The Tocqueville Fund’s maximum borrowing was $4,045,000 and average borrowing was $146,444, the Opportunity Fund’s maximum borrowing was $1,556,000 and average borrowing was $67,563. This borrowing resulted in interest expenses of $5,584, and $1,790, respectively. The Phoenix Fund did not use the Line.
Annual Report | 39
The Tocqueville Trust
Report of Independent Registered Public Accounting Firm
To the Shareholders and Board of Trustees of
The Tocqueville Trust
Opinion on the Financial Statements
We have audited the accompanying statements of assets and liabilities, including the schedules of investments, of The Tocqueville Trust comprising The Tocqueville Fund, The Tocqueville Opportunity Fund, and The Tocqueville Phoenix Fund (the “Funds”) as of October 31, 2022, the related statements of operations for the year then ended, and the statements of changes in net assets, the related notes, and the financial highlights for each of the two years in the period then ended (collectively referred to as the “financial statements”). In our opinion, the financial statements present fairly, in all material respects, the financial position of each of the Funds as of October 31, 2022, the results of their operations for the year then ended, and the changes in net assets and the financial highlights for each of the two years in the period then ended, in conformity with accounting principles generally accepted in the United States of America.
The Funds’ financial highlights for the year ended October 31, 2020, and prior, were audited by other auditors whose report dated December 23, 2020 expressed an unqualified opinion on those financial highlights.
Basis for Opinion
These financial statements are the responsibility of the Funds’ management. Our responsibility is to express an opinion on the Funds’ financial statements based on our audits. We are a public accounting firm registered with the Public Company Accounting Oversight Board (United States) (“PCAOB”) and are required to be independent with respect to the Funds in accordance with the U.S. federal securities laws and the applicable rules and regulations of the Securities and Exchange Commission and the PCAOB.
We conducted our audits in accordance with the standards of the PCAOB. Those standards require that we plan and perform the audit to obtain reasonable assurance about whether the financial statements are free of material misstatement whether due to error or fraud.
Our audits included performing procedures to assess the risks of material misstatement of the financial statements, whether due to error or fraud, and performing procedures that respond to those risks. Such procedures included examining, on a test basis, evidence regarding the amounts and disclosures in the financial statements. Our procedures included confirmation of securities owned as of October 31, 2022, by correspondence with the custodian and brokers. Our audits also included evaluating the accounting principles used and significant estimates made by management, as well as evaluating the overall presentation of the financial statements. We believe that our audits provide a reasonable basis for our opinion.
40 | October 31, 2022
We have served as the Funds’ auditor since 2021.

COHEN & COMPANY, LTD.
Milwaukee, Wisconsin
December 21, 2022
Annual Report | 41
ADDITIONAL INFORMATION (UNAUDITED)
1. ADDITIONAL DISCLOSURE REGARDING FUND TRUSTEES AND OFFICERS
Independent Trustees
| Name and Age | | Position(s) Held
with the Trust | | Term of Office
and Length of
Time Served (1) | | Principal Occupation(s)
During Past Five Years | | Number of Funds
in Fund Complex
Overseen By Trustee | | Other Directorships
Held by Trustee |
| | | | | | | | | | | |
George Cooke
Year of Birth: 1952 | | Trustee; Member of Audit Committee; Member of Governance and Nominating Committee | | Indefinite Term, Since 2020 | | Business Development, Tocqueville Capital Management, June 2015 – April 2020. | | 3 | | None |
| | | | | | | | | | | |
Charles F. Gauvin
Year of Birth: 1956 | | Trustee; Member of Audit Committee; Member of Governance and Nominating Committee | | Indefinite Term, Since February 2015 | | Independent consultant on strategy, leadership and philanthropy, from 2018 – present; Chief Development Officer, Woods Hole Oceanographic Institution, from February 2016 – 2018; Executive Director, Maine Audubon, from August 2014 – January 2016 | | 3 | | Director, Bioqual, Inc., July 1992 – present. |
| | | | | | | | | | | |
James W. Gerard
Year of Birth: 1961 | | Trustee; Member of Audit Committee; Member of Governance and Nominating Committee | | Indefinite Term, Since 2001 | | Managing Director, Hycroft Advisors, from January 2010-present; Managing Director, deVisscher & Co., LLC from January 2013 to present; The Chart Group from January 2001 to present. | | 3 | | President, American Overseas Memorial Day Association, 1998 – present; Trustee, Salisbury School, 2005 – present; Director, American Friends of Bleraucourt, 1992 – present; President, Little Baby Face Foundation, March 2015 – present. |
42 | October 31, 2022
ADDITIONAL INFORMATION (UNAUDITED)
Interested Trustees(2) and Officers
| Name and Age | | Position(s) Held
with the Trust | | Term of Office
and Length of
Time Served (1) | | Principal Occupation(s)
During Past Five Years | | Number of Funds
in Fund Complex
Overseen By Trustee | | Other Directorships
Held by Trustee |
| | | | | | | | | | | |
Jeff Zatkowsky
Year of Birth: 1970 | | Treasurer | | Indefinite Term, Since 2021 | | Controller / Treasurer of Tocqueville Asset Management from February 2021 to present; CFO, SMT Financial Corp., December 2019 – February 2021; Controller, Summit Financial Corp., August 2014 - November 2019; Manager, Citco Fund Services, March 2007 – July 2014. | | N/A | | N/A |
| | | | | | | | | | | |
Robert W. Kleinschmidt
Year of Birth: 1949 | | Chairman, President, and Trustee | | Indefinite Term, Chairman Since 2016, and President and Trustee Since 1991 | | Chief Executive Officer, President and Chief Investment Officer, Tocqueville Asset Management; Director, Tocqueville Management Corporation, General Partner, Tocqueville Asset Management L.P. and Tocqueville Securities L.P., January 1994 to present. | | 3 | | President and Director, Tocqueville Management Corporation, the General Partner of Tocqueville Asset Management L.P. and Tocqueville Securities L.P. |
| | | | | | | | | | | |
Stephan Yevak
Year of Birth: 1959 | | Anti-Money Laundering Compliance Officer | | Indefinite Term, Since 2018 | | Deputy Chief Compliance Officer, Tocqueville Securities, L.P. from August 2011 to present; Deputy Chief Compliance Officer, Tocqueville Asset Management from August 2011 to present. Anti-Money Laundering Compliance Officer to both entities from March 2018 to present. | | N/A | | N/A |
Annual Report | 43
ADDITIONAL INFORMATION (UNAUDITED)
Interested Trustees(2) and Officers
| Name and Age | | Position(s) Held
with the Trust | | Term of Office
and Length of
Time Served (1) | | Principal Occupation(s)
During Past Five Years | | Number of Funds
in Fund Complex
Overseen By Trustee | | Other Directorships
Held by Trustee |
| | | | | | | | | | | |
Cleo Kotis
Year of Birth: 1975 | | Secretary | | Indefinite Term, Since 2010 | | Director of Operations, the Delafield Group of Tocqueville Asset Management L.P., 2009 to present. | | N/A | | N/A |
| | | | | | | | | | | |
Charles Martin
Year of Birth: 1988 | | Chief Compliance Officer | | Indefinite Term, Since 2020 | | Managing Director, Vigilant Compliance, LLC, 2012 – present. | | N/A | | N/A |
| (1) | Each Trustee will hold office for an indefinite term until the earliest of (i) the next meeting of shareholders, if any, called for the purpose of considering the election or re-election of such Trustee and until the election and qualification of his or her successor, if any, elected at such meeting, or (ii) the date a Trustee resigns or retires, or a Trustee is removed by the Board of Trustees or shareholders, in accordance with the Trust’s By-Laws, as amended, and Agreement and Declaration of Trust, as amended. Each officer will hold office for an indefinite term until the date he or she resigns or retires or until his or her successor is elected and qualifies. |
| (2) | “Interested person” of the Trust as defined in the 1940 Act. Mr. Kleinschmidt is considered “interested person” because of his affiliation with the Advisor. |
The Statement of Additional Information includes additional information about the Trustees and is available free of charge by calling the Funds toll free at 1-800-355-7307.
44 | October 31, 2022
| 2. | INVESTMENT ADVISORY AGREEMENT DISCLOSURE |
In determining whether to approve the continuance of the Investment Advisory Agreements and the Administration Agreement, the Trustees, including the Independent Trustees, considered the following information:
1) The nature, extent and quality of services provided by the Adviser.
The Trustees reviewed in detail the nature and extent of the services provided by the Adviser under the terms of the Investment Advisory Agreements and the quality of those services provided to Funds over the past year. The Trustees noted that the services under the Investment Advisory Agreements include: managing the investment and reinvestment of the Funds’ assets; supervising and managing all aspects of the Funds’ operations; and providing the Board on a regular basis with financial reports and analyses on the Funds’ operations and the operations of comparable investment companies. The Trustees also observed that the Adviser provides various administrative services to the Funds pursuant to the terms of the Administration Agreement and considered the nature, extent and quality of services provided under that agreement as well. The Trustees evaluated these factors based on their direct experience with the Adviser and in consultation with counsel. The Trustees concluded that the nature and extent of the services provided under the Investment Advisory Agreements and the Administration Agreement were reasonable and appropriate in relation to the advisory fee and administration fee, respectively, that the level of services provided by the Adviser to the Funds had not diminished over the past year and that the quality of services continues to be high. The Trustees reviewed the personnel responsible for providing advisory and administrative services to the Funds and concluded, based on their experience and interaction with the Adviser, that (i) the Adviser was able to retain quality portfolio managers and other personnel; (ii) the Adviser exhibited a high level of diligence and attention to detail in carrying out its advisory and administrative responsibilities under the Investment Advisory Agreements and Administration Agreement, respectively, for the Funds; (iii) the Adviser was responsive to requests of the Trustees; and (iv) the Adviser had kept the Trustees apprised of developments relating to the Funds and the industry in general. The Trustees also focused on the Adviser’s reputation and long-standing relationship with the Trust.
In connection with its assessment of the performance of the Adviser, the Trustees reviewed the Adviser’s financial statements and considered the Adviser’s financial condition and whether it has the resources necessary to continue to carry out its obligations under the Investment Advisory Agreements and the Administration Agreement. The Trustees concluded that the Adviser has the financial resources necessary to continue to perform its obligations under the Investment Advisory Agreements and the Administration Agreement and to continue to provide the high quality services that it has provided to the Funds to date.
2) The performance of the Funds and the Adviser.
The Trustees reviewed the investment performance of the Funds, both on an absolute basis and as compared to a peer group for each respective Fund for the one-year, three-year, five-year and ten-year periods, ended July 31, 2022. The peer groups were comprised of other funds that had similar investment objectives and sales load structures, as determined by Morningstar: The Morningstar Large Blend Funds peer group, with total net assets between $200 million and $400 million, for The Tocqueville Fund; the Morningstar Mid-Cap Growth Funds peer group, with total net assets between $50 million and $150 million, for The Tocqueville Opportunity Fund; and the Morningstar Small Value Funds peer group, with total net assets between $100 million and $300 million, for The Tocqueville Phoenix Fund (the “Performance Peer Groups”).
Annual Report | 45
The Trustees also compared each Fund’s investment performance against its benchmark market indices: the S&P 500 Index for The Tocqueville Fund; the Russell 2500 Growth Index for The Tocqueville Opportunity Fund; and the Russell 2000 Value Index and the Russell 2000 Total Return Index for The Tocqueville Phoenix Fund (the “Indices”) for the one-year, three-year, five-year, and ten-year periods ended July 31, 2021 for all the Funds. The Trustees considered the above information as helpful in their assessment of whether the Adviser was obtaining for the Funds’ shareholders the performance that was available in the marketplace given each Fund’s investment objectives, policies, strategies, limitations and restrictions. The Trustees concluded that the performance of the Funds against their respective Performance Peer Groups was satisfactory. In particular, the Trustees noted that The Tocqueville Fund had underperformed as compared to its Index for all periods and underperformed the median of its Performance Peer Group for all periods. The Trustees noted that The Tocqueville Opportunity Fund underperformed its Index for the one-year period and outperformed its Index for the three-year, five-year, and ten-year periods and underperformed the median of its Performance Peer Group for the one-year period and outperformed the median of its Performance Peer Group for the three-year, five-year, and ten-year periods. The Trustees noted that The Tocqueville Phoenix Fund overperformed both of its Indices for the one-year period and underperformed both of its Indices for the three-year, five-year, and ten-year periods; and overperformed the median of its Performance Peer Group for all periods.
3) The cost of the advisory services and the profits to the Adviser from the relationship with the Trust.
In connection with the Trustee’s consideration of the level of the advisory fees, the Trustees considered a number of factors. The Trustees compared the level of the advisory fees for each Fund against the advisory fees charged by funds in a universe of funds: the Morningstar Large Blend Funds peer group, with average net assets between $221 million and $384 million, for The Tocqueville Fund; the Morningstar Mid-Cap Growth Funds peer group, with average net assets between $54 million and $146 million, for The Tocqueville Opportunity Fund; and the Morningstar Small Value Funds peer group, with average net assets between $100 million and $282 million, for The Tocqueville Phoenix Fund (the “Expense Peer Groups”). The Trustees considered comparative total fund expenses of the Funds and the Expense Peer Groups. The Trustees used this comparative fee information and total expense data as a guide to help assess the reasonableness of each Fund’s advisory fee, although they acknowledged that it was difficult to make precise comparisons with other funds since the exact nature of services provided under each Expense Peer Group fund agreement is often not apparent. The Trustees also viewed the Expense Peer Group fee information as a whole as useful in assessing whether the Adviser was providing services at a cost that was competitive with other, similar funds.
46 | October 31, 2022
The Trustees noted that the contract rate advisory fee and administration fee for each of the Funds were reasonable, despite the contractual advisory fee rate being above average for The Tocqueville Fund, and the administration fee being above average for The Tocqueville Fund, The Tocqueville Opportunity Fund, and The Tocqueville Phoenix Fund when compared to their respective Expense Peer Groups. The Trustees also considered the combined contract rate advisory and administration fee as compared to their respective Expense Peer Group. The Board further observed that the total expense ratios of the Funds were also reasonable. The Board noted that the total expense ratio for the Funds were above average when compared to their respective Expense Peer Groups. The Board also noted that the Funds each operate pursuant to an Expense Limitation Agreement whereby the Adviser has agreed to waive a portion of its fee necessary to limit the Fund’s total operating expenses to the level set forth in the Fund’s prospectus.
The Trustees also considered the profitability to the Adviser and its affiliate arising out of its relationship with the Trust. In this regard, the Trustees reviewed profitability data relating to the Adviser for the 12 month period ended July 31, 2022. The Trustees considered revenues received by the Adviser under the Investment Advisory Agreements and the Administration Agreement as well as revenues received by the Adviser’s affiliate, the Distributor, under the 12b-1 plans and Related Agreements and commissions received for effecting portfolio transactions. The Trustees concluded that the profitability of the Funds to the Adviser was not excessive.
4) The extent to which economies of scale will be realized as the Funds grow and whether fee levels reflect those economies of scale.
With respect to the Trustees’ consideration of economies of scale, the Trustees discussed with the Adviser whether economies of scale would be realized by it in its management of a Fund at higher asset levels. The Trustees noted that all of the Funds currently have advisory fee breakpoints and that they were satisfied that the current breakpoints were appropriate when compared with each Fund’s respective Peer Group. The Trustees also noted that the administration fee also has breakpoints. In the event there was significant asset growth in the future in a Fund, the Trustee’s determined to reassess whether the advisory fees and administration fee, including the current breakpoint structure, appropriately took into account any economies of scale that had been realized as a result of that growth.
5) Other Factors.
The Trustees also discussed the Adviser’s practices regarding the selection and compensation of brokers and dealers that execute portfolio transactions for the Funds and the brokers’ and dealers’ provision of brokerage and research services to the Adviser. The Trustees further discussed the potential benefits the Adviser derived from the Funds’ soft dollar arrangements, whereby brokers provide research to the Funds or the Adviser in return for allocating fund brokerage, and other investment data concerning soft dollars. The Board also discussed the Adviser’s use of an affiliated broker to effect portfolio transactions, noting that in addition to paying a competitive rate on commissions, the Adviser believed the Funds received better execution on trades.
Annual Report | 47
Based on a consideration of all these factors in their totality, the Trustees, including all of the Independent Trustees, determined that the Funds’ advisory fees and administration fees were fair and reasonable with respect to the quality of services that the Adviser provides and in light of the other factors described above that the Trustees deemed relevant. The Trustees based their decision on evaluations of all these factors as a whole and did not consider any one factor as all-important or controlling.
| | | |
| 3. | PROXY VOTING POLICIES AND PROCEDURES |
A description of the policies and procedures that The Tocqueville Trust uses to determine how to vote proxies relating to portfolio securities is available without charge upon request by calling 1-800-355-7307. Information regarding how The Tocqueville Trust voted proxies relating to portfolio securities during the most recent 12-month period ended June 30 is available by calling 1-800-355-7307 and it is also available on the SEC’s web site at http://www.sec.gov.
At the special meeting held on November 15, 2022, shareholders of both the Opportunity Fund and the Phoenix Fund voted to approve the Plans of Reorganization, and to transact such other business as may have properly come before the special meeting. Shareholders of each Fund were asked to consider and vote upon the following proposals:
| 1. | For shareholders of each Acquired Fund to approve the Plan with respect to each Acquired Fund, which provides for: (i) the transfer of all of the assets and liabilities of each Acquired Fund to the Acquiring Fund in exchange for shares of the Acquiring Fund; and (ii) the distribution of shares of the Acquiring Fund so received to shareholders of each Acquired Fund. |
| 2. | For shareholders of each Acquired Fund to transact such other business as may properly come before the Special Meeting or any adjournment thereof. |
The results of the meeting were as follows:
| | Proposal 1 | | Proposal 2 |
| | For % | | Against % | | Abstain % | | For % | | Against % | | Abstain % |
| Opportunity Fund | | | 99.48 | % | | 0.16 | % | | 0.36 | % | | 99.50 | % | | 0.11 | % | | 0.39 | % |
| Phoenix Fund | | | 91.84 | % | | 2.45 | % | | 5.71 | % | | 92.14 | % | | 2.16 | % | | 5.70 | % |
Accordingly, the proposal was approved.
48 | October 31, 2022
| | | |
| 4. | SHAREHOLDER REPORTS AND QUARTERLY PORTFOLIO DISCLOSURE |
The Tocqueville Trust will file its complete schedule of portfolio holdings with the SEC for the first and third quarters of each fiscal year on Part F of Form N-PORT. The Fund’s Part F of Form N-PORT will be available on the EDGAR database on the SEC’s website at www.sec.gov. These Forms may also be reviewed and copied at the SEC’s Public Reference Room in Washington D.C. Information about the operation of the Public Reference Room may be obtained by calling 1-800-SEC-0330. Quarterly portfolio holdings are also available on the website of The Tocqueville Funds, www.tocquevillefunds.com.
| | | |
| 5. | SHAREHOLDER NOTIFICATION OF FEDERAL TAX STATUS |
For the fiscal year ended October 31, 2022, certain dividends paid by the Funds may be subject to a maximum tax rate of 23%, as provided for by the Tax Cuts and Jobs Act of 2017. The percentage of dividends declared from ordinary income designated as qualified dividend income was as follows:
| Tocqueville Fund | 100.00% |
| Opportunity Fund | 30.48% |
| Phoenix Fund | 100.00% |
For corporate shareholders, the percent of ordinary income distributions qualifying for the corporate dividends received deduction for the fiscal year ended October 31, 2022, was as follows:
| Tocqueville Fund | 100.00% |
| Opportunity Fund | 27.91% |
| Phoenix Fund | 100.00% |
For the year ended October 31, 2022, the funds designate the following percent of ordinary distributions paid as interest-related dividends under the Internal Revenue Code Section 871(k)(1)(c):
| Tocqueville Fund | 0.00% |
| Opportunity Fund | 0.00% |
| Phoenix Fund | 0.00% |
The percentage of taxable ordinary income distributions that are designated as short-term capital gain distributions under Internal Revenue Section 871(k)(2)(C) for each Fund were as follows.
| Tocqueville Fund | 0.00% |
| Opportunity Fund | 100.00% |
| Phoenix Fund | 100.00% |
Annual Report | 49
[This page intentionally left blank]
Investment Adviser
Tocqueville Asset Management L.P.
40 W. 57th St., 19th Floor
New York, NY 10019
(212) 698-0800
www.tocqueville.com
Distributor
Tocqueville Securities, L.P.
40 W. 57th St., 19th Floor
New York, NY 10019
(212) 698-0800
Shareholders’ Servicing and Transfer Agent
U.S. Bank Global Fund Services, LLC doing business as
U.S. Bank Global Fund Services
615 East Michigan Street
Milwaukee, WI 53202
Custodian
U.S. Bank, N.A.
Custody Operations
1555 River Center Drive, Suite 302
Milwaukee, WI 53212
Board of Trustees
Robert W. Kleinschmidt—Chairman
George Cooke
Charles F. Gauvin
James W. Gerard
Independent Registered Public Accounting Firm
Cohen & Company, Ltd.
342 North Water Street, Suite 830
Milwaukee, WI 53202

Tocqueville Funds
c/o US Bancorp Fund Services, LLC
P.O. Box 701
Milwaukee, WI 53201-0701
www.tocquevillefunds.com
TQ ANUAL 10/31/22