UNITED STATES
SECURITIES AND EXCHANGE COMMISSION
Washington, D.C. 20549
FORM N-CSR
CERTIFIED SHAREHOLDER REPORT OF REGISTERED
MANAGEMENT INVESTMENT COMPANIES
Investment Company Act file number 811-04840
The Tocqueville Trust
(Exact name of registrant as specified in charter)
The Tocqueville Trust
40 W. 57th St., 19th Floor
New York, NY 10019
(Address of principal executive offices) (Zip code)
Robert W. Kleinschmidt
The Tocqueville Trust
40 W. 57th St., 19th Floor
New York, NY 10019
(Name and address of agent for service)
(212) 698-0800
Registrant’s telephone number, including area code
Date of fiscal year end: October 31, 2018
Date of reporting period: October 31, 2018
Item 1. Reports to Stockholders.

The Tocqueville Trust
Mutual Funds
Annual Report
October 31, 2018
The Tocqueville Fund
The Tocqueville Opportunity Fund
The Tocqueville International Value Fund
The Tocqueville Gold Fund
The Delafield Fund
The Tocqueville Select Fund

This report is not authorized for distribution to prospective investors unless preceded or accompanied by a currently effective prospectus of The Tocqueville Trust. Please call 1-800-697-FUND (3863) for a free prospectus. Read it carefully before you invest.
You are invited to visit our website @ www.tocquevillefunds.com
Chairman’s Letter
Dear Fellow Shareholder,
Toward the end of the recently concluded fiscal year (October 31, 2018) markets began to react to concerns over global trade wars, U.S. mid-term elections, an unusually chaotic Presidential administration, Brexit, weakness in commodity prices, and rising interest rates. Most of these factors were evident through-out the period, but markets turned their attention elsewhere, particularly towards the seemingly limitless opportunities and growth prospects of a select few, large capitalization, technology/new economy companies. When two of them topped one trillion dollars in market value within a few weeks of each other, it was, in retrospect, a sign that these more fundamental concerns would once again begin to matter. And, indeed they have, continuing into the current fiscal year. From our long-term, sober perspective, the change of focus was inevitable, if not outright predictable.
Timing, as they say, is everything, and, no doubt, the preoccupation with the FANG stocks lasted far longer than we would have guessed. In some cases, valuations were clearly stretched, but there were other factors, as well. Consensus bullishness is always a contrary indicator. Among other certainties, large powerful companies attract unwanted government and media attention. The FANG names have had their share of that and we believe more is to come. Make no mistake, these companies are, for the most part, high quality, disruptive technology global giants with high returns on capital, piles of cash and dominant market shares. These strengths, however, led to very widespread enthusiastic complacency, even as they raised warning flags to regulators, media kingmakers and an assorted variety of political opportunists. The pair make for a dangerous combination.
Meanwhile, most other markets and common shares had a much more difficult time of it, through-out most of the fiscal year and particularly, at the end of it. In the period ahead, we would not be surprised to see this larger group of equities, in the U.S. as well as in the rest of the world, do better, as trade tensions eventually ease, Brexit finally happens, the markets embrace, as they usually do, divided government in Washington, and the Mueller probe into Russian influence over the U.S. Presidential Elections comes to (a probable anti-climactic) close, while lower oil prices and continued solid economic growth in the world’s largest economy justify valuations. Rising interest rates remain a concern, of course, as the problem with massive sovereign dollar denominated debt has not gone away, indeed it has only worsened. This needs to be carefully watched for its fiscal and inflationary implications. But so long as inflationary expectations and
interest rates are at benign levels, we believe the path of least resistance for the army of worldwide equities will be up, even if the leadership has been de-fanged.
Sincerely,

Robert W. Kleinschmidt
Chairman
The Tocqueville Fund
Dear Fellow Shareholder,
For the 12 months ended October 31, 2018, the Tocqueville Fund gained 2.01%, compared with the S&P 500, which returned 7.35% and with the Russell 3000 Value Index which returned 2.77%. Once again growth stocks outperformed value stocks; and, the S&P’s results were inflated by the now so-called FANMAG stocks (Facebook, Amazon, Netflix, Microsoft, Apple and Google), though not quite as heavily as last year, and hints of sector rotation away from large cap tech definitely appeared to begin during the later months of the period. Still, these six names (some of which are owned by the Fund but are underweighted compared with the benchmarks) combined to contribute approximately 40% of the S&P’s returns.
Sector performance of the Fund was mixed with Health Care, Information Technology and Consumer Discretionary leading the way and Energy, Industrials and Real Estate being the biggest detractors. Individually, the top performing names were Amazon, Microsoft, Boeing, Apple and Merck. Aside from the Fund’s participation in the FANMAG stocks, Boeing made the list of the top performers for the second year in a row on the continued health of the aerospace industry and Merck benefitted from its new Keytruda lung cancer drug.
The laggards in the portfolio were Applied Materials, General Electric, DowDuPont, Weyerhaeuser and Schlumberger. Applied Materials which was a top performer last year suffered as fears of a downturn in the semiconductor cycle took hold. General Electric, which was also on the list of laggards last year due to its considerable energy exposure, secular challenges and problems with cash flow conversion was held over because it had been embarking on a major restructuring with new management that we hoped would be successful. The situation has turned out to be worse than we thought, so we liquidated the position at the end of the fiscal year for tax purposes. Schlumberger was also held over despite being a laggard from last year as we had believed that oil producers would eventually need to return to large scale projects that are their specialty, and that oil prices supported a return to higher service activity levels. However, while oil production and spending may have improved, it has come in areas where Schlumberger is not as active, such as domestic shale regions. So here, too, for tax purposes, we chose to eliminate the position, as management continued to take down its forecasts and refocus on Halliburton, which is more exposed to shale.
Several new positions were initiated during the period. One of these is Fluor, an engineering and construction business. Fluor’s shares had fallen out of favor because of recent declines in its backlog, particularly in energy and mining; poor performance on several fixed price contracts; and worsening revenue mix. Our take was that its valuation more than accounted for these negatives, and with the global economy improving, so should its backlog. Importantly, we reasoned, with what we view as one of the best
balance sheets in the industry, if other participants faltered during the downturn, Fluor would be poised to pick up market share.
Another new position is Vulcan Materials, an aggregates and cement producer, which is similar to Eagle Materials, which was also purchased but later sold during the year. Vulcan, unlike Eagle, does not have the energy or homebuilding exposure that seems to continue to be a drag on Eagle’s business and were the reasons for our decision to switch out of the position. Vulcan shares appeared out of favor, as investors continued to doubt the ability of the Trump Administration to pass any infrastructure related legislation. Our view was that the company would benefit from an infrastructure bill that could be brought back into play following mid-term elections, and that weather delays would eventually resolve themselves.
Other positions that we added to or initiated during the fiscal year at times of market volatility or when opportunities presented themselves include: Apple, Arconic, Baker Hughes GE, Biogen, Brighthouse Financial, Campbell Soup, Coherent, Eagle Materials, General Electric, Goldcorp, Halliburton, JD.com, JP Morgan, Juno Therapeutics, Las Vegas Sands, Metlife, Nektar Therapeutics, Newell Brands, Noble Energy, Overstock, Parker Hannifin, PG&E, Pioneer Natural Resources, Walt Disney, Wells Fargo and Zoe’s Kitchen.
A variety of names were sold or reduced during the period, mostly in response to needs for liquidity but also to make room for better ideas, as prices reached our objectives or in response to fundamental changes. These included: Alcoa, Alkermes, Amazon, Apple, Applied Materials, Baker Hughes GE, Boeing, Brighthouse Financial, Coherent, Delta Airlines, DowDuPont, Eagle Materials, Facebook, Fannie Mae 8.25% Series S Preferred, General Electric, Intel, Las Vegas Sands, Lazard, McDonald’s, Microsoft, Newell Brands, Nextera Energy, Noble Energy, Overstock.com, Palo Alto Networks, PG&E, Qualcomm, Schlumberger, Synchrony Financial, U.S. Concrete, Walmart, Wells Fargo, Williams Sonoma and Zoe’s Kitchen. Of those sold due to fundamental change, Juno Therapeutics was as a result of a takeover and JD.com, which became embroiled in controversy which could have long-term implications.
As we look forward, we continue to believe that the U.S. economy is relatively healthy, with few signs of a near-term recession, due to its strong consumer sector and the fiscal stimulus from lower taxes, reduced regulation and higher government spending. However, the market is beginning to pay more attention to perceived signs of a global slowdown (which may, or may not, materialize) as exhibited by declining commodity and energy prices and a flattening yield curve. While the market is still near its record highs, there is evidence of investor rotation away from the large-cap technology names that have led the market for so many years and toward more typical value-oriented names. If so, we believe we are well positioned to participate in that transition.
Sincerely,
| | |
| | 
|
| Robert W. Kleinschmidt | | Peter D. Shawn |
| Portfolio Manager | | Director of Research |
The Tocqueville Fund
(Unaudited)
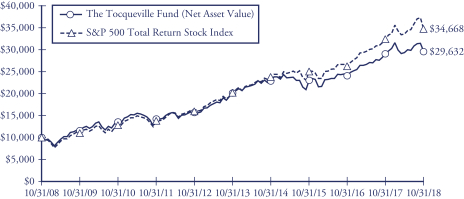
This chart assumes an initial gross investment of $10,000 made on 10/31/08. Returns shown do not reflect the deduction of taxes that a shareholder would pay on fund distributions or the redemption of fund shares. Performance reflects fee waivers in effect. In the absence of fee waivers, total return would be reduced. Returns shown include the reinvestment of all dividends and other distributions. Past performance is not predictive of future performance. Investment return and principal value will fluctuate so that your shares, when redeemed, may be worth more or less than their original cost.
The Standard & Poor’s 500 Total Return Stock Index (S&P 500) is a capital-weighted index, representing the aggregate market value of the common equity of 500 stocks primarily traded on the New York Stock Exchange. Returns assume the reinvestment of all dividends.
AVERAGE ANNUAL RATE OF RETURN (%)
FOR YEARS ENDED OCTOBER 31, 2018
| | | | | | | | | | | | | | | | |
| | | 1 Year | | | 3 Year | | | 5 Year | | | 10 Year | |
The Tocqueville Fund | | | 2.01% | | | | 8.86% | | | | 8.02% | | | | 11.47% | |
Standard & Poor’s 500 Total Return Stock Index | | | 7.35% | | | | 11.52% | | | | 11.34% | | | | 13.24% | |
The Tocqueville Opportunity Fund
Dear Fellow Shareholder,
We are pleased to provide this investment overview for the 2018 fiscal year for the Tocqueville Opportunity Fund. During the year ended October 31, 2018, the Fund appreciated 5.30% and underperformed the SMID cap growth benchmark, the Russell 2500 Growth Index, which gained 5.52%. The past year’s returns followed the prior year’s (Fiscal 2017) strong investment appreciation of 36.47% versus the benchmark which gained 30.07%. We believe that the past two years of solid performance were in part driven by a very challenging environment in 2016 for growth issues due to pervasive uncertainty and a heightened sense of macro related risks, including: Chinese currency devaluation, a weakened Chinese economy, an oil price collapse, the first Fed tightening in the current cycle, EU bank credits, possible drug price regulation, Brexit, and the U.S. Presidential election. We view the past two years’ gains as not only having benefitted from a solid background of strong sales and earnings growth, but also due to recovery from negative sentiment in 2016.
We believed that the consequent economic stimulus would usher in a new period of rising consumer and corporate confidence which would lead to a pop in capital spending. Shortly after the new tax policy was passed, the Administration announced changes to U.S. trade policy—broadly targeted to major U.S. trading partners including: Mexico, Canada, China, Japan and the European Union. Initially, we believed that the impact of trade policy adjustments and tariffs on imported goods would be benign; we now believe that macroeconomic risks and uncertainty have increased. In addition to a clear slowing of economic activity outside the U.S., there is recent evidence that corporate confidence is wavering, and that capital spending and residential housing activity and prices are decelerating. The Federal Reserve appears certain to remain committed to its current cycle of rate tightening, as unemployment levels exist at historical lows and wage increases threaten underlying inflation. In short, the investment outlook has become more uncertain.
Investments in Information Technology, Basic Materials, and Energy provided the leading contributions on a relative basis versus the benchmark. Information Technology investments were the leading drivers of absolute and relative performance. Positive relative performance in the Materials and Energy sectors were attributable to the fact that we maintained appreciable underweights in each sector throughout the investment period—the two were in fact the worst two performing sectors for the year. As the fiscal year was closing out, oil price declines were accelerating given overproduction. Industrials, Financials, Real Estate and Utilities sector investments also contributed positively on a relative basis, despite the fact that the Fund was underweight each of these sectors over the course of the fiscal year. Healthcare, Consumer Discretionary, Staples and Communication Services (new sector) all lagged the benchmark on a relative basis.
While Healthcare investments provided the second leading sector gains on an absolute basis, the Fund was impacted by underperformance of several of the Fund’s longer-term healthcare investments.
Technology investments in IT Service, Internet and Cloud software drove the overall performance of the Fund on an absolute and relative basis, including: New Relic, ServiceNow, Shopify, Coupa Software, Paycom Software and Workday. Other than Coupa, all of these names have been long-term, multiyear investments for the Fund. We continue to maintain a very constructive view on the outlook for IT spending over the next year due to CIO spending surveys, CEO commentary, and the ongoing secular shift of IT spending from on-premise and license-based to edge, cloud and SAAS based models. Acquisitions in the Technology sector have confirmed not only the shift in strategy, but also attractive valuations. Healthcare investments proved to be the most challenging during the year. While the Fund’s performance was led by gains in SAGE Therapeutics, Sarepta Therapeutics and AveXis, it was significantly dragged downward by declines in at least five of last year’s leaders despite FDA approvals for most including: TESARO, Spark Therapeutics, Clovis Oncology and Alnylam Pharmaceuticals.
We are pleased to write that the Fund participated in 8 takeovers during the fiscal period, and that the Fund has participated in approximately 90 takeovers since 2010. Fiscal 2018 takeovers included: Oclaro, K2M Holdings, Juno, Integrated Devices, Callidus Software, Cavium, AveXis, and Esterline. We believe the rising uncertainty of trade policies and tariffs have not only begun to crimp capital spending but also takeover activities, despite attractive valuations and strong balance sheets.
The Fund’s Top 10, 50, and 100 positions at the end of the fiscal period comprised 36%, 76%, and 94%, respectively. The Fund’s active share relative to its benchmark continues to be high and has ranged from a low of 78.5% to high of 84.5% during the past 12 months.
We believe that the Fund’s investments are placed in competitively advantaged companies which are led by strong management. We have learned lessons over the years, and one of the most important is not to sell competitively advantaged companies when sentiment shifts to negative although investment fundamentals for such companies remain strong and market shares are expanding. Investing in fast growing companies in industries that are undergoing rapid innovations, change and expansion can be particularly challenging during periods of heightened macroeconomic risks; however, as we experienced in 2011 (Greece) and 2016 (China, Oil, Brexit, Presidential Election), volatile markets generally present the best investment opportunities for the patient investor.
As always, we appreciate your continued confidence in our efforts on behalf of the Fund and its shareholders.
Sincerely,

Thomas R. Vandeventer
Portfolio Manager
The Tocqueville Opportunity Fund
(Unaudited)
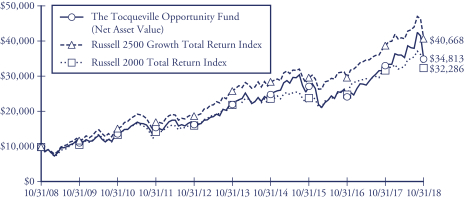
This chart assumes an initial gross investment of $10,000 made on 10/31/08. Returns shown do not reflect the deduction of taxes that a shareholder would pay on fund distributions or the redemption of fund shares. Returns shown include the reinvestment of all dividends and other distributions. Past performance is not predictive of future performance. Investment return and principal value will fluctuate so that your shares, when redeemed, may be worth more or less than their original cost.
The chart and table reflect The Opportunity Fund’s performance achieved prior to the changes effected in 2010 to its investment strategy.
The Russell 2500 Growth Total Return Index is an unmanaged index that measures the performance of the small to mid-cap growth segment of the U.S. equity universe. It includes those Russell 2500 companies with higher price-to-book ratios and higher forecasted growth values. Returns assume the reinvestment of all dividends
The Russell 2000 Total Return Index is an unmanaged index that measures the performance of the 2,000 smallest companies in the Russell 3000 Index. Returns include the reinvestment of all dividends.
AVERAGE ANNUAL RATE OF RETURN (%)
FOR YEARS ENDED OCTOBER 31, 2018
| | | | | | | | | | | | | | | | |
| | | 1 Year | | | 3 Year | | | 5 Year | | | 10 Year | |
The Tocqueville Opportunity Fund | | | 5.30% | | | | 8.71% | | | | 9.54% | | | | 13.29% | |
Russell 2500 Growth Total Return Index | | | 5.52% | | | | 11.13% | | | | 9.53% | | | | 15.06% | |
Russell 2000 Total Return Index | | | 1.85% | | | | 10.68% | | | | 8.01% | | | | 12.44% | |
The Tocqueville International Value Fund
Dear Fellow Shareholder,
During the fiscal year ended October 31, 2018, the Tocqueville International Value Fund’s total U.S. dollar return was negative 13.22%. In the same period, the Morgan Stanley EAFE Index Net, the index against which we are most often compared to, had a net total U.S. dollar return of negative 6.85%. For the 15-year period ended October 31, 2018, the Fund’s total U.S. dollar return was 6.95% per annum. In the same period, the Morgan Stanley EAFE Index Net had a net total U.S. dollar return of 5.78% per annum.
Developed equity markets outside the U.S. generally declined during the year, as positive earnings growth data was overshadowed by investor concerns regarding Brexit, Italy’s politics and budget deficit, and trade wars and their damaging impact on global growth. Growth concerns were magnified by the U.S. Federal Reserve’s apparent determination to increase interest rates. With growth relatively strong in the U.S., the dollar increased in value against most currencies, which in turn contributed to declines in the price of most commodities. In spite of growth concerns, long-term interest rates were generally up. Equity market volatility increased, and credit spreads widened somewhat. Among the worst performing markets were China, Korea and Germany, each levered to global growth and trade. Among industry groups, paper and forest products, home furnishings, pharmaceuticals, oil & gas producers, travel and leisure and retail performed well, while banks, auto parts, building materials, tobacco and telecoms were weak.
During the period, the Fund benefited from security selection in the consumer discretionary, financials and materials areas. Results were negatively impacted by the performance of positions in the healthcare, industrials and information technology areas. The Fund had meaningful contributions from design software concern Aveva, telecom equipment provider Ericsson, resource company BHP Billiton, fertilizer producer and distributor Nutrien, and drug maker Novartis. Notable detractors were chemical and consumer company Bayer, IT services concern Sopra Steria, medical equipment maker Miraca, building materials maker and distributor Saint Gobain, and analog chipmaker Infineon.
The Fund sold its positions in DCC, Misumi, Ericsson, and Johnson Matthey as their respective share prices approached our estimates of intrinsic value. Tender offers for Fund holdings Zodiac and Global Logistics Properties were completed, and Fund holding Potash Corp. became Nutrien following its merger with Agrium. We eliminated the position in Telefonica Brasil as the competitive environment became more uncertain. We exited the position in Miraca when the company’s senior management failed to convince us of the strategic rationale for its surprise large capital expenditure plan. We reduced the position in Bayer when a California court ruled in favor of a plaintiff claiming the company’s glyphosate herbicide product causes cancer.
During the period, the Fund purchased a position in software concern Micro Focus International, when shares sold off in response to weaker than expected operating results. Micro Focus has a portfolio of mature, cash generative enterprise software businesses and a fast-growing cloud software business. In our view, the market is valuing the company as if the mature businesses are in double digit decline, enabling us to acquire a largely recurring stream of free cash flows at a low multiple. We took a position in sporting goods maker Asics, which trades at a multi-year low valuation due to weak performance in the U.S. and European operations. We believe that management has a credible plan to improve results in the U.S. and Europe. Meanwhile, the company is generating profitable growth in China and the rest of Asia. We purchased shares of megabank Mitsubishi UFJ, which trades at a deep discount to book value and we believe that a combination of strategic focus on asset management and lending outside Japan should translate to an improving return on equity. We purchased a position in branded food company Danone. Danone’s product portfolio and growth profile have been among the best in the industry; however, subpar operating margins and questions about capital allocation have caused the stock to trade at a discount to intrinsic value. Under the leadership of its current CEO, Danone is shifting its focus from sales growth to improving margins and returns on capital, which should lead to improved profit growth and a rerating of the stock.
During the year, we added to positions in BHP Billiton, Nokia, Sanofi, UBS, Bollore, Smiths Group, CRH, Siemens, ISS, and St. Gobain, among others. Overall, there was a marginal increase in our exposure to Japan and Europe, including the U.K. and a decrease in our exposure to Latin America. We began the period with approximately 9% in cash reserves and finished the period with roughly 6%.
At the outset of the year, we noted that equity markets were enjoying an unusually positive confluence of factors, including strong growth, low inflation, low interest rates, lax monetary policy, and fiscal stimulus. Since then, we have seen a mild slowdown in growth, an uptick in inflation, a small pickup in interest rates, and a shift away from lax monetary policy in the U.S. The macro landscape is complicated by several factors, including trade disputes, Brexit, and budget deficits in the U.S. and Italy. That said, PMIs remain in positive territory and employment levels and consumer confidence are healthy. Inflation and interest rates remain low in absolute terms, liquidity conditions remain supportive in Europe and Japan, and valuations remain reasonable in absolute terms. Investor sentiment has shifted from complacent to guarded in recent months. In this mixed context, we continue to focus on individual company fundamentals and valuations.
Our investment objective remains to generate positive absolute returns and to exceed the returns of the major indices over the course of an economic cycle. To protect and grow your capital, we continue to seek out compelling long-term investment opportunities in companies that have defensible business franchises, are out of favor or misunderstood, and trade at a substantial discount to intrinsic value.
Sincerely,

James Hunt
Portfolio Manager
The Tocqueville International Value Fund
(Unaudited)
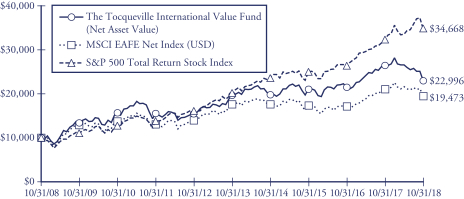
This chart assumes an initial gross investment of $10,000 made on 10/31/08. Returns shown do not reflect the deduction of taxes that a shareholder would pay on fund distributions or the redemption of fund shares. Performance reflects fee waivers in effect. In the absence of fee waivers, total return would be reduced. Returns shown include the reinvestment of all dividends and other distributions. Past performance is not predictive of future performance. Investment return and principal value will fluctuate so that your shares, when redeemed, may be worth more or less than their original cost.
The MSCI EAFE Net Index is an unmanaged market-capitalization-weighted index composed of companies representative of the market structure of 21 Developed Market Countries in Europe, Australia, Asia and the Far East.
The Standard & Poor’s 500 Total Return Stock Index (S&P 500) is a capital-weighted index, representing the aggregate market value of the common equity of 500 stocks primarily traded on the New York Stock Exchange. Returns include the reinvestment of all dividends.
AVERAGE ANNUAL RATE OF RETURN (%)
FOR YEARS ENDED OCTOBER 31, 2018
| | | | | | | | | | | | | | | | |
| | | 1 Year | | | 3 Year | | | 5 Year | | | 10 Year | |
The Tocqueville International Value Fund | | | -13.22% | | | | 3.06% | | | | 3.23% | | | | 8.68% | |
MSCI EAFE Net Index | | | -6.85% | | | | 3.62% | | | | 2.02% | | | | 6.89% | |
Standard & Poor’s 500 Total Return Stock Index | | | 7.35% | | | | 11.52% | | | | 11.34% | | | | 13.24% | |
The Tocqueville Gold Fund
Dear Fellow Shareholder,
During the past year, the gold price declined 4.43% and the Tocqueville Gold Fund declined 18.60%. During the same period, the U.S. dollar as measured by the DXY rose 2.72%. Over the past few years, the stronger dollar has been a headwind for gold. We believe that dollar strength is unsustainable due to intractable fiscal issues facing the U.S. As the financial markets begin to focus on the likelihood that trillion-dollar fiscal deficits are becoming commonplace, the dollar will begin to weaken. Famed investment manager Ray Dalio of Bridgewater Associates expects the dollar to decline by 30% over the next two years. If he is correct, and we believe that he is, a decline of that magnitude would very likely lead to chaotic financial markets and a substantial rise in inflation.
Gold ownership is a proven strategy to protect capital against systemic financial risk. In recent years, financial markets have been sanguine as to the implications of reckless U.S. fiscal and monetary policy. We believe that a moment of clarity is fast approaching, and it will take the form of a substantial decline in equities and a concomitant rise in the precious metals complex.
The Fund’s largest position is physical gold bullion made up of 119,680 ounces and represents about 17% of the Fund’s assets. That investment is held outside the financial system in secured vaults and audited regularly. The position provides Fund investors direct ownership of gold. Because gold bullion is less volatile than the precious metal equities held by the Fund, the physical gold position helped reduce the Fund’s overall volatility this past year.
The vast majority of the Fund’s assets are invested in mining equities that are focused on gold discovery or production. Additionally, and sometimes along with gold, we are exposed to silver. Silver is not only a precious metal but has many industrial applications as well. Similar to gold, it is considered a monetary metal. It often occurs with gold in multi-metallic orebodies, enhancing the value of those metal deposits.
The precious metal mining stocks that contributed positively during the past year included Corvus Gold Inc., Northern Star Resources Ltd., Evolution Mining Ltd., and Aurico Metals Inc. Corvus Gold Inc. is currently developing a significant gold resource on its Nevada property and has the potential to add more gold ounces from its drilling campaign. Northern Star Resources Ltd. and Evolution Mining Ltd. are two Australian based companies that are benefiting from well-executed acquisition strategies and improved operating costs due to a weaker Australian dollar. Aurico Metals Inc. was acquired in a friendly acquisition at a premium to its average market price during the past year.
Detour Gold Corporation, Franco-Nevada Corporation, Ivanhoe Mines Ltd., and Fresnillo PLC declined during the period and had the greatest negative impact on the
Fund’s performance. Detour Gold Corporation changed its mine plan which delayed some mining activity and reduced gold production this year. Franco-Nevada Corporation corrected from much stronger performance during 2017. Ivanhoe Mines Ltd. corrected from the market’s concern surrounding resource nationalism. Fresnillo PLC, a major silver producer, sold off as silver prices came under pressure between June and September, but more recently has recovered as silver prices generally stabilized.
During the period, the Fund established new positions in Cia de Minas Buenaventura, Yamana Gold Inc. and Gold Standard Ventures Corp. Buenaventura is growing cash flow from its current and new operating mines, while Yamana Gold Inc. is improving on its financial condition. Gold Standard Ventures Corp. has been developing gold deposits on its Nevada properties, which are likely to be attractive to a major mining company looking for U.S. based gold resources. Several positions were eliminated because they were either fully valued or presented limited value creation opportunities, such as Almadex Minerals and Independence Group; while Dalradian Resources was acquired during the year. With the proposed merger of two of the sector’s larger gold miners, Barrick and Randgold, we expect to see more sector M&A activity in the coming years.
It is notable that the precious metals mining sector represents one of the few islands of value in an overvalued equity market. Valuations relative to earnings, cash flow, reserves and production are the lowest in two decades. At the same time, companies in the Fund’s portfolio have done a good job of creating value for shareholders even if that accomplishment has been unrecognized in share performance.
As 2019 unfolds, we expect inflationary pressure to become manifest, while monetary policy remains behind the curve. Investor interest in precious metals was dormant during 2018, but we expect it to return as macroeconomic trends turn more favorable. These would include equity market weakness reflecting softening economic growth and dollar weakness accompanied by rising inflation and interest rates.
We appreciate your support over the past year and look forward to improved returns in 2019 and the years ahead.
Sincerely,
| | | | |
 | |  | |  |
| John C. Hathaway | | Douglas B. Groh | | Ryan McIntyre |
| Portfolio Manager | | Portfolio Manager | | Portfolio Manager |
The Tocqueville Gold Fund
(Unaudited)
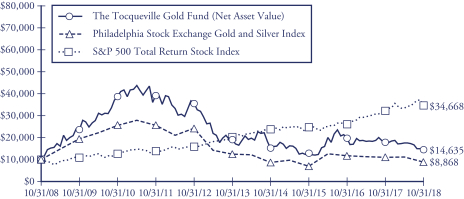
This chart assumes an initial gross investment of $10,000 made on 10/31/08. Returns shown do not reflect the deduction of taxes that a shareholder would pay on fund distributions or the redemption of fund shares. Returns shown include the reinvestment of all dividends and other distributions. Past performance is not predictive of future performance. Investment return and principal value will fluctuate so that your shares, when redeemed, may be worth more or less than their original cost. The Fund imposes a 2% redemption fee on shares held 90 days or less.
In 2009, 2010, and 2016 the performance of The Tocqueville Gold Fund was achieved during a period of unusually favorable market conditions. Such performance may not be sustainable.
The Philadelphia Stock Exchange Gold and Silver Index is an unmanaged capitalization-weighted index which includes the leading companies involved in the mining of gold and silver. Returns include the reinvestment of all dividends.
The Standard & Poor’s 500 Total Return Stock Index (S&P 500) is a capital-weighted index, representing the aggregate market value of the common equity of 500 stocks primarily traded on the New York Stock Exchange. Returns include the reinvestment of all dividends.
AVERAGE ANNUAL RATE OF RETURN (%)
FOR YEARS ENDED OCTOBER 31, 2018
| | | | | | | | | | | | | | | | |
| | | 1 Year | | | 3 Year | | | 5 Year | | | 10 Year | |
The Tocqueville Gold Fund | | | -18.60% | | | | 3.67% | | | | -5.26% | | | | 3.88% | |
Philadelphia Stock Exchange Gold and Silver Index | | | -20.23% | | | | 8.36% | | | | -6.73% | | | | -1.19% | |
Standard & Poor’s 500 Total Return Stock Index | | | 7.35% | | | | 11.52% | | | | 11.34% | | | | 13.24% | |
The Delafield Fund
Dear Fellow Shareholder,
For the fiscal year ended October 31, 2018, the Fund’s net asset value decreased 10.61%, underperforming an increase of 1.85% for the Russell 2000 Index (“Russell 2000”) and an increase of 7.35% for the larger cap oriented Standard & Poor’s 500 Index (“S&P 500”), each on a total return basis. Broadly speaking, during the first quarter of the fiscal year U.S. equity indices captured in excess of their eventual full fiscal year returns. During that three-month period, the Russell 2000 posted a 5.14% increase and the S&P 500 advanced in excess of 10%. Stocks rallied on favorable corporate earnings results, solid labor market data and an improved outlook for prospects of continued U.S. economic growth. The subsequent nine months of the fiscal year, however, were marked with the return of volatility and both domestic and foreign worries drove overall declines in the indices. On the domestic front, investors seemed to reverse course and focus on the possibility of spiking inflation and probability of rising interest rates, as well as the tumultuous and acrimonious political environment. Further, later in the fiscal period, President Trump’s trade war with China began to evidence itself in negative corporate earnings surprises. Internationally, friction remained constant in many parts of the world; Brexit related worries were renewed with ongoing negotiations unresolved and several foreign economies appearing to be headed into decline. From February 1, 2018 through October 31, 2018, the Russell 2000 declined 3.13%, while the S&P 500 dropped a comparable 2.57%.
The Fund’s performance for the fiscal year was disappointing. Both the Fund’s style (value) and the Fund’s market cap sweet spot (small to mid) remained out of favor with investors. The Russell 2000 Value Index finished the fiscal year in the red and underperformed the Russell 2000 Growth Index by nearly 500 basis points. While the Standard & Poor’s 500 Value Index managed to eke out a modest gain for the year, its growth-oriented counterpart outperformed by about 800 basis points. The divergence in performance between small and large cap stocks during the fiscal year was evident in the roughly 5.5 percentage point differential in the respective returns of the Russell 2000 and S&P 500. In an environment that was hostile to the Fund’s investment approach, investment selection needed to be nearly flawless; unfortunately, that was not the case. Six of the Fund’s holdings experienced outsized declines that in aggregate accounted for almost all of the underperformance, relative to the Russell 2000. At present, we believe the dislocation in three of these stocks (TTMI Technologies, Inc. (TTMI), U.S. Concrete, Inc. (USCR) and Flex Ltd. (FLEX)) is only temporary and they remain core holdings in the Fund’s portfolio, while the remaining three (Horizon Global Corporation (HZN), Diebold Nixdorf, Inc. (DBD) and McDermott International, Inc. (MDR)) have either been sold out entirely or have been greatly reduced in size. In contrast, Xerium Technologies Inc. (XRM), Team Inc. (TISI) and Fabrinet (FN) generated outsized returns during the fiscal year and were the largest positive contributors.
Not surprisingly, the Fund’s relative performance on a sector basis was highly correlated to the aforementioned six stocks. Information technology was the most challenged sector relative to the Russell 2000, with declines in DBD, FLEX and TTMI leading the way. The Fund’s materials sector investments (USCR) similarly underperformed, followed by consumer discretionary (HZN). A relative lack of exposure to the healthcare sector was also a detriment to the Fund’s performance, as it was the largest absolute contributor to the Russell 2000 during the fiscal year. Industrials, the Fund’s most heavily weighted sector, was a relative bright spot during the fiscal year.
During the fiscal year, we added a number of new positions to the portfolio, the largest of which included Acuity Brands Inc. (AYI), Apogee Enterprises Inc. (APOG), Commercial Metals Company (CMC), W.R. Grace (GRA), Mohawk Industries Inc (MHK), and Newell Brands Inc (NWL). The largest portfolio deletions included Acacia Communications Inc. (ACIA), Barnes Group Inc. (B), Boardwalk Pipeline Partners LP (BWP), Diebold Nixdorf (DBD), G-III Apparel Group, LTD (GIII), Invacare Corp (IVC) and Korn Ferry (KFY).
While the Fund’s performance has trailed the market for a frustratingly long period of time, the companies in which the Fund invests have, for the most part, continued to show progress. They are generating cash, increasing earnings and, in some cases, making strategic acquisitions to accelerate their growth. We remain convinced that their progress will be reflected in higher market values over time.
Sincerely,
| | |
 | |  |
| J. Dennis Delafield | | Vincent Sellecchia |
| Portfolio Manager | | Portfolio Manager |
| | |
 | |  |
| Joshua Kaufthal | | James Maxwell |
| Portfolio Manager | | Portfolio Manager |
The Delafield Fund
(Unaudited)
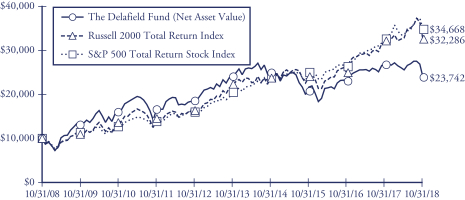
This chart assumes an initial gross investment of $10,000 made on 10/31/08. Since the Delafield Fund did not commence operations until 9/28/09, returns prior to that date are those of the Predecessor Fund. The Delafield Fund assumed the net asset value and performance history of the Predecessor Fund (See Footnote 1 to the Financial Statements). Returns shown do not reflect the deduction of taxes that a shareholder would pay on fund distributions or the redemption of fund shares. Performance reflects fee waivers in effect. In the absence of fee waivers, total return would be reduced. Returns shown include the reinvestment of all dividends and other distributions. Past performance is not predictive of future performance. Investment return and principal value will fluctuate so that your shares, when redeemed, may be worth more or less than their original cost.
The Russell 2000 Total Return Index is an unmanaged index that measures the performance of the 2,000 smallest companies in the Russell 3000 Index, which represent approximately 10% of the total market capitalization of the Russell 3000 Index. Returns include the reinvestment of all dividends.
The Standard & Poor’s 500 Total Return Stock Index (S&P 500) is a capital-weighted index, representing the aggregate market value of the common equity of 500 stocks primarily traded on the New York Stock Exchange. Returns include the reinvestment of all dividends.
AVERAGE ANNUAL RATE OF RETURN (%)
FOR YEARS ENDED OCTOBER 31, 2018
| | | | | | | | | | | | | | | | |
| | | 1 Year | | | 3 Year | | | 5 Year | | | 10 Year | |
The Delafield Fund | | | -10.61% | | | | 3.18% | | | | -0.42% | | | | 9.03% | |
Russell 2000 Total Return Index | | | 1.85% | | | | 10.68% | | | | 8.01% | | | | 12.44% | |
Standard & Poor’s 500 Total Return Stock Index | | | 7.35% | | | | 11.52% | | | | 11.34% | | | | 13.24% | |
The Tocqueville Select Fund
Dear Fellow Shareholder,
For the fiscal year ended October 31, 2018, the Fund’s net asset value decreased 6.39%, underperforming total returns of 2.80% and 1.85% for the Russell 2500 Index (“Russell 2500”) and Russell 2000 Index (“Russell 2000”), respectively. Performance of U.S. equity markets was uneven during the fiscal year, with stocks generating in excess of their eventual full fiscal year returns in the first quarter and declining in aggregate for the balance of the year. During the first quarter, the Russell 2500 posted a 6.79% increase, with stocks rallying on favorable corporate earnings results, solid labor market data and an improved outlook for prospects for continued U.S. economic growth. The Russell 2500 subsequently endured a 3.74% decline over the next nine months of the fiscal year, with volatility returning to the market and domestic and foreign macro worries re-emerging. On the domestic front, investors seemed to reverse course and focus on the possibility of spiking inflation and probability of rising interest rates, as well as the tumultuous and acrimonious political environment. Further, later in the fiscal period, President Trump’s trade war with China began to evidence itself in negative corporate earnings surprises. Internationally, friction remained constant in many parts of the world; Brexit related worries were renewed with ongoing negotiations unresolved and several foreign economies appearing to be headed into decline.
The Fund’s performance for the fiscal year was unsatisfactory. Through three quarters, the Fund’s performance was generally in-line with the Russell 2500 and then in the fourth quarter, a number of individual holdings suffered particularly meaningful declines. Owing to the concentrated nature of the Fund, individual miscues can be rather meaningful to the aggregate performance, as was the case this fiscal year. Namely Flex Ltd., Mohawk Industries and TTM Technologies Inc. experienced what we believe to be temporary miscues and remain in the Fund’s portfolio. In contrast, Horizon Global Corporation, Real Industry Inc. and Diebold Nixdorf were sold out of the Fund. In total, during the fiscal year, these five names detracted from the Fund’s relative performance by almost 15 percentage points.
Not surprisingly, the Fund’s relative performance on a sector basis was highly correlated to the aforementioned six stocks. Consumer discretionary was the Fund’s most challenged sector relative to the Russell 2500, with declines in Horizon Global and Mohawk leading the way. The Fund similarly underperformed in the information technology sector owing to Diebold, Flex and TTM Technologies. The Fund’s lack of exposure to the healthcare sector was also a detriment to its performance, as it was the largest absolute contributor to the Russell 2500 during the fiscal year. Industrials, the Fund’s most heavily weighted sector, was a relative bright spot during the fiscal year. Industrials holdings, led by Team, Inc., ICF International, Inc. and Harsco Corporation, contributed nearly 300 basis points of absolute and relative performance.
We added a number of new positions to the portfolio during the fiscal year, including Acuity Brands Inc., Apogee Enterprises Inc., Fabrinet, W.R. Grace, Mohawk Industries, Newell Brands Inc., and Tile Shop Holdings Inc. In addition to the portfolio deletions mentioned earlier, we also exited our positions in Dover Corporation, G-III Apparel Group, Pier 1 Imports Inc., and Xerium Technologies.
While we are disappointed in our trailing performance, we believe that we have positioned the portfolio for future success. We also believe that the companies in which we are invested have, for the most part, made progress. They are generating cash, increasing earnings and, in some cases, making strategic acquisitions to accelerate their growth. We remain convinced that this progress will be reflected in higher market values over time.
Sincerely,
| | | | |
| | | | |
J. Dennis Delafield | | Vincent Sellecchia | | Joshua Kaufthal |
Portfolio Manager | | Portfolio Manager | | Portfolio Manager |
| | |
 | | |
Donald Wang | | James Maxwell |
Portfolio Manager | | Portfolio Manager |
The Tocqueville Select Fund
(Unaudited)
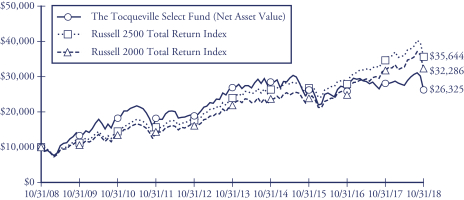
This chart assumes an initial gross investment of $10,000 made on 10/31/08. Since The Tocqueville Select Fund did not commence operations until 9/28/09, returns from the period from September 29, 2008 to September 27, 2009 are those of the Class Y Shares of the Predecessor Fund (See Footnote 1 to the Financial Statements). Prior to that period, returns shown are those of a limited partnership managed by the adviser. Returns shown do not reflect the deduction of taxes that a shareholder would pay on fund distributions or the redemption of fund shares. Performance reflects fee waivers in effect. In the absence of fee waivers, total return would be reduced. Returns shown include the reinvestment of all dividends and other distributions. Past performance is not predictive of future performance. Investment return and principal value will fluctuate so that your shares, when redeemed, may be worth more or less than their original cost.
In 2013 the performance of The Tocqueville Select Fund was achieved during a period of unusually favorable market conditions. Such performance may not be sustainable.
The Russell 2500 Total Return Index is an unmanaged index that measures the performance of the 2,500 smallest companies in the Russell 3000 Index. Returns include the reinvestment of all dividends.
The Russell 2000 Total Return Index is an unmanaged index that measures the performance of the 2,000 smallest companies in the Russell 3000 Index. Returns include the reinvestment of all dividends.
AVERAGE ANNUAL RATE OF RETURN (%)
FOR YEARS ENDED OCTOBER 31, 2018
| | | | | | | | | | | | | | | | |
| | | 1 Year | | | 3 Year | | | 5 Year | | | 10 Year | |
The Tocqueville Select Fund | | | -6.39% | | | | 0.00% | | | | -0.47% | | | | 10.16% | |
Russell 2500 Total Return Index | | | 2.80% | | | | 10.05% | | | | 8.32% | | | | 13.55% | |
Russell 2000 Total Return Index | | | 1.85% | | | | 10.68% | | | | 8.01% | | | | 12.44% | |
Expense Example—October 31, 2018 (Unaudited)
As a shareholder of The Tocqueville Trust (the “Funds”), you incur ongoing costs, including management fees; distribution fees; and other Fund expenses. This example is intended to help you understand your ongoing costs (in dollars) of investing in the Funds and to compare costs with the ongoing costs of investing in other mutual funds.
The Example is based on an investment of $1,000 invested at the beginning of the period and held the entire period (May 1, 2018-October 31, 2018).
Actual Expenses
The first line of the table below provides information about actual account values and actual expenses. You may use the information in this line, together with the amount you invested, to estimate the expenses that you paid over the period. Simply divide your account value by $1,000 (for example, an $8,600 account value divided by $1,000 = 8.6), then multiply the result by the number in the first line under the heading entitled “Expenses Paid During Period” to estimate the expenses you paid on your account during this period.
Hypothetical Example for Comparison Purposes
The second line of the table below provides information about hypothetical account values and hypothetical expenses based on the Funds’ actual expense ratios and an assumed rate of return of 5% per year before expenses, which is not the Funds’ actual return. The hypothetical account values and expenses may not be used to estimate the actual ending account balance or expenses you paid for the period. You may use this information to compare the ongoing costs of investing in the Funds and other funds. To do so, compare this 5% hypothetical example with the 5% hypothetical examples that appear in the shareholder reports of the other funds.
Please note that the expenses shown in the table are meant to highlight your ongoing costs only and do not reflect any transactional costs, such as sales charges (loads), redemption fees, or exchange fees. Therefore, the second line of the table is useful in comparing ongoing costs only, and will not help you determine the relative costs of owning different funds. In addition, if these transactional costs were included, your costs would have been higher.
Expense Example Tables (Unaudited)
The Tocqueville Fund
| | | | | | | | | | | | |
| | | Beginning
Account Value
May 1, 2018 | | | Ending
Account Value
October 31, 2018 | | | Expenses Paid
During Period*
May 1, 2018 -
October 31, 2018 | |
Actual | | $ | 1,000.00 | | | $ | 1,010.10 | | | $ | 6.33 | |
Hypothetical (5% return before expenses) | | | 1,000.00 | | | | 1,018.90 | | | | 6.36 | |
| * | Expenses are equal to the Fund’s annualized six-month expense ratio (including interest expense) of 1.25% for The Tocqueville Fund, multiplied by the average account value over the period, multiplied by 184/365 to reflect the one-half year period. |
The Tocqueville Opportunity Fund
| | | | | | | | | | | | |
| | | Beginning
Account Value
May 1, 2018 | | | Ending
Account Value
October 31, 2018 | | | Expenses Paid
During Period*
May 1, 2018 -
October 31, 2018 | |
Actual | | $ | 1,000.00 | | | $ | 986.60 | | | $ | 6.31 | |
Hypothetical (5% return before expenses) | | | 1,000.00 | | | | 1,018.85 | | | | 6.41 | |
| * | Expenses are equal to the Fund’s annualized six-month expense ratio (including interest expense) of 1.26% for The Tocqueville Opportunity Fund, multiplied by the average account value over the period, multiplied by 184/365 to reflect the one-half year period. |
The Tocqueville International Value Fund
| | | | | | | | | | | | |
| | | Beginning
Account Value
May 1, 2018 | | | Ending
Account Value
October 31, 2018 | | | Expenses Paid
During Period*
May 1, 2018 -
October 31, 2018 | |
Actual | | $ | 1,000.00 | | | $ | 865.50 | | | $ | 5.88 | |
Hypothetical (5% return before expenses) | | | 1,000.00 | | | | 1,018.90 | | | | 6.36 | |
| * | Expenses are equal to the Fund’s annualized six-month expense ratio of 1.25% for The Tocqueville International Value Fund, multiplied by the average account value over the period, multiplied by 184/365 to reflect the one-half year period. |
The Tocqueville Gold Fund
| | | | | | | | | | | | |
| | | Beginning
Account Value
May 1, 2018 | | | Ending
Account Value
October 31, 2018 | | | Expenses Paid
During Period*
May 1, 2018 -
October 31, 2018 | |
Actual | | $ | 1,000.00 | | | $ | 832.40 | | | $ | 6.60 | |
Hypothetical (5% return before expenses) | | | 1,000.00 | | | | 1,018.00 | | | | 7.27 | |
| * | Expenses are equal to the Fund’s annualized six-month expense ratio (including interest expense) of 1.43% for The Tocqueville Gold Fund, multiplied by the average account value over the period, multiplied by 184/365 to reflect the one-half year period. |
The Delafield Fund
| | | | | | | | | | | | |
| | | Beginning
Account Value
May 1, 2018 | | | Ending
Account Value
October 31, 2018 | | | Expenses Paid
During Period*
May 1, 2018 -
October 31, 2018 | |
Actual | | $ | 1,000.00 | | | $ | 930.00 | | | $ | 6.08 | |
Hypothetical (5% return before expenses) | | | 1,000.00 | | | | 1,018.90 | | | | 6.36 | |
| * | Expenses are equal to the Fund’s annualized six-month expense ratio of 1.25% for The Delafield Fund, multiplied by the average account value over the period, multiplied by 184/365 to reflect the one-half year period. |
The Tocqueville Select Fund
| | | | | | | | | | | | |
| | | Beginning
Account Value
May 1, 2018 | | | Ending
Account Value
October 31, 2018 | | | Expenses Paid
During Period*
May 1, 2018 -
October 31, 2018 | |
Actual | | $ | 1,000.00 | | | $ | 956.10 | | | $ | 6.16 | |
Hypothetical (5% return before expenses) | | | 1,000.00 | | | | 1,018.90 | | | | 6.36 | |
| * | Expenses are equal to the Fund’s annualized six-month expense ratio of 1.25% for The Tocqueville Select Fund, multiplied by the average account value over the period, multiplied by 184/365 to reflect the one-half year period. |
The Tocqueville Fund
Financial Highlights
| | | | | | | | | | | | | | | | | | | | |
Per share operating performance
(For a share outstanding throughout the
year) | | Years Ended October 31, | |
| | 2018 | | | 2017 | | | 2016 | | | 2015 | | | 2014 | |
Net asset value, beginning of year | | $ | 38.60 | | | $ | 33.72 | | | $ | 32.91 | | | $ | 34.18 | | | $ | 30.67 | |
| | | | | | | | | | | | | | | | | | | | |
Operations: | | | | | | | | | | | | | | | | | | | | |
Net investment income (1) | | | 0.35 | | | | 0.37 | | | | 0.42 | | | | 0.37 | | | | 0.28 | |
Net realized and unrealized gain (loss) | | | 0.45 | | | | 6.40 | | | | 1.07 | | | | (0.19 | ) | | | 3.78 | |
| | | | | | | | | | | | | | | | | | | | |
Total from investment operations * | | | 0.80 | | | | 6.77 | | | | 1.49 | | | | 0.18 | | | | 4.06 | |
| | | | | | | | | | | | | | | | | | | | |
Distributions to shareholders: | | | | | | | | | | | | | | | | | | | | |
Dividends from net investment income | | | (0.33 | ) | | | (0.39 | ) | | | (0.35 | ) | | | (0.25 | ) | | | (0.30 | ) |
Distributions from net realized gains | | | (3.23 | ) | | | (1.50 | ) | | | (0.33 | ) | | | (1.20 | ) | | | (0.25 | ) |
| | | | | | | | | | | | | | | | | | | | |
Total distributions | | | (3.56 | ) | | | (1.89 | ) | | | (0.68 | ) | | | (1.45 | ) | | | (0.55 | ) |
| | | | | | | | | | | | | | | | | | | | |
Change in net asset value for the year | | | (2.76 | ) | | | 4.88 | | | | 0.81 | | | | (1.27 | ) | | | 3.51 | |
| | | | | | | | | | | | | | | | | | | | |
Net asset value, end of year | | $ | 35.84 | | | $ | 38.60 | | | $ | 33.72 | | | $ | 32.91 | | | $ | 34.18 | |
| | | | | | | | | | | | | | | | | | | | |
* Includes redemption fees per share of | | | N/A | | | | N/A | | | | N/A | | | | 0.00 | (2) | | | 0.00 | (2) |
Total Return | | | 2.0 | % | | | 20.9 | % | | | 4.6 | % | | | 0.5 | % | | | 13.4 | % |
Ratios/supplemental data | | | | | | | | | | | | | | | | | | | | |
Net assets, end of year (000) | | $ | 272,043 | | | $ | 293,637 | | | $ | 283,126 | | | $ | 309,267 | | | $ | 380,561 | |
Ratio to average net assets: | | | | | | | | | | | | | | | | | | | | |
Expenses before waiver/reimbursement | | | 1.26 | % | | | 1.27 | % | | | 1.27 | % | | | 1.29 | % | | | 1.25 | % |
Expenses after waiver/reimbursement | | | 1.25 | % | | | 1.26 | %(3) | | | 1.24 | %(3) | | | 1.25 | % | | | 1.24 | % |
Net investment income before waiver/reimbursement | | | 0.91 | % | | | 0.97 | % | | | 1.18 | % | | | 0.91 | % | | | 0.84 | % |
Net investment income after waiver/reimbursement | | | 0.92 | % | | | 0.98 | % | | | 1.21 | % | | | 0.95 | % | | | 0.85 | % |
Portfolio turnover rate | | | 19 | % | | | 10 | % | | | 12 | % | | | 15 | % | | | 19 | % |
| (1) | Net investment income per share is calculated using the ending balance prior to consideration or adjustment for permanent book-to-tax differences. |
| (2) | Represents less than $0.01. |
| (3) | Includes 0.01% of interest expense. Interest expense is not included in the Fund’s waiver/reimbursement. |
The Accompanying Notes are an Integral Part of these Financial Statements.
The Tocqueville Opportunity Fund
Financial Highlights
| | | | | | | | | | | | | | | | | | | | |
Per share operating performance
(For a share outstanding throughout the
year) | | Years Ended October 31, | |
| | 2018 | | | 2017 | | | 2016 | | | 2015 | | | 2014 | |
Net asset value, beginning of year | | $ | 26.12 | | | $ | 19.14 | | | $ | 21.41 | | | $ | 22.78 | | | $ | 21.29 | |
| | | | | | | | | | | | | | | | | | | | |
Operations: | | | | | | | | | | | | | | | | | | | | |
Net investment loss (1) | | | (0.29 | ) | | | (0.37 | ) | | | (0.29 | ) | | | (0.15 | ) | | | (0.22 | ) |
Net realized and unrealized gain (loss) | | | 1.63 | | | | 7.35 | | | | (1.98 | ) | | | 1.98 | | | | 2.80 | |
| | | | | | | | | | | | | | | | | | | | |
Total from investment operations * | | | 1.34 | | | | 6.98 | | | | (2.27 | ) | | | 1.83 | | | | 2.58 | |
| | | | | | | | | | | | | | | | | | | | |
Distributions to shareholders: | | | | | | | | | | | | | | | | | | | | |
Dividends from net investment income | | | — | | | | — | | | | — | | | | — | | | | — | |
Distributions from net realized gains | | | (0.86 | ) | | | — | | | | — | | | | (3.20 | ) | | | (1.09 | ) |
| | | | | | | | | | | | | | | | | | | | |
Total distributions | | | (0.86 | ) | | | — | | | | — | | | | (3.20 | ) | | | (1.09 | ) |
| | | | | | | | | | | | | | | | | | | | |
Change in net asset value for the year | | | 0.48 | | | | 6.98 | | | | (2.27 | ) | | | (1.37 | ) | | | 1.49 | |
| | | | | | | | | | | | | | | | | | | | |
Net asset value, end of year | | $ | 26.60 | | | $ | 26.12 | | | $ | 19.14 | | | $ | 21.41 | | | $ | 22.78 | |
| | | | | | | | | | | | | | | | | | | | |
* Includes redemption fees per share of | | | N/A | | | | N/A | | | | N/A | | | | 0.00 | (2) | | | 0.00 | (2) |
Total Return | | | 5.3 | % | | | 36.5 | % | | | (10.6 | )% | | | 9.1 | % | | | 12.6 | % |
Ratios/supplemental data | | | | | | | | | | | | | | | | | | | | |
Net assets, end of year (000) | | $ | 82,106 | | | $ | 77,773 | | | $ | 92,958 | | | $ | 153,456 | | | $ | 80,324 | |
Ratio to average net assets: | | | | | | | | | | | | | | | | | | | | |
Expenses before waiver/reimbursement | | | 1.33 | % | | | 1.38 | % | | | 1.38 | % | | | 1.31 | % | | | 1.30 | % |
Expenses after waiver/reimbursement | | | 1.26 | %(3) | | | 1.30 | %(3)(4) | | | 1.38 | % | | | 1.31 | % | | | 1.30 | % |
Net investment loss before waiver/reimbursement | | | (1.13 | )% | | | (1.05 | )% | | | (0.94 | )% | | | (0.95 | )% | | | (0.90 | )% |
Net investment loss after waiver/reimbursement | | | (1.06 | )% | | | (0.97 | )%(4) | | | (0.94 | )% | | | (0.95 | )% | | | (0.90 | )% |
Portfolio turnover rate | | | 151 | % | | | 133 | % | | | 108 | % | | | 101 | % | | | 92 | % |
| (1) | Net investment loss per share is calculated using the ending balance prior to consideration or adjustment for permanent book-to-tax differences. |
| (2) | Represents less than $0.01. |
| (3) | Includes interest expense of 0.01% for the year ended October 31, 2018 and 0.05% for the year ended October 31, 2017. Interest expense is not included in the Fund’s waiver/reimbursement. |
| (4) | Expense waiver of 1.25% was implemented on November 1, 2016. |
The Accompanying Notes are an Integral Part of these Financial Statements.
The Tocqueville International Value Fund
Financial Highlights
| | | | | | | | | | | | | | | | | | | | |
Per share operating performance
(For a share outstanding throughout
the year) | | Years Ended October 31, | |
| | 2018 | | | 2017 | | | 2016 | | | 2015 | | | 2014 | |
Net asset value, beginning of year | | $ | 17.58 | | | $ | 14.44 | | | $ | 14.59 | | | $ | 14.48 | | | $ | 14.71 | |
| | | | | | | | | | | | | | | | | | | | |
Operations: | | | | | | | | | | | | | | | | | | | | |
Net investment income (1) | | | 0.24 | | | | 0.14 | | | | 0.14 | | | | 0.15 | | | | 0.15 | |
Net realized and unrealized gain (loss) | | | (2.53 | ) | | | 3.23 | | | | 0.14 | | | | 0.80 | | | | (0.15 | ) |
| | | | | | | | | | | | | | | | | | | | |
Total from investment operations * | | | (2.29 | ) | | | 3.37 | | | | 0.28 | | | | 0.95 | | | | — | |
| | | | | | | | | | | | | | | | | | | | |
Distributions to shareholders: | | | | | | | | | | | | | | | | | | | | |
Dividends from net investment income | | | (0.17 | ) | | | (0.15 | ) | | | (0.25 | ) | | | (0.32 | ) | | | (0.23 | ) |
Distributions from net realized gains | | | (0.06 | ) | | | (0.08 | ) | | | (0.18 | ) | | | (0.52 | ) | | | — | |
| | | | | | | | | | | | | | | | | | | | |
Total distributions | | | (0.23 | ) | | | (0.23 | ) | | | (0.43 | ) | | | (0.84 | ) | | | (0.23 | ) |
| | | | | | | | | | | | | | | | | | | | |
Change in net asset value for the year | | | (2.52 | ) | | | 3.14 | | | | (0.15 | ) | | | 0.11 | | | | (0.23 | ) |
| | | | | | | | | | | | | | | | | | | | |
Net asset value, end of year | | $ | 15.06 | | | $ | 17.58 | | | $ | 14.44 | | | $ | 14.59 | | | $ | 14.48 | |
| | | | | | | | | | | | | | | | | | | | |
* Includes redemption fees per share of | | | N/A | | | | N/A | | | | N/A | | | | 0.00 | (2) | | | 0.00 | (2) |
Total Return | | | (13.2 | )% | | | 23.7 | % | | | 2.0 | % | | | 7.2 | % | | | (0.0 | )% |
Ratios/supplemental data | | | | | | | | | | | | | | | | | | | | |
Net assets, end of year (000) | | $ | 1,060,000 | | | $ | 1,120,994 | | | $ | 525,808 | | | $ | 333,762 | | | $ | 237,051 | |
Ratio to average net assets: | | | | | | | | | | | | | | | | | | | | |
Expenses before waiver/reimbursement | | | 1.48 | % | | | 1.53 | % | | | 1.58 | % | | | 1.57 | % | | | 1.54 | % |
Expenses after waiver/reimbursement | | | 1.25 | % | | | 1.25 | % | | | 1.25 | % | | | 1.25 | % | | | 1.25 | % |
Net investment income before waiver/reimbursement | | | 1.09 | % | | | 0.73 | % | | | 0.90 | % | | | 0.71 | % | | | 0.62 | % |
Net investment income after waiver/reimbursement | | | 1.32 | % | | | 1.01 | % | | | 1.23 | % | | | 1.03 | % | | | 0.91 | % |
Portfolio turnover rate | | | 25 | % | | | 22 | % | | | 26 | % | | | 42 | % | | | 31 | % |
| (1) | Net investment income per share is calculated using the ending balance prior to consideration or adjustment for permanent book-to-tax differences. |
| (2) | Represents less than $0.01. |
The Accompanying Notes are an Integral Part of these Financial Statements.
The Tocqueville Gold Fund
Financial Highlights
| | | | | | | | | | | | | | | | | | | | |
Per share operating performance
(For a share outstanding throughout
the year) | | Years Ended October 31, | |
| | 2018 | | | 2017 | | | 2016 | | | 2015 | | | 2014 | |
Net asset value, beginning of year | | $ | 35.64 | | | $ | 39.32 | | | $ | 26.04 | | | $ | 30.38 | | | $ | 38.01 | |
| | | | | | | | | | | | | | | | | | | | |
Operations: | | | | | | | | | | | | | | | | | | | | |
Net investment loss (1) | | | (0.38 | ) | | | (0.39 | ) | | | (0.33 | ) | | | (0.27 | ) | | | (0.08 | ) |
Net realized and unrealized gain (loss) | | | (6.25 | ) | | | (3.29 | ) | | | 13.61 | | | | (4.07 | ) | | | (7.55 | ) |
| | | | | | | | | | | | | | | | | | | | |
Total from investment operations * | | | (6.63 | ) | | | (3.68 | ) | | | 13.28 | | | | (4.34 | ) | | | (7.63 | ) |
| | | | | | | | | | | | | | | | | | | | |
Distributions to shareholders: | | | | | | | | | | | | | | | | | | | | |
Dividends from net investment income | | | — | | | | — | | | | — | | | | — | | | | — | |
Distributions from net realized gains | | | — | | | | — | | | | — | | | | — | | | | — | |
| | | | | | | | | | | | | | | | | | | | |
Total distributions | | | — | | | | — | | | | — | | | | — | | | | — | |
| | | | | | | | | | | | | | | | | | | | |
Change in net asset value for the year | | | (6.63 | ) | | | (3.68 | ) | | | 13.28 | | | | (4.34 | ) | | | (7.63 | ) |
| | | | | | | | | | | | | | | | | | | | |
Net asset value, end of year | | $ | 29.01 | | | $ | 35.64 | | | $ | 39.32 | | | $ | 26.04 | | | $ | 30.38 | |
| | | | | | | | | | | | | | | | | | | | |
* Includes redemption fees per share of | | | 0.00 | (2) | | | 0.01 | | | | 0.01 | | | | 0.01 | | | | 0.02 | |
Total Return | | | (18.6 | )% | | | (9.4 | )% | | | 51.0 | % | | | (14.3 | )% | | | (20.1 | )% |
Ratios/supplemental data | | | | | | | | | | | | | | | | | | | | |
Net assets, end of year (000) | | $ | 859,394 | | | $ | 1,153,287 | | | $ | 1,365,282 | | | $ | 947,367 | | | $ | 1,138,557 | |
Ratio to average net assets: | | | | | | | | | | | | | | | | | | | | |
Expense | | | 1.42 | % | | | 1.38 | % | | | 1.39 | % | | | 1.43 | % | | | 1.36 | % |
Net investment loss | | | (0.88 | )% | | | (0.95 | )% | | | (0.91 | )% | | | (0.84 | )% | | | (0.78 | )% |
Portfolio turnover rate | | | 9 | % | | | 14 | % | | | 15 | % | | | 11 | % | | | 10 | % |
| (1) | Net investment loss per share is calculated using the ending balance prior to consideration or adjustment for permanent book-to-tax differences. |
| (2) | Represents less than $0.01. |
The Accompanying Notes are an Integral Part of these Financial Statements.
The Delafield Fund
Financial Highlights
| | | | | | | | | | | | | | | | | | | | |
Per share operating performance
(For a share outstanding
throughout the year) | | Years Ended October 31, | |
| | 2018 | | | 2017 | | | 2016 | | | 2015 | | | 2014 | |
Net asset value, beginning of year | | $ | 26.40 | | | $ | 26.47 | | | $ | 28.64 | | | $ | 36.40 | | | $ | 37.13 | |
| | | | | | | | | | | | | | | | | | | | |
Operations: | | | | | | | | | | | | | | | | | | | | |
Net investment loss (1) | | | (0.14 | ) | | | (0.15 | ) | | | (0.15 | ) | | | (0.14 | ) | | | (0.10 | ) |
Net realized and unrealized gain (loss) | | | (2.27 | ) | | | 4.91 | | | | 0.78 | | | | (3.99 | ) | | | 0.70 | |
| | | | | | | | | | | | | | | | | | | | |
Total from investment operations * | | | (2.41 | ) | | | 4.76 | | | | 0.63 | | | | (4.13 | ) | | | 0.60 | |
| | | | | | | | | | | | | | | | | | | | |
Distributions to shareholders: | | | | | | | | | | | | | | | | | | | | |
Dividends from net investment income | | | — | | | | — | | | | — | | | | — | | | | — | |
Distributions from net realized gains | | | (3.79 | ) | | | (4.83 | ) | | | (2.80 | ) | | | (3.63 | ) | | | (1.33 | ) |
| | | | | | | | | | | | | | | | | | | | |
Total distributions | | | (3.79 | ) | | | (4.83 | ) | | | (2.80 | ) | | | (3.63 | ) | | | (1.33 | ) |
| | | | | | | | | | | | | | | | | | | | |
Change in net asset value for the year | | | (6.20 | ) | | | (0.07 | ) | | | (2.17 | ) | | | (7.76 | ) | | | (0.73 | ) |
| | | | | | | | | | | | | | | | | | | | |
Net asset value, end of year | | $ | 20.20 | | | $ | 26.40 | | | $ | 26.47 | | | $ | 28.64 | | | $ | 36.40 | |
| | | | | | | | | | | | | | | | | | | | |
* Includes redemption fees per share of | | | N/A | | | | N/A | | | | N/A | | | | 0.00 | (2) | | | 0.00 | (2) |
Total Return | | | (10.6 | )% | | | 19.0 | % | | | 3.3 | % | | | (12.3 | )% | | | 1.6 | % |
Ratios/supplemental data | | | | | | | | | | | | | | | | | | | | |
Net assets, end of year (000) | | $ | 237,119 | | | $ | 373,353 | | | $ | 400,827 | | | $ | 674,525 | | | $ | 1,475,139 | |
Ratio to average net assets: | | | | | | | | | | | | | | | | | | | | |
Expenses before waiver/reimbursement | | | 1.32 | % | | | 1.31 | % | | | 1.29 | % | | | 1.25 | % | | | 1.21 | % |
Expenses after waiver/reimbursement | | | 1.25 | % | | | 1.25 | %(3) | | | 1.29 | % | | | 1.25 | % | | | 1.21 | % |
Net investment loss before waiver/reimbursement | | | (0.55 | )% | | | (0.55 | )% | | | (0.33 | )% | | | (0.15 | )% | | | (0.24 | )% |
Net investment loss after waiver/reimbursement | | | (0.48 | )% | | | (0.49 | )%(3) | | | (0.33 | )% | | | (0.15 | )% | | | (0.24 | )% |
Portfolio turnover rate | | | 40 | % | | | 36 | % | | | 39 | % | | | 19 | % | | | 34 | % |
| (1) | Net investment loss per share is calculated using the ending balance prior to consideration or adjustment for permanent book-to-tax differences. |
| (2) | Represents less than $0.01. |
| (3) | Expense waiver of 1.25% was implemented on November 1, 2016. |
The Accompanying Notes are an Integral Part of these Financial Statements.
The Tocqueville Select Fund
Financial Highlights
| | | | | | | | | | | | | | | | | | | | |
Per share operating performance
(For a share outstanding throughout the
year) | | Years Ended October 31, | |
| | 2018 | | | 2017 | | | 2016 | | | 2015 | | | 2014 | |
Net asset value, beginning of year | | $ | 11.87 | | | $ | 11.43 | | | $ | 12.08 | | | $ | 14.90 | | | $ | 15.57 | |
| | | | | | | | | | | | | | | | | | | | |
Operations: | | | | | | | | | | | | | | | | | | | | |
Net investment loss (1) | | | (0.05 | ) | | | (0.06 | ) | | | (0.07 | ) | | | (0.08 | ) | | | (0.07 | ) |
Net realized and unrealized gain (loss) | | | (0.70 | ) | | | 1.12 | | | | (0.18 | ) | | | (1.00 | ) | | | 0.94 | |
| | | | | | | | | | | | | | | | | | | | |
Total from investment operations * | | | (0.75 | ) | | | 1.06 | | | | (0.25 | ) | | | (1.08 | ) | | | 0.87 | |
| | | | | | | | | | | | | | | | | | | | |
Distributions to shareholders: | | | | | | | | | | | | | | | | | | | | |
Dividends from net investment income | | | — | | | | — | | | | — | | | | — | | | | — | |
Distributions from net realized gains | | | (0.22 | ) | | | (0.62 | ) | | | (0.40 | ) | | | (1.74 | ) | | | (1.54 | ) |
| | | | | | | | | | | | | | | | | | | | |
Total distributions | | | (0.22 | ) | | | (0.62 | ) | | | (0.40 | ) | | | (1.74 | ) | | | (1.54 | ) |
| | | | | | | | | | | | | | | | | | | | |
Change in net asset value for the year | | | (0.97 | ) | | | 0.44 | | | | (0.65 | ) | | | (2.82 | ) | | | (0.67 | ) |
| | | | | | | | | | | | | | | | | | | | |
Net asset value, end of year | | $ | 10.90 | | | $ | 11.87 | | | $ | 11.43 | | | $ | 12.08 | | | $ | 14.90 | |
| | | | | | | | | | | | | | | | | | | | |
* Includes redemption fees per share of | | | N/A | | | | N/A | | | | N/A | | | | 0.00 | (2) | | | 0.00 | (2) |
Total Return | | | (6.4 | )% | | | 8.9 | % | | | (1.9 | )% | | | (8.0 | )% | | | 6.1 | % |
Ratios/supplemental data | | | | | | | | | | | | | | | | | | | | |
Net assets, end of year (000) | | $ | 39,225 | | | $ | 49,453 | | | $ | 63,812 | | | $ | 81,813 | | | $ | 108,060 | |
Ratio to average net assets: | | | | | | | | | | | | | | | | | | | | |
Expenses before waiver/reimbursement | | | 1.37 | % | | | 1.37 | % | | | 1.37 | % | | | 1.36 | % | | | 1.32 | % |
Expenses after waiver/reimbursement | | | 1.25 | % | | | 1.25 | %(3) | | | 1.37 | % | | | 1.36 | % | | | 1.32 | % |
Net investment loss before waiver/reimbursement | | | (0.50 | )% | | | (0.47 | )% | | | (0.45 | )% | | | (0.52 | )% | | | (0.50 | )% |
Net investment loss after waiver/reimbursement | | | (0.38 | )% | | | (0.35 | )%(3) | | | (0.45 | )% | | | (0.52 | )% | | | (0.50 | )% |
Portfolio turnover rate | | | 27 | % | | | 24 | % | | | 32 | % | | | 43 | % | | | 32 | % |
| (1) | Net investment loss per share is calculated using the ending balance prior to consideration or adjustment for permanent book-to-tax differences. |
| (2) | Represents less than $0.01. |
| (3) | Expense waiver of 1.25% was implemented on November 1, 2016. |
The Accompanying Notes are an Integral Part of these Financial Statements.
The Tocqueville Fund
Schedule of Investments as of October 31, 2018
| | | | | | | | |
| Common Stocks—94.2% | | Shares | | | Value | |
Automobiles & Components—1.2% | | | | | |
Ford Motor Co. | | | 350,000 | | | $ | 3,342,500 | |
Banks—1.4% | | | | | | | | |
Bank of America Corp. | | | 100,000 | | | | 2,750,000 | |
JPMorgan Chase & Co. | | | 9,000 | | | | 981,180 | |
| | | | | | | | 3,731,180 | |
Capital Goods—8.0% | | | | | | | | |
Arconic, Inc. | | | 175,000 | | | | 3,557,750 | |
Caterpillar, Inc. | | | 25,000 | | | | 3,033,000 | |
Fluor Corp. | | | 25,000 | | | | 1,096,500 | |
Illinois Tool Works, Inc. | | | 40,000 | | | | 5,102,800 | |
Parker-Hannifin Corp. | | | 13,000 | | | | 1,971,190 | |
The Boeing Co. | | | 20,000 | | | | 7,097,200 | |
| | | | | | | | 21,858,440 | |
Commercial & Professional Services—1.2% | |
Steelcase, Inc.—Class A | | | 200,000 | | | | 3,320,000 | |
Consumer Services—2.3% | | | | | | | | |
McDonald’s Corp. | | | 35,000 | | | | 6,191,500 | |
Diversified Financials—2.2% | | | | | |
The Bank of New York Mellon Corp. | | | 125,000 | | | | 5,916,250 | |
Energy—6.2% | | | | | | | | |
Exxon Mobil Corp. | | | 100,000 | | | | 7,968,000 | |
Halliburton Co. | | | 130,000 | | | | 4,508,400 | |
Pioneer Natural Resources Co. | | | 29,000 | | | | 4,270,830 | |
| | | | | | | | 16,747,230 | |
Food & Staples Retailing—3.3% | | | | | |
Walmart, Inc. | | | 90,000 | | | | 9,025,200 | |
Food, Beverage & Tobacco—4.0% | |
Campbell Soup Co. | | | 100,000 | | | | 3,741,000 | |
The Coca-Cola Co. | | | 150,000 | | | | 7,182,000 | |
| | | | | | | | 10,923,000 | |
Health Care Equipment & Services—1.3% | |
Abbott Laboratories | | | 50,000 | | | | 3,447,000 | |
Household & Personal Products—5.4% | |
Colgate-Palmolive Co. | | | 100,000 | | | | 5,955,000 | |
The Procter & Gamble Co. | | | 100,000 | | | | 8,868,000 | |
| | | | | | | | 14,823,000 | |
Insurance—2.7% | | | | | | | | |
Aflac, Inc. | | | 100,000 | | | | 4,307,000 | |
Brighthouse Financial, Inc.(a) | | | 25,000 | | | | 990,750 | |
MetLife, Inc. | | | 50,000 | | | | 2,059,500 | |
| | | | | | | | 7,357,250 | |
Materials—6.6% | | | | | | | | |
BHP Billiton Ltd.—ADR(b) | | | 50,000 | | | | 2,309,000 | |
DowDuPont, Inc. | | | 100,000 | | | | 5,392,000 | |
Goldcorp, Inc.(b) | | | 100,000 | | | | 902,000 | |
Nutrien Ltd.(b) | | | 40,000 | | | | 2,117,200 | |
Sonoco Products Co. | | | 75,000 | | | | 4,093,500 | |
Vulcan Materials Co. | | | 30,000 | | | | 3,034,200 | |
| | | | | | | | 17,847,900 | |
Media—1.7% | | | | | | | | |
The Walt Disney Co. | | | 40,000 | | | | 4,593,200 | |
Media & Entertainment—2.8% | |
Alphabet, Inc.—Class A(a) | | | 7,000 | | | | 7,634,060 | |
Pharmaceuticals, Biotechnology & Life Sciences—12.7% | |
Biogen, Inc.(a) | | | 10,000 | | | | 3,042,700 | |
Ionis Pharmaceuticals, Inc.(a) | | | 75,000 | | | | 3,716,250 | |
Johnson & Johnson | | | 70,000 | | | | 9,799,300 | |
Merck & Co., Inc. | | | 125,000 | | | | 9,201,250 | |
Nektar Therapeutics(a) | | | 5,000 | | | | 193,400 | |
Pfizer, Inc. | | | 200,000 | | | | 8,612,000 | |
| | | | | | | | 34,564,900 | |
Retailing—2.9% | |
Amazon.com, Inc.(a) | | | 5,000 | | | | 7,990,050 | |
Semiconductors & Semiconductor Equipment—5.5% | |
Applied Materials, Inc. | | | 150,000 | | | | 4,932,000 | |
Intel Corp. | | | 150,000 | | | | 7,032,000 | |
QUALCOMM, Inc. | | | 50,000 | | | | 3,144,500 | |
| | | | | | | | 15,108,500 | |
Software & Services—9.6% | |
Automatic Data Processing, Inc. | | | 75,000 | | | | 10,806,000 | |
Facebook, Inc.—Class A(a) | | | 30,000 | | | | 4,553,700 | |
Microsoft Corp. | | | 100,000 | | | | 10,681,000 | |
| | | | | | | | 26,040,700 | |
The Accompanying Footnotes are an Integral Part of these Financial Statements.
The Tocqueville Fund
Schedule of Investments as of October 31, 2018
| | | | | | | | |
| Common Stocks—94.2% | | Shares | | | Value | |
Technology Hardware & Equipment—3.8% | |
Apple, Inc. | | | 47,500 | | | $ | 10,395,850 | |
Bio-key International, Inc.(a)(c)(d)
(Originally acquired 09/16/05, Cost $0) | | | 1,963 | | | | — | |
| | | | | | | | 10,395,850 | |
Telecommunication Services—2.1% | |
Verizon Communications, Inc. | | | 100,000 | | | | 5,709,000 | |
Transportation—2.6% | | | | | |
Delta Air Lines, Inc. | | | 100,000 | | | | 5,473,000 | |
Kansas City Southern | | | 15,000 | | | | 1,529,400 | |
| | | | | | | | 7,002,400 | |
Utilities—4.7% | | | | | | | | |
NextEra Energy, Inc. | | | 74,000 | | | | 12,765,000 | |
Total Common Stocks
(Cost $131,132,132) | | | | | | | 256,334,110 | |
Preferred Stock—0.0% | | | | | | | | |
Health Care Equipment & Supplies—0.0% | |
Velico Medical, Inc.(c)(d) (Originally acquired 10/13/16, Cost $0) | | | 400,000 | | | | 1,600 | |
Total Preferred Stock
(Cost $—) | | | | | | | 1,600 | |
Real Estate Investment Trust (REIT)—2.0% | |
Real Estate—2.0% | | | | | |
Weyerhaeuser Co. | | | 200,000 | | | | 5,326,000 | |
Total Real Estate Investment Trust
(Cost $3,645,642) | | | | 5,326,000 | |
Exchange-Traded Fund (ETF) —1.1% | |
Metals and Mining—1.1% | |
SPDR S&P Metals & Mining ETF | | | 100,000 | | | | 3,057,000 | |
Total Exchange-Traded Fund
(Cost $1,495,845) | | | | 3,057,000 | |
Short-Term
Investment—2.2% | | Shares | | | Value | |
Money Market Fund—2.2% | |
STIT-Treasury Portfolio—Institutional Class, 2.092%(e) | | | 5,973,564 | | | | 5,973,564 | |
Total Short-Term Investment
(Cost $5,973,564) | | | | 5,973,564 | |
Total Investments
(Cost $142,247,183)—99.5% | | | | 270,692,274 | |
Other Assets in Excess of Liabilities—0.5% | | | | 1,351,200 | |
Total Net Assets—100.0% | | | $ | 272,043,474 | |
| | | | | | | | |
Percentages are stated as a percent of net assets.
ADR American Depository Receipt
| (a) | Non-income producing security. |
| (b) | Foreign issued Security. Foreign Concentration (including ADR’s) was as follows: Australia 0.8%; Canada 1.1%. |
| (c) | Denotes a security that is either fully or partially restricted to resale. The aggregate value of restricted securities as of October 31, 2018 was $1,600 which represented 0.0% of net assets. |
| (d) | Security is fair valued using procedures approved by the Board of Trustees which includes significant unobservable inputs and is deemed a Level 3 security. See Footnote 2. The aggregate value of fair value securities as of October 31, 2018 was $1,600 which represented 0.0% of net assets. |
| (e) | Rate listed is the 7-day effective yield. |
The Global Industry Classification Standard (GICS®) was developed by and/or is the exclusive property of MSCI, Inc. and Standard & Poor Financial Services LLC (“S&P”). GICS is a service mark of MSCI and S&P and has been licensed for use by U.S. Bancorp Fund Services, LLC.
The Accompanying Footnotes are an Integral Part of these Financial Statements.
The Tocqueville Opportunity Fund
Schedule of Investments as of October 31, 2018
| | | | | | | | |
| Common Stocks—99.4% | | Shares | | | Value | |
Automobiles & Components—0.0% | |
Delphi Technologies PLC(a) | | | 1 | | | $ | 21 | |
Capital Goods—2.5% | | | | | | | | |
HEICO Corp. | | | 2,343 | | | | 196,414 | |
Hexcel Corp. | | | 600 | | | | 35,112 | |
Hubbell, Inc. | | | 500 | | | | 50,850 | |
IDEX Corp. | | | 3,000 | | | | 380,460 | |
Nordson Corp. | | | 1,500 | | | | 184,005 | |
PGT Innovations, Inc.(b) | | | 5,000 | | | | 101,300 | |
RBC Bearings, Inc.(b) | | | 500 | | | | 73,840 | |
Rockwell Automation, Inc. | | | 500 | | | | 82,365 | |
SiteOne Landscape Supply, Inc.(b) | | | 3,000 | | | | 204,120 | |
Spirit AeroSystems Holdings, Inc.—Class A | | | 500 | | | | 42,005 | |
Trex Co., Inc.(b) | | | 3,000 | | | | 183,900 | |
United Rentals, Inc.(b) | | | 500 | | | | 60,035 | |
WABCO Holdings, Inc.(b) | | | 500 | | | | 53,725 | |
Watsco, Inc. | | | 2,000 | | | | 296,360 | |
Woodward, Inc. | | | 1,000 | | | | 73,640 | |
| | | | | | | | 2,018,131 | |
Commercial & Professional Services—1.0% | |
Copart, Inc.(b) | | | 2,000 | | | | 97,820 | |
Robert Half International, Inc. | | | 3,000 | | | | 181,590 | |
TransUnion | | | 8,500 | | | | 558,875 | |
| | | | | | | | 838,285 | |
Consumer Durables & Apparel—2.4% | |
Cavco Industries, Inc.(b) | | | 500 | | | | 100,305 | |
Leggett & Platt, Inc. | | | 3,000 | | | | 108,930 | |
Lululemon Athletica, Inc.(b) | | | 10,500 | | | | 1,477,665 | |
Roku, Inc.(b) | | | 5,000 | | | | 278,000 | |
| | | | | | | | 1,964,900 | |
Consumer Services—1.6% | | | | | | | | |
Domino’s Pizza, Inc. | | | 1,400 | | | | 376,306 | |
Planet Fitness, Inc.—Class A(b) | | | 4,000 | | | | 196,360 | |
Restaurant Brands International LP(a) | | | 37 | | | | 2,015 | |
Vail Resorts, Inc. | | | 3,000 | | | | 753,960 | |
| | | | | | | | 1,328,641 | |
Diversified Financials—0.8% | |
FactSet Research Systems, Inc. | | | 400 | | | | 89,504 | |
MarketAxess Holdings, Inc. | | | 150 | | | | 31,451 | |
MSCI, Inc. | | | 1,500 | | | | 225,570 | |
S&P Global, Inc. | | | 1,500 | | | | 273,480 | |
SEI Investments Co. | | | 500 | | | | 26,725 | |
| | | | | | | | 646,730 | |
Health Care Equipment & Services—9.1% | |
ABIOMED, Inc.(b) | | | 1,300 | | | | 443,560 | |
Align Technology, Inc.(b) | | | 750 | | | | 165,900 | |
Boston Scientific Corp.(b) | | | 18,000 | | | | 650,520 | |
DexCom, Inc.(b) | | | 9,500 | | | | 1,261,315 | |
Glaukos Corp.(b) | | | 500 | | | | 28,970 | |
IDEXX Laboratories, Inc.(b) | | | 3,500 | | | | 742,420 | |
Inogen, Inc.(b) | | | 1,200 | | | | 227,484 | |
Insulet Corp.(b) | | | 4,000 | | | | 352,840 | |
Intuitive Surgical, Inc.(b) | | | 3,500 | | | | 1,824,130 | |
iRhythm Technologies, Inc.(b) | | | 5,000 | | | | 386,300 | |
Medidata Solutions, Inc.(b) | | | 3,500 | | | | 246,050 | |
STAAR Surgical Co.(b) | | | 14,000 | | | | 561,540 | |
Veeva Systems, Inc.—Class A(b) | | | 6,000 | | | | 548,100 | |
| | | | | | | | 7,439,129 | |
Materials—0.1% | | | | | | | | |
Berry Global Group, Inc.(b) | | | 1,500 | | | | 65,430 | |
Worthington Industries, Inc. | | | 500 | | | | 20,940 | |
| | | | | | | | 86,370 | |
Media—0.5% | | | | | | | | |
Live Nation Entertainment, Inc.(b) | | | 8,000 | | | | 418,400 | |
Media & Entertainment—4.3% | |
Alphabet, Inc.—Class C(b) | | | 1,900 | | | | 2,045,863 | |
Match Group, Inc.(b) | | | 13,000 | | | | 672,360 | |
Spotify Technology SA(a)(b) | | | 5,500 | | | | 823,295 | |
| | | | | | | | 3,541,518 | |
Pharmaceuticals, Biotechnology & Life Sciences—24.7% | |
ACADIA Pharmaceuticals, Inc.(b) | | | 22,000 | | | | 428,560 | |
Aerie Pharmaceuticals, Inc.(b) | | | 13,000 | | | | 691,340 | |
Alnylam Pharmaceuticals, Inc.(b) | | | 1,000 | | | | 80,430 | |
Amarin Corp PLC—ADR(a)(b) | | | 9,500 | | | | 197,885 | |
Atara Biotherapeutics, Inc.(b) | | | 8,500 | | | | 290,445 | |
The Accompanying Footnotes are an Integral Part of these Financial Statements.
The Tocqueville Opportunity Fund
Schedule of Investments as of October 31, 2018
| | | | | | | | |
| Common Stocks—99.4% | | Shares | | | Value | |
Audentes Therapeutics, Inc.(b) | | | 7,500 | | | $ | 211,500 | |
BioMarin Pharmaceutical, Inc.(b) | | | 2,500 | | | | 230,425 | |
Bluebird Bio, Inc.(b) | | | 16,500 | | | | 1,892,550 | |
Cellectis SA—ADR(a)(b) | | | 2,500 | | | | 63,475 | |
CRISPR Therapeutics AG(a)(b) | | | 500 | | | | 16,385 | |
Editas Medicine, Inc.(b) | | | 14,000 | | | | 354,620 | |
Forward Pharma A/S—ADR(a)(b) | | | 1,000 | | | | 1,230 | |
Genfit(a)(b) | | | 500 | | | | 11,677 | |
Genmab A/S(a)(b) | | | 6,500 | | | | 890,495 | |
Global Blood Therapeutics, Inc.(b) | | | 1,500 | | | | 52,635 | |
GW Pharmaceuticals PLC—ADR(a)(b) | | | 7,000 | | | | 962,430 | |
Immunomedics, Inc.(b) | | | 36,500 | | | | 822,345 | |
Intellia Therapeutics, Inc.(b) | | | 10,500 | | | | 178,290 | |
Intercept Pharmaceuticals, Inc.(b) | | | 5,000 | | | | 480,050 | |
Intra-Cellular Therapies, Inc.(b) | | | 10,000 | | | | 169,800 | |
Iovance Biotherapeutics, Inc.(b) | | | 18,000 | | | | 163,440 | |
Loxo Oncology, Inc.(b) | | | 5,500 | | | | 839,630 | |
Madrigal Pharmaceuticals, Inc.(b) | | | 1,500 | | | | 286,290 | |
Mettler-Toledo International, Inc.(b) | | | 500 | | | | 273,410 | |
Neurocrine Biosciences, Inc.(b) | | | 8,000 | | | | 857,200 | |
Pacira Pharmaceuticals, Inc.(b) | | | 10,000 | | | | 488,900 | |
REGENXBIO, Inc.(b) | | | 10,000 | | | | 666,700 | |
Sage Therapeutics, Inc.(b) | | | 22,500 | | | | 2,895,300 | |
Sarepta Therapeutics, Inc.(b) | | | 28,500 | | | | 3,812,160 | |
Seattle Genetics, Inc.(b) | | | 2,500 | | | | 140,325 | |
Spark Therapeutics, Inc.(b) | | | 9,000 | | | | 404,910 | |
Vertex Pharmaceuticals, Inc.(b) | | | 1,500 | | | | 254,190 | |
Viking Therapeutics, Inc.(b) | | | 20,000 | | | | 272,000 | |
Voyager Therapeutics, Inc.(b) | | | 35,000 | | | | 474,950 | |
Xencor, Inc.(b) | | | 2,500 | | | | 81,800 | |
Zogenix, Inc.(b) | | | 8,500 | | | | 354,960 | |
| | | | | | | | 20,292,732 | |
Retailing—4.5% | | | | | | | | |
Amazon.com, Inc.(b) | | | 1,900 | | | | 3,036,219 | |
RH(b) | | | 1,200 | | | | 138,852 | |
Ulta Beauty, Inc.(b) | | | 600 | | | | 164,712 | |
Wayfair, Inc.—Class A(b) | | | 3,000 | | | | 330,870 | |
| | | | | | | | 3,670,653 | |
Semiconductors & Semiconductor Equipment—5.2% | |
Advanced Micro Devices, Inc.(b) | | | 2,500 | | | | 45,525 | |
ams AG(a) | | | 1,500 | | | | 58,353 | |
NVIDIA Corp. | | | 19,300 | | | | 4,069,019 | |
Silicon Laboratories, Inc.(b) | | | 800 | | | | 65,224 | |
| | | | | | | | 4,238,121 | |
Software & Services—41.2% | | | | | | | | |
Activision Blizzard, Inc. | | | 500 | | | | 34,525 | |
Adobe, Inc.(b) | | | 5,500 | | | | 1,351,680 | |
ANSYS, Inc.(b) | | | 1,500 | | | | 224,325 | |
Appian Corp.(b) | | | 2,000 | | | | 51,420 | |
Apptio, Inc.—Class A(b) | | | 3,000 | | | | 77,700 | |
Aspen Technology, Inc.(b) | | | 3,000 | | | | 254,670 | |
Atlassian Corp. PLC—Class A(a)(b) | | | 3,500 | | | | 265,685 | |
Broadridge Financial Solutions, Inc. | | | 5,000 | | | | 584,700 | |
Cadence Design Systems, Inc.(b) | | | 5,000 | | | | 222,850 | |
Cloudera, Inc.(b) | | | 1,500 | | | | 20,640 | |
CoStar Group, Inc.(b) | | | 500 | | | | 180,710 | |
Coupa Software, Inc.(b) | | | 17,000 | | | | 1,102,110 | |
DocuSign, Inc.(b) | | | 2,000 | | | | 83,880 | |
Dropbox, Inc.—Class A(b) | | | 1,500 | | | | 35,205 | |
EPAM Systems, Inc.(b) | | | 2,000 | | | | 238,940 | |
Euronet Worldwide, Inc.(b) | | | 3,500 | | | | 389,130 | |
Fair Isaac Corp.(b) | | | 2,500 | | | | 481,775 | |
Fidelity National Information Services, Inc. | | | 500 | | | | 52,050 | |
Fiserv, Inc.(b) | | | 3,000 | | | | 237,900 | |
Fortinet, Inc.(b) | | | 4,500 | | | | 369,810 | |
Gartner, Inc.(b) | | | 1,000 | | | | 147,520 | |
Global Payments, Inc. | | | 3,500 | | | | 399,805 | |
GoDaddy, Inc.—Class A(b) | | | 6,000 | | | | 439,020 | |
GrubHub, Inc.(b) | | | 1,500 | | | | 139,110 | |
Guidewire Software, Inc.(b) | | | 4,000 | | | | 355,880 | |
MongoDB, Inc.(b) | | | 2,500 | | | | 203,750 | |
New Relic, Inc.(b) | | | 31,000 | | | | 2,766,750 | |
Nutanix, Inc.—Class A(b) | | | 9,000 | | | | 373,590 | |
Okta, Inc.(b) | | | 20,000 | | | | 1,167,200 | |
Paycom Software, Inc.(b) | | | 10,500 | | | | 1,314,600 | |
Paylocity Holding Corp.(b) | | | 17,500 | | | | 1,151,325 | |
PayPal Holdings, Inc.(b) | | | 14,000 | | | | 1,178,660 | |
Pegasystems, Inc. | | | 500 | | | | 26,760 | |
Proofpoint, Inc.(b) | | | 4,500 | | | | 409,275 | |
The Accompanying Footnotes are an Integral Part of these Financial Statements.
The Tocqueville Opportunity Fund
Schedule of Investments as of October 31, 2018
| | | | | | | | |
| Common Stocks—99.4% | | Shares | | | Value | |
PTC, Inc.(b) | | | 3,000 | | | $ | 247,230 | |
RealPage, Inc.(b) | | | 500 | | | | 26,500 | |
Salesforce.com, Inc.(b) | | | 3,000 | | | | 411,720 | |
ServiceNow, Inc.(b) | | | 22,000 | | | | 3,982,880 | |
Shopify, Inc.—Class A(a)(b) | | | 16,500 | | | | 2,279,475 | |
Splunk, Inc.(b) | | | 9,000 | | | | 898,560 | |
Square, Inc.—Class A(b) | | | 13,500 | | | | 991,575 | |
SS&C Technologies Holdings, Inc. | | | 2,000 | | | | 102,320 | |
Tableau Software, Inc.—Class A(b) | | | 3,000 | | | | 320,040 | |
Talend SA—ADR(a)(b) | | | 1,000 | | | | 61,950 | |
The Ultimate Software Group, Inc.(b) | | | 1,550 | | | | 413,276 | |
Total System Services, Inc. | | | 9,500 | | | | 865,925 | |
The Trade Desk, Inc.—Class A(b) | | | 2,000 | | | | 247,100 | |
Twilio, Inc.—Class A(b) | | | 10,000 | | | | 752,200 | |
Tyler Technologies, Inc.(b) | | | 1,500 | | | | 317,490 | |
Upland Software, Inc.(b) | | | 3,000 | | | | 94,620 | |
WEX, Inc.(b) | | | 1,500 | | | | 263,940 | |
Wirecard AG(a) | | | 3,000 | | | | 562,018 | |
Workday, Inc.—Class A(b) | | | 19,500 | | | | 2,593,890 | |
Worldpay, Inc.—Class A(b) | | | 8,000 | | | | 734,720 | |
Zendesk, Inc.(b) | | | 16,000 | | | | 879,520 | |
Zscaler, Inc.(b) | | | 13,000 | | | | 471,770 | |
| | | | | | | | 33,851,669 | |
Technology Hardware & Equipment—1.3% | |
II-VI, Inc.(b) | | | 1,000 | | | | 37,230 | |
Lumentum Holdings, Inc.(b) | | | 4,000 | | | | 218,600 | |
Palo Alto Networks, Inc.(b) | | | 3,500 | | | | 640,640 | |
Universal Display Corp. | | | 1,000 | | | | 123,010 | |
Viavi Solutions, Inc.(b) | | | 5,000 | | | | 57,650 | |
| | | | | | | | 1,077,130 | |
Transportation—0.2% | |
Knight-Swift Transportation Holdings, Inc. | | | 500 | | | | 16,000 | |
Union Pacific Corp. | | | 1,000 | | | | 146,220 | |
| | | | | | | | 162,220 | |
Total Common Stocks
(Cost $60,664,662) | | | | | | | 81,574,650 | |
Real Estate
Investment
Trust—0.0% | | Shares | | | | | | Value | |
Real Estate—0.0% | | | | | | | | | | | | |
Equinix, Inc. | | | 1 | | | | | | | | 379 | |
Total Real Estate Investment Trust
(Cost $297) | | | | | | | | | | | 379 | |
Purchased Call
Options—0.3% | | Contracts | | | Notional
Amount | | | | |
Energy—0.0% | | | | | | | | | | | | |
Schlumberger Ltd.
Expiration: January 2019,
Exercise Price $65.00(b) | | | 400 | | | | 2,600,000 | | | | 5,200 | |
Pharmaceuticals, Biotechnology & Life Sciences—0.1% | |
Alnylam Pharmaceuticals, Inc.
Expiration: December 2018,
Exercise Price $100.00(b) | | | 150 | | | | 1,500,000 | | | | 23,250 | |
Sage Therapeutics, Inc.
Expiration: November 2018,
Exercise Price $160.00(b) | | | 125 | | | | 2,000,000 | | | | 18,750 | |
| | | | | | | | | | | | 42,000 | |
Software & Services—0.0% | |
Alphabet, Inc.
Expiration: November 2018,
Exercise Price $1250.00(b) | | | 70 | | | | 8,750,000 | | | | 2,450 | |
Microsoft Corp.
Expiration: November 2018,
Exercise Price $110.00(b) | | | 200 | | | | 2,200,000 | | | | 27,000 | |
| | | | | | | | | | | | 29,450 | |
The Accompanying Footnotes are an Integral Part of these Financial Statements.
The Tocqueville Opportunity Fund
Schedule of Investments as of October 31, 2018
| | | | | | | | | | | | |
Purchased Call
Options—0.3% | | Contracts | | | Notional
Amount | | | Value | |
Technology Hardware & Equipment—0.2% | |
Apple, Inc.
Expiration: November 2018,
Exercise Price $215.00(b) | | | 125 | | | | 2,687,500 | | | $ | 125,625 | |
Apple, Inc.
Expiration: November 2018,
Exercise Price $220.00(b) | | | 100 | | | | 2,200,000 | | | | 49,700 | |
| | | | | | | | | | | | 175,325 | |
Total Purchased Options
(Cost $814,774) | | | | | | | | | | | 251,975 | |
Short-Term
Investment—0.1% | | Shares | | | | | | | |
Money Market Fund—0.1% | | | | | | | | | | | | |
STIT-Treasury Portfolio—Instiutional Class, 2.092%(c) | | | 99,380 | | | | | | | | 99,380 | |
Total Short-Term Investment
(Cost $99,380) | | | | | | | | | | | 99,380 | |
Total Investments
(Cost $61,579,113)—99.8% | | | | | | | | 81,926,384 | |
Other Assets in Excess of Liabilities—0.2% | | | | | | | | | | | 179,373 | |
Total Net Assets—100.0% | | | | | | | | | | $ | 82,105,757 | |
| | | | | | | | | | | | |
| Percentages | are stated as a percent of net assets. |
| ADR | American Depository Receipt |
| (a) | Foreign issued Security. Foreign Concentration (including ADR’s) was as follows: Austria 0.1%; Canada 2.8%; Denmark 1.1%; France 0.2%; Germany 0.7%; Jersey 0.0%; Luxembourg 1.0%; Switzerland 0.0%; United Kingdom 1.7%. |
| (b) | Non-income producing security. |
| (c) | Rate listed is the 7-day effective yield. |
The Accompanying Footnotes are an Integral Part of these Financial Statements.
The Tocqueville International Value Fund
Schedule of Investments as of October 31, 2018
| | | | | | | | |
| Common Stocks—91.9% | | Shares | | | Value | |
Australia—2.7% | |
BHP Billiton Ltd.—ADR | | | 617,130 | | | $ | 28,499,063 | |
Belgium—2.5% | |
Groupe Bruxelles Lambert SA | | | 282,712 | | | | 26,292,952 | |
Brazil—1.6% | |
Ambev SA—ADR | | | 4,081,500 | | | | 17,672,895 | |
Canada—1.8% | |
Nutrien Ltd. | | | 357,554 | | | | 18,925,333 | |
Cayman Islands—0.6% | |
Baidu, Inc.—ADR(a) | | | 32,390 | | | | 6,156,043 | |
Denmark—2.8% | |
ISS A/S | | | 904,275 | | | | 29,697,457 | |
Finland—2.2% | |
Nokia OYJ—ADR | | | 4,186,100 | | | | 23,525,882 | |
France—16.7% | |
Bollore SA | | | 6,321,729 | | | | 26,745,778 | |
Bureau Veritas SA | | | 1,191,573 | | | | 26,881,841 | |
Cie de Saint-Gobain | | | 586,528 | | | | 22,095,226 | |
Danone SA | | | 239,800 | | | | 16,980,960 | |
IPSOS | | | 363,804 | | | | 9,687,514 | |
Publicis Groupe SA | | | 322,575 | | | | 18,672,773 | |
Sanofi | | | 400,666 | | | | 35,803,551 | |
Sopra Steria Group | | | 185,000 | | | | 20,490,060 | |
| | | | | | | | 177,357,703 | |
Germany—7.7% | |
Bayer AG | | | 283,692 | | | | 21,745,573 | |
Continental AG | | | 31,900 | | | | 5,273,369 | |
Infineon Technologies AG | | | 1,084,069 | | | | 21,721,259 | |
Siemens AG—ADR | | | 399,780 | | | | 22,963,363 | |
Wacker Neuson SE | | | 443,119 | | | | 9,840,455 | |
| | | | | | | | 81,544,019 | |
Hong Kong—1.8% | |
Clear Media Ltd.(b)
(Originally acquired 10/08/09, Cost $14,895,581) | | | 15,955,100 | | | | 12,207,500 | |
Kerry Logistics Network Ltd. | | | 4,409,500 | | | | 6,993,046 | |
| | | | | | | | 19,200,546 | |
Ireland—2.5% | |
CRH PLC | | | 878,600 | | | | 26,206,901 | |
Japan—17.9% | |
Amano Corp. | | | 1,201,400 | | | | 25,545,941 | |
Asics Corp. | | | 1,446,600 | | | | 20,937,410 | |
FANUC Corp. | | | 138,170 | | | | 24,037,029 | |
Hitachi Ltd. | | | 745,368 | | | | 22,786,045 | |
Hoya Corp. | | | 357,600 | | | | 20,231,506 | |
Kao Corp. | | | 300,900 | | | | 20,016,538 | |
Makita Corp. | | | 522,200 | | | | 18,053,691 | |
Mitsubishi UFJ Financial Group, Inc. | | | 4,748,800 | | | | 28,742,078 | |
Toho Co., Ltd. | | | 286,380 | | | | 9,343,262 | |
| | | | | | | | 189,693,500 | |
Netherlands—1.9% | |
Unilever NV—ADR | | | 378,000 | | | | 20,328,840 | |
Netherlands Antilles—2.2% | |
Schlumberger Ltd. | | | 454,200 | | | | 23,305,002 | |
Spain—4.7% | |
Applus Services SA | | | 2,255,869 | | | | 30,668,287 | |
Banco Santander SA | | | 3,957,500 | | | | 18,829,514 | |
| | | | | | | | 49,497,801 | |
Switzerland—6.6% | |
Credit Suisse Group AG—ADR | | | 1,468,378 | | | | 18,986,127 | |
Novartis AG—ADR | | | 341,700 | | | | 29,885,082 | |
UBS Group AG | | | 1,541,113 | | | | 21,421,471 | |
| | | | | | | | 70,292,680 | |
United Kingdom—12.4% | |
AVEVA Group PLC | | | 512,625 | | | | 17,147,377 | |
Diageo PLC—ADR | | | 157,490 | | | | 21,758,818 | |
Lloyds Banking Group PLC | | | 24,493,812 | | | | 17,874,112 | |
Micro Focus International PLC | | | 1,272,000 | | | | 19,718,824 | |
Royal Dutch Shell PLC—Class B—ADR | | | 457,658 | | | | 30,072,707 | |
Smiths Group PLC | | | 1,394,614 | | | | 24,859,737 | |
| | | | | | | | 131,431,575 | |
The Accompanying Footnotes are an Integral Part of these Financial Statements.
The Tocqueville International Value Fund
Schedule of Investments as of October 31, 2018
| | | | | | | | |
| Common Stocks—91.9% | | Shares | | | Value | |
United States—3.3% | |
Aflac, Inc. | | | 644,300 | | | $ | 27,750,001 | |
Estre Ambiental SA(a) | | | 1,440,000 | | | | 6,940,800 | |
| | | | | | | | 34,690,801 | |
Total Common Stocks
(Cost $979,308,200) | | | | 974,318,993 | |
Preferred Stock—2.3% | |
Republic of Korea—2.3% | |
Samsung Electronics Co., Ltd. | | | 760,300 | | | | 23,988,035 | |
Total Preferred Stock
(Cost $18,308,489) | | | | 23,988,035 | |
Short-Term Investments—5.8% | |
Money Market Fund—4.9% | |
STIT-Treasury Portfolio—Institutional Class, 2.092%(c) | | | 52,200,000 | | | | 52,200,000 | |
Money Market
Deposit
Account—0.9% | | Principal
Amount | | | | |
U.S. Bank Money Market Deposit Account, 0.300% | | $ | 9,101,661 | | | | 9,101,661 | |
Total Short-Term Investments
(Cost $61,301,661) | | | | 61,301,661 | |
Total Investments
(Cost $1,058,918,350)—100.0% | | | | 1,059,608,689 | |
Other Assets in Excess of Liabilities—0.0% | | | | 391,419 | |
Total Net Assets—100.0% | | | $ | 1,060,000,108 | |
| | | | | | | | |
Percentages are stated as a percent of net assets.
ADR American Depository Receipt
(a) Non-income producing security.
| (b) | Denotes a security that is either fully or partially restricted to resale. The value of restricted securities as of October 31, 2018 was $12,207,500, which represented 1.2% of net assets. |
| (c) | Rate listed is the 7-day effective yield. |
The Accompanying Footnotes are an Integral Part of these Financial Statements.
The Tocqueville Gold Fund
Schedule of Investments as of October 31, 2018
| | | | | | | | |
| Common Stocks—77.1% | | Shares | | | Value | |
Gold Related Securities—68.9% | |
Australia—4.9% | | | | | | | | |
Evolution Mining Ltd. | | | 6,193,374 | | | $ | 13,069,799 | |
Newcrest Mining Ltd. | | | 654,300 | | | | 9,549,491 | |
Northern Star Resources Ltd. | | | 3,187,500 | | | | 19,818,466 | |
| | | | | | | | 42,437,756 | |
Canada—53.1% | | | | | | | | |
Agnico Eagle Mines Ltd. | | | 236,200 | | | | 8,352,032 | |
Agnico Eagle Mines Ltd.(a) | | | 526,485 | | | | 18,596,644 | |
Alacer Gold Corp.(b) | | | 4,091,800 | | | | 6,682,646 | |
Alamos Gold, Inc. | | | 2,469,500 | | | | 9,853,305 | |
Almaden Minerals Ltd.—Class B(b)(c) | | | 5,607,319 | | | | 2,853,815 | |
Argonaut Gold, Inc.(b)(c) | | | 2,837,000 | | | | 2,779,999 | |
ATAC Resources Ltd.(b)(c) | | | 9,784,891 | | | | 2,750,131 | |
B2Gold Corp.(b) | | | 9,273,700 | | | | 22,813,302 | |
Barkerville Gold Mines Ltd.(b) | | | 7,110,000 | | | | 2,268,373 | |
Corvus Gold, Inc.(b)(c) | | | 3,226,901 | | | | 6,379,583 | |
Corvus Gold, Inc.(a)(b)(c) | | | 13,578,800 | | | | 26,508,805 | |
Corvus Gold, Inc.(b)(c) | | | 1,739,130 | | | | 3,395,164 | |
Detour Gold Corp.(b) | | | 4,470,100 | | | | 32,970,998 | |
East Asia Minerals Corp.(b)(c) | | | 13,290,993 | | | | 858,168 | |
Falco Resources Ltd.(b)(c) | | | 16,222,300 | | | | 4,004,898 | |
Franco-Nevada Corp.(b) | | | 605,900 | | | | 37,841,998 | |
GoGold Resources, Inc.(b) | | | 3,968,500 | | | | 708,418 | |
Goldcorp, Inc. | | | 1,935,910 | | | | 17,484,880 | |
Gold Standard Ventures Corp.(b) | | | 7,011,700 | | | | 10,386,125 | |
IAMGOLD Corp.(b) | | | 3,880,500 | | | | 13,271,310 | |
International Tower Hill Mines Ltd.(b)(c) | | | 5,738,836 | | | | 2,725,947 | |
International Tower Hill Mines Ltd.(a)(b)(c) | | | 20,331,298 | | | | 9,266,420 | |
Jaguar Mining, Inc.(b)(c) | | | 64,330,707 | | | | 10,017,695 | |
Kinross Gold Corp.(b) | | | 4,234,167 | | | | 10,966,492 | |
Novagold Resources, Inc.(b) | | | 2,831,300 | | | | 11,410,139 | |
NuLegacy Gold Corp.(b)(c) | | | 28,556,090 | | | | 3,687,596 | |
OceanaGold Corp.(a) | | | 1,551,100 | | | | 4,465,547 | |
OceanaGold Corp. | | | 4,431,459 | | | | 12,629,658 | |
Osisko Gold Royalties Ltd. | | | 24,340 | | | | 186,201 | |
Osisko Gold Royalties Ltd.(a) | | | 2,014,400 | | | | 15,424,173 | |
Osisko Mining, Inc.(b) | | | 7,704,239 | | | | 15,625,598 | |
Pan American Silver Corp. | | | 2,755,798 | | | | 40,455,115 | |
Premier Gold Mines Ltd.(b)(c) | | | 8,630,160 | | | | 11,275,685 | |
Rockhaven Resources Ltd.(b) | | | 4,631,500 | | | | 422,181 | |
SEMAFO, Inc.(b)(c) | | | 11,300,000 | | | | 24,634,000 | |
Strategic Metals Ltd.(b)(c) | | | 10,113,400 | | | | 2,650,403 | |
Torex Gold Resources, Inc.(b) | | | 1,678,100 | | | | 15,283,846 | |
Trifecta Gold Ltd.(b)(c) | | | 2,325,199 | | | | 110,392 | |
Wesdome Gold Mines Ltd.(b) | | | 600,000 | | | | 1,727,373 | |
Wheaton Precious Metals Corp. | | | 1,491,675 | | | | 24,508,220 | |
Yamana Gold, Inc. | | | 3,524,000 | | | | 7,999,480 | |
| | | | | | | | 456,232,755 | |
Jersey—1.9% | | | | | | | | |
Randgold Resources Ltd.—ADR | | | 201,400 | | | | 15,817,956 | |
Peru—1.2% | | | | | | | | |
Cia de Minas Buenaventura SAA—ADR | | | 798,100 | | | | 11,045,704 | |
United Kingdom—2.2% | | | | | |
Fresnillo PLC | | | 1,742,300 | | | | 18,898,393 | |
United States—5.6% | | | | | | | | |
Contango ORE, Inc.(b) | | | 263,200 | | | | 5,217,940 | |
Electrum Ltd.(b)(d)(e)
(Originally acquired 12/21/07, Cost $13,065,361) | | | 2,127,287 | | | | 106,364 | |
Newmont Mining Corp. | | | 613,600 | | | | 18,972,512 | |
Royal Gold, Inc | | | 312,200 | | | | 23,923,886 | |
| | | | | | | | 48,220,702 | |
Total Gold Related Securities | | | | 592,653,266 | |
The Accompanying Footnotes are an Integral Part of these Financial Statements.
The Tocqueville Gold Fund
Schedule of Investments as of October 31, 2018
| | | | | | | | |
| Common Stocks—77.1% | | Shares | | | Value | |
Other Precious Metals Related Securities—7.3% | |
Canada—6.1% | | | | | | | | |
Bear Creek Mining Corp.(b)(c) | | | 7,413,200 | | | $ | 7,207,943 | |
Ivanhoe Mines Ltd.—Class A(b) | | | 7,882,379 | | | | 14,849,253 | |
MAG Silver Corp.(b)(c) | | | 1,432,665 | | | | 10,295,120 | |
MAG Silver Corp.(b)(c) | | | 2,661,600 | | | | 19,030,440 | |
Nickel Creek Platinum Ltd.(b)(c) | | | 12,379,201 | | | | 1,081,399 | |
| | | | | | | | 52,464,155 | |
United States—1.2% | | | | | | | | |
Sunshine Mining & Refining(b)(d)(e)
(Originally acquired 03/15/11, Cost $21,353,108) | | | 2,300,212 | | | | 10,350,954 | |
Total Other Precious Metals
Related Securities | | | | 62,815,109 | |
Other Securities—0.9% | | | | | | | | |
United States—0.9% | | | | | | | | |
Gold Bullion International LLC(b)(c)(d)(e)
(Originally acquired 05/12/10, Cost $5,000,000) | | | 5,000,000 | | | | 6,893,000 | |
I-Pulse, Inc.(b)(d)(e)
(Originally acquired 10/09/07, Cost $175,524) | | | 74,532 | | | | 640,975 | |
Total Other Securities | | | | | | | 7,533,975 | |
Total Common Stocks
(Cost $970,302,756) | | | | | | | 663,002,350 | |
Private Fund—1.9% | | | | | | | | |
Gold Related Security—1.9% | |
Tocqueville Bullion Reserve LP—Class G(b)(c)(d)(e)
(Originally acquired 11/28/11, Cost $25,000,000) | | | 13,806 | | | | 16,113,165 | |
Total Private Fund
(Cost $25,000,000) | | | | 16,113,165 | |
| Gold Bullion—16.9% | | Ounces | | | Value | |
Gold Bullion(b) | | | 119,680 | | | | 145,381,919 | |
Total Gold Bullion
(Cost $70,975,249) | | | | | | | 145,381,919 | |
| Warrants—0.1% | | Shares | | | | |
Gold Related Securities—0.1% | |
Canada—0.1% | | | | | | | | |
Almaden Minerals Ltd.
Expiration: 08/08/2019, Exercise Price: CAD $2.00(b)(c)(d)(e)
(Originally acquired 02/03/17, Cost $0) | | | 79,585 | | | | 1,143 | |
Almaden Minerals Ltd.
Expiration: 11/11/2018, Exercise Price: CAD $2.00(b)(c)(d)(e)
(Originally acquired 05/11/16, Cost $0) | | | 740,741 | | | | — | |
Barkerville Gold Mines Ltd.
Expiration: 11/16/2018, Exercise Price: CAD $1.30(b)(d)(e)
(Originally acquired 05/12/17, Cost $0) | | | 3,555,000 | | | | — | |
East Asia Minerals Corp.
Expiration: 03/05/2020, Exercise Price: CAD $0.50(b)(c)(d)(e)
(Originally acquired 03/03/17, Cost $0) | | | 3,321,250 | | | | 214,445 | |
East Asia Minerals Corp.
Expiration: 12/05/2019, Exercise Price: CAD $0.50(b)(c)(d)(e)
(Originally acquired 12/05/14, Cost $0) | | | 976,493 | | | | — | |
The Accompanying Footnotes are an Integral Part of these Financial Statements.
The Tocqueville Gold Fund
Schedule of Investments as of October 31, 2018
| | | | | | | | |
| Warrants—0.1% | | Shares | | | Value | |
East Asia Minerals Corp.
Expiration: 03/05/2020, Exercise Price: CAD $0.50(b)(c)(d)(e)
(Originally acquired 03/04/15, Cost $0) | | | 4,617,560 | | | $ | 291,831 | |
Equinox Gold Corp.
Expiration: 04/16/2019, Exercise Price: CAD $2.92(b)(d)(e)
(Originally acquired 04/03/14, Cost $0) | | | 150,000 | | | | — | |
Osisko Gold Royalties Ltd.
Expiration: 02/18/2022,
Exercise Price: CAD $36.50(b) | | | 274,000 | | | | 132,166 | |
Total Gold Related Securities | | | | | | | 639,585 | |
Other Precious Metals Related Security—0.0% | |
Canada—0.0% | | | | | | | | |
Nickel Creek Platinum Ltd.
Expiration: 08/08/22, Exercise Price: CAD $0.35(b)(c)(d)(e)
(Originally acquired 08/04/17, Cost $0) | | | 6,189,601 | | | | 193,241 | |
Total Warrants
(Cost $1) | | | | | | | 832,826 | |
Short-Term
Investment—3.9% | | Shares | | | Value | |
Money Market Fund—3.9% | |
STIT-Treasury Portfolio—Institutional Class, 2.092%(f) | | | 33,166,234 | | | | 33,166,234 | |
Total Short-Term Investment
(Cost $33,166,234) | | | | | | | 33,166,234 | |
Total Investments
(Cost $1,099,444,240)—99.9% | | | | 858,496,494 | |
Other Assets in Excess of Liabilities—0.1% | | | | 897,835 | |
Total Net Assets—100.0% | | | $ | 859,394,329 | |
| | | | | | | | |
Percentages are stated as a percent of net assets.
ADR American Depository Receipt
| (a) | Denotes an issue that is traded on a foreign exchange when a company is listed more than once. |
| (b) | Non-income producing security. |
| (c) | Affiliated company. See Footnote 8. |
| (d) | Denotes a security that is either fully or partially restricted to resale. The value of restricted securities as of October 31, 2018 was $34,805,118, which represented 4.0% of net assets. |
| (e) | Security is fair valued using procedures approved by the Board of Trustees which includes significant unobservable inputs and is deemed either a Level 2 or 3 security. See Footnote 2. The aggregate value of fair valued securities as of October 31, 2018 was $34,805,118, which represented 4.0% of net assets. |
| (f) | Rate listed is the 7-day effective yield. |
The Accompanying Footnotes are an Integral Part of these Financial Statements.
The Delafield Fund
Schedule of Investments as of October 31, 2018
| | | | | | | | |
| Common Stocks—66.2% | | Shares | | | Value | |
Aerospace & Defense—1.3% | | | | | | | | |
Ducommun, Inc.(a) | | | 85,000 | | | $ | 3,158,600 | |
Auto Components—2.4% | | | | | | | | |
Garrett Motion, Inc.(a) | | | 165,000 | | | | 2,503,050 | |
Gentex Corp. | | | 115,000 | | | | 2,420,750 | |
Horizon Global Corp.(a) | | | 125,120 | | | | 701,923 | |
| | | | | | | | 5,625,723 | |
Broadcasting—2.4% | | | | | | | | |
TEGNA, Inc. | | | 500,000 | | | | 5,770,000 | |
Building Products—1.6% | | | | | | | | |
Apogee Enterprises, Inc. | | | 102,000 | | | | 3,682,200 | |
Chemicals—13.3% | | | | | | | | |
Eastman Chemical Co. | | | 105,000 | | | | 8,226,750 | |
GCP Applied Technologies, Inc.(a) | | | 195,000 | | | | 5,064,150 | |
HB Fuller Co. | | | 122,500 | | | | 5,446,350 | |
Minerals Technologies, Inc. | | | 80,000 | | | | 4,380,000 | |
PolyOne Corp. | | | 110,000 | | | | 3,554,100 | |
WR Grace & Co. | | | 75,000 | | | | 4,859,250 | |
| | | | | | | | 31,530,600 | |
Commercial Services & Supplies—1.6% | |
Pitney Bowes, Inc. | | | 100,000 | | | | 662,000 | |
Team, Inc.(a) | | | 155,000 | | | | 3,084,500 | |
| | | | | | | | 3,746,500 | |
Construction and Engineering—1.0% | |
Aegion Corp.(a) | | | 120,000 | | | | 2,323,200 | |
Construction Materials—2.7% | |
U.S. Concrete, Inc.(a) | | | 198,000 | | | | 6,462,720 | |
Electrical Equipment—1.9% | | | | | | | | |
Acuity Brands, Inc. | | | 36,000 | | | | 4,523,040 | |
Electronic Equipment, Instruments & Components—11.7% | |
Avnet, Inc. | | | 55,000 | | | | 2,203,850 | |
Fabrinet(a)(b) | | | 155,000 | | | | 6,714,600 | |
Flex Ltd.(a)(b) | | | 555,000 | | | | 4,362,300 | |
Plexus Corp.(a) | | | 65,000 | | | | 3,796,000 | |
TTM Technologies, Inc.(a) | | | 925,000 | | | | 10,822,500 | |
| | | | | | | | 27,899,250 | |
Energy Equipment & Services—1.0% | |
McDermott International, Inc.(a)(b) | | | 312,500 | | | | 2,415,628 | |
Health Care Providers & Services—0.6% | |
Cross Country Healthcare, Inc.(a) | | | 150,000 | | | | 1,324,500 | |
Household Durables—3.0% | | | | | |
Mohawk Industries, Inc.(a) | | | 26,500 | | | | 3,305,345 | |
Newell Brands, Inc. | | | 230,000 | | | | 3,652,400 | |
| | | | | | | | 6,957,745 | |
Interactive Media & Services—1.8% | |
Cars.com, Inc.(a) | | | 165,000 | | | | 4,308,150 | |
Machinery—5.5% | | | | | | | | |
Crane Co. | | | 70,000 | | | | 6,092,800 | |
Harsco Corp.(a) | | | 165,000 | | | | 4,532,550 | |
REV Group, Inc. | | | 225,000 | | | | 2,454,750 | |
| | | | | | | | 13,080,100 | |
Metals & Mining—2.8% | |
Commercial Metals Co. | | | 300,000 | | | | 5,718,000 | |
Schnitzer Steel Industries, Inc.—Class A | | | 35,000 | | | | 941,500 | |
| | | | | | | | 6,659,500 | |
Professional Services—1.9% | |
TrueBlue, Inc.(a) | | | 190,000 | | | | 4,432,700 | |
Technology Hardware, Storage & Peripherals—1.5% | |
Electronics For Imaging, Inc.(a) | | | 50,000 | | | | 1,522,500 | |
Hewlett Packard Enterprise Co. | | | 125,000 | | | | 1,906,250 | |
| | | | | | | | 3,428,750 | |
Textiles, Apparel & Luxury Goods—3.9% | |
Hanesbrands, Inc. | | | 215,000 | | | | 3,689,400 | |
PVH Corp. | | | 42,000 | | | | 5,073,180 | |
Sequential Brands Group, Inc.(a) | | | 400,000 | | | | 524,000 | |
| | | | | | | | 9,286,580 | |
The Accompanying Footnotes are an Integral Part of these Financial Statements.
The Delafield Fund
Schedule of Investments as of October 31, 2018
| | | | | | | | |
| Common Stocks—66.2% | | Shares | | | Value | |
Trading Companies & Distributors—4.3% | |
Rush Enterprises, Inc.—Class A | | | 120,000 | | | $ | 4,246,800 | |
WESCO International, Inc.(a) | | | 120,000 | | | | 6,021,600 | |
| | | | | | | | 10,268,400 | |
Total Common Stocks
(Cost $140,443,414) | | | | 156,883,886 | |
Short-Term Investments—34.2% | |
Money Market Fund—4.7% | |
STIT-Treasury Portfolio—Institutional Class, 2.092%(c) | | | 11,169,105 | | | | 11,169,105 | |
US Treasury Bills—29.5% | |
1.981%, 11/01/2018(d) | | | 50,000,000 | | | | 50,000,000 | |
2.168%, 12/27/2018(d) | | | 20,000,000 | | | | 19,931,711 | |
| | | | | | | | 69,931,711 | |
Total Short-Term Investments
(Cost $81,102,807) | | | | 81,100,816 | |
Total Investments
(Cost $221,546,221)—100.4% | | | | 237,984,702 | |
Liabilities in Excess of Other Assets—(0.4)% | | | | (865,909 | ) |
Total Net Assets—100.0% | | | $ | 237,118,793 | |
| | | | | | | | |
Percentages are stated as a percent of net assets.
| (a) | Non-income producing security. |
| (b) | Foreign issued security. Foreign Concentration was as follows: Cayman Islands 2.8%; Panama 1.0%; Singapore 1.8%. |
| (c) | Rate listed is the 7-day effective yield. |
| (d) | Rate show is the effective yield based on purchased price. The calculation assumed the security is held to maturity. |
The Accompanying Footnotes are an Integral Part of these Financial Statements.
The Tocqueville Select Fund
Schedule of Investments as of October 31, 2018
| | | | | | | | |
| Common Stocks—92.8% | | Shares | | | Value | |
Auto Components—4.9% | | | | | |
Gentex Corp. | | | 92,000 | | | $ | 1,936,600 | |
Building Products—2.5% | | | | | | | | |
Apogee Enterprises, Inc. | | | 26,900 | | | | 971,090 | |
Chemicals—12.3% | | | | | | | | |
Eastman Chemical Co. | | | 21,500 | | | | 1,684,525 | |
Minerals Technologies, Inc. | | | 28,900 | | | | 1,582,275 | |
WR Grace & Co. | | | 24,200 | | | | 1,567,918 | |
| | | | | | | | 4,834,718 | |
Commercial Services & Supplies—4.8% | |
Team, Inc.(a) | | | 95,100 | | | | 1,892,490 | |
Electrical Equipment—3.0% | | | | | | | | |
Acuity Brands, Inc. | | | 9,300 | | | | 1,168,452 | |
Electronic Equipment, Instruments & Components—11.9% | |
Fabrinet(a)(b) | | | 41,300 | | | | 1,789,116 | |
Flex Ltd.(a)(b) | | | 161,500 | | | | 1,269,390 | |
TTM Technologies, Inc.(a) | | | 138,100 | | | | 1,615,770 | |
| | | | | | | | 4,674,276 | |
Household Durables—6.7% | | | | | | | | |
Mohawk Industries, Inc.(a) | | | 11,000 | | | | 1,372,030 | |
Newell Brands, Inc. | | | 78,100 | | | | 1,240,228 | |
| | | | | | | | 2,612,258 | |
Internet Software & Services—9.7% | |
Cars.com, Inc.(a) | | | 65,733 | | | | 1,716,289 | |
j2 Global, Inc. | | | 28,400 | | | | 2,068,656 | |
| | | | | | | | 3,784,945 | |
IT Services—5.9% | | | | | | | | |
EPAM Systems, Inc.(a) | | | 19,400 | | | | 2,317,718 | |
Machinery—9.7% | | | | | | | | |
Harsco Corp.(a) | | | 79,600 | | | | 2,186,612 | |
Stanley Black & Decker, Inc. | | | 13,850 | | | | 1,613,802 | |
| | | | | | | | 3,800,414 | |
Media—4.0% | |
TEGNA, Inc. | | | 136,000 | | | | 1,569,440 | |
Professional Services—8.4% | | | | | | | | |
ICF International, Inc. | | | 24,800 | | | | 1,826,272 | |
TrueBlue, Inc.(a) | | | 62,891 | | | | 1,467,247 | |
| | | | | | | | 3,293,519 | |
Specialty Retail—3.9% | | | | | | | | |
Tile Shop Holdings, Inc. | | | 237,000 | | | | 1,540,500 | |
Trading Companies & Distributors—5.1% | |
WESCO International, Inc.(a) | | | 40,300 | | | | 2,022,254 | |
Total Common Stocks
(Cost $29,121,613) | | | | | | | 36,418,674 | |
Short-Term Investments—7.5% | |
Money Market Fund—4.9% | |
STIT-Treasury Portfolio—Institutional Class, 2.092%(c) | | | 1,900,000 | | | | 1,900,000 | |
Money Market Deposit
Account—2.6% | | Principal
Amount | | | | |
U.S. Bank Money Market Deposit Account, 0.300% | | $ | 1,027,168 | | | | 1,027,168 | |
Total Short-Term Investments
(Cost $2,927,168) | | | | | | | 2,927,168 | |
Total Investments
(Cost $32,048,781)—100.3% | | | | 39,345,842 | |
Liabilities in Excess of Other Assets—(0.3)% | | | | (121,238 | ) |
Total Net Assets—100.0% | | | $ | 39,224,604 | |
| | | | | | | | |
Percentages are stated as a percent of net assets.
| (a) | Non-income producing security. |
| (b) | Foreign issued security. Foreign concentration was as follows: Cayman Islands 4.6%; Singapore 3.2%. |
| (c) | Rate listed is the 7-day effective yield. |
The Accompanying Footnotes are an Integral Part of these Financial Statements.
Percent of Total Investments
The Tocqueville Fund
Allocation of Portfolio Holdings
October 31, 2018
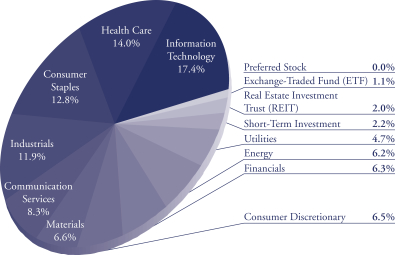
The Tocqueville Opportunity Fund
Allocation of Portfolio Holdings
October 31, 2018
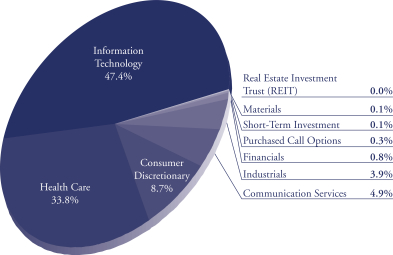
Percent of Total Investments
The Tocqueville International Value Fund
Allocation of Portfolio Holdings
October 31, 2018
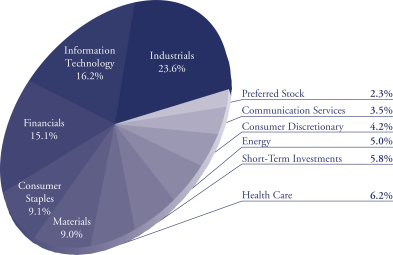
The Tocqueville Gold Fund
Allocation of Portfolio Holdings
October 31, 2018
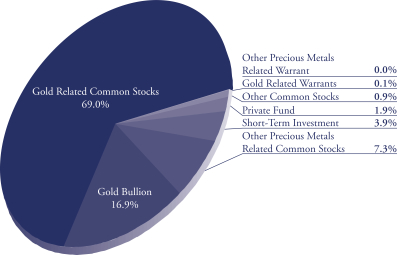
Percent of Total Investments
The Delafield Fund
Allocation of Portfolio Holdings
October 31, 2018
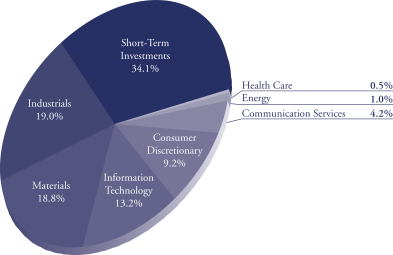
The Tocqueville Select Fund
Allocation of Portfolio Holdings
October 31, 2018
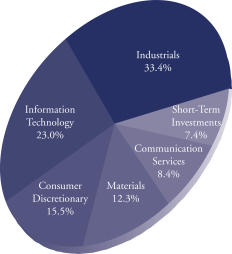
The Tocqueville Trust
Statements of Assets & Liabilities
October 31, 2018
| | | | | | | | | | | | |
| | | The
Tocqueville
Fund | | | The
Tocqueville
Opportunity
Fund | | | The
Tocqueville
International
Value Fund | |
Assets: | | | | | | | | | | | | |
Investments, at value (1) | | $ | 270,692,274 | | | $ | 81,926,384 | | | $ | 1,059,608,689 | |
Foreign currencies, at value (2) | | | — | | | | — | | | | 548,314 | |
Receivable for investments sold | | | 13,166,426 | | | | 2,040,898 | | | | 1,097,282 | |
Receivable for Fund shares sold | | | 12,414 | | | | 55,810 | | | | 1,937,720 | |
Dividends, interest and other receivables | | | 302,927 | | | | 707 | | | | 5,714,482 | |
Other assets | | | 16,628 | | | | 14,591 | | | | 42,908 | |
| | | | | | | | | | | | |
Total Assets | | | 284,190,669 | | | | 84,038,390 | | | | 1,068,949,395 | |
| | | | | | | | | | | | |
Liabilities: | | | | | | | | | | | | |
Payable for investments purchased | | | 11,798,653 | | | | 1,819,400 | | | | 6,001,557 | |
Payable for foreign currencies purchased | | | — | | | | 1,770 | | | | 1,612 | |
Payable for Fund shares redeemed | | | 3,649 | | | | 10,517 | | | | 1,604,746 | |
Payable to Adviser (see Note 10) | | | 188,360 | | | | 55,006 | | | | 756,164 | |
Payable to Administrator | | | 35,943 | | | | 406 | | | | 150,037 | |
Payable to Trustees | | | 16,314 | | | | 5,916 | | | | 68,903 | |
Accrued distribution fee | | | 42,619 | | | | 11,167 | | | | 17,572 | |
Accrued expenses and other liabilities | | | 61,657 | | | | 28,451 | | | | 348,696 | |
| | | | | | | | | | | | |
Total Liabilities | | | 12,147,195 | | | | 1,932,633 | | | | 8,949,287 | |
| | | | | | | | | | | | |
Net Assets | | $ | 272,043,474 | | | $ | 82,105,757 | | | $ | 1,060,000,108 | |
| | | | | | | | | | | | |
Net assets consist of: | | | | | | | | | | | | |
Paid in capital | | $ | 122,123,863 | | | $ | 55,907,639 | | | $ | 1,057,752,403 | |
Total distributable earnings | | | 149,919,611 | | | | 26,198,118 | | | | 2,247,705 | |
| | | | | | | | | | | | |
Net assets | | $ | 272,043,474 | | | $ | 82,105,757 | | | $ | 1,060,000,108 | |
| | | | | | | | | | | | |
Shares of beneficial interest outstanding (unlimited shares of $0.01 par value authorized) | | | 7,590,680 | | | | 3,086,525 | | | | 70,401,878 | |
Net asset value, offering and redemption price per share | | $ | 35.84 | | | $ | 26.60 | | | $ | 15.06 | |
| | | | | | | | | | | | |
(1) Cost of investments | | $ | 142,247,183 | | | $ | 61,579,113 | | | $ | 1,058,918,350 | |
(2) Cost of foreign currencies | | $ | — | | | $ | — | | | $ | 563,978 | |
The Accompanying Notes are an Integral Part of these Financial Statements.
The Tocqueville Trust
Statements of Assets & Liabilities
October 31, 2018
| | | | | | | | | | | | |
| | | The
Tocqueville
Gold Fund | | | The
Delafield Fund | | | The
Tocqueville
Select Fund | |
Assets: | | | | | | | | | | | | |
Investments, at value (1) | | | | | | | | | | | | |
Unaffiliated issuers | | $ | 683,276,066 | | | $ | 237,984,702 | | | $ | 39,345,842 | |
Affiliated issuers | | | 175,220,428 | | | | — | | | | — | |
Foreign currencies, at value (2) | | | 929,773 | | | | — | | | | — | |
Receivable for investments sold | | | — | | | | — | | | | — | |
Receivable for Fund shares sold | | | 1,977,058 | | | | 63,173 | | | | 15,334 | |
Dividends, interest and other receivables | | | 51,414 | | | | 73,904 | | | | 21,352 | |
Other assets | | | 19,257 | | | | 10,203 | | | | 14,448 | |
| | | | | | | | | | | | |
Total Assets | | | 861,473,996 | | | | 238,131,982 | | | | 39,396,976 | |
| | | | | | | | | | | | |
Liabilities: | | | | | | | | | | | | |
Payable for investments purchased | | | — | | | | 303,097 | | | | 117,612 | |
Payable for foreign currencies purchased | | | — | | | | — | | | | — | |
Payable for Fund shares redeemed | | | 889,598 | | | | 361,378 | | | | 49 | |
Payable to Adviser (see Note 10) | | | 679,784 | | | | 192,924 | | | | 26,033 | |
Payable to Administrator | | | 102,549 | | | | 35,609 | | | | 3,237 | |
Payable to Trustees | | | 48,045 | | | | 16,207 | | | | 2,305 | |
Accrued distribution fee | | | 46,335 | | | | 23,903 | | | | 5,892 | |
Accrued expenses and other liabilities | | | 313,356 | | | | 80,071 | | | | 17,244 | |
| | | | | | | | | | | | |
Total Liabilities | | | 2,079,667 | | | | 1,013,189 | | | | 172,372 | |
| | | | | | | | | | | | |
Net Assets | | $ | 859,394,329 | | | $ | 237,118,793 | | | $ | 39,224,604 | |
| | | | | | | | | | | | |
Net assets consist of: | | | | | | | | | | | | |
Paid in capital | | $ | 1,498,780,597 | | | $ | 205,930,338 | | | $ | 36,207,542 | |
Total distributable earnings | | | (639,386,268 | ) | | | 31,188,455 | | | | 3,017,062 | |
| | | | | | | | | | | | |
Net assets | | $ | 859,394,329 | | | $ | 237,118,793 | | | $ | 39,224,604 | |
| | | | | | | | | | | | |
Shares of beneficial interest outstanding (unlimited shares of $0.01 par value authorized) | | | 29,622,803 | | | | 11,739,589 | | | | 3,600,002 | |
Net asset value, offering and redemption price per share | | $ | 29.01 | | | $ | 20.20 | | | $ | 10.90 | |
| | | | | | | | | | | | |
(1) Cost of investments | | | | | | | | | | | | |
Unafilliated issuers | | $ | 741,895,317 | | | $ | 221,546,221 | | | $ | 32,048,781 | |
Affiliated issuers | | $ | 357,548,923 | | | $ | — | | | $ | — | |
(2) Cost of foreign currencies | | $ | 934,902 | | | $ | — | | | $ | — | |
The Accompanying Notes are an Integral Part of these Financial Statements.
The Tocqueville Trust
Statements of Operations
For the Year Ended October 31, 2018
| | | | | | | | | | | | |
| | | The
Tocqueville
Fund | | | The
Tocqueville
Opportunity
Fund | | | The
Tocqueville
International
Value Fund | |
Investment Income: | | | | | | | | | |
Dividends* | | $ | 6,300,011 | | | $ | 176,831 | | | $ | 31,189,773 | |
Interest | | | 15,100 | | | | 1,112 | | | | 1,000,786 | |
| | | | | | | | | | | | |
Total investment income | | | 6,315,111 | | | | 177,943 | | | | 32,190,559 | |
| | | | | | | | | | | | |
Expenses: | | | | | | | | | | | | |
Investment Adviser’s fee (See Note 4) | | | 2,182,414 | | | | 656,200 | | | | 11,877,582 | |
Distribution fees (See Note 4) | | | 727,471 | | | | 218,733 | | | | 3,125,861 | |
Administration fees (See Note 4) | | | 436,483 | | | | 131,240 | | | | 1,680,413 | |
Transfer agent and shareholder services fees | | | 64,472 | | | | 23,445 | | | | 603,155 | |
Trustee fees and expenses | | | 52,022 | | | | 16,213 | | | | 246,173 | |
Legal fees | | | 46,005 | | | | 12,662 | | | | 211,777 | |
Fund accounting fees | | | 28,168 | | | | 21,542 | | | | 130,167 | |
Audit fees | | | 28,023 | | | | 12,191 | | | | 121,057 | |
Blue sky fees | | | 25,829 | | | | 25,202 | | | | 94,998 | |
Other expenses (See Note 10) | | | 17,392 | | | | 7,117 | | | | 99,582 | |
Custody fees | | | 16,950 | | | | 17,668 | | | | 223,367 | |
Printing and mailing expense | | | 14,706 | | | | 3,899 | | | | 116,915 | |
Insurance expense | | | 8,660 | | | | 2,458 | | | | 31,185 | |
Interest expense | | | 5,364 | | | | 12,740 | | | | — | |
Registration fees | | | 2,065 | | | | 1,436 | | | | 3,147 | |
| | | | | | | | | | | | |
Total expenses before waiver | | | 3,656,024 | | | | 1,162,746 | | | | 18,565,379 | |
Less: Fees waived (See Note 4) | | | (15,087 | ) | | | (56,403 | ) | | | (2,936,076 | ) |
| | | | | | | | | | | | |
Net expenses | | | 3,640,937 | | | | 1,106,343 | | | | 15,629,303 | |
| | | | | | | | | | | | |
Net Investment Income (Loss) | | | 2,674,174 | | | | (928,400 | ) | | | 16,561,256 | |
| | | | | | | | | | | | |
The Accompanying Notes are an Integral Part of these Financial Statements.
The Tocqueville Trust
Statements of Operations
For the Year Ended October 31, 2018
| | | | | | | | | | | | |
| | | The
Tocqueville
Fund | | | The
Tocqueville
Opportunity
Fund | | | The
Tocqueville
International
Value Fund | |
Realized and Unrealized Gain (Loss): | | | | | | | | | | | | |
Net realized gain (loss) on: | | | | | | | | | | | | |
Investments | | | 21,491,107 | | | | 9,097,855 | | | | (7,346,813 | ) |
Foreign currency translation | | | 4,090 | | | | (14,410 | ) | | | (1,862,018 | ) |
Written Option | | | — | | | | (2,771 | ) | | | — | |
| | | | | | | | | | | | |
| | | 21,495,197 | | | | 9,080,674 | | | | (9,208,831 | ) |
Net change in unrealized appreciation (depreciation) on: | | | | | | | | | | | | |
Investments | | | (17,842,614 | ) | | | (4,555,488 | ) | | | (165,667,954 | ) |
Foreign currency translation | | | (39 | ) | | | 1,328 | | | | (19,994,025 | ) |
| | | | | | | | | | | | |
| | | (17,842,653 | ) | | | (4,554,160 | ) | | | (185,661,979 | ) |
Net gain (loss) on investments and foreign currency | | | 3,652,544 | | | | 4,526,514 | | | | (194,870,810 | ) |
| | | | | | | | | | | | |
Net Increase (Decrease) in Net Assets Resulting from Operations | | $ | 6,326,718 | | | $ | 3,598,114 | | | $ | (178,309,554 | ) |
| | | | | | | | | | | | |
* Net of foreign taxes withheld of: | | $ | 8,700 | | | $ | 1,356 | | | $ | 3,707,945 | |
| | | | | | | | | | | | |
The Accompanying Notes are an Integral Part of these Financial Statements.
The Tocqueville Trust
Statements of Operations
For the Year Ended October 31, 2018
| | | | | | | | | | | | |
| | | The
Tocqueville
Gold Fund | | | The
Delafield
Fund | | | The
Tocqueville
Select Fund | |
Investment Income: | | | | | | | | | |
Dividends* | | $ | 5,428,907 | | | $ | 1,667,220 | | | $ | 350,650 | |
Interest | | | 114,886 | | | | 715,809 | | | | 37,029 | |
| | | | | | | | | | | | |
Total investment income | | | 5,543,793 | | | | 2,383,029 | | | | 387,679 | |
| | | | | | | | | | | | |
Expenses: | | | | | | | | | | | | |
Investment Adviser’s fee (See Note 4) | | | 8,885,348 | | | | 2,457,877 | | | | 358,874 | |
Distribution fees (See Note 4) | | | 2,563,960 | | | | 777,660 | | | | 112,148 | |
Administration fees (See Note 4) | | | 1,407,606 | | | | 466,596 | | | | 67,289 | |
Transfer agent and shareholder services fees | | | 643,134 | | | | 122,277 | | | | 14,958 | |
Trustee fees and expenses | | | 176,010 | | | | 52,065 | | | | 7,331 | |
Legal fees | | | 177,788 | | | | 47,586 | | | | 6,536 | |
Fund accounting fees | | | 90,889 | | | | 28,217 | | | | 5,165 | |
Audit fees | | | 73,499 | | | | 27,177 | | | | 7,792 | |
Blue sky fees | | | 48,846 | | | | 28,740 | | | | 24,099 | |
Other expenses (See Note 10) | | | 62,266 | | | | 18,470 | | | | 2,476 | |
Custody fees | | | 244,809 | | | | 33,896 | | | | 2,604 | |
Printing and mailing expense | | | 91,230 | | | | 32,925 | | | | 2,094 | |
Insurance expense | | | 33,932 | | | | 10,095 | | | | 1,456 | |
Interest expense | | | 14,649 | | | | — | | | | — | |
Registration fees | | | 4,597 | | | | 1,669 | | | | 901 | |
| | | | | | | | | | | | |
Total expenses before waiver | | | 14,518,563 | | | | 4,105,250 | | | | 613,723 | |
Less: Fees waived (See Note 4) | | | — | | | | (214,711 | ) | | | (52,981 | ) |
| | | | | | | | | | | | |
Net expenses | | | 14,518,563 | | | | 3,890,539 | | | | 560,742 | |
| | | | | | | | | | | | |
Net Investment Loss | | | (8,974,770 | ) | | | (1,507,510 | ) | | | (173,063 | ) |
| | | | | | | | | | | | |
The Accompanying Notes are an Integral Part of these Financial Statements.
The Tocqueville Trust
Statements of Operations
For the Year Ended October 31, 2018
| | | | | | | | | | | | |
| | | The
Tocqueville
Gold Fund | | | The
Delafield
Fund | | | The
Tocqueville
Select Fund | |
Realized and Unrealized Gain (Loss): | | | | | | | | | | | | |
Net realized gain (loss) on: | | | | | | | | | | | | |
Investments | | | | | | | | | | | | |
Unaffiliated issuers | | | 5,468,997 | | | | 21,617,558 | | | | (4,128,184 | ) |
Affiliated issuers | | | 605,548 | | | | — | | | | — | |
Foreign currency translation | | | (539,223 | ) | | | — | | | | — | |
| | | | | | | | | | | | |
| | | 5,535,322 | | | | 21,617,558 | | | | (4,128,184 | ) |
Net change in unrealized appreciation (depreciation) on: | | | | | | | | | | | | |
Investments | | | (192,015,751 | ) | | | (48,172,817 | ) | | | 1,590,296 | |
Foreign currency translation | | | 599,557 | | | | — | | | | — | |
| | | | | | | | | | | | |
| | | (191,416,194 | ) | | | (48,172,817 | ) | | | 1,590,296 | |
Net loss on investments and foreign currency | | | (185,880,872 | ) | | | (26,555,259 | ) | | | (2,537,888 | ) |
| | | | | | | | | | | | |
Net Decrease in Net Assets Resulting from Operations | | $ | (194,855,642 | ) | | $ | (28,062,769 | ) | | $ | (2,710,951 | ) |
| | | | | | | | | | | | |
* Net of foreign taxes withheld of: | | $ | 422,447 | | | $ | — | | | $ | — | |
| | | | | | | | | | | | |
The Accompanying Notes are an Integral Part of these Financial Statements.
The Tocqueville Trust
Statements of Changes in Net Assets
| | | | | | | | | | | | | | | | | | | | | | | | |
| | | The Tocqueville Fund | | | The Tocqueville
Opportunity Fund | | | The Tocqueville
International Value Fund | |
| | | For the
Year Ended
October 31,
2018 | | | For the
Year Ended
October 31,
2017 | | | For the
Year Ended
October 31,
2018 | | | For the
Year Ended
October 31,
2017 | | | For the
Year Ended
October 31,
2018 | | | For the
Year Ended
October 31,
2017 | |
Operations: | | | | | | | | | | | | | | | | | | | | | | | | |
Net investment income (loss) | | $ | 2,674,174 | | | $ | 2,798,964 | | | $ | (928,400 | ) | | $ | (766,582 | ) | | $ | 16,561,256 | | | $ | 7,808,075 | |
Net realized gain (loss) on sale of investments and foreign currency | | | 21,495,197 | | | | 27,750,358 | | | | 9,080,674 | | | | 7,318,004 | | | | (9,208,831 | ) | | | 4,954,445 | |
Net change in unrealized appreciation (depreciation) | | | (17,842,653 | ) | | | 23,747,091 | | | | (4,554,160 | ) | | | 18,157,916 | | | | (185,661,979 | ) | | | 150,926,517 | |
| | | | | | | | | | | | | | | | | | | | | | | | |
Net increase (decrease) in net assets resulting from operations | | | 6,326,718 | | | | 54,296,413 | | | | 3,598,114 | | | | 24,709,338 | | | | (178,309,554 | ) | | | 163,689,037 | |
| | | | | | | | | | | | | | | | | | | | | | | | |
Total dividends and distributions | | | (26,828,335 | ) | | | (15,436,819 | )(1) | | | (2,589,302 | ) | | | — | | | | (14,880,734 | ) | | | (8,262,201 | )(2) |
Fund share transactions: | | | | | | | | | | | | | | | | | | | | | | | | |
Shares sold | | | 14,681,016 | | | | 20,393,861 | | | | 16,112,469 | | | | 7,604,183 | | | | 500,256,514 | | | | 603,434,286 | |
Shares issued to holders in reinvestment of dividends | | | 25,480,630 | | | | 14,742,846 | | | | 2,468,524 | | | | — | | | | 13,265,360 | | | | 7,212,804 | |
Shares redeemed* | | | (41,253,735 | ) | | | (63,484,870 | ) | | | (15,257,530 | ) | | | (47,498,497 | ) | | | (381,325,273 | ) | | | (170,888,189 | ) |
| | | | | | | | | | | | | | | | | | | | | | | | |
Net increase (decrease) | | | (1,092,089 | ) | | | (28,348,163 | ) | | | 3,323,463 | | | | (39,894,314 | ) | | | 132,196,601 | | | | 439,758,901 | |
| | | | | | | | | | | | | | | | | | | | | | | | |
Net increase (decrease) in net assets | | | (21,593,706 | ) | | | 10,511,431 | | | | 4,332,275 | | | | (15,184,976 | ) | | | (60,993,687 | ) | | | 595,185,737 | |
The Accompanying Notes are an Integral Part of these Financial Statements.
The Tocqueville Trust
Statements of Changes in Net Assets
| | | | | | | | | | | | | | | | | | | | | | | | |
| | | The Tocqueville Fund | | | The Tocqueville
Opportunity Fund | | | The Tocqueville
International Value Fund | |
| | | For the
Year Ended
October 31,
2018 | | | For the
Year Ended
October 31,
2017 | | | For the
Year Ended
October 31,
2018 | | | For the
Year Ended
October 31,
2017 | | | For the
Year Ended
October 31,
2018 | | | For the
Year Ended
October 31,
2017 | |
Net Assets: | | | | | | | | | | | | | | | | | | | | | | | | |
Beginning of year | | | 293,637,180 | | | | 283,125,749 | | | | 77,773,482 | | | | 92,958,458 | | | | 1,120,993,795 | | | | 525,808,058 | |
| | | | | | | | | | | | | | | | | | | | | | | | |
End of year | | $ | 272,043,474 | | | $ | 293,637,180 | (3) | | $ | 82,105,757 | | | $ | 77,773,482 | (4) | | $ | 1,060,000,108 | | | $ | 1,120,993,795 | (5) |
| | | | | | | | | | | | | | | | | | | | | | | | |
| (1) | Includes net investment income distributions of $3,191,286 and net realized gain distributions of $12,245,533. |
| (2) | Includes net investment income distributions of $5,348,368 and net realized gain distributions of $2,913,833. |
| (3) | Includes accumulated net investment income of $2,189,633. |
| (4) | Includes accumulated investment loss $638,189. |
| (5) | Includes accumulated net investment income of $5,919,191. |
The Accompanying Notes are an Integral Part of these Financial Statements.
The Tocqueville Trust
Statements of Changes in Net Assets
| | | | | | | | | | | | | | | | | | | | | | | | |
| | | The Tocqueville Gold Fund | | | The Delafield Fund | | | The Tocqueville Select Fund | |
| | | For the
Year Ended
October 31,
2018 | | | For the
Year Ended
October 31,
2017 | | | For the
Year Ended
October 31,
2018 | | | For the
Year Ended
October 31,
2017 | | | For the
Year Ended
October 31,
2018 | | | For the
Year Ended
October 31,
2017 | |
Operations: | | | | | | | | | | | | | | | | | | | | | | | | |
Net investment loss | | $ | (8,974,770 | ) | | $ | (11,627,847 | ) | | $ | (1,507,510 | ) | | $ | (1,941,535 | ) | | $ | (173,063 | ) | | $ | (198,971 | ) |
Net realized gain (loss) on sale of investments and foreign currency | | | 5,535,322 | | | | (62,949,271 | ) | | | 21,617,558 | | | | 63,482,709 | | | | (4,128,184 | ) | | | 1,808,514 | |
Net change in unrealized appreciation (depreciation) | | | (191,416,194 | ) | | | (57,383,526 | ) | | | (48,172,817 | ) | | | 9,477,267 | | | | 1,590,296 | | | | 3,581,268 | |
| | | | | | | | | | | | | | | | | | | | | | | | |
Net decrease in net assets resulting from operations | | | (194,855,642 | ) | | | (131,960,644 | ) | | | (28,062,769 | ) | | | 71,018,441 | | | | (2,710,951 | ) | | | 5,190,811 | |
Total dividends and distributions | | | — | | | | — | | | | (51,947,188 | ) | | | (71,259,512 | )(6) | | | (903,727 | ) | | | (3,023,170 | )(7) |
Fund share transactions: | | | | | | | | | | | | | | | | | | | | | | | | |
Shares sold | | | 213,886,198 | | | | 273,496,683 | | | | 14,347,640 | | | | 18,861,894 | | | | 2,787,932 | | | | 4,133,895 | |
Shares issued to holders in reinvestment of dividends | | | — | | | | — | | | | 50,048,422 | | | | 68,515,995 | | | | 890,838 | | | | 2,918,410 | |
Shares redeemed* | | | (312,923,463 | ) | | | (353,530,850 | ) | | | (120,620,354 | ) | | | (114,610,738 | ) | | | (10,292,016 | ) | | | (23,579,503 | ) |
| | | | | | | | | | | | | | | | | | | | | | | | |
Net decrease | | | (99,037,265 | ) | | | (80,034,167 | ) | | | (56,224,292 | ) | | | (27,232,849 | ) | | | (6,613,246 | ) | | | (16,527,198 | ) |
| | | | | | | | | | | | | | | | | | | | | | | | |
Net decrease in net assets | | | (293,892,907 | ) | | | (211,994,811 | ) | | | (136,234,249 | ) | | | (27,473,920 | ) | | | (10,227,924 | ) | | | (14,359,557 | ) |
The Accompanying Notes are an Integral Part of these Financial Statements.
The Tocqueville Trust
Statements of Changes in Net Assets
| | | | | | | | | | | | | | | | | | | | | | | | |
| | | The Tocqueville Gold Fund | | | The Delafield Fund | | | The Tocqueville Select Fund | |
| | | For the
Year Ended
October 31,
2018 | | | For the
Year Ended
October 31,
2017 | | | For the
Year Ended
October 31,
2018 | | | For the
Year Ended
October 31,
2017 | | | For the
Year Ended
October 31,
2018 | | | For the
Year Ended
October 31,
2017 | |
Net Assets: | | | | | | | | | | | | | | | | | | | | | | | | |
Beginning of year | | | 1,153,287,236 | | | | 1,365,282,047 | | | | 373,353,042 | | | | 400,826,962 | | | | 49,452,528 | | | | 63,812,085 | |
| | | | | | | | | | | | | | | | | | | | | | | | |
End of year** | | $ | 859,394,329 | | | $ | 1,153,287,236 | (8) | | $ | 237,118,793 | | | $ | 373,353,042 | (9) | | $ | 39,224,604 | | | $ | 49,452,528 | (10) |
| | | | | | | | | | | | | | | | | | | | | | | | |
* Net of redemption fees of: | | $ | 67,378 | | | $ | 228,731 | | | $ | — | | | $ | — | | | $ | — | | | $ | — | |
| | | | | | | | | | | | | | | | | | | | | | | | |
| (6) | Includes net investment income distributions of $0 and net realized gain distributions of $71,259,512. |
| (7) | Includes net investment income distributions of $0 and net realized gain distributions of $3,023,170. |
| (8) | Includes accumulated net investment loss of $25,988,316. |
| (9) | Includes accumulated net investment loss of $619,614. |
| (10) | Includes accumulated net investment loss of $17,192. |
The Accompanying Notes are an Integral Part of these Financial Statements.
The Tocqueville Trust
Notes to Financial Statements
1. ORGANIZATION
The Tocqueville Trust (the “Trust”) is a Massachusetts business trust registered under the Investment Company Act of 1940 and organized on September 17, 1986, consisting of six separate funds (each, a “Fund” or, collectively, the “Funds”). Each Fund is an open-end management investment company with a different investment objective. The Tocqueville Fund, The Tocqueville Opportunity Fund (the “Opportunity Fund”), The Tocqueville International Value Fund (the “International Fund”), The Delafield Fund and The Tocqueville Select Fund (the “Select Fund”) are classified as diversified investment companies. The Tocqueville Gold Fund (the “Gold Fund”) is classified as a non-diversified investment company. The Tocqueville Fund’s investment objective is long-term capital appreciation which it seeks to achieve by investing primarily in securities of United States issuers. The Opportunity Fund’s investment objective is to achieve long-term capital appreciation which it seeks to achieve by investing in the common stocks of small and mid-cap companies which have the potential to deliver superior long term earnings growth. The International Fund’s investment objective is long-term capital appreciation consistent with preservation of capital which it seeks to achieve by investing primarily in securities of non-U.S. issuers. The Gold Fund’s investment objective is long-term capital appreciation which it seeks to achieve by investing in gold, securities of companies located throughout the world that are engaged in mining or processing gold (“gold related securities”), other precious metals and securities of companies located throughout the world that are engaged in mining or processing such other precious metals (“other precious metal securities”). The Delafield Fund’s investment objectives are to seek long-term preservation of capital (sufficient growth to outpace inflation over an extended period of time) and growth of capital which it seeks to achieve by investing primarily in the equity securities of domestic companies. The Tocqueville Select Fund’s investment objective is to achieve long-term capital appreciation by investing in a focused group of common stocks issued primarily by small and mid-sized U.S. companies. Current income is a secondary objective for The Tocqueville Select Fund.
The Delafield Fund, a series of the Trust, commenced operations on September 28, 2009 as successor to Delafield Fund, Inc. The predecessor Delafield Fund, Inc. commenced operations on November 19, 1993.
The Tocqueville Select Fund, a series of the Trust, commenced operations on September 28, 2009 as successor to the Delafield Select Fund, a series of Natixis Funds Trust II. The predecessor Delafield Select Fund commenced operations on September 29, 2008 for Class A and Class C shares and on September 26, 2008 for Class Y shares. Prior to September 29, 2008, the predecessor Delafield Select Fund operated as a Delaware limited partnership using substantially the same investment objectives and investment policies as the predecessor fund. The limited partnership was incepted in July 1998.
2. SIGNIFICANT ACCOUNTING POLICIES
The following is a summary of significant accounting principles followed by the Trust in the preparation of its financial statements.
a) Security valuation and security transactions
Investments in securities, including foreign securities, traded on an exchange or quoted on the over-the-counter market are valued at the last sale price or, if no sale occurred during the day, at the mean between closing bid and asked prices, as last reported by a pricing service approved by the Trustees. Securities that are principally traded on the National Association of Securities Dealers Automated Quotation National Market (“NASDAQ”) are generally valued at the NASDAQ Official Closing Price (“NOCP”). If there is no NASDAQ Official Closing Price for a NASDAQ-listed security or sale price available for an over-the-counter security, the mean of the latest bid and asked quotations from NASDAQ will be used. Investments in gold will be valued at the spot price of gold determined based on the mean of the last bid and asked price at the close of the New York Commodity Exchange. When market quotations for securities are not readily available, or when restricted securities or other assets are being valued, such assets are valued at fair value as determined in good faith by or under procedures approved by the Trustees. Money market funds are valued at market price. Money market deposit accounts are reflected at cost as this is a cash instrument. Fixed income securities are valued at market price. Fixed Income securities, such as corporate bonds, convertible bonds and U.S. government agency issues for which market quotations are not readily available may be valued based on information supplied by independent pricing services using matrix pricing formulas and/or independent broker bid quotations.
Trading in securities on foreign securities exchanges normally is completed before the calculation of the Funds’ net asset value. Trading on these foreign exchanges may not take place on all days on which there is regular trading on the New York Stock Exchange (“NYSE”), or may take place on days on which there is no regular trading on the NYSE. Similarly, the Funds may hold securities traded in domestic markets where the market may close early on a given day prior to calculation of the Funds’ net asset value. Events affecting the value of such securities held by the Funds that occur between the close of trading in the security and the close of trading on the NYSE normally will not be reflected in the Funds’ calculation of the net asset value. However, significant events will be closely monitored, and where it is determined that an adjustment should be made to the security’s value because significant interim events may materially affect the value of the security, the security will be priced at its fair value in accordance with the procedures approved by the Trustees.
Investment and shareholder transactions are recorded on trade date. Dividend income is recognized on the ex-dividend date. Interest income is recognized on an accrual basis and includes, where applicable, the amortization of premiums and accretion of discounts. Net realized gains and losses from sales of securities are determined on the specific identification cost method.
b) Restricted and illiquid securities
The Funds may invest in securities that are subject to legal or contractual restrictions on resale or are illiquid. A security may be considered illiquid if it lacks a readily available market or if its valuation has not changed for a certain period of time. Disposal of these securities may involve time consuming negotiations and expense, and a prompt sale at the current valuation may be difficult.
c) Fair Valuation Measurements
The Trust has adopted authoritative fair valuation accounting standards which establish an authoritative definition of fair value and set out a hierarchy for measuring fair value. These standards require additional disclosures about the various inputs and valuation techniques used to develop the measurements of fair value and a discussion in changes in valuation techniques and related inputs during the year. These inputs are summarized in the three broad levels listed below.
| | • | Level 1 - Quoted prices in active markets for identical securities. |
| | • | Level 2 - Other significant observable inputs (including quoted prices for similar securities, interest rates, prepayment speeds, credit risk, etc.). |
| | • | Level 3 - Significant unobservable inputs (including the Fund’s own assumptions in determining the fair value of investments). |
When using the market quotations or closing price provided by the pricing service for equity investments, including common stocks, preferred stocks, foreign issued common stocks, exchange-traded funds, closed end mutual funds and real estate investment trusts, which are traded on an exchange are valued at the last sale price reported by the exchange on which the securities are primarily traded on the day of valuation and when the market is considered active, the security will be classified as a Level 1 security. When using the mean between the latest bid and ask price, the security will be classified as Level 2. Common stocks of the International Value Fund that are traded on non-North American exchanges are generally valued using matrix pricing formulas provided by an independent pricing service. These securities will be classified as Level 2 securities. When matrix pricing formulas are not available and fair valuation is not applied, the use of closing prices provided by the primary source of the funds will be used. These will be classified as Level 1 securities. Gold bullion is valued at the mean of the closing bid and ask prices from the New York Mercantile Exchange and is classified as a Level 2.
Investment in mutual funds, including money market funds, are generally priced at the ending net asset value (NAV) provided by the service agent of the funds and will be classified as Level 1 securities.
Debt securities, such as corporate bonds, convertible bonds, commercial paper, money market deposit accounts and U.S. government agency issues for which market quotations are not readily available may be valued based on information supplied by independent pricing services using matrix pricing formulas and/or independent broker bid quotations and are classified as Level 2. Warrants and rights for which the underlying
security is registered and equities which are subject to a required holding period, but have a comparable public issue, are valued in good faith by the adviser pursuant to procedures established under the general supervision and responsibility of the Funds’ Board of Trustees. These securities will generally be classified as Level 2 securities. If the warrant or right is exchange traded and the official closing price of the exchange is used, these instruments are classified as Level 1 securities. Forward currency contracts derive their value from the underlying currency prices. These are valued by a pricing service using pricing models. The models use inputs that are observed from active markets, such as exchange rates. These contracts are classified as Level 2. Options can diverge from the prices of their underlying instruments. These are valued at the composite last price reported by the exchange on which the options are primarily traded on the day of the valuation and are classified as Level 1. If there is no composite last price on a given day the mean between the latest bid and ask price will be used. These contracts are classified as Level 2.
Any securities or other assets for which market quotations are not readily available are valued at fair value as determined in good faith by the Adviser pursuant to procedures established under the general supervision and responsibility of the Funds’ Board of Trustees and will be classified as Level 3 securities. In determining fair value, a Fund will seek to assign a value to the security which it believes represents the amount that the Fund could reasonably expect to receive upon its current sale. With respect to securities that are actively traded on U.S. exchanges, the Funds expect that market quotations will generally be available and that fair value might be used only in limited circumstances, such as when trading for a security is halted during the trading day.
For securities traded principally on foreign exchanges, the Funds may use fair value pricing if an event occurs after the close of trading of the principal foreign exchange on which a security is traded, but before calculation of a Fund’s NAV, which a Fund believes affects the value of the security since its last market quotation. Such events may involve situations relating to a single issuer (such as news related to the issuer announced after the close of the principal foreign exchange), or situations relating to sectors of the market or the markets in general (such as significant fluctuations in the U.S. or foreign markets or significant changes in exchange rates, natural disasters, armed conflicts, or governmental actions).
In determining whether a significant event has occurred with respect to securities traded principally in foreign markets, the Funds may engage a third party fair value service provider to systematically recommend the adjustment of closing market prices of non-U.S. securities based upon changes in a designated U.S. securities market index occurring from the time of close of the relevant foreign market and the close of the NYSE. Fair value pricing may also be used to value restricted securities held by the Funds or securities with little or no trading activity for extended periods of time. Fair value pricing involves judgments that are inherently subjective and inexact and it is not possible to determine with certainty when, and to what extent, an event will affect a market price. As a result, there can be no assurance that fair value pricing will reflect actual market value and it is possible that the fair value determined for a security may differ materially from the value that could be realized upon the sale of the security.
The following is a summary of the inputs used, as of October 31, 2018, involving the Funds’ assets and liabilities carried at fair value. The inputs of methodology used for valuing securities may not be an indication of the risk associated with investing in those securities.
| | | | | | | | | | | | | | | | |
| Description | | Level 1 | | | Level 2 | | | Level 3 | | | Total | |
The Tocqueville Fund | | | | | | | | | | | | | | | | |
Assets | | | | | | | | | | | | | | | | |
Common Stocks* | | $ | 256,334,110 | | | $ | — | | | $ | — | | | $ | 256,334,110 | |
Preferred Stock* | | | — | | | | — | | | | 1,600 | | | | 1,600 | |
Real Estate Investment Trust (REIT)* | | | 5,326,000 | | | | — | | | | — | | | | 5,326,000 | |
Exchange-Traded Fund (ETF)* | | | 3,057,000 | | | | — | | | | — | | | | 3,057,000 | |
Money Market Fund | | | 5,973,564 | | | | — | | | | — | | | | 5,973,564 | |
| | | | | | | | | | | | | | | | |
Total Assets | | $ | 270,690,674 | | | $ | — | | | $ | 1,600 | | | $ | 270,692,274 | |
| | | | | | | | | | | | | | | | |
| | | | |
| The Tocqueville Opportunity Fund | | Level 1 | | | Level 2 | | | Level 3 | | | Total | |
Assets | | | | | | | | | | | | | | | | |
Common Stocks* | | $ | 81,574,650 | | | $ | — | | | $ | — | | | $ | 81,574,650 | |
Real Estate Investment Trust (REIT)* | | | 379 | | | | — | | | | — | | | | 379 | |
Total Purchased Call Options* | | | 251,975 | | | | — | | | | — | | | | 251,975 | |
Money Market Fund | | | 99,380 | | | | — | | | | — | | | | 99,380 | |
| | | | | | | | | | | | | | | | |
Total Assets | | $ | 81,926,384 | | | $ | — | | | $ | — | | | $ | 81,926,384 | |
| | | | | | | | | | | | | | | | |
| | | | |
| The Tocqueville International Value Fund | | Level 1 | | | Level 2 | | | Level 3 | | | Total | |
Assets | | | | | | | | | | | | | | | | |
Common Stocks | | | | | | | | | | | | | | | | |
Australia | | $ | 28,499,063 | | | $ | — | | | $ | — | | | $ | 28,499,063 | |
Belgium | | | — | | | | 26,292,952 | | | | — | | | | 26,292,952 | |
Brazil | | | 17,672,895 | | | | — | | | | — | | | | 17,672,895 | |
Canada | | | 18,925,333 | | | | — | | | | — | | | | 18,925,333 | |
Cayman Islands | | | 6,156,043 | | | | — | | | | — | | | | 6,156,043 | |
Denmark | | | — | | | | 29,697,457 | | | | — | | | | 29,697,457 | |
Finland | | | 23,525,882 | | | | — | | | | — | | | | 23,525,882 | |
France | | | — | | | | 177,357,703 | | | | — | | | | 177,357,703 | |
Germany | | | 28,236,732 | | | | 53,307,287 | | | | — | | | | 81,544,019 | |
Hong Kong | | | 12,207,500 | | | | 6,993,046 | | | | — | | | | 19,200,546 | |
Ireland | | | — | | | | 26,206,901 | | | | — | | | | 26,206,901 | |
Japan | | | — | | | | 189,693,500 | | | | — | | | | 189,693,500 | |
Netherlands | | | 20,328,840 | | | | — | | | | — | | | | 20,328,840 | |
Netherlands Antilles | | | 23,305,002 | | | | — | | | | — | | | | 23,305,002 | |
Spain | | | — | | | | 49,497,801 | | | | — | | | | 49,497,801 | |
Switzerland | | | 70,292,680 | | | | — | | | | — | | | | 70,292,680 | |
United Kingdom | | | 51,831,525 | | | | 79,600,050 | | | | — | | | | 131,431,575 | |
United States | | | 34,690,801 | | | | — | | | | — | | | | 34,690,801 | |
| | | | | | | | | | | | | | | | |
Total Common Stocks | | | 335,672,296 | | | | 638,646,697 | | | | — | | | | 974,318,993 | |
Preferred Stock* | | | — | | | | 23,988,035 | | | | — | | | | 23,988,035 | |
Money Market Fund | | | 52,200,000 | | | | — | | | | — | | | | 52,200,000 | |
Money Market Deposit Account | | | — | | | | 9,101,661 | | | | — | | | | 9,101,661 | |
| | | | | | | | | | | | | | | | |
Total Assets | | $ | 387,872,296 | | | $ | 671,736,393 | | | $ | — | | | $ | 1,059,608,689 | |
| | | | | | | | | | | | | | | | |
| | | | | | | | | | | | | | | | |
| The Tocqueville Gold Fund | | Level 1 | | | Level 2 | | | Level 3 | | | Total | |
Assets | | | | | | | | | | | | | | | | |
Common Stocks | | | | | | | | | | | | | | | | |
Gold Related | | $ | 587,218,570 | | | $ | 5,328,332 | | | $ | 106,364 | | | $ | 592,653,266 | |
Other Precious Metals Related | | | 52,464,155 | | | | — | | | | 10,350,954 | | | | 62,815,109 | |
Other | | | — | | | | — | | | | 7,533,975 | | | | 7,533,975 | |
| | | | | | | | | | | | | | | | |
Total Common Stocks | | | 639,682,725 | | | | 5,328,332 | | | | 17,991,293 | | | | 663,002,350 | |
Private Fund^ | | | — | | | | — | | | | 16,113,165 | | | | 16,113,165 | |
Gold Bullion* | | | — | | | | 145,381,919 | | | | — | | | | 145,381,919 | |
Warrants* | | | | | | | 832,826 | | | | | | | | 832,826 | |
Money Market Fund | | | 33,166,234 | | | | — | | | | — | | | | 33,166,234 | |
| | | | | | | | | | | | | | | | |
Total Assets | | $ | 672,848,959 | | | $ | 151,543,077 | | | $ | 34,104,458 | | | $ | 858,496,494 | |
| | | | | | | | | | | | | | | | |
| | | | |
| The Delafield Fund | | Level 1 | | | Level 2 | | | Level 3 | | | Total | |
Assets | | | | | | | | | | | | | | | | |
Common Stocks* | | $ | 156,883,886 | | | $ | — | | | $ | — | | | $ | 156,883,886 | |
Money Market Fund | | | 11,169,105 | | | | — | | | | — | | | | 11,169,105 | |
U.S. Treasury Bills | | | — | | | | 69,931,711 | | | | — | | | | 69,931,711 | |
| | | | | | | | | | | | | | | | |
Total Assets | | $ | 168,052,991 | | | $ | 69,931,711 | | | $ | — | | | $ | 237,984,702 | |
| | | | | | | | | | | | | | | | |
| | | | |
| The Tocqueville Select Fund | | Level 1 | | | Level 2 | | | Level 3 | | | Total | |
Assets | | | | | | | | | | | | | | | | |
Common Stocks* | | $ | 36,418,674 | | | $ | — | | | $ | — | | | $ | 36,418,674 | |
Money Market Fund | | | 1,900,000 | | | | — | | | | — | | | | 1,900,000 | |
Money Market Deposit Account | | | — | | | | 1,027,168 | | | | — | | | | 1,027,168 | |
| | | | | | | | | | | | | | | | |
Total Assets | | $ | 38,318,674 | | | $ | 1,027,168 | | | $ | — | | | $ | 39,345,842 | |
| | | | | | | | | | | | | | | | |
| * | For further information regarding portfolio characteristics, please see the accompanying Schedules of Investments. |
| ^ | The Gold Fund currently invests in a private fund that primarily invests in physical gold and is subject to redemption restrictions. This private fund investment can only be disposed of with notice given 24 hours in advance of redemption. Due to the elapsed time, the investment of the Gold Fund is not subject to any redemption fees going forward. |
Below is a reconciliation that details the activity of securities in Level 3 during the current fiscal year:
| | | | | | | | |
| | | The
Tocqueville
Fund | | | The
Tocqueville
Gold Fund | |
Beginning Balance—November 1, 2017 | | $ | 1,600 | | | $ | 18,586,934 | |
Purchases | | | — | | | | — | |
Sales | | | — | | | | — | |
Realized gains | | | — | | | | — | |
Realized losses | | | — | | | | — | |
Change in unrealized depreciation | | | — | | | | (595,641 | ) |
Transfers in/(out) of Level 3 | | | — | | | | 16,113,165 | |
| | | | | | | | |
Ending Balance—October 31, 2018 | | $ | 1,600 | | | $ | 34,104,458 | |
| | | | | | | | |
The movement into Level 3 in the Gold Fund was due to the latest price change of a comparable proxy investment being used because the NAV from the Fund Administrator of the security was not readily available.
Change in unrealized appreciation (depreciation) for securities that were considered Level 3 at the start of the period but no longer held or considered Level 3 at year end was $0.
| | | | | | | | | | | | |
Fund | | Type of
Security | | Industry | | Fair Value at 10/31/2018 | | Valuation Techniques | | Unobservable
Inputs | | Range |
The Tocqueville Fund | | Preferred Stock | | Health Care
Equipment &
Supplies | | $ 1,600 | | Latest company valuation | | Financing prices | | $0.004 |
The Tocqueville Gold Fund | | Common Stock | | Gold Related | | $ 106,364 | | Latest company valuation | | Financing prices | | $0.05-$0.33 |
| | | | Other Precious
Metals Related | | 10,350,954 | | Latest company financing price | | Financing prices | | $4.50 |
| | | | Other | | 7,533,975 | | Latest company financing price | | Financing prices | | $1.38-$8.60 |
| | Private Fund | | Gold Related | | 16,113,165 | | Latest price change of comparable proxy investment | | Adviser deemed comparable proxy investment | | $1,167.11 |
The significant unobservable inputs used in the fair value measurement of the Tocqueville Fund’s preferred stock and the Gold Fund’s common stocks are the most recent financing prices of the portfolio company, which approximate the companies’ value in the market place. The significant unobservable inputs used fot the private fund is the latest price change of an Adviser deemed comparable proxy investment.
Significant changes in the companies’ ability to receive financing for new projects in the future would be an indication of the companies’ financial position and market value. Significant changes in the latest price change of the comparable proxy investment or a change in the adviser deemed comparable proxy investment could impact the value of the security.
The Trust’s valuation procedures have been adopted by the Trust’s Board of Trustees, which has established a Valuation Committee to oversee the valuation process. The Valuation Committee meets on an as needed basis to evaluate changes in the valuation of portfolio securities. The full findings and valuations are then reviewed quarterly by the Independent Trustees.
d) Derivative Instruments and Hedging Activities
The Funds’ Adviser may use derivative instruments, such as options, as a means to manage exposure to different types of risk, including market risk and exchange rate risk, and to gain exposure to underlying securities. The Trust has adopted disclosure standards in order to enable the investor to understand how and why an entity used derivatives, how derivatives are accounted for, and how derivatives affect an entity’s results of operations and financial position.
In the Opportunity Fund, the Adviser used options to gain exposure to the underlying equity security and to earn premium income.
Balance Sheet—Values of Derivative Instruments as of October 31, 2018.
The Tocqueville Opportunity Fund
| | | | | | | | | | | | |
| | | Asset Derivatives | | | Liability Derivatives | |
| Derivatives not accounted for as hedging instruments | | Balance Sheet
Location | | Value | | | Balance Sheet
Location | | Value | |
Purchased Options | | Investments,
at Value | | $ | 251,975 | | | | | $ | — | |
| | | | | | | | | | | | |
Total | | | | $ | 251,975 | | | | | $ | — | |
| | | | | | | | | | | | |
The Effect of Derivative Instruments on the Statement of Operations for the year ended October 31, 2018.
The Tocqueville Opportunity Fund
| | | | | | | | |
| | | Net Realized Gain
(Loss) on Investments | | | Net Change in
Unrealized
Depreciation on
Investments | |
Purchased Options | | $ | 282,938 | | | | $ (1,151,206) | |
Written Option | | | (2,771 | ) | | | — | |
| | | | | | | | |
Total | | $ | 280,167 | | | | $ (1,151,206) | |
| | | | | | | | |
Derivatives Risk
The risks of using the types of derivatives in which the Funds may engage include the risk that movements in the value of the derivative may not fully offset or complement instruments currently held in the Funds in the manner intended by the Adviser; the risk that the counterparty to a derivative contract may fail to comply with their obligations to the Fund; the risk that the derivative may not possess a liquid secondary market at a time when the Fund would look to disengage the position; the risk that additional capital from the Fund may be called upon to fulfill the conditions of the derivative contract; and the risk that the cost of the derivative contracts may reduce the overall returns experienced by the Funds. The measurement of risks associated with these instruments is meaningful only when all related offsetting transactions are considered. The Fund may enter into written call options to hedge against changes in the value of equities. The Fund’s option component of the overall investment strategy is often referred to as a “buy-write” strategy (also called a “covered call” strategy), in which the Adviser (as defined below) writes (sells) a call option contract while at the same time owning an equivalent number of shares of the underlying stock to generate moderate current income. The writing of call options is intended to reduce the volatility of the portfolio and to earn premium income. Written call options expose the Fund to minimal counterparty credit risk since they are exchange traded and the exchange’s clearing house guarantees the options against default. As the writer of a call option, the Fund has the obligation to sell the security at the exercise price during the exercise period in the event the option is exercised. The use of options do not create leverage in the Funds.
The average monthly value of purchased options in the Opportunity Fund during the year ended October 31, 2018 was $863,123.
The average monthly value of written options in the Opportunity Fund during the year ended October 31, 2018 was $10,125.
Transactions in options in the Opportunity Fund during the year ended October 31, 2018 were as follows:
| | | | | | | | |
| | | Notional
Amount | | | Contracts | |
Outstanding, beginning of year: | | $ | 29,757,500 | | | | 7,925 | |
Options purchased | | | 149,605,000 | | | | 11,975 | |
Options terminated in closing transactions | | | (94,086,250 | ) | | | (12,375 | ) |
Options exercised | | | (3,845,000 | ) | | | (325 | ) |
Options expired | | | (59,493,750 | ) | | | (6,030 | ) |
| | | | | | | | |
Outstanding, end of year: | | $ | 21,937,500 | | | | 1,170 | |
e) Foreign currency translation
Investments and other assets and liabilities denominated in foreign currencies are translated to U.S. dollars at the prevailing rates of exchange, in accordance with the Trust’s Portfolio Securities Valuation and Foreign Exchange Contracts Procedures. The Tocqueville Fund, The Tocqueville Opportunity Fund, The Tocqueville International Value Fund and The Tocqueville Gold Fund have engaged in transactions in securities denominated in foreign currencies and, as a result, entered into foreign exchange transactions. These Funds are exposed to additional market risk as a result of changes in the value of the underlying currency in relation to the U.S. dollar. Risks include potential inability of counterparties to meet the terms of their obligations. The value of foreign currencies are marked-to-market on a daily basis, which reflects the changes in the market value of the contract at the close of each day’s trading, resulting in daily unrealized gains and/or losses. When the transactions are settled or the contracts are closed, the Funds recognize a realized gain or loss.
The Funds isolate that portion of the results of operations resulting from changes in foreign exchange rates on investments from the fluctuations arising from changes in market prices of securities held. Such fluctuations are reflected as net realized and unrealized gain or loss on foreign currency translation.
Reported net realized foreign exchange gains or losses arise from sales of foreign currencies, currency gains or losses realized between the trade and settlement dates on securities transactions, the differences between the amounts of dividends, interest, and foreign withholding taxes recorded on the Fund’s books, and the U.S. dollar equivalent of the amounts actually received or paid. Net unrealized foreign exchange gains and losses arise from changes in the value of assets and liabilities other than investments in securities at the end of the fiscal year, resulting from changes in the exchange rates.
f) Dividends and distributions to shareholders
Dividends to shareholders are recorded on the ex-dividend date. Dividends from net investment income are declared and paid annually by the Funds. Distributions of net realized capital gains, if any, will be declared and paid at least annually. Income and capital gain distributions are determined in accordance with income tax regulations which may differ from generally accepted accounting principles. Permanent differences between financial and tax reporting may result in reclassification to capital stock.
g) Use of estimates
The preparation of financial statements in conformity with accounting principles generally accepted in the United States of America requires management to make estimates and assumptions that affect the reported amounts of assets and liabilities and disclosure of contingent assets and liabilities at the date of the financial statements and the reported amounts of revenues and expenses during the reporting year. Actual results could differ from those estimates.
h) Indemnification
In the normal course of business the Funds enter into contracts that contain general indemnification clauses. The Funds’ maximum exposure under these arrangements is unknown, as this would involve future claims against a Fund that have not yet occurred. Based on experience, the Funds expect the risk of loss to be remote.
(i) Recent accounting pronouncement
In August 2018, FASB issued ASU 2018-13, Fair Value Measurement (Topic 820): Disclosure Framework—Changes to the Disclosure Requirements for Fair Value Measurement (“ASU 2018-13”). The primary focus of ASU 2018-13 is to improve the effectiveness of the disclosure requirements for fair value measurements. The changes affect all companies that are required to include fair value measurement disclosures. In general, the amendments in ASU 2018-13 are effective for all entities for fiscal years and interim periods within those fiscal years, beginning after December 15, 2019. An entity is permitted to early adopt the removed or modified disclosures upon the issuance of ASU 2018-13 and may delay adoption of the additional disclosures, which are required for public companies only, until their effective date. Management is currently evaluating the impact these changes will have on the Fund’s financial statements and disclosures.
j) Subsequent events evaluation
The Board of Trustees of the Trust has approved an Agreement and Plan of Reorganization and Termination (the “Plan”) providing for the reorganization of the International Value Fund (the “Target Fund”), into a newly organized series (the “Acquiring Fund”) of American Beacon Funds, a Massachusetts business trust. The reorganization of the Target Fund is subject to approval by its shareholders.
If shareholders of the Target Fund approve the reorganization, the reorganization is expected to take effect on or about January 18, 2019.
In preparing these financial statements, the Trust has evaluated events and transactions for potential recognition or disclosure resulting from subsequent events through the date financial statements were available to be issued. This evaluation did not result in any subsequent events, other than those noted above, that necessitated disclosure and/or adjustments.
3. FEDERAL INCOME TAX
There is no tax liability resulting from unrecognized tax benefits relating to uncertain income tax positions taken or expected to be taken on the tax return for the fiscal year-end October 31, 2018, or for any other tax years which are open for exam. As of October 31, 2018, open tax years include the tax years ended October 31, 2015 through 2018. The Trust is also not aware of any tax positions for which it is reasonably possible that the total amounts of unrecognized tax benefits will significantly change in the next six months. The Funds recognize interest and penalties, if any, related to unrecognized tax benefits as income tax expense in the Statement of Operations. During the year, the Funds did not incur any interest or penalties.
Provision for federal income taxes or excise taxes has not been made since the Funds have elected to be taxed as Regulated Investment Companies and intend to distribute substantially all taxable income to shareholders and otherwise comply with the provisions of the Internal Revenue Code applicable to Regulated Investment Companies. Distributions from net realized gains for book purposes may include short-term capital gains which are included as ordinary income to shareholders for tax purposes. Additionally, accounting principles generally accepted in the United States of America require that certain components of net assets relating to permanent differences be reclassified between financial and tax reporting. These reclassifications have no effect on net assets or net asset value per share. For the year ended October 31, 2018, the following table shows the reclassifications made:
| | | | | | | | | | | | |
| | | Undistributed
Net Investment
Income/(Loss) | | | Accumulated Net
Realized
Gain/(Loss) | | | Paid In Capital | |
Tocqueville Fund | | $ | (255,910 | ) | | $ | (2,077,060 | ) | | $ | 2,332,970 | |
Opportunity Fund | | | 914,313 | | | | (1,636,210 | ) | | | 721,897 | |
International Value Fund | | | (1,862,038 | ) | | | 1,862,038 | | | | — | |
Gold Fund | | | 16,829,513 | | | | (2,321,521 | ) | | | (14,507,992 | ) |
Delafield Fund | | | 2,127,124 | | | | (6,885,940 | ) | | | 4,758,816 | |
Select Fund | | | 38,440 | | | | 36 | | | | (38,476 | ) |
The permanent differences primarily relate to net operating losses, foreign currency reclasses, the usage of tax equalization, Partnerships, and PFICs.
As of October 31, 2018, the components of accumulated earnings (losses) for income tax purposes were as follows:
| | | | | | | | | | | | | | | | | | | | | | | | |
| | | Tocqueville
Fund | | | Opportunity
Fund | | | International
Value Fund | | | Gold
Fund | | | Delafield Fund | | | Select Fund | |
Tax cost of Investments | | $ | 142,247,183 | | | $ | 62,674,596 | | | $ | 1,061,857,224 | | | $ | 1,113,608,673 | | | $ | 221,615,767 | | | $ | 32,057,578 | |
| | | | | | | | | | | | | | | | | | | | | | | | |
Unrealized Appreciation | | | 129,677,022 | | | | 23,419,455 | | | | 102,611,034 | | | | 164,356,476 | | | | 34,648,434 | | | | 9,871,400 | |
Unrealized Depreciation | | | (1,231,931 | ) | | | (4,167,667 | ) | | | (104,311,255 | ) | | | (418,538,882 | ) | | | (18,279,499 | ) | | | (2,583,136 | ) |
| | | | | | | | | | | | | | | | | | | | | | | | |
Net unrealized appreciation (depreciation) | | | 128,445,091 | | | | 19,251,788 | | | | (1,700,221 | ) | | | (254,182,406 | ) | | | 16,368,935 | | | | 7,288,264 | |
| | | | | | | | | | | | | | | | | | | | | | | | |
Undistributed operating income | | | 2,114,645 | | | | — | | | | 11,284,673 | | | | — | | | | 49,879 | | | | — | |
Undistributed long-term gains | | | 19,359,873 | | | | 7,593,051 | | | | — | | | | — | | | | 14,769,641 | | | | — | |
| | | | | | | | | | | | | | | | | | | | | | | | |
Distributable earnings | | | 21,474,518 | | | | 7,593,051 | | | | 11,284,673 | | | | — | | | | 14,819,520 | | | | — | |
| | | | | | | | | | | | | | | | | | | | | | | | |
Other accumulated gain/(loss) | | | 2 | | | | (646,721 | ) | | | (7,336,747 | ) | | | (385,203,862 | ) | | | — | | | | (4,271,202 | ) |
| | | | | | | | | | | | | | | | | | | | | | | | |
Total accumulated gain/(loss) | | $ | 149,919,611 | | | $ | 26,198,118 | | | $ | 2,247,705 | | | $ | (639,386,268 | ) | | $ | 31,188,455 | | | $ | 3,017,062 | |
| | | | | | | | | | | | | | | | | | | | | | | | |
The difference between book-basis and tax-basis unrealized appreciation is attributable primarily to wash sale deferrals and passive foreign investment companies (PFIC’s).
The tax character of distributions paid during the years ended October 31, 2018 and 2017 was as follows:
| | | | | | | | | | | | |
| | | October 31, 2018 | |
| | | Ordinary
Income | | | Long Term
Capital Gain | | | Total | |
Tocqueville Fund | | $ | 2,493,282 | | | $ | 24,335,053 | | | $ | 26,828,335 | |
Opportunity Fund | | | — | | | | 2,589,302 | | | | 2,589,302 | |
International Value Fund | | | 11,212,289 | | | | 3,668,445 | | | | 14,880,734 | |
Gold Fund | | | — | | | | — | | | | — | |
Delafield Fund | | | 2,432,967 | | | | 49,514,221 | | | | 51,947,188 | |
Select Fund | | | — | | | | 903,727 | | | | 903,727 | |
| |
| | | October 31, 2017 | |
| | | Ordinary
Income | | | Long Term
Capital Gain | | | Total | |
Tocqueville Fund | | $ | 3,191,286 | | | $ | 12,245,533 | | | $ | 15,436,819 | |
Opportunity Fund | | | — | | | | — | | | | — | |
International Value Fund | | | 5,348,368 | | | | 2,913,833 | | | | 8,262,201 | |
Gold Fund | | | — | | | | — | | | | — | |
Delafield Fund | | | — | | | | 71,259,512 | | | | 71,259,512 | |
Select Fund | | | — | | | | 3,023,170 | | | | 3,023,170 | |
The Fund designated as long-term capital gain dividend, pursuant to Internal Revenue Code Section 852(b)(3), the amount necessary to reduce the earnings and profits of the Funds related to net capital gain to zero for the tax years ended October 31, 2018 and 2017.
For the fiscal year ended October 31, 2018 the Opportunity Fund, Gold Fund, and Select Fund had late year losses of $646,060, $7,503,492 and $143,018, respectively.
At October 31, 2018 certain Funds had tax basis capital losses which may be carried forward to offset future capital gains as shown below.
| | | | | | | | |
| | | Capital Losses Expiring
Indefinite Short Term | | | Capital Losses Expiring
Indefinite Long Term | |
International Value Fund | | $ | 7,258,341 | | | $ | — | |
Gold Fund | | | 2,295,524 | | | | 375,404,846 | |
Select Fund | | | 737,776 | | | | 3,390,408 | |
To the extent that Funds listed above may realize future net capital gains, those gains will be offset by any of their unused respective capital loss carryforwards
4. INVESTMENT ADVISORY AND OTHER AGREEMENTS
Tocqueville Asset Management L.P. (“Tocqueville”) is the investment adviser (the “Adviser”) to the Trust under Investment Advisory Agreements approved by shareholders. For its services, Tocqueville receives fees from The Tocqueville Fund, calculated daily and
payable monthly, at an annual rate of 0.75% on the first $1 billion of the average daily net assets of the Fund, and 0.65% of the average daily net assets in excess of $1 billion. Tocqueville receives fees from The Tocqueville Opportunity Fund, calculated daily and payable monthly, at an annual rate of 0.75% on the first $500 million of the average daily net assets of the Fund, and 0.65% of the average daily net assets in excess of $500 million. Tocqueville receives fees from The Tocqueville International Value Fund, calculated daily and payable monthly, at an annual rate of 1.00% on the first $1 billion of the average daily net assets of the Fund, and 0.75% of the average daily net assets in excess of $1 billion. Tocqueville receives fees from The Tocqueville Gold Fund, calculated daily and payable monthly, at an annual rate of 1.00% on the first $500 million of the average daily net assets of the Fund, 0.75% of the average daily net assets in excess of $500 million but not exceeding $1 billion, and 0.65% of the average daily net assets in excess of $1 billion. Tocqueville receives fees from The Delafield Fund, calculated daily and payable monthly, at an annual rate of 0.80% on the first $250 million of net assets of the Fund; 0.75% on the next $250 million of net assets of the Fund; 0.70% on the next $500 million of net assets of the Fund; and 0.65% on all net assets of the Fund over $1 billion. Tocqueville receives fees from The Tocqueville Select Fund, calculated daily and payable monthly, at an annual rate of 0.80% on all net assets of the Fund.
With respect to The Tocqueville Fund, The Tocqueville Opportunity Fund, The Tocqueville International Value Fund, The Delafield Fund and The Tocqueville Select Fund, the Adviser has contractually agreed to waive its advisory fees and/or reimburse expenses in order to ensure that The Tocqueville Fund’s and The Tocqueville International Value Fund’s total annual operating expenses do not exceed 1.25% of its average daily net assets (excluding taxes, interest expense, acquired fund fees and expenses, or extraordinary expenses such as litigation). The Expense Limitation Agreements will remain in effect until March 1, 2020 for each fund. For the year ended October 31, 2018, the Adviser waived $15,087, $56,403, $2,936,076, $214,711, and $52,981 of the advisory fee for The Tocqueville Fund, The Tocqueville Opportunity Fund, The Tocqueville International Fund, The Delafield Fund, and The Tocqueville Select Fund respectively. Such amounts are not subject to recoupment by the Adviser.
Pursuant to an Administrative Services Agreement, each Fund pays to the Adviser a fee computed and paid monthly at an annual rate of 0.15% on the first $400 million of the average daily net assets of each fund; 0.13% on the next $600 million of the average daily net assets of each fund; and 0.12% on all the average daily net assets of each fund over $1 billion. For the year ended October 31, 2018, the Adviser has made payments of $75,625, $22,740, $324,938, $266,437, $80,814, and $11,657, to U.S. Bancorp Fund Services, LLC for services provided under a Sub-Administration Agreement for The Tocqueville Fund, The Tocqueville Opportunity Fund, The Tocqueville International Value Fund, The Tocqueville Gold Fund, The Delafield Fund and The Tocqueville Select Fund, respectively.
Tocqueville Securities, L.P. (the “Distributor”), an affiliate of Tocqueville, acts as distributor for shares of the Trust. Each Fund adopted a distribution and service plan pursuant to Rule 12b-1 of the 1940 Act. Pursuant to the plans, each Fund pays to the
Distributor distribution and service fees of 0.25% per annum of its average daily net assets.
Commissions earned by the Distributor for services rendered as a registered broker-dealer in securities transactions for The Tocqueville Fund, The Tocqueville Opportunity Fund, The Tocqueville International Fund, The Tocqueville Gold Fund, The Delafield Fund and The Tocqueville Select Fund for the year ended October 31, 2018, were $19,800, $95,017, $2,553, $9,150, $15,046, $8,242, respectively.
5. CAPITAL SHARE TRANSACTIONS.
Transactions in capital shares for each Fund were as follows:
| | | | | | | | |
| | | For the Year
Ended
October 31, 2018 | | | For the Year
Ended
October 31, 2017 | |
| The Tocqueville Fund | | Shares | | | Shares | |
Shares sold | | | 400,145 | | | | 588,202 | |
Shares issued to holders in reinvestment dividends | | | 705,639 | | | | 435,792 | |
Shares redeemed | | | (1,122,176 | ) | | | (1,813,017 | ) |
| | | | | | | | |
Net decrease | | | (16,392 | ) | | | (789,023 | ) |
| | |
| The Tocqueville Opportunity Fund | | | | | | | | |
Shares sold | | | 566,780 | | | | 344,287 | |
Shares issued to holders in reinvestment dividends | | | 97,416 | | | | — | |
Shares redeemed | | | (555,070 | ) | | | (2,224,181 | ) |
| | | | | | | | |
Net increase (decrease) | | | 109,126 | | | | (1,879,894 | ) |
| | |
| The Tocqueville International Value Fund | | | | | | | | |
Shares sold | | | 28,716,655 | | | | 37,730,215 | |
Shares issued to holders in reinvestment dividends | | | 766,784 | | | | 509,379 | |
Shares redeemed | | | (22,853,917 | ) | | | (10,870,395 | ) |
| | | | | | | | |
Net increase | | | 6,629,522 | | | | 27,369,199 | |
| | |
| The Tocqueville Gold Fund | | | | | | | | |
Shares sold | | | 6,517,002 | | | | 7,433,508 | |
Shares issued to holders in reinvestment dividends | | | — | | | | — | |
Shares redeemed | | | (9,256,841 | ) | | | (9,794,433 | ) |
| | | | | | | | |
Net decrease | | | (2,739,839 | ) | | | (2,360,925 | ) |
| | |
| The Delafield Fund | | | | | | | | |
Shares sold | | | 621,501 | | | | 735,499 | |
Shares issued to holders in reinvestment dividends | | | 2,222,399 | | | | 2,739,544 | |
Shares redeemed | | | (5,243,871 | ) | | | (4,475,349 | ) |
| | | | | | | | |
Net decrease | | | (2,399,971 | ) | | | (1,000,306 | ) |
| | |
| The Tocqueville Select Fund | | | | | | | | |
Shares sold | | | 233,208 | | | | 341,500 | |
Shares issued to holders in reinvestment dividends | | | 76,796 | | | | 231,253 | |
Shares redeemed | | | (875,383 | ) | | | (1,991,554 | ) |
| | | | | | | | |
Net decrease | | | (565,379 | ) | | | (1,418,801 | ) |
6. FUND SHARE TRANSACTIONS
Each Fund currently offers only one class of shares of beneficial interest. A redemption fee of 2.00% is imposed on redemptions of shares held 90 days or fewer for The Tocqueville Gold Fund. This fee is retained by the Fund and is credited to paid in capital. Redemptions to which the fee applies include redemptions of shares resulting from an exchange made pursuant to the Exchange Privilege, as defined in the Trust’s Prospectus dated February 28, 2018. For a more detailed description of when the redemption fee does not apply, please see the Trust’s Prospectus.
7. INVESTMENT TRANSACTIONS
Purchases and sales of investment securities (excluding short-term instruments) for the year ended October 31, 2018 are summarized below.
| | | | | | | | | | | | | | | | | | | | | | | | |
| | | Tocqueville
Fund | | | Opportunity
Fund | | | International
Value Fund | | | Gold Fund | | | Delafield
Fund | | | Select
Fund | |
Purchases: | | $ | 53,717,529 | | | $ | 129,343,312 | | | $ | 476,356,943 | | | $ | 86,538,322 | | | $ | 89,599,435 | | | $ | 10,949,691 | |
| | | | | | | | | | | | | | | | | | | | | | | | |
Sales: | | $ | 84,716,921 | | | $ | 130,082,457 | | | $ | 293,344,612 | | | $ | 228,929,926 | | | $ | 174,399,936 | | | $ | 18,241,274 | |
| | | | | | | | | | | | | | | | | | | | | | | | |
U.S. Government Security Purchases: | | $ | — | | | $ | — | | | $ | — | | | $ | — | | | $ | — | | | $ | — | |
| | | | | | | | | | | | | | | | | | | | | | | | |
U.S. Government Security Sales: | | $ | 1,106,594 | | | $ | — | | | $ | — | | | $ | — | | | $ | — | | | $ | — | |
| | | | | | | | | | | | | | | | | | | | | | | | |
8. TRANSACTIONS WITH AFFILIATES*
The following issuers are affiliated with the Funds; that is, the Adviser had control of 5% or more of the outstanding voting securities during the period from November 1, 2017 through October 31, 2018. As defined in Section (2)(a)(3) of the Investment Company Act of 1940; such issues are:
| | | | | | | | | | | | | | | | | | | | | | | | | | | | | | | | | | | | | | | | | | | | | | | | |
| | | November 1, 2017 | | | Additions | | | Reductions | | | October 31,
2018 | | | Dividend
Income | | | Realized
Gain/(Loss) | | | Change in
Gross
Unrealized
Appreciation/
(Depreciation) | | | October 31, 2018 | |
Issuer Name | | Share
Balance | | | Cost | | | Share
Balance | | | Cost | | | Share
Balance | | | Cost | | | Share
Balance | | | Value | | | Cost | |
The Tocqueville Gold Fund | | | | | | | | | | | | | | | | | | | | | | | | | | | | | | | | | | | | | | | | | | | | | | | | |
Almaden Minerals Ltd.—Class B | | | 5,607,319 | | | $ | 5,045,196 | | | | 875,000 | | | $ | 685,388 | | | | (875,000 | ) | | $ | (1,073,235 | ) | | | 5,607,319 | | | $ | — | | | $ | (258,036 | ) | | $ | (2,452,151 | ) | | $ | 2,853,815 | | | $ | 4,657,349 | |
Almaden Minerals Ltd. Warrant | | | 740,741 | | | | — | | | | — | | | | — | | | | — | | | | — | | | | 740,741 | | | | — | | | | — | | | | (104,557 | ) | | | — | | | | — | |
Almaden Minerals Ltd. Warrant | | | 875,000 | | | | — | | | | — | | | | — | | | | (875,000 | ) | | | — | | | | — | | | | — | | | | — | | | | (211,883 | ) | | | — | | | | — | |
Almaden Minerals Ltd. Warrant | | | 79,585 | | | | — | | | | — | | | | — | | | | — | | | | — | | | | 79,585 | | | | — | | | | — | | | | (21,744 | ) | | | 1,143 | | | | — | |
Argonaut Gold, Inc. | | | 2,837,000 | | | | 12,710,613 | | | | — | | | | — | | | | — | | | | — | | | | 2,837,000 | | | | — | | | | — | | | | (2,343,797 | ) | | | 2,779,999 | | | | 12,710,613 | |
ATAC Resources Ltd. | | | 9,784,891 | | | | 31,231,836 | | | | — | | | | — | | | | — | | | | — | | | | 9,784,891 | | | | — | | | | — | | | | (1,345,553 | ) | | | 2,750,131 | | | | 31,231,836 | |
AuRico Metals, Inc.(a) | | | 7,411,437 | | | | 4,616,358 | | | | — | | | | — | | | | (7,411,437 | ) | | | (4,616,358 | ) | | | — | | | | — | | | | 5,632,300 | | | | (2,851,953 | ) | | | — | | | | — | |
Bear Creek Mining Corp. | | | 7,413,200 | | | | 28,761,181 | | | | — | | | | — | | | | — | | | | — | | | | 7,413,200 | | | | — | | | | — | | | | (3,997,189 | ) | | | 7,207,943 | | | | 28,761,181 | |
Contango ORE, Inc.(a) | | | 263,200 | | | | 5,000,800 | | | | — | | | | — | | | | — | | | | — | | | | 263,200 | | | | — | | | | — | | | | (13,160 | ) | | | 5,217,940 | | | | 5,000,800 | |
Corvus Gold, Inc. | | | 3,226,901 | | | | 2,212,904 | | | | — | | | | — | | | | — | | | | — | | | | 3,226,901 | | | | — | | | | — | | | | 3,267,237 | | | | 6,379,583 | | | | 2,212,904 | |
Corvus Gold, Inc. | | | 13,030,000 | | | | 10,588,821 | | | | 548,000 | | | | 825,263 | | | | — | | | | — | | | | 13,578,000 | | | | — | | | | — | | | | 12,957,551 | | | | 26,508,805 | | | | 11,414,084 | |
Corvus Gold, Inc. | | | — | | | | — | | | | 1,739,130 | | | | 1,561,600 | | | | — | | | | — | | | | 1,739,130 | | | | — | | | | — | | | | 1,833,565 | | | | 3,395,164 | | | | 1,561,600 | |
East Asia Minerals Corp. | | | 13,290,993 | | | | 22,796,021 | | | | — | | | | — | | | | — | | | | — | | | | 13,290,993 | | | | — | | | | — | | | | (223,574 | ) | | | 858,168 | | | | 22,796,021 | |
East Asia Minerals Corp. Warrant | | | 976,493 | | | | — | | | | — | | | | — | | | | — | | | | — | | | | 976,493 | | | | — | | | | — | | | | — | | | | — | | | | — | |
East Asia Minerals Corp. Warrant | | | 3,321,250 | | | | — | | | | — | | | | — | | | | — | | | | — | | | | 3,321,250 | | | | — | | | | — | | | | (55,868 | ) | | | 214,445 | | | | — | |
East Asia Minerals Corp. Warrant | | | 4,617,560 | | | | — | | | | — | | | | — | | | | — | | | | — | | | | 4,617,560 | | | | — | | | | — | | | | (83,630 | ) | | | 291,831 | | | | — | |
Falco Resources Ltd. | | | 16,222,300 | | | | 11,973,054 | | | | — | | | | — | | | | — | | | | — | | | | 16,222,300 | | | | — | | | | — | | | | (8,569,554 | ) | | | 4,004,898 | | | | 11,973,054 | |
Falco Resources Ltd. Warrant | | | 7,000,000 | | | | — | | | | — | | | | — | | | | (7,000,000 | ) | | | — | | | | — | | | | — | | | | — | | | | (475,855 | ) | | | — | | | | — | |
GoGold Resources, Inc.(a) | | | 13,668,000 | | | | 17,067,345 | | | | 4,455,000 | | | | 5,552,910 | | | | (14,154,500 | ) | | | (17,685,880 | ) | | | 3,968,500 | | | | — | | | | (9,243,692 | ) | | | 8,285,741 | | | | 708,418 | | | | 4,934,375 | |
Gold Bullion International LLC | | | 5,000,000 | | | | 5,000,000 | | | | — | | | | — | | | | — | | | | — | | | | 5,000,000 | | | | — | | | | — | | | | — | | | | 6,893,000 | | | | 5,000,000 | |
International Tower Hill Mines Ltd. | | | 5,738,836 | | | | 20,953,121 | | | | — | | | | — | | | | — | | | | — | | | | 5,738,836 | | | | — | | | | — | | | | 286,368 | | | | 2,725,947 | | | | 20,953,121 | |
International Tower Hill Mines Ltd. | | | 20,331,298 | | | | 44,453,358 | | | | — | | | | — | | | | — | | | | — | | | | 20,331,298 | | | | — | | | | — | | | | (26,578,656 | ) | | | 9,266,420 | | | | 44,453,358 | |
Jaguar Mining, Inc. | | | 64,330,707 | | | | 8,127,887 | | | | — | | | | — | | | | — | | | | — | | | | 64,330,707 | | | | — | | | | — | | | | (5,939,073 | ) | | | 10,017,695 | | | | 8,127,887 | |
MAG Silver Corp. | | | 2,827,100 | | | | 31,221,184 | | | | — | | | | — | | | | (165,500 | ) | | | (1,684,478 | ) | | | 2,661,600 | | | | — | | | | 333,107 | | | | (9,308,883 | ) | | | 19,030,440 | | | | 29,536,706 | |
MAG Silver Corp. | | | — | | | | — | | | | 1,432,665 | | | | 15,000,003 | | | | — | | | | — | | | | 1,432,665 | | | | — | | | | — | | | | (4,704,882 | ) | | | 10,295,120 | | | | 15,000,003 | |
| | | | | | | | | | | | | | | | | | | | | | | | | | | | | | | | | | | | | | | | | | | | | | | | |
| | | November 1, 2017 | | | Additions | | | Reductions | | | October 31,
2018 | | | Dividend
Income | | | Realized
Gain/(Loss) | | | Change in
Gross
Unrealized
Appreciation/
(Depreciation) | | | October 31, 2018 | |
Issuer Name | | Share
Balance | | | Cost | | | Share
Balance | | | Cost | | | Share
Balance | | | Cost | | | Share
Balance | | | Value | | | Cost | |
Nickel Creek Platinum | | | 12,379,201 | | | $ | 2,544,342 | | | | — | | | $ | — | | | | — | | | $ | — | | | | 12,379,201 | | | $ | — | | | $ | — | | | $ | (1,739,688 | ) | | $ | 1,081,399 | | | $ | 2,544,342 | |
Nickel Creek Platinum Warrant | | | 6,189,601 | | | | — | | | | — | | | | — | | | | — | | | | — | | | | 6,189,601 | | | | — | | | | — | | | | (699,623 | ) | | | 193,241 | | | | — | |
NuLegacy Gold Corp. | | | 28,556,090 | | | | 6,158,205 | | | | — | | | | — | | | | — | | | | — | | | | 28,556,090 | | | | — | | | | — | | | | (296,666 | ) | | | 3,687,596 | | | | 6,158,205 | |
NuLegacy Gold Corp. Warrant | | | 9,020,590 | | | | — | | | | — | | | | — | | | | (9,020,590 | ) | | | — | | | | — | | | | — | | | | — | | | | (2,797 | ) | | | — | | | | — | |
Osisko Mining, Inc.(a) | | | 5,704,239 | | | | 14,650,796 | | | | 2,000,000 | | | | 6,732,118 | | | | — | | | | — | | | | 7,704,239 | | | | — | | | | — | | | | (7,750,808 | ) | | | 15,625,598 | | | | 21,382,914 | |
Osisko Mining, Inc.(a)(b) | | | 2,000,000 | | | | 6,732,118 | | | | — | | | | — | | | | (2,000,000 | ) | | | (6,732,118 | ) | | | — | | | | — | | | | — | | | | — | | | | — | | | | — | |
Premier Gold Mines Ltd. | | | 9,643,160 | | | | 18,374,832 | | | | — | | | | — | | | | (1,013,000 | ) | | | (2,592,311 | ) | | | 8,630,160 | | | | — | | | | 264,709 | | | | (11,770,356 | ) | | | 11,275,685 | | | | 15,782,521 | |
SEMAFO, Inc. | | | 11,467,000 | | | | 43,362,142 | | | | — | | | | — | | | | (167,000 | ) | | | (245,313 | ) | | | 11,300,000 | | | | — | | | | 265,768 | | | | (3,399,456 | ) | | | 24,634,000 | | | | 43,116,829 | |
Strategic Metals Ltd. | | | 10,113,400 | | | | 14,557,309 | | | | — | | | | — | | | | — | | | | — | | | | 10,113,400 | | | | — | | | | — | | | | (798,861 | ) | | | 2,650,403 | | | | 14,557,309 | |
Tocqueville Bullion Reserve LP—Class G(c) | | | 13,806 | | | | 25,000,000 | | | | — | | | | — | | | | — | | | | — | | | | 13,806 | | | | — | | | | — | | | | (865,012 | ) | | | 16,113,165 | | | | 25,000,000 | |
Torex Gold Resources, Inc.(a) | | | 2,366,950 | | | | 34,206,758 | | | | 81,100 | | | | 803,647 | | | | (769,950 | ) | | | (14,952,225 | ) | | | 1,678,100 | | | | — | | | | (7,905,551 | ) | | | (3,206,938 | ) | | | 15,283,846 | | | | 20,058,180 | |
Trifecta Gold Ltd. | | | 2,325,199 | | | | — | | | | — | | | | — | | | | — | | | | — | | | | 2,325,199 | | | | — | | | | — | | | | (123,913 | ) | | | 110,392 | | | | — | |
| | | | | | | | | | | | | | | | | | | | | | | | | | | | | | | | | | | | | | | | | | | | | | | | |
| | | | | | $ | 427,346,181 | | | | | | | $ | 31,160,929 | | | | | | | $ | (49,581,918 | ) | | | | | | $ | — | | | $ | (10,911,395 | ) | | $ | (73,305,618 | ) | | $ | 212,056,230 | | | $ | 408,925,192 | |
The Delafield Fund | | | | | | | | | | | | | | | | | | | | | | | | | | | | | | | | | | | | | | | | | | | | | | | | |
Real Industry, Inc.(a) | | | 225,000 | | | | 1,102,089 | | | | — | | | | — | | | | (225,000 | ) | | | (1,102,089 | ) | | | — | | | | — | | | | (1,023,642 | ) | | | 708,338 | | | | — | | | | — | |
Xerium Technologies, Inc.(a) | | | 700,000 | | | | 9,534,818 | | | | — | | | | — | | | | (700,000 | ) | | | (9,534,818 | ) | | | — | | | | — | | | | (1,590,889 | ) | | | 6,244,818 | | | | — | | | | — | |
| | | | | | | | | | | | | | | | | | | | | | | | | | | | | | | | | | | | | | | | | | | | | | | | |
| | | | | | $ | 10,636,907 | | | | | | | $ | — | | | | | | | $ | (10,636,907 | ) | | | | | | $ | — | | | $ | (2,614,531 | ) | | $ | 6,953,156 | | | $ | — | | | $ | — | |
The Tocqueville Select Fund | | | | | | | | | | | | | | | | | | | | | | | | | | | | | | | | | | | | | | | | | | | | | | | | |
Real Industry, Inc.(a) | | | 890,281 | | | | 3,561,317 | | | | — | | | | — | | | | (890,281 | ) | | | (3,561,317 | ) | | | — | | | | — | | | | (3,250,727 | ) | | | 2,003,325 | | | | — | | | | — | |
Xerium Technologies, Inc.(a) | | | 265,000 | | | | 3,374,608 | | | | — | | | | — | | | | (265,000 | ) | | | (3,374,608 | ) | | | — | | | | — | | | | (734,617 | ) | | | 2,129,108 | | | | — | | | | — | |
| | | | | | | | | | | | | | | | | | | | | | | | | | | | | | | | | | | | | | | | | | | | | | | | |
| | | | | | $ | 6,935,925 | | | | | | | $ | — | | | | | | | $ | (6,935,925 | ) | | | | | | $ | — | | | $ | (3,985,344 | ) | | $ | 4,132,433 | | | $ | — | | | $ | — | |
| * | All affiliates listed are neither majority-owned subsidiaries or other controlled companies. |
| (a) | Security is no longer an affiliated company at October 31, 2018. |
| (b) | Private security restrictions lifted during period and combined with other non restricted securities |
| (c) | Tocqueville Bullion Reserve (“TBR”) is a Delaware Limited Partnership created for the purpose of owning physical gold. The General Partner of TBR is TERA Management LLC (“Tera”), a Delaware Limited Liability Company, which is equally owned and managed by Tocqueville Partners II LLC (“TP2”), a Delaware Limited Liability Company, and Eidesis Real Assets LLC (“Eidesis”), a Delaware Limited Liability Company. The Managing Member of TP2 is Robert Kleinschmidt, President of the Trust, who has a 51% participating percentage in TP2 and the sole Non-Managing Member is John Hathaway, co-portfolio manager of the Tocqueville Gold Fund, who has a 49% participating percentage. |
9. LINE OF CREDIT
The Tocqueville Trust has a $300,000,000 line of credit (the “Line”), which is uncommitted, with U.S. Bank NA. The Line is for temporary emergency or extraordinary purposes, including the meeting of redemption requests that otherwise might require the untimely disposition of securities. The Line is secured by the Trust’s assets. The Line has a one year term and is reviewed annually by the Board of Trustees. The current agreement runs through May 25, 2019. The interest rate as of October 31, 2018 was 4.75%. During the year ended October 31, 2018, the Tocqueville Fund’s maximum borrowing was $4,132,000 and average borrowing was $130,877, the Opportunity Fund’s maximum borrowing was $2,592,000 and average borrowing was $291,032, and the Gold Fund’s maximum borrowing was $14,418,000 and average borrowing was $400,107. This borrowing resulted in interest expenses of $5,364, $12,740 and $14,649, respectively. The International Value Fund, The Delafield Fund and The Select Fund did not use the Line.
10. OTHER EXPENSES
Other expenses include reimbursement to the Adviser for compensation of the Trust’s Chief Compliance Officer. For the year ended October 31, 2018, reimbursement to the Adviser for compensation of the Trust’s Chief Compliance Officer from the Funds amounted to $14,520, $4,375, $62,351, $51,028, $15,487, $2,239 for the Tocqueville Fund, Opportunity Fund, International Value Fund, Gold Fund, Delafield Fund, and Select Fund respectively.
The Tocqueville Trust
Report of Independent Registered Public Accounting Firm
To the Shareholders and Board of Trustees of
The Tocqueville Trust
Opinion on the Financial Statements
We have audited the accompanying statements of assets and liabilities, including the schedules of investments of the Tocqueville Trust, comprised of The Tocqueville Fund, The Tocqueville Opportunity Fund, The Tocqueville International Value Fund, The Tocqueville Gold Fund, The Delafield Fund, and The Tocqueville Select Fund (collectively, the “Funds”) as of October 31, 2018, and the related statements of operations for the year then ended, statements of changes in net assets for the two years in the period then ended, and the financial highlights for each of the five years in the period then ended, and the related notes (collectively referred to as the financial statements). In our opinion, the financial statements present fairly, in all material respects, the financial position of the Funds as of October 31, 2018, and the results of operations for the year then ended, the changes in net assets for the two years in the period then ended, and the financial highlights for each of the five years in the period then ended, in conformity with accounting principles generally accepted in the United States of America.
Basis for Opinion
These financial statements are the responsibility of the Funds’ management. Our responsibility is to express an opinion on the Funds’ financial statements based on our audits. We are a public accounting firm registered with the Public Company Accounting Oversight Board (United States) (“PCAOB”) and are required to be independent with respect to the Funds in accordance with the U.S. federal securities laws and the applicable rules and regulations of the Securities and Exchange Commission and the PCAOB.
We conducted our audits in accordance with the standards of the PCAOB. Those standards require that we plan and perform the audits to obtain reasonable assurance about whether the financial statements are free of material misstatement, whether due to error or fraud. The Funds are not required to have, nor were we engaged to perform, an audit of its internal control over financial reporting. As part of our audits we are required to obtain an understanding of internal control over financial reporting but not for the purpose of expressing an opinion on the effectiveness of the Funds’ internal control over financial reporting. Accordingly, we express no such opinion.
Our audits included performing procedures to assess the risks of material misstatement of the financial statements, whether due to error or fraud, and performing procedures that respond to those risks. Such procedures included examining, on a test
basis, evidence supporting the amounts and disclosures in the financial statements. Our audits also included evaluating the accounting principles used and significant estimates made by management, as well as evaluating the overall presentation of the financial statements. Our procedures included confirmation of securities owned as of October 31, 2018, by correspondence with custodians and brokers, or by other appropriate auditing procedures where replies form brokers were not received. We believe that our audits provide a reasonable basis for our opinion.
/s/ GRANT THORNTON LLP
We have served as the Funds’ auditor since 2006.
Chicago, IL
December 21, 2018
ADDITIONAL INFORMATION (UNAUDITED)
1. ADDITIONAL DISCLOSURE REGARDING FUND TRUSTEES AND OFFICERS
Independent Trustees
| | | | | | | | | | | | |
Name and Age | | Position(s) Held
with the Trust | | Term of Office
and Length of
Time Served (1) | | Principal Occupation(s) During Past Five Years | | Number of Funds
in Fund Complex
Overseen By Trustee | | | Other Directorships Held by Trustee |
| | | | | |
Charles W. Caulkins Year of Birth: 1956 | | Trustee; Member of Audit Committee; Member of Governance and Nominating Committee | | Indefinite Term, Since 2003 | | Private Investor dba Plan B Partners from January 2012 – present. | | | 6 | | | None |
| | | | | |
Alexander Douglas Year of Birth: 1947 | | Trustee; Member of Audit Committee; Member of Governance and Nominating Committee | | Indefinite Term, Since 2010 | | Retired. Formerly, President, CEO and owner of Spaulding Law Printing, Inc. from 1992 to November 2014. | | | 6 | | | None |
ADDITIONAL INFORMATION (UNAUDITED)
Independent Trustees
| | | | | | | | | | | | |
Name and Age | | Position(s) Held
with the Trust | | Term of Office
and Length of
Time Served (1) | | Principal Occupation(s) During Past Five Years | | Number of Funds
in Fund Complex
Overseen By Trustee | | | Other Directorships Held by Trustee |
| | | | | |
Charles F. Gauvin Year of Birth: 1956 | | Trustee; Member of Audit Committee; Member of Governance and Nominating Committee | | Indefinite Term, Since February 2015 | | Chief Development Officer, Woods Hole Oceanographic Institution, from February 2016 – present; Executive Director, Maine Audubon, from August 2014 – January 2016; Chief Development Officer, Carnegie Endowment for International Peace, from September 2011 – May 2014; Partner, The Riparian Fund/Legacy Ranch Partners (private equity real estate fund), from February 2010 – December 2012. | | | 6 | | | Director, Bioqual, Inc., July 1992 – present. |
| | | | | |
James W. Gerard Year of Birth: 1961 | | Trustee; Member of Audit Committee; Member of Governance and Nominating Committee | | Indefinite Term, Since 2001 | | Managing Director, Hycroft Advisors, from January 2010-present; Managing Director, deVisscher & Co., LLC from January 2013 to present; The Chart Group from January 2001 to present. | | | 6 | | | President, American Overseas Memorial Day Association, 1998 to present; Trustee, Salisbury School, 2005 to present; Director, American Friends of Bleraucourt, 1992 to present; President, Little Baby Face Foundation, March 2015 to present. |
ADDITIONAL INFORMATION (UNAUDITED)
Independent Trustees
| | | | | | | | | | | | |
Name and Age | | Position(s) Held
with the Trust | | Term of Office
and Length of
Time Served (1) | | Principal Occupation(s) During Past Five Years | | Number of Funds
in Fund Complex
Overseen By Trustee | | | Other Directorships Held by Trustee |
| | | | | |
William F. Indoe Year of Birth: 1942 | | Trustee; Member of Audit Committee; Member of Governance and Nominating Committee | | Indefinite Term, Since December 2006 | | Retired. Formerly, Sullivan & Cromwell LLP (attorneys-at-law). 1968 – 2011. | | | 6 | | | Director, Rho Capital Partners, Inc. |
| | | | | |
William J. Nolan III Year of Birth: 1947 | | Trustee; Chair of Audit Committee; Member of Governance and Nominating Committee | | Indefinite Term, Since December 2006 | | Retired. Executive Vice President & Treasurer PaineWebber Inc. 1997 – 2001. | | | 6 | | | Trustee, Adirondack Museum, Blue Mt. Lake, NY 1996 to present (Treasurer, 2000 to 2013; Executive Committee, 2000 – present). |
ADDITIONAL INFORMATION (UNAUDITED)
Interested Trustees(2) and Officers
| | | | | | | | | | |
Name and Age | | Position(s) Held
with the Trust | | Term of Office
and Length of
Time Served (1) | | Principal Occupation(s) During Past Five Years | | Number of Funds
in Fund Complex
Overseen By Trustee | | Other Directorships Held by Trustee |
| | | | | |
Helen Balk Year of Birth:1972 | | Treasurer | | Indefinite Term, Since 2014 | | Controller / Treasurer of Tocqueville Asset Management from January 2014 to present; Manager / Staff Accountant at Pegg & Pegg LLP from August 1995 to January 2014. | | N/A | | N/A |
| | | | | |
Stephan Yevak Year of Birth: 1959 | | Anti-Money Laundering Compliance Officer | | Indefinite Term, Since 2018 | | Deputy Chief Compliance Officer, Tocqueville Securities, L.P. (August 2011 to present); Deputy Chief Compliance Officer, Tocqueville Asset Management (August 2011 to present). Anti-Money Laundering Compliance Officer to both entities (March 2018 to present) | | N/A
| | N/A |
| | | | | |
Robert W. Kleinschmidt Year of Birth: 1949 | | Chairman, President, and Trustee | | Indefinite Term, Chairman Since 2016, and President and Trustee Since 1991 | | President and Chief Investment Officer of Tocqueville Asset Management; Director, Tocqueville Management Corporation, the General Partner of Tocqueville Asset Management L.P. and Tocqueville Securities L.P. from January 1994 to present. | | 6 | | President and Director, Tocqueville Management Corporation, the General Partner of Tocqueville Asset Management L.P. and Tocqueville Securities L.P. |
| | | | | |
Cleo Kotis Year of Birth: 1975 | | Secretary | | Indefinite Term, Since 2010 | | Director of Operations, the Delafield Group of Tocqueville Asset Management L.P., 2009 to present. | | N/A | | N/A |
| | | | | |
Thomas Pandick Year of Birth: 1947 | | Chief Compliance Officer | | Indefinite Term, Since 2004 | | Chief Compliance Officer (October 2004 –present) Tocqueville Asset Management L.P. | | N/A | | N/A |
| (1) | Each Trustee will hold office for an indefinite term until the earliest of (i) the next meeting of shareholders, if any, called for the purpose of considering the election or re-election of such Trustee and until the election and qualification of his or her successor, if any, elected at such meeting, or (ii) the date a Trustee resigns or retires, or a Trustee is removed by the Board of Trustees or shareholders, in accordance with the Trust’s By-Laws, as amended, and Agreement and Declaration of Trust, as amended. Each officer will hold office for an indefinite term until the date he or she resigns or retires or until his or her successor is elected and qualifies. |
| (2) | “Interested person” of the Trust as defined in the 1940 Act. Mr. Kleinschmidt is considered “interested person” because of his affiliation with the Advisor. |
The Statement of Additional Information includes additional information about the Trustees and is available free of charge by calling the Funds toll free at 1-800-355-7307.
2. INVESTMENT ADVISORY AGREEMENT DISCLOSURE
In determining whether to approve the continuance of the Investment Advisory Agreement and the Administration Agreement with respect to the Tocqueville Fund, the Opportunity Fund, the International Value Fund, the Gold Fund, the Delafield Fund, and the Select Fund, the Trustees, including the Independent Trustees, considered the following information:
1) The nature, extent and quality of services provided by the Adviser.
The Trustees reviewed in detail the nature and extent of the services provided by the Adviser under the terms of the Investment Advisory Agreements and the quality of those services provided to Funds over the past year. The Trustees noted that the services under the Investment Advisory Agreements include: managing the investment and reinvestment of the Funds’ assets; supervising and managing all aspects of the Funds’ operations; and providing the Board on a regular basis with financial reports and analyses on the Funds’ operations and the operations of comparable investment companies. The Trustees also observed that the Adviser provides various administrative services to the Funds pursuant to the terms of the Administration Agreement and considered the nature, extent and quality of services provided under that agreement as well. The Trustees evaluated these factors based on their direct experience with the Adviser and in consultation with counsel. The Trustees concluded that the nature and extent of the services provided under the Investment Advisory Agreements and the Administration Agreement were reasonable and appropriate in relation to the advisory fee and administration fee, respectively, that the level of services provided by the Adviser to the Funds had not diminished over the past year and that the quality of services continues to be high. The Trustees reviewed the personnel responsible for providing advisory and administrative services to the Funds and concluded, based on their experience and interaction with the Adviser, that (i) the Adviser was able to retain quality portfolio managers and other personnel; (ii) the Adviser exhibited a high level of diligence and attention to detail in carrying out its advisory and administrative responsibilities under the Investment Advisory Agreements and Administration Agreement, respectively, for the Funds; (iii) the Adviser was responsive to requests of the Trustees; and (iv) the Adviser had kept the Trustees apprised of developments relating to the Funds and the industry in general. The Trustees also focused on the Adviser’s reputation and long-standing relationship with the Trust.
In connection with its assessment of the performance of the Adviser, the Trustees reviewed the Adviser’s financial statements and considered the Adviser’s financial condition and whether it has the resources necessary to continue to carry out its obligations under the Investment Advisory Agreements and the Administration Agreement. The Trustees concluded that the Adviser has the financial resources necessary to continue to perform its obligations under the Investment Advisory Agreements and the Administration Agreement and to continue to provide the high quality services that it has provided to the Funds to date.
2) The performance of the Funds and the Adviser.
The Trustees reviewed the investment performance of the Funds, both on an absolute basis and as compared to a peer group for each respective Fund for the one-year, three-year, five-year and ten-year periods, ended July 31, 2018. The peer groups were comprised of other funds that had similar investment objectives and sales load structures, as determined by Morningstar: The Morningstar Large Blend Funds peer group, with total net assets between $236 million and $384 million, for The Tocqueville Fund; the Morningstar Mid-Cap Growth Funds peer group, with total net assets between $49 million and $128 million, for The Tocqueville Opportunity Fund; the Morningstar Foreign Large Blend Funds peer group, with total net assets between $916 million and $1.6 billion, for The Tocqueville International Value Fund; the Morningstar Precious Metals Funds peer group, with total net assets between $319 million and 2.2 billion for The Tocqueville Gold Fund; the Morningstar Mid-Cap Value Funds peer group, with total net assets between $209 million and $418 million, for The Delafield Fund; and the Morningstar Small Value Funds peer group, with total net assets between $31 million and $98 million, for The Tocqueville Select Fund (the “Performance Peer Groups”). The Trustees considered that the performance information for The Delafield Fund and The Tocqueville Select Fund includes the performance information of their respective predecessor funds, which had different investment advisers, but the Trustees considered this information since these Funds have substantially the same portfolio management team.
The Trustees also compared each Fund’s investment performance against its benchmark market indices: the S&P 500 Index for The Tocqueville Fund; the Russell 2500 Growth Index for The Tocqueville Opportunity Fund; the Morgan Stanley EAFE Index for The Tocqueville International Value Fund; the S&P 500 Index and the Philadelphia Stock Exchange Gold & Silver Index for The Tocqueville Gold Fund; the S&P 500 Index and the Russell 2000 Index for The Delafield Fund; the Russell 2500 Index and the Russell 2000 Index for The Tocqueville Select Fund (the “Indices”) for the one-year, three-year, five-year and ten-year periods ended July 31, 2018 for all the Funds. The Trustees considered the above information as helpful in their assessment of whether the Adviser was obtaining for the Funds’ shareholders the performance that was available in the marketplace given each Fund’s investment objectives, policies, strategies, limitations and restrictions. The Trustees concluded that the performance of the Funds against their respective Performance Peer Groups was satisfactory. In particular, the Trustees noted that The Tocqueville Fund had underperformed as compared to its Index for all periods and underperformed the median of its Performance Peer Group for all periods. The Trustees noted that The Tocqueville Opportunity Fund outperformed its Index for the one-year, and five-year periods; underperformed its Index for the three-year and ten-year periods; and outperformed the median of its Performance Peer Group for the one-year, five-year, and ten-year periods and underperformed the median of its Performance Peer Group for the three-year period. The Trustees noted that The Tocqueville International Value Fund outperformed its Index for the three-year, five-year and ten-year periods; underperformed its Index for the one-year period; outperformed the median of its
Performance Peer Group for the three-year, five-year and ten-year periods; and underperformed the median of its Performance Peer Group for the one-year period. The Trustees noted that The Tocqueville Gold Fund underperformed both of its Indices for all periods; and underperformed the median of its Performance Peer Group for all periods. The Trustees noted that The Delafield Fund underperformed both of its Indices for all periods; and underperformed the median of its Performance Peer Group for all periods. The Trustees noted that The Tocqueville Select Fund underperformed both of its Indices for all periods; underperformed the median of its Performance Peer Group for the three-year, five-year, and ten-year periods; and outperformed the for the one-year period. The Trustees questioned Mr. Kleinschmidt, in particular, about the underperformance of The Delafield Fund and The Tocqueville Select Fund. He noted that these periods were challenging for the value style of investing used by The Delafield Fund and The Tocqueville Select Fund and, as a result, caused them to trail relevant indices.
3) The cost of the advisory services and the profits to the Adviser from the relationship with the Trust.
In connection with the Trustee’s consideration of the level of the advisory fees, the Trustees considered a number of factors. The Trustees compared the level of the advisory fees for each Fund against the advisory fees charged by funds in a universe of funds: the Morningstar Large Cap Funds peer group, with average net assets between $236 million and $384 million, for The Tocqueville Fund; the Morningstar Mid-Cap Growth Funds peer group, with average net assets between $49 million and $128 million, for The Tocqueville Opportunity Fund; the Morningstar Foreign Large Blend Funds peer group, with average net assets between $916 million and $1.6 billion, for The Tocqueville International Value Fund; all funds in the Morningstar Precious Metals Funds peer group, with average net assets between $319 million and 2.2 billion, for The Tocqueville Gold Fund; the Morningstar Mid-Cap Value Funds peer group, with average net assets between $209 million and $418 million, for The Delafield Fund; and the Morningstar Small Value Funds peer group, with average net assets between $31 million and $98 million, for The Tocqueville Select Fund (the “Expense Peer Groups”). The Trustees considered comparative total fund expenses of the Funds and the Expense Peer Groups. The Trustees used this comparative fee information and total expense data as a guide to help assess the reasonableness of each Fund’s advisory fee, although they acknowledged that it was difficult to make precise comparisons with other funds since the exact nature of services provided under each Expense Peer Group fund agreement is often not apparent. The Trustees also viewed the Expense Peer Group fee information as a whole as useful in assessing whether the Adviser was providing services at a cost that was competitive with other, similar funds.
The Trustees noted that the contract rate advisory fee and administration fee for each of the Funds were reasonable, despite the contractual advisory fee rate being above average for The Tocqueville Fund, The Tocqueville International Value Fund, and The Tocqueville Gold Fund and the administration fee being above average for The Tocqueville Opportunity Fund, The Tocqueville International Fund, and The Delafield
Fund when compared to their respective Expense Peer Groups. The Trustees also considered the combined contract rate advisory and administration fee as compared to their respective Expense Peer Group. The Board further observed that the total expense ratios of the Funds were also reasonable. The Board noted that the total expense ratio for The Tocqueville Fund, The Tocqueville International Value Fund, The Tocqueville Gold Fund and The Delafield Fund was above average, when compared to their respective Expense Peer Groups and that the total expense ratio for The Tocqueville Opportunity Fund and the Tocqueville Select Fund was below average, when compared to its respective Expense Peer Group. The Board also noted that the Funds each operate pursuant to an Expense Limitation Agreement whereby the Adviser has agreed to waive a portion of its fee necessary to limit the Fund’s total operating expenses to the level set forth in the Fund’s prospectus.
The Trustees also considered the profitability to the Adviser and its affiliate arising out of its relationship with the Trust. In this regard, the Trustees reviewed profitability data relating to the Adviser for the 12 month period ended July 31, 2018. The Trustees considered revenues received by the Adviser under the Investment Advisory Agreements and the Administration Agreement as well as revenues received by the Adviser’s affiliate, the Distributor, under the 12b-1 plans and Related Agreements and commissions received for effecting portfolio transactions. The Trustees also received and reviewed the Adviser’s financial statements and the Adviser provided an oral update on its profitability numbers since October 31, 2015. The Trustees concluded that the profitability of the Funds to the Adviser was not excessive.
4) The extent to which economies of scale will be realized as the Funds grow and whether fee levels reflect those economies of scale.
With respect to the Trustees’ consideration of economies of scale, the Trustees discussed with the Adviser whether economies of scale would be realized by it in its management of a Fund at higher asset levels. The Trustees noted that all of the Funds, except for The Tocqueville Select Fund, currently have advisory fee breakpoints and that they were satisfied that the current breakpoints were appropriate when compared with each Fund’s respective Peer Group. The Trustees considered that breakpoints are not necessary at this time for The Tocqueville Select Fund, given the small size of The Tocqueville Select Fund. The Trustees also noted that the administration fee also has breakpoints. In the event there was significant asset growth in the future in a Fund, the Trustee’s determined to reassess whether the advisory fees and administration fee, including the current breakpoint structure, appropriately took into account any economies of scale that had been realized as a result of that growth.
5) Other Factors.
The Trustees also discussed the Adviser’s practices regarding the selection and compensation of brokers and dealers that execute portfolio transactions for the Funds and the brokers’ and dealers’ provision of brokerage and research services to the Adviser. The Trustees further discussed the potential benefits the Adviser derived from the Funds’ soft
dollar arrangements, whereby brokers provide research to the Funds or the Adviser in return for allocating fund brokerage, and other investment data concerning soft dollars. The Board also discussed the Adviser’s use of an affiliated broker to effect portfolio transactions, noting that in addition to paying a competitive rate on commissions, the Adviser believed the Funds received better execution on trades.
Based on a consideration of all these factors in their totality, the Trustees, including all of the Independent Trustees, determined that the Funds’ advisory fees and administration fees were fair and reasonable with respect to the quality of services that the Adviser provides and in light of the other factors described above that the Trustees deemed relevant. The Trustees based their decision on evaluations of all these factors as a whole and did not consider any one factor as all-important or controlling.
3. PROXY VOTING POLICIES AND PROCEDURES
A description of the policies and procedures that The Tocqueville Trust uses to determine how to vote proxies relating to portfolio securities is available without charge upon request by calling 1-800-355-7307. Information regarding how The Tocqueville Trust voted proxies relating to portfolio securities during the most recent 12-month period ended June 30 is available by calling 1-800-355-7307 and it is also available on the SEC’s web site at http://www.sec.gov.
4. SHAREHOLDER REPORTS AND QUARTERLY PORTFOLIO DISCLOSURE
The Tocqueville Trust is required to file its complete schedule of portfolio holdings with the SEC for its first and third fiscal quarters on Form N-Q. The Trust’s Form N-Q will be available without charge, upon request on the SEC’s website (http://www.sec.gov) and may be available by calling 1-800-697-3863. You can also obtain copies of Form N-Q by (i) visiting the SEC’s Public Reference Room in Washington, DC (information on the operation of the Public Reference Room may be obtained by calling 1-202-551-8090); (ii) sending your request and a duplicating fee to the SEC’s Public Reference Room, Washington, DC 20549-1520; or (iii) sending your request electronically to publicinfosec.gov. Quarterly portfolio holdings are also available on the website of The Tocqueville Funds, www.tocquevillefunds.com.
5. SHAREHOLDER NOTIFICATION OF FEDERAL TAX STATUS
For the fiscal year ended October 31, 2018, certain dividends paid by the Funds may be subject to a maximum tax rate of 15%, as provided for by the Jobs and Growth Tax Relief Reconciliation Act of 2003. The percentage of dividends declared from ordinary income designated as qualified dividend income was as follows:
| | | | |
Tocqueville Fund | | | 100.00 | % |
Opportunity Fund | | | 0.00 | % |
International Value Fund | | | 100.00 | % |
Gold Fund | | | 0.00 | % |
Delafield Fund | | | 100.00 | % |
Select Fund | | | 0.00 | % |
For corporate shareholders, the percent of ordinary income distributions qualifying for the corporate dividends received deduction for the fiscal year ended October 31, 2018 was as follows:
| | | | |
Tocqueville Fund | | | 100.00 | % |
Opportunity Fund | | | 0.00 | % |
International Value Fund | | | 3.12 | % |
Gold Fund | | | 0.00 | % |
Delafield Fund | | | 100.00 | % |
Select Fund | | | 0.00 | % |
For the year ended October 31, 2018, the funds designate the following percent of ordinary distributions paid as interest-related dividends under the Internal Revenue Code Section 871(k)(1)(c):
| | | | |
Tocqueville Fund | | | 0.08 | % |
Opportunity Fund | | | 0.00 | % |
International Value Fund | | | 1.49 | % |
Gold Fund | | | 0.00 | % |
Delafield Fund | | | 3.95 | % |
Select Fund | | | 0.00 | % |
The percentage of taxable ordinary income distributions that are designated as short-term capital gain distributions under Internal Revenue Section 871(k)(2)(C) for each Fund were as follows.
| | | | |
Tocqueville Fund | | | 0.00 | % |
Opportunity Fund | | | 0.00 | % |
International Value Fund | | | 0.00 | % |
Gold Fund | | | 0.00 | % |
Delafield Fund | | | 100.00 | % |
Select Fund | | | 0.00 | % |
6. FOREIGN TAX CREDIT
For the year ended October 31, 2018, the Tocqueville International Value Fund earned foreign source income and paid foreign taxes which they intend to pass through to their shareholders pursuant to Section 853 of the Internal Revenue Code as follows:
| | | | | | | | |
Country | | Gross Dividend
Per Share | | | Taxes Withheld
Per Share | |
Australia | | | 0.01791364 | | | | — | |
Belgium | | | 0.01349822 | | | | 0.00202 | |
Brazil | | | 0.02177505 | | | | 0.00115 | |
Canada | | | 0.00833828 | | | | 0.00125 | |
Switzerland | | | 0.03208469 | | | | 0.00209 | |
Germany | | | 0.03581226 | | | | 0.00477 | |
Great Britain | | | 0.08357060 | | | | — | |
Denmark | | | 0.01454275 | | | | 0.00218 | |
France | | | 0.06944376 | | | | 0.01058 | |
Hong Kong | | | 0.00709538 | | | | — | |
Ireland | | | 0.00958534 | | | | — | |
Spain | | | 0.01762870 | | | | 0.00264 | |
Finland | | | 0.01095473 | | | | 0.00164 | |
Japan | | | 0.06742325 | | | | 0.00674 | |
South Korea | | | 0.02128126 | | | | 0.00437 | |
Sweden | | | 0.00435987 | | | | 0.00065 | |
Netherlands | | | 0.02888018 | | | | 0.00433 | |
Netherlands Antilles | | | 0.01217581 | | | | — | |
Mexico | | | 0.00378395 | | | | 0.00114 | |
| | | | | | | | |
| | | 0.48015 | | | | 0.04557 | |
| | | | | | | | |
Investment Adviser
Tocqueville Asset Management L.P.
40 W. 57th St., 19th Floor
New York, NY 10019
(212) 698-0800
www.tocqueville.com
Distributor
Tocqueville Securities, L.P.
40 W. 57th St., 19th Floor
New York, NY 10019
(212) 698-0800
Shareholders’ Servicing and Transfer Agent
U.S. Bancorp Fund Services, LLC,
doing business as U.S. Bank Global Fund Services
P.O. Box 701
Milwaukee, WI 53201-0701
(800) 697-3863
Custodian
U.S. Bank, N.A.
Custody Operations
1555 River Center Drive, Suite 302
Milwaukee, WI 53212
Board of Trustees
Robert W. Kleinschmidt—Chairman
Charles W. Caulkins
Alexander Douglas
Charles F. Gauvin
James W. Gerard
William F. Indoe
William J. Nolan III
Independent Registered Public Accounting Firm
Grant Thornton LLP
171 North Clark St., Suite 200
Chicago, IL 60601
Tocqueville Funds
c/o US Bancorp Fund Services, LLC
P.O. Box 701
Milwaukee, WI 53201-0701
www.tocquevillefunds.com
TQ-ANNUAL Tocqueville Annual Report 10/31/2018
Item 2. Code of Ethics.
The registrant has adopted a code of ethics that applies to the registrant’s principal executive officer and principal financial officer. The registrant has not made any substantive amendments to its code of ethics during the period covered by this report. The registrant has not granted any waivers from any provisions of the code of ethics during the period covered by this report.
Incorporated by reference to the Registrant’s Form N-CSR filed December 30, 2015.
Item 3. Audit Committee Financial Expert.
The registrant’s board of trustees has determined that there is at least one audit committee financial expert serving on its audit committee. James Gerard and William Nolan III are the “audit committee financial experts” and are considered to be “independent” as each term is defined in Item 3 of Form N-CSR.
Item 4. Principal Accountant Fees and Services.
The registrant has engaged its principal accountant to perform audit services, audit-related services, tax services and other services during the past two fiscal years. “Audit services” refer to performing an audit of the registrant’s annual financial statements or services that are normally provided by the accountant in connection with statutory and regulatory filings or engagements for those fiscal years. “Audit-related services” refer to the assurance and related services by the principal accountant that are reasonably related to the performance of the audit. “Tax services” refer to professional services rendered by the principal accountant for tax compliance, tax advice, and tax planning. “Other services” were not provided by the principal accountant. The following table details the aggregate fees billed or expected to be billed for each of the last two fiscal years for audit fees, audit-related fees, tax fees and other fees by the principal accountant.
| | | | | | | | |
| | | FYE
10/31/2018 | | | FYE
10/31/2017 | |
Audit Fees | | | 191,100 | | | | 198,000 | |
Audit-Related Fees | | | 0 | | | | 0 | |
Tax Fees | | | 28,620 | | | | 27,030 | |
All Other Fees | | | 0 | | | | 0 | |
The audit committee has adopted pre-approval policies and procedures that require the audit committee to pre-approve all audit and non-audit services of the registrant, including services provided to any entity affiliated with the registrant.
The percentage of fees billed by Grant Thornton applicable to non-audit services pursuant to waiver of pre-approval requirement were as follows:
| | | | | | | | |
| | | FYE
10/31/2018 | | | FYE
10/31/2017 | |
Audit-Related Fees | | | 0 | % | | | 0 | % |
Tax Fees | | | 0 | % | | | 0 | % |
All Other Fees | | | 0 | % | | | 0 | % |
All of the principal accountant’s hours spent on auditing the registrant’s financial statements were attributed to work performed by full-time permanent employees of the principal accountant.
The following table indicates the non-audit fees billed or expected to be billed by the registrant’s accountant for services to the registrant and to the registrant’s investment adviser (and any other controlling entity, etc.—not sub-adviser) for the last two years. The audit committee of the board of trustees/directors has considered whether the provision of non-audit services that were rendered to the registrant’s investment adviser is compatible with maintaining the principal accountant’s independence and has concluded that the provision of such non-audit services by the accountant has not compromised the accountant’s independence.
| | | | | | | | |
Non-Audit Related Fees | | FYE
10/31/2018 | | | FYE
10/31/2017 | |
Registrant | | | 28,620 | | | | 27,030 | |
Registrant’s Investment Adviser | | | 0 | | | | 0 | |
Item 5. Audit Committee of Listed Registrants.
Not applicable to registrants who are not listed issuers (as defined in Rule 10A-3 under the Securities Exchange Act of 1934).
Item 6. Investments.
Schedule of Investments is included as part of the report to shareholders filed under Item 1 of this Form.
Item 7. Disclosure of Proxy Voting Policies and Procedures for Closed-End Management Investment Companies.
Not applicable to open-end investment companies.
Item 8. Portfolio Managers of Closed-End Management Investment Companies.
Not applicable to open-end investment companies.
Item 9. Purchases of Equity Securities by Closed-End Management Investment Company and Affiliated Purchasers.
Not applicable to open-end investment companies.
Item 10. Submission of Matters to a Vote of Security Holders.
There have been no material changes to the procedures by which shareholders may recommend nominees to the registrant’s board of trustees.
Item 11. Controls and Procedures.
| (a) | The Registrant’s President and Treasurer have reviewed the Registrant’s disclosure controls and procedures (as defined in Rule 30a-3(c) under the Investment Company Act of 1940 (the “Act”)) as of a date within 90 days of the filing of this report, as required by Rule 30a-3(b) under the Act and Rules 13a-15(b) or 15d-15(b) under the Securities Exchange Act of 1934. Based on their review, such officers have concluded that the disclosure controls and procedures are effective in ensuring that information required to be disclosed in this report is appropriately recorded, processed, summarized and reported and made known to them by others within the Registrant and by the Registrant’s service provider. |
| (b) | There were no changes in the Registrant’s internal control over financial reporting (as defined in Rule 30a-3(d) under the Act) that occurred during the second fiscal quarter of the period covered by this report that has materially affected, or is reasonably likely to materially affect, the Registrant’s internal control over financial reporting. |
Item 12. Disclosure of Securities Lending Activities for Closed-End Management Investment Companies
Not applicable to open-end investment companies.
Item 13. Exhibits.
| (a) | (1) Any code of ethics or amendment thereto, that is the subject of the disclosure required by Item 2, to the extent that the registrant intends to satisfy Item 2 requirements through filing an exhibit. |
Incorporated by reference to the Registrant’s Form N-CSR filed December 30, 2015.
(2) A separate certification for each principal executive officer and principal financial officer pursuant to Section 302 of the Sarbanes-Oxley Act of 2002. Filed herewith.
(3) Any written solicitation to purchase securities under Rule 23c-1 under the Act sent or given during the period covered by the report by or on behalf of the registrant to 10 or more persons. Not applicable to open-end investment companies.
| (b) | Certifications pursuant to Section 906 of the Sarbanes-Oxley Act of 2002. Furnished herewith. |
SIGNATURES
Pursuant to the requirements of the Securities Exchange Act of 1934 and the Investment Company Act of 1940, the registrant has duly caused this report to be signed on its behalf by the undersigned, thereunto duly authorized.
| | |
| | (Registrant) The Tocqueville Trust |
| |
| | By (Signature and Title)* /s/ Robert W. Kleinschmidt |
| | Robert W. Kleinschmidt, President |
| |
| | Date 12/28/18 |
Pursuant to the requirements of the Securities Exchange Act of 1934 and the Investment Company Act of 1940, this report has been signed below by the following persons on behalf of the registrant and in the capacities and on the dates indicated.
| | |
| | By (Signature and Title)* /s/ Robert W. Kleinschmidt |
| | Robert W. Kleinschmidt, President |
| |
| | Date 12/28/18 |
| |
| | By (Signature and Title)* /s/ Helen Balk |
| | Helen Balk, Treasurer |
| |
| | Date 12/28/18 |
| * | Print the name and title of each signing officer under his or her signature. |